2011 sia snow sports youth market intelligence report
TRANSCRIPT
2011 SIA Snow Sports Youth Market Intelligence Report
SnowSports Industries America (SIA) | SIA is the national not-for-profit, North American member-owned trade association representing the winter sports industry. Established in 1954, SIA annually produces the SIA Snow Show, the largest winter sports industry trade show and networking environment, while delivering invaluable data/research, support, marketing products, services and programs.
For over 50 years, SIA continues to work collectively with our members: cross country, backcountry, snowshoe, alpine and snowboard companies, rep, retailer, resort, regional and national associations and Buying Groups. Guidance from these different sectors of the industry make SIA what it is today, an organization representative of suppliers, retailers and reps all with the goal of getting more people on snow more often and making sure they are properly equipped and dressed to give them the best experience of snow sports.
SIA. Partner. Resource. Advocate.
Membership in SIA is open to product manufacturers, distributors, suppliers, retail shops, sales reps, and industry professionals that are involved in the snow sports industry and meet specific membership requirements. SIA’s membership base averages approximately 600 snow sports companies. For those businesses that provide services to companies in the snow sports industry (i.e., raw material and fabric suppliers, photographers, financial institutions, publications, Internet/Web designers and public relations consulting firms etc.), SIA offers a Supporting Membership. Members magnify their power by working together to further the development of the snow sports industry. Call SIA at 703.556.9020 for more information about membership.
For more information about SIA’s research products contact:
Kelly Davis, Director of Research
SnowSports Industries America
8377-B Greensboro Drive, McLean, VA 22102-3529
703.506.4224 | [email protected]
Visit SIA’s website, www.snowsports.org for additional information on SIA.
©2011, SnowSports Industries America, Incorporated ("SIA"). All rights reserved. This report is the exclusive property of SIA. Use, reproduction or distribution, in whole or in part, in any manner by any means, including any form of electronic distribution, without the prior written authorization of SIA is strictly prohibited and in violation of the copyright laws and international copyright treaties. A monetary reward will be provided to persons who provide SIA with conclusive evidence of unauthorized copying of this publication or transmission. SIA members may use this report for internal business.
Understanding the SIA Youth Market Intelligence Report
The Snow Sports Youth Market Intelligence Report offers a compilation of research from over 10 different snow sports industry studies. This version of the SIA Market Intelligence Report covers all products and services specifically made or provided to persons under 18 (youth). It includes detailed snow sports participation data, retail sales tracking for snow sports equipment, apparel and accessories, ski area visits, business trends, demographics, merchandise distribution and more. It is the most comprehensive snow sports reference tool about sales of youth specific products and services available to snow sports industry professionals; perfect for presentations, writing business plans, research and overall industry knowledge.
This report is published annually by SnowSports Industries America (SIA) before the start of each snow sport season.
Special thanks to National Ski Areas Association, National Sporting Goods Association, Leisure Trends Group, and the National Climate Data Center for providing research material for this Report.
The information contained in this Report is the property of SIA. It cannot be reproduced or extracted in whole or in part in any way, without prior written permission of SIA.
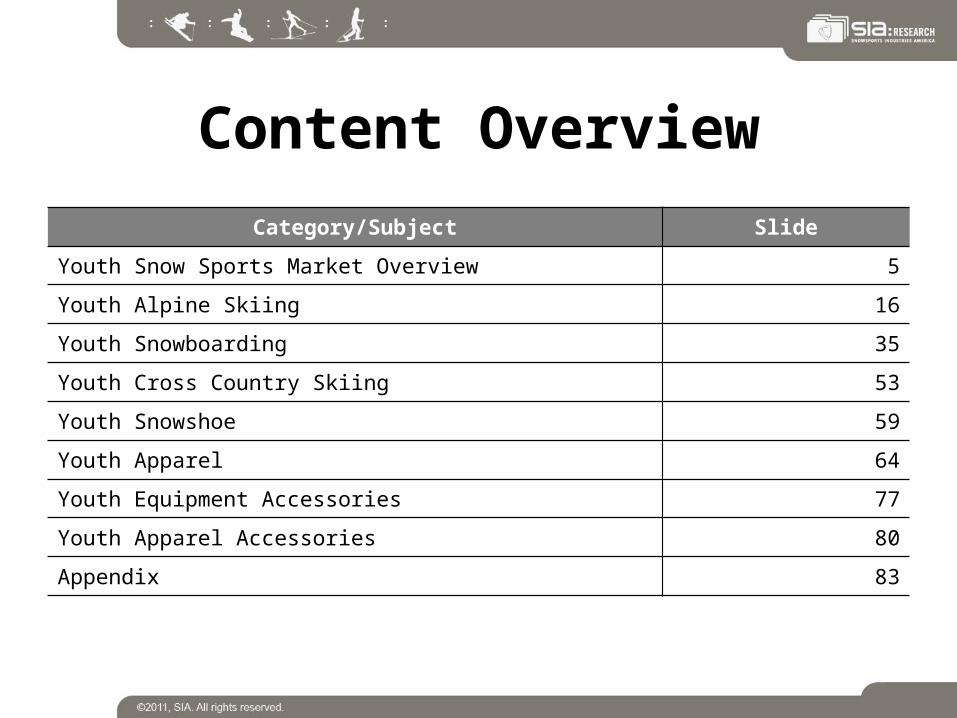
Content Overview
Category/Subject Slide
Youth Snow Sports Market Overview 5
Youth Alpine Skiing 16
Youth Snowboarding 35
Youth Cross Country Skiing 53
Youth Snowshoe 59
Youth Apparel 64
Youth Equipment Accessories 77
Youth Apparel Accessories 80
Appendix 83
The Youth Snow Sports Market
Overview
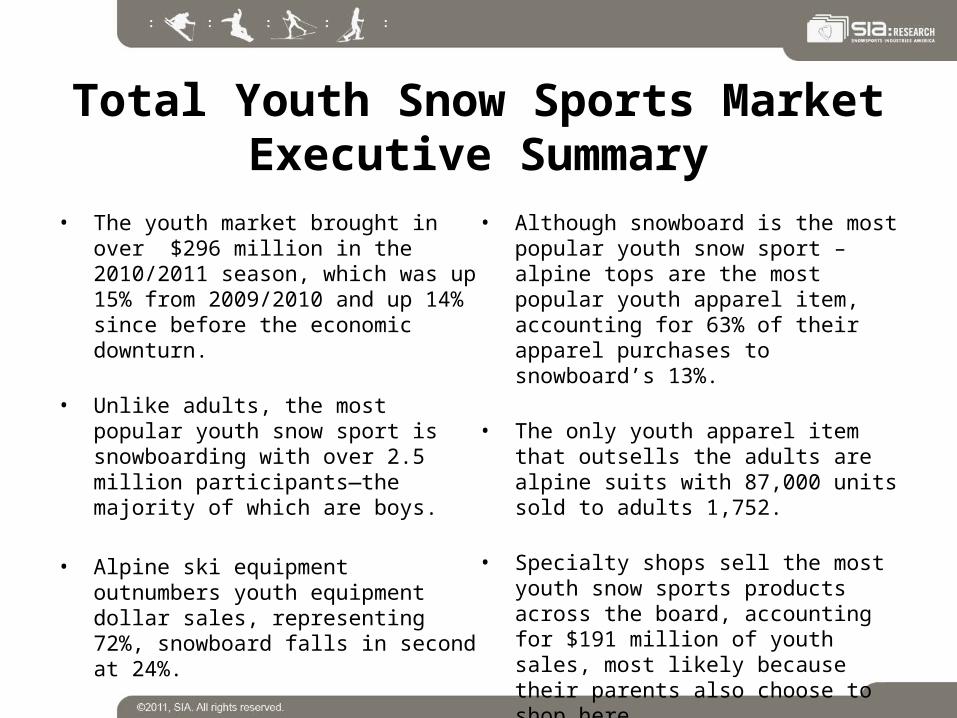
Total Youth Snow Sports MarketExecutive Summary
• The youth market brought in over $296 million in the 2010/2011 season, which was up 15% from 2009/2010 and up 14% since before the economic downturn.
• Unlike adults, the most popular youth snow sport is snowboarding with over 2.5 million participants—the majority of which are boys.
• Alpine ski equipment outnumbers youth equipment dollar sales, representing 72%, snowboard falls in second at 24%.
• Although snowboard is the most popular
youth snow sport – alpine tops are the most popular youth apparel item, accounting for 63% of their apparel purchases to snowboard’s 13%.
• The only youth apparel item that outsells the adults are alpine suits with 87,000 units sold to adults 1,752.
• Specialty shops sell the most youth snow sports products across the board, accounting for $191 million of youth sales, most likely because their parents also choose to shop here.
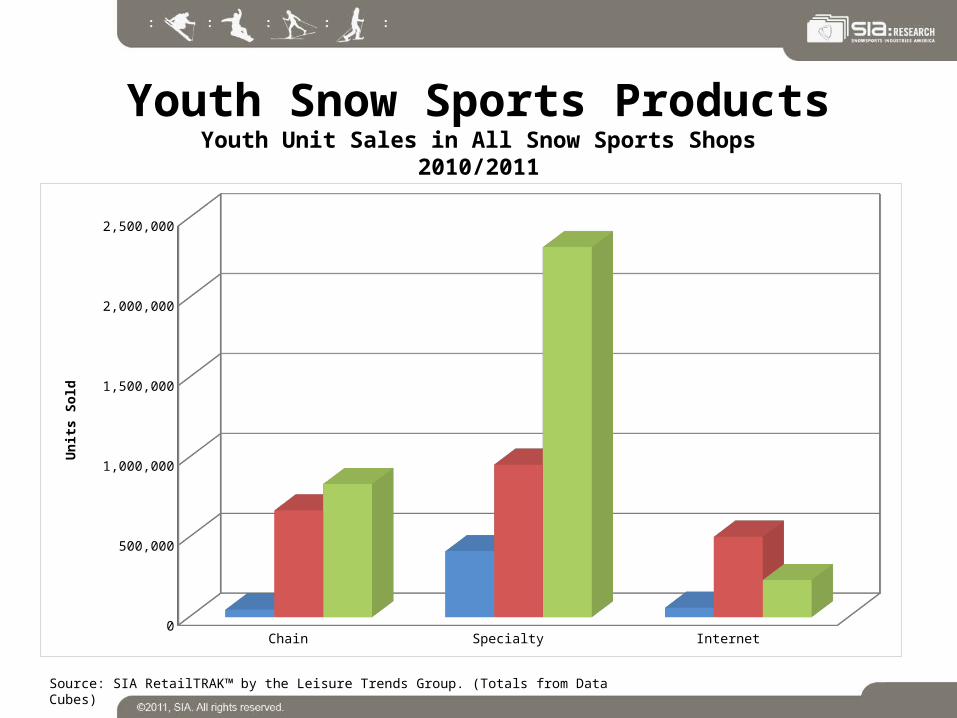
Youth Snow Sports ProductsYouth Unit Sales in All Snow Sports Shops
2010/2011
Source: SIA RetailTRAK™ by the Leisure Trends Group. (Totals from Data Cubes)
Chain Specialty Internet
Equipment 47035.8004 411684.4457 59068.1238
Apparel 668291.6447 954943.4999 503607.3759
Accessories 833591.2344 2316831.3774 232688.4756
250,000
750,000
1,250,000
1,750,000
2,250,000
Un
its
So
ld
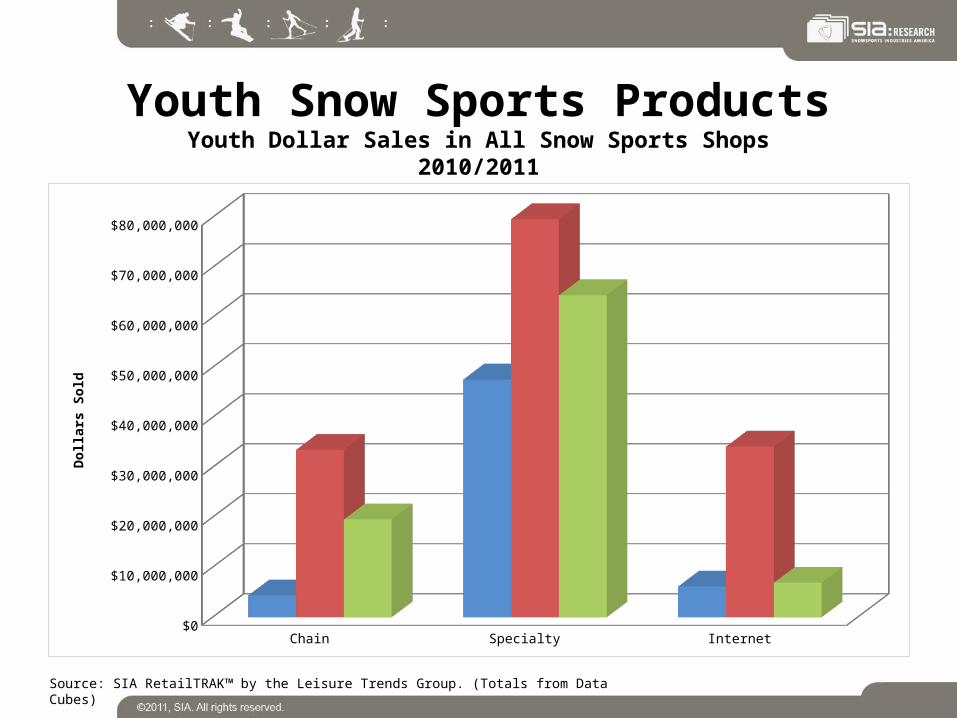
Youth Snow Sports ProductsYouth Dollar Sales in All Snow Sports Shops
2010/2011
Source: SIA RetailTRAK™ by the Leisure Trends Group. (Totals from Data Cubes)
Chain Specialty Internet
Equipment 4368617.8966 47550216.55 6153928.9115
Apparel 33480396.6807 79629611.6086 34136831.3593
Accessories 19573117.4018 64397147.4268 6903730.4337
$5,000,000
$15,000,000
$25,000,000
$35,000,000
$45,000,000
$55,000,000
$65,000,000
$75,000,000
Do
llar
s S
old
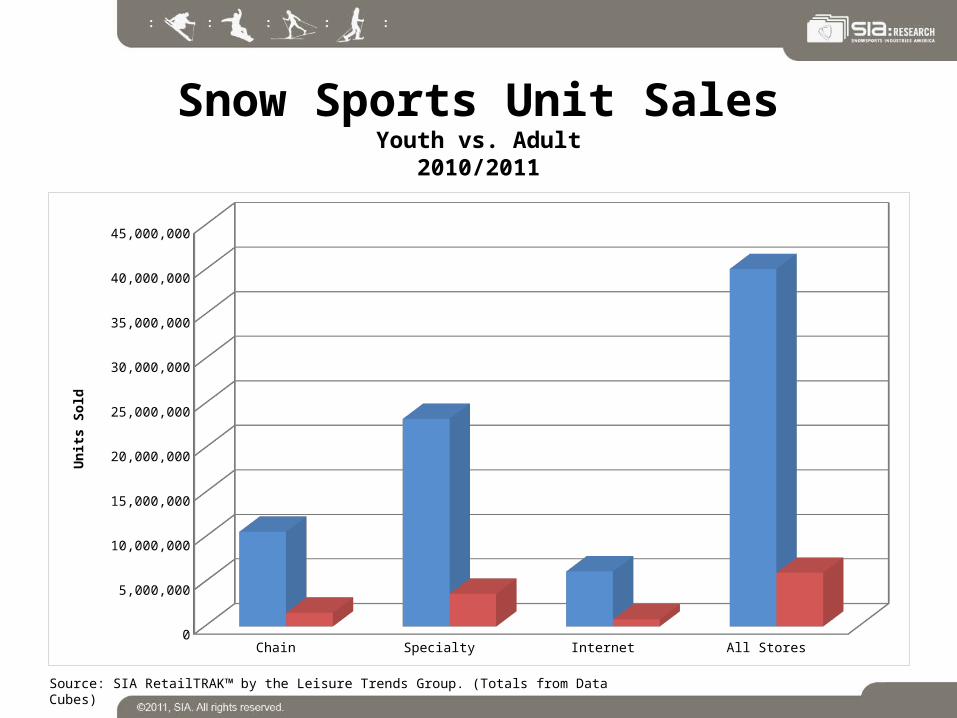
Snow Sports Unit SalesYouth vs. Adult
2010/2011
Source: SIA RetailTRAK™ by the Leisure Trends Group. (Totals from Data Cubes)
Chain Specialty Internet All Stores
Adult 10639574.3225 23316376.4842 6180320.7616 40136271.5683
Junior 1548918.6795 3683459.323 795363.9753 6027741.9778
2,500,000
7,500,000
12,500,000
17,500,000
22,500,000
27,500,000
32,500,000
37,500,000
42,500,000
Un
its
So
ld
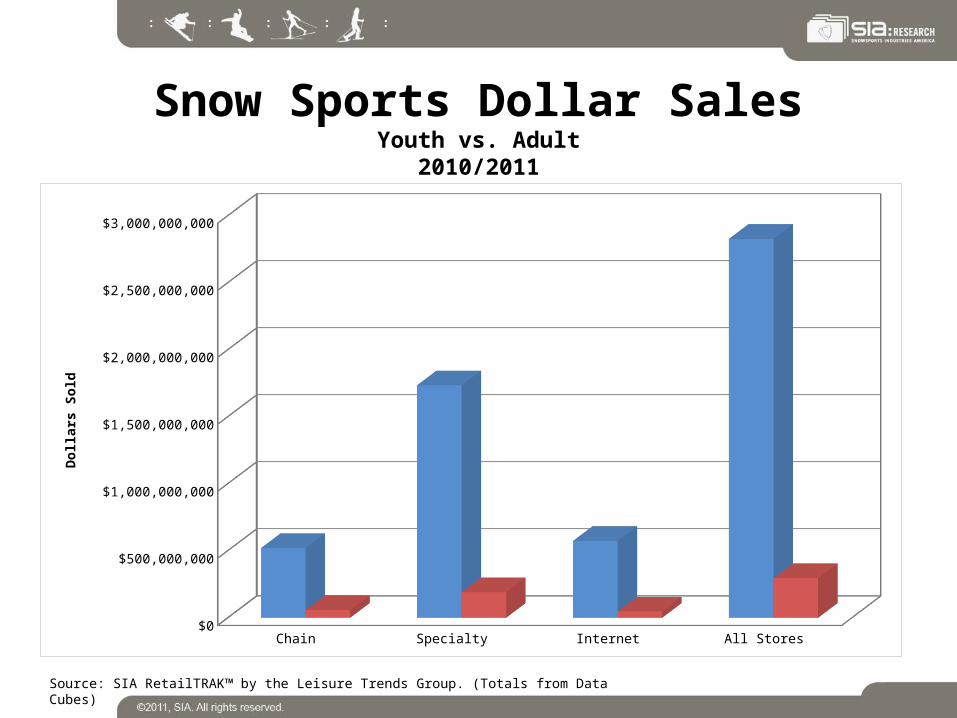
Snow Sports Dollar SalesYouth vs. Adult
2010/2011
Source: SIA RetailTRAK™ by the Leisure Trends Group. (Totals from Data Cubes)
Chain Specialty Internet All Stores
Adult 520144000.7836 1735050509.5728 573366847.8469 2828561358.2033
Junior 57422131.9791 191576975.5854 47194490.7045 296193598.269
$250,000,000
$750,000,000
$1,250,000,000
$1,750,000,000
$2,250,000,000
$2,750,000,000
Do
llar
s S
old
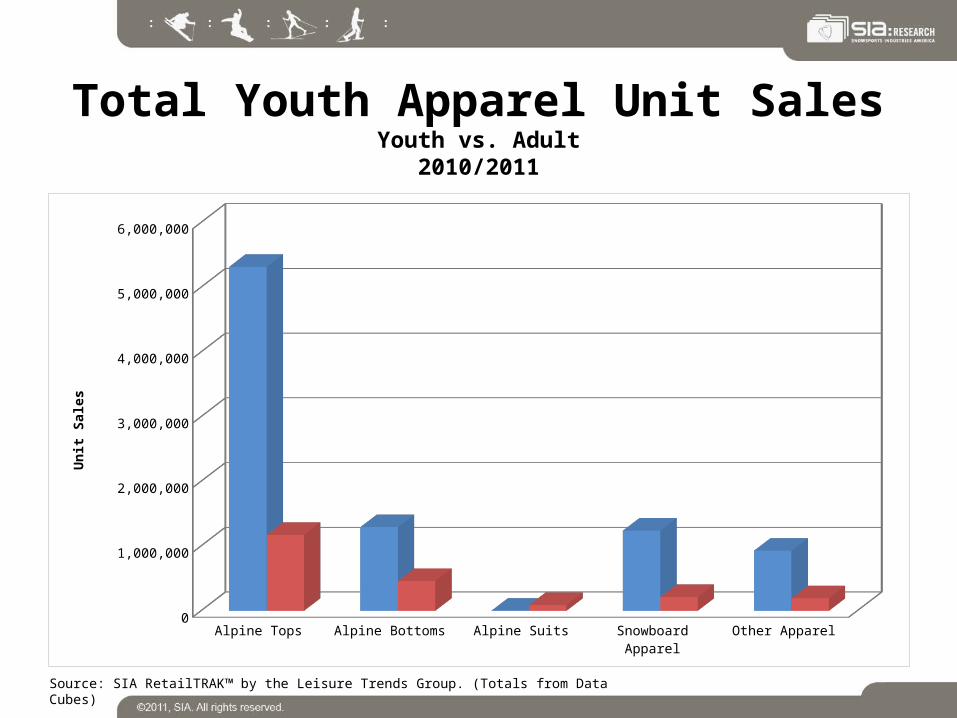
Total Youth Apparel Unit SalesYouth vs. Adult
2010/2011
Source: SIA RetailTRAK™ by the Leisure Trends Group. (Totals from Data Cubes)
Alpine Tops Alpine Bottoms Alpine Suits Snowboard Apparel Other Apparel
Adult 5313436.2061 1291129.1253 1751.5823 1237303.0043 928818.6732
Junior 1172374.532 460045.1806 87373.7891 212992.1493 194056.8695
500,000
1,500,000
2,500,000
3,500,000
4,500,000
5,500,000
Un
it S
ales

Total Youth Apparel Dollar SalesYouth vs. Adult
2010/2011
Source: SIA RetailTRAK™ by the Leisure Trends Group. (Totals from Data Cubes)
Alpine Tops67%
Alpine Bottoms13%
Alpine Suits0%
Snowboard Apparel
15%
Other Apparel5%
Adult
Alpine Tops61%
Alpine Bottoms19%
Alpine Suits4%
Snowboard Apparel
12%
Other Apparel4%
Junior
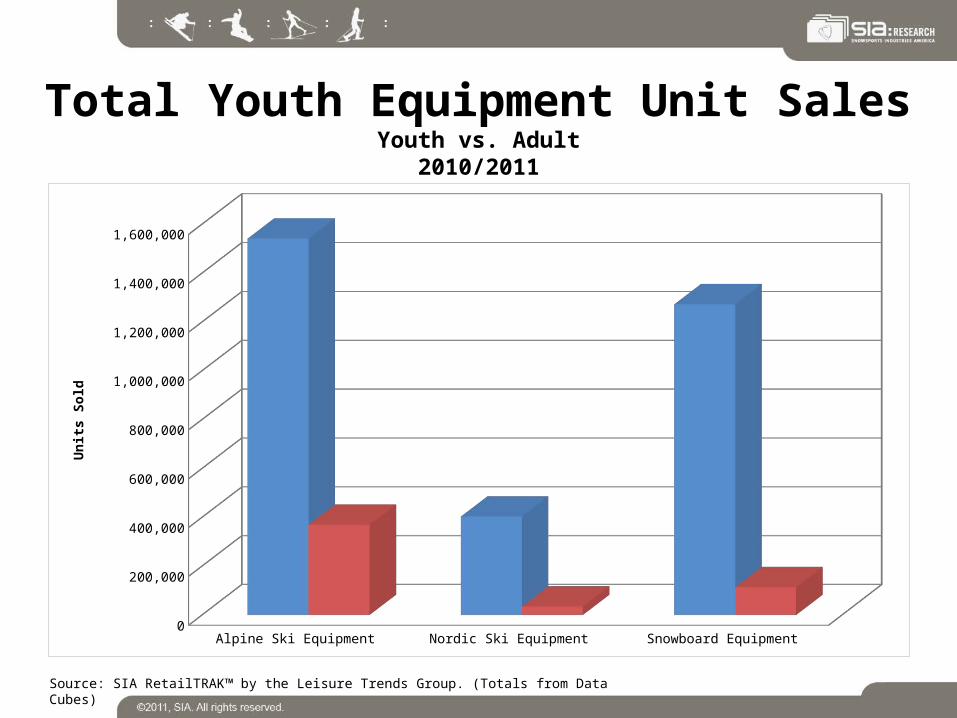
Total Youth Equipment Unit SalesYouth vs. Adult
2010/2011
Source: SIA RetailTRAK™ by the Leisure Trends Group. (Totals from Data Cubes)
Alpine Ski Equipment Nordic Ski Equipment Snowboard Equipment
Adult 1541728.1133 403300.3844 1272264.5226
Junior 369377.5272 34545.913 113835.6539
100,000
300,000
500,000
700,000
900,000
1,100,000
1,300,000
1,500,000
Un
its
So
ld
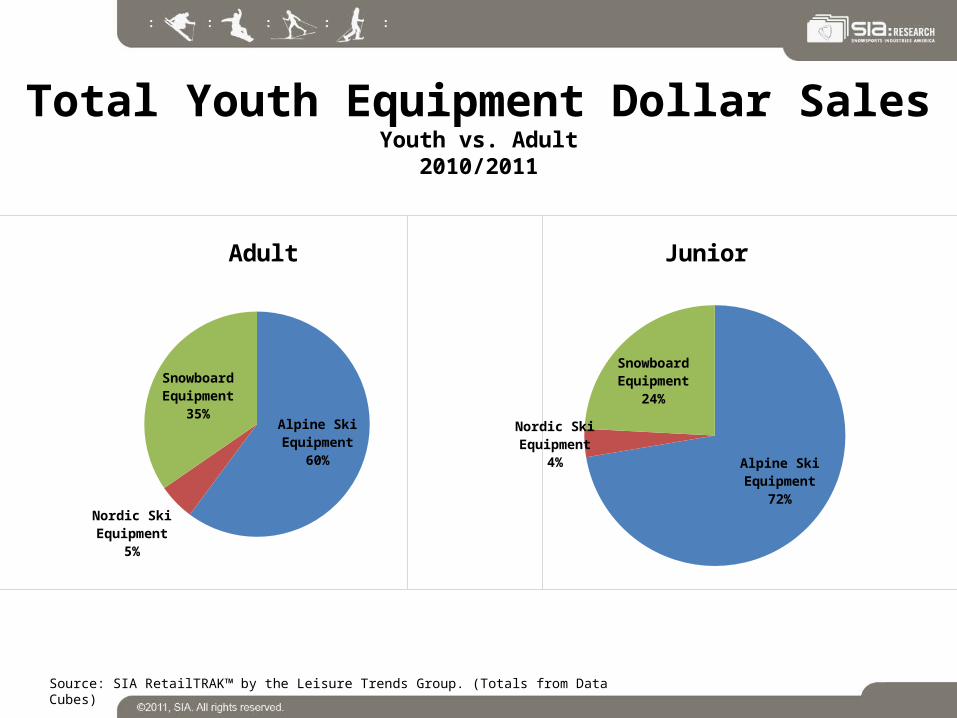
Total Youth Equipment Dollar SalesYouth vs. Adult
2010/2011
Source: SIA RetailTRAK™ by the Leisure Trends Group. (Totals from Data Cubes)
Alpine Ski Equipment
60%
Nordic Ski Equipment
5%
Snowboard Equipment
35%
Adult
Alpine Ski Equipment
72%
Nordic Ski Equipment
4%
Snowboard Equipment
24%
Junior
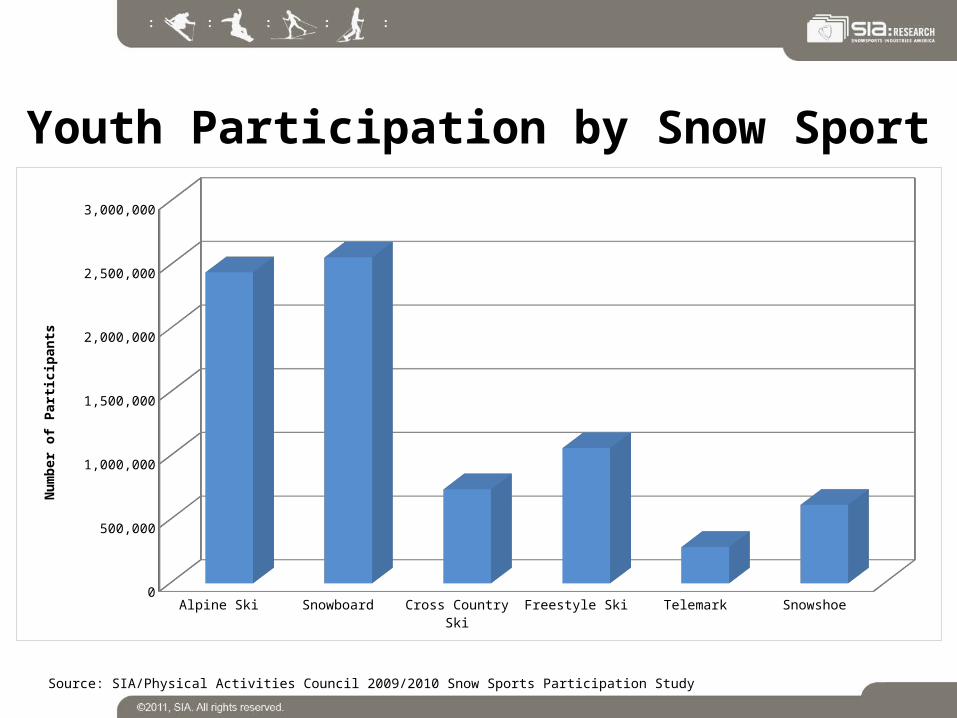
Youth Participation by Snow Sport
Alpine Ski Snowboard Cross Country Ski Freestyle Ski Telemark Snowshoe
Youth 2443000 2561000 739000 1062000 285000 616000
250,000
750,000
1,250,000
1,750,000
2,250,000
2,750,000
Nu
mb
er o
f P
arti
cip
ants
Source: SIA/Physical Activities Council 2009/2010 Snow Sports Participation Study
Youth Alpine Skiing
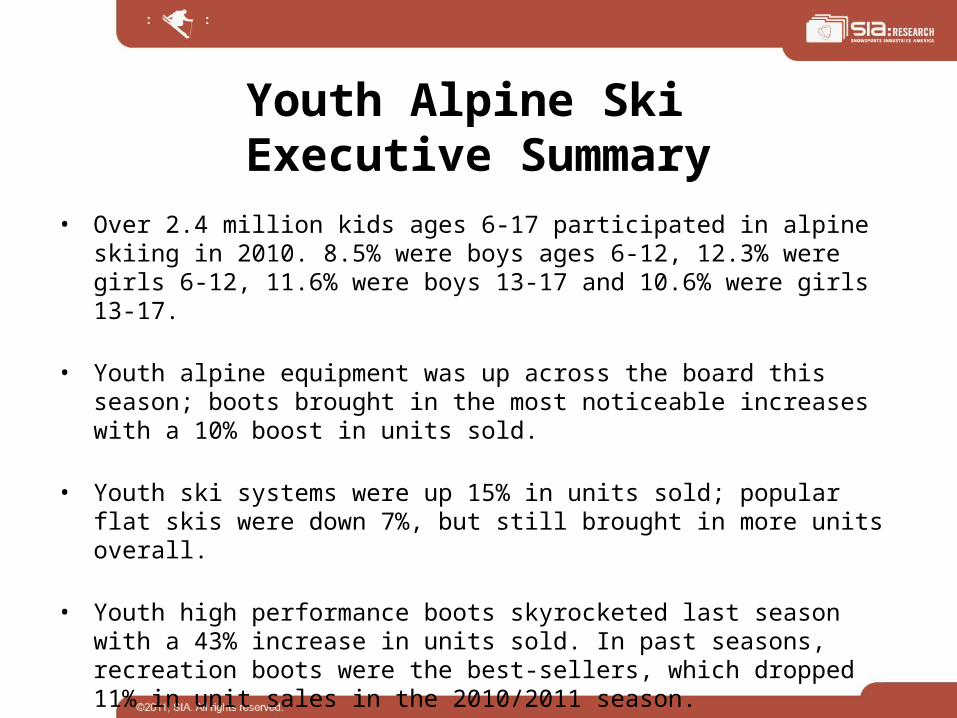
Youth Alpine Ski Executive Summary
• Over 2.4 million kids ages 6-17 participated in alpine skiing in 2010. 8.5% were boys ages 6-12, 12.3% were girls 6-12, 11.6% were boys 13-17 and 10.6% were girls 13-17.
• Youth alpine equipment was up across the board this season; boots brought in the most noticeable increases with a 10% boost in units sold.
• Youth ski systems were up 15% in units sold; popular flat skis were down 7%, but still brought in more units overall.
• Youth high performance boots skyrocketed last season with a 43% increase in units sold. In past seasons, recreation boots were the best-sellers, which dropped 11% in unit sales in the 2010/2011 season.

Youth Alpine Ski Participation
Ages 6 to 17 Ages 18 +
Alpine Ski Participants 2443000 9061000
500,000
1,500,000
2,500,000
3,500,000
4,500,000
5,500,000
6,500,000
7,500,000
8,500,000
9,500,000
Nu
mb
er o
f P
arti
cip
ants
Source: SIA/Physical Activities Council 2009/2010 Snow Sports Participation Study
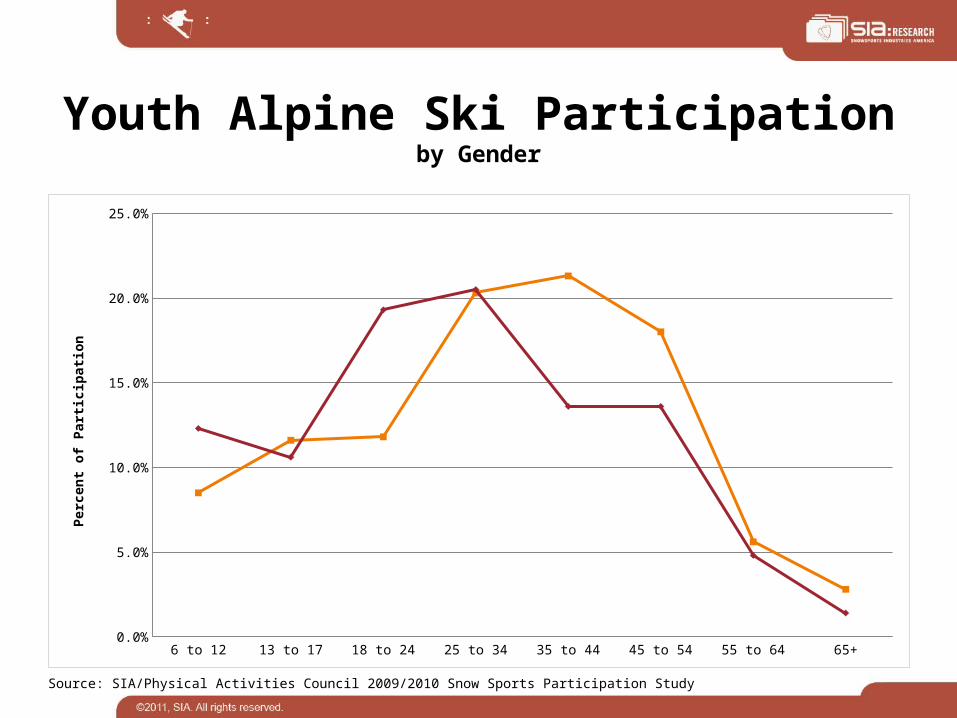
Youth Alpine Ski Participationby Gender
6 to 12 13 to 17 18 to 24 25 to 34 35 to 44 45 to 54 55 to 64 65+
Male Alpine Skiers 0.085 0.116 0.118 0.203 0.213 0.18 0.056 0.028
Female Alpine Skiers 0.123 0.106 0.193 0.205 0.136 0.136 0.048 0.014
2.5%
7.5%
12.5%
17.5%
22.5%
Per
cen
t o
f P
arti
cip
atio
n
Source: SIA/Physical Activities Council 2009/2010 Snow Sports Participation Study
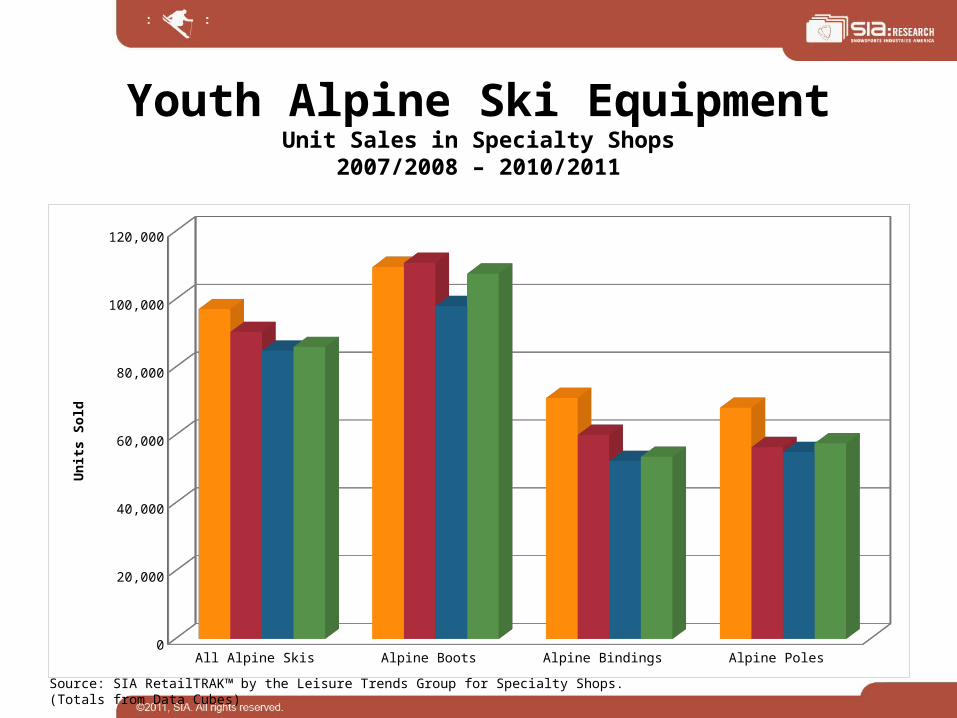
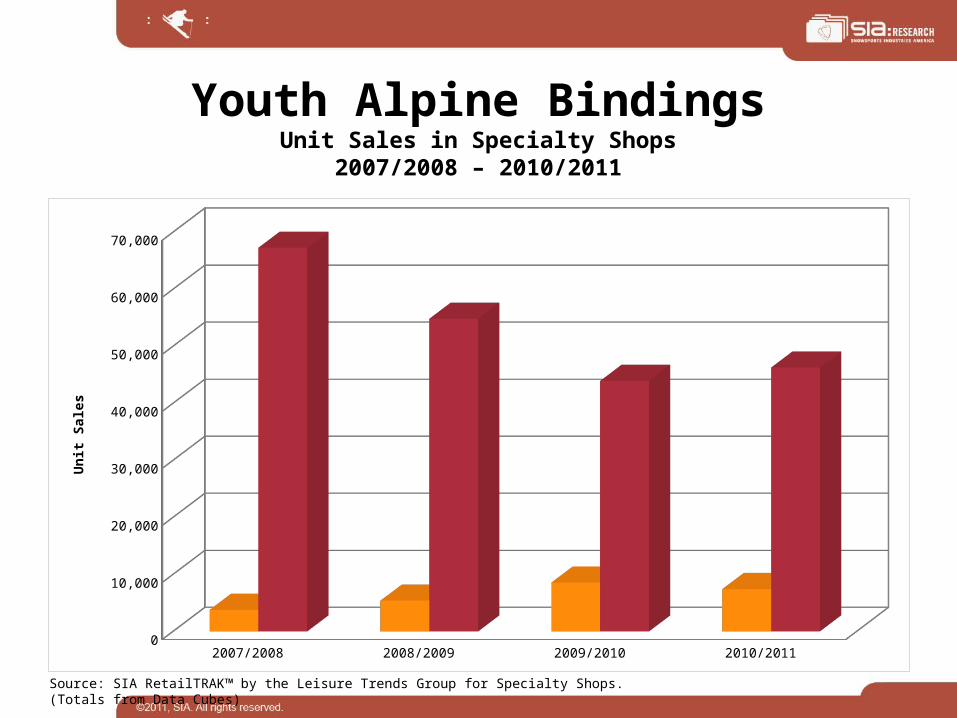
Youth Alpine Ski EquipmentUnit Sales in Specialty Shops
2007/2008 – 2010/2011
All Alpine Skis Alpine Boots Alpine Bindings Alpine Poles
2007/2008 97204.0127 109610.3452 71030.1227 68110.676
2008/2009 90479.3567 110834.9307 60193.6555 56537.641
2009/2010 84954.9294 98066.8594 52475.693 55103.4161
2010/2011 86038.7719 107642.6851 53649.8191 57645.9122
10,000
30,000
50,000
70,000
90,000
110,000
Un
its
So
ld
Source: SIA RetailTRAK™ by the Leisure Trends Group for Specialty Shops. (Totals from Data Cubes)
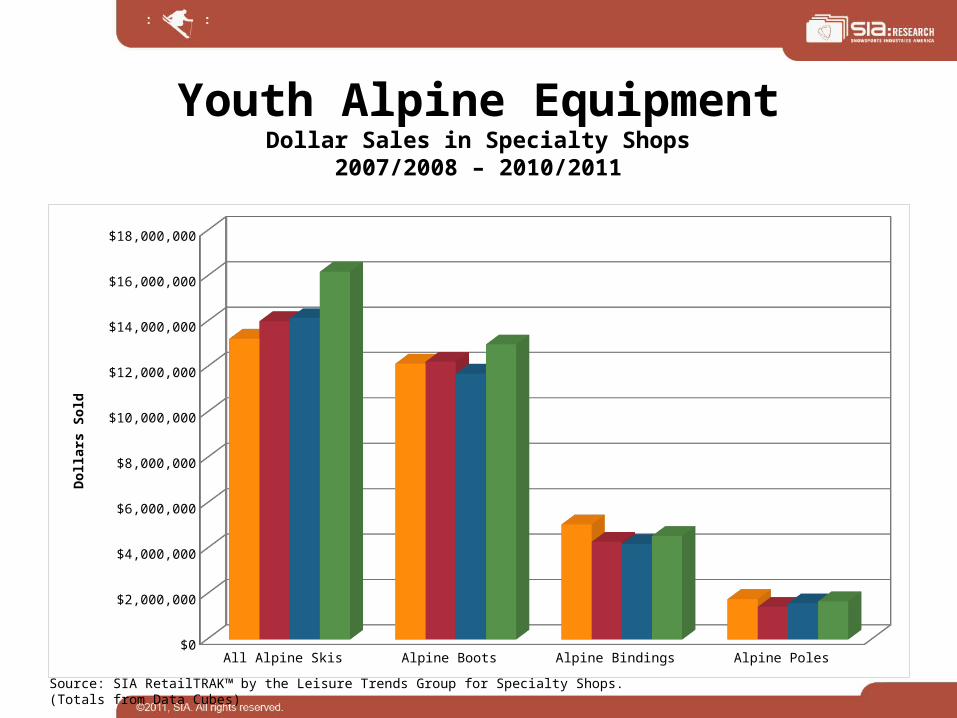
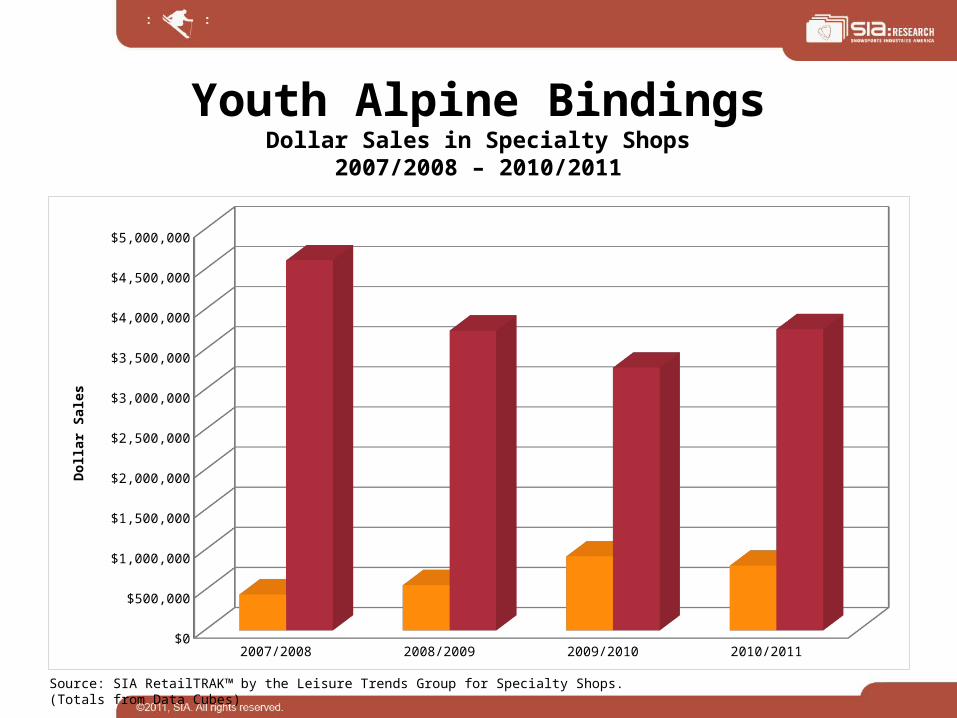
Youth Alpine EquipmentDollar Sales in Specialty Shops
2007/2008 – 2010/2011
All Alpine Skis Alpine Boots Alpine Bindings Alpine Poles
2007/2008 13253399.7073 12152400.2467 5064795.1223 1773835.7521
2008/2009 14026405.2898 12240909.2375 4305505.6239 1436881.861
2009/2010 14157943.213 11710974.9079 4202974.2525 1593471.8527
2010/2011 16208481.345 13001082.6831 4565593.6491 1679985.1036
$1,000,000
$3,000,000
$5,000,000
$7,000,000
$9,000,000
$11,000,000
$13,000,000
$15,000,000
$17,000,000
Do
llar
s S
old
Source: SIA RetailTRAK™ by the Leisure Trends Group for Specialty Shops. (Totals from Data Cubes)
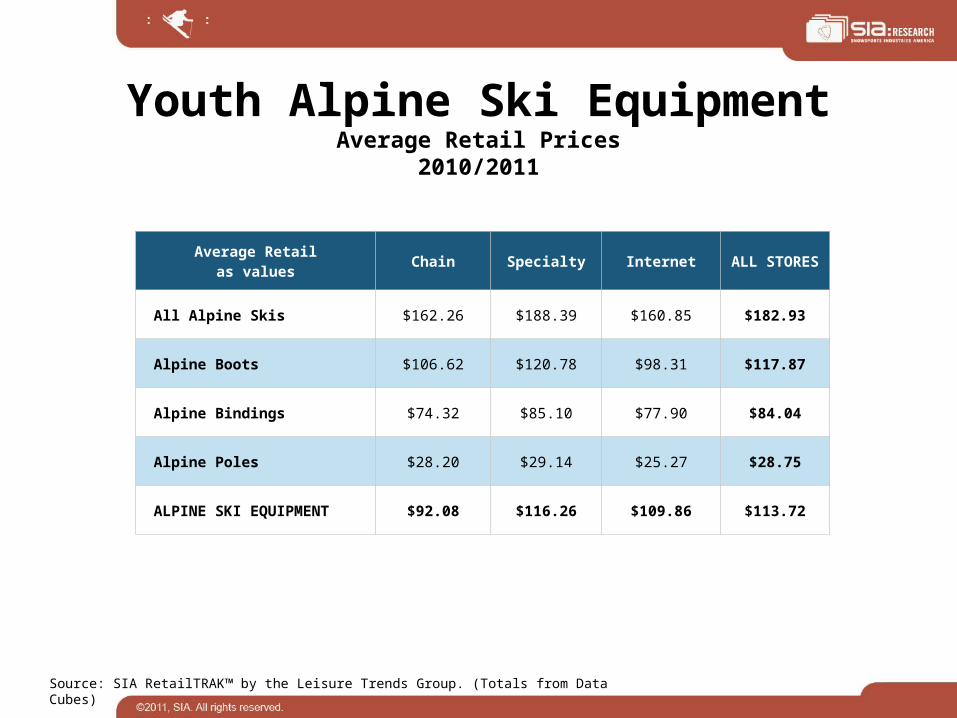
Youth Alpine Ski EquipmentAverage Retail Prices
2010/2011
Average Retailas values Chain Specialty Internet ALL STORES
All Alpine Skis $162.26 $188.39 $160.85 $182.93
Alpine Boots $106.62 $120.78 $98.31 $117.87
Alpine Bindings $74.32 $85.10 $77.90 $84.04
Alpine Poles $28.20 $29.14 $25.27 $28.75
ALPINE SKI EQUIPMENT $92.08 $116.26 $109.86 $113.72
Source: SIA RetailTRAK™ by the Leisure Trends Group. (Totals from Data Cubes)

Youth Alpine SkisUnit Sales in Specialty Shops
2007/2008 – 2010/2011
2007/2008 2008/2009 2009/2010 2010/2011
Flat Skis 66677.6569 62657.9182 52682.3501 48750.0142
Ski Systems 30526.3558 27821.4385 32272.5793 37288.7577
5,000
15,000
25,000
35,000
45,000
55,000
65,000
Un
it S
ales
Source: SIA RetailTRAK™ by the Leisure Trends Group for Specialty Shops. (Totals from Data Cubes)

Youth Alpine SkisDollar Sales in Specialty Shops
2007/2008 – 2010/2011
2007/2008 2008/2009 2009/2010 2010/2011
Flat Skis 8848472.9884 9688826.3813 7828471.0819 8135940.7001
Ski Systems 4404926.7189 4337578.9085 6329472.1311 8072540.6449
$500,000
$1,500,000
$2,500,000
$3,500,000
$4,500,000
$5,500,000
$6,500,000
$7,500,000
$8,500,000
$9,500,000
Do
llar
Sal
es
Source: SIA RetailTRAK™ by the Leisure Trends Group for Specialty Shops. (Totals from Data Cubes)
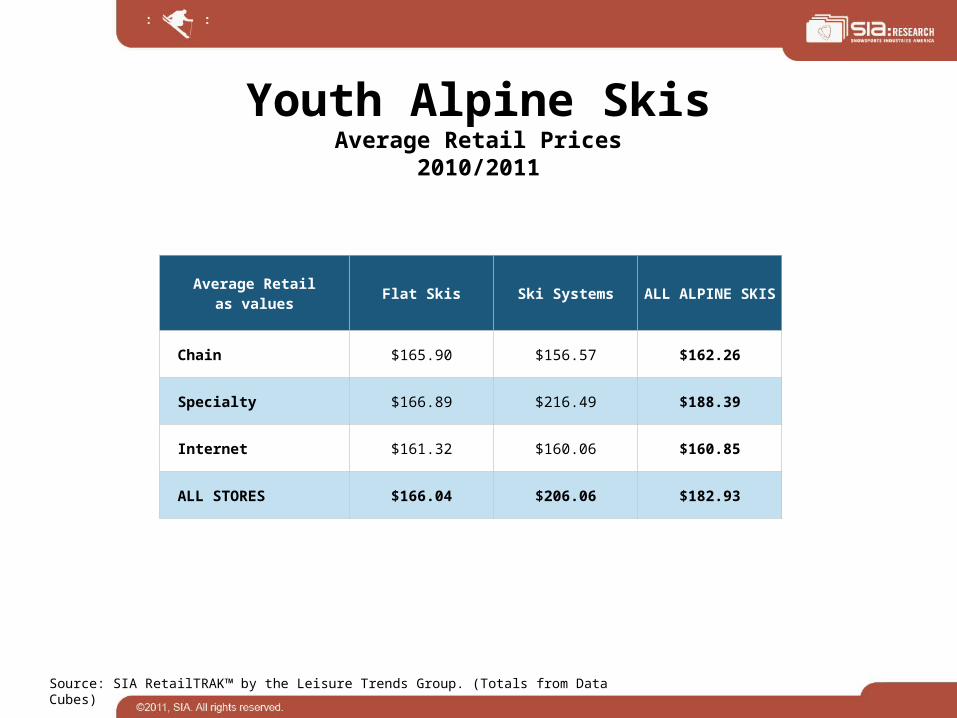
Youth Alpine SkisAverage Retail Prices
2010/2011
Average Retailas values Flat Skis Ski Systems ALL ALPINE SKIS
Chain $165.90 $156.57 $162.26
Specialty $166.89 $216.49 $188.39
Internet $161.32 $160.06 $160.85
ALL STORES $166.04 $206.06 $182.93
Source: SIA RetailTRAK™ by the Leisure Trends Group. (Totals from Data Cubes)
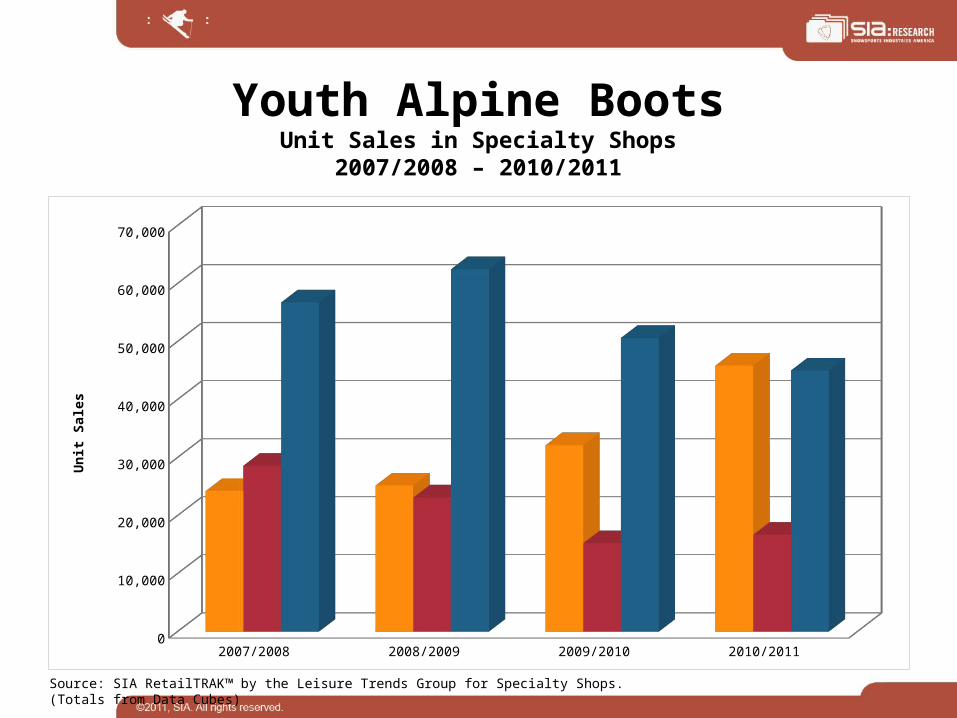
Youth Alpine BootsUnit Sales in Specialty Shops
2007/2008 – 2010/2011
2007/2008 2008/2009 2009/2010 2010/2011
High Performance 24236.8772 25205.7907 32146.752 45878.9257
Sport Performance 28613.4681 23143.6373 15265.3951 16735.2087
Recreation 56759.9999 62485.5027 50654.7123 45028.5507
5,000
15,000
25,000
35,000
45,000
55,000
65,000
Un
it S
ales
Source: SIA RetailTRAK™ by the Leisure Trends Group for Specialty Shops. (Totals from Data Cubes)
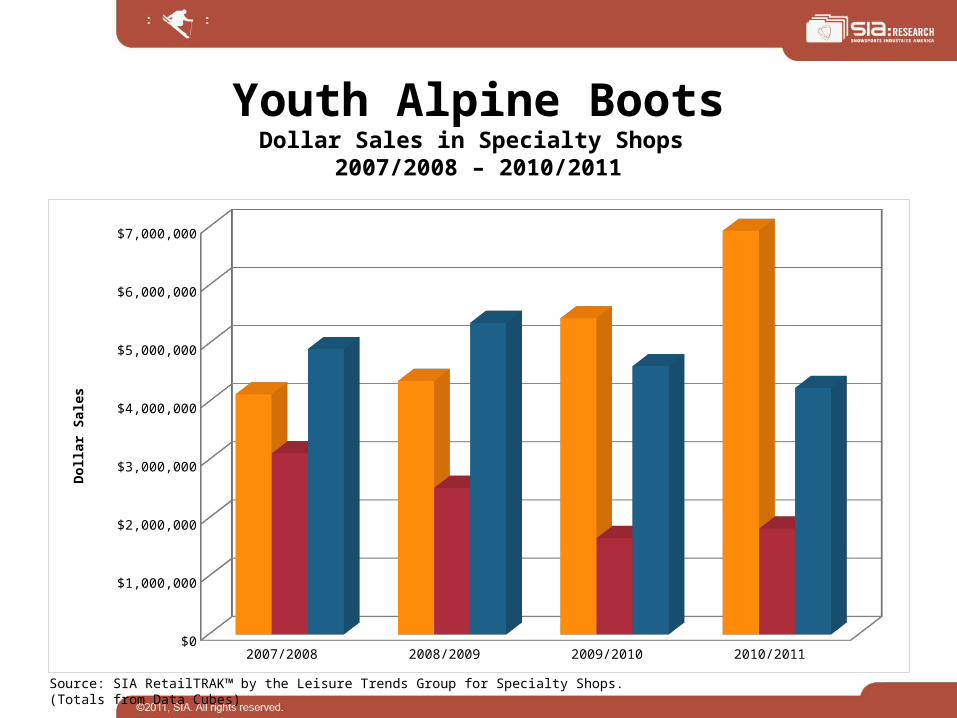
Youth Alpine BootsDollar Sales in Specialty Shops
2007/2008 – 2010/2011
2007/2008 2008/2009 2009/2010 2010/2011
High Performance 4129261.9261 4359825.3051 5436466.551 6940816.1636
Sport Performance 3114334.494 2521232.4456 1659139.3041 1821172.264
Recreation 4908803.8266 5359851.4868 4615369.0528 4239094.2555
$500,000
$1,500,000
$2,500,000
$3,500,000
$4,500,000
$5,500,000
$6,500,000
Do
llar
Sal
es
Source: SIA RetailTRAK™ by the Leisure Trends Group for Specialty Shops. (Totals from Data Cubes)
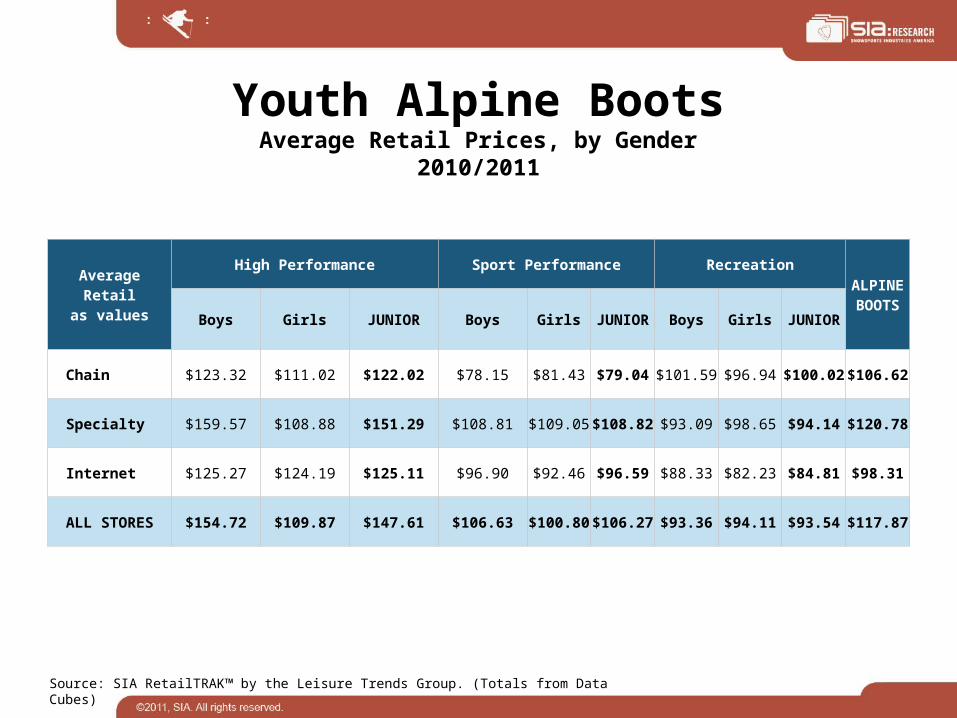
Youth Alpine BootsAverage Retail Prices, by Gender
2010/2011
Average Retailas values
High Performance Sport Performance RecreationALPINE BOOTS
Boys Girls JUNIOR Boys Girls JUNIOR Boys Girls JUNIOR
Chain $123.32 $111.02 $122.02 $78.15 $81.43 $79.04 $101.59 $96.94 $100.02 $106.62
Specialty $159.57 $108.88 $151.29 $108.81 $109.05 $108.82 $93.09 $98.65 $94.14 $120.78
Internet $125.27 $124.19 $125.11 $96.90 $92.46 $96.59 $88.33 $82.23 $84.81 $98.31
ALL STORES $154.72 $109.87 $147.61 $106.63 $100.80 $106.27 $93.36 $94.11 $93.54 $117.87
Source: SIA RetailTRAK™ by the Leisure Trends Group. (Totals from Data Cubes)
Youth Alpine BindingsUnit Sales in Specialty Shops
2007/2008 – 2010/2011
2007/2008 2008/2009 2009/2010 2010/2011
MAX DIN 8-11 3768.3695 5386.5682 8537.0118 7398.2339
MAX DIN 1-7 67261.7532 54807.0873 43938.6812 46251.5852
5,000
15,000
25,000
35,000
45,000
55,000
65,000
Un
it S
ales
Source: SIA RetailTRAK™ by the Leisure Trends Group for Specialty Shops. (Totals from Data Cubes)
Youth Alpine BindingsDollar Sales in Specialty Shops
2007/2008 – 2010/2011
2007/2008 2008/2009 2009/2010 2010/2011
MAX DIN 8-11 448558.51 565871.0005 923905.7975 807498.5254
MAX DIN 1-7 4616236.6123 3739634.6234 3279068.455 3758095.1237
$250,000
$750,000
$1,250,000
$1,750,000
$2,250,000
$2,750,000
$3,250,000
$3,750,000
$4,250,000
$4,750,000
Do
llar
Sal
es
Source: SIA RetailTRAK™ by the Leisure Trends Group for Specialty Shops. (Totals from Data Cubes)

Youth Alpine BindingsAverage Retail Prices, by Gender
2010/2011
Average Retailas values
MAX DIN 8-11 MAX DIN 1-7ALPINE
BINDINGSBoys JUNIOR Boys Girls JUNIOR
Chain $78.94 $78.94 $80.89 $47.74 $74.12 $74.32
Specialty $109.15 $109.15 $80.76 $85.39 $81.25 $85.10
Internet $123.28 $123.28 $78.85 $58.18 $73.13 $77.90
ALL STORES $109.67 $109.67 $80.63 $77.27 $80.20 $84.04
Source: SIA RetailTRAK™ by the Leisure Trends Group. (Totals from Data Cubes)
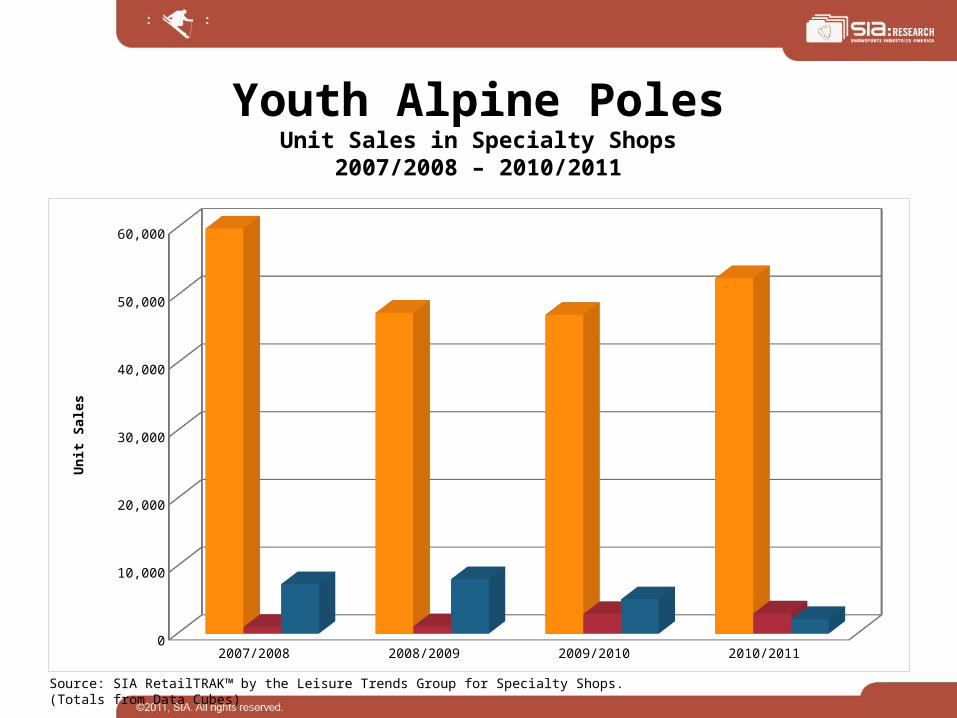
Youth Alpine PolesUnit Sales in Specialty Shops
2007/2008 – 2010/2011
2007/2008 2008/2009 2009/2010 2010/2011
Alpine Poles - Aluminum 59839.268 47395.1876 47120.8225 52512.4173
Alpine Poles - Carbon 969.9446 1097.6002 2908.5949 2980.5984
Alpine Poles - Composite 7301.4634 8044.8532 5073.9987 2152.8965
5,000
15,000
25,000
35,000
45,000
55,000
Un
it S
ales
Source: SIA RetailTRAK™ by the Leisure Trends Group for Specialty Shops. (Totals from Data Cubes)

Youth Alpine PolesDollar Sales in Specialty Shops
2007/2008 – 2010/2011
2007/2008 2008/2009 2009/2010 2010/2011
Alpine Poles - Aluminum 1588931.984 1232238.8856 1372724.3366 1534372.054
Alpine Poles - Carbon 25309.5615 26117.193 86421.5909 94102.1258
Alpine Poles - Composite 159594.2066 178525.7824 134325.9252 51510.9238
$100,000
$300,000
$500,000
$700,000
$900,000
$1,100,000
$1,300,000
$1,500,000
Do
llar
Sal
es
Source: SIA RetailTRAK™ by the Leisure Trends Group for Specialty Shops. (Totals from Data Cubes)

Youth Alpine PolesAverage Retail Prices, by Gender
2010/2011
Average Retail
as values
Alpine Poles - Aluminum Alpine Poles - Carbon Alpine Poles - CompositeALPINE POLES
Boys Girls JUNIOR Boys JUNIOR Boys Girls JUNIOR
Chain $29.92 $22.26 $28.39 $0.00 $0.00 $19.96 $11.77 $11.95 $28.20
Specialty $30.51 $21.34 $29.22 $31.57 $31.57 $25.94 $22.62 $23.93 $29.14
Internet $25.77 $25.32 $25.70 $25.56 $25.56 $0.00 $22.58 $22.58 $25.27
ALL STORES $30.14 $21.79 $28.88 $31.55 $31.55 $25.92 $22.00 $23.14 $28.75
Source: SIA RetailTRAK™ by the Leisure Trends Group. (Totals from Data Cubes)

Youth Snowboarding
Youth SnowboardExecutive Summary
• 35.2% of male snowboarders are ages 6-17; girls represent 23.5% of the female snowboarding category.
• Girls continue to represent a small fraction of snowboard equipment purchases in comparison to boys.
• Youth snowboard equipment brought in over $10.5 million in sales last season—of that, $9.2 million came from boys equipment sales.
• Overall, youth snowboard purchases were down in 2010/2011 with the exception of freeride boards, which saw a 38% increase in unit sales.
• Snowboard equipment sales were down across the board, with the exception of boys bindings, which saw a nominal increase of 2% in units.

Youth Snowboarding Participation
6 to 17 18 +
Snowboard Participation 2561000 5634000
500,000
1,500,000
2,500,000
3,500,000
4,500,000
5,500,000
Nu
mb
er o
f P
arti
cip
ants
Source: SIA/Physical Activities Council 2009/2010 Snow Sports Participation Study

Youth Snowboarding Participationby Gender
6 to 12 13 to 17 18 to 24 25 to 34 35 to 44 45 to 54 55 to 64 65+
Male Snowboarders 0.112 0.24 0.198 0.2 0.144 0.092 0.012 0.001
Female Snowboarders 0.076 0.159 0.288 0.324 0.079 0.047 0.024 0.003
2.5%
7.5%
12.5%
17.5%
22.5%
27.5%
32.5%
Per
cen
t P
arti
cip
ated
Source: SIA/Physical Activities Council 2009/2010 Snow Sports Participation Study

Boys Snowboard EquipmentUnit Sales in Specialty Shops
2007/2008 – 2010/2011
2007/2008 2008/2009 2009/2010 2010/2011
Snowboards 39979.1913 33772.7241 33760.581 30712.5858
Snowboard Boots 28989.5108 26709.7199 25079.1823 23470.5061
Snowboard Bindings 24445.4168 21039.8461 17157.6365 17432.4096
2,500
7,500
12,500
17,500
22,500
27,500
32,500
37,500
Un
it S
ales
Source: SIA RetailTRAK™ by the Leisure Trends Group for Specialty Shops. (Totals from Data Cubes)
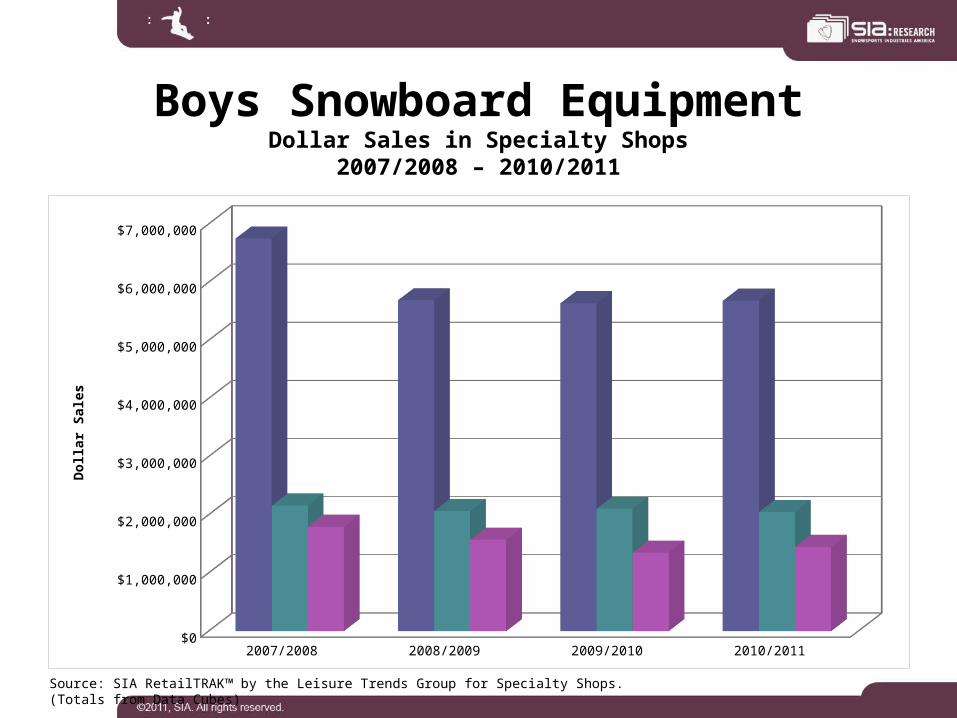
Boys Snowboard EquipmentDollar Sales in Specialty Shops
2007/2008 – 2010/2011
2007/2008 2008/2009 2009/2010 2010/2011
Snowboards 6750613.9685 5688685.4931 5638113.4757 5681532.883
Snowboard Boots 2157142.3768 2063888.1245 2103585.3435 2048705.0336
Snowboard Bindings 1793441.0876 1570587.4378 1348169.9129 1448741.0977
$500,000
$1,500,000
$2,500,000
$3,500,000
$4,500,000
$5,500,000
$6,500,000
Do
llar
Sal
es
Source: SIA RetailTRAK™ by the Leisure Trends Group for Specialty Shops. (Totals from Data Cubes)

Girls Snowboard EquipmentUnit Sales in Specialty Shops
2007/2008 – 2010/2011
2007/2008 2008/2009 2009/2010 2010/2011
Snowboards 9554.0754 7572.7789 7211.6136 7133.3359
Snowboard Boots 531.7865 2701.7399 2492.4802 2479.6642
Snowboard Bindings 595.2249 1979.1788 2125.3726 1161.0842
500
1,500
2,500
3,500
4,500
5,500
6,500
7,500
8,500
9,500
Un
it S
ales
Source: SIA RetailTRAK™ by the Leisure Trends Group for Specialty Shops. (Totals from Data Cubes)
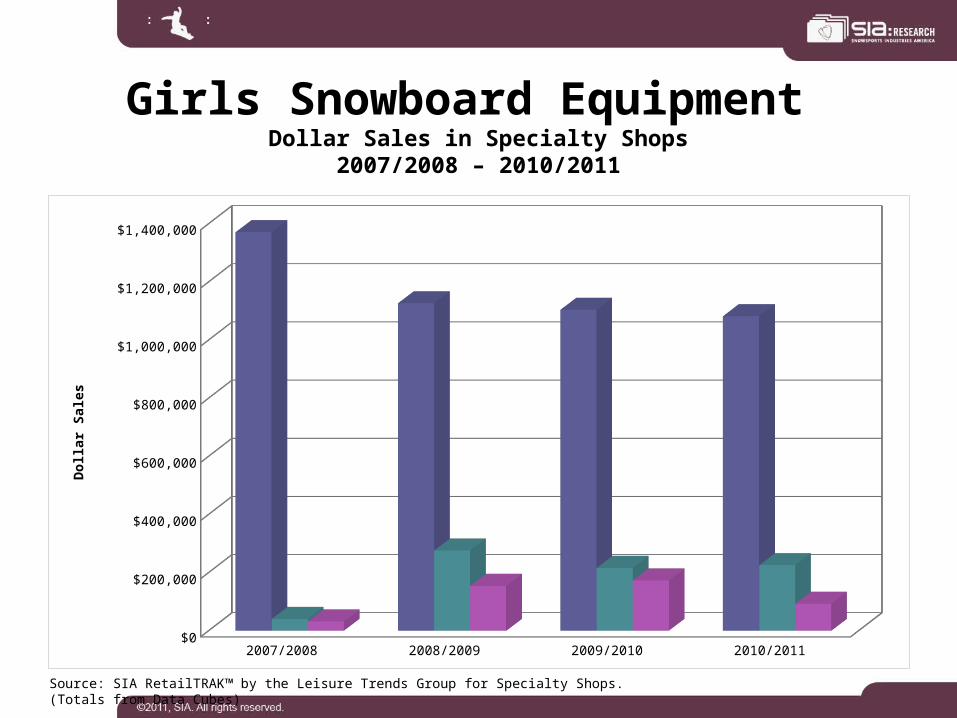
Girls Snowboard Equipment Dollar Sales in Specialty Shops
2007/2008 – 2010/2011
2007/2008 2008/2009 2009/2010 2010/2011
Snowboards 1370704.0245 1126468.2899 1103984.6888 1081754.507
Snowboard Boots 40466.8324 276062.5063 215797.288 225137.0278
Snowboard Bindings 31803.2739 154106.5029 172852.076 92869.0582
$100,000
$300,000
$500,000
$700,000
$900,000
$1,100,000
$1,300,000
Do
llar
Sal
es
Source: SIA RetailTRAK™ by the Leisure Trends Group for Specialty Shops. (Totals from Data Cubes)
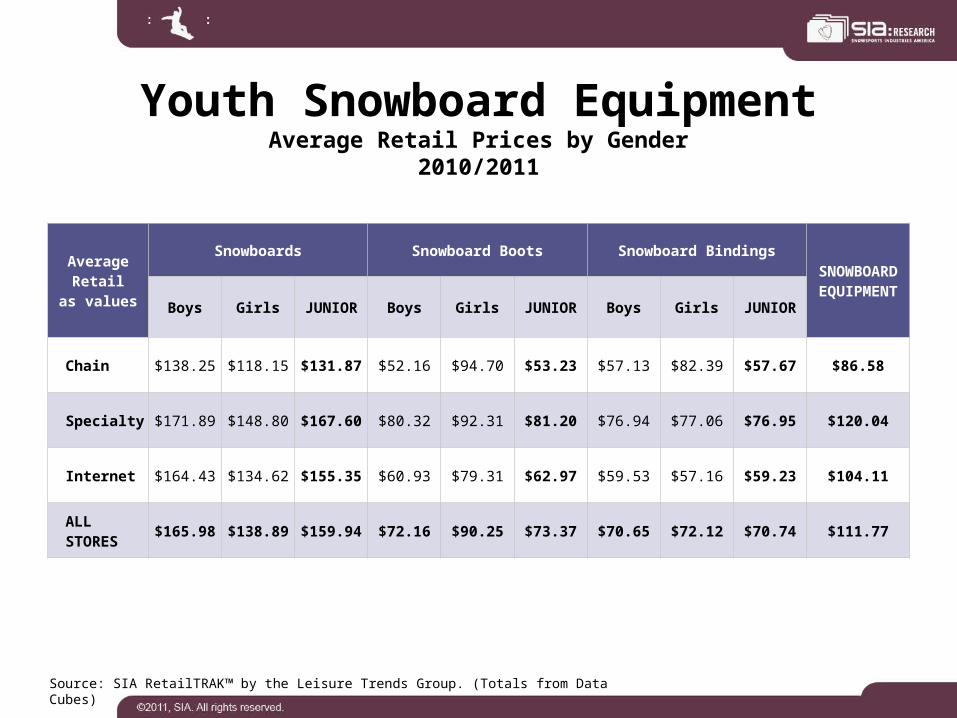
Youth Snowboard EquipmentAverage Retail Prices by Gender
2010/2011
Average Retail
as values
Snowboards Snowboard Boots Snowboard BindingsSNOWBOARD EQUIPMENT
Boys Girls JUNIOR Boys Girls JUNIOR Boys Girls JUNIOR
Chain $138.25 $118.15 $131.87 $52.16 $94.70 $53.23 $57.13 $82.39 $57.67 $86.58
Specialty $171.89 $148.80 $167.60 $80.32 $92.31 $81.20 $76.94 $77.06 $76.95 $120.04
Internet $164.43 $134.62 $155.35 $60.93 $79.31 $62.97 $59.53 $57.16 $59.23 $104.11
ALL STORES $165.98 $138.89 $159.94 $72.16 $90.25 $73.37 $70.65 $72.12 $70.74 $111.77
Source: SIA RetailTRAK™ by the Leisure Trends Group. (Totals from Data Cubes)
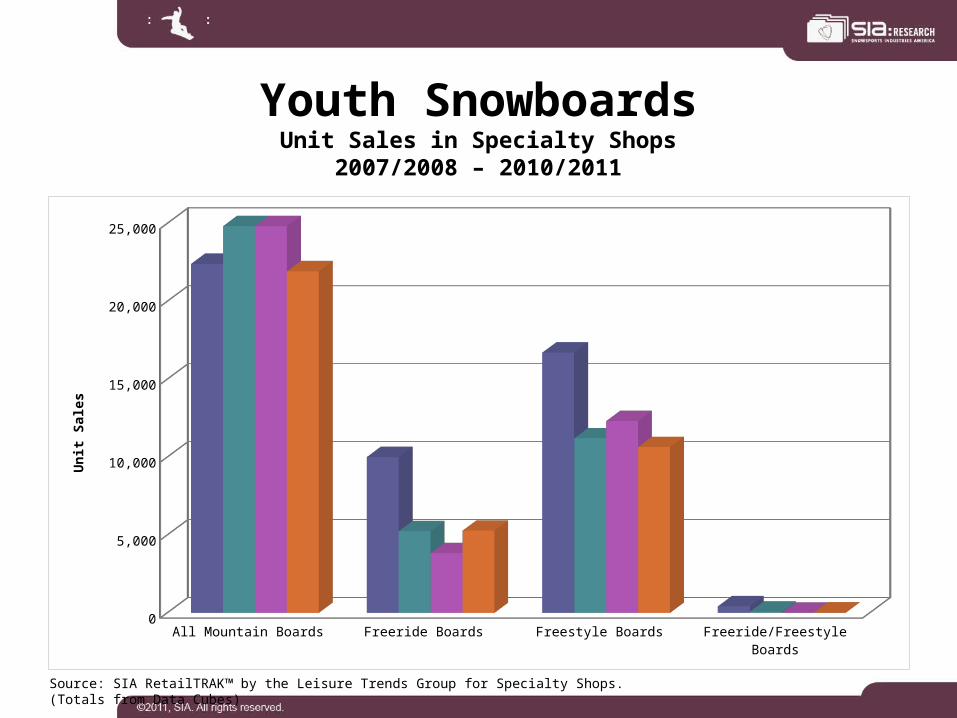
Youth SnowboardsUnit Sales in Specialty Shops
2007/2008 – 2010/2011
All Mountain Boards Freeride Boards Freestyle Boards Freeride/Freestyle Boards
2007/2008 22407.9986 10001.1843 16706.0665 418.0173
2008/2009 24822.7415 5240.8941 11211.5303 70.3371
2009/2010 24827.8545 3829.5507 12314.7894 0
2010/2011 21921.6947 5272.7684 10644.5682 6.8904
2,500
7,500
12,500
17,500
22,500
Un
it S
ales
Source: SIA RetailTRAK™ by the Leisure Trends Group for Specialty Shops. (Totals from Data Cubes)
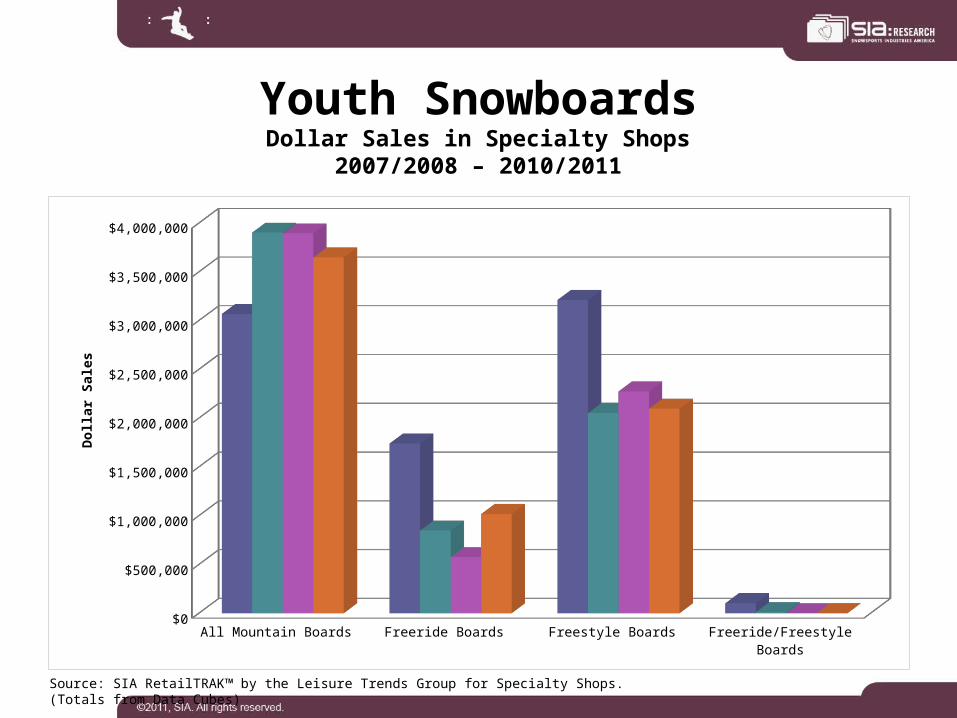
Youth SnowboardsDollar Sales in Specialty Shops
2007/2008 – 2010/2011
All Mountain Boards Freeride Boards Freestyle Boards Freeride/Freestyle Boards
2007/2008 3066588.794 1740493.735 3211798.9721 102436.4919
2008/2009 3902972.7658 848059.2167 2052351.564 11770.2365
2009/2010 3893948.21 573552.5342 2274597.4203 0
2010/2011 3647674.0616 1016985.8386 2097006.3252 1621.1646
$250,000
$750,000
$1,250,000
$1,750,000
$2,250,000
$2,750,000
$3,250,000
$3,750,000
Do
llar
Sal
es
Source: SIA RetailTRAK™ by the Leisure Trends Group for Specialty Shops. (Totals from Data Cubes)
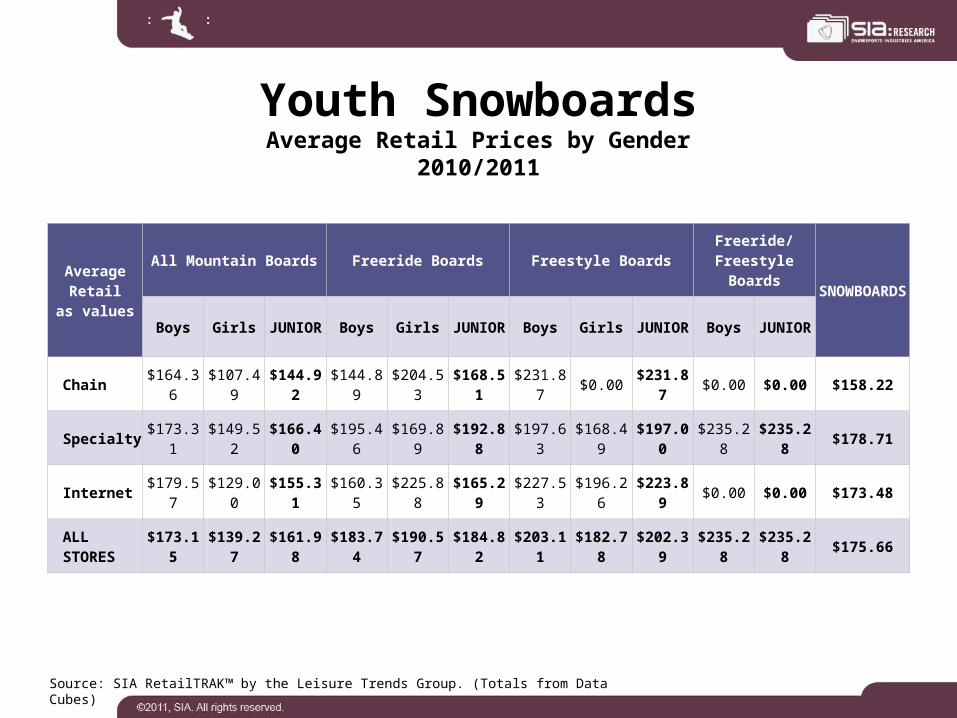
Youth SnowboardsAverage Retail Prices by Gender
2010/2011
Average Retail
as values
All Mountain Boards Freeride Boards Freestyle Boards Freeride/Freestyle Boards
SNOWBOARDS
Boys Girls JUNIOR Boys Girls JUNIOR Boys Girls JUNIOR Boys JUNIOR
Chain $164.36 $107.49 $144.92 $144.89 $204.53 $168.51 $231.87 $0.00 $231.87 $0.00 $0.00 $158.22
Specialty $173.31 $149.52 $166.40 $195.46 $169.89 $192.88 $197.63 $168.49 $197.00 $235.28 $235.28 $178.71
Internet $179.57 $129.00 $155.31 $160.35 $225.88 $165.29 $227.53 $196.26 $223.89 $0.00 $0.00 $173.48
ALL STORES $173.15 $139.27 $161.98 $183.74 $190.57 $184.82 $203.11 $182.78 $202.39 $235.28 $235.28 $175.66
Source: SIA RetailTRAK™ by the Leisure Trends Group. (Totals from Data Cubes)

Youth Snowboard BootsUnit Sales in Specialty Shops
2007/2008 – 2010/2011
2007/2008 2008/2009 2009/2010 2010/2011
Boys 28989.5108 26709.7199 25079.1823 23470.5061
Girls 531.7865 2701.7399 2492.4802 2479.6642
2,500
7,500
12,500
17,500
22,500
27,500
Un
it S
ales
Source: SIA RetailTRAK™ by the Leisure Trends Group for Specialty Shops. (Totals from Data Cubes)
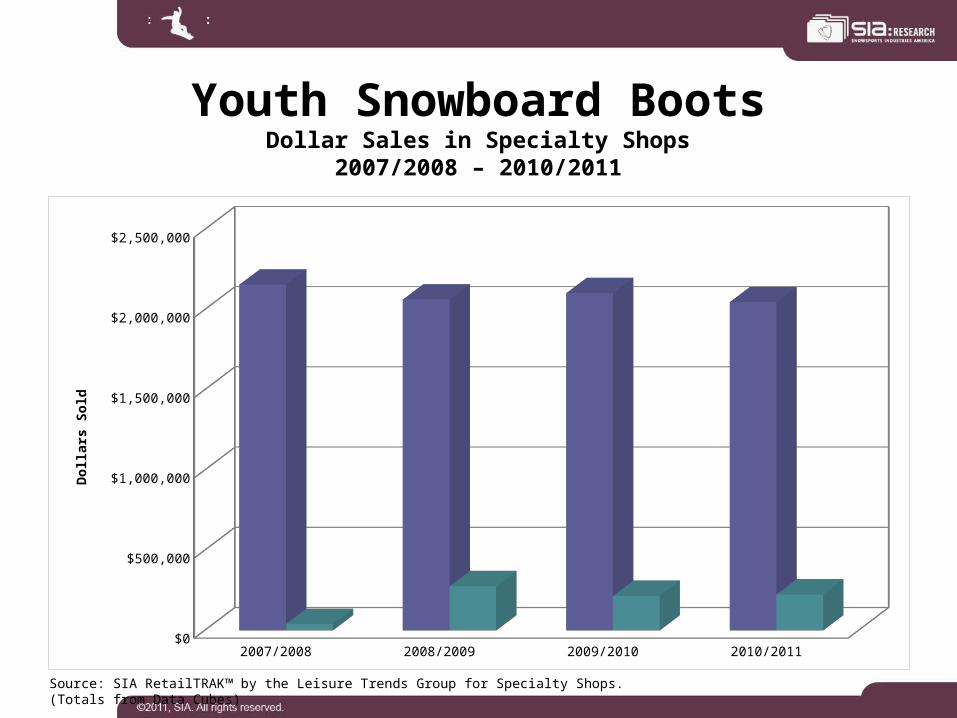
Youth Snowboard BootsDollar Sales in Specialty Shops
2007/2008 – 2010/2011
2007/2008 2008/2009 2009/2010 2010/2011
Boys 2157142.3768 2063888.1245 2103585.3435 2048705.0336
Girls 40466.8324 276062.5063 215797.288 225137.0278
$250,000
$750,000
$1,250,000
$1,750,000
$2,250,000
Do
llar
s S
old
Source: SIA RetailTRAK™ by the Leisure Trends Group for Specialty Shops. (Totals from Data Cubes)
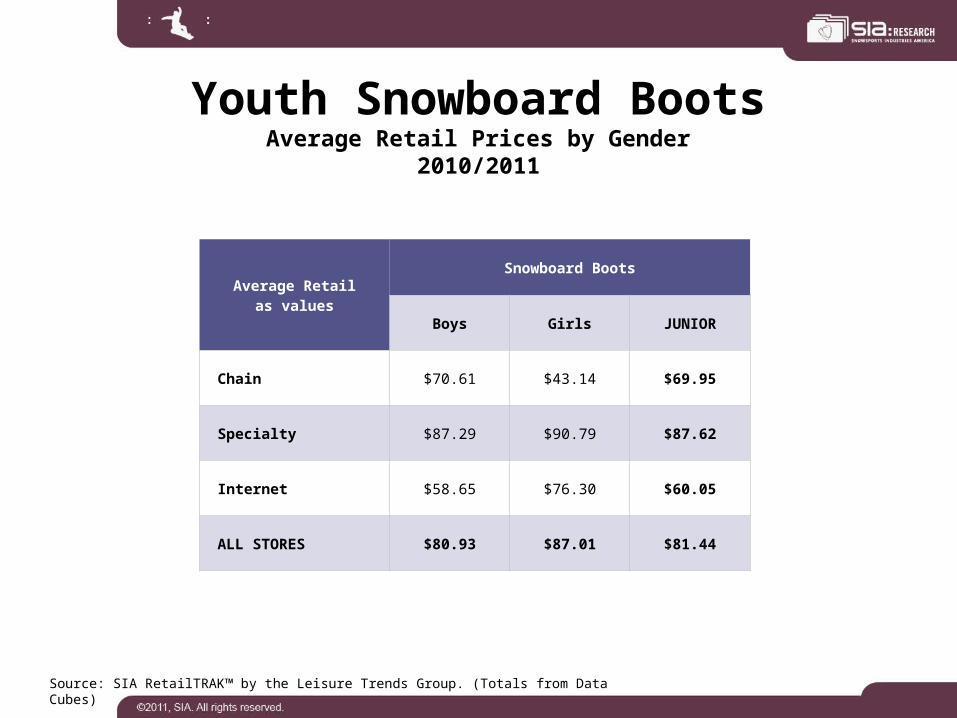
Youth Snowboard BootsAverage Retail Prices by Gender
2010/2011
Average Retailas values
Snowboard Boots
Boys Girls JUNIOR
Chain $70.61 $43.14 $69.95
Specialty $87.29 $90.79 $87.62
Internet $58.65 $76.30 $60.05
ALL STORES $80.93 $87.01 $81.44
Source: SIA RetailTRAK™ by the Leisure Trends Group. (Totals from Data Cubes)
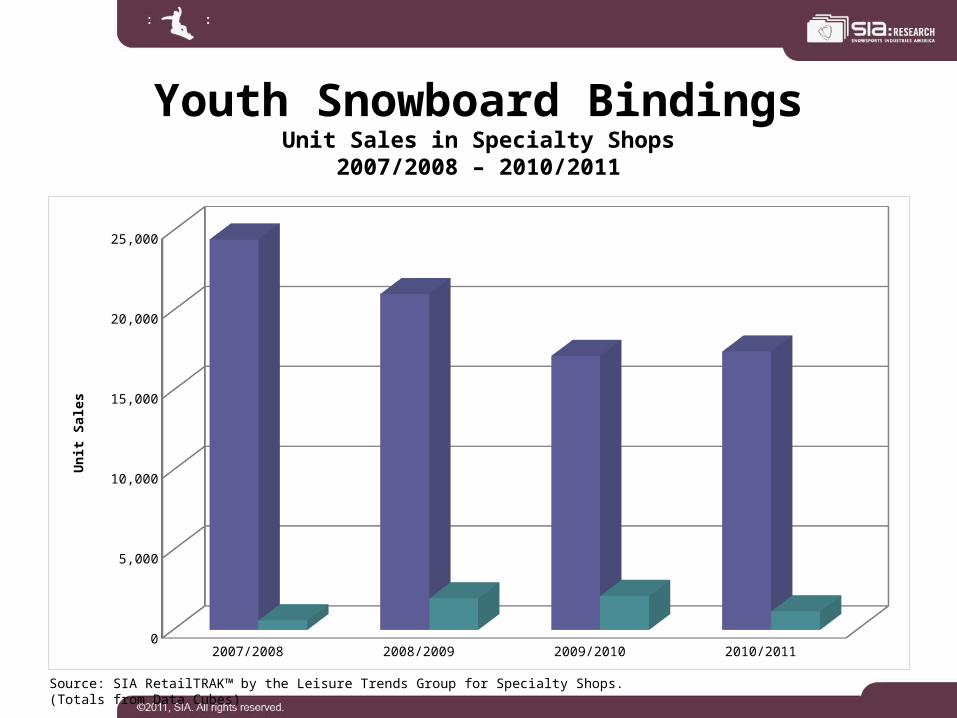
Youth Snowboard BindingsUnit Sales in Specialty Shops
2007/2008 – 2010/2011
2007/2008 2008/2009 2009/2010 2010/2011
Snowboard Bindings Boys 24445.4168 21039.8461 17157.6365 17432.4096
Snowboard Bindings Girls 595.2249 1979.1788 2125.3726 1161.0842
2,500
7,500
12,500
17,500
22,500
Un
it S
ales
Source: SIA RetailTRAK™ by the Leisure Trends Group for Specialty Shops. (Totals from Data Cubes)
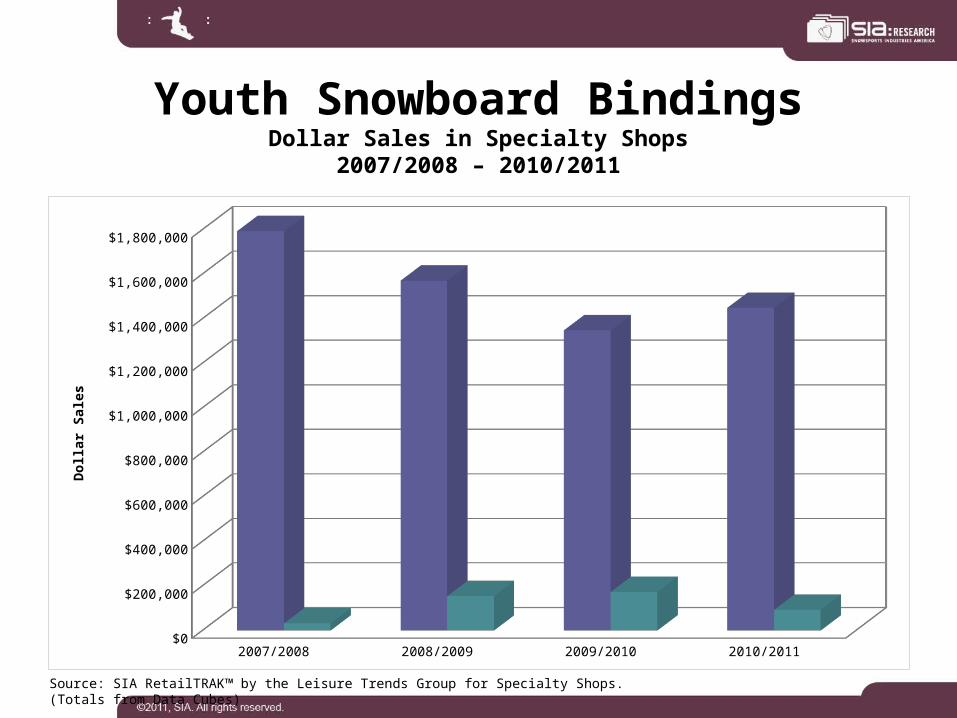
Youth Snowboard BindingsDollar Sales in Specialty Shops
2007/2008 – 2010/2011
2007/2008 2008/2009 2009/2010 2010/2011
Snowboard Bindings Boys 1793441.0876 1570587.4378 1348169.9129 1448741.0977
Snowboard Bindings Girls 31803.2739 154106.5029 172852.076 92869.0582
$100,000
$300,000
$500,000
$700,000
$900,000
$1,100,000
$1,300,000
$1,500,000
$1,700,000
Do
llar
Sal
es
Source: SIA RetailTRAK™ by the Leisure Trends Group for Specialty Shops. (Totals from Data Cubes)
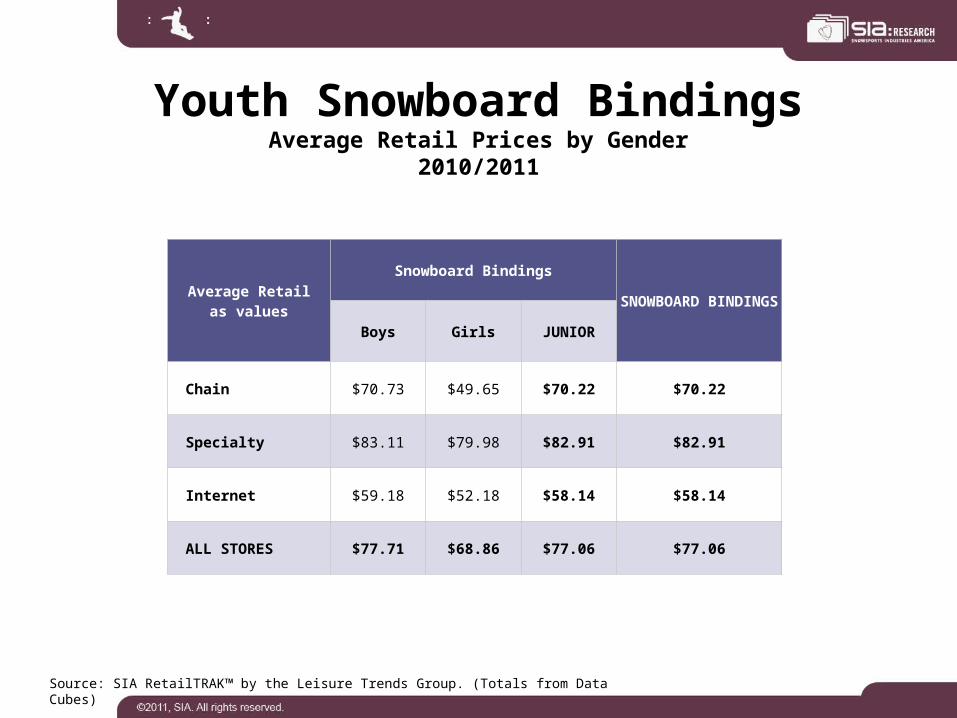
Youth Snowboard BindingsAverage Retail Prices by Gender
2010/2011
Average Retailas values
Snowboard Bindings
SNOWBOARD BINDINGS
Boys Girls JUNIOR
Chain $70.73 $49.65 $70.22 $70.22
Specialty $83.11 $79.98 $82.91 $82.91
Internet $59.18 $52.18 $58.14 $58.14
ALL STORES $77.71 $68.86 $77.06 $77.06
Source: SIA RetailTRAK™ by the Leisure Trends Group. (Totals from Data Cubes)
Youth Cross Country Skiing
Youth Cross Country SkiExecutive Summary
• 739,000 kids participated in cross country skiing in 2010; 8.7% are ages 6-12, 7.7% are ages 13-17.
• Cross country equipment sales were up in all categories last season, but still struggle to surpass the 2007/2008 season.– Youth XC skis up 3%– Youth XC boots up 6%– Youth XC bindings up 5%– Youth XC poles up 7%

Youth Cross Country Participation
6 to 17 18 +
Cross Country Participants 739000 3790000
250,000
750,000
1,250,000
1,750,000
2,250,000
2,750,000
3,250,000
3,750,000
Nu
mb
er o
f P
arti
cip
ants
Source: SIA/Physical Activities Council 2009/2010 Snow Sports Participation Study
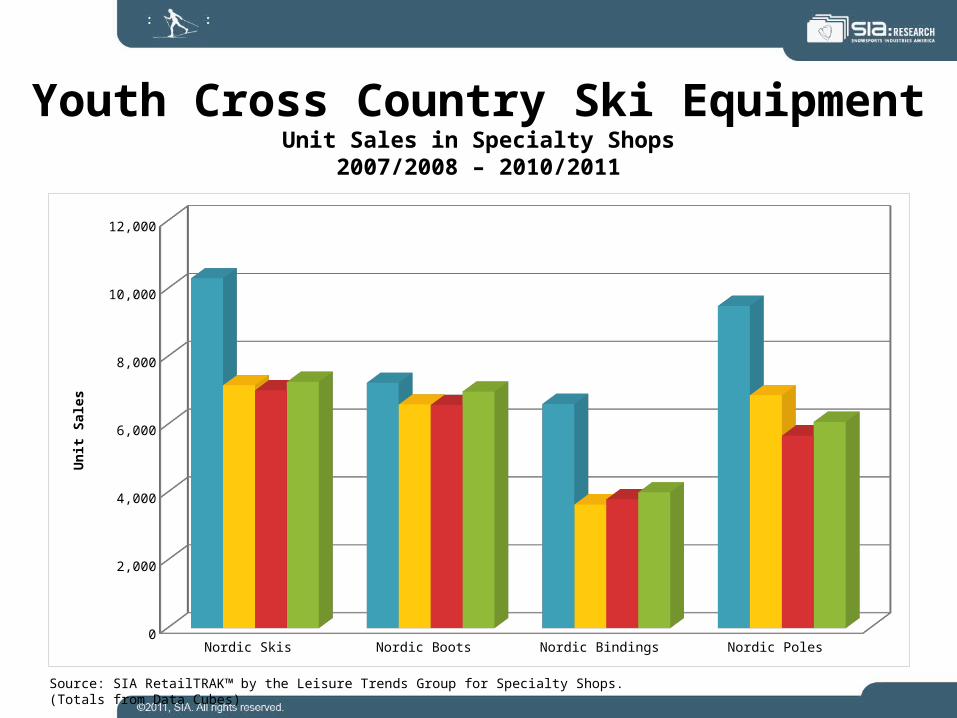
Youth Cross Country Ski EquipmentUnit Sales in Specialty Shops
2007/2008 – 2010/2011
Nordic Skis Nordic Boots Nordic Bindings Nordic Poles
2007/2008 10315.0338 7233.8654 6610.7851 9499.5901
2008/2009 7160.0081 6594.4121 3646.5284 6869.3607
2009/2010 7015.6 6576.5249 3797.0818 5677.2175
2010/2011 7259.9818 6974.2659 4002.2338 6081.1901
1,000
3,000
5,000
7,000
9,000
11,000
Un
it S
ales
Source: SIA RetailTRAK™ by the Leisure Trends Group for Specialty Shops. (Totals from Data Cubes)
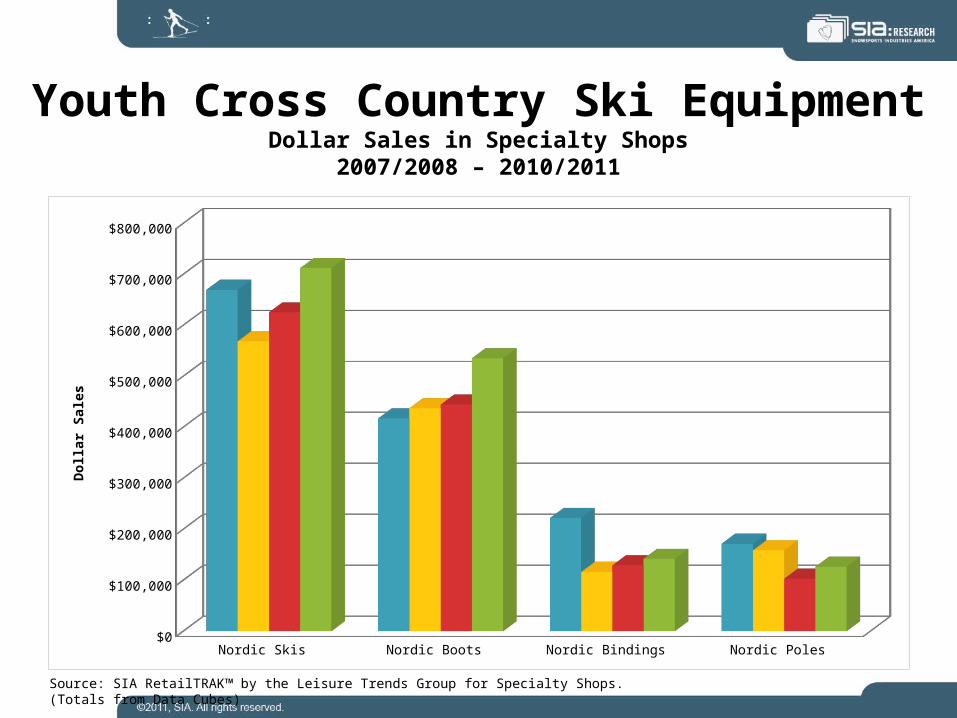
Youth Cross Country Ski EquipmentDollar Sales in Specialty Shops
2007/2008 – 2010/2011
Nordic Skis Nordic Boots Nordic Bindings Nordic Poles
2007/2008 670055.8497 417619.5811 222093.4651 171837.2134
2008/2009 568969.3513 437731.416 116256.9895 158720.0657
2009/2010 625560.6416 444840.7656 129332.8046 103478.059
2010/2011 712229.0698 535354.8422 142303.3239 126446.926
$50,000
$150,000
$250,000
$350,000
$450,000
$550,000
$650,000
$750,000
Do
llar
Sal
es
Source: SIA RetailTRAK™ by the Leisure Trends Group for Specialty Shops. (Totals from Data Cubes)
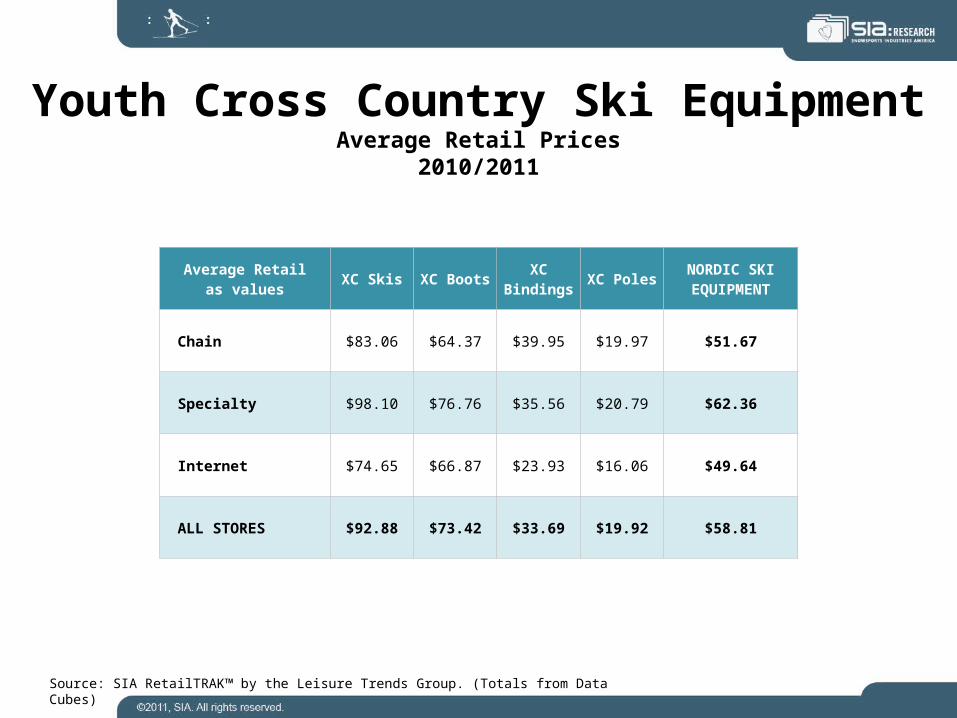
Youth Cross Country Ski EquipmentAverage Retail Prices
2010/2011
Average Retailas values XC Skis XC Boots XC
Bindings XC Poles NORDIC SKI EQUIPMENT
Chain $83.06 $64.37 $39.95 $19.97 $51.67
Specialty $98.10 $76.76 $35.56 $20.79 $62.36
Internet $74.65 $66.87 $23.93 $16.06 $49.64
ALL STORES $92.88 $73.42 $33.69 $19.92 $58.81
Source: SIA RetailTRAK™ by the Leisure Trends Group. (Totals from Data Cubes)

Youth Snowshoe

Youth Snowshoe Participation
6 to 12 18 +
Snowshoe Participation 616000 3586000
250,000
750,000
1,250,000
1,750,000
2,250,000
2,750,000
3,250,000
3,750,000
Nu
mb
er o
f P
arti
cip
ants
Source: SIA/Physical Activities Council 2009/2010 Snow Sports Participation Study
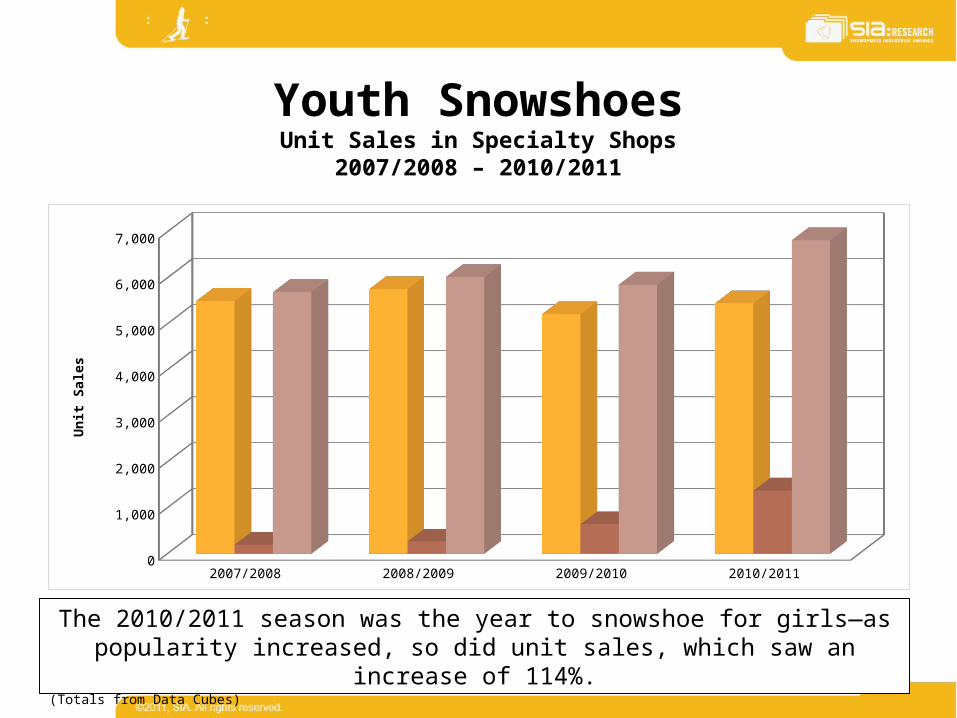
Youth SnowshoesUnit Sales in Specialty Shops
2007/2008 – 2010/2011
2007/2008 2008/2009 2009/2010 2010/2011
Snowshoes Boys 5495.5615 5753.5873 5210.1557 5445.4197
Snowshoes Girls 195.9326 264.7037 642.3338 1372.9366
Snowshoes Junior 5691.4941 6018.291 5852.4895 6818.3563
500
1,500
2,500
3,500
4,500
5,500
6,500
Un
it S
ales
Source: SIA RetailTRAK™ by the Leisure Trends Group for Specialty Shops. (Totals from Data Cubes)
The 2010/2011 season was the year to snowshoe for girls—as popularity increased, so did unit sales, which saw an increase of 114%.
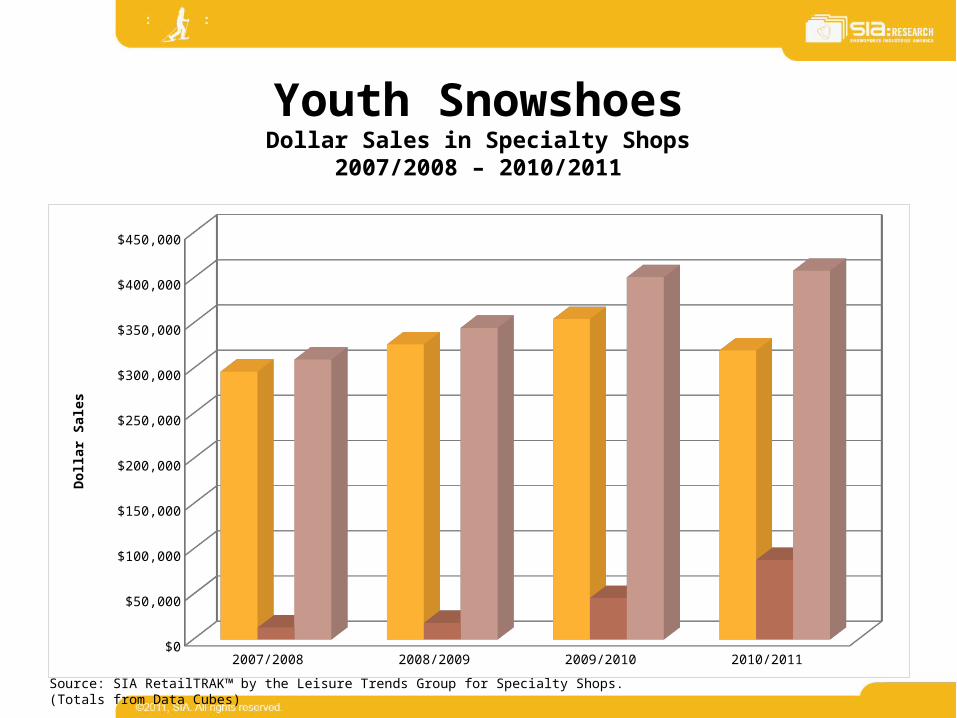
Youth SnowshoesDollar Sales in Specialty Shops
2007/2008 – 2010/2011
2007/2008 2008/2009 2009/2010 2010/2011
Snowshoes Boys 296800.1964 326701.4297 354940.1691 320023.4189
Snowshoes Girls 13362.9901 18613.4262 46290.2178 88416.504
Snowshoes Junior 310163.1865 345314.8559 401230.3869 408439.9229
$25,000
$75,000
$125,000
$175,000
$225,000
$275,000
$325,000
$375,000
$425,000
Do
llar
Sal
es
Source: SIA RetailTRAK™ by the Leisure Trends Group for Specialty Shops. (Totals from Data Cubes)
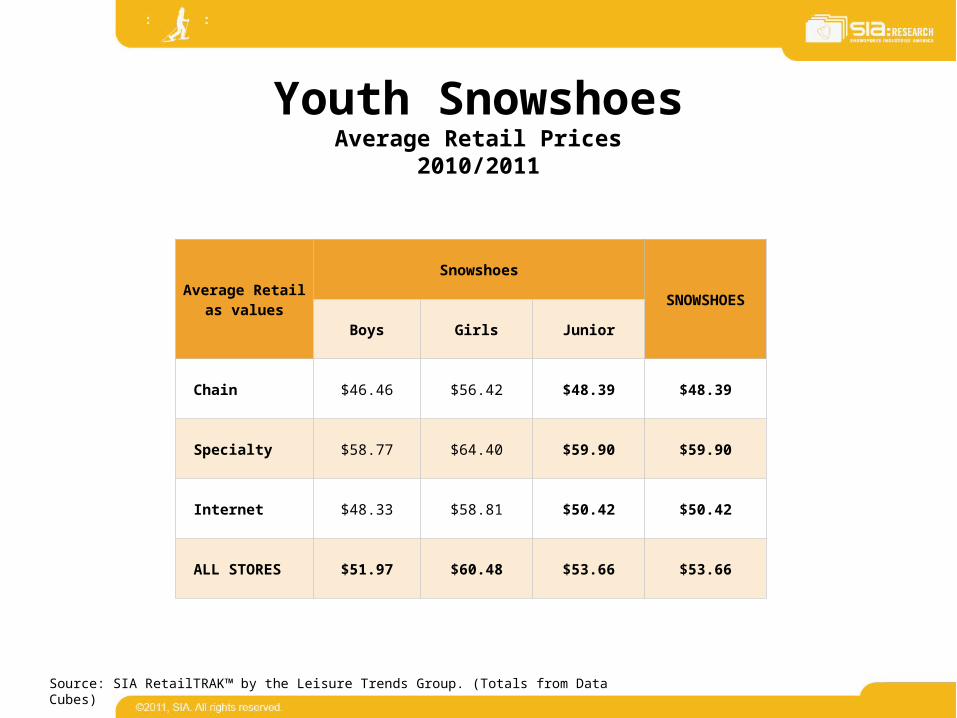
Youth SnowshoesAverage Retail Prices
2010/2011
Average Retailas values
Snowshoes
SNOWSHOES
Boys Girls Junior
Chain $46.46 $56.42 $48.39 $48.39
Specialty $58.77 $64.40 $59.90 $59.90
Internet $48.33 $58.81 $50.42 $50.42
ALL STORES $51.97 $60.48 $53.66 $53.66
Source: SIA RetailTRAK™ by the Leisure Trends Group. (Totals from Data Cubes)
Youth Apparel
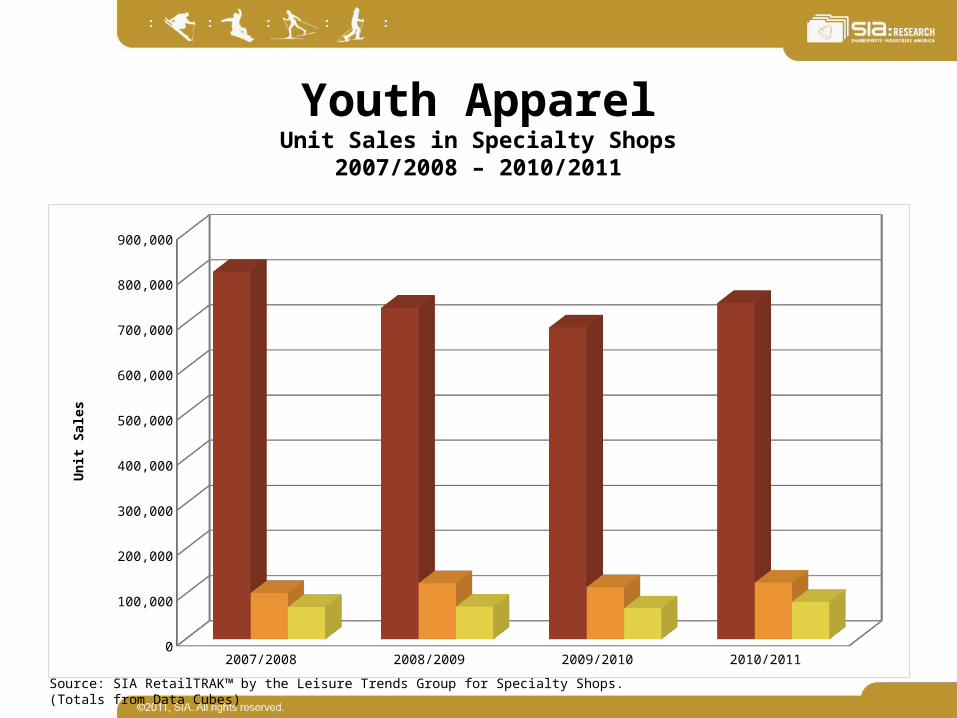
Youth ApparelUnit Sales in Specialty Shops
2007/2008 – 2010/2011
2007/2008 2008/2009 2009/2010 2010/2011
Alpine Apparel 814974.1051 735207.0224 691441.9716 745804.1903
Snowboard Apparel 102815.6678 124658.908 115969.9596 125942.7872
Other Apparel 72006.546 72682.9556 68993.0529 83196.5224
50,000
150,000
250,000
350,000
450,000
550,000
650,000
750,000
850,000
Un
it S
ales
Source: SIA RetailTRAK™ by the Leisure Trends Group for Specialty Shops. (Totals from Data Cubes)
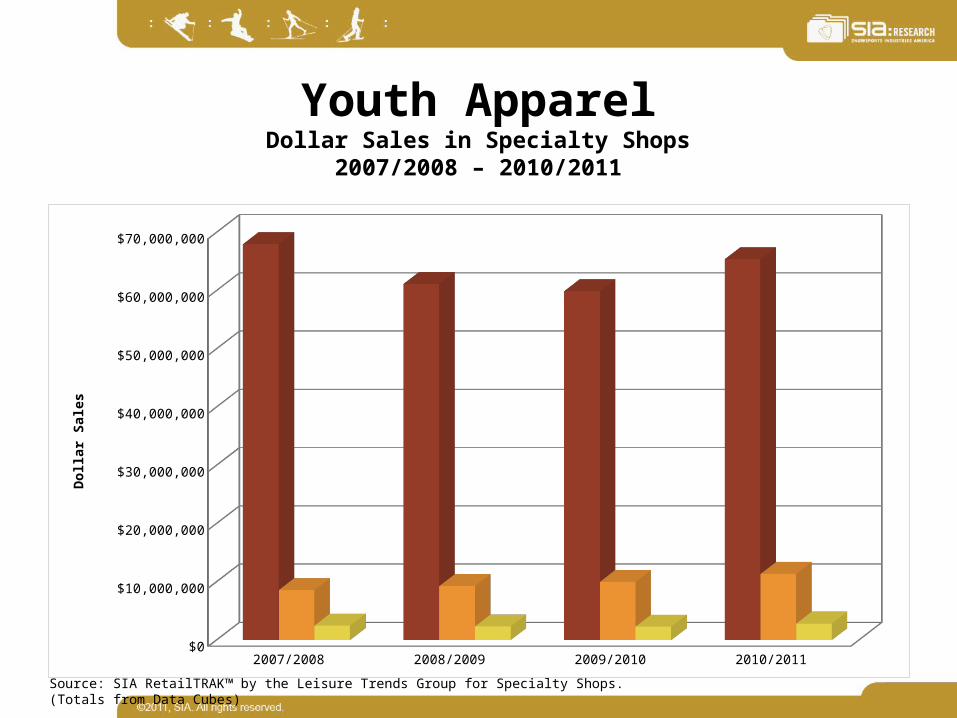
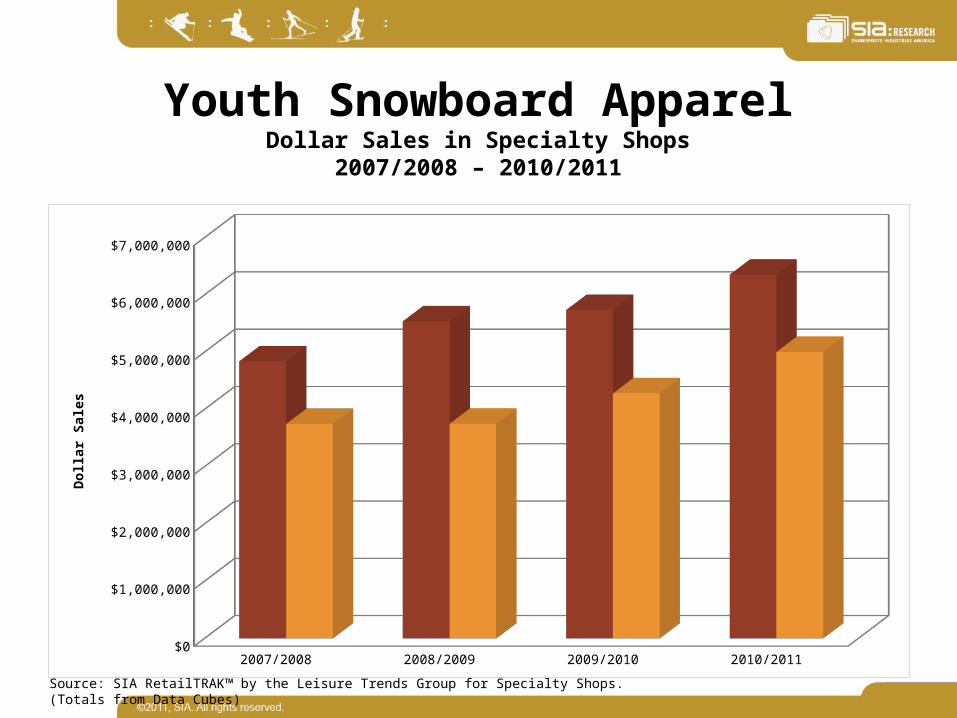
Youth ApparelDollar Sales in Specialty Shops
2007/2008 – 2010/2011
2007/2008 2008/2009 2009/2010 2010/2011
Alpine Apparel 68025594.8356 61190122.9022 59944094.2746 65433456.5209
Snowboard Apparel 8591621.8562 9291135.2507 10017992.172 11359479.6033
Other Apparel 2499173.6163 2364428.0674 2318444.5885 2836675.4844
$5,000,000
$15,000,000
$25,000,000
$35,000,000
$45,000,000
$55,000,000
$65,000,000
Do
llar
Sal
es
Source: SIA RetailTRAK™ by the Leisure Trends Group for Specialty Shops. (Totals from Data Cubes)
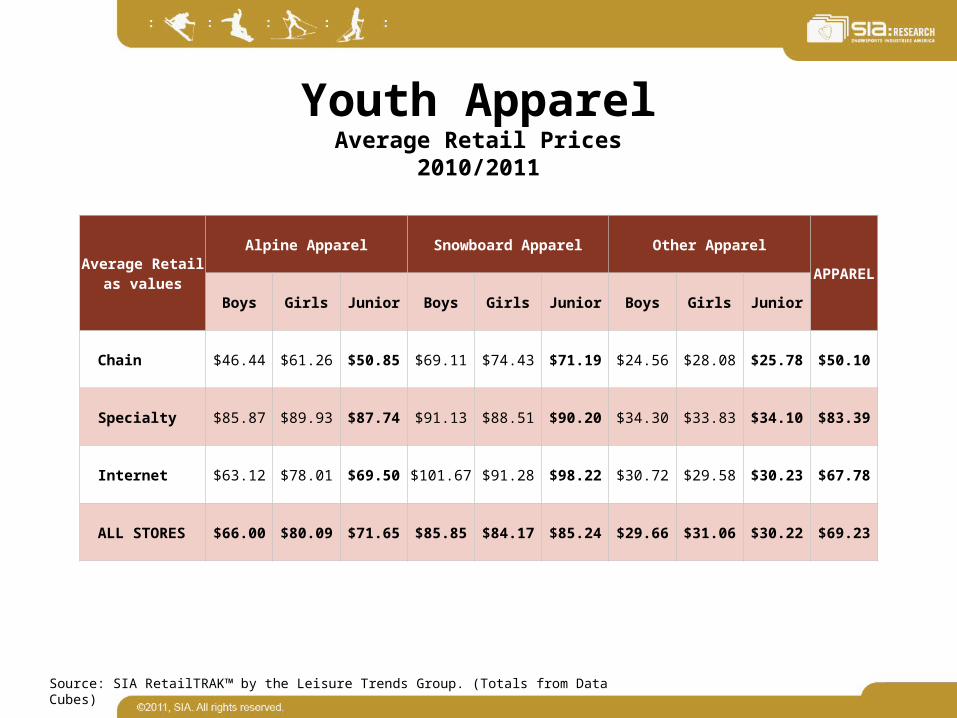
Youth ApparelAverage Retail Prices
2010/2011
Average Retailas values
Alpine Apparel Snowboard Apparel Other Apparel
APPAREL
Boys Girls Junior Boys Girls Junior Boys Girls Junior
Chain $46.44 $61.26 $50.85 $69.11 $74.43 $71.19 $24.56 $28.08 $25.78 $50.10
Specialty $85.87 $89.93 $87.74 $91.13 $88.51 $90.20 $34.30 $33.83 $34.10 $83.39
Internet $63.12 $78.01 $69.50 $101.67 $91.28 $98.22 $30.72 $29.58 $30.23 $67.78
ALL STORES $66.00 $80.09 $71.65 $85.85 $84.17 $85.24 $29.66 $31.06 $30.22 $69.23
Source: SIA RetailTRAK™ by the Leisure Trends Group. (Totals from Data Cubes)
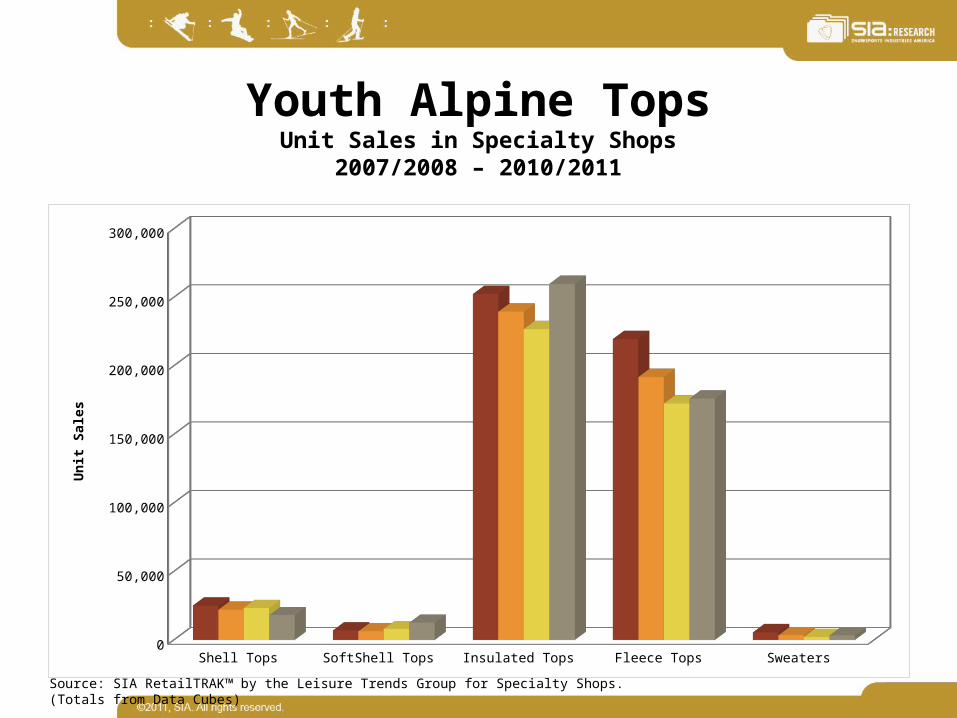
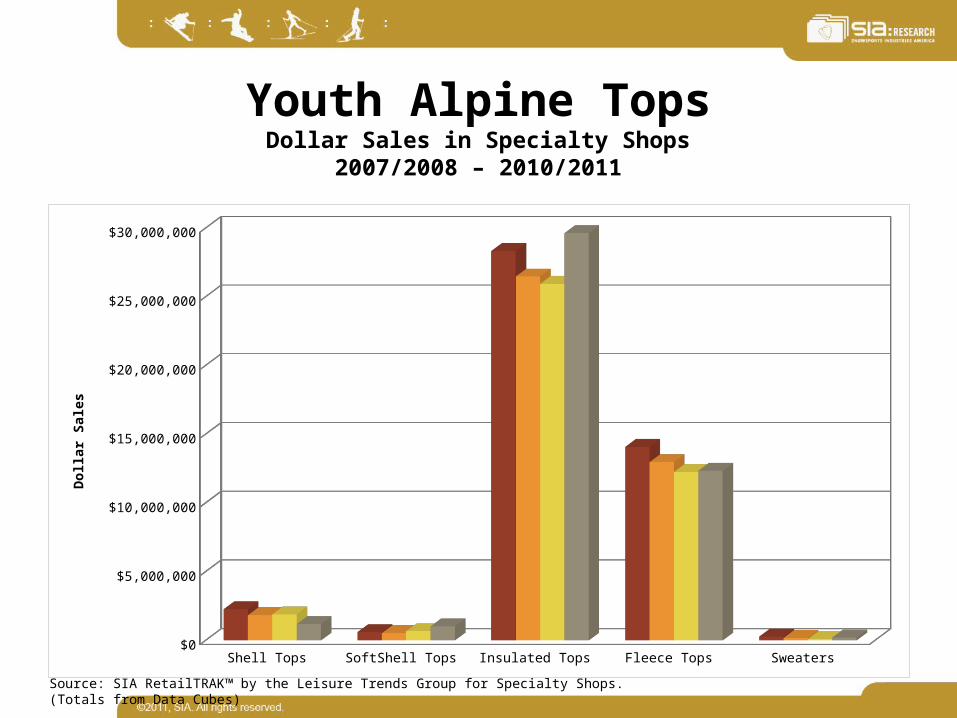
Youth Alpine TopsUnit Sales in Specialty Shops
2007/2008 – 2010/2011
Shell Tops SoftShell Tops Insulated Tops Fleece Tops Sweaters
2007/2008 25073.1553 6946.4025 252382.851 219548.1675 5566.3618
2008/2009 22042.5189 6305.5155 239524.6236 191861.612 3434.8975
2009/2010 23333.6962 7929.5058 226791.6834 172460.6145 2200.7122
2010/2011 18162.0301 12568.4182 259757.575 176022.0546 3241.9816
25,000
75,000
125,000
175,000
225,000
275,000
Un
it S
ales
Source: SIA RetailTRAK™ by the Leisure Trends Group for Specialty Shops. (Totals from Data Cubes)
Youth Alpine TopsDollar Sales in Specialty Shops
2007/2008 – 2010/2011
Shell Tops SoftShell Tops Insulated Tops Fleece Tops Sweaters
2007/2008 2272159.4293 605958.388 28344391.3375 14083947.0915 271876.059
2008/2009 1844010.6505 531640.3779 26486285.0095 12979213.1639 177172.3069
2009/2010 1892173.0573 669635.2994 25950029.3938 12263067.3025 99479.2821
2010/2011 1191656.5491 1019091.2852 29638714.5294 12345645.7166 208644.2425
$2,500,000
$7,500,000
$12,500,000
$17,500,000
$22,500,000
$27,500,000
Do
llar
Sal
es
Source: SIA RetailTRAK™ by the Leisure Trends Group for Specialty Shops. (Totals from Data Cubes)
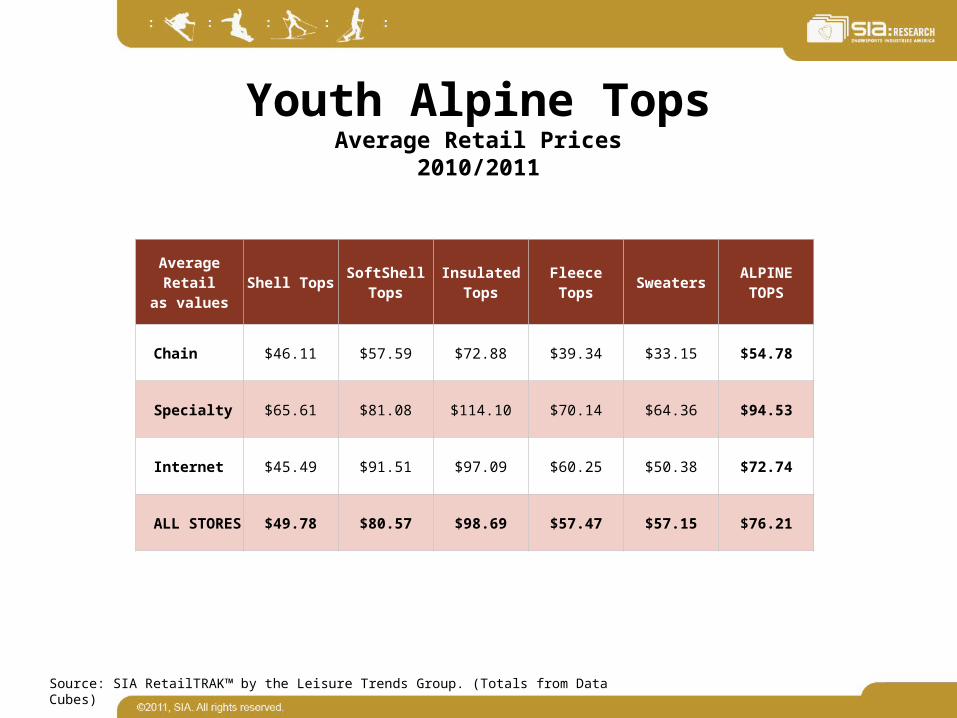
Youth Alpine TopsAverage Retail Prices
2010/2011
Average Retailas values Shell Tops SoftShell
TopsInsulated
Tops Fleece Tops Sweaters ALPINE TOPS
Chain $46.11 $57.59 $72.88 $39.34 $33.15 $54.78
Specialty $65.61 $81.08 $114.10 $70.14 $64.36 $94.53
Internet $45.49 $91.51 $97.09 $60.25 $50.38 $72.74
ALL STORES $49.78 $80.57 $98.69 $57.47 $57.15 $76.21
Source: SIA RetailTRAK™ by the Leisure Trends Group. (Totals from Data Cubes)
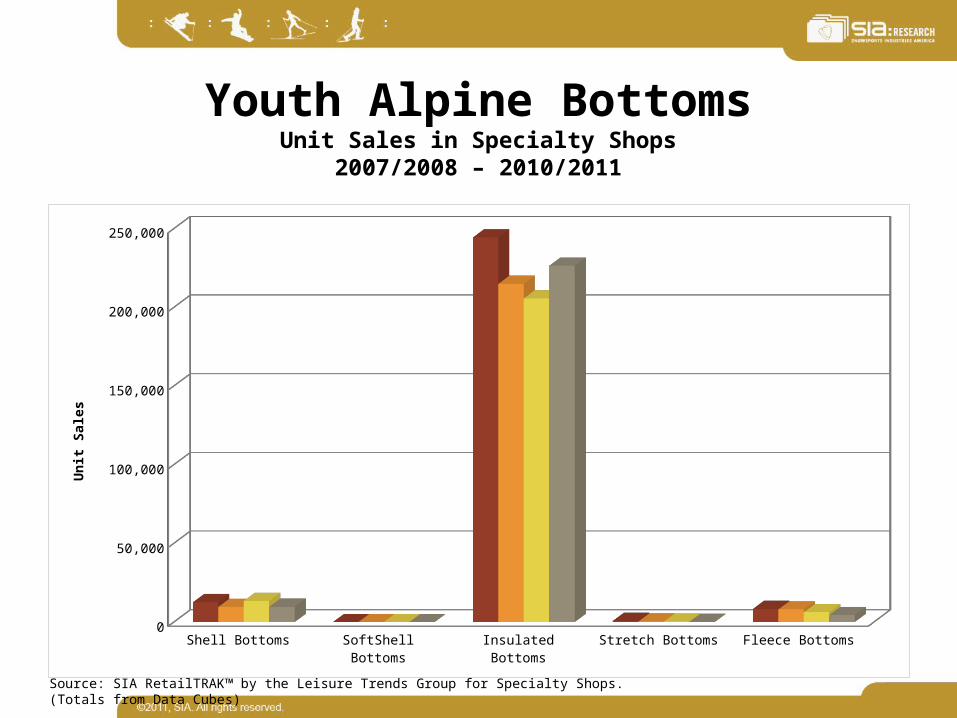
Youth Alpine BottomsUnit Sales in Specialty Shops
2007/2008 – 2010/2011
Shell Bottoms SoftShell Bottoms Insulated Bottoms Stretch Bottoms Fleece Bottoms
2007/2008 12575.8398 49.3258 244393.5747 850.3941 8403.7302
2008/2009 9666.7337 17.5246 214937.3615 439.0288 8078.2019
2009/2010 13407.5351 3.6444 205700.6211 382.8798 6266.3942
2010/2011 9794.6868 15.4887 226401.4826 101.3582 4554.0442
25,000
75,000
125,000
175,000
225,000
Un
it S
ales
Source: SIA RetailTRAK™ by the Leisure Trends Group for Specialty Shops. (Totals from Data Cubes)

Youth Alpine BottomsDollar Sales in Specialty Shops
2007/2008 – 2010/2011
Shell Bottoms SoftShell Bottoms Insulated Bottoms Stretch Bottoms Fleece Bottoms
2007/2008 744249.423 1183.8192 17697204.8759 88543.9192 324024.5021
2008/2009 485677.4011 1394.9582 15026280.1434 59797.7613 273436.649
2009/2010 817584.626 364.44 15125959.6948 47118.3366 177322.1724
2010/2011 521372.0166 1239.096 17414940.9241 11026.0551 126200.3838
$1,000,000
$3,000,000
$5,000,000
$7,000,000
$9,000,000
$11,000,000
$13,000,000
$15,000,000
$17,000,000
Do
llar
Sal
es
Source: SIA RetailTRAK™ by the Leisure Trends Group for Specialty Shops. (Totals from Data Cubes)
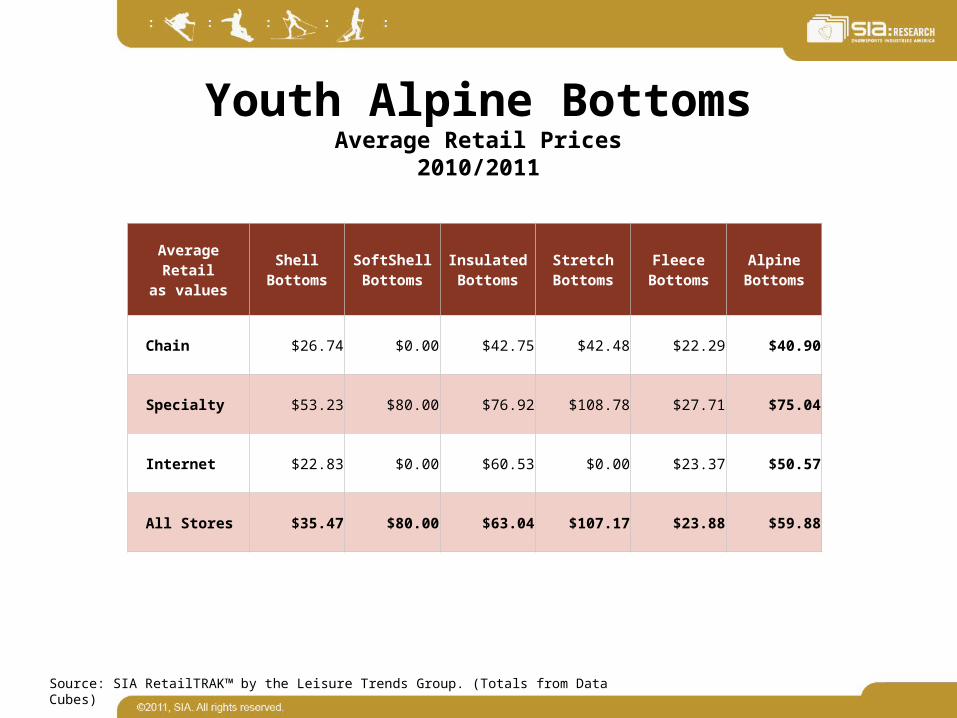
Youth Alpine BottomsAverage Retail Prices
2010/2011
Average Retailas values
Shell Bottoms
SoftShell Bottoms
Insulated Bottoms
Stretch Bottoms
Fleece Bottoms
Alpine Bottoms
Chain $26.74 $0.00 $42.75 $42.48 $22.29 $40.90
Specialty $53.23 $80.00 $76.92 $108.78 $27.71 $75.04
Internet $22.83 $0.00 $60.53 $0.00 $23.37 $50.57
All Stores $35.47 $80.00 $63.04 $107.17 $23.88 $59.88
Source: SIA RetailTRAK™ by the Leisure Trends Group. (Totals from Data Cubes)

Youth Snowboard ApparelUnit Sales in Specialty Shops
2007/2008 – 2010/2011
2007/2008 2008/2009 2009/2010 2010/2011
Snowboard Tops 51817.2784 67635.6656 59867.754 63916.965
Snowboard Bottoms 50998.3894 57023.2424 56102.2056 62025.8222
5,000
15,000
25,000
35,000
45,000
55,000
65,000
Un
it S
ales
Source: SIA RetailTRAK™ by the Leisure Trends Group for Specialty Shops. (Totals from Data Cubes)
Youth Snowboard ApparelDollar Sales in Specialty Shops
2007/2008 – 2010/2011
2007/2008 2008/2009 2009/2010 2010/2011
Snowboard Tops 4844033.9008 5539455.3117 5737219.5427 6354526.4265
Snowboard Bottoms 3747587.9554 3751679.939 4280772.6293 5004953.1768
$500,000
$1,500,000
$2,500,000
$3,500,000
$4,500,000
$5,500,000
$6,500,000
Do
llar
Sal
es
Source: SIA RetailTRAK™ by the Leisure Trends Group for Specialty Shops. (Totals from Data Cubes)
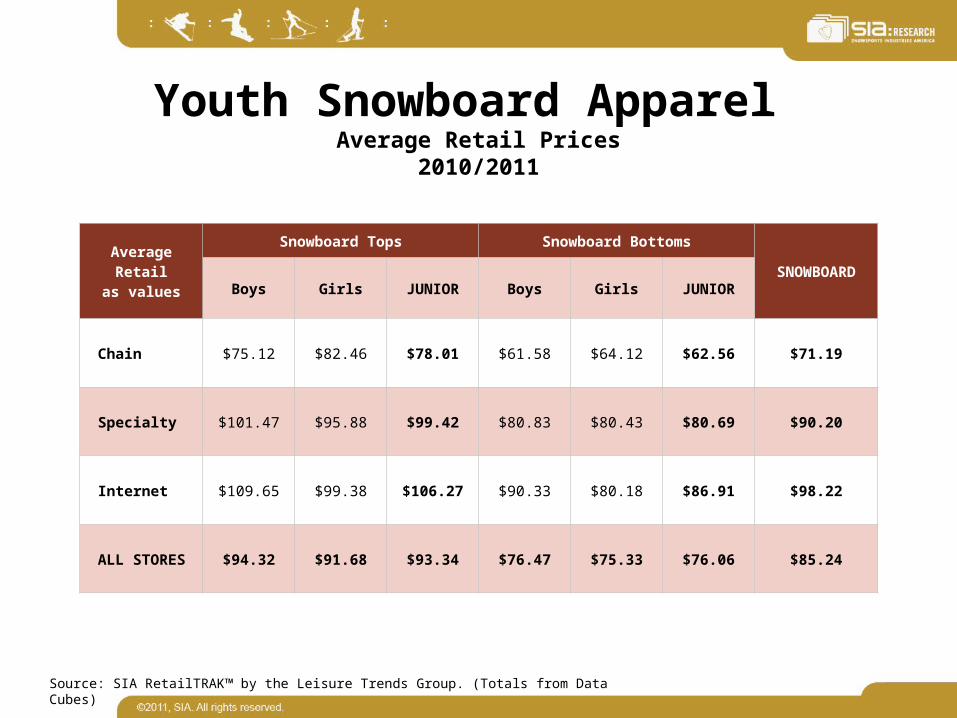
Youth Snowboard Apparel Average Retail Prices
2010/2011
Average Retailas values
Snowboard Tops Snowboard BottomsSNOWBOARD
Boys Girls JUNIOR Boys Girls JUNIOR
Chain $75.12 $82.46 $78.01 $61.58 $64.12 $62.56 $71.19
Specialty $101.47 $95.88 $99.42 $80.83 $80.43 $80.69 $90.20
Internet $109.65 $99.38 $106.27 $90.33 $80.18 $86.91 $98.22
ALL STORES $94.32 $91.68 $93.34 $76.47 $75.33 $76.06 $85.24
Source: SIA RetailTRAK™ by the Leisure Trends Group. (Totals from Data Cubes)
Youth Equipment Accessories
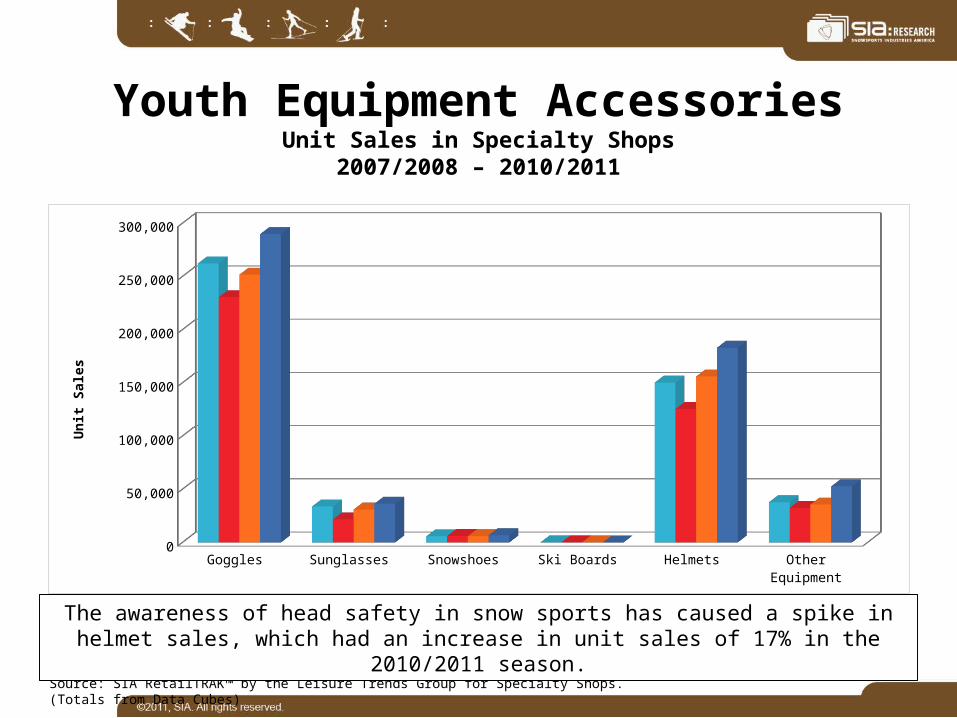
Youth Equipment AccessoriesUnit Sales in Specialty Shops
2007/2008 – 2010/2011
Goggles Sunglasses Snowshoes Ski Boards Helmets Other Equipment
2007/2008 262254.0059 33869.0973 5691.4941 132.7658 150286.0825 37749.003
2008/2009 230383.3722 21739.988 6018.291 43.9274 125412.426 32459.7295
2009/2010 251714.2147 30925.1927 5852.4895 67.7203 156007.7589 35622.6967
2010/2011 289880.6175 36415.5451 6818.3563 16.2173 183010.188 52699.025
25,000
75,000
125,000
175,000
225,000
275,000
Un
it S
ales
Source: SIA RetailTRAK™ by the Leisure Trends Group for Specialty Shops. (Totals from Data Cubes)
The awareness of head safety in snow sports has caused a spike in helmet sales, which had an increase in unit sales of 17% in the 2010/2011 season.
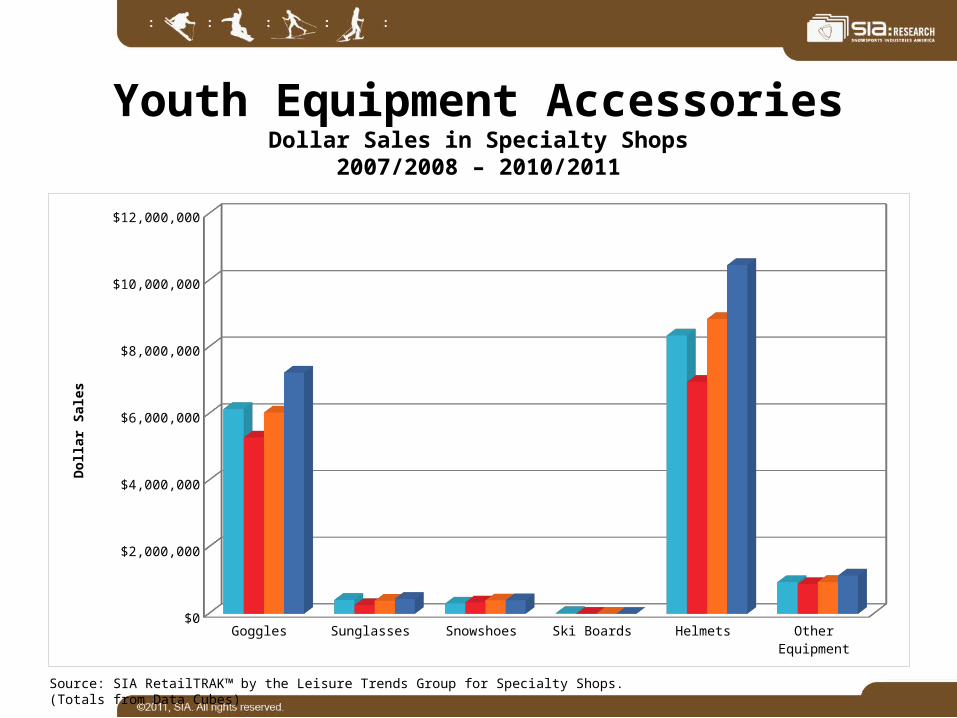
Youth Equipment AccessoriesDollar Sales in Specialty Shops
2007/2008 – 2010/2011
Goggles Sunglasses Snowshoes Ski Boards Helmets Other Equipment
2007/2008 6147708.5797 418590.7545 310163.1865 21451.6091 8351254.9673 954774.3345
2008/2009 5292739.5002 261061.2195 345314.8559 3570.3936 6955306.2077 891464.4763
2009/2010 6038548.6652 392261.1345 401230.3869 5126.643 8848907.6831 957644.6543
2010/2011 7238189.2654 451559.9781 408439.9229 1383.2715 10465150.0916 1147437.1074
$1,000,000
$3,000,000
$5,000,000
$7,000,000
$9,000,000
$11,000,000
Do
llar
Sal
es
Source: SIA RetailTRAK™ by the Leisure Trends Group for Specialty Shops. (Totals from Data Cubes)
Youth Apparel Accessories
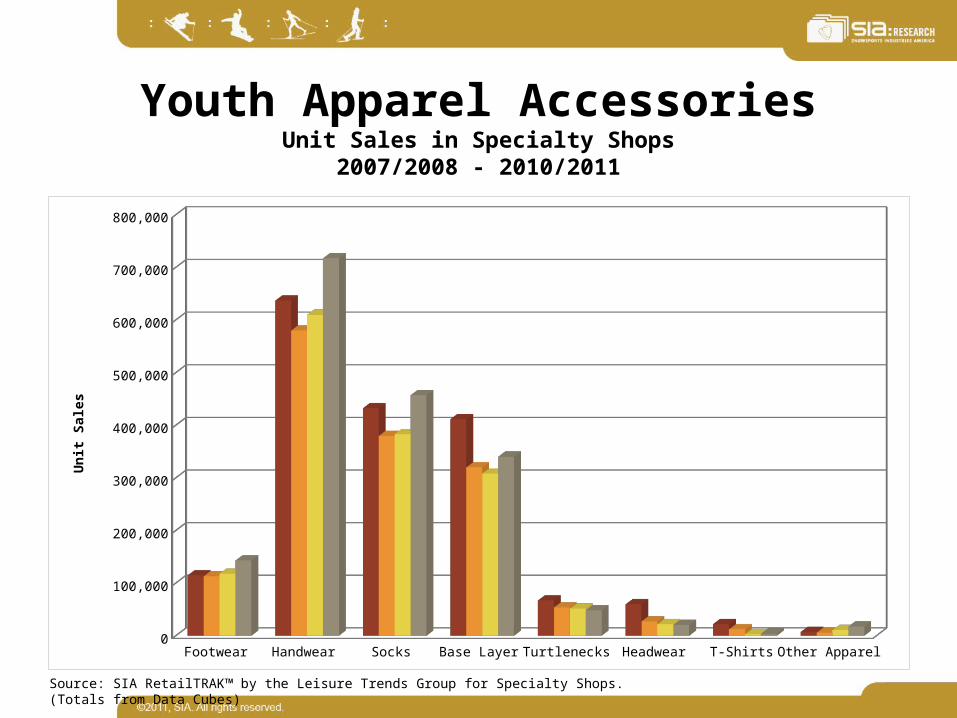
Youth Apparel AccessoriesUnit Sales in Specialty Shops
2007/2008 - 2010/2011
Footwear Handwear Socks Base Layer Turtlenecks Headwear T-Shirts Other Apparel
2007/2008 114751.7143 636803.1356 432270.3778 411502.9673 67167.309 59664.0408 22212.4271 7223.9432
2008/2009 113112.2959 579989.5041 379621.6642 319987.6788 53634.6604 27218.0852 12133.0633 5796.3242
2009/2010 117922.024 609913.6562 382971.6963 307851.4751 51591.3361 21752.5015 2829.6649 11091.777
2010/2011 142928.2643 717325.7308 457154.2986 340146.8161 48282.265 20644.5282 3888.6725 17620.8527
50,000
150,000
250,000
350,000
450,000
550,000
650,000
750,000
Un
it S
ales
Source: SIA RetailTRAK™ by the Leisure Trends Group for Specialty Shops. (Totals from Data Cubes)

Youth Apparel AccessoriesDollar Sales in Specialty Shops
2007/2008 – 2010/2011
Footwear Handwear Socks Base Layer Turtlenecks Headwear T-Shirts Other Apparel
2007/2008
5233475.1393 14310406.8723
5017825.8967 10956650.3352
2664706.5509 1325599.5778 340339.7394 145629.9976
2008/2009
5074832.0925 13523571.7037
4635308.0411 8992314.5758 1995625.012 571280.1844 191246.8617 132361.5691
2009/2010
5810141.9923 14943138.7966
5018297.0541 8973306.1283 2192277.6878 470142.0655 43665.6685 236081.7963
2010/2011
7174714.9783 18087347.307 6088815.1161 10323057.2106
2108973.1427 457799.8208 60565.9274 383714.287
$1,000,000
$3,000,000
$5,000,000
$7,000,000
$9,000,000
$11,000,000
$13,000,000
$15,000,000
$17,000,000
$19,000,000
Do
llar
Sal
es
Source: SIA RetailTRAK™ by the Leisure Trends Group for Specialty Shops. (Totals from Data Cubes)
Appendix
Methodology and Sample SizeSIA RetailTRAK™ by the Leisure Trends Group
This snow sport retail audit monitors retail sales and inventory levels by using a representative sample of retail stores throughout the country that sell alpine, Nordic and snowboard merchandise. The sample stores send to Leisure Trends their month-end sales and inventory files.
While specialty stores report inventory data, chain & Internet stores do not. The end of October reports (sales from August, 2010 through the end of October, 2010) represents data from urban and suburban locations. In a normal year, resort shops report sales beginning in the month of November.
The data from panel stores are used to create a computer model that projects the sample data to the total population of stores selling alpine, Nordic and snowboard merchandise. In 2010 we conducted a distribution survey of snow sport stores and identified around 1,900 specialty storefronts and 1,634 chain store fronts. Each year, there are changes to the panel. These changes are caused by any number of reasons including closed stores, unwillingness to cooperate, data integrity issues and panel refinements.

SIA RetailTRAK™ by the Leisure Trends GroupRetail Sales Channel Outline
The following table represents the 2010/11 snow sport panels by channel of distribution.
Store Definitions:
Specialty Stores: Single and multiple store retail organizations that concentrate their merchandise at medium and high price points. These stores typically provide a higher level of service and are independently owned and operated.
Chain Stores: Retail organizations that operate stores throughout either a regional or national area. Merchandise is centered in the medium and lower price points. Additionally, chain stores tend to promote heavily and discount deeper than specialty stores.
Internet/Catalog: The panel of internet/catalog merchants comprises the core pure play e-commerce & catalog retailers as well as chain and specialty brick & mortar retailers that have an online presence. Brick & mortar retailers provide a separate report for their online transactions.
* The Internet/Catalog retail channel for the 2010-11 Retail Audit consists of 20 Internet & Catalog retail managements including both pure online retailers as well as brick & mortar retailers selling online. These managements represent nearly 40% of the total Internet/catalog snow sports sales.
Source: SIA RetailTRAK™ by the Leisure Trends GroupDue to confidentiality agreements between Leisure Trends Group and retailers on the panel, the list of participating retailers is not available. Sales through mass merchants such as Wal-Mart and Kmart, large mail order companies or Internet companies (ebay, Amazon, etc) and department stores are not included in the SIA RetailTRAK™ by the Leisure Trends Group.

Snow Sports WebsitesSIA Sites
Snowsports.org Association site
Snowlink.com Consumer site
WinterFeelsGood.com LEARNASNOWSPORT.org National Youth Participation Initiatives
WinterTrails.org Winter Trails Program
Industry Media and Association (Trade) Sites
NSAA.org National Ski Areas Association
Thesnowpros.comProfessional Ski Instructors Association/American Association of Snowboard Instructors
SAMinfo.com Ski Area Management Magazine
OutdoorIndustry.com Outdoor Industry Association (OIA)
NSGA.org National Sporting Goods Association (NSGA)
Business.transworld.net Transworld Business
Consumer Snow Sports Sites
EXPN.COM Winter X-Games
Powdermag.com Powder Magazine
Skinet.com SKI and Skiing Magazine
Freeskier.com Freeskier Magazine
Skipressworld.com Ski Press Magazine
Skiracing.com Ski Racing Magazine
Snowboarding.transworld.net Transworld Snowboarding Magazine
Snowboardcanada.com Snowboard Canada Magazine
Fresh.snowboardermag.com Snowboarder Magazine
Snowboarding.transworld.com Transworld Snowboarding
Snowboard-mag.com Snowboard Magazine
Fuel.tv Fuel TV
Skichannel.com The Ski Channel
Olympic SitesVancourver2010.com 2010 Winter Olympics
USSkiTeam.com U.S. Ski Team Info
USSnowboarding.com U.S. Snowboard Team Info