2011 summary annual report innovation | growth | integrity
TRANSCRIPT
innovation | growth | integrity2 0 1 1 SUM M A RY A N N UA L R E P ORT
Imperial Oil Limited | 2 0 1 1 ANNUAL REPORT SUMMARY B
C ORPOR ATE PROFILE
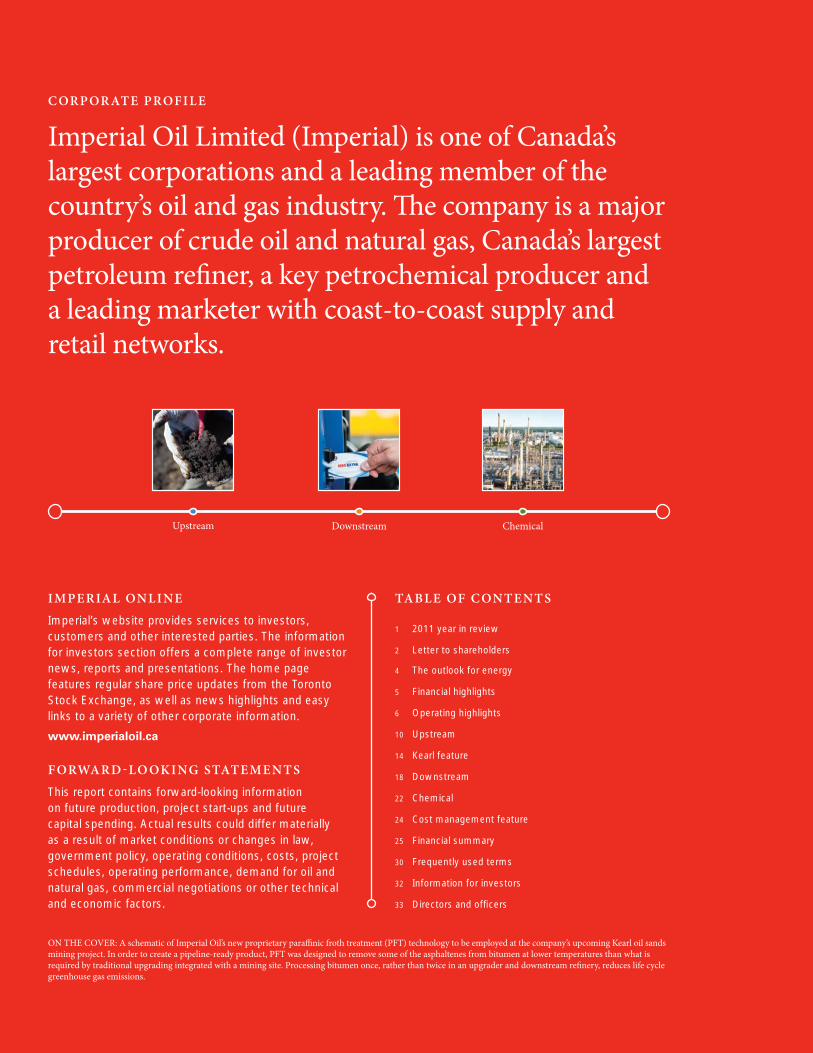
Imperial Oil Limited (Imperial) is one of Canada’s largest corporations and a leading member of the country’s oil and gas industry. The company is a major producer of crude oil and natural gas, Canada’s largest petroleum refiner, a key petrochemical producer and a leading marketer with coast-to-coast supply and retail networks.
Upstream Downstream Chemical
IMPERIAL ONLINE
Imperial’s website provides services to investors, customers and other interested parties. The information for investors section offers a complete range of investor news, reports and presentations. The home page features regular share price updates from the Toronto Stock Exchange, as well as news highlights and easy links to a variety of other corporate information.
www.imperialoil.ca
FORWARD-LO OKING STATEMENT S
This report contains forward-looking information on future production, project start-ups and future capital spending. Actual results could differ materially as a result of market conditions or changes in law, government policy, operating conditions, costs, project schedules, operating performance, demand for oil and natural gas, commercial negotiations or other technical and economic factors.
TABLE OF C ONTENT S
1 2011 year in review
2 Letter to shareholders
4 The outlook for energy
5 Financial highlights
6 Operating highlights
10 Upstream
14 Kearl feature
18 Downstream
22 Chemical
24 Cost management feature
25 Financial summary
30 Frequently used terms
32 Information for investors
33 Directors and officers
ON THE COVER: A schematic of Imperial Oil’s new proprietary paraffinic froth treatment (PFT) technology to be employed at the company’s upcoming Kearl oil sands mining project. In order to create a pipeline-ready product, PFT was designed to remove some of the asphaltenes from bitumen at lower temperatures than what is required by traditional upgrading integrated with a mining site. Processing bitumen once, rather than twice in an upgrader and downstream refinery, reduces life cycle greenhouse gas emissions.
Imperial Oil Limited | 2 0 1 1 ANNUAL REPORT SUMMARY1
CHAIRMAN’S LET TER | HIGHLIGHT S | UPSTREAM | D OWNSTREAM | CHEMICAL | FINANCIAL SUMMARY
RETURN ON CAPITAL EMPLOYED (RO CE)percent
10 1107 0908
60
40
20
0
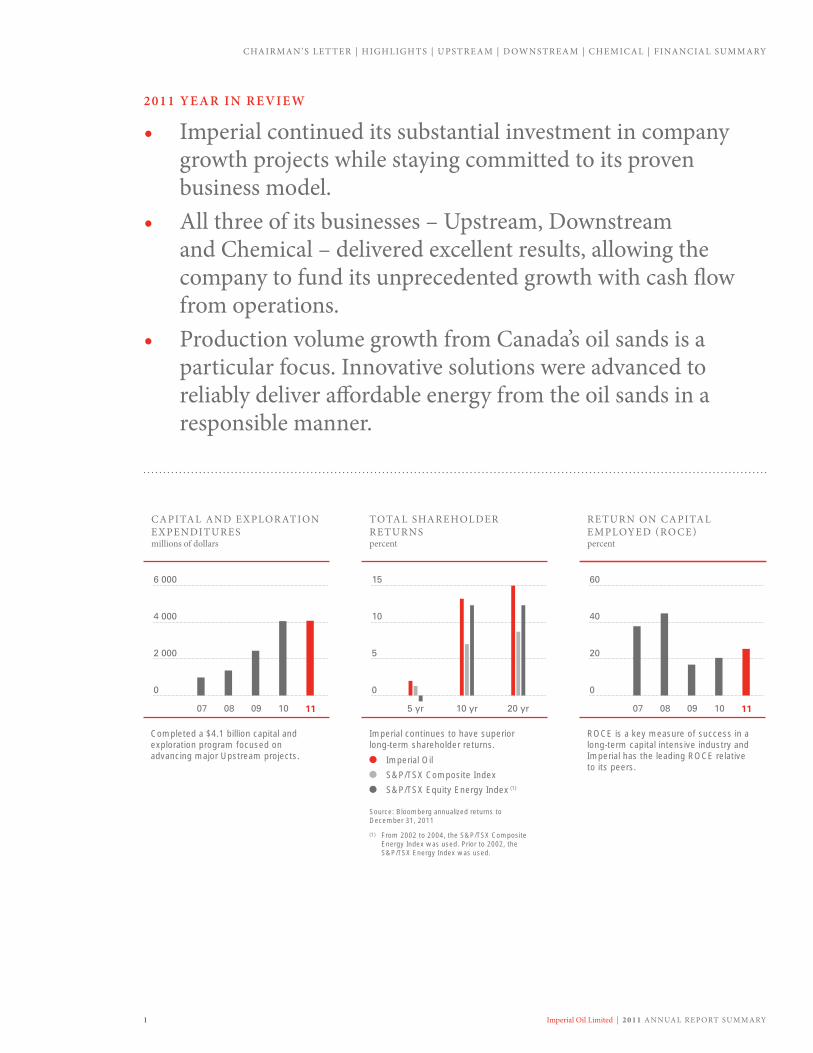
2011 YEAR IN REVIEW
• Imperial continued its substantial investment in company growth projects while staying committed to its proven business model.
• All three of its businesses – Upstream, Downstream and Chemical – delivered excellent results, allowing the company to fund its unprecedented growth with cash flow from operations.
• Production volume growth from Canada’s oil sands is a particular focus. Innovative solutions were advanced to reliably deliver affordable energy from the oil sands in a responsible manner.
Completed a $4.1 billion capital and exploration program focused on advancing major Upstream projects.
ROCE is a key measure of success in a long-term capital intensive industry and Imperial has the leading ROCE relative to its peers.
Source: Bloomberg annualized returns to December 31, 2011
(1) From 2002 to 2004, the S&P/TSX Composite Energy Index was used. Prior to 2002, the S&P/TSX Energy Index was used.
Imperial Oil
S&P/TSX Composite Index
S&P/TSX Equity Energy Index (1)
CAPITAL AND EXPLOR ATION EXPENDITURESmillions of dollars
10 1107 0908
6 000
4 000
2 000
0
TOTAL SHAREHOLDER RETURNSpercent
5 yr 20 yr10 yr
15
10
5
0
Imperial continues to have superior long-term shareholder returns.

Imperial Oil Limited | 2 0 1 1 ANNUAL REPORT SUMMARY 2
TO OUR SHAREHOLDERS
Rigorous execution of our business model delivers a year of strong results and progress.
This past year highlighted again the strength of Imperial Oil’s business model. We rely on our long-term commitment to improving operational excellence, investing with discipline, and driving technological leadership in resource development to see ourselves through pivotal periods of company history. 2011 will be noted as
a year of high activity before momentous change and growth for our company, starting with the production launch of our Kearl oil sands project, our largest-ever capital investment.
As we prepared for our long-term production growth, we also retained flexibility to meet changing business conditions. Our 2011 results reflect the capture of improved market conditions. Earnings of $3.4 billion were the second highest in our history. Return on average capital employed (ROCE) led our peers at 25.4 percent, even with our large capital expenditures. Cash flow from operations and asset sales remained strong at $4.8 billion and supported sustained capital investment growth. Over the last 10 years, Imperial has distributed more than $13.7 billion to shareholders.
In 2011, we continued to refine our approach to managing the safety risks inherent in our business. Safety requires a relentless focus with no room for complacency. This past year saw a sustained improvement in contractor workforce safety performance, which is one of the best in our industry. However, an increase in employee lost-time incident rate was disappointing. This will be improved in 2012.
Managing the risks involved with our environmental performance is another key priority. Our Operations Integrity Management System (OIMS) offers the rigour and structure required to ensure that our commitment
to risk management is embedded in all of our business activities. As a result, we had our best ever environmental compliance year.
Imperial’s Upstream, Downstream and Chemical businesses once again realized strong operating performances and delivered excellent results. Our Cold Lake oil sands operation had another outstanding year, highlighted by a record production of 160,000 barrels per day. Downstream and Chemical results were anchored by excellent performance from our Strathcona refinery.
In 2011, we entered the second year of a decade-long growth strategy in which we will invest between $35 billion and $40 billion to double our total Upstream production. Strong base business performance and a healthy balance sheet have so far allowed us to finance this growth primarily from internally generated cash flow. Capital and exploration expenditures in 2011 totalled $4.1 billion, mainly focused on advancing the construction of the Kearl Initial Development project.
Kearl will be an important new source of volume growth for our company and North American energy markets. Kearl’s initial development remains on track for a late 2012 start-up.
In December, the Kearl Expansion Project was sanctioned, increasing Kearl’s gross proved reserves to 2.8 billion barrels. Capital investment for the expansion project will be less as we reuse the initial development’s design and benefit from its full development infrastructure. Continuing from one project to the next will also give us a competitive advantage by retaining the productive and experienced labour resources working at Kearl today and utilizing well established supply commitments. We expect the expansion project will start up in late 2015.
Energy is a critical need for modern economies. New technologies in areas such as medicine, computing, transportation and personal communications are creating a greater demand for energy. Energy development is the engine of the Canadian economy and will continue to bring opportunities to all Canadians through employment and services funded in part by our industry’s royalty and tax dollars. With that in mind, we are confident that we
CHAIRMAN’S LET TER | HIGHLIGHT S | UPSTREAM | D OWNSTREAM | CHEMICAL | FINANCIAL SUMMARY
Imperial Oil Limited | 2 0 1 1 ANNUAL REPORT SUMMARY3
CHAIRMAN’S LET TER | HIGHLIGHT S | UPSTREAM | D OWNSTREAM | CHEMICAL | FINANCIAL SUMMARY
can continue to deliver reliable and affordable energy that will both benefit Canadians and minimize risks to people and the environment.
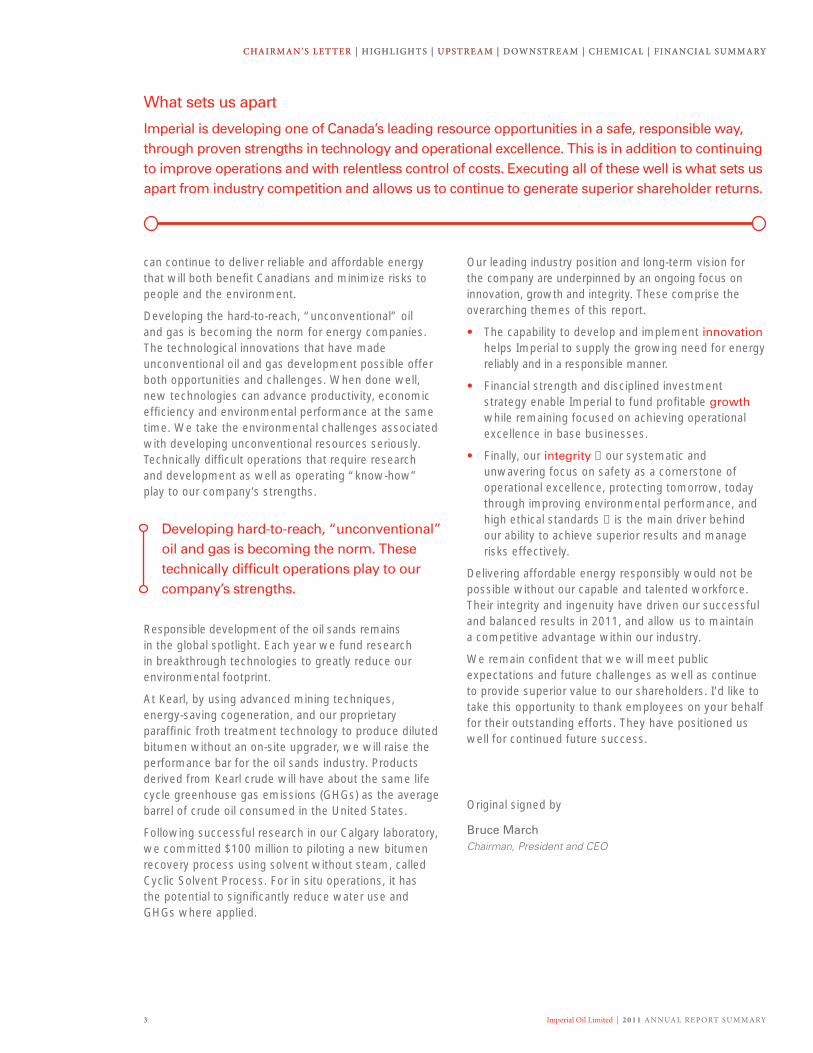
Developing the hard-to-reach, “unconventional” oil and gas is becoming the norm for energy companies. The technological innovations that have made unconventional oil and gas development possible offer both opportunities and challenges. When done well, new technologies can advance productivity, economic efficiency and environmental performance at the same time. We take the environmental challenges associated with developing unconventional resources seriously. Technically difficult operations that require research and development as well as operating “know-how” play to our company’s strengths.
Developing hard-to-reach, “unconventional” oil and gas is becoming the norm. These technically difficult operations play to our company’s strengths.
Responsible development of the oil sands remains in the global spotlight. Each year we fund research in breakthrough technologies to greatly reduce our environmental footprint.
At Kearl, by using advanced mining techniques, energy-saving cogeneration, and our proprietary paraffinic froth treatment technology to produce diluted bitumen without an on-site upgrader, we will raise the performance bar for the oil sands industry. Products derived from Kearl crude will have about the same life cycle greenhouse gas emissions (GHGs) as the average barrel of crude oil consumed in the United States.
Following successful research in our Calgary laboratory, we committed $100 million to piloting a new bitumen recovery process using solvent without steam, called Cyclic Solvent Process. For in situ operations, it has the potential to significantly reduce water use and GHGs where applied.
Our leading industry position and long-term vision for the company are underpinned by an ongoing focus on innovation, growth and integrity. These comprise the overarching themes of this report.
• The capability to develop and implement innovation helps Imperial to supply the growing need for energy reliably and in a responsible manner.
• Financial strength and disciplined investment strategy enable Imperial to fund profitable growth while remaining focused on achieving operational excellence in base businesses.
• Finally, our integrity − our systematic and unwavering focus on safety as a cornerstone of operational excellence, protecting tomorrow, today through improving environmental performance, and high ethical standards − is the main driver behind our ability to achieve superior results and manage risks effectively.
Delivering affordable energy responsibly would not be possible without our capable and talented workforce. Their integrity and ingenuity have driven our successful and balanced results in 2011, and allow us to maintain a competitive advantage within our industry.
We remain confident that we will meet public expectations and future challenges as well as continue to provide superior value to our shareholders. I’d like to take this opportunity to thank employees on your behalf for their outstanding efforts. They have positioned us well for continued future success.
Original signed by
Bruce March Chairman, President and CEO
What sets us apart
Imperial is developing one of Canada’s leading resource opportunities in a safe, responsible way, through proven strengths in technology and operational excellence. This is in addition to continuing to improve operations and with relentless control of costs. Executing all of these well is what sets us apart from industry competition and allows us to continue to generate superior shareholder returns.
Imperial Oil Limited | 2 0 1 1 ANNUAL REPORT SUMMARY 4
THE OU TLO OK FOR ENERGY: A VIEW TO 2040*
Energy growth is directly linked to well-being and prosperity across the globe. Meeting the growing demand for energy in a safe and environmentally responsible manner is a key challenge.Consider how modern energy enriches your life. Now consider the seven billion other people on earth who also use energy each day to make their own lives richer, more productive, safer and healthier. It is perhaps the biggest driver of energy demand: the human desire to sustain and improve the well-being of ourselves, our families and our communities. Through 2040, population and economic growth will drive demand higher, but the world will use energy more efficiently and shift toward lower-carbon fuels.
Here are some other findings to consider:
• In developing countries, energy demand will grow close to 60 percent as five-sixths of the world’s population strives to improve their living standards. In developed economies, energy demand will remain essentially flat.
• Growing electricity demand will remain the biggest driver of energy needs, with electricity generation accounting for 40 percent of global energy use by 2040.
• Natural gas – which emits up to 60 percent less CO2 emissions than coal when used for electricity generation − will be the fastest-growing major fuel. Unconventional gas – from shale and other rock formations – has helped unlock up to 250 years of global gas supply at current demand levels.
• Gains in efficiency across economies worldwide through energy-saving practices and technologies will significantly reduce demand growth and curb emissions.
• Keeping pace with energy demand growth will require unprecedented levels of investment and the pursuit of all economic energy sources.
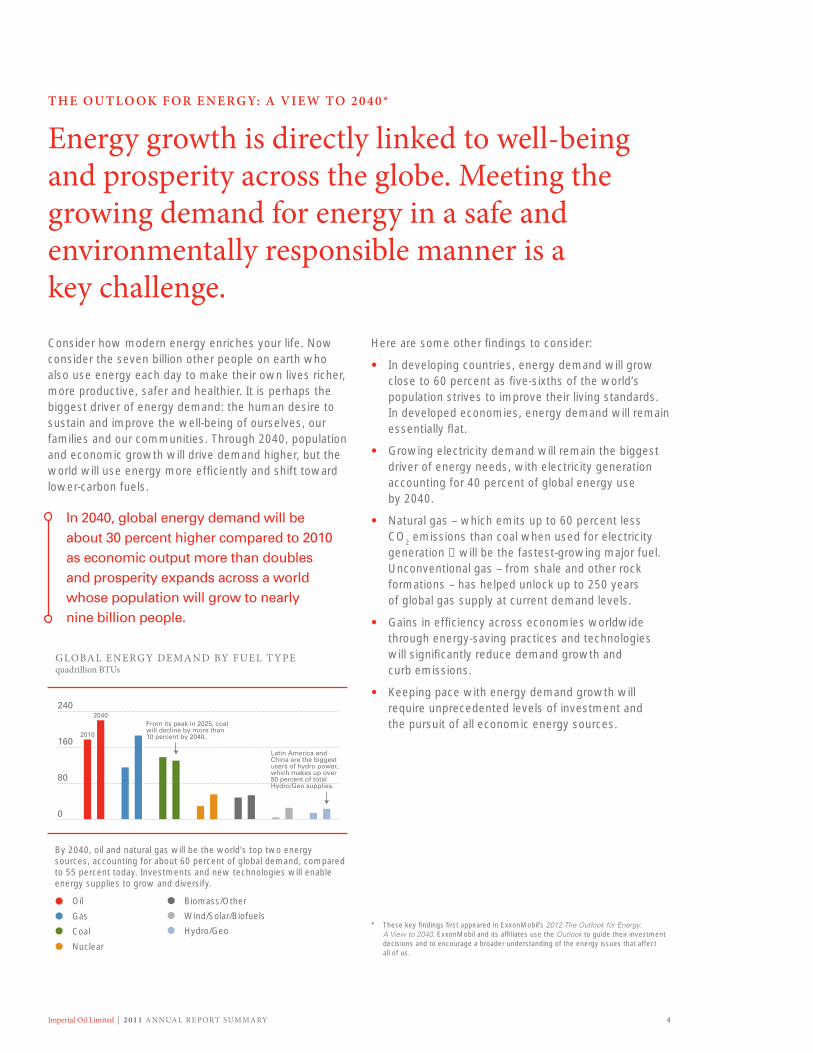
In 2040, global energy demand will be about 30 percent higher compared to 2010 as economic output more than doubles and prosperity expands across a world whose population will grow to nearly nine billion people.
* These key findings first appeared in ExxonMobil’s 2012 The Outlook for Energy: A View to 2040. ExxonMobil and its affiliates use the Outlook to guide their investment decisions and to encourage a broader understanding of the energy issues that affect all of us.
By 2040, oil and natural gas will be the world’s top two energy sources, accounting for about 60 percent of global demand, compared to 55 percent today. Investments and new technologies will enable energy supplies to grow and diversify.
GLOBAL ENERGY DEMAND BY FUEL T YPEquadrillion BTUs
2010
240
160
80
0
2040From its peak in 2025, coalwill decline by more than10 percent by 2040.
Latin America andChina are the biggestusers of hydro power,which makes up over80 percent of totalHydro/Geo supplies.
Oil Biomass/Other
Gas Wind/Solar/Biofuels
Coal
Nuclear
Hydro/Geo

Imperial Oil Limited | 2 0 1 1 ANNUAL REPORT SUMMARY5
Earnings were 50 percent higher than 2010 and the second highest in the company’s history.
INC OME PER SHAREdollars per share – diluted
10 1107 0908
6
4
2
0
CHAIRMAN’S LET TER | HIGHLIGHT S | UPSTREAM | D OWNSTREAM | CHEMICAL | FINANCIAL SUMMARY
• Earnings of $3.4 billion or $3.95 per share is up from $2.2 billion or $2.59 per share in 2010.
• Industry leading return on capital employed (ROCE) was 25.4 percent in 2011, even with significant assets under construction. ROCE excluding assets under construction was 59.6 percent.
• Annual per share dividends paid increased for the 17th consecutive year. This is the 120th year that Imperial has paid a dividend without interruption.
• Completion of a capital and exploration expenditure program of $4.1 billion, including advancing major company growth projects.
• Capital and exploration expenditures were funded primarily from internally generated funds and cash on hand. New debt of $455 million was raised in the year, with year-end debt of $1.2 billion. However, with year-end cash on hand of $1.2 billion, Imperial ended 2011 with zero net debt.
• Strong balance sheet maintained. Debt as a percent of total capital was only nine percent.
• Imperial maintained its AAA rating from Standard & Poor’s and remains the only Canadian industrial company with this rating.
• Imperial does not hedge the price of its production, its foreign exchange requirements or interest rate exposure, nor does it use special-purpose financial instruments, or off-balance-sheet financing structures.
FINANCIAL HIGHLIGHT S
Superior long-term shareholder value
Financial highlights
(millions of dollars) 2011 2010 2009 2008 2007
Operating revenues 30 474 24 946 21 292 31 240 25 069Net income 3 371 2 210 1 579 3 878 3 188Cash flow from operating activities and asset sales (a) 4 803 3 351 1 658 4 535 3 905Cash and cash equivalents at year-end 1 202 267 513 1 974 1 208Total debt at year-end 1 207 756 140 143 146Average capital employed (b) 13 261 10 791 9 432 8 684 8 509Capital and exploration expenditures 4 066 4 045 2 438 1 363 978Dividends paid 373 356 341 330 319 (a) The definition of cash flow from operating activities and asset sales can be found on page 31. (b) The definition of average capital employed can be found on page 30.
Key financial ratios
2011 2010 2009 2008 2007
Net income per share – diluted (dollars) (a) 3.95 2.59 1.84 4.36 3.41Return on average capital employed (percent) (b) 25.4 20.5 16.8 44.7 37.7Return on average shareholders’ equity (percent) (c) 27.5 21.4 17.1 45.7 41.6Annual shareholders’ return (percent) (d) 12.9 0.9 0.2 (24.3) 28.0Debt to capital (percent) (e) 9 7 2 2 2Dividends per share 0.44 0.43 0.40 0.38 0.35(a) Calculated by reference to the average number of shares outstanding, weighted monthly (page 29). (b) The definition of return on average capital employed can be found on page 30. (c) Net income divided by average shareholders’ equity (page 27).(d) Includes share appreciation and dividends.(e) Current and long-term portions of debt (page 27) and the company’s share of equity company debt, divided by debt and shareholders’ equity (page 27).

Imperial Oil Limited | 2 0 1 1 ANNUAL REPORT SUMMARY 6
OPER ATING HIGHLIGHT S
Integrity: providing affordable energy responsibly.Focused on safety and environmental protection
• Safety performance continued in line with best in industry. The company’s goal remains that “nobody gets hurt,” as nothing is more important.
• There was a sustained improvement in contractor results. Even with a 25 percent increase in the total number of contractor hours worked, the Upstream achieved a best ever safety performance.
• Employee lost-time incident rate increased in 2011. Employee safety was a disappointment and will be the focus for improvement in 2012.
• In 2011, Strathcona refinery was recognized by the Alberta Petro-Chemical Safety Council as the best performer in 2010 for achieving the lowest injury rate among its members for employees and contractors who had between two million and five million exposure hours.
• Environmental management and performance was a major focus with an eye to “Protect tomorrow. Today.”
• Last year was a best ever year in environmental compliance. We had nine environmental compliance incidents in 2011; our next best year was in 2005 with 14 incidents.
• Fifty-seven employees, including managers and others involved in influencing environmental performance, received training in environmental leadership in 2011, bringing the total number of employees trained to 384.
• Lloyd’s Quality Assurance confirmed that the Operations Integrity Management System used by Imperial continued to meet requirements of ISO 14001.
Investing in future growth, advancing major projects
• Initial development of the Kearl oil sands mining project is 87 percent complete and scheduled for a late 2012 start-up. Key objectives are to continue to improve safety of Kearl construction and start-up activities and to minimize the environmental impact of the project, contributing to responsible development of this oil sands resource.
• The Kearl expansion phase, sanctioned in December 2011, will bring the project’s gross cumulative proved reserves to 2.8 billion oil-equivalent barrels of which Imperial’s share is 71 percent. Start-up is scheduled for late 2015.
• Engineering is nearing completion and early construction work has commenced on the approved Cold Lake Nabiye expansion – an incremental 40,000 barrels a day of production is expected to start up by late 2014.
• Production pilot development continued in the Horn River Basin in northeast British Columbia, a promising shale gas resource. Imperial, together with ExxonMobil Canada in a 50/50 joint venture, holds one of the largest land positions here with more than 340,000 combined net acres.
• The National Energy Board (NEB), the agency responsible for issuing drilling licences in federal offshore areas, held a review of the safety and environmental requirements for offshore drilling in Canada’s Arctic. In September 2011, as part
2.8 billionoil-equivalent barrels of proved reserves at Kearl
Imperial plans to double production by the end of this decade.
New development
Oil sands
Conventional
RESOURCE DEVELOPMENT BUILDING PRODUCTION VOLUMEthousands of oil-equivalent barrels a day before royalties
16 201311
800
600
400
200
0

Imperial Oil Limited | 2 0 1 1 ANNUAL REPORT SUMMARY7
of its review, the NEB sponsored a five-day round table in Inuvik to collect public input on expectations for future drilling applications. Imperial gave a presentation at the meeting that supported the advancement by the NEB of goal-based regulation. The company is now reviewing the NEB recommendations that were issued in December 2011.
Increased reserves and volume performance
• Average daily production of crude oil, natural gas and natural gas liquids was 297,000 oil-equivalent barrels a day before royalties.
• Cold Lake in situ oil sands operation saw record production at 160,000 barrels per day.
• Proved reserves at year-end totalled 3.19 billion oil-equivalent barrels, up 642 million from 2010. Total resource is in excess of 16 billion barrels. Proved reserves represent more than 36 years of current production.
• Imperial Oil exchanged in situ oil sands acreage for oil sands mining acreage contiguous with the company’s Firebag property. This transaction adds non-proved resource for Imperial.
• Athabasca (in situ and mining) and Horn River assets increased the resource base by more than one billion oil-equivalent barrels.
• Imperial Oil sold shallow gas properties, changing the company’s Upstream volume mix to about 90 percent oil-weighted in 2012.
• Petroleum product sales volumes were 447,000 barrels a day. Gasoline sales were 220,000 barrels a day. Imperial remained Canada’s largest petroleum refiner.
2.1.
CHAIRMAN’S LET TER | HIGHLIGHT S | UPSTREAM | D OWNSTREAM | CHEMICAL | FINANCIAL SUMMARY
Oct 11Jul 10 Dec 11Jul 11Apr 11Jan 11Oct 10
180
120
60
0
Reliability and continued growth at Cold Lake is demonstrated by increasing daily production from July 2010 to December 2011.
C OLD L AKE DAILY PRODUCTIONthousands of barrels per day
1. Cold Lake increases its average production to 160,000 barrels per day in 2011. 2. Kearl Initial Development is 87 percent complete at year-end. 3. Exploration Manager Mike Peacock speaks at the NEB round table in Inuvik.
3.


Imperial Oil Limited | 2 0 1 1 ANNUAL REPORT SUMMARY9
In addition to its own research, Imperial participates in industry collaborations with organizations such as:
• Centre for Oil Sands Innovation (COSI) at the University of Alberta
• Oil Sands Tailings Consortium (OSTC)
As a founding member, the company joined the Oil Sands Tailings Consortium (OSTC) to accelerate industry-wide solutions to this oil sands environmental challenge. This unique partnership opens the door for collaboration in the development of next-generation tailings reclamation technologies. Imperial is leveraging the OSTC to evaluate new tailings treatment technologies prior to the start-up of its Kearl oil sands project in late 2012. Since its formation in 2011, there has been significant progress in sharing information and developing joint research and development projects among the member companies.
The groundwork was laid in 2011 for Imperial and 11 other major oil sands companies to form the Canada’s Oil Sands Innovation Alliance in March 2012. The goal of the alliance is to mobilize the best thinking, experience and technology available to deliver accelerated improvements to oil sands environmental performance. The oil sands operators intend to pursue enhanced collaboration in the environmental priority areas of water use and treatment, land reclamation and reduction of GHGs.
Building and maintaining strong relationships by investing in the communities where we operate
• Imperial supported communities across Canada where it has a presence through total contributions of $15 million in 2011. This includes $6 million contributed to more than 300 organizations through the Imperial Oil Foundation. The foundation focuses on supporting education in math and sciences; funding environment and energy initiatives; and investing in local communities with a particular emphasis on Aboriginal opportunities. Such investments are considered critical to Canada’s future prosperity.
• 2011 was the first year of the Indigenous Women in Community Leadership program. The goal of the program, in which Imperial has made a five-year commitment, is to engage and develop the next generation of Aboriginal women leaders. With Imperial Oil Foundation support, 12 Aboriginal women from communities across Canada graduated from the program at the Coady International Institute at St. Francis Xavier University in Nova Scotia.
• In 2011, a strategy to enhance Aboriginal business development associated with Kearl and Cold Lake operations was undertaken, with a focus on developing local Aboriginal businesses towards sustainably providing support for our operations. The progress and results are stewarded by senior managers.
• For more information, please see Imperial’s Corporate Citizenship Report on the Imperial website at www.imperialoil.ca.
Excellence driven by people
• At year-end 2011, Imperial’s workforce numbered 5,083 employees. The representation of women, now at about 28 percent, continues to increase overall, particularly in the Management, Professional, Technical, Operational and Executive job categories.
• Imperial also continued its ongoing recruitment program and hired more than 300 career employees to help advance its growth opportunities.
CHAIRMAN’S LET TER | HIGHLIGHT S | UPSTREAM | D OWNSTREAM | CHEMICAL | FINANCIAL SUMMARY
• Significant resource base of more than 16 billion oil-equivalent barrels.• Proved reserves life index of greater than 36 years.• Non-proved resources of more than 13 billion oil-equivalent barrels,
of which more than 11 billion barrels are oil sands.(a) Reserves estimates based on the average first-day-of-the-month price for each month
during the last 12-month period ending December 31. For reserves calculated under National Instrument 51-101 (NI 51-101) requirements, please refer to the company’s filing of its NI 51-101 data on the System for Electronic Document Analysis and Retrieval (SEDAR) at www.sedar.com.
(b) Pursuant to National Instrument 51-101 disclosure guidelines, and using Canadian Oil and Gas Evaluation Handbook definitions, Imperial’s non-proved resources are classified as a “contingent resource.” Such resources are a best estimate of the company’s net interest after royalties at year-end 2011, as determined by Imperial’s internal qualified reserves evaluator. Contingent resources are considered to be potentially recoverable from known accumulations using established technology or technology under development, but are currently not considered to be commercially recoverable due to one or more contingencies. There is no certainty that it will be economically viable or technically feasible to produce any portion of the resource. See discussion on pages 10-13 in the Upstream section for additional information on components of the contingent resource base, including undeveloped oil sands acreage and the Mackenzie gas project.
Net production
Proved reserves (a)
Non-proved resources (b)
SIGNIFICANT RESOURCE BASEbillions of oil-equivalent barrels – 2011
15
10
5
0
Conventional,including
frontier
In situoil sands
Minableoil sands

Imperial Oil Limited | 2 0 1 1 ANNUAL REPORT SUMMARY 1 0
Imperial’s fundamental Upstream strategies guide our exploration, development and production activities.
STR ATEGIES
• Identify and selectively capture the highest-quality exploration opportunities
• Invest in projects that deliver superior returns
• Maximize profitability of existing oil and gas production
• Maximize resource value through high-impact technologies and integrated solutions
C OMPETITIVE ADVANTAGES
• Quality and size of resource base
• Disciplined investing
• Operational excellence
• High-impact technologies
Imperial Oil Limited | 2 0 1 1 ANNUAL REPORT SUMMARY1 1
CHAIRMAN’S LET TER | HIGHLIGHT S | UPSTREAM | D OWNSTREAM | CHEMICAL | FINANCIAL SUMMARY
UPSTREAM
Growth: achieving operational excellence in base business while advancing future projects.
Results and highlights
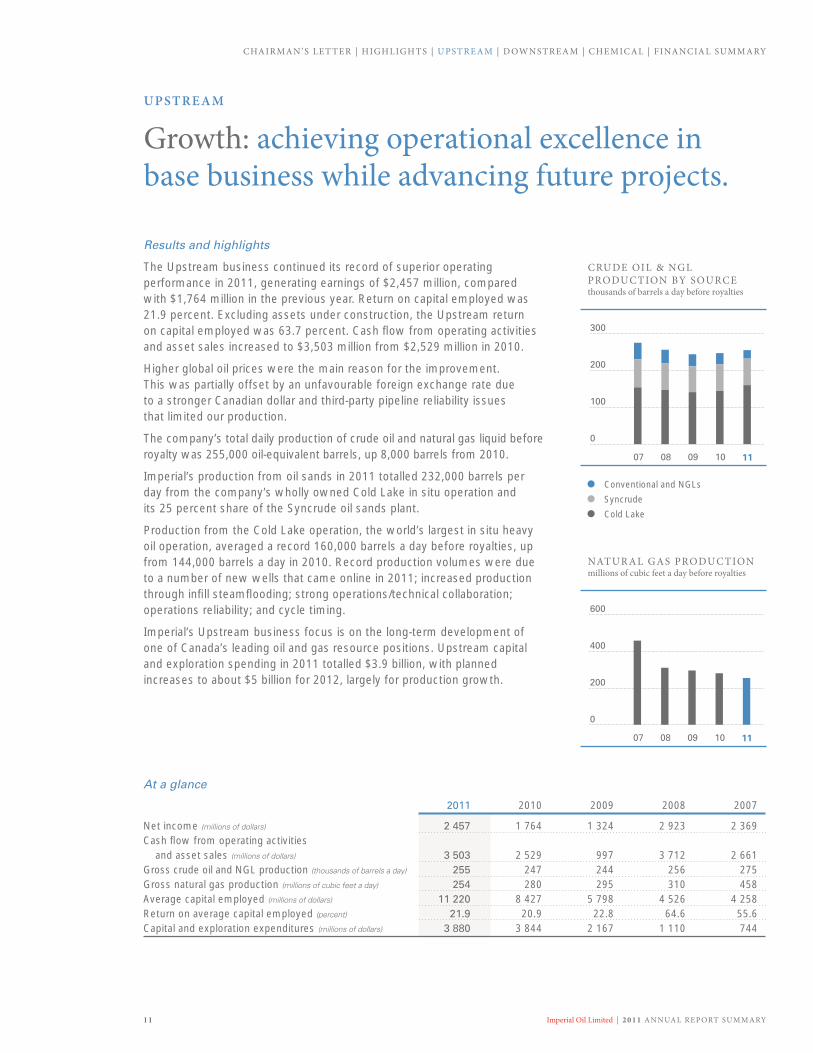
The Upstream business continued its record of superior operating performance in 2011, generating earnings of $2,457 million, compared with $1,764 million in the previous year. Return on capital employed was 21.9 percent. Excluding assets under construction, the Upstream return on capital employed was 63.7 percent. Cash flow from operating activities and asset sales increased to $3,503 million from $2,529 million in 2010.
Higher global oil prices were the main reason for the improvement. This was partially offset by an unfavourable foreign exchange rate due to a stronger Canadian dollar and third-party pipeline reliability issues that limited our production.
The company’s total daily production of crude oil and natural gas liquid before royalty was 255,000 oil-equivalent barrels, up 8,000 barrels from 2010.
Imperial’s production from oil sands in 2011 totalled 232,000 barrels per day from the company’s wholly owned Cold Lake in situ operation and its 25 percent share of the Syncrude oil sands plant.
Production from the Cold Lake operation, the world’s largest in situ heavy oil operation, averaged a record 160,000 barrels a day before royalties, up from 144,000 barrels a day in 2010. Record production volumes were due to a number of new wells that came online in 2011; increased production through infill steamflooding; strong operations/technical collaboration; operations reliability; and cycle timing.
Imperial’s Upstream business focus is on the long-term development of one of Canada’s leading oil and gas resource positions. Upstream capital and exploration spending in 2011 totalled $3.9 billion, with planned increases to about $5 billion for 2012, largely for production growth.
At a glance
2011 2010 2009 2008 2007
Net income (millions of dollars) 2 457 1 764 1 324 2 923 2 369Cash flow from operating activities
and asset sales (millions of dollars) 3 503 2 529 997 3 712 2 661Gross crude oil and NGL production (thousands of barrels a day) 255 247 244 256 275Gross natural gas production (millions of cubic feet a day) 254 280 295 310 458Average capital employed (millions of dollars) 11 220 8 427 5 798 4 526 4 258Return on average capital employed (percent) 21.9 20.9 22.8 64.6 55.6Capital and exploration expenditures (millions of dollars) 3 880 3 844 2 167 1 110 744
CRUDE OIL & NGL PRODUCTION BY SOURCEthousands of barrels a day before royalties
Conventional and NGLs
Syncrude
Cold Lake
10 1107 0908
0
100
200
300
NATUR AL GAS PRODUCTIONmillions of cubic feet a day before royalties
10 1107 0908
600
400
200
0

Imperial Oil Limited | 2 0 1 1 ANNUAL REPORT SUMMARY 1 2
UPSTREAM
Resource base: proved reserves increased by 29 percent
In 2011, proved reserves increases of 730 million barrels of oil equivalent more than offset production of 88 million barrels of oil equivalent in the year. The principal increase was associated with the expansion development of the Kearl oil sands project.
Imperial’s total proved and non-proved resource base now exceeds 16 billion barrels of oil equivalent, or more than 185 years’ worth of production at current levels – an industry-leading position in terms of size, quality and diversity.
Imperial’s focus in its Upstream business is on the long-term development of one of Canada’s leading oil and gas resource positions. The company plans to double Upstream production volumes by 2020.
The company’s exploration portfolio offers further opportunities to add to this resource position, including unconventional gas in northeast British Columbia, further oil sands delineation, and drilling offshore in the Beaufort Sea. During 2011, Imperial added 261,000 net acres to its acreage holdings.
Innovation and growth: unconventional resources offer opportunity
Oil sands (also see Kearl feature on page 14)
Canada’s oil sands are increasingly recognized as a significant contributor to global oil supply, North American energy security and Canada’s economic prosperity. The challenge is to bring these resources to market efficiently, and in a safe and environmentally responsible manner.
Net proved reserves (a) (b) (c) (f)
Total oil Synthetic oil Bitumen equivalent Liquids (d) Natural Gas (Syncrude) (Cold Lake and Kearl) basis (e)
year ended millions of barrels billions of cubic feet millions of barrels millions of barrels millions of barrels
2007 82 635 694 717 1 5992008 64 593 734 1 437 2 3342009 63 590 691 1 661 2 5132010 57 576 681 1 715 2 5492011 55 422 653 2 413 3 191(a) Net reserves are the company’s share of reserves after deducting the shares of mineral owners or governments or both. All reported reserves are located in Canada.(b) For reserves calculated under National Instrument 51-101 (NI 51-101) requirements, please refer to the company’s filing of its NI 51-101 data on the System for Electronic Document
Analysis and Retrieval (SEDAR) at www.sedar.com.(c Prior to 2009, synthetic oil and mined bitumen reserves were reported separately as mining reserves in the company’s Form 10-K. In 2008, the company reported for the first time
807 million barrels of mined bitumen reserves, net share, from the initial development phase of the Kearl project.(d) Liquids include crude, condensate and natural gas liquids (NGLs).(e) Gas converted to oil-equivalent at six million cubic feet per 1 000 barrels.(f) Reserves were calculated based upon SEC’s pricing requirement. Beginning with the 2009 year-end, reserves were calculated based on amended SEC’s pricing requirement,
which applied the average of the first-day-of-the-month price for each month during the last 12-month period.
When completed, the Kearl oil sands project will contribute to a doubling of Imperial’s production to about 600,000 barrels per day by 2020.

Imperial Oil Limited | 2 0 1 1 ANNUAL REPORT SUMMARY1 3
CHAIRMAN’S LET TER | HIGHLIGHT S | UPSTREAM | D OWNSTREAM | CHEMICAL | FINANCIAL SUMMARY
Imperial has been a pioneer in their development and continues to hold a major position with over 13 billion barrels of non-proved resource. The company has a number of projects that can be developed to supply responsible energy for decades to come, including 398,000 net acres of undeveloped oil sands leases.
In 2011, Imperial advanced plans for an expansion project at Cold Lake called Nabiye with the potential to produce 40,000 barrels a day of bitumen. Plans for Nabiye include: improving environmental performance through cogeneration of electricity and steam, which improves efficiency, reduces operating costs and lowers net greenhouse gas emissions (GHGs); directional drilling, which will decrease land use footprint; and facilities to cut air emissions of sulphur dioxide. The project was sanctioned in February 2012.
Syncrude, in which Imperial has a 25 percent interest, is the world’s largest oil sands producer, with gross proved reserves of 2.9 billion barrels of synthetic oil. Imperial’s share of Syncrude production in 2011 fell to a disappointing 72,000 barrels a day of synthetic crude oil before royalty, down from 73,000 barrels a day in 2010. Focus at Syncrude continues to be on improving reliability, cost performance, and on-schedule and on-budget execution of its capital investments in mine relocations and tailings reclamation.
Tight oil
In central Alberta, Imperial has acreage held through existing conventional production. New applications of technology, such as horizontal drilling and hydraulic fracturing, have recently allowed industry to safely produce tight oil (oil in tight sandstone formations), essentially giving new life to old, mature fields. Imperial initiated work in central Alberta to understand the potential for this technology at its existing land holdings.
Horn River
Imperial, together with ExxonMobil Canada in a 50-50 joint venture, has one of the largest acreage positions in the Horn River shale gas play in northeast British Columbia.
Eight horizontal wells were drilled on a single pad to evaluate well productivity and cost performance. Drilling activities were undertaken safely well ahead of schedule and below cost expectations. Construction activities are underway for the pilot gas processing and transmission facilities. This production pilot is on schedule with start-up in late 2012.
Athabasca
Imperial holds extensive undeveloped acreage with promising mining and in situ development opportunities in the Athabasca region of Alberta. In 2011, the company continued development planning for one of the in situ leases.
Mackenzie gas project
The National Energy Board approved the permit to build the pipeline and the federal government issued the Certificate of Public Convenience and Necessity in late 2010. Federal cabinet approved the project in 2011, and discussions with the government on an appropriate fiscal framework continued, largely aimed at sharing the risks of development of such a large project, but with potential benefit for the whole northern region.
The project is designed to bring to market gas from three previously discovered onshore gas fields in the Mackenzie River Delta area of Northern Canada, together comprising about six trillion cubic feet of estimated recoverable gas resource. Imperial’s wholly owned Taglu field represents about half of this. Imperial is the operator for the project.
Beaufort exploration
Imperial and ExxonMobil Canada each hold a 25 percent interest in one million acres of offshore exploration acreage in the Beaufort Sea area of northern Canada, approximately 120 kilometres north of the Mackenzie Delta.
An Imperial strength is its ability to progress opportunities in such potentially promising but technically challenging frontier areas. The company is working with regulators and industry to collaborate on safe and responsible drilling offshore in the Arctic. Imperial maintains that any future activity in the Arctic must take the utmost care to protect the ecosystem and drilling should only take place if there is a strong focus on incident prevention.
The company is reviewing the recommendations made by the National Energy Board in December of 2011.
Imperial Oil Limited | 2 0 1 1 ANNUAL REPORT SUMMARY 1 4
FEATURE – KEARL
Innovation, growth and integrity: Kearl will use the next generation of technologies to raise the performance bar for oil sands mining.As the largest capital project in Imperial’s history, Kearl will initially supply 110,000 barrels per day of bitumen, with production of 345,000 barrels per day by 2020 when the project’s initial development and expansion phases are fully constructed and debottlenecked.
Kearl (71 percent owned by Imperial, 29 percent owned by ExxonMobil Canada) maintains two distinct advantages in the oil sands mining industry: a reduced environmental footprint from the application of the latest proprietary and industry technologies, and lower operating costs due to the quality of the resource.
The Kearl lease represents one of the largest and best-quality oil sands mining properties in the Athabasca region, with about 4.6 billion barrels gross of recoverable resource and a production lifespan of about 40 years.
In addition, the deployment of the next generation of oil sands technologies will build on industry experience and knowledge to set new standards for environmental performance in oil sands mining.
With less than a year until first oil, the Kearl oil sands project is poised to significantly raise Imperial’s overall production while becoming the next generation of oil sands mining facilities.
Progress in 2011
2011 has been a year of significant progress and achievement. The initial development went from 40 percent complete in January to 87 percent complete at year-end and remains on schedule for start-up in late 2012.
By August, the company received approval to deliver modular equipment that had been delayed south of the Canadian border from the states of Idaho, Montana and Washington. Project construction sequencing was modified in order to meet the targeted operational start of late 2012.
Significant milestones reached on the project in 2011: all six bitumen froth separation units were safely transported to foundations; all four steam boilers, the primary separation cell and all tanks have been hydro-tested; 14 Caterpillar 797 400-tonne haul trucks and the Komatsu hydraulic shovel are ready for operation; both Caterpillar electric shovels are ready for commissioning.
The River Water Intake became the first part of the facilities to be placed in operation at the end of July. The best available bird deterrent system became operational two seasons prior to introducing tailings to the containment area.
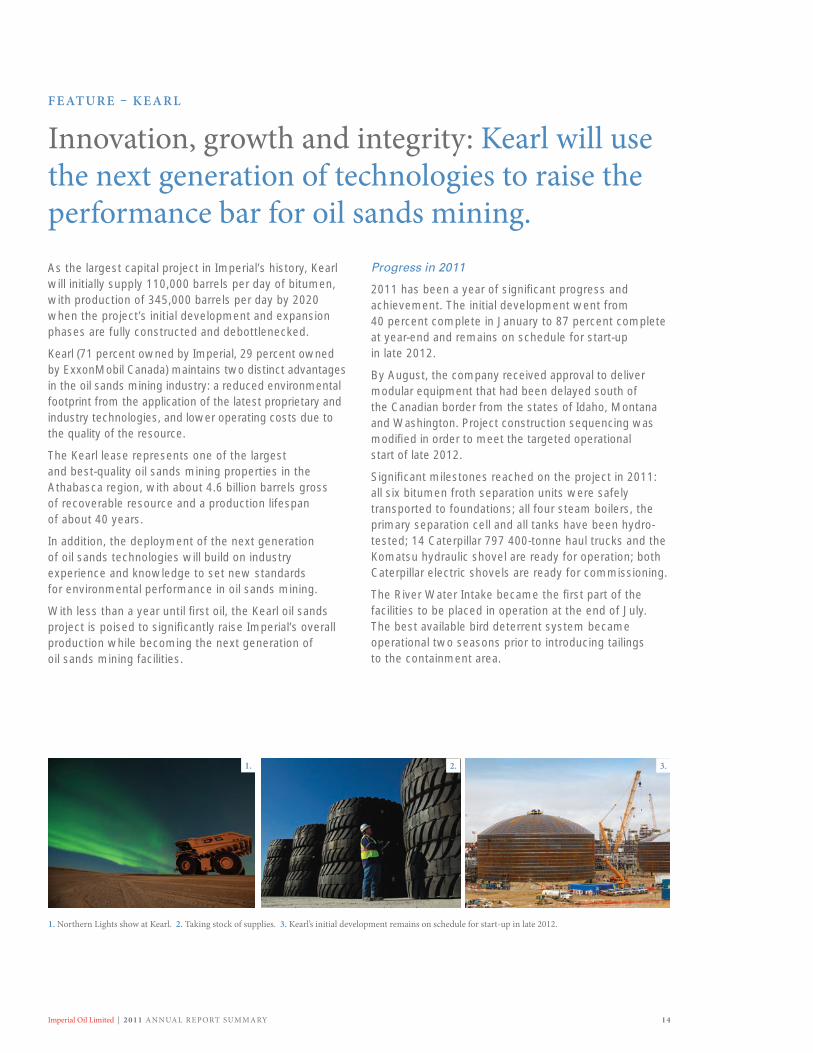
1. Northern Lights show at Kearl. 2. Taking stock of supplies. 3. Kearl’s initial development remains on schedule for start-up in late 2012.
1. 2. 3.

Imperial Oil Limited | 2 0 1 1 ANNUAL REPORT SUMMARY1 5
CHAIRMAN’S LET TER | HIGHLIGHT S | UPSTREAM | D OWNSTREAM | CHEMICAL | FINANCIAL SUMMARY
Execution excellence
Kearl is a large capital- and labour-intensive project in a remote and occasionally harsh location far from major population centres. These pressures have had negative impacts on costs and schedules for many industry projects in the region. Despite these challenges, Kearl has not altered its projected start date from the original schedule.
The foundation of the company’s successful development of Kearl is Imperial and ExxonMobil’s project management and execution expertise. Together, they have a strong track record of establishing clear goals that guide project planning and execution to meet high standards of quality and operating reliability. Delivering projects safely, efficiently and on schedule will differentiate Imperial’s performance in Canada’s oil sands.
Imperial sanctioned the Kearl Initial Development in May 2009 when others suspended work, thereby securing top tier contractors. The Kearl Expansion Project, sanctioned in December 2011, will continue to use many of the same contractors, thereby avoiding
demobilization and remobilization costs. Kearl will also follow a “design one, build many” approach in alignment with the proven procedure used for many of ExxonMobil’s global development opportunities. As such, the expansion project can reuse design and engineering work from the initial development, reducing project costs and optimizing the engineering/procurement/construction schedule.
Technology
From its early days, Imperial Oil has fostered a culture of innovation to drive research and technology. Over the last several years, the company has spent in the order of $100 million a year on research and development primarily focused on oil sands technology. This includes developing enhancements to existing practices as well as pursuing breakthrough technologies that hold the potential for major step-change improvements. The result of these combined efforts is a track record of continuous improvement in resource recovery rates and environmental performance in both mining and in situ oil sands development.
Kearl will raise the bar for oil sands mining performance by featuring the next generation of technologies to reduce the environmental footprint of development. These include the company’s proprietary paraffinic froth treatment that will produce a saleable crude oil without an on-site upgrader. This treatment will result in energy savings and reduced greenhouse gas emissions (GHGs)
1. Employee Lisa Hopeman looks over plans. 2. Kearl oil sands project at dusk. 3. Contractors help ready the operation.
1.
3.
2.
345,000barrels per day of production by 2020
Imperial Oil Limited | 2 0 1 1 ANNUAL REPORT SUMMARY 1 6
because the bitumen needs to be processed once in a downstream refinery rather than twice in an upgrader and a downstream refinery.
Kearl will also employ cogeneration technology to further reduce GHGs and save on energy. Cogeneration is an efficient method of capturing waste heat to produce steam and electricity at the same time.
A recent IHS CERA report noted that petroleum products derived from Kearl crude – i.e., an operation that produces diluted bitumen through paraffinic froth treatment and using cogeneration – will have about the same life cycle GHGs as the average of crudes consumed in the United States. Kearl will be the first oil sands facility to achieve this.
Environment and reclamation
Long before any shovels went into the ground, scientists at Imperial developed a plan to use better and faster methods to reclaim the land disturbed by operations. In fact, Kearl has already started to reclaim land impacted by project construction.
The company’s reclamation efforts include removing, segregating and storing soils from this site so that the local productive topsoil can be used as soon as an area becomes available for reclamation. Because native species are not widely available commercially, Imperial scientists collect and store seeds to be used in the reclamation of the land. Imperial has also teamed up
with local First Nations contractors to collect tree and shrub seeds now to ensure sufficient stock for future reclamation. Local First Nations also provide input on species used in traditional medicines and ceremonies to help select appropriate vegetation for replanting. The first of the trees and shrubs grown from those seeds were planted this year in areas where the reclaimed landform was completed.
Imperial recognizes that water is a crucial resource. Currently, only three percent of the Athabasca river is allocated to the oil and gas industry, and Kearl will use less than 0.4 percent of the river’s annual flow. Kearl will also have a three-month on-site water storage to minimize water withdrawal during the winter low-flow period.
Kearl will reuse all process water during operations, and will capture groundwater and surface runoff water to minimize freshwater river withdrawals.
Kearl is also building the first of three compensation lakes to replace fish habitat disrupted by development. Created and designed with input from local First Nations, these lakes will be deep enough to allow
FEATURE – KEARL
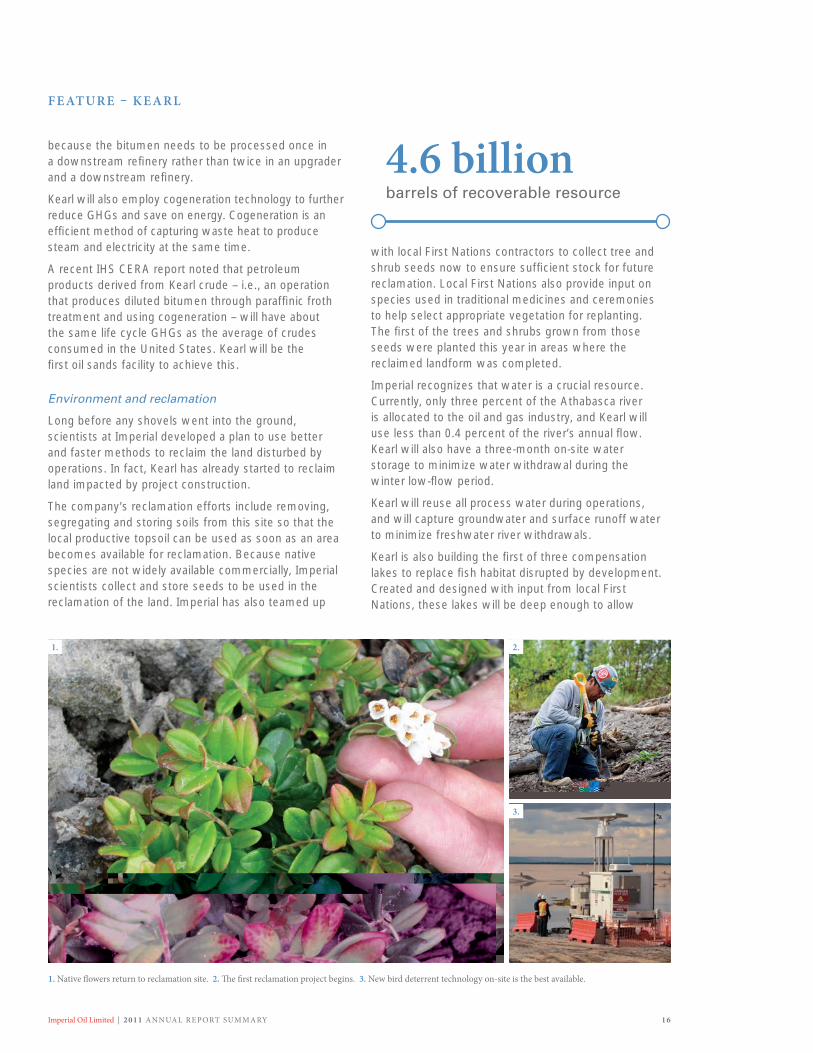
4.6 billionbarrels of recoverable resource
2.1.
1. Native flowers return to reclamation site. 2. The first reclamation project begins. 3. New bird deterrent technology on-site is the best available.
3.
Imperial Oil Limited | 2 0 1 1 ANNUAL REPORT SUMMARY1 7
Kearl’s waterfowl deterrent plan utilizes the best available technology and employs a dedicated on-site team to operate the system and provide the best level of bird detection and deterrence in the industry.
CHAIRMAN’S LET TER | HIGHLIGHT S | UPSTREAM | D OWNSTREAM | CHEMICAL | FINANCIAL SUMMARY
fish to overwinter in them and will eventually connect to the existing Kearl Lake, which on its own is too shallow to support year-round fish habitat. These lakes will be accessible for traditional use by local communities.
In oil sands mining, tailings management is an industry-wide concern. It is the reason that Imperial, along with six other major oil sands mining developers, reached an unprecedented technology-sharing agreement to form a consortium aimed at speeding up the reclamation of tailings ponds.
As a member of the Oil Sands Tailing Consortium, Imperial is sharing its research with industry so that the environmental benefits of the company’s work can have the broadest reach. For example, rather than treating all tailings the same way, Imperial scientists have discovered that separating tailings by their physical properties (whether they are coarse or fine or contain asphaltenes) and then tailoring the treatment of each can reduce the volume of tailings ponds and allow reclamation to occur earlier. A pilot based on Imperial’s research is now being tested at Shell’s Athabasca oil sands project. It could benefit Shell Canada, Teck Resources and Total E&P Canada, as they use or plan to use similar tailings treatments to Imperial’s.
Early success has encouraged plans for a larger pilot to be conducted at Shell’s site this year. Other tailings research by Imperial, currently at the lab testing stage, has the potential to also benefit all operators.
More recently, in March of 2012, 12 major oil sands companies entered into an alliance to bring together the best knowledge, experience and technology available to further improvements to oil sands environmental performance. As part of the new Canada’s Oil Sands Innovation Alliance (COSIA), Imperial and other oil sands operators intend to pursue unprecedented collaboration in water use and treatment, land reclamation and reduction of GHGs.
Finally, keeping waterfowl safe is crucial. Kearl’s waterfowl deterrent plan utilizes the best available technology and employs a dedicated on-site team to operate the system and provide the best level of bird detection and deterrence in the industry.
Stakeholder engagement and socio-economic development
From the project’s outset, Imperial has sought an inclusive, consultative approach to doing business with local stakeholders. The project team is committed to a process of continuous dialogue, and works with local advisory committees to update communities on project status and to discuss concerns.
Aboriginal business development is a key focus area. From the outset, Imperial’s aim has been to ensure Aboriginal people and businesses directly benefit from the Kearl project through local skills development, direct investment and employment. To that end, Imperial created a socio-economic network for the project to ensure Aboriginal businesses would be able to participate. The company also requires all major contractors on Kearl to have an Aboriginal socio-economic development position on their staff. Their role is to analyze the scope of work and look for opportunities to contract with Aboriginal businesses in the region.
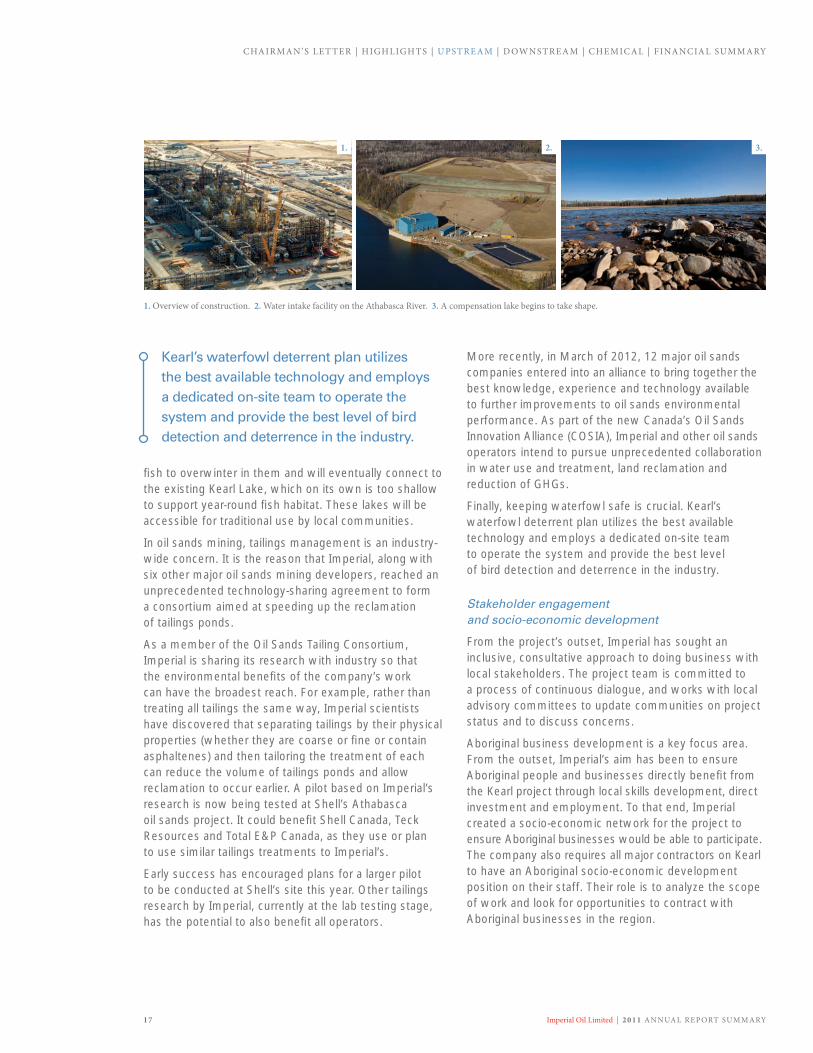
1. Overview of construction. 2. Water intake facility on the Athabasca River. 3. A compensation lake begins to take shape.
1. 2. 3.

Imperial Oil Limited | 2 0 1 1 ANNUAL REPORT SUMMARY 1 8
Our consistent business strategies are vital to achieving a sustained competitive advantage.
STR ATEGIES
• Maintain best-in-class operations
• Provide valued and high-quality products and services to our customers
• Lead industry in efficiency and effectiveness
• Maximize integration synergies with other Imperial businesses
• Selectively invest for resilient, advantaged returns
C OMPETITIVE ADVANTAGES
• Portfolio quality
• Disciplined investing
• High-impact technologies
• Operational excellence
• Integration
Imperial Oil Limited | 2 0 1 1 ANNUAL REPORT SUMMARY1 9
CHAIRMAN’S LET TER | HIGHLIGHT S | UPSTREAM | D OWNSTREAM | CHEMICAL | FINANCIAL SUMMARY
D OWNSTREAM
Integrity: consistency helps achieve second- best earnings. Imperial is the largest petroleum refiner in Canada with a significant share in all major petroleum product market sectors, including retail sales and finished lubricants. Competitive advantage is provided through having leading refining and marketing operations in Eastern, Central and Western Canada.
Results and highlights
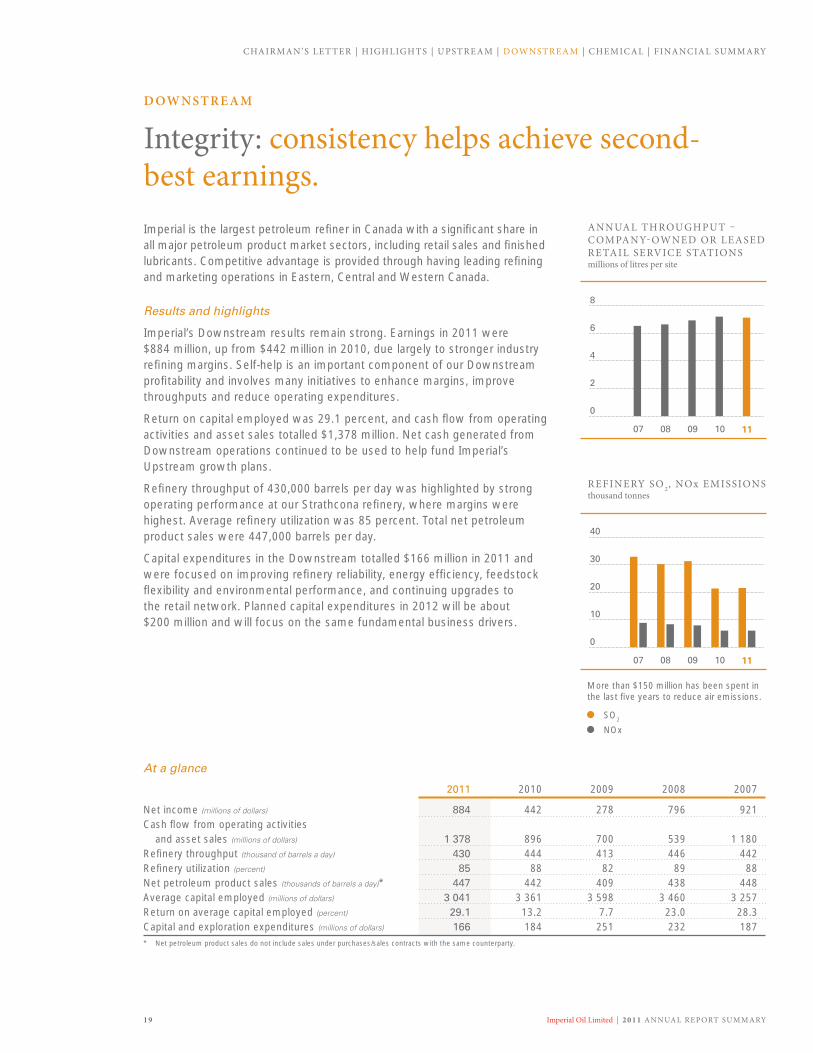
Imperial’s Downstream results remain strong. Earnings in 2011 were $884 million, up from $442 million in 2010, due largely to stronger industry refining margins. Self-help is an important component of our Downstream profitability and involves many initiatives to enhance margins, improve throughputs and reduce operating expenditures.
Return on capital employed was 29.1 percent, and cash flow from operating activities and asset sales totalled $1,378 million. Net cash generated from Downstream operations continued to be used to help fund Imperial’s Upstream growth plans.
Refinery throughput of 430,000 barrels per day was highlighted by strong operating performance at our Strathcona refinery, where margins were highest. Average refinery utilization was 85 percent. Total net petroleum product sales were 447,000 barrels per day.
Capital expenditures in the Downstream totalled $166 million in 2011 and were focused on improving refinery reliability, energy efficiency, feedstock flexibility and environmental performance, and continuing upgrades to the retail network. Planned capital expenditures in 2012 will be about $200 million and will focus on the same fundamental business drivers.
At a glance
2011 2010 2009 2008 2007
Net income (millions of dollars) 884 442 278 796 921Cash flow from operating activities
and asset sales (millions of dollars) 1 378 896 700 539 1 180Refinery throughput (thousand of barrels a day) 430 444 413 446 442Refinery utilization (percent) 85 88 82 89 88Net petroleum product sales (thousands of barrels a day)* 447 442 409 438 448Average capital employed (millions of dollars) 3 041 3 361 3 598 3 460 3 257Return on average capital employed (percent) 29.1 13.2 7.7 23.0 28.3Capital and exploration expenditures (millions of dollars) 166 184 251 232 187* Net petroleum product sales do not include sales under purchases/sales contracts with the same counterparty.
ANNUAL THROUGHPUT – C OMPANY-OWNED OR LEASED RETAIL SERVICE STATIONSmillions of litres per site
4
10 1107 0908
8
6
2
0
REFINERY SO 2, NOx EMISSIONSthousand tonnes
20
10 1107 0908
40
30
10
0
More than $150 million has been spent in the last five years to reduce air emissions.
SO2
NOx

Imperial Oil Limited | 2 0 1 1 ANNUAL REPORT SUMMARY 2 0
Refining and supply: reducing costs by upgrading lower-valued crudes
Refining and supply financial performance improved, compared to 2010, due to our ability to capture strong mid-continent margins. However, results were in part offset by increased planned maintenance activity at our Nanticoke refinery and the challenging market conditions of Atlantic Basin refining.
In addition to having the largest total crude oil processing capacity of any refiner in Canada, Imperial’s refinery system has the most conversion capacity or ability to convert less valuable crude oil components to high-valued products. This enables Imperial to take advantage of lower-valued crudes, helping reduce overall costs. In 2011, we processed more than 100,000 barrels a day of price-advantaged crudes.
Operational excellence encompasses all aspects of our activities:
• Ensuring safe, environmentally responsible operations
• Highbusinessstandardsandcontrols,including management of credit exposure with bad debt losses confined to one-tenth of one percent
• Improvingreliability
• Energyefficiency–toreducebothcosts and greenhouse gas emissions
• Productquality
• Efficientprojectexecution
Markets for refined products in Canada are relatively mature and are not expected to grow as energy efficiency of new motor vehicles continues to improve. In this environment, the strategy for earnings growth focuses on striving for best-in-class unit costs and reliable operations while providing quality, valued products and services to customers.
Fuels marketing: providing more to customers
The fuels marketing business in Canada continues to be a solid contributor to overall Downstream profitability. Imperial remains one of the largest branded retail marketers in Canada, selling through a chain of more than 1,800 Esso-branded retail stations, and marketing to commercial customers through a network of approximately 70 branded agents and resellers. Imperial also markets fuels directly to large customers in the industrial, road transport, aviation and marine businesses, and supplies large unbranded wholesale customers with their petroleum product requirements.
Fuels marketing sales volumes were 322,500 barrels a day, up almost 5,500 barrels a day from the previous year. Aviation sales volumes were 30,000 barrels a day, the highest in the history of the business.
Through a disciplined capital investment program and relationships with branded wholesalers, Imperial remains focused on providing customers with a premium offer that includes locations that are convenient and accessible, and offer one-stop shopping for fuel, convenience products, food services and a car wash.
Imperial continues to invest to upgrade its network of approximately 480 company-owned or leased locations. This network is anchored by On the Run branded convenience stores and supported by important alliance partnerships including Tim Hortons and RBC Royal Bank. In 2011, Imperial implemented a new point-of-sale system that employs chip-and-pin technology that reduces opportunity for fraudulent card use.
D OWNSTREAM
Imperial’s car washes are a part of its premium retail offer.

Imperial Oil Limited | 2 0 1 1 ANNUAL REPORT SUMMARY2 1
CHAIRMAN’S LET TER | HIGHLIGHT S | UPSTREAM | D OWNSTREAM | CHEMICAL | FINANCIAL SUMMARY
Industrial and wholesale business: reducing complexity and cost
In 2011, Imperial made significant progress towards improving its industrial and wholesale segment, the portion of the business involved in the sale of bulk products through Esso-branded agents and resellers across Canada. The effort entails the conversion of its company-owned commercial business to a branded-distributor method of business. This strategy will reduce complexity, costs and risks in the business while enabling local branded resellers to grow their business. In November 2011, as part of this program, Imperial reached an agreement with Viterra, a publicly traded Canadian company, to become a branded reseller of Esso fuels primarily to agricultural customers in the Prairies. Conversions have also been completed with strong branded reseller partners in several others areas, including Newfoundland, Prince Edward Island, Quebec and parts of Ontario and British Columbia.
Lubricants and specialties: fully Mobil-branded offer increases sales
Imperial is the leading marketer and manufacturer of lubricants in Canada. In 2011, based on customer preferences, the lubricants and specialties business completed the move to a fully Mobil-branded offer. Sales grew one percent from 2010. In 2011, Imperial introduced Mobil 1 Advanced Fuel Economy to its Flagship Mobil 1 offer. This advanced synthetic product enhances engine efficiency and improves fuel economy by up to 1.2 percent compared to other engine oil grades in Canada.
Mobil Delvac, a heavy-duty diesel engine oil for commercial vehicles, was introduced in 2009. Sales of the flagship Delvac product, Mobil Delvac 1, increased by 16 percent compared to 2010.
While Imperial also markets Mobil-branded lubricant products directly to large industrial customers and original equipment manufacturer accounts, the lubricants business is further improving market coverage by establishing a Strategic Distributor Network, comprised of larger, more capable distributors, to efficiently represent Mobil products in their respective markets.
29 percentCanadian lubricant market share
Trademarks:
1 On the Run, Speedpass, Mobil, Mobil Super, Mobil 1, Delvac, Mobil Delvac 1, Mobil 1 Lube Express and the Pegasus design are trademarks of Exxon Mobil Corporation or one of its subsidiaries. Imperial Oil licensee.
2 RBC and Royal Bank are registered trademarks of Royal Bank of Canada.3 Tim Hortons is a registered trademark of the TDL Marks Corporation.
2.1.
1. Imperial manufactures and markets Mobil-branded lubricants in Canada. 2. A corporate retail site. 3. A Toronto attendant.
3.
Imperial Oil Limited | 2 0 1 1 ANNUAL REPORT SUMMARY 2 2
A disciplined execution of our long-term business strategies has translated into strong performance across the business cycle.
STR ATEGIES
• Focus on business that capitalizes on core competencies
• Capture benefits of integration
• Consistently deliver best-in-class performance
• Selectively invest in advantaged projects
C OMPETITIVE ADVANTAGES
• Portfolio quality
• Disciplined investing
• Operational excellence
• Integration synergies
• Advantaged feedstock
Imperial Oil Limited | 2 0 1 1 ANNUAL REPORT SUMMARY2 3
CHAIRMAN’S LET TER | HIGHLIGHT S | UPSTREAM | D OWNSTREAM | CHEMICAL | FINANCIAL SUMMARY
CHEMICAL
Integrity: near-record earnings realized through integration and a disciplined business approach.
Imperial is one of Canada’s leading producers of chemical products with the largest market share in North America for polyethylene used in rotational molding and the second-largest market share in injection molding.
Results and highlights
Chemical operations had a strong year for safety, reliability and overall performance. Earnings were $122 million in 2011, up from $69 million in 2010 as a result of continuing margin strength and the absence of a major facilities turnaround in 2010. The chemical business remains highly cyclical. Margins were up in 2011, reflecting improved global economic conditions and the continued focus on premium product segments.
Imperial’s ongoing focus on the integration of its Chemical and refinery operations continues to deliver benefits through the physical integration of sites, joint feedstock and facilities planning, as well as shared manufacturing excellence networks and corporate services. Through this approach, Imperial was able to remain a leader in cost and productivity by upgrading component streams to their highest value.
Return on average capital employed was 58.9 percent, and cash flow from operating activities and asset sales totalled $53 million. Successful management of credit exposure contributed to strong returns.
Total sales of petrochemical products were 1,016 thousand tonnes, compared with 989 thousand tonnes in 2010, due to lower planned maintenance activities.
Capital expenditures in 2011 were $4 million, compared with $10 million in 2010. Planned expenditures in 2012 will be about $14 million and will include investments in safety and environmental initiatives, and operational and reliability improvements.
In 2011, Imperial signed a long-term supply agreement for ethane from the Marcellus shale formation to use as cost-advantaged feedstock for the Sarnia chemical plant. The agreement is expected to take effect in July 2013.
At a glance
2011 2010 2009 2008 2007
Net income (millions of dollars) 122 69 46 100 97Cash flow from operating activities
and asset sales (millions of dollars) 53 65 67 183 109Chemical sales volumes (thousands of tonnes) 1 016 989 1 026 1 021 1 121 Average capital employed (millions of dollars) 207 165 169 199 230Return on average capital employed (percent) 58.9 41.8 27.2 50.4 42.2Capital and exploration expenditures (millions of dollars) 4 10 15 13 11
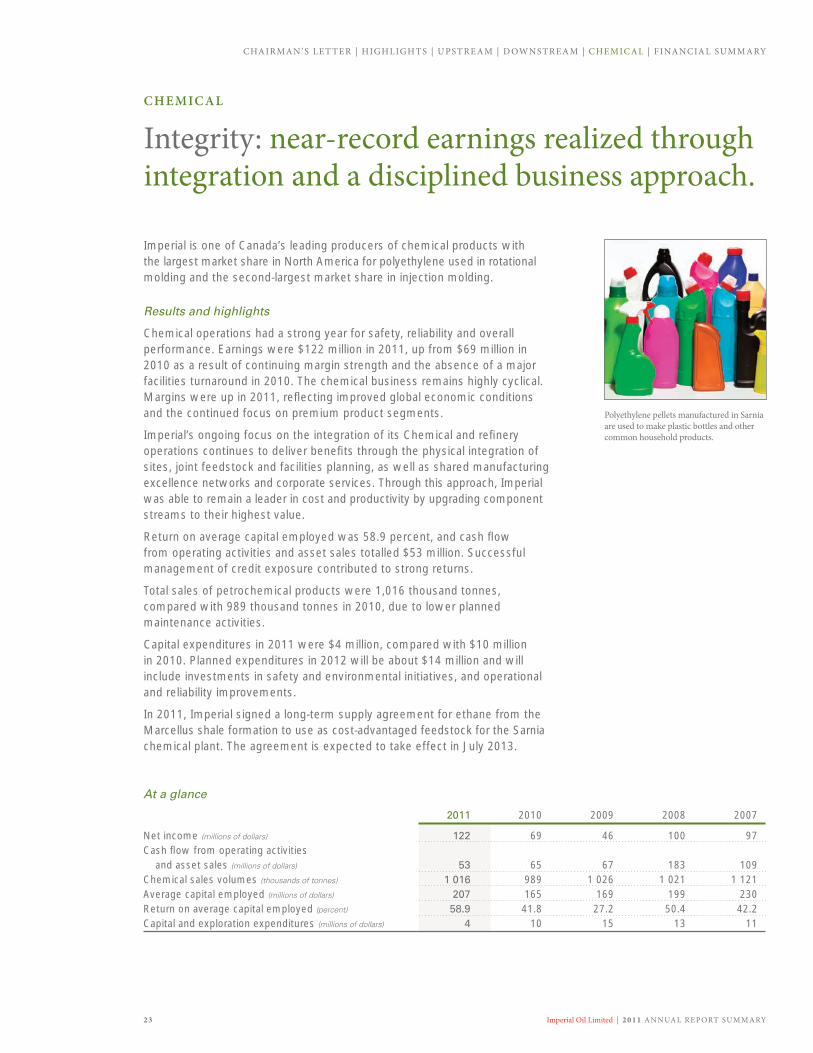
Polyethylene pellets manufactured in Sarnia are used to make plastic bottles and other common household products.

Imperial Oil Limited | 2 0 1 1 ANNUAL REPORT SUMMARY 2 4
FEATURE – WHY C OST MANAGEMENT IS KEY TO IMPERIAL’ S PROFITABILIT Y
Imperial’s operational excellence philosophy is to focus on the business elements within its control. These elements include relentlessly managing costs, continuing to improve energy efficiency, and growing profitable sales.Imperial delivers superior returns to shareholders. A major contributor to that has been a relentless focus on managing costs.
Imperial’s cost management takes several forms – a highly disciplined approach to investment, a commitment to operating our facilities at the lowest possible unit cost, and an organizational focus where the continuous improvement of all our processes – operational as well as administrative − are pursued. Together, this has resulted in an industry-leading return on average capital employed that is underpinned by double-digit returns in all of the company’s individual business segments.
Each year, Imperial identifies actionable “self-help” initiatives that create improvements, such as reducing operating costs, improving reliability, reducing downtime, increasing production, and selling more high-value products.
In the Downstream, Imperial is taking advantage of integration opportunities to help optimize earnings and costs. At the Sarnia manufacturing site, our Refining and Chemical businesses are heavily integrated, allowing the company to take full advantage of shared site support functions such as maintenance, project development and execution, and safety, health and environmental resources, as well as optimal feedstock and intermediate stream disposition.
To stay competitive, the company aims to have the lowest cost structure and the most efficient operations. Competitive advantages for Imperial are the many technology advances that help it to improve yields and increase efficiency.
Attention to costs does not stop at the operations level. The company is ever mindful of the overhead costs of its business – what is called “cost above field,” or the costs over and above those incurred in direct operations. For over a decade, Imperial has been able to keep overhead cost growth below the rate of
inflation. Continuous improvement methodologies − standardization, simplification and centralization of work processes − are important enablers to cost reduction.
Another key element of cost containment is energy management. For example, at the manufacturing sites, Imperial’s target is to improve energy efficiency by one percent each year (an 18 percent reduction has been achieved since 1990). Following the successes at Downstream refinery sites, the company adopted the Global Energy Management System at Cold Lake and Syncrude facilities.
In the Upstream, Imperial’s relationship with ExxonMobil has helped to eliminate unnecessary work and improve effectiveness by capitalizing on best practices around the world. For example, in 2011, an effectiveness workshop was conducted at Cold Lake to identify wellwork opportunities to improve profitability. As a result of this study, initiatives were identified and implemented that reduced wellwork jobs, saving the company approximately $5 million per year. This relentless approach to managing costs provides a competitive advantage and makes Imperial less vulnerable to economic downturns.
OPER ATING C OST Smillions of dollars
0805 11
8 000
6 000
4 000
2 000
0
Costs have remained flat since 2005.

Imperial Oil Limited | 2 0 1 1 ANNUAL REPORT SUMMARY2 5
CHAIRMAN’S LET TER | HIGHLIGHT S | UPSTREAM | D OWNSTREAM | CHEMICAL | FINANCIAL SUMMARY
Summary of accounting policies and practices
The company’s accounting and financial reporting fairly reflect its straightforward business model involving the extracting, refining and marketing of hydrocarbons and hydrocarbon-based products. The summary financial statements have been prepared in accordance with generally accepted accounting principles of the United States of America (GAAP). GAAP requires management to make estimates and judgments that affect the reported amounts of assets, liabilities, revenues and expenses and the disclosure of contingent assets and liabilities. All amounts are in Canadian dollars unless otherwise indicated.
The summary financial statements include the accounts of Imperial Oil Limited and its subsidiaries. Intercompany accounts and transactions are eliminated. Subsidiaries include those companies in which Imperial has both an equity interest and the continuing ability to unilaterally determine strategic, operating, investing and financing policies. A significant portion of the company’s Upstream activities is conducted jointly with other companies. The accounts reflect the company’s share of undivided interest in such activities, including its 25 percent interest in the Syncrude joint venture and its nine percent interest in the Sable offshore energy project as well as its 70.96 percent interest in the Kearl project, which is currently under development.
Revenues associated with sales of crude oil, natural gas, petroleum and chemical products are recognized when the products are delivered and title passes to the customer.
Inventories of crude oil, products and merchandise are carried at the lower of current market value or cost (generally determined under the last-in, first-out method – LIFO).
The company does not use financing structures for the purpose of altering accounting outcomes or removing debt from the balance sheet. The company does not use derivative instruments to speculate on the future direction of currency or commodity prices.
The company’s exploration and production activities are accounted for under the “successful efforts” method. Depreciation, depletion and amortization are primarily determined under either the unit-of-production method or the straight-line method. Unit-of-production rates are based on the amount of proved developed reserves of oil and gas that are estimated to be recoverable from existing facilities. The straight-line method is based on estimated asset service life.
The company incurs retirement obligations for certain assets at the time they are installed. The fair values of these obligations are recorded as liabilities on a discounted basis and are accreted over time for the change in their present value. The costs associated with these liabilities are capitalized as part of the related assets and depreciated. Liabilities for environmental costs are recorded when it is probable that obligations have been incurred and the amounts can be reasonably estimated.
The company recognizes the underfunded or overfunded status of defined benefit pension and other post-retirement plans as a liability or asset in the balance sheet with the offset in shareholders’ equity, net of deferred taxes.
A variety of claims have been made against Imperial Oil and certain of its consolidated subsidiaries in a number of pending lawsuits and tax disputes. For further information on tax contingencies and litigation, see Notes 3 and 9 to the Consolidated Financial Statements in Appendix A of Imperial Oil’s 2012 Management Proxy Circular.
The company awards share-based compensation to employees in the form of restricted stock units. Compensation expense is measured each reporting period based on the company’s current stock price and is recorded in the consolidated statement of income over the requisite service period of each award.
Further information on the company’s accounting policies and practices can be found in Appendix A of Imperial Oil’s 2012 Management Proxy Circular (Critical accounting estimates and note 1 to the consolidated financial statements).
FINANCIAL SUMMARY
Report of independent registered public accounting firm
To the Shareholders of Imperial Oil Limited:
We have audited, in accordance with the standards of the Public Company Accounting Oversight Board (United States), the consolidated balance sheets of Imperial Oil Limited as of December 31, 2011 and December 31, 2010, and the related consolidated statements of income, shareholders’ equity and cash flows for each of the three years in the period ended December 31, 2011 (not presented herein) appearing in Appendix A to the Management Proxy Circular for the 2012 annual meeting of shareholders of the Company; and in our report dated February 23, 2012, we expressed an unqualified opinion on those consolidated financial statements.
In our opinion, the information set forth in the accompanying condensed consolidated financial statements (pages 25 to 28) is fairly stated, in all material respects, in relation to the consolidated financial statements from which it has been derived.
PricewaterhouseCoopers LLP Chartered Accountants, Calgary, Alberta, Canada February 23, 2012
Imperial Oil Limited | 2 0 1 1 ANNUAL REPORT SUMMARY 2 6
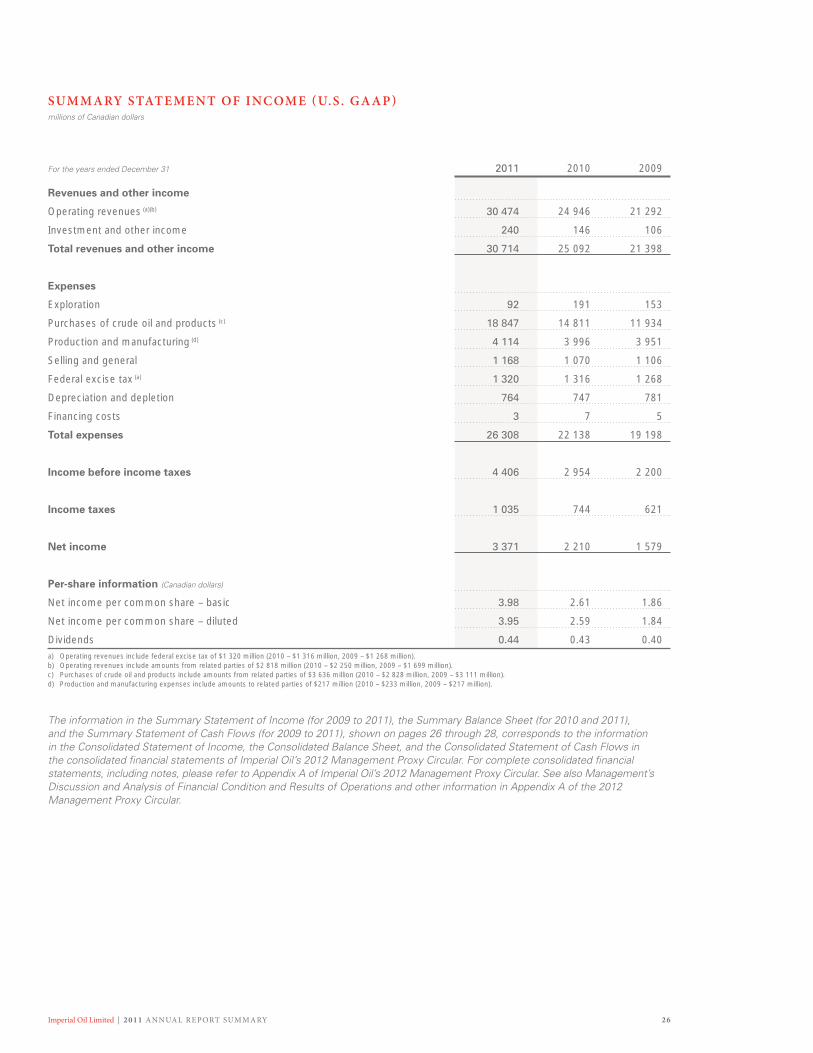
SUMMARY STATEMENT OF INC OME (U.S . GAAP)millions of Canadian dollars
For the years ended December 31 2011 2010 2009
Revenues and other income
Operating revenues (a)(b) 30 474 24 946 21 292
Investment and other income 240 146 106
Total revenues and other income 30 714 25 092 21 398
Expenses
Exploration 92 191 153
Purchases of crude oil and products (c) 18 847 14 811 11 934
Production and manufacturing (d) 4 114 3 996 3 951
Selling and general 1 168 1 070 1 106
Federal excise tax (a) 1 320 1 316 1 268
Depreciation and depletion 764 747 781
Financing costs 3 7 5
Total expenses 26 308 22 138 19 198
Income before income taxes 4 406 2 954 2 200
Income taxes 1 035 744 621
Net income 3 371 2 210 1 579
Per-share information (Canadian dollars)
Net income per common share – basic 3.98 2.61 1.86
Net income per common share – diluted 3.95 2.59 1.84
Dividends 0.44 0.43 0.40 a) Operating revenues include federal excise tax of $1 320 million (2010 – $1 316 million, 2009 – $1 268 million).b) Operating revenues include amounts from related parties of $2 818 million (2010 – $2 250 million, 2009 – $1 699 million).c) Purchases of crude oil and products include amounts from related parties of $3 636 million (2010 – $2 828 million, 2009 – $3 111 million).d) Production and manufacturing expenses include amounts to related parties of $217 million (2010 – $233 million, 2009 – $217 million).
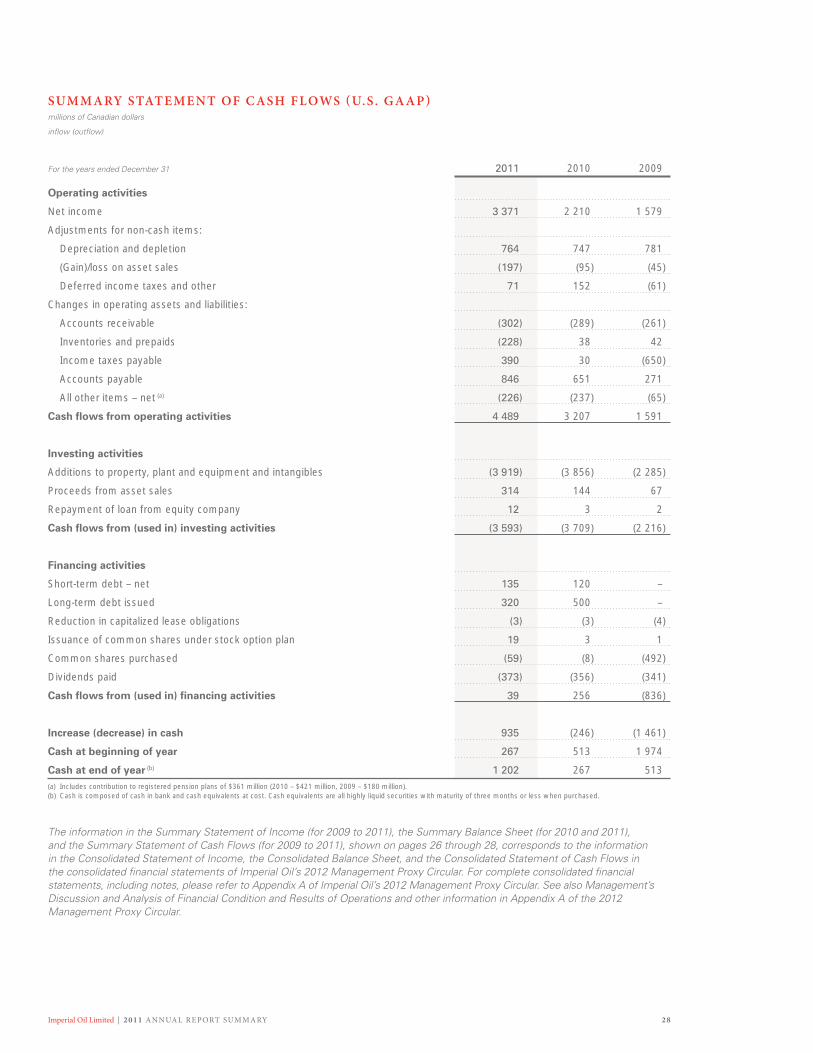
The information in the Summary Statement of Income (for 2009 to 2011), the Summary Balance Sheet (for 2010 and 2011), and the Summary Statement of Cash Flows (for 2009 to 2011), shown on pages 26 through 28, corresponds to the information in the Consolidated Statement of Income, the Consolidated Balance Sheet, and the Consolidated Statement of Cash Flows in the consolidated financial statements of Imperial Oil’s 2012 Management Proxy Circular. For complete consolidated financial statements, including notes, please refer to Appendix A of Imperial Oil’s 2012 Management Proxy Circular. See also Management’s Discussion and Analysis of Financial Condition and Results of Operations and other information in Appendix A of the 2012 Management Proxy Circular.

Imperial Oil Limited | 2 0 1 1 ANNUAL REPORT SUMMARY2 7
CHAIRMAN’S LET TER | HIGHLIGHT S | UPSTREAM | D OWNSTREAM | CHEMICAL | FINANCIAL SUMMARY
At December 31 2011 2010
Assets
Current assets
Cash 1 202 267
Accounts receivable, less estimated doubtful amounts 2 290 2 000
Inventories of crude oil and products 762 527
Materials, supplies and prepaid expenses 239 246
Deferred income tax assets 590 498
Total current assets 5 083 3 538
Long-term receivables, investments and other long-term assets 920 870
Property, plant and equipment, less accumulated depreciation and depletion 19 162 15 905
Goodwill 204 204
Other intangible assets, net 60 63
Total assets 25 429 20 580
Liabilities
Current liabilities
Notes and loans payable 364 229
Accounts payable and accrued liabilities (a) 4 317 3 470
Income taxes payable 1 268 878
Total current liabilities 5 949 4 577
Long-term debt (b) 843 527
Other long-term obligations 3 876 2 753
Deferred income tax liabilities 1 440 1 546
Total liabilities 12 108 9 403
Commitments and contingent liabilities
Shareholders’ equity
Common shares at stated value (c) 1 528 1 511
Earnings reinvested 14 031 11 090
Accumulated other comprehensive income (2 238) (1 424)
Total shareholders’ equity 13 321 11 177
Total liabilities and shareholders’ equity 25 429 20 580 (a) Accounts payable and accrued liabilities include amounts payable to related parties of $215 million (2010 – amounts receivable of $45 million).(b) Long-term debt includes amounts to related parties of $820 million (2010 – $500 million).(c) Number of common shares outstanding was 848 million (2010 – 848 million).
The information in the Summary Statement of Income (for 2009 to 2011), the Summary Balance Sheet (for 2010 and 2011), and the Summary Statement of Cash Flows (for 2009 to 2011), shown on pages 26 through 28, corresponds to the information in the Consolidated Statement of Income, the Consolidated Balance Sheet, and the Consolidated Statement of Cash Flows in the consolidated financial statements of Imperial Oil’s 2012 Management Proxy Circular. For complete consolidated financial statements, including notes, please refer to Appendix A of Imperial Oil’s 2012 Management Proxy Circular. See also Management’s Discussion and Analysis of Financial Condition and Results of Operations and other information in Appendix A of the 2012 Management Proxy Circular.
SUMMARY BAL ANCE SHEET (U.S . GAAP)millions of Canadian dollars
Imperial Oil Limited | 2 0 1 1 ANNUAL REPORT SUMMARY 2 8
SUMMARY STATEMENT OF CASH FLOWS (U.S . GAAP)millions of Canadian dollars
inflow (outflow)
For the years ended December 31 2011 2010 2009
Operating activities
Net income 3 371 2 210 1 579
Adjustments for non-cash items:
Depreciation and depletion 764 747 781
(Gain)/loss on asset sales (197) (95) (45)
Deferred income taxes and other 71 152 (61)
Changes in operating assets and liabilities:
Accounts receivable (302) (289) (261)
Inventories and prepaids (228) 38 42
Income taxes payable 390 30 (650)
Accounts payable 846 651 271
All other items – net (a) (226) (237) (65)
Cash flows from operating activities 4 489 3 207 1 591
Investing activities
Additions to property, plant and equipment and intangibles (3 919) (3 856) (2 285)
Proceeds from asset sales 314 144 67
Repayment of loan from equity company 12 3 2
Cash flows from (used in) investing activities (3 593) (3 709) (2 216)
Financing activities
Short-term debt – net 135 120 –
Long-term debt issued 320 500 –
Reduction in capitalized lease obligations (3) (3) (4)
Issuance of common shares under stock option plan 19 3 1
Common shares purchased (59) (8) (492)
Dividends paid (373) (356) (341)
Cash flows from (used in) financing activities 39 256 (836)
Increase (decrease) in cash 935 (246) (1 461)
Cash at beginning of year 267 513 1 974
Cash at end of year (b) 1 202 267 513 (a) Includes contribution to registered pension plans of $361 million (2010 – $421 million, 2009 – $180 million).(b) Cash is composed of cash in bank and cash equivalents at cost. Cash equivalents are all highly liquid securities with maturity of three months or less when purchased.
The information in the Summary Statement of Income (for 2009 to 2011), the Summary Balance Sheet (for 2010 and 2011), and the Summary Statement of Cash Flows (for 2009 to 2011), shown on pages 26 through 28, corresponds to the information in the Consolidated Statement of Income, the Consolidated Balance Sheet, and the Consolidated Statement of Cash Flows in the consolidated financial statements of Imperial Oil’s 2012 Management Proxy Circular. For complete consolidated financial statements, including notes, please refer to Appendix A of Imperial Oil’s 2012 Management Proxy Circular. See also Management’s Discussion and Analysis of Financial Condition and Results of Operations and other information in Appendix A of the 2012 Management Proxy Circular.

Imperial Oil Limited | 2 0 1 1 ANNUAL REPORT SUMMARY2 9
CHAIRMAN’S LET TER | HIGHLIGHT S | UPSTREAM | D OWNSTREAM | CHEMICAL | FINANCIAL SUMMARY
2011 2010 2009 2008 2007
Share ownershipAverage number outstanding,
weighted monthly (thousands) 847 659 847 609 849 760 882 604 928 527Number of shares outstanding
at December 31 (thousands) 847 599 847 599 847 599 859 402 903 263Shares held in Canada at December 31 (percent) 10.8 10.8 10.8 11.1 12.1Number of registered shareholders at December 31 (a) 12 736 12 909 13 157 13 206 13 108Number of shareholders registered in Canada 11 304 11 430 11 621 11 620 11 450
Shares traded (thousands) 317 857 212 188 318 055 477 574 292 888
Share prices (dollars) (b)
Toronto Stock ExchangeHigh 54.00 43.50 49.11 62.54 56.26Low 34.15 36.95 35.95 28.79 37.40Close at December 31 45.39 40.58 40.66 40.99 54.62
NYSE Amex (U.S. dollars)
High 55.63 43.54 43.13 63.08 61.48Low 32.18 35.18 28.44 23.84 31.87Close at December 31 44.48 40.52 38.66 33.72 54.78
Net income per share (dollars)
– basic 3.98 2.61 1.86 4.39 3.43– diluted 3.95 2.59 1.84 4.36 3.41
Price ratios at December 31Share price to net earnings (c) 11.5 15.7 22.1 9.4 16.0
Dividends declared (d)
Total (millions of dollars) 373 364 340 334 324Per share (dollars) 0.44 0.43 0.40 0.38 0.35(a) Exxon Mobil Corporation owns 69.6 percent of Imperial’s shares. (b) Imperial’s shares are listed on the Toronto Stock Exchange. The company’s shares also trade in the United States of America on the NYSE Amex LLC. Imperial has unlisted privileges
on the NYSE Amex LLC, a subsidiary of NYSE Euronext. The symbol on these exchanges for Imperial’s common shares is IMO. Share prices were obtained from stock exchange records. U.S. dollar share price presented is based on consolidated U.S. market data.
(c) Closing share price at December 31 at the Toronto Stock Exchange, divided by net income per share – diluted.(d) The fourth quarter dividend is paid on January 1 of the succeeding year.
Career employees 2011 2010 2009 2008 2007
5 083 4 969 5 015 4 843 4 785
SHARE OWNERSHIP, TR ADING AND PERFORMANCE
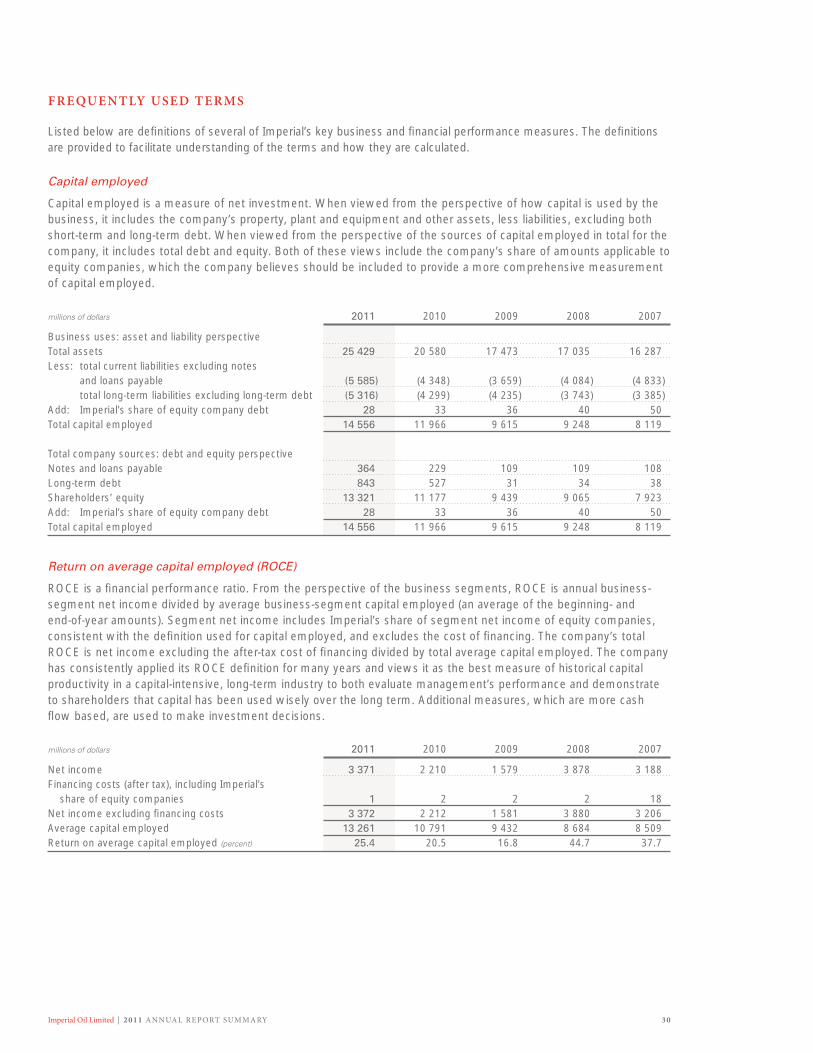
Imperial Oil Limited | 2 0 1 1 ANNUAL REPORT SUMMARY 3 0
FREQUENTLY USED TERMS
Listed below are definitions of several of Imperial’s key business and financial performance measures. The definitions are provided to facilitate understanding of the terms and how they are calculated.
Capital employed
Capital employed is a measure of net investment. When viewed from the perspective of how capital is used by the business, it includes the company’s property, plant and equipment and other assets, less liabilities, excluding both short-term and long-term debt. When viewed from the perspective of the sources of capital employed in total for the company, it includes total debt and equity. Both of these views include the company’s share of amounts applicable to equity companies, which the company believes should be included to provide a more comprehensive measurement of capital employed.
millions of dollars 2011 2010 2009 2008 2007
Business uses: asset and liability perspective Total assets 25 429 20 580 17 473 17 035 16 287 Less: total current liabilities excluding notes
and loans payable (5 585) (4 348) (3 659) (4 084) (4 833) total long-term liabilities excluding long-term debt (5 316) (4 299) (4 235) (3 743) (3 385)Add: Imperial’s share of equity company debt 28 33 36 40 50 Total capital employed 14 556 11 966 9 615 9 248 8 119
Total company sources: debt and equity perspective Notes and loans payable 364 229 109 109 108 Long-term debt 843 527 31 34 38 Shareholders’ equity 13 321 11 177 9 439 9 065 7 923 Add: Imperial’s share of equity company debt 28 33 36 40 50 Total capital employed 14 556 11 966 9 615 9 248 8 119
Return on average capital employed (ROCE)
ROCE is a financial performance ratio. From the perspective of the business segments, ROCE is annual business-segment net income divided by average business-segment capital employed (an average of the beginning- and end-of-year amounts). Segment net income includes Imperial’s share of segment net income of equity companies, consistent with the definition used for capital employed, and excludes the cost of financing. The company’s total ROCE is net income excluding the after-tax cost of financing divided by total average capital employed. The company has consistently applied its ROCE definition for many years and views it as the best measure of historical capital productivity in a capital-intensive, long-term industry to both evaluate management’s performance and demonstrate to shareholders that capital has been used wisely over the long term. Additional measures, which are more cash flow based, are used to make investment decisions.
millions of dollars 2011 2010 2009 2008 2007
Net income 3 371 2 210 1 579 3 878 3 188 Financing costs (after tax), including Imperial’s
share of equity companies 1 2 2 2 18 Net income excluding financing costs 3 372 2 212 1 581 3 880 3 206 Average capital employed 13 261 10 791 9 432 8 684 8 509 Return on average capital employed (percent) 25.4 20.5 16.8 44.7 37.7
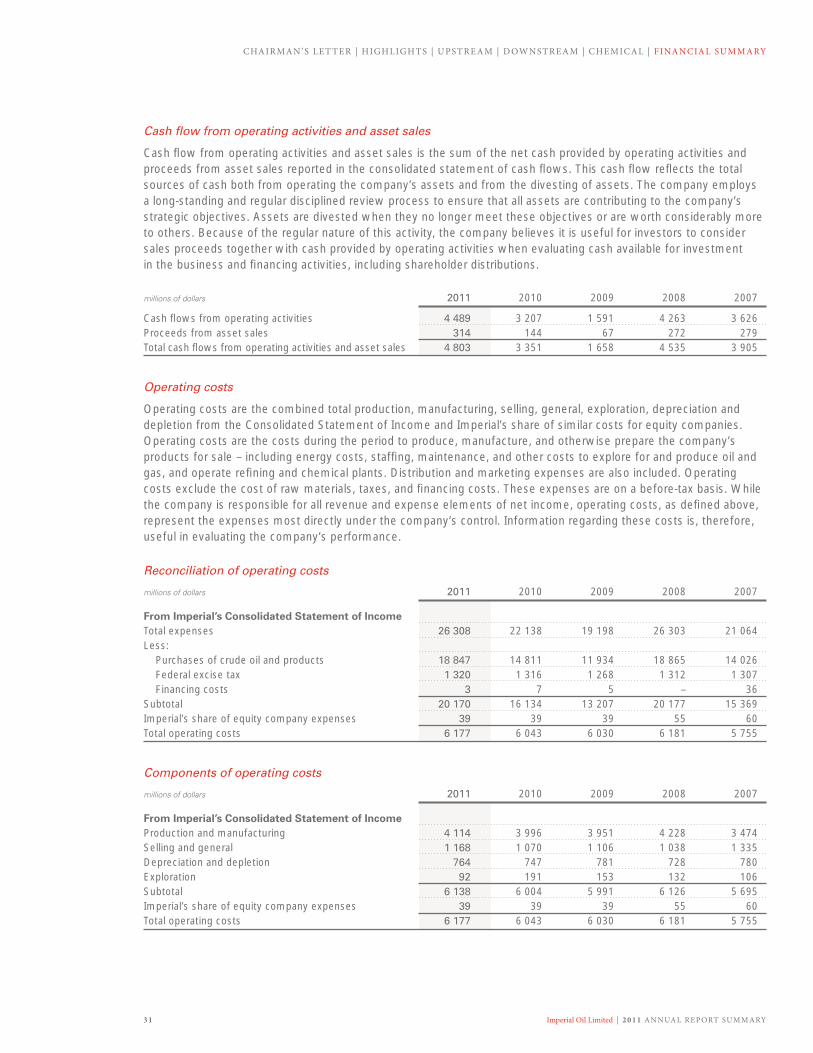
Imperial Oil Limited | 2 0 1 1 ANNUAL REPORT SUMMARY3 1
CHAIRMAN’S LET TER | HIGHLIGHT S | UPSTREAM | D OWNSTREAM | CHEMICAL | FINANCIAL SUMMARY
Cash flow from operating activities and asset sales
Cash flow from operating activities and asset sales is the sum of the net cash provided by operating activities and proceeds from asset sales reported in the consolidated statement of cash flows. This cash flow reflects the total sources of cash both from operating the company’s assets and from the divesting of assets. The company employs a long-standing and regular disciplined review process to ensure that all assets are contributing to the company’s strategic objectives. Assets are divested when they no longer meet these objectives or are worth considerably more to others. Because of the regular nature of this activity, the company believes it is useful for investors to consider sales proceeds together with cash provided by operating activities when evaluating cash available for investment in the business and financing activities, including shareholder distributions.
millions of dollars 2011 2010 2009 2008 2007
Cash flows from operating activities 4 489 3 207 1 591 4 263 3 626 Proceeds from asset sales 314 144 67 272 279 Total cash flows from operating activities and asset sales 4 803 3 351 1 658 4 535 3 905
Operating costs
Operating costs are the combined total production, manufacturing, selling, general, exploration, depreciation and depletion from the Consolidated Statement of Income and Imperial’s share of similar costs for equity companies. Operating costs are the costs during the period to produce, manufacture, and otherwise prepare the company’s products for sale – including energy costs, staffing, maintenance, and other costs to explore for and produce oil and gas, and operate refining and chemical plants. Distribution and marketing expenses are also included. Operating costs exclude the cost of raw materials, taxes, and financing costs. These expenses are on a before-tax basis. While the company is responsible for all revenue and expense elements of net income, operating costs, as defined above, represent the expenses most directly under the company’s control. Information regarding these costs is, therefore, useful in evaluating the company’s performance.
Reconciliation of operating costs
millions of dollars 2011 2010 2009 2008 2007
From Imperial’s Consolidated Statement of IncomeTotal expenses 26 308 22 138 19 198 26 303 21 064Less: Purchases of crude oil and products 18 847 14 811 11 934 18 865 14 026 Federal excise tax 1 320 1 316 1 268 1 312 1 307 Financing costs 3 7 5 – 36Subtotal 20 170 16 134 13 207 20 177 15 369Imperial’s share of equity company expenses 39 39 39 55 60Total operating costs 6 177 6 043 6 030 6 181 5 755
Components of operating costs
millions of dollars 2011 2010 2009 2008 2007
From Imperial’s Consolidated Statement of IncomeProduction and manufacturing 4 114 3 996 3 951 4 228 3 474Selling and general 1 168 1 070 1 106 1 038 1 335Depreciation and depletion 764 747 781 728 780Exploration 92 191 153 132 106Subtotal 6 138 6 004 5 991 6 126 5 695Imperial’s share of equity company expenses 39 39 39 55 60Total operating costs 6 177 6 043 6 030 6 181 5 755

Imperial Oil Limited | 2 0 1 1 ANNUAL REPORT SUMMARY 3 2
Head office
Imperial Oil Limited P.O. Box 2480, Station ‘M’ Calgary, Alberta Canada T2P 3M9
Telephone: 1-800-567-3776 Fax: 1-800-367-0585
Annual meeting
The annual meeting of shareholders will be held on Wednesday, May 2, 2012, at 9:30 a.m. local time at the Metropolitan Conference Centre, 333 - 4th Avenue S.W., Calgary, Alberta, Canada.
Shareholder account matters
To change your address, transfer shares, eliminate multiple mailings, elect to receive dividends in U.S. funds, have dividends deposited directly into accounts at financial institutions in Canada that provide electronic fund transfer services, enrol in the dividend reinvestment and share purchase plan, or enrol for electronic delivery of shareholder reports, please contact Imperial’s transfer agent, CIBC Mellon Trust Company.
CIBC Mellon Trust Company* P.O. Box 700 Postal Station B Montreal, Quebec H3B 3K3
Telephone: 1-800-387-0825 (from Canada & U.S.A.) or 416-682-3860 Fax: 1-888-249-6189 or 514-985-8843 Email: [email protected] Website: www.canstockta.com
United States resident shareholders may transfer their shares through American Stock Transfer & Trust Company LLC.
American Stock Transfer 6201 - 15th Avenue Brooklyn, New York U.S.A. 11219
Telephone: 1-800-387-0825 Email: [email protected] Website: www.amstock.com
Dividend reinvestment and share purchase plan
This plan provides shareholders with two ways to add to their shareholdings at a reduced cost. The plan enables shareholders to reinvest their cash dividends in additional shares at an average market price.
Shareholders can also invest between $50 and $5,000 each calendar quarter in additional shares at an average market price.
Funds directed to the dividend reinvestment and share purchase plan are used to buy existing shares on a stock exchange rather than newly issued shares.
Imperial online
Imperial publishes a wide range of information on its website, including annual and interim reports, SEC filings, proxy circulars and forms, key dates for investors and shareholders, as well as other information that should be helpful to our shareholders in the day-to-day management of their shares. Should you not be able to find the information you are looking for, please contact customer service at 1-800-567-3776.
Website: www.imperialoil.ca
Investor information
Information is also available by writing to the investor relations manager at Imperial’s head office or by:
E-mail: [email protected] Telephone: 403-237-4538 Fax: 403-237-2075
For all other shareholder services-related inquiries, please contact:
Brian W. Livingston Vice-president, general counsel and corporate secretary Telephone: 403-237-2915 Fax: 403-237-2490
Version française du rapport
Pour obtenir la version française du rapport de la Compagnie Pétrolière Impériale Ltée, veuillez écrire à la division des Relations avec les investisseurs, Compagnie Pétrolière Impériale Ltée, P.O. Box 2480, Station ’M’, Calgary, Alberta, Canada T2P 3M9.
Included in this Summary Annual Report are financial and operating highlights and summary financial statements. For complete consolidated financial statements, including notes, please refer to the Management Proxy Circular for Imperial Oil’s 2012 annual meeting. The Management Proxy Circular also includes Management’s Discussion and Analysis of Financial Condition and Results of Operations. The Investors section of Imperial Oil’s website (www.imperialoil.ca) contains the Management Proxy Circular.
INFORMATION FOR INVESTORS
* Canadian Stock Transfer Company Inc. acts as the administrative agent for CIBC Mellon Trust Company.

CHAIRMAN’S LET TER | HIGHLIGHT S | UPSTREAM | D OWNSTREAM | CHEMICAL | FINANCIAL SUMMARY
Imperial Oil Limited | 2 0 1 1 ANNUAL REPORT SUMMARY3 3
DIRECTORS AND OFFICERS
Board of directors
Krystyna T. Hoeg Corporate director Toronto, Ontario
Bruce H. March Chairman, president and chief executive officer Imperial Oil Limited Calgary, Alberta
Jack M. Mintz Palmer Chair in Public Policy University of Calgary Calgary, Alberta
Robert C. Olsen Executive vice-president ExxonMobil Production Company Houston, Texas
David S. Sutherland Corporate director Waterloo, Ontario
Sheelagh D. Whittaker Corporate director London, England
Victor L. Young Corporate director St. John’s, Newfoundland and Labrador
Other officers
Paul J. Masschelin Senior vice-president finance and administration and treasurer
T. Glenn Scott Senior vice-president resources division
Sean R. Carleton Controller
Brian W. Livingston Vice-president general counsel and corporate secretary
Audit committee
V.L. Young, chair S.D. Whittaker, vice-chair K.T. Hoeg J.M. Mintz D.S. Sutherland
Executive resources committee
K.T. Hoeg, chair V.L. Young, vice-chair J.M. Mintz R.C. Olsen D.S. Sutherland S.D. Whittaker
Nominations and corporate governance committee
S.D. Whittaker, chair J.M. Mintz, vice-chair K.T. Hoeg R.C. Olsen D.S. Sutherland V.L. Young
Environment, health and safety committee
J.M. Mintz, chair D.S. Sutherland, vice-chair K.T. Hoeg R.C. Olsen S.D. Whittaker V.L. Young
Contributions committee
D.S. Sutherland, chair K.T. Hoeg, vice-chair B.H. March J.M. Mintz R.C. Olsen S.D. Whittaker V.L. Young
Imperial Oil Limited Board of Directors from left to right: David S. Sutherland, Sheelagh D. Whittaker, Jack M. Mintz, Bruce H. March, Krystyna T. Hoeg, Victor L. Young and Robert C. Olsen.
Imperial Oil Limited (Imperial) is one of Canada’s largest corporations and a leading member of the country’s oil and gas industry. The company is a major producer of crude oil and natural gas, Canada’s largest petroleum refiner, a key petrochemical producer and a leading marketer with coast-to-coast supply and retail networks.
Imperial Oil LimitedP.O. Box 2480, Station ‘M’Calgary, Alberta T2P 3M9
This report was printed on paper made from ECF bleached pulp that is certified by the Forest Stewardship Council®.