2011 summer assessor conference - in.gov summer assessor conference cost schedules for the 2012...
TRANSCRIPT

2011 Summer Assessor Conference
Cost Schedules for the 2012 Reassessment
Terry Knee, DLGF Field Supervisor
J. Wayne Moore, Ph.D.
September 1‐2, 20111

Cost Schedules for the 2012 Reassessment
• Delivery schedule of the 2012 cost tables:– Appendix C: Draft was distributed in early May; Final revised release was
July 1, 2011
– Appendix G: Draft was distributed July 1, 2011; Final revised release wasAppendix G: Draft was distributed July 1, 2011; Final revised release was August 2011
• Why were new cost schedules needed?– 2002 cost schedules were based on 1999 costs
– Construction costs have changed
– Original Guidelines (Manual) was written 35 years ago
– Construction methods, design, materials have changed
C t d l ti d d i & d t– Cost model assumptions needed review & update
2
Cost Schedules for the 2012 Reassessment
• What goals were set for doing the update?• Minimize the cost
• No change in data collection requirements
f f• Retain existing format to minimize software impact
• Develop an in‐house annual update capacity if possible
3
Cost Schedules for the 2012 Reassessment
• Method selected was to do the work at DLGF • Best potential to control & minimize cost
• Best potential for minimizing software impact
• Best potential for developing annual cost update capacity
• What process was used?• 1st – Issue RFP to obtain the right to use cost publisher’s data
• 2nd – Issue RFP to obtain technical assistance & trainingd• 3rd – Create a cost update project team– Barry Wood, Terry Knee, David Schwab, & Wayne Moore
4
Cost Schedules for the 2012 Reassessment
• If Indiana’s assessment standard is “market‐value‐in‐use”, why are cost schedules needed?– Construction cost provides the foundation from which sales calibration analysis and adjustments begin
– Cost of construction is understandable to most people
N h* i l l ti di t h f d– New research* on using parcel x‐y location coordinates has found that accurate replacement cost new (RCN) is an important variable for improving model results in Geographic Attribute Weighted Regression, a technique that is yielding the best house price estimates to date
* Moore & Myers (2010) Journal of Property Tax Assessment & Administration • Volume 6, Issue 3 Moore & Myers (2010) Journal of Property Tax Assessment & Administration Volume 6, Issue 3
5

Cost Schedules for the 2012 Reassessment
• Exactly what is replacement cost new (RCN)?Exactly what is replacement cost new (RCN)?Definition: Replacement cost new (RCN) is the cost, including material, labor, and overhead, that would be incurred in constructing an improvement having the same utility to its owner as a subject improvement withouthaving the same utility to its owner as a subject improvement, without necessarily reproducing exactly any particular characteristics of the subject(IAAO 1997, p. 120).
• Fact: Building design materials and construction• Fact: Building design, materials, and construction methods have undergone much change during the past few yearsfew years
• Hence, a replacement structure will likely be different in design and materials from the original improvementg g p
6

Cost Schedules for the 2012 Reassessment
What is a “Cost Model” and why is it needed?• Building material and labor costs are tracked by specialized
publishers for commercial use by insurance companies and the construction industry as well as appraisersthe construction industry, as well as appraisers
• Contractors use the published cost data for creating detailed cost estimates from building plans g p
• Appraisers need a cost approach estimating model that gives the best trade‐off between accuracy and time invested
• The same building material and labor cost data can give different estimating accuracy, depending upon the cost
d l d thi ill b h l t ith C ft d tmodel used – this will be shown later with Craftsman data7

Cost Schedules for the 2012 Reassessment
Examples of Cost Estimating Model Differences(Moore: 1995 IAAO Conference Presentation, “Stratified Cost Approach”, p 228)
8

Cost Schedules for the 2012 Reassessment
Accurate Cost Model Assumptions Are Neededp
• All “models” attempt to simulate the real world
– Models require assumptions
– A “typical” structure must be defined by RCN model assumptions
– Building construction design and methods have changed
– Most original cost approach model assumptions are not available
• Therefore, first step was to define assumptions
9
Cost Schedules for the 2012 Reassessment
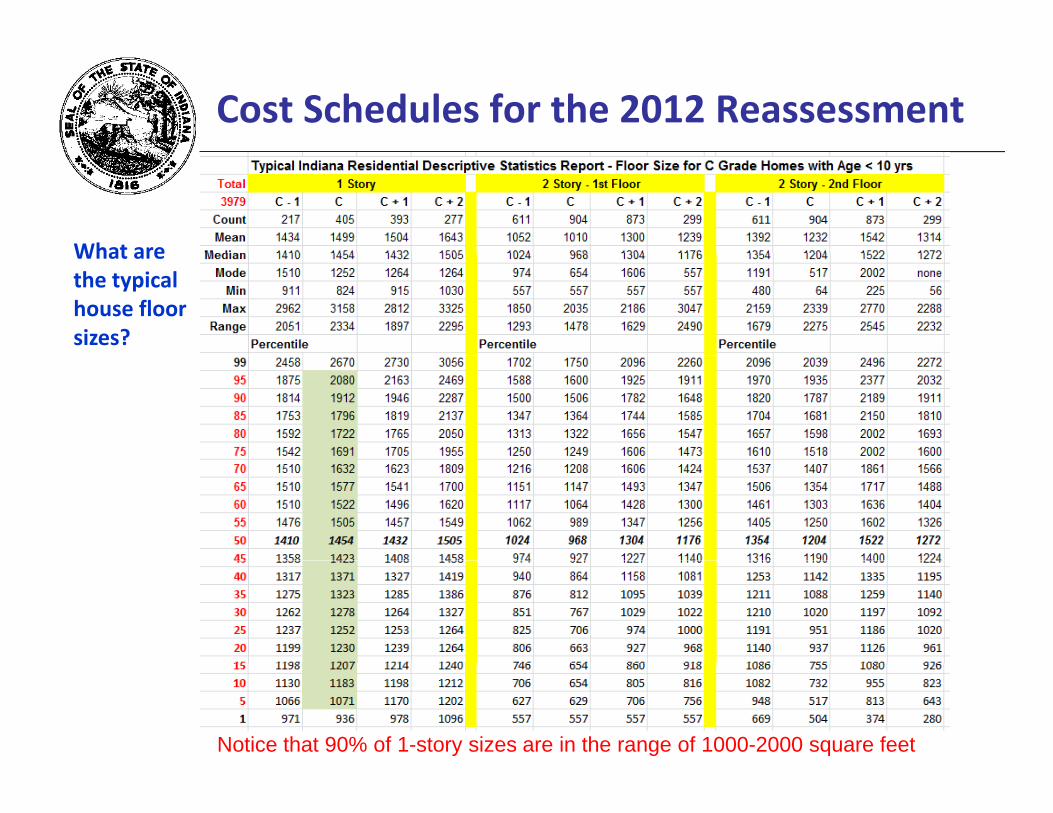
What areWhat are the typical house floor sizes?
Notice that 90% of 1-story sizes are in the range of 1000-2000 square feet10

Cost Schedules for the 2012 Reassessment
Residential Model Assumptions
• Model assumptions formed from real world observationModel assumptions formed from real world observation
• Benchmark house sizes to fit data and span Schedule A:100 400 600 800 1000 1200 1300 1400 1500 1600 1800 2400 3200 4000 5000
• From 2010 new house floor plans, we determined construction characteristics for each floor level:
A i li f h b h k h i– Average perimeter linear feet at each benchmark house size– Average linear feet of interior walls at each benchmark house size– Number of single window equivalents at each benchmark house size– Number of exterior and interior doors at each benchmark house size– Average linear feet of attached garage common wall– Typical roof pitch for each house type:
• One story, two story, part upper floor (½ & ¾ story), attic level
11

Cost Schedules for the 2012 Reassessment
• Residential cost model assumptions based upon anResidential cost model assumptions based upon an analysis of 269 modern floor plans:– 91 one story house plans including 13 from major Indianapolis home builders
– 70 two story first floor plans including 16 from major Indianapolis home buildersIndianapolis home builders
– 73 two story second floor plans including 16 from Indianapolis home builders
– 35 half & three‐quarter story upper level floor plans from the national house plan database
12

Cost Schedules for the 2012 Reassessment
Residential Cost Model Data Gathering
13

Cost Schedules for the 2012 Reassessment
Summarizing House Plan Data in Excel
14
Cost Schedules for the 2012 Reassessment
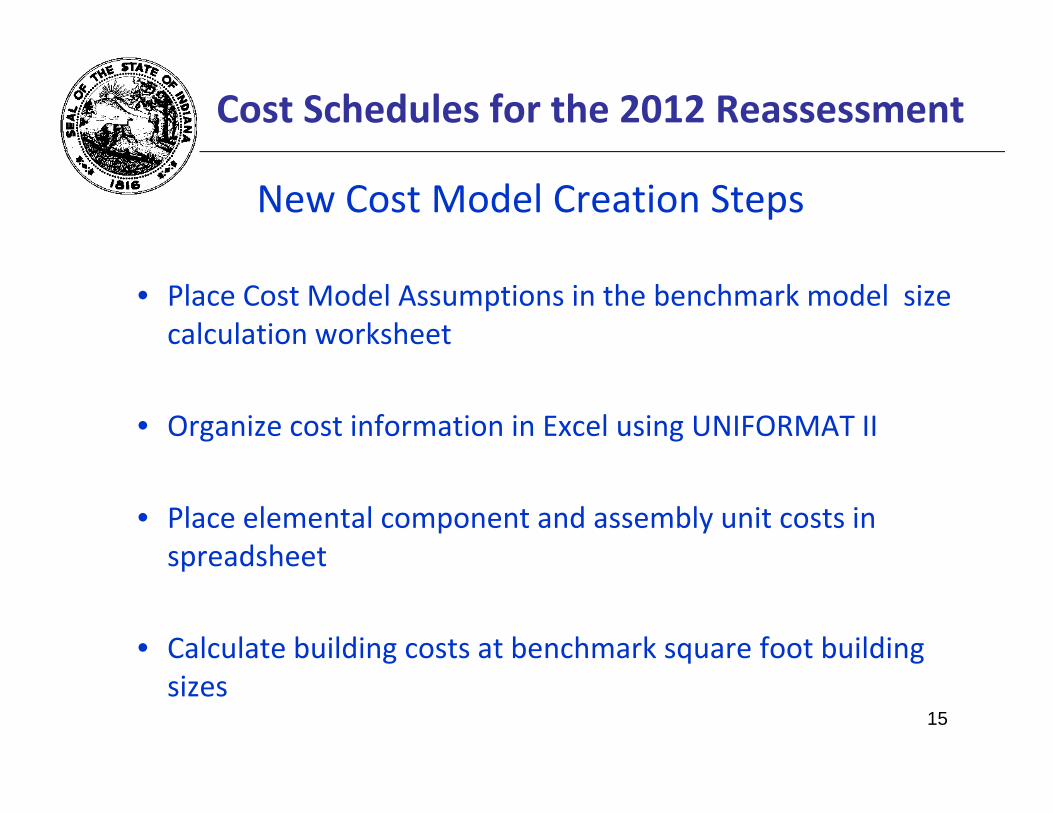
New Cost Model Creation Steps
• Place Cost Model Assumptions in the benchmark model size calculation worksheet
• Organize cost information in Excel using UNIFORMAT II
• Place elemental component and assembly unit costs in spreadsheetspreadsheet
• Calculate building costs at benchmark square foot building g q gsizes
15
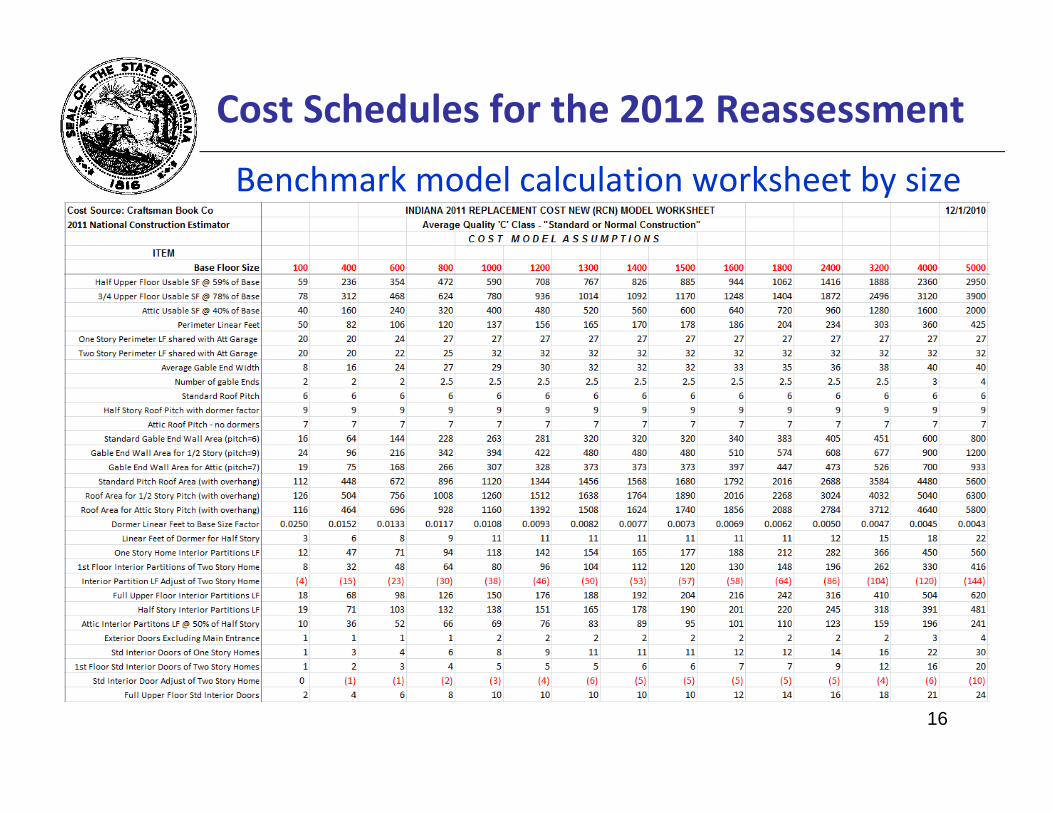
Cost Schedules for the 2012 Reassessment
Benchmark model calculation worksheet by size
16

Cost Schedules for the 2012 Reassessment
Closer look at Cost Model Assumptions: Exterior Closure & Roof
17

Cost Schedules for the 2012 Reassessment
Closer look at Cost Model Assumptions:Part Upper Story
18

Cost Schedules for the 2012 Reassessment
Closer look at Cost Model Assumptions: Part Upper Story Size
Story Living Area Calculation from ANSI Z765‐2003The figure below illustrates a 28 by 42 foot house with part upper living area discussed in the ANSI house measurement standard Commentary section. Without dormers, the construction configuration described would allow a part upper story size of 525 square feet of living area on the upper level, which is 44.6% of the first floor living area (roof pitch is 7.7” per 12”).
19

Cost Schedules for the 2012 Reassessment
Closer look at Cost Model Assumptions: Roof Pitch
20

Cost Schedules for the 2012 Reassessment
Closer look at Cost Model Assumptions:Roof Pitch & Usable Area
Empirical research conducted to establish cost model assumptions revealed that • Standard roof pitch for one & two story houses with no upper level should be 6/12
• Roof pitch for attic upper level should be 7/12 giving usable area of 40% of the base area• Roof pitch for attic upper level should be 7/12 giving usable area of 40% of the base area
• Roof pitch of half story level should be 9/12 giving usable area of 59% of the base area
• Three‐quarter story is ½ full upper story and ½ half story with usable area of 78% of the base
21
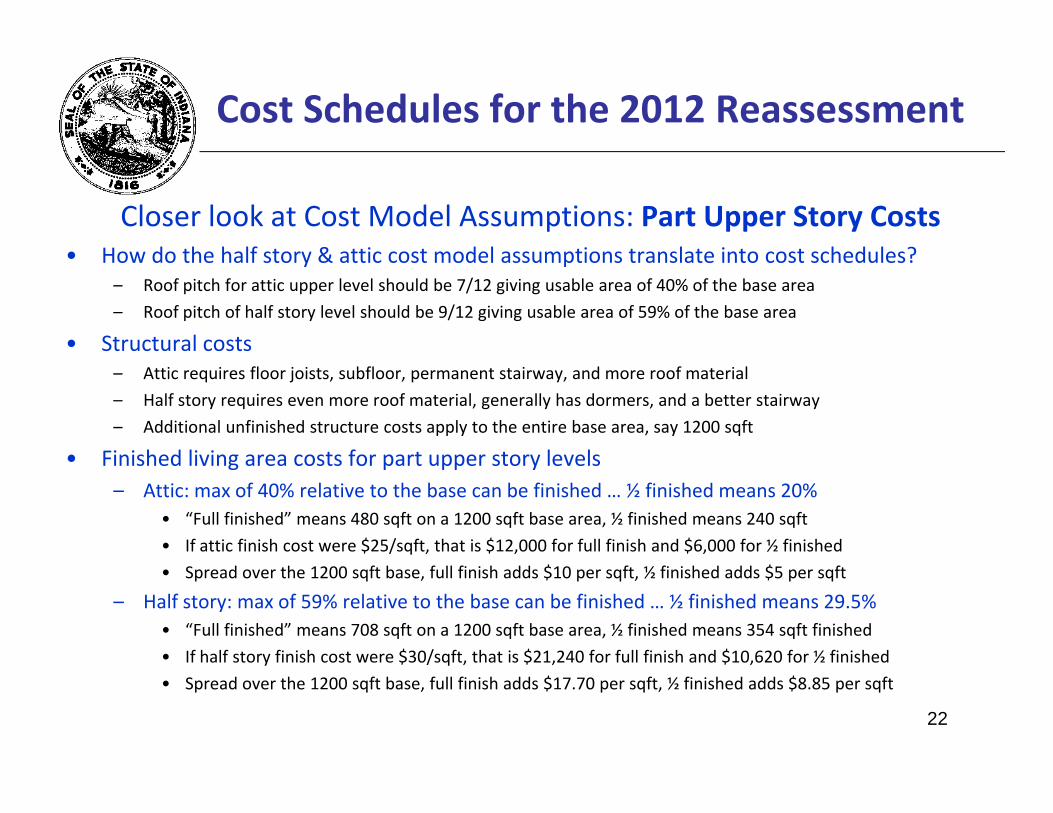
Cost Schedules for the 2012 Reassessment
Closer look at Cost Model Assumptions: Part Upper Story Costs• How do the half story & attic cost model assumptions translate into cost schedules?• How do the half story & attic cost model assumptions translate into cost schedules?
– Roof pitch for attic upper level should be 7/12 giving usable area of 40% of the base area
– Roof pitch of half story level should be 9/12 giving usable area of 59% of the base area
• Structural costs– Attic requires floor joists, subfloor, permanent stairway, and more roof material
– Half story requires even more roof material, generally has dormers, and a better stairway
– Additional unfinished structure costs apply to the entire base area, say 1200 sqft
• Finished living area costs for part upper story levels• Finished living area costs for part upper story levels– Attic: max of 40% relative to the base can be finished … ½ finished means 20%
• “Full finished” means 480 sqft on a 1200 sqft base area, ½ finished means 240 sqft
• If attic finish cost were $25/sqft, that is $12,000 for full finish and $6,000 for ½ finished
• Spread over the 1200 sqft base, full finish adds $10 per sqft, ½ finished adds $5 per sqft
– Half story: max of 59% relative to the base can be finished … ½ finished means 29.5%• “Full finished” means 708 sqft on a 1200 sqft base area, ½ finished means 354 sqft finished
• If half story finish cost were $30/sqft, that is $21,240 for full finish and $10,620 for ½ finished y $ / q , $ , $ ,
• Spread over the 1200 sqft base, full finish adds $17.70 per sqft, ½ finished adds $8.85 per sqft
22

Cost Schedules for the 2012 Reassessment
Closer look at Cost Model Assumptions: Interior Walls
• Why is it important to know the LF of interior walls?– Interior walls are expensive to build
– Modern floor plans use more of an “open design”• Most offices are an open design with far fewer interior partitions
• 1st floor plan of a 2‐story home is different (more open) than a 1‐story home
– Full upper story and part upper story are also different
– Using 2010 partition assembly costs for 2x4 walls:
• Partition wall assemblies cost $6.36 per sqft
• This is $50.88 per LF for an 8’ interior partition
• Hence, accurate cost model estimates important
• Next slide shows interior wall assembly cost components23

Cost Schedules for the 2012 Reassessment
2X4 INTERIOR PARTITION WALL ASSEMBLY, RESIDENTIAL RATES
24

Cost Schedules for the 2012 Reassessment
Closer look at Cost Model Assumptions: Interior Walls
25

Cost Schedules for the 2012 Reassessment
Closer look at Cost Model Assumptions: Doors & Windows
26
Cost Schedules for the 2012 Reassessment
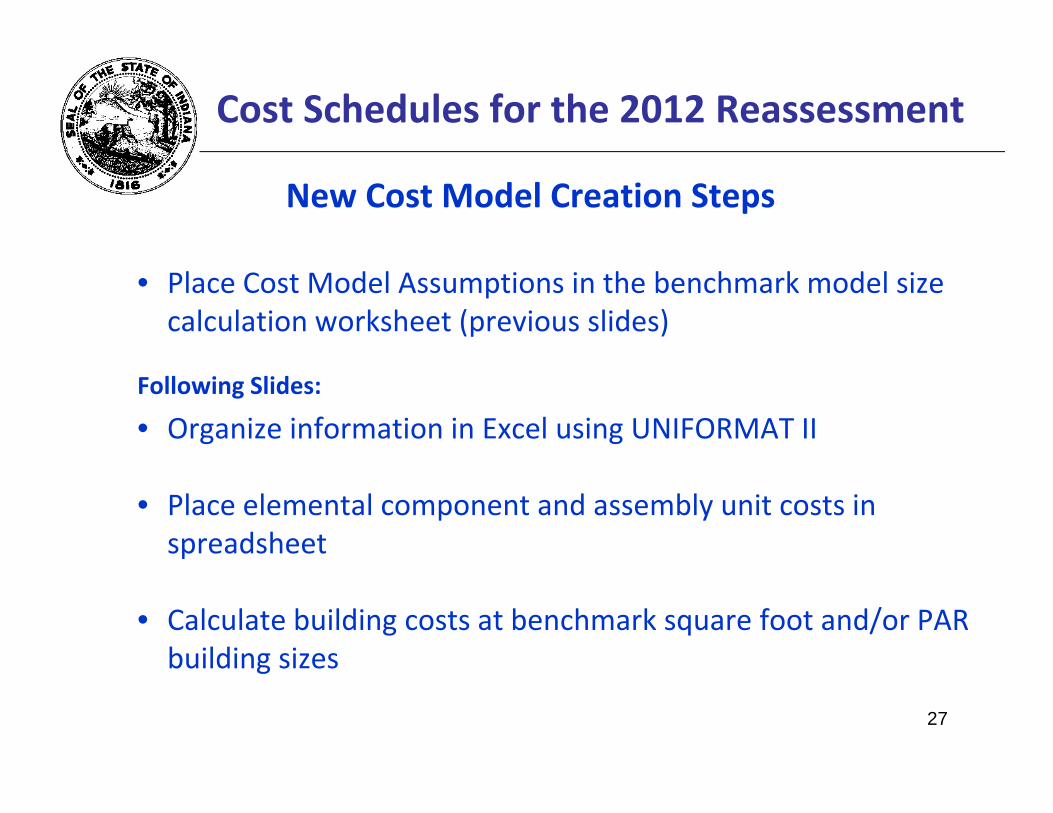
New Cost Model Creation Steps
• Place Cost Model Assumptions in the benchmark model size calculation worksheet (previous slides)
Following Slides:
• Organize information in Excel using UNIFORMAT II
• Place elemental component and assembly unit costs in spreadsheet
• Calculate building costs at benchmark square foot and/or PAR building sizesbuilding sizes
27

Cost Schedules for the 2012 Reassessment
Organize information in Excel using UNIFORMAT II
28
Cost Schedules for the 2012 Reassessment
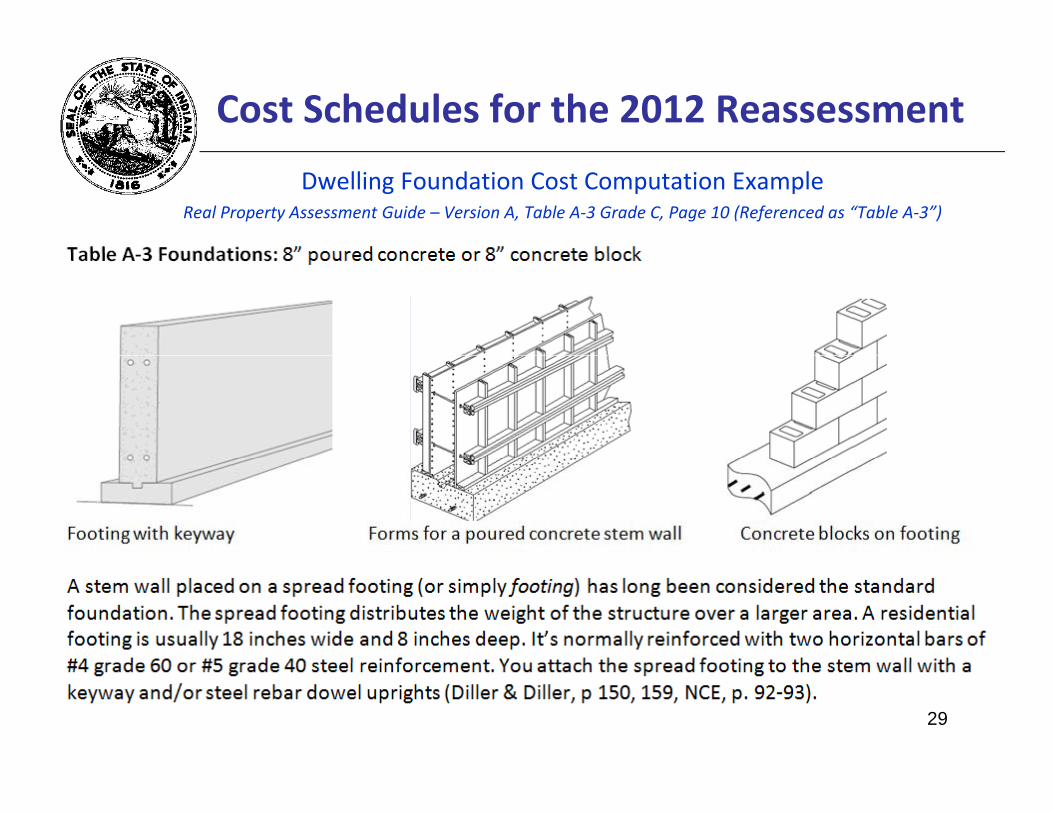
Dwelling Foundation Cost Computation ExampleReal Property Assessment Guide – Version A, Table A‐3 Grade C, Page 10 (Referenced as “Table A‐3”)
29
Cost Schedules for the 2012 Reassessment
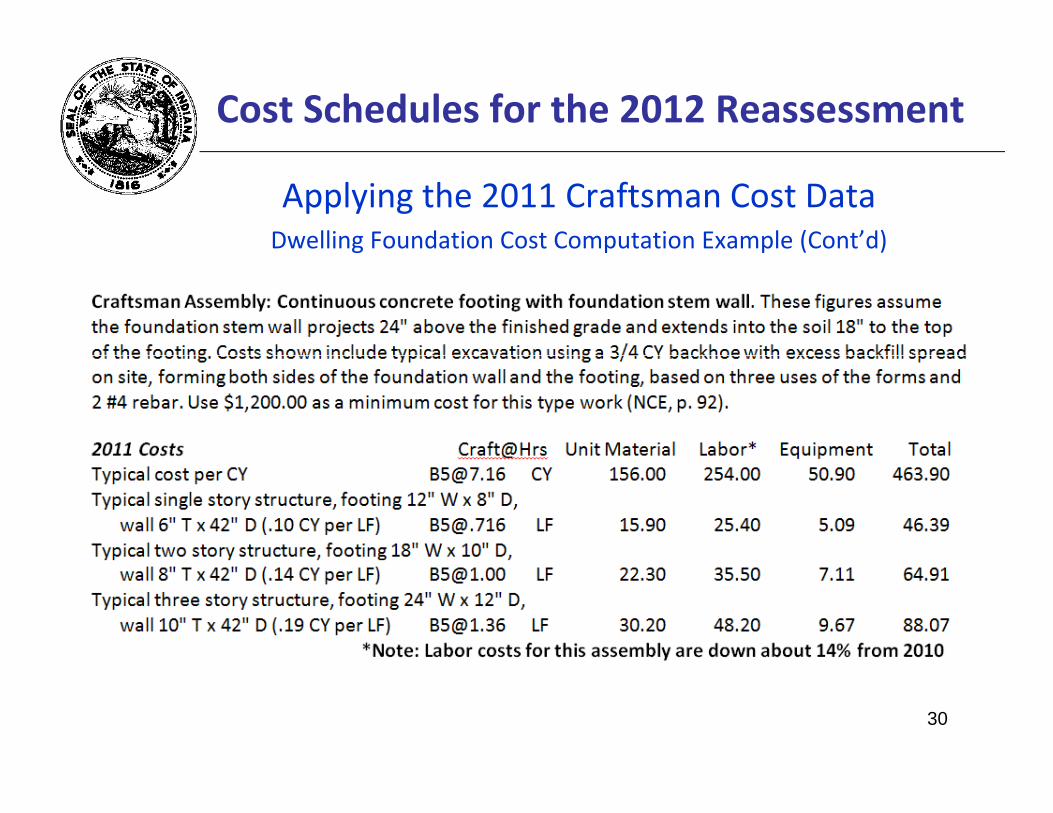
Applying the 2011 Craftsman Cost DataDwelling Foundation Cost Computation Example (Cont’d)g p p
30

Cost Schedules for the 2012 Reassessment
Applying the 2011 Craftsman Cost DataDwelling Foundation Cost Computation Example (Cont’d)g p p
31
Cost Schedules for the 2012 Reassessment
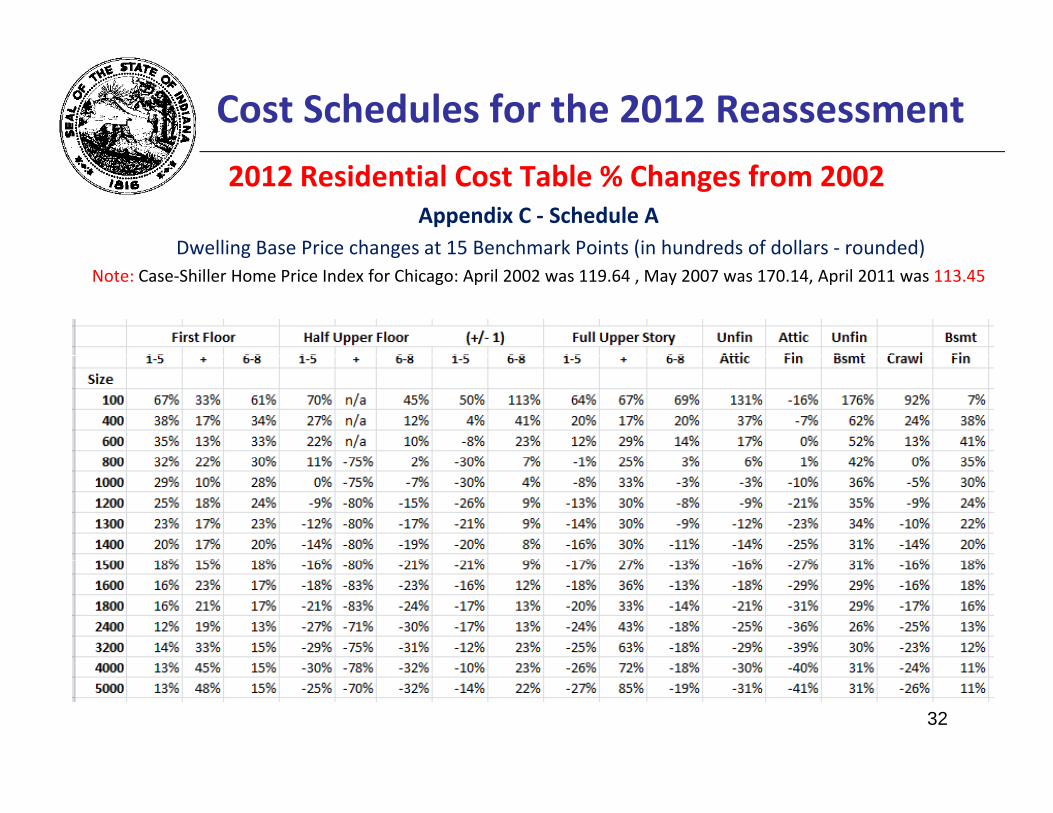
2012 Residential Cost Table % Changes from 2002Appendix C ‐ Schedule A
Dwelling Base Price changes at 15 Benchmark Points (in hundreds of dollars ‐ rounded)Dwelling Base Price changes at 15 Benchmark Points (in hundreds of dollars rounded)Note: Case‐Shiller Home Price Index for Chicago: April 2002 was 119.64 , May 2007 was 170.14, April 2011 was 113.45
32

Cost Schedules for the 2012 Reassessment
2012 Residential Cost Table Test ResultsUsing 28 New Construction Model Homes from Indianapolis Home Builders
Advertised prices of the model homes located on the builders’ websites in March of 2011 were used to compare with the initial cost estimates using Craftsman costs with their Indianapolis local cost modifier – the difference is the VEM.
Also, Craftsman labor rates were found to be high when compared to the Indiana Department of Labor Marion County construction industry labor rates.
33

Cost Schedules for the 2012 Reassessment2009‐2010 Residential Sales ‐ RCN/RCNLD Test Results
Using the new 1012 cost schedules with no neighborhood adjustments
34

Cost Schedules for the 2012 Reassessment
Size Analysis of 10,252 Commercial/Industrial Marion Co 1st Floor sizes.
Note that many GCM & GCI Uses are coded as Wood Joist Type 1 ConstructionNote that many GCM & GCI Uses are coded as Wood Joist Type 1 Construction
Also note the difference between Mean and Median sizes ‐ big size variation
‐ Requires economies of scale adjustments
“One model fits all” for each Use Type creates value estimation challengesOne model fits all for each Use Type creates value estimation challenges
“One GCI shell model fits all” creates challenges: Mill Mfg. vs. Mini‐warehouse
35

Cost Schedules for the 2012 Reassessment
Commercial Cost Model Data PAR/Size Points • Microsoft Excel Solver used to determine model benchmark data:
– found the best dimensions for each PAR – set the object function to minimize perimeter for each PAR and size– set the object function to minimize perimeter for each PAR and size– by allowing Solver to adjust the length and width dimensions – perimeter had to always be greater as size increased
• PAR = 100 x (Perimeter Linear Feet / Floor Area Square Feet)• Example: For a 200 x 200 building, PAR = 100 x 800/40000 = 2
36

Cost Schedules for the 2012 ReassessmentCommercial model assumptions are in Appendix D:
37

Cost Schedules for the 2012 Reassessment
Commercial models example – GCM Basic Shell Components ‐ 1st floor
38

Cost Schedules for the 2012 Reassessment
Commercial models specific for certain items but vague for othersExamples: Flooring is very specific, but partitions and lighting are very general Commercial models to be reviewed and updated over the next year….. Commercial models to be reviewed and updated over the next year
39

Cost Schedules for the 2012 Reassessment
Commercial models example – GCM Bank Use Type Finish ‐ 1st floor
40

Cost Schedules for the 2012 Reassessment
Perimeter-to-Area Ratio (PAR) Summary for C/I Models
41

Cost Schedules for the 2012 Reassessment
Partition Density Assumptions for 2012 and 2002 GRM Models
42
Cost Schedules for the 2012 Reassessment
Accounting for Economies of Scale • When more units of something are produced, it costs less to produce each unit.• Economic efficiencies result from carrying out a process such as building
construction on a larger and larger scale. “Every estimator knows that as quantity built increases, the unit cost decreases … when comparison projects are either much larger or much smaller than thewhen comparison projects are either much larger or much smaller than the proposed project, adjustments need to be made for the economy of scale,” wrote John D. Bledsoe (2002, p. 14), PhD, PE, author of the reference book Successful Estimating Methods . . . from Concept to Bid. • The economies of scale size adjustment incorporated in the 2012 Indiana cost
tables based upon Bledsoe (1992) and those found in Means (2012) tables are nearly identical.
• According to Bledsoe, when building sizes are within 10% of one another, there is little difference for which a size factor cost multiplier is needed; however, when sizes differ significantly (more than 10%) a cost adjustment multiplier is required for accurate estimates.required for accurate estimates.
43

Cost Schedules for the 2012 Reassessment
Factors Contributing to Economies of Scale in ConstructionSome of the inputs that a building contractor controls in a larger construction project that contribute to economies of scale:construction project that contribute to economies of scale:• Lower material costs: When a builder buys materials in bulk for larger
jobs - for example, concrete, plywood, or steel – the builder can take advantage of volume discountsg
• Specialized equipment: As the scale of a construction project increases, a builder can employ the use of specialized labor and equipment resulting in greater efficiency – Example D4 tractor in slab construction
• Learning curve effect: Each new commercial building construction project is unique with a new set of plans and requirements. The learning curve effect refers to the capability of workers to improve their productivity by regularly repeating the same type of action Theproductivity by regularly repeating the same type of action. The increased productivity is achieved through practice, self-perfection and minor innovations resulting in a reduction in the number of work-hours necessary to achieve a specified amount of output
An economies of scale adjustment was applied in producing residential as well as commercial and industrial cost tables 44
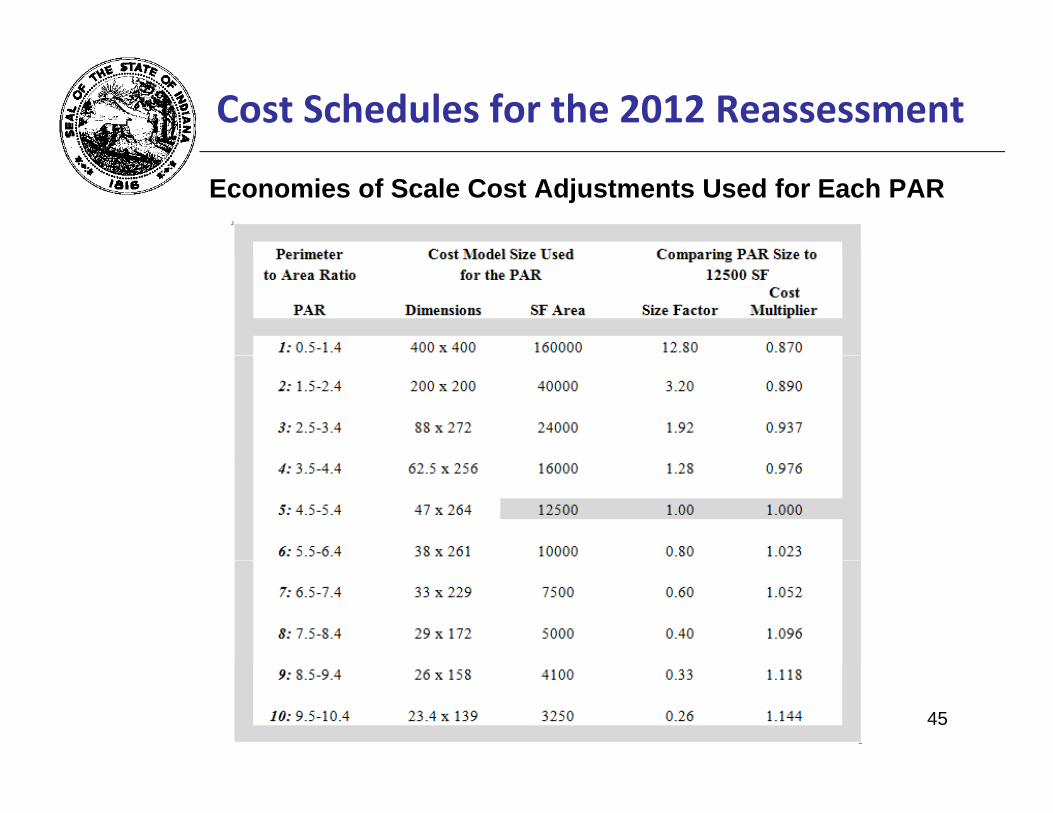
Cost Schedules for the 2012 Reassessment
Economies of Scale Cost Adjustments Used for Each PAR
45

Cost Schedules for the 2012 Reassessment
2012 Commercial/Industrial Cost Table Changes from 2002All First Floor Uses, Economies of Scale Base = 12,500, VEM ‐30%
46

Cost Schedules for the 2012 ReassessmentEconomic Conditions, Labor Rates, and Local Modifiers
• All of the national cost publishers (M&S, RS Means, Craftsman) did poorly in estimating the level of local costs for the Indianapolis area during the recent turbulent real estate market and major recession – they are 21‐40% high
• Also note the difference in CODs from the same basic Craftsman cost data –the Cost Model used with the data is the reason for the differences
47
Cost Schedules for the 2012 Reassessment
Verified Economic Modifier (VEM)• Unit costs published by Craftsman in the 2011 National Cost Estimator (NCE)
id th t t f l b t i l d i t O h d dprovide the cost components of labor, material, and equipment. Overhead and profit are accounted for by adding a 25% markup to the total.
• Craftsman and R.S. Means published costs show the cost component details, b t Marshall & S ift does not Craftsman labor rates ere compared to thebut Marshall & Swift does not. Craftsman labor rates were compared to the construction industry 2010 labor rates gathered by the Indiana Department of Labor for Marion County and found to be much too high for the local market.
• According to the most recent Bureau of Labor Statistics data construction• According to the most recent Bureau of Labor Statistics data, construction industry unemployment in June 2011 was 70% higher than the national unemployment rate. Turbulent real estate prices and a depressed construction industry with high unemployment have made it very difficult for national costindustry with high unemployment have made it very difficult for national cost publishers to estimate the labor component of local construction costs.
• To survive in very difficult times, healthy Indiana construction companies are doing projects with no profit and substantially reducing their overheaddoing projects with no profit and substantially reducing their overhead expenses; less healthy companies are failing.
• Based upon verified local data, the Department is using a VEM of ‐30% 48

Cost Schedules for the 2012 Reassessment
Confirmation of the Selected ‐30% VEM• Residential testing against actual local market prices included the VEM
Testing against new construction market prices from local home builders– Testing against new construction market prices from local home builders• Median ratio of 1.06 with VEM applied
• Coefficient of Dispersion (COD) of 4.75
Testing against 2009 & 2010 verified sales in Johnson & Allen Counties– Testing against 2009 & 2010 verified sales in Johnson & Allen Counties • RCN median ratio of 1.14 with VEM applied for Johnson Co homes built 2001‐2010
• RCN median ratio of 1.09 with VEM applied for Allen Co homes built 2001‐2010
• Commercial testing of GCR apartment costs against residential costs:• Commercial testing of GCR apartment costs against residential costs:
49

Cost Schedules for the 2012 Reassessment
New Cost Models & Schedules• Impact on the 2012 Reassessment
– Costs are now more accurate and current
– With cost schedule up 25%, how much will assessed values change?
– Impact of compliance with 50 IAC 27p p
– Impact on characteristics data & collection• Half story vs. Attic – they are different ‐ important to use base size
• Attached vs Integral Garages – about the same cost resultAttached vs. Integral Garages about the same cost result
• Grades & possible grade creep because of using outdated costs
• Commercial interior partitions and past partition adjustments
• Impact on comp ter soft are• Impact on computer software– Table structure did not change – only table rates changed
– Therefore, there should be no need to change software
– Benchmark size points are highlighted in Appendix C, Schedule A
– Software may interpolate between size points if desired 50

Cost Schedules for the 2012 Reassessment
CONCLUSION• Cost tables for use in the 2012 reassessment that differ from previous
tables in a number of ways:tables in a number of ways:– the underlying property models were updated to reflect current building design– the Department included economies of scale to account for size variations
th D t t b ht th ti l t ti t i li ith th I di l– the Department brought the national cost estimates in line with the Indiana real estate market and construction industry through the application of an empirically-derived Verified Economic Modifier (VEM)
• These updates create a need for assessors to review and potentially revise• These updates create a need for assessors to review and potentially revise market factors, schedule C adjustments, effective age, obsolescence, and any other factor that was used to bring the previous replacement cost new in line with market value‐in‐use
• The resulting cost tables are expected to produce more accurate RCN (replacement cost new) estimates for properties and allow assessors to produce a market value-in-use for a property that requires fewer market p p p y qand property-factor adjustments
51
Cost Schedules for the 2012 Reassessment
Other Information
• Tables were field tested prior to distribution
• Tables were revised based upon assessor and vendor review/feedback
• Delivery schedule of the 2012 cost tables:• Delivery schedule of the 2012 cost tables:– Appendix C: Draft was distributed in early May; Final revised release was July 1, 2011
– Appendix G: Draft was distributed July 1, 2011; Final revised release was August 2011
• Next planned cost table update on or about October 1, 2012 for use withNext planned cost table update on or about October 1, 2012 for use with assessments effective March 1, 2013 for taxes paid in 2014
• Cost table guidance/information was provided in June 2010:– See http://www in gov/dlgf/files/100621 ‐ Wood Memo ‐See http://www.in.gov/dlgf/files/100621_ _Wood_Memo_
_2012_General_Reassessment_Cost_Information.pdf
• QUESTIONS?
52

Contact the Department of Local Government Finance
• Terry Knee
• Telephone: 317‐519‐1809p
• Fax: 317.232.8779
• E‐mail: [email protected]
• Web site: www.in.gov/dlgf
• “Contact Us”: www.in.gov/dlgf/2338.htm
• Wayne Moore
• Telephone: 937.408.7342p
• Fax: 937.390.0936
• E‐mail: [email protected]
• Web site: www.jwaynemoore.net53