2011 wind technologies market report
TRANSCRIPT

Energy Efficiency & Renewable Energy eere.energy.gov
1
Program Name or Ancillary Text eere.energy.gov
WIND AND WATER POWER PROGRAM
1
2011 Wind Technologies Market Report
Ryan Wiser and Mark Bolinger
Lawrence Berkeley National Laboratory
Report Summary
August 2012

WIND AND WATER POWER PROGRAM
2
Presentation Overview • Introduction to current edition of
U.S. wind energy market report
• Wind Energy Market Trends
– Installation trends
– Industry trends
– Cost trends
– Performance trends
– Wind power price trends
– Policy and market drivers
– Future outlook

WIND AND WATER POWER PROGRAM
3
2011 Wind Technologies Market Report Purpose, Scope, and Data:
• With a focus on 2011, summarize trends in the U.S. wind power market, including information on wind installations, industry developments, project costs, O&M costs, performance, power sales prices, policy/market trends
• Scope primarily includes wind turbines over 100 kW in size
• Data sources include AWEA, EIA, FERC, SEC, etc. (see full report)
Report Authors:
• Primary authors: Ryan Wiser and Mark Bolinger, Berkeley Lab
• Contributions from others at Berkeley Lab, Exeter Assoc., NREL
Available at: http://www1.eere.energy.gov/wind/

WIND AND WATER POWER PROGRAM
4
New to the Current Edition of the Report • Summary of trends in the wind resource conditions in which
wind power projects have been sited
• Expanded discussion of how the reporting of power sales prices impacts the apparent pricing of wind, including new data on full-term power purchase agreement pricing
• Shortened discussion of offshore wind energy à companion report funded by the U.S. Department of Energy focused exclusively on offshore wind will be published later this year

WIND AND WATER POWER PROGRAM
5
Key Findings • Wind is a credible source of new generation in the U.S. • Despite the lack of policy clarity, turbine manufacturers and
their suppliers continued to localize production in 2011
• Turbine scaling has boosted wind project capacity factors • Falling wind turbine prices have begun to push installed project
costs lower
• Lower wind turbine prices and installed project costs, along with improved capacity factors, are enabling aggressive wind power pricing
• Looking ahead, projections are for continued strong growth in 2012, followed by a dramatically lower but uncertain 2013

WIND AND WATER POWER PROGRAM
6
Installation Trends

WIND AND WATER POWER PROGRAM
7
• 6.8 GW of wind power added in 2011 in U.S., 31% higher than in 2010 • $14 billion invested in wind power project additions • Cumulative wind power capacity up by 16%, bringing total to 47 GW
Wind Power Additions Increased in 2011, but Remained Below 2008 and 2009 Levels
0
1
2
3
4
5
6
7
8
9
10
1998
1999
2000
2001
2002
2003
2004
2005
2006
2007
2008
2009
2010
2011
0
5
10
15
20
25
30
35
40
45
50
Annual US Capacity (left scale)
Cumulative US Capacity (right scale)
Cum
ulat
ive
Cap
acity
(GW
)
Ann
ual C
apac
ity (G
W)

WIND AND WATER POWER PROGRAM
8
Wind Power Comprised 32% of Electric Generating Capacity Additions in 2011
• Wind power in 2011 was again the 2nd-largest resource added (after gas, and for the 6th time in the past seven years)
0%
10%
20%
30%
40%
50%
0
20
40
60
80
100
2000 2001 2002 2003 2004 2005 2006 2007 2008 2009 2010 2011
Tota
l Ann
ual
Cap
acity
Add
ition
s (G
W)
Wind Gas CoalOther Renewable Other Non-Renewable Wind (% of Total)
Wind Capacity Add
ition
s(%
of Total Ann
ual Capacity Add
ition
s)

WIND AND WATER POWER PROGRAM
9
China Was 1st and the U.S. Was 2nd in Both New and Cumulative Wind Power Capacity
• Global wind power capacity additions in 2011 up 6% from 2010 level • U.S. additions = 16% of global additions in 2011, up from 13% in 2010
but down from 26-30% from 2007 through 2009
Annual Capacity (2011, MW)
Cumulative Capacity (end of 2011, MW)
China 17,631 China 62,412 U.S. 6,816 U.S. 46,916 India 3,300 Germany 29,248 Germany 2,007 Spain 21,350 U.K. 1,293 India 16,266 Canada 1,267 U.K. 7,155 Spain 1,050 France 6,836 Italy 950 Italy 6,733 France 875 Canada 5,278 Sweden 763 Portugal 4,214 Rest of World 5,766 Rest of World 34,453 TOTAL 41,718 TOTAL 240,861 Source: BTM Consult; AWEA project database for U.S. capacity

WIND AND WATER POWER PROGRAM
0%2%
4%6%8%
10%
12%14%16%18%
20%22%24%26%
28%30%
Den
mar
k
Portu
gal
Spai
n
Irela
nd
Ger
man
y
Gre
ece
UK
Swed
en
Net
herla
nds
Italy
Indi
a
Pola
nd
U.S
.
Fran
ce
Chi
na
Turk
ey
Aust
ralia
Can
ada
Braz
il
Japa
n
TOTA
L
Approximate Wind Penetration, end of 2011
Approximate Wind Penetration, end of 2010
Approximate Wind Penetration, end of 2009
Approximate Wind Penetration, end of 2008
Approximate Wind Penetration, end of 2007
Approximate Wind Penetration, end of 2006
Estim
ated
Win
d G
ener
atio
n as
aPr
opor
tion
of E
lect
ricity
Con
sum
ptio
n
10
U.S. Lagging Other Countries in Wind As a Percentage of Electricity Consumption
Note: Figure only includes the 20 countries with the most installed wind power capacity at the end of 2011
WIND AND WATER POWER PROGRAM
11
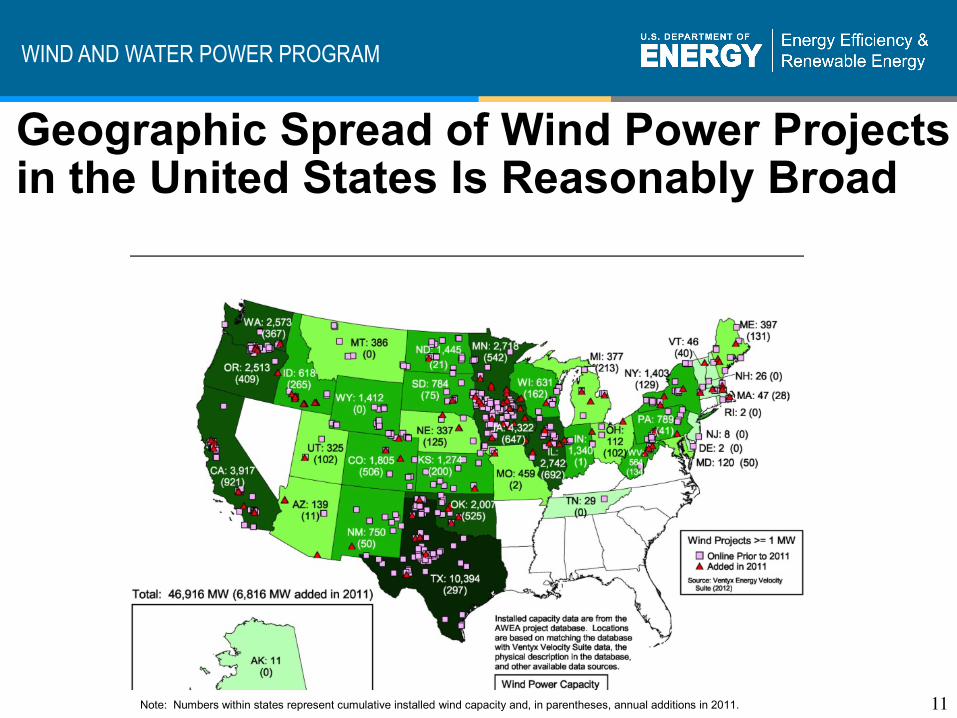
Geographic Spread of Wind Power Projects in the United States Is Reasonably Broad
Note: Numbers within states represent cumulative installed wind capacity and, in parentheses, annual additions in 2011.

WIND AND WATER POWER PROGRAM
12
California Added the Most Wind Capacity in 2011; Six States Exceed 10% Wind Energy
At end of 2011: • Texas continued to
lead in cumulative capacity, by a large margin
• 20 states had >500 MW of capacity (8 had >2000 MW)
• 2 states had the ability to provide >20% of total in-state generation from wind (6 states >10%, 14 states >5%)
Capacity (MW) Percentage of In-State Generation Annual (2011) Cumulative (end of 2011) Actual (2011)* Estimated (end of 2011)**
California 921 Texas 10,394 South Dakota 22.3% South Dakota 22.1% Illinois 692 Iowa 4,322 Iowa 18.8% Iowa 20.0% Iowa 647 California 3,917 North Dakota 14.7% Minnesota 14.9% Minnesota 542 Illinois 2,742 Minnesota 12.7% North Dakota 14.1% Oklahoma 525 Minnesota 2,718 Wyoming 10.1% Colorado 10.7% Colorado 506 Washington 2,573 Colorado 9.2% Oregon 10.5% Oregon 409 Oregon 2,513 Kansas 8.2% Idaho 9.7% Washington 367 Oklahoma 2,007 Idaho 8.2% Kansas 9.2% Texas 297 Colorado 1,805 Oregon 8.2% Oklahoma 9.1% Idaho 265 North Dakota 1,445 Oklahoma 7.1% Wyoming 8.8% Michigan 213 Wyoming 1,412 Texas 6.9% Texas 7.3% Kansas 200 New York 1,403 New Mexico 5.4% Maine 6.5% Wisconsin 162 Indiana 1,340 Washington 5.3% New Mexico 5.8% West Virginia 134 Kansas 1,274 Maine 4.5% Washington 5.5% Maine 131 Pennsylvania 789 Montana 4.2% California 4.7% New York 129 South Dakota 784 California 4.0% Montana 3.8% Nebraska 125 New Mexico 750 Illinois 3.1% Illinois 3.7% Utah 102 Wisconsin 631 Hawaii 3.1% Hawaii 3.7% Ohio 102 Idaho 618 Nebraska 2.9% Indiana 3.0% South Dakota 75 West Virginia 564 Indiana 2.7% Nebraska 2.9% Rest of U.S. 274 Rest of U.S. 2,915 Rest of U.S. 0.4% Rest of U.S. 0.5% TOTAL 6,816 TOTAL 46,916 TOTAL 2.9% TOTAL 3.2%
* Based on 2011 wind and total generation by state from EIA’s Electric Power Monthly. ** Based on a projection of wind electricity generation from end-of-2011 wind power capacity, divided by total in-state electricity generation in 2011. Source: AWEA project database, EIA, Berkeley Lab estimates

WIND AND WATER POWER PROGRAM
13
No Offshore Turbines Commissioned in the U.S., But 10 Projects Totaling 3.8 GW Are Somewhat More Advanced in Development
• Two projects have power purchase agreements (PPAs):
• Cape Wind (MA)
• Deepwater (RI)
• Nation’s first offshore wind power PPA cancelled in 2011: NRG Bluewater (DE)

WIND AND WATER POWER PROGRAM
0
50
100
150
200
250
Wind Natural Gas Solar Nuclear Coal Other
Nam
epla
te C
apac
ity (G
W)
Entered queue in 2011 Total in queue at end of 2011
14
Roughly 220 GW of Wind Power Capacity in Transmission Interconnection Queues
Not all of this capacity will be built….
1.5 times as much wind power as next-largest resource (natural gas) in sampled 41 queues
But… absolute amount of wind (and coal) in sampled queues has declined in recent years whereas natural gas and solar capacity has increased

WIND AND WATER POWER PROGRAM
15
96% Planned for Midwest, PJM, Texas, Mountain, Northwest, Southwest Power Pool, and California
Not all of this capacity will be built….
0
5
10
15
20
25
30
35
40
45
50
MISO /Midwest
PJM ERCOT Mountain Northwest SPP CaliforniaISO
New YorkISO
ISO-NewEngland
Southeast
Nam
epla
te W
ind
Pow
er C
apac
ity (G
W)
Entered queue in 2011 Total in queue at end of 2011

WIND AND WATER POWER PROGRAM
16
Industry Trends

WIND AND WATER POWER PROGRAM
17
Despite Ongoing Proliferation of New Entrants, “Big 3” Turbine Suppliers Gained Market Share
• Increase in number of turbine vendors serving market since 2005, but top three (in aggregate) have gained market share since 2008-09
• 2011 installations by Chinese and South Korean manufacturers included: Sany Electric, Samsung, Goldwind, Hyundai, Sinovel, and Unison
0%
10%
20%
30%
40%
50%
60%
70%
80%
90%
100%
2005 2006 2007 2008 2009 2010 2011
Other
Acciona
Gamesa
REpower
Clipper
Nordex
Mitsubishi
Suzlon
Siemens
Vestas
GE Wind
Turb
ine
Man
ufac
ture
r U.S
. Mar
ket S
hare

WIND AND WATER POWER PROGRAM
18
U.S. Wind Manufacturing Has Increased, but Supply Chain Is Under Severe Pressure
Note: map is not intended to be exhaustive
• Larger number of new manufacturing facilities opened in 2011 than in 2010
• 8 of 10 turbine OEMs with largest share of U.S. market in 2011 had one or more manufacturing facilities in the U.S. in 2011; only one major OEM had U.S. manufacturing in 2004

WIND AND WATER POWER PROGRAM
19
Substantial Over-Capacity of U.S. Nacelle Assembly Capability in 2011, with Even Greater Over-Capacity Possible After 2012
Source: Bloomberg New Energy Finance
0
2
4
6
8
10
12
14
2006 2007 2008 2009 2010 2011 2012e 2013e 2014e
Win
d Tu
rbin
e N
acel
le A
ssem
bly C
apac
ity in
the
U.S
. (an
d W
ind
Turb
ine
Inst
alla
tions
) (G
W)
Other
Nordex
Gamesa
Siemens
Vestas
GE
U.S. Turbine Installations
• Substantial growth in wind capacity additions in 2012, but weakened prospects after 2012
• 75,000 full time workers employed directly or indirectly in wind industry…but layoffs have begun, and more are likely
• Downward pressure on turbine and component pricing à lower profit margins & weakened financial results

WIND AND WATER POWER PROGRAM
20
Estimated U.S. Imports of Wind-Related Equipment Increased Somewhat in 2011 Relative to 2010; Exports Held Steady
0
1
2
3
4
5
6
7
20052375 MW
20062454 MW
20075249 MW
20088361 MW
200910000 MW
20105214 MW
20116816 MW
Bill
ion
US
$201
1
Other Wind Turbine ComponentsTowersWind-Powered Generating Sets
Estimated US Imports:Exports of Wind-Powered Generating Sets

WIND AND WATER POWER PROGRAM
21
Source Markets for Imports Have Varied Over Time, and By Type of Wind Equipment
0%
20%
40%
60%
80%
100%
2005 2006 2007 2008 2009 2010 2011
Other
Wind-‐Powered Generating Sets
Asia
Europe
Europe
Asia
44%
18%
14%
5%
9%
8%
3%
Towers -‐ 2011China
Vietnam
Korea
Other Asia
Canada
Mexico
All Europe
1.5 pt
• U.S. imports of wind-powered generating sets largely come from Europe, whereas U.S. imports of towers largely come from Asia

WIND AND WATER POWER PROGRAM
0
2
4
6
8
10
12
14
2005-2006 2007-2008 2009-2010 2011
Impo
rts a
s Fr
actio
n of
Tur
bine
Cos
t
Billi
on U
S$2
011
Average Annual Turbine Equipment Cost (Calendar Year)Value of Selected Imports (Customs value, 4 month lag, Sept - Aug)Estimated Import Fraction
50%
40%
0%
30%
60%
70%
10%
20%
22
A Growing % of Equipment Used in U.S. Projects Has Been Sourced Domestically
• Domestic content has increased from 35% in 2005-06 to 67% in 2011
See full report for the many assumptions used to generate the data in this figure

WIND AND WATER POWER PROGRAM
23
Average Turbine Size Increased in 2011
• 42% of turbines installed in 2011 were > 2.0 MW, up from 28% in 2010, 24% in 2009, 20% in 2008, 16% in 2006 & 2007, and just 0.1% in previous years
0.72 MW0.89 MW
1.23 MW
1.46 MW1.60 MW 1.65 MW 1.67 MW 1.74 MW 1.80 MW
1.97 MW
0.00
0.25
0.50
0.75
1.00
1.25
1.50
1.75
2.00
2.25
1998-99 2000-01 2002-03 2004-05 2006 2007 2008 2009 2010 2011
1,431 1,974 1,687 1,900 1,530 3,190 5,014 5,736 2,902 3,464
1,029 1,751 2,080 2,769 2,453 5,249 8,360 9,997 5,210 6,816
COD:
Turbines:
MW:
Ave
rage
Tur
bine
Siz
e (M
W)

WIND AND WATER POWER PROGRAM
24
Average Hub Heights and Rotor Diameters Have Increased Over Time
• On average, since 1998-99, hub heights are 25 meters (45%) higher and rotor diameters are 41 meters (86%) larger
0
10
20
30
40
50
60
70
80
90
1998-991,4031,001
2000-011,9741,751
2002-031,6832,074
2004-051,9182,734
20061,4772,402
20073,1905,249
20085,0048,349
20095,7339,993
20102,9015,208
20113,4646,816
Rotor Diameter
Hub Height
COD:Turbines:
MW:
Ave
rage
Rot
or D
iam
eter
and
Hub
Hei
ght (
m)

WIND AND WATER POWER PROGRAM
25
Project Finance Was a Mixed Bag in 2011 • Weakened debt market
– Greek/European debt crisis drove retrenchment – New banking regulations lead to shorter bank loan tenors, though
institutional lenders continued to offer longer-term products – 4,000 MW of new wind raised $5.9 billion in debt, down 30% from 2010 – Bank loan pricing ratcheted up a bit, but interest rates starting below 6%
still achievable
• Tax equity market improved somewhat – $3.5 billion in tax equity committed to wind in 2011, similar to 2010 – 19 tax equity deals in 2011, with 22 active investors – Pricing stable and new/returning investors entered the market – Attrition of investors possible with loss of 1603 Treasury Grant program

WIND AND WATER POWER PROGRAM
26
Utility Project Ownership Increased in 2011, but IPP Ownership Remained Dominant
0%
10%
20%
30%
40%
50%
60%
70%
80%
90%
100%
1998 1999 2000 2001 2002 2003 2004 2005 2006 2007 2008 2009 2010 20110%
10%
20%
30%
40%
50%
60%
70%
80%
90%
100%
Other
Publicly Owned Utility (POU)
Investor-Owned Utility (IOU)
Independent Power Producer (IPP)
% o
f Cum
ulat
ive
Inst
alle
d C
apac
ity
Other:155 MW (2%)
IPP: 4,965 MW (73%)
IOU:1,492 MW
(22%)
POU:204 MW (3%)
2011 Capacity byOwner Type
Utility ownership jumped to 25% in 2011 (up from 15% in 2009 and 2010) on the back of nearly 600 MW of new capacity built/owned by MidAmerican

WIND AND WATER POWER PROGRAM
27
Electric Utilities Are Still the Dominant Off-Takers of Wind Power
• Scarcity of power purchase agreements drove continued merchant development, though at somewhat lower levels than in recent years
0%
10%
20%
30%
40%
50%
60%
70%
80%
90%
100%
1998 1999 2000 2001 2002 2003 2004 2005 2006 2007 2008 2009 2010 20110%
10%
20%
30%
40%
50%
60%
70%
80%
90%
100%
On-Site
Merchant/Quasi-Merchant
Power Marketer
POU
IOU
% o
f Cum
ulat
ive
Inst
alle
d C
apac
ity
Merchant:1,434 MW
(21%)
IOU:4,302 MW
(63%)
POU:899 MW
(13%)
2011 Capacity byOff-Take Category
Marketer:147 MW (2%)
On-Site:35 MW (0.5%)

WIND AND WATER POWER PROGRAM
28
Cost Trends

WIND AND WATER POWER PROGRAM
0200400600800
1,0001,2001,4001,6001,8002,0002,200
Jan-
97
Jan-
98
Jan-
99
Jan-
00
Jan-
01
Jan-
02
Jan-
03
Jan-
04
Jan-
05
Jan-
06
Jan-
07
Jan-
08
Jan-
09
Jan-
10
Jan-
11
Jan-
12
Announcement Date
Orders <5 MWOrders from 5 - 100 MWOrders >100 MW
Turb
ine
Tran
sact
ion
Pric
e (2
011$
/kW
)
Recentreportedturbineprice
quotes
29
Wind Turbine Prices Continued to Decline in 2011, After Rising from 2002-2008
• Recent turbine price quotes reportedly in the range of $900-1,270/kW, with more-favorable terms for buyers and improved technology
Figure depicts reported transaction prices from 96 U.S. wind turbine orders totaling 26.6 GW

WIND AND WATER POWER PROGRAM
30
Though Slow to Reflect Declining Wind Turbine Prices, Reported Installed Project Costs Finally Turned the Corner in 2011
Note: 2012 sample of 20 projects totaling ~2.6 GW is preliminary, but suggests lower costs for 2012 projects
0
500
1,000
1,500
2,000
2,500
3,000
3,500
4,000
4,500
5,000
1982
1983
1984
1985
1986
1987
1988
1989
1990
1991
1992
1993
1994
1995
1996
1997
1998
1999
2000
2001
2002
2003
2004
2005
2006
2007
2008
2009
2010
2011
2012
Inst
alle
d Pr
ojec
t Cos
t (20
11 $
/kW
) Individual Project Cost (584 projects totaling 42,614 MW) Capacity-Weighted Average Project Cost

WIND AND WATER POWER PROGRAM
31
Economies of Scale Evident At Least At Low End of Project Size Range
0
500
1,000
1,500
2,000
2,500
3,000
3,500
4,000
4,500
5,000
≤5 MW 5-20 MW 20-50 MW 50-100 MW 100-200 MW >200 MW
100 MW 430 MW 1,404 MW 4,372 MW 9,605 MW 5,284 MW
52 projects 34 projects 39 projects 56 projects 72 projects 22 projects
Inst
alle
d P
roje
ct C
ost (
2011
$/k
W) Capacity-Weighted Average Project Cost
Individual Project Cost
Sample includes projects built from 2009-2011

WIND AND WATER POWER PROGRAM
32
Economies of Scale Also Evident (Though Somewhat Less So) By Turbine Size
• Theory: A project may be built less-expensively using fewer larger turbines instead of a larger number of smaller turbines
0
500
1,000
1,500
2,000
2,500
3,000
3,500
4,000
4,500
5,000
>0.1 & <1 MW ≥1 & <1.75 MW ≥1.75 & <2.5 MW ≥2.5 & <3.25 MW
20 MW 9,448 MW 9,637 MW 2,090 MW
15 projects 142 projects 92 projects 26 projects
Inst
alle
d P
roje
ct C
ost (
2011
$/k
W)
Capacity-Weighted Average Project Cost
Individual Project Cost
Sample includes projects built from 2009-2011

WIND AND WATER POWER PROGRAM
33
Some Regional Differences in Wind Power Project Costs Are Apparent
• Different permitting/development costs may play a role at both ends of spectrum: it’s easier to build in TX and the Heartland and more difficult in New England and CA (see slide 42 for regional definitions)
0
500
1,000
1,500
2,000
2,500
3,000
3,500
4,000
4,500
5,000
Texas Heartland Great Lakes Mountain Northwest East California New England
30 projects 81 projects 34 projects 20 projects 48 projects 20 projects 19 projects 23 projects
3,256 MW 5,902 MW 3,328 MW 2,091 MW 3,308 MW 1,383 MW 1,502 MW 423 MW
Inst
alle
d Pr
ojec
t Cos
t (20
11 $
/kW
)
Capacity-Weighted Average Project Cost Individual Project Cost Capacity-Weighted Average Cost, Total U.S.
Sample includes projects built from 2009-2011

WIND AND WATER POWER PROGRAM
34
Newer Projects Appear to Show Improvements in Operations and Maintenance Costs
Capacity-weighted average 2000-11 O&M costs for projects built in the 1980s equal $33/MWh, dropping to $23/MWh for projects built in 1990s, and to $10/MWh for projects built since 2000 Note: Sample is limited, and consists of 133 wind power projects totaling 7,965 MW; few projects in sample have complete records of O&M costs from 2000-11; O&M costs reported here DO NOT include all operating costs
0
10
20
30
40
50
60
70
1982
1983
1984
1985
1986
1987
1988
1989
1990
1991
1992
1993
1994
1995
1996
1997
1998
1999
2000
2001
2002
2003
2004
2005
2006
2007
2008
2009
2010
Commercial Operation Date
Projects with no 2011 O&M dataProjects with 2011 O&M dataPolynomial Trend Line (all projects)
Ave
rage
Ann
ual O
&M
Cos
t 200
0-20
11
(201
1 $/
MW
h)

WIND AND WATER POWER PROGRAM
35
O&M Costs Appear to Increase with Project Age, and Decrease for More Recently Installed Projects
Note: Sample size is extremely limited
0
5
10
15
20
25
30
1 2 3 4 5 6 7 8 9 10
Project Age (Number of Years Since Commercial Operation Date)
1998-20042005-2010
Commercial Operation Date:
n=18
Med
ian
Ann
ual O
&M
Cos
t(2
011
$/M
Wh)
n=36
n=20
n=8
n=5
n=3
n=3
n=31
n=34
n=23
n=25
n=11
n=6
n=3
n=3
n=2
O&M reported in figure does not include all operating costs: Statements from public companies with large U.S. wind asset bases report total operating costs in 2011 for projects built in the 2000s of ~$22/MWh

WIND AND WATER POWER PROGRAM
36
Performance Trends

WIND AND WATER POWER PROGRAM
37
Average Capacity Factors Have Improved Over Time, But Leveled Off in Recent Years
• General improvement reflects increase in hub height and rotor diameter • Drop in 2009 and 2010, and rebound in 2011, driven in part by: (1) inter-
annual wind resource variation, and (2) wind power curtailment
0%
5%
10%
15%
20%
25%
30%
35%
1999 2000 2001 2002 2003 2004 2005 2006 2007 2008 2009 2010 2011
5 12 41 84 97 119 143 168 210 254 354 466 397
544 1,000 1,531 3,271 3,811 5,211 5,880 8,712 10,695 15,670 24,368 34,213 37,606
Capa
city
Fac
tor
Based on Estimated Generation (if no curtailment in subset of regions)
Based on Actual Generation (with curtailment)
4-Year Moving Average (based on estimated generation)
Year:
Projects:
MW:

WIND AND WATER POWER PROGRAM
38
Curtailment a Growing Issue in Some Areas
Assuming a 33% capacity factor, the total amount of wind generation curtailed in 2011 within just the six territories shown above equates to the annual output of roughly 1,220 MW of wind power capacity
2007 2008 2009 2010 2011 Electric Reliability Council of Texas (ERCOT)
109 (1.2%)
1,417 (8.4%)
3,872 (17.1%)
2,067 (7.7%)
2,622 (8.5%)
Southwestern Public Service Company (SPS) N/A 0
(0.0%) 0
(0.0%) 0.9
(0.0%) 0.5
(0.0%) Public Service Company of Colorado (PSCo) N/A 2.5
(0.1%) 19.0
(0.6%) 81.5
(2.2%) 63.9
(1.4%) Northern States Power Company (NSP) N/A 25.4
(0.8%) 42.4
(1.2%) 42.6
(1.2%) 54.4
(1.2%) Midwest Independent System Operator (MISO), less NSP N/A N/A 250
(2.2%) 781
(4.4%) 657
(3.0%) Bonneville Power Administration (BPA) N/A N/A N/A 4.6*
(0.1%) 128.7* (1.4%)
Total Across These Six Areas: 109 (1.2%)
1,445 (5.6%)
4,183 (9.6%)
2,978 (4.8%)
3,526 (4.8%)
*A portion of BPA’s curtailment is estimated assuming that each curtailment event lasts for half of the maximum possible hour for each event. Source: ERCOT, Xcel Energy, MISO, BPA
Estimated Wind Curtailment (GWh and % of potential wind generation)

WIND AND WATER POWER PROGRAM
39
Binning by Project Vintage and Focusing on 2011 Performance Tells A Similar Story
• Projects installed since 2005 have bucked the trend of generally increasing capacity factors among more-recently built projects
0%
10%
20%
30%
40%
50%
60%
Pre-1998 1998-99 2000-01 2002-03 2004-05 2006 2007 2008 2009 2010
5 projects 24 projects 25 projects 38 projects 29 projects 22 projects 36 projects 72 projects 96 projects 50 projects
475 MW 777 MW 1,617 MW 2,061 MW 3,578 MW 1,755 MW 5,071 MW 8,008 MW 9,276 MW 4,989 MW
Capacity-Weighted Average (by project vintage) Individual Project (by project vintage)
2011
Cap
acity
Fac
tor (
by p
roje
ct v
inta
ge)
Sample includes 397 projects totaling 37.6 GW

WIND AND WATER POWER PROGRAM
40
Turbine Scaling Should Boost Performance, but Is Offset By Declining Resource Quality
• Both hub height and swept rotor area relative to turbine capacity were relatively stable from 2006-2009
• Rotor scaling since 2009 is expected to boost performance in future years
• Projects increasingly sited in lower wind speed areas, particularly since 2008: 2011 projects were (on avg.) located in estimated 80-meter resource conditions that are 16.1% worse than projects built in 1998-99 à likely a result of improvements in low wind speed technology, transmission/siting limitations, and policy influences
75
80
85
90
95
100
1998-99 2000-01 2002-03 2004-05 2006 2007 2008 2009 2010 20112.2
2.3
2.4
2.5
2.6
2.7
2.8
2.9
3.0
3.1
3.2
Average 80m Wind Resource Quality Among Built Projects (left scale)
Swept Area divided by Nameplate Capacity (right scale)
Inde
x of
Win
d R
esou
rce
Qua
lity a
t 80m
(199
8-99
=100
)
Inve
rse
of S
peci
fic P
ower
(m^2
/ kW
)

WIND AND WATER POWER PROGRAM
41
Regional Performance Differences Are Apparent
0%
10%
20%
30%
40%
50%
60%
East New England California Great Lakes Northwest Texas Mountain Heartland
26 projects 10 projects 14 projects 29 projects 51 projects 48 projects 29 projects 98 projects
2,282 MW 291 MW 1,127 MW 3,898 MW 4,445 MW 8,256 MW 3,026 MW 9,468 MW
Capacity-Weighted Average (by region) Individual Project (by region) Capacity-Weighted Average (total U.S.)
2011
Cap
acity
Fac
tor
Sample includes 305 projects built from 2004-2010 and totaling 32.8 GW
Average capacity factors highest in the Heartland and Mountain regions, lowest in the East and New England

WIND AND WATER POWER PROGRAM
42
Performance Differences Are Roughly Consistent with the Relative Quality of the Wind Resource in Each Region
Average wind speed at 80 meters
Northwest
Mountain
Texas
Heartland
GreatLakes
California
Southeast
East
NewEngland
Average wind speed at 80 meters
Northwest
Mountain
Texas
Heartland
GreatLakes
California
Southeast
East
NewEngland

WIND AND WATER POWER PROGRAM
43
Wind Power Price Trends

WIND AND WATER POWER PROGRAM
44
Sample of Wind Power Prices • Berkeley Lab collects data on historical wind power sales
prices
• Sample includes 271 projects built from 1998-2011, totaling 20,189 MW (44% of all wind capacity added in that period)
• Prices reflect the historical bundled price of electricity and RECs as sold by the project owner under a power purchase agreement – Dataset excludes merchant plants and projects that sell renewable
energy certificates (RECs) separately – Prices reflect receipt of state and federal incentives (e.g., the PTC or
Treasury grant), as well as various local policy and market influences; as a result, prices do not reflect wind energy generation costs

WIND AND WATER POWER PROGRAM
45
Cumulative, Sample-Wide Wind Power Prices Continued to Move Higher in 2011
General trend of falling and then rising prices consistent with the project cost trends shown earlier, but cumulative nature of figure results in a smoother, less-responsive curve that lags the directional changes in cost trends
0
10
20
30
40
50
60
70
1999 2000 2001 2002 2003 2004 2005 2006 2007 2008 2009 2010 2011
11 12 22 33 47 64 80 97 120 150 184 233 271
588 600 741 1,444 2,294 3,103 4,056 4,987 7,980 10,535 13,701 17,190 20,189
Cumulative Capacity-Weighted Average Wind Power Price (with 25% and 75% quartiles)
Win
d P
ower
Pric
e (2
011
$/M
Wh)
Year:
Projects:
MW:
Sample includes projects built from 1998-2011

WIND AND WATER POWER PROGRAM
46
Binning Wind Power Sales Prices by Project Vintage Also Fails to Show a Price Reversal
Graphic shows prices in 2011 from projects built from 1998-2011
0
20
40
60
80
100
120
1998-99 2000-01 2002-03 2004-05 2006 2007 2008 2009 2010 2011
14 projects 21 projects 33 projects 21 projects 14 projects 24 projects 31 projects 53 projects 27 projects 33 projects
650 MW 854 MW 1,648 MW 1,269 MW 742 MW 3,190 MW 2,669 MW 3,987 MW 2,386 MW 2,793 MW
Capacity-Weighted Average (by project vintage)
Individual Project (by project vintage)
2011
Win
d Po
wer
Pric
e (2
011
$/M
Wh)

WIND AND WATER POWER PROGRAM
47
Binning Wind Power Sales Prices by PPA Execution Date Shows Steeply Falling Prices
• In previous slide, substantial lag between PPA execution and project completion masked the recent reduction in prices that becomes apparent when projects are binned by PPA execution date
0
20
40
60
80
100
120
1998-99 2000-01 2002-03 2004-05 2006 2007 2008 2009 2010 2011
10 projects 13 projects 21 projects 24 projects 25 projects 12 projects 33 projects 41 projects 23 projects 2 projects
577 MW 939 MW 1,583 MW 2,402 MW 2,451 MW 1,638 MW 3,483 MW 4,320 MW 2,184 MW 150 MW
Capacity-Weighted Average (by PPA vintage) Individual Projects (by PPA vintage) Individual Projects Built in 2011 (by PPA vintage)
2011
Wind
Pow
er P
rice
(201
1 $/
MW
h)

WIND AND WATER POWER PROGRAM
48
Focusing on a Smaller Sample of Full-Term PPAs Demonstrates that Levelized Wind Prices Declined in 2011 and Vary by Region
$0
$20
$40
$60
$80
$100
$120
Jan-
96
Jan-
97
Jan-
98
Jan-
99
Jan-
00
Jan-
01
Jan-
02
Jan-
03
Jan-
04
Jan-
05
Jan-
06
Jan-
07
Jan-
08
Jan-
09
Jan-
10
Jan-
11
Jan-
12
PPA Execution Date
California (2,127 MW, 19 contracts) Rest of US (4,033 MW, 66 contracts) Wind Belt (10,882 MW, 131 contracts)
Leve
lized
PPA
Pric
e (2
011
$/M
Wh)
Full-term (rather than historical) data allow for a calculation of levelized prices over the entire PPA duration
Among the sample of PPAs signed in 2011, the capacity-weighted average levelized price is $35/MWh, down from $59/MWh for PPAs signed in 2010 and $72/MWh for PPAs signed in 2009

WIND AND WATER POWER PROGRAM
49
Wind Pricing Varies Widely By Region
Though sample size is problematic in several regions, Texas, the Heartland and the Mountain regions appear to be among the lowest price areas, on average, while California is by far the highest price region
0
20
40
60
80
100
120
Texas Heartland Mountain New England Great Lakes East Northwest California
1 project 23 projects 6 projects 3 projects 5 projects 5 projects 7 projects 10 projects
78 MW 1,395 MW 868 MW 113 MW 600 MW 314 MW 724 MW 1,088 MW
Capacity-Weighted Average (by region) Individual Project (by region) Capacity-Weighted Average (total U.S.)
2011
Win
d P
ower
Pric
e (2
011
$/M
Wh)
Sample includes projects built in 2010 and 2011

WIND AND WATER POWER PROGRAM
50
Low Wholesale Electricity Prices Continued to Challenge the Relative Economics of Wind Power
• Wholesale price range reflects flat block of power across 23 pricing nodes across the U.S. • Recent wholesale prices reflect low natural gas prices, driven by weak economy and shale gas • Price comparison shown here is far from perfect – see full report for caveats
0
10
20
30
40
50
60
70
80
90
2003 2004 2005 2006 2007 2008 2009 2010 2011
47 projects 64 projects 80 projects 97 projects 120 projects 150 projects 184 projects 233 projects 271 projects
2,294 MW 3,103 MW 4,056 MW 4,987 MW 7,980 MW 10,535 MW 13,701 MW 17,190 MW 20,189 MW
2011
$/M
Wh
Nationwide Wholesale Power Price Range (for a flat block of power)
Cumulative Capacity-Weighted Average Wind Power Price (with 25% and 75% quartiles)
Wind project sample includes projects built from 1998-2011

WIND AND WATER POWER PROGRAM
51
Gap Between Wholesale Prices and Wind Power Prices Crossed All Regions in 2011
But… many PPAs signed in 2011 (shown earlier, many at $30-40/MWh) are competitive at 2011 wholesale prices
Notes: Within a region there are a range of wholesale prices because multiple price hubs exist in each area; price comparison shown here is far from perfect – see full report for caveats
0
20
40
60
80
100
120
Texas Heartland Mountain New England Great Lakes East Northwest California Total US
1 project 23 projects 6 projects 3 projects 5 projects 5 projects 7 projects 10 projects 60 projects
78 MW 1,395 MW 868 MW 113 MW 600 MW 314 MW 724 MW 1,088 MW 5,180 MW
Average 2011 Wholesale Power Price Range 2011 Capacity-Weighted Average Wind Power Price Individual Project 2011 Wind Power Price
Wind project sample includes projects built in 2010 and 2011
2011
$/M
Wh

WIND AND WATER POWER PROGRAM
52
Renewable Energy Certificate (REC) Prices Rise in Northeast, Remain Depressed Elsewhere
REC prices vary by: market type (compliance vs. voluntary); geographic region; specific design of state RPS policies
$0
$10
$20
$30
$40
Jan-
05
Jul-0
5
Jan-
06
Jul-0
6
Jan-
07
Jul-0
7
Jan-
08
Jul-0
8
Jan-
09
Jul-0
9
Jan-
10
Jul-1
0
Jan-
11
Jul-1
1
Jan-
12
Low-Price REC Markets
DC Tier 1 DE Class IIL Wind MD Tier 1NJ Class I OH Out-of -StatePA Tier 1 TXVoluntary Wind (National) Voluntary Wind (West)
$0
$20
$40
$60
$80
Jan-
05
Jul-0
5
Jan-
06
Jul-0
6
Jan-
07
Jul-0
7
Jan-
08
Jul-0
8
Jan-
09
Jul-0
9
Jan-
10
Jul-1
0
Jan-
11
Jul-1
1
Jan-
12
High-Price REC Markets
CT Class I MA Class I ME NewNH Class I RI New OH In-State
2011
$/M
Wh

WIND AND WATER POWER PROGRAM
53
Policy and Market Drivers

WIND AND WATER POWER PROGRAM
54
Uncertainty Reigns in Federal Incentives for Wind Energy Beyond 2012 • Commercial wind projects placed in service before the end of 2012 have
access to either the PTC or ITC • Treasury cash grant program available for projects that were under
construction by the end of 2011 and placed in service by the end of 2012 § > 60% of the new wind capacity installed in 2011 elected the cash grant
• First-year “bonus depreciation” at 100% through 2011; reverted back to 50% for 2012 (and slated to disappear altogether in 2013)
• The Section 1705 loan guarantee program has wound down: program closed on four loan guarantees to wind projects totaling 1,024 MW, 285 MW of which were online by the end of 2011
• With PTC, 30% ITC, 30% cash grant, and bonus depreciation all currently scheduled to expire at the end of 2012, the wind sector is currently experiencing serious federal policy uncertainty, and therefore rushing to complete projects by the end of the year

WIND AND WATER POWER PROGRAM
55
State Policies Help Direct Location and Amount of Wind Development, but Current Policies Cannot Support Continued Growth at Levels Seen in the Recent Past
• 29 states and D.C. have mandatory RPS
• State RPS’s can support ~4-5 GW/yr of total renewable energy additions in near term, on average (less for wind specifically)
Non-Binding Goal
Source: Berkeley Lab
WI: 10% by 2015
NV: 25% by 2025
TX: 5,880 MW by 2015
PA: 8.5% by 2020
NJ: 22.5% by 2020CT: 23% by 2020
MA: 11.1% by 2009 +1%/yr
ME: 40% by 2017
NM: 20% by 2020 (IOUs)10% by 2020 (co-ops)
CA: 33% by 2020
MN: 25% by 2025Xcel: 30% by 2020
IA: 105 MW by 1999
MD: 20% by 2022
RI: 16% by 2019
HI: 40% by 2030
AZ: 15% by 2025
NY: 30% by 2015
CO: 30% by 2020 (IOUs)10% by 2020 (co-ops and munis)
MT: 15% by 2015
DE: 25% by 2025
DC: 20% by 2020
WA: 15% by 2020
NH: 23.8% by 2025
OR: 25% by 2025 (large utilities)5-10% by 2025 (smaller utilities)
NC: 12.5% by 2021 (IOUs)10% by 2018 (co-ops and munis)
IL: 25% by 2025
Mandatory RPS
VT: 20% by 2017ND: 10% by 2015
VA: 15% by 2025MO: 15% by 2021
OH: 12.5% by 2024
SD: 10% by 2015
UT: 20% by 2025
MI: 10% by 2015
KS: 20% of peak demand by 2020
OK: 15% by 2015
AK: 50% by 2025

WIND AND WATER POWER PROGRAM
56
Despite Progress on Overcoming Transmission Barriers, Constraints Remain • 2,300 circuit miles of new transmission under construction near end
of 2011; additional 17,800 circuit miles planned through 2015 • AWEA has identified near-term transmission projects that – if all
were completed – could carry ~45 GW of wind capacity • FERC Order No. 1000 requires public utility transmission providers
to improve planning processes and determine a cost allocation methodology for new transmission facilities
• States, grid operators, regional organizations, and DOE continue to take proactive steps to encourage transmission investment to improve access to renewable resources
• Numerous transmission projects designed, in part, to support wind made further progress in development and/or construction in 2011
• BUT…lack of transmission still a major barrier to wind development (witness curtailment data shown earlier on slides 37 & 38)

WIND AND WATER POWER PROGRAM
57
Integrating Wind Energy into Power Systems Is Manageable, but Not Free of Costs
$0
$2
$4
$6
$8
$10
$12
0% 10% 20% 30% 40% 50% 60% 70%
Inte
grat
ion
Cos
t ($/
MW
h)
Wind Penetration (Capacity Basis)
APS (2007) Avista (2007) BPA (2009) [a] BPA (2011) [a] CA RPS (2006) [b] EWITS (2010) Idaho Power (2007) MN-MISO (2006) [c] Nebraska (2010) Pacificorp (2005) Pacificorp (2007) PacifiCorp (2010) Portland GE (2011) Puget Sound Energy (2007) SPP-SERC (2011) We Energies (2003) Xcel-MNDOC (2004) Xcel-PSCo (2006) Xcel-PSCo (2008) Xcel-PSCo (2011) [d] Xcel-UWIG (2003)
Nebraska with Additional Cost of Hourly Wind to Energy-equivalent Daily Flat Block
of Power
Xcel-PSCo-2008 at 2006 Gas Prices
Xcel-PSCo-2011 with Coal Cycling Costs
Notes: Because methods vary and a consistent set of operational impacts has not been included in each study, results from the different analyses of integration costs and balancing reserves are not fully comparable. There has been some recent literature questioning the methods used to estimate wind integration costs and the ability to explicitly disentangle those costs.

WIND AND WATER POWER PROGRAM
58
Studies Find that Greater Wind Penetration Requires Increased Balancing Reserves
• The estimated increase in balancing reserves rarely exceeds 15% in these studies • “Fast” markets (i.e., with shorter scheduling periods) can generally integrate wind
more easily, with less need for increased balancing reserves (see graph on right)
0%
5%
10%
15%
20%
25%
30%
Incr
ease
in B
alan
cing
Res
erve
s (
Incr
emen
tal R
eser
ve M
W /
Incr
emen
tal W
ind
MW
) APS (2007) Avista (2007) BPA (2009) BPA (2011) CA IAP (2007) [a] CAISO (2007) CAISO (2010) [a] ERCOT (2008) EWITS (2010) Idaho Power (2007) ISO-NE (2010) MN-MISO (2006) Nebraska (2010) [b] New York (2005) NorthWestern (2011) NYISO (2010) Oahu (2011) [a,c] Pacificorp (2007) PacifiCorp (2010) SPP (2010) SPP-SERC (2011) We Energies (2003) WWSIS (2010) Xcel-MNDOC (2004) Xcel-PSCo (2006) Xcel-UWIG (2003)
0%
5%
10%
15%
20%
25%
30%
-10% 0% 10% 20% 30% 40% 50% 60%
Incr
ease
in B
alan
cing
Res
erve
s (
Incr
emen
tal
Res
erve
MW
/ In
crem
enta
l Win
d M
W)
Wind Penetration (Capacity Basis)
Scheduling period : <15-min
0%
5%
10%
15%
20%
25%
30%
0% 10% 20% 30% 40% 50%
Incr
ease
in B
alan
cing
Res
erve
s (I
ncre
men
tal
Res
erve
MW
/ In
crem
enta
l Win
d M
W)
Wind Penetration (Capacity Basis)
Scheduling period: >15-min

WIND AND WATER POWER PROGRAM
59
Future Outlook

WIND AND WATER POWER PROGRAM
60
Forecasts Predict Substantial Growth in Wind Additions in 2012 as Developers Rush to Complete Projects Before the Scheduled Expiration of Federal Incentives
Source Assumed Status of
Federal Tax Incentives After 2012
2012 2013 2014 Cumulative Additions 2012-2014
EIA (2012) Expired 7,280 1,430 600 9,310 Bloomberg NEF (2012a) Expired 11,200 1,000 3,000 15,200 Navigant (2011) Expired 8,500 2,400 2,400 13,300 EIA (2012) Extended Indefinitely 3,230 3,320 580 7,130 BTM (2012) Presumably Extended 8,250 7,500 9,000 24,750 Bloomberg NEF (2012a)* Extended – 3 year 11,200 3,100 5,500 19,800 IHS EER (2012) Extended – 3+ year 12,000 1,200 6,050 19,250 MAKE (2012) Extended – details n/a 10,700 3,800 4,600 19,100 Navigant (2011) Extended – 4 year 8,500 7,500 8,000 24,000

WIND AND WATER POWER PROGRAM
61
Uncertainties in Near-Term Market Growth Reflect Conflicting Trends • Lower additions anticipated in 2013 and 2014, with predictions
varying in part based on PTC extension assumptions
• Lower prices for wind energy realized in more recent PPAs may support higher growth in the future, but headwinds include:
– Possible expiration of federal incentives at the end of 2012 – Continued low natural gas and wholesale electricity prices – Inadequate transmission infrastructure in some areas – Modest electricity demand growth and need for new capacity – Softer incremental demand from state RPS markets in near term – Growing competition from solar energy in some regions of the country

WIND AND WATER POWER PROGRAM
62
U.S. Is on a Trajectory that May Lead to 20% of Electricity Coming from Wind But ramping up further to ~16 GW/year and maintaining that pace for a decade is an enormous challenge, and is far from pre-determined; forecasts for growth in 2013 and 2014 are below the 20% trajectory
0
2
4
6
8
10
12
14
16
18
2006
2007
2008
2009
2010
2011
2012
2013
2014
2015
2016
2017
2018
2019
2020
2021
2022
2023
2024
2025
2026
2027
2028
2029
2030
0
35
70
105
140
175
210
245
280
315
Deployment Path in 20% Wind Report (annual) Actual Wind Installations (annual) Deployment Path in 20% Wind Report (cumulative) Actual Wind Installations (cumulative)
Ann
ual C
apac
ity (G
W)
range of annual projections(green = PTC extension, red = no extension)
Cum
ulat
ive
Cap
acity
(GW
)

WIND AND WATER POWER PROGRAM
63
For More Information... See full report for additional findings, a discussion of the sources of data used, etc.
• http://www1.eere.energy.gov/wind//
To contact the primary authors • Ryan Wiser, Lawrence Berkeley National Laboratory
510-486-5474, [email protected] • Mark Bolinger, Lawrence Berkeley National Laboratory
603-795-4937, [email protected]
Berkeley Lab’s contributions to this report were funded by the Wind & Water Power Program, Office of Energy Efficiency and Renewable Energy of the U.S. Department of Energy under Contract No. DE-AC02-05CH11231. The authors are solely responsible for any omissions or errors contained herein.