2011−2012 - ministry of healthpublic employees pension plan • annual report • 2011–2012 ......
TRANSCRIPT

PublicEmployeesPensionPlan
2011−2012A N N U A L R E P O R T

1PUBLIC EMPLOYEES PENSION BOARD
PUBLIC EMPLOYEES PENSION PLAN • ANNUAL REPORT • 2011–2012
TABLE OF CONTENTS
Letters of transmittal..........................................................................................2
Chair’s Comments...............................................................................................3
FinanCial highlights.............................................................................................4
Investment highlights...........................................................................................5
Plan Profile........................................................................................................6
PubliC emPloyees Pension board.............................................................................8
Investments.......................................................................................................12
Plan administration...........................................................................................22
StrategiC goals................................................................................................24
StrategiC initiatives............................................................................................25
Risk management..............................................................................................30
management’s rePort........................................................................................36
FinanCial statements
Auditor’s rePort........................................................................................38
Statement of finanCial Position....................................................................39
Statement of Changes in net assets available for benefits..............................40
Notes to finanCial statements.....................................................................41
SChedules to the finanCial statements..........................................................59
This.annual.report.is.available.in.electronic.format.at.www.peba.gov.sk.ca

2PUBLIC EMPLOYEES PENSION BOARDPUBLIC EMPLOYEES PENSION PLAN • ANNUAL REPORT • 2011–2012
LETTERS OF TRANSMITTAL
Ken Krawetz Minister.of.Finance
Her.Honour,.The.Honourable.Vaughn.Solomon.Schofield.
Lieutenant.Governor.of.the.Province.of.Saskatchewan
May.it.Please.Your.Honour:
I.respectfully.submit.the.Annual.Report.of.the.Public.Employees.Pension.Board.for.the.fiscal.year.ending.
March.31,.2012.
Ken.Krawetz
Minister.of.Finance
The.Honourable.Ken.Krawetz
Minister.of.Finance
Sir:
On.behalf.of.the.Public.Employees.Pension.Board,.I.have.the.honour.of.submitting.the.Annual.Report.of.the.
Public.Employees.Pension.Board.for.the.fiscal.year.ending.March.31,.2012.
Kenneth.R..HorsmanChair

3PUBLIC EMPLOYEES PENSION BOARD
PUBLIC EMPLOYEES PENSION PLAN • ANNUAL REPORT • 2011–2012
Kenneth R. Horsman Chair
“...the.Board.identified.a.number.of.investment.option.initiatives.that.will.be.rolled.out.over.the.next.three.years.”
On.behalf.of.the.members.of.the.Public.Employees.Pension.Board.(the.Board),.I.am.pleased.to.present.the.
2011-2012.Annual.Report.of.the.Public.Employees.Pension.Plan.(PEPP)...The.report.details.critical.strategic.
plan.activities.and.accomplishments,.and.pertinent.Plan.financial.and.investment.information.
The.Board.remains.focused.on.making.decisions.in.the.best.interest.of.members...As.such,.it.is.committed.to.
addressing.members’.changing.needs.by.regularly.reviewing.the.services.it.provides...
As.a.part.of.that.commitment,.the.major.focus.for.the.Board.was.to.conduct.a.review.of.PEPP’s.investment.
options.in.2011...The.review.confirmed.that.the.fundamental.design.of.the.Plan’s.investment.options.is.
sound...It.also.identified.some.new.opportunities...As.a.result,.the.Board.identified.a.number.of.investment.
option.initiatives.that.will.be.rolled.out.over.the.next.three.years...The.new.initiatives.are.designed.to.
provide.members.with.improved.returns.over.the.long.term,.reduce.their.risk.of.loss,.and.provide.them.with.
retirement.income.guidance...The.Board.is.confident.these.initiatives.will.place.the.Plan.in.a.strong.position.
for.the.future.and.give.members.the.tools.to.make.informed.choices.that.will.suit.their.time.horizon,.risk.
tolerance,.and.retirement.goals,.up.to.and.during.retirement.
.
This.spring.members.were.provided.with.a.new.value-added.service...Elements.of.the.regular.semi-annual.
Member.Statement.were.combined.with.the.annual.Retire@Ease.Statement...Information.in.this.statement.
will.help.members.create.and/or.modify.their.personal.retirement.plans...The.combined.statement.will.be.
mailed.to.members.once.a.year,.for.the.period.ending.March.31...The.regular.semi-annual.statement.will.
continue.to.be.mailed.to.members.each.fall..
I.am.privileged.to.chair.the.Public.Employees.Pension.Board.and.to.present.the.2011-2012.Annual.Report.
Kenneth.R..Horsman
Chair
CHAIR’S COMMENTS
4PUBLIC EMPLOYEES PENSION BOARDPUBLIC EMPLOYEES PENSION PLAN • ANNUAL REPORT • 2011–2012
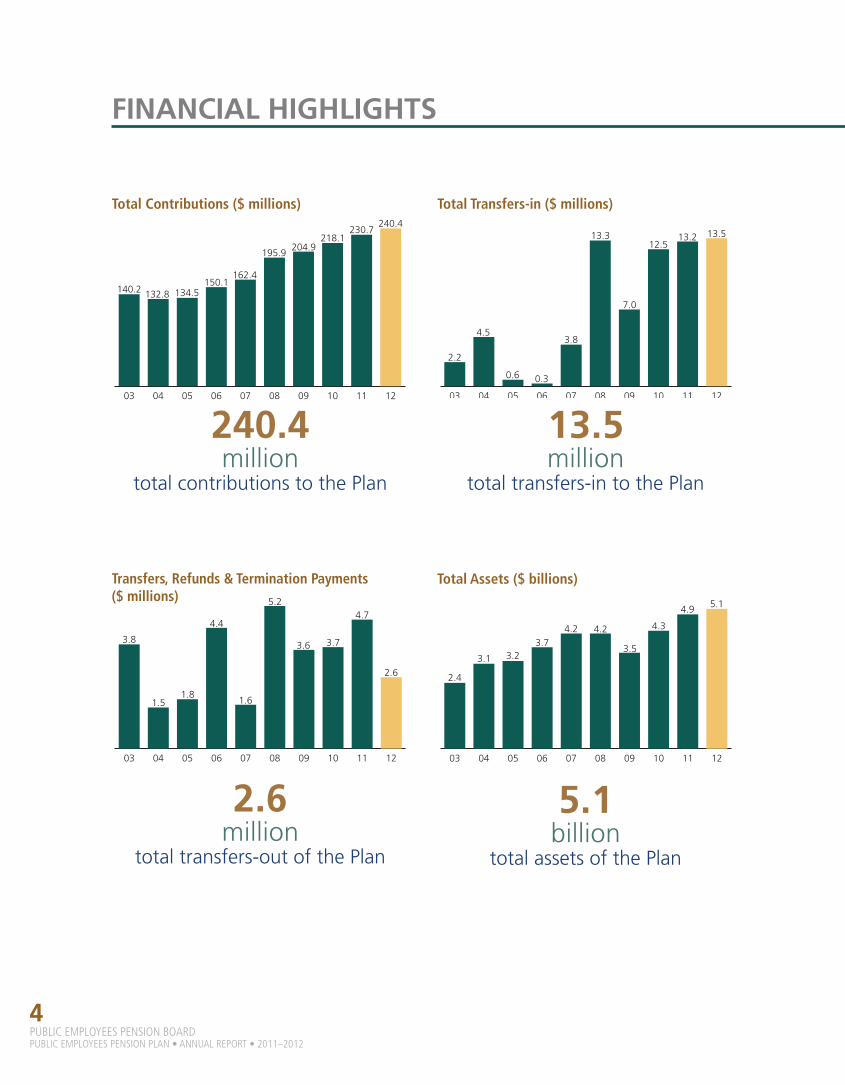
FINANCIAL HIGHLIGHTS
240.4million
total.contributions.to.the.Plan
12111009080706050403
240.4230.7
218.1204.9
195.9
162.4150.1
134.5132.8140.2
12111009080706050403
13.513.212.5
7.0
13.3
3.8
0.30.6
4.5
2.2
12111009080706050403
2.6
4.7
3.73.6
5.2
1.6
4.4
1.81.5
3.8
Total Contributions ($ millions) Total Transfers-in ($ millions)
Transfers, Refunds & Termination Payments ($ millions)
13.5million
total.transfers-in.to.the.Plan
2.6million
total.transfers-out.of.the.Plan
5.1billion
total.assets.of.the.Plan
12111009080706050403
5.14.9
4.3
3.5
4.24.23.7
3.23.1
2.4
Total Assets ($ billions)

5PUBLIC EMPLOYEES PENSION BOARD
PUBLIC EMPLOYEES PENSION PLAN • ANNUAL REPORT • 2011–2012
INVESTMENT HIGHLIGHTS
PEPP Fees and Rates of Return1 (as.at.March.31,.2012)
Fund
(%)
Gross.Rate.of.Return
Fees.PEBA.&.Board2
Fees.Investments3
Net.Rate.of.Return Benchmark
Accelerated.Growth (0.6) 0.12 0.45 (1.2) 1.1
Growth 1.0 0.12 0.39 0.5 2.4
Balanced 2.3 0.12 0.32 1.9 3.3
Moderate 3.9 0.12 0.26 3.5 4.6
Conservative 5.1 0.12 0.14 4.8 5.8
Short-term.Bond 5.0 0.12 0.12 4.8 4.41.The.rate.of.return.and.fee.data.for.the.PEPP.Steps.Fund.varies.with.each.step.2.Of.the.0.12%.fees.shown,.the.Board.accounts.for.less.than.0.01%.3.Investment.fees.include.fees.for.investment.managers,.consulting.and.custody
Table 1.0
3,839.5 Balanced.Fund 183.1 Moderate.
Fund
390.1 Short-term.Bond.Fund 134.9 Conservative.
Fund
205.7 PEPP.Steps.Fund 130.0 Accelerated.
Growth.Fund
199.7 Growth.Fund
Assets by Investment Option ($ millions) (as.at.March.31,.2012)Total Transfers-in ($ millions)
Total Assets ($ billions)
Equity.markets.in.general.were.mixed.for.the.year,.with.Canadian.and..non-North.American.equity.markets.producing.negative.returns,.lagging.behind.positive.returns.from.U.S..equities...Strong.performances.by.the.domestic.fixed.income.and.real.estate.portfolios.also.contributed.positively.to.the.Plan...This.led.to.the.most.aggressive.asset.allocation.funds.losing.value.over.the.year,.while.the.more.moderate.and.conservative.funds.were.able.to.post.limited.gains.

6PUBLIC EMPLOYEES PENSION BOARDPUBLIC EMPLOYEES PENSION PLAN • ANNUAL REPORT • 2011–2012
PEPP.was.established.and.is.governed.by.The Public Employees Pension Plan Act..It.is.registered.as.a.pension.
plan.pursuant.to.The Pension and Benefits Act, 1992.and.the.Income Tax Act (Canada).
The.Public.Employees.Pension.Plan.(PEPP).has.79.participating.employers.and.51,308.members.at..
March.31,.2012...Participating.employers.include.the.Government.of.Saskatchewan,.Crown.Corporations,.
agencies,.boards.and.other.public.institutions...
PEPP.is.a.defined.contribution.(DC).pension.
plan...A.member’s.contributions.and.his.or.her.
employers’.contributions,.plus.any.return.on.
investment,.are.used.to.provide.a.member.with.
income.based.upon.the.account.balance.he.or.
she.has.built.at.retirement.
Enrolment.in.the.Plan.is.mandatory.for.employees.
who.hold.a.permanent.position.with.an.employer.
participating.in.the.Plan...Unless.otherwise.
specified.in.an.agreement,.non-permanent.
employees.may.choose.to.join.the.Plan.at.any.
time.
Member.and.employer.contributions.are.
calculated.as.a.percentage.of.the.member’s.
total.gross.regular.earnings...Unless.otherwise.
specified.in.an.agreement,.the.contribution.
percentage.is.five.per.cent...Member.
contributions.are.made.by.payroll.deduction.
20,659Inactive members
1,349Variable Pension Benefit members
29,300Active members
PLAN PROFILE
51.3 thousandPlan.members
$5.1 billionPlan.assets
2.8thousandinter-fund.transfers.completed.by.Plan.members.online
Membership Activity
Membership at March 31, 2011 50,236
Add:
Enrolment.during.the.year 3,139
Variable.Pension.Benefit.(VPB).enrolment 401
Less:
Exiting.members 2,468
Membership at March 31, 2012 51,308
Table 1.1

7PUBLIC EMPLOYEES PENSION BOARD
PUBLIC EMPLOYEES PENSION PLAN • ANNUAL REPORT • 2011–2012
Contributions.to.PEPP.are.tax.deductible.up.to.a.maximum.set.by.the Income Tax Act (Canada)...Members.do.
not.pay.taxes.on.contributions.or.the.accumulated.investment.income.until.they.withdraw.an.amount.from.
the.Plan.
Contributions.are.forwarded.to.the.Plan.and.are.used.to.purchase.units.in.the.PEPP.investment.option.of.the.
member’s.choice.
Units.are.valued.daily.following.market.close...Once.a.new.unit.value.is.declared,.member.accounts.are.
valued.using.the.new.unit.value...Return.on.investment.is.reflected.in.the.changing.unit.value...The.amount.
the.member.receives.at.payout.or.transfer.is.calculated.using.the.unit.value.in.effect.at.the.date.of.payment.
Members.may.retire.and.begin.to.receive.retirement.income.at.age.50.or.older.
Members.may.defer.purchasing.a.retirement.income.option.after.retirement...The.Income Tax Act (Canada).
states.that.a.pension.must.begin.by.the.end.of.the.calendar.year.a.member.turns.age.71.
13.6thousandPlan.members.registered.in..PEPP.Access
45.0years
average.age..of.active..
Plan.members
79employers
number.of.participating.employers
Variable Pension BenefitInactiveActive
70-7465-6960-6455-5950-5445-4940-4435-3930-3425-2920-2415-19
Membership Distribution by Age Band as at March 31, 2012

8PUBLIC EMPLOYEES PENSION BOARDPUBLIC EMPLOYEES PENSION PLAN • ANNUAL REPORT • 2011–2012
PUBLIC EMPLOYEES PENSION BOARDBoard Members: (left to right)
Dennis.Terry,.Denise.Macza,.Cathy.Uhersky,.Jack.Duvall,.Michael.Friebe,.Kenneth.R..Horsman,.Derrick.Goulet,..Sean.Engemoen,.Kathy.Martin
The.Board.consists.of.nine.members;.four.are.appointed.on.behalf.of.participating.employers,.four.on.behalf.
of.employees...The.Board.conducts.an.external.recruitment.process.to.choose.a.Chair,.who.is.appointed.for.a.
three-year.term..
To provide lifetime retirement benefitsto members.
PURPOSE
To manage the assetsand expenses solely in the best interests of members.
MISSION GOALS
To ensure all Plan members are well informed about the plan and the choices they can make within the plan.
Public Employees Pension Board Members at March 31, 2012
Name Position Appointing BodyKenneth.R..Horsman Chair Public.Employees.Pension.Board
Michael.Friebe Vice-Chair Canadian.Union.of.Public.Employees.Local.600
Jack.Duvall Member Saskatchewan.Government.and.General.Employees’.Union
Sean.Engemoen Member Saskatchewan.Institute.of.Applied.Science.and.TechnologySaskatchewan.Liquor.and.Gaming.Authority
Derrick.Goulet Member International.Brotherhood.of.Electrical.Workers.Union.Local.2067
Denise.Macza Member Public.Service.Commission
Kathy.Martin Member Communications,.Energy.and.Paperworkers.Union.of.Canada
Dennis.Terry Member SaskEnergy,.SaskPower,.SaskTel
Cathy.Uhersky Member Saskatchewan.Crop.Insurance.Corporation,.Workers’.Compensation.Board,.Saskatchewan.Cancer.Foundation
Table 1.2

9PUBLIC EMPLOYEES PENSION BOARD
PUBLIC EMPLOYEES PENSION PLAN • ANNUAL REPORT • 2011–2012
The Public Employees Pension Board (the Board) administers PEPP. The Board has the fiduciary responsibility for administering PEPP and managing the investment activities in the best interests of all PEPP members.
Board Education
The.Board.has.an.education.program.in.place.for.Board.members...The.purpose.
of.the.program.is.to.ensure.the.Board.members.possess.a.sound.knowledge.and.
understanding.of.pension,.investment,.and.governance.related.issues...The.Board.
budgets.$5,000.per.year.for.each.Board.member.for.registration.fees...Expenses.
related.to.travel.and.accommodation.are.reimbursed.at.rates.established.by.the.Public.
Service.Commission.
Upon.appointment.to.the.Board,.new.members.receive.a.variety.of.orientation.
materials,.and.each.member.meets.with.the.Board’s.Executive.Secretary.regarding.
Board.materials.and.meeting.process...New.members.are.also.assigned.a.mentor.
during.their.orientation.period...Mentors.are.drawn.from.experienced.Board.
members.who.are.able.to.answer.questions.and.offer.guidance.to.the.new.member.
as.required.
Board.members.are.required.to.undertake.a.formal.education.program...The.
program.provides.a.list.of.courses.and.seminars.that.deliver.specific.investment.and.
governance-related.information.relevant.to.Board.members.
•. Within.six.months.of.appointment.to.the.Board,.members.must.complete.a.
course.on.basic.investment.principles.facilitated.by.the.Board’s.administrator.
•. Within.one.year,.members.must.complete.a.course.on.pension.investment.
management.
•. Within.two.years,.members.must.complete.a.course.on.basic.trustee.
development.
•. Within.three.years,.members.must.complete.a.course.on.advanced.trustee.
development.
The Board education program is to ensure
Board members possess a sound knowledge and
understanding of pension, investment
and governance related issues.

10PUBLIC EMPLOYEES PENSION BOARDPUBLIC EMPLOYEES PENSION PLAN • ANNUAL REPORT • 2011–2012
PUBLIC EMPLOYEES PENSION BOARD
Board.members.who.have.completed.the.formal.education.program.are.also.required.to.attend.one.
educational.event.annually.that.is.facilitated.by.an.industry-recognized.pension.and.benefits.organization...A.
Board.member.who.is.actively.pursuing.the.formal.education.program.is.exempt.from.the.obligations.found.
in.the.ongoing.development.for.all.members...However,.all.members.are.strongly.encouraged.to.attend.an.
education.event.
Conferences.and.other.events.attended.by.Board.members.as.part.of.their.ongoing.education.provide.the.
Board.with.information.on.the.current.governance,.investment.and.legal.environment.affecting.pension.
plans...They.also.provide.opportunities.for.Board.members.to.meet.with.pension.experts.and.pension.trustees.
from.other.pension.plans.to.discuss.common.issues.
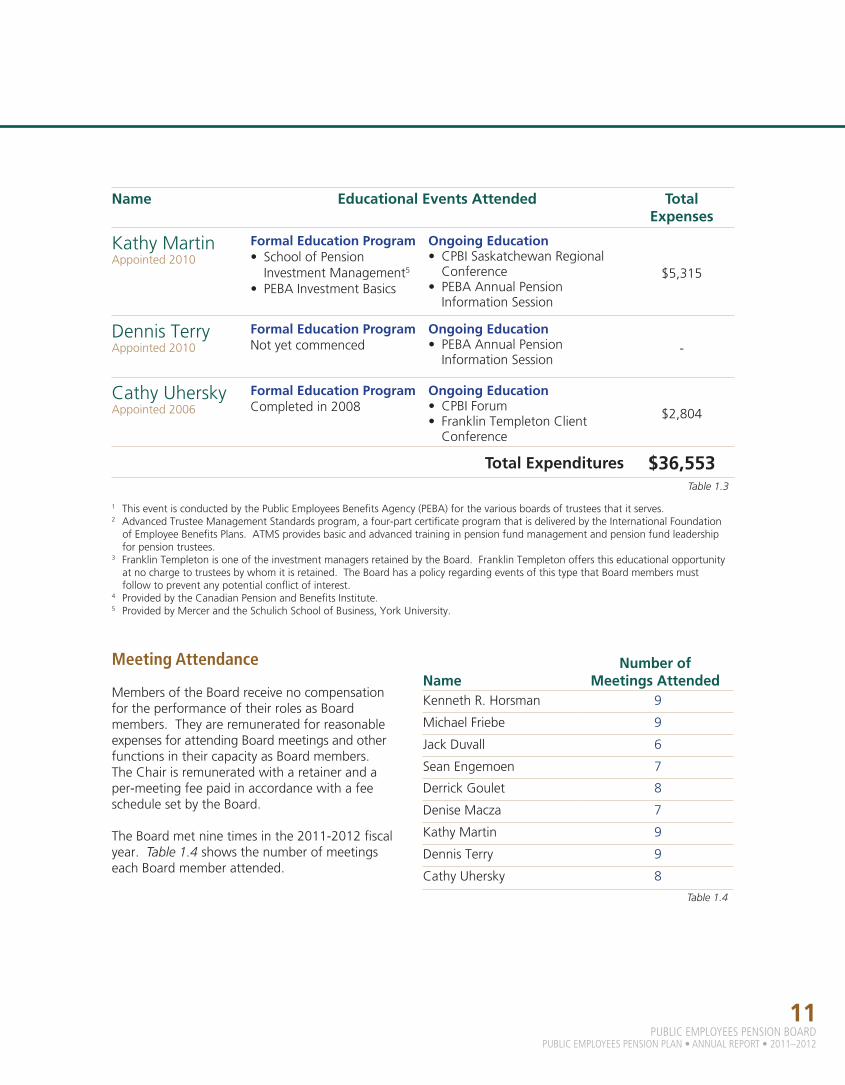
Table 1.3.lists.the.education.events.attended.by.Board.members.to.March.31,.2012.
Seminars, Courses and Other Events Attended by Board Members in 2011–2012
Name Educational Events Attended Total Expenses
Jack.DuvallAppointed.2008
Formal Education ProgramCompleted.in.2009
Ongoing Education•. PEBA.Annual.Pension.Information.Session1
$284
Sean.EngemoenAppointed.2007
Formal Education ProgramCompleted.in.2008
Ongoing Education•. PEBA.Annual.Pension.Information.Session
•. ATMS.Part.22$2,903
Michael.FriebeAppointed.2005
Formal Education ProgramCompleted.in.2007
Ongoing Education•. Franklin.Templeton.Client.Conference3
•. CFA.Institute.Annual.Forecast
$2,232
Derrick.GouletAppointed.2006
Formal Education ProgramCompleted.in.2008
Ongoing Education•. CPBI.Saskatchewan.Regional.Conference4
•. PEBA.Annual.Pension.Information.Session
$1,536
Ken.HorsmanRetained.2005
Formal Education ProgramCompleted.in.2008
Ongoing Education•. PEBA.Annual.Pension.Information.Session
•. Board.Effectiveness.Program,.Rotman.School.of.Management
•. CPBI.Luncheon.and.Presentation
$16,705
Denise.MaczaAppointed.2001
Formal Education ProgramCompleted.in.2003
Ongoing Education•. Institute.of.Corporate.Directors.Education.Program
•. Directors.Education.Program.Written.Exam
$4,774
11PUBLIC EMPLOYEES PENSION BOARD
PUBLIC EMPLOYEES PENSION PLAN • ANNUAL REPORT • 2011–2012
Name Educational Events Attended Total Expenses
Kathy.MartinAppointed.2010
Formal Education Program•. School.of.Pension.Investment.Management5
•. PEBA.Investment.Basics
Ongoing Education•. CPBI.Saskatchewan.Regional.Conference
•. PEBA.Annual.Pension.Information.Session
$5,315
Dennis.TerryAppointed.2010
Formal Education ProgramNot.yet.commenced
Ongoing Education•. PEBA.Annual.Pension.Information.Session
-
Cathy.UherskyAppointed.2006
Formal Education ProgramCompleted.in.2008
Ongoing Education•. CPBI.Forum•. Franklin.Templeton.Client.Conference
$2,804
Total Expenditures $36,553Table 1.3
1....This.event.is.conducted.by.the.Public.Employees.Benefits.Agency.(PEBA).for.the.various.boards.of.trustees.that.it.serves.2....Advanced.Trustee.Management.Standards.program,.a.four-part.certificate.program.that.is.delivered.by.the.International.Foundation.of.Employee.Benefits.Plans...ATMS.provides.basic.and.advanced.training.in.pension.fund.management.and.pension.fund.leadership.for.pension.trustees...
3....Franklin.Templeton.is.one.of.the.investment.managers.retained.by.the.Board...Franklin.Templeton.offers.this.educational.opportunity.at.no.charge.to.trustees.by.whom.it.is.retained...The.Board.has.a.policy.regarding.events.of.this.type.that.Board.members.must.follow.to.prevent.any.potential.conflict.of.interest.
4....Provided.by.the.Canadian.Pension.and.Benefits.Institute.5....Provided.by.Mercer.and.the.Schulich.School.of.Business,.York.University.
Meeting Attendance
Members.of.the.Board.receive.no.compensation.for.the.performance.of.their.roles.as.Board.members...They.are.remunerated.for.reasonable.expenses.for.attending.Board.meetings.and.other.functions.in.their.capacity.as.Board.members..The.Chair.is.remunerated.with.a.retainer.and.a.per-meeting.fee.paid.in.accordance.with.a.fee.schedule.set.by.the.Board.
The.Board.met.nine.times.in.the.2011-2012.fiscal.year...Table 1.4.shows.the.number.of.meetings.each.Board.member.attended.
NameNumber of
Meetings AttendedKenneth.R..Horsman 9
Michael.Friebe 9
Jack.Duvall 6
Sean.Engemoen 7
Derrick.Goulet 8
Denise.Macza 7
Kathy.Martin 9
Dennis.Terry 9
Cathy.Uhersky 8
Table 1.4

12PUBLIC EMPLOYEES PENSION BOARDPUBLIC EMPLOYEES PENSION PLAN • ANNUAL REPORT • 2011–2012
INVESTMENTS
Year In Review
The.2011-2012.fiscal.year.was.challenging.for.equity.investments...Investor.sentiment.was.considerably.
negative.during.the.first.half.of.the.year,.leading.to.negative.performance.both.in.domestic.and.foreign.
equities...The.ongoing.sovereign.debt.concerns.within.the.European.Union.were.a.major.focal.point.
throughout.much.of.the.year,.with.negotiations.revolving.around.Greek.debt.and.increasing.yields.for.
Spanish.and.Italian.debt.creating.significant.headwinds.for.the.global.economy...There.was.not.much.
to.offset.this.from.the.U.S.,.with.its.economy.continuing.to.be.sluggish...In.an.attempt.to.calm.investor.
nervousness,.the.U.S..Federal.Reserve.went.so.far.as.to.make.the.unorthodox.move.of.pledging.to.keep.
interest.rates.low.through.2013...Down.to.the.wire.negotiations.on.the.U.S..debt.ceiling.between.the.two.
major.political.parties,.along.with.cuts.to.China’s.growth.forecasts.compounded.the.pessimistic.outlook.
prevalent.in.the.first.half.of.the.year.
Pessimism.began.to.turn.into.optimism.during.the.second.half.of.the.fiscal.year...In.Europe,.agreements.were.
reached.that.would.see.a.Greek.default.of.50.cents.on.the.euro.and.impose.austerity.measures.on.the.Greek.
budget.in.exchange.for.continued.bail-out.funds.from.other.European.nations...In.addition,.all.European.
Union.members.except.for.Great.Britain.agreed.to.make.fiscal.discipline.mandatory.for.member.countries.
which.helped.to.temporarily.alleviate.concerns.of.a.collapse.of.the.common.currency...The.U.S..economy.
began.to.pick.up.steam.as.well,.as.indicated.by.strong.and.broad.job.growth.
In.Canada,.the.economy.continued.to.be.somewhat.limited.as.a.result.of.continuing.global.headwinds...The.
gross.domestic.product.(GDP).managed.to.edge.up.1.6.per.cent.year.over.year.as.of.February.2012,.led.by.
manufacturing.and.wholesale.trade...Exports.were.greater.than.imports.by.$1.8.billion.in.2011,.the.first.time.
since.2008.that.Canada.has.been.a.net.exporter...Employment.was.up.1.1.per.cent,.or.197,000.jobs,.the.
majority.of.which.were.full-time.positions...This.dropped.the.unemployment.rate.down.to.7.2.per.cent.as.of.
March.2012...And.according.to.the.Bank.of.Canada’s.core.index,.inflation.was.at.1.9.per.cent.year.over.year.
as.of.March.2012.

13PUBLIC EMPLOYEES PENSION BOARD
PUBLIC EMPLOYEES PENSION PLAN • ANNUAL REPORT • 2011–2012
Pessimism began to turn into optimism during the second half of the fiscal year.
Overview
The.Plan.offers.members.the.choice.of.six.asset.allocation.funds:
•. Accelerated.Growth.Fund •. Moderate.Fund
•. Growth.Fund •. Conservative.Fund
•. Balanced.Fund •. PEPP.Steps.Fund
Members.may.invest.in.the.Short-term.Bond.Fund,.either.in.addition.to.or.instead.of,.investing.in.one.of.the.
six.asset.allocation.funds.
PEPP Members
Investment Options
Asset Class Investment Managers
Canadian Equities Greystone Managed Investments Inc. TD Asset Management Inc. Globe Flex Capital, L.P. Hillsdale Investment Mangement Inc.
Foreign Equities Greystone Managed Investments Inc. Hansberger Global Investors, Inc. TD Asset Management Inc. BlackRock Asset Management Canada Inc. Tweedy, Browne Company LLC Franklin Templeton Investments Corp.
Real Estate Greystone Managed Investments Inc.
Bonds Greystone Managed Investments Inc. TD Asset Management Inc.
Cash & Equivalents TD Asset Management Inc.
Short-term Bonds Greystone Managed Investments Inc.
Accelerated Growth FundGrowth FundBalanced FundModerate FundConservative FundPEPP Steps FundShort-term Bond Fund
choose
invest in
Performance.of.the.domestic.bond.market.was.strong.for.most.of.the.year,.although.it.began.to.taper.
off.in.late.2011...The.Bank.of.Canada.left.it’s.key.overnight.rate.at.1.0.per.cent.over.the.entire.year,.as.a.
response.to.global.economic.concerns.and.a.pledge.by.its.U.S..counterpart.not.to.raise.rates.in.2012.or.
2013...The.Bank.of.Canada’s.bond.yields.dropped.considerably,.with.the.five-year.bond.yield.dropping.1.2.
per.cent.to.1.6.per.cent,.and.the.10.year.bond.yield.dropping.1.2.per.cent.to.2.1.per.cent...The.Canadian.
dollar,.although.slipping.slightly.in.value.relative.to.the.U.S..dollar.and.other.major.currencies,.remains.strong.
relative.to.its.historic.performance.

14PUBLIC EMPLOYEES PENSION BOARDPUBLIC EMPLOYEES PENSION PLAN • ANNUAL REPORT • 2011–2012
INVESTMENTS
Asset.allocation.funds.invest.in.a.mix.of.asset.classes,.including.equities.(Canadian.and.foreign),.real
estate,.fixed.income.and.cash.equivalents...The.mix.depends.on.the.fund:.more.conservative.funds.are.
weighted.more.heavily.toward.fixed-income.investments,.where.more.aggressive.funds.are.weighted.more.
heavily.toward.equities...The.Short-term.Bond.Fund.is.invested.solely.in.fixed.income.investments.
Equities.offer.the.greatest.potential.return,.but.are.exposed.to.a.high.level.of.market.volatility,.meaning.they.
are.susceptible.to.losses.over.the.short.term...As.such,.equities.are.best.suited.for.long-term.investors.who.
are.able.to.ride.out.short-term.volatility.in.return.for.long-term.growth.potential.
Fixed-income.investments,.such.as.bonds.and.cash.equivalents,.are.lower-volatility.investments,.meaning.they.
are.much.better.suited.to.capital.preservation...For.this.reason,.members.with.less.tolerance.for.short-term.
volatility.may.prefer.funds.with.a.greater.percentage.of.fixed.income.
Members.will.want.to.make.an.investment.choice.that.fits.their.risk.tolerance.and.investment.profile...PEPP’s.
seven.investment.options.offer.members.a.range.from.the.Accelerated.Growth.Fund,.an.equity-based.fund,.
to.the.Conservative.Fund.to.the.Short-term.Bond.Fund,.invested.solely.in.fixed.income.investments.
The.PEPP.Steps.Fund,.the.default.investment.fund.for.the.Plan,.is.an.asset.allocation.fund.that.automatically.
moves.members.to.more.conservative.investments.over.time...Equity.holdings.decrease.and.bond.
holdings.increase.by.increments.of.approximately.five.per.cent.for.each.of.the.12.steps.
15PUBLIC EMPLOYEES PENSION BOARD
PUBLIC EMPLOYEES PENSION PLAN • ANNUAL REPORT • 2011–2012
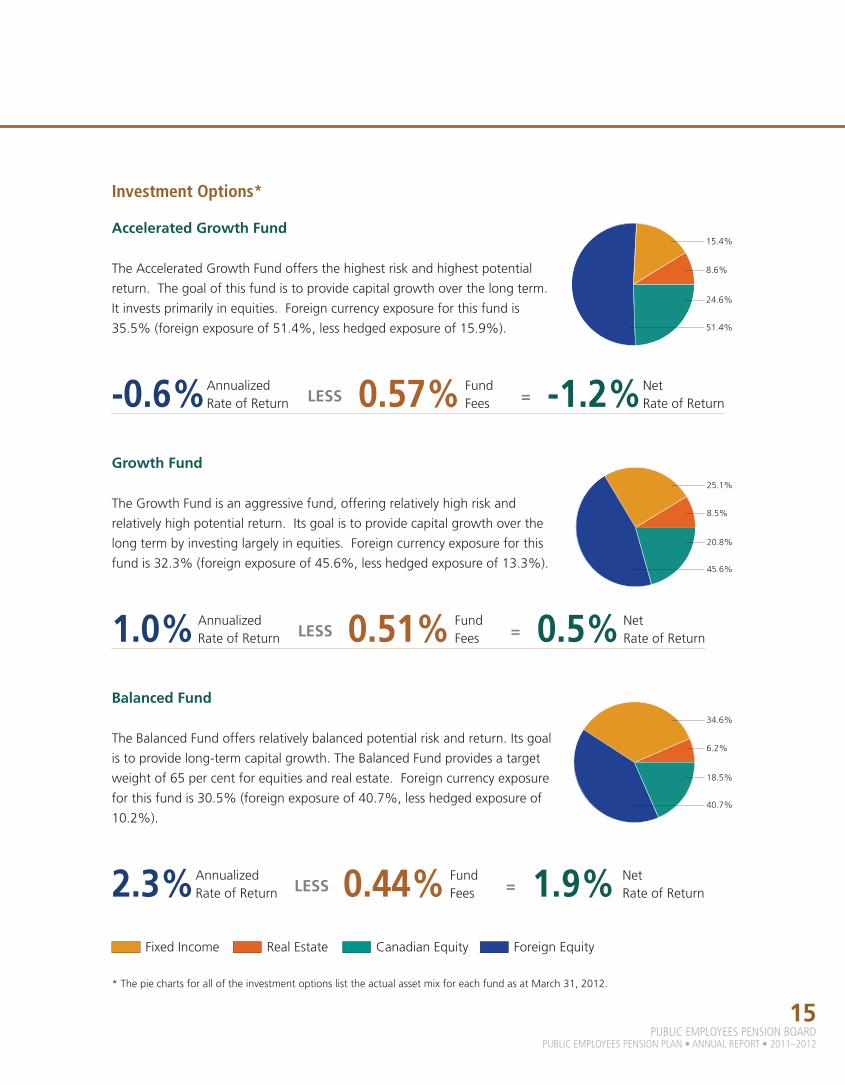
Investment Options*
Accelerated Growth Fund
The.Accelerated.Growth.Fund.offers.the.highest.risk.and.highest.potential.
return...The.goal.of.this.fund.is.to.provide.capital.growth.over.the.long.term...
It.invests.primarily.in.equities...Foreign.currency.exposure.for.this.fund.is.
35.5%.(foreign.exposure.of.51.4%,.less.hedged.exposure.of.15.9%).
-0.6%AnnualizedRate.of.Return LESS 0.57% Fund.
Fees = -1.2%NetRate.of.Return
Growth Fund
The.Growth.Fund.is.an.aggressive.fund,.offering.relatively.high.risk.and.
relatively.high.potential.return...Its.goal.is.to.provide.capital.growth.over.the.
long.term.by.investing.largely.in.equities...Foreign.currency.exposure.for.this.
fund.is.32.3%.(foreign.exposure.of.45.6%,.less.hedged.exposure.of.13.3%).
1.0% AnnualizedRate.of.Return LESS 0.51% Fund.
Fees = 0.5% NetRate.of.Return
Balanced Fund
The.Balanced.Fund.offers.relatively.balanced.potential.risk.and.return..Its.goal.
is.to.provide.long-term.capital.growth..The.Balanced.Fund.provides.a.target.
weight.of.65.per.cent.for.equities.and.real.estate...Foreign.currency.exposure.
for.this.fund.is.30.5%.(foreign.exposure.of.40.7%,.less.hedged.exposure.of.
10.2%).
2.3%AnnualizedRate.of.Return LESS 0.44% Fund.
Fees = 1.9% NetRate.of.Return
Fixed.Income Real.Estate Canadian.Equity Foreign.Equity
51.4%
24.6%
8.6%
15.4%
45.6%
20.8%
8.5%
25.1%
40.7%
18.5%
6.2%
34.6%
*.The.pie.charts.for.all.of.the.investment.options.list.the.actual.asset.mix.for.each.fund.as.at.March.31,.2012.

16PUBLIC EMPLOYEES PENSION BOARDPUBLIC EMPLOYEES PENSION PLAN • ANNUAL REPORT • 2011–2012
Moderate Fund
The.Moderate.Fund.is.designated.to.provide.a.balance.of.security.and..
long-term.growth.by.balancing.the.risk.and.potential.returns.of.the.major.
asset.classes..It.invests.almost.equally.in.fixed.income.and.equities.with.a.small.
allocation.to.real.estate..Foreign.currency.exposure.for.this.fund.is.23.9%.
(foreign.exposure.of.32.2%,.less.hedged.exposure.of.8.3%)
3.9%AnnualizedRate.of.Return LESS 0.38% Fund.
Fees = 3.5% NetRate.of.Return
Conservative Fund
The.Conservative.Fund.is.designed.to.provide.returns.with.little.fluctuation..
By.focusing.mainly.on.fixed.income.investments,.it.offers.lower.risk.and.lower.
potential.for.return.than.other.PEPP.asset.allocation.funds..Foreign.currency.
exposure.for.this.fund.is.17.9%.(foreign.exposure.of.21.2%,.less.hedged.
exposure.of.3.3%).
5.1%AnnualizedRate.of.Return LESS 0.26%Fund.
Fees = 4.8% NetRate.of.Return
Short-term Bond Fund
The.Short-term.Bond.Fund.is.the.most.conservative.investment.choice.within.
PEPP.and.offers.the.lowest.potential.risks.and.returns...Because.its.goal.is.to.
preserve.capital,.it.invests.strictly.in.bonds.with.a.maturity.of.five.years.or.less..
There.is.no.foreign.currency.exposure.for.this.fund.
5.0%AnnualizedRate.of.Return LESS 0.24%Fund.
Fees = 4.8% NetRate.of.Return
Fixed.Income Real.Estate Canadian.Equity Foreign.Equity
32.2%
14.6%
3.6%
49.6%
21.2%
9.1%
69.7%
100.0
INVESTMENTS
17PUBLIC EMPLOYEES PENSION BOARD
PUBLIC EMPLOYEES PENSION PLAN • ANNUAL REPORT • 2011–2012
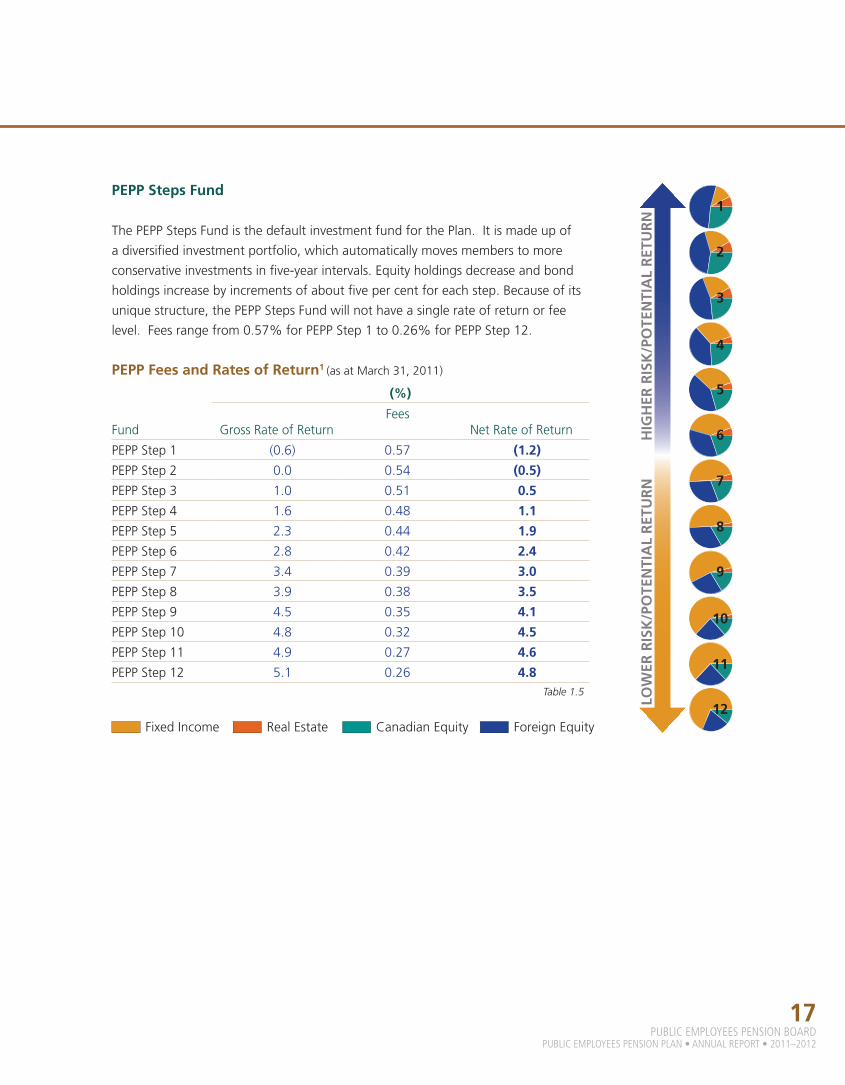
PEPP Steps Fund
The.PEPP.Steps.Fund.is.the.default.investment.fund.for.the.Plan...It.is.made.up.of.
a.diversified.investment.portfolio,.which.automatically.moves.members.to.more.
conservative.investments.in.five-year.intervals..Equity.holdings.decrease.and.bond.
holdings.increase.by.increments.of.about.five.per.cent.for.each.step..Because.of.its.
unique.structure,.the.PEPP.Steps.Fund.will.not.have.a.single.rate.of.return.or.fee.
level...Fees.range.from.0.57%.for.PEPP.Step.1.to.0.26%.for.PEPP.Step.12.
LOW
ER R
ISK
/PO
TEN
TIA
L R
ETU
RN
H
IGH
ER R
ISK
/PO
TEN
TIA
L R
ETU
RN
PEPP Fees and Rates of Return1 (as.at.March.31,.2011)
Fund
(%)
Gross.Rate.of.ReturnFees.
Net.Rate.of.Return
PEPP.Step.1 (0.6) 0.57 (1.2)
PEPP.Step.2 0.0 0.54 (0.5)
PEPP.Step.3 1.0 0.51 0.5
PEPP.Step.4 1.6 0.48 1.1
PEPP.Step.5 2.3 0.44 1.9
PEPP.Step.6 2.8 0.42 2.4
PEPP.Step.7 3.4 0.39 3.0
PEPP.Step.8 3.9 0.38 3.5
PEPP.Step.9 4.5 0.35 4.1
PEPP.Step.10 4.8 0.32 4.5
PEPP.Step.11 4.9 0.27 4.6
PEPP.Step.12 5.1 0.26 4.8Table 1.5
Fixed.Income Real.Estate Canadian.Equity Foreign.Equity12
11
10
9
8
7
6
5
4
3
2
1

18PUBLIC EMPLOYEES PENSION BOARDPUBLIC EMPLOYEES PENSION PLAN • ANNUAL REPORT • 2011–2012
INVESTMENTS
Investment Managers
Within.each.asset.class,.one.or.more.investment.managers.are.used.for.each.investment.option..The.use.of.
different.managers.allows.for.further.diversification.of.the.investments.within.each.investment.option...Use.
of.different.investment.managers.allows.the.Plan.to.employ.different.investment.styles.that.can.focus.on.
different.regions.or.sectors.for.investment,.reducing.the.risk.that.any.one.region,.sector.or.style.may.suffer.
during.any.economic.cycle.or.event.
Investment Manager Mandates
Investment.Manger Mandate DescriptionGlobeFlex.Capital,.L.P.(GlobeFlex)
•. Canadian.Equities Actively.manages.small.cap.Canadian.equities
Greystone.Managed.Investments..Inc.(Greystone)
•. Canadian.Equities
•. U.S..Equities
•. Real.Estate
•. Fixed.Income
•. Short-term.Bonds
Actively.manages.Canadian.equities
Actively.manages.U.S..equities,.without.currency.hedging
Actively.manages.real.estate
Actively.manages.fixed.income
Actively.manages.the.Short-term.Bond.Fund
Hansberger.Global.Investors.Inc.(Hansberger)
•. Non-North..American.Equities
Actively.manages.non-North.American.equites,.without.currency.hedging
Hillsdale.Investment.Management(Hillsdale)
•. Canadian.Equities Actively.manages.small.and.mid.cap.Canadian.equities
BlackRock.Asset.Management.Canada.Inc.(BlackRock)
•. U.S..Equities Actively.manages.small.and.mid.cap.U.S..equities,.without.currency.hedging
TD.Asset.Management.Inc.(TDAM)
•. Canadian.Equities
•. U.S..Equities
•. Fixed.Income
•. Canadian.Money.Market
Passively.manages.Canadian.equities
Passively.manages.U.S..equities,.without.currency.hedging
Passively.manages.fixed.income
Actively.manages.Canadian.money.market
Franklin.Templeton.Investments.Corp.(Templeton)
•. Non-North..American.Equities
Actively.manages.non-North.American.equities,.without.currency.hedging
Tweedy,.Browne.Company.LLC(Tweedy)
•. Non-North.American.Equities
Actively.manages.non-North.American.equities,.with.currency.hedging
Table 1.6
19PUBLIC EMPLOYEES PENSION BOARD
PUBLIC EMPLOYEES PENSION PLAN • ANNUAL REPORT • 2011–2012
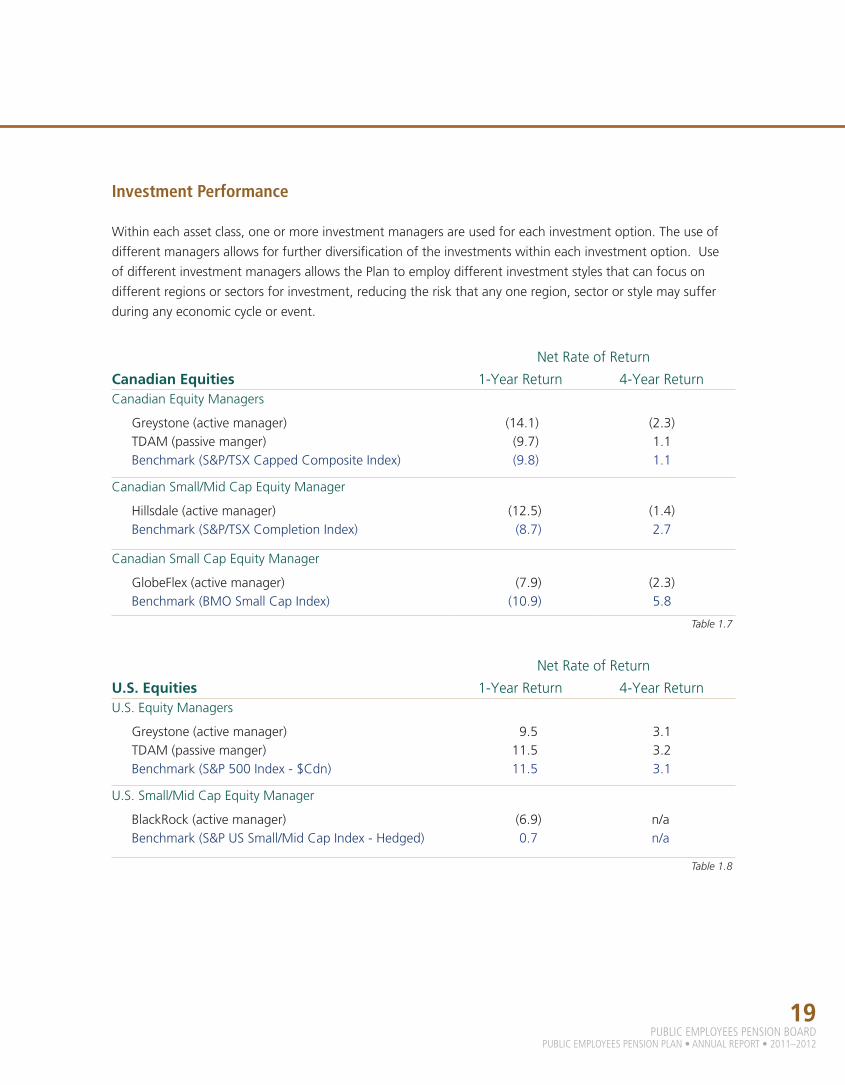
Investment Performance
Within.each.asset.class,.one.or.more.investment.managers.are.used.for.each.investment.option..The.use.of.
different.managers.allows.for.further.diversification.of.the.investments.within.each.investment.option...Use.
of.different.investment.managers.allows.the.Plan.to.employ.different.investment.styles.that.can.focus.on.
different.regions.or.sectors.for.investment,.reducing.the.risk.that.any.one.region,.sector.or.style.may.suffer.
during.any.economic.cycle.or.event.
Net.Rate.of.Return
Canadian Equities 1-Year.Return 4-Year.ReturnCanadian.Equity.Managers
Greystone.(active.manager)TDAM.(passive.manger)Benchmark.(S&P/TSX.Capped.Composite.Index)
(14.1)(9.7)(9.8)
(2.3)1.11.1
Canadian.Small/Mid.Cap.Equity.Manager
Hillsdale.(active.manager)Benchmark.(S&P/TSX.Completion.Index)
(12.5)(8.7)
(1.4)2.7
Canadian.Small.Cap.Equity.Manager
GlobeFlex.(active.manager)Benchmark.(BMO.Small.Cap.Index)
(7.9)(10.9)
(2.3)5.8
Table 1.7
Net.Rate.of.Return
U.S. Equities 1-Year.Return 4-Year.ReturnU.S..Equity.Managers
Greystone.(active.manager)TDAM.(passive.manger)Benchmark.(S&P.500.Index.-.$Cdn)
9.511.511.5
3.13.23.1
U.S..Small/Mid.Cap.Equity.Manager
BlackRock.(active.manager)Benchmark.(S&P.US.Small/Mid.Cap.Index.-.Hedged)
(6.9)0.7
n/an/a
Table 1.8
20PUBLIC EMPLOYEES PENSION BOARDPUBLIC EMPLOYEES PENSION PLAN • ANNUAL REPORT • 2011–2012
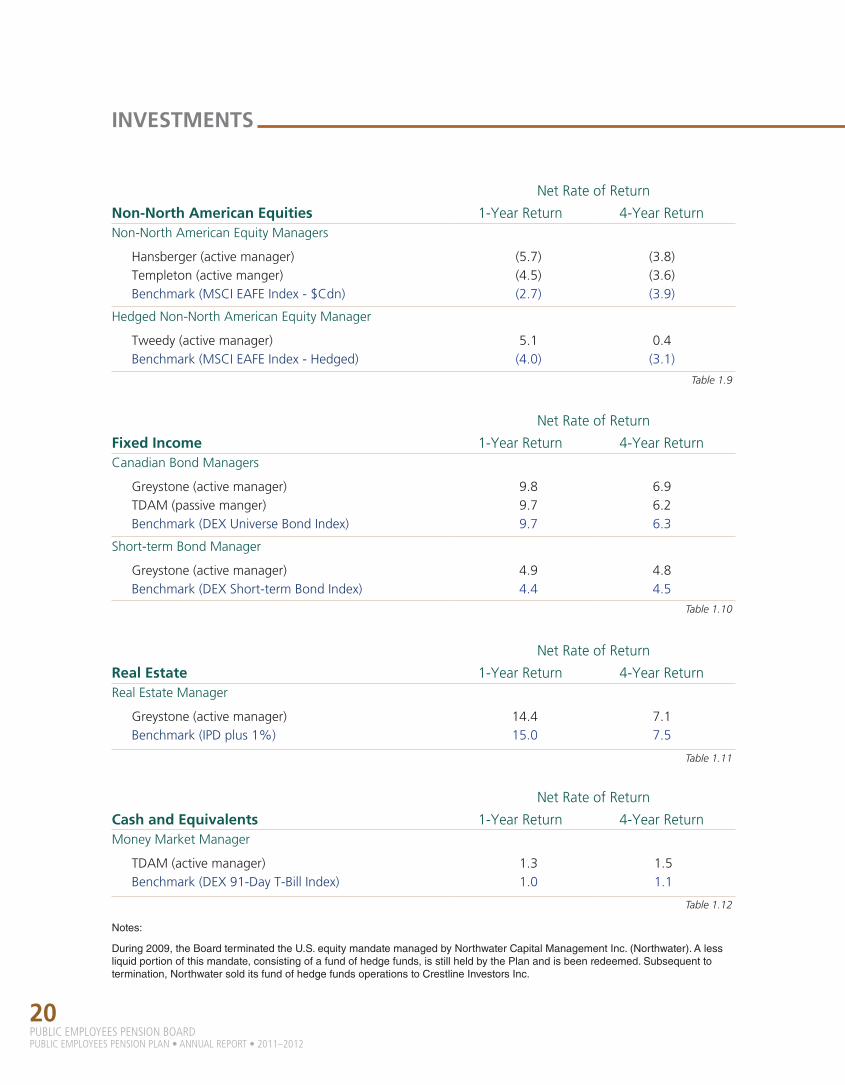
Net.Rate.of.Return
Non-North American Equities 1-Year.Return 4-Year.ReturnNon-North.American.Equity.Managers
Hansberger.(active.manager)Templeton.(active.manger)Benchmark.(MSCI.EAFE.Index.-.$Cdn)
(5.7)(4.5)(2.7)
(3.8)(3.6)(3.9)
Hedged.Non-North.American.Equity.Manager
Tweedy.(active.manager)Benchmark.(MSCI.EAFE.Index.-.Hedged)
5.1(4.0)
0.4(3.1)
Table 1.9
INVESTMENTS
Net.Rate.of.Return
Fixed Income 1-Year.Return 4-Year.ReturnCanadian.Bond.Managers
Greystone.(active.manager)TDAM.(passive.manger)Benchmark.(DEX.Universe.Bond.Index)
9.89.79.7
6.96.26.3
Short-term.Bond.Manager
Greystone.(active.manager)Benchmark.(DEX.Short-term.Bond.Index)
4.94.4
4.84.5
Table 1.10
Net.Rate.of.Return
Real Estate 1-Year.Return 4-Year.ReturnReal.Estate.Manager
Greystone.(active.manager)Benchmark.(IPD.plus.1%)
14.415.0
7.17.5
Table 1.11
Net.Rate.of.Return
Cash and Equivalents 1-Year.Return 4-Year.ReturnMoney.Market.Manager
TDAM.(active.manager)Benchmark.(DEX.91-Day.T-Bill.Index)
1.31.0
1.51.1
Table 1.12
Notes:
During 2009, the Board terminated the U.S. equity mandate managed by Northwater Capital Management Inc. (Northwater). A less liquid portion of this mandate, consisting of a fund of hedge funds, is still held by the Plan and is been redeemed. Subsequent to termination, Northwater sold its fund of hedge funds operations to Crestline Investors Inc.
21PUBLIC EMPLOYEES PENSION BOARD
PUBLIC EMPLOYEES PENSION PLAN • ANNUAL REPORT • 2011–2012
Investment Consulting
The.Board.retains.Mercer.(Canada).Limited.for.investment.consulting.services.that.include.research.and.
analysis.of.financial.markets,.market.trends,.investment.managers,.and.investment.performance,.but.also.
global.trends.in.investments.and.pension.plan.design...Mercer.(Canada).Limited.was.paid.$737,517.in.fees.
for.the.year.ended.March.31,.2012.
Investment Custody and Valuation
The.Board.retains.RBC.Dexia.Investor.Services.Trust.as.the.custodian.of.the.Plan..The.custodian.is.responsible.
for.custody.of.all.financial.assets.of.the.Plan.(in.the.name.of.PEPP),.settles.all.investment.transactions.and.
ensures.all.investment.income.(dividends.and.interest).is.collected..The.custodian.also.reports.all.investment.
transactions.and.conducts.valuation.for.the.Plan..The.custodian.was.paid.$1,477,080.for.the.year.ended.
March.31,.2012..
Investment Administration
PEBA.is.retained.by.the.Board.for.administration.of.the.Plan’s.investment.program..This.includes.declaring.
unit.values.for.all.investment.options,.monitoring.of.investment.performance,.communicating.with.external.
investment.managers.and.the.investment.consultant,.research,.compliance.monitoring.and.managing.asset.
mix.and.cash.flows.
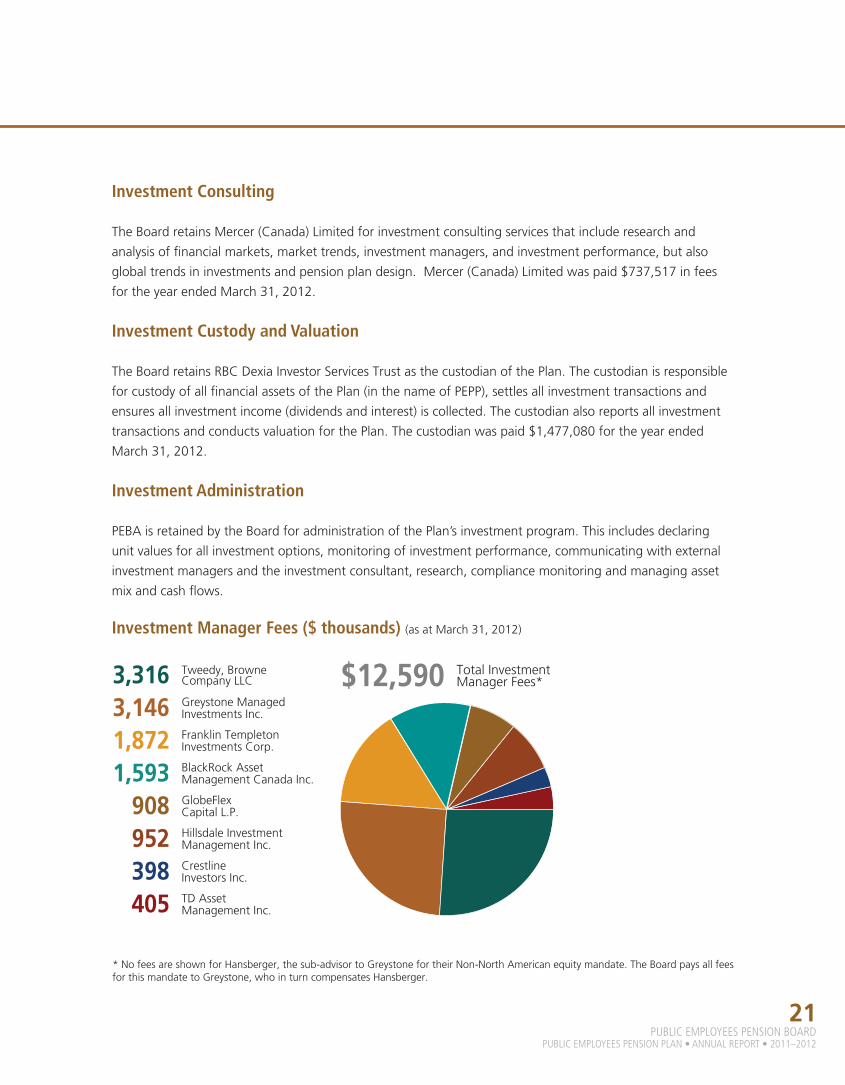
3,316 Tweedy,.Browne..Company.LLC
3,146 Greystone.Managed..Investments.Inc.
1,872 Franklin.Templeton..Investments.Corp.
1,593 BlackRock.Asset..Management.Canada.Inc.
908 GlobeFlex..Capital.L.P.
952 Hillsdale.Investment..Management.Inc.
398 Crestline..Investors.Inc.
405 TD.Asset..Management.Inc.
Investment Manager Fees ($ thousands) (as.at.March.31,.2012)
$12,590 Total.Investment.Manager.Fees*
*.No.fees.are.shown.for.Hansberger,.the.sub-advisor.to.Greystone.for.their.Non-North.American.equity.mandate..The.Board.pays.all.fees.for.this.mandate.to.Greystone,.who.in.turn.compensates.Hansberger.

22PUBLIC EMPLOYEES PENSION BOARDPUBLIC EMPLOYEES PENSION PLAN • ANNUAL REPORT • 2011–2012
The.Board.has.delegated.the.day-to-day.administration.of.the.Plan.and.management.of.its.assets.to.PEBA...
The.cost.for.this.is.charged.to.the.Fund...PEBA.is.a.branch.of.the.Ministry.of.Finance...PEBA.administers.a.
wide.range.of.pension.and.benefit.plans.
Under.contract.with.the.Board,.PEBA.provides.all.services.required.to.operate,.administer.and.manage.the.
Plan.in.a.manner.consistent.with.and.according.to.all.statutory.provisions.and.regulations.that.apply.to.the.
Plan...
To.administer.the.Plan,.PEBA:
•. maintains.all.member.and.accounting.records;
•. collects.and.deposits.contributions.to.the.Fund;
•. transfers.contributions.to.the.custodian.of.the.Fund.for.investment;
•. determines.all.questions.of.coverage,.eligibility.and.methods.of.providing.or.arranging.for.the.provision.
of.benefits;
•. calculates.and.pays.all.pension.benefits;
•. communicates.with.members.and.participating.employers;.and
•. prepares.the.annual.report.
PEBA.also.provides.Senior.Executive.Officer.services.and.Executive.Secretary.services.to.the.Board...In..
2011-2012,.the.Board.paid.PEBA $6,523,000.for.administrative.services.
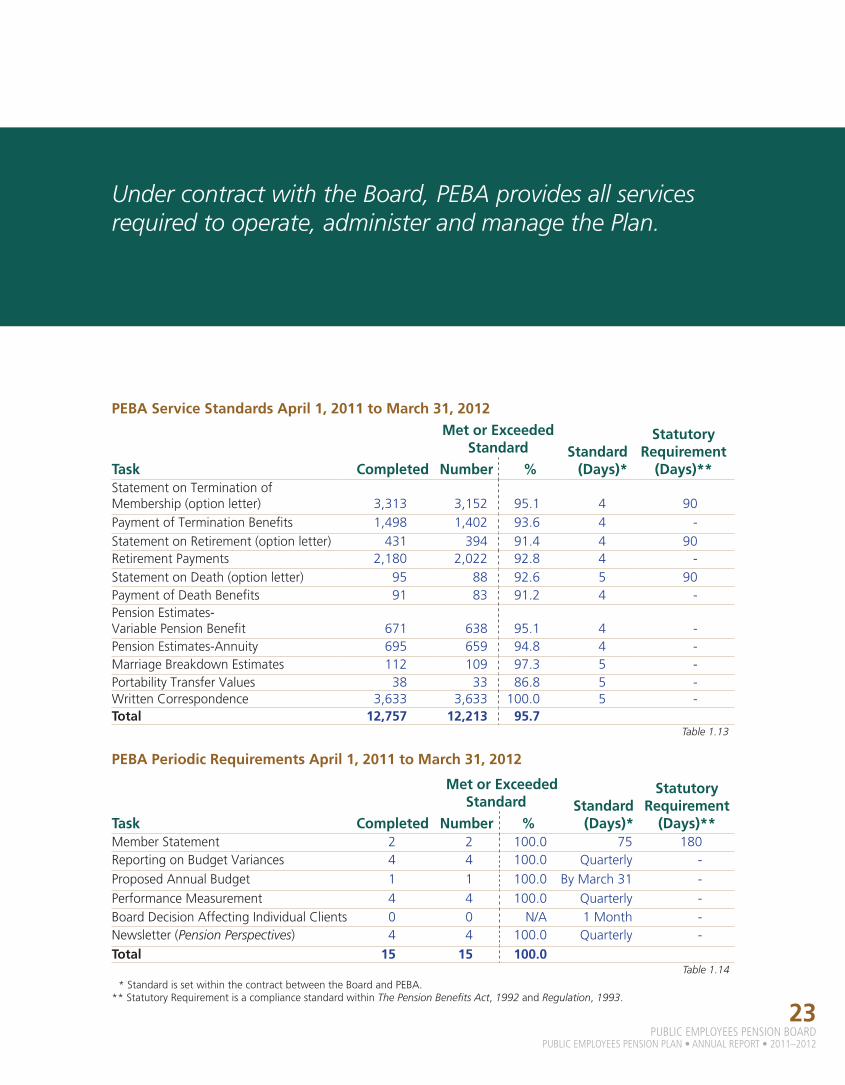
Administration Service Standards
PEBA.reports.measurement.against.standards.to.the.Board.quarterly...Table 1.13.and.Table 1.14.provide.
measurement.results.for.the.2011-2012.year.
PLAN ADMINISTRATION
Public Employees Pension (PEPP) Pension.Information.Officer
23PUBLIC EMPLOYEES PENSION BOARD
PUBLIC EMPLOYEES PENSION PLAN • ANNUAL REPORT • 2011–2012
PEBA Service Standards April 1, 2011 to March 31, 2012
Task Completed
Met or Exceeded Standard Standard
(Days)*
Statutory Requirement
(Days)**Number %Statement.on.Termination.of..Membership.(option.letter) 3,313 3,152 95.1 4 90Payment.of.Termination.Benefits 1,498 1,402 93.6 4 -Statement.on.Retirement.(option.letter) 431 394 91.4 4 90Retirement.Payments 2,180 2,022 92.8 4 -Statement.on.Death.(option.letter) 95 88 92.6 5 90Payment.of.Death.Benefits 91 83 91.2 4 -Pension.Estimates-..Variable.Pension.Benefit 671 638 95.1 4 -Pension.Estimates-Annuity 695 659 94.8 4 -Marriage.Breakdown.Estimates 112 109 97.3 5 -Portability.Transfer.Values 38 33 86.8 5 -Written.Correspondence 3,633 3,633 100.0 5 -Total 12,757 12,213 95.7
Table 1.13
PEBA Periodic Requirements April 1, 2011 to March 31, 2012
Task Completed
Met or Exceeded Standard Standard
(Days)*
Statutory Requirement
(Days)**Number %Member.Statement 2 2 100.0 75 180Reporting.on.Budget.Variances 4 4 100.0 Quarterly -Proposed.Annual.Budget 1 1 100.0 By.March.31 -Performance.Measurement 4 4 100.0 Quarterly -Board.Decision.Affecting.Individual.Clients 0 0 N/A 1.Month -Newsletter.(Pension Perspectives) 4 4 100.0 Quarterly -Total 15 15 100.0
Table 1.14*.Standard.is.set.within.the.contract.between.the.Board.and.PEBA.**.Statutory.Requirement.is.a.compliance.standard.within.The Pension Benefits Act,.1992.and.Regulation,.1993.
Under contract with the Board, PEBA provides all services required to operate, administer and manage the Plan.

24PUBLIC EMPLOYEES PENSION BOARDPUBLIC EMPLOYEES PENSION PLAN • ANNUAL REPORT • 2011–2012
The PEPP strategic business plan was developed within the context of the Plan’s purpose, mission and goals.
STRATEGIC GOALS
The.Board.has.adopted.a.comprehensive.governance.process.that.includes.regular.strategic.planning.and.risk.
assessment...The.strategic.goals.of.the.PEPP.Strategic.Business.Plan.for.2012-2013.include:
AService Delivery,
Design and Communications
Plan members have access to pension
services and information which meet their needs.
BPlan Governance
The Board strives to be an industry
leader in its pensionplan governance
practices.
CAccountability
Performance ofthe Plan and theBoard’s service
providers ismeasured, managed,
and reported.
The.Board.conducts.a.review.of.its.strategic.business.plan.annually...The.strategic.business.plan.is.constructed.
on.a.rolling.three-year.basis.
Public Employees Pension (PEPP) Plan.Member

25PUBLIC EMPLOYEES PENSION BOARD
PUBLIC EMPLOYEES PENSION PLAN • ANNUAL REPORT • 2011–2012
STRATEGIC INITIATIVES
Public Employees Pension (PEPP) Plan.Member
A. SERVICE DELIVERY, DESIGN AND COMMUNICATIONS
The.Board.is.committed.to.ensuring.that.Plan.members.have.access.to.pension.services.and.information.
which.meet.their.needs.
The.Board.is.determined.to.maintain.its.position.as.an.industry.leader.in.the.value-added.services.the.Plan.
provides.to.its.members.
The.Board.is.continually.exploring.leading.industry.practices,.but.its.primary.benchmark.in.Plan.design.and.
service.delivery.is.the.satisfaction.of.Plan.members...The.Board’s.goal.is.to.ensure.that.Plan.design.and.service.
delivery.meet.Plan.member.needs.
This.means.providing.members.with.risk-appropriate.investment.options.to.enable.them.
to.make.the.investment.choice.that.is.most.appropriate.to.their.circumstances...It.also.
means.providing.members.with.the.information.needed.to.make.that.choice.
The.best.way.the.Board.can.know.whether.the.options.and.services.it.provides.are.
meeting.member.needs.is.to.ask.members...The.Board.is.committed.to.facilitating..
two-way.communication.with.members.to.gather.their.feedback.
The.Board’s.goal.is.to.provide.options.and.services.that.give.members.every.reason.to.
remain.in.the.Plan.and.that.attract.the.attention.of.other.public-sector.employers.and.
employees.who.will.seek.to.join.the.Plan.
The best way the Board can know
whether the options and services it
provides are meeting member needs is to
ask members.

26PUBLIC EMPLOYEES PENSION BOARDPUBLIC EMPLOYEES PENSION PLAN • ANNUAL REPORT • 2011–2012
STRATEGIC INITIATIVES
Activities Accomplished in 2011-2012
Define the Plan’s role in the provision of financial advice to members.
•. The.Plan.began.consultation.with.the.Saskatchewan.Financial.Services.Commission.regarding.a.proposed.
model.for.the.delivery.of.advice.to.Plan.members.to.assist.them.with.the.decisions.they.must.make.as.
members.of.the.Plan.
Enhance client self-service by expanding online capabilities.
•. PEPP.implemented.software.allowing.online.registration.for.educational.events.offered.by.the.Plan.in.
March.2011.
•. PEPP.investigated.the.potential.for.providing.access.to.more.information.through.the.PEPP.Access.online.
account.information.system.
•. PEPP.investigated.enabling.newly-enrolled.members.to.submit.information.via.the.website.
•. PEPP.has.developed.a.secure.means.of.permitting.employers.to.remit.contributions.electronically..
Investigation.continues.to.determine.what.other.functionality.would.benefit.employers.and.the.costs.
associated.with.developing.those.features.
•. PEPP.encourages.members.to.use.the.PEPP.Access online.account.information.system.and.the.
Retire@Ease™.retirement.planning.tool.through.the.Ready,.Set,.PEPP.and.RetireWithEase.presentations...
The.RetireWithEase.presentation.includes.a.demo.and.overview.of.the.retirement.planning.tool.and.
Ready,.Set,.PEPP.speaks.to.the.features.of.PEPP.Access.
Update suite of investment options.
•. The.Board.completed.a.strategic.review.of.the.Plan’s.investment.options.and.their.ability.to.meet.the.
ongoing.needs.of.members,.and.it.approved.several.measures.intended.to.improve.member.outcomes.
Activities Planned for 2012-2013
• The Plan will provide communication to Plan members regarding the Board’s plan to improve member
outcomes. Implementation of the Board’s planned enhancements to the Plan will commence in 2012.
• The Plan will continue its consultation with the Saskatchewan Financial Services Commission regarding
the provision of advice to Plan members to assist them with the decisions they must make as members of
the Plan.
27PUBLIC EMPLOYEES PENSION BOARD
PUBLIC EMPLOYEES PENSION PLAN • ANNUAL REPORT • 2011–2012
B. PLAN GOVERNANCE
Pension.plan.governance.refers.to.the.roles.and.responsibilities.of.the.Board.and.its.service.providers.in.
fulfilling.the.Boards.fiduciary*.obligations.to.Plan.members.and.their.beneficiaries...The.Board.strives.to.be.an.
industry.leader.in.its.pension.plan.governance.practices.
The.Board.recognizes.that.good.governance.is.crucial.to.the.long-term.success.of.the.Plan...Good.governance.
requires.appropriate.control.mechanisms.that.encourage.good.decision.making,.proper.and.timely.execution,.
and.regular.review.and.assessment...The.Board.has.invested.considerable.effort.in.developing.its.governance.
practices.and.policies,.and.will.continue.to.seek.ways.of.improving.its.governance.program.
Several.ongoing.initiatives.have.been.implemented.in.this.area,.including:
•. annual.self-assessment.based.on.Canadian.Association.of.Pension.Supervisory.Authorities.Guidelines;
•. annual.self-assessment.and.periodic.external.assessment.against.the.Guidelines.for.Capital.Accumulation.
Plans.and.best.practices;
•. the.creation.of.a.Board.Policy.Manual.with.ongoing.policy.development;.and
•. periodic.benchmarking.of.the.Board’s.governance.practices.against.the.governance.practices.of.other.
pension.governing.bodies.through.benchmarking.surveys.and.audits.
The.Board’s.primary.objective.in.its.pursuit.of.this.goal.is.to.improve.its.oversight.of.the.Plan.
* A fiduciary relationship is a legal term for a special type of relationship under the law where one party is bound to act strictly in the best interest of the beneficiary. An example of a fiduciary relationship is the relationship between a doctor and a patient: a doctor is bound to act honestly, in good faith, and strictly in the best interest of the patient.

28PUBLIC EMPLOYEES PENSION BOARDPUBLIC EMPLOYEES PENSION PLAN • ANNUAL REPORT • 2011–2012
STRATEGIC INITIATIVES
Activities Accomplished in 2011-2012
Review Board practices, areas of focus, and Board/Management roles and responsibilities.
•. The.Board.implemented.a.process.for.Board.members.to.self-evaluate.their.educational.needs.in.
consultation.with.the.Board.Chair.
•. The.Board.has.implemented.a.process.to.evaluate.the.executive.management.services.provided.to.the.
Board.
•. The.Board.amended.its.educational.program.for.Board.members.to.include.additional.Plan-specific,.
Board-specific,.and.governance-focused.content.
Implement a policy on director certification.
•. The.Board.deferred.development.of.a.policy.on.director.certification.until.Board.members.were.able.to.
attend.additional.courses.to.determine.their.value.for.Board.member.education.
Review alternate models for the administration of the Act to determine if the Board can better discharge its
duties to Plan members.
• The.Board.deferred.exploring.alternate.models.for.the.administration.of.the.Plan.until.it.could.discuss.the.
topic.at.its.annual.strategic.planning.session.in.2012.
Activities Planned for 2012-2013
• Review the Plan’s risk management program and develop a plan to address any items requiring attention.
29PUBLIC EMPLOYEES PENSION BOARD
PUBLIC EMPLOYEES PENSION PLAN • ANNUAL REPORT • 2011–2012
C. ACCOUNTABILITY
The.Board.measures,.manages.and.reports.on.the.performance.of.the.Plan.and.its.service.providers.
The.Board.believes.that.good.governance.requires.a.strong.focus.on.accountability,.the.basis.of.which.is.
the.establishment.of.measurable.objectives,.the.monitoring.of.progress.against.these.objectives,.and.the.
communication.of.the.results.to.Plan.stakeholders...
The.Board.has.made.considerable.progress.with.respect.to.this.goal,.including:
•. the.establishment.of.service.standards.for.the.Plan.administrator;.
•. the.development.and.implementation.of.a.strategic.business.plan;.and
•. annual.Board.member.self.assessment.
The.Board.has.two.primary.objectives.in.its.pursuit.of.this.goal:
•. The.Board.demonstrates.that.it.governs.the.Plan.responsibly..
•. The.Board.demonstrates.that.it.provides.appropriate.oversight.of.service.providers.
Activities Accomplished in 2011-2012
Comprehensive review of the Plan’s investment policy regarding environmental, social, and governance (ESG)
considerations.
•. The.Board.finalized.the.statement.of.its.investment.belief.with.regard.to.environmental,.social,.and.
governance.considerations.in.the.Plan’s.investment.policy.
Implementation of the balanced scorecard.
•. The.Board.received.a.revised.balanced.scorecard.which.included.draft.targets.for.several.measures.
Activities Planned for 2012-2013
• The Board will review additional recommendations with regard to the Plan’s balanced scorecard and the
Plan’s enhanced reporting framework as a whole.
30PUBLIC EMPLOYEES PENSION BOARDPUBLIC EMPLOYEES PENSION PLAN • ANNUAL REPORT • 2011–2012
RISK MANAGEMENT
Within.its.mandate,.the.Board.is.responsible.for.managing.risks.that.could.affect.the.operation.of.PEPP,.the.
Plan’s.members.and.other.stakeholders.
Annually,.the.Board.will.conduct.a.risk-management.review...This.annual.review.is.designed.to.identify.
potential.events.and.trends.that.may.positively.or.negatively.affect.the.Board’s.ability.to.achieve.its.strategic.
goals.or.maintain.its.operations...These.events.and.trends.are.defined.as.risks.
Risk:..The.potential.events.and.trends.that.may.positively.or.negatively.affect.the.operation.of.
the.Plan,.the.members.or.other.stakeholders.of.the.Plan.or.the.attainment.of.strategic.goals.
The.risk-management.process.and.review.ensures.that.the.Board,.along.with.its.administrator,.identifies.
and.evaluates.risks,.ensures.appropriate.strategies.are.in.place.to.manage.these.risks.and.reviews.the.
performance.of.the.risk-management.strategies.for.the.previous.year.
The.Risk.Management.Plan.and.its.annual.review.ensure.that.a.regular,.documented.process.is.in.place.
for.the.management.of.the.Plan’s.foreseeable.risks...Documenting.the.rationale.for.arriving.at.decisions.
strengthens.accountability.and.demonstrates.due.diligence..
The Board’s Risk Management Philosophy Statement
The.Board.is.committed.to.creating.and.maintaining.value.for.the.members.of.the.Plan...The.
Plan.faces.risks.as.the.Board.fulfills.this.commitment...Therefore,.the.Board.is.responsible.
for.managing.all.foreseeable.risks.that.could.affect.the.operation.of.the.Plan.and.the.Plan’s.
stakeholders...Through.its.risk-management.process,.the.Board.identifies,.measures,.monitors.
and.manages.these.risks.in.a.manner.that.is.consistent.with.the.Board’s.governance.model.
31PUBLIC EMPLOYEES PENSION BOARD
PUBLIC EMPLOYEES PENSION PLAN • ANNUAL REPORT • 2011–2012
The Board is responsible for managing all foreseeable risks that could affect the operation of the Plan and the Plan’s stakeholders.
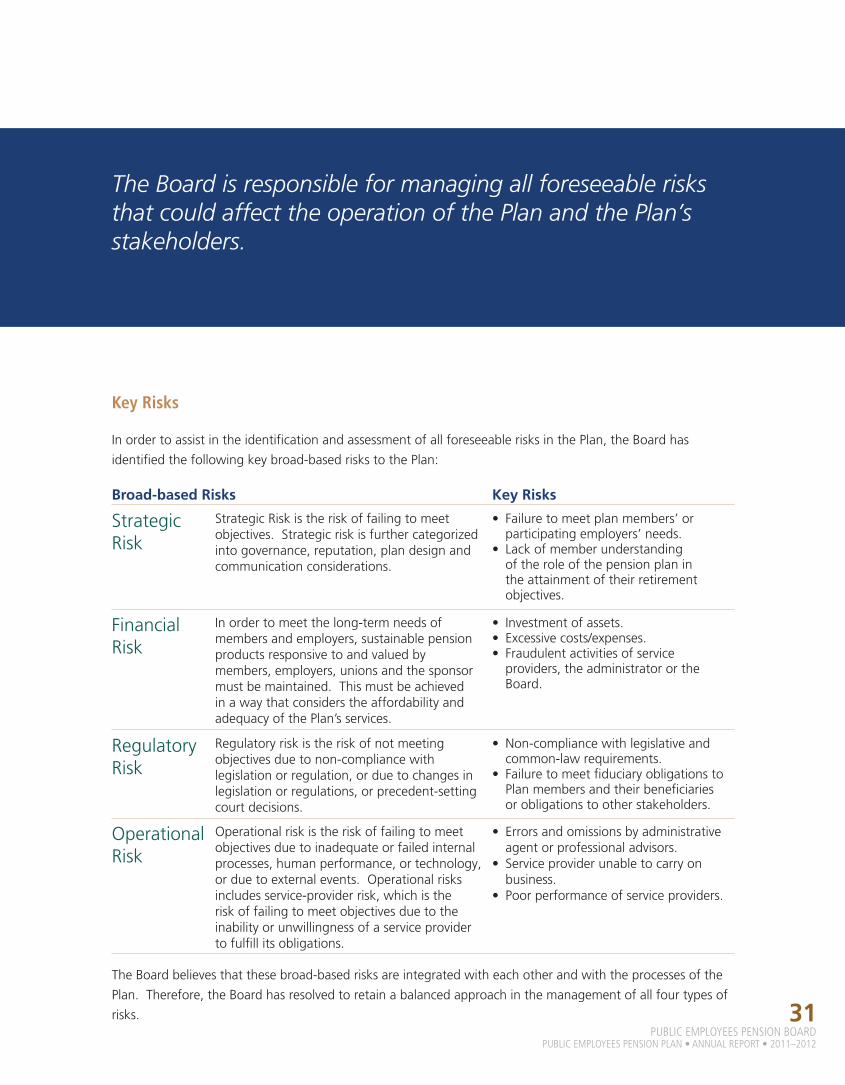
Key Risks
In.order.to.assist.in.the.identification.and.assessment.of.all.foreseeable.risks.in.the.Plan,.the.Board.has.
identified.the.following.key.broad-based.risks.to.the.Plan:
Broad-based Risks Key Risks
Strategic..Risk
Strategic.Risk.is.the.risk.of.failing.to.meet.objectives...Strategic.risk.is.further.categorized.into.governance,.reputation,.plan.design.and.communication.considerations.
•. Failure.to.meet.plan.members’.or.participating.employers’.needs.
•. Lack.of.member.understanding.of.the.role.of.the.pension.plan.in.the.attainment.of.their.retirement.objectives.
Financial..Risk
In.order.to.meet.the.long-term.needs.of.members.and.employers,.sustainable.pension.products.responsive.to.and.valued.by.members,.employers,.unions.and.the.sponsor.must.be.maintained...This.must.be.achieved.in.a.way.that.considers.the.affordability.and.adequacy.of.the.Plan’s.services.
•. Investment.of.assets.•. Excessive.costs/expenses.•. Fraudulent.activities.of.service.providers,.the.administrator.or.the.Board.
Regulatory..Risk
Regulatory.risk.is.the.risk.of.not.meeting.objectives.due.to.non-compliance.with.legislation.or.regulation,.or.due.to.changes.in.legislation.or.regulations,.or.precedent-setting.court.decisions.
•. Non-compliance.with.legislative.and.common-law.requirements.
•. Failure.to.meet.fiduciary.obligations.to.Plan.members.and.their.beneficiaries.or.obligations.to.other.stakeholders.
Operational.Risk
Operational.risk.is.the.risk.of.failing.to.meet.objectives.due.to.inadequate.or.failed.internal.processes,.human.performance,.or.technology,.or.due.to.external.events...Operational.risks.includes.service-provider.risk,.which.is.the.risk.of.failing.to.meet.objectives.due.to.the.inability.or.unwillingness.of.a.service.provider.to.fulfill.its.obligations.
•. Errors.and.omissions.by.administrative.agent.or.professional.advisors.
•. Service.provider.unable.to.carry.on.business.
•. Poor.performance.of.service.providers.
The.Board.believes.that.these.broad-based.risks.are.integrated.with.each.other.and.with.the.processes.of.the.
Plan...Therefore,.the.Board.has.resolved.to.retain.a.balanced.approach.in.the.management.of.all.four.types.of.
risks.
32PUBLIC EMPLOYEES PENSION BOARDPUBLIC EMPLOYEES PENSION PLAN • ANNUAL REPORT • 2011–2012
RISK MANAGEMENT
The.Board.has.developed.and.implemented.these.strategies.and.ongoing.business.
practices.to.manage.the.following.risks:
•. The.Board.implemented.a.Statement.of.Investment.Policies.and.Goals.(SIP&G).
that.outlines.the.Board’s.investment.beliefs.and.provides.for.risk.management.
through.diversification.of.asset.classes,.capital.markets.and.investment.
managers.
The.SIP&G.defines.the.benchmark.to.which.investment.performance.is.
measured....The.Board.annually.reviews.the.SIP&G.
The.Board.communicates.investment.performance.
Independent.monitoring.is.carried.out.by:
.– PEBA;
.– Mercer.(Canada).Ltd.;
.– RBC.Dexia.Investor.Services;.and
.– custodians.of.pooled.funds.used.by.the.Board.
•. The.Board.ensures.initiatives.and.Plan-related.activities.are.adequately.funded.
through.its.budgeting.process.
•. The.Board.receives.a.report.comparing.the.administrative.costs.for..
public-sector.pension.plans,.including.other.public-sector.defined.
contribution.pension.plans,.annually.
•. The.Board.reviews.the.performance.standards.for.the.Board’s.administrator.quarterly,.investment.consultant.annually,.investment.managers.quarterly,.and.custodian.semi-annually.
•. The.Board.annually.evaluates.the.performance.of.the.executive.management.services.provided.by.its.administrator.
•. The.Board.requires.that.service.providers.confirm.that.they.maintain.disaster.recovery.plans.and.adhere.to.a.code.of.conduct.
•. There.are.two.levels.of.audit:
.– The.Board.retains.Deloitte.&.Touche.LLP.to.conduct.an.audit.of.the.Plan..
.– The.Provincial.Auditor.reports.to.the.Legislative.Assembly.regarding.the.
audit.of.the.Plan.
•. The.Board.has.an.Acquisition.and.Retention.of.Services.policy.that.details.
how.the.Board.is.to.retain.and.evaluate.service.providers.
The Board has developed and implemented strategies and ongoing business practices to manage risk.

33PUBLIC EMPLOYEES PENSION BOARD
PUBLIC EMPLOYEES PENSION PLAN • ANNUAL REPORT • 2011–2012
•. The.Board’s.administrator.reviews.and.reports.
compliance.with.legislative.requirements.
annually.
•. The.Periodic.Checklist.is.a.list.of.major.items.
identified.by.the.Board.that.are.necessary.for.
the.administration.of.a.pension.plan...The.
checklist.allows.verification.that.an.activity.
has.been.carried.out...The.completed.Periodic.
Checklist.is.provided.to.the.Board.on.a..
semi-annual.basis..
•. Board.members.are.required.to.review.and.sign.
the.Board’s.Code.of.Conduct.and.Conflict.of.
Interest.Procedures.at.least.annually.
•. The.Board.has.outlined.the.education.required.
to.aid.Board.members.in.executing.their.
fiduciary.and.governance.duties.
•. The.Board.formally.reviews.its.Strategic.Business.
Plan.on.a.periodic.basis.
•. The.Board.regularly.consults.with.legal.counsel.
and.outside.advisors.regarding.issues.on.which.
it.is.deliberating.
•. The.Board.retains.service.providers.who.are.
experts.in.the.responsibilities.to.which.they.are.
assigned.with.respect.to.the.Plan.
•. PEBA.staff.provides.retirement.information.
seminars.and.individual.information.to.Plan.
members.
•. Information.tools.include.member.and.employer.
seminars,.employer.bulletins.and.guides,.
website.information,.and.written.materials.
•. The.Board.consults.with.Plan.members.and.
participating.employers.on.a.regular.basis.to.
determine.their.needs.
34PUBLIC EMPLOYEES PENSION BOARDPUBLIC EMPLOYEES PENSION PLAN • ANNUAL REPORT • 2011–2012
RISK MANAGEMENT
Activities Accomplished in 2011-2012
Board review of the Plan’s investment options and how these options fit with the Plan’s investment objectives.
•. The.Board.reviewed.and.amended.its.investment.policy.in.April.2011.
•. The.Board.has.completed.a.strategic.initiative.to.review.the.investment.options.provided.to.members.of.
the.Plan.and.has.approved.several.measures.intended.to.improve.member.outcomes.
Periodic evaluation by the Board’s administrator of the performance of the auditor, investment consultant and
custodian.
•. The.Board.reviewed.the.performance.of.its.auditor.in.October.2011...The.Board.reviewed.the.
performance.of.its.custodian.in.September.2011.and.January.2012...The.Board.reviewed.the.
performance.of.its.investment.consultant.in.March.2012...The.evaluations.found.the.performance.of.all.
service.providers.to.be.satisfactory.
The Board will continue to receive quarterly updates comparing actual expenditures versus budgeted
amounts.
•. The.Board.received.quarterly.updates.on.its.budget.for.the.periods.ending.June,.September,.and.
December.2011,.and.March.2012.
The Board’s auditor will audit PEBA’s reporting of performance measures to the Board.
•. The.Plan’s.auditor,.Deloitte.and.Touche.LLP.(Deloitte),.reported.to.the.Board.in.June.2011.on.its.audit.
of.the.administrator’s.reporting.of.its.performance.of.administration.tasks.as.it.compared.to.the.service.
standards...No.exceptions.were.reported.
•. In.November.2011,.the.Board.decided.that.this.audit.is.no.longer.necessary.and.will.not.conduct.it.in.the.
future.unless.circumstances.warrant.it.
The completed Periodic Checklist will be provided to the Board on a semi-annual basis.
•. PEBA.provided.the.Board.with.the.final.Periodic.Checklist.for.2010-2011.in.May.2011.and.the.interim.
Periodic.Checklist.for.the.first.six.months.of.2011-2012.in.November.2011.
35PUBLIC EMPLOYEES PENSION BOARD
PUBLIC EMPLOYEES PENSION PLAN • ANNUAL REPORT • 2011–2012
Other Activities Accomplished in 2011-2012
• PEBA.enhanced.its.systems.and.processes.for.investment.fund.monitoring.and.
unit.value.validation.in.2011-2012.
• PEBA.engaged.an.audit.firm.in.2011-2012.to.design.an.audit.program.for.PEBA’s.
unit.value.processes...The.purpose.of.the.audit.is.to.assure.the.Board.that.PEBA’s.
processes.for.the.calculation.of.PEPP.daily.unit.values.are.appropriate.and.may.be.
relied.upon.
Activities Planned for 2012-2013
•. The.Board.will.oversee.the.implementation.of.the.changes.it.directed.be.made.to.
the.Plan’s.investment.options.
•. The.Board.will.continue.to.periodically.evaluate.the.performance.of.its.auditor,.
investment.consultant,.and.custodian.
•. The.Board.will.continue.to.receive.quarterly.updates.comparing.actual.
expenditures.versus.budgeted.amounts.
•. The.completed.Periodic.Checklist.will.be.provided.to.the.Board.on.a.semi-annual.
basis.
•. Work.will.continue.in.2012-2013.on.the.audit.program.for.PEBA’s.unit.value.
processes.in.order.to.ensure.that.PEBA’s.processes.are.appropriate.and.may.be.
relied.upon...PEBA.will.report.to.the.Board.regarding.the.findings.of.the.audit.
The Board will oversee the
implementation of changes it directed to be made to the Plan’s investment
options.
36PUBLIC EMPLOYEES PENSION BOARDPUBLIC EMPLOYEES PENSION PLAN • ANNUAL REPORT • 2011–2012
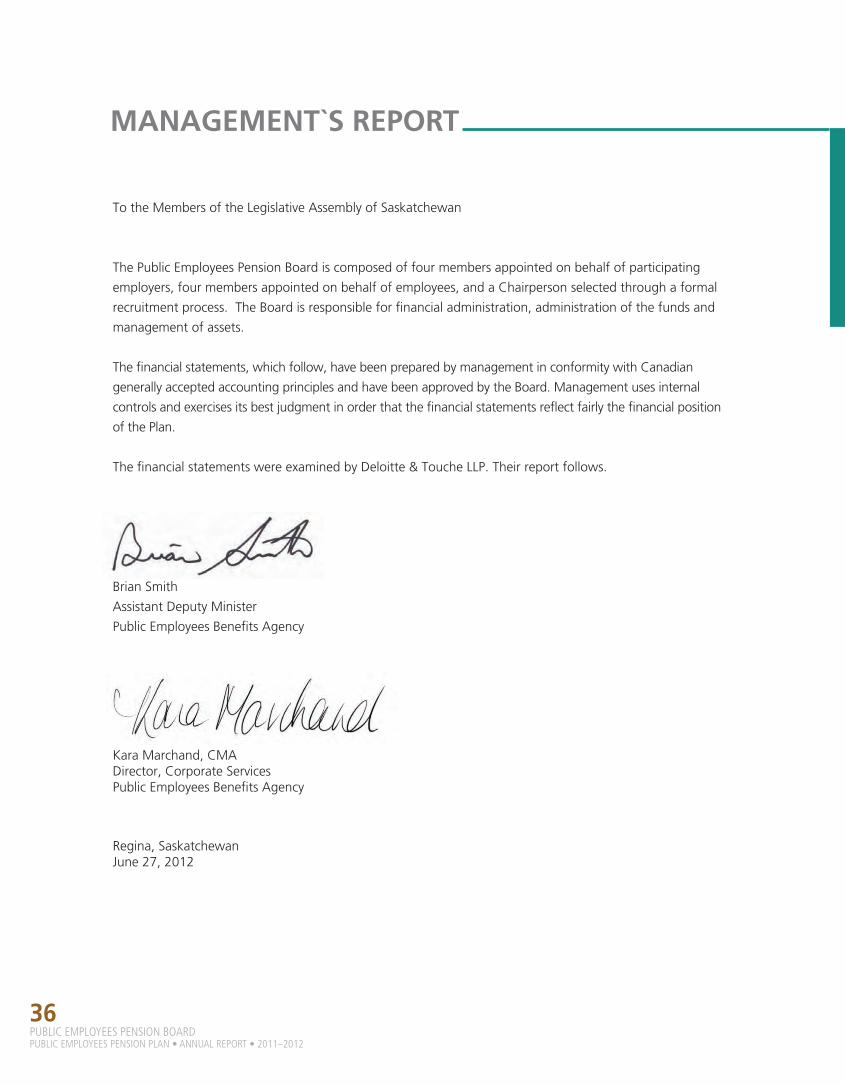
MANAGEMENT`S REPORT
To.the.Members.of.the.Legislative.Assembly.of.Saskatchewan
The.Public.Employees.Pension.Board.is.composed.of.four.members.appointed.on.behalf.of.participating.
employers,.four.members.appointed.on.behalf.of.employees,.and.a.Chairperson.selected.through.a.formal.
recruitment.process...The.Board.is.responsible.for.financial.administration,.administration.of.the.funds.and.
management.of.assets.
The.financial.statements,.which.follow,.have.been.prepared.by.management.in.conformity.with.Canadian.
generally.accepted.accounting.principles.and.have.been.approved.by.the.Board..Management.uses.internal.
controls.and.exercises.its.best.judgment.in.order.that.the.financial.statements.reflect.fairly.the.financial.position.
of.the.Plan.
The.financial.statements.were.examined.by.Deloitte.&.Touche.LLP..Their.report.follows.
Brian.Smith........................................................................................................
Assistant.Deputy.Minister..................................................................................
Public.Employees.Benefits.Agency...
Regina,.Saskatchewan.............................................................................................June.27,.2012...........
Kara.Marchand,.CMADirector,.Corporate.ServicesPublic.Employees.Benefits.Agency

37PUBLIC EMPLOYEES PENSION BOARD
PUBLIC EMPLOYEES PENSION PLAN • ANNUAL REPORT • 2011–2012
PUBLIC EMPLOYEES PENSION BOARD
PUBLIC EMPLOYEES PENSION PLAN
FINANCIAL STATEMENTS (as.at.March.31,.2012)
Public Employees Pension (PEPP) Plan.Member
38PUBLIC EMPLOYEES PENSION BOARDPUBLIC EMPLOYEES PENSION PLAN • ANNUAL REPORT • 2011–2012
To the Members of the Legislative Assembly of Saskatchewan:
We have audited the accompanying financial statements of the Public Employees Pension Plan, which comprise the statements of financial position as at March 31, 2012 and March 31, 2011, and the statements of changes in net assets available for benefits for the years then ended, and a summary of significant accounting policies and other explanatory information.
Management’s Responsibility for the Financial Statements
Management is responsible for the preparation and fair presentation of these financial statements in accordance with Canadian accounting standards for pension plans, and for such internal control as management determines is necessary to enable the preparation of financial statements that are free from material misstatement, whether due to fraud or error.
Auditor’s Responsibility
Our responsibility is to express an opinion on these financial statements based on our audits. We conducted our audits in accordance with Canadian generally accepted auditing standards. Those standards require that we comply with ethical requirements and plan and perform the audit to obtain reasonable assurance about whether the financial statements are free from material misstatement.
An audit involves performing procedures to obtain audit evidence about the amounts and disclosures in the financial statements. The procedures selected depend on the auditor’s judgment, including the assessment of the risks of material misstatement of the financial statements, whether due to fraud or error. In making those risk assessments, the auditor considers internal control relevant to the entity’s preparation and fair presentation of the financial statements in order to design audit procedures that are appropriate in the circumstances, but not for the purpose of expressing an opinion on the effectiveness of the entity’s internal control. An audit also includes evaluating the appropriateness of accounting policies used and the reasonableness of accounting estimates made by management, as well as evaluating the overall presentation of the financial statements.
We believe that the audit evidence we have obtained in our audits is sufficient and appropriate to provide a basis for our audit opinion.
Opinion
In our opinion, the financial statements present fairly, in all material respects, the financial position of Public Employees Pension Plan as at March 31, 2012, and March 31, 2011 and the changes in net assets available for benefits for the years then ended in accordance with Canadian accounting standards for pension plans.
Chartered Accountants June 27, 2012 Regina, Saskatchewan
INDEPENDENT AUDITOR’S REPORT

39PUBLIC EMPLOYEES PENSION BOARD
PUBLIC EMPLOYEES PENSION PLAN • ANNUAL REPORT • 2011–2012
Public Employees Pension Plan Statement 1Statement of Financial Position
March 31 March 31 April 12012 2011 2010
(Note 3g)ASSETS
Investments (Note 4)Short‐term 36,328$ 34,769$ 26,265$ Bonds and debentures 778,759 552,196 534,090 Equities 1,420,294 1,526,467 1,370,009 Pooled funds 2,418,771 2,305,623 2,100,752 Real estate ‐ ‐ 5,742 Investments under securities lending program 391,188 458,099 303,607
5,045,340 4,877,154 4,340,465 ReceivablesContributions receivable ‐ employee 1,923 2,578 2,540 Contributions receivable ‐ employer 1,990 2,656 3,067 Accrued investment income 8,749 8,176 8,361
12,662 13,410 13,968
Cash 38,965 30,919 40,029 Due from General Revenue Fund (Note 7) 4,564 2,175 1,855 Total assets 5,101,531 4,923,658 4,396,317
LIABILITIESAdministrative expenses payable 6,001 4,117 2,350 Refunds, transfers and other payables 1,227 3,211 1,268 Total liabilities 7,228 7,328 3,618
NET ASSETS AVAILABLE FOR BENEFITS 5,094,303$ 4,916,330$ 4,392,699$
(See accompanying notes to the financial statements)(See Schedule 1 for Statement of Financial Position by Investment Option)
(in thousands)
FINANCIAL STATEMENTS
40PUBLIC EMPLOYEES PENSION BOARDPUBLIC EMPLOYEES PENSION PLAN • ANNUAL REPORT • 2011–2012
FINANCIAL STATEMENTS
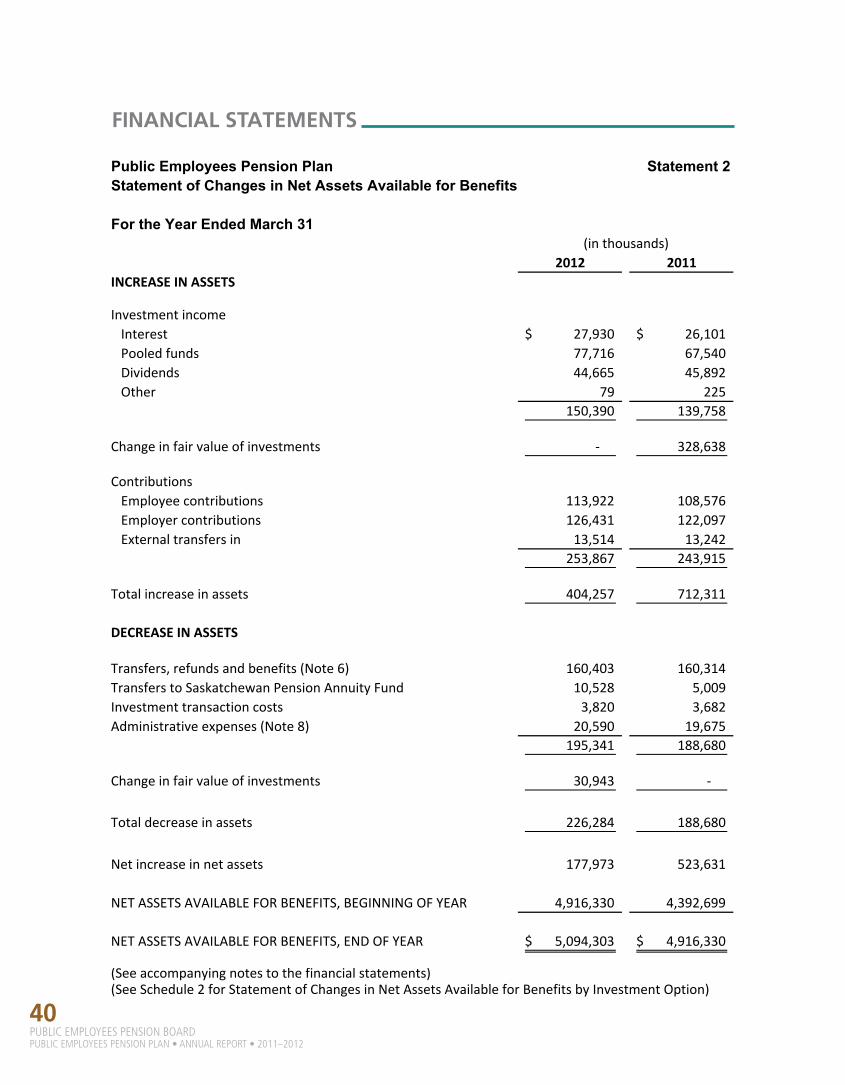
Public Employees Pension Plan Statement 2Statement of Changes in Net Assets Available for Benefits
For the Year Ended March 31
2012 2011INCREASE IN ASSETS
Investment incomeInterest 27,930$ 26,101$ Pooled funds 77,716 67,540 Dividends 44,665 45,892 Other 79 225
150,390 139,758
Change in fair value of investments ‐ 328,638
ContributionsEmployee contributions 113,922 108,576 Employer contributions 126,431 122,097 External transfers in 13,514 13,242
253,867 243,915
Total increase in assets 404,257 712,311
DECREASE IN ASSETS
Transfers, refunds and benefits (Note 6) 160,403 160,314 Transfers to Saskatchewan Pension Annuity Fund 10,528 5,009 Investment transaction costs 3,820 3,682 Administrative expenses (Note 8) 20,590 19,675
195,341 188,680
Change in fair value of investments 30,943 ‐
Total decrease in assets 226,284 188,680
Net increase in net assets 177,973 523,631
NET ASSETS AVAILABLE FOR BENEFITS, BEGINNING OF YEAR 4,916,330 4,392,699
NET ASSETS AVAILABLE FOR BENEFITS, END OF YEAR 5,094,303$ 4,916,330$
(See accompanying notes to the financial statements)(See Schedule 2 for Statement of Changes in Net Assets Available for Benefits by Investment Option)
(in thousands)

41PUBLIC EMPLOYEES PENSION BOARD
PUBLIC EMPLOYEES PENSION PLAN • ANNUAL REPORT • 2011–2012
Public Employees Pension Plan Notes to the Financial Statements
March 31, 2012
1. Description of Plan
The following description of the Public Employees Pension Plan is a summary only. For more complete information, reference should be made to the Plan text.
a) General
The Public Employees Pension Plan Act (the “Act”) is the legislative authority for the Public Employees Pension Plan (the “Plan”) which is domiciled in Regina, Saskatchewan, and which is a defined contribution plan that covers the employees of a number of government entities. Effective September 1, 2002, the Plan also covers the Members of the Legislative Assembly.
The Act established the Plan to accumulate all contributions and earnings for plan members. The Plan consists of five asset allocation Funds: the Accelerated Growth Fund; the Growth Fund; the Balanced Fund; the Moderate Fund; the Conservative Fund; one lifecycle Fund: the PEPP Steps Fund; and the Short-term Bond Fund.
All Funds receive and hold, in trust for members, contributions from the members and employers (“participants”) and investment income derived from the Plan’s investments.
All Funds hold varying percentages of bonds, equities, real estate, mortgages, pooled funds, short-term investments and derivative financial instruments. The asset mix of each fund is established based on the expected volatility of the underlying securities and assets. The Accelerated Growth Fund is considered the most volatile and contains the highest percentage of equities relative to fixed income investments of all the funds. The Short-term Bond Fund is considered the least volatile and contains the lowest percentage of equities relative to fixed income investments.
Effective November 1, 2007, members of PEPP may choose either one of the five asset allocation funds or the PEPP Steps Fund. In addition, each member may also choose the Short-term Bond Fund.
The Plan uses a unitized method of plan participation whereby each member has a certain number of units of ownership in the net assets of the investment funds. Investment income including changes in the market value of the investments and expenses is reflected in the market value of the net asset value per unit of participation. The total available to a member upon termination or retirement is equal to the particular member's account balance at that date, subject to certain vesting and other specific rules governing the Plan.
The Plan introduced a Variable Pension Benefit option (“VPB”) in May 2006 whereby retired members could elect to withdraw all or some of their pension funds either through lump-sum withdrawals or scheduled monthly payments. Members who participate in the VPB may choose to invest in any of the funds which are offered by the Plan.
NOTES TO THE FINANCIAL STATEMENTS
42PUBLIC EMPLOYEES PENSION BOARDPUBLIC EMPLOYEES PENSION PLAN • ANNUAL REPORT • 2011–2012
b) Administration
The Act established the Public Employees Pension Board (“Pension Board”) to administer the Plan. The Pension Board is comprised of nine members: four are appointed on behalf of participating employers, four on behalf of employees. The Board conducts an external recruitment process to choose a Chair, who is appointed for a three-year term. The Public Employees Benefits Agency (“PEBA”) is under contract with the Board to provide day-to-day administration.
c) Retirement
Members may retire as early as age 50.
Upon retirement a member may choose to receive a VPB from the Plan or to purchase an annuity from the Saskatchewan Pension Annuity Fund or from a private company that issues annuities.
Alternatively, the funds may be left in the Plan to continue to accumulate earnings to provide retirement income beginning no later than the end of the calendar year in which the member reaches age 71, be transferred to a Locked-in Retirement Account or, after age 50, to a Locked-in Retirement Income Fund, Life Income Fund or a Life Annuity from the Saskatchewan Pension Annuity Fund, or be transferred to another pension plan which has a reciprocal agreement with the Plan.
Members who elect to receive a VPB retain their account balances within the Plan. Those members who purchase their annuities from the Saskatchewan Pension Annuity Fund have their accumulated balance in the Plan at the date of retirement transferred to the Saskatchewan Pension Annuity Fund.
A VPB is a periodic payment made from a registered plan to a member of that plan and which must conform to certain minimum payment requirements but not to any maximum payment requirements.
d) Completeness of Contributions
Participants are responsible for the accuracy and completeness of member contributions remitted to the Plan. Accordingly, these financial statements presume the accuracy and completeness of the participants' contributions.
2. Basis of Preparation
a) Statement of Compliance
The financial statements for the year ended March 31, 2012 have been prepared in accordance with Canadian accounting standards for pension plans as defined in the Canadian Institute of Chartered Accountants (“CICA”) Handbook section 4600, Pension Plans. For matters not addressed in Section 4600, International Financial Reporting Standards (“IFRSs”) have been followed.
The plan was previously prepared in accordance with CICA Handbook section 4100 and while there are differences between these sections, there were no differences that affected the financial position of the Plan.
These financial statements were authorized and issued by the Board on June 27, 2012.
NOTES TO THE FINANCIAL STATEMENTS
43PUBLIC EMPLOYEES PENSION BOARD
PUBLIC EMPLOYEES PENSION PLAN • ANNUAL REPORT • 2011–2012
b) Functional and Presentation Currency
These financial statements are presented in Canadian Dollars, which is the Plan’s functional currency, and are rounded to the nearest thousand unless otherwise noted.
3. Significant Accounting Policies
The significant accounting policies are as follows:
a) Investments
Investments are classified as held for trading and are stated at fair value. The change in the fair value of investments from the beginning to the end of each year is reflected in the statement of changes in net assets available for benefits.
Fair value of investments is determined as follows:
Short-term investments are valued at cost which, together with accrued investment income, approximates fair value given the short-term nature of these investments.
Bonds and equities are valued at year-end quoted bid prices from recognized security dealers and accredited stock exchanges on which the security is principally traded.
Pooled fund investments are valued at the unit value supplied by the pooled fund administrator, which represent the underlying net assets of the pooled fund at fair values determined using closing bid prices.
Real estate is valued using market values from independent appraisals. The frequency of real estate appraisals occurs at least semi-annually.
Investments in derivative financial instruments, including futures, forwards and option contracts, are valued at year end quoted market prices where available. Where quoted market prices are not available, values are determined using pricing models, which take into account current market and contractual prices of the underlying instruments, as well as time value and yield curve or volatility factors underlying the position.
Investment transactions are recorded on the trade date.
b) Other Assets and Financial Liabilities
Accounts receivable are classified as loans and receivables and accounts payable are classified as other financial liabilities and are measured at amortized cost. Due to their short-term nature, the amortized cost of these instruments approximates their fair value.
c) Investment Income and Transaction Costs
Investment income, which is recorded on the accrual basis, includes interest income, dividends and real estate operating income. Brokers’ commissions and other transaction costs are recognized in the statement of changes in net assets available for benefits in the period incurred.
44PUBLIC EMPLOYEES PENSION BOARDPUBLIC EMPLOYEES PENSION PLAN • ANNUAL REPORT • 2011–2012
d) Foreign Currency Translation
Monetary items denominated in foreign currency are translated at the exchange rate in effect at year-end. Investments, revenue and expense items are translated at the exchange rate in effect at the transaction date. Gains and losses arising on translation at year-end are included in the change in market value of the investments.
e) Income Taxes
The Plan is a registered pension plan, as defined by the Income Tax Act (Canada) and, accordingly, is not subject to income taxes.
f) Use of Estimates and Judgments
The preparation of financial statements in accordance with Canadian accounting standards for pension plans requires management to make estimates and assumptions that affect the recorded amounts of assets and liabilities and disclosures of contingent assets and liabilities at the date of the financial statement and the recorded amounts of revenue and expenses during the year. Significant items subject to such estimates and assumptions include the valuation of investments. Actual results could differ from these estimates.
g) Adoption of new Accounting Standards
Effective April 1, 2010, the financial statements have been prepared in accordance with Canadian accounting standards for pension plans as outlined in the CICA Handbook, section 4600, Pension Plans. These standards were required to be adopted with retrospective restatement. The transition to the new standards did not require any changes to the prior year figures or the Plan’s accounting policies. The opening statement of financial position in accordance with section 4600 as of April 1, 2010 has been disclosed for comparative purposes.
h) Future Accounting Policy Changes
A number of new standards, amendments to standards and interpretations which become effective for annual periods beginning on or after January 1, 2013 and which may have an impact on the Plan, include: IFRS 9, Financial Instruments; IFRS 12, Disclosure of Interests in Other Entities; and IFRS 13, Fair Value Measurement. The extent of the impact on adoption of these standards is not known at this time, but is not expected to be material.
NOTES TO THE FINANCIAL STATEMENTS

45PUBLIC EMPLOYEES PENSION BOARD
PUBLIC EMPLOYEES PENSION PLAN • ANNUAL REPORT • 2011–2012
4. Investments
The carrying values of the Plan’s investments are as follows:
Security Lending Program
Through its custodian, the Plan participates in an investment security lending program for the purpose of generating fee income. Non-cash collateral of at least 105% of the market value of the loaned securities is retained by the Plan until the loaned securities have been returned (see Securities Collateral note). The market value of the loaned securities is monitored on a daily basis with additional collateral obtained or refunded as the market value of the loaned securities fluctuates. In addition, the custodian provides indemnification against any potential losses in the securities lending program. While in the possession of counterparties, the loaned securities may be resold or re-pledged by such counterparties.
Short-term Investments
Short-term investments are comprised of treasury bills, notes and commercial paper with effective rates of 0.11% to 1.30% (2011 – 0.10% to 1.00%), and an average remaining term to maturity of 66 days (2011 - 75 days).
The Plan's investment policy states that investments must meet a minimum investment standard of "A2/P2" or equivalent rating by a recognized credit rating service.
Other than the Government of Canada, no single issue represents more than 20.78% (2011 – 14.71%) of the market value of the short-term investment portfolio.
2012 2011 April 1, 2010
Short‐term 36,328$ 34,769$ 26,265$ Bonds and debentures 778,759 552,196 534,090 Canadian equities 455,572 578,848 526,571 U.S. equities 410,238 409,310 370,328 Global equities 554,484 538,309 473,110 Short‐term investment pooled fund 176,200 53,383 52,312 Fixed income pooled fund 1,027,990 1,078,803 983,936 Canadian equity pooled fund 219,783 254,245 210,999 U.S. equity pooled funds 470,081 438,984 420,615 Global equity pooled funds 237,332 229,681 212,541 Real estate pooled fund 287,385 250,527 220,349 Real estate ‐ ‐ 5,742
4,654,152$ 4,419,055$ 4,036,858$
Investments under securities lending:Short‐term 1,676$ 1,169$ ‐$ Bonds and debentures 78,519 113,513 50,041 Canadian equities 146,891 116,833 85,686 U.S. equities 54,513 88,133 45,311 Global equities 109,589 138,451 122,569
391,188$ 458,099$ 303,607$
(in thousands)
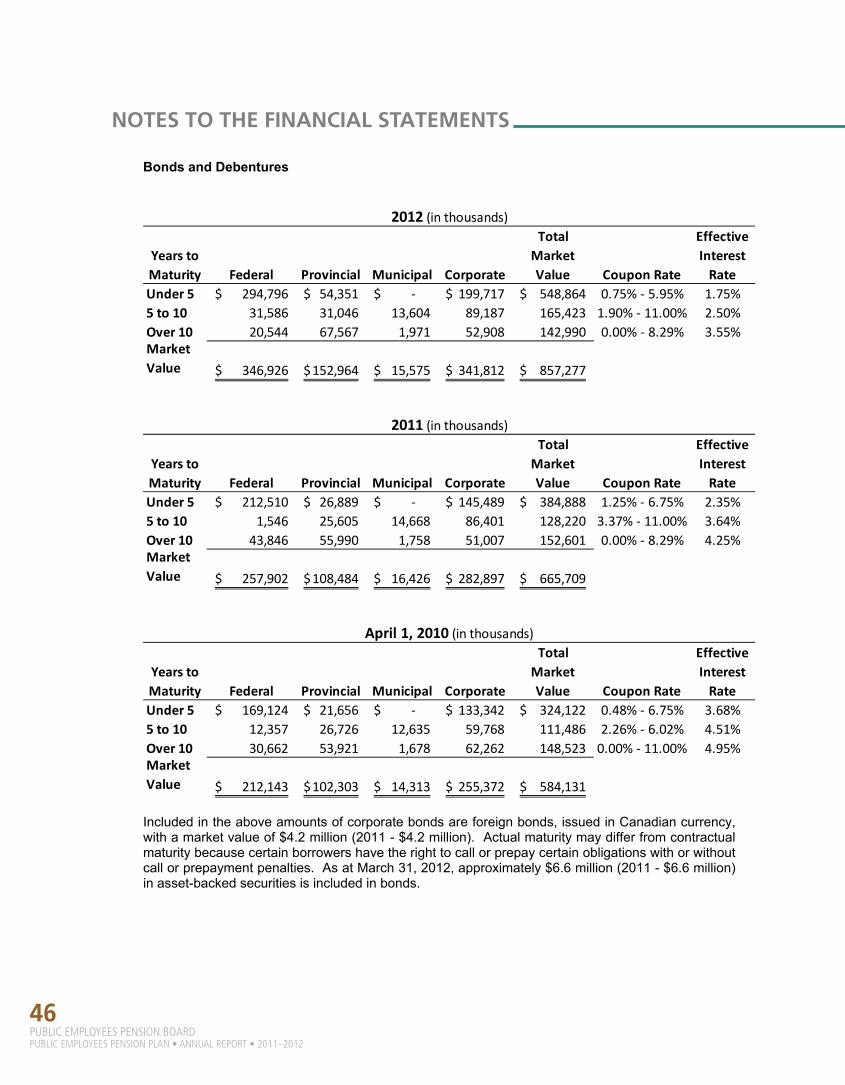
46PUBLIC EMPLOYEES PENSION BOARDPUBLIC EMPLOYEES PENSION PLAN • ANNUAL REPORT • 2011–2012
Bonds and Debentures
Included in the above amounts of corporate bonds are foreign bonds, issued in Canadian currency, with a market value of $4.2 million (2011 - $4.2 million). Actual maturity may differ from contractual maturity because certain borrowers have the right to call or prepay certain obligations with or without call or prepayment penalties. As at March 31, 2012, approximately $6.6 million (2011 - $6.6 million) in asset-backed securities is included in bonds.
Years to Maturity Federal Provincial Municipal Corporate
Total Market Value Coupon Rate
Effective Interest Rate
Under 5 294,796$ 54,351$ ‐$ 199,717$ 548,864$ 0.75% ‐ 5.95% 1.75%5 to 10 31,586 31,046 13,604 89,187 165,423 1.90% ‐ 11.00% 2.50%Over 10 20,544 67,567 1,971 52,908 142,990 0.00% ‐ 8.29% 3.55%Market Value 346,926$ 152,964$ 15,575$ 341,812$ 857,277$
2012 (in thousands)
Years to Maturity Federal Provincial Municipal Corporate
Total Market Value Coupon Rate
Effective Interest Rate
Under 5 212,510$ 26,889$ ‐$ 145,489$ 384,888$ 1.25% ‐ 6.75% 2.35%5 to 10 1,546 25,605 14,668 86,401 128,220 3.37% ‐ 11.00% 3.64%Over 10 43,846 55,990 1,758 51,007 152,601 0.00% ‐ 8.29% 4.25%Market Value 257,902$ 108,484$ 16,426$ 282,897$ 665,709$
2011 (in thousands)
Years to Maturity Federal Provincial Municipal Corporate
Total Market Value Coupon Rate
Effective Interest Rate
Under 5 169,124$ 21,656$ ‐$ 133,342$ 324,122$ 0.48% ‐ 6.75% 3.68%5 to 10 12,357 26,726 12,635 59,768 111,486 2.26% ‐ 6.02% 4.51%Over 10 30,662 53,921 1,678 62,262 148,523 0.00% ‐ 11.00% 4.95%Market Value 212,143$ 102,303$ 14,313$ 255,372$ 584,131$
April 1, 2010 (in thousands)
NOTES TO THE FINANCIAL STATEMENTS
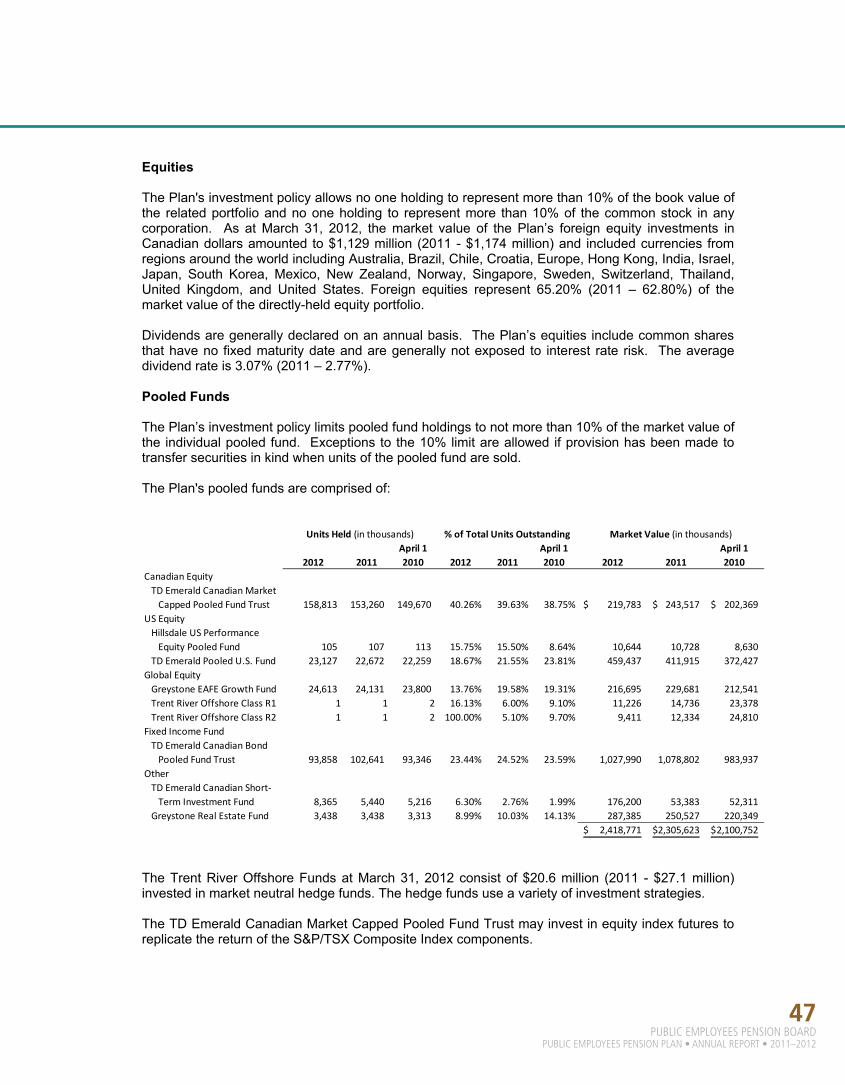
47PUBLIC EMPLOYEES PENSION BOARD
PUBLIC EMPLOYEES PENSION PLAN • ANNUAL REPORT • 2011–2012
Equities
The Plan's investment policy allows no one holding to represent more than 10% of the book value of the related portfolio and no one holding to represent more than 10% of the common stock in any corporation. As at March 31, 2012, the market value of the Plan’s foreign equity investments in Canadian dollars amounted to $1,129 million (2011 - $1,174 million) and included currencies from regions around the world including Australia, Brazil, Chile, Croatia, Europe, Hong Kong, India, Israel, Japan, South Korea, Mexico, New Zealand, Norway, Singapore, Sweden, Switzerland, Thailand, United Kingdom, and United States. Foreign equities represent 65.20% (2011 – 62.80%) of the market value of the directly-held equity portfolio.
Dividends are generally declared on an annual basis. The Plan’s equities include common shares that have no fixed maturity date and are generally not exposed to interest rate risk. The average dividend rate is 3.07% (2011 – 2.77%).
Pooled Funds
The Plan’s investment policy limits pooled fund holdings to not more than 10% of the market value of the individual pooled fund. Exceptions to the 10% limit are allowed if provision has been made to transfer securities in kind when units of the pooled fund are sold.
The Plan's pooled funds are comprised of:
The Trent River Offshore Funds at March 31, 2012 consist of $20.6 million (2011 - $27.1 million) invested in market neutral hedge funds. The hedge funds use a variety of investment strategies.
The TD Emerald Canadian Market Capped Pooled Fund Trust may invest in equity index futures to replicate the return of the S&P/TSX Composite Index components.
2012 2011April 1 2010 2012 2011
April 1 2010 2012 2011
April 1 2010
Canadian EquityTD Emerald Canadian Market Capped Pooled Fund Trust 158,813 153,260 149,670 40.26% 39.63% 38.75% 219,783$ 243,517$ 202,369$
US EquityHillsdale US Performance Equity Pooled Fund 105 107 113 15.75% 15.50% 8.64% 10,644 10,728 8,630
TD Emerald Pooled U.S. Fund 23,127 22,672 22,259 18.67% 21.55% 23.81% 459,437 411,915 372,427 Global EquityGreystone EAFE Growth Fund 24,613 24,131 23,800 13.76% 19.58% 19.31% 216,695 229,681 212,541 Trent River Offshore Class R1 1 1 2 16.13% 6.00% 9.10% 11,226 14,736 23,378 Trent River Offshore Class R2 1 1 2 100.00% 5.10% 9.70% 9,411 12,334 24,810
Fixed Income FundTD Emerald Canadian Bond Pooled Fund Trust 93,858 102,641 93,346 23.44% 24.52% 23.59% 1,027,990 1,078,802 983,937
OtherTD Emerald Canadian Short‐Term Investment Fund 8,365 5,440 5,216 6.30% 2.76% 1.99% 176,200 53,383 52,311
Greystone Real Estate Fund 3,438 3,438 3,313 8.99% 10.03% 14.13% 287,385 250,527 220,349 2,418,771$ 2,305,623$ 2,100,752$
Units Held (in thousands) % of Total Units Outstanding Market Value (in thousands)

48PUBLIC EMPLOYEES PENSION BOARDPUBLIC EMPLOYEES PENSION PLAN • ANNUAL REPORT • 2011–2012
The TD Emerald Pooled U.S. Fund may invest in equity index futures to replicate the return of the S&P 500 Composite Index components.
The TD Emerald Canadian Bond Pooled Fund Trust may not invest in any derivative investments.
The Hillsdale US Performance Equity Pooled Fund may utilize forward contracts, swaps, futures contracts, options and other investments to hedge against currency or to achieve its investment objectives.
The TD Emerald Canadian Short Term Investment Fund may use derivatives such as options, futures, forward contracts and swaps provided the reasons for use are consistent with the Fund’s objectives and strategies. The Fund does not use derivatives for speculative trading or to create a portfolio with excess leverage.
The Greystone EAFE Growth Fund may invest in futures contracts, forward contracts, or other derivatives provided the reasons for doing so are consistent with the investment objectives of the pooled fund.
Investments in real estate consist of Canadian commercial property held directly by the Greystone Real Estate Fund. The market appraisals used in valuing the real estate involves various assumptions. Changes in the underlying assumptions will have an impact on the market value of the investments.
Fair Value
The Plan has classified its fair valued financial instrument holdings using a hierarchy that reflects the significance of the inputs used in determining their measurements.
Under the classification structure, financial instruments recorded at unadjusted quoted prices in active markets for identical assets and liabilities are classified as Level 1. Instruments valued using inputs other than quoted prices that are observable for the asset or liability either directly or indirectly are classified as Level 2. Instruments values using inputs that are not based on observable market data are classified as Level 3.
The following table classifies the Plan’s required financial instruments within a fair value hierarchy:
Level 1 Level 2 Level 3 TotalBonds and debentures ‐$ 850,703$ 6,574$ 857,277$ Pooled funds ‐ 2,131,386 287,379 2,418,765 Short‐term 38,004 ‐ ‐ 38,004 Real estate ‐ ‐ 6 6 Equities 1,723,995 7,293 ‐ 1,731,288 Total 1,761,999$ 2,989,382$ 293,959$ 5,045,340$
2012 (in thousands)
NOTES TO THE FINANCIAL STATEMENTS

49PUBLIC EMPLOYEES PENSION BOARD
PUBLIC EMPLOYEES PENSION PLAN • ANNUAL REPORT • 2011–2012
Real Estate Fund
Asset‐Backed Bonds Total
Balance at April 1 250,527$ 6,574$ 257,101$ Net purchases and sales (25) ‐ (25) Gains (losses)Realized 25 ‐ 25 Unrealized 36,858 ‐ 36,858
Balance at March 31 287,385$ 6,574$ 293,959$
Level 1 Level 2 Level 3 TotalBonds and debentures ‐$ 659,135$ 6,574$ 665,709$ Pooled funds ‐ 2,055,096 250,519 2,305,615 Short‐term 35,938 ‐ ‐ 35,938 Real estate ‐ ‐ 8 8 Equities 1,868,647 1,237 ‐ 1,869,884 Total 1,904,585$ 2,715,468$ 257,101$ 4,877,154$
Real Estate Fund
Asset‐Backed Bonds Total
Balance at April 1 226,091$ 6,574$ 232,665$ Net purchases and sales 2,524 ‐ 2,524 Gains (losses)Realized 590 ‐ 590 Unrealized 21,322 ‐ 21,322
Balance at March 31 250,527$ 6,574$ 257,101$
Level 1 Level 2 Level 3 TotalBonds and debentures ‐$ 577,557$ 6,574$ 584,131$ Pooled funds ‐ 1,880,403 220,349 2,100,752 Short‐term 26,265 ‐ ‐ 26,265 Real estate ‐ ‐ 5,742 5,742 Equities 1,599,159 24,416 ‐ 1,623,575 Total 1,625,424$ 2,482,376$ 232,665$ 4,340,465$
2011 (in thousands)
April 1, 2010 (in thousands)
2012 Fair Value measurement using level 3 inputs
2011 Fair Value measurement using level 3 inputs

50PUBLIC EMPLOYEES PENSION BOARDPUBLIC EMPLOYEES PENSION PLAN • ANNUAL REPORT • 2011–2012
NOTES TO THE FINANCIAL STATEMENTS
Real Estate Fund
Asset‐Backed Bonds Total
Balance at April 1 259,413$ ‐$ 259,413$ Net purchases and sales (39,180) 6,574 (32,606) Gains (losses)Realized 60,253 ‐ 60,253 Unrealized (54,395) ‐ (54,395)
Balance at March 31 226,091$ 6,574$ 232,665$
2010 Fair Value measurement using level 3 inputs
5. Derivatives
Derivative financial instruments are financial contracts whose values are derived from changes in underlying assets, interest or currency exchange rates. The Plan objective is to achieve an overall Plan duration that approximates the duration of the Plan liabilities on a going-concern basis.
At March 31, 2012 the Plan held the following derivatives:
Future / Forward Contracts
The Plan has entered into foreign exchange forward contracts to hedge some of its foreign currency exposure in foreign equity pooled funds. Foreign exchange forward contracts are obligations in which two counterparties agree to exchange one currency for another at a specified price for settlement on a predetermined date in the future.
The Non North American Equity mandate managed by Tweedy Browne Company LLC and the US Equity mandate managed by BlackRock Asset Management Company Ltd. include currency hedging programs to reduce the impact of foreign currency changes on the Plan. It is the intention of both these managers to hedge 100% of the foreign currency and so the net exposure of the Plan to these foreign currency changes should be 0%. Forward contracts are used to hedge the foreign currency exposure within the mandate as indicated in the following table.
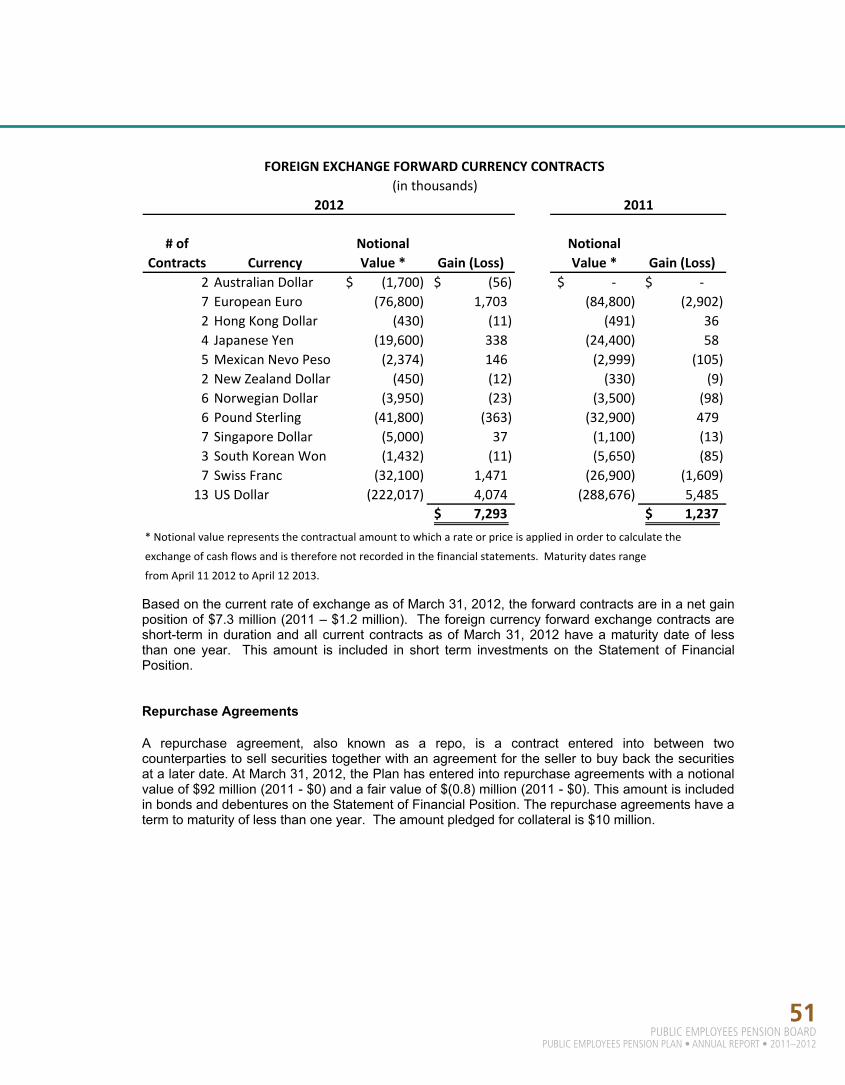
51PUBLIC EMPLOYEES PENSION BOARD
PUBLIC EMPLOYEES PENSION PLAN • ANNUAL REPORT • 2011–2012
Based on the current rate of exchange as of March 31, 2012, the forward contracts are in a net gain position of $7.3 million (2011 – $1.2 million). The foreign currency forward exchange contracts are short-term in duration and all current contracts as of March 31, 2012 have a maturity date of less than one year. This amount is included in short term investments on the Statement of Financial Position.
Repurchase Agreements
A repurchase agreement, also known as a repo, is a contract entered into between two counterparties to sell securities together with an agreement for the seller to buy back the securities at a later date. At March 31, 2012, the Plan has entered into repurchase agreements with a notional value of $92 million (2011 - $0) and a fair value of $(0.8) million (2011 - $0). This amount is included in bonds and debentures on the Statement of Financial Position. The repurchase agreements have a term to maturity of less than one year. The amount pledged for collateral is $10 million.
# of Contracts Currency
Notional Value * Gain (Loss)
Notional Value * Gain (Loss)
2 Australian Dollar (1,700)$ (56)$ ‐$ ‐$ 7 European Euro (76,800) 1,703 (84,800) (2,902) 2 Hong Kong Dollar (430) (11) (491) 36 4 Japanese Yen (19,600) 338 (24,400) 58 5 Mexican Nevo Peso (2,374) 146 (2,999) (105) 2 New Zealand Dollar (450) (12) (330) (9) 6 Norwegian Dollar (3,950) (23) (3,500) (98) 6 Pound Sterling (41,800) (363) (32,900) 479 7 Singapore Dollar (5,000) 37 (1,100) (13) 3 South Korean Won (1,432) (11) (5,650) (85) 7 Swiss Franc (32,100) 1,471 (26,900) (1,609)
13 US Dollar (222,017) 4,074 (288,676) 5,485 7,293$ 1,237$
* Notional value represents the contractual amount to which a rate or price is applied in order to calculate the
exchange of cash flows and is therefore not recorded in the financial statements. Maturity dates range
from April 11 2012 to April 12 2013.
2012 2011
FOREIGN EXCHANGE FORWARD CURRENCY CONTRACTS(in thousands)

52PUBLIC EMPLOYEES PENSION BOARDPUBLIC EMPLOYEES PENSION PLAN • ANNUAL REPORT • 2011–2012
6. Transfers, Refunds and Benefits
(thousands of dollars) 2012 2011
Termination refunds Death and lump sum benefits Variable pension benefits Marital transfers Transfers to registered retirement savings plans and to private companies providing annuities Transfers out
$ 4,429 10,267 46,083
1,337
95,642 2,645
$ 5,678 5,822
38,306 1,845
103,914 4,749
$160,403 $160,314
7. Due from General Revenue Fund
The Plan's bank accounts are included in the Consolidated Offset Bank Concentration arrangement for the Government of Saskatchewan.
The Plan's earned interest is calculated and paid by the General Revenue Fund on a quarterly basis to the Plan's bank accounts using the Government's 30 day borrowing rate and the Plan's average bank account balance. The Government’s average 30 day borrowing rate in 2012 was 1.05% (2011 – 0.80%).
8. Administration Expenses
The annual operating expenditures associated with the Plan's administration are paid to the Public Employees Benefits Agency Revolving Fund except for custodial fees and investment management fees, which are paid directly.
(thousands of dollars) 2012 2011
Budget Actual Budget Actual
Audit fees Administration costs Custodial fees Investment management fees
(unaudited) $ 43
7,0391,335
11,762
$ 43 6,480 1,477
12,590
(unaudited) $ 40
6,309 1,500
10,265
$ 41 5,962 1,497
12,175 $20,179 $20,590 $18,114 $19,675
NOTES TO THE FINANCIAL STATEMENTS

53PUBLIC EMPLOYEES PENSION BOARD
PUBLIC EMPLOYEES PENSION PLAN • ANNUAL REPORT • 2011–2012
9. Financial Risk Management
The nature of the Plan’s operations results in a statement of financial position that consists primarily of financial instruments. The risks that arise are credit risk, market risk (consisting of interest rate risk, foreign exchange risk and equity price risk) and liquidity risk.
Significant financial risks are related to the Plan’s investments. These financial risks are managed by having an investment policy, which is approved annually by the Board. The investment policy provides guidelines to the Plan’s investments managers for the asset mix of the portfolio regarding quality and quantity of fixed term investments, real estate and equity investments. The asset mix helps to reduce the impact of market value fluctuations by requiring investments in different asset classes and in domestic and foreign markets. Derivatives are allowed within the Plan to hedge against losses and substitute for direct investment. The Board’s policy prevents the use of derivatives for speculative trading or to create a portfolio with leverage. PEBA reviews and reports on regular compliance reports from its investment managers and custodian as to their compliance with the investment policy. PEBA also reviews and reports on regular compliance reports from its custodian as to the investment managers’ compliance with the investment policy.
Credit risk
Credit risk is the risk that one party does not pay funds owed to another party. The Plan’s credit risk arises primarily from two distinct sources: accounts receivable and certain investments. The maximum credit risk to which it is exposed at March 31, 2012 is limited to the carrying value of the financial assets summarized as follows:
Accounts receivable are primarily made up of employee and employer contributions receivable and accrued investment income. Employee and employer contributions receivable are generally received in less than 30 days. Accrued investment income is received on the next scheduled payment date, generally either annually or semi-annually.
Credit risk within investments is primarily related to short-term investments, bonds and debentures, and the fixed income pooled funds. It is managed through the investment policy that limits fixed term investments to those of high credit quality (minimum rating for bonds, BBB, and for short-term investments is A2/P2) along with limits to the maximum notional amount of exposure with respect to any one issuer.
2012 2011 April 1, 2010
Cash 38,965$ 30,919$ 40,029$ Accounts receivable 12,662 13,410 13,968 Fixed income investments * 2,099,471 1,833,832 1,646,644 Due from the General Revenue Fund 4,564 2,175 1,855
* includes short‐term investments , TD Emerald Canadian Short‐Term Investment Fund,
bonds and debentures , and the fixed income pooled fund.
(in thousands)2012 2011 April 1, 2010
Cash 38,965$ 30,919$ 40,029$ Accounts receivable 12,662 13,410 13,968 Fixed income investments * 2,099,471 1,833,832 1,646,644 Due from the General Revenue Fund 4,564 2,175 1,855
* includes short‐term investments, TD Emerald Canadian Short‐Term Investment Fund,
bonds and debentures, and the fixed income pooled fund.
(in thousands)
9. Financial Risk Management
The nature of the Plan’s operations results in a statement of financial position that consists primarily of financial instruments. The risks that arise are credit risk, market risk (consisting of interest rate risk, foreign exchange risk and equity price risk) and liquidity risk.
Significant financial risks are related to the Plan’s investments. These financial risks are managed by having an investment policy, which is approved annually by the Board. The investment policy provides guidelines to the Plan’s investments managers for the asset mix of the portfolio regarding quality and quantity of fixed term investments, real estate and equity investments. The asset mix helps to reduce the impact of market value fluctuations by requiring investments in different asset classes and in domestic and foreign markets. Derivatives are allowed within the Plan to hedge against losses and substitute for direct investment. The Board’s policy prevents the use of derivatives for speculative trading or to create a portfolio with leverage. PEBA reviews and reports on regular compliance reports from its investment managers and custodian as to their compliance with the investment policy. PEBA also reviews and reports on regular compliance reports from its custodian as to the investment managers’ compliance with the investment policy.
Credit risk
Credit risk is the risk that one party does not pay funds owed to another party. The Plan’s credit risk arises primarily from two distinct sources: accounts receivable and certain investments. The maximum credit risk to which it is exposed at March 31, 2012 is limited to the carrying value of the financial assets summarized as follows:
Accounts receivable are primarily made up of employee and employer contributions receivable and accrued investment income. Employee and employer contributions receivable are generally received in less than 30 days. Accrued investment income is received on the next scheduled payment date, generally either annually or semi-annually.
Credit risk within investments is primarily related to short-term investments, bonds and debentures, and the fixed income pooled funds. It is managed through the investment policy that limits fixed term investments to those of high credit quality (minimum rating for bonds, BBB, and for short-term investments is A2/P2) along with limits to the maximum notional amount of exposure with respect to any one issuer.
2012 2011 April 1, 2010
Cash 38,965$ 30,919$ 40,029$ Accounts receivable 12,662 13,410 13,968 Fixed income investments * 2,099,471 1,833,832 1,646,644 Due from the General Revenue Fund 4,564 2,175 1,855
* includes short‐term investments , TD Emerald Canadian Short‐Term Investment Fund,
bonds and debentures , and the fixed income pooled fund.
(in thousands)
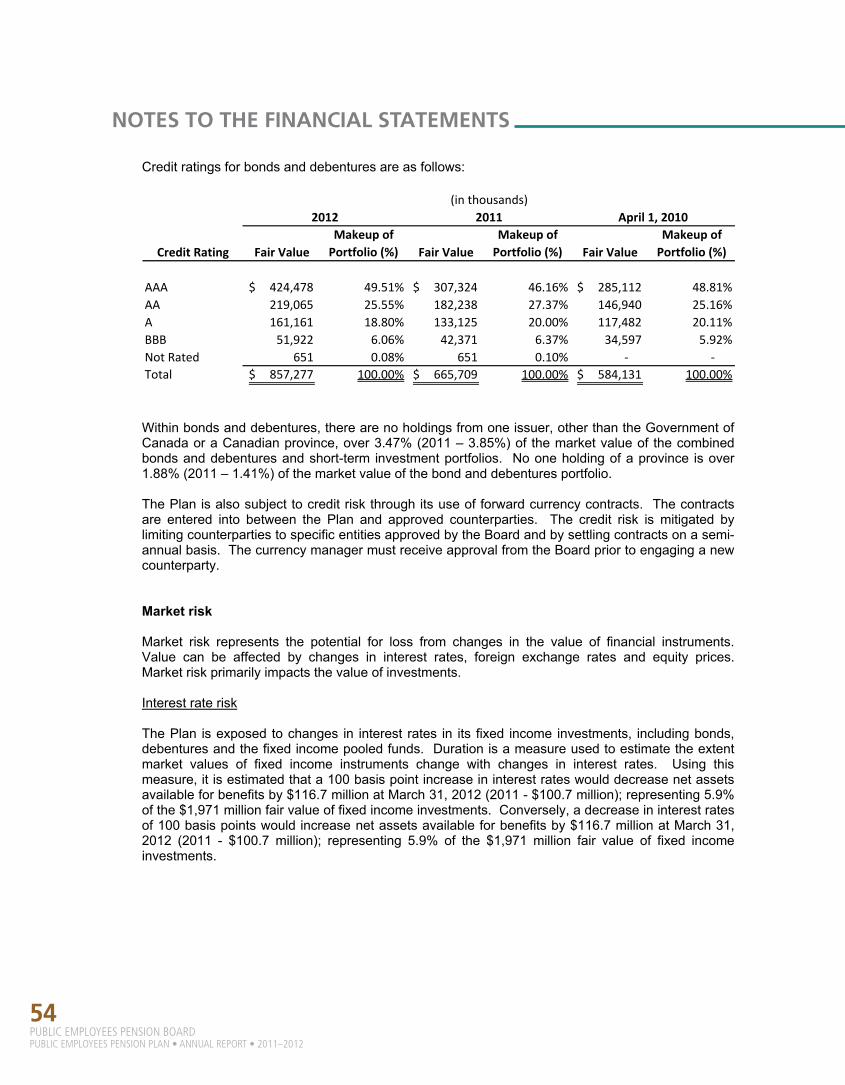
54PUBLIC EMPLOYEES PENSION BOARDPUBLIC EMPLOYEES PENSION PLAN • ANNUAL REPORT • 2011–2012
Credit ratings for bonds and debentures are as follows:
Within bonds and debentures, there are no holdings from one issuer, other than the Government of Canada or a Canadian province, over 3.47% (2011 – 3.85%) of the market value of the combined bonds and debentures and short-term investment portfolios. No one holding of a province is over 1.88% (2011 – 1.41%) of the market value of the bond and debentures portfolio.
The Plan is also subject to credit risk through its use of forward currency contracts. The contracts are entered into between the Plan and approved counterparties. The credit risk is mitigated by limiting counterparties to specific entities approved by the Board and by settling contracts on a semi-annual basis. The currency manager must receive approval from the Board prior to engaging a new counterparty.
Market risk
Market risk represents the potential for loss from changes in the value of financial instruments. Value can be affected by changes in interest rates, foreign exchange rates and equity prices. Market risk primarily impacts the value of investments.
Interest rate risk
The Plan is exposed to changes in interest rates in its fixed income investments, including bonds, debentures and the fixed income pooled funds. Duration is a measure used to estimate the extent market values of fixed income instruments change with changes in interest rates. Using this measure, it is estimated that a 100 basis point increase in interest rates would decrease net assets available for benefits by $116.7 million at March 31, 2012 (2011 - $100.7 million); representing 5.9% of the $1,971 million fair value of fixed income investments. Conversely, a decrease in interest rates of 100 basis points would increase net assets available for benefits by $116.7 million at March 31, 2012 (2011 - $100.7 million); representing 5.9% of the $1,971 million fair value of fixed income investments.
Credit Rating Fair ValueMakeup of Portfolio (%) Fair Value
Makeup of Portfolio (%) Fair Value
Makeup of Portfolio (%)
AAA 424,478$ 49.51% 307,324$ 46.16% 285,112$ 48.81%AA 219,065 25.55% 182,238 27.37% 146,940 25.16%A 161,161 18.80% 133,125 20.00% 117,482 20.11%BBB 51,922 6.06% 42,371 6.37% 34,597 5.92%Not Rated 651 0.08% 651 0.10% ‐ ‐ Total 857,277$ 100.00% 665,709$ 100.00% 584,131$ 100.00%
2012 2011 April 1, 2010(in thousands)
NOTES TO THE FINANCIAL STATEMENTS
Credit Rating Fair ValueMakeup of Portfolio (%) Fair Value
Makeup of Portfolio (%) Fair Value
Makeup of Portfolio (%)
AAA 424,478$ 49.51% 307,324$ 46.16% 285,112$ 48.81%AA 219,065 25.55% 182,238 27.37% 146,940 25.16%A 161,161 18.80% 133,125 20.00% 117,482 20.11%BBB 51,922 6.06% 42,371 6.37% 34,597 5.92%Not Rated 651 0.08% 651 0.10% ‐ ‐ Total 857,277$ 100.00% 665,709$ 100.00% 584,131$ 100.00%
2012 2011 April 1, 2010(in thousands)
Credit ratings for bonds and debentures are as follows:
Within bonds and debentures, there are no holdings from one issuer, other than the Government of Canada or a Canadian province, over 3.47% (2011 – 3.85%) of the market value of the combined bonds and debentures and short-term investment portfolios. No one holding of a province is over 1.88% (2011 – 1.41%) of the market value of the bond and debentures portfolio.
The Plan is also subject to credit risk through its use of forward currency contracts. The contracts are entered into between the Plan and approved counterparties. The credit risk is mitigated by limiting counterparties to specific entities approved by the Board and by settling contracts on a semi-annual basis. The currency manager must receive approval from the Board prior to engaging a new counterparty.
Market risk
Market risk represents the potential for loss from changes in the value of financial instruments. Value can be affected by changes in interest rates, foreign exchange rates and equity prices. Market risk primarily impacts the value of investments.
Interest rate risk
The Plan is exposed to changes in interest rates in its fixed income investments, including bonds, debentures and the fixed income pooled funds. Duration is a measure used to estimate the extent market values of fixed income instruments change with changes in interest rates. Using this measure, it is estimated that a 100 basis point increase in interest rates would decrease net assets available for benefits by $116.7 million at March 31, 2012 (2011 - $100.7 million); representing 5.9% of the $1,971 million fair value of fixed income investments. Conversely, a decrease in interest rates of 100 basis points would increase net assets available for benefits by $116.7 million at March 31, 2012 (2011 - $100.7 million); representing 5.9% of the $1,971 million fair value of fixed income investments.
Credit Rating Fair ValueMakeup of Portfolio (%) Fair Value
Makeup of Portfolio (%) Fair Value
Makeup of Portfolio (%)
AAA 424,478$ 49.51% 307,324$ 46.16% 285,112$ 48.81%AA 219,065 25.55% 182,238 27.37% 146,940 25.16%A 161,161 18.80% 133,125 20.00% 117,482 20.11%BBB 51,922 6.06% 42,371 6.37% 34,597 5.92%Not Rated 651 0.08% 651 0.10% ‐ ‐ Total 857,277$ 100.00% 665,709$ 100.00% 584,131$ 100.00%
2012 2011 April 1, 2010(in thousands)
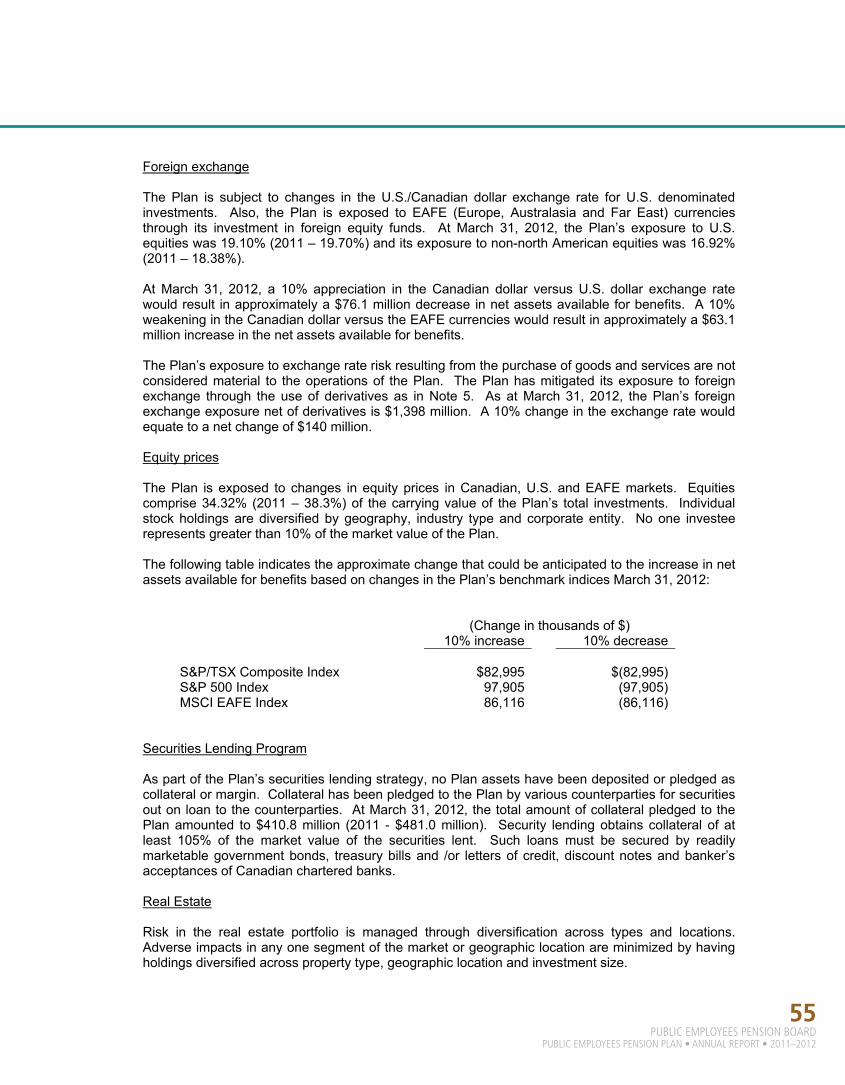
55PUBLIC EMPLOYEES PENSION BOARD
PUBLIC EMPLOYEES PENSION PLAN • ANNUAL REPORT • 2011–2012
Foreign exchange
The Plan is subject to changes in the U.S./Canadian dollar exchange rate for U.S. denominated investments. Also, the Plan is exposed to EAFE (Europe, Australasia and Far East) currencies through its investment in foreign equity funds. At March 31, 2012, the Plan’s exposure to U.S. equities was 19.10% (2011 – 19.70%) and its exposure to non-north American equities was 16.92% (2011 – 18.38%).
At March 31, 2012, a 10% appreciation in the Canadian dollar versus U.S. dollar exchange rate would result in approximately a $76.1 million decrease in net assets available for benefits. A 10% weakening in the Canadian dollar versus the EAFE currencies would result in approximately a $63.1 million increase in the net assets available for benefits.
The Plan’s exposure to exchange rate risk resulting from the purchase of goods and services are not considered material to the operations of the Plan. The Plan has mitigated its exposure to foreign exchange through the use of derivatives as in Note 5. As at March 31, 2012, the Plan’s foreign exchange exposure net of derivatives is $1,398 million. A 10% change in the exchange rate would equate to a net change of $140 million.
Equity prices
The Plan is exposed to changes in equity prices in Canadian, U.S. and EAFE markets. Equities comprise 34.32% (2011 – 38.3%) of the carrying value of the Plan’s total investments. Individual stock holdings are diversified by geography, industry type and corporate entity. No one investee represents greater than 10% of the market value of the Plan.
The following table indicates the approximate change that could be anticipated to the increase in net assets available for benefits based on changes in the Plan’s benchmark indices March 31, 2012:
(Change in thousands of $) 10% increase 10% decrease
S&P/TSX Composite Index $82,995 $(82,995) S&P 500 Index 97,905 (97,905) MSCI EAFE Index 86,116 (86,116)
Securities Lending Program
As part of the Plan’s securities lending strategy, no Plan assets have been deposited or pledged as collateral or margin. Collateral has been pledged to the Plan by various counterparties for securities out on loan to the counterparties. At March 31, 2012, the total amount of collateral pledged to the Plan amounted to $410.8 million (2011 - $481.0 million). Security lending obtains collateral of at least 105% of the market value of the securities lent. Such loans must be secured by readily marketable government bonds, treasury bills and /or letters of credit, discount notes and banker’s acceptances of Canadian chartered banks.
Real Estate
Risk in the real estate portfolio is managed through diversification across types and locations. Adverse impacts in any one segment of the market or geographic location are minimized by having holdings diversified across property type, geographic location and investment size.

56PUBLIC EMPLOYEES PENSION BOARDPUBLIC EMPLOYEES PENSION PLAN • ANNUAL REPORT • 2011–2012
Liquidity risk
Liquidity risk is the risk that the Plan is unable to meet its financial obligations as they fall due. Cash resources are managed on a daily basis based on anticipated cash flows.
10. Related Party Transactions
All Government of Saskatchewan agencies such as ministries, corporations, boards and commissions are related since all are controlled by the Government. Also, the Plan is related to non-crown enterprises that the Government jointly owns or significantly influences. Costs charged by the Public Employees Benefits Agency Revolving Fund in administering the Plan are reflected in these financial statements.
The Plan holds $10.1 million (2011 - $13.6 million) Province of Saskatchewan Bonds and Debentures with a yield of 4.46% (2011 – 4.82%). Investment income including change in market value of $1.1 million (2011 - $0.9 million) was recorded from the Province of Saskatchewan Bonds and Debentures.
The Plan has an accounts payable balance as at March 31, 2012 of $0.9 million (2011 - $0.7 million) due to the Public Employees Benefits Agency Revolving Fund.
Other related party transactions are disclosed separately in these financial statements.
Account balances resulting from the above transactions are included in the statement of net assets available for benefits and are settled at agreed upon exchange rates.
11. Capital Management
The Plan receives new capital from employee and employer contributions. The Plan also benefits from income and market value increases on its invested capital. The Plan’s capital is invested in a number of asset classes including equities, bonds and debentures, real estate, pooled funds, and short-term investments. The Board has delegated the operational investment decisions to a number of different investment management firms through a number of different investment mandates as defined in the Plan’s Statement of Investment Policy and Procedures.
12. Fair Value of Financial Assets and Liabilities
For the following financial assets and liabilities the carrying amount approximates fair value due to their immediate or short-term maturity:
a) contributions receivable b) accrued investment income c) due from General Revenue Fund
d) administrative expenses payable e) refunds, transfers and other payables
The fair value of investments is disclosed in Note 4.
NOTES TO THE FINANCIAL STATEMENTS

57PUBLIC EMPLOYEES PENSION BOARD
PUBLIC EMPLOYEES PENSION PLAN • ANNUAL REPORT • 2011–2012
13. Comparative Figures
Certain prior year balances have been reclassified to conform with the current year’s financial statement presentation
14. Value and Performance of Members’ Accounts
In accordance with Canadian accounting standards for pension plans, various accruals are included in the Statement of Financial Position. However, only transactions that were processed and unitized during the fiscal year ending March 31, 2012 are reflected in the unitized account balances of members at year-end. The total value of members’ unitized accounts at March 31, 2012 was $5,083 million (2011 – $4,909 million).
Investment income including changes in the market value of the investments (investment performance) and expenses is reflected in the market value of the net asset value per unit of participation and is determined daily. Investment and administration expenses relating to each Fund are accrued to or paid from the Fund prior to establishing its daily unit price. The Funds’ unit price will increase or decrease according to the Funds’ investment performance after expenses.
Fund transactions are processed using forward pricing. This means they are processed at the next unit price set after the Plan receives contributions or requests for transfers, refunds and benefits.
Fund transactions may be suspended temporarily at management’s discretion where an accurate unit price for a Fund cannot be determined due to the unavailability of reliable market pricing or other asset valuations.
On November 1, 2007, the Plan introduced a new fund structure whereby members may choose either one of the five asset allocation Funds or the PEPP Steps Fund. In addition, each member may also choose the Short-term Bond Fund. The PEPP Steps Fund is comprised of twelve separate Funds, five of which are the asset allocation Funds. In all, there are thirteen separate Funds.
The following table shows some selected data for each of the Funds:
UnitsNet asset value
per unitTotal net
assets (000's) Return %PEPP Step 1 (Accelerated Growth Fund) 1,346,317 96.5692 130,013$ ‐1.2%PEPP Step 2 75,959 100.6379 7,644 ‐0.5%PEPP Step 3 (Growth Fund) 1,953,623 102.239 199,736 0.5%PEPP Step 4 245,452 104.1951 25,575 1.1%PEPP Step 5 (Balanced Fund) 29,676,516 129.3786 3,839,507 1.9%PEPP Step 6 219,415 109.4881 24,023 2.4%PEPP Step 7 315,426 112.166 35,380 3.0%PEPP Step 8 (Moderate Fund) 1,616,586 113.3145 183,183 3.5%PEPP Step 9 503,730 114.9013 57,879 4.1%PEPP Step 10 305,072 117.5567 35,863 4.5%PEPP Step 11 166,315 116.0627 19,303 4.6%PEPP Step 12 (Conservative Fund) 1,134,031 119.0006 134,950 4.8%Short‐term Bond Fund 2,935,710 132.8921 390,133 4.8%Total Unitized Net Assets 5,083,189$
2012
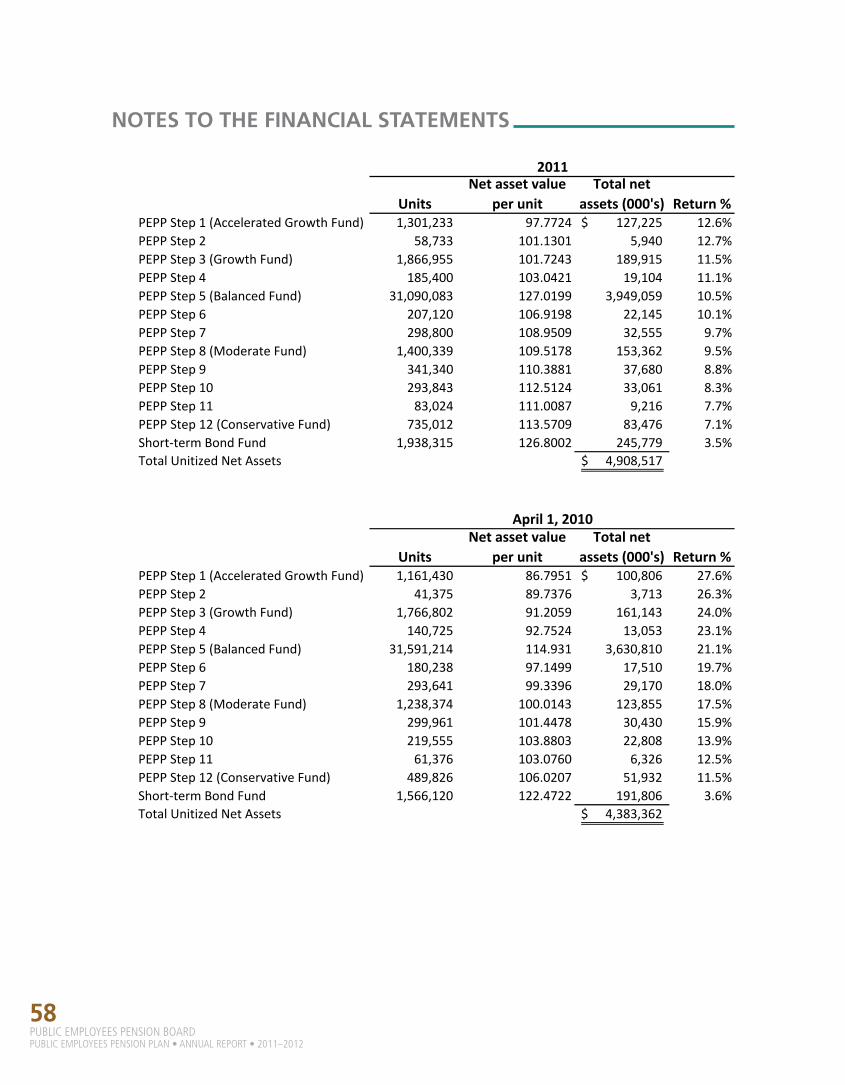
58PUBLIC EMPLOYEES PENSION BOARDPUBLIC EMPLOYEES PENSION PLAN • ANNUAL REPORT • 2011–2012
UnitsNet asset value
per unitTotal net
assets (000's) Return %PEPP Step 1 (Accelerated Growth Fund) 1,301,233 97.7724 127,225$ 12.6%PEPP Step 2 58,733 101.1301 5,940 12.7%PEPP Step 3 (Growth Fund) 1,866,955 101.7243 189,915 11.5%PEPP Step 4 185,400 103.0421 19,104 11.1%PEPP Step 5 (Balanced Fund) 31,090,083 127.0199 3,949,059 10.5%PEPP Step 6 207,120 106.9198 22,145 10.1%PEPP Step 7 298,800 108.9509 32,555 9.7%PEPP Step 8 (Moderate Fund) 1,400,339 109.5178 153,362 9.5%PEPP Step 9 341,340 110.3881 37,680 8.8%PEPP Step 10 293,843 112.5124 33,061 8.3%PEPP Step 11 83,024 111.0087 9,216 7.7%PEPP Step 12 (Conservative Fund) 735,012 113.5709 83,476 7.1%Short‐term Bond Fund 1,938,315 126.8002 245,779 3.5%Total Unitized Net Assets 4,908,517$
UnitsNet asset value
per unitTotal net
assets (000's) Return %PEPP Step 1 (Accelerated Growth Fund) 1,161,430 86.7951 100,806$ 27.6%PEPP Step 2 41,375 89.7376 3,713 26.3%PEPP Step 3 (Growth Fund) 1,766,802 91.2059 161,143 24.0%PEPP Step 4 140,725 92.7524 13,053 23.1%PEPP Step 5 (Balanced Fund) 31,591,214 114.931 3,630,810 21.1%PEPP Step 6 180,238 97.1499 17,510 19.7%PEPP Step 7 293,641 99.3396 29,170 18.0%PEPP Step 8 (Moderate Fund) 1,238,374 100.0143 123,855 17.5%PEPP Step 9 299,961 101.4478 30,430 15.9%PEPP Step 10 219,555 103.8803 22,808 13.9%PEPP Step 11 61,376 103.0760 6,326 12.5%PEPP Step 12 (Conservative Fund) 489,826 106.0207 51,932 11.5%Short‐term Bond Fund 1,566,120 122.4722 191,806 3.6%Total Unitized Net Assets 4,383,362$
2011
April 1, 2010
NOTES TO THE FINANCIAL STATEMENTS
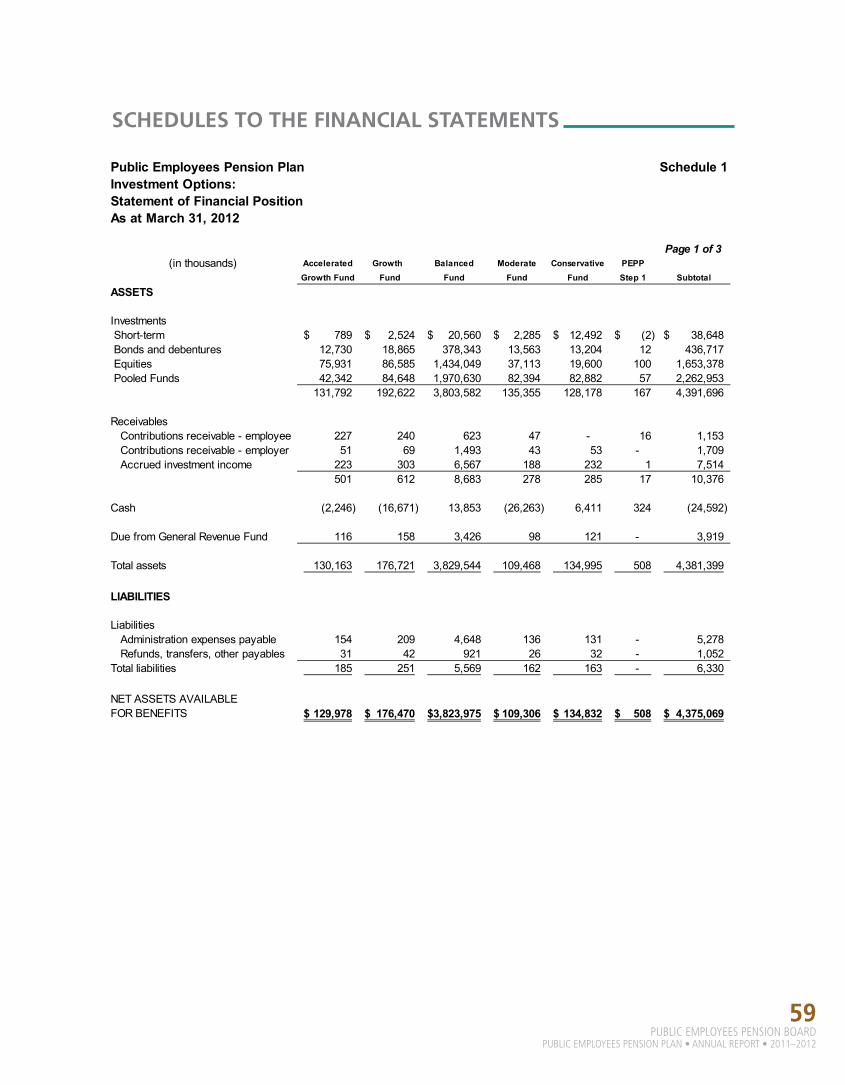
59PUBLIC EMPLOYEES PENSION BOARD
PUBLIC EMPLOYEES PENSION PLAN • ANNUAL REPORT • 2011–2012
SCHEDULES TO THE FINANCIAL STATEMENTS
Public Employees Pension Plan Schedule 1Investment Options:Statement of Financial PositionAs at March 31, 2012
Page 1 of 3(in thousands) Accelerated Growth Balanced Moderate Conservative PEPP
Growth Fund Fund Fund Fund Fund Step 1 Subtotal
ASSETS
Investments Short-term 789$ 2,524$ 20,560$ 2,285$ 12,492$ (2)$ 38,648$ Bonds and debentures 12,730 18,865 378,343 13,563 13,204 12 436,717 Equities 75,931 86,585 1,434,049 37,113 19,600 100 1,653,378 Pooled Funds 42,342 84,648 1,970,630 82,394 82,882 57 2,262,953
131,792 192,622 3,803,582 135,355 128,178 167 4,391,696
ReceivablesContributions receivable - employee 227 240 623 47 - 16 1,153Contributions receivable - employer 51 69 1,493 43 53 - 1,709Accrued investment income 223 303 6,567 188 232 1 7,514
501 612 8,683 278 285 17 10,376
Cash (2,246) (16,671) 13,853 (26,263) 6,411 324 (24,592)
Due from General Revenue Fund 116 158 3,426 98 121 - 3,919
Total assets 130,163 176,721 3,829,544 109,468 134,995 508 4,381,399
LIABILITIES
LiabilitiesAdministration expenses payable 154 209 4,648 136 131 - 5,278Refunds, transfers, other payables 31 42 921 26 32 - 1,052
Total liabilities 185 251 5,569 162 163 - 6,330
NET ASSETS AVAILABLE FOR BENEFITS 129,978$ 176,470$ 3,823,975$ 109,306$ 134,832$ 508$ 4,375,069$

60PUBLIC EMPLOYEES PENSION BOARDPUBLIC EMPLOYEES PENSION PLAN • ANNUAL REPORT • 2011–2012
SCHEDULES TO THE FINANCIAL STATEMENTS
Public Employees Pension Plan Schedule 1Investment Options:Statement of Financial PositionAs at March 31, 2012
Page 2 of 3(in thousands) PEPP PEPP PEPP PEPP PEPP PEPP
Step 2 Step 3 Step 4 Step 5 Step 6 Step 7 Subtotal
ASSETS
Investments Short-term 95$ (214)$ 167$ (297)$ 230$ 263$ 244$ Bonds and debentures 753 811 2,536 843 2,394 3,548 10,885 Equities 3,948 4,048 10,780 3,650 7,735 10,037 40,198 Pooled Funds 2,963 3,825 12,002 5,534 13,299 20,777 58,400
7,759 8,470 25,485 9,730 23,658 34,625 109,727
ReceivablesContributions receivable - employee 131 222 177 136 97 87 850 Contributions receivable - employer 3 9 10 9 9 14 54 Accrued investment income 13 41 44 40 41 61 240
147 272 231 185 147 162 1,144
Cash (117) 15,345 89 13,297 369 757 29,740
Due from General Revenue Fund 7 22 23 21 22 32 127
Total assets 7,796 24,109 25,828 23,233 24,196 35,576 140,738
LIABILITIES
LiabilitiesAdministration expenses payable 8 24 27 30 28 41 158 Refunds, transfers, other payables 2 6 6 6 6 9 35
Total liabilities 10 30 33 36 34 50 193
NET ASSETS AVAILABLE FOR BENEFITS 7,786$ 24,079$ 25,795$ 23,197$ 24,162$ 35,526$ 140,545$
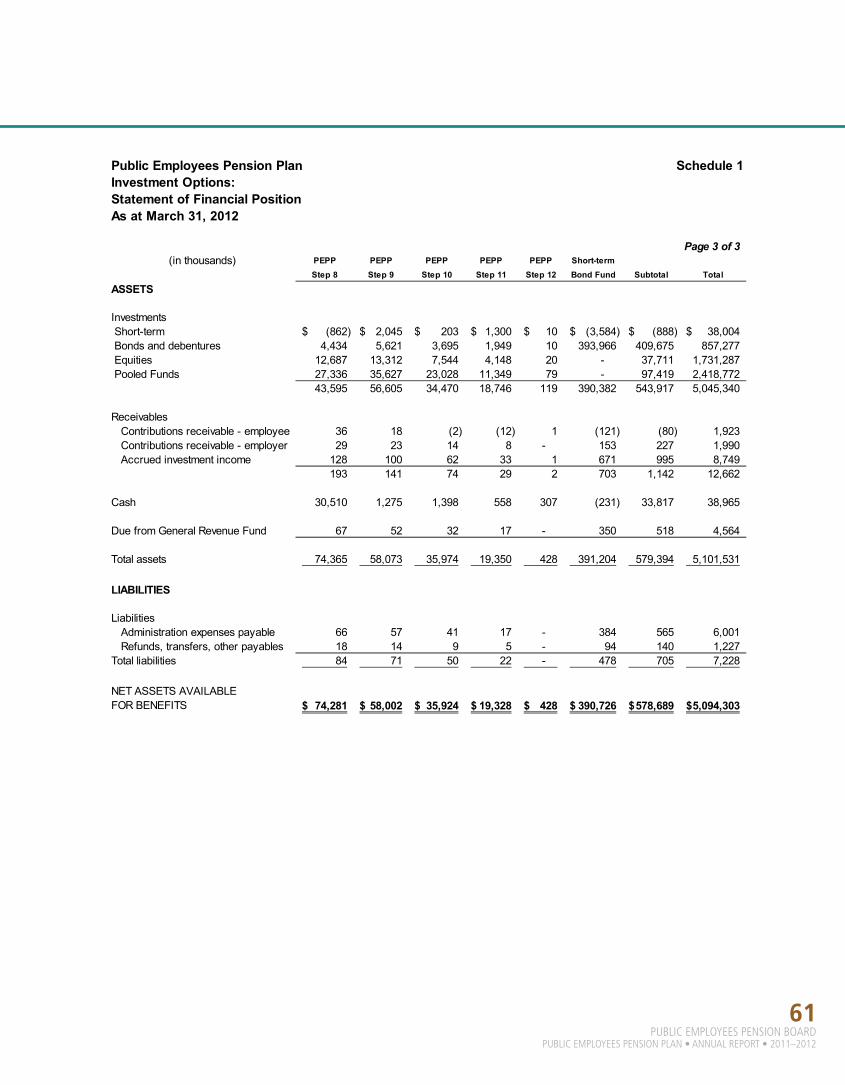
61PUBLIC EMPLOYEES PENSION BOARD
PUBLIC EMPLOYEES PENSION PLAN • ANNUAL REPORT • 2011–2012
Public Employees Pension Plan Schedule 1Investment Options:Statement of Financial PositionAs at March 31, 2012
Page 3 of 3(in thousands) PEPP PEPP PEPP PEPP PEPP Short-term
Step 8 Step 9 Step 10 Step 11 Step 12 Bond Fund Subtotal Total
ASSETS
Investments Short-term (862)$ 2,045$ 203$ 1,300$ 10$ (3,584)$ (888)$ 38,004$ Bonds and debentures 4,434 5,621 3,695 1,949 10 393,966 409,675 857,277 Equities 12,687 13,312 7,544 4,148 20 - 37,711 1,731,287 Pooled Funds 27,336 35,627 23,028 11,349 79 - 97,419 2,418,772
43,595 56,605 34,470 18,746 119 390,382 543,917 5,045,340
ReceivablesContributions receivable - employee 36 18 (2) (12) 1 (121) (80) 1,923 Contributions receivable - employer 29 23 14 8 - 153 227 1,990 Accrued investment income 128 100 62 33 1 671 995 8,749
193 141 74 29 2 703 1,142 12,662
Cash 30,510 1,275 1,398 558 307 (231) 33,817 38,965
Due from General Revenue Fund 67 52 32 17 - 350 518 4,564
Total assets 74,365 58,073 35,974 19,350 428 391,204 579,394 5,101,531
LIABILITIES
LiabilitiesAdministration expenses payable 66 57 41 17 - 384 565 6,001 Refunds, transfers, other payables 18 14 9 5 - 94 140 1,227
Total liabilities 84 71 50 22 - 478 705 7,228
NET ASSETS AVAILABLE FOR BENEFITS 74,281$ 58,002$ 35,924$ 19,328$ 428$ 390,726$ 578,689$ 5,094,303$

62PUBLIC EMPLOYEES PENSION BOARDPUBLIC EMPLOYEES PENSION PLAN • ANNUAL REPORT • 2011–2012
SCHEDULES TO THE FINANCIAL STATEMENTS
Public Employees Pension Plan Schedule 2Investment Options:Statement of Changes in Net Assets Available for BenefitsFor the Year Ended March 31, 2012
Page 1 of 3(in thousands) Accelerated Growth Balanced Moderate Conservative PEPP
Growth Fund Fund Fund Fund Fund Step 1 Subtotal
INCREASE IN ASSETSInvestment income Interest 457$ 681$ 13,912$ 475$ 606$ -$ 16,131$ Pooled funds 532 1,969 63,199 3,039 3,472 1 72,212 Dividends 1,923 2,232 37,603 846 332 2 42,938 Other 5 5 43 3 2 - 58
2,917 4,887 114,757 4,363 4,412 3 131,339
Change in fair value of investments (3,871) (3,868) (31,501) (7,327) 1,601 6 (44,960)
Contributions Employee contributions 4,874 5,716 75,629 2,459 2,050 252 90,980 Employer contributions 5,670 6,546 84,827 2,508 2,204 266 102,021 External transfers in 693 868 9,117 253 257 2 11,190 Interfund transfers net (4,111) (5,410) (231,257) 10,474 50,357 (383) (180,330)
7,126 7,720 (61,684) 15,694 54,868 137 23,861
Total increase in assets 6,172 8,739 21,572 12,730 60,881 146 110,240
DECREASE IN ASSETSTransfers, refunds and benefits 2,615 3,278 108,678 3,940 7,987 61 126,559 Transfer to Saskatchewan Pension Annuity Fund - 309 5,794 183 1,050 - 7,336 Investment transaction costs 105 142 3,160 92 89 - 3,588 Administrative expenses 716 911 16,321 457 299 1 18,705 Total decrease in assets 3,436 4,640 133,953 4,672 9,425 62 156,188
Net increase in net assets 2,736 4,099 (112,381) 8,058 51,456 84 (45,948) NET ASSETS AVAILABLE FOR BENEFITS, BEGINNING OF YEAR 127,242 172,371 3,936,356 101,248 83,376 424 4,421,017
NET ASSETS AVAILABLE FOR BENEFITS, END OF YEAR 129,978$ 176,470$ 3,823,975$ 109,306$ 134,832$ 508$ 4,375,069$
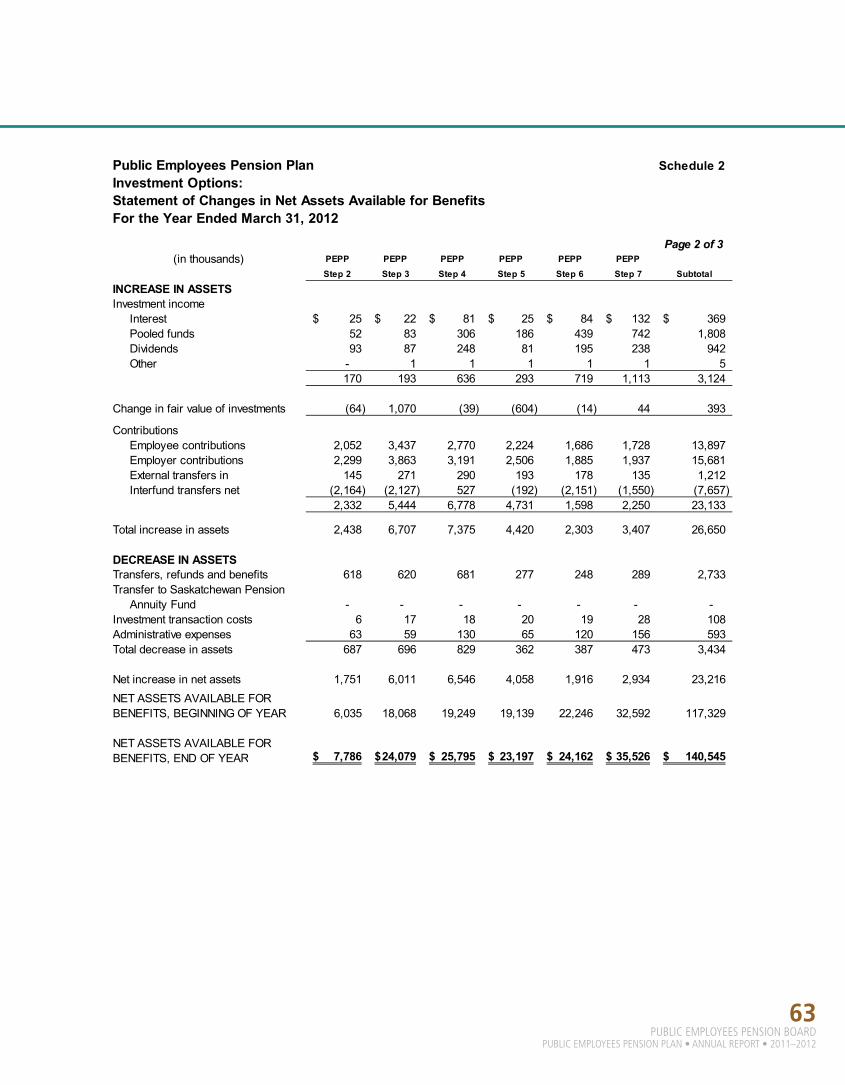
63PUBLIC EMPLOYEES PENSION BOARD
PUBLIC EMPLOYEES PENSION PLAN • ANNUAL REPORT • 2011–2012
Public Employees Pension Plan Schedule 2Investment Options:Statement of Changes in Net Assets Available for BenefitsFor the Year Ended March 31, 2012
Page 2 of 3(in thousands) PEPP PEPP PEPP PEPP PEPP PEPP
Step 2 Step 3 Step 4 Step 5 Step 6 Step 7 Subtotal
INCREASE IN ASSETSInvestment income Interest 25$ 22$ 81$ 25$ 84$ 132$ 369$ Pooled funds 52 83 306 186 439 742 1,808 Dividends 93 87 248 81 195 238 942 Other - 1 1 1 1 1 5
170 193 636 293 719 1,113 3,124
Change in fair value of investments (64) 1,070 (39) (604) (14) 44 393
Contributions Employee contributions 2,052 3,437 2,770 2,224 1,686 1,728 13,897 Employer contributions 2,299 3,863 3,191 2,506 1,885 1,937 15,681 External transfers in 145 271 290 193 178 135 1,212 Interfund transfers net (2,164) (2,127) 527 (192) (2,151) (1,550) (7,657)
2,332 5,444 6,778 4,731 1,598 2,250 23,133
Total increase in assets 2,438 6,707 7,375 4,420 2,303 3,407 26,650
DECREASE IN ASSETSTransfers, refunds and benefits 618 620 681 277 248 289 2,733 Transfer to Saskatchewan Pension Annuity Fund - - - - - - - Investment transaction costs 6 17 18 20 19 28 108 Administrative expenses 63 59 130 65 120 156 593 Total decrease in assets 687 696 829 362 387 473 3,434
Net increase in net assets 1,751 6,011 6,546 4,058 1,916 2,934 23,216 NET ASSETS AVAILABLE FOR BENEFITS, BEGINNING OF YEAR 6,035 18,068 19,249 19,139 22,246 32,592 117,329
NET ASSETS AVAILABLE FOR BENEFITS, END OF YEAR 7,786$ 24,079$ 25,795$ 23,197$ 24,162$ 35,526$ 140,545$
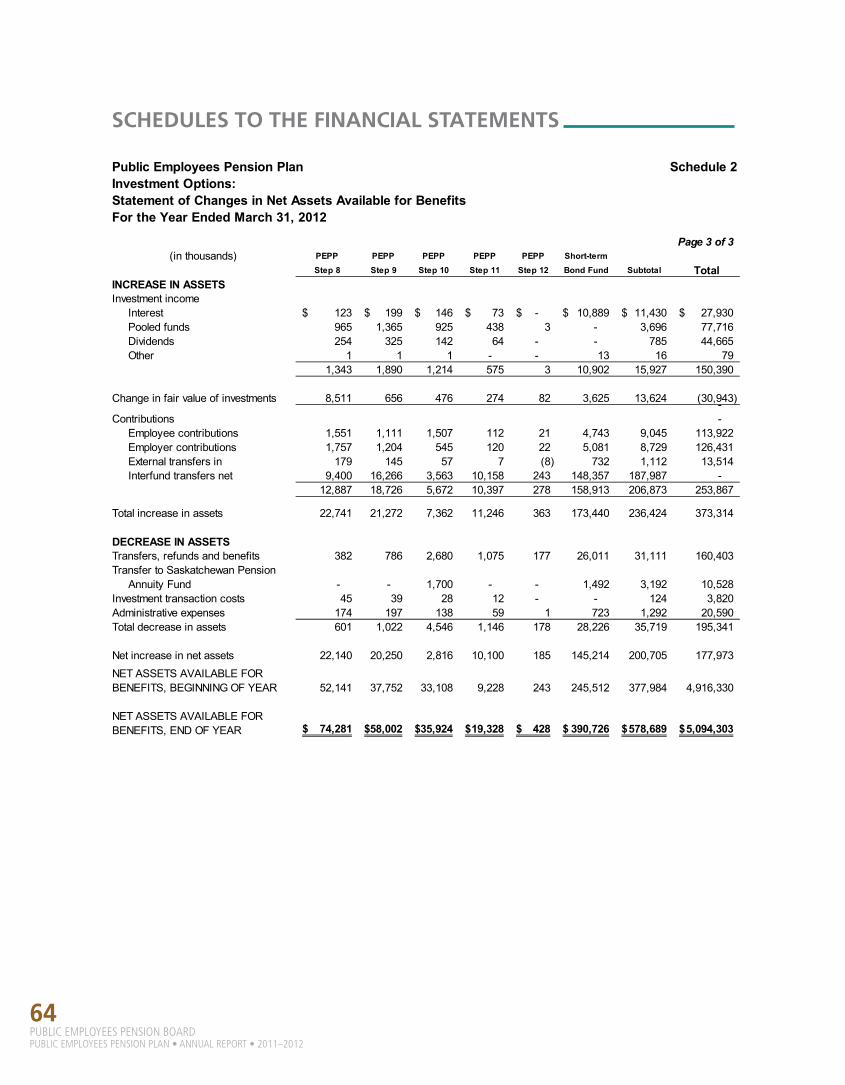
64PUBLIC EMPLOYEES PENSION BOARDPUBLIC EMPLOYEES PENSION PLAN • ANNUAL REPORT • 2011–2012
Public Employees Pension Plan Schedule 2Investment Options:Statement of Changes in Net Assets Available for BenefitsFor the Year Ended March 31, 2012
Page 3 of 3(in thousands) PEPP PEPP PEPP PEPP PEPP Short-term
Step 8 Step 9 Step 10 Step 11 Step 12 Bond Fund Subtotal TotalINCREASE IN ASSETSInvestment income Interest 123$ 199$ 146$ 73$ -$ 10,889$ 11,430$ 27,930$ Pooled funds 965 1,365 925 438 3 - 3,696 77,716 Dividends 254 325 142 64 - - 785 44,665 Other 1 1 1 - - 13 16 79
1,343 1,890 1,214 575 3 10,902 15,927 150,390
Change in fair value of investments 8,511 656 476 274 82 3,625 13,624 (30,943)-Contributions - Employee contributions 1,551 1,111 1,507 112 21 4,743 9,045 113,922 Employer contributions 1,757 1,204 545 120 22 5,081 8,729 126,431 External transfers in 179 145 57 7 (8) 732 1,112 13,514 Interfund transfers net 9,400 16,266 3,563 10,158 243 148,357 187,987 -
12,887 18,726 5,672 10,397 278 158,913 206,873 253,867
Total increase in assets 22,741 21,272 7,362 11,246 363 173,440 236,424 373,314
DECREASE IN ASSETSTransfers, refunds and benefits 382 786 2,680 1,075 177 26,011 31,111 160,403Transfer to Saskatchewan Pension Annuity Fund - - 1,700 - - 1,492 3,192 10,528Investment transaction costs 45 39 28 12 - - 124 3,820Administrative expenses 174 197 138 59 1 723 1,292 20,590Total decrease in assets 601 1,022 4,546 1,146 178 28,226 35,719 195,341
Net increase in net assets 22,140 20,250 2,816 10,100 185 145,214 200,705 177,973NET ASSETS AVAILABLE FOR BENEFITS, BEGINNING OF YEAR 52,141 37,752 33,108 9,228 243 245,512 377,984 4,916,330
NET ASSETS AVAILABLE FOR BENEFITS, END OF YEAR 74,281$ 58,002$ 35,924$ 19,328$ 428$ 390,726$ 578,689$ 5,094,303$
SCHEDULES TO THE FINANCIAL STATEMENTS