2011annualreport - smithfield foodsastrolite pc 100® stock produced by monadnock paper mills. this...
TRANSCRIPT

SMITHFIELDFOODS,INC.2011ANNUALREPORT
SMITHFIELD FOODS, INC.200 Commerce StreetSmithfield, VA 23430+1 757 365 3000www.smithfieldfoods.com
2011 ANNUAL REPORT
SMITHFIELD FOODS is a $12 billion global food company and the world’s
largest pork processor and hog producer. In the United States, the
company is also the leader in numerous packaged meats categories with
popular brands including Farmland,®Smithfield,
®Eckrich,
®Armour,
®and
John Morrell.®Smithfield Foods is committed to providing good food in a
responsible way and maintains robust environmental, food safety,
employee safety, animal welfare, and community involvement programs.

Created and produced by RKC! (Robinson Kurtin Communications! Inc)Executive Photography: Timothy LlewellynPrinting: Dynagraf
The Smithfield Foods 2011 Annual Report achievedthe following by printing on paper with recycledcontent compared with 100 percent virgin paper.
Wood saved 4,435 poundsWastewater flow saved 7,136 gallonsSolid waste not produced 452 poundsCarbon dioxide not generated 1,380 net poundsEnergy not consumed 4.94 million BTUsCarbon emissions not produced 603 pounds
This report, with the exception of the Form 10-K, is printed onAstrolite PC 100® stock produced by Monadnock Paper Mills.This stock is made from 100 percent post-consumer recycledfiber. Astrolite PC 100 is also manufactured carbon neutralusing 100 percent renewable electricity.
The Form 10-K is printed on Domtar RRD Financial RecycledFSC. It contains 10 percent post–consumer recycled fiber.
Non-GAAP Measure Reconciliationfor Pork Segment Profitability Chart (page 1) (in millions) FY 07 FY 08 FY 09 FY 10 FY 11
Operating profit—Pork segment $219 $449 $395 $539 $ 753Add: Pork segment restructuring
and impairment charges — — 88 34 —
Financial Highlights
Fiscal years ended May 1, 2011 May 2, 2010 May 3, 2009(in millions, except per share data)
Sales $12,202.7 $11,202.6 $12,487.7
Operating profit (loss) 1,095.0 62.8 (223.9)
Income (loss) from continuing operations 521.0 (101.4) (250.9)
Net income (loss) 521.0 (101.4) (198.4)
Diluted earnings (loss) per share from continuing operations 3.12 (.65) (1.78)
Diluted earnings (loss) per share 3.12 (.65) (1.41)
Weighted average diluted shares outstanding 167.2 157.1 141.1
Additional Information
Capital expenditures $ 176.8 $ 174.7 $ 179.3
Depreciation expense 227.4 236.9 264.0
Working capital 2,110.0 2,128.4 1,497.7
Net debt1 1,747.6 2,556.9 2,786.6
Shareholders’ equity 3,545.5 2,755.6 2,612.4
Net debt to total capitalization2 33.0% 48.1% 51.6%
1 Net debt is equal to notes payable and long-term debt and capital lease obligations, including current portion, less cash and cash equivalents.
2 Computed using net debt divided by net debt and shareholders’ equity.
Pork segment adjusted EBIT $219 $449 $483 $573 $ 753
Operating profit—Pork segment $219 $449 $395 $539 $ 753Less: Operating profit—Fresh pork (34) (141) (76) (61) (406)Add: Packaged meats restructuring
and impairment charges — — 67 17 —
Packaged meats adjusted EBIT $185 $308 $386 $495 $ 347
Operating profit—Pork segment $219 $449 $395 $539 $ 753Less: Operating profit—Packaged meats (185) (308) (319) (478) (347)Add: Fresh pork restructuring
and impairment charges — — 21 17 —
Fresh pork adjusted EBIT $ 34 $ 141 $ 97 $ 78 $406

To Our Shareholders
Fiscal 2011 was a record year for Smithfield and underscored our evolution into a consumer packaged meats company.We reported net income of $521.0 million, or $3.12 per diluted share, compared to a net loss of $101.4 million, or $.65 per dilutedshare—an improvement of $622.4 million. These record results far exceeded those of our last record year, as we continued totransform Smithfield to deliver higher quality and more consistent earnings to our shareholders. Higher average unit sellingprices and live hog prices in the Pork and Hog Production segments, respectively, resulted in a 9 percent increase in sales to$12.2 billion in fiscal 2011.
Pork Segment DrivesEarnings ContributionThe Pork segment produced recordoperating profit for the fourthconsecutive year, which continued todemonstrate an important shift in thekey drivers of our business modeltoward consumer packaged meats.Pork segment earnings increased32 percent from the prior year andgenerated 72 percent and 69 percentof the company’s sales and operatingprofit, respectively.
In addition, Pork segment profitabilitymore than tripled from fiscal 2007.
32%
40%
72%
9%
19%
$406
FY 07 FY 08 FY 09 FY 11
$34
$219
$449$483
$573
$753
$185
$308 $386 $495
$347
$141 $97
FY 10
$780
$100
$200
$300
$400
$500
$600
$700
$800
Pork segment adjusted EBIT(in millions)
Note: FY 09 and FY 10 results adjusted forrestructuring and impairment charges; referto non–GAAP measure reconciliations oninside back cover.
Driving Record Pork Segment Profitability
Fiscal 2011 Sales*
Pork Segment
Fresh Pork
Packaged Meats
Hog Production Segment
International Segment
Fiscal 2011 Operating Profit
* Includes intersegment sales
69%
11%
20%
32%
37%
Pork Segment
Fresh Pork
Packaged Meats
Hog Production Segment
International Segment
Packaged Meats
Fresh Pork
Total Pork Segment
1
2
®
Leveraging the Smithfield Brand PortfolioOur ability to deliver record results in our Pork segment for the fourth year in a row was driven byseveral key factors that we achieved through our Pork segment restructuring plan. Most importantly,this plan provided Smithfield with a highly coordinated sales and marketing platform andconsolidated brand portfolio, which we effectively leveraged to deliver normalized packaged meatsmargins in the face of record-high raw material costs this year.
This year, we achieved double-digit top-line growth in the following key strategic brands andproduct categories, demonstrating the strength of the Smithfield brand portfolio:
� Armour LunchMakers portable lunches;� Farmland marinated premium branded fresh pork;� Healthy Ones deli, the fastest growing offering in the Smithfield deli portfolio;� Kretschmar deli, Smithfield’s premium full line deli brand; and� Smithfield marinated premium branded fresh pork.
In addition, we maintained leading market share in these important value-added product categories:
� Bacon� Bone-in hams� Meatballs� Specialty cut hams� Spiral sliced hams
Positive Industry Fundamentals Fuel Record ResultsOverall favorable market dynamics benefited the company in all segments this year. Supply anddemand remained well in balance and resulted in a business environment that was very favorable inthe Pork segment and sharply improved in the Hog Production segment.
Our fresh pork and consumer packaged meats businesses delivered solid and consistent earnings.The success of the Pork segment restructuring allowed us to exhibit strong discipline by closelyaligning higher production efficiencies, lower overhead costs, and a more coordinated sales andmarketing focus. Fresh pork earnings were bolstered by solid exports and low protein supplies, whichcreated an environment of exceptional profitability. Robust demand for U.S. pork exports wasenhanced by a weak dollar, as the U.S. remained one of the lowest cost global protein producers.
Hog Production segment operating results rebounded substantially, as a reduction in inventoriesresulted in double-digit increases in live hog prices. At the same time, favorable grain hedges yieldedraising costs that were in line with the prior year.
We also divested several non-core assets, including our 49 percent interest in Butterball and ourrelated turkey production assets, as well as several hog production operations. These moves weremade as part of our continuing strategy to reduce exposure to commodity businesses and increaseefficiencies and return on invested capital. These divestitures have contributed to a reduction in ourexposure to the domestic corn markets of more than 40 percent since fiscal 2008.
Continued Strong Results in Fiscal 2012Looking forward to fiscal 2012, we remain focused on delivering a more stable earnings stream and capitalizing on the manyimprovements we have made in all segments of the business:
� We expect to achieve profitable top-line growth in our packaged meats business through increased consumer marketing ofour key brands and focus on innovation, while maintaining strong pricing discipline to deliver margins in our normalized range.
� Balanced supply and demand and strong exports should generate solid fresh pork margins, although we anticipate thatprofitability will return to more normalized levels.
� The current futures curve for lean hogs suggests robust pricing that should yield profitability in fiscal 2012, despite higher grainprices that will push raising costs into the mid $60s per hundredweight. We anticipate continued low global hog inventories,as we do not see herd expansion on the horizon.
� The Hog Production Group cost savings initiative is in progress and should improve profitability by approximately $90 millionannually, or $2 per hundredweight, by fiscal 2014.
� Having considerably improved our balance sheet, we expect to realize our goal of reducing interest expense by $100 millionannually in fiscal 2012.
Although fiscal 2011 was a record year, this is only the beginning. The growth wehave achieved in our Pork segment is indicative of our plans, potential, and ability tocapitalize on our coordinated sales and marketing platform. We strongly believe thatwe will build long-term value for shareholders as we continue to transform Smithfieldinto a consumer packaged meats company. Thank you for your support.
Sincerely,
C. Larry PopePresident and Chief Executive Officer
July 1, 2011
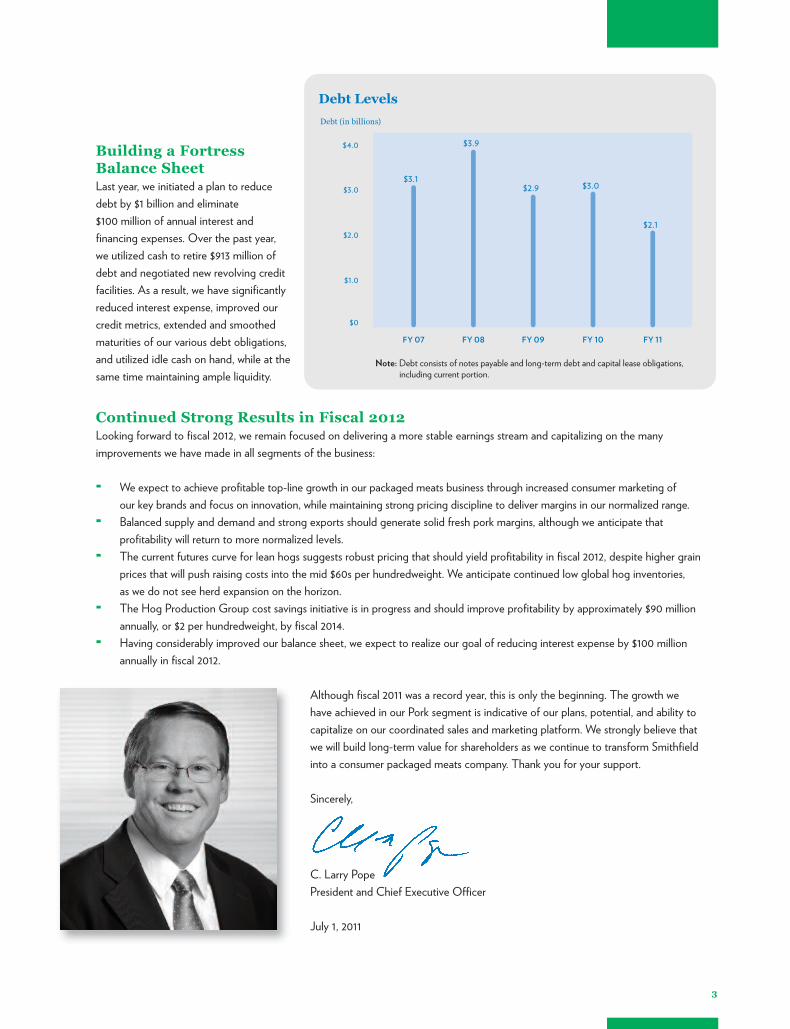
Debt (in billions)
$0
$1.0
$2.0
$3.0
$4.0
FY 11
$2.1
FY 10
$3.0
FY 09
$2.9
FY 08
$3.9
FY 07
$3.1
Debt Levels
Note: Debt consists of notes payable and long-term debt and capital lease obligations,including current portion.
Building a FortressBalance SheetLast year, we initiated a plan to reducedebt by $1 billion and eliminate$100 million of annual interest andfinancing expenses. Over the past year,we utilized cash to retire $913 million ofdebt and negotiated new revolving creditfacilities. As a result, we have significantlyreduced interest expense, improved ourcredit metrics, extended and smoothedmaturities of our various debt obligations,and utilized idle cash on hand, while at thesame time maintaining ample liquidity.
3

Fiscal Years (dollars and shares in millions, except per share data) 2011 2010 2009
OPERATIONS
Sales $12,202.7 $11,202.6 $12,487.7Gross profit 1,714.1 730.1 624.6Selling, general, and administrative expenses 789.8 705.9 798.4Operating profit (loss) 1,095.0 62.8 (223.9)Interest expense 245.4 266.4 221.8Income (loss) from continuing operations 521.0 (101.4) (250.9)Net income (loss) 521.0 (101.4) (198.4)
PER DILUTED SHARE
Income (loss) from continuing operations $ 3.12 $ (.65) $ (1.78)Net income (loss) 3.12 (.65) (1.41)Book value 1 21.21 17.54 18.51Weighted average shares outstanding 167.2 157.1 141.1
FINANCIAL POSITION
Working capital $ 2,110.0 $ 2,128.4 $ 1,497.7Total assets 7,611.8 7,708.9 7,200.2Net debt 2 1,747.6 2,556.9 2,786.6Shareholders’ equity 3,545.5 2,755.6 2,612.4
FINANCIAL RATIOS
Current ratio 2.72 2.79 2.16Net debt to total capitalization 3 33.0% 48.1% 51.6%
OTHER INFORMATION
Capital expenditures $ 176.8 $ 174.7 $ 179.3Depreciation expense 227.4 236.9 264.0Common shareholders of record 956 1,010 1,074Number of employees 46,350 48,000 52,400
1 Computed using shareholders' equity divided by weighted average shares outstanding.2 Net debt is equal to notes payable and long-term debt and capital lease obligations, including current portion, less cash and cash equivalents.3 Computed using net debt divided by net debt and shareholders’ equity.
10-Year Financial Summary
4

2008 2007 2006 2005 2004 2003 2002
$11,351.2 $9,359.3 $8,828.1 $8,983.6 $6,807.7 $4,907.6 $5,276.51,148.4 1,060.5 1,040.1 1,173.9 787.9 470.2 824.6813.6 686.0 620.9 595.6 496.1 431.4 444.4396.8 422.7 430.7 595.5 290.7 29.2 381.9184.8 133.6 117.6 117.2 109.3 76.7 82.8139.2 211.9 206.2 315.8 122.4 (26.7) 86.7128.9 166.8 172.7 296.2 227.1 26.3 196.9
$ 1.04 $ 1.89 $ 1.84 $ 2.81 $ 1.10 $ (.24) $ 1.69.96 1.49 1.54 2.64 2.03 .24 1.78
22.71 20.03 18.11 16.93 14.31 11.83 12.41134.2 111.9 112.0 112.3 111.7 109.6 110.4
$ 2,215.3 $1,795.3 $ 1,597.2 $ 1,773.6 $1,346.5 $1,222.6 $ 842.48,867.9 6,968.6 6,177.3 5,773.6 4,828.1 4,244.4 3,907.13,826.1 3,035.1 2,468.9 2,189.9 1,712.7 1,577.5 1,339.23,048.2 2,240.8 2,028.2 1,901.4 1,598.9 1,299.2 1,362.8
2.36 2.31 2.21 2.57 2.34 2.17 2.1255.7% 57.5% 54.9% 53.5% 51.7% 54.8% 49.6%
$ 428.8 $ 453.7 $ 367.2 $ 184.4 $ 119.1 $ 153.9 $ 123.5258.0 201.0 181.8 168.2 147.1 131.0 113.81,095 1,128 1,196 1,269 1,332 1,195 1,390
58,100 53,100 52,500 51,290 46,400 44,100 41,000
5

Cumulative Total Return ComparisonsThe following charts compare the five-year performance and 10-year performance, respectively, of Smithfield Foods stock with theS&P 500 Composite Index and the S&P 500 Packaged Foods &Meats Index, each prepared byMorningstar, Inc. The return for the five-yearperiod is based on $100 invested on April 30, 2006, and the return for the 10-year period is based on $100 invested on April 29, 2001.Both returns assume that dividends were reinvested.
6
4/30/06 4/29/07 4/27/08 5/03/09 5/02/10 5/01/11
$160$150$140$130$120$110$100$90$80$70$60$50$40$30$20
uu
u
u
u
uu
u
u
u
6
$ 87.58
$ 115.65
$ 151.12
u
u
u
u
u
$100.00 $112.53 $105.87 $32.01 $69.67 $87.58100.00 116.15 110.81 71.44 98.66 115.65100.00 119.07 113.22 93.06 129.98 151.12
Five-Year Cumulative Total Return
4/29/01 4/28/02 4/27/03 5/02/04 5/01/05 4/30/06 4/29/07 4/27/08 5/03/09 5/02/10 5/01/11
$220$210$200$190$180$170$160$150$140$130$120$110$100$90$80$70$60$50$40
u
u
u
uu
uu
u
u
$ 128.88$ 131.73
$ 212.97
u
u
u
Ten-Year Cumulative Total Return
u
u
u
u
uu
u
uu
u
u
u
u
u
u
u
u
u
$100.00 $114.88 $102.95 $145.51 $165.54 $147.16 $165.59 $155.80 $47.10 $102.52 $128.88100.00 87.07 74.02 92.81 98.70 113.91 132.30 126.22 81.38 112.38 131.73100.00 112.88 104.34 136.09 145.64 140.93 167.80 159.57 131.15 183.18 212.97
Smithfield Foods, Inc.
S&P 500 Composite
S&P 500 Packaged Foods &Meats

UNITED STATESSECURITIES AND EXCHANGE COMMISSION
Washington, D.C. 20549
FORM 10-KANNUAL REPORT PURSUANT TO SECTION 13 OR 15(d) OF THE SECURITIES EXCHANGE ACT
OF 1934For the fiscal year ended May 1, 2011
Commission file number: 1-15321
SMITHFIELD FOODS, INC.(Exact name of registrant as specified in its charter)
Virginia 52-0845861(State or other jurisdiction of
incorporation or organization)(I.R.S. Employer
Identification No.)
200 Commerce StreetSmithfield, Virginia 23430
(Address of principal executive offices) (Zip Code)
(757) 365-3000(Registrant’s telephone number, including area code)
Securities registered pursuant to Section 12(b) of the Act:Title of each class Name of each exchange on which registered
Common Stock, $.50 par value per share New York Stock Exchange
Securities registered pursuant to Section 12(g) of the Act:None
Indicate by check mark if the registrant is a well-known seasoned issuer, as defined in Rule 405 of the Securities Act. Yes Í No ‘
Indicate by check mark if the registrant is not required to file reports pursuant to Section 13 or Section 15(d) of the Act. Yes ‘ No Í
Indicate by check mark whether the registrant (1) has filed all reports required to be filed by Section 13 or 15(d) of the SecuritiesExchange Act of 1934 during the preceding 12 months (or for such shorter period that the registrant was required to file such reports),and (2) has been subject to such filing requirements for the past 90 days. Yes Í No ‘
Indicate by check mark whether the registrant has submitted electronically and posted on its corporate Web site, if any, everyInteractive Data File required to be submitted and posted pursuant to rule 405 of Regulation S-T during the preceding 12 months (orfor such shorter period that the registrant was required to submit and post such files). Yes Í No ‘
Indicate by check mark if disclosure of delinquent filers pursuant to Item 405 of Regulation S-K is not contained herein, and will notbe contained, to the best of registrant’s knowledge, in definitive proxy or information statements incorporated by reference in Part IIIof this Form 10-K or any amendment to this Form 10-K. ‘
Indicate by check mark whether the registrant is a large accelerated filer, an accelerated filer, a non-accelerated filer, or a smallerreporting company. See the definitions of “large accelerated filer,” “accelerated filer” and “smaller reporting company” in Rule 12b-2of the Exchange Act.
Large accelerated filer Í Accelerated filer ‘ Non-accelerated filer ‘ Smaller reporting company ‘
Indicate by check mark whether the registrant is a shell company (as defined in Rule 12b-2 of the Exchange Act). Yes ‘ No Í
The aggregate market value of the shares of registrant’s Common Stock held by non-affiliates as of October 31, 2010 wasapproximately $1.7 billion. This figure was calculated by multiplying (i) the $16.75 last sales price of registrant’s Common Stock asreported on the New York Stock Exchange on the last business day of the registrant’s most recently completed second fiscal quarterby (ii) the number of shares of registrant’s Common Stock not held by any executive officer or director of the registrant or any personknown to the registrant to own more than five percent of the outstanding Common Stock of the registrant. Such calculation does notconstitute an admission or determination that any such executive officer, director or holder of more than five percent of theoutstanding shares of Common Stock of the registrant is in fact an affiliate of the registrant.
At June 14, 2011, 166,080,231 shares of the registrant’s Common Stock were outstanding.

DOCUMENTS INCORPORATED BY REFERENCE
Part III incorporates certain information by reference from the registrant’s definitive proxy statement to be filed withrespect to its Annual Meeting of Shareholders to be held on September 21, 2011.
SMITHFIELD FOODS, INC.
TABLE OF CONTENTS
PAGE
PART IITEM 1. Business . . . . . . . . . . . . . . . . . . . . . . . . . . . . . . . . . . . . . . . . . . . . . . . . . . . . . . . . . . . . . . . . . . . 3ITEM 1A. Risk Factors . . . . . . . . . . . . . . . . . . . . . . . . . . . . . . . . . . . . . . . . . . . . . . . . . . . . . . . . . . . . . . . . 14ITEM 1B. Unresolved Staff Comments . . . . . . . . . . . . . . . . . . . . . . . . . . . . . . . . . . . . . . . . . . . . . . . . . . . 22ITEM 2. Properties . . . . . . . . . . . . . . . . . . . . . . . . . . . . . . . . . . . . . . . . . . . . . . . . . . . . . . . . . . . . . . . . . . 23ITEM 3. Legal Proceedings . . . . . . . . . . . . . . . . . . . . . . . . . . . . . . . . . . . . . . . . . . . . . . . . . . . . . . . . . . . 25ITEM 4. (Removed and Reserved) . . . . . . . . . . . . . . . . . . . . . . . . . . . . . . . . . . . . . . . . . . . . . . . . . . . . . . 27
Executive Officers of the Registrant . . . . . . . . . . . . . . . . . . . . . . . . . . . . . . . . . . . . . . . . . . . . . 28PART II
ITEM 5. Market for Registrant’s Common Equity, Related Stockholder Matters and Issuer Purchasesof Equity Securities . . . . . . . . . . . . . . . . . . . . . . . . . . . . . . . . . . . . . . . . . . . . . . . . . . . . . . . . 29
ITEM 6. Selected Financial Data . . . . . . . . . . . . . . . . . . . . . . . . . . . . . . . . . . . . . . . . . . . . . . . . . . . . . . . 30ITEM 7. Management’s Discussion and Analysis of Financial Condition and Results of
Operations . . . . . . . . . . . . . . . . . . . . . . . . . . . . . . . . . . . . . . . . . . . . . . . . . . . . . . . . . . . . . . . 32ITEM 7A. Quantitative and Qualitative Disclosures About Market Risk . . . . . . . . . . . . . . . . . . . . . . . . . 67ITEM 8. Financial Statements and Supplementary Data . . . . . . . . . . . . . . . . . . . . . . . . . . . . . . . . . . . . . 68ITEM 9. Changes in and Disagreements with Accountants on Accounting and Financial
Disclosure . . . . . . . . . . . . . . . . . . . . . . . . . . . . . . . . . . . . . . . . . . . . . . . . . . . . . . . . . . . . . . . 121ITEM 9A. Controls and Procedures . . . . . . . . . . . . . . . . . . . . . . . . . . . . . . . . . . . . . . . . . . . . . . . . . . . . . . 121ITEM 9B. Other Information . . . . . . . . . . . . . . . . . . . . . . . . . . . . . . . . . . . . . . . . . . . . . . . . . . . . . . . . . . . 121
PART IIIITEM 10. Directors, Executive Officers and Corporate Governance . . . . . . . . . . . . . . . . . . . . . . . . . . . . 122ITEM 11. Executive Compensation . . . . . . . . . . . . . . . . . . . . . . . . . . . . . . . . . . . . . . . . . . . . . . . . . . . . . . 122ITEM 12. Security Ownership of Certain Beneficial Owners and Management and Related
Stockholder Matters . . . . . . . . . . . . . . . . . . . . . . . . . . . . . . . . . . . . . . . . . . . . . . . . . . . . . . . . 122ITEM 13. Certain Relationships and Related Transactions, and Director Independence . . . . . . . . . . . . . 122ITEM 14. Principal Accounting Fees and Services . . . . . . . . . . . . . . . . . . . . . . . . . . . . . . . . . . . . . . . . . . 122
PART IVITEM 15. Exhibits and Financial Statement Schedules . . . . . . . . . . . . . . . . . . . . . . . . . . . . . . . . . . . . . . 123Signatures . . . . . . . . . . . . . . . . . . . . . . . . . . . . . . . . . . . . . . . . . . . . . . . . . . . . . . . . . . . . . . . . . . . . . . . . . . . 130
PART I
ITEM 1. BUSINESS
GENERAL DEVELOPMENT OF BUSINESS
Smithfield Foods, Inc., together with its subsidiaries (the “Company,” “we,” “us” or “our”) began as a porkprocessing operation called The Smithfield Packing Company, founded in 1936 by Joseph W. Luter and his son,Joseph W. Luter, Jr. Through a series of acquisitions starting in 1981, we have become the largest pork processorand hog producer in the world.
We produce and market a wide variety of fresh meat and packaged meats products both domestically andinternationally. We operate in a cyclical industry and our results are affected by fluctuations in commodityprices. Additionally, some of the key factors influencing our business are customer preferences and demand forour products; our ability to maintain and grow relationships with customers; the introduction of new andinnovative products to the marketplace; accessibility to international markets for our products including theeffects of any trade barriers; and operating efficiencies of our facilities.
We conduct our operations through four reportable segments: Pork, Hog Production, International and Corporate,each of which is comprised of a number of subsidiaries, joint ventures and other investments. A fifth reportablesegment, the Other segment, contains the results of several recently disposed of businesses, including our formerturkey production operations and our previous 49% interest in Butterball, LLC (Butterball), which were sold inDecember 2010 (fiscal 2011), as well as our former live cattle operations, which were sold in the first quarter offiscal 2010. The Pork segment consists mainly of our three wholly-owned U.S. fresh pork and packaged meatssubsidiaries. The Hog Production segment consists of our hog production operations located in the U.S. TheInternational segment is comprised mainly of our meat processing and distribution operations in Poland,Romania and the United Kingdom, our interests in meat processing operations, mainly in Western Europe andMexico, our hog production operations located in Poland and Romania and our interests in hog productionoperations in Mexico. The Corporate segment provides management and administrative services to support ourother segments.
Prior to fiscal 2011, our hog production operations in Poland and Romania and our interests in hog productionoperations in Mexico were included in our Hog Production segment. In fiscal 2011, these operations were movedinto our International segment to more appropriately align our operating segments with the way our chiefoperating decision maker now assesses performance of these segments and allocates resources to these segments.The results for all fiscal periods presented have been reclassified to reflect this change in our reportablesegments.
Fiscal 2011 Business Developments
The following business developments have occurred since the beginning of fiscal 2011:
Butterball
In June 2010 (fiscal 2011), we announced that we had made an offer to purchase our joint venture partner’s 51%ownership interest in Butterball and our partner’s related turkey production assets. In accordance withButterball’s operating agreement, our partner had to either accept the offer to sell or be required to purchase our49% interest and our related turkey production assets, which we refer to below as our turkey operations.
In September 2010 (fiscal 2011), we were notified of our joint venture partner’s decision to purchase our 49%interest in Butterball and our related turkey production assets. In December 2010 (fiscal 2011), we completed thesale of these assets for $167.0 million and recognized a gain of $0.2 million.
3
Hog Farm Sales
In January 2011 and April 2011 (fiscal 2011), we completed the sale of certain hog production assets located inOklahoma, Iowa and Texas. As a result of these sales, we received total net proceeds of $112.0 million andrecognized a net gain of $18.7 million, after allocating $25.5 million of goodwill to these asset groups. The netgain was recorded in selling, general and administrative expenses in our Hog Production segment. The sale ofthese farms, which did not supply any of our pork processing plants, is the result of our strategy to reduceexposure to commodity businesses and shed non-core assets.
Hog Production Cost Savings Initiative
In the fourth quarter of fiscal 2010, we announced a plan to improve the cost structure and profitability of ourdomestic hog production operations (the Cost Savings Initiative). The plan includes a number of undertakingsdesigned to improve operating efficiencies and productivity. These consist of farm reconfigurations andconversions, termination of certain high cost, third-party hog grower contracts and breeding stock sourcingcontracts, as well as a number of other cost reduction activities. Certain of these activities are expected to occurover the next two years in order to allow for the successful transformation of farms while minimizing disruptionof supply.
We expect to incur a total of approximately $43 million in charges under this plan. We also anticipate capitalexpenditures totaling approximately $86 million. Pre-tax charges and capital expenditures in fiscal 2011 totaled$28.0 million and $44.0 million, respectively. As of the end of fiscal 2011, we had incurred total charges andcapital expenditures of $37.1 million and $46.3 million, respectively. All amounts were recorded in the HogProduction segment.
This Cost Savings Initiative is expected to gradually improve the profitability of our Hog Production segmentover the next two fiscal years. We expect that by fiscal 2014, the benefits of this initiative will be fully realizedand we currently estimate profitability improvement of approximately $2 per hundredweight, or $90 million,annually.
Pork Segment Restructuring
In February 2009 (fiscal 2009), we announced a plan to consolidate and streamline the corporate structure andmanufacturing operations of our Pork segment (the Restructuring Plan). The plan included the closure of sixplants. This restructuring has made us more competitive by improving operating efficiencies and increasing plantutilization. We completed the Restructuring Plan in the first half of fiscal 2011 with cumulative restructuring andimpairment charges of approximately $105.5 million. There were no material charges incurred in fiscal 2011. Allcharges were recorded in the Pork segment.
DESCRIPTION OF SEGMENTS
Pork Segment
The Pork segment consists mainly of three wholly-owned U.S. fresh pork and packaged meats subsidiaries. ThePork segment produces a wide variety of fresh pork and packaged meats products in the U.S. and markets themnationwide and to numerous foreign markets, including China, Japan, Mexico, Russia and Canada. The Porksegment currently operates over 40 processing plants. We process hogs at eight plants (five in the Midwest andthree in the Southeast), with an aggregate slaughter capacity of approximately 110,000 hogs per day. In fiscal2011, the Pork segment processed approximately 27.3 million hogs.
The Pork segment sold approximately 3.6 billion pounds of fresh pork in fiscal 2011. A substantial portion of ourfresh pork is sold to retail customers as unprocessed, trimmed cuts such as butts, loins (including roasts andchops), picnics and ribs.
4

The Pork segment also sold approximately 2.7 billion pounds of packaged meats products in fiscal 2011. Weproduce a wide variety of packaged meats, including smoked and boiled hams, bacon, sausage, hot dogs (pork,beef and chicken), deli and luncheon meats, specialty products such as pepperoni, dry meat products, andready-to-eat, prepared foods such as pre-cooked entrees and pre-cooked bacon and sausage. We market ourdomestic packaged meats products under a number of labels including the following major brand names:Smithfield, Farmland, John Morrell, Gwaltney, Armour, Eckrich, Margherita, Carando, Kretschmar, Cook’s,Curly’s and Healthy Ones. We also sell a substantial quantity of packaged meats as private-label products.
Our product lines also include leaner fresh pork products as well as lower-fat and lower-salt packaged meats. Wealso market a line of lower-fat value-priced luncheon meats, smoked sausage and hot dogs, as well as fat-free delihams and 40% lower-fat bacon.
The following table shows the percentages of Pork segment revenues derived from packaged meats products andfresh pork for the fiscal years indicated.
Fiscal Years
2011 2010 2009
Packaged meats . . . . . . . . . . . . . . . . . . . . . . . . . . . . . . . . . . . . . . . . . . . . . . . . 56% 55% 53%Fresh pork(1) . . . . . . . . . . . . . . . . . . . . . . . . . . . . . . . . . . . . . . . . . . . . . . . . . . . 44 45 47
100% 100% 100%
(1) Includes by-products and rendering.
In fiscal 2011, export sales (including by-products and rendering) comprised approximately 16% of the Porksegment’s volumes and approximately 13% of the segment’s revenues.
Hog Production Segment
As a complement to our Pork segment, we have vertically integrated into hog production and are the world’slargest hog producer. The Hog Production segment consists of our hog production operations located in the U.S.The Hog Production segment operates numerous hog production facilities with approximately 827,000 sowsproducing about 16.4 million market hogs annually.
The profitability of hog production is directly related to the market price of live hogs and the cost of feed grainssuch as corn and soybean meal. The Hog Production segment generates higher profits when hog prices are highand feed grain prices are low, and lower profits (or losses) when hog prices are low and feed grain prices arehigh. We believe that the Hog Production segment furthers our strategic initiative of vertical integration andreduces our exposure to fluctuations in profitability historically experienced by the pork processing industry. Inaddition, with the importance of food safety to the consumer, our vertically integrated system provides increasedtraceability from conception of livestock to consumption of the pork product.
The following table shows the percentages of Hog Production segment revenues derived from hogs soldinternally and externally and other products for the fiscal years indicated.
Fiscal Years
2011 2010 2009
Internal hog sales . . . . . . . . . . . . . . . . . . . . . . . . . . . . . . . . . . . . . . . . . . . . . . . 78% 77% 80%External hog sales . . . . . . . . . . . . . . . . . . . . . . . . . . . . . . . . . . . . . . . . . . . . . . 21 20 17Other products(1) . . . . . . . . . . . . . . . . . . . . . . . . . . . . . . . . . . . . . . . . . . . . . . . 1 3 3
100% 100% 100%
(1) Consists primarily of feed.
5
Genetics
We own certain genetic lines of specialized breeding stock which are marketed using the name SmithfieldPremium Genetics (SPG). The Hog Production segment makes extensive use of these genetic lines, withapproximately 777,000 SPG breeding sows. In addition, we have sublicensed some of these rights to some of ourstrategic hog production partners. We believe that the hogs produced by these genetic lines are the leanest hogscommercially available and enable us to market highly differentiated pork products. We believe that the leannessand increased meat yields of these hogs enhance our profitability with respect to both fresh pork and packagedmeats. In fiscal 2011, we produced approximately 14.8 million SPG hogs.
Hog production operations
We use advanced management techniques to produce premium quality hogs on a large scale at a low cost. Wedevelop breeding stock, optimize diets for our hogs at each stage of the growth process, process feed for our hogsand design hog containment facilities. We believe our economies of scale and production methods, together withour use of the advanced SPG genetics, make us a low cost producer of premium quality hogs. We also utilizeindependent farmers and their facilities to raise hogs produced from our breeding stock. Under multi-yearcontracts, a farmer provides the initial facility investment, labor and front line management in exchange for aservice fee. In fiscal 2011, approximately 65% of our market hogs were finished on contract farms.
International Segment
The International segment includes our meat processing and distribution operations in Poland, Romania and theUnited Kingdom, our interests in meat processing operations, mainly in Western Europe and Mexico, our hogproduction operations located in Poland and Romania and our interests in hog production operations in Mexico.Our international meat processing operations produce a wide variety of fresh pork, beef, poultry and packagedmeats products, including cooked hams, sausages, hot dogs, bacon and canned meats. Our noncontrollinginterests in international meat processing operations include a 37% interest in the common stock of CFG, aleading European packaged meats company headquartered in Madrid, Spain, and one of the largest worldwidewith annual sales of approximately $2.4 billion.
The following table shows the percentages of International segment revenues derived from packaged meats, freshpork and other products for the fiscal years indicated.
Fiscal Years
2011 2010 2009
Packaged meats . . . . . . . . . . . . . . . . . . . . . . . . . . . . . . . . . . . . . . . . . . . . . . . . 45% 45% 46%Fresh pork . . . . . . . . . . . . . . . . . . . . . . . . . . . . . . . . . . . . . . . . . . . . . . . . . . . . 24 26 31Other products(1) . . . . . . . . . . . . . . . . . . . . . . . . . . . . . . . . . . . . . . . . . . . . . . . 31 29 23
100% 100% 100%
(1) Includes poultry, beef, external hog sales, by-products and rendering
The International segment has sales denominated in foreign currencies and, as a result, is subject to certaincurrency exchange risk. See “Item 7. Management’s Discussion and Analysis of Financial Condition and Resultsof Operations—Derivative Financial Instruments” for a discussion of our foreign currency hedging activities.
Other Segment
The Other segment contains the results of several recently disposed of businesses, including our former turkeyproduction operations and our previous 49% interest in Butterball, LLC (Butterball), which were sold inDecember 2010 (fiscal 2011), as well as our former live cattle operations, which were sold in the first quarter offiscal 2010. The live cattle operations consisted of the live cattle inventories that were excluded from the sale ofSmithfield Beef, Inc. (Smithfield Beef) in October 2008 (fiscal 2009).
6

SEGMENTS IN GENERAL
Sources and Availability of Raw Materials
Feed grains, including corn, soybean meal and wheat, are the primary raw materials of our hog productionoperations. These grains are readily available from numerous sources at competitive prices. We generallypurchase corn and soybean meal through forward purchase contracts. Historically, grain prices have been subjectto fluctuations and have escalated in recent years due to increased worldwide demand.
Live hogs are the primary raw materials of the Pork segment and our meat processing operations in theInternational segment. Historically, hog prices have been subject to substantial fluctuations. Hog supplies, andconsequently prices, are affected by factors such as corn and soybean meal prices, weather and farmers’ access tocapital. Hog prices tend to rise seasonally as hog supplies decrease during the hot summer months and tend todecline as supplies increase during the fall. This tendency is due to lower farrowing performance during thewinter months and slower animal growth rates during the hot summer months.
The Pork segment purchased approximately 49% of its U.S. live hog requirements from the Hog Productionsegment in fiscal 2011. In addition, we have established multi-year agreements with Maxwell Foods, Inc. andPrestage Farms, Inc., which provide us with a stable supply of high-quality hogs at market-indexed prices. Theseproducers supplied approximately 11% of hogs processed by the Pork segment in fiscal 2011. We also purchasehogs on a daily basis at our Southeastern and Midwestern processing plants and our company-owned buyingstations in three Southeastern and five Midwestern states.
Like the Pork segment, live hogs are the primary raw materials of our meat processing operations in theInternational segment with the primary source of hogs being our hog production operations located in Poland andRomania. Our meat processing operations in the International segment purchased approximately 67% of its livehog requirements from our hog production operations located in Poland and Romania in fiscal 2011.
We also purchase fresh pork from other meat processors to supplement our processing requirements. Additionalpurchases include raw beef, poultry and other meat products that are added to sausages, hot dogs and luncheonmeats. Those meat products and other materials and supplies, including seasonings, smoking and curing agents,sausage casings and packaging materials, are readily available from numerous sources at competitive prices.
Nutrient Management and Other Environmental Issues
Our hog production facilities have been designed to meet or exceed all applicable zoning and other governmentregulations. These regulations require, among other things, maintenance of separation distances between farmsand nearby residences, schools, churches, public use areas, businesses, rivers, streams and wells and adherence torequired construction standards.
Hog production facilities generate significant quantities of manure, which must be managed properly to protectpublic health and the environment. We believe that we use the best technologies currently available andeconomically feasible for the management of swine manure, which require permits under state, and in someinstances, federal law. The permits impose standards and conditions on the design and operation of the systemsto protect public health and the environment, and can also impose nutrient management planning requirementsdepending on the type of system utilized. The most common system of swine manure management employed byour hog production facilities is the lagoon and spray field system, in which lined earthen lagoons are utilized totreat the manure before it is applied to agricultural fields by spray application. The nitrogen and phosphorus inthe treated manure serve as a crop fertilizer.
We follow a number of other policies and protocols to reduce the impact of our hog production operations on theenvironment, including: the employment of environmental management systems; ongoing employee trainingregarding environmental controls; walk-around inspections at all sites by trained personnel; formal emergencyresponse plans that are regularly updated; and collaboration with manufacturers regarding testing and developingnew equipment. For further information see “Regulation” below.
7
Customers and Marketing
Our fundamental marketing strategy is to provide quality and value to the ultimate consumers of our fresh pork,packaged meats and other meat products. We have a variety of consumer advertising and trade promotionprograms designed to build awareness and increase sales distribution and penetration. We also provide salesincentives for our customers through rebates based on achievement of specified volume and/or growth in volumelevels.
We have significant market presence, both domestically and internationally, where we sell our fresh pork,packaged meats and other meat products to national and regional supermarket chains, wholesale distributors, thefoodservice industry (fast food, restaurant and hotel chains, hospitals and other institutional customers), exportmarkets and other further processors. We use both in-house salespersons as well as independent commissionbrokers to sell our products. In fiscal 2011, we sold our products to more than 4,000 customers, none of whomaccounted for as much as 10% of consolidated revenues. We have no significant or seasonally variable backlogbecause most customers prefer to order products shortly before shipment and, therefore, do not enter into formallong-term contracts.
Methods of Distribution
We use a combination of private fleets of leased tractor trailers and independent common carriers and owneroperators to distribute live hogs, fresh pork, packaged meats and other meat products to our customers, as well asto move raw materials between plants for further processing. We coordinate deliveries and use backhauling toreduce overall transportation costs. In the U.S., we distribute products directly from some of our plants and fromleased distribution centers primarily in Missouri, Pennsylvania, North Carolina, Virginia, Kansas, Wisconsin,Indiana, Illinois, California, Iowa, Nebraska and Texas. We also operate distribution centers adjacent to ourplants in Bladen County, North Carolina, Sioux Falls, South Dakota and Crete, Nebraska. Internationally, wedistribute our products through a combination of leased and owned warehouse facilities.
Trademarks
We own and use numerous marks, which are registered trademarks or are otherwise subject to protection underapplicable intellectual property laws. We consider these marks and the accompanying goodwill and customerrecognition valuable and material to our business. We believe that registered trademarks have been important tothe success of our branded fresh pork and packaged meats products. In a number of markets, our brands areamong the leaders in select product categories.
Seasonality
The meat processing business is somewhat seasonal in that, traditionally, the periods of higher sales for hams arethe holiday seasons such as Christmas, Easter and Thanksgiving, and the periods of higher sales for smokedsausages, hot dogs and luncheon meats are the summer months. The Pork segment typically builds substantialinventories of hams in anticipation of its seasonal holiday business. In addition, the Hog Production segmentexperiences lower farrowing performance during the winter months and slower animal growth rates during thehot summer months resulting in a decrease in hog supplies in the summer and an increase in hog supplies in thefall.
Competition
The protein industry is highly competitive. Our products compete with a large number of other protein sources,including chicken, beef and seafood, but our principal competition comes from other pork processors.
We believe that the principal competitive factors in the pork processing industry are price, product quality andinnovation, product distribution and brand loyalty. Some of our competitors are more diversified than us,
8
especially now that we have sold our beef and turkey operations. To the extent that their other operationsgenerate profits, these more diversified competitors may be able to support their meat processing operationsduring periods of low or negative profitability.
Research and Development
We conduct continuous research and development activities to develop new products and to improve existingproducts and processes. We incurred expenses on company-sponsored research and development activities of$47.0 million, $38.8 million and $52.6 million in fiscal 2011, 2010 and 2009, respectively.
FINANCIAL INFORMATION ABOUT SEGMENTS
Financial information for each reportable segment, including revenues, operating profit and total assets, isdisclosed in Note 18 in “Item 8. Financial Statements and Supplementary Data.”
RISK MANAGEMENT AND HEDGING
We are exposed to market risks primarily from changes in commodity prices, as well as interest rates and foreignexchange rates. To mitigate these risks, we utilize derivative instruments to hedge our exposure to changingprices and rates. For further information see “Item 7. Management’s Discussion and Analysis of FinancialCondition and Results of Operations—Derivative Financial Instruments.”
REGULATION
Regulation in General
Like other participants in the industry, we are subject to various laws and regulations administered by federal,state and other government entities, including the United States Environmental Protection Agency (EPA) andcorresponding state agencies, as well as the United States Department of Agriculture, the Grain Inspection,Packers and Stockyard Administration, the United States Food and Drug Administration, the United StatesOccupational Safety and Health Administration, the Commodities and Futures Trading Commission and similaragencies in foreign countries.
From time to time, we receive notices and inquiries from regulatory authorities and others asserting that we arenot in compliance with particular laws and regulations. In some instances, litigation ensues. In addition,individuals may initiate litigation against us.
Many of our facilities are subject to environmental permits and other regulatory requirements, violations ofwhich are subject to civil and criminal sanction. In some cases, third parties may also have the right to sue toenforce compliance.
We use the International Organization for Standardization (ISO) 14001 standard to manage and optimizeenvironmental performance, and we were the first in the industry to achieve ISO 14001 certification for our hogproduction and processing facilities. ISO guidelines require a long-term management plan integrating regularthird-party audits, goal setting, corrective action, documentation, and executive review. Our EnvironmentalManagement System (EMS), which conforms to the ISO 14001 standard, addresses the significant environmentalaspects of our operations, provides employee training programs and facilitates engagement with localcommunities and regulators. Most importantly, the EMS allows the collection, analysis and reporting of relevantenvironmental data to facilitate our compliance with applicable environmental laws and regulations.
Water
In March 2011, the U.S. Court of Appeals for the Fifth Circuit overturned EPA’s November 2008 rule requiringthat confined animal feeding operations (CAFOs) that “discharge or propose to discharge” apply for permit
9
coverage under the Clean Water Act’s National Pollutant Discharge Elimination System (NPDES). Althoughcompliance with the 2008 rule did not have a material adverse effect on our hog production operations, the FifthCircuit’s decision (which held that only discharging CAFOs have a duty to apply for NPDES permit coverage)has served to clarify the extent of our obligations under the NPDES permit program.
In the fall of 2007, an activist group and others filed a rulemaking petition with the North CarolinaEnvironmental Management Commission (the Commission) requesting that the Commission initiate arulemaking to require monitoring by swine operations covered by federal and state general permits in NorthCarolina. In May 2008, the Commission accepted the petition and directed staff to form a stakeholder group toassist staff in developing a proposed rule before proceeding to public comment and before further Commissionconsideration. Rules were proposed in May 2009, and the matter continues to proceed under the stateadministrative process including a second-round of public comment. Although compliance with a newmonitoring rule in North Carolina could impose additional costs on our hog production operations, such costs arenot expected to have a material adverse effect on our hog production operations.
Air
During calendar year 2002, the National Academy of Sciences (the Academy) undertook a study at EPA’srequest to assist EPA in considering possible future regulation of air emissions from animal feeding operations.The Academy’s study identified a need for more research and better information, but also recommendedimplementing without delay technically and economically feasible management practices to decrease emissions.Further, our hog production subsidiaries have accepted EPA’s offer to enter into an administrative consentagreement and order with owners and operators of hog farms and other animal production operations. Under theterms of the consent agreement and order, participating owners and operators agreed to pay a penalty, contributetowards the cost of an air emissions monitoring study and make their farms available for monitoring. In return,participating farms have been given immunity from federal civil enforcement actions alleging violations of airemissions requirements under certain federal statutes, including the Clean Air Act. Pursuant to our consentagreement and order, we paid a $100,000 penalty to EPA. Premium Standard Farm, Inc.’s (PSF) Texas farms andcompany-owned farms in North Carolina also agreed to participate in this program. The National Pork Board, ofwhich we are a member and financial contributor, paid the costs of the air emissions monitoring study on behalfof all hog producers, including us, out of funds collected from its members in previous years. The cost of thestudy for all hog producers is approximately $6.0 million. Monitoring under the study began in the spring 2007and ended in the winter 2010. EPA made the data available to the public in January 2011 and also issued a Callfor Information seeking additional emissions data to ensure it considers the broadest range of available scientificdata as it develops improved methodologies for estimating emissions. EPA will review the data to developemissions estimating methodologies where site-specific information is unavailable. EPA anticipates making thedraft emission estimation methodologies available for public comment by animal type, beginning with themethodology for broilers in early 2011. The agency anticipates finalizing the methodologies in June 2012. Newregulations governing air emissions from animal agriculture operations are likely to emerge from the monitoringprogram undertaken pursuant to the consent agreement and order. There can be no assurance that any newregulations that may be proposed to address air emissions from animal feeding operations will not have amaterial adverse effect on our financial position or results of operations.
Greenhouse Gases (GHGs) and Climate Change
The EPA finalized regulations in calendar year 2010 under the Clean Air Act, which may trigger new sourcereview and permitting requirements for certain sources of GHG emissions. These rulemakings are all subject tojudicial appeals. There may also be changes in applicable state law pertaining to the regulation of GHGs. Severalstates have taken steps to require the reduction of GHGs by certain companies and public utilities, primarilythrough the planned development of GHG inventories and/or regional GHG cap and trade programs and targetedenforcement.
10
As in virtually every industry, GHG emissions occur at several points across our operations, includingproduction, transportation and processing. Compliance with future legislation, if any, and compliance withcurrently evolving regulation of GHGs by EPA and the states may result in increased compliance costs, capitalexpenditures, and operating costs. In the event that any future compliance requirements at any of our facilitiesrequire more than the sustainability measures that we are currently undertaking to monitor emissions andimprove our energy efficiency, we may experience significant increases in our costs of operation. Such costs mayinclude the cost to purchase offsets or allowances and costs to reduce GHG emissions if such reductions arerequired. These regulatory changes may also lead to higher cost of goods and services which may be passed on tous by suppliers.
As an agriculture-based company, changes to the climate and weather patterns could also affect key inputs to ourbusiness as the result of shifts in temperatures, water availability, precipitation, and other factors. Both the costand availability of corn and other feed crops, for example, could be affected. The regulation or taxation of carbonemissions could also affect the prices of commodities, energy, and other inputs to our business. We believe therecould also be opportunities for us as a result of heightened interest in alternative energy sources, including thosederived from manure, and participation in carbon markets. However, it is not possible at this time to predict thecomplete structure or outcome of any future legislative efforts to address GHG emissions and climate change,whether EPA’s regulatory efforts will survive court challenge, or the eventual cost to us of compliance. Therecan be no assurance that GHG regulation will not have a material adverse effect on our financial position orresults of operations.
E15 Ruling
In October 2010, the Environmental Protection Agency (EPA) granted a “partial waiver” to a statutory bar underthe Clean Air Act prohibiting fuel manufacturers from introducing fuel additives that are not “substantiallysimilar” to those already approved and in use for vehicles of model year (MY) 1975 or later. The EPA’s decisionallows fuel manufactures to increase the ethanol content of gasoline to 15 percent (E15) for use in MY 2007 andnewer light-duty motor vehicles, including passenger cars, light-duty trucks, and medium-duty passengervehicles. In January 2011, the EPA granted another partial waiver authorizing E15 use in MY 2001-2006 light-duty motor vehicles. Prior to EPA’s decisions, the ethanol content of gasoline in the United States was limited to10 percent. These rulemakings are all subject to judicial appeals.
Taken together, the two actions by the EPA allow the introduction of E15 into commerce and the marketplace bymanufacturers. Although the long-term impact of E15 is currently unknown, studies have shown that expandedcorn-based ethanol production has driven up the price of livestock feed and led to commodity-price volatility.We cannot presently assess the full economic impact of the proposed regulations on the meat processing industryor on our operations.
Proposed GIPSA Rule
In June 2010, the United States Department of Agriculture, Grain Inspection, Packers and StockyardsAdministration (GIPSA) published a proposed rule adding new regulations under the Packers and Stockyards Actand requested public comment. The public comment period has closed, and GIPSA is considering what, if anychanges it may adopt based on the comments received. These new regulations, if adopted as proposed, couldsignificantly impact our relationships both with other meat packers to whom we sell livestock and with ourindependent contract growers from whom we buy livestock by prohibiting or restricting numerous practices thathave been permitted for decades. We cannot presently assess the full economic impact of the proposedregulations on the meat processing industry or on our operations.
Regulatory and Other Proceedings
From time to time we receive notices from regulatory authorities and others asserting that we are not incompliance with certain environmental laws and regulations. In some instances, litigation ensues.
11
In March 2006 (fiscal 2006), we settled two citizen citation lawsuits alleging among other things violations ofcertain environmental laws. The consent decree provides, among other things, that our subsidiary, Murphy-Brown LLC, will undertake a series of measures designed to enhance the performance of the swine wastemanagement systems on approximately 244 company-owned farms in North Carolina and thereby reduce thepotential for surface water or ground water contamination from these farms. Murphy-Brown has successfullycompleted a number of the measures called for in the consent decree and expects to fulfill its remaining consentdegree obligations over the next two to three years, at which time it will move for termination of the decree.
Prior to our acquisition of PSF, it had entered into a consent judgment with the State of Missouri and a consentdecree with the federal government and a citizens group. The judgment and decree generally required that PSFpay penalties to settle past alleged regulatory violations, utilize new technologies to reduce nitrogen in thematerial that it applies to farm fields and research, and develop and implement “Next Generation Technology”for environmental controls at certain of its Missouri operations.
Prior to our acquisition of PSF, it estimated in 2004 that it would invest approximately $33.0 million in totalcapital to implement the new technologies by calendar 2010 to comply with the judgment and decree. As ofMay 1, 2011, PSF estimated costs to comply with the judgment and decree to be approximately $37.2 million, ofwhich $33.5 million had been spent. Included in these expenditures is a fertilizer plant in northern Missouri thatconverts waste into commercial grade fertilizer. We also anticipated spending an estimated $2.3 million toreplace aging lagoon covers, which PSF installed in the past to comply with consent judgment obligations.
On September 1, 2010, PSF and the Attorney General of the State of Missouri jointly filed a Judgment Extendingthe Consent Judgment (the Extension) to install new technologies approved in April 2010 by the panel ofuniversity experts responsible for approving new technologies. Pursuant to the terms of the Extension, PSFagreed, among other things, to reduce the hog population at three farms, install mechanical devices designed toscrape manure from the subfloors of barns at certain Missouri farms (the scrapers), and make a voluntarypayment of $1.0 million to the road funds and school funds in specified Missouri counties where PSF operates.The Extension provides for various benchmarks and a timetable to complete these tasks with stipulated penaltiesfor not meeting the deadlines. PSF surpassed the initial milestones for 2010 and is presently ahead of schedulefor 2011. The deadline for the full installation of the scrapers has been extended to July 31, 2012. Although PSFcontinues to analyze the expected costs to implement the Extension, it does not currently expect that the costs tocomply with the Extension will materially increase the $37.2 million estimate to comply with the judgment anddecree as of May 1, 2011.
For further information regarding regulatory matters resulting in litigation, see “Item 3. Legal Proceedings.”
Environmental Stewardship
In July 2000, in furtherance of our continued commitment to responsible environmental stewardship, we and ourNorth Carolina-based hog production subsidiaries voluntarily entered into an agreement with the AttorneyGeneral of North Carolina (the Agreement) designed to enhance water quality in the State of North Carolinathrough a series of initiatives to be undertaken by us and our subsidiaries while protecting access to swineoperations in North Carolina. One of the features of the Agreement reflects our commitment to preserving andenhancing the environment of eastern North Carolina by providing a total of $50.0 million to assist in thepreservation of wetlands and other natural areas in eastern North Carolina and to promote similar environmentalenhancement activities. To fulfill our commitment, we made annual contributions of $2.0 million beginning infiscal 2001 through fiscal 2010. Due to the losses we were experiencing in our Hog Production segment in fiscal2010, we entered into an agreement with the Attorney General of North Carolina to defer our annual payments infiscal 2011 and fiscal 2012. This agreement does not reduce our $50.0 million commitment, and we expect tore-start our annual $2.0 million payment in fiscal 2013.
12

Animal Welfare
Our animal care management program guides the proper and humane care of our animals at every stage of theirlives, from gestation to transport to processing plant. All farm employees and contract hog producers mustemploy the methods and techniques of the management system and take steps to verify their compliance.Adherence to proper animal welfare management is a condition of our agreements with contract producers. Weare committed to providing nutritious food and fresh water, sound veterinary care, appropriate treatment,protection from weather conditions, and freedom from willful neglect or abuse. Our Hog Production segmentraises animals according to the National Pork Board’s (NPB) Pork Quality Assurance Plus Program (PQAPlus®). The program’s concepts and methods are similar to the animal care management system we haddeveloped ourselves in 2001 and was one of the most comprehensive programs in our industry. We assisted theNational Pork Board in the development of PQA Plus. Our employees and contract hog producers become PQAPlus certified only after attending a training session on good production practices (which includes topics such asresponsible animal handling, disease prevention, biosecurity, responsible antibiotic use, and appropriate feeding).Farms entered into the program undergo regular on-farm site assessments and become eligible for random third-party audits. PQA Plus certification is valid for three years. We obtained certification of all company-owned andcontract farms under the PQA Plus program by the end of calendar year 2009.
Smithfield was also one of the founding adopters of the National Pork Board’s “We Care” program, whichdemonstrates that pork producers are accountable to established ethical principles and animal well-beingpractices.
In January 2007 (fiscal 2007), we announced a voluntary, ten-year program to phase out individual gestationstalls at our sow farms and replace the gestation stalls with group pens. We currently estimate the total cost ofour transition to group pens to be approximately $300.0 million. As previously disclosed, we announced thedelay of capital expenditures for the program due to significant operating losses previously incurred by our HogProduction segment and that we no longer expected to complete the phase-out within ten years of the originalannouncement. In third quarter of fiscal 2011, we restarted capital expenditures for the program. This programrepresents a significant financial commitment and reflects our desire to be more animal friendly, as well as toaddress the concerns and needs of our customers. By the end of calendar year 2011, we expect that nearly 30percent of company-owned sows will be in group housing facilities.
EMPLOYEES
The following table shows the approximate number of our employees and the approximate number of employeescovered by collective bargaining agreements or that are members of labor unions in each segment, as of May 1,2011:
Segment Employees
Employees Covered byCollective Bargaining
Agreements(1)
Pork . . . . . . . . . . . . . . . . . . . . . . . . . . . . . . . . . . . . . . . . . . . . . . . . . . . . . . . . . 31,000 20,500International . . . . . . . . . . . . . . . . . . . . . . . . . . . . . . . . . . . . . . . . . . . . . . . . . . 10,300 2,500Hog Production . . . . . . . . . . . . . . . . . . . . . . . . . . . . . . . . . . . . . . . . . . . . . . . . 4,900 —Corporate . . . . . . . . . . . . . . . . . . . . . . . . . . . . . . . . . . . . . . . . . . . . . . . . . . . . 150 —
Totals . . . . . . . . . . . . . . . . . . . . . . . . . . . . . . . . . . . . . . . . . . . . . . . . . . . 46,350 23,000
(1) Includes employees that are members of labor unions.
Approximately 3,700 are covered by collective bargaining agreements that expire in fiscal 2012. Collectivebargaining agreements covering other employees expire over periods throughout the next several years. Webelieve that our relationship with our employees is satisfactory.
13

FINANCIAL INFORMATION ABOUT GEOGRAPHIC AREAS
See Note 18 in “Item 8. Financial Statements and Supplementary Data” for financial information aboutgeographic areas. See “Item 1A. Risk Factors” for a discussion of the risks associated with our international salesand operations.
AVAILABLE INFORMATION
Our website address is www.smithfieldfoods.com. The information on our website is not part of this annualreport. Our annual report on Form 10-K, quarterly reports on Form 10-Q, current reports on Form 8-K and anyamendments to those reports are available free of charge through our website as soon as reasonably practicableafter filing or furnishing the material to the SEC. You may read and copy documents we file at the SEC’s PublicReference Room at 100 F Street, N.E., Washington D.C. 20549. Please call the SEC at 1-800-SEC-0330 forinformation on the public reference room. The SEC maintains a website that contains annual, quarterly andcurrent reports, proxy statements and other information that issuers (including us) file electronically with theSEC. The SEC’s website is www.sec.gov.
ITEM 1A. RISK FACTORS
The following risk factors should be read carefully in connection with evaluating our business and the forward-looking information contained in this Annual Report on Form 10-K. The risk factors below represent what webelieve are the known material risk factors with respect to us and our business. Any of the following risks couldmaterially adversely affect our business, operations, industry, financial position or future financial results.
Our results of operations are cyclical and could be adversely affected by fluctuations in the commodityprices for hogs and grains.
We are largely dependent on the cost and supply of hogs and feed ingredients and the selling price of ourproducts and competing protein products, all of which are determined by constantly changing and volatile marketforces of supply and demand as well as other factors over which we have little or no control. These other factorsinclude:
• competing demand for corn for use in the manufacture of ethanol or other alternative fuels,
• environmental and conservation regulations,
• import and export restrictions such as trade barriers resulting from, among other things, health concerns,
• economic conditions,
• weather, including weather impacts on our water supply and the impact on the availability and pricing ofgrains,
• energy prices, including the effect of changes in energy prices on our transportation costs and the cost offeed, and
• crop and livestock diseases.
We cannot assure you that all or part of any increased costs experienced by us from time to time can be passedalong to consumers of our products, in a timely manner or at all.
Hog prices demonstrate a cyclical nature over periods of years, reflecting the supply of hogs on the market.Further, hog raising costs are largely dependent on the fluctuations of commodity prices for corn and other feedingredients. For example, our fiscal 2009 results of operations were negatively impacted by higher feed and feedingredient costs which increased hog raising costs to $62 per hundredweight in fiscal 2009 from $50 per hundredweight in the prior year, or 24%, at a time of continued weak lean hog prices due to excess supply. When hogprices are lower than our hog production costs, our non-vertically integrated competitors may have a costadvantage.
14

Additionally, commodity pork prices demonstrate a cyclical nature over periods of years, reflecting changes inthe supply of fresh pork and competing proteins on the market, especially beef and chicken.
We attempt to manage certain of these risks through the use of our risk management and hedging programs.However, these programs may also limit our ability to participate in gains from favorable commodityfluctuations. For example, we ensured availability of grain supplies in the summer of 2008 through the end offiscal 2009 by locking in corn at approximately $6 per bushel through this period. As a result, our feed costsremained at these high levels through the end of fiscal 2009 despite the decrease in the price of corn on thecommodities markets during such period. The high cost of feed, in particular corn, and the impact of thesehedges were principal factors in making the Hog Production segment unprofitable during fiscal 2009 and fiscal2010. Additionally, a portion of our commodity derivative contracts are marked-to-market such that the relatedunrealized gains and losses are reported in earnings on a quarterly basis. This accounting treatment may causesignificant volatility in our quarterly earnings. See “Item 7. Management’s Discussion and Analysis of FinancialCondition and Results of Operations-Derivative Financial Instruments” for further information.
Outbreaks of disease among or attributed to livestock can significantly affect production, the supply ofraw materials, demand for our products and our business.
We take precautions to ensure that our livestock are healthy and that our processing plants and other facilitiesoperate in a sanitary manner. Nevertheless, we are subject to risks relating to our ability to maintain animalhealth and control diseases. Livestock health problems could adversely impact production, the supply of rawmaterials and consumer confidence in all of our operating segments.
From time to time, we have experienced outbreaks of certain livestock diseases and we may experienceadditional occurrences of disease in the future. Disease can reduce the number of offspring produced, hamper thegrowth of livestock to finished size, result in expensive vaccination programs and require in some cases thedestruction of infected livestock, all of which could adversely affect our production or ability to sell or export ourproducts. Adverse publicity concerning any disease or health concern could also cause customers to loseconfidence in the safety and quality of our food products, particularly as we expand our branded pork products.In addition to risks associated with maintaining the health of our livestock, any outbreak of disease elsewhere inthe U.S. or in other countries could reduce consumer confidence in the meat products affected by the particulardisease, generate adverse publicity, depress market conditions for our hogs internationally and/or domesticallyand result in the imposition of import or export restrictions.
Outbreaks of disease among or attributed to livestock also may have indirect consequences that adversely affectour business. For example, past outbreaks of avian influenza in various parts of the world reduced the globaldemand for poultry and thus created a temporary surplus of poultry both domestically and internationally. Thispoultry surplus placed downward pressure on poultry prices which in turn reduced meat prices including porkboth in the U.S. and internationally.
Any perceived or real health risks related to our products or the food industry generally or increasedregulation could adversely affect our ability to sell our products.
We are subject to risks affecting the food industry generally, including risks posed by the following:
• food spoilage or food contamination,
• evolving consumer preferences and nutritional and health-related concerns,
• consumer product liability claims,
• product tampering,
• the possible unavailability and expense of product liability insurance, and
• the potential cost and disruption of a product recall.
15

Adverse publicity concerning any perceived or real health risk associated with our products could also causecustomers to lose confidence in the safety and quality of our food products, which could adversely affect ourability to sell our products, particularly as we expand our branded products business. We could also be adverselyaffected by perceived or real health risks associated with similar products produced by others to the extent suchrisks cause customers to lose confidence in the safety and quality of such products generally and, therefore, leadcustomers to opt for other meat options that are perceived as safe. The A(H1N1) influenza outbreak that began inlate fiscal 2009 illustrates the adverse impact that can result from perceived health risks associated with theproducts we sell. Although the CDC and other regulatory and scientific bodies indicated that people cannot getA(H1N1) influenza from eating cooked pork or pork products, the perception of some consumers that the diseasecould be transmitted in that manner was the apparent cause of the temporary decline in pork consumption in latefiscal 2009 and early fiscal 2010.
Our products are susceptible to contamination by disease producing organisms or pathogens, such as Listeriamonocytogenes, Salmonella, Campylobacter and generic E. coli. Because these organisms and pathogens aregenerally found in the environment, there is a risk that one or more, as a result of food processing, could bepresent in our products. We have systems in place designed to monitor food safety risks throughout all stages ofour vertically integrated process. However, we cannot assure you that such systems, even when workingeffectively, will eliminate the risks related to food safety. These organisms and pathogens can also be introducedto our products as a result of improper handling at the further processing, foodservice or consumer level. Inaddition to the risks caused by our processing operations and the subsequent handling of the products, we mayencounter the same risks if any third party tampers with our products. We could be required to recall certain ofour products in the event of contamination or adverse test results. Any product contamination also could subjectus to product liability claims, adverse publicity and government scrutiny, investigation or intervention, resultingin increased costs and decreased sales as customers lose confidence in the safety and quality of our foodproducts. Any of these events could have an adverse impact on our operations and financial results.
Our manufacturing facilities and products, including the processing, packaging, storage, distribution, advertisingand labeling of our products, are subject to extensive federal, state and foreign laws and regulations in the foodsafety area, including constant government inspections and governmental food processing controls. Loss of orfailure to obtain necessary permits and registrations could delay or prevent us from meeting current productdemand, introducing new products, building new facilities or acquiring new businesses and could adversely affectoperating results. If we are found to be out of compliance with applicable laws and regulations, particularly if itrelates to or compromises food safety, we could be subject to civil remedies, including fines, injunctions, recalls orasset seizures, as well as potential criminal sanctions, any of which could have an adverse effect on our financialresults. In addition, future material changes in food safety regulations could result in increased operating costs orcould be required to be implemented on schedules that cannot be met without interruptions in our operations.
Environmental regulation and related litigation and commitments could have a material adverse effect onus.
Our past and present business operations and properties are subject to extensive and increasingly stringentfederal, state, local and foreign laws and regulations pertaining to protection of the environment, includingamong others:
• the treatment and discharge of materials into the environment,
• the handling and disposition of manure and solid wastes and
• the emission of greenhouse gases.
Failure to comply with these laws and regulations or any future changes to them may result in significantconsequences to us, including administrative, civil and criminal penalties, liability for damages and negativepublicity. Some requirements applicable to us may also be enforced by citizen groups or other third parties.Natural disasters, such as flooding and hurricanes, can cause the discharge of effluents or other waste into the
16

environment, potentially resulting in our being subject to further liability claims and governmental regulation ashas occurred in the past. See “Item 1. Business—Regulation” for further discussion of regulatory compliance asit relates to environmental risk. We have incurred, and will continue to incur, significant capital and operatingexpenditures to comply with these laws and regulations.
We also face the risk of lawsuits based on the law of nuisance even if we are operating in compliance withapplicable regulations. Before we acquired PSF and subsequent to our acquisition of PSF, certain nuisance suitsin Missouri resulted in jury verdicts against PSF. Currently, we are defending a number of additional nuisancesuits with respect to farms in Missouri. See “Item 3. Legal Proceedings—Missouri litigation.” Although we arecontinuing PSF’s vigorous defense of these claims, we cannot assure you that we will be successful, thatadditional nuisance claims will not arise in the future or that the accruals for this litigation will not have to besubstantially increased.
In addition, we acquired PSF in fiscal 2008, which entered into environmental consent decrees in the State ofMissouri requiring PSF to research, develop and implement new technologies to control wastewater, air and odoremissions from its Missouri farms. See “Item 1. Business—Regulation” for further information regarding theseobligations. We cannot assure you that the costs of carrying out these obligations will not exceed previousestimates or that requirements applicable to us will not be altered in ways that will require us to incur significantadditional costs and adversely affect our financial results. In addition, new environmental issues could arise thatwould cause currently unanticipated investigations, assessments or expenditures.
Governmental authorities may take further action restricting our ability to produce and/or sell livestockor adopt new regulations impacting our production or processing operations, which could adversely affectour business.
A number of states, including Iowa and Missouri, have adopted legislation that prohibits or restricts the ability ofmeat packers, or in some cases corporations generally, from owning livestock or engaging in farming. Inaddition, Congress has recently considered federal legislation that would ban meat packers from owninglivestock. We cannot assure you that such or similar legislation affecting our operations will not be adopted at thefederal or state levels in the future. Such legislation, if adopted and applicable to our current operations and notsuccessfully challenged or settled, could have a material adverse impact on our operations and our financialstatements.
In fiscal 2008, the State of North Carolina enacted a permanent moratorium on the construction of new hog farmsusing the lagoon and sprayfield system. The moratorium limits us from expanding our North Carolina productionoperations. This permanent moratorium replaced a 10-year moratorium on the construction of hog farms withmore than 250 hogs or the expansion of existing large farms. This moratorium may over time lead to increasedcompetition for contract growers.
Further, in June 2010, the United States Department of Agriculture, Grain Inspection, Packers and StockyardsAdministration (GIPSA) published a proposed rule adding new regulations under the Packers and Stockyards Act(PSA). If adopted as proposed, the new regulations appear to, among other things:
• prohibit meat packers from purchasing livestock from other packers or their affiliates;
• eliminate the requirement that GIPSA or livestock producers demonstrate competitive harm to proveviolations of Sections 202(a) and 202(b) of the PSA, which sections limit unfair, unjustly discriminatoryor deceptive practices and undue or unreasonable preferences or advantages in livestock purchasingpractices;
• require meat packers to maintain written records justifying deviations from standard price or contractterms offered to livestock producers; and
• limit a packer’s ability to purchase livestock through dealers operating as packer buyers.
17

As an integrated hog producer and processor, these new regulations, if adopted, could significantly impact ourrelationships both with other meat packers to whom we sell livestock and with our independent contract growersfrom whom we buy livestock by prohibiting or restricting numerous practices that have been permitted for decades.We cannot predict whether the proposed regulations or some modified regulations will be adopted or the extent ofthe effect of any such regulations on the meat processing industry or on our operations or financial results.
Our level of indebtedness and the terms of our indebtedness could adversely affect our business andliquidity position.
As of May 1, 2011, we had:
• approximately $2.1 billion of indebtedness;
• guarantees of up to $87.0 million for the financial obligations of certain unconsolidated joint ventures andhog farmers;
• guarantees of $12.4 million for leases that were transferred to JBS in connection with the sale ofSmithfield Beef; and
• aggregate borrowing capacity available under our ABL Credit Facility (as defined below) totaling $855.9million, taking into account no outstanding borrowings and outstanding letters of credit of $144.1 million.
In June 2011 (fiscal 2012), we refinanced our asset-based revolving credit agreement totaling $1.0 billion thatsupported short-term funding needs and letters of credit (the ABL Credit Facility) into two separate facilities:(1) an inventory based revolving credit facility up to $925 million, with an option to expand up to $1.25 billion(the Inventory Revolver), and (2) an accounts receivable securitization facility up to $275 million (theSecuritization Facility). We may request working capital loans and letters of credit under both facilities.
Our indebtedness may increase from time to time for various reasons, including fluctuations in operating results,working capital needs, capital expenditures and potential acquisitions or joint ventures. In addition, due to thevolatile nature of the commodities markets, we may have to borrow significant amounts to cover any margincalls under our risk management and hedging programs. During fiscal 2011, margin deposits posted by us rangedfrom $(50.6) million to $193.9 million (negative amounts representing margin deposits we have received fromour brokers). Our consolidated indebtedness level could significantly affect our business because:
• it may, together with the financial and other restrictive covenants in the agreements governing ourindebtedness, limit or impair our ability in the future to obtain financing, refinance any of ourindebtedness, sell assets or raise equity on commercially reasonable terms or at all, which could cause usto default on our obligations and materially impair our liquidity,
• a downgrade in our credit rating could restrict or impede our ability to access capital markets at attractiverates and increase the cost of future borrowings,
• it may reduce our flexibility to respond to changing business and economic conditions or to takeadvantage of business opportunities that may arise,
• a portion of our cash flow from operations must be dedicated to interest payments on our indebtednessand is not available for other purposes, which amount would increase if prevailing interest rates rise,
• substantially all of our assets in the United States secure the Inventory Revolver, the SecuritizationFacility, our $200.0 million term loan due June 9, 2016 (the Rabobank Term Loan) and our outstandingsenior secured notes, which could limit our ability to dispose of such assets or utilize the proceeds of suchdispositions and, upon an event of default under any such secured indebtedness, the lenders thereundercould foreclose upon our pledged assets, and
• it could make us more vulnerable to downturns in general economic or industry conditions or in ourbusiness.
18

Further, our debt agreements restrict the payment of dividends to shareholders and, under certain circumstances,may limit additional borrowings, investments, the acquisition or disposition of assets, mergers andconsolidations, transactions with affiliates, the creation of liens and the repayment of certain debt.
Should market conditions deteriorate, or our operating results be depressed in the future, we may have to requestamendments to our covenants and restrictions. There can be no assurance that we will be able to obtain suchrelief should it be needed in the future. A breach of any of these covenants or restrictions could result in a defaultthat would permit our senior lenders, including lenders under the Inventory Revolver, the Securitization Facility,the Rabobank Term Loan, the holders of our senior secured notes or the holders of our senior unsecured notes, asthe case may be, to declare all amounts outstanding under the Inventory Revolver, the Securitization Facility, theRabobank Term Loan, the senior secured notes or the senior unsecured notes to be due and payable, togetherwith accrued and unpaid interest, and the commitments of the relevant lenders to make further extensions ofcredit under the Inventory Revolver and the Securitization Facility could be terminated. If we were unable torepay our secured indebtedness to our lenders, these lenders could proceed against the collateral securing thatindebtedness, which could include substantially all of our assets. Our future ability to comply with financialcovenants and other conditions, make scheduled payments of principal and interest, or refinance existingborrowings depends on future business performance that is subject to economic, financial, competitive and otherfactors, including the other risks set forth in this Item 1A.
We may not be successful in implementing and executing on our hog production cost savings initiative.
In fiscal 2010, we announced a plan to improve the cost structure and profitability of our domestic hogproduction operations. The Cost Savings Initiative includes a number of undertakings designed to improveoperating efficiencies and productivity. These consist of farm reconfigurations and conversions, and terminationof certain high cost, third party hog grower contracts and breeding stock sourcing contracts, as well as a numberof other cost reduction activities. We can provide no assurance, however, that the Cost Savings Initiative willresult in the expected profitability improvement in our Hog Production segment.
Our operations are subject to the risks associated with acquisitions and investments in joint ventures.
From time to time we review opportunities for strategic growth through acquisitions. We have also pursued andmay in the future pursue strategic growth through investment in joint ventures. These acquisitions andinvestments may involve large transactions or realignment of existing investments. These transactions presentfinancial, managerial and operational challenges, including:
• diversion of management attention from other business concerns,
• difficulty with integrating businesses, operations, personnel and financial and other systems,
• lack of experience in operating in the geographical market of the acquired business,
• increased levels of debt potentially leading to associated reduction in ratings of our debt securities andadverse impact on our various financial ratios,
• the requirement that we periodically review the value at which we carry our investments in joint ventures,and, in the event we determine that the value at which we carry a joint venture investment has beenimpaired, the requirement to record a non-cash impairment charge, which charge could substantiallyaffect our reported earnings in the period of such charge, would negatively impact our financial ratios andcould limit our ability to obtain financing in the future,
• potential loss of key employees and customers of the acquired business,
• assumption of and exposure to unknown or contingent liabilities of acquired businesses,
• potential disputes with the sellers, and
• for our investments, potential lack of common business goals and strategies with, and cooperation of, ourjoint venture partners.
19

In addition, acquisitions outside the U.S. may present unique difficulties and increase our exposure to those risksassociated with international operations.
We could experience financial or other setbacks if any of the businesses that we have acquired or may acquire inthe future have problems of which we are not aware or liabilities that exceed expectations.
Our numerous equity investments in joint ventures, partnerships and other entities, both within and outside theU.S., are periodically involved in modifying and amending their credit facilities and loan agreements. The abilityof these entities to refinance or amend their facilities on a successful and satisfactory basis, and to comply withthe covenants in their financing facilities, affects our assessment of the carrying value of any individualinvestment. As of May 1, 2011, none of our equity investments represented more than 6% of our totalconsolidated assets. If we determine in the future that an investment is impaired, we would be required to recorda non-cash impairment charge, which could substantially affect our reported earnings in the period of suchcharge. In addition, any such impairment charge would negatively impact our financial ratios and could limit ourability to obtain financing in the future. See “Item 8. Notes to Consolidated Financial Statements—Note 7:Investments” for a discussion of the accounting treatment of our equity investments.
We are subject to risks associated with our international sales and operations.
Sales to international customers accounted for approximately 22% of our net sales in fiscal 2011. We conductforeign operations in Poland, Romania and the United Kingdom and export our products to more than 40countries. In addition, we are engaged in joint ventures in Mexico and have a significant investment in WesternEurope. As of May 1, 2011, approximately 32% of our long-lived assets were associated with our foreignoperations. Because of the growing market share of U.S. pork products in the international markets, U.S.exporters are increasingly being affected by measures taken by importing countries to protect local producers.
Our international sales, operations and investments are subject to various risks related to economic or politicaluncertainties including among others:
• general economic and political conditions,
• imposition of tariffs, quotas, trade barriers and other trade protection measures imposed by foreigncountries,
• the closing of borders by foreign countries to the import of our products due to animal disease or otherperceived health or safety issues,
• difficulties and costs associated with complying with, and enforcing remedies under, a wide variety ofcomplex domestic and international laws, treaties and regulations,
• different regulatory structures and unexpected changes in regulatory environments,
• tax rates that may exceed those in the United States and earnings that may be subject to withholdingrequirements and incremental taxes upon repatriation,
• potentially negative consequences from changes in tax laws, and
• distribution costs, disruptions in shipping or reduced availability of freight transportation.
Furthermore, our foreign operations are subject to the risks described above as well as additional risks anduncertainties including among others:
• fluctuations in currency values, which have affected, among other things, the costs of our investments inforeign operations,
• translation of foreign currencies into U.S. dollars, and
• foreign currency exchange controls.
20

Negative consequences relating to these risks and uncertainties could jeopardize or limit our ability to transactbusiness in one or more of those markets where we operate or in other developing markets and could adverselyaffect our financial results.
Our operations are subject to the general risks of litigation.
We are involved on an ongoing basis in litigation arising in the ordinary course of business or otherwise. Trendsin litigation may include class actions involving consumers, shareholders, employees or injured persons, andclaims related to commercial, labor, employment, antitrust, securities or environmental matters. Moreover, theprocess of litigating cases, even if we are successful, may be costly, and may approximate the cost of damagessought. These actions could also expose us to adverse publicity, which might adversely affect our brands,reputation and/or customer preference for our products. Litigation trends and expenses and the outcome oflitigation cannot be predicted with certainty and adverse litigation trends, expenses and outcomes could adverselyaffect our financial results.
We depend on availability of, and satisfactory relations with, our employees.
As of May 1, 2011, we had approximately 46,350 employees, 23,000 of whom are covered by collectivebargaining agreements or are members of labor unions. Our operations depend on the availability, retention andrelative costs of labor and maintaining satisfactory relations with employees and the labor unions. Further,employee shortages can and do occur, particularly in rural areas where some of our operations are located. Laborrelations issues arise from time to time, including issues in connection with union efforts to represent employeesat our plants and with the negotiation of new collective bargaining agreements. If we fail to maintain satisfactoryrelations with our employees or with the labor unions, we may experience labor strikes, work stoppages or otherlabor disputes. Negotiation of collective bargaining agreements also could result in higher ongoing labor costs. Inaddition, the discovery by us or governmental authorities of undocumented workers, as has occurred in the past,could result in our having to attempt to replace those workers, which could be disruptive to our operations or maybe difficult to do.
Immigration reform continues to attract significant attention in the public arena and the U.S. Congress. If newimmigration legislation is enacted, such laws may contain provisions that could increase our costs in recruiting,training and retaining employees. Also, although our hiring practices comply with the requirements of federallaw in reviewing employees’ citizenship or authority to work in the U.S., increased enforcement efforts withrespect to existing immigration laws by governmental authorities may disrupt a portion of our workforce or ouroperations at one or more of our facilities, thereby negatively impacting our business.
We cannot assure you that these activities or consequences will not adversely affect our financial results in thefuture.
The continued consolidation of customers could negatively impact our business.
Our ten largest customers represented approximately 30% of net sales for fiscal year 2011. We do not have long-term sales agreements (other than to certain third-party hog customers) or other contractual assurances as tofuture sales to these major customers. In addition, continued consolidation within the retail industry, includingamong supermarkets, warehouse clubs and food distributors, has resulted in an increasingly concentrated retailbase and increased our credit exposure to certain customers. Our business could be materially adversely affectedand suffer significant set backs in sales and operating income from the loss of some of our larger customers or ifour larger customers’ plans, markets, and/or financial condition should change significantly.
An impairment in the carrying value of goodwill could negatively impact our consolidated results ofoperations and net worth.
Goodwill is recorded at fair value and is not amortized, but is reviewed for impairment at least annually or morefrequently if impairment indicators arise. In evaluating the potential for impairment of goodwill, we make
21

assumptions regarding future operating performance, business trends, and market and economic conditions. Suchanalyses further require us to make judgmental assumptions about sales, operating margins, growth rates, anddiscount rates. There are inherent uncertainties related to these factors and to management’s judgment inapplying these factors to the assessment of goodwill recoverability. Goodwill reviews are prepared usingestimates of the fair value of reporting units based on market multiples of EBITDA (earnings before interest,taxes, depreciation and amortization) and/or on the estimated present value of future discounted cash flows. Wecould be required to evaluate the recoverability of goodwill prior to the annual assessment if we experiencedisruptions to the business, unexpected significant declines in operating results, divestiture of a significantcomponent of our business or market capitalization declines. For example, at the end of the third quarter of fiscal2009, we performed an interim test of the carrying amount of goodwill related to our U.S. hog productionoperations. We undertook this test due to the significant losses incurred in our hog production operations anddecline in the market price of our common stock at that time. We determined that the fair value of our U.S. hogproduction reporting unit exceeded its carrying value by more than 20%. Therefore goodwill was not impaired.However, these types of events and the resulting analyses could result in non-cash goodwill impairment chargesin the future.
Impairment charges could substantially affect our reported earnings in the periods of such charges. In addition,impairment charges would negatively impact our financial ratios and could limit our ability to obtain financing inthe future. As of May 1, 2011, we had $793.3 million of goodwill, which represented approximately 10% of totalassets.
Deterioration of economic conditions could negatively impact our business.
Our business may be adversely affected by changes in national or global economic conditions, includinginflation, interest rates, availability of and access to capital markets, consumer spending rates, energy availabilityand costs (including fuel surcharges) and the effects of governmental initiatives to manage economic conditions.Any such changes could adversely affect the demand for our products or the cost and availability of our neededraw materials, cooking ingredients and packaging materials, thereby negatively affecting our financial results.
Disruptions and instability in credit and other financial markets and deterioration of national and globaleconomic conditions, could, among other things:
• make it more difficult or costly for us to obtain financing for our operations or investments or to refinanceour debt in the future;
• cause our lenders to depart from prior credit industry practice and make more difficult or expensive thegranting of any technical or other waivers under our credit agreements to the extent we may seek them inthe future;
• impair the financial condition of some of our customers, suppliers or counterparties to our derivativeinstruments, thereby increasing customer bad debts, non-performance by suppliers or counterpartyfailures negatively impacting our treasury operations;
• negatively impact global demand for protein products, which could result in a reduction of sales,operating income and cash flows;
• decrease the value of our investments in equity and debt securities, including our company-owned lifeinsurance and pension plan assets, which could result in higher pension cost and statutorily mandatedfunding requirements; and
• impair the financial viability of our insurers.
ITEM 1B. UNRESOLVED STAFF COMMENTS
None
22
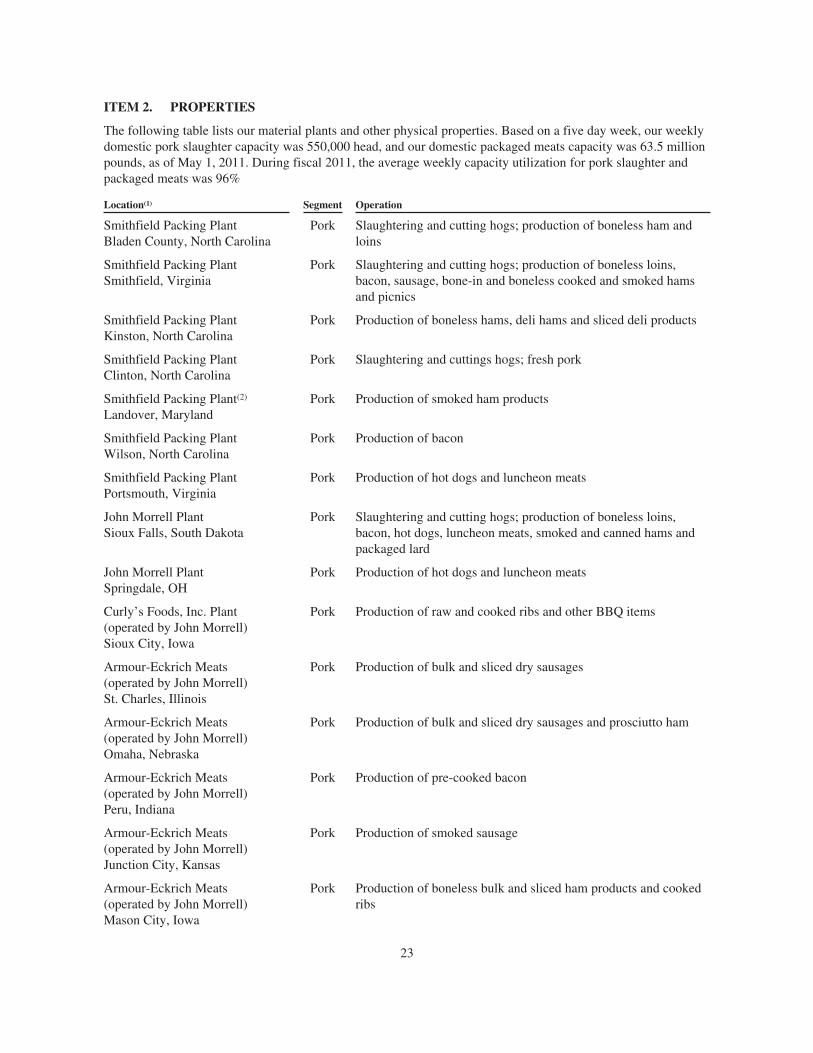
ITEM 2. PROPERTIES
The following table lists our material plants and other physical properties. Based on a five day week, our weeklydomestic pork slaughter capacity was 550,000 head, and our domestic packaged meats capacity was 63.5 millionpounds, as of May 1, 2011. During fiscal 2011, the average weekly capacity utilization for pork slaughter andpackaged meats was 96%
Location(1) Segment Operation
Smithfield Packing PlantBladen County, North Carolina
Pork Slaughtering and cutting hogs; production of boneless ham andloins
Smithfield Packing PlantSmithfield, Virginia
Pork Slaughtering and cutting hogs; production of boneless loins,bacon, sausage, bone-in and boneless cooked and smoked hamsand picnics
Smithfield Packing PlantKinston, North Carolina
Pork Production of boneless hams, deli hams and sliced deli products
Smithfield Packing PlantClinton, North Carolina
Pork Slaughtering and cuttings hogs; fresh pork
Smithfield Packing Plant(2)
Landover, MarylandPork Production of smoked ham products
Smithfield Packing PlantWilson, North Carolina
Pork Production of bacon
Smithfield Packing PlantPortsmouth, Virginia
Pork Production of hot dogs and luncheon meats
John Morrell PlantSioux Falls, South Dakota
Pork Slaughtering and cutting hogs; production of boneless loins,bacon, hot dogs, luncheon meats, smoked and canned hams andpackaged lard
John Morrell PlantSpringdale, OH
Pork Production of hot dogs and luncheon meats
Curly’s Foods, Inc. Plant(operated by John Morrell)Sioux City, Iowa
Pork Production of raw and cooked ribs and other BBQ items
Armour-Eckrich Meats(operated by John Morrell)St. Charles, Illinois
Pork Production of bulk and sliced dry sausages
Armour-Eckrich Meats(operated by John Morrell)Omaha, Nebraska
Pork Production of bulk and sliced dry sausages and prosciutto ham
Armour-Eckrich Meats(operated by John Morrell)Peru, Indiana
Pork Production of pre-cooked bacon
Armour-Eckrich Meats(operated by John Morrell)Junction City, Kansas
Pork Production of smoked sausage
Armour-Eckrich Meats(operated by John Morrell)Mason City, Iowa
Pork Production of boneless bulk and sliced ham products and cookedribs
23

Location(1) Segment Operation
Armour-Eckrich Meats(operated by John Morrell)St. James, Minnesota
Pork Production of sliced luncheon meats
Farmland PlantCrete, Nebraska
Pork Slaughtering and cutting hogs; fresh and packaged porkproducts
Farmland PlantMonmouth, Illinois
Pork Slaughtering and cutting hogs; production of bacon andprocessed hams, extra tender and ground pork
Farmland PlantDenison, Iowa
Pork Slaughtering and cutting hogs; production of bacon andprocessed hams
Farmland PlantMilan, Missouri
Pork Slaughtering and cutting hogs; fresh pork
Farmland PlantWichita, Kansas
Pork Production of hot dogs and luncheon meats
Cook’s Hams Plant(operated by Farmland Foods)Lincoln, Nebraska
Pork Production of traditional and spiral sliced smoked bone-inhams; corned beef and other smoked meat items
Cook’s Hams Plant(operated by Smithfield Packing)Grayson, Kentucky
Pork Production of spiral hams and smoked ham products
Cook’s Hams Plant(operated by Farmland Foods)Martin City, Missouri
Pork Production of spiral hams
Patrick Cudahy Plant(operated by John Morrell)Cudahy, Wisconsin
Pork Production of bacon, dry sausage, boneless cooked hams andrefinery products
Animex PlantSzczecin, Poland
International Slaughtering and deboning hogs; production of packagedand other pork products
Animex PlantIlawa, Poland
International Production of fresh meat and packaged products
Animex PlantStarachowice, Poland
International Slaughtering and deboning hogs; production of packagedand other pork products
Animex PlantElk, Poland
International Slaughtering and deboning hogs; production of packagedand other pork products
Animex PlantMorliny, Poland
International Production of packaged and other pork and beef products
Smithfield Prod PlantsTimisoara, Romania
International Deboning, slaughtering and rendering hogs
Corporate HeadquartersSmithfield, Virginia
Corporate Management and administrative support services for othersegments
(1) Substantially all of our Pork segment facilities are pledged as collateral under our credit facilities.
(2) Facility is leased.
24

The Hog Production segment owns and leases numerous hog production and grain storage facilities, as well asfeedmills, mainly in North Carolina, Utah and Virginia, with additional facilities in Oklahoma, Colorado, Texas,Iowa, Illinois, South Carolina, Missouri, Pennsylvania and South Dakota. A substantial number of these ownedfacilities are pledged under our credit facilities.
Also, the International segment owns and leases numerous hog production and grain storage facilities, as well asfeedmills, in Poland and Romania.
ITEM 3. LEGAL PROCEEDINGS
We and certain of our subsidiaries are parties to the environmental litigation matters discussed in “Item 1.Business—Regulation” above. Apart from those matters and the matters listed below, we and our affiliates areparties in various lawsuits arising in the ordinary course of business. In the opinion of management, any ultimateliability with respect to the ordinary course matters will not have a material adverse effect on our financialposition or results of operations.
MISSOURI LITIGATION
PSF is a wholly-owned subsidiary that we acquired on May 7, 2007 when a wholly-owned subsidiary of oursmerged with and into PSF. As a result of our acquisition of PSF and through other separate acquisitions by CGCof our common stock, CGC beneficially owned approximately 7.9% of our common stock as of June 15, 2010(based on a Schedule 13D/A filed by CGC on June 16, 2010).
In 2002, lawsuits based on the law of nuisance were filed against PSF and CGC in the Circuit Court of JacksonCounty, Missouri entitled Steven Adwell, et al. v. PSF, et al. and Michael Adwell, et al. v. PSF, et al. InNovember 2006, a jury trial involving six plaintiffs in the Adwell cases resulted in a jury verdict of compensatorydamages for those six plaintiffs in the amount of $750,000 each for a total of $4.5 million. The jury also foundthat CGC and PSF were liable for punitive damages; however, the parties agreed to settle the plaintiffs’ claimsfor the amount of the compensatory damages, and the plaintiffs waived punitive damages.
On March 1, 2007, the court severed the claims of the remaining Adwell plaintiffs into separate actions andordered that they be consolidated for trial by household. In the second Adwell trial, a jury trial involving threeplaintiffs resulted in a jury verdict in December 2007 in favor of PSF and CGC as to all claims. On July 8, 2008,the court reconsolidated the claims of the remaining 49 Adwell plaintiffs for trial by farm.
On March 4, 2010, a jury trial involving 15 plaintiffs who live near Homan farm resulted in a jury verdict ofcompensatory damages for the plaintiffs for a total of $11,050,000. Thirteen of the Homan farm plaintiffsreceived damages in the amount of $825,000 each. One of the plaintiffs received damages in the amount of$250,000, while another plaintiff received $75,000. The Court of Appeals of Missouri (Western District) denieddefendants’ appeal. On May 17, 2011, defendants filed an Application for Transfer of the appeal with theMissouri Supreme Court, which remains pending. We believe that there are substantial grounds for reversal ofthe verdict on appeal. Pursuant to a pre-existing arrangement, PSF is obligated to indemnify CGC for certainliabilities, if any, resulting from the Missouri litigation, including any liabilities resulting from the foregoingverdict.
The next Adwell trial, which will resolve the claims of up to 28 plaintiffs who live near Scott Colby farm iscurrently scheduled to commence on August 1, 2011.
In March 2004, the same attorneys representing the Adwell plaintiffs filed two additional nuisance lawsuits in theCircuit Court of Jackson County, Missouri entitled Fred Torrey, et al. v. PSF, et al. and Doyle Bounds, et al. v.PSF, et al. There are seven plaintiffs in both suits combined, each of whom claims to live near swine farms
25

owned or under contract with PSF. Plaintiffs allege that these farms interfered with the plaintiffs’ use andenjoyment of their respective properties. Plaintiffs in the Torrey suit also allege trespass.
In May 2004, two additional nuisance suits were filed in the Circuit Court of Daviess County, Missouri entitledVernon Hanes, et al. v. PSF, et al. and Steve Hanes, et al. v. PSF, et al. Plaintiffs in the Vernon Hanes case allegenuisance, negligence, violation of civil rights, and negligence of contractor. In addition, plaintiffs in both theVernon and Steve Hanes cases assert personal injury and property damage claims. Plaintiffs seek recovery of anunspecified amount of compensatory and punitive damages, costs and attorneys’ fees, as well as injunctive relief.On March 28, 2008, plaintiffs in the Vernon Hanes case voluntarily dismissed all claims without prejudice. Anew petition was filed by the Vernon Hanes plaintiffs on April 14, 2008, alleging nuisance, negligence andtrespass against six defendants, including us. We filed a Motion for Summary Judgment seeking its dismissalfrom the Vernon Hanes case, which was granted by the Court on September 1, 2010. Trial for the remainingclaims commenced on June 2, 2011.
Also in May 2004, the same lead lawyer who filed the Adwell, Bounds and Torrey lawsuits filed a putative classaction lawsuit entitled Daniel Herrold, et al. and Others Similarly Situated v. ContiGroup Companies, Inc., PSF,and PSF Group Holdings, Inc. in the Circuit Court of Jackson County, Missouri. This action originally sought tocreate a class of plaintiffs living within ten miles of PSF’s farms in northern Missouri, including contract growerfarms, who were alleged to have suffered interference with their right to use and enjoy their respective properties.On January 22, 2007, plaintiffs in the Herrold case filed a Second Amended Petition in which they abandoned allclass action allegations and efforts to certify the action as a class action and added an additional 193 namedplaintiffs to join the seven prior class representatives to pursue a one count claim to recover monetary damages,both actual and punitive, for temporary nuisance. On June 28, 2007, the court entered an order grantingdefendants’ motion to transfer venue to the northern Missouri counties in which the alleged injuries occurred. Asa result of those rulings, the claims of all but seven of the plaintiffs have been transferred to the appropriatevenues in northern Missouri.
Following the initial transfers, plaintiffs filed motions to transfer each of the cases back to Jackson County.Those motions were denied in all nine cases, but seven cases were transferred to neighboring counties pursuant toMissouri’s venue rules. Following all transfers, Herrold cases were pending in Chariton, Clark, DeKalb,Harrison, Jackson, Linn, and Nodaway counties. Plaintiffs agreed to file Amended Petitions in all cases exceptJackson County; however, Amended Petitions have been filed in only Chariton, Clark, Harrison, Linn andNodaway counties. In the Amended Petitions filed in Chariton on April 30, 2010 and in Linn on May 13, 2010,plaintiffs added claims of negligence and also claim that defendants are liable for the alleged negligence ofseveral contract grower farms. Pursuant to notices of dismissal filed by plaintiffs on January 27, February 23 andApril 10, 2009, all cases in Nodaway County have been dismissed. Discovery is now proceeding in the remainingcases where Amended Petitions have been filed.
In February 2006, the same lawyer who represents the plaintiffs in Hanes filed a nuisance lawsuit entitled GaroldMcDaniel, et al. v. PSF, et al. in the Circuit Court of Daviess County, Missouri. In the Second Amended Petition,which was filed on February 2008, plaintiffs seek recovery of an unspecified amount of compensatory andpunitive damages, costs and injunctive relief. Two of the four plaintiffs settled their claims; PSF purchased theirproperty for $285,000 in exchange for a full release. A third plaintiff is deceased, leaving a single plaintiff in thecase. The remaining parties are conducting discovery, and no trial date has been set.
In May 2007, the same lead lawyer who filed the Adwell, Bounds, Herrold and Torrey lawsuits filed a nuisancelawsuit entitled Jake Cooper, et al. v. Smithfield Foods, Inc., et al. in the Circuit Court of Vernon County,Missouri. Murphy-Brown, LLC, Murphy Farms, LLC, Murphy Farms, Inc. and we have all been named asdefendants. The other seven named defendants include Murphy Family Ventures, LLC, DM Farms of Rose Hill,LLC, and PSM Associates, LLC, which are entities affiliated with Wendell Murphy, a director of ours, and/or hisfamily members. Initially there were 13 plaintiffs in the lawsuit, but the claims of two plaintiffs were voluntarilydismissed without prejudice. All remaining plaintiffs are current or former residents of Vernon and Barton
26
Counties, Missouri, each of whom claims to live or have lived near swine farms presently or previously owned ormanaged by the defendants. Plaintiffs allege that odors from these farms interfered with the use and enjoyment oftheir respective properties. Plaintiffs seek recovery of an unspecified amount of compensatory and punitivedamages, costs and attorneys’ fees. Defendants have filed responsive pleadings and discovery is ongoing.
In July 2008, the same lawyers who filed the Adwell, Bounds, Herrold, Torrey and Cooper lawsuits filed anuisance lawsuit entitled John Arnold, et al. v. Smithfield Foods, Inc., et al. in the Circuit Court of DaviessCounty, Missouri. The Company and two of our subsidiaries, PSF and KC2 Real Estate LLC were named asdefendants. In August 2008, plaintiffs filed a second Petition adding one employee as a defendant. There werethree plaintiffs in the lawsuit, who are residents of Daviess County and who claimed to live near swine farmsowned or operated by defendants. Plaintiffs alleged that odors from these farms cause nuisances that interferewith the use and enjoyment of their properties. On April 20, 2009, plaintiffs voluntarily dismissed this casewithout prejudice. Plaintiffs refiled the case on April 20, 2010, adding CGC as a defendant. Defendants havefiled responsive pleadings, including a motion to dismiss all claims against the employee-defendant.
We believe we have good defenses to all of the actions described above and intend to defend vigorously thesesuits.
BEDFORD FACILITY
As we have previously disclosed, environmental releases at our former meat processing and packaging facilitylocated in Bedford, Virginia occurred in fiscal 2006 and fiscal 2007. Our Smithfield Packing subsidiary operatedthe facility, which closed in fiscal 2007 as part of our previously announced east coast restructuring plan.Federal, state and local officials investigated all of the releases under applicable environmental laws in fiscal2006 and fiscal 2007 and, as of the date of this report, we are not aware of any contemplated material legalproceedings with respect to any of these releases. If any such legal proceeding is commenced, depending on theresults of the investigations, then we could face potential monetary penalties. However, management believes,although we can provide no assurance, that any ultimate liability with respect to these matters will not have amaterial adverse effect on our financial position or results of operations.
SIOUX FALLS FACILITY
In a letter dated February 2011, the United States Department of Justice notified our John Morrell subsidiary thatthe EPA had referred a civil enforcement action against the company. DOJ alleges that John Morrell has violatedcertain chemical accident prevention requirements of section 112(r)(7) of the federal Clean Air Act in connectionwith operations of the refrigeration systems at its Sioux Falls facility. These violations are reported to have beenrevealed during EPA inspections in December 2009 and April 2010. We are investigating the matter and haveheld informal conferences with DOJ and EPA beginning in early March 2011. While we could face potentialmonetary penalties, depending upon the results of the investigation, we believe that any ultimate liability withrespect to these matters will not have a material adverse effect on our financial position or operations.
ITEM 4. (REMOVED AND RESERVED)
27

EXECUTIVE OFFICERS OF THE REGISTRANT
The following table shows the name and age, position and business experience during the past five years of eachof our executive officers. The board of directors elects executive officers to hold office until the next annualmeeting of the board of directors, until their successors are elected or until their resignation or removal.
Name and Age Position Business Experience During Past Five Years
C. Larry Pope (56) President and ChiefExecutive Officer
Mr. Pope was elected President and ChiefExecutive Officer in June 2006, effectiveSeptember 1, 2006. Mr. Pope served as Presidentand Chief Operating Officer from October 2001to September 2006.
Robert W. Manly, IV (58) Executive Vice President andChief Financial Officer
Mr. Manly was elected Executive Vice Presidentin August 2006 and was named to the additionalposition of Chief Financial Officer, effectiveJuly 1, 2008. He also served as Interim ChiefFinancial Officer from January 2007 to June2007. Prior to August 2006, he was Presidentsince October 1996 and Chief Operating Officersince June 2005 of PSF.
Joseph W. Luter, IV (46) Executive Vice President Mr. Luter was elected Executive Vice President inApril 2008 concentrating on sales and marketing.He served as President of Smithfield Packingfrom November 2004 to April 2008. Mr. Luter isthe son of Joseph W. Luter, III, Chairman of theBoard of Directors.
George H. Richter (66) President and ChiefOperating Officer, PorkGroup
Mr. Richter was elected President and ChiefOperating Officer, Pork Group in April 2008.Mr. Richter served as President of FarmlandFoods from October 2003 to April 2008.
Timothy O. Schellpeper (46) President of SmithfieldPacking
Mr. Schellpeper was elected President ofSmithfield Packing in April 2008. He was SeniorVice President of Operations at Farmland Foodsfrom August 2005 to April 2008.
Jerry H. Godwin (64) President of Murphy-Brown Mr. Godwin has served as President of Murphy-Brown since April 2001.
Joseph B. Sebring (64) President of John Morrell Mr. Sebring has served as President of JohnMorrell since May 1994.
Michael E. Brown (52) President of Farmland Foods Mr. Brown was elected President of FarmlandFoods in October 2010. He served as President ofArmour-Eckrich and Executive Vice President ofJohn Morrell Food Group from 2006 to October2010.
28

PART II
ITEM 5. MARKET FOR REGISTRANT’S COMMON EQUITY, RELATED STOCKHOLDERMATTERS AND ISSUER PURCHASES OF EQUITY SECURITIES
MARKET INFORMATION
Our common stock trades on the New York Stock Exchange under the symbol “SFD”. The following table showsthe high and low sales price of our common stock for each quarter of fiscal 2011 and fiscal 2010.
2011 2010
High Low High Low
First quarter . . . . . . . . . . . . . . . . . . . . . . . . . . . . . . . . . $ 19.17 $ 13.34 $ 14.39 $ 8.80Second quarter . . . . . . . . . . . . . . . . . . . . . . . . . . . . . . . 17.34 14.04 14.78 11.36Third quarter . . . . . . . . . . . . . . . . . . . . . . . . . . . . . . . . 21.25 15.93 17.62 13.20Fourth quarter . . . . . . . . . . . . . . . . . . . . . . . . . . . . . . . 24.93 19.69 21.48 14.70
HOLDERS
As of June 14, 2011 there were approximately 956 record holders of our common stock.
DIVIDENDS
We have never paid a cash dividend on our common stock and have no current plan to pay cash dividends. Inaddition, the terms of certain of our debt agreements prohibit the payment of any cash dividends on our commonstock. We would only pay cash dividends from assets legally available for that purpose, and payment of cashdividends would depend on our financial condition, results of operations, current and anticipated capitalrequirements, restrictions under then existing debt instruments and other factors then deemed relevant by theboard of directors.
PURCHASES OF EQUITY SECURITIES BY THE ISSUER AND AFFILIATED PURCHASERS
Issuer Purchases of Equity Securities
Period
(a)Total Number ofShares Purchased
(b)Average Price Paid
per Share
(c)Total Number ofShares Purchasedas Part of PubliclyAnnounced Plans
or Programs
(d)Maximum Number
of Shares thatMay Yet Be
Purchased Underthe Plans orPrograms(1)
January 31, 2011 to March 1, 2011 . . . . . . . — n/a n/a 2,873,430March 2, 2011 to April 1, 2011 . . . . . . . . . . — n/a n/a 2,873,430April 2, 2011 to May 1, 2011 . . . . . . . . . . . 8,639 $23.40 n/a 2,873,430
Total . . . . . . . . . . . . . . . . . . . . . . . . . . 8,639(2) $23.40 n/a 2,873,430
(1) As of May 1, 2011, our board of directors had authorized the repurchase of up to 20,000,000 shares of our common stock. The originalrepurchase plan was announced on May 6, 1999 and increases in the number of shares we may repurchase under the plan wereannounced on December 15, 1999, January 20, 2000, February 26, 2001, February 14, 2002 and June 2, 2005. On June 16, 2011, weannounced that our board of directors had authorized the repurchase of up to $150.0 million of our common stock over the next 24months. This new authorization replaced all prior authorizations.
(2) The purchases were made in open market transactions by Wells Fargo, as trustee, and the shares are held in a rabbi trust for the benefit ofparticipants in the Smithfield Foods, Inc. 2008 Incentive Compensation Plan director fee deferral program. The 2008 IncentiveCompensation Plan was approved by our shareholders on August 27, 2008.
29

ITEM 6. SELECTED FINANCIAL DATA
The following table shows selected consolidated financial data and other operational data for the fiscal yearsindicated. The financial data was derived from our audited consolidated financial statements. You should readthe information in conjunction with “Item 8. Financial Statements and Supplementary Data” and “Item 7.Management’s Discussion and Analysis of Financial Condition and Results of Operations.”
Fiscal Years
2011 2010 2009 2008 2007
(in millions, except per share data)
Statement of Income Data:Sales . . . . . . . . . . . . . . . . . . . . . . . . . . . . . . . . . . . . $12,202.7 $11,202.6 $12,487.7 $11,351.2 $ 9,359.3Cost of sales . . . . . . . . . . . . . . . . . . . . . . . . . . . . . . 10,488.6 10,472.5 11,863.1 10,202.8 8,298.8
Gross profit . . . . . . . . . . . . . . . . . . . . . . . . . . . 1,714.1 730.1 624.6 1,148.4 1,060.5Selling, general and administrative expenses . . . . . 789.8 705.9 798.4 813.6 686.0Gain on fire insurance recovery . . . . . . . . . . . . . . . (120.6) — — — —Equity in (income) loss of affiliates . . . . . . . . . . . . (50.1) (38.6) 50.1 (62.0) (48.2)
Operating profit (loss) . . . . . . . . . . . . . . . . . . . 1,095.0 62.8 (223.9) 396.8 422.7Interest expense . . . . . . . . . . . . . . . . . . . . . . . . . . . . 245.4 266.4 221.8 184.8 133.6Other loss (income) . . . . . . . . . . . . . . . . . . . . . . . . . 92.5 11.0 (63.5) — —
Income (loss) from continuing operationsbefore income taxes . . . . . . . . . . . . . . . . . . . 757.1 (214.6) (382.2) 212.0 289.1
Income tax expense (benefit) . . . . . . . . . . . . . . . . . 236.1 (113.2) (131.3) 72.8 77.2
Income (loss) from continuing operations . . . 521.0 (101.4) (250.9) 139.2 211.9Income (loss) from discontinued operations, net of
tax . . . . . . . . . . . . . . . . . . . . . . . . . . . . . . . . . . . . — — 52.5 (10.3) (45.1)
Net income (loss) . . . . . . . . . . . . . . . . . . . . . . $ 521.0 $ (101.4) $ (198.4) $ 128.9 $ 166.8
Net Income (Loss) Per Diluted Share:Continuing operations . . . . . . . . . . . . . . . . . . . . . . . $ 3.12 $ (.65) $ (1.78) $ 1.04 $ 1.89Discontinued operations . . . . . . . . . . . . . . . . . . . . . — — .37 (.08) (.40)
Net income (loss) per diluted commonshare . . . . . . . . . . . . . . . . . . . . . . . . . . . . . . $ 3.12 $ (.65) $ (1.41) $ .96 $ 1.49
Weighted average diluted shares outstanding . . . . . 167.2 157.1 141.1 134.2 111.9
Balance Sheet Data:Working capital . . . . . . . . . . . . . . . . . . . . . . . . . . . . $ 2,110.0 $ 2,128.4 $ 1,497.7 $ 2,215.3 $ 1,795.3Total assets . . . . . . . . . . . . . . . . . . . . . . . . . . . . . . . 7,611.8 7,708.9 7,200.2 8,867.9 6,968.6Long-term debt and capital lease obligations . . . . . 1,978.6 2,918.4 2,567.3 3,474.4 2,838.6Shareholders’ equity . . . . . . . . . . . . . . . . . . . . . . . . 3,545.5 2,755.6 2,612.4 3,048.2 2,240.8
Other Consolidated Operational Data:Total hogs processed(1) . . . . . . . . . . . . . . . . . . . . . . 30.4 32.9 35.2 33.9 26.7Packaged meats sales (pounds)(1) . . . . . . . . . . . . . . 3,159.7 3,238.0 3,450.6 3,363.4 3,073.8Fresh pork sales (pounds)(1) . . . . . . . . . . . . . . . . . . . 4,035.0 4,289.9 4,702.0 4,356.7 3,389.0Total hogs sold(2) . . . . . . . . . . . . . . . . . . . . . . . . . . . 18.6 19.3 20.4 20.2 14.6
(1) Comprised of Pork segment and International segment.
(2) Comprised of Hog Production segment and International segment and includes intercompany hog sales.
30
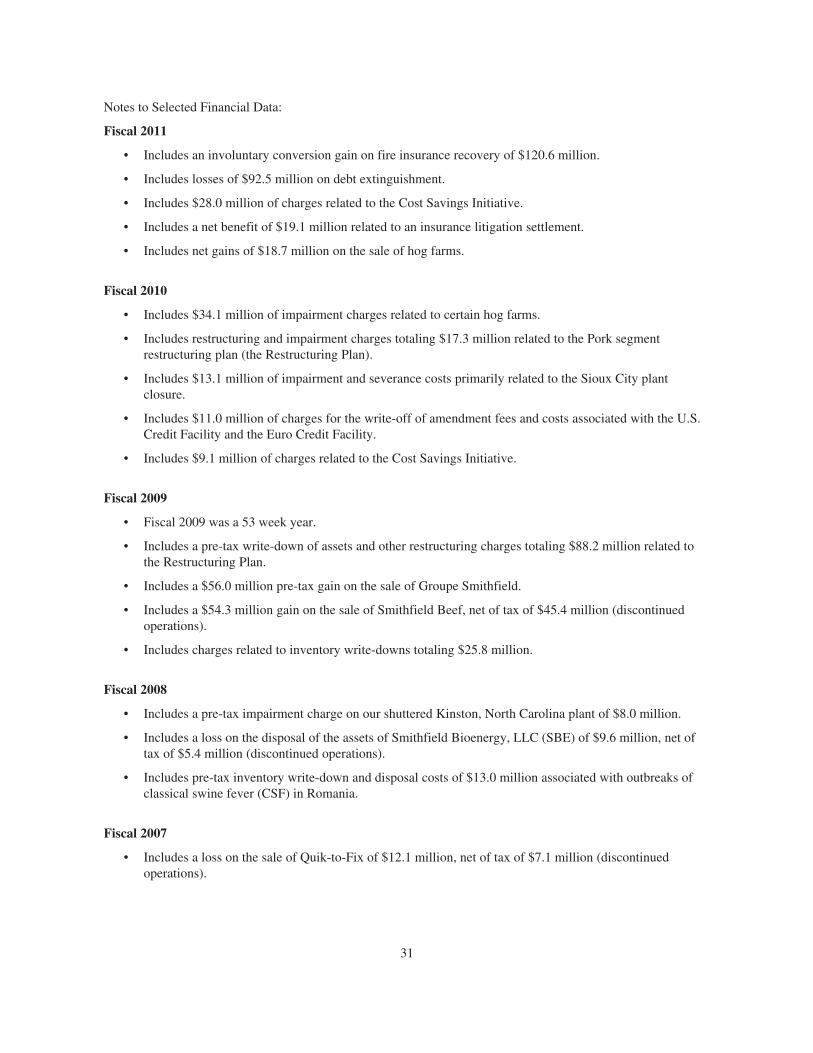
Notes to Selected Financial Data:
Fiscal 2011
• Includes an involuntary conversion gain on fire insurance recovery of $120.6 million.
• Includes losses of $92.5 million on debt extinguishment.
• Includes $28.0 million of charges related to the Cost Savings Initiative.
• Includes a net benefit of $19.1 million related to an insurance litigation settlement.
• Includes net gains of $18.7 million on the sale of hog farms.
Fiscal 2010
• Includes $34.1 million of impairment charges related to certain hog farms.
• Includes restructuring and impairment charges totaling $17.3 million related to the Pork segmentrestructuring plan (the Restructuring Plan).
• Includes $13.1 million of impairment and severance costs primarily related to the Sioux City plantclosure.
• Includes $11.0 million of charges for the write-off of amendment fees and costs associated with the U.S.Credit Facility and the Euro Credit Facility.
• Includes $9.1 million of charges related to the Cost Savings Initiative.
Fiscal 2009
• Fiscal 2009 was a 53 week year.
• Includes a pre-tax write-down of assets and other restructuring charges totaling $88.2 million related tothe Restructuring Plan.
• Includes a $56.0 million pre-tax gain on the sale of Groupe Smithfield.
• Includes a $54.3 million gain on the sale of Smithfield Beef, net of tax of $45.4 million (discontinuedoperations).
• Includes charges related to inventory write-downs totaling $25.8 million.
Fiscal 2008
• Includes a pre-tax impairment charge on our shuttered Kinston, North Carolina plant of $8.0 million.
• Includes a loss on the disposal of the assets of Smithfield Bioenergy, LLC (SBE) of $9.6 million, net oftax of $5.4 million (discontinued operations).
• Includes pre-tax inventory write-down and disposal costs of $13.0 million associated with outbreaks ofclassical swine fever (CSF) in Romania.
Fiscal 2007
• Includes a loss on the sale of Quik-to-Fix of $12.1 million, net of tax of $7.1 million (discontinuedoperations).
31
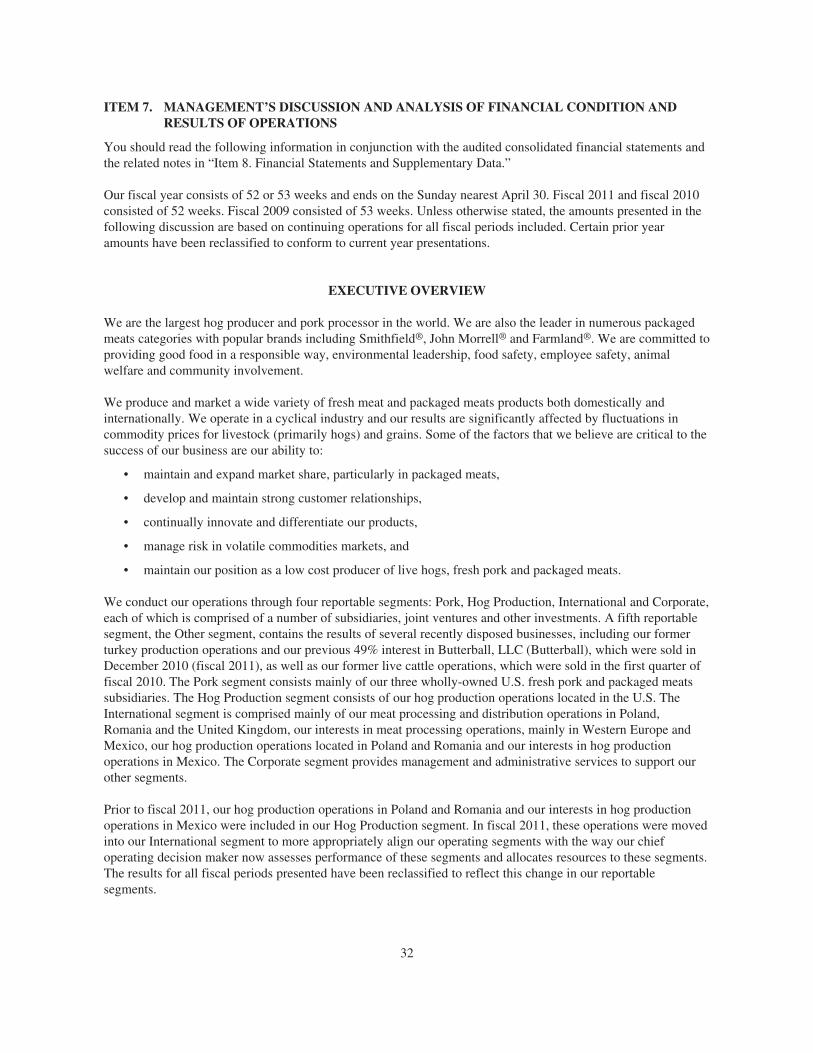
ITEM 7. MANAGEMENT’S DISCUSSION AND ANALYSIS OF FINANCIAL CONDITION ANDRESULTS OF OPERATIONS
You should read the following information in conjunction with the audited consolidated financial statements andthe related notes in “Item 8. Financial Statements and Supplementary Data.”
Our fiscal year consists of 52 or 53 weeks and ends on the Sunday nearest April 30. Fiscal 2011 and fiscal 2010consisted of 52 weeks. Fiscal 2009 consisted of 53 weeks. Unless otherwise stated, the amounts presented in thefollowing discussion are based on continuing operations for all fiscal periods included. Certain prior yearamounts have been reclassified to conform to current year presentations.
EXECUTIVE OVERVIEW
We are the largest hog producer and pork processor in the world. We are also the leader in numerous packagedmeats categories with popular brands including Smithfield®, John Morrell® and Farmland®. We are committed toproviding good food in a responsible way, environmental leadership, food safety, employee safety, animalwelfare and community involvement.
We produce and market a wide variety of fresh meat and packaged meats products both domestically andinternationally. We operate in a cyclical industry and our results are significantly affected by fluctuations incommodity prices for livestock (primarily hogs) and grains. Some of the factors that we believe are critical to thesuccess of our business are our ability to:
• maintain and expand market share, particularly in packaged meats,
• develop and maintain strong customer relationships,
• continually innovate and differentiate our products,
• manage risk in volatile commodities markets, and
• maintain our position as a low cost producer of live hogs, fresh pork and packaged meats.
We conduct our operations through four reportable segments: Pork, Hog Production, International and Corporate,each of which is comprised of a number of subsidiaries, joint ventures and other investments. A fifth reportablesegment, the Other segment, contains the results of several recently disposed businesses, including our formerturkey production operations and our previous 49% interest in Butterball, LLC (Butterball), which were sold inDecember 2010 (fiscal 2011), as well as our former live cattle operations, which were sold in the first quarter offiscal 2010. The Pork segment consists mainly of our three wholly-owned U.S. fresh pork and packaged meatssubsidiaries. The Hog Production segment consists of our hog production operations located in the U.S. TheInternational segment is comprised mainly of our meat processing and distribution operations in Poland,Romania and the United Kingdom, our interests in meat processing operations, mainly in Western Europe andMexico, our hog production operations located in Poland and Romania and our interests in hog productionoperations in Mexico. The Corporate segment provides management and administrative services to support ourother segments.
Prior to fiscal 2011, our hog production operations in Poland and Romania and our interests in hog productionoperations in Mexico were included in our Hog Production segment. In fiscal 2011, these operations were movedinto our International segment to more appropriately align our operating segments with the way our chiefoperating decision maker now assesses performance of these segments and allocates resources to these segments.The results for all fiscal periods presented have been reclassified to reflect this change in our reportablesegments.
32

Fiscal 2011 Summary
Net income was $521.0 million, or $3.12 per diluted share, in fiscal 2011, compared to net loss of $101.4 million,or $.65 per diluted share, in fiscal 2010. The following significant factors impacted fiscal 2011 results comparedto fiscal 2010:
• Pork segment operating profit increased $214.7 million driven by substantially higher fresh pork marketprices, which more than offset the impact of higher raw material costs.
• Hog Production segment operating results improved $763.6 million mainly due to a 29% increase indomestic market live hog prices.
• International segment operating profit decreased slightly as the expiration of certain subsidy programs inRomania was partially offset by improved profitability from our investments in Western Europe andMexico.
• Other segment operating results declined by $6.0 million, due to the disposal of our turkey business inDecember 2010 (fiscal 2011).
• Corporate segment results improved $71.9 million, primarily due to a $120.6 million gain on the finalsettlement of our insurance claim related to the fire that occurred at our Cudahy, Wisconsin facility infiscal 2010, partially offset by higher variable compensation expenses stemming from substantiallyimproved consolidated operating results.
Project 100
In the latter half of fiscal 2010, we developed a plan to reduce the level of debt on our balance sheet by $1 billionand eliminate $100 million of annual interest expense from our statement of income (Project 100). This projectwas intended to improve our credit metrics, extend and smooth maturities of our various debt obligations andutilize idle cash on hand, while at the same time, maintaining ample liquidity. As of May 1, 2011, we wereapproximately 90% complete with Project 100 after repurchasing senior notes with face values totaling $913.1million for $993.1 million during fiscal 2011. As a result, our net debt (long-term debt and capital leaseobligations including current portion and notes payable, net of cash) to total capitalization (net debt plusshareholders’ equity) has decreased from 48% at the end of fiscal 2010 to 33% as of May 1, 2011. Our goal is tomaintain a net debt to total capitalization ratio of approximately 40% or lower with a ceiling of 50%.
Core Strategies for Growth
Organic
In fiscal 2011, we completed our Pork segment restructuring plan, in which we consolidated a number ofindependent operating companies into three large regional operating companies, increased capacity utilization byclosing six inefficient and underutilized packaged meats plants and one fresh pork plant, consolidated our salesorganizations and rationalized our brands in order to focus on twelve major brand names. We believe this planhas resulted in an annual profitability improvement of approximately $125 million. In addition, we are currentlyin the process of executing our plan to improve the cost structure and profitability of our domestic hogproduction operations. We believe this initiative will result in an annual profitability improvement of $2 perhundredweight, or approximately $90 million, by fiscal 2014.
We believe these initiatives provide us with a highly competitive organizational structure and position us well fortop and bottom line growth in our base business.
Mergers and Acquisitions
We are also in a position to expand our business by utilizing a disciplined approach to acquire branded packagedmeats companies while enhancing return on invested capital and maintaining a conservative balance sheet.
33

We continue to be outward looking for companies that would allow us to continue to grow while maintaining aconservative balance sheet and increasing shareholder value.
Recent Regulatory Developments
E15 Ruling
In October 2010 (fiscal 2011), the Environmental Protection Agency (EPA) granted a “partial waiver” to astatutory bar under the Clean Air Act prohibiting fuel manufacturers from introducing fuel additives that are not“substantially similar” to those already approved and in use for vehicles of model year (MY) 1975 or later. TheEPA’s decision allows fuel manufactures to increase the ethanol content of gasoline to 15 percent (E15) for usein MY 2007 and newer light-duty motor vehicles, including passenger cars, light-duty trucks, and medium-dutypassenger vehicles. In January 2011, the EPA granted another partial waiver authorizing E15 use inMY 2001-2006 light-duty motor vehicles. Prior to EPA’s decisions, the ethanol content of gasoline in the UnitedStates was limited to 10 percent. These rulemakings are all subject to judicial appeals.
Taken together, the two actions by the EPA allow the introduction of E15 into commerce and the marketplace bymanufacturers. Although the long-term impact of E15 is currently unknown, studies have shown that expandedcorn-based ethanol production has driven up the price of livestock feed and led to commodity-price volatility.We cannot presently assess the full economic impact of the proposed regulations on the meat processing industryor on our operations.
Proposed GIPSA Rule
In June 2010 (fiscal 2011), the United States Department of Agriculture, Grain Inspection, Packers andStockyards Administration (GIPSA) published a proposed rule adding new regulations under the Packers andStockyards Act and requested public comment. The public comment period has closed, and GIPSA is consideringwhat, if any changes it may adopt based on the comments received. These new regulations, if adopted asproposed, could significantly impact our relationships both with other meat packers to whom we sell livestockand with our independent contract growers from whom we buy livestock by prohibiting or restricting numerouspractices that have been permitted for decades. We cannot presently assess the full economic impact of theproposed regulations on the meat processing industry or on our operations.
Outlook
The commodity markets affecting our business are sometimes volatile and fluctuate on a daily basis. In thisunpredictable operating environment, it is difficult to make meaningful long-term forecasts of industry trends andconditions. The outlook statements that follow must be viewed in this context.
• Pork—Despite tight hog supplies and high live hog prices, which typically place pressure on fresh porkmargins, we achieved very solid processing margins in fiscal 2011. Fresh pork margins were particularlystrong, as record high cut-out values drove significant margin gains on a per head basis. As we enterfiscal 2012, fresh pork margins have begun to moderate below fiscal 2011’s record levels. However,fundamentals in the fresh pork complex continue to be strong. And, the segment should benefit from flatindustry slaughter levels and higher relative world-wide pork prices. On the export front, we expectcontinued healthy demand will provide additional domestic price support and help the overall fresh porkcomplex. Accordingly, we remain optimistic about our fresh pork performance moving into fiscal 2012.
Pricing discipline, rationalization of low margin business, increased plant capacity utilization and thebenefits of the Restructuring Plan, as defined below under “Significant Events Affecting Results ofOperations,” helped sustain packaged meats margins in fiscal 2011 despite sharp increases in rawmaterial costs. We expect these same factors will continue to insulate our packaged meats margins in thecoming year. As we move into fiscal 2012, we expect our packaged meats business will again be solidly
34

profitable, notwithstanding continued high raw material costs associated with higher live hog prices. Wecurrently expect margins in this part of the business to average $.10 to $.15 per pound for fiscal 2012.
In summary, we continue to be optimistic about the Pork segment in the near term. We expect the actionswe have taken on the sales, operating and restructuring fronts will support sustainable segmentprofitability. With the completion of the Restructuring Plan, we are now focusing our efforts on sales andmarketing initiatives designed to drive profitable top line growth.
• Hog Production—After a considerable and extended period of sizable losses in the hog productionindustry, the cycle has turned and the environment has improved significantly. Modest contractions in theU.S. sow herd contributed to tightened supplies which, in turn, have resulted in higher live hog marketprices. Live hog prices averaged nearly 30% higher during the 12 months ended May 1, 2011 than duringthe comparative period a year earlier. We do not foresee significant herd expansion on the horizon, whichshould help stabilize prices at even healthier levels than we experienced in fiscal 2011.
Our domestic raising costs spiked to all-time highs in the second quarter of fiscal 2009, reaching aquarterly average of $63 per hundredweight. Since that time, raising costs have moderated into themid-to-upper $50’s per hundredweight. Spiking feed grain prices are again expected to drive raising costshigher into the low $60’s per hundredweight early in fiscal 2012, and then flatten out in the mid $60’slater in the year. At the same time, however, the current futures curve for lean hogs suggests robust livehog pricing throughout fiscal 2012. Consequently, we expect our live hog production operations to beprofitable in fiscal 2012. Longer term, we have developed a plan, described more fully below, to improveour cost structure. We expect the cost savings plan will reduce our base raising costs by approximately $2per hundredweight, or $90 million, annually by fiscal 2014.
• International—We were pleased with the performance of our international meat operations in fiscal 2011.Looking forward, higher hog and meat prices in Poland will likely pressure margins and profits off offiscal 2011’s record highs. Still, we expect our Polish results will be solidly profitable in fiscal 2012 as anincreasing percentage of volume shifts to higher margin packaged meats products. Our meat operations inMexico are also expected to make positive contributions in fiscal 2012. In Romania, our meat processingoperations are facing headwinds of a recessionary environment and weak demand. As a result, we do notexpect our Romanian meat operations, which are the smallest of our international meat operations, to beprofitable in fiscal 2012. However, we do expect measurable improvements over fiscal 2011. Insummary, we expect our overall international meat operations will continue to deliver positive results aswe move into fiscal 2012.
Beyond our wholly-owned meat operations, we also expect continued positive contributions from ourinvestment in CFG (as defined below). However, CFG will be operating in an adverse environment ofhigh unemployment, recessionary conditions across Western Europe and higher raw material costs, whichmay temper future results.
On the live production side of the business, we expect higher year-over-year grain prices throughout ourinternational swine production operations in fiscal 2012. This will put pressure on feeding margins. At thesame time however, we expect to see improvements in live hog pricing in fiscal 2012 as expecteddecreases in international pig inventories, particularly in the second half of the year, tighten supplies.And, we are encouraged by the recent announcement from Russia that its grain export ban, enacted inAugust 2010, will be lifted effective July 1, 2011. We expect the resumption of these grain exports willhave a positive impact on the overall grain complex in Europe.
• Other—The Other segment is comprised almost entirely of our wholly-owned turkey operations and our49% interest in Butterball, LLC (Butterball). As more fully described under “Significant Events AffectingResults of Operations-Butterball,” we completed the sale of these assets in early December 2010.Accordingly, the segment is not expected to generate income or loss for fiscal 2012.
35

RESULTS OF OPERATIONS
Significant Events Affecting Results of Operations
Fire Insurance Settlement
In July 2009 (fiscal 2010), a fire occurred at the primary manufacturing facility of our subsidiary, PatrickCudahy, Inc. (Patrick Cudahy), in Cudahy, Wisconsin. The fire damaged a portion of the facility’s productionspace and required the temporary cessation of operations, but did not consume the entire facility. Shortly after thefire, we resumed production activities in undamaged portions of the plant, including the distribution center, andtook steps to address the supply needs for Patrick Cudahy products by shifting production to other Company andthird-party facilities.
We maintain comprehensive general liability and property insurance, including business interruption insurance.In December 2010 (fiscal 2011), we reached an agreement with our insurance carriers to settle the claim for atotal of $208.0 million, of which $70.0 million had been advanced to us in fiscal 2010. We allocated theseproceeds to first recover the book value of the property lost, out-of-pocket expenses incurred and businessinterruption losses that resulted from the fire. The remaining proceeds were recognized as an involuntaryconversion gain of $120.6 million in the Corporate segment in the third quarter of fiscal 2011. The involuntaryconversion gain was classified in a separate line item on the consolidated statement of income.
Based on an evaluation of business interruption losses incurred, we recognized $15.8 million and $31.8 million infiscal 2011 and fiscal 2010, respectively, of the insurance proceeds in cost of sales in our Pork segment to offsetbusiness interruption losses incurred.
Debt Extinguishment
In August 2010 (fiscal 2011), we began repurchasing a portion of our senior unsecured notes due August 2011(2011 Notes). We paid $210.7 million to repurchase notes with a face value of $203.8 million. We recognized aloss of $7.3 million in the second quarter of fiscal 2011, including the write-off of related unamortized debt costs,as a result of these debt repurchases.
In November 2010 (fiscal 2011), we commenced an offer to purchase for cash (the November Tender Offer) upto an aggregate of $337.0 million principal amount of our outstanding 2011 Notes. The November Tender Offerexpired on December 1, 2010. As a result of the November Tender Offer, we paid $332.4 million to repurchasenotes with a face value of $318.4 million and recognized a loss of $14.1 million in the third quarter of fiscal2011, including the write-off of related unamortized premiums and debt costs.
In January 2011 (fiscal 2011), we commenced a Dutch auction cash tender offer to purchase for $450.0 million incash (the January Tender Offer) the maximum aggregate principal amount of our outstanding senior unsecurednotes due May 2013 (2013 Notes) and our outstanding senior secured notes due July 2014 (2014 Notes). TheJanuary Tender Offer expired on February 9, 2011. As a result of the January Tender Offer, we paid $450.0million to repurchase 2013 Notes and 2014 Notes with face values of $190.0 million and $200.9 million,respectively, and recognized a loss of $71.1 million in the fourth quarter of fiscal 2011, including the write-off ofrelated unamortized discounts and debt costs.
Hog Production Cost Savings Initiative
In the fourth quarter of fiscal 2010, we announced a plan to improve the cost structure and profitability of ourdomestic hog production operations (the Cost Savings Initiative). The plan includes a number of undertakingsdesigned to improve operating efficiencies and productivity. These consist of farm reconfigurations andconversions, termination of certain high cost, third party hog grower contracts and breeding stock sourcingcontracts, as well as a number of other cost reduction activities. Certain of these activities are expected to occurover the next two years in order to allow for the successful transformation of farms while minimizing disruptionof supply.
36
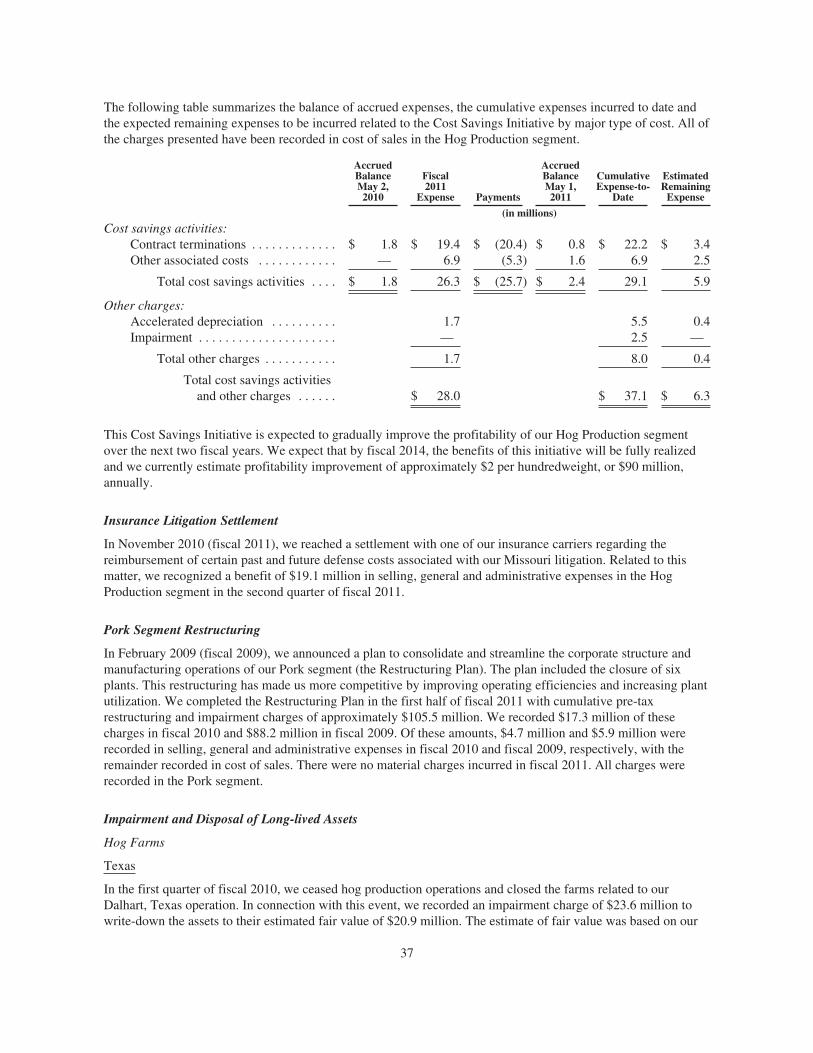
The following table summarizes the balance of accrued expenses, the cumulative expenses incurred to date andthe expected remaining expenses to be incurred related to the Cost Savings Initiative by major type of cost. All ofthe charges presented have been recorded in cost of sales in the Hog Production segment.
AccruedBalanceMay 2,2010
Fiscal2011
Expense Payments
AccruedBalanceMay 1,2011
CumulativeExpense-to-
Date
EstimatedRemaining
Expense
(in millions)
Cost savings activities:Contract terminations . . . . . . . . . . . . . $ 1.8 $ 19.4 $ (20.4) $ 0.8 $ 22.2 $ 3.4Other associated costs . . . . . . . . . . . . — 6.9 (5.3) 1.6 6.9 2.5
Total cost savings activities . . . . $ 1.8 26.3 $ (25.7) $ 2.4 29.1 5.9
Other charges:Accelerated depreciation . . . . . . . . . . 1.7 5.5 0.4Impairment . . . . . . . . . . . . . . . . . . . . . — 2.5 —
Total other charges . . . . . . . . . . . 1.7 8.0 0.4
Total cost savings activitiesand other charges . . . . . . $ 28.0 $ 37.1 $ 6.3
This Cost Savings Initiative is expected to gradually improve the profitability of our Hog Production segmentover the next two fiscal years. We expect that by fiscal 2014, the benefits of this initiative will be fully realizedand we currently estimate profitability improvement of approximately $2 per hundredweight, or $90 million,annually.
Insurance Litigation Settlement
In November 2010 (fiscal 2011), we reached a settlement with one of our insurance carriers regarding thereimbursement of certain past and future defense costs associated with our Missouri litigation. Related to thismatter, we recognized a benefit of $19.1 million in selling, general and administrative expenses in the HogProduction segment in the second quarter of fiscal 2011.
Pork Segment Restructuring
In February 2009 (fiscal 2009), we announced a plan to consolidate and streamline the corporate structure andmanufacturing operations of our Pork segment (the Restructuring Plan). The plan included the closure of sixplants. This restructuring has made us more competitive by improving operating efficiencies and increasing plantutilization. We completed the Restructuring Plan in the first half of fiscal 2011 with cumulative pre-taxrestructuring and impairment charges of approximately $105.5 million. We recorded $17.3 million of thesecharges in fiscal 2010 and $88.2 million in fiscal 2009. Of these amounts, $4.7 million and $5.9 million wererecorded in selling, general and administrative expenses in fiscal 2010 and fiscal 2009, respectively, with theremainder recorded in cost of sales. There were no material charges incurred in fiscal 2011. All charges wererecorded in the Pork segment.
Impairment and Disposal of Long-lived Assets
Hog Farms
Texas
In the first quarter of fiscal 2010, we ceased hog production operations and closed the farms related to ourDalhart, Texas operation. In connection with this event, we recorded an impairment charge of $23.6 million towrite-down the assets to their estimated fair value of $20.9 million. The estimate of fair value was based on our
37
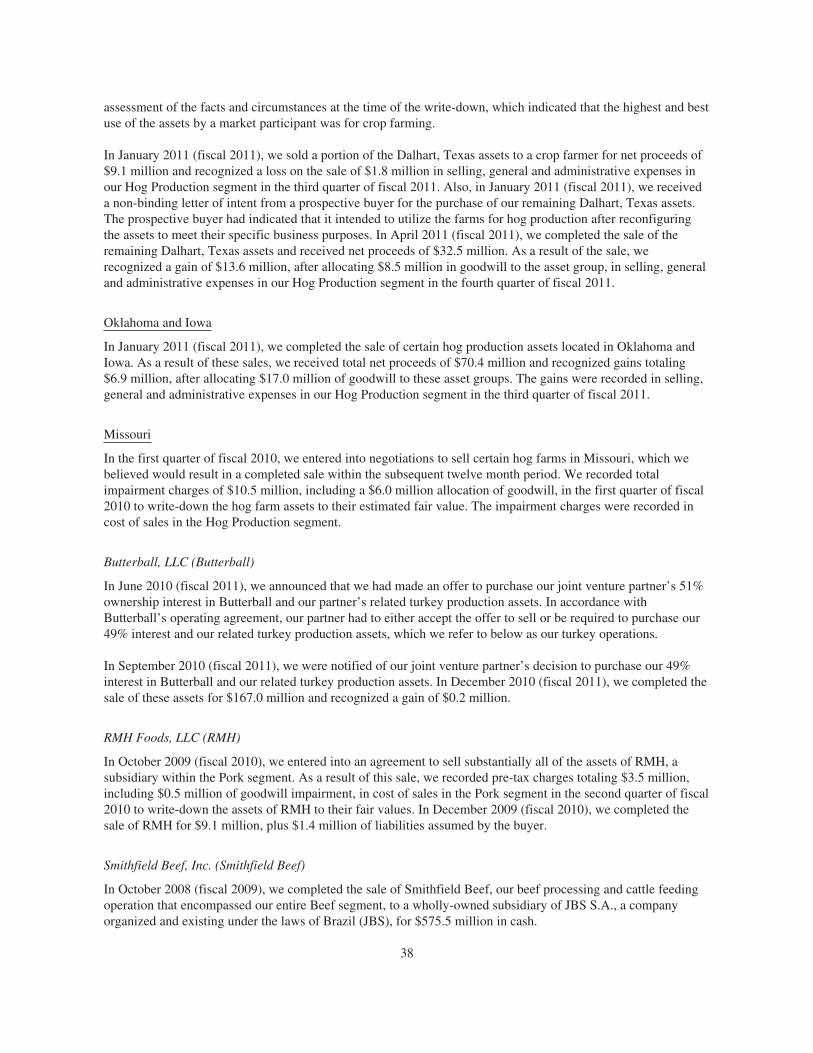
assessment of the facts and circumstances at the time of the write-down, which indicated that the highest and bestuse of the assets by a market participant was for crop farming.
In January 2011 (fiscal 2011), we sold a portion of the Dalhart, Texas assets to a crop farmer for net proceeds of$9.1 million and recognized a loss on the sale of $1.8 million in selling, general and administrative expenses inour Hog Production segment in the third quarter of fiscal 2011. Also, in January 2011 (fiscal 2011), we receiveda non-binding letter of intent from a prospective buyer for the purchase of our remaining Dalhart, Texas assets.The prospective buyer had indicated that it intended to utilize the farms for hog production after reconfiguringthe assets to meet their specific business purposes. In April 2011 (fiscal 2011), we completed the sale of theremaining Dalhart, Texas assets and received net proceeds of $32.5 million. As a result of the sale, werecognized a gain of $13.6 million, after allocating $8.5 million in goodwill to the asset group, in selling, generaland administrative expenses in our Hog Production segment in the fourth quarter of fiscal 2011.
Oklahoma and Iowa
In January 2011 (fiscal 2011), we completed the sale of certain hog production assets located in Oklahoma andIowa. As a result of these sales, we received total net proceeds of $70.4 million and recognized gains totaling$6.9 million, after allocating $17.0 million of goodwill to these asset groups. The gains were recorded in selling,general and administrative expenses in our Hog Production segment in the third quarter of fiscal 2011.
Missouri
In the first quarter of fiscal 2010, we entered into negotiations to sell certain hog farms in Missouri, which webelieved would result in a completed sale within the subsequent twelve month period. We recorded totalimpairment charges of $10.5 million, including a $6.0 million allocation of goodwill, in the first quarter of fiscal2010 to write-down the hog farm assets to their estimated fair value. The impairment charges were recorded incost of sales in the Hog Production segment.
Butterball, LLC (Butterball)
In June 2010 (fiscal 2011), we announced that we had made an offer to purchase our joint venture partner’s 51%ownership interest in Butterball and our partner’s related turkey production assets. In accordance withButterball’s operating agreement, our partner had to either accept the offer to sell or be required to purchase our49% interest and our related turkey production assets, which we refer to below as our turkey operations.
In September 2010 (fiscal 2011), we were notified of our joint venture partner’s decision to purchase our 49%interest in Butterball and our related turkey production assets. In December 2010 (fiscal 2011), we completed thesale of these assets for $167.0 million and recognized a gain of $0.2 million.
RMH Foods, LLC (RMH)
In October 2009 (fiscal 2010), we entered into an agreement to sell substantially all of the assets of RMH, asubsidiary within the Pork segment. As a result of this sale, we recorded pre-tax charges totaling $3.5 million,including $0.5 million of goodwill impairment, in cost of sales in the Pork segment in the second quarter of fiscal2010 to write-down the assets of RMH to their fair values. In December 2009 (fiscal 2010), we completed thesale of RMH for $9.1 million, plus $1.4 million of liabilities assumed by the buyer.
Smithfield Beef, Inc. (Smithfield Beef)
In October 2008 (fiscal 2009), we completed the sale of Smithfield Beef, our beef processing and cattle feedingoperation that encompassed our entire Beef segment, to a wholly-owned subsidiary of JBS S.A., a companyorganized and existing under the laws of Brazil (JBS), for $575.5 million in cash.
38

The sale included 100 percent of Five Rivers Ranch Cattle Feeding LLC (Five Rivers), which was previously a50/50 joint venture with Continental Grain Company (CGC). Immediately preceding the closing of the JBStransaction, we acquired CGC’s 50 percent investment in Five Rivers for 2,166,667 shares of our common stockvalued at $27.87 per share and $8.7 million for working capital adjustments.
The JBS transaction excluded substantially all live cattle inventories held by Smithfield Beef and Five Rivers asof the closing date, together with associated debt. All of the live cattle inventories were sold by the first quarterof fiscal 2010. Our results from the sale of the live cattle inventories that were excluded from the JBS transactionare reported in income from continuing operations in the Other segment.
We recorded a pre-tax gain of $99.7 million ($54.3 million net of tax) on the sale of Smithfield Beef in fiscal2009. The results of Smithfield Beef are reported as discontinued operations, including the gain on the sale.
Sales, interest expense and net income of Smithfield Beef for fiscal 2009 were $1.7 billion, $17.3 million and$0.9 million, respectively. Interest expense is allocated to discontinued operations based on specific borrowingsby the discontinued operations. These results are reported in income from discontinued operations.
Smithfield Bioenergy, LLC (SBE)
In April 2007 (fiscal 2007), we decided to exit the alternative fuels business. As a result, we recorded impairmentcharges of $9.6 million, net of tax of $5.4 million, during fiscal 2008 to reflect the assets of SBE at theirestimated fair value. In May 2008 (fiscal 2009), we completed the sale of substantially all of SBE’s assets for$11.5 million. The results of SBE are reported as discontinued operations.
Sales, interest expense and net loss of SBE for fiscal 2009 were $3.8 million, $1.3 million and $2.7 million,respectively. These results are reported in income from discontinued operations.
Sioux City, Iowa Plant Closure
In January 2010 (fiscal 2010), we announced that we would close our fresh pork processing plant located inSioux City, Iowa. The Sioux City plant was one of our oldest and least efficient plants. The plant design severelylimited our ability to produce value-added packaged meats products and maximize production throughput. Aportion of the plant’s production was transferred to other nearby Smithfield plants. We closed the Sioux Cityplant in April 2010 (fiscal 2010).
As a result of the planned closure, we recorded charges of $13.1 million in the third quarter of fiscal 2010. Thesecharges consisted of $3.6 million for the write-down of long-lived assets, $2.5 million of unusable inventoriesand $7.0 million for estimated severance benefits pursuant to contractual and ongoing benefit arrangements.Substantially all of these charges were recorded in cost of sales in the Pork segment. We do not expect anysignificant future charges associated with the plant closure.
Investment Activities
Groupe Smithfield S.L. (Groupe Smithfield) / Campofrío Alimentación, S.A. (Campofrío)
In June 2008 (fiscal 2009), we announced an agreement to sell Groupe Smithfield to Campofrío in exchange forshares of Campofrío common stock. In December 2008 (fiscal 2009), the merger of Campofrío and GroupeSmithfield was finalized. The new company, known as CFG, is listed on the Madrid and Barcelona StockExchanges. The merger created the largest pan-European company in the packaged meats sector and one of thefive largest worldwide. The sale of Groupe Smithfield resulted in a pre-tax gain of $56.0 million, recognized inthe International segment in the third quarter of fiscal 2009.
39
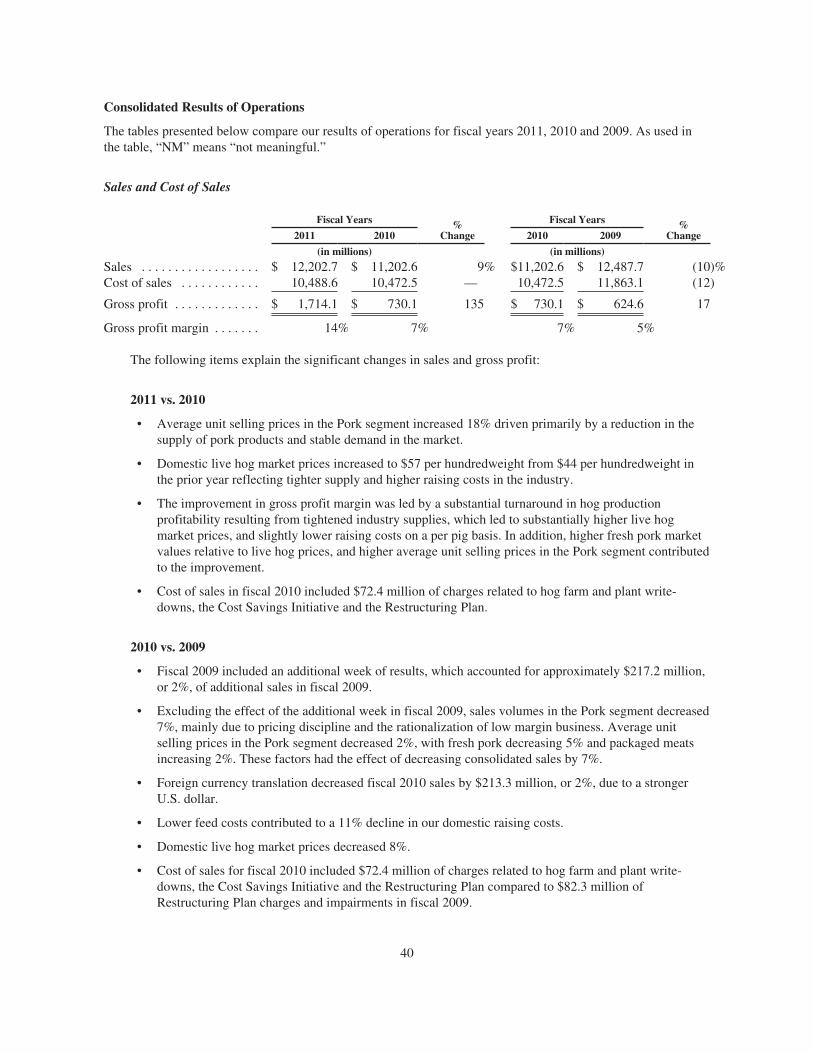
Consolidated Results of Operations
The tables presented below compare our results of operations for fiscal years 2011, 2010 and 2009. As used inthe table, “NM” means “not meaningful.”
Sales and Cost of Sales
Fiscal Years %Change
Fiscal Years %Change2011 2010 2010 2009
(in millions) (in millions)
Sales . . . . . . . . . . . . . . . . . . $ 12,202.7 $ 11,202.6 9% $11,202.6 $ 12,487.7 (10)%Cost of sales . . . . . . . . . . . . 10,488.6 10,472.5 — 10,472.5 11,863.1 (12)
Gross profit . . . . . . . . . . . . . $ 1,714.1 $ 730.1 135 $ 730.1 $ 624.6 17
Gross profit margin . . . . . . . 14% 7% 7% 5%
The following items explain the significant changes in sales and gross profit:
2011 vs. 2010
• Average unit selling prices in the Pork segment increased 18% driven primarily by a reduction in thesupply of pork products and stable demand in the market.
• Domestic live hog market prices increased to $57 per hundredweight from $44 per hundredweight inthe prior year reflecting tighter supply and higher raising costs in the industry.
• The improvement in gross profit margin was led by a substantial turnaround in hog productionprofitability resulting from tightened industry supplies, which led to substantially higher live hogmarket prices, and slightly lower raising costs on a per pig basis. In addition, higher fresh pork marketvalues relative to live hog prices, and higher average unit selling prices in the Pork segment contributedto the improvement.
• Cost of sales in fiscal 2010 included $72.4 million of charges related to hog farm and plant write-downs, the Cost Savings Initiative and the Restructuring Plan.
2010 vs. 2009
• Fiscal 2009 included an additional week of results, which accounted for approximately $217.2 million,or 2%, of additional sales in fiscal 2009.
• Excluding the effect of the additional week in fiscal 2009, sales volumes in the Pork segment decreased7%, mainly due to pricing discipline and the rationalization of low margin business. Average unitselling prices in the Pork segment decreased 2%, with fresh pork decreasing 5% and packaged meatsincreasing 2%. These factors had the effect of decreasing consolidated sales by 7%.
• Foreign currency translation decreased fiscal 2010 sales by $213.3 million, or 2%, due to a strongerU.S. dollar.
• Lower feed costs contributed to a 11% decline in our domestic raising costs.
• Domestic live hog market prices decreased 8%.
• Cost of sales for fiscal 2010 included $72.4 million of charges related to hog farm and plant write-downs, the Cost Savings Initiative and the Restructuring Plan compared to $82.3 million ofRestructuring Plan charges and impairments in fiscal 2009.
40
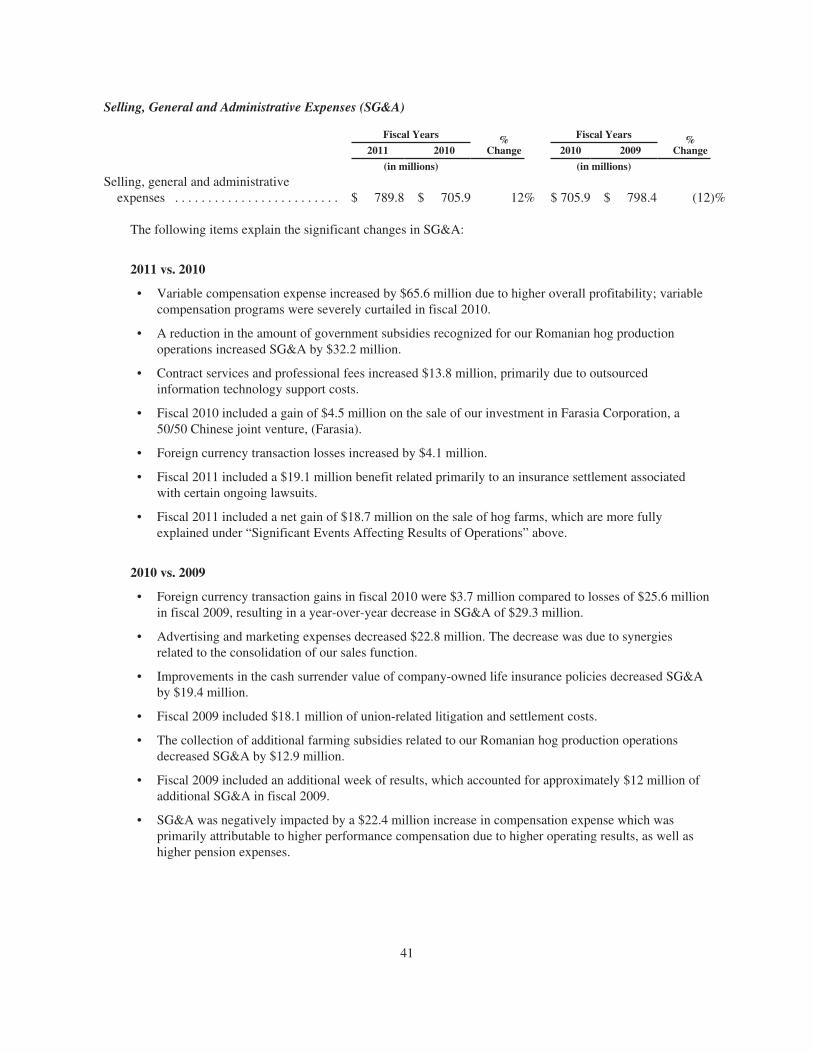
Selling, General and Administrative Expenses (SG&A)
Fiscal Years %Change
Fiscal Years %Change2011 2010 2010 2009
(in millions) (in millions)
Selling, general and administrativeexpenses . . . . . . . . . . . . . . . . . . . . . . . . . $ 789.8 $ 705.9 12% $ 705.9 $ 798.4 (12)%
The following items explain the significant changes in SG&A:
2011 vs. 2010
• Variable compensation expense increased by $65.6 million due to higher overall profitability; variablecompensation programs were severely curtailed in fiscal 2010.
• A reduction in the amount of government subsidies recognized for our Romanian hog productionoperations increased SG&A by $32.2 million.
• Contract services and professional fees increased $13.8 million, primarily due to outsourcedinformation technology support costs.
• Fiscal 2010 included a gain of $4.5 million on the sale of our investment in Farasia Corporation, a50/50 Chinese joint venture, (Farasia).
• Foreign currency transaction losses increased by $4.1 million.
• Fiscal 2011 included a $19.1 million benefit related primarily to an insurance settlement associatedwith certain ongoing lawsuits.
• Fiscal 2011 included a net gain of $18.7 million on the sale of hog farms, which are more fullyexplained under “Significant Events Affecting Results of Operations” above.
2010 vs. 2009
• Foreign currency transaction gains in fiscal 2010 were $3.7 million compared to losses of $25.6 millionin fiscal 2009, resulting in a year-over-year decrease in SG&A of $29.3 million.
• Advertising and marketing expenses decreased $22.8 million. The decrease was due to synergiesrelated to the consolidation of our sales function.
• Improvements in the cash surrender value of company-owned life insurance policies decreased SG&Aby $19.4 million.
• Fiscal 2009 included $18.1 million of union-related litigation and settlement costs.
• The collection of additional farming subsidies related to our Romanian hog production operationsdecreased SG&A by $12.9 million.
• Fiscal 2009 included an additional week of results, which accounted for approximately $12 million ofadditional SG&A in fiscal 2009.
• SG&A was negatively impacted by a $22.4 million increase in compensation expense which wasprimarily attributable to higher performance compensation due to higher operating results, as well ashigher pension expenses.
41

Equity in (Income) Loss of Affiliates
Fiscal Years %Change
Fiscal Years %Change2011 2010 2010 2009
(in millions) (in millions)
CFG(1) . . . . . . . . . . . . . . . . . . . . . . . . $ (17.0) $ (4.5) 278% $ (4.5) $ 5.6 180%Mexican joint ventures . . . . . . . . . . . (29.6) (13.2) 124 (13.2) 9.8 235Butterball . . . . . . . . . . . . . . . . . . . . . . (1.3) (18.8) (93) (18.8) 19.5 196Cattleco, LLC (Cattleco) . . . . . . . . . . — — NM — 15.1 NMAll other equity method
investments . . . . . . . . . . . . . . . . . . (2.2) (2.1) 5 (2.1) 0.1 NM
Equity in (income) loss ofaffiliates . . . . . . . . . . . . . . . . . $ (50.1) $ (38.6) 30 $ (38.6) $ 50.1 177
(1) Reflects the combined results of Groupe Smithfield and Campofrío.
The following items explain the significant changes in equity in (income) loss of affiliates:
2011 vs. 2010
• Fiscal 2010 results for CFG included a $10.4 million debt restructuring charge and a $1.3 millioncharge related to its discontinued Russian operation.
• Equity income from our Mexican joint ventures increased significantly as a result of higher hog prices.
• The decrease in equity income from Butterball reflects our sale of the investment in the third quarter offiscal 2011, which is more fully explained under “Significant Events Affecting Results of Operations”above.
2010 vs. 2009
• Improved results at Butterball were mainly driven by lower raw material costs as a result of lower feedprices and a modification of our live turkey transfer pricing agreement with Butterball from a cost-based pricing arrangement to a market-based pricing arrangement, as well as reduced plant operatingcosts due to production initiatives.
• Our investment in CFG was positively impacted by merger synergies and cost reduction programs.Fiscal 2010 included $10.4 million of debt restructuring charges at CFG and $1.3 million of chargesrelated to CFG’s discontinued Russian operation. However, the year-over-year impact of these chargeswas offset by $8.8 million of charges recorded in fiscal 2009 related to CFG’s discontinued Russianoperation and $3.2 million of charges related to a restructuring at Groupe Smithfield.
• The improvements in our Mexican hog production joint ventures reflect substantially lower feed costsand foreign currency transaction gains of $3.4 million in fiscal 2010 compared to foreign currencytransaction losses of $7.6 million in fiscal 2009.
• Fiscal 2009 included $15.1 million of losses related to our former cattle joint venture, Cattleco, whichhad been completely liquidated by the fourth quarter of fiscal 2009.
Interest Expense
Fiscal Years %Change
Fiscal Years %Change2011 2010 2010 2009
(in millions) (in millions)
Interest expense . . . . . . . . . . . . . . . . $ 245.4 $ 266.4 (8)% $ 266.4 $ 221.8 20%
42

The following items explain the significant changes in interest expense:
2011 vs. 2010
• Interest expense decreased primarily due to the repurchase of $913.1 million of our senior unsecuredand senior secured notes in fiscal 2011. The repurchase of these notes is more fully described under“Liquidity and Capital Resources” below.
2010 vs. 2009
• The increase in interest expense was primarily due to the issuance of higher cost debt in fiscal 2010 andthe amortization of the associated debt issuance costs. The debt instruments we entered into in fiscal2010 are more fully described under “Liquidity and Capital Resources” below. The increase in interestexpense was partially offset by the effect of an additional week in fiscal 2009.
Other Loss (Income)
Fiscal Years %Change
Fiscal Years %Change2011 2010 2010 2009
(in millions) (in millions)
Other loss (income) . . . . . . . . . . . . . $ 92.5 $ 11.0 NM $ 11.0 $ (63.5) (117)%
The following items explain the significant changes in other loss (income):
2011 vs. 2010
• As described more fully under “Liquidity and Capital Resources” below, we repurchased $913.1million of our senior unsecured and senior secured notes in fiscal 2011 and recognized losses on debtextinguishment of $92.5 million compared to debt extinguishment losses of $11.0 million in fiscal2010.
2010 vs. 2009
• Other loss in fiscal 2010 consisted of $11.0 million of charges for the write-off of amendment fees andcosts associated with the extinguishment of our then existing secured revolving credit facility (the U.S.Credit Facility) and our then existing European secured revolving credit facility (the Euro CreditFacility). The purpose of these write-offs is more fully described under “Liquidity and CapitalResources” below. Other income in fiscal 2009 consisted of a $56.0 million gain on the sale of ourinterest in Groupe Smithfield to Campofrio and a $7.5 million gain on the repurchase of long-termdebt.
Income Tax (Benefit) Expense
Fiscal Years
2011 2010 2009
Income tax (benefit) expense (in millions) . . . . . . . . . . . . . . . . . . . . . . . . $ 236.1 $ (113.2) $ (131.3)Effective tax rate . . . . . . . . . . . . . . . . . . . . . . . . . . . . . . . . . . . . . . . . . . . . 31% 53% 34%
The following items explain the significant changes in the effective tax rate:
2011 vs. 2010
• The decrease in the effective tax rate was due primarily to the mix of foreign earnings (which havelower effective tax rates) and domestic earnings in fiscal 2011 compared to fiscal 2010, the benefit ofthe Federal manufacturer’s deduction, the utilization of foreign tax credits in the fiscal 2011, and thelegislative retroactive reinstatement of the Credit for Increasing Research Activities.
43
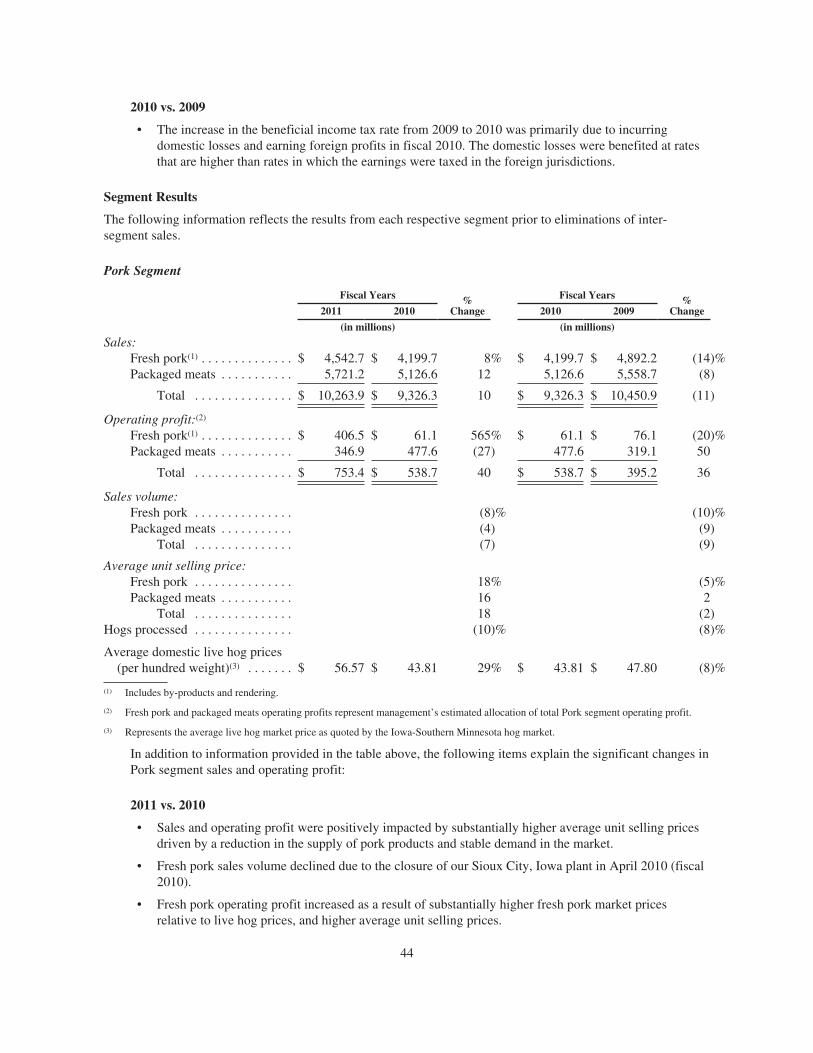
2010 vs. 2009
• The increase in the beneficial income tax rate from 2009 to 2010 was primarily due to incurringdomestic losses and earning foreign profits in fiscal 2010. The domestic losses were benefited at ratesthat are higher than rates in which the earnings were taxed in the foreign jurisdictions.
Segment Results
The following information reflects the results from each respective segment prior to eliminations of inter-segment sales.
Pork Segment
Fiscal Years %Change
Fiscal Years %Change2011 2010 2010 2009
(in millions) (in millions)
Sales:Fresh pork(1) . . . . . . . . . . . . . . $ 4,542.7 $ 4,199.7 8% $ 4,199.7 $ 4,892.2 (14)%Packaged meats . . . . . . . . . . . 5,721.2 5,126.6 12 5,126.6 5,558.7 (8)
Total . . . . . . . . . . . . . . . $ 10,263.9 $ 9,326.3 10 $ 9,326.3 $ 10,450.9 (11)
Operating profit:(2)
Fresh pork(1) . . . . . . . . . . . . . . $ 406.5 $ 61.1 565% $ 61.1 $ 76.1 (20)%Packaged meats . . . . . . . . . . . 346.9 477.6 (27) 477.6 319.1 50
Total . . . . . . . . . . . . . . . $ 753.4 $ 538.7 40 $ 538.7 $ 395.2 36
Sales volume:Fresh pork . . . . . . . . . . . . . . . (8)% (10)%Packaged meats . . . . . . . . . . . (4) (9)
Total . . . . . . . . . . . . . . . (7) (9)
Average unit selling price:Fresh pork . . . . . . . . . . . . . . . 18% (5)%Packaged meats . . . . . . . . . . . 16 2
Total . . . . . . . . . . . . . . . 18 (2)Hogs processed . . . . . . . . . . . . . . . (10)% (8)%
Average domestic live hog prices(per hundred weight)(3) . . . . . . . $ 56.57 $ 43.81 29% $ 43.81 $ 47.80 (8)%
(1) Includes by-products and rendering.
(2) Fresh pork and packaged meats operating profits represent management’s estimated allocation of total Pork segment operating profit.
(3) Represents the average live hog market price as quoted by the Iowa-Southern Minnesota hog market.
In addition to information provided in the table above, the following items explain the significant changes inPork segment sales and operating profit:
2011 vs. 2010
• Sales and operating profit were positively impacted by substantially higher average unit selling pricesdriven by a reduction in the supply of pork products and stable demand in the market.
• Fresh pork sales volume declined due to the closure of our Sioux City, Iowa plant in April 2010 (fiscal2010).
• Fresh pork operating profit increased as a result of substantially higher fresh pork market pricesrelative to live hog prices, and higher average unit selling prices.
44

• Packaged meats operating profit declined, reflecting substantially higher raw material costs, which wewere unable to pass on fully to consumers.
• Operating profit in fiscal 2010 included $30.4 million in charges associated with the Restructuring Planand the Sioux City plant closure.
2010 vs. 2009
• Fiscal 2009 included an additional week of results, which accounted for approximately $202.0 million,or 2%, of additional sales in fiscal 2009.
• Excluding the effect of an additional week of results in fiscal 2009, fresh pork and packaged meatssales volumes each decreased 7%. Sales volumes were impacted by pricing discipline and therationalization of low margin business due to the Restructuring Plan.
• Operating profit in fiscal 2009 included $88.2 million of restructuring and impairment charges relatedto the Restructuring Plan. Of this amount, $67.0 million related to our packaged meats operations and$21.2 million related to our fresh pork operations. Operating profit in fiscal 2010 included $17.3million of restructuring and impairment charges related to the Restructuring Plan. Of this amount,$13.4 million related to our packaged meats operations and $3.9 related to our fresh pork operations.
• Operating profit in fiscal 2009 included $18.1 million of union-related litigation and settlementcharges.
• Operating profit in fiscal 2010 included both incremental costs and offsetting recoveries of businessinterruption losses related to the fire that occurred at the primary manufacturing facility of oursubsidiary, Patrick Cudahy, in July 2009 (fiscal 2010). We recorded $31.8 million of insuranceproceeds in cost of sales in fiscal 2010, which offset the estimated business interruption losses incurredduring fiscal 2010.
• Operating profit in fiscal 2010 was negatively impacted by $13.1 million of impairment and severancecosts related to the Sioux City plant closure.
Hog Production Segment
Fiscal Years %Change
Fiscal Years %Change2011 2010 2010 2009
(in millions) (in millions)
Sales . . . . . . . . . . . . . . . . . . . . . . . . . . $ 2,705.1 $ 2,207.8 23% $ 2,207.8 $ 2,428.2 (9)%Operating profit (loss) . . . . . . . . . . . . 224.4 (539.2) 142 (539.2) (491.3) (10)
Head sold . . . . . . . . . . . . . . . . . . . . . . 16.43 17.43 (6)% 17.43 18.64 (6)%
Average domestic live hog prices(per hundred weight)(1) . . . . . . . . . $ 56.57 $ 43.81 29% $ 43.81 $ 47.80 (8)%
Domestic raising costs (per hundredweight) . . . . . . . . . . . . . . . . . . . . . . $ 54.14 $ 54.88 (1)% $ 54.88 $ 61.87 (11)%
(1) Represents the average live hog market price as quoted by the Iowa-Southern Minnesota hog market.
In addition to the information provided in the table above, the following items explain the significantchanges in Hog Production segment sales and operating profit:
2011 vs. 2010
• Sales and operating profit were positively impacted by substantially higher live hog prices due to areduction in the supply of market hogs.
• Operating loss in fiscal 2010 included $34.1 million in impairment charges related to certain hog farms,which is more fully explained under “Significant Events Affecting Results of Operations” above.
45

• Operating profit in fiscal 2011 included a benefit of $19.1 million related primarily to an insurancesettlement associated with certain ongoing lawsuits.
• Operating profit in fiscal 2011 includes a net gain of $18.7 million on the sales of hog farms, which aremore fully explained under “Significant Events Affecting Results of Operations” above.
• Operating profit in fiscal 2011 included charges associated with the Cost Savings Initiative of $28.0million compared to $9.1 million in fiscal 2010.
2010 vs. 2009
• The effect of an additional week of results in fiscal 2009 decreased sales $41.1 million, or 2%.
• Excluding the effect of the additional week of results in fiscal 2009, head sold decreased 5% due to theimpact of our sow reduction program.
• The decrease in domestic raising costs is primarily attributable to lower feed prices.
• Operating loss in fiscal 2010 included $34.1 million of impairment charges related to certain hogfarms, which are more fully explained under “Significant Events Affecting Results of Operations”above.
• Operating loss in fiscal 2010 included $9.1 million of charges associated with the Cost SavingsInitiative.
International Segment
Fiscal Years %Change
Fiscal Years %Change2011 2010 2010 2009
(in millions) (in millions)Sales:
Poland . . . . . . . . . . . . . . . . . . $ 1,040.0 $ 992.6 5% $ 992.6 $ 1,050.4 (6)%Romania . . . . . . . . . . . . . . . . 199.1 182.4 9 182.4 202.5 (10)Other . . . . . . . . . . . . . . . . . . . 101.6 102.2 (1) 102.2 124.6 (18)
Total . . . . . . . . . . . . . . . $ 1,340.7 $ 1,277.2 5 $ 1,277.2 $ 1,377.5 (7)
Operating profit (loss):Poland . . . . . . . . . . . . . . . . . . $ 64.0 $ 75.7 (15)% $ 75.7 $ 27.2 178%Romania . . . . . . . . . . . . . . . . 9.2 35.1 (74) 35.1 (4.2) NMOther(1) . . . . . . . . . . . . . . . . . . 42.7 17.1 150 17.1 (18.0) 195
Total . . . . . . . . . . . . . . . $ 115.9 $ 127.9 (9) $ 127.9 $ 5.0 NM
Poland:Sales volume (pounds)(2) . . . . 12% 17%Average unit selling
price(2) . . . . . . . . . . . . . . . . (7) (19)Hogs processed . . . . . . . . . . . 24 8Raising costs (per
hundredweight) . . . . . . . . . 3 (29)
Romania:Sales volume (pounds)(2) . . . . 22% 11%Average unit selling
price(2) . . . . . . . . . . . . . . . . (10) (19)Hogs processed . . . . . . . . . . . 17 15Raising costs (per
hundredweight) . . . . . . . . . (12) (24)
(1) Includes our equity method investments in Mexico and the results from our investment in CFG.(2) Excludes the sale of live hogs.
46

In addition to the information provided in the table above, the following items explain the significantchanges in International segment sales and operating profit:
2011 vs. 2010
• The increases in sales volumes were primarily due to capacity expansion in semi-processed andsausage products in Poland and the expansion of hog production operations in Romania.
• The decline in average unit selling prices reflects continued adverse economic conditions in Europe.
• In Romania, we recognized $32.2 million less in government subsidies for hog production than theprior year due to the expiration of the subsidy program in the second half of fiscal 2010.
• Equity income from our equity method investments increased $29.3 million primarily driven by higherhog prices in Mexico. Also, equity income from CFG in fiscal 2010 was negatively impacted by $10.4million of debt restructuring charges and $1.3 million of charges related to its discontinued Russianoperation.
2010 vs. 2009
• Foreign currency translation caused fiscal 2010 sales to decrease by $213.3 million, or 17%, due to astronger U.S. dollar.
• Operating profit was positively impacted by lower raw material costs.
• Operating profit was positively impacted by $1.8 million in foreign currency transaction gains in fiscal2010, compared to $15.8 million in foreign currency transaction losses in fiscal 2009.
• Operating profit was positively impacted by an $35.0 million improvement in equity income as CFGbenefited from merger synergies and cost reduction programs and our Mexican joint venturesexperienced lower feed costs. Fiscal 2010 included $10.4 million of debt restructuring charges at CFGand $1.3 million of charges related to its discontinued Russian operation. However, the year-over-yearimpact of these charges was offset by $8.8 million of charges recorded in fiscal 2009 related to CFG’sdiscontinued Russian operation and $3.2 million of charges related to a restructuring at GroupeSmithfield. Also, equity income from our Mexican joint ventures included $3.4 million of foreigncurrency transaction gains in fiscal 2010 compared to $7.6 million of foreign currency transactionlosses in fiscal 2009.
• Operating profit was positively impacted by a $12.9 million increase in farming subsidies related to ourRomanian hog production operations.
Other Segment
Fiscal Years %Change
Fiscal Years %Change2011 2010 2010 2009
(in millions) (in millions)
Sales . . . . . . . . . . . . . . . . . . . . . . . . . . $ 74.7 $ 153.3 (51)% $ 153.3 $ 250.8 (39)%Operating (loss) profit . . . . . . . . . . . . . (2.4) 3.6 (167) 3.6 (46.6) 108
The following items explain the significant changes in Other segment sales and operating profit:
2011 vs. 2010
• The decrease in sales and operating profit reflects the sale of our turkey operations, including ourinvestment in Butterball, in December 2010 (fiscal 2011), which is more fully explained under“Significant Events Affecting Results of Operations” above.
• Fiscal 2010 included the sale of our remaining live cattle inventory totaling $33.3 million.
47
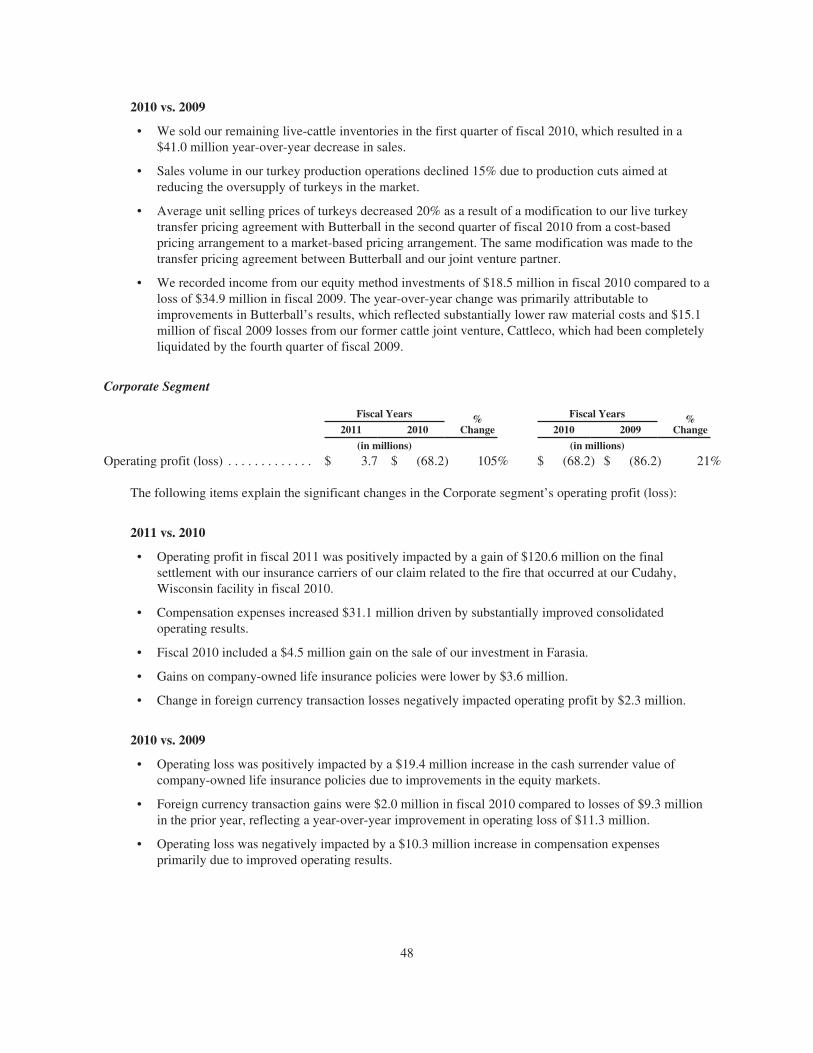
2010 vs. 2009
• We sold our remaining live-cattle inventories in the first quarter of fiscal 2010, which resulted in a$41.0 million year-over-year decrease in sales.
• Sales volume in our turkey production operations declined 15% due to production cuts aimed atreducing the oversupply of turkeys in the market.
• Average unit selling prices of turkeys decreased 20% as a result of a modification to our live turkeytransfer pricing agreement with Butterball in the second quarter of fiscal 2010 from a cost-basedpricing arrangement to a market-based pricing arrangement. The same modification was made to thetransfer pricing agreement between Butterball and our joint venture partner.
• We recorded income from our equity method investments of $18.5 million in fiscal 2010 compared to aloss of $34.9 million in fiscal 2009. The year-over-year change was primarily attributable toimprovements in Butterball’s results, which reflected substantially lower raw material costs and $15.1million of fiscal 2009 losses from our former cattle joint venture, Cattleco, which had been completelyliquidated by the fourth quarter of fiscal 2009.
Corporate Segment
Fiscal Years %Change
Fiscal Years %Change2011 2010 2010 2009
(in millions) (in millions)
Operating profit (loss) . . . . . . . . . . . . . $ 3.7 $ (68.2) 105% $ (68.2) $ (86.2) 21%
The following items explain the significant changes in the Corporate segment’s operating profit (loss):
2011 vs. 2010
• Operating profit in fiscal 2011 was positively impacted by a gain of $120.6 million on the finalsettlement with our insurance carriers of our claim related to the fire that occurred at our Cudahy,Wisconsin facility in fiscal 2010.
• Compensation expenses increased $31.1 million driven by substantially improved consolidatedoperating results.
• Fiscal 2010 included a $4.5 million gain on the sale of our investment in Farasia.
• Gains on company-owned life insurance policies were lower by $3.6 million.
• Change in foreign currency transaction losses negatively impacted operating profit by $2.3 million.
2010 vs. 2009
• Operating loss was positively impacted by a $19.4 million increase in the cash surrender value ofcompany-owned life insurance policies due to improvements in the equity markets.
• Foreign currency transaction gains were $2.0 million in fiscal 2010 compared to losses of $9.3 millionin the prior year, reflecting a year-over-year improvement in operating loss of $11.3 million.
• Operating loss was negatively impacted by a $10.3 million increase in compensation expensesprimarily due to improved operating results.
48

LIQUIDITY AND CAPITAL RESOURCES
Summary
Our cash requirements consist primarily of the purchase of raw materials used in our hog production and porkprocessing operations, long-term debt obligations and related interest, lease payments for real estate, machinery,vehicles and other equipment, and expenditures for capital assets, other investments and other general businesspurposes. Our primary sources of liquidity are cash we receive as payment for the products we produce and sell,as well as our credit facilities.
Based on the following, we believe that our current liquidity position is strong and that our cash flows fromoperations and availability under our credit facilities will be sufficient to meet our working capital needs andfinancial obligations for at least the next twelve months:
• As of May 1, 2011, our liquidity position was approximately $1.3 billion, comprised of $855.9 million ofavailability under the ABL Credit Facility (as defined below), $374.7 million in cash and cash equivalentsand $48.9 million of availability under international credit lines.
• In June 2011 (fiscal 2012), we refinanced the ABL Credit Facility (as defined below) into the InventoryRevolver (as defined below) and the Securitization Facility (as defined below). The refinance is morefully explained under “Credit Facilities” below.
• We generated $616.4 million of net cash flows from operating activities in fiscal 2011.
Sources of Liquidity
We have available a variety of sources of liquidity and capital resources, both internal and external. Theseresources provide funds required for current operations, acquisitions, integration costs, debt retirement and othercapital requirements.
Accounts Receivable and Inventories
The meat processing industry is characterized by high sales volume and rapid turnover of inventories andaccounts receivable. Because of the rapid turnover rate, we consider our meat inventories and accounts receivablehighly liquid and readily convertible into cash. The Hog Production segment also has rapid turnover of accountsreceivable. Although inventory turnover in the Hog Production segment is slower, mature hogs are readilyconvertible into cash. Borrowings under our credit facilities are used, in part, to finance increases in the levels ofinventories and accounts receivable resulting from seasonal and other market-related fluctuations in raw materialcosts.
Credit Facilities
May 1, 2011
Facility Capacity
BorrowingBase
Adjustment
OutstandingLetters of
CreditOutstandingBorrowings
AmountAvailable
(in millions)
ABL Credit Facility . . . . . . . . . . . . . . . . . . . . . . . . . $ 1,000.0 $ — $ (144.1) $ — $ 855.9International facilities . . . . . . . . . . . . . . . . . . . . . . . 125.8 — — (76.9) 48.9
Total credit facilities . . . . . . . . . . . . . . . . . . . . $ 1,125.8 $ — $ (144.1) $ (76.9) $ 904.8
In June 2011 (fiscal 2012), we refinanced our asset-based revolving credit agreement totaling $1.0 billion thatsupported short-term funding needs and letters of credit (the ABL Credit Facility) into two separate facilities:(1) an inventory based revolving credit facility up to $925 million, with an option to expand up to $1.25 billion
49

(the Inventory Revolver), and (2) an accounts receivable securitization facility up to $275 million (theSecuritization Facility). We may request working capital loans and letters of credit under both facilities.
Availability under the Inventory Revolver is a function of the level of eligible inventories, subject to reserves.The Inventory Revolver matures in June 2016. However, it will mature in March 2014 if the outstandingprincipal balance of the 2014 Notes, net of the amount of cash in excess of $75 million, exceeds $300 million.The unused commitment fee and the interest rate spreads are a function of our leverage ratio (as defined in theSecond Amended and Restated Credit Agreement). The initial unused commitment fee and spread above LIBORare 0.5% and 2.75%, respectively. The Inventory Revolver includes financial covenants. The ratio of our fundeddebt to capitalization (as defined in the Second Amended and Restated Credit Agreement) may not exceed 0.5 to1.0, and our EBITDA to interest expense ratio (as defined in the Second Amended and Restated Creditagreement) may not be less than 2.5 to 1.0. Obligations under the Inventory Revolver are guaranteed by ourmaterial U.S. subsidiaries and are secured by (i) a first priority lien on certain personal property, including cashand cash equivalents, deposit accounts, inventory, intellectual property, and certain equity interests, and (ii) asecond priority lien on substantially all of the guarantors’ real property, fixtures and equipment. We incurredapproximately $12.0 million in transaction fees in connection with the Inventory Revolver, which will beamortized over its five year life.
The term of the Securitization Facility is three years. All accounts receivable will be sold by our principal U.S.operating subsidiaries to a wholly-owned “bankruptcy remote” special purpose vehicle (SPV). The SPV willpledge the receivables as security for loans and letters of credit from a conduit lender or a committed lender. TheSPV will be included in our consolidated financial statements and therefore, the accounts receivable owned by itwill be included in our consolidated balance sheet. However, the accounts receivable owned by the SPV will beseparate and distinct from our other assets and will not be available to our creditors should we become insolvent.The unused commitment fee and the interest rate spreads are a function of our leverage ratio (as defined in theSecond Amended and Restated Credit Agreement). The initial unused commitment fee and spread above theconduit lender’s cost of funds (or in the case of funding by the committed lender, above LIBOR) are 0.5% and1.5%, respectively. We incurred approximately $2.5 million in transaction fees in connection with theSecuritization Facility, which will be amortized over its three year life.
Securities
We have a shelf registration statement filed with the Securities and Exchange Commission to register sales ofdebt, stock and other securities from time to time. We would use the net proceeds from the possible sale of thesesecurities for acquisitions, repayment of existing debt or general corporate purposes.
Cash Flows
Operating Activities
Fiscal Years
2011 2010 2009
(in millions)
Net cash flows from operating activities . . . . . . . . . . . . . . . . . . . . . . . . . . . . . $ 616.4 $ 258.2 $ 269.9
The following items explain the significant changes in cash flows from operating activities over the pastthree fiscal years:
2011 vs. 2010
• Cash received from customers increased due to higher selling prices on fresh pork, packaged meats andlive hogs.
• Cash received for the settlement of derivative contracts and for margin requirements increased $315.9million.
50
• We received cash dividends from CFG of approximately $3.4 million in fiscal 2011 compared to $16.6million in fiscal 2010.
• Cash paid to outside hog suppliers was significantly higher than the prior year due to a 29% increase inaverage domestic live hog market prices.
• Cash paid for grain was approximately $139.1 million higher than the prior year due to increased feedprices.
• We contributed $128.5 million to our qualified and non-qualified pension plans in fiscal 2011compared to $73.9 million in fiscal 2010.
• In fiscal 2011, we transferred a total $27.2 million of cash to our workers compensation serviceproviders to replace letters of credit previously held as collateral in these arrangements.
2010 vs. 2009
• Cash received from customers decreased significantly due to lower sales volumes and fresh porkmarket prices.
• Cash paid for the settlement of derivative contracts and for margin requirements increased $130.8million.
• Cash paid to outside hog suppliers decreased as average live hog market prices declined by 8%.
• We paid approximately $124.2 million less for grains in fiscal 2010 due to substantially lower feedprices.
• Cash paid for transportation and energy decreased due to significantly lower fuel prices and energycosts.
• We received $60.1 million of insurance proceeds in fiscal 2010 attributable to business interruptionrecoveries and reimbursable costs related to the Patrick Cudahy fire.
• We received a cash dividend from CFG of $16.6 million in fiscal 2010.
Investing Activities
Fiscal Years
2011 2010 2009
(in millions)
Capital expenditures . . . . . . . . . . . . . . . . . . . . . . . . . . . . . . . . . . . . . . . . . . . . $ (176.8) $ (174.7) $ (179.3)Dispositions, including Butterball, LLC . . . . . . . . . . . . . . . . . . . . . . . . . . . . . 261.5 23.3 587.0Insurance proceeds . . . . . . . . . . . . . . . . . . . . . . . . . . . . . . . . . . . . . . . . . . . . . 120.6 9.9 —Net disposals (additions) of breeding stock . . . . . . . . . . . . . . . . . . . . . . . . . . 26.2 (8.0) 4.8Proceeds from sale of property, plant and equipment . . . . . . . . . . . . . . . . . . . 22.8 11.7 21.4Dividends received . . . . . . . . . . . . . . . . . . . . . . . . . . . . . . . . . . . . . . . . . . . . . — 5.3 56.5Investments in partnerships . . . . . . . . . . . . . . . . . . . . . . . . . . . . . . . . . . . . . . . — (1.3) (31.7)Business acquisitions, net of cash acquired . . . . . . . . . . . . . . . . . . . . . . . . . . — — (17.4)
Net cash flows from investing activities . . . . . . . . . . . . . . . . . . . . . . . . . . . . . $ 254.3 $ (133.8) $ 441.3
The following items explain the significant investing activities for each of the past three fiscal years:
2011
• Capital expenditures primarily related to plant and hog farm improvement projects, includingapproximately $44.0 million related to the Cost Savings Initiative.
• Dispositions included proceeds from the sale of our investment in Butterball, LLC and our relatedturkey production assets and proceeds from the sale of hog operations in Texas, Oklahoma and Iowa.
51
• The insurance proceeds represent the gain on involuntary conversion of property, plant and equipmentdue to the Patrick Cudahy fire upon the final settlement of claims with our insurance carriers in thethird quarter of fiscal 2011.
• Proceeds from the sale of property, plant and equipment includes $9.1 million from the sale of farmland in Texas.
2010
• Dispositions included $14.2 million in proceeds from the sale of our interest in Farasia and $9.1 millionin proceeds from the sale of RMH Foods, LLC, a subsidiary in the Pork segment.
• Capital expenditures were primarily related to the Restructuring Plan, the purchase of property andequipment previously leased and plant and hog farm improvement projects.
• The insurance proceeds represent the portion of total insurance proceeds received through the thirdquarter of fiscal 2010 attributable to the destruction of property, plant and equipment due to the firethat occured at our Patrick Cudahy facility.
2009
• We received $575.5 million for the sale of Smithfield Beef and $11.5 million for the sale of SBE. Theproceeds were used to pay down the U.S. Credit Facility and other long-term debt.
• Capital expenditures primarily related to plant and hog farm improvement projects.
• We received dividends of $56.5 million from the liquidation of Cattleco.
Financing Activities
Fiscal Years
2011 2010 2009
(in millions)
Proceeds from the issuance of long-term debt . . . . . . . . . . . . . . . . . . . . . . . $ — $ 840.4 $ 600.0Net borrowings (repayments) on revolving credit facilities and notes
payables . . . . . . . . . . . . . . . . . . . . . . . . . . . . . . . . . . . . . . . . . . . . . . . . . . . 21.6 (491.6) (962.5)Principal payments on long-term debt and capital lease obligations . . . . . . (944.5) (333.3) (356.6)Net proceeds from the issuance of common stock and stock option
exercises . . . . . . . . . . . . . . . . . . . . . . . . . . . . . . . . . . . . . . . . . . . . . . . . . . 1.2 296.9 122.3Cash posted as collateral . . . . . . . . . . . . . . . . . . . . . . . . . . . . . . . . . . . . . . . . (23.9) — —Purchase of call options . . . . . . . . . . . . . . . . . . . . . . . . . . . . . . . . . . . . . . . . . — — (88.2)Purchase of redeemable noncontrolling interest . . . . . . . . . . . . . . . . . . . . . . — (38.9) —Proceeds from the sale of warrants . . . . . . . . . . . . . . . . . . . . . . . . . . . . . . . . — — 36.7Debt issuance costs and other . . . . . . . . . . . . . . . . . . . . . . . . . . . . . . . . . . . . — (64.6) (25.2)
Net cash flows from financing activities . . . . . . . . . . . . . . . . . . . . . . . . $ (945.6) $ 208.9 $ (673.5)
The following items explain the significant financing activities for each of the past three fiscal years:
2011
• We repaid $16.2 million in outstanding notes payable and received $40.4 million from draws on creditfacilities in the International segment.
• We repurchased a portion of our senior unsecured notes due August 2011 with a total face value of$522.2 million for $543.1 million through open market purchases as well as a tender offer that expiredon December 1, 2010. Also, we paid $450.0 million to repurchase a portion of our senior unsecured
52
notes due May 2013 and our senior secured notes due July 2014 with face values of $190.0 million and$200.9 million, respectively, as a result of a tender offer that expired on February 9, 2011.
• We repaid $30.1 million on outstanding loans in the International segment.
• We transferred $20.0 million of cash into a deposit account to serve as collateral for overdrafts oncertain of our bank accounts in place of letters of credit previously used under our banking agreementand $3.9 million of cash to the counterparty of our interest rate swap contract to serve as collateral andreplace letters of credit previously provided under the contract.
2010
• In July 2009, we issued $625 million aggregate principal amount of 10% senior secured notes at a priceequal to 96.201% of their face value. In August 2009, we issued an additional $225 million aggregateprincipal amount of 10% senior secured notes at a price equal to 104% of their face value, plus accruedinterest from July 2, 2009 to August 14, 2009. Collectively, these notes, which mature in July 2014, arereferred to as the “2014 Notes.” Interest payments are due semi-annually on January 15 and July 15.The 2014 Notes are guaranteed by substantially all of our U.S. subsidiaries.
We used the net proceeds from the issuance of the 2014 Notes, together with other available cash, torepay borrowings and terminate commitments under the U.S. Credit Facility, to repay the outstandingbalance under the Euro Credit Facility, to repay and/or refinance other indebtedness and for othergeneral corporate purposes.
• In July 2009, we entered into a $200.0 million term loan due August 29, 2013 (the Rabobank TermLoan), which replaced our then existing $200.0 million term loan that was scheduled to mature inAugust 2011. In June 2011 (fiscal 2012), we refinanced the Rabobank Term Loan and extended itsmaturity to June 9, 2016. Under the new terms, we are obligated to repay $25.0 million on June 9,2015. We may elect to prepay the loan at any time, subject to the payment of certain prepayment feesin respect of any voluntary prepayment prior to June 9, 2013 and other customary breakage costs.
• In September 2009, we issued 21,660,649 shares of common stock in a registered public offering at$13.85 per share. In October 2009, we issued an additional 598,141 shares of common stock at $13.85per share to cover over-allotments from the offering. We incurred costs of $13.5 million associatedwith the offering. The net proceeds from the offering were used to repay our $206.3 million seniorunsecured notes, which matured in October 2009, and for working capital and other general corporatepurposes.
• We paid debt issuance costs totaling $64.6 million related to the 2014 Notes, the Rabobank Term Loanand the ABL Credit Facility. The debt issuance costs were capitalized and are being amortized intointerest expense over the life of each instrument.
• In November 2009, the noncontrolling interest holders of Premium Pet Health, LLC (PPH), asubsidiary in our Pork segment, notified us of their intention to exercise their put option, requiring us topurchase all of their ownership interests in the subsidiary. In December 2009, we acquired theremaining 49% interest in PPH for $38.9 million. PPH is a leading protein by-product processor thatsupplies many of the leading pet food processors in the United States.
2009
• In July 2008, we issued $400.0 million aggregate principal amount of 4% convertible senior notes dueJune 30, 2013 in a registered offering (the Convertible Notes). The Convertible Notes are payable withcash and, at certain times, are convertible into shares of our common stock based on an initialconversion rate, subject to adjustment, of 44.082 shares per $1,000 principal amount of ConvertibleNotes (which represents an initial conversion price of approximately $22.68 per share). Uponconversion, a holder will receive cash up to the principal amount of the Convertible Notes and sharesof our common stock for the remainder, if any, of the conversion obligation.
53

In connection with the issuance of the Convertible Notes, we entered into separate convertible notehedge transactions with respect to our common stock to reduce potential economic dilution uponconversion of the Convertible Notes, and separate warrant transactions (collectively referred to as theCall Spread Transactions). We purchased call options in private transactions that permit us to acquireup to approximately 17.6 million shares of our common stock at an initial strike price of $22.68 pershare, subject to adjustment, for $88.2 million. We also sold warrants in private transactions for totalproceeds of approximately $36.7 million. The warrants permit the purchasers to acquire up toapproximately 17.6 million shares of our common stock at an initial exercise price of $30.54 per share,subject to adjustment.
We incurred fees and expenses associated with the issuance of the Convertible Notes totaling $11.4million, which were capitalized and will be amortized to interest expense over the life of theConvertible Notes. The net proceeds of $337.1 million from the issuance of the Convertible Notes andthe Call Spread Transactions were used to retire short-term uncommitted credit lines and to reduceamounts outstanding under the U.S. Credit Facility.
• In July 2008, we issued a total of 7,000,000 shares of our common stock to Starbase InternationalLimited, a company registered in the British Virgin Islands which is a subsidiary of COFCO (HongKong) Limited (COFCO). The shares were issued at a purchase price of $17.45 per share. The proceedsfrom the issuance of these shares were used to reduce amounts outstanding under the U.S. CreditFacility.
• In August 2008, we entered into a three-year $200.0 million term loan with Cooperatieve CentraleRaiffeisen-Boerenleenbank B.A. (Rabobank) maturing on August 29, 2011. This term loan wasreplaced with the Rabobank Term Loan in July 2009 (fiscal 2010).
• During the third quarter of fiscal 2009, we redeemed a total of $93.7 million principal amount of our8% senior unsecured notes due in October 2009 for $86.2 million and recorded a gain of $7.5 millionin other income.
• In June 2008, we entered into a $200.0 million unsecured committed credit facility with JP MorganChase Bank and Goldman Sachs Credit Partners L.P., intended to help bridge our working capitalneeds through the time of the closing of the sale of Smithfield Beef in the event we were unable toissue the Convertible Notes. We only borrowed $50.0 million under this credit facility as it replaced anexisting and fully drawn $50.0 million line. We repaid the $50.0 million in June 2008 and terminatedthis credit facility in July 2008.
54

Capitalization
May 1,2011
May 2,2010
(in millions)
10% senior secured notes, due July 2014, including unamortized discounts of$11.2 million and $20.6 million . . . . . . . . . . . . . . . . . . . . . . . . . . . . . . . . . . . . . . . . . $ 412.9 $ 604.4
10% senior secured notes, due July 2014, including unamortized premiums of$6.1 million and $7.8 million . . . . . . . . . . . . . . . . . . . . . . . . . . . . . . . . . . . . . . . . . . . 231.1 232.8
7% senior unsecured notes, due August 2011, including unamortized premiums of$0.2 million and $2.3 million . . . . . . . . . . . . . . . . . . . . . . . . . . . . . . . . . . . . . . . . . . . 78.0 602.3
7.75% senior unsecured notes, due July 2017 . . . . . . . . . . . . . . . . . . . . . . . . . . . . . . . . . 500.0 500.04% senior unsecured Convertible Notes, due June 2013, including unamortized
discounts of $47.3 million and $65.9 million . . . . . . . . . . . . . . . . . . . . . . . . . . . . . . . 352.7 334.17.75% senior unsecured notes, due May 2013 . . . . . . . . . . . . . . . . . . . . . . . . . . . . . . . . 160.0 350.0Floating rate senior secured term loan, due August 2013 . . . . . . . . . . . . . . . . . . . . . . . . 200.0 200.0Various, interest rates from 0% to 9%, due May 2011 through March 2017 . . . . . . . . . 160.0 139.4
Total debt . . . . . . . . . . . . . . . . . . . . . . . . . . . . . . . . . . . . . . . . . . . . . . . . . . . . . . . . . 2,094.7 2,963.0Current portion . . . . . . . . . . . . . . . . . . . . . . . . . . . . . . . . . . . . . . . . . . . . . . . . . . . . . . . . (143.2) (72.2)
Total long-term debt . . . . . . . . . . . . . . . . . . . . . . . . . . . . . . . . . . . . . . . . . . . . . . . . $ 1,951.5 $ 2,890.8
Total shareholders’ equity . . . . . . . . . . . . . . . . . . . . . . . . . . . . . . . . . . . . . . . . . . . . $ 3,545.5 $ 2,755.6
Interest Expense Spread
Although we had no borrowings outstanding on the ABL Credit Facility as of May 1, 2011, based on our creditratings, the applicable interest expense spread would have been 4.25%. A one-level downgrade in our creditratings by either applicable rating agency would not result in an increase in our interest expense spread.
Debt Covenants and the Incurrence Test
Our various debt agreements contain covenants that limit additional borrowings, acquisitions, dispositions,leasing of assets and payments of dividends to shareholders, among other restrictions.
Our senior unsecured and secured notes limit our ability to incur additional indebtedness, subject to certainexceptions, when our interest coverage ratio is, or after incurring additional indebtedness would be, less than 2.0to 1.0 (the Incurrence Test). Beginning in the third quarter of fiscal 2009 and through the first quarter of fiscal2011, we did not meet the Incurrence Test. The Incurrence Test is not a maintenance covenant and our failure tomeet the Incurrence Test was not a default. We met the Incurrence Test in each of the final three quarters offiscal 2011.
Guarantees
As part of our business, we are party to various financial guarantees and other commitments as described below.These arrangements involve elements of performance and credit risk that are not included in the consolidatedbalance sheet. We could become liable in connection with these obligations depending on the performance of theguaranteed party or the occurrence of future events that we are unable to predict. If we consider it probable thatwe will become responsible for an obligation, we will record the liability in our consolidated balance sheet.
We (together with our joint venture partners) guarantee financial obligations of certain unconsolidated jointventures. The financial obligations are: up to $87.0 million of debt borrowed by Agroindustrial del Noroeste(Norson), of which $58.0 million was outstanding as of May 1, 2011, and up to $3.5 million of liabilities with
55

respect to currency swaps executed by another of our unconsolidated Mexican joint ventures, Granjas Carroll deMexico. The covenants in the guarantee relating to Norson’s debt incorporate our covenants under the ABLCredit Facility. In addition, we continue to guarantee $12.4 million of leases that were transferred to JBS inconnection with the sale of Smithfield Beef. Some of these lease guarantees will be released in the near futureand others will remain in place until the leases expire in February 2022.
Additional Matters Affecting Liquidity
Capital Projects
As of May 1, 2011, we had total estimated remaining capital expenditures of $136.8 million on approvedprojects, including approximately $40.1 million related to the Cost Savings Initiative. These projects areexpected to be funded over the next several years with cash flows from operations and borrowings under creditfacilities. Total capital expenditures are expected to remain below depreciation in fiscal 2012.
Group Pens
In January 2007 (fiscal 2007), we announced a voluntary, ten-year program to phase out individual gestationstalls at our sow farms and replace the gestation stalls with group pens. We currently estimate the total cost ofour transition to group pens to be approximately $300.0 million. As previously disclosed, we announced thedelay of capital expenditures for the program due to significant operating losses previously incurred by our HogProduction segment and that we no longer expected to complete the phase-out within ten years of the originalannouncement. In the third quarter of fiscal 2011, we restarted capital expenditures for the program. Thisprogram represents a significant financial commitment and reflects our desire to be more animal friendly, as wellas to address the concerns and needs of our customers. By the end of calendar year 2011, we expect that nearly30 percent of company-owned sows will be in group housing facilities.
Risk Management Activities
We are exposed to market risks primarily from changes in commodity prices, and to a lesser degree, interest ratesand foreign exchange rates. To mitigate these risks, we utilize derivative instruments to hedge our exposure tochanging prices and rates, as more fully described under “Derivative Financial Instruments” below. Our liquidityposition may be positively or negatively affected by changes in the underlying value of our derivative portfolio.When the value of our open derivative contracts decrease, we may be required to post margin deposits with ourbrokers to cover a portion of the decrease. Conversely, when the value of our open derivative contracts increase,our brokers may be required to deliver margin deposits to us for a portion of the increase. During fiscal 2011,margin deposits posted by us ranged from $(50.6) million to $193.9 million (negative amounts representingmargin deposits we have received from our brokers). The average daily amount on deposit with brokers duringfiscal 2011 was $59.5 million. As of May 1, 2011, the net amount on deposit with brokers was $46.3 million.
The effects, positive or negative, on liquidity resulting from our risk management activities tend to be mitigatedby offsetting changes in cash prices in our core business. For example, in a period of rising grain prices, gainsresulting from long grain derivative positions would generally be offset by higher cash prices paid to farmers andother suppliers in spot markets. These offsetting changes do not always occur, however, in the same amounts orin the same period, with lag times of as much as twelve months.
Pension Plan Funding
Funding requirements for our pension plans are determined based on the funded status measured at the end ofeach year. The values of our pension obligation and related assets may fluctuate significantly, which may in turnlead to a larger underfunded status in our pension plans and a higher funding requirement. We contributed $95.1million to our qualified pension plans in fiscal 2011. Our expected minimum funding requirement in fiscal 2012is $61.8 million.
56
Litigation Costs
PSF, certain of our other subsidiaries and affiliates and we are parties to litigation in Missouri involving anumber of claims alleging that hog farms owned or under contract with the defendants interfered with theplaintiffs’ use and enjoyment of their properties. These claims are more fully described in “Item 3. LegalProceedings—Missouri Litigation.” We established a reserve estimating our liability for these and similarpotential claims on the opening balance sheet for our acquisition of PSF. Consequently, expenses and otherliabilities associated with these claims will not affect our profits or losses unless our reserve proves to beinsufficient or excessive. However, legal expenses incurred in our and our subsidiaries’ defense of these claimsand any payments made to plaintiffs through unfavorable verdicts or otherwise will negatively impact our cashflows and our liquidity position. Although we recognize the uncertainties of litigation, based on our historicalexperience and our understanding of the facts and circumstances underlying these claims, we believe that theseclaims will not have a material adverse effect on our results of operations or financial condition.
Share Repurchase Authorization
In June 2011 (fiscal 2012), we announced that our board of directors had approved a share repurchase programauthorizing us to buy up to $150 million of our common stock over the next 24 months. Share repurchases wouldbe funded from cash on hand. This authorization replaces our previous share repurchase program. Sharerepurchases may be made on the open market, or in privately negotiated transactions. The number of sharesrepurchased, and the timing of any buybacks, will depend on corporate cash balances, business and economicconditions, and other factors, including investment opportunities. The program may be discontinued at any time.
Contractual Obligations and Commercial Commitments
The following table provides information about our contractual obligations and commercial commitments as ofMay 1, 2011.
Payments Due By Period
Total < 1 Year 1-3 Years 3-5 Years > 5 Years
(in millions)
Long-term debt . . . . . . . . . . . . . . . . . . . . . . . . . . . . $ 2,094.7 $ 143.2 $ 778.6 $ 665.1 $ 507.8Interest . . . . . . . . . . . . . . . . . . . . . . . . . . . . . . . . . . . 599.8 157.3 271.3 113.0 58.2Capital lease obligations, including interest . . . . . . 29.9 0.7 1.2 1.2 26.8Operating leases . . . . . . . . . . . . . . . . . . . . . . . . . . . 155.3 35.9 53.2 29.0 37.2Capital expenditure commitments . . . . . . . . . . . . . . 25.3 25.3 — — —Purchase obligations:
Hog procurement(1) . . . . . . . . . . . . . . . . . . . . . 5,211.5 1,507.1 1,742.5 1,335.4 626.5Contract hog growers(2) . . . . . . . . . . . . . . . . . . 1,413.9 431.9 350.8 245.3 385.9Other(3) . . . . . . . . . . . . . . . . . . . . . . . . . . . . . . . 568.1 471.7 79.6 14.4 2.4
Total . . . . . . . . . . . . . . . . . . . . . . . . . . . . . . . . . . . . $10,098.5 $ 2,773.1 $ 3,277.2 $ 2,403.4 $ 1,644.8
(1) Through the Pork and International segments, we have purchase agreements with certain hog producers. Some of these arrangementsobligate us to purchase all of the hogs produced by these producers. Other arrangements obligate us to purchase a fixed amount of hogs.Due to the uncertainty of the number of hogs that we are obligated to purchase and the uncertainty of market prices at the time of hogpurchases, we have estimated our obligations under these arrangements. Future payments were estimated using current live hog marketprices, available futures contract prices and internal projections adjusted for historical quality premiums.
(2) Through the Hog Production segment, we use independent farmers and their facilities to raise hogs produced from our breeding stock.Under multi-year contracts, the farmers provide the initial facility investment, labor and front line management in exchange for aperformance-based service fee payable upon delivery. We are obligated to pay this service fee for all hogs delivered. We have estimatedour obligation based on expected hogs delivered from these farmers.
(3) Includes fixed price forward grain purchase contracts totaling $74.3 million. Also includes unpriced forward grain purchase contractswhich, if valued as of May 1, 2011 market prices, would be $266.5 million. These forward grain contracts are accounted for as normalpurchases. As a result, they are not recorded in the balance sheet.
57

OFF-BALANCE SHEET ARRANGEMENTS
We do not have any off-balance sheet arrangements that have a material current effect, or that are reasonablylikely to have a material future effect, on our financial condition, changes in financial condition, revenues orexpenses, results of operations, liquidity, capital expenditures or capital resources.
DERIVATIVE FINANCIAL INSTRUMENTS
We are exposed to market risks primarily from changes in commodity prices, as well as interest rates and foreignexchange rates. To mitigate these risks, we utilize derivative instruments to hedge our exposure to changingprices and rates.
Derivative instruments are recorded in the balance sheet as either assets or liabilities at fair value. For derivativesthat qualify and have been designated as cash flow or fair value hedges for accounting purposes, changes in fairvalue have no net impact on earnings, to the extent the derivative is considered perfectly effective in achievingoffsetting changes in fair value or cash flows attributable to the risk being hedged, until the hedged item isrecognized in earnings (commonly referred to as the “hedge accounting” method). For derivatives that do notqualify or are not designated as hedging instruments for accounting purposes, changes in fair value are recordedin current period earnings (commonly referred to as the “mark-to-market” method). Under this guidance, we mayelect either method of accounting for our derivative portfolio, assuming all the necessary requirements are met.We have in the past availed ourselves of either acceptable method and expect to do so in the future. We believeall of our derivative instruments represent economic hedges against changes in prices and rates, regardless oftheir designation for accounting purposes.
When available, we use quoted market prices to determine the fair value of our derivative instruments. This mayinclude exchange prices, quotes obtained from brokers, or independent valuations from external sources, such asbanks. In some cases where market prices are not available, we make use of observable market based inputs tocalculate fair value.
The size and mix of our derivative portfolio varies from time to time based upon our analysis of current andfuture market conditions. The following table presents the fair values of our open derivative financial instrumentsin the consolidated balance sheets(1).
May 1,2011
May 2,2010
(in millions)
Grains . . . . . . . . . . . . . . . . . . . . . . . . . . . . . . . . . . . . . . . . . . . . . . . . . . . . . . . . . $ 75.0 $ 7.1Livestock . . . . . . . . . . . . . . . . . . . . . . . . . . . . . . . . . . . . . . . . . . . . . . . . . . . . . . . (12.9) (122.6)Energy . . . . . . . . . . . . . . . . . . . . . . . . . . . . . . . . . . . . . . . . . . . . . . . . . . . . . . . . . 0.9 (4.0)Interest rates . . . . . . . . . . . . . . . . . . . . . . . . . . . . . . . . . . . . . . . . . . . . . . . . . . . . (2.3) (8.1)Foreign currency . . . . . . . . . . . . . . . . . . . . . . . . . . . . . . . . . . . . . . . . . . . . . . . . . (1.4) 3.3
(1) Negative amounts represent net liabilities
58

Sensitivity Analysis
The following table presents the sensitivity of the fair value of our open commodity contracts and interest rateand foreign currency contracts to a hypothetical 10% change in market prices or in interest rates and foreignexchange rates, as of May 1, 2011 and May 2, 2010.
May 1,2011
May 2,2010
(in millions)
Grains . . . . . . . . . . . . . . . . . . . . . . . . . . . . . . . . . . . . . . . . . . . . . . . . . . . . . . . . . $ 33.1 $ 48.8Livestock . . . . . . . . . . . . . . . . . . . . . . . . . . . . . . . . . . . . . . . . . . . . . . . . . . . . . . . 85.4 137.2Energy . . . . . . . . . . . . . . . . . . . . . . . . . . . . . . . . . . . . . . . . . . . . . . . . . . . . . . . . . 0.3 0.9Interest rates . . . . . . . . . . . . . . . . . . . . . . . . . . . . . . . . . . . . . . . . . . . . . . . . . . . . — 0.2Foreign currency . . . . . . . . . . . . . . . . . . . . . . . . . . . . . . . . . . . . . . . . . . . . . . . . . 11.0 0.5
Commodities Risk
Our meat processing and hog production operations use various raw materials, mainly corn, lean hogs, live cattle,pork bellies, soybeans and wheat, which are actively traded on commodity exchanges. We hedge thesecommodities when we determine conditions are appropriate to mitigate the inherent price risks. While thishedging may limit our ability to participate in gains from favorable commodity fluctuations, it also tends toreduce the risk of loss from adverse changes in raw material prices. Commodities underlying our derivativeinstruments are subject to significant price fluctuations. Any requirement to mark-to-market the positions thathave not been designated or do not qualify for hedge accounting could result in volatility in our results ofoperations. We attempt to closely match the hedging instrument terms with the hedged item’s terms. Gains andlosses resulting from our commodity derivative contracts are recorded in cost of sales except for lean hogcontracts that are designated in cash flow hedging relationships, which are recorded in sales, and are offset byincreases and decreases in cash prices in our core business (with such increases and decreases also reflected incost of sales). For example, in a period of rising grain prices, gains resulting from long grain derivative positionswould generally be offset by higher cash prices paid to farmers and other suppliers in spot markets. However,under the “mark-to-market” method described above, these offsetting changes do not always occur in the sameperiod, with lag times of as much as twelve months.
Interest Rate and Foreign Currency Exchange Risk
We enter into interest rate swaps to hedge our exposure to changes in interest rates on certain financialinstruments and to manage the overall mix of fixed rate and floating rate debt instruments. We also periodicallyenter into foreign exchange forward contracts to hedge exposure to changes in foreign currency rates on foreigndenominated assets and liabilities as well as forecasted transactions denominated in foreign currencies.
59
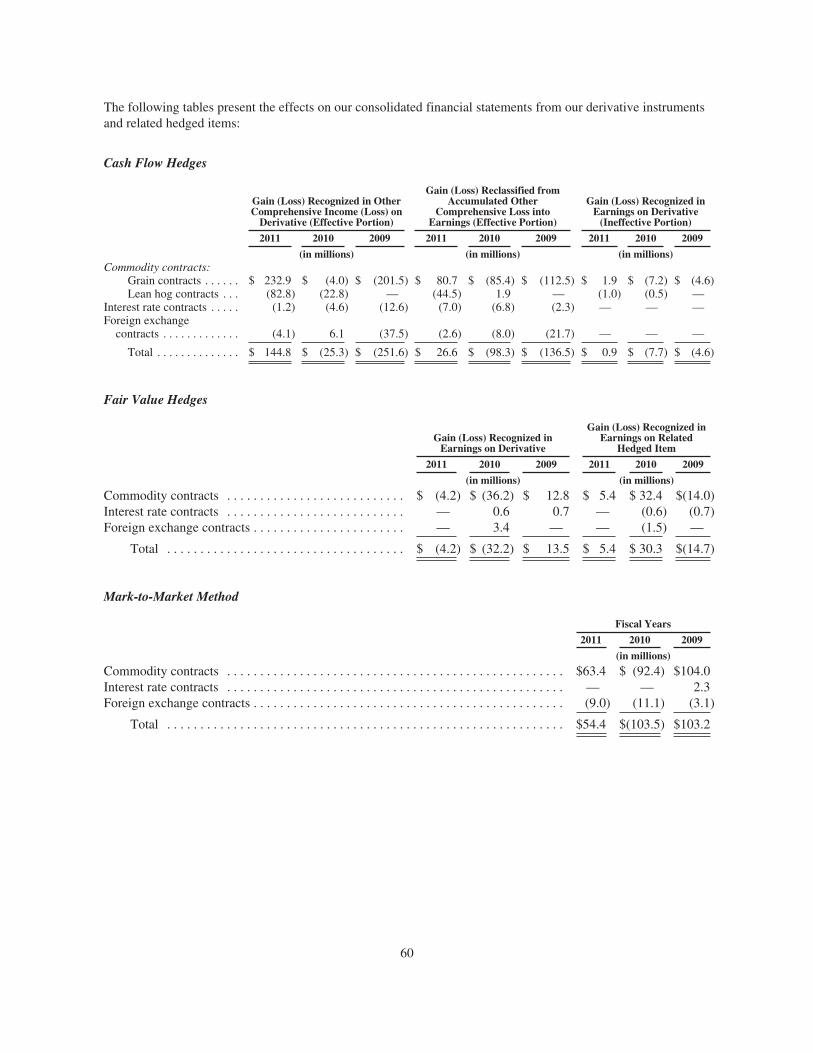
The following tables present the effects on our consolidated financial statements from our derivative instrumentsand related hedged items:
Cash Flow Hedges
Gain (Loss) Recognized in OtherComprehensive Income (Loss) on
Derivative (Effective Portion)
Gain (Loss) Reclassified fromAccumulated Other
Comprehensive Loss intoEarnings (Effective Portion)
Gain (Loss) Recognized inEarnings on Derivative
(Ineffective Portion)
2011 2010 2009 2011 2010 2009 2011 2010 2009
(in millions) (in millions) (in millions)Commodity contracts:
Grain contracts . . . . . . $ 232.9 $ (4.0) $ (201.5) $ 80.7 $ (85.4) $ (112.5) $ 1.9 $ (7.2) $ (4.6)Lean hog contracts . . . (82.8) (22.8) — (44.5) 1.9 — (1.0) (0.5) —
Interest rate contracts . . . . . (1.2) (4.6) (12.6) (7.0) (6.8) (2.3) — — —Foreign exchange
contracts . . . . . . . . . . . . . (4.1) 6.1 (37.5) (2.6) (8.0) (21.7) — — —
Total . . . . . . . . . . . . . . $ 144.8 $ (25.3) $ (251.6) $ 26.6 $ (98.3) $ (136.5) $ 0.9 $ (7.7) $ (4.6)
Fair Value Hedges
Gain (Loss) Recognized inEarnings on Derivative
Gain (Loss) Recognized inEarnings on Related
Hedged Item
2011 2010 2009 2011 2010 2009
(in millions) (in millions)
Commodity contracts . . . . . . . . . . . . . . . . . . . . . . . . . . . $ (4.2) $ (36.2) $ 12.8 $ 5.4 $ 32.4 $(14.0)Interest rate contracts . . . . . . . . . . . . . . . . . . . . . . . . . . . — 0.6 0.7 — (0.6) (0.7)Foreign exchange contracts . . . . . . . . . . . . . . . . . . . . . . . — 3.4 — — (1.5) —
Total . . . . . . . . . . . . . . . . . . . . . . . . . . . . . . . . . . . . $ (4.2) $ (32.2) $ 13.5 $ 5.4 $ 30.3 $(14.7)
Mark-to-Market Method
Fiscal Years
2011 2010 2009
(in millions)
Commodity contracts . . . . . . . . . . . . . . . . . . . . . . . . . . . . . . . . . . . . . . . . . . . . . . . . . . . $63.4 $ (92.4) $104.0Interest rate contracts . . . . . . . . . . . . . . . . . . . . . . . . . . . . . . . . . . . . . . . . . . . . . . . . . . . — — 2.3Foreign exchange contracts . . . . . . . . . . . . . . . . . . . . . . . . . . . . . . . . . . . . . . . . . . . . . . . (9.0) (11.1) (3.1)
Total . . . . . . . . . . . . . . . . . . . . . . . . . . . . . . . . . . . . . . . . . . . . . . . . . . . . . . . . . . . . $54.4 $(103.5) $103.2
60
CRITICAL ACCOUNTING POLICIES AND ESTIMATES
The preparation of consolidated financial statements requires us to make estimates and assumptions. Theseestimates and assumptions affect the reported amounts of assets and liabilities and disclosure of contingent assetsand liabilities at the date of the consolidated financial statements and the reported amounts of revenues andexpenses during the reporting period. These estimates and assumptions are based on our experience and ourunderstanding of the current facts and circumstances. Actual results could differ from those estimates. Thefollowing is a summary of certain accounting policies and estimates we consider critical. Our accounting policiesare more fully discussed in Note 1 in “Item 8. Financial Statements and Supplementary Data.”
Description Judgments and UncertaintiesEffect if Actual Results Differ
From Assumptions
Contingent liabilities
We are subject to lawsuits,investigations and other claimsrelated to the operation of our farms,labor, livestock procurement,securities, environmental, product,taxing authorities and other matters,and are required to assess thelikelihood of any adverse judgmentsor outcomes to these matters, as wellas potential ranges of probable lossesand fees.
A determination of the amount ofreserves and disclosures required, ifany, for these contingencies are madeafter considerable analysis of eachindividual issue. We accrue forcontingent liabilities when anassessment of the risk of loss isprobable and can be reasonablyestimated. We disclose contingentliabilities when the risk of loss isreasonably possible or probable.
Our contingent liabilities containuncertainties because the eventualoutcome will result from futureevents, and determination ofcurrent reserves requires estimatesand judgments related to futurechanges in facts andcircumstances, differinginterpretations of the law andassessments of the amount ofdamages or fees, and theeffectiveness of strategies or otherfactors beyond our control.
We have not made any materialchanges in the accountingmethodology used to establish ourcontingent liabilities during thepast three fiscal years.
We do not believe there is areasonable likelihood there will bea material change in the estimatesor assumptions used to calculateour contingent liabilities.However, if actual results are notconsistent with our estimates orassumptions, we may be exposedto gains or losses that could bematerial.
Marketing and advertising costs
We incur advertising, retailerincentive and consumer incentivecosts to promote products throughmarketing programs. These programsinclude cooperative advertising,volume discounts, in- store displayincentives, coupons and otherprograms.
Marketing and advertising costs arecharged in the period incurred. Weaccrue costs based on the estimatedperformance, historical utilizationand redemption of each program.
Recognition of the costs related tothese programs containsuncertainties due to judgmentrequired in estimating the potentialperformance and redemption ofeach program. These estimates arebased on many factors, includingexperience of similar promotionalprograms.
We have not made any materialchanges in the accountingmethodology used to establish ourmarketing accruals during the pastthree fiscal years.
We do not believe there is areasonable likelihood there will bea material change in the estimatesor assumptions used to calculateour marketing accruals. However,if actual results are not consistentwith our estimates or assumptions,we may be exposed to gains orlosses that could be material.
61

Description Judgments and UncertaintiesEffect if Actual Results Differ
From Assumptions
Cash consideration given tocustomers is considered a reductionin the price of our products, thusrecorded as a reduction to sales. Theremainder of marketing andadvertising costs is recorded as aselling, general and administrativeexpense.
Accrued self insurance
We are self insured for certain lossesrelated to health and welfare,workers’ compensation, auto liabilityand general liability claims.
We use an independent third-partyactuary to assist in the determinationof certain of our self-insuranceliabilities. We and the actuaryconsider a number of factors whenestimating our self-insuranceliability, including claims experience,demographic factors, severity factorsand other actuarial assumptions.
We periodically review our estimatesand assumptions with our third-partyactuary to assist us in determining theadequacy of our self-insuranceliability.
Our self-insurance liabilitiescontain uncertainties due toassumptions required andjudgment used. Costs to settle ourobligations, including legal andhealthcare costs, could increase ordecrease causing estimates of ourself- insurance liabilities tochange. Incident rates, includingfrequency and severity, couldincrease or decrease causingestimates in our self-insuranceliabilities to change.
We have not made any materialchanges in the accountingmethodology used to establish ourself-insurance liabilities during thepast three fiscal years.
We do not believe there is areasonable likelihood there will bea material change in the estimatesor assumptions used to calculateour self-insurance liabilities.However, if actual results are notconsistent with our estimates orassumptions, we may be exposedto gains or losses that could bematerial. A 10% increase in theestimates as of May 1, 2011,would result in an increase in theamount we recorded for our self-insurance liabilities ofapproximately $7.5 million.
Impairment of long-lived assets
Long-lived assets are evaluated forimpairment whenever events orchanges in circumstances indicate thecarrying value may not berecoverable. Examples include acurrent expectation that a long-livedasset will be disposed of significantlybefore the end of its previouslyestimated useful life, a significantadverse change in the extent ormanner in which we use a long-livedasset or a change in its physicalcondition.
When evaluating long-lived assets forimpairment, we compare the carryingvalue of the asset to the asset’sestimated undiscounted future cash
Our impairment analysis containsuncertainties due to judgment inassumptions and estimatessurrounding undiscounted futurecash flows of the long-lived asset,including forecasting useful livesof assets and selecting the discountrate that reflects the risk inherentin future cash flows.
We have not made any materialchanges in the accountingmethodology used to evaluate theimpairment of long-lived assetsduring the last three years.
We do not believe there is areasonable likelihood there will bea material change in the estimatesor assumptions used to calculateimpairments of long- lived assets.However, if actual results are notconsistent with our estimates andassumptions used to calculateestimated future cash flows, wemay be exposed to futureimpairment losses that could bematerial.
62
Description Judgments and UncertaintiesEffect if Actual Results Differ
From Assumptions
flows. Impairment is recorded if theestimated future cash flows are lessthan the carrying value of the asset.The impairment is the excess of thecarrying value over the fair value ofthe long-lived asset.
We recorded impairment chargesrelated to long-lived assets of $9.2million, $48.1 million (including $6.5million of goodwill) and $70.9million in fiscal 2011, 2010 and2009, respectively.
Impairment of goodwill and other non-amortized intangible assets
Goodwill impairment is determinedusing a two-step process. The firststep is to identify if a potentialimpairment exists by comparing thefair value of a reporting unit with itscarrying amount, including goodwill.If the fair value of a reporting unitexceeds its carrying amount,goodwill of the reporting unit is notconsidered to have a potentialimpairment and the second step ofthe impairment test is not necessary.However, if the carrying amount of areporting unit exceeds its fair value,the second step is performed todetermine if goodwill is impaired andto measure the amount of impairmentloss to recognize, if any.
The second step compares theimplied fair value of goodwill withthe carrying amount of goodwill. Ifthe implied fair value of goodwillexceeds the carrying amount,goodwill is not considered impaired.However, if the carrying amount ofgoodwill exceeds the implied fairvalue, an impairment loss isrecognized in an amount equal to thatexcess.
The implied fair value of goodwill isdetermined in the same manner as theamount of goodwill recognized in abusiness combination (i.e., the fairvalue of the reporting unit isallocated to all the assets and
We estimate the fair value of ourreporting units by applyingvaluation multiples and/orestimating future discounted cashflows.
The selection of multiples and cashflows is dependent uponassumptions regarding futurelevels of operating performance aswell as business trends andprospects, and industry, marketand economic conditions.
A discounted cash flow analysisrequires us to make variousjudgmental assumptions aboutsales, operating margins, growthrates and discount rates. Whenestimating future discounted cashflows, we consider theassumptions that hypotheticalmarketplace participants would usein estimating future cash flows. Inaddition, where applicable, anappropriate discount rate is used,based on our cost of capital orlocation-specific economic factors.
We experienced significant lossesin our domestic hog productionoperations in fiscal 2009 and fiscal2010 resulting primarily fromrecord high grain prices. Our HogProduction segment returned toprofitability in fiscal 2011. The fair
We have not made any materialchanges in the accountingmethodology used to evaluateimpairment of goodwill and otherintangible assets during the lastthree years.
As of May 1, 2011, we had $793.3million of goodwill and $348.0million of other non-amortizedintangible assets. Our goodwill isincluded in the following segments:
• $216.1 million—Pork
• $157.2 million—International
• $420.0 million—HogProduction
As a result of the first step of the2011 goodwill impairmentanalysis, the fair value of eachreporting unit exceeded itscarrying value. Therefore, thesecond step was not necessary. Ahypothetical 10% decrease in theestimated fair value of ourreporting units would not result ina material impairment.
Our fiscal 2011 othernon-amortized intangible assetimpairment analysis did not resultin an impairment charge. Ahypothetical 10% decrease in theestimated fair value of ourintangible assets would not resultin a material impairment.
63

Description Judgments and UncertaintiesEffect if Actual Results Differ
From Assumptions
liabilities, including anyunrecognized intangible assets, as ifthe reporting unit had been acquiredin a business combination and the fairvalue of the reporting unit was thepurchase price paid to acquire thereporting unit).
For our other non-amortizedintangible assets, if the carrying valueof the intangible asset exceeds its fairvalue, an impairment loss isrecognized in an amount equal to thatexcess.
We have elected to make the first dayof the fourth quarter the annualimpairment assessment date forgoodwill and other intangible assets.However, we could be required toevaluate the recoverability ofgoodwill and other intangible assetsprior to the required annualassessment if we experiencedisruptions to the business,unexpected significant declines inoperating results, divestiture of asignificant component of the businessor a decline in market capitalization.For example, in fiscal 2009, weperformed an interim test of thecarrying amount of goodwill relatedto our U.S. hog production operationsdue to significant losses incurred inour hog production operations, thedeteriorating macro- economicenvironment, the continued marketvolatility and the decrease in ourmarket capitalization.
value estimates of our HogProduction reporting units assumenormalized operating marginassumptions based on long-termexpectations and marginshistorically realized in the hogproduction industry.
The fair values of trademarks havebeen calculated using a royalty ratemethod. Assumptions aboutroyalty rates are based on the ratesat which similar brands andtrademarks are licensed in themarketplace.
Our impairment analysis containsuncertainties due to uncontrollableevents that could positively ornegatively impact the anticipatedfuture economic and operatingconditions.
64

Description Judgments and UncertaintiesEffect if Actual Results Differ
From Assumptions
Income taxes
We estimate total income tax expensebased on statutory tax rates and taxplanning opportunities available to usin various jurisdictions in which weearn income.
Federal income taxes include anestimate for taxes on earnings offoreign subsidiaries expected to beremitted to the United States and betaxable, but not for earningsconsidered indefinitely invested inthe foreign subsidiary.
Deferred income taxes are recognizedfor the future tax effects of temporarydifferences between financial andincome tax reporting using tax ratesin effect for the years in which thedifferences are expected to reverse.
Valuation allowances are recordedwhen it is likely a tax benefit will notbe realized for a deferred tax asset.
We record unrecognized tax benefitliabilities for known or anticipatedtax issues based on our analysis ofwhether, and the extent to which,additional taxes will be due. Thisanalysis is performed in accordancewith the applicable accountingguidance.
Changes in tax laws and ratescould affect recorded deferred taxassets and liabilities in the future.
Changes in projected futureearnings could affect the recordedvaluation allowances in the future.
Our calculations related to incometaxes contain uncertainties due tojudgment used to calculate taxliabilities in the application ofcomplex tax regulations across thetax jurisdictions where we operate.
Our analysis of unrecognized taxbenefits contain uncertaintiesbased on judgment used to applythe more likely than notrecognition and measurementthresholds.
We do not believe there is areasonable likelihood there will bea material change in the tax relatedbalances or valuation allowances.However, due to the complexity ofsome of these uncertainties, theultimate resolution may result in apayment that is materially differentfrom the current estimate of the taxliabilities.
To the extent we prevail in mattersfor which liabilities have beenestablished, or are required to payamounts in excess of our recordedliabilities, our effective tax rate ina given financial statement periodcould be materially affected. Anunfavorable tax settlement mayrequire use of our cash and resultin an increase in our effective taxrate in the period of resolution. Afavorable tax settlement could berecognized as a reduction in oureffective tax rate in the period ofresolution.
Pension Accounting
We provide the majority of our U.S.employees with pension benefits. Weaccount for our pension plans inaccordance with the applicableaccounting guidance, which requiresus to recognize the funded status ofour pension plans in our consolidatedbalance sheets and to recognize, as acomponent of other comprehensiveincome (loss), the gains or losses andprior service costs or credits thatarise during the period, but are notrecognized in net periodic benefitcost.
The measurement of our pensionobligation and costs is dependenton a variety of assumptionsregarding future events. The keyassumptions we use includediscount rates, salary growth,retirement ages/mortality rates andthe expected return on plan assets.
These assumptions may have aneffect on the amount and timing offuture contributions. The discountrate assumption is based oninvestment yields available atyear-end on corporate bonds rated
If actual results are not consistentwith our estimates or assumptions,we may be exposed to gains orlosses that could be material. Forexample, the discount rate used tomeasure our projected benefitobligation decreased from 8.25%as of May 3, 2009 to 6.00% as ofMay 2, 2010, which was theprimary cause for an increased netpension cost of $82.0 million infiscal 2011.
An additional 0.50% decrease inthe discount rate used to measure
65

Description Judgments and UncertaintiesEffect if Actual Results Differ
From Assumptions
We use an independent third-partyactuary to assist in the determinationof our pension obligation and relatedcosts.
We generally contribute theminimum amount required undergovernment regulations to ourqualified pension plans. We funded$95.1 million, $62.6 million and$43.1 million to our qualified pensionplans during fiscal 2011, 2010 and2009, respectively. We expect tofund at least $61.8 million in fiscal2012.
AA and above with a maturity tomatch our expected benefitpayment stream. The salary growthassumption reflects our long- termactual experience, the near-termoutlook and assumed inflation.Retirement rates are basedprimarily on actual planexperience. Mortality rates arebased on mandated mortalitytables, which have flexibility toconsider industry specific groups,such as blue collar or white collar.The expected return on plan assetsreflects asset allocations,investment strategy and historicalreturns of the asset categories. Theeffects of actual results differingfrom these assumptions areaccumulated and amortized overfuture periods and, therefore,generally affect our recognizedexpense in such future periods.
The following weighted averageassumptions were used todetermine our benefit obligationand net benefit cost for fiscal 2011:
• 6.00%—Discount rate todetermine net benefit cost
• 5.85%—Discount rate todetermine pension benefitobligation
• 8.00%—Expected return onplan assets
• 4.00%—Salary growth
our projected benefit obligationwould have caused a decrease infunded status of $82.8 million asof May 1, 2011, and would resultin additional net pension cost of$9.2 million in fiscal 2012.
A 0.50% decrease in expectedreturn on plan assets would resultin a $4.8 million increase in netpension cost in fiscal 2012.
In addition to higher net pensioncost, a significant decrease in thefunded status of our pension planscaused by either a devaluation ofplan assets or a decline in thediscount rate would result inhigher pension fundingrequirements.
Derivatives Accounting
See “Derivative FinancialInstruments” above for a discussionof our derivative accounting policy.
Recent Accounting Pronouncements
See Note 1 in “Item 8. Financial Statements and Supplementary Data” for information about recently issuedaccounting standards not yet adopted by us, including their potential effects on our financial statements.
66

FORWARD-LOOKING INFORMATION
This report contains “forward-looking” statements within the meaning of the federal securities laws. Theforward-looking statements include statements concerning our outlook for the future, as well as other statementsof beliefs, future plans and strategies or anticipated events, and similar expressions concerning matters that arenot historical facts. Our forward-looking information and statements are subject to risks and uncertainties thatcould cause actual results to differ materially from those expressed in, or implied by, the statements. These risksand uncertainties include the availability and prices of live hogs, raw materials, fuel and supplies, food safety,livestock disease, live hog production costs, product pricing, the competitive environment and related marketconditions, risks associated with our indebtedness, including cost increases due to rising interest rates or changesin debt ratings or outlook, hedging risk, operating efficiencies, changes in foreign currency exchange rates,access to capital, the cost of compliance with and changes to regulations and laws, including changes inaccounting standards, tax laws, environmental laws, agricultural laws and occupational, health and safety laws,adverse results from ongoing litigation, actions of domestic and foreign governments, labor relations issues,credit exposure to large customers, the ability to make effective acquisitions and successfully integrate newlyacquired businesses into existing operations, our ability to effectively restructure portions of our operations andachieve cost savings from such restructurings and uncertainties described under “Item 1A. Risk Factors.”Readers are cautioned not to place undue reliance on forward-looking statements because actual results maydiffer materially from those expressed in, or implied by, the statements. Any forward-looking statement that wemake speaks only as of the date of such statement, and we undertake no obligation to update any forward-lookingstatements, whether as a result of new information, future events or otherwise. Comparisons of results for currentand any prior periods are not intended to express any future trends or indications of future performance, unlessexpressed as such, and should only be viewed as historical data.
ITEM 7A. QUANTITATIVE AND QUALITATIVE DISCLOSURES ABOUT MARKET RISK
Information about our exposure to market risk is included in “Item 7. Management’s Discussion and Analysis ofFinancial Condition and Results of Operations—Derivative Financial Instruments” of this Annual Report onForm 10-K.
All statements other than historical information required by this item are forward-looking statements. The actualimpact of future market changes could differ materially because of, among others, the factors discussed in thisAnnual Report on Form 10-K.
67

ITEM 8. FINANCIAL STATEMENTS AND SUPPLEMENTARY DATA
INDEX TO FINANCIAL STATEMENTS AND FINANCIAL STATEMENT SCHEDULE
PAGE
Report of Independent Registered Public Accounting Firm on Internal Control Over FinancialReporting . . . . . . . . . . . . . . . . . . . . . . . . . . . . . . . . . . . . . . . . . . . . . . . . . . . . . . . . . . . . . . . . . . . . . . . . . . 69
Report of Independent Registered Public Accounting Firm on Consolidated Financial Statements . . . . . . 70Consolidated Statements of Income for the Fiscal Years 2011, 2010 and 2009 . . . . . . . . . . . . . . . . . . . . . . 71Consolidated Balance Sheets as of May 1, 2011 and May 2, 2010 . . . . . . . . . . . . . . . . . . . . . . . . . . . . . . . . 72Consolidated Statements of Cash Flows for the Fiscal Years 2011, 2010 and 2009 . . . . . . . . . . . . . . . . . . . 73Consolidated Statements of Shareholders’ Equity for the Fiscal Years 2011, 2010 and 2009 . . . . . . . . . . . 74Notes to Consolidated Financial Statements . . . . . . . . . . . . . . . . . . . . . . . . . . . . . . . . . . . . . . . . . . . . . . . . . 75Schedule II—Valuation and Qualifying Accounts . . . . . . . . . . . . . . . . . . . . . . . . . . . . . . . . . . . . . . . . . . . . . 120
68

REPORT OF INDEPENDENT REGISTERED PUBLIC ACCOUNTING FIRM ONINTERNAL CONTROL OVER FINANCIAL REPORTING
The Board of Directors and Shareholders of Smithfield Foods, Inc.
We have audited Smithfield Foods, Inc. and subsidiaries’ internal control over financial reporting as of May 1,2011, based on criteria established in Internal Control-Integrated Framework issued by the Committee ofSponsoring Organizations of the Treadway Commission (the COSO criteria). Smithfield Foods, Inc. andsubsidiaries’ management is responsible for maintaining effective internal control over financial reporting, andfor its assessment of the effectiveness of internal control over financial reporting included in the accompanyingManagement’s Annual Report on Internal Control over Financial Reporting in Item 9A. Our responsibility is toexpress an opinion on the company’s internal control over financial reporting based on our audit.
We conducted our audit in accordance with the standards of the Public Company Accounting Oversight Board(United States). Those standards require that we plan and perform the audit to obtain reasonable assurance aboutwhether effective internal control over financial reporting was maintained in all material respects. Our auditincluded obtaining an understanding of internal control over financial reporting, assessing the risk that a materialweakness exists, testing and evaluating the design and operating effectiveness of internal control based on theassessed risk, and performing such other procedures as we considered necessary in the circumstances. We believethat our audit provides a reasonable basis for our opinion.
A company’s internal control over financial reporting is a process designed to provide reasonable assuranceregarding the reliability of financial reporting and the preparation of financial statements for external purposes inaccordance with generally accepted accounting principles. A company’s internal control over financial reportingincludes those policies and procedures that (1) pertain to the maintenance of records that, in reasonable detail,accurately and fairly reflect the transactions and dispositions of the assets of the company; (2) provide reasonableassurance that transactions are recorded as necessary to permit preparation of financial statements in accordancewith generally accepted accounting principles, and that receipts and expenditures of the company are being madeonly in accordance with authorizations of management and directors of the company; and (3) provide reasonableassurance regarding prevention or timely detection of unauthorized acquisition, use, or disposition of thecompany’s assets that could have a material effect on the financial statements.
Because of its inherent limitations, internal control over financial reporting may not prevent or detectmisstatements. Also, projections of any evaluation of effectiveness to future periods are subject to the risk thatcontrols may become inadequate because of changes in conditions, or that the degree of compliance with thepolicies or procedures may deteriorate.
In our opinion, Smithfield Foods, Inc. and subsidiaries maintained, in all material respects, effective internalcontrol over financial reporting as of May 1, 2011, based on the COSO criteria.
We also have audited, in accordance with the standards of the Public Company Accounting Oversight Board(United States), the consolidated balance sheets of Smithfield Foods, Inc. and subsidiaries as of May 1, 2011 andMay 2, 2010, and the related consolidated statements of income, shareholders’ equity and cash flows for each ofthe three years in the period ended May 1, 2011 of Smithfield Foods, Inc. and subsidiaries and our report datedJune 17, 2011 expressed an unqualified opinion thereon.
/s/ Ernst & Young LLP
Richmond, VirginiaJune 17, 2011
69
REPORT OF INDEPENDENT REGISTERED PUBLIC ACCOUNTING FIRMON CONSOLIDATED FINANCIAL STATEMENTS
The Board of Directors and Shareholders of Smithfield Foods, Inc.
We have audited the accompanying consolidated balance sheets of Smithfield Foods, Inc. and subsidiaries as ofMay 1, 2011 and May 2, 2010, and the related consolidated statements of income, shareholders’ equity, and cashflows for each of the three years in the period ended May 1, 2011. Our audits also included the financialstatement schedule listed in the Index at Item 15. These financial statements and schedule are the responsibilityof the Company’s management. Our responsibility is to express an opinion on these financial statements andschedule based on our audits.
We conducted our audits in accordance with the standards of the Public Company Accounting Oversight Board(United States). Those standards require that we plan and perform the audit to obtain reasonable assurance aboutwhether the financial statements are free of material misstatement. An audit includes examining, on a test basis,evidence supporting the amounts and disclosures in the financial statements. An audit also includes assessing theaccounting principles used and significant estimates made by management, as well as evaluating the overallfinancial statement presentation. We believe that our audits provide a reasonable basis for our opinion.
In our opinion, the financial statements referred to above present fairly, in all material respects, the consolidatedfinancial position of Smithfield Foods, Inc. and subsidiaries at May 1, 2011 and May 2, 2010, and theconsolidated results of their operations and their cash flows for each of the three years in the period ended May 1,2011, in conformity with U.S. generally accepted accounting principles. Also, in our opinion, the relatedfinancial statement schedule, when considered in relation to the basic financial statements taken as a whole,presents fairly in all material respects the information set forth therein.
We also have audited, in accordance with the standards of the Public Company Accounting Oversight Board(United States), Smithfield Foods, Inc. and subsidiaries’ internal control over financial reporting as of May 1,2011, based on criteria established in Internal Control-Integrated Framework issued by the Committee ofSponsoring Organizations of the Treadway Commission and our report dated June 17, 2011 expressed anunqualified opinion thereon.
/s/ Ernst & Young LLP
Richmond, VirginiaJune 17, 2011
70

SMITHFIELD FOODS, INC. AND SUBSIDIARIES
CONSOLIDATED STATEMENTS OF INCOME(in millions, except per share data)
Fiscal Years
2011 2010 2009
Sales . . . . . . . . . . . . . . . . . . . . . . . . . . . . . . . . . . . . . . . . . . . . . . . . . . . . . $ 12,202.7 $ 11,202.6 $ 12,487.7Cost of sales . . . . . . . . . . . . . . . . . . . . . . . . . . . . . . . . . . . . . . . . . . . . . . . 10,488.6 10,472.5 11,863.1
Gross profit . . . . . . . . . . . . . . . . . . . . . . . . . . . . . . . . . . . . . . . . . . . . 1,714.1 730.1 624.6Selling, general and administrative expenses . . . . . . . . . . . . . . . . . . . . . . 789.8 705.9 798.4Gain on fire insurance recovery . . . . . . . . . . . . . . . . . . . . . . . . . . . . . . . . (120.6) — —Equity in (income) loss of affiliates . . . . . . . . . . . . . . . . . . . . . . . . . . . . . (50.1) (38.6) 50.1
Operating profit (loss) . . . . . . . . . . . . . . . . . . . . . . . . . . . . . . . . . . . . 1,095.0 62.8 (223.9)Interest expense . . . . . . . . . . . . . . . . . . . . . . . . . . . . . . . . . . . . . . . . . . . . . 245.4 266.4 221.8Other loss (income) . . . . . . . . . . . . . . . . . . . . . . . . . . . . . . . . . . . . . . . . . . 92.5 11.0 (63.5)
Income (loss) from continuing operations before income taxes . . . . 757.1 (214.6) (382.2)Income tax expense (benefit) . . . . . . . . . . . . . . . . . . . . . . . . . . . . . . . . . . 236.1 (113.2) (131.3)
Income (loss) from continuing operations . . . . . . . . . . . . . . . . . . . . 521.0 (101.4) (250.9)Income from discontinued operations, net of tax . . . . . . . . . . . . . . . . . . . — — 52.5
Net income (loss) . . . . . . . . . . . . . . . . . . . . . . . . . . . . . . . . . . . . . . . $ 521.0 $ (101.4) $ (198.4)
Net income (loss) per share:Basic:
Continuing operations . . . . . . . . . . . . . . . . . . . . . . . . . . . . . . . . . . . . $ 3.14 $ (.65) $ (1.78)Discontinued operations . . . . . . . . . . . . . . . . . . . . . . . . . . . . . . . . . . — — .37
Net income (loss) per basic common share . . . . . . . . . . . . . . . . $ 3.14 $ (.65) $ (1.41)
Diluted:Continuing operations . . . . . . . . . . . . . . . . . . . . . . . . . . . . . . . . . . . . $ 3.12 $ (.65) $ (1.78)Discontinued operations . . . . . . . . . . . . . . . . . . . . . . . . . . . . . . . . . . — — .37
Net income (loss) per diluted common share . . . . . . . . . . . . . . $ 3.12 $ (.65) $ (1.41)
Weighted average shares outstanding:Basic . . . . . . . . . . . . . . . . . . . . . . . . . . . . . . . . . . . . . . . . . . . . . . . . . 166.0 157.1 141.1Effect of dilutive shares . . . . . . . . . . . . . . . . . . . . . . . . . . . . . . . . . . 1.2 — —
Diluted . . . . . . . . . . . . . . . . . . . . . . . . . . . . . . . . . . . . . . . . . . . . 167.2 157.1 141.1
See Notes to Consolidated Financial Statements
71
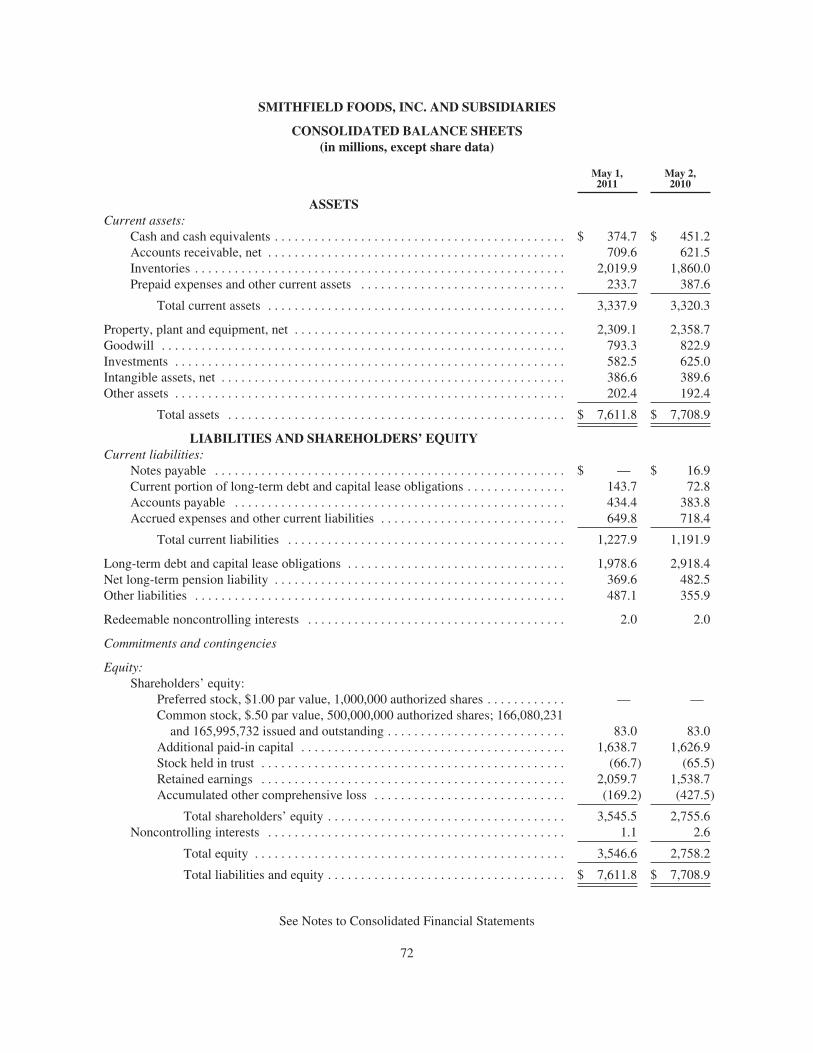
SMITHFIELD FOODS, INC. AND SUBSIDIARIES
CONSOLIDATED BALANCE SHEETS(in millions, except share data)
May 1,2011
May 2,2010
ASSETSCurrent assets:
Cash and cash equivalents . . . . . . . . . . . . . . . . . . . . . . . . . . . . . . . . . . . . . . . . . . . . $ 374.7 $ 451.2Accounts receivable, net . . . . . . . . . . . . . . . . . . . . . . . . . . . . . . . . . . . . . . . . . . . . . 709.6 621.5Inventories . . . . . . . . . . . . . . . . . . . . . . . . . . . . . . . . . . . . . . . . . . . . . . . . . . . . . . . . 2,019.9 1,860.0Prepaid expenses and other current assets . . . . . . . . . . . . . . . . . . . . . . . . . . . . . . . 233.7 387.6
Total current assets . . . . . . . . . . . . . . . . . . . . . . . . . . . . . . . . . . . . . . . . . . . . . 3,337.9 3,320.3
Property, plant and equipment, net . . . . . . . . . . . . . . . . . . . . . . . . . . . . . . . . . . . . . . . . . 2,309.1 2,358.7Goodwill . . . . . . . . . . . . . . . . . . . . . . . . . . . . . . . . . . . . . . . . . . . . . . . . . . . . . . . . . . . . . 793.3 822.9Investments . . . . . . . . . . . . . . . . . . . . . . . . . . . . . . . . . . . . . . . . . . . . . . . . . . . . . . . . . . . 582.5 625.0Intangible assets, net . . . . . . . . . . . . . . . . . . . . . . . . . . . . . . . . . . . . . . . . . . . . . . . . . . . . 386.6 389.6Other assets . . . . . . . . . . . . . . . . . . . . . . . . . . . . . . . . . . . . . . . . . . . . . . . . . . . . . . . . . . . 202.4 192.4
Total assets . . . . . . . . . . . . . . . . . . . . . . . . . . . . . . . . . . . . . . . . . . . . . . . . . . . $ 7,611.8 $ 7,708.9
LIABILITIES AND SHAREHOLDERS’ EQUITYCurrent liabilities:
Notes payable . . . . . . . . . . . . . . . . . . . . . . . . . . . . . . . . . . . . . . . . . . . . . . . . . . . . . $ — $ 16.9Current portion of long-term debt and capital lease obligations . . . . . . . . . . . . . . . 143.7 72.8Accounts payable . . . . . . . . . . . . . . . . . . . . . . . . . . . . . . . . . . . . . . . . . . . . . . . . . . 434.4 383.8Accrued expenses and other current liabilities . . . . . . . . . . . . . . . . . . . . . . . . . . . . 649.8 718.4
Total current liabilities . . . . . . . . . . . . . . . . . . . . . . . . . . . . . . . . . . . . . . . . . . 1,227.9 1,191.9
Long-term debt and capital lease obligations . . . . . . . . . . . . . . . . . . . . . . . . . . . . . . . . . 1,978.6 2,918.4Net long-term pension liability . . . . . . . . . . . . . . . . . . . . . . . . . . . . . . . . . . . . . . . . . . . . 369.6 482.5Other liabilities . . . . . . . . . . . . . . . . . . . . . . . . . . . . . . . . . . . . . . . . . . . . . . . . . . . . . . . . 487.1 355.9
Redeemable noncontrolling interests . . . . . . . . . . . . . . . . . . . . . . . . . . . . . . . . . . . . . . . 2.0 2.0
Commitments and contingencies
Equity:Shareholders’ equity:
Preferred stock, $1.00 par value, 1,000,000 authorized shares . . . . . . . . . . . . — —Common stock, $.50 par value, 500,000,000 authorized shares; 166,080,231
and 165,995,732 issued and outstanding . . . . . . . . . . . . . . . . . . . . . . . . . . . 83.0 83.0Additional paid-in capital . . . . . . . . . . . . . . . . . . . . . . . . . . . . . . . . . . . . . . . . 1,638.7 1,626.9Stock held in trust . . . . . . . . . . . . . . . . . . . . . . . . . . . . . . . . . . . . . . . . . . . . . . (66.7) (65.5)Retained earnings . . . . . . . . . . . . . . . . . . . . . . . . . . . . . . . . . . . . . . . . . . . . . . 2,059.7 1,538.7Accumulated other comprehensive loss . . . . . . . . . . . . . . . . . . . . . . . . . . . . . (169.2) (427.5)
Total shareholders’ equity . . . . . . . . . . . . . . . . . . . . . . . . . . . . . . . . . . . . 3,545.5 2,755.6Noncontrolling interests . . . . . . . . . . . . . . . . . . . . . . . . . . . . . . . . . . . . . . . . . . . . . 1.1 2.6
Total equity . . . . . . . . . . . . . . . . . . . . . . . . . . . . . . . . . . . . . . . . . . . . . . . 3,546.6 2,758.2
Total liabilities and equity . . . . . . . . . . . . . . . . . . . . . . . . . . . . . . . . . . . . $ 7,611.8 $ 7,708.9
See Notes to Consolidated Financial Statements
72

SMITHFIELD FOODS, INC. AND SUBSIDIARIES
CONSOLIDATED STATEMENTS OF CASH FLOWS(in millions)
Fiscal Years
2011 2010 2009
Cash flows from operating activities:Net income (loss) . . . . . . . . . . . . . . . . . . . . . . . . . . . . . . . . . . . . . . . . . . . . . . . . . . . . . . . . . . $ 521.0 $ (101.4) $ (198.4)Adjustments to reconcile net cash flows from operating activities:
Income from discontinued operations, net of tax . . . . . . . . . . . . . . . . . . . . . . . . . . . . . . — — (52.5)Equity in (income) loss of affiliates . . . . . . . . . . . . . . . . . . . . . . . . . . . . . . . . . . . . . . . . (50.1) (38.6) 50.1Depreciation and amortization . . . . . . . . . . . . . . . . . . . . . . . . . . . . . . . . . . . . . . . . . . . . 231.9 242.3 270.5Gain on fire insurance recovery . . . . . . . . . . . . . . . . . . . . . . . . . . . . . . . . . . . . . . . . . . . (120.6) — —Deferred income taxes . . . . . . . . . . . . . . . . . . . . . . . . . . . . . . . . . . . . . . . . . . . . . . . . . . 158.2 35.3 (98.6)Impairment of assets . . . . . . . . . . . . . . . . . . . . . . . . . . . . . . . . . . . . . . . . . . . . . . . . . . . 9.2 51.3 81.8(Gain) loss on sale of property, plant and equipment, including breeding stock . . . . . . (53.0) 22.7 8.0Pension expense . . . . . . . . . . . . . . . . . . . . . . . . . . . . . . . . . . . . . . . . . . . . . . . . . . . . . . . 82.0 67.3 30.8Gain on sale of investments . . . . . . . . . . . . . . . . . . . . . . . . . . . . . . . . . . . . . . . . . . . . . . — (4.5) (58.0)
Pension contributions . . . . . . . . . . . . . . . . . . . . . . . . . . . . . . . . . . . . . . . . . . . . . . . . . . . . . . . (128.5) (73.9) (53.9)Changes in operating assets and liabilities and other, net:
Accounts receivable . . . . . . . . . . . . . . . . . . . . . . . . . . . . . . . . . . . . . . . . . . . . . . . . . . . . (63.8) (12.6) 53.9Inventories . . . . . . . . . . . . . . . . . . . . . . . . . . . . . . . . . . . . . . . . . . . . . . . . . . . . . . . . . . . (178.4) 46.5 225.6Prepaid expenses and other current assets . . . . . . . . . . . . . . . . . . . . . . . . . . . . . . . . . . . 132.2 (209.6) (66.5)Accounts payable . . . . . . . . . . . . . . . . . . . . . . . . . . . . . . . . . . . . . . . . . . . . . . . . . . . . . . 36.6 (12.6) (91.7)Accrued expenses and other current liabilities . . . . . . . . . . . . . . . . . . . . . . . . . . . . . . . (72.6) 160.3 13.1Other . . . . . . . . . . . . . . . . . . . . . . . . . . . . . . . . . . . . . . . . . . . . . . . . . . . . . . . . . . . . . . . 112.3 85.7 155.7
Net cash flows from operating activities . . . . . . . . . . . . . . . . . . . . . . . . . . . . . . . . 616.4 258.2 269.9
Cash flows from investing activities:Capital expenditures . . . . . . . . . . . . . . . . . . . . . . . . . . . . . . . . . . . . . . . . . . . . . . . . . . . . . . . . (176.8) (174.7) (179.3)Dispositions, including Butterball, LLC . . . . . . . . . . . . . . . . . . . . . . . . . . . . . . . . . . . . . . . . 261.5 23.3 587.0Insurance proceeds . . . . . . . . . . . . . . . . . . . . . . . . . . . . . . . . . . . . . . . . . . . . . . . . . . . . . . . . . 120.6 9.9 —Net disposals (additions) of breeding stock . . . . . . . . . . . . . . . . . . . . . . . . . . . . . . . . . . . . . . 26.2 (8.0) 4.8Proceeds from sale of property, plant and equipment . . . . . . . . . . . . . . . . . . . . . . . . . . . . . . 22.8 11.7 21.4Dividends received . . . . . . . . . . . . . . . . . . . . . . . . . . . . . . . . . . . . . . . . . . . . . . . . . . . . . . . . . — 5.3 56.5Investments in partnerships . . . . . . . . . . . . . . . . . . . . . . . . . . . . . . . . . . . . . . . . . . . . . . . . . . — (1.3) (31.7)Business acquisitions, net of cash acquired . . . . . . . . . . . . . . . . . . . . . . . . . . . . . . . . . . . . . . — — (17.4)
Net cash flows from investing activities . . . . . . . . . . . . . . . . . . . . . . . . . . . . . . . . 254.3 (133.8) 441.3
Cash flows from financing activities:Proceeds from the issuance of long-term debt . . . . . . . . . . . . . . . . . . . . . . . . . . . . . . . . . . . . — 840.4 600.0Net borrowings (repayments) on revolving credit facilities and notes payables . . . . . . . . . . 21.6 (491.6) (962.5)Principal payments on long-term debt and capital lease obligations . . . . . . . . . . . . . . . . . . . (944.5) (333.3) (356.6)Net proceeds from the issuance of common stock and stock option exercises . . . . . . . . . . . 1.2 296.9 122.3Cash posted as collateral . . . . . . . . . . . . . . . . . . . . . . . . . . . . . . . . . . . . . . . . . . . . . . . . . . . . (23.9) — —Purchase of call options . . . . . . . . . . . . . . . . . . . . . . . . . . . . . . . . . . . . . . . . . . . . . . . . . . . . . — — (88.2)Purchase of redeemable noncontrolling interest . . . . . . . . . . . . . . . . . . . . . . . . . . . . . . . . . . — (38.9) —Proceeds from the sale of warrants . . . . . . . . . . . . . . . . . . . . . . . . . . . . . . . . . . . . . . . . . . . . — — 36.7Debt issuance costs and other . . . . . . . . . . . . . . . . . . . . . . . . . . . . . . . . . . . . . . . . . . . . . . . . — (64.6) (25.2)
Net cash flows from financing activities . . . . . . . . . . . . . . . . . . . . . . . . . . . . . . . . (945.6) 208.9 (673.5)
Cash flows from discontinued operations:Net cash flows from operating activities . . . . . . . . . . . . . . . . . . . . . . . . . . . . . . . . . . . . . . . . — — 34.7Net cash flows from investing activities . . . . . . . . . . . . . . . . . . . . . . . . . . . . . . . . . . . . . . . . — — (7.0)Net cash flows from financing activities . . . . . . . . . . . . . . . . . . . . . . . . . . . . . . . . . . . . . . . . — — (0.8)
Net cash flows from discontinued operations activities . . . . . . . . . . . . . . . . . . . . . — — 26.9
Effect of foreign exchange rate changes on cash . . . . . . . . . . . . . . . . . . . . . . . . . . . . . . . . . . . . . . (1.6) (1.1) (2.9)
Net change in cash and cash equivalents . . . . . . . . . . . . . . . . . . . . . . . . . . . . . . . . . . . . . . . . . . . . (76.5) 332.2 61.7Cash and cash equivalents at beginning of period . . . . . . . . . . . . . . . . . . . . . . . . . . . . . . . . . . . . . 451.2 119.0 57.3
Cash and cash equivalents at end of period . . . . . . . . . . . . . . . . . . . . . . . . . . . . . . . . . . . . . . . . . . $ 374.7 $ 451.2 $ 119.0
See Notes to Consolidated Financial Statements
73
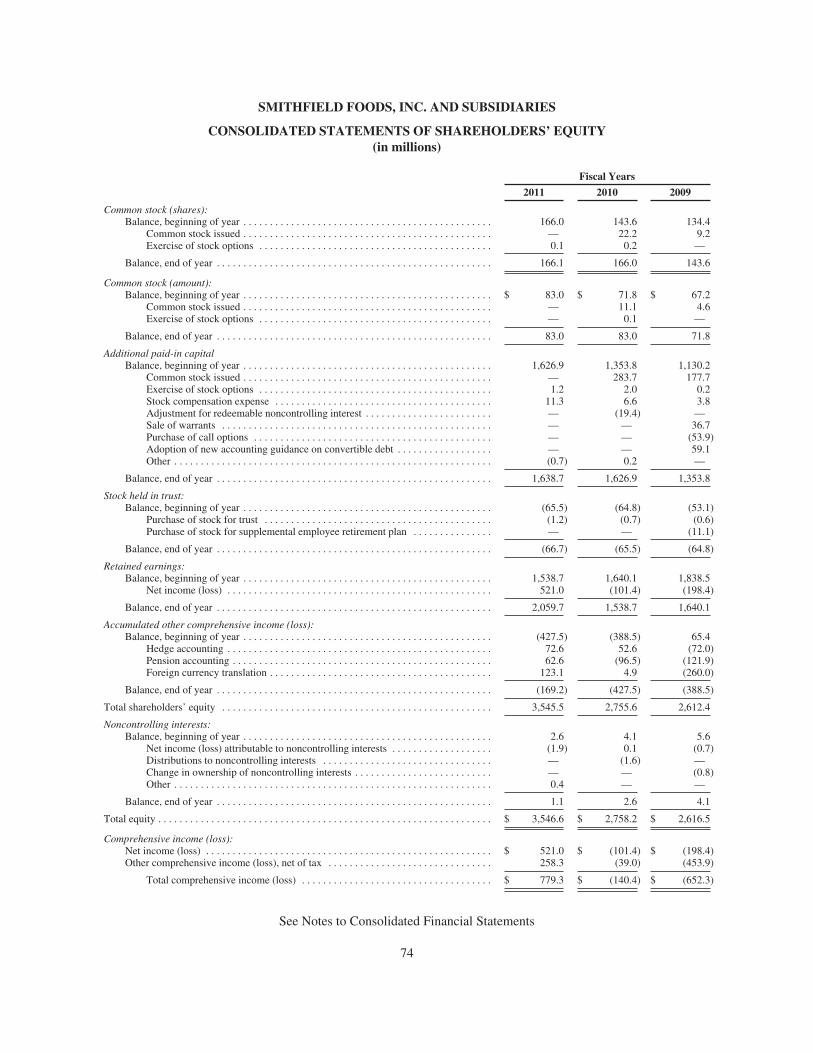
SMITHFIELD FOODS, INC. AND SUBSIDIARIES
CONSOLIDATED STATEMENTS OF SHAREHOLDERS’ EQUITY(in millions)
Fiscal Years
2011 2010 2009
Common stock (shares):Balance, beginning of year . . . . . . . . . . . . . . . . . . . . . . . . . . . . . . . . . . . . . . . . . . . . . . . 166.0 143.6 134.4
Common stock issued . . . . . . . . . . . . . . . . . . . . . . . . . . . . . . . . . . . . . . . . . . . . . . . — 22.2 9.2Exercise of stock options . . . . . . . . . . . . . . . . . . . . . . . . . . . . . . . . . . . . . . . . . . . . 0.1 0.2 —
Balance, end of year . . . . . . . . . . . . . . . . . . . . . . . . . . . . . . . . . . . . . . . . . . . . . . . . . . . . 166.1 166.0 143.6
Common stock (amount):Balance, beginning of year . . . . . . . . . . . . . . . . . . . . . . . . . . . . . . . . . . . . . . . . . . . . . . . $ 83.0 $ 71.8 $ 67.2
Common stock issued . . . . . . . . . . . . . . . . . . . . . . . . . . . . . . . . . . . . . . . . . . . . . . . — 11.1 4.6Exercise of stock options . . . . . . . . . . . . . . . . . . . . . . . . . . . . . . . . . . . . . . . . . . . . — 0.1 —
Balance, end of year . . . . . . . . . . . . . . . . . . . . . . . . . . . . . . . . . . . . . . . . . . . . . . . . . . . . 83.0 83.0 71.8
Additional paid-in capitalBalance, beginning of year . . . . . . . . . . . . . . . . . . . . . . . . . . . . . . . . . . . . . . . . . . . . . . . 1,626.9 1,353.8 1,130.2
Common stock issued . . . . . . . . . . . . . . . . . . . . . . . . . . . . . . . . . . . . . . . . . . . . . . . — 283.7 177.7Exercise of stock options . . . . . . . . . . . . . . . . . . . . . . . . . . . . . . . . . . . . . . . . . . . . 1.2 2.0 0.2Stock compensation expense . . . . . . . . . . . . . . . . . . . . . . . . . . . . . . . . . . . . . . . . . 11.3 6.6 3.8Adjustment for redeemable noncontrolling interest . . . . . . . . . . . . . . . . . . . . . . . . — (19.4) —Sale of warrants . . . . . . . . . . . . . . . . . . . . . . . . . . . . . . . . . . . . . . . . . . . . . . . . . . . — — 36.7Purchase of call options . . . . . . . . . . . . . . . . . . . . . . . . . . . . . . . . . . . . . . . . . . . . . — — (53.9)Adoption of new accounting guidance on convertible debt . . . . . . . . . . . . . . . . . . — — 59.1Other . . . . . . . . . . . . . . . . . . . . . . . . . . . . . . . . . . . . . . . . . . . . . . . . . . . . . . . . . . . . (0.7) 0.2 —
Balance, end of year . . . . . . . . . . . . . . . . . . . . . . . . . . . . . . . . . . . . . . . . . . . . . . . . . . . . 1,638.7 1,626.9 1,353.8
Stock held in trust:Balance, beginning of year . . . . . . . . . . . . . . . . . . . . . . . . . . . . . . . . . . . . . . . . . . . . . . . (65.5) (64.8) (53.1)
Purchase of stock for trust . . . . . . . . . . . . . . . . . . . . . . . . . . . . . . . . . . . . . . . . . . . (1.2) (0.7) (0.6)Purchase of stock for supplemental employee retirement plan . . . . . . . . . . . . . . . — — (11.1)
Balance, end of year . . . . . . . . . . . . . . . . . . . . . . . . . . . . . . . . . . . . . . . . . . . . . . . . . . . . (66.7) (65.5) (64.8)
Retained earnings:Balance, beginning of year . . . . . . . . . . . . . . . . . . . . . . . . . . . . . . . . . . . . . . . . . . . . . . . 1,538.7 1,640.1 1,838.5
Net income (loss) . . . . . . . . . . . . . . . . . . . . . . . . . . . . . . . . . . . . . . . . . . . . . . . . . . 521.0 (101.4) (198.4)
Balance, end of year . . . . . . . . . . . . . . . . . . . . . . . . . . . . . . . . . . . . . . . . . . . . . . . . . . . . 2,059.7 1,538.7 1,640.1
Accumulated other comprehensive income (loss):Balance, beginning of year . . . . . . . . . . . . . . . . . . . . . . . . . . . . . . . . . . . . . . . . . . . . . . . (427.5) (388.5) 65.4
Hedge accounting . . . . . . . . . . . . . . . . . . . . . . . . . . . . . . . . . . . . . . . . . . . . . . . . . . 72.6 52.6 (72.0)Pension accounting . . . . . . . . . . . . . . . . . . . . . . . . . . . . . . . . . . . . . . . . . . . . . . . . . 62.6 (96.5) (121.9)Foreign currency translation . . . . . . . . . . . . . . . . . . . . . . . . . . . . . . . . . . . . . . . . . . 123.1 4.9 (260.0)
Balance, end of year . . . . . . . . . . . . . . . . . . . . . . . . . . . . . . . . . . . . . . . . . . . . . . . . . . . . (169.2) (427.5) (388.5)
Total shareholders’ equity . . . . . . . . . . . . . . . . . . . . . . . . . . . . . . . . . . . . . . . . . . . . . . . . . . . 3,545.5 2,755.6 2,612.4
Noncontrolling interests:Balance, beginning of year . . . . . . . . . . . . . . . . . . . . . . . . . . . . . . . . . . . . . . . . . . . . . . . 2.6 4.1 5.6
Net income (loss) attributable to noncontrolling interests . . . . . . . . . . . . . . . . . . . (1.9) 0.1 (0.7)Distributions to noncontrolling interests . . . . . . . . . . . . . . . . . . . . . . . . . . . . . . . . — (1.6) —Change in ownership of noncontrolling interests . . . . . . . . . . . . . . . . . . . . . . . . . . — — (0.8)Other . . . . . . . . . . . . . . . . . . . . . . . . . . . . . . . . . . . . . . . . . . . . . . . . . . . . . . . . . . . . 0.4 — —
Balance, end of year . . . . . . . . . . . . . . . . . . . . . . . . . . . . . . . . . . . . . . . . . . . . . . . . . . . . 1.1 2.6 4.1
Total equity . . . . . . . . . . . . . . . . . . . . . . . . . . . . . . . . . . . . . . . . . . . . . . . . . . . . . . . . . . . . . . . $ 3,546.6 $ 2,758.2 $ 2,616.5
Comprehensive income (loss):Net income (loss) . . . . . . . . . . . . . . . . . . . . . . . . . . . . . . . . . . . . . . . . . . . . . . . . . . . . . . $ 521.0 $ (101.4) $ (198.4)Other comprehensive income (loss), net of tax . . . . . . . . . . . . . . . . . . . . . . . . . . . . . . . 258.3 (39.0) (453.9)
Total comprehensive income (loss) . . . . . . . . . . . . . . . . . . . . . . . . . . . . . . . . . . . . $ 779.3 $ (140.4) $ (652.3)
See Notes to Consolidated Financial Statements
74

SMITHFIELD FOODS, INC. AND SUBSIDIARIES
NOTES TO CONSOLIDATED FINANCIAL STATEMENTS
NOTE 1: SUMMARY OF SIGNIFICANT ACCOUNTING POLICIES
Unless otherwise stated, amounts presented in these notes to our consolidated financial statements are based oncontinuing operations for all fiscal periods included. Certain prior year amounts have been reclassified toconform to current year presentation.
Principles of Consolidation
The consolidated financial statements include the accounts of all wholly-owned subsidiaries, as well as allmajority-owned subsidiaries and other entities for which we have a controlling interest. Entities that are 50%owned or less are accounted for under the equity method when we have the ability to exercise significantinfluence. We use the cost method of accounting for investments in which our ability to exercise significantinfluence is limited. All intercompany transactions and accounts have been eliminated. The results of operationsinclude our proportionate share of the results of operations of entities acquired from the date of each acquisitionfor purchase business combinations. Consolidating the results of operations and financial position of variableinterest entities for which we are the primary beneficiary does not have a material effect on sales, net income(loss), or net income (loss) per diluted share, or on our financial position for the fiscal periods presented.
Foreign currency denominated assets and liabilities are translated into U.S. dollars using the exchange rates ineffect at the balance sheet date. Results of operations and cash flows in foreign currencies are translated into U.S.dollars using the average exchange rate over the course of the fiscal year. The effect of exchange rate fluctuationson the translation of assets and liabilities is included as a component of shareholders’ equity in accumulated othercomprehensive loss. Gains and losses that arise from exchange rate fluctuations on transactions denominated in acurrency other than the functional currency are included in selling, general and administrative expenses asincurred. We recorded net losses on foreign currency transactions of $0.4 million in fiscal 2011, net gains onforeign currency transactions of $3.7 million in fiscal 2010 and net losses on foreign currency transactions of$25.6 million in fiscal 2009.
Our Polish operations have different fiscal period end dates. As such, we have elected to consolidate the resultsof these operations on a one-month lag. We do not believe the impact of reporting the results of these entities ona one-month lag is material to the consolidated financial statements. Prior to fiscal 2009, the results of ourRomanian operations were reported on a one-month lag. Fiscal 2009 included thirteen months of results from ourRomanian operations in order to bring these operations in line with our standard fiscal reporting period. Theeffects of the additional month of results were not material to our consolidated financial statements.
The consolidated financial statements are prepared in conformity with accounting principles generally acceptedin the U.S., which require us to make estimates and use assumptions that affect the amounts reported in theconsolidated financial statements and accompanying notes. Actual results could differ from those estimates.
Our fiscal year consists of 52 or 53 weeks and ends on the Sunday nearest April 30. Fiscal 2011 and fiscal 2010consisted of 52 weeks. Fiscal 2009 consisted of 53 weeks.
Cash and Cash Equivalents
We consider all highly liquid investments with original maturities of 90 days or less to be cash equivalents. Themajority of our cash is concentrated in demand deposit accounts or money market funds. The carrying value ofcash equivalents approximates market value.
In fiscal 2011, we transferred $20.0 million of cash into a deposit account to serve as collateral for bankingservices provided by our cash management service provider under a banking agreement. We also transferred a
75

total of $27.2 million and $3.9 million of cash to our workers compensation service providers and thecounterparty of an interest rate swap contract, respectively. The cash generally replaced letters of creditpreviously held as collateral for these arrangements. We have reclassified the $20.0 million of cash on deposit toprepaid expenses and other current assets and the remaining $31.1 million to other assets on the consolidatedbalance sheet as of May 1, 2011.
Accounts Receivable
Accounts receivable are recorded net of the allowance for doubtful accounts. We regularly evaluate thecollectibility of our accounts receivable based on a variety of factors, including the length of time the receivablesare past due, the financial health of the customer and historical experience. Based on our evaluation, we recordreserves to reduce the related receivables to amounts we reasonably believe are collectible. Our reserve foruncollectible accounts receivable was $9.2 million and $8.1 million as of May 1, 2011 and May 2, 2010,respectively.
Inventories
Inventories consist of the following:
May 1,2011
May 2,2010
(in millions)
Live hogs . . . . . . . . . . . . . . . . . . . . . . . . . . . . . . . . . . . . . . . . . . . . . . . . . . . . . . . . . . . . . . . . . $ 942.8 $ 853.5Fresh and packaged meats . . . . . . . . . . . . . . . . . . . . . . . . . . . . . . . . . . . . . . . . . . . . . . . . . . . . 875.5 786.0Grains . . . . . . . . . . . . . . . . . . . . . . . . . . . . . . . . . . . . . . . . . . . . . . . . . . . . . . . . . . . . . . . . . . . 89.8 66.9Manufacturing supplies . . . . . . . . . . . . . . . . . . . . . . . . . . . . . . . . . . . . . . . . . . . . . . . . . . . . . . 60.0 70.5Other . . . . . . . . . . . . . . . . . . . . . . . . . . . . . . . . . . . . . . . . . . . . . . . . . . . . . . . . . . . . . . . . . . . . 51.8 83.1
Total inventories . . . . . . . . . . . . . . . . . . . . . . . . . . . . . . . . . . . . . . . . . . . . . . . . . . . . . . . $2,019.9 $1,860.0
Live hogs are generally valued at the lower of first-in, first-out cost or market, adjusted for changes in the fairvalue of live hogs that are hedged. Costs include purchase costs, feed, medications, contract grower fees andother production expenses. Fresh meat is valued at USDA and other market prices and adjusted for the cost offurther processing. Packaged meats are valued at the lower of cost or market. Costs for packaged productsinclude meat, labor, supplies and overhead. Average costing is primarily utilized to account for fresh andpackaged meats and grains. Manufacturing supplies are principally ingredients and packaging materials.
In fiscal 2009, prior to the sale of Smithfield Beef, we recorded after-tax charges of approximately $36 million inincome from discontinued operations on the write-down of cattle inventories due to a decline in live cattle marketprices. Refer to Note 3—Impairment and Disposal of Long-lived Assets for further discussion of our sale ofSmithfield Beef. Also, in fiscal 2009, we recorded pre-tax charges totaling $4.3 million in income (loss) fromcontinuing operations in the Other segment for the write-down of cattle inventories due to a decline in live cattlemarket prices. Additionally, we incurred inventory write-downs and other associated costs in the Pork segmenttotaling approximately $7 million in fiscal 2009.
Derivative Financial Instruments and Hedging Activities
See Note 6—Derivative Financial Instruments for our policy.
Property, Plant and Equipment, Net
Property, plant and equipment is generally stated at historical cost, which includes the then fair values of assetsacquired in business combinations, and depreciated on a straight-line basis over the estimated useful lives of the
76

assets. Assets held under capital leases are classified in property, plant and equipment, net and amortized over thelease term. The amortization of assets held under capital leases is included in depreciation expense. The cost ofassets held under capital leases was $37.4 million and $35.0 million at May 1, 2011 and May 2, 2010,respectively. The assets held under capital leases had accumulated amortization of $3.7 million and $1.4 millionat May 1, 2011 and May 2, 2010, respectively. Depreciation expense is included in either cost of sales or selling,general and administrative expenses, as appropriate. Depreciation expense totaled $227.4 million, $236.9 millionand $264.0 million in fiscal 2011, 2010 and 2009, respectively.
Interest is capitalized on property, plant and equipment over the construction period. Total interest capitalizedwas $1.6 million, $2.8 million and $2.0 million in fiscal 2011, 2010 and 2009, respectively.
Property, plant and equipment, net, consists of the following:
Useful LifeMay 1,2011
May 2,2010
(in Years) (in millions)
Land and improvements . . . . . . . . . . . . . . . . . . . . . . . . . . . . . . . . . . . . . . 0-20 $ 271.7 $ 300.1Buildings and improvements . . . . . . . . . . . . . . . . . . . . . . . . . . . . . . . . . . . 20-40 1,720.8 1,681.2Machinery and equipment . . . . . . . . . . . . . . . . . . . . . . . . . . . . . . . . . . . . . 5-25 1,710.2 1,639.7Breeding stock . . . . . . . . . . . . . . . . . . . . . . . . . . . . . . . . . . . . . . . . . . . . . . 2 159.3 151.5Computer hardware and software . . . . . . . . . . . . . . . . . . . . . . . . . . . . . . . 3-5 136.3 112.0Other . . . . . . . . . . . . . . . . . . . . . . . . . . . . . . . . . . . . . . . . . . . . . . . . . . . . . 3-10 54.8 56.6Construction in progress . . . . . . . . . . . . . . . . . . . . . . . . . . . . . . . . . . . . . . 133.6 97.4
4,186.7 4,038.5Accumulated depreciation . . . . . . . . . . . . . . . . . . . . . . . . . . . . . . . . . . . . . (1,877.6) (1,679.8)
Property, plant and equipment, net . . . . . . . . . . . . . . . . . . . . . . . . . . $ 2,309.1 $ 2,358.7
Goodwill and Other Intangible Assets
Goodwill represents the excess of the purchase price over the fair value of identifiable net assets of businessesacquired. Intangible assets with finite lives are amortized over their estimated useful lives. The useful life of anintangible asset is the period over which the asset is expected to contribute directly or indirectly to future cashflows.
Goodwill and indefinite-lived intangible assets are tested for impairment annually in the fourth quarter, or soonerif impairment indicators arise. Goodwill is tested for impairment using a two-step process. The first step is toidentify if a potential impairment exists by comparing the fair value of a reporting unit with its carrying amount,including goodwill. The fair value of a reporting unit is estimated by applying valuation multiples and/orestimating future discounted cash flows. The selection of multiples is dependent upon assumptions regardingfuture levels of operating performance as well as business trends and prospects, and industry, market andeconomic conditions. When estimating future discounted cash flows, we consider the assumptions thathypothetical marketplace participants would use in estimating future cash flows. In addition, where applicable,an appropriate discount rate is used, based on an industry-wide average cost of capital or location-specificeconomic factors. If the fair value of a reporting unit exceeds its carrying amount, goodwill of the reporting unitis not considered to have a potential impairment and the second step of the impairment test is not necessary.However, if the carrying amount of a reporting unit exceeds its fair value, the second step is performed todetermine if goodwill is impaired and to measure the amount of impairment loss to recognize, if any.
The second step compares the implied fair value of goodwill with the carrying amount of goodwill. The impliedfair value of goodwill is determined in the same manner as the amount of goodwill recognized in a businesscombination (i.e., the fair value of the reporting unit is allocated to all the assets and liabilities, including any
77

unrecognized intangible assets, as if the reporting unit had been acquired in a business combination and the fairvalue of the reporting unit was the purchase price paid to acquire the reporting unit). If the implied fair value ofgoodwill exceeds the carrying amount, goodwill is not considered impaired. However, if the carrying amount ofgoodwill exceeds the implied fair value, an impairment loss is recognized in an amount equal to that excess.
Based on the results of the first step of our annual goodwill impairment tests, as of our testing date, noimpairment indicators were noted for all the periods presented.
The carrying amount of goodwill includes cumulative impairment losses of $6.0 million as of May 1, 2011 andMay 2, 2010.
Intangible assets consist of the following:
Useful LifeMay 1,2011
May 2,2010
(in Years) (in millions)
Amortized intangible assets:Customer relations assets . . . . . . . . . . . . . . . . . . . . . . . . . . . . . . . . . 15-16 $ 13.3 $ 13.3Patents, rights and leasehold interests . . . . . . . . . . . . . . . . . . . . . . . . 5-25 11.8 12.7Contractual relationships . . . . . . . . . . . . . . . . . . . . . . . . . . . . . . . . . . 22 33.1 33.1Accumulated amortization . . . . . . . . . . . . . . . . . . . . . . . . . . . . . . . . (19.6) (17.4)
Amortized intangible assets, net . . . . . . . . . . . . . . . . . . . . . . . . 38.6 41.7Non-amortized intangible assets:
Trademarks . . . . . . . . . . . . . . . . . . . . . . . . . . . . . . . . . . . . . . . . . . . . Indefinite 341.9 341.6Permits . . . . . . . . . . . . . . . . . . . . . . . . . . . . . . . . . . . . . . . . . . . . . . . . Indefinite 6.1 6.3
Intangible assets, net . . . . . . . . . . . . . . . . . . . . . . . . . . . . . . . . . $ 386.6 $ 389.6
The fair values of trademarks are calculated using a royalty rate method. Assumptions about royalty rates arebased on the rates at which similar brands and trademarks are licensed in the marketplace. If the carrying value ofour indefinite-lived intangible assets exceeds their fair value, an impairment loss is recognized in an amountequal to that excess. Intangible assets with finite lives are reviewed for recoverability when indicators ofimpairment are present using estimated future undiscounted cash flows related to those assets. We havedetermined that no impairments of our intangible assets existed for any of the periods presented.
Amortization expense for intangible assets was $3.2 million, $3.1 million and $2.9 million in fiscal 2011, 2010and 2009, respectively. As of May 1, 2011, the estimated amortization expense associated with our intangibleassets for each of the next five fiscal years is expected to be $2.7 million.
Debt Issuance Costs, Premiums and Discounts
Debt issuance costs, premiums and discounts are amortized into interest expense over the terms of the relatedloan agreements using the effective interest method or other methods which approximate the effective interestmethod.
Investments
We record our share of earnings and losses from our equity method investments in equity in (income) loss ofaffiliates. Some of these results are reported on a one-month lag which, in our opinion, does not materiallyimpact our consolidated financial statements. We consider whether the fair values of any of our equity methodinvestments have declined below their carrying value whenever adverse events or changes in circumstancesindicate that recorded values may not be recoverable. If we consider any such decline to be other than temporary(based on various factors, including historical financial results, product development activities and the overall
78

health of the affiliate’s industry), then a write-down of the investment would be recorded to its estimated fairvalue. We have determined that no write-down was necessary for all periods presented. See Note 7—Investmentsfor further discussion.
Income Taxes
Income taxes are accounted for under the asset and liability method. Deferred tax assets and liabilities arerecognized for the estimated future tax consequences attributable to differences between the financial statementcarrying amounts of existing assets and liabilities and their respective tax bases. Deferred tax assets and liabilitiesare measured using enacted tax rates in effect for the year in which those temporary differences are expected tobe recovered or settled. The effect on deferred tax assets and liabilities of a change in tax rate is recognized inearnings in the period that includes the enactment date. Valuation allowances are established when necessary toreduce deferred tax assets to amounts more likely than not to be realized.
The determination of our provision for income taxes requires significant judgment, the use of estimates, and theinterpretation and application of complex tax laws. Significant judgment is required in assessing the timing andamounts of deductible and taxable items.
We record unrecognized tax benefit liabilities for known or anticipated tax issues based on our analysis ofwhether, and the extent to which, additional taxes will be due. We accrue interest and penalties related tounrecognized tax benefits as other liabilities and recognize the related expense as income tax expense.
Pension Accounting
We recognize the funded status of our benefit plans in the consolidated balance sheets. We also recognize as acomponent of accumulated other comprehensive loss, the net of tax results of the gains or losses and prior servicecosts or credits that arise during the period but are not recognized in net periodic benefit cost. These amounts areadjusted out of accumulated other comprehensive loss as they are subsequently recognized as components of netperiodic benefit cost.
We measure our pension and other postretirement benefit plan obligations and related plan assets as of the lastday of our fiscal year. The measurement of our pension obligations and related costs is dependent on the use ofassumptions and estimates. These assumptions include discount rates, salary growth, mortality rates and expectedreturns on plan assets. Changes in assumptions and future investment returns could potentially have a materialimpact on our expenses and related funding requirements.
Self-Insurance Programs
We are self-insured for certain levels of general and vehicle liability, property, workers’ compensation, productrecall and health care coverage. The cost of these self-insurance programs is accrued based upon estimatedsettlements for known and anticipated claims. Any resulting adjustments to previously recorded reserves arereflected in current period earnings.
Contingent Liabilities
We are subject to lawsuits, investigations and other claims related to the operation of our farms, labor, livestockprocurement, securities, environmental, product, taxing authorities and other matters, and are required to assessthe likelihood of any adverse judgments or outcomes to these matters, as well as potential ranges of probablelosses and fees.
A determination of the amount of accruals and disclosures required, if any, for these contingencies is made afterconsiderable analysis of each individual issue. We accrue for contingent liabilities when an assessment of the riskof loss is probable and can be reasonably estimated. We disclose contingent liabilities when the risk of loss isreasonably possible or probable.
79
Our contingent liabilities contain uncertainties because the eventual outcome will result from future events. Ourdetermination of accruals and any reasonably possible losses in excess of those accruals require estimates andjudgments related to future changes in facts and circumstances, interpretations of the law, the amount of damagesor fees, and the effectiveness of strategies or other factors beyond our control. If actual results are not consistentwith our estimates or assumptions, we may be exposed to gains or losses that could be material.
Revenue Recognition
We recognize revenues from product sales upon delivery to customers or when title passes. Revenue is recordedat the invoice price for each product net of estimated returns and sales incentives provided to customers. Salesincentives include various rebate and trade allowance programs with our customers, primarily discounts andrebates based on achievement of specified volume or growth in volume levels.
Advertising and Promotional Costs
Advertising and promotional costs are expensed as incurred except for certain production costs, which areexpensed upon the first airing of the advertisement. Promotional sponsorship costs are expensed as thepromotional events occur. Advertising costs totaled $102.5 million, $111.3 million and $119.6 million in fiscal2011, 2010 and 2009, respectively, and were included in selling, general and administrative expenses.
Shipping and Handling Costs
Shipping and handling costs are reported as a component of cost of sales.
Research and Development Costs
Research and development costs are expensed as incurred. Research and development costs totaled $47.0 million,$38.8 million and $52.6 million in fiscal 2011, 2010 and 2009, respectively.
Net Income (Loss) per Share
We present dual computations of net income (loss) per share. The basic computation is based on weightedaverage common shares outstanding during the period. The diluted computation reflects the potentially dilutiveeffect of common stock equivalents, such as stock options, during the period.
NOTE 2: NEW ACCOUNTING GUIDANCE
In June 2009 and December 2009, the FASB issued guidance requiring an analysis to determine whether avariable interest gives the entity a controlling financial interest in a variable interest entity. This guidancerequires an ongoing assessment and eliminates the quantitative approach previously required for determiningwhether an entity is the primary beneficiary. This guidance was effective for fiscal years beginning afterNovember 15, 2009. We adopted the new guidance in the first quarter of fiscal 2011 and determined that it hadno impact on our consolidated financial statements.
NOTE 3: IMPAIRMENT AND DISPOSAL OF LONG-LIVED ASSETS
Hog Farms
Texas
In the first quarter of fiscal 2010, we ceased hog production operations and closed the farms related to ourDalhart, Texas operation. In connection with this event, we recorded an impairment charge of $23.6 million towrite-down the assets to their estimated fair value of $20.9 million. The estimate of fair value was based on our
80

assessment of the facts and circumstances at the time of the write-down, which indicated that the highest and bestuse of the assets by a market participant was for crop farming. The estimated fair value was determined using theinitial valuation of the property in connection with our acquisition of the farms, relevant market data based onrecent transactions for similar real property and third party estimates. In connection with our evaluation, we haddetermined that these assets did not meet the criteria to be classified as held for sale due to the uncertainty that asale would ultimately occur and be completed within a twelve-month period. We subsequently reevaluated theseassets for appropriate classification each quarter.
In January 2011 (fiscal 2011), we sold land included in our Dalhart, Texas operations to a crop farmer for netproceeds of $9.1 million and recognized a loss on the sale of $1.8 million in selling, general and administrativeexpenses in our Hog Production segment in the third quarter of fiscal 2011. Also, in January 2011 (fiscal 2011),we received a non-binding letter of intent from a prospective buyer for the purchase of our remaining Dalhart,Texas assets. The prospective buyer had indicated that it intended to utilize the farms for hog production afterreconfiguring the assets to meet their specific business purposes. In April 2011 (fiscal 2011), we completed thesale of the remaining Dalhart, Texas assets and received net proceeds of $32.5 million. As a result of the sale, werecognized a gain of $13.6 million in selling, general and administrative expenses in our Hog Production segmentin the fourth quarter of fiscal 2011, after allocating $8.5 million in goodwill to the asset group. Goodwill wasallocated to this business based on its fair value relative to the estimated fair value of our domestic hogproduction reporting unit. The operating results and cash flows from these asset groups were not consideredmaterial for separate disclosure.
Oklahoma and Iowa
In January 2011 (fiscal 2011), we completed the sale of certain hog production assets located in Oklahoma andIowa. As a result of these sales, we received total net proceeds of $70.4 million and recognized gains totaling$6.9 million, after allocating $17.0 million of goodwill to these asset groups. Goodwill was allocated to thisbusiness based on its fair value relative to the estimated fair value of our domestic hog production reporting unit.The gains were recorded in selling, general and administrative expenses in our Hog Production segment in thethird quarter of fiscal 2011. The operating results and cash flows from these asset groups were not consideredmaterial for separate disclosure.
Missouri
In the first quarter of fiscal 2010, we entered into negotiations to sell certain hog farms located in Missouri,which we believed would result in a completed sale within the subsequent twelve month period. We recordedtotal impairment charges of $10.5 million, including a $6.0 million allocation of goodwill, in the first quarter offiscal 2010 to write-down the hog farm assets to their estimated fair value. The impairment charges wererecorded in cost of sales in the Hog Production segment. We determined the fair value of the assets byprobability-weighting an estimated range of sales proceeds based on price negotiations between us and theprospective buyer, which included consideration of recent market multiples. We allocated goodwill to the assetdisposal group based on its estimated fair value relative to the estimated fair value of our domestic hogproduction reporting unit.
Based on our evaluation in the first quarter of fiscal 2010, we classified these properties, which consistedprimarily of property, plant and equipment, as held for sale as of August 2, 2009 and November 1, 2009.However, in the quarter ended January 31, 2010, negotiations for the sale of these properties stalled indefinitelyas we were unwilling to meet certain demands of the prospective buyer. At that time, we concluded it was nolonger probable that a sale of these properties would occur and be completed within one year. As a result, wereclassified these properties as held and used as of January 31, 2010 and determined that no adjustment to thecarrying amount was necessary. These properties continue to be classified as held and used in the consolidatedbalance sheets as of May 1, 2011 and May 2, 2010.
81

Butterball, LLC (Butterball)
In June 2010 (fiscal 2011), we announced that we had made an offer to purchase our joint venture partner’s 51%ownership interest in Butterball and our partner’s related turkey production assets. In accordance withButterball’s operating agreement, our partner had to either accept the offer to sell or be required to purchase our49% interest and our related turkey production assets, which we refer to below as our turkey operations.
In September 2010 (fiscal 2011), we were notified of our joint venture partner’s decision to purchase our 49%interest in Butterball and our related turkey production assets. In December 2010 (fiscal 2011), we completed thesale of these assets for $167.0 million and recognized a gain of $0.2 million. The gain was calculated as the cashselling price, net of costs to sell, less the carrying amount of the asset disposal group. The operating results andcash flows from our turkey operations were not considered material for separate disclosure.
Sioux City, Iowa Plant
In January 2010 (fiscal 2010), we announced that we would close our fresh pork processing plant located inSioux City, Iowa. The Sioux City plant was one of our oldest and least efficient plants. The plant design severelylimited our ability to produce value-added packaged meats products and maximize production throughput. Aportion of the plant’s production was transferred to other nearby Smithfield plants. We closed the Sioux Cityplant in April 2010 (fiscal 2010).
As a result of the planned closure, we recorded charges of $13.1 million in the third quarter of fiscal 2010. Thesecharges consisted of $3.6 million for the write-down of long-lived assets, $2.5 million of unusable inventoriesand $7.0 million for estimated severance benefits pursuant to contractual and ongoing benefit arrangements.Substantially all of these charges were recorded in cost of sales in the Pork segment. There were no significantcharges associated with this plant closure in fiscal 2011 and we do not expect any significant future charges.
RMH Foods, LLC (RMH)
In October 2009 (fiscal 2010), we entered into an agreement to sell substantially all of the assets of RMH, asubsidiary within the Pork segment. As a result of this sale, we recorded pre-tax charges totaling $3.5 million,including $0.5 million of goodwill impairment, in cost of sales in the Pork segment in the second quarter of fiscal2010 to write-down the assets of RMH to their fair values. In December 2009 (fiscal 2010), we completed thesale of RMH for $9.1 million, plus $1.4 million of liabilities assumed by the buyer.
Smithfield Beef, Inc. (Smithfield Beef)
In March 2008 (fiscal 2008), we entered into an agreement with JBS S.A., a company organized and existingunder the laws of Brazil (JBS), to sell Smithfield Beef, our beef processing and cattle feeding operation thatencompassed our entire Beef segment. In October 2008 (fiscal 2009), we completed the sale of Smithfield Beeffor $575.5 million in cash.
The sale included 100 percent of Five Rivers Ranch Cattle Feeding LLC (Five Rivers), which was previously a50/50 joint venture with Continental Grain Company (CGC). Immediately preceding the closing of the JBStransaction, we acquired CGC’s 50 percent investment in Five Rivers for 2,166,667 shares of our common stockvalued at $27.87 per share and $8.7 million for working capital adjustments.
The JBS transaction excluded substantially all live cattle inventories held by Smithfield Beef and Five Rivers asof the closing date, together with associated debt. All live cattle inventories previously held by Five Rivers weresold by the end of fiscal 2009. The remaining live cattle inventories of Smithfield Beef, which were excludedfrom the JBS transaction, were sold in the first quarter of fiscal 2010. Our results from the sale of the live cattleinventories that were excluded from the JBS transaction are reported in income from continuing operations in theOther segment.
82
We recorded an estimated pre-tax gain of $95.2 million ($51.9 million net of tax) on the sale of Smithfield Beefin the second quarter of fiscal 2009. We recorded an additional gain of approximately $4.5 million ($2.4 millionnet of tax) in the third quarter of fiscal 2009 for the settlement of differences in working capital at closing fromagreed-upon targets. These gains were recorded in income (loss) from discontinued operations.
Sales, interest expense and net income of Smithfield Beef for fiscal 2009 were $1.7 billion, $17.3 million and$0.9 million, respectively. Interest expense is allocated to discontinued operations based on specific borrowingsby the discontinued operations. These results are reported in income from discontinued operations.
Smithfield Bioenergy, LLC (SBE)
In April 2007 (fiscal 2007), we decided to exit the alternative fuels business and dispose of substantially all of theassets of SBE. In February 2008 (fiscal 2008), we signed a definitive agreement to sell substantially all of SBE’sassets, and in May 2008 (fiscal 2009), we completed the sale for $11.5 million.
Sales, interest expense and net loss of SBE for fiscal 2009 were $3.8 million, $1.3 million and $2.7 million,respectively. These results are reported in income from discontinued operations.
NOTE 4: PORK RESTRUCTURING
In February 2009 (fiscal 2009), we announced a plan to consolidate and streamline the corporate structure andmanufacturing operations of our Pork segment (the Restructuring Plan). This restructuring was intended to makeus more competitive by improving operating efficiencies and increasing plant utilization. The Restructuring Planincluded the following primary initiatives:
• the closing of the following six plants, with the transfer of production to more efficient facilities:
• The Smithfield Packing Company, Incorporated’s (Smithfield Packing) Smithfield South plant inSmithfield, Virginia;
• Smithfield Packing’s Plant City, Florida plant;
• Smithfield Packing’s Elon, North Carolina plant;
• John Morrell & Co’s (John Morrell) Great Bend, Kansas plant;
• Farmland Foods, Inc.’s (Farmland Foods) New Riegel, Ohio plant; and
• Armour-Eckrich’s Hastings, Nebraska plant;
• a reduction in the number of operating companies in the Pork segment from seven to three;
• the merger of the fresh pork sales forces of the John Morrell and Farmland Foods business units; and
• the consolidation of the international sales organizations of our U.S. operating companies into one groupthat is responsible for exports.
We completed the Restructuring Plan in the first half of fiscal 2011 with cumulative pre-tax restructuring andimpairment charges of approximately $105.5 million. We recorded $17.3 million of these charges in fiscal 2010and $88.2 million in fiscal 2009. Of these amounts, $4.7 million and $5.9 million were recorded in selling,general and administrative expenses in fiscal 2010 and fiscal 2009, respectively, with the remainder recorded incost of sales. Total impairment charges were $74.7 million, including $0.5 million in fiscal 2010 and $74.2million in fiscal 2009. Other restructuring charges consisted of employee severance and related benefits, plantconsolidation expenses and plant wind-down expenses. There were no material charges incurred in fiscal 2011.All charges were recorded in the Pork segment.
83
NOTE 5: HOG PRODUCTION COST SAVINGS INITIATIVE
In the fourth quarter of fiscal 2010, we announced a plan to improve the cost structure and profitability of ourdomestic hog production operations (the Cost Savings Initiative). The plan includes a number of undertakingsdesigned to improve operating efficiencies and productivity. These consist of farm reconfigurations andconversions, termination of certain high cost, third party hog grower contracts and breeding stock sourcingcontracts, as well as a number of other cost reduction activities. Certain of these activities are expected to occurover the next two years in order to allow for the successful transformation of farms while minimizing disruptionof supply.
The following table summarizes the balance of accrued expenses, the cumulative expenses incurred to date andthe expected remaining expenses to be incurred related to the Cost Savings Initiative by major type of cost. All ofthe charges presented have been recorded in cost of sales in the Hog Production segment.
AccruedBalance
May 2, 2010Fiscal 2011
Expense Payments
AccruedBalance
May 1, 2011
CumulativeExpense-to-
Date
EstimatedRemaining
Expense
(in millions)
Cost savings activities:Contract terminations . . . . . . . . . $ 1.8 $ 19.4 $ (20.4) $ 0.8 $ 22.2 $ 3.4Other associated costs . . . . . . . . — 6.9 (5.3) 1.6 6.9 2.5
Total cost savingsactivities . . . . . . . . . . . . . $ 1.8 26.3 $ (25.7) $ 2.4 29.1 5.9
Other charges:Accelerated depreciation . . . . . . 1.7 5.5 0.4Impairment . . . . . . . . . . . . . . . . . — 2.5 —
Total other charges . . . . . . . 1.7 8.0 0.4
Total cost savingsactivities and othercharges . . . . . . . . . . $ 28.0 $ 37.1 $ 6.3
In addition to the charges presented in the table above, we anticipate capital expenditures totaling approximately$86 million, of which we have spent $46.3 million through May 1, 2011.
NOTE 6: DERIVATIVE FINANCIAL INSTRUMENTS
Our meat processing and hog production operations use various raw materials, primarily live hogs, corn andsoybean meal, which are actively traded on commodity exchanges. We hedge these commodities when wedetermine conditions are appropriate to mitigate price risk. While this hedging may limit our ability to participatein gains from favorable commodity fluctuations, it also tends to reduce the risk of loss from adverse changes inraw material prices. We attempt to closely match the commodity contract terms with the hedged item. We alsoenter into interest rate swaps to hedge exposure to changes in interest rates on certain financial instruments andforeign exchange forward contracts to hedge certain exposures to fluctuating foreign currency rates.
We record all derivatives in the balance sheet as either assets or liabilities at fair value. Accounting for changesin the fair value of a derivative depends on whether it qualifies and has been designated as part of a hedgingrelationship. For derivatives that qualify and have been designated as hedges for accounting purposes, changes infair value have no net impact on earnings, to the extent the derivative is considered perfectly effective inachieving offsetting changes in fair value or cash flows attributable to the risk being hedged, until the hedgeditem is recognized in earnings (commonly referred to as the “hedge accounting” method). For derivatives that donot qualify or are not designated as hedging instruments for accounting purposes, changes in fair value arerecorded in current period earnings (commonly referred to as the “mark-to-market” method). We may elect eithermethod of accounting for our derivative portfolio, assuming all the necessary requirements are met. We have in
84

the past availed ourselves of either acceptable method and expect to do so in the future. We believe all of ourderivative instruments represent economic hedges against changes in prices and rates, regardless of theirdesignation for accounting purposes.
We do not offset the fair value of derivative instruments with cash collateral held with or received from the samecounterparty under a master netting arrangement. As of May 1, 2011, prepaid expenses and other current assetsincluded $46.4 million representing cash on deposit with brokers to cover losses on our open derivativeinstruments. Changes in commodity prices could have a significant impact on cash deposit requirements underour broker and counterparty agreements. We have reviewed our derivative contracts and have determined thatthey do not contain credit contingent features which would require us to post additional collateral if we did notmaintain a credit rating equivalent to what was in place at the time the contracts were entered into.
We are exposed to losses in the event of nonperformance or nonpayment by counterparties under financialinstruments. Although our counterparties primarily consist of financial institutions that are investment grade,there is still a possibility that one or more of these companies could default. However, a majority of our financialinstruments are exchange traded futures contracts held with brokers and counterparties with whom we maintainmargin accounts that are settled on a daily basis, thereby limiting our credit risk to non-exchange tradedderivatives. Determination of the credit quality of our counterparties is based upon a number of factors, includingcredit ratings and our evaluation of their financial condition. As of May 1, 2011, we had credit exposure of $37.9million on non-exchange traded derivative contracts, excluding the effects of netting arrangements. As a result ofnetting arrangements, our credit exposure was reduced to $35.1 million. No significant concentrations of creditrisk existed as of May 1, 2011.
The size and mix of our derivative portfolio varies from time to time based upon our analysis of current andfuture market conditions. The following table presents the fair values of our open derivative financial instrumentsin the consolidated balance sheets on a gross basis. All grain contracts, livestock contracts and foreign exchangecontracts are recorded in prepaid expenses and other current assets or accrued expenses and other currentliabilities within the consolidated balance sheets, as appropriate. Interest rate contracts are recorded in otherliabilities.
Assets Liabilities
May 1,2011
May 2,2010
May 1,2011
May 2,2010
(in millions) (in millions)
Derivatives using the “hedge accounting” method:Grain contracts . . . . . . . . . . . . . . . . . . . . . . . . . . . . . . . . . . . . . $ 46.2 $ 11.5 $ 4.8 $ 3.4Livestock contracts . . . . . . . . . . . . . . . . . . . . . . . . . . . . . . . . . 22.9 — 29.5 40.8Interest rate contracts . . . . . . . . . . . . . . . . . . . . . . . . . . . . . . . . — — 2.3 8.1Foreign exchange contracts . . . . . . . . . . . . . . . . . . . . . . . . . . . 0.2 3.0 — —
Total . . . . . . . . . . . . . . . . . . . . . . . . . . . . . . . . . . . . . . . . . 69.3 14.5 36.6 52.3
Derivatives using the “mark-to-market” method:Grain contracts . . . . . . . . . . . . . . . . . . . . . . . . . . . . . . . . . . . . . 38.3 5.5 4.7 6.5Livestock contracts . . . . . . . . . . . . . . . . . . . . . . . . . . . . . . . . . 1.7 5.8 8.0 87.6Energy contracts . . . . . . . . . . . . . . . . . . . . . . . . . . . . . . . . . . . . 1.0 — 0.1 4.0Foreign exchange contracts . . . . . . . . . . . . . . . . . . . . . . . . . . . 0.3 0.5 1.9 0.2
Total . . . . . . . . . . . . . . . . . . . . . . . . . . . . . . . . . . . . . . . . . 41.3 11.8 14.7 98.3
Total fair value of derivative instruments . . . . . . . . $ 110.6 $ 26.3 $ 51.3 $ 150.6
85
Hedge Accounting Method
Cash Flow Hedges
We enter into derivative instruments, such as futures, swaps and options contracts, to manage our exposure to thevariability in expected future cash flows attributable to commodity price risk associated with the forecasted saleof live hogs and fresh pork, and the forecasted purchase of corn and soybean meal. In addition, we enter intointerest rate swaps to manage our exposure to changes in interest rates associated with our variable interest ratedebt, and we enter into foreign exchange contracts to manage our exposure to the variability in expected futurecash flows attributable to changes in foreign exchange rates associated with the forecasted purchase or sale ofassets denominated in foreign currencies. We generally do not hedge anticipated transactions beyond twelvemonths.
During fiscal 2011, the range of notional volumes associated with open derivative instruments designated in cashflow hedging relationships was as follows:
Minimum Maximum Metric
Commodities:Corn . . . . . . . . . . . . . . . . . . . . . . . . . . . . . . . . . . . . . . 20,447,900 54,885,000 BushelsSoybean meal . . . . . . . . . . . . . . . . . . . . . . . . . . . . . . 145,700 516,000 TonsLean Hogs . . . . . . . . . . . . . . . . . . . . . . . . . . . . . . . . . 182,640,000 1,008,880,000 Pounds
Interest rate . . . . . . . . . . . . . . . . . . . . . . . . . . . . . . . . . . . . 200,000,000 200,000,000 U.S. DollarsForeign currency(1) . . . . . . . . . . . . . . . . . . . . . . . . . . . . . . 8,951,592 89,021,606 U.S. Dollars
(1) Amounts represent the U.S. dollar equivalent of various foreign currency contracts.
When cash flow hedge accounting is applied, derivative gains or losses are recognized as a component of othercomprehensive income (loss) and reclassified into earnings in the same period or periods during which thehedged transactions affect earnings. Derivative gains and losses, when reclassified into earnings, are recorded incost of sales for grain contracts, sales for lean hog contracts, interest expense for interest rate contracts andselling, general and administrative expenses for foreign exchange contracts. Gains and losses on derivativesdesigned to hedge price risk associated with fresh pork sales are recorded in the Hog Production segment.
The following table presents the effects on our consolidated financial statements of pre-tax gains and losses onderivative instruments designated in cash flow hedging relationships for the fiscal years indicated:
Gain (Loss) Recognizedin Other Comprehensive
Income (Loss) onDerivative (Effective Portion)
Gain (Loss) Reclassified fromAccumulated Other
Comprehensive Loss intoEarnings (Effective Portion)
Gain (Loss) Recognized inEarnings on Derivative
(Ineffective Portion)
2011 2010 2009 2011 2010 2009 2011 2010 2009
(in millions) (in millions) (in millions)Commodity contracts:
Grain contracts . . . . . . . . . $ 232.9 $ (4.0) $(201.5) $ 80.7 $ (85.4) $(112.5) $ 1.9 $ (7.2) $ (4.6)Lean hog contracts . . . . . . (82.8) (22.8) — (44.5) 1.9 — (1.0) (0.5) —
Interest rate contracts . . . . . . . . (1.2) (4.6) (12.6) (7.0) (6.8) (2.3) — — —Foreign exchange contracts . . . (4.1) 6.1 (37.5) (2.6) (8.0) (21.7) — — —
Total . . . . . . . . . . . . . . . . . $ 144.8 $ (25.3) $(251.6) $ 26.6 $ (98.3) $(136.5) $ 0.9 $ (7.7) $ (4.6)
For the fiscal periods presented, foreign exchange contracts were determined to be highly effective. We haveexcluded from the assessment of effectiveness differences between spot and forward rates, which we havedetermined to be immaterial. During fiscal 2011, we discontinued cash flow hedge accounting on a number ofgrain contracts associated with our hog farm operation in Oklahoma, which was sold in January 2011 (fiscal2011), because it was probable that the original forecasted transactions were no longer expected to occur. Theimpact of these contracts on our results of operations was immaterial.
86
As of May 1, 2011, there were deferred net gains of $48.1 million, net of tax of $31.0 million, in accumulatedother comprehensive loss. We expect to reclassify $54.9 million ($33.5 million net of tax) of the deferred netgains on closed commodity contracts into earnings in fiscal 2012. We are unable to estimate the gains or losses tobe reclassified into earnings in fiscal 2012 related to open contracts as their values are subject to change.
Fair Value Hedges
We enter into derivative instruments (primarily futures contracts) that are designed to hedge changes in the fairvalue of live hog inventories and firm commitments to buy grains. We also enter into interest rate swaps tomanage interest rate risk associated with our fixed rate borrowings. When fair value hedge accounting is applied,derivative gains and losses are recognized in earnings currently along with the change in fair value of the hedgeditem attributable to the risk being hedged. The gains or losses on the derivative instruments and the offsettinglosses or gains on the related hedged items are recorded in cost of sales for commodity contracts, interest expensefor interest rate contracts and selling, general and administrative expenses for foreign exchange contracts.
During fiscal 2011, the range of notional volumes associated with open derivative instruments designated in fairvalue hedging relationships was as follows:
Minimum Maximum Metric
Commodities:Lean hogs . . . . . . . . . . . . . . . . . . . . . . . . . . . . . . . . . 37,560,000 431,440,000 PoundsCorn . . . . . . . . . . . . . . . . . . . . . . . . . . . . . . . . . . . . . . 2,495,000 11,400,000 Bushels
The following table presents the effects on our consolidated statements of income of gains and losses onderivative instruments designated in fair value hedging relationships and the related hedged items for the fiscalyears indicated:
Gain (Loss) Recognized in Earningson Derivative
Gain (Loss) Recognized in Earningson Related Hedged Item
2011 2010 2009 2011 2010 2009
(in millions) (in millions)
Commodity contracts . . . . . . . . . . . . . . . . . . . $ (4.2) $ (36.2) $ 12.8 $ 5.4 $ 32.4 $ (14.0)Interest rate contracts . . . . . . . . . . . . . . . . . . . — 0.6 0.7 — (0.6) (0.7)Foreign exchange contracts . . . . . . . . . . . . . . . — 3.4 — — (1.5) —
Total . . . . . . . . . . . . . . . . . . . . . . . . . . . . $ (4.2) $ (32.2) $ 13.5 $ 5.4 $ 30.3 $ (14.7)
We recognized losses of $24.9 million and $3.1 million for fiscal 2011 and fiscal 2010, respectively, and gains of$5.5 million for fiscal 2009 on closed commodity derivative contracts as the underlying cash transactionsaffected earnings.
For fair value hedges of hog inventory, we elect to exclude from the assessment of effectiveness differencesbetween the spot and futures prices. These differences are recorded directly into earnings as they occur. Thesedifferences resulted in a gain of $0.2 million in fiscal 2011 and a loss of $4.4 million in fiscal 2010. There wereno fair value hedges of hog inventory in fiscal 2009.
Mark-to-Market Method
Derivative instruments that are not designated as a hedge, have been de-designated from a hedging relationship,or do not meet the criteria for hedge accounting, are marked-to-market with the unrealized gains and lossestogether with actual realized gains and losses from closed contracts being recognized in current period earnings.Under the mark-to-market method, gains and losses are recorded in cost of sales for commodity contracts, andselling, general and administrative expenses for interest rate contracts and foreign currency contracts.
87

During fiscal 2011, the range of notional volumes associated with open derivative instruments using the“mark-to-market” method was as follows:
Minimum Maximum Metric
Commodities:Lean hogs . . . . . . . . . . . . . . . . . . . . . . . . . . . . . . . . . . . . . . . . . 81,440,000 1,011,960,000 PoundsCorn . . . . . . . . . . . . . . . . . . . . . . . . . . . . . . . . . . . . . . . . . . . . . . 10,000 45,643,300 BushelsSoybean meal . . . . . . . . . . . . . . . . . . . . . . . . . . . . . . . . . . . . . . 12,050 335,834 TonsSoybeans . . . . . . . . . . . . . . . . . . . . . . . . . . . . . . . . . . . . . . . . . . 115,000 890,000 BushelsWheat . . . . . . . . . . . . . . . . . . . . . . . . . . . . . . . . . . . . . . . . . . . . — 3,415,000 BushelsLive cattle . . . . . . . . . . . . . . . . . . . . . . . . . . . . . . . . . . . . . . . . . — 1,400,000 PoundsPork bellies . . . . . . . . . . . . . . . . . . . . . . . . . . . . . . . . . . . . . . . . — 2,040,000 PoundsNatural gas . . . . . . . . . . . . . . . . . . . . . . . . . . . . . . . . . . . . . . . . . 2,040,000 3,780,000 Million BTU
Foreign currency(1) . . . . . . . . . . . . . . . . . . . . . . . . . . . . . . . . . . . . . . 48,660,934 143,743,810 U.S. Dollars
(1) Amounts represent the U.S. dollar equivalent of various foreign currency contracts.
The following table presents the amount of gains (losses) recognized in the consolidated statements of income onderivative instruments using the “mark-to-market” method by type of derivative contract for the fiscal yearsindicated:
Fiscal Years
2011 2010 2009
(in millions)
Commodity contracts . . . . . . . . . . . . . . . . . . . . . . . . . . . . . . . . . . . . . . . . . . . . . . . . . . . $63.4 $ (92.4) $104.0Interest rate contracts . . . . . . . . . . . . . . . . . . . . . . . . . . . . . . . . . . . . . . . . . . . . . . . . . . . — — 2.3Foreign exchange contracts . . . . . . . . . . . . . . . . . . . . . . . . . . . . . . . . . . . . . . . . . . . . . . . (9.0) (11.1) (3.1)
Total . . . . . . . . . . . . . . . . . . . . . . . . . . . . . . . . . . . . . . . . . . . . . . . . . . . . . . . . . . . . $54.4 $(103.5) $103.2
The table above reflects gains and losses from both open and closed contracts including, among other things,gains and losses related to contracts designed to hedge price movements that occur entirely within a fiscal yearThe table includes amounts for both realized and unrealized gains and losses. The table is not, therefore, a simplerepresentation of unrealized gains and losses recognized in the income statement during any period presented.
NOTE 7: INVESTMENTS
Investments consist of the following:
Equity Investment Segment % OwnedMay 1,2011
May 2,2010
(in millions)
Campofrío Food Group (CFG) . . . . . . . . . . . . . . . . . . . . International 37% $ 445.1 $ 417.3Mexican joint ventures . . . . . . . . . . . . . . . . . . . . . . . . . . International 50% 110.2 75.1Butterball(1) . . . . . . . . . . . . . . . . . . . . . . . . . . . . . . . . . . . Other — — 99.8All other equity method investments . . . . . . . . . . . . . . . Various Various 27.2 32.8
Total investments . . . . . . . . . . . . . . . . . . . . . . . . . . $ 582.5 $ 625.0
(1) In the third quarter of fiscal 2011, we completed the sale of Butterball. See Note 3—Impairment and Disposal of Long-lived Assets forfurther discussion.
88

Equity in (income) loss of affiliates consists of the following:
Fiscal Years
Equity Investment Segment 2011 2010 2009
(in millions)
CFG(1) . . . . . . . . . . . . . . . . . . . . . . . . . . . . . . . . . . . . . . . International $ (17.0) $ (4.5) $ 5.6Mexican joint ventures . . . . . . . . . . . . . . . . . . . . . . . . . . International (29.6) (13.2) 9.8Butterball(2) . . . . . . . . . . . . . . . . . . . . . . . . . . . . . . . . . . . Other (1.3) (18.8) 19.5Cattleco, LLC (Cattleco)(3) . . . . . . . . . . . . . . . . . . . . . . . Other — — 15.1All other equity method investments . . . . . . . . . . . . . . . Various (2.2) (2.1) 0.1
Equity in (income) loss of affiliates . . . . . . . . . . . . $ (50.1) $ (38.6) $ 50.1
(1) CFG prepares its financial statements in accordance with International Financial Reporting Standards. Our share of CFG’s results reflectsU.S. GAAP adjustments and thus, there may be differences between the amounts we report for CFG and the amounts reported by CFG.
(2) In the third quarter of fiscal 2011, we completed the sale of Butterball. See Note 3—Impairment and Disposal of Long-lived Assets forfurther discussion.
(3) In fiscal 2009, in conjunction with the sale of Smithfield Beef, we formed a 50/50 joint venture with CGC, named Cattleco, to sell theremaining live cattle from Five Rivers that were not sold to JBS. All of the remaining live cattle were sold before the end of fiscal 2009at market-based prices. See Note 3—Impairment and Disposal of Long-lived Assets for further discussion.
The combined summarized financial information for CFG consists of the following:
Fiscal Years
2011 2010 2009
(in millions)
Income statement information:Sales . . . . . . . . . . . . . . . . . . . . . . . . . . . . . . . . . . . . . . . . . . . . . . . . . . . . . . . $2,433.3 $2,593.8 $2,627.9Gross profit . . . . . . . . . . . . . . . . . . . . . . . . . . . . . . . . . . . . . . . . . . . . . . . . . . 423.0 559.6 537.2Net income (loss) . . . . . . . . . . . . . . . . . . . . . . . . . . . . . . . . . . . . . . . . . . . . . 46.1 12.9 (10.0)
May 1,2011
May 2,2010
(in millions)
Balance sheet information:Current assets . . . . . . . . . . . . . . . . . . . . . . . . . . . . . . . . . . . . . . . . . . . . . . . . $1,025.6 $ 882.9Long-term assets . . . . . . . . . . . . . . . . . . . . . . . . . . . . . . . . . . . . . . . . . . . . . . 1,856.1 1,659.1Current liabilities . . . . . . . . . . . . . . . . . . . . . . . . . . . . . . . . . . . . . . . . . . . . . . 874.1 683.1Long-term liabilities . . . . . . . . . . . . . . . . . . . . . . . . . . . . . . . . . . . . . . . . . . . 990.9 1,015.6
CFG
In fiscal 2009, we sold Groupe Smithfield S.L., a 50/50 joint venture, to Campofrío Alimentación, S.A.(Campofrío) in exchange for shares of Campofrío common stock, creating a new merged company known asCFG. The merger created the largest pan-European company in the packaged meats sector and one of the fivelargest worldwide. The sale of Groupe Smithfield resulted in a pre-tax gain of $56.0 million, which was recordedin other (loss) income in the consolidated statement of income. We valued the shares of Campofrío stockreceived in connection with the sale of our interest in Groupe Smithfield based on the last quoted market price ofthe stock on the closing date of the transaction.
As of May 1, 2011, we held 37,811,302 shares of CFG common stock. The stock was valued at €9.22 per share(approximately $13.65 per share) on the close of the last day of trading before the end of fiscal 2011. Beginningin the third quarter of fiscal 2009 and throughout much of fiscal 2011 and fiscal 2010, the carrying amount of ourinvestment in CFG exceeded the market value of the underlying securities. We have analyzed our investment inCFG for impairment and have determined that the fair value of our investment exceeded the carrying amount as
89
of May 1, 2011. We estimate the fair value of our investment based on a variety of information including marketmultiples for comparable businesses, expectations about future cash flows of CFG, the market price of theunderlying securities and a premium applied for our significant noncontrolling interest. The premium is based onthe premise that we are the single largest shareholder of CFG, hold positions on CFG’s Board of Directors andhave significant influence over the strategic and operational decisions made by CFG. Based on our assessment,no impairment existed as of May 1, 2011.
In fiscal 2010, as part of a debt restructuring, CFG redeemed certain of its debt instruments and, as a result, werecorded $10.4 million of charges in equity in (income) loss of affiliates.
Farasia Corporation (Farasia)
In November 2009 (fiscal 2010), we completed the sale of our investment in Farasia, a 50/50 Chinese jointventure formed in 2001, for RMB 97.0 million ($14.2 million at the time of the transaction). We recorded, inselling, general and administrative expenses, a $4.5 million pre-tax gain on the sale of this investment.
NOTE 8: ACCRUED EXPENSES AND OTHER CURRENT LIABILITIES
Accrued expenses and other current liabilities consist of the following:
May 1,2011
May 2,2010
(in millions)
Payroll and related benefits . . . . . . . . . . . . . . . . . . . . . . . . . . . . . . . . . . . . . . . . . . . . . . . $ 246.9 $ 192.4Derivative instruments . . . . . . . . . . . . . . . . . . . . . . . . . . . . . . . . . . . . . . . . . . . . . . . . . . 17.0 119.7Self-insurance reserves . . . . . . . . . . . . . . . . . . . . . . . . . . . . . . . . . . . . . . . . . . . . . . . . . . 53.9 60.3Accrued interest . . . . . . . . . . . . . . . . . . . . . . . . . . . . . . . . . . . . . . . . . . . . . . . . . . . . . . . . 49.0 70.4Other . . . . . . . . . . . . . . . . . . . . . . . . . . . . . . . . . . . . . . . . . . . . . . . . . . . . . . . . . . . . . . . . 283.0 275.6
Total accrued expenses and other current liabilities . . . . . . . . . . . . . . . . . . . . . . . . $ 649.8 $ 718.4
NOTE 9: DEBT
Long-term debt consists of the following:
May 1,2011
May 2,2010
(in millions)
10% senior secured notes, due July 2014, including unamortized discounts of $11.2million and $20.6 million . . . . . . . . . . . . . . . . . . . . . . . . . . . . . . . . . . . . . . . . . . . . . . $ 412.9 $ 604.4
10% senior secured notes, due July 2014, including unamortized premiums of $6.1million and $7.8 million . . . . . . . . . . . . . . . . . . . . . . . . . . . . . . . . . . . . . . . . . . . . . . . 231.1 232.8
7% senior unsecured notes, due August 2011, including unamortized premiums of$0.2 million and $2.3 million . . . . . . . . . . . . . . . . . . . . . . . . . . . . . . . . . . . . . . . . . . . 78.0 602.3
7.75% senior unsecured notes, due July 2017 . . . . . . . . . . . . . . . . . . . . . . . . . . . . . . . . . 500.0 500.04% senior unsecured Convertible Notes, due June 2013, including unamortized
discounts of $47.3 million and $65.9 million . . . . . . . . . . . . . . . . . . . . . . . . . . . . . . . 352.7 334.17.75% senior unsecured notes, due May 2013 . . . . . . . . . . . . . . . . . . . . . . . . . . . . . . . . 160.0 350.0Floating rate senior secured term loan, due August 2013 . . . . . . . . . . . . . . . . . . . . . . . . 200.0 200.0Various, interest rates from 0% to 9%, due May 2011 through March 2017 . . . . . . . . . 160.0 139.4
Total debt . . . . . . . . . . . . . . . . . . . . . . . . . . . . . . . . . . . . . . . . . . . . . . . . . . . . . . . . . 2,094.7 2,963.0Current portion . . . . . . . . . . . . . . . . . . . . . . . . . . . . . . . . . . . . . . . . . . . . . . . . . . . . . . . . (143.2) (72.2)
Total long-term debt . . . . . . . . . . . . . . . . . . . . . . . . . . . . . . . . . . . . . . . . . . . . . . . . $ 1,951.5 $ 2,890.8
90
Scheduled maturities of long-term debt are as follows:
Fiscal Year (in millions)
2012 . . . . . . . . . . . . . . . . . . . . . . . . . . . . . . . . . . . . . . . . . . . . . . . . . . . . . . . . . . . . . . . . . . . . . . . . . . . . . $ 143.22013 . . . . . . . . . . . . . . . . . . . . . . . . . . . . . . . . . . . . . . . . . . . . . . . . . . . . . . . . . . . . . . . . . . . . . . . . . . . . . 111.92014 . . . . . . . . . . . . . . . . . . . . . . . . . . . . . . . . . . . . . . . . . . . . . . . . . . . . . . . . . . . . . . . . . . . . . . . . . . . . . 666.72015 . . . . . . . . . . . . . . . . . . . . . . . . . . . . . . . . . . . . . . . . . . . . . . . . . . . . . . . . . . . . . . . . . . . . . . . . . . . . . 647.92016 . . . . . . . . . . . . . . . . . . . . . . . . . . . . . . . . . . . . . . . . . . . . . . . . . . . . . . . . . . . . . . . . . . . . . . . . . . . . . 17.2Thereafter . . . . . . . . . . . . . . . . . . . . . . . . . . . . . . . . . . . . . . . . . . . . . . . . . . . . . . . . . . . . . . . . . . . . . . . . 507.8
Total debt . . . . . . . . . . . . . . . . . . . . . . . . . . . . . . . . . . . . . . . . . . . . . . . . . . . . . . . . . . . . . . . . . . . . $2,094.7
Debt Extinguishments
In August 2010 (fiscal 2011), we began repurchasing a portion of our senior unsecured notes due August 2011(2011 Notes). We paid $210.7 million to repurchase notes with a face value of $203.8 million. We recognized aloss of $7.3 million in the second quarter of fiscal 2011, including the write-off of related unamortized debt costs,as a result of these debt repurchases.
In November 2010 (fiscal 2011), we commenced an offer to purchase for cash (the November Tender Offer) upto an aggregate of $337.0 million principal amount of our outstanding 2011 Notes. The November Tender Offerexpired on December 1, 2010. As a result of the November Tender Offer, we paid $332.4 million to repurchasenotes with a face value of $318.4 million and recognized a loss of $14.1 million in the third quarter of fiscal2011, including the write-off of related unamortized premiums and debt costs.
In January 2011 (fiscal 2011), we commenced a Dutch auction cash tender offer to purchase for $450.0 million incash (the January Tender Offer) the maximum aggregate principal amount of our outstanding senior unsecurednotes due May 2013 (2013 Notes) and our outstanding senior secured notes due July 2014 (2014 Notes). TheJanuary Tender Offer expired on February 9, 2011. As a result of the January Tender Offer, we paid $450.0million to repurchase 2013 Notes and 2014 Notes with face values of $190.0 million and $200.9 million,respectively, and recognized a loss of $71.1 million in the fourth quarter of fiscal 2011, including the write-off ofrelated unamortized discounts and debt costs.
In fiscal 2010, we recognized $11.0 million of losses on debt extinguishment related to the termination of variousdebt agreements, including our then existing $1.3 billion secured revolving credit agreement (the U.S. CreditFacility) and €300 million European secured revolving credit facility.
In fiscal 2009, we recognized a gain of $7.5 million on the early redemption of $93.7 million of our 8% seniorunsecured notes due in October 2009 for $86.2 million.
2014 Notes
In July 2009 (fiscal 2010), we issued $625 million aggregate principal amount of 10% senior secured notes at aprice equal to 96.201% of their face value. In August 2009 (fiscal 2010), we issued an additional $225 millionaggregate principal amount of 10% senior secured notes at a price equal to 104% of their face value, plus accruedinterest from July 2, 2009 to August 14, 2009. Collectively, these notes, which mature in July 2014 are referredto as the “2014 Notes”.
The 2014 Notes are guaranteed by substantially all of our U.S. subsidiaries. The 2014 Notes are secured by first-priority liens, subject to permitted liens and exceptions for excluded assets, in substantially all of the guarantors’
91

real property, fixtures and equipment (collectively, the Non-ABL Collateral) and, as of June 9, 2011, by second-priority liens on certain personal property, including cash and cash equivalents, deposit accounts, inventory,intellectual property, and certain equity interests (the Inventory Revolver Collateral). See Note 21—SubsequentEvents for further information on the Inventory Revolver.
The 2014 Notes will rank equally in right of payment to all of our existing and future senior debt and senior inright of payment to all of our existing and future subordinated debt. The guarantees will rank equally in right ofpayment with all of the guarantors’ existing and future senior debt and senior in right of payment to all of theguarantors’ existing and future subordinated debt. In addition, the 2014 Notes are structurally subordinated to theliabilities of our non-guarantor subsidiaries.
Credit Facilities
In July 2009 (fiscal 2010), we entered into an asset-based revolving credit agreement totaling $1.0 billion thatsupported short-term funding needs and letters of credit (the ABL Credit Facility), which, along with the 2014Notes, replaced the U.S. Credit Facility, which was scheduled to expire in August 2010 (fiscal 2011).
Availability under the ABL Credit Facility was based on a percentage of certain eligible accounts receivable andeligible inventory and was reduced by certain reserves. After reducing the amount available by outstandingletters of credit issued under the ABL Credit Facility of $144.1 million, the amount available for borrowing, as ofMay 1, 2011, was $855.9 million, of which, we had no outstanding borrowings.
In June 2011 (fiscal 2012), we refinanced the ABL Credit Facility. See Note 21—Subsequent Events for furtherinformation on the refinancing.
As of May 1, 2011, we had aggregate credit facilities and credit lines totaling $1,125.8 million. Our unusedcapacity under these credit facilities and credit lines was $904.8 million. These facilities and lines are generallyat prevailing market rates. We pay commitment fees on the unused portion of the facilities.
Average borrowings under credit facilities and credit lines were $81.6 million, $163.7 million and $936.4 millionat average interest rates of 4.8%, 4.9% and 4.5% during fiscal 2011, 2010 and 2009, respectively. Maximumborrowings were $256.9 million, $609.3 million and $1.5 billion in fiscal 2011, 2010 and 2009, respectively.Total outstanding borrowings were $76.9 million as of May 1, 2011 and $45.3 million as of May 2, 2010 withaverage interest rates of 5.2% and 5.3%, respectively.
Rabobank Term Loan
In July 2009 (fiscal 2010), we entered into a $200.0 million term loan due August 29, 2013 (the Rabobank TermLoan), which replaced our then existing $200.0 million term loan that was scheduled to mature in August 2011.
In June 2011 (fiscal 2012), we refinanced the Rabobank Term Loan. See Note 21—Subsequent Events for furtherinformation on the refinancing.
Convertible Notes
In July 2008 (fiscal 2009), we issued $400.0 million aggregate principal amount of 4% convertible senior notesdue June 30, 2013 (the Convertible Notes) in a registered offering. The Convertible Notes are senior unsecuredobligations. The Convertible Notes are payable with cash and, at certain times, are convertible into shares of ourcommon stock based on an initial conversion rate, subject to adjustment, of 44.082 shares per $1,000 principalamount of Convertible Notes (which represents an initial conversion price of approximately $22.68 per share).Upon conversion, a holder will receive cash up to the principal amount of the Convertible Notes and shares ofour common stock for the remainder, if any, of the conversion obligation.
92
Prior to April 1, 2013, holders may convert their notes into cash and shares of our common stock, if any, at theapplicable conversion rate under the following circumstances:
• during any fiscal quarter if the last reported sale price of our common stock is greater than or equal to120% of the applicable conversion price for at least 20 trading days during the period of 30 consecutivetrading days ending on the last trading day of the preceding fiscal quarter;
• during the five business-day period after any ten consecutive trading-day period in which the trading priceper $1,000 principal amount of notes was less than 98% of the last reported sale price of our commonstock multiplied by the applicable conversion rate; or
• upon the occurrence of specified corporate transactions.
On or after April 1, 2013, holders may convert their Convertible Notes at any time prior to the close of businesson the third scheduled trading day immediately preceding the maturity date, regardless of the foregoingcircumstances.
The Convertible Notes were originally accounted for as a combined debt instrument as the conversion feature didnot meet the requirements to be accounted for separately as a derivative financial instrument. In May 2008, theFASB issued new accounting guidance specifying that issuers of convertible debt instruments that may be settledin cash upon conversion (including partial cash settlement) should separately account for the liability and equitycomponents in a manner that will reflect the entity’s nonconvertible debt borrowing rate when interest cost isrecognized in subsequent periods. The amount allocated to the equity component represents a discount to the debtrecorded. This discount represents the amount of additional interest expense to be recognized using the effectiveinterest method over the life of the debt, to accrete the debt to the principal amount due at maturity. We adoptedthe new accounting guidance beginning in the first quarter of fiscal 2010 (beginning May 4, 2009). On the date ofissuance of the Convertible Notes, our nonconvertible debt borrowing rate was determined to be 10.2%. Based onthat rate of interest, the liability component and equity component of the Convertible Notes were determined tobe $304.2 million and $95.8 million, respectively.
In connection with the issuance of the Convertible Notes, we entered into separate convertible note hedgetransactions with respect to our common stock to reduce potential economic dilution upon conversion of theConvertible Notes, and separate warrant transactions (collectively referred to as the Call Spread Transactions).We purchased call options that permit us to acquire up to approximately 17.6 million shares of our commonstock, subject to adjustment, which is the number of shares initially issuable upon conversion of the ConvertibleNotes. In addition, we sold warrants permitting the purchasers to acquire up to approximately 17.6 million sharesof our common stock, subject to adjustment. See Note 14—Equity for more information on the Call SpreadTransactions.
NOTE 10: LEASE OBLIGATIONS, COMMITMENTS AND GUARANTEES
We lease facilities and equipment under non-cancelable operating leases. The terms of each lease agreement varyand may contain renewal or purchase options. Rental payments under operating leases are charged to expense onthe straight-line basis over the period of the lease. Rental expense under operating leases of real estate,machinery, vehicles and other equipment was $42.3 million, $49.3 million and $50.3 million in fiscal 2011, 2010and 2009, respectively.
93

Future rental commitments under non-cancelable operating leases as of May 1, 2011 are as follows:
Fiscal Year (in millions)
2012 . . . . . . . . . . . . . . . . . . . . . . . . . . . . . . . . . . . . . . . . . . . . . . . . . . . . . . . . . . . . . . . . . . . . . . . . . . . . . $ 35.92013 . . . . . . . . . . . . . . . . . . . . . . . . . . . . . . . . . . . . . . . . . . . . . . . . . . . . . . . . . . . . . . . . . . . . . . . . . . . . . 29.42014 . . . . . . . . . . . . . . . . . . . . . . . . . . . . . . . . . . . . . . . . . . . . . . . . . . . . . . . . . . . . . . . . . . . . . . . . . . . . . 23.82015 . . . . . . . . . . . . . . . . . . . . . . . . . . . . . . . . . . . . . . . . . . . . . . . . . . . . . . . . . . . . . . . . . . . . . . . . . . . . . 16.62016 . . . . . . . . . . . . . . . . . . . . . . . . . . . . . . . . . . . . . . . . . . . . . . . . . . . . . . . . . . . . . . . . . . . . . . . . . . . . . 12.4Thereafter . . . . . . . . . . . . . . . . . . . . . . . . . . . . . . . . . . . . . . . . . . . . . . . . . . . . . . . . . . . . . . . . . . . . . . . . 37.2
Total . . . . . . . . . . . . . . . . . . . . . . . . . . . . . . . . . . . . . . . . . . . . . . . . . . . . . . . . . . . . . . . . . . . . . . . . $155.3
As of May 1, 2011, future minimum lease payments under capital leases were approximately $29.9 million. Thepresent value of the future minimum lease payments was $27.6 million. The long-term portion of capital leaseobligations was $27.1 million and $27.6 million as of May 1, 2011 and May 2, 2010, respectively, and thecurrent portion was $0.5 million and $0.6 million as of May 1, 2011 and May 2, 2010, respectively.
We have agreements, expiring through fiscal 2013, to use cold storage warehouses owned by partnerships, ofwhich we are 50% partners. We have agreed to pay prevailing competitive rates for use of the facilities, subjectto aggregate guaranteed minimum annual fees. In fiscal 2011, 2010 and 2009, we paid $18.2 million, $19.7million and $18.7 million, respectively, in fees for use of the facilities. We had investments in the partnerships of$2.3 million as of May 1, 2011, and $2.2 million as of May 2, 2010, respectively.
We have purchase commitments with certain livestock producers that obligate us to purchase all the livestockthat these producers deliver. Other arrangements obligate us to purchase a fixed amount of livestock. We also useindependent farmers and their facilities to raise hogs produced from our breeding stock in exchange for aperformance-based service fee payable upon delivery. We estimate the future obligations under thesecommitments based on available commodity livestock futures prices and internal projections about future hogprices, expected quantities delivered and anticipated performance. Our estimated future obligations under thesecommitments are as follows:
Fiscal Year (in millions)
2012 . . . . . . . . . . . . . . . . . . . . . . . . . . . . . . . . . . . . . . . . . . . . . . . . . . . . . . . . . . . . . . . . . . . . . . . . . . . . . $1,939.02013 . . . . . . . . . . . . . . . . . . . . . . . . . . . . . . . . . . . . . . . . . . . . . . . . . . . . . . . . . . . . . . . . . . . . . . . . . . . . . 1,136.12014 . . . . . . . . . . . . . . . . . . . . . . . . . . . . . . . . . . . . . . . . . . . . . . . . . . . . . . . . . . . . . . . . . . . . . . . . . . . . . 957.22015 . . . . . . . . . . . . . . . . . . . . . . . . . . . . . . . . . . . . . . . . . . . . . . . . . . . . . . . . . . . . . . . . . . . . . . . . . . . . . 847.42016 . . . . . . . . . . . . . . . . . . . . . . . . . . . . . . . . . . . . . . . . . . . . . . . . . . . . . . . . . . . . . . . . . . . . . . . . . . . . . 733.3
As of May 1, 2011, we were also committed to purchase approximately $340.8 million under forward graincontracts payable in fiscal 2012.
As of May 1, 2011, we had total estimated remaining capital expenditures of $136.8 million on approvedprojects. These projects are expected to be funded over the next several years with cash flows from operationsand borrowings under credit facilities.
As part of our business, we are a party to various financial guarantees and other commitments as describedbelow. These arrangements involve elements of performance and credit risk that are not included in theconsolidated balance sheets as of May 1, 2011. We could become liable in connection with these obligationsdepending on the performance of the guaranteed party or the occurrence of future events that we are unable topredict. If we consider it probable that we will become responsible for an obligation, we will record the liabilityon our consolidated balance sheet.
94

We (together with our joint venture partners) guarantee financial obligations of certain unconsolidated jointventures. The financial obligations are: up to $87.0 million of debt borrowed by Agroindustrial del Noroeste(Norson), of which$58.0 million was outstanding as of May 1, 2011, and up to $3.5 million of liabilities withrespect to currency swaps executed by another of our unconsolidated Mexican joint ventures, Granjas Carroll deMexico. The covenants in the guarantee relating to Norson’s debt incorporate our covenants under the ABLCredit Facility. In addition, we continue to guarantee $12.4 million of leases that were transferred to JBS inconnection with the sale of Smithfield Beef. Some of these lease guarantees will be released in the near futureand others will remain in place until the leases expires in February 2022.
NOTE 11: INCOME TAXES
Income tax expense (benefit) consists of the following:
Fiscal Years
2011 2010 2009
(in millions)
Current income tax (benefit) expense:Federal . . . . . . . . . . . . . . . . . . . . . . . . . . . . . . . . . . . . . . . . . . . . . . . . $ 57.6 $ (150.2) $ (45.1)State . . . . . . . . . . . . . . . . . . . . . . . . . . . . . . . . . . . . . . . . . . . . . . . . . . 17.2 2.5 2.0Foreign . . . . . . . . . . . . . . . . . . . . . . . . . . . . . . . . . . . . . . . . . . . . . . . 3.1 (0.8) 10.4
77.9 (148.5) (32.7)
Deferred income tax (benefit) expense:Federal . . . . . . . . . . . . . . . . . . . . . . . . . . . . . . . . . . . . . . . . . . . . . . . . 128.3 55.0 (78.1)State . . . . . . . . . . . . . . . . . . . . . . . . . . . . . . . . . . . . . . . . . . . . . . . . . . 24.2 (23.1) (17.0)Foreign . . . . . . . . . . . . . . . . . . . . . . . . . . . . . . . . . . . . . . . . . . . . . . . 5.7 3.4 (3.5)
158.2 35.3 (98.6)
Total income tax (benefit) expense . . . . . . . . . . . . . . . . . . . . . . $ 236.1 $ (113.2) $ (131.3)
A reconciliation of taxes computed at the federal statutory rate to the provision for income taxes is as follows:
Fiscal Years
2011 2010 2009
Federal income taxes at statutory rate . . . . . . . . . . . . . . . . . . . . . . . . . . . . 35.0% 35.0% 35.0%State income taxes, net of federal tax benefit . . . . . . . . . . . . . . . . . . . . . . 3.4 6.5 4.5Foreign income taxes . . . . . . . . . . . . . . . . . . . . . . . . . . . . . . . . . . . . . . . . (1.2) 9.6 8.7Groupe Smithfield / Campofrío merger . . . . . . . . . . . . . . . . . . . . . . . . . . — — (7.2)Net change in valuation allowance . . . . . . . . . . . . . . . . . . . . . . . . . . . . . . (3.4) (0.4) (4.9)Tax credits . . . . . . . . . . . . . . . . . . . . . . . . . . . . . . . . . . . . . . . . . . . . . . . . . (1.1) 2.3 2.5Manufacturer’s deduction . . . . . . . . . . . . . . . . . . . . . . . . . . . . . . . . . . . . . (1.8) — —Impact of non-deductible goodwill . . . . . . . . . . . . . . . . . . . . . . . . . . . . . . 2.0 1.0 —Other . . . . . . . . . . . . . . . . . . . . . . . . . . . . . . . . . . . . . . . . . . . . . . . . . . . . . (1.7) (1.3) (4.2)
Effective tax rate . . . . . . . . . . . . . . . . . . . . . . . . . . . . . . . . . . . . . . . . 31.2% 52.7% 34.4%
We had income taxes payable of $18.8 million as of May 1, 2011 and income taxes receivable of $103.6 millionas of May 2, 2010.
95
The tax effects of temporary differences consist of the following:
May 1,2011
May 2,2010
(in millions)
Deferred tax assets:Pension liabilities . . . . . . . . . . . . . . . . . . . . . . . . . . . . . . . . . . . . . . . . . . . . . . . . . . . . . . . . . $138.6 $175.3Tax credits, carryforwards and net operating losses . . . . . . . . . . . . . . . . . . . . . . . . . . . . . . . 96.8 141.2Accrued expenses . . . . . . . . . . . . . . . . . . . . . . . . . . . . . . . . . . . . . . . . . . . . . . . . . . . . . . . . . 41.7 48.3Derivatives . . . . . . . . . . . . . . . . . . . . . . . . . . . . . . . . . . . . . . . . . . . . . . . . . . . . . . . . . . . . . . — 52.8Employee benefits . . . . . . . . . . . . . . . . . . . . . . . . . . . . . . . . . . . . . . . . . . . . . . . . . . . . . . . . . 11.1 11.1Other . . . . . . . . . . . . . . . . . . . . . . . . . . . . . . . . . . . . . . . . . . . . . . . . . . . . . . . . . . . . . . . . . . . 39.6 45.3
327.8 474.0Valuation allowance . . . . . . . . . . . . . . . . . . . . . . . . . . . . . . . . . . . . . . . . . . . . . . . . . . . . . . . (66.8) (91.5)
Total deferred tax assets . . . . . . . . . . . . . . . . . . . . . . . . . . . . . . . . . . . . . . . . . . . . . . . . $261.0 $382.5
Deferred tax liabilities:Property, plant and equipment . . . . . . . . . . . . . . . . . . . . . . . . . . . . . . . . . . . . . . . . . . . . . . . $337.4 $267.5Intangible assets . . . . . . . . . . . . . . . . . . . . . . . . . . . . . . . . . . . . . . . . . . . . . . . . . . . . . . . . . . 108.5 98.2Derivatives . . . . . . . . . . . . . . . . . . . . . . . . . . . . . . . . . . . . . . . . . . . . . . . . . . . . . . . . . . . . . . 44.7 —Investments in subsidiaries . . . . . . . . . . . . . . . . . . . . . . . . . . . . . . . . . . . . . . . . . . . . . . . . . . 53.5 59.6
Total deferred tax liabilities . . . . . . . . . . . . . . . . . . . . . . . . . . . . . . . . . . . . . . . . . . . . . $544.1 $425.3
The following table presents the classification of deferred taxes in our balance sheets as of May 1, 2011 andMay 2, 2010:
May 1,2011
May 2,2010
(in millions)
Other current assets . . . . . . . . . . . . . . . . . . . . . . . . . . . . . . . . . . . . . . . . . . . . . . . . . . . . . . . . . . . . $ 39.3 $ 96.5Other assets . . . . . . . . . . . . . . . . . . . . . . . . . . . . . . . . . . . . . . . . . . . . . . . . . . . . . . . . . . . . . . . . . . 5.6 5.2Accrued expenses and other current liabilities . . . . . . . . . . . . . . . . . . . . . . . . . . . . . . . . . . . . . . . 3.9 —Other liabilities . . . . . . . . . . . . . . . . . . . . . . . . . . . . . . . . . . . . . . . . . . . . . . . . . . . . . . . . . . . . . . . 324.1 144.5
Management makes an assessment to determine if its deferred tax assets are more likely than not to be realized.Valuation allowances are established in the event that management believes the related tax benefits will not berealized. The valuation allowance primarily relates to state credits, state net operating loss carryforwards andlosses in foreign jurisdictions for which no tax benefit was recognized. During fiscal 2011, the valuationallowance decreased by $24.7 million resulting primarily from currency translation, release of a valuationallowance on foreign tax credits, lapse of statute of limitations and deferred tax adjustments with an immaterialamount impacting the effective tax rate.
The tax credits, carry-forwards and net operating losses expire from fiscal 2012 to 2031.
As a result of the merger of Groupe Smithfield with and into Campofrío during fiscal 2009, we were required toprovide additional deferred taxes on the earnings of Groupe Smithfield that were previously deferred becausethey were considered permanently reinvested, as well as on inherent gains related to the pre-merger holdings ofGroupe Smithfield and Campofrío. There were foreign subsidiary net earnings that were considered permanentlyreinvested of $97.8 million and $19.5 million as of May 1, 2011 and May 2, 2010, respectively. It is notreasonably determinable as to the amount of deferred tax liability that would need to be provided if such earningswere not reinvested.
96
A reconciliation of the beginning and ending liability for unrecognized tax benefits is as follows:
(in millions)
Balance as of May 3, 2009 . . . . . . . . . . . . . . . . . . . . . . . . . . . . . . . . . . . . . . . . . . . . . . . . . . . . . . . . . . . $40.5Additions for tax positions taken in the current year . . . . . . . . . . . . . . . . . . . . . . . . . . . . . . . . . . . 3.3Additions for tax positions taken in prior years . . . . . . . . . . . . . . . . . . . . . . . . . . . . . . . . . . . . . . . 4.0Reductions for tax positions taken in prior years . . . . . . . . . . . . . . . . . . . . . . . . . . . . . . . . . . . . . . (2.1)Settlements with taxing authorities . . . . . . . . . . . . . . . . . . . . . . . . . . . . . . . . . . . . . . . . . . . . . . . . . (1.6)Lapse of statute of limitations . . . . . . . . . . . . . . . . . . . . . . . . . . . . . . . . . . . . . . . . . . . . . . . . . . . . . (0.9)
Balance as of May 2, 2010 . . . . . . . . . . . . . . . . . . . . . . . . . . . . . . . . . . . . . . . . . . . . . . . . . . . . . . . . . . . 43.2
Additions for tax positions taken in the current year . . . . . . . . . . . . . . . . . . . . . . . . . . . . . . . . . . . 4.9Additions for tax positions taken in prior years . . . . . . . . . . . . . . . . . . . . . . . . . . . . . . . . . . . . . . . 0.9Settlements with taxing authorities . . . . . . . . . . . . . . . . . . . . . . . . . . . . . . . . . . . . . . . . . . . . . . . . . (7.3)Lapse of statute of limitations . . . . . . . . . . . . . . . . . . . . . . . . . . . . . . . . . . . . . . . . . . . . . . . . . . . . . (8.1)
Balance as of May 1, 2011 . . . . . . . . . . . . . . . . . . . . . . . . . . . . . . . . . . . . . . . . . . . . . . . . . . . . . . . . . . . $33.6
We operate in multiple taxing jurisdictions, both within the U.S. and outside of the U.S., and are subject toexamination from various tax authorities. The liability for unrecognized tax benefits included $10.4 million and$10.5 million of accrued interest as of May 1, 2011 and May 2, 2010, respectively. We recognized $0.1 millionof net interest income and $0.4 million and $0.5 million of net interest expense in income tax expense (benefit)during fiscal 2011, 2010 and 2009, respectively. The liability for unrecognized tax benefits included $32.6million as of May 1, 2011 and $32.9 million as of May 2, 2010, that if recognized, would impact the effective taxrate.
We are currently being audited in several tax jurisdictions and remain subject to examination until the statute oflimitations expires for the respective tax jurisdiction. Within specific countries, we may be subject to audit byvarious tax authorities, or subsidiaries operating within the country may be subject to different statute oflimitations expiration dates. We have concluded all U.S. federal income tax matters through fiscal 2005. We arecurrently in appeals for the 2006 through 2010 tax years and under U.S federal examination for the 2011 tax year.
Based upon the expiration of statutes of limitations and/or the conclusion of tax examinations in severaljurisdictions as of May 1, 2011, we believe it is reasonably possible that the total amount of previouslyunrecognized tax benefits may decrease by up to $2.0 million within twelve months of May 1, 2011.
NOTE 12: PENSION AND OTHER RETIREMENT PLANS
We provide the majority of our U.S. employees with pension benefits. Salaried employees are provided benefitsbased on years of service and average salary levels. Hourly employees are provided benefits of stated amountsfor each year of service.
97

The following table presents a reconciliation of the pension benefit obligation, plan assets and the funded statusof these pension plans.
May 1,2011
May 2,2010
(in millions)
Change in benefit obligation:Benefit obligation at beginning of year . . . . . . . . . . . . . . . . . . . . . . . . . . . . . . . . . . . . . . $1,283.9 $ 926.4Service cost . . . . . . . . . . . . . . . . . . . . . . . . . . . . . . . . . . . . . . . . . . . . . . . . . . . . . . . . . . . 37.0 22.6Interest cost . . . . . . . . . . . . . . . . . . . . . . . . . . . . . . . . . . . . . . . . . . . . . . . . . . . . . . . . . . . 74.9 73.7Benefits paid . . . . . . . . . . . . . . . . . . . . . . . . . . . . . . . . . . . . . . . . . . . . . . . . . . . . . . . . . . (69.3) (64.2)Actuarial loss . . . . . . . . . . . . . . . . . . . . . . . . . . . . . . . . . . . . . . . . . . . . . . . . . . . . . . . . . . 1.0 325.4Other . . . . . . . . . . . . . . . . . . . . . . . . . . . . . . . . . . . . . . . . . . . . . . . . . . . . . . . . . . . . . . . . 2.4 —
Benefit obligation at end of year . . . . . . . . . . . . . . . . . . . . . . . . . . . . . . . . . . . . . . . 1,329.9 1,283.9
Change in plan assets:(1)
Fair value of plan assets at beginning of year . . . . . . . . . . . . . . . . . . . . . . . . . . . . . . . . . 788.7 586.2Actual return on plan assets . . . . . . . . . . . . . . . . . . . . . . . . . . . . . . . . . . . . . . . . . . . . . . 125.8 192.6Employer contributions . . . . . . . . . . . . . . . . . . . . . . . . . . . . . . . . . . . . . . . . . . . . . . . . . . 95.1 62.6Benefits paid . . . . . . . . . . . . . . . . . . . . . . . . . . . . . . . . . . . . . . . . . . . . . . . . . . . . . . . . . . (56.2) (52.7)Other . . . . . . . . . . . . . . . . . . . . . . . . . . . . . . . . . . . . . . . . . . . . . . . . . . . . . . . . . . . . . . . . 3.0 —
Fair value of plan assets at end of year . . . . . . . . . . . . . . . . . . . . . . . . . . . . . . . . . . 956.4 788.7
Funded status . . . . . . . . . . . . . . . . . . . . . . . . . . . . . . . . . . . . . . . . . . . . . . . . . . $ (373.5) $ (495.2)
Amounts recognized in the consolidated balance sheet:Net long-term pension liability . . . . . . . . . . . . . . . . . . . . . . . . . . . . . . . . . . . . . . . . . . . . $ (369.6) $ (482.5)Accrued expenses and other current liabilities . . . . . . . . . . . . . . . . . . . . . . . . . . . . . . . . (4.5) (12.7)Other assets . . . . . . . . . . . . . . . . . . . . . . . . . . . . . . . . . . . . . . . . . . . . . . . . . . . . . . . . . . . 0.6 —
Net amount recognized at end of year . . . . . . . . . . . . . . . . . . . . . . . . . . . . . . . . . . . $ (373.5) $ (495.2)
(1) Excludes the assets and related activity of our non-qualified defined benefit pension plans. The fair value of assets related to ournon-qualified plans was $117.7 million and $49.2 million as of May 1, 2011 and May 2, 2010 , respectively. We made cash contributionsof $33.4 million and $11.3 million in fiscal 2011 and fiscal 2010. In fiscal 2011, we also contributed company-owned life insurancepolicies with cash surrender values totaling $29.4 million on the date of contribution. Benefits paid for our non-qualified plans were$13.1 million and $11.5 million for fiscal 2011 and fiscal 2010, respectively.
The accumulated benefit obligation for all defined benefit pension plans was $1.3 billion and $1.2 billion as ofMay 1, 2011 and May 2, 2010, respectively. The accumulated benefit obligation for all of our defined benefitpension plans exceeded the fair value of plan assets for both periods presented.
The following table shows the pre-tax unrecognized items included as components of accumulated othercomprehensive loss related to our defined benefit pension plans for the periods indicated.
May 1,2011
May 2,2010
(in millions)
Unrecognized actuarial loss . . . . . . . . . . . . . . . . . . . . . . . . . . . . . . . . . . . . . . . . . . . . . . . . . . . . $(365.3) $(460.5)Unrecognized prior service credit . . . . . . . . . . . . . . . . . . . . . . . . . . . . . . . . . . . . . . . . . . . . . . . 7.2 7.6
We expect to recognize $23.2 million of the actuarial loss and prior service cost as net periodic pension cost infiscal 2012.
98

The following table presents the components of the net periodic pension costs for the periods indicated:
Fiscal Years
2011 2010 2009
(in millions)
Service cost . . . . . . . . . . . . . . . . . . . . . . . . . . . . . . . . . . . . . . . . . . . . . . . . . . . . . . . . . . . $ 37.0 $ 22.6 $ 25.5Interest cost . . . . . . . . . . . . . . . . . . . . . . . . . . . . . . . . . . . . . . . . . . . . . . . . . . . . . . . . . . . 74.9 73.7 68.6Expected return on plan assets . . . . . . . . . . . . . . . . . . . . . . . . . . . . . . . . . . . . . . . . . . . . . (63.9) (49.3) (69.7)Net amortization . . . . . . . . . . . . . . . . . . . . . . . . . . . . . . . . . . . . . . . . . . . . . . . . . . . . . . . . 34.0 20.3 6.4
Net periodic pension cost . . . . . . . . . . . . . . . . . . . . . . . . . . . . . . . . . . . . . . . . . . . . . $ 82.0 $ 67.3 $ 30.8
The following table shows our weighted-average assumptions for the periods indicated.
Fiscal Years
2011 2010 2009
Discount rate to determine net periodic benefit cost . . . . . . . . . . . . . . . . . . . . . . . . . . . . . . . . . 6.00% 8.25% 6.90%Discount rate to determine benefit obligation . . . . . . . . . . . . . . . . . . . . . . . . . . . . . . . . . . . . . . 5.85 6.00 8.25Expected long-term rate of return on plan assets . . . . . . . . . . . . . . . . . . . . . . . . . . . . . . . . . . . . 8.00 8.25 8.25Rate of compensation increase . . . . . . . . . . . . . . . . . . . . . . . . . . . . . . . . . . . . . . . . . . . . . . . . . . 4.00 4.00 4.00
We use an independent third-party actuary to assist in the determination of assumptions used and themeasurement of our pension obligation and related costs. We review and select the discount rate to be used inconnection with our pension obligation annually. In determining the discount rate, we use the yield on corporatebonds (rated AA or better) that coincides with the cash flows of the plans’ estimated benefit payouts. The modeluses a yield curve approach to discount each cash flow of the liability stream at an interest rate specificallyapplicable to the timing of each respective cash flow. Using imputed interest rates, the model sums the presentvalue of each cash flow stream to calculate an equivalent weighted average discount rate. We use this resultingweighted average discount rate to determine our final discount rate.
To determine the expected long-term return on plan assets, we consider the current and anticipated assetallocations, as well as historical and estimated returns on various categories of plan assets. Long-term trends areevaluated relative to market factors such as inflation, interest rates and fiscal and monetary polices in order toassess the capital market assumptions. Over the 5-year period ended May 1, 2011 and May 2, 2010, the averagerate of return on plan assets was approximately 3.87% and 2.87% percent, respectively. Actual results that differfrom our assumptions are accumulated and amortized over future periods and, therefore, affect expense in futureperiods.
Pension plan assets may be invested in cash and cash equivalents, equities, debt securities, insurance contractsand real estate. Our investment policy for the pension plans is to balance risk and return through a diversifiedportfolio of high-quality equity and fixed income securities. Equity targets for the pension plans are as indicatedin the following table. Maturity for fixed income securities is managed such that sufficient liquidity exists tomeet near-term benefit payment obligations. The plans retain outside investment advisors to manage planinvestments within parameters established by our plan trustees.
99

The following table presents the fair value of our qualified pension plan assets by major asset category as ofMay 1, 2011 and May 2, 2010. The allocation of our pension plan assets is based on the target range presented inthe following table.
May 1,2011
May 2,2010
TargetRange
(in millions)
Asset category:Cash and cash equivalents, net of payables for unsettled transactions . . . . . . . . . . $ 83.9 $ 86.2 0-4%Equity securities . . . . . . . . . . . . . . . . . . . . . . . . . . . . . . . . . . . . . . . . . . . . . . . . . . . . 570.5 421.9 45-65Debt securities . . . . . . . . . . . . . . . . . . . . . . . . . . . . . . . . . . . . . . . . . . . . . . . . . . . . . 266.6 249.6 18-38Alternative assets . . . . . . . . . . . . . . . . . . . . . . . . . . . . . . . . . . . . . . . . . . . . . . . . . . . 35.4 31.0 2-10
Total . . . . . . . . . . . . . . . . . . . . . . . . . . . . . . . . . . . . . . . . . . . . . . . . . . . . . . . . . $956.4 $788.7
See Note 15—Fair Value Measurements for additional information about the fair value of our pension assets.
As of May 1, 2011 and May 2, 2010, the amount of our common stock included in plan assets was 4,757,066 and3,850,837 shares, respectively, with market values of $112.1 million and $72.2 million, respectively.
We generally contribute the minimum amount required under government regulations to our qualified pensionplans, plus amounts necessary to maintain an 80% funded status in order to avoid benefit restrictions under thePension Protection Act. Minimum employer contributions to our qualified pension plans are expected to be $61.8million for fiscal 2012.
Expected future benefit payments for our defined benefit pension plans are as follows:
Fiscal Year (in millions)
2012 . . . . . . . . . . . . . . . . . . . . . . . . . . . . . . . . . . . . . . . . . . . . . . . . . . . . . . . . . . . . . . . . . . . . . . . . . . . . . $ 66.92013 . . . . . . . . . . . . . . . . . . . . . . . . . . . . . . . . . . . . . . . . . . . . . . . . . . . . . . . . . . . . . . . . . . . . . . . . . . . . . 67.82014 . . . . . . . . . . . . . . . . . . . . . . . . . . . . . . . . . . . . . . . . . . . . . . . . . . . . . . . . . . . . . . . . . . . . . . . . . . . . . 70.92015 . . . . . . . . . . . . . . . . . . . . . . . . . . . . . . . . . . . . . . . . . . . . . . . . . . . . . . . . . . . . . . . . . . . . . . . . . . . . . 74.42016 . . . . . . . . . . . . . . . . . . . . . . . . . . . . . . . . . . . . . . . . . . . . . . . . . . . . . . . . . . . . . . . . . . . . . . . . . . . . . 78.42017-2021 . . . . . . . . . . . . . . . . . . . . . . . . . . . . . . . . . . . . . . . . . . . . . . . . . . . . . . . . . . . . . . . . . . . . . . . . 457.9
We sponsor defined contribution pension plans (401(k) plans) covering substantially all U.S. employees. Ourcontributions vary depending on the plan but are based primarily on each participant’s level of contribution andcannot exceed the maximum allowable for tax purposes. Total contributions were $13.9 million, $13.9 millionand $13.7 million for fiscal 2011, 2010 and 2009, respectively.
We also provide health care and life insurance benefits for certain retired employees. These plans are unfundedand generally pay covered costs reduced by retiree premium contributions, co-payments and deductibles. Weretain the right to modify or eliminate these benefits. We consider disclosures related to these plans immaterial tothe consolidated financial statements and related notes.
NOTE 13: REDEMPTION OF NONCONTROLLING INTERESTS
Prior to fiscal 2010, we held a 51% ownership interest in Premium Pet Health, LLC (PPH), a leading proteinby-product processor that supplies many of the leading pet food processors in the United States. The partnershipagreement afforded the noncontrolling interest holders an option to require us to redeem their ownership interestsbeginning in November 2009 (fiscal 2010). The redemption value was determinable from a specified formulabased on the earnings of PPH.
100
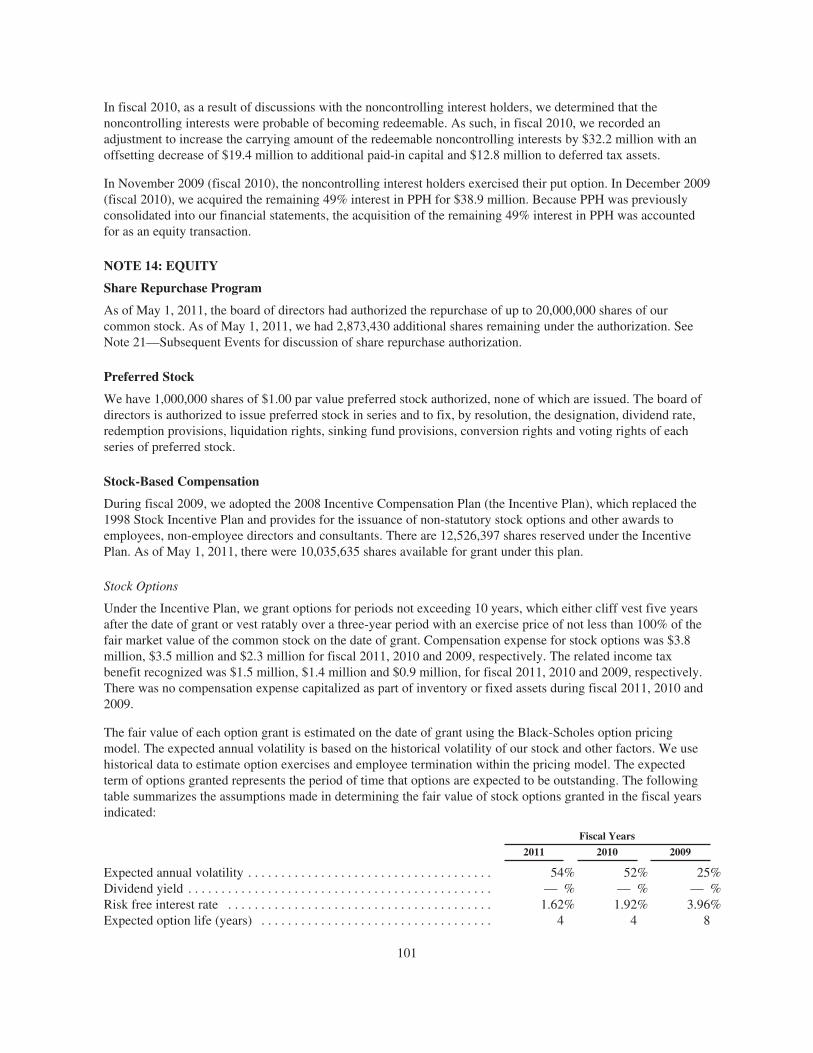
In fiscal 2010, as a result of discussions with the noncontrolling interest holders, we determined that thenoncontrolling interests were probable of becoming redeemable. As such, in fiscal 2010, we recorded anadjustment to increase the carrying amount of the redeemable noncontrolling interests by $32.2 million with anoffsetting decrease of $19.4 million to additional paid-in capital and $12.8 million to deferred tax assets.
In November 2009 (fiscal 2010), the noncontrolling interest holders exercised their put option. In December 2009(fiscal 2010), we acquired the remaining 49% interest in PPH for $38.9 million. Because PPH was previouslyconsolidated into our financial statements, the acquisition of the remaining 49% interest in PPH was accountedfor as an equity transaction.
NOTE 14: EQUITY
Share Repurchase Program
As of May 1, 2011, the board of directors had authorized the repurchase of up to 20,000,000 shares of ourcommon stock. As of May 1, 2011, we had 2,873,430 additional shares remaining under the authorization. SeeNote 21—Subsequent Events for discussion of share repurchase authorization.
Preferred Stock
We have 1,000,000 shares of $1.00 par value preferred stock authorized, none of which are issued. The board ofdirectors is authorized to issue preferred stock in series and to fix, by resolution, the designation, dividend rate,redemption provisions, liquidation rights, sinking fund provisions, conversion rights and voting rights of eachseries of preferred stock.
Stock-Based Compensation
During fiscal 2009, we adopted the 2008 Incentive Compensation Plan (the Incentive Plan), which replaced the1998 Stock Incentive Plan and provides for the issuance of non-statutory stock options and other awards toemployees, non-employee directors and consultants. There are 12,526,397 shares reserved under the IncentivePlan. As of May 1, 2011, there were 10,035,635 shares available for grant under this plan.
Stock Options
Under the Incentive Plan, we grant options for periods not exceeding 10 years, which either cliff vest five yearsafter the date of grant or vest ratably over a three-year period with an exercise price of not less than 100% of thefair market value of the common stock on the date of grant. Compensation expense for stock options was $3.8million, $3.5 million and $2.3 million for fiscal 2011, 2010 and 2009, respectively. The related income taxbenefit recognized was $1.5 million, $1.4 million and $0.9 million, for fiscal 2011, 2010 and 2009, respectively.There was no compensation expense capitalized as part of inventory or fixed assets during fiscal 2011, 2010 and2009.
The fair value of each option grant is estimated on the date of grant using the Black-Scholes option pricingmodel. The expected annual volatility is based on the historical volatility of our stock and other factors. We usehistorical data to estimate option exercises and employee termination within the pricing model. The expectedterm of options granted represents the period of time that options are expected to be outstanding. The followingtable summarizes the assumptions made in determining the fair value of stock options granted in the fiscal yearsindicated:
Fiscal Years
2011 2010 2009
Expected annual volatility . . . . . . . . . . . . . . . . . . . . . . . . . . . . . . . . . . . . . 54% 52% 25%Dividend yield . . . . . . . . . . . . . . . . . . . . . . . . . . . . . . . . . . . . . . . . . . . . . . — % — % — %Risk free interest rate . . . . . . . . . . . . . . . . . . . . . . . . . . . . . . . . . . . . . . . . 1.62% 1.92% 3.96%Expected option life (years) . . . . . . . . . . . . . . . . . . . . . . . . . . . . . . . . . . . 4 4 8
101

The options granted in fiscal 2011 and fiscal 2010 were valued in separate tranches according to the expected lifeof each tranche. The above table reflects the weighted average risk free interest rate and expected option life ofeach tranche. The expected annual volatility and dividend yield were the same for all options granted in fiscal2011 and fiscal 2010. We have never paid a cash dividend on our common stock and have no current plan to paycash dividends.
The following table summarizes stock option activity under the Incentive Plan as of May 1, 2011, and changesduring the year then ended:
Number ofShares
WeightedAverage
Exercise Price
WeightedAverage
RemainingContractual
Term (Years)
AggregateIntrinsicValue (inmillions)
Outstanding as of May 2, 2010 . . . . . . . . . . . . . . . . . . . . . . 1,995,436 23.39Granted . . . . . . . . . . . . . . . . . . . . . . . . . . . . . . . . . . . . 726,167 15.37Exercised . . . . . . . . . . . . . . . . . . . . . . . . . . . . . . . . . . . (84,499) 14.64Forfeited . . . . . . . . . . . . . . . . . . . . . . . . . . . . . . . . . . . (160,498) 21.83
Outstanding as of May 1, 2011 . . . . . . . . . . . . . . . . . . . . . . 2,476,606 21.44 4.8 $ 11.3
Exercisable as of May 1, 2011 . . . . . . . . . . . . . . . . . . . . . . 884,936 22.36 2.8 $ 3.0
The weighted average grant-date fair value of options granted during fiscal 2011, 2010 and 2009 was $6.61,$5.62 and $9.43, respectively. The total intrinsic value of options exercised during fiscal 2011, 2010 and 2009was $0.4 million, $1.0 million and $0.1 million, respectively.
As of May 1, 2011, there was $4.0 million of total unrecognized compensation cost related to nonvested stockoptions granted under the Incentive Plan. That cost is expected to be recognized over a weighted average periodof 1.3 years. The total fair value of stock options vested during fiscal 2011, 2010 and 2009 was $1.9 million, $2.4million and $0.2 million, respectively.
Performance Share Units
The Incentive Plan also provides for the issuance of performance share units to reward employees for theachievement of performance goals. Each performance share unit represents and has a value equal to one share ofour common stock. Payment of vested performance share units is generally in our common stock.
In June 2010 (fiscal 2011), we granted a total of 370,000 performance share units under the 2008 IncentiveCompensation Plan (the Incentive Plan). The performance share units will vest ratably over a two-year serviceperiod provided that we achieve a certain earnings target in either fiscal 2011 or fiscal 2012, which we achievedin fiscal 2011. The fair value of the performance share units was determined based on our closing stock price onthe date of grant of $17.57. The fair value is being recognized over the expected vesting period of each award.
Also, in June 2010 (fiscal 2011), we granted a number of performance share units to certain employees in ourPork Group. The actual number of performance share units were based on the achievement of certain salesvolume growth targets for the Pork segment in fiscal 2011. The sales volume growth targets were not met and noperformance share units were granted.
In December 2009 (fiscal 2010), we granted a total of 100,000 performance share units under the Incentive Plan.The performance share units will vest two years from the grant date provided that certain performance goals aremet and the employees remain employed through the vesting date. The fair value of these performance shareunits was also determined based on our closing stock price on the date of grant of $16.68. The fair value of eachperformance share unit is being recognized as compensation expense over the two-year requisite service period.
102

In July 2009 (fiscal 2010), we granted a total of 622,000 performance share units under the Incentive Plan. Theperformance share units will vest ratably over a three-year service period provided that we achieve a certainearnings target in any of fiscal years 2010, 2011 or 2012, which we achieved in fiscal 2011. The fair value of theperformance share units was determined based on our closing stock price on the date of grant of $10.64. The fairvalue is being recognized over the expected vesting period each award.
In fiscal 2009, we granted a total of 160,000 performance share units. The performance share units have a five-year term and each performance share unit represents and has a value equal to one share of our common stock.The performance share units vest in 20% increments once the volume-weighted average of the closing price ofour common stock for 15 consecutive trading days equals or exceeds $26, $32, $38, $44 and $50. In addition tothese vesting requirements, a participant must generally be employed by us one year from the date of grant forthe performance share units granted to such participant to vest. Payment of the vested performance share unitsshall be in our common stock. The fair value of the performance share units was estimated on the date of grantusing a Monte-Carlo Simulation technique. The weighted average grant-date fair value of the performance shareunits was $12.13.
In fiscal 2011, 237,500 performance share units were forfeited. The number of performance share unitsoutstanding as of May 1, 2011 was 1,189,500. As of May 1, 2011, the number of performance share units thathad vested was 253,167. Compensation expense related to all outstanding performance share units was $7.5million, $3.1 million and $1.6 million in fiscal 2011, 2010 and 2009, respectively. The related income tax benefitrecognized was $2.9 million, $1.2 million and $0.6 million for fiscal 2011, 2010 and 2009, respectively. As ofMay 1, 2011, there was approximately $3.5 million of total unrecognized compensation cost related to theperformance share units, substantially all of which is expected to be recognized in fiscal 2012.
Call Spread Transactions
In connection with the issuance of the Convertible Notes (see Note 9—Debt), we entered into separateconvertible note hedge transactions with respect to our common stock to minimize the impact of potentialeconomic dilution upon conversion of the Convertible Notes, and separate warrant transactions.
We purchased call options in private transactions that permit us to acquire up to approximately 17.6 millionshares of our common stock at an initial strike price of $22.68 per share, subject to adjustment, for $88.2 million.In general, the call options allow us to acquire a number of shares of our common stock initially equal to thenumber of shares of common stock issuable to the holders of the Convertible Notes upon conversion. These calloptions will terminate upon the maturity of the Convertible Notes.
We also sold warrants in private transactions for total proceeds of approximately $36.7 million. The warrantspermit the purchasers to acquire up to approximately 17.6 million shares of our common stock at an initialexercise price of $30.54 per share, subject to adjustment. The warrants expire on various dates from October2013 (fiscal 2014) to December 2013 (fiscal 2014).
The Call Spread Transactions, in effect, increase the initial conversion price of the Convertible Notes from$22.68 per share to $30.54 per share, thus reducing the potential future economic dilution associated withconversion of the notes. The Convertible Notes and the warrants could have a dilutive effect on our earnings pershare to the extent that the price of our common stock during a given measurement period exceeds the respectiveexercise prices of those instruments. The call options are excluded from the calculation of diluted earnings pershare as their impact is anti-dilutive.
We have analyzed the Call Spread Transactions and determined that they meet the criteria for classification asequity instruments. As a result, we recorded the purchase of the call options as a reduction to additional paid-incapital and the proceeds of the warrants as an increase to additional paid-in capital. Subsequent changes in fairvalue of those instruments are not recognized in the financial statements as long as the instruments continue tomeet the criteria for equity classification.
103
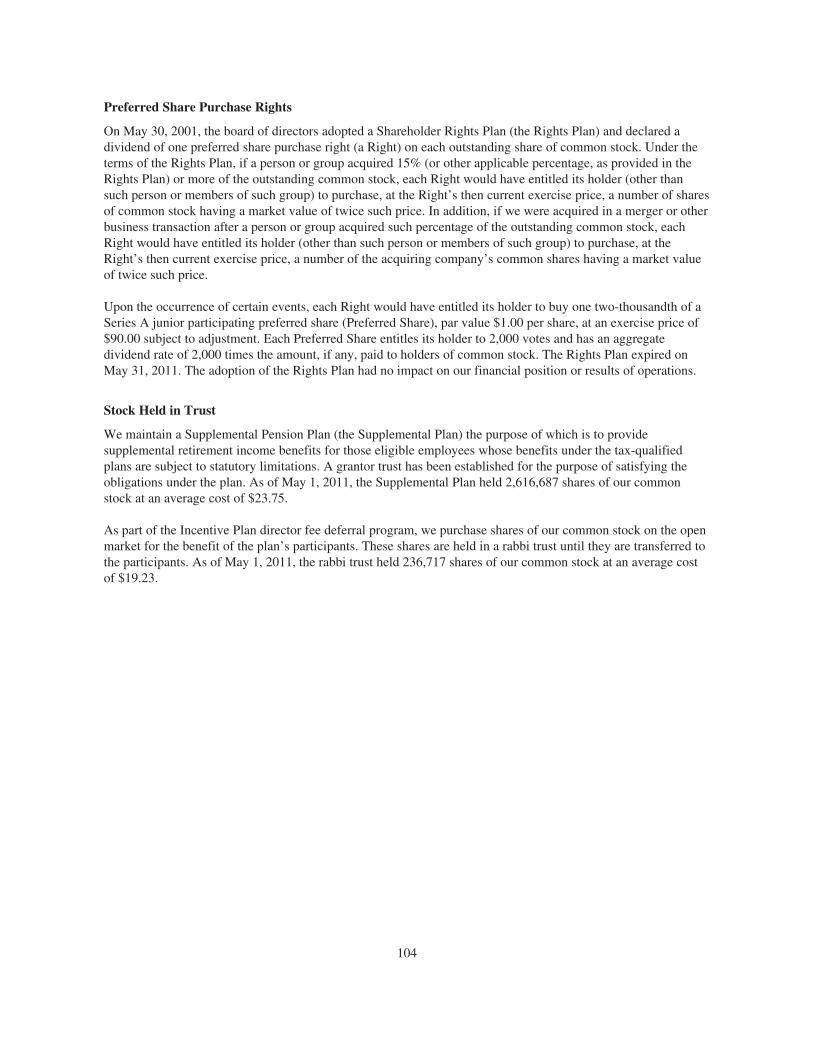
Preferred Share Purchase Rights
On May 30, 2001, the board of directors adopted a Shareholder Rights Plan (the Rights Plan) and declared adividend of one preferred share purchase right (a Right) on each outstanding share of common stock. Under theterms of the Rights Plan, if a person or group acquired 15% (or other applicable percentage, as provided in theRights Plan) or more of the outstanding common stock, each Right would have entitled its holder (other thansuch person or members of such group) to purchase, at the Right’s then current exercise price, a number of sharesof common stock having a market value of twice such price. In addition, if we were acquired in a merger or otherbusiness transaction after a person or group acquired such percentage of the outstanding common stock, eachRight would have entitled its holder (other than such person or members of such group) to purchase, at theRight’s then current exercise price, a number of the acquiring company’s common shares having a market valueof twice such price.
Upon the occurrence of certain events, each Right would have entitled its holder to buy one two-thousandth of aSeries A junior participating preferred share (Preferred Share), par value $1.00 per share, at an exercise price of$90.00 subject to adjustment. Each Preferred Share entitles its holder to 2,000 votes and has an aggregatedividend rate of 2,000 times the amount, if any, paid to holders of common stock. The Rights Plan expired onMay 31, 2011. The adoption of the Rights Plan had no impact on our financial position or results of operations.
Stock Held in Trust
We maintain a Supplemental Pension Plan (the Supplemental Plan) the purpose of which is to providesupplemental retirement income benefits for those eligible employees whose benefits under the tax-qualifiedplans are subject to statutory limitations. A grantor trust has been established for the purpose of satisfying theobligations under the plan. As of May 1, 2011, the Supplemental Plan held 2,616,687 shares of our commonstock at an average cost of $23.75.
As part of the Incentive Plan director fee deferral program, we purchase shares of our common stock on the openmarket for the benefit of the plan’s participants. These shares are held in a rabbi trust until they are transferred tothe participants. As of May 1, 2011, the rabbi trust held 236,717 shares of our common stock at an average costof $19.23.
104

Accumulated Other Comprehensive Income (Loss)
The following table summarizes the components of accumulated other comprehensive income (loss) and therelated activity during fiscal 2011, 2010 and 2009:
ForeignCurrency
TranslationPension
AccountingHedge
Accounting
AccumulatedOther
ComprehensiveIncome (Loss)
(in millions)
Balance at April 27, 2008 . . . . . . . . . . . . . . . . . . $ 132.4 $ (61.9) $ (5.1) $ 65.4Unrecognized losses . . . . . . . . . . . . . . . . . . (261.0) (199.2) (251.6) (711.8)Reclassification into net earnings . . . . . . . . 1.0 5.7 146.8 153.5Tax effect . . . . . . . . . . . . . . . . . . . . . . . . . . . — 71.6 32.8 104.4
Other comprehensive loss . . . . . . . . . . (260.0) (121.9) (72.0) (453.9)
Balance at May 3, 2009 . . . . . . . . . . . . . . . . . . . . (127.6) (183.8) (77.1) (388.5)Unrecognized gains (losses) . . . . . . . . . . . . 3.4 (179.9) (26.6) (203.1)Reclassification into net earnings . . . . . . . . — 20.3 98.3 118.6Tax effect . . . . . . . . . . . . . . . . . . . . . . . . . . . 1.5 63.1 (19.1) 45.5
Other comprehensive income (loss) . . 4.9 (96.5) 52.6 (39.0)
Balance at May 2, 2010 . . . . . . . . . . . . . . . . . . . . (122.7) (280.3) (24.5) (427.5)Unrecognized gains . . . . . . . . . . . . . . . . . . . 120.2 60.8 144.9 325.9Reclassification into net earnings . . . . . . . . — 38.9 (26.6) 12.3Tax effect . . . . . . . . . . . . . . . . . . . . . . . . . . . 2.9 (37.1) (45.7) (79.9)
Other comprehensive income . . . . . . . 123.1 62.6 72.6 258.3
Balance at May 1, 2011 . . . . . . . . . . . . . . . . . . . . $ 0.4 $ (217.7) $ 48.1 $ (169.2)
NOTE 15: FAIR VALUE MEASUREMENTS
Fair value is defined as the price that would be received to sell an asset or paid to transfer a liability in an orderlytransaction between market participants at the measurement date. We are required to consider and reflect theassumptions of market participants in fair value calculations. These factors include nonperformance risk (the riskthat an obligation will not be fulfilled) and credit risk, both of the reporting entity (for liabilities) and of thecounterparty (for assets).
We use, as appropriate, a market approach (generally, data from market transactions), an income approach(generally, present value techniques), and/or a cost approach (generally, replacement cost) to measure the fairvalue of an asset or liability. These valuation approaches incorporate inputs such as observable, independentmarket data that management believes are predicated on the assumptions market participants would use to pricean asset or liability. These inputs may incorporate, as applicable, certain risks such as nonperformance risk,which includes credit risk.
The FASB has established a three-level fair value hierarchy that prioritizes the inputs used to measure fair value.The fair value hierarchy gives the highest priority to quoted market prices (Level 1) and the lowest priority tounobservable inputs (Level 3). The three levels of inputs used to measure fair value are as follows:
• Level 1—quoted prices in active markets for identical assets or liabilities accessible by the reportingentity.
• Level 2—observable inputs other than quoted prices included in Level 1, such as quoted prices for similarassets and liabilities in active markets; quoted prices for identical or similar assets and liabilities inmarkets that are not active; or other inputs that are observable or can be corroborated by observablemarket data.
105

• Level 3—unobservable for an asset or liability. Unobservable inputs should only be used to the extentobservable inputs are not available.
The fair value hierarchy gives the highest priority to quoted market prices (Level 1) and the lowest priority tounobservable inputs (Level 3). Financial assets and liabilities have been classified in their entirety based on thelowest level of input that is significant to the fair value measurement.
When available, we use quoted market prices to determine fair value and we classify such measurements withinLevel 1. In some cases where market prices are not available, we make use of observable market-based inputs(i.e., Bloomberg and commodity exchanges) to calculate fair value, in which case the measurements areclassified within Level 2. When quoted market prices or observable market-based inputs are unavailable, or whenour fair value measurements incorporate significant unobservable inputs, we would classify such measurementswithin Level 3.
Assets and Liabilities Measured at Fair Value on a Recurring Basis
The following tables set forth, by level within the fair value hierarchy, our non-pension financial assets andliabilities that were measured at fair value on a recurring basis as of May 1, 2011 and May 2, 2010:
May 1, 2011 May 2, 2010
Level 1 Level 2 Level 3 Total Level 1 Level 2 Level 3 Total
(in millions) (in millions)
AssetsDerivatives:
Commodity contracts . . . . . . . . $ 45.2 $ 34.6 $ — $ 79.8 $ — $ — $ — $ —Foreign exchange contracts . . . — 0.5 — 0.5 — 3.5 — 3.5
Money market fund . . . . . . . . . . . . . — — — — 325.4 — — 325.4Insurance contracts . . . . . . . . . . . . . . 49.4 — — 49.4 42.7 — — 42.7
Total . . . . . . . . . . . . . . . . . $ 94.6 $ 35.1 $ — $ 129.7 $ 368.1 $ 3.5 $ — $ 371.6
LiabilitiesDerivatives:
Commodity contracts . . . . . . . . $ 16.8 $ — $ — $ 16.8 $ 112.2 $ 7.3 $ — $ 119.5Interest rate contracts . . . . . . . . — 2.3 — 2.3 — 8.1 — 8.1Foreign exchange contracts . . . — 1.9 — 1.9 — 0.2 — 0.2
Total . . . . . . . . . . . . . . . . . $ 16.8 $ 4.2 $ — $ 21.0 $ 112.2 $ 15.6 $ — $ 127.8
We invest our cash in an overnight money market fund, which is treated as a trading security with the unrealizedgains recorded in earnings.
Assets and Liabilities Measured at Fair Value on a Nonrecurring Basis
Certain assets and liabilities are measured at fair value on a nonrecurring basis after initial recognition; that is,the assets and liabilities are not measured at fair value on an ongoing basis but are subject to fair valueadjustments in certain circumstances, for example, when there is evidence of impairment.
In fiscal 2011 and fiscal 2010, we recorded impairment charges totaling $9.2 million and $51.3 million,respectively, to write-down certain assets, consisting primarily of property, plant and equipment, to theirestimated fair values. The fair value measurements of these assets were determined using relevant market databased on recent transactions for similar assets and third party estimates, which we classify as Level 2 inputs. Fairvalues were also determined using valuation techniques, which incorporate unobservable inputs that reflect ourown assumptions regarding how market participants would price the assets, which we classify as Level 3 inputs.
106

Pension Plan Assets
The following table summarizes our pension plan assets measured at fair value on a recurring basis (at leastannually) as of May 1, 2011 and May 2, 2010:
May 1, 2011 May 2, 2010
Level 1 Level 2 Level 3 Total Level 1 Level 2 Level 3 Total
(in millions) (in millions)
Cash equivalents . . . . . . . . . . . . . . . . $ 3.0 $ 87.5 $ — $ 90.5 $ 2.8 $ 93.9 $ — $ 96.7Equity securities:
Preferred stock . . . . . . . . . . . . . . — 0.3 — 0.3 — 0.2 — 0.2U.S. common stock:
Health care . . . . . . . . . . . . . 32.0 — — 32.0 27.3 — — 27.3Utilities . . . . . . . . . . . . . . . 3.8 — — 3.8 3.9 — — 3.9Financials . . . . . . . . . . . . . . 41.0 — — 41.0 32.9 — — 32.9Consumer staples . . . . . . . . 128.1 — — 128.1 82.0 — — 82.0Consumer discretionary . . . 32.3 — — 32.3 23.3 — — 23.3Materials . . . . . . . . . . . . . . 14.6 — — 14.6 9.1 — — 9.1Energy . . . . . . . . . . . . . . . . 30.0 — — 30.0 18.6 — — 18.6Information technology . . . 34.2 — — 34.2 19.4 — — 19.4Industrials . . . . . . . . . . . . . 38.5 — — 38.5 25.1 — — 25.1Telecommunication
service . . . . . . . . . . . . . . 2.1 — — 2.1 1.2 — — 1.2International common stock . . . 23.0 — — 23.0 15.2 — — 15.2Mutual funds:
International . . . . . . . . . . . . 42.9 45.0 — 87.9 35.8 70.1 — 105.9Domestic large cap . . . . . . — 70.0 — 70.0 — 57.8 — 57.8Balanced . . . . . . . . . . . . . . 32.7 — — 32.7 — — — —
Fixed income:Mutual funds . . . . . . . . . . . . . . . 108.9 1.5 — 110.4 72.7 2.7 — 75.4Asset-backed securities . . . . . . . — 69.5 — 69.5 — 53.4 — 53.4Corporate debt securities . . . . . . — 44.4 — 44.4 — 67.7 — 67.7Government debt securities . . . . 32.9 9.4 — 42.3 35.7 17.4 — 53.1
Limited partnerships . . . . . . . . . . . . . — — 33.6 33.6 — — 29.2 29.2Insurance contracts . . . . . . . . . . . . . . — — 1.8 1.8 — — 1.8 1.8
Total fair value . . . . . . . . . . $ 600.0 $ 327.6 $ 35.4 963.0 $ 405.0 $ 363.2 $ 31.0 799.2
Net payables for unsettledtransactions . . . . . . . . . . . . . . . . . . (6.6) (10.5)
Total plan assets . . . . . . . . . $ 956.4 $ 788.7
107
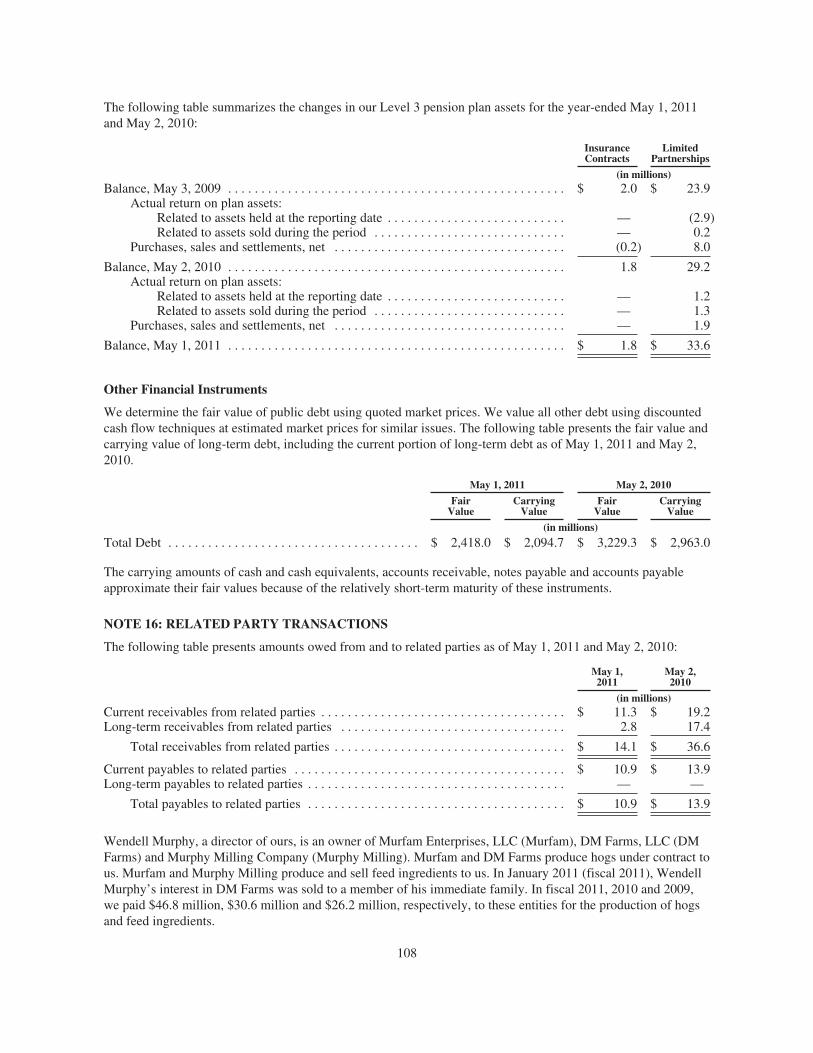
The following table summarizes the changes in our Level 3 pension plan assets for the year-ended May 1, 2011and May 2, 2010:
InsuranceContracts
LimitedPartnerships
(in millions)Balance, May 3, 2009 . . . . . . . . . . . . . . . . . . . . . . . . . . . . . . . . . . . . . . . . . . . . . . . . . . . $ 2.0 $ 23.9
Actual return on plan assets:Related to assets held at the reporting date . . . . . . . . . . . . . . . . . . . . . . . . . . . — (2.9)Related to assets sold during the period . . . . . . . . . . . . . . . . . . . . . . . . . . . . . — 0.2
Purchases, sales and settlements, net . . . . . . . . . . . . . . . . . . . . . . . . . . . . . . . . . . . (0.2) 8.0
Balance, May 2, 2010 . . . . . . . . . . . . . . . . . . . . . . . . . . . . . . . . . . . . . . . . . . . . . . . . . . . 1.8 29.2Actual return on plan assets:
Related to assets held at the reporting date . . . . . . . . . . . . . . . . . . . . . . . . . . . — 1.2Related to assets sold during the period . . . . . . . . . . . . . . . . . . . . . . . . . . . . . — 1.3
Purchases, sales and settlements, net . . . . . . . . . . . . . . . . . . . . . . . . . . . . . . . . . . . — 1.9
Balance, May 1, 2011 . . . . . . . . . . . . . . . . . . . . . . . . . . . . . . . . . . . . . . . . . . . . . . . . . . . $ 1.8 $ 33.6
Other Financial Instruments
We determine the fair value of public debt using quoted market prices. We value all other debt using discountedcash flow techniques at estimated market prices for similar issues. The following table presents the fair value andcarrying value of long-term debt, including the current portion of long-term debt as of May 1, 2011 and May 2,2010.
May 1, 2011 May 2, 2010
FairValue
CarryingValue
FairValue
CarryingValue
(in millions)
Total Debt . . . . . . . . . . . . . . . . . . . . . . . . . . . . . . . . . . . . . . $ 2,418.0 $ 2,094.7 $ 3,229.3 $ 2,963.0
The carrying amounts of cash and cash equivalents, accounts receivable, notes payable and accounts payableapproximate their fair values because of the relatively short-term maturity of these instruments.
NOTE 16: RELATED PARTY TRANSACTIONS
The following table presents amounts owed from and to related parties as of May 1, 2011 and May 2, 2010:
May 1,2011
May 2,2010
(in millions)Current receivables from related parties . . . . . . . . . . . . . . . . . . . . . . . . . . . . . . . . . . . . . $ 11.3 $ 19.2Long-term receivables from related parties . . . . . . . . . . . . . . . . . . . . . . . . . . . . . . . . . . 2.8 17.4
Total receivables from related parties . . . . . . . . . . . . . . . . . . . . . . . . . . . . . . . . . . . $ 14.1 $ 36.6
Current payables to related parties . . . . . . . . . . . . . . . . . . . . . . . . . . . . . . . . . . . . . . . . . $ 10.9 $ 13.9Long-term payables to related parties . . . . . . . . . . . . . . . . . . . . . . . . . . . . . . . . . . . . . . . — —
Total payables to related parties . . . . . . . . . . . . . . . . . . . . . . . . . . . . . . . . . . . . . . . $ 10.9 $ 13.9
Wendell Murphy, a director of ours, is an owner of Murfam Enterprises, LLC (Murfam), DM Farms, LLC (DMFarms) and Murphy Milling Company (Murphy Milling). Murfam and DM Farms produce hogs under contract tous. Murfam and Murphy Milling produce and sell feed ingredients to us. In January 2011 (fiscal 2011), WendellMurphy’s interest in DM Farms was sold to a member of his immediate family. In fiscal 2011, 2010 and 2009,we paid $46.8 million, $30.6 million and $26.2 million, respectively, to these entities for the production of hogsand feed ingredients.
108

Wendell Murphy also has immediate family members who hold ownership interests in Arrowhead Farms, Inc.,Crusader Farms, LLC, Enviro-Tech Farms, Inc., Golden Farms, Inc., Lisbon 1 Farm, Inc., Murphy-HonourFarms, Inc., PSM Associates LLC, Pure Country Farms, LLC, Stantonsburg Farm, Inc., Triumph Associates LLCand Webber Farms, Inc. A vice president of our Hog Production segment also holds an ownership interest inLisbon 1 Farm, Inc. These farms either produce and sell hogs to us or produce and sell feed ingredients to us. Infiscal 2011, 2010 and 2009, we paid $17.2 million, $14.3 million and $20.6 million, respectively, to these entitiesfor hogs and feed ingredients.
The chief executive officer and a vice president of our Hog Production segment hold ownership interests in JCTLLC (JCT). JCT owns certain farms that produce hogs under contract with the Hog Production segment. In fiscal2011, 2010 and 2009, we paid $7.8 million, $8.0 million and $7.3 million, respectively, to JCT for the productionof hogs. In fiscal 2011, 2010 and 2009, we received $3.3 million, $3.1 million and $3.2 million, respectively,from JCT for reimbursement of associated farm and other support costs.
Two vice presidents of our Hog Production segment have ownership interests in Sea Coast, LLC. One of thesevice presidents is the sole owner of Advantage Farms, LLC and the other is a partial owner of Texas Hogs, LLC.Another vice president of our Hog Production segment is the sole owner of Old Oak Farms, LLC. Thesecompanies produce and raise hogs for us under contractual arrangements that are consistent with third partygrower contracts. In fiscal 2011, 2010 and 2009, we paid service fees of $2.2 million, $0.9 million and $0.9million, respectively, to these companies. In fiscal 2011, 2010 and 2009, we received $0.5 million, $0.5 millionand $0.2 million, respectively, from these companies for reimbursement of associated farm and other supportcosts.
As described in Note 3—Impairment and Disposal of Long-lived Assets, immediately preceding the closing ofthe JBS transaction we acquired CGC’s 50 percent investment in Five Rivers for 2,166,667 shares of ourcommon stock valued at $27.87 per share and $8.7 million for working capital adjustments. Based on a Schedule13D/A filed on June 16, 2010, CGC is now a beneficial owner of approximately 7.9% of our common stock. PaulJ. Fribourg, a former member of our board of directors, is Chairman, President and Chief Executive Officer ofCGC. Michael Zimmerman, a former advisory director of the Company, is Executive Vice President and ChiefFinancial Officer of CGC.
We believe that the terms of the foregoing arrangements were no less favorable to us than if entered into withunaffiliated companies.
NOTE 17: REGULATION AND CONTINGENCIES
Like other participants in the industry, we are subject to various laws and regulations administered by federal,state and other government entities, including the United States Environmental Protection Agency (EPA) andcorresponding state agencies, as well as the United States Department of Agriculture, the Grain Inspection,Packers and Stockyard Administration, the United States Food and Drug Administration, the United StatesOccupational Safety and Health Administration, the Commodities and Futures Trading Commission and similaragencies in foreign countries.
We from time to time receive notices and inquiries from regulatory authorities and others asserting that we arenot in compliance with such laws and regulations. In some instances, litigation ensues. In addition, individualsmay initiate litigation against us.
Missouri Litigation
Premium Standard Farms, Inc. (PSF) is a wholly-owned subsidiary that we acquired on May 7, 2007 when awholly-owned subsidiary of ours merged with and into PSF.
In 2002, lawsuits based on the law of nuisance were filed against PSF and CGC in the Circuit Court of JacksonCounty, Missouri entitled Steven Adwell, et al. v. PSF, et al. and Michael Adwell, et al. v. PSF, et al. In
109

November 2006, a jury trial involving six plaintiffs in the Adwell cases resulted in a jury verdict of compensatorydamages for those six plaintiffs in the amount of $750,000 each for a total of $4.5 million. The jury also foundthat CGC and PSF were liable for punitive damages; however, the parties agreed to settle the plaintiffs’ claimsfor the amount of the compensatory damages, and the plaintiffs waived punitive damages.
On March 1, 2007, the court severed the claims of the remaining Adwell plaintiffs into separate actions andordered that they be consolidated for trial by household. In the second Adwell trial, a jury trial involving threeplaintiffs resulted in a jury verdict in December 2007 in favor of PSF and CGC as to all claims. On July 8, 2008,the court reconsolidated the claims of the remaining 49 Adwell plaintiffs for trial by farm.
On March 4, 2010, a jury trial involving 15 plaintiffs who live near Homan farm resulted in a jury verdict ofcompensatory damages for the plaintiffs for a total of $11,050,000. Thirteen of the Homan farm plaintiffsreceived damages in the amount of $825,000 each. One of the plaintiffs received damages in the amount of$250,000, while another plaintiff received $75,000. The Court of Appeals of Missouri (Western District) denieddefendants’ appeal. On May 17, 2011, defendants filed an Application for Transfer of the appeal with theMissouri Supreme Court, which remains pending. We believe that there are substantial grounds for reversal ofthe verdict on appeal. Pursuant to a pre-existing arrangement, PSF is obligated to indemnify CGC for certainliabilities, if any, resulting from the Missouri litigation, including any liabilities resulting from the foregoingverdict.
The next Adwell trial, which will resolve the claims of up to 28 plaintiffs who live near Scott Colby farm iscurrently scheduled to commence on August 1, 2011.
In March 2004, the same attorneys representing the Adwell plaintiffs filed two additional nuisance lawsuits in theCircuit Court of Jackson County, Missouri entitled Fred Torrey, et al. v. PSF, et al . and Doyle Bounds, et al. v.PSF, et al. There are seven plaintiffs in both suits combined, each of whom claims to live near swine farmsowned or under contract with PSF. Plaintiffs allege that these farms interfered with the plaintiffs’ use andenjoyment of their respective properties. Plaintiffs in the Torrey suit also allege trespass.
In May 2004, two additional nuisance suits were filed in the Circuit Court of Daviess County, Missouri entitledVernon Hanes, et al. v. PSF, et al. and Steve Hanes, et al. v. PSF, et al. Plaintiffs in the Vernon Hanes case allegenuisance, negligence, violation of civil rights, and negligence of contractor. In addition, plaintiffs in both theVernon and Steve Hanes cases assert personal injury and property damage claims. Plaintiffs seek recovery of anunspecified amount of compensatory and punitive damages, costs and attorneys’ fees, as well as injunctive relief.On March 28, 2008, plaintiffs in the Vernon Hanes case voluntarily dismissed all claims without prejudice. Anew petition was filed by the Vernon Hanes plaintiffs on April 14, 2008, alleging nuisance, negligence andtrespass against six defendants, including us. We filed a Motion for Summary Judgment seeking its dismissalfrom the Vernon Hanes case, which was granted by the Court on September 1, 2010. Trial for the remainingclaims commenced on June 2, 2011.
Also in May 2004, the same lead lawyer who filed the Adwell, Bounds and Torrey lawsuits filed a putative classaction lawsuit entitled Daniel Herrold, et al. and Others Similarly Situated v. ContiGroup Companies, Inc., PSF,and PSF Group Holdings, Inc. in the Circuit Court of Jackson County, Missouri. This action originally sought tocreate a class of plaintiffs living within ten miles of PSF’s farms in northern Missouri, including contract growerfarms, who were alleged to have suffered interference with their right to use and enjoy their respective properties.On January 22, 2007, plaintiffs in the Herrold case filed a Second Amended Petition in which they abandoned allclass action allegations and efforts to certify the action as a class action and added an additional 193 namedplaintiffs to join the seven prior class representatives to pursue a one count claim to recover monetary damages,both actual and punitive, for temporary nuisance. On June 28, 2007, the court entered an order grantingdefendants’ motion to transfer venue to the northern Missouri counties in which the alleged injuries occurred. Asa result of those rulings, the claims of all but seven of the plaintiffs have been transferred to the appropriatevenues in northern Missouri.
110

Following the initial transfers, plaintiffs filed motions to transfer each of the cases back to Jackson County.Those motions were denied in all nine cases, but seven cases were transferred to neighboring counties pursuant toMissouri’s venue rules. Following all transfers, Herrold cases were pending in Chariton, Clark, DeKalb,Harrison, Jackson, Linn, and Nodaway counties. Plaintiffs agreed to file Amended Petitions in all cases exceptJackson County; however, Amended Petitions have been filed in only Chariton, Clark, Harrison, Linn andNodaway counties. In the Amended Petitions filed in Chariton on April 30, 2010 and in Linn on May 13, 2010,plaintiffs added claims of negligence and also claim that defendants are liable for the alleged negligence ofseveral contract grower farms. Pursuant to notices of dismissal filed by plaintiffs on January 27, February 23 andApril 10, 2009, all cases in Nodaway County have been dismissed. Discovery is now proceeding in the remainingcases where Amended Petitions have been filed.
In February 2006, the same lawyer who represents the plaintiffs in Hanes filed a nuisance lawsuit entitled GaroldMcDaniel, et al. v. PSF, et al. in the Circuit Court of Daviess County, Missouri. In the Second Amended Petition,which was filed on February 2008, plaintiffs seek recovery of an unspecified amount of compensatory andpunitive damages, costs and injunctive relief. Two of the four plaintiffs settled their claims; PSF purchased theirproperty for $285,000 in exchange for a full release. A third plaintiff is deceased, leaving a single plaintiff in thecase. The remaining parties are conducting discovery, and no trial date has been set.
In May 2007, the same lead lawyer who filed the Adwell, Bounds, Herrold and Torrey lawsuits filed a nuisancelawsuit entitled Jake Cooper, et al. v. Smithfield Foods, Inc., et al. in the Circuit Court of Vernon County,Missouri. Murphy-Brown, LLC, Murphy Farms, LLC, Murphy Farms, Inc. and we have all been named asdefendants. The other seven named defendants include Murphy Family Ventures, LLC, DM Farms of Rose Hill,LLC, and PSM Associates, LLC, which are entities affiliated with Wendell Murphy, a director of ours, and/or hisfamily members. Initially there were 13 plaintiffs in the lawsuit, but the claims of two plaintiffs were voluntarilydismissed without prejudice. All remaining plaintiffs are current or former residents of Vernon and BartonCounties, Missouri, each of whom claims to live or have lived near swine farms presently or previously owned ormanaged by the defendants. Plaintiffs allege that odors from these farms interfered with the use and enjoyment oftheir respective properties. Plaintiffs seek recovery of an unspecified amount of compensatory and punitivedamages, costs and attorneys’ fees. Defendants have filed responsive pleadings and discovery is ongoing.
In July 2008, the same lawyers who filed the Adwell, Bounds, Herrold, Torrey and Cooper lawsuits filed anuisance lawsuit entitled John Arnold, et al. v. Smithfield Foods, Inc., et al. in the Circuit Court of DaviessCounty, Missouri. The Company and two of our subsidiaries, PSF and KC2 Real Estate LLC were named asdefendants. In August 2008, plaintiffs filed a second Petition adding one employee as a defendant. There werethree plaintiffs in the lawsuit, who are residents of Daviess County and who claimed to live near swine farmsowned or operated by defendants. Plaintiffs alleged that odors from these farms cause nuisances that interferewith the use and enjoyment of their properties. On April 20, 2009, plaintiffs voluntarily dismissed this casewithout prejudice. Plaintiffs refiled the case on April 20, 2010, adding CGC as a defendant. Defendants havefiled responsive pleadings, including a motion to dismiss all claims against the employee-defendant.
In November 2010 (fiscal 2011), we reached a settlement with one of our insurance carriers regarding thereimbursement of certain past and future defense costs associated with our Missouri litigation. Related to thismatter, we recognized a net benefit of $19.1 million in selling, general and administrative expenses in the HogProduction segment in the second quarter of fiscal 2011.
We believe we have good defenses to all of the actions described above and intend to defend vigorously thesesuits. Although we recognize the uncertainties of litigation, based on our historical experience and ourunderstanding of the facts and circumstances underlying these claims, we believe that these claims will not havea material adverse effect on our results of operations or financial condition.
Our policy for establishing accruals and disclosures for contingent liabilities is contained in Note 1—Summaryof Significant Accounting Policies. We established an accrual estimating our liability for these and similar
111

potential claims on the opening balance sheet for our acquisition of PSF. Consequently, expenses and otherliabilities associated with these claims will not affect our profits or losses unless our accrual proves to beinsufficient or excessive. However, legal expenses incurred in our and our subsidiaries’ defense of these claimsand any payments made to plaintiffs through unfavorable verdicts or otherwise will negatively impact our cashflows and our liquidity position.
Given the inherent uncertainty of the outcome for these and similar potential claims, it is possible that the totalcosts incurred related to these and similar potential claims could exceed our current estimates. As of May 1,2011, we cannot reasonably estimate the maximum potential exposure or the range of possible loss in excess ofamounts accrued for these contingencies. We will continue to review the amount of any necessary accruals orother related expenses and record charges in the period in which the determination is made that an adjustment isrequired.
Fire Insurance Settlement
In July 2009 (fiscal 2010), a fire occurred at the primary manufacturing facility of our subsidiary, PatrickCudahy, Inc. (Patrick Cudahy), in Cudahy, Wisconsin. The fire damaged a portion of the facility’s productionspace and required the temporary cessation of operations, but did not consume the entire facility. Shortly after thefire, we resumed production activities in undamaged portions of the plant, including the distribution center, andtook steps to address the supply needs for Patrick Cudahy products by shifting production to other Company andthird-party facilities.
We maintain comprehensive general liability and property insurance, including business interruption insurance.In December 2010 (fiscal 2011), we reached an agreement with our insurance carriers to settle the claim for atotal of $208.0 million, of which $70.0 million had been advanced to us in fiscal 2010. We allocated theseproceeds to first recover the book value of the property lost, out-of-pocket expenses incurred and businessinterruption losses that resulted from the fire. The remaining proceeds were recognized as an involuntaryconversion gain of $120.6 million in the Corporate segment in the third quarter of fiscal 2011. The involuntaryconversion gain was classified in a separate line item on the consolidated statement of income.
Based on an evaluation of business interruption losses incurred, we recognized $15.8 million and $31.8 million infiscal 2011 and fiscal 2010, respectively, of the insurance proceeds in cost of sales in our Pork segment to offsetbusiness interruption losses incurred.
Of the $208.0 million in insurance proceeds received to settle the claim, $120.6 million and $9.9 million has beenclassified in net cash flows from investing activities in the consolidated statements of cash flows for fiscal 2011and fiscal 2010, respectively, which represents the portion of proceeds related to destruction of the facility. Theremainder of the proceeds was recorded in net cash flows from operating activities in the consolidated statementsof cash flows and was attributed to business interruption recoveries and reimbursable costs covered under ourinsurance policy.
NOTE 18: REPORTING SEGMENTS
Our operating segments are determined on the basis of how we internally report and evaluate financialinformation used to make operating decisions. For external reporting purposes, we aggregate operating segmentswhich have similar economic characteristics, products, production processes, types or classes of customers anddistribution methods into reportable segments based on a combination of factors, including products producedand geographic areas of operations. Our reportable segments are: Pork, Hog Production, International Other andCorporate, each of which is comprised of a number of subsidiaries, joint ventures and other investments.
Prior to the first quarter of fiscal 2011, our hog production operations in Poland and Romania and our interest inhog production operations in Mexico were included in our Hog Production segment. In the first quarter of fiscal2011, these operations were moved into our International segment to more appropriately align our operating
112

segments with the way our chief operating decision maker now assesses performance of these segments andallocates resources to these segments. The fiscal 2010 and fiscal 2009 results presented below have been restatedto reflect this change in our reportable segments. As discussed in Note 3—Impairment and Disposal of Long-lived Assets, we sold our Beef operations in fiscal 2009, the results of which are reported as discontinuedoperations.
Pork Segment
The Pork segment consists mainly of our three wholly-owned U.S. fresh pork and packaged meats subsidiaries.The Pork segment produces a wide variety of fresh pork and packaged meats products in the U.S. and marketsthem nationwide and to numerous foreign markets, including China, Japan, Mexico, Russia and Canada. Freshpork products include loins, butts, picnics and ribs, among others. Packaged meats products include smoked andboiled hams, bacon, sausage, hot dogs (pork, beef and chicken), deli and luncheon meats, specialty products suchas pepperoni, dry meat products, and ready-to-eat, prepared foods such as pre-cooked entrees and pre-cookedbacon and sausage.
The following table shows the percentages of Pork segment revenues derived from packaged meats and freshpork for the fiscal years indicated.
Fiscal Years
2011 2010 2009
Packaged meats . . . . . . . . . . . . . . . . . . . . . . . . . . . . . . . . . . . . . . . . . . . . . . . . 56% 55% 53%Fresh pork(1) . . . . . . . . . . . . . . . . . . . . . . . . . . . . . . . . . . . . . . . . . . . . . . . . . . . 44 45 47
100% 100% 100%
(1) Includes by-products and rendering.
Hog Production Segment
The Hog Production segment consists of our hog production operations located in the U.S. The Hog Productionsegment operates numerous facilities with approximately 827,000 sows producing about 16.4 million markethogs annually. The Hog Production segment produces approximately 49% of the Pork segment’s live hogrequirements. We own certain genetic lines of specialized breeding stock which are marketed using the nameSmithfield Premium Genetics (SPG). All SPG hogs are processed internally.
The following table shows the percentages of Hog Production segment revenues derived from hogs soldinternally and externally, and other products for the fiscal years indicated.
Fiscal Years
2011 2010 2009
Internal hog sales . . . . . . . . . . . . . . . . . . . . . . . . . . . . . . . . . . . . . . . . . . . . . . . 78% 77% 80%External hog sales . . . . . . . . . . . . . . . . . . . . . . . . . . . . . . . . . . . . . . . . . . . . . . 21 20 17Other products(1) . . . . . . . . . . . . . . . . . . . . . . . . . . . . . . . . . . . . . . . . . . . . . . . 1 3 3
100% 100% 100%
(1) Consists primarily of feed.
International Segment
The International segment includes our meat processing and distribution operations in Poland, Romania and theUnited Kingdom, our interests in meat processing operations, mainly in Western Europe and Mexico, our hogproduction operations located in Poland and Romania and our interests in hog production operations in Mexico.Our international meat processing operations produce a wide variety of fresh pork, beef, poultry and packagedmeats products, including cooked hams, sausages, hot dogs, bacon and canned meats.
113

The following table shows the percentages of International segment revenues derived from packaged meats, freshpork and other products for the fiscal years indicated.
Fiscal Years
2011 2010 2009
Packaged meats . . . . . . . . . . . . . . . . . . . . . . . . . . . . . . . . . . . . . . . . . . . . . . . . 45% 45% 46%Fresh pork . . . . . . . . . . . . . . . . . . . . . . . . . . . . . . . . . . . . . . . . . . . . . . . . . . . . 24 26 31Other products(1) . . . . . . . . . . . . . . . . . . . . . . . . . . . . . . . . . . . . . . . . . . . . . . . 31 29 23
100% 100% 100%
(1) Includes poultry, beef, external hog sales, by-products and rendering
Other Segment
The Other segment, contains the results of several recently disposed businesses, including our former turkeyproduction operations and our previous 49% interest in Butterball, LLC (Butterball), which were sold inDecember 2010 (fiscal 2011), as well as our former live cattle operations, which were sold in the first quarter offiscal 2010. Our live cattle operations consisted of the live cattle inventories that were excluded from the sale ofSmithfield Beef, Inc. (Smithfield Beef) in October 2008 (fiscal 2009). See Note 3—Impairment and Disposal ofLong-lived Assets for further discussion of these dispositions.
Corporate Segment
The Corporate segment provides management and administrative services to support our other segments.
114
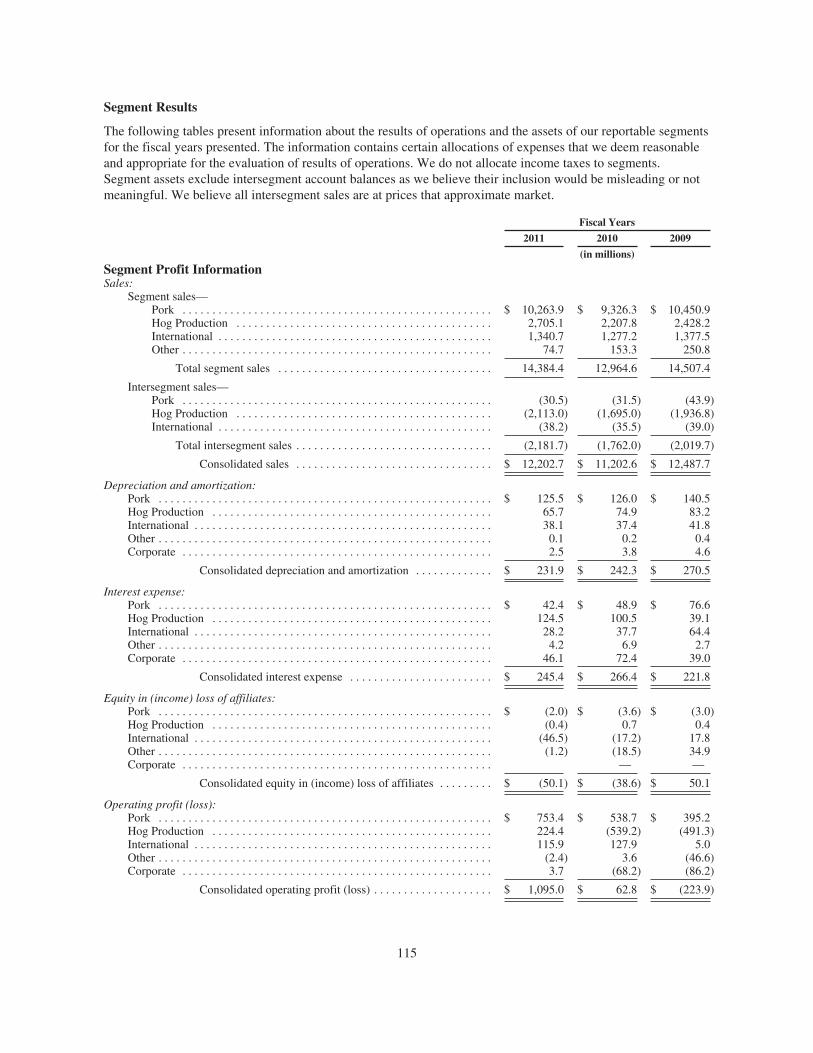
Segment Results
The following tables present information about the results of operations and the assets of our reportable segmentsfor the fiscal years presented. The information contains certain allocations of expenses that we deem reasonableand appropriate for the evaluation of results of operations. We do not allocate income taxes to segments.Segment assets exclude intersegment account balances as we believe their inclusion would be misleading or notmeaningful. We believe all intersegment sales are at prices that approximate market.
Fiscal Years
2011 2010 2009
(in millions)
Segment Profit InformationSales:
Segment sales—Pork . . . . . . . . . . . . . . . . . . . . . . . . . . . . . . . . . . . . . . . . . . . . . . . . . . . . $ 10,263.9 $ 9,326.3 $ 10,450.9Hog Production . . . . . . . . . . . . . . . . . . . . . . . . . . . . . . . . . . . . . . . . . . . 2,705.1 2,207.8 2,428.2International . . . . . . . . . . . . . . . . . . . . . . . . . . . . . . . . . . . . . . . . . . . . . . 1,340.7 1,277.2 1,377.5Other . . . . . . . . . . . . . . . . . . . . . . . . . . . . . . . . . . . . . . . . . . . . . . . . . . . . 74.7 153.3 250.8
Total segment sales . . . . . . . . . . . . . . . . . . . . . . . . . . . . . . . . . . . . 14,384.4 12,964.6 14,507.4
Intersegment sales—Pork . . . . . . . . . . . . . . . . . . . . . . . . . . . . . . . . . . . . . . . . . . . . . . . . . . . . (30.5) (31.5) (43.9)Hog Production . . . . . . . . . . . . . . . . . . . . . . . . . . . . . . . . . . . . . . . . . . . (2,113.0) (1,695.0) (1,936.8)International . . . . . . . . . . . . . . . . . . . . . . . . . . . . . . . . . . . . . . . . . . . . . . (38.2) (35.5) (39.0)
Total intersegment sales . . . . . . . . . . . . . . . . . . . . . . . . . . . . . . . . . (2,181.7) (1,762.0) (2,019.7)
Consolidated sales . . . . . . . . . . . . . . . . . . . . . . . . . . . . . . . . . $ 12,202.7 $ 11,202.6 $ 12,487.7
Depreciation and amortization:Pork . . . . . . . . . . . . . . . . . . . . . . . . . . . . . . . . . . . . . . . . . . . . . . . . . . . . . . . . $ 125.5 $ 126.0 $ 140.5Hog Production . . . . . . . . . . . . . . . . . . . . . . . . . . . . . . . . . . . . . . . . . . . . . . . 65.7 74.9 83.2International . . . . . . . . . . . . . . . . . . . . . . . . . . . . . . . . . . . . . . . . . . . . . . . . . . 38.1 37.4 41.8Other . . . . . . . . . . . . . . . . . . . . . . . . . . . . . . . . . . . . . . . . . . . . . . . . . . . . . . . . 0.1 0.2 0.4Corporate . . . . . . . . . . . . . . . . . . . . . . . . . . . . . . . . . . . . . . . . . . . . . . . . . . . . 2.5 3.8 4.6
Consolidated depreciation and amortization . . . . . . . . . . . . . $ 231.9 $ 242.3 $ 270.5
Interest expense:Pork . . . . . . . . . . . . . . . . . . . . . . . . . . . . . . . . . . . . . . . . . . . . . . . . . . . . . . . . $ 42.4 $ 48.9 $ 76.6Hog Production . . . . . . . . . . . . . . . . . . . . . . . . . . . . . . . . . . . . . . . . . . . . . . . 124.5 100.5 39.1International . . . . . . . . . . . . . . . . . . . . . . . . . . . . . . . . . . . . . . . . . . . . . . . . . . 28.2 37.7 64.4Other . . . . . . . . . . . . . . . . . . . . . . . . . . . . . . . . . . . . . . . . . . . . . . . . . . . . . . . . 4.2 6.9 2.7Corporate . . . . . . . . . . . . . . . . . . . . . . . . . . . . . . . . . . . . . . . . . . . . . . . . . . . . 46.1 72.4 39.0
Consolidated interest expense . . . . . . . . . . . . . . . . . . . . . . . . $ 245.4 $ 266.4 $ 221.8
Equity in (income) loss of affiliates:Pork . . . . . . . . . . . . . . . . . . . . . . . . . . . . . . . . . . . . . . . . . . . . . . . . . . . . . . . . $ (2.0) $ (3.6) $ (3.0)Hog Production . . . . . . . . . . . . . . . . . . . . . . . . . . . . . . . . . . . . . . . . . . . . . . . (0.4) 0.7 0.4International . . . . . . . . . . . . . . . . . . . . . . . . . . . . . . . . . . . . . . . . . . . . . . . . . . (46.5) (17.2) 17.8Other . . . . . . . . . . . . . . . . . . . . . . . . . . . . . . . . . . . . . . . . . . . . . . . . . . . . . . . . (1.2) (18.5) 34.9Corporate . . . . . . . . . . . . . . . . . . . . . . . . . . . . . . . . . . . . . . . . . . . . . . . . . . . . — —
Consolidated equity in (income) loss of affiliates . . . . . . . . . $ (50.1) $ (38.6) $ 50.1
Operating profit (loss):Pork . . . . . . . . . . . . . . . . . . . . . . . . . . . . . . . . . . . . . . . . . . . . . . . . . . . . . . . . $ 753.4 $ 538.7 $ 395.2Hog Production . . . . . . . . . . . . . . . . . . . . . . . . . . . . . . . . . . . . . . . . . . . . . . . 224.4 (539.2) (491.3)International . . . . . . . . . . . . . . . . . . . . . . . . . . . . . . . . . . . . . . . . . . . . . . . . . . 115.9 127.9 5.0Other . . . . . . . . . . . . . . . . . . . . . . . . . . . . . . . . . . . . . . . . . . . . . . . . . . . . . . . . (2.4) 3.6 (46.6)Corporate . . . . . . . . . . . . . . . . . . . . . . . . . . . . . . . . . . . . . . . . . . . . . . . . . . . . 3.7 (68.2) (86.2)
Consolidated operating profit (loss) . . . . . . . . . . . . . . . . . . . . $ 1,095.0 $ 62.8 $ (223.9)
115

May 1,2011
May 2,2010
May 3,2009
(in millions)
Segment Asset InformationTotal assets:
Pork . . . . . . . . . . . . . . . . . . . . . . . . . . . . . . . . . . . . . . . . . . . . . . . . . . $ 2,620.2 $ 2,579.3 $ 2,571.3Hog Production . . . . . . . . . . . . . . . . . . . . . . . . . . . . . . . . . . . . . . . . . 2,074.2 2,020.9 2,159.8International . . . . . . . . . . . . . . . . . . . . . . . . . . . . . . . . . . . . . . . . . . . 1,885.1 1,650.1 1,602.4Other . . . . . . . . . . . . . . . . . . . . . . . . . . . . . . . . . . . . . . . . . . . . . . . . . — 169.4 186.5Corporate . . . . . . . . . . . . . . . . . . . . . . . . . . . . . . . . . . . . . . . . . . . . . . 1,032.3 1,289.2 680.2
Consolidated total assets . . . . . . . . . . . . . . . . . . . . . . . . . . . . . . $ 7,611.8 $ 7,708.9 $ 7,200.2
Investments:Pork . . . . . . . . . . . . . . . . . . . . . . . . . . . . . . . . . . . . . . . . . . . . . . . . . . $ 17.4 $ 17.1 $ 15.5Hog Production . . . . . . . . . . . . . . . . . . . . . . . . . . . . . . . . . . . . . . . . . 2.7 2.4 2.2International . . . . . . . . . . . . . . . . . . . . . . . . . . . . . . . . . . . . . . . . . . . 544.9 478.7 465.6Other . . . . . . . . . . . . . . . . . . . . . . . . . . . . . . . . . . . . . . . . . . . . . . . . . — 106.7 87.0Corporate . . . . . . . . . . . . . . . . . . . . . . . . . . . . . . . . . . . . . . . . . . . . . . 17.5 20.1 31.3
Consolidated investments . . . . . . . . . . . . . . . . . . . . . . . . . . . . . $ 582.5 $ 625.0 $ 601.6
Capital expenditures:Pork . . . . . . . . . . . . . . . . . . . . . . . . . . . . . . . . . . . . . . . . . . . . . . . . . . $ 81.3 $ 141.7 $ 115.1Hog Production . . . . . . . . . . . . . . . . . . . . . . . . . . . . . . . . . . . . . . . . . 68.6 10.0 25.8International . . . . . . . . . . . . . . . . . . . . . . . . . . . . . . . . . . . . . . . . . . . 26.8 22.1 23.6Corporate . . . . . . . . . . . . . . . . . . . . . . . . . . . . . . . . . . . . . . . . . . . . . . 0.1 0.9 14.8Discontinued operations . . . . . . . . . . . . . . . . . . . . . . . . . . . . . . . . . . — — 7.1
Consolidated capital expenditures . . . . . . . . . . . . . . . . . . . . . . . $ 176.8 $ 174.7 $ 186.4
The following table shows the change in the carrying amount of goodwill by reportable segment:
Pork InternationalHog
Production Other Total
(in millions)
Balance, May 3, 2009 . . . . . . . . . . . . . . . . . . . . . . $ 217.6 $ 127.8 $ 455.1 $ 19.5 $ 820.0Impairment(1) . . . . . . . . . . . . . . . . . . . . . . . . . (0.5) — (6.0) — (6.5)Other goodwill adjustments(2) . . . . . . . . . . . . (0.6) 13.6 (3.6) — 9.4
Balance, May 2, 2010 . . . . . . . . . . . . . . . . . . . . . . 216.5 141.4 445.5 19.5 822.9Disposals(1) . . . . . . . . . . . . . . . . . . . . . . . . . . — — (25.5) (19.5) (45.0)Other goodwill adjustments(2) . . . . . . . . . . . . (0.4) 15.8 — — 15.4
Balance, May 1, 2011 . . . . . . . . . . . . . . . . . . . . . . $ 216.1 $ 157.2 $ 420.0 $ — $ 793.3
(1) See Note 3—Impairment and Disposal of Long-lived Assets for discussion of disposals and impairments.
(2) Other goodwill adjustments primarily include the effects of foreign currency translation.
116
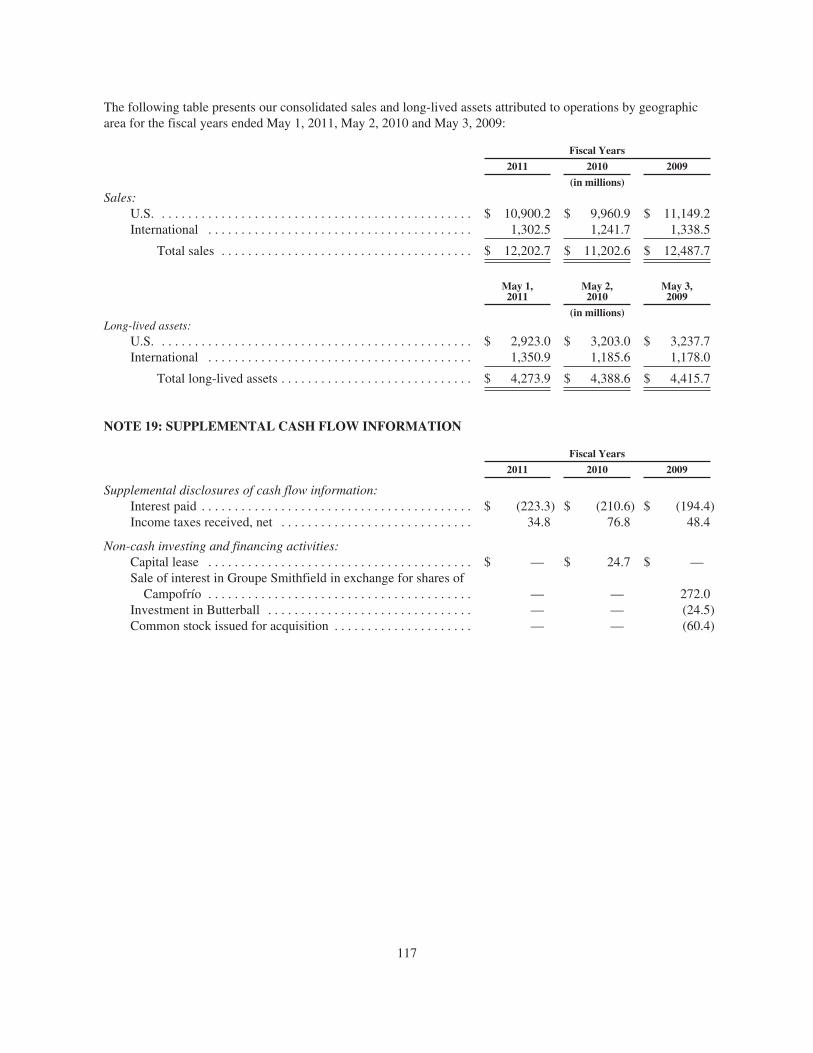
The following table presents our consolidated sales and long-lived assets attributed to operations by geographicarea for the fiscal years ended May 1, 2011, May 2, 2010 and May 3, 2009:
Fiscal Years
2011 2010 2009
(in millions)
Sales:U.S. . . . . . . . . . . . . . . . . . . . . . . . . . . . . . . . . . . . . . . . . . . . . . . . $ 10,900.2 $ 9,960.9 $ 11,149.2International . . . . . . . . . . . . . . . . . . . . . . . . . . . . . . . . . . . . . . . . 1,302.5 1,241.7 1,338.5
Total sales . . . . . . . . . . . . . . . . . . . . . . . . . . . . . . . . . . . . . . $ 12,202.7 $ 11,202.6 $ 12,487.7
May 1,2011
May 2,2010
May 3,2009
(in millions)Long-lived assets:
U.S. . . . . . . . . . . . . . . . . . . . . . . . . . . . . . . . . . . . . . . . . . . . . . . . $ 2,923.0 $ 3,203.0 $ 3,237.7International . . . . . . . . . . . . . . . . . . . . . . . . . . . . . . . . . . . . . . . . 1,350.9 1,185.6 1,178.0
Total long-lived assets . . . . . . . . . . . . . . . . . . . . . . . . . . . . . $ 4,273.9 $ 4,388.6 $ 4,415.7
NOTE 19: SUPPLEMENTAL CASH FLOW INFORMATION
Fiscal Years
2011 2010 2009
Supplemental disclosures of cash flow information:Interest paid . . . . . . . . . . . . . . . . . . . . . . . . . . . . . . . . . . . . . . . . . $ (223.3) $ (210.6) $ (194.4)Income taxes received, net . . . . . . . . . . . . . . . . . . . . . . . . . . . . . 34.8 76.8 48.4
Non-cash investing and financing activities:Capital lease . . . . . . . . . . . . . . . . . . . . . . . . . . . . . . . . . . . . . . . . $ — $ 24.7 $ —Sale of interest in Groupe Smithfield in exchange for shares of
Campofrío . . . . . . . . . . . . . . . . . . . . . . . . . . . . . . . . . . . . . . . . — — 272.0Investment in Butterball . . . . . . . . . . . . . . . . . . . . . . . . . . . . . . . — — (24.5)Common stock issued for acquisition . . . . . . . . . . . . . . . . . . . . . — — (60.4)
117
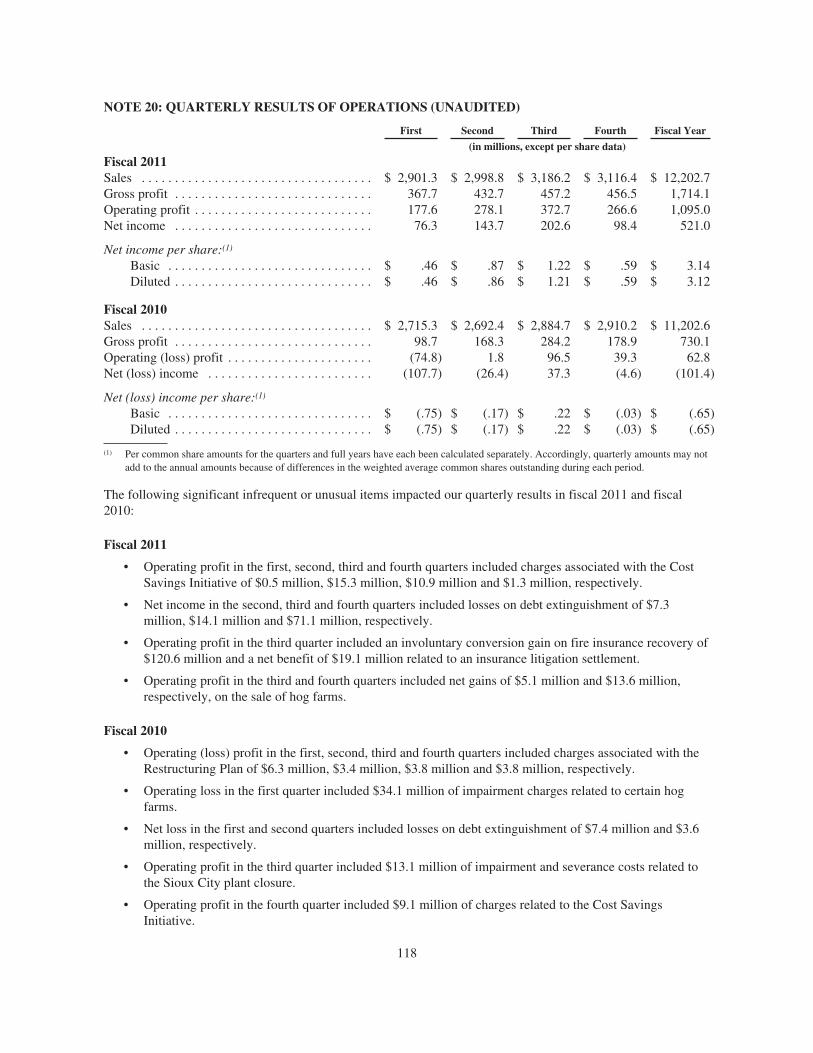
NOTE 20: QUARTERLY RESULTS OF OPERATIONS (UNAUDITED)
First Second Third Fourth Fiscal Year
(in millions, except per share data)
Fiscal 2011Sales . . . . . . . . . . . . . . . . . . . . . . . . . . . . . . . . . . . $ 2,901.3 $ 2,998.8 $ 3,186.2 $ 3,116.4 $ 12,202.7Gross profit . . . . . . . . . . . . . . . . . . . . . . . . . . . . . . 367.7 432.7 457.2 456.5 1,714.1Operating profit . . . . . . . . . . . . . . . . . . . . . . . . . . . 177.6 278.1 372.7 266.6 1,095.0Net income . . . . . . . . . . . . . . . . . . . . . . . . . . . . . . 76.3 143.7 202.6 98.4 521.0
Net income per share:(1)
Basic . . . . . . . . . . . . . . . . . . . . . . . . . . . . . . . $ .46 $ .87 $ 1.22 $ .59 $ 3.14Diluted . . . . . . . . . . . . . . . . . . . . . . . . . . . . . . $ .46 $ .86 $ 1.21 $ .59 $ 3.12
Fiscal 2010Sales . . . . . . . . . . . . . . . . . . . . . . . . . . . . . . . . . . . $ 2,715.3 $ 2,692.4 $ 2,884.7 $ 2,910.2 $ 11,202.6Gross profit . . . . . . . . . . . . . . . . . . . . . . . . . . . . . . 98.7 168.3 284.2 178.9 730.1Operating (loss) profit . . . . . . . . . . . . . . . . . . . . . . (74.8) 1.8 96.5 39.3 62.8Net (loss) income . . . . . . . . . . . . . . . . . . . . . . . . . (107.7) (26.4) 37.3 (4.6) (101.4)
Net (loss) income per share:(1)
Basic . . . . . . . . . . . . . . . . . . . . . . . . . . . . . . . $ (.75) $ (.17) $ .22 $ (.03) $ (.65)Diluted . . . . . . . . . . . . . . . . . . . . . . . . . . . . . . $ (.75) $ (.17) $ .22 $ (.03) $ (.65)
(1) Per common share amounts for the quarters and full years have each been calculated separately. Accordingly, quarterly amounts may notadd to the annual amounts because of differences in the weighted average common shares outstanding during each period.
The following significant infrequent or unusual items impacted our quarterly results in fiscal 2011 and fiscal2010:
Fiscal 2011
• Operating profit in the first, second, third and fourth quarters included charges associated with the CostSavings Initiative of $0.5 million, $15.3 million, $10.9 million and $1.3 million, respectively.
• Net income in the second, third and fourth quarters included losses on debt extinguishment of $7.3million, $14.1 million and $71.1 million, respectively.
• Operating profit in the third quarter included an involuntary conversion gain on fire insurance recovery of$120.6 million and a net benefit of $19.1 million related to an insurance litigation settlement.
• Operating profit in the third and fourth quarters included net gains of $5.1 million and $13.6 million,respectively, on the sale of hog farms.
Fiscal 2010
• Operating (loss) profit in the first, second, third and fourth quarters included charges associated with theRestructuring Plan of $6.3 million, $3.4 million, $3.8 million and $3.8 million, respectively.
• Operating loss in the first quarter included $34.1 million of impairment charges related to certain hogfarms.
• Net loss in the first and second quarters included losses on debt extinguishment of $7.4 million and $3.6million, respectively.
• Operating profit in the third quarter included $13.1 million of impairment and severance costs related tothe Sioux City plant closure.
• Operating profit in the fourth quarter included $9.1 million of charges related to the Cost SavingsInitiative.
118
NOTE 21: SUBSEQUENT EVENTS
Working Capital Facilities
In June 2011 (fiscal 2012), we refinanced the ABL Credit Facility into two separate facilities: (1) an inventorybased revolving credit facility up to $925 million, with an option to expand up to $1.25 billion (the InventoryRevolver), and (2) an accounts receivable securitization facility up to $275 million (the Securitization Facility).We may request working capital loans and letters of credit under both facilities.
Availability under the Inventory Revolver is a function of the level of eligible inventories, subject to reserves.The Inventory Revolver matures in June 2016. However, it will mature on March 15, 2014 if the outstandingprincipal balance of the 2014 Notes, net of the amount of cash in excess of $75 million, exceeds $300 million onthat date. The unused commitment fee and the interest rate spreads are a function of our leverage ratio (as definedin the Second Amended and Restated Credit Agreement). The initial unused commitment fee and spread aboveLIBOR are 0.5% and 2.75%, respectively. The Inventory Revolver includes financial covenants. The ratio of ourfunded debt to capitalization (as defined in the Second Amended and Restated Credit Agreement) may notexceed 0.5 to 1.0, and our EBITDA to interest expense ratio (as defined in the Second Amended and RestatedCredit agreement) may not be less than 2.5 to 1.0. Obligations under the Inventory Revolver are guaranteed byour material U.S. subsidiaries and are secured by (i) a first priority lien on the Inventory Revolver Collateral, and(ii) a second priority lien on the Non-ABL Collateral. We incurred approximately $12.0 million in transactionfees in connection with the Inventory Revolver, which will be amortized over its five year life.
The term of the Securitization Facility is three years. All accounts receivable will be sold by our principal U.S.operating subsidiaries to a wholly-owned “bankruptcy remote” special purpose vehicle (SPV). The SPV willpledge the receivables as security for loans and letters of credit from a conduit lender or a committed lender. TheSPV will be included in our consolidated financial statements and therefore, the accounts receivable owned by itwill be included in our consolidated balance sheet. However, the accounts receivable owned by the SPV will beseparate and distinct from our other assets and will not be available to our creditors should we become insolvent.The unused commitment fee and the interest rate spreads are a function of our leverage ratio (as defined in theSecond Amended and Restated Credit Agreement). The initial unused commitment fee and spread above theconduit lender’s cost of funds (or in the case of funding by the committed lender, above LIBOR) are 0.5% and1.5%, respectively. We incurred approximately $2.5 million in transaction fees in connection with theSecuritization Facility, which will be amortized over its three year life.
Rabobank Term Loan
In June 2011 (fiscal 2012), we refinanced the Rabobank Term Loan and extended its maturity date fromAugust 29, 2013 to June 9, 2016. We are obligated to repay $25.0 million of the principal under the RabobankTerm Loan on June 9, 2015. We may elect to prepay the loan at any time, subject to the payment of certainprepayment fees in respect of any voluntary prepayment prior to June 9, 2013 and other customary breakagecosts. Interest accrues, at our option, at LIBOR plus 3.75% or a base rate (the greater of Rabobank’s prime rateand the Federal funds rate plus 0.5%). Obligations under the Rabobank Term Loan are guaranteed by ourmaterial U.S. subsidiaries and are secured by a first priority lien on the Non-ABL Collateral and a second prioritylien on the Inventory Revolver Collateral. We incurred approximately $1.0 million in transaction fees inconnection with the amendment and extension of the Rabobank Term Loan, which will be amortized over thefive year life of the loan.
Share Repurchase Authorization
In June 2011 (fiscal 2012), we announced that our board of directors had approved a share repurchase programauthorizing us to buy up to $150 million of our common stock over the next 24 months. Share repurchases wouldbe funded from cash on hand. This authorization replaces our previous share repurchase program. Sharerepurchases may be made on the open market, or in privately negotiated transactions. The number of sharesrepurchased, and the timing of any buybacks, will depend on corporate cash balances, business and economicconditions, and other factors, including investment opportunities. The program may be discontinued at any time.
119
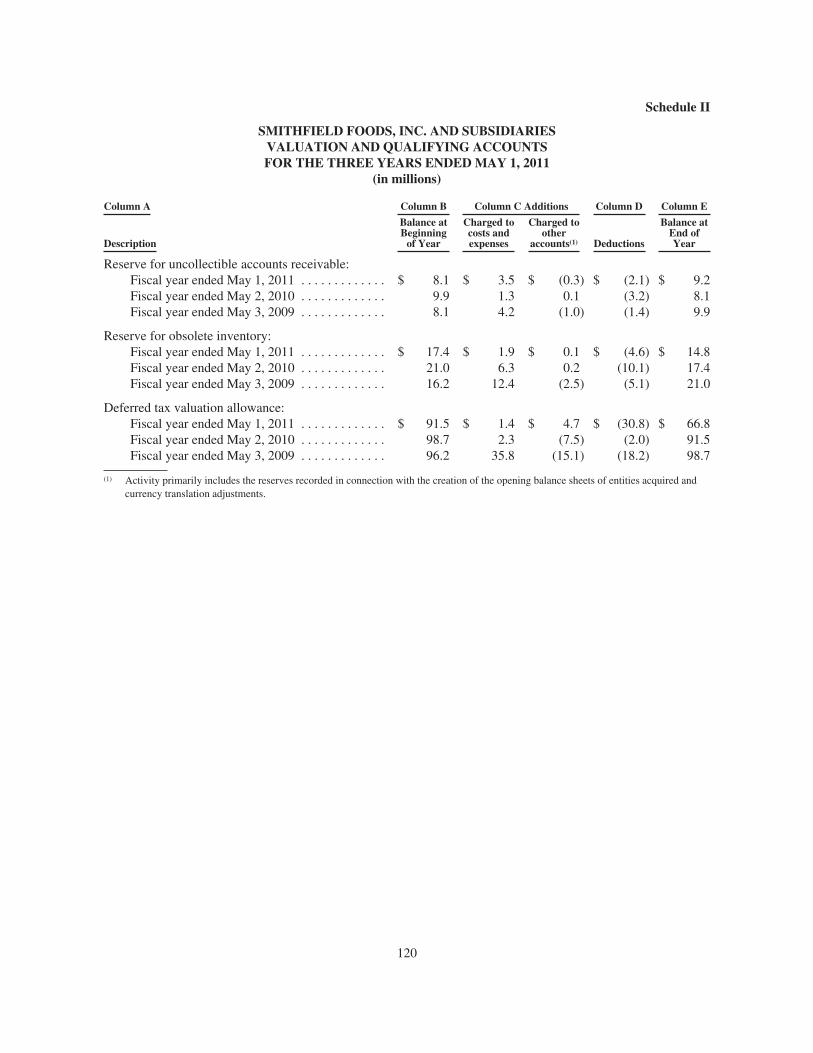
Schedule II
SMITHFIELD FOODS, INC. AND SUBSIDIARIESVALUATION AND QUALIFYING ACCOUNTSFOR THE THREE YEARS ENDED MAY 1, 2011
(in millions)
Column A Column B Column C Additions Column D Column E
Description
Balance atBeginning
of Year
Charged tocosts andexpenses
Charged toother
accounts(1) Deductions
Balance atEnd ofYear
Reserve for uncollectible accounts receivable:Fiscal year ended May 1, 2011 . . . . . . . . . . . . . $ 8.1 $ 3.5 $ (0.3) $ (2.1) $ 9.2Fiscal year ended May 2, 2010 . . . . . . . . . . . . . 9.9 1.3 0.1 (3.2) 8.1Fiscal year ended May 3, 2009 . . . . . . . . . . . . . 8.1 4.2 (1.0) (1.4) 9.9
Reserve for obsolete inventory:Fiscal year ended May 1, 2011 . . . . . . . . . . . . . $ 17.4 $ 1.9 $ 0.1 $ (4.6) $ 14.8Fiscal year ended May 2, 2010 . . . . . . . . . . . . . 21.0 6.3 0.2 (10.1) 17.4Fiscal year ended May 3, 2009 . . . . . . . . . . . . . 16.2 12.4 (2.5) (5.1) 21.0
Deferred tax valuation allowance:Fiscal year ended May 1, 2011 . . . . . . . . . . . . . $ 91.5 $ 1.4 $ 4.7 $ (30.8) $ 66.8Fiscal year ended May 2, 2010 . . . . . . . . . . . . . 98.7 2.3 (7.5) (2.0) 91.5Fiscal year ended May 3, 2009 . . . . . . . . . . . . . 96.2 35.8 (15.1) (18.2) 98.7
(1) Activity primarily includes the reserves recorded in connection with the creation of the opening balance sheets of entities acquired andcurrency translation adjustments.
120

ITEM 9. CHANGES IN AND DISAGREEMENTS WITH ACCOUNTANTS ON ACCOUNTING ANDFINANCIAL DISCLOSURE
None.
ITEM 9A. CONTROLS AND PROCEDURES
EVALUATION OF DISCLOSURE CONTROLS AND PROCEDURES
An evaluation was performed under the supervision and with the participation of management, including theChief Executive Officer (CEO) and the Chief Financial Officer (CFO), regarding the effectiveness of the designand operation of our disclosure controls and procedures (as defined in Rule 13a-15(e) promulgated under theSecurities Exchange Act of 1934, as amended) as of May 1, 2011. Based on that evaluation, management,including the CEO and CFO, has concluded that our disclosure controls and procedures were effective as ofMay 1, 2011.
MANAGEMENT’S ANNUAL REPORT ON INTERNAL CONTROL OVER FINANCIAL REPORTING
Management is responsible for establishing and maintaining adequate internal control over financial reporting, asdefined in Rules 13a-15(f) of the Securities Exchange Act of 1934. Our internal control system was designed toprovide reasonable assurance to management and the board of directors regarding the preparation and fairpresentation of published financial statements. Because of its inherent limitations, internal control over financialreporting may not prevent or detect misstatements. Also, projections of any evaluation of effectiveness to futureperiods are subject to the risk that controls may become inadequate because of changes in conditions, or thedegree of compliance with the policies or procedures may deteriorate.
Management conducted an evaluation of the effectiveness of our internal control over financial reporting as ofMay 1, 2011. In making this assessment, we used criteria set forth by the Committee of SponsoringOrganizations of the Treadway Commission (COSO) in Internal Control-Integrated Framework. Based on thisevaluation under the framework in Internal Control—Integrated Framework issued by COSO, managementconcluded that our internal control over financial reporting was effective as of May 1, 2011.
Our independent registered public accounting firm, Ernst & Young LLP, has audited the financial statementsincluded in this Form 10-K and has issued an attestation report on our internal control over financial reporting.Their attestation report on our internal control over financial reporting and their attestation report on the audit ofthe consolidated financial statements are included in “Item 8. Financial Statements and Supplementary Data” ofthis Annual Report on Form 10-K.
CHANGES IN INTERNAL CONTROL OVER FINANCIAL REPORTING
In the quarter ended May 1, 2011, there were no changes in our internal control over financial reporting that havematerially affected, or are reasonably likely to materially affect, our internal control over financial reporting.
ITEM 9B. OTHER INFORMATION
Not applicable.
121

PART III
ITEM 10. DIRECTORS, EXECUTIVE OFFICERS AND CORPORATE GOVERNANCE
Information required by this Item regarding our executive officers is included in Part I of this Annual Report onForm 10-K.
All other information required by this Item is incorporated by reference to our definitive proxy statement to befiled with respect to our Annual Meeting of Shareholders to be held on September 21, 2011 under the headingsentitled “Nominees for Election to Three-Year Terms,” “Directors whose Terms do not Expire this Year,”“Section 16(a) Beneficial Ownership Reporting Compliance” and “Corporate Governance.”
ITEM 11. EXECUTIVE COMPENSATION
Information required by this Item is incorporated by reference to our definitive proxy statement to be filed withrespect to our Annual Meeting of Shareholders to be held on September 21, 2011 under the headings (includingthe narrative disclosures following a referenced table) entitled “Compensation Discussion and Analysis,”“Summary Compensation Table,” “Grants of Plan-Based Awards,” “Outstanding Equity Awards at Fiscal Year-End,” “Option Exercises and Stock Vested,” “Pension Benefits,” “Nonqualified Deferred Compensation,”“Estimated Payments Upon Severance or Change-in-Control,” “Director Compensation,” “CompensationCommittee Report,” and “Compensation Committee Interlocks and Insider Participation.”
ITEM 12. SECURITY OWNERSHIP OF CERTAIN BENEFICIAL OWNERS AND MANAGEMENTAND RELATED STOCKHOLDER MATTERS
Information required by this Item is incorporated by reference to our definitive proxy statement to be filed withrespect to our Annual Meeting of Shareholders to be held on September 21, 2011 under the headings entitled“Principal Shareholders,” “Common Stock Ownership of Executive Officers and Directors” and “EquityCompensation Plan Information.”
ITEM 13. CERTAIN RELATIONSHIPS, RELATED TRANSACTIONS AND DIRECTORINDEPENDENCE
Information required by this Item is incorporated by reference to our definitive proxy statement to be filed withrespect to our Annual Meeting of Shareholders to be held on September 21, 2011 under the headings entitled“Related Party Transactions” and “Corporate Governance.”
ITEM 14. PRINCIPAL ACCOUNTING FEES AND SERVICES
Information required by this Item is incorporated by reference to our definitive proxy statement to be filed withrespect to our Annual Meeting of Shareholders to be held on September 21, 2011 under the headings entitled“Audit Committee Report” and “Ratification of Selection of Independent Auditors.”
122
PART IV
ITEM 15. EXHIBITS AND FINANCIAL STATEMENT SCHEDULES
The following documents are filed as part of this report:
1. Financial Statements:
• Consolidated Statements of Income for the Fiscal Years 2011, 2010 and 2009
• Consolidated Balance Sheets as of May 1, 2011 and May 2, 2010
• Consolidated Statements of Cash Flows for the Fiscal Years 2011, 2010 and 2009
• Consolidated Statements of Shareholders’ Equity for the Fiscal Years 2011, 2010 and 2009
• Notes to Consolidated Financial Statements
• Report of Independent Registered Public Accounting Firm on Internal Control Over Financial Reporting
• Report of Independent Registered Public Accounting Firm on Consolidated Financial Statements
2. Financial Statement Schedule—Schedule II—Valuation and Qualifying Accounts
Certain financial statement schedules are omitted because they are not applicable or the required information isincluded herein or is shown in the consolidated financial statements or related notes filed as part of this report.
3. Exhibits
Exhibit 2.1 — Stock Purchase Agreement, dated March 4, 2008, by and among Smithfield Foods,Inc., and JBS S.A. (incorporated by reference to Exhibit 2.1 to the Company’sCurrent Report on Form 8-K filed with the SEC on March 5, 2008).
Exhibit 2.2(a) — Purchase Agreement, dated March 4, 2008, by and among Continental GrainCompany, ContiBeef LLC, Smithfield Foods, Inc., and MF Cattle Feeding, Inc.(incorporated by reference to Exhibit 2.2 to the Company’s Current Report onForm 8-K filed with the SEC on March 5, 2008).
Exhibit 2.2(b) — Amendment, dated October 23, 2008, to the Purchase Agreement, dated as ofMarch 4, 2008, by and among Continental Grain Company, ContiBeef LLC,Smithfield Foods, Inc. and MF Cattle Feeding, Inc. (incorporated by reference toExhibit 2.3 to the Company’s Current Report on Form 8-K filed with the SEC onOctober 24, 2008).
Exhibit 3.1 — Articles of Amendment effective August 27, 2009 to the Amended and RestatedArticles of Incorporation, including the Amended and Restated Articles ofIncorporation of the Company, as amended to date (incorporated by reference toExhibit 3.1 to the Company’s Quarterly Report on Form 10-Q filed with the SEC onSeptember 11, 2009).
Exhibit 3.2 — Amendment to the Bylaws effective June 16, 2010, including the Bylaws of theCompany, as amended to date (incorporated by reference to Exhibit 3.2 to theCompany’s Annual Report on Form 10-K filed with the SEC on June 18, 2010).
Exhibit 4.1 — Indenture between the Company and SunTrust Bank, as trustee, dated May 21, 2003regarding the issuance by the Company of $350,000,000 senior notes (incorporatedby reference to Exhibit 4.11(a) to the Company’s Annual Report on Form 10-K filedwith the SEC on July 23, 2003).
123
Exhibit 4.2 — Indenture between the Company and U.S. Bank National Association (successor toSunTrust Bank), as trustee, dated August 4, 2004 regarding the issuance by theCompany of senior notes (incorporated by reference to Exhibit 4.1 to the Company’sQuarterly Report on Form 10-Q filed with the SEC on September 10, 2004).
Exhibit 4.3(a) — Registration Rights Agreement, dated May 7, 2007, among the Company andContiGroup Companies, Inc. (incorporated by reference to Exhibit 4.1 to theCompany’s Current Report on Form 8-K filed with the SEC on May 7, 2007).
Exhibit 4.3(b) — Amendment No. 1, dated as of October 23, 2008, to the Registration RightsAgreement, dated as of May 7, 2007, by and between Smithfield Foods, Inc. andContinental Grain Company (incorporated by reference to Exhibit 4.1 to theCompany’s Current Report on Form 8-K filed with the SEC on October 24, 2008).
Exhibit 4.4(a) — Indenture-Senior Debt Securities, dated June 1, 2007, between the Company andU.S. Bank National Association as trustee (incorporated by reference to Exhibit4.10(a) to the Company’s Annual Report on Form 10-K filed with the SEC onJune 28, 2007).
Exhibit 4.4(b) — First Supplemental Indenture to the Indenture-Senior Debt Securities between theCompany and U.S. Bank National Association, as trustee, dated as of June 22, 2007regarding the issuance by the Company of the 2007 7.750% Senior Notes due 2017(incorporated by reference to Exhibit 4.10(b) to the Company’s Annual Report onForm 10-K filed with the SEC on June 28, 2007).
Exhibit 4.4(c) — Second Supplemental Indenture to the Indenture-Senior Debt Securities between theCompany and U.S. Bank National Association, as trustee, dated as of July 8, 2008regarding the issuance by the Company of the 2008 4.00% Convertible Senior Notesdue 2013 (incorporated by reference to Exhibit 4.8 to the Company’s QuarterlyReport on Form 10-Q filed with the SEC on September 5, 2008).
Exhibit 4.5(a) — Indenture, dated July 2, 2009, among the Company, the Guarantors and U.S. BankNational Association, as Trustee (incorporated by reference to Exhibit 4.1 to theCompany’s Current Report on Form 8-K filed with the SEC on July 8, 2009).
Exhibit 4.5(b) — Form of 10% Senior Secured Note Due 2014 (incorporated by reference toExhibit 4.2 to the Company’s Current Report on Form 8-K filed with the SEC onJuly 8, 2009).
Exhibit 4.5(c) — Form of 10% Senior Secured Note Due 2014 (incorporated by reference toExhibit 4.2 to the Company’s Current Report on Form 8-K filed with the SEC onAugust 14, 2009).
Exhibit 4.6 — Form of Subordinated Indenture between the Company and U.S. Bank NationalAssociation, as trustee, as supplemented from time to time (incorporated byreference to Exhibit 4.6 to the Company’s Registration Statement on Form S-3 filedwith the SEC on June 25, 2010).
Registrant hereby agrees to furnish the SEC, upon request, other instrumentsdefining the rights of holders of long-term debt of the Registrant.
Exhibit 10.1(a)** — Smithfield Foods, Inc. 1998 Stock Incentive Plan (incorporated by reference toExhibit 10.7 to the Company’s Form 10-K Annual Report filed with the SEC onJuly 30, 1998).
Exhibit 10.1(b)** — Amendment No. 1 to the Smithfield Foods, Inc. 1998 Stock Incentive Plan datedAugust 29, 2000 (incorporated by reference to Exhibit 10.6(b) of the Company’sAnnual Report on Form 10-K filed with the SEC on July 29, 2002).
124
Exhibit 10.1(c)** — Amendment No. 2 to the Smithfield Foods, Inc. 1998 Stock Incentive Plan datedAugust 29, 2001 (incorporated by reference to Exhibit 10.6(c) of the Company’sAnnual Report on Form 10-K filed with the SEC on July 29, 2002).
Exhibit 10.1(d)** — Form of Nonstatutory Stock Option Agreement for the Smithfield Foods, Inc. 1998Stock Incentive Plan (incorporated by reference to Exhibit 10.3(d) to the Company’sAnnual Report on Form 10-K filed with the SEC on July 11, 2005).
Exhibit 10.2** — Smithfield Foods, Inc. 2005 Non-Employee Directors Stock Incentive Plan(incorporated by reference to Exhibit 10.1 to the Company’s Current Report onForm 8-K filed with the SEC on September 1, 2005).
Exhibit 10.3** — Consulting Agreement, dated August 30, 2006, by and between the Company andJoseph W. Luter, III (incorporated by reference to Exhibit 10.2 to the Company’sCurrent Report on Form 8-K filed with the SEC on September 6, 2006).
Exhibit 10.4 — Purchase Agreement, dated as of June 30, 2008, among Smithfield Foods, Inc.,Starbase International Limited and COFCO (Hong Kong) Limited (incorporated byreference to Exhibit 10.4 to the Company’s Quarterly Report on Form 10-Q filedwith the SEC on September 5, 2008).
Exhibit 10.5 — Merger Protocol, dated June 30, 2008, between Campofrío Alimentación, S.A. andGroupe Smithfield Holdings, S.L. and others (incorporated by reference toExhibit 10.5 to the Company’s Quarterly Report on Form 10-Q filed with the SECon September 5, 2008).
Exhibit 10.6(a) — Master Terms and Conditions for Convertible Bond Hedging Transactions, dated asof July 1, 2008, between Citibank, N.A. and Smithfield Foods, Inc. (incorporated byreference to Exhibit 10.1 to the Company’s Current Report on Form 8-K filed withthe SEC on July 8, 2008).
Exhibit 10.6(b) — Master Terms and Conditions for Convertible Bond Hedging Transactions, dated asof July 1, 2008, between Goldman, Sachs & Co. and Smithfield Foods, Inc.(incorporated by reference to Exhibit 10.2 to the Company’s Current Report onForm 8-K filed with the SEC on July 8, 2008).
Exhibit 10.6(c) — Master Terms and Conditions for Convertible Bond Hedging Transactions, dated asof July 1, 2008, between JPMorgan Chase Bank, National Association, LondonBranch and Smithfield Foods, Inc. (incorporated by reference to Exhibit 10.3 to theCompany’s Current Report on Form 8-K filed with the SEC on July 8, 2008).
Exhibit 10.6(d) — Confirmation for Convertible Bond Hedging Transaction, dated July 1, 2008,between Citibank, N.A. and Smithfield Foods, Inc. (incorporated by reference toExhibit 10.4 to the Company’s Current Report on Form 8-K filed with the SEC onJuly 8, 2008).
Exhibit 10.6(e) — Confirmation for Convertible Bond Hedging Transaction, dated July 1, 2008,between Goldman, Sachs & Co. and Smithfield Foods, Inc. (incorporated byreference to Exhibit 10.5 to the Company’s Current Report on Form 8-K filed withthe SEC on July 8, 2008).
Exhibit 10.6(f) — Confirmation for Convertible Bond Hedging Transaction, dated July 1, 2008,between JPMorgan Chase Bank, National Association, London Branch andSmithfield Foods, Inc. (incorporated by reference to Exhibit 10.6 to the Company’sCurrent Report on Form 8-K filed with the SEC on July 8, 2008).
125

Exhibit 10.6(g) — Master Terms and Conditions for Warrants Issued by Smithfield Foods, Inc. toCitibank, N.A., dated as of July 1, 2008 (incorporated by reference to Exhibit 10.7 tothe Company’s Current Report on Form 8-K filed with the SEC on July 8, 2008).
Exhibit 10.6(h) — Master Terms and Conditions for Warrants Issued by Smithfield Foods, Inc. toGoldman, Sachs & Co., dated as of July 1, 2008 (incorporated by reference toExhibit 10.8 to the Company’s Current Report on Form 8-K filed with the SEC onJuly 8, 2008).
Exhibit 10.6(i) — Master Terms and Conditions for Warrants Issued by Smithfield Foods, Inc. toJPMorgan Chase Bank, National Association, London Branch, dated as of July 1,2008 (incorporated by reference to Exhibit 10.9 to the Company’s Current Report onForm 8-K filed with the SEC on July 8, 2008).
Exhibit 10.6(j) — Confirmation for Warrants Issued by Smithfield Foods, Inc. to Citibank, N.A., datedJuly 1, 2008 (incorporated by reference to Exhibit 10.10 to the Company’s CurrentReport on Form 8-K filed with the SEC on July 8, 2008).
Exhibit 10.6(k) — Confirmation for Warrants Issued by Smithfield Foods, Inc. to Goldman, Sachs &Co., dated July 1, 2008 (incorporated by reference to Exhibit 10.11 to theCompany’s Current Report on Form 8-K filed with the SEC on July 8, 2008).
Exhibit 10.6(l) — Confirmation for Warrants Issued by Smithfield Foods, Inc. to JPMorgan ChaseBank, National Association, London Branch, dated July 1, 2008 (incorporated byreference to Exhibit 10.12 to the Company’s Current Report on Form 8-K filed withthe SEC on July 8, 2008).
Exhibit 10.7(a)** — Smithfield Foods, Inc. Amended and Restated 2008 Incentive Compensation Plan(incorporated by reference to Exhibit 10.3 to the Company’s Quarterly Report onForm 10-Q filed with the SEC on September 11, 2009).
Exhibit 10.7(b)** — Form of Smithfield Foods, Inc. 2008 Incentive Compensation Plan PerformanceShare Unit Award (incorporated by reference to Exhibit 10.2 to the Company’sCurrent Report on Form 8-K filed with the SEC on September 3, 2008).
Exhibit 10.7(c)** — Form of Smithfield Foods, Inc. 2008 Incentive Compensation Plan Stock OptionAward (incorporated by reference to Exhibit 10.1 to the Company’s Current Reporton Form 8-K filed with the SEC on July 10, 2009).
Exhibit 10.7(d)** — Form of Smithfield Foods, Inc. 2008 Incentive Compensation Plan PerformanceShare Unit Award for fiscal 2010 (incorporated by reference to Exhibit 10.2 to theCompany’s Current Report on Form 8-K filed with the SEC on July 10, 2009).
Exhibit 10.7(e)** — Form of Smithfield Foods, Inc. 2008 Incentive Compensation Plan PerformanceShare Unit Award granted December 2009 (incorporated by reference toExhibit 10.2 to the Company’s Quarterly Report on Form 10-Q filed with the SECon March 12, 2010).
Exhibit 10.7(f)** — Summary of Performance Share Unit Awards to Executive Officers in the PorkGroup granted on June 15, 2010 (incorporated by reference to Exhibit 99.1 to theCompany’s Current Report on Form 8-K filed with the SEC on June 21, 2010).
Exhibit 10.7(g)** — Form of Smithfield Foods, Inc. 2008 Incentive Compensation Plan PerformanceShare Unit Award to Executive Officers in the Pork Group granted on June 15, 2010(incorporated by reference to Exhibit 10.3 to the Company’s Quarterly Report onForm 10-Q filed with the SEC on September 9, 2010).
126

Exhibit 10.8** — Description of Incentive Award granted to George H. Richter (incorporated byreference to Exhibit 99.1 to the Company’s Current Report on Form 8-K filed withthe SEC on October 6, 2009).
Exhibit 10.9** — Summary of Incentive Award, One-Time Cash Bonus and Performance Share Unitsgranted to Robert W. Manly, IV (incorporated by reference to Exhibit 99.1 to theCompany’s Current Report on Form 8- K filed with the SEC on December 14, 2009).
Exhibit 10.10 — Market Hog Contract Grower Agreement, dated May 13, 1998, by and betweenContinental Grain Company and CGC Asset Acquisition Corp. (incorporated byreference to Exhibit 10.3 to the Company’s Quarterly Report on Form 10-Q filedwith the SEC on March 12, 2010).
Exhibit 10.11** — Retirement Agreement and General Release dated as of August 9, 2010 between theCompany and Richard J. M. Poulson (incorporated by reference to Exhibit 99.1 to theCompany’s Current Report on Form 8-K filed with the SEC on August 16, 2010).
Exhibit 10.12** — Compensation for Named Executive Officers for fiscal 2011(incorporated byreference to Exhibit 10.4 to the Company’s Quarterly Report on Form 10-Q filedwith the SEC on September 9, 2010).
Exhibit 10.13** — Smithfield Foods, Inc. Change in Control Executive Severance Plan (incorporatedby reference to Exhibit 99.1 to the Company’s Current Report on Form 8-K filedwith the SEC on September 8, 2010).
Exhibit 10.14** — Compensation for Non-Employee Directors as of September 1, 2010 (incorporatedby reference to Exhibit 10.3 to the Company’s Quarterly Report on Form 10-Q filedwith the SEC on December 9, 2010).
Exhibit 10.15(a) — Credit Agreement, dated July 2, 2009, among the Company, the Guarantors, thelenders party thereto, JPMorgan Chase Bank, N.A., as administrative agent and jointcollateral agent, J.P. Morgan Securities Inc., General Electric Capital Corporation,Barclays Capital, Morgan Stanley Bank, N.A. and Coöperatieve Centrale Raiffeisen-Boerenleenbank B.A., “Rabobank Nederland”, New York Branch, as jointbookrunners and co-lead arrangers, General Electric Capital Corporation, as co-documentation and joint collateral agent, Barclay’s Capital and Morgan StanleyBank, N.A., as co- documentation agents and Coöperatieve Centrale Raiffeisen-Boerenleenbank B.A., “Rabobank Nederland”, New York Branch, as syndicationagent (incorporated by reference to Exhibit 4.3 to the Company’s Current Report onForm 8-K filed with the SEC on July 8, 2009).
Exhibit 10.15(b) — Amended and Restated Pledge and Security Agreement, dated July 2, 2009, amongthe Company, the Guarantors and JPMorgan Chase Bank, N.A., as administrativeagent (incorporated by reference to Exhibit 4.5 to the Company’s Current Report onForm 8-K filed with the SEC on July 8, 2009).
Exhibit 10.15(c) — First Amendment and Consent, dated as of October 29, 2009, to the Amended andRestated Credit Agreement, dated as of July 2, 2009, among the Company, theSubsidiary Guarantors, Coöperatieve Centrale Raiffeisen-Boerenleenbank B.A.,“Rabobank Nederland”, New York Branch, as syndication agent, Barclays Bank PLC,Morgan Stanley Bank, N.A. and General Electric Capital Corporation, asco-documentation agents, JPMorgan Chase Bank, N.A. and General Electric CapitalCorporation, as joint collateral agents, and JPMorgan Chase Bank, N.A. asadministrative agent and the Amended and Restated Pledge Agreement, dated as ofJuly 2, 2009, among the Company, the Subsidiary Guarantors and JPMorgan ChaseBank, N.A. as administrative agent (incorporated by reference to Exhibit 4.2 to theCompany’s Quarterly Report on Form 10-Q filed with the SEC on December 11, 2009).
127
Exhibit 10.16(a) — Term Loan Agreement, dated July 2, 2009, among the Company, the Guarantors, thelenders party thereto and Coöperatieve Centrale Raiffeisen-Boerenleenbank B.A.“Rabobank Nederland”, New York Branch, as administrative agent (incorporated byreference to Exhibit 4.4 to the Company’s Current Report on Form 8-K filed withthe SEC on July 8, 2009).
Exhibit 10.16(b) — First Amendment to Term Loan Agreement, dated as of June 9, 2011, among theCompany, the subsidiaries of the Company party thereto, Coöperatieve CentraleRaiffeisen-Boerenleenbank B.A. “Rabobank Nederland”, New York Branch, asadministrative agent and the lenders party thereto (incorporated by reference toExhibit 10.5 to the Company’s Current Report on Form 8-K filed with the SEC onJuly 16, 2011).
Exhibit 10.17 — Pledge and Security Agreement, dated July 2, 2009, among the Company, theGuarantors, and U.S. Bank National Association, as collateral agent (incorporated byreference to Exhibit 4.6 to the Company’s Current Report on Form 8-K filed withthe SEC on July 8, 2009).
Exhibit 10.18 — Intercreditor Agreement, dated July 2, 2009, among the Company, the Guarantors,JPMorgan Chase Bank, N.A., as administrative agent, and U.S. Bank NationalAssociation, as collateral agent (incorporated by reference to Exhibit 4.7 to theCompany’s Current Report on Form 8-K filed with the SEC on July 8, 2009).
Exhibit 10.19 — Intercreditor and Collateral Agency Agreement, dated July 2, 2009, among theCompany, the Guarantors, U.S Bank National Association, as collateral agent, U.S.Bank National Association, as trustee for the Notes, and Coöperatieve CentraleRaiffeisen-Boerenleenbank B.A. “Rabobank Nederland”, New York Branch, asadministrative agent (incorporated by reference to Exhibit 4.8 to the Company’sCurrent Report on Form 8-K filed with the SEC on July 8, 2009).
Exhibit 10.20(a) — Second Amended and Restated Credit Agreement, dated as of June 9, 2011, amongthe Company, the subsidiaries of the Company party thereto, Coöperatieve CentraleRaiffeisen-Boerenleenbank B.A., “Rabobank Nederland”, New York Branch, asAdministrative Agent, the lenders party thereto, and the other agents and arrangersparty thereto (incorporated by reference to Exhibit 10.1 to the Company’s CurrentReport on Form 8-K filed with the SEC on July 16, 2011).
Exhibit 10.20(b) — Second Amended and Restated Pledge and Security Agreement, dated as of June 9,2011, among the Company, the subsidiaries of the Company party thereto andCoöperatieve Centrale Raiffeisen- Boerenleenbank B.A., “Rabobank Nederland”, NewYork Branch, as Administrative Agent (incorporated by reference to Exhibit 10.2 tothe Company’s Current Report on Form 8-K filed with the SEC on July 16, 2011).
Exhibit 10.21 — Receivables Sale Agreement, dated as of June 9, 2011, among SmithfieldReceivables Funding LLC, the Company, SFFC, Inc., Farmland Foods, Inc., TheSmithfield Packing Company, Incorporated, Patrick Cudahy, LLC, Premium PetHealth, LLC, John Morrell & Co., Smithfield Global Products, Inc., and Armour-Eckrich Meats LLC (incorporated by reference to Exhibit 10.3 to the Company’sCurrent Report on Form 8-K filed with the SEC on July 16, 2011).
Exhibit 10.22 — Credit and Security Agreement, dated as of June 9, 2011, among SmithfieldReceivables Funding LLC,, the Company, Rabobank, as the Administrative Agentand certain lenders and co-agents party thereto (incorporated by reference toExhibit 10.4 to the Company’s Current Report on Form 8-K filed with the SEC onJuly 16, 2011).
128
Exhibit 21* — Subsidiaries of the Company.
Exhibit 23.1* — Consent of Independent Registered Public Accounting Firm.
Exhibit 31.1* — Certification of C. Larry Pope, President and Chief Executive Officer, pursuant toSection 302 of the Sarbanes-Oxley Act of 2002.
Exhibit 31.2* — Certification of Robert W. Manly, IV, Executive Vice President and Chief FinancialOfficer, pursuant to Section 302 of the Sarbanes-Oxley Act of 2002.
Exhibit 32.1* — Certification of C. Larry Pope, President and Chief Executive Officer, pursuant to 18U.S.C. 1350, as adopted pursuant to Section 906 of the Sarbanes-Oxley Act of 2002.
Exhibit 32.2* — Certification of Robert W. Manly, IV, Executive Vice President and Chief FinancialOfficer, pursuant to 18 U.S.C. 1350, as adopted pursuant to Section 906 of theSarbanes-Oxley Act of 2002.
* Filed herewith.
** Management contract or compensatory plan or arrangement of the Company required to be filed as anexhibit.
129

SIGNATURES
Pursuant to the requirements of Section 13 or 15(d) of the Securities Exchange Act of 1934, the registranthas duly caused this report to be signed on its behalf by the undersigned, thereunto duly authorized.
REGISTRANT: SMITHFIELD FOODS, INC.
By: /s/ C. LARRY POPE
C. Larry PopePresident and Chief Executive Officer
Date: June 17, 2011
Pursuant to the requirements of the Securities Exchange Act of 1934, this report has been signed below bythe following persons on behalf of the registrant and in the capacities and on the dates indicated.
Signature Title Date
/s/ JOSEPH W. LUTER, IIIJoseph W. Luter, III
Chairman of the Board andDirector
June 17, 2011
/s/ C. LARRY POPE
C. Larry Pope
President, Chief Executive Officerand Director
June 17, 2011
/s/ ROBERT W. MANLY, IVRobert W. Manly, IV
Executive Vice President and ChiefFinancial Officer (PrincipalFinancial Officer)
June 17, 2011
/s/ KENNETH M. SULLIVAN
Kenneth M. Sullivan
Vice President, Finance and ChiefAccounting Officer (PrincipalAccounting Officer)
June 17, 2011
/s/ ROBERT L. BURRUS, JR.Robert L. Burrus, Jr.
Director June 17, 2011
/s/ CAROL T. CRAWFORD
Carol T. Crawford
Director June 17, 2011
/s/ RICHARD T. CROWDER
Richard T. Crowder
Director June 17, 2011
/s/ MARGARET G. LEWIS
Margaret G. Lewis
Director June 17, 2011
/s/ WENDELL H. MURPHY
Wendell H. Murphy
Director June 17, 2011
/s/ DAVID C. NELSON
David C. Nelson
Director June 17, 2011
/s/ FRANK S. ROYAL, M.D.Frank S. Royal, M.D.
Director June 17, 2011
130
Signature Title Date
/s/ JOHN T. SCHWIETERS
John T. Schwieters
Director June 17, 2011
/s/ PAUL S. TRIBLE, JR.Paul S. Trible, Jr.
Director June 17, 2011
/s/ MELVIN O. WRIGHT
Melvin O. Wright
Director June 17, 2011
131

[THIS PAGE INTENTIONALLY LEFT BLANK]

CORPORATE OFFICERS
C. LARRY POPEPresident andChief Executive Officer
GEORGE H. RICHTERPresident and ChiefOperating Officer,Pork Group
JOSEPHW. LUTER, IVExecutive Vice President
ROBERTW. MANLY, IVExecutive Vice Presidentand Chief Financial Officer
DHAMU THAMODARANExecutive Vice Presidentand Chief CommodityHedging Officer
MICHAEL H. COLEVice President,Chief Legal Officerand Secretary
JEFFREY A. DEELVice President andCorporate Controller
TIMOTHY P. DYKSTRAVice President andCorporate Treasurer
BART ELLISVice President,Operations Analysis
MICHAEL D. FLEMMINGVice President andSenior Counsel
CRAIG R. HARLOWVice President, Internal Audit
KEIRA L. LOMBARDOVice President, InvestorRelations and CorporateCommunications
HENRY L. MORRISSenior CorporateVice President,Operations and Engineering
KENNETHM. SULLIVANVice President of Financeand Chief Accounting Officer
DENNIS H. TREACYSenior Vice President,Corporate Affairs, andChief Sustainability Officer
VERNON T. TURNERVice President,Corporate Tax
MANSOUR ZADEHChief Information Officer
DIRECTORS
Management
JOSEPHW. LUTER, IIIChairman of the Board
C. LARRY POPEPresident andChief Executive Officer,Smithfield Foods, Inc.
ROBERT L. BURRUS, JR.Chairman Emeritusof the law firm ofMcGuireWoods LLP
HON. CAROL T.CRAWFORDFormer Commissioner,U.S. International TradeCommission
RICHARD T. CROWDERProfessor of InternationalTrade, College of Agricultureand Life Sciences, VirginiaPolytechnic Institute andState University
MARGARET G. LEWISPresident, HCACapital Division
WENDELL H. MURPHYPrivate Investor,former Chairman ofthe Board andChief Executive Officerof Murphy Farms, Inc.
DAVID C. NELSONGlobal Strategist, AnimalProtein Grains and Oilseeds,Food & AgribusinessResearch and AdvisoryGroup, Rabobank
FRANK S. ROYAL, M.D.Physician
JOHN T. SCHWIETERSVice Chairman, Perseus LLC,a merchant bank andprivate equity fundmanagement company
HON. PAUL S. TRIBLE, JR.President, ChristopherNewport University
MELVIN O. WRIGHTFormerly a senior executiveof Dean Witter Reynolds,now Morgan Stanley
DIRECTOREMERITUS
RAY A. GOLDBERGMoffett Professor ofAgriculture andBusiness, Emeritus,Harvard Business School
INDEPENDENT OPERATINGCOMPANY PRESIDENTS
MICHAEL E. BROWNFarmland Foods, Inc.
JERRY H. GODWINMurphy-Brown, LLC
BOGDANMIHAILSmithfield Prod &Smithfield Ferme
DAREK NOWAKOWSKIAnimex
TIMOTHY O.SCHELLPEPERThe SmithfieldPacking Company, Inc.
JOSEPH B. SEBRINGJohn Morrell Food Group
7
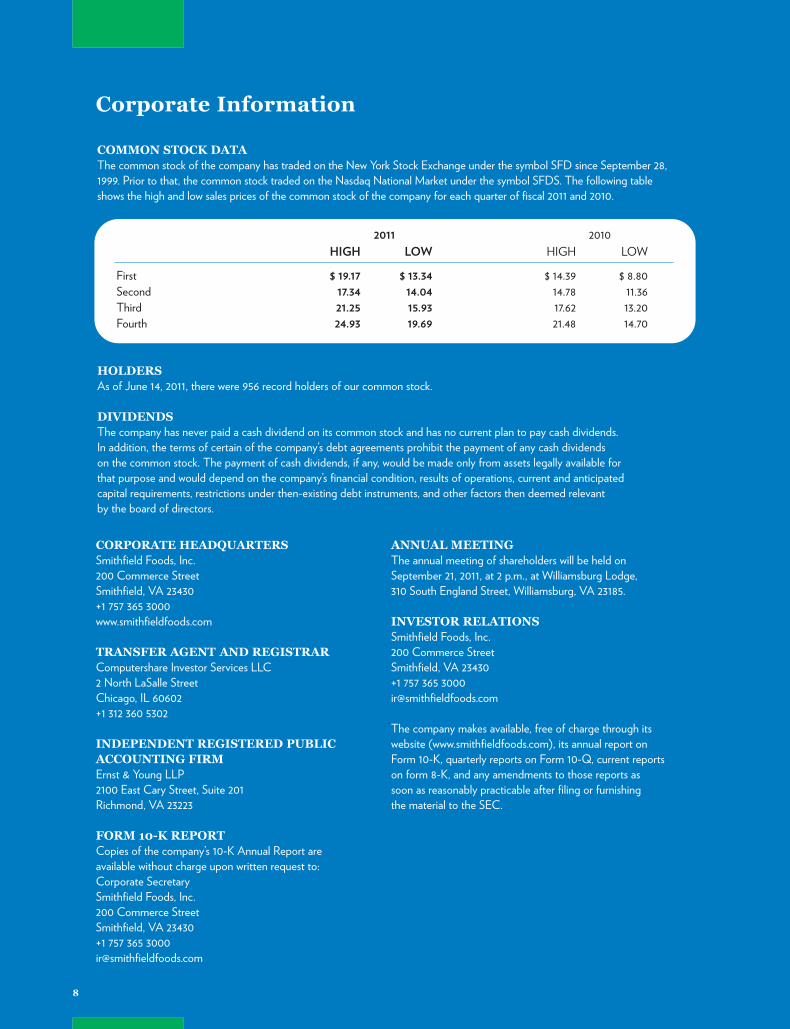
COMMON STOCK DATAThe common stock of the company has traded on the New York Stock Exchange under the symbol SFD since September 28,1999. Prior to that, the common stock traded on the Nasdaq National Market under the symbol SFDS. The following tableshows the high and low sales prices of the common stock of the company for each quarter of fiscal 2011 and 2010.
2011 2010HIGH LOW HIGH LOW
First $ 19.17 $ 13.34 $ 14.39 $ 8.80Second 17.34 14.04 14.78 11.36Third 21.25 15.93 17.62 13.20Fourth 24.93 19.69 21.48 14.70
HOLDERSAs of June 14, 2011, there were 956 record holders of our common stock.
DIVIDENDSThe company has never paid a cash dividend on its common stock and has no current plan to pay cash dividends.In addition, the terms of certain of the company’s debt agreements prohibit the payment of any cash dividendson the common stock. The payment of cash dividends, if any, would be made only from assets legally available forthat purpose and would depend on the company’s financial condition, results of operations, current and anticipatedcapital requirements, restrictions under then-existing debt instruments, and other factors then deemed relevantby the board of directors.
ANNUAL MEETINGThe annual meeting of shareholders will be held onSeptember 21, 2011, at 2 p.m., at Williamsburg Lodge,310 South England Street, Williamsburg, VA 23185.
INVESTOR RELATIONSSmithfield Foods, Inc.200 Commerce StreetSmithfield, VA 23430+1 757 365 [email protected]
The company makes available, free of charge through itswebsite (www.smithfieldfoods.com), its annual report onForm 10-K, quarterly reports on Form 10-Q, current reportson form 8-K, and any amendments to those reports assoon as reasonably practicable after filing or furnishingthe material to the SEC.
CORPORATE HEADQUARTERSSmithfield Foods, Inc.200 Commerce StreetSmithfield, VA 23430+1 757 365 3000www.smithfieldfoods.com
TRANSFER AGENT AND REGISTRARComputershare Investor Services LLC2 North LaSalle StreetChicago, IL 60602+1 312 360 5302
INDEPENDENT REGISTERED PUBLICACCOUNTING FIRMErnst & Young LLP2100 East Cary Street, Suite 201Richmond, VA 23223
FORM 10-K REPORTCopies of the company’s 10-K Annual Report areavailable without charge upon written request to:Corporate SecretarySmithfield Foods, Inc.200 Commerce StreetSmithfield, VA 23430+1 757 365 [email protected]
Corporate Information
8
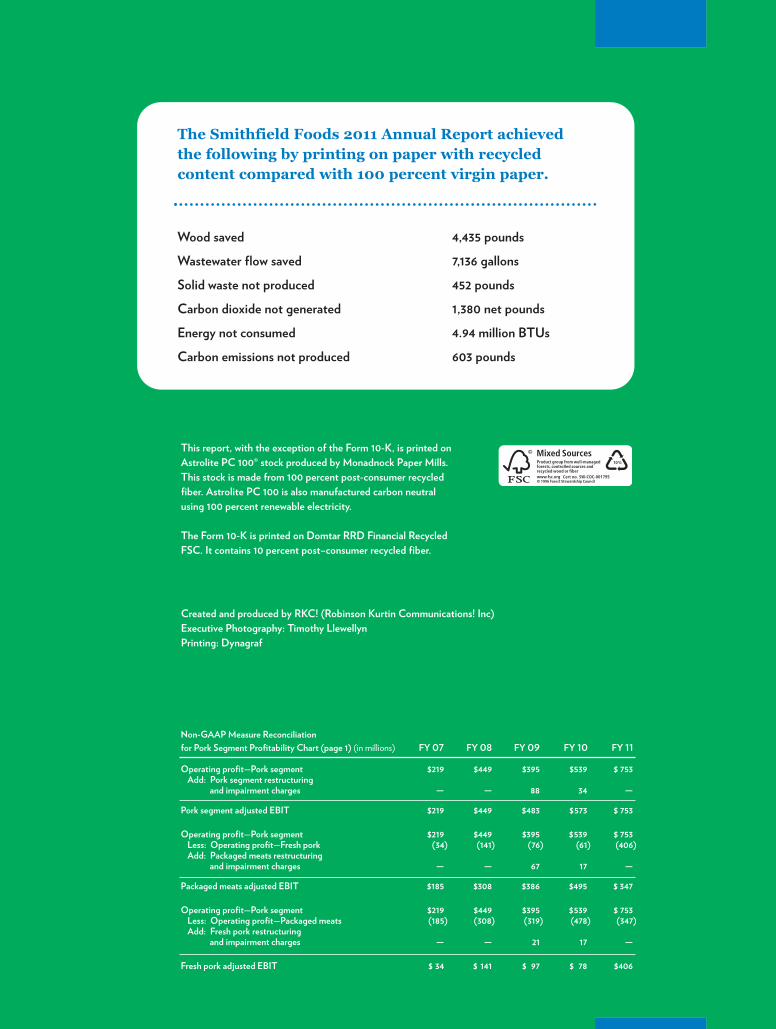
Financial Highlights
Fiscal years ended May 1, 2011 May 2, 2010 May 3, 2009(in millions, except per share data)
Sales $12,202.7 $11,202.6 $12,487.7
Operating profit (loss) 1,095.0 62.8 (223.9)
Income (loss) from continuing operations 521.0 (101.4) (250.9)
Net income (loss) 521.0 (101.4) (198.4)
Diluted earnings (loss) per share from continuing operations 3.12 (.65) (1.78)
Diluted earnings (loss) per share 3.12 (.65) (1.41)
Weighted average diluted shares outstanding 167.2 157.1 141.1
Additional Information
Capital expenditures $ 176.8 $ 174.7 $ 179.3
Depreciation expense 227.4 236.9 264.0
Working capital 2,110.0 2,128.4 1,497.7
Net debt1 1,747.6 2,556.9 2,786.6
Shareholders’ equity 3,545.5 2,755.6 2,612.4
Net debt to total capitalization2 33.0% 48.1% 51.6%
1 Net debt is equal to notes payable and long-term debt and capital lease obligations, including current portion, less cash and cash equivalents.
2 Computed using net debt divided by net debt and shareholders’ equity.
Created and produced by RKC! (Robinson Kurtin Communications! Inc)Executive Photography: Timothy LlewellynPrinting: Dynagraf
The Smithfield Foods 2011 Annual Report achievedthe following by printing on paper with recycledcontent compared with 100 percent virgin paper.
Wood saved 4,435 poundsWastewater flow saved 7,136 gallonsSolid waste not produced 452 poundsCarbon dioxide not generated 1,380 net poundsEnergy not consumed 4.94 million BTUsCarbon emissions not produced 603 pounds
This report, with the exception of the Form 10-K, is printed onAstrolite PC 100® stock produced by Monadnock Paper Mills.This stock is made from 100 percent post-consumer recycledfiber. Astrolite PC 100 is also manufactured carbon neutralusing 100 percent renewable electricity.
The Form 10-K is printed on Domtar RRD Financial RecycledFSC. It contains 10 percent post–consumer recycled fiber.
Non-GAAP Measure Reconciliationfor Pork Segment Profitability Chart (page 1) (in millions) FY 07 FY 08 FY 09 FY 10 FY 11
Operating profit—Pork segment $219 $449 $395 $539 $ 753Add: Pork segment restructuring
and impairment charges — — 88 34 —
Pork segment adjusted EBIT $219 $449 $483 $573 $ 753
Operating profit—Pork segment $219 $449 $395 $539 $ 753Less: Operating profit—Fresh pork (34) (141) (76) (61) (406)Add: Packaged meats restructuring
and impairment charges — — 67 17 —
Packaged meats adjusted EBIT $185 $308 $386 $495 $ 347
Operating profit—Pork segment $219 $449 $395 $539 $ 753Less: Operating profit—Packaged meats (185) (308) (319) (478) (347)Add: Fresh pork restructuring
and impairment charges — — 21 17 —
Fresh pork adjusted EBIT $ 34 $ 141 $ 97 $ 78 $406

SMITHFIELDFOODS,INC.2011ANNUALREPORT
SMITHFIELD FOODS, INC.200 Commerce StreetSmithfield, VA 23430+1 757 365 3000www.smithfieldfoods.com
2011 ANNUAL REPORT
SMITHFIELD FOODS is a $12 billion global food company and the world’s
largest pork processor and hog producer. In the United States, the
company is also the leader in numerous packaged meats categories with
popular brands including Farmland,®Smithfield,
®Eckrich,
®Armour,
®and
John Morrell.®Smithfield Foods is committed to providing good food in a
responsible way and maintains robust environmental, food safety,
employee safety, animal welfare, and community involvement programs.