2011q4 google earnings slides
TRANSCRIPT

Q4 2011 Quarterly Earnings
Summary

2
Fourth Quarter 2011 Highlights
• Revenue growth of 25% Y/Y and 9% Q/Q – Google properties revenue increased 29% Y/Y and 8% Q/Q
– Network revenues increased 15% Y/Y and 11% Q/Q
– International revenues were $5.6 billion
• Operational Highlights – Strong financial metrics: revenue growth, profitability, cash flow
– Continuing to invest in three major areas of focus:
• Core ads: Search and Display advertising
• Businesses demonstrating high consumer success: YouTube, Android, Chrome
• New businesses where we’re investing to drive adoption and innovation: Social,
Enterprise, Commerce, Local

3
Quarterly Revenues ($
in m
illio
ns)
178 186 188 209 300 258 254 273 269 310 385 410
3,693 3,653 3,956
4,421 4,439 4,499 4,833
5,672 5,8796,232
6,740 7,294
1,638 1,684 1,801
2,044 2,036 2,063
2,199
2,495 2,427
2,484
2,595
2,880
$0
$1,000
$2,000
$3,000
$4,000
$5,000
$6,000
$7,000
$8,000
$9,000
$10,000
$11,000
Q1'09 Q2'09 Q3'09 Q4'09 Q1'10 Q2'10 Q3'10 Q4'10 Q1'11 Q2'11 Q3'11 Q4'11
Other Google.com Network
Q4’11 Y/Y Growth = 25%
Q4’11 Q/Q Growth = 9%
5,509 5,523 5,945
6,674 6,775 6,820 7,286
8,440 8,575
9,026
9,720
10,584

4
U.S. vs. International Revenues
48% 47% 47% 47% 47% 48% 48% 48% 47% 46% 45% 47%
52% 53% 53% 53% 53% 52% 52% 52% 53% 54% 55% 53%
0%
10%
20%
30%
40%
50%
60%
70%
80%
90%
100%
Q1'09 Q2'09 Q3'09 Q4'09 Q1'10 Q2'10 Q3'10 Q4'10 Q1'11 Q2'11 Q3'11 Q4'11
US International
5,509 5,523
($ in millions)
6,674 5,945 6,775 6,820 7,286 8,440 8,575 9,026 9,720 10,584

5
1,436 1,453 1,559
1,721 1,711 1,732 1,805
2,069 2,038 2,110 2,210
2,453
26.9%27.2% 27.1%
26.6% 26.4% 26.4%
25.7%25.3%
24.5%24.2%
23.7%24.1%
15%
20%
25%
30%
$0
$500
$1,000
$1,500
$2,000
$2,500
Q1'09 Q2'09 Q3'09 Q4'09 Q1'10 Q2'10 Q3'10 Q4'10 Q1'11 Q2'11 Q3'11 Q4'11
TAC TAC as % of Advertising Revenues
Traffic Acquisition Costs ($
in m
illio
ns)

6
Costs and Expenses
Note: Please refer to supporting Table 1 for reconciliations of non-GAAP costs and
expenses to GAAP costs and expenses
GAAP
($ in millions) Q4'10 Q3'11 Q4'11 Cost of Revenues $2,946 $3,378 $3,702
Percent of revenues 35% 35% 35%
Research & Development $1,051 $1,404 $1,298
Percent of revenues 12% 14% 12%
Sales & Marketing $902 $1,204 $1,268
Percent of revenues 11% 12% 12%
General & Administrative $559 $676 $809
Percent of revenues 7% 7% 8%
Total Costs & Expenses $5,458 $6,662 $7,077
Percent of revenues 65% 69% 67%
Non-GAAP
($ in millions) Q4'10 Q3'11 Q4'11 Cost of Revenues $2,901 $3,306 $3,625
Percent of revenues 34% 34% 34%
Research & Development $827 $1,093 $1,032 Percent of revenues 10% 11% 10%
Sales & Marketing $826 $1,100 $1,163 Percent of revenues 10% 11% 11%
General & Administrative $508 $592 $721 Percent of revenues 6% 6% 7%
Total Costs & Expenses $5,062 $6,091 $6,541 Percent of revenues 60% 63% 62%
7
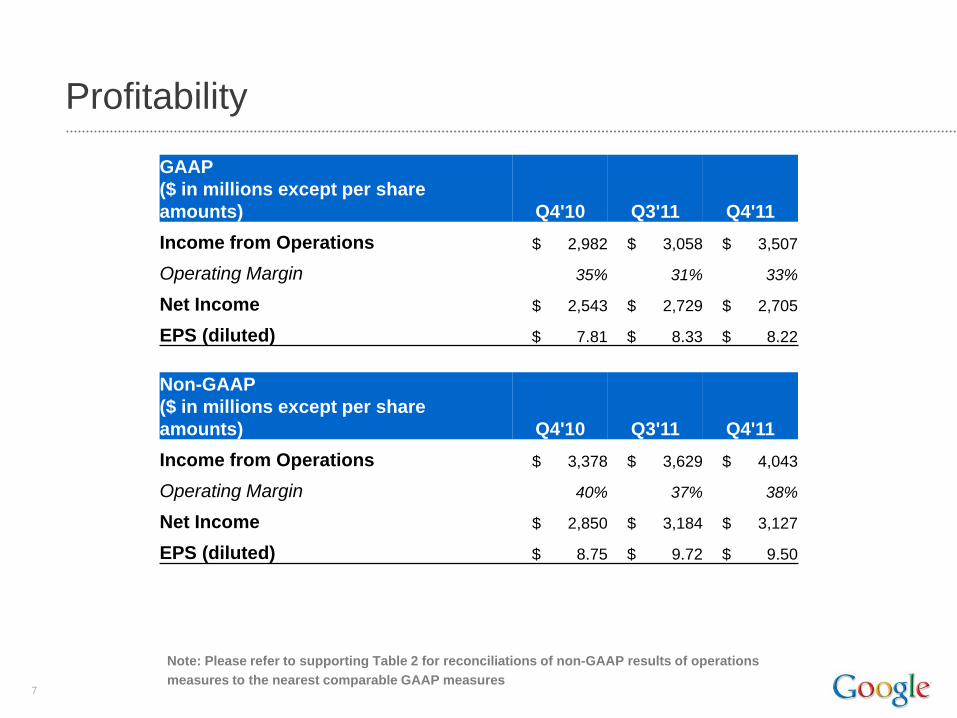
Profitability
Note: Please refer to supporting Table 2 for reconciliations of non-GAAP results of operations
measures to the nearest comparable GAAP measures
GAAP
($ in millions except per share
amounts) Q4'10 Q3'11 Q4'11
Income from Operations $ 2,982 $ 3,058 $ 3,507
Operating Margin 35% 31% 33%
Net Income $ 2,543 $ 2,729 $ 2,705
EPS (diluted) $ 7.81 $ 8.33 $ 8.22
Non-GAAP
($ in millions except per share
amounts) Q4'10 Q3'11 Q4'11
Income from Operations $ 3,378 $ 3,629 $ 4,043
Operating Margin 40% 37% 38%
Net Income $ 2,850 $ 3,184 $ 3,127
EPS (diluted) $ 8.75 $ 9.72 $ 9.50
8
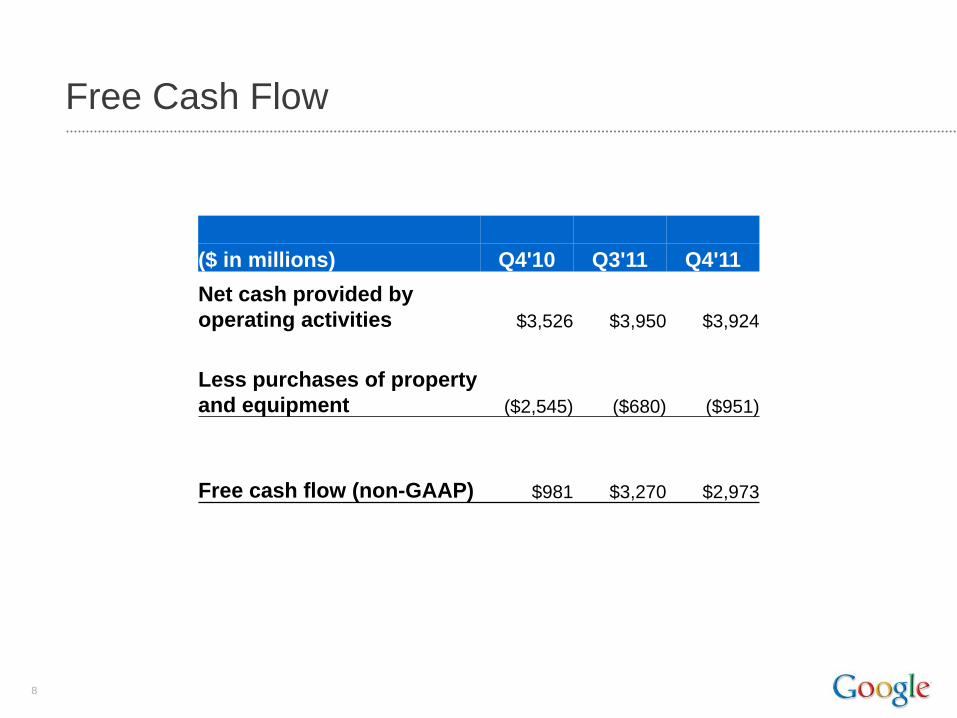
Free Cash Flow
($ in millions) Q4'10 Q3'11 Q4'11
Net cash provided by
operating activities $3,526 $3,950 $3,924
Less purchases of property
and equipment ($2,545) ($680) ($951)
Free cash flow (non-GAAP) $981 $3,270 $2,973

9
Overview of Q4 2011 OI&E and FX
In Interest and Other Income (Expense), Net, we recognized net expense of $18M for Q4 • In Q4, we recognized $199M of interest income earned on our investments and $39M
in realized gains. • We recognized an impairment charge of $88M related to our investment in Clearwire. • We expensed $134M related to our FX cash flow hedging program.
• Excluding gains related to our FX cash flow hedging program, had foreign exchange
rates remained constant from Q3 2011 through Q4 2011, our revenue in Q4 2011 would have been $239M higher. Excluding gains related to our FX cash flow hedging program, had foreign exchange rates remained constant from Q4 2010 through Q4 2011, our revenue in Q4 2011 would have been $39M lower.
• In addition, our FX cash flow hedging program allowed us to recognize a benefit of approximately $25M to international revenue this quarter.

10
Revenues by Geography
($ in millions) Q4'10 Q3'11 Q4'11
United States $4,055 $4,420 $4,980
United Kingdom $878 $1,047 $1,064
Rest of the world $3,507 $4,253 $4,540
Total Revenues $8,440 $9,720 $10,584

11
International Revenues Excluding Hedging and FX Impact (Y/Y)
($ in millions) Q4'10 Q4'11 ($ in millions) Q3'10 Q3'11
UK revenues (GAAP) $878 $1,064 UK revenues (GAAP) $840 $1,047
exclude: exclude:
a) f/x impact on Q4'11 revenues using Q4'10 rates
(gains)/losses n/a 2
a) f/x impact on Q3'11 revenues using Q3'10 rates
(gains)/losses n/a (56)
b) hedging gains (2) (6) b) hedging gains (11) -
UK revenues excluding f/x and hedging impact (Non-
GAAP) $876 $1,060
UK revenues excluding f/x and hedging impact (Non-
GAAP) $829 $991
Y/Y % (Non-GAAP) 21% Y/Y % (Non-GAAP) 20%
($ in millions) Q4'10 Q4'11 ($ in millions) Q3'10 Q3'11
ROW revenues (GAAP) $3,507 $4,540 ROW revenues (GAAP) $2,929 $4,253
exclude: exclude:
a) f/x impact on Q4'11 revenues using Q4'10 rates
(gains)/losses n/a (41)
a) f/x impact on Q3'11 revenues using Q3'10 rates
(gains)/losses n/a (427)
b) hedging gains (23) (19) b) hedging gains (78) (1)
ROW revenues excluding f/x and hedging impact (Non-
GAAP) $3,484 $4,480
ROW revenues excluding f/x and hedging impact (Non-
GAAP) $2,851 $3,825
Y/Y % (Non-GAAP) 29% Y/Y % (Non-GAAP) 34%

12
International Revenues Excluding Hedging and FX Impact (Q/Q)
($ in millions) Q3'11 Q4'11 ($ in millions) Q2'11 Q3'11
UK revenues (GAAP) $1,047 $1,064 UK revenues (GAAP) $976 $1,047
exclude: exclude:
a) f/x impact on Q4'11 revenues using Q3'11 rates
(gains)/losses n/a 32
a) f/x impact on Q3'11 revenues using Q2'11 rates
(gains)/losses n/a 1
b) hedging gains - (6) b) hedging gains - -
UK revenues excluding f/x and hedging impact (Non-
GAAP) $1,047 $1,090
UK revenues excluding f/x and hedging impact (Non-
GAAP) $976 $1,048
Q/Q % (Non-GAAP) 4% Q/Q % (Non-GAAP) 7%
($ in millions) Q3'11 Q4'11 ($ in millions) Q2'11 Q3'11
ROW revenues (GAAP) $4,253 $4,540 ROW revenues (GAAP) $3,895 $4,253
exclude: exclude:
a) f/x impact on Q4'11 revenues using Q3'11 rates
(gains)/losses n/a 207
a) f/x impact on Q3'11 revenues using Q2'11 rates
(gains)/losses n/a (54)
b) hedging gains (1) (19) b) hedging gains (4) (1)
ROW revenues excluding f/x and hedging impact (Non-
GAAP) $4,252 $4,728
ROW revenues excluding f/x and hedging impact (Non-
GAAP) $3,891 $4,198
Q/Q % (Non-GAAP) 11% Q/Q % (Non-GAAP) 8%

13
Table 1 - Reconciliations of non-GAAP costs and expenses to GAAP costs and expenses
($ in millions) Q4'10
As a % of
Revenues (1) Q3'11
As a % of
Revenues (1) Q4'11
As a % of
Revenues (1)
Cost of revenues (GAAP) $ 2,946 35% $ 3,378 35% $ 3,702 35%
Less: Stock-based compensation expense (45) (72) (77)
Cost of revenues (non-GAAP) $ 2,901 34% $ 3,306 34% $ 3,625 34%
Research and development (GAAP) $ 1,051 12% $ 1,404 14% $ 1,298 12%
Less: Stock-based compensation expense (224) (311) (266)
Research and development (non-GAAP) $ 827 10% $ 1,093 11% $ 1,032 10%
Sales and marketing (GAAP) $ 902 11% $ 1,204 12% $ 1,268 12%
Less: Stock-based compensation expense (76) (104) (105)
Sales and marketing (non-GAAP) $ 826 10% $ 1,100 11% $ 1,163 11%
General and administrative (GAAP) $ 559 7% $ 676 7% $ 809 8%
Less: Stock-based compensation expense (51) (84) (88)
General and administrative (non-GAAP) $ 508 6% $ 592 6% $ 721 7%
Total costs and expenses (GAAP) $ 5,458 65% $ 6,662 69% $ 7,077 67%
Less: Stock-based compensation expense (396) (571) (536)
Total costs and expenses (non-GAAP) $ 5,062 60% $ 6,091 63% $ 6,541 62%
(1) Percentages based on revenues of $8,440 million in Q4'10, $9,720 million in Q3'11 and $10,584 million in Q4'11.

14
Table 2 - Reconciliations of non-GAAP results of operations measures to the nearest comparable GAAP measures
(In millions except per share amounts) Q4'10
Operating
Margin (1) Q3'11
Operating
Margin (1) Q4'11
Operating
Margin (1)
Income from operations (GAAP) $ 2,982 35% $ 3,058 31% $ 3,507 33%
Add: Stock-based compensation expense 396 571 536
Income from operations (non-GAAP) $ 3,378 40% $ 3,629 37% $ 4,043 38%
Net income (GAAP) $ 2,543 $ 2,729 $ 2,705
Add: Stock-based compensation expense (net of tax) 307 455 422
Net income (non-GAAP) $ 2,850 $ 3,184 $ 3,127
Net income per share - diluted (GAAP) $ 7.81 $ 8.33 $ 8.22
Net income per share - diluted (non-GAAP) $ 8.75 $ 9.72 $ 9.50
Shares used in per share calculation - diluted 326 327 329
(1) Percentages based on revenues of $8,440 million in Q4'10, $9,720 million in Q3'11 and $10,584 million in Q4'11.

Q4 2011 Quarterly Earnings
Summary