2012 annual report - wal-mart stores, inc
TRANSCRIPT
2012 Annual Report
50 yearsof helping customers
save money and live betterPowering our future:2.2 million associates committed to our customers.
Wal-Mart Stores, Inc. (NYSE: WMT)702 S. W. 8th StreetBentonville, Arkansas 72716 USA479-273-4000walmartstores.com
2012 Annual Report
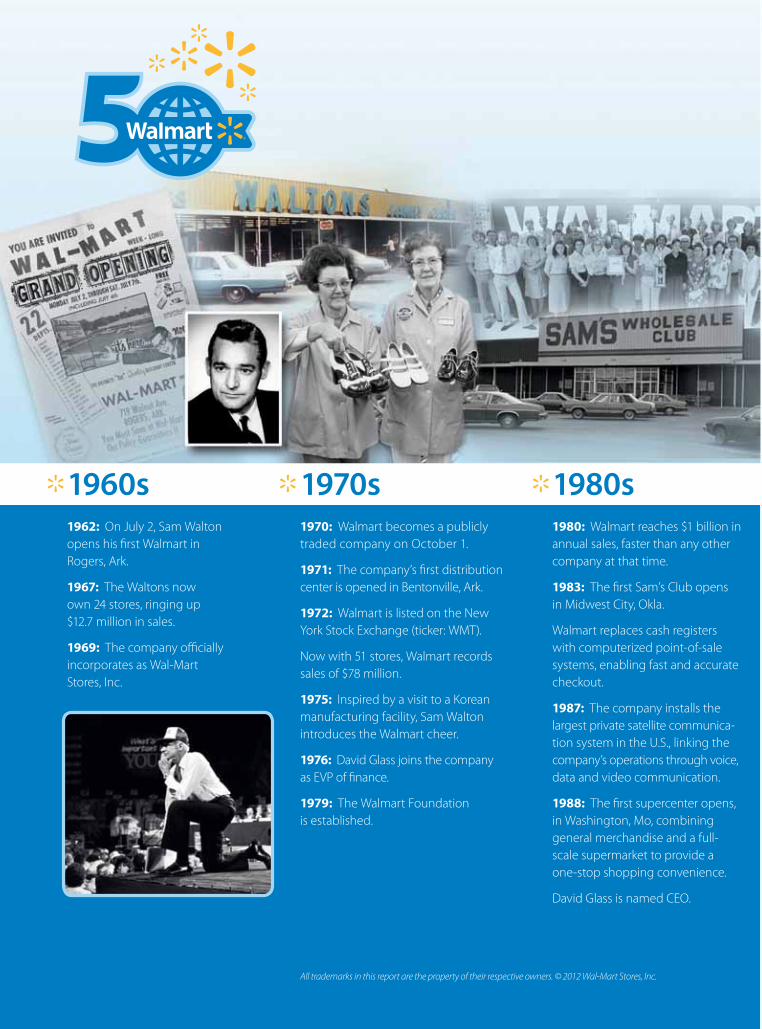
1960s1962: On July 2, Sam Walton opens his first Walmart in Rogers, Ark.
1967: The Waltons now own 24 stores, ringing up $12.7 million in sales.
1969: The company officially incorporates as Wal-Mart Stores, Inc.
1970s1970: Walmart becomes a publicly traded company on October 1.
1971: The company’s first distribution center is opened in Bentonville, Ark.
1972: Walmart is listed on the New York Stock Exchange (ticker: WMT).
Now with 51 stores, Walmart records sales of $78 million.
1975: Inspired by a visit to a Korean manufacturing facility, Sam Walton introduces the Walmart cheer.
1976: David Glass joins the company as EVP of finance.
1979: The Walmart Foundation is established.
1980s1980: Walmart reaches $1 billion in annual sales, faster than any other company at that time.
1983: The first Sam’s Club opens in Midwest City, Okla.
Walmart replaces cash registers with computerized point-of-sale systems, enabling fast and accurate checkout.
1987: The company installs the largest private satellite communica-tion system in the U.S., linking the company’s operations through voice, data and video communication.
1988: The first supercenter opens, in Washington, Mo, combining general merchandise and a full-scale supermarket to provide a one-stop shopping convenience.
David Glass is named CEO.
All trademarks in this report are the property of their respective owners. © 2012 Wal-Mart Stores, Inc.
4.92 acres of forestland preserved
via managed forestry
1,323 fewer trees consumed
via recycling
267,786 kWh less energy – the same
used by 10 homes for a year
590 metric tons of greenhouse gas offset –
the equivalent of taking 118 cars off the road for a year
60,769 kWh converted to clean renewable
sources (printing plant using RECs)
481,050 fewer gallons of water
consumed
Download Walmart’s Investor Relations app and look for ongoing updates to access:
• Financial news• Quarterly results• Annual Shareholders’
Meeting materials • Proxy voting• Investor presentations
Our sustainable, next generation report.The minimized environmental footprint of this report is the result of an extensive, collaborative effort of Walmart and its supply chain partners. The environmental and social impact continues to be an important consideration. It is printed on paper from well-managed forests containing recycled PCW fiber that is Elementally Chlorine Free (ECF). It is printed using 100 percent renewable wind power (RECs), along with environmental manufacturing principles that were utilized in the printing process. These practices include environmentally responsible procurement, lean manufacturing, green chemistry principles, the recycling of residual materials and reduced volatile organic compound inks and coatings.
Follow us on Twitter®: www.twitter.com/walmart
Like us on Facebook®: www.facebook.com/walmart
Electronic accessSince 2007, we have reduced our annual report print run by approximately two million copies. Please enroll to receive all materials electronically for the Annual Shareholders’ Meeting at www.walmartstores.com/investors.
Savings baselines were developed using the U.S. national averages of
similar papers and printing practices by EarthColor Printing.
Rainforest Alliance CertifiedTM
SmartWood Program Labeling Guidelines
Walmart 2012 Annual Report 1 Walmart 2012 Annual Report 1
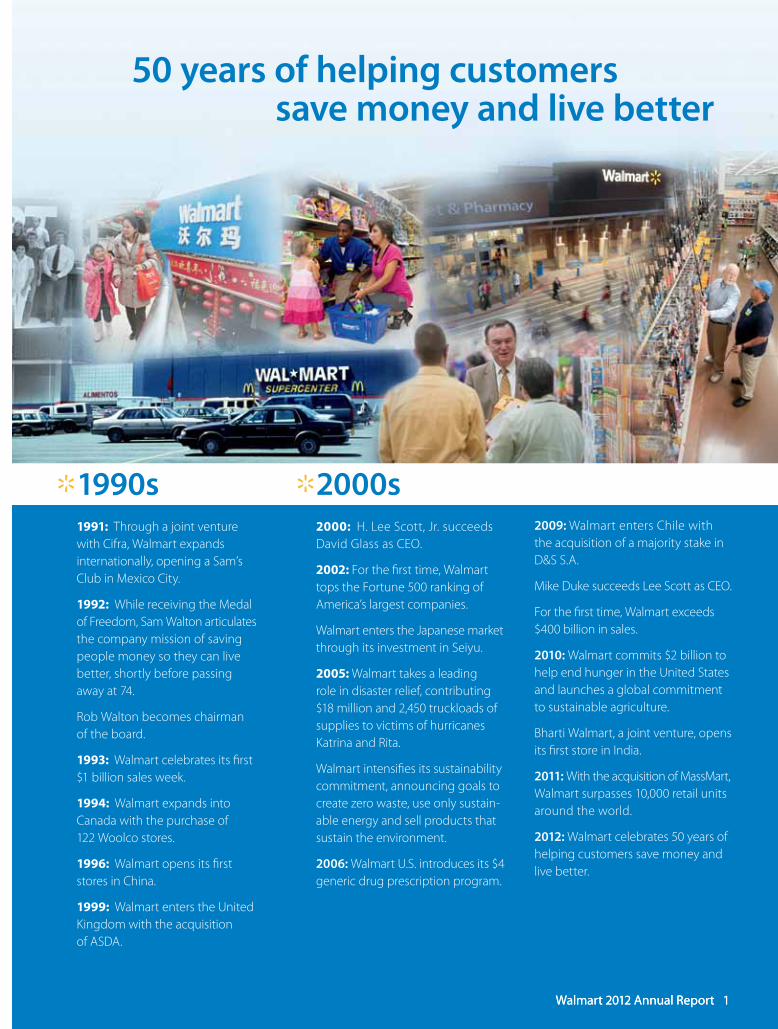
50 years of helping customers save money and live better
1990s1991: Through a joint venture with Cifra, Walmart expands internationally, opening a Sam’s Club in Mexico City.
1992: While receiving the Medal of Freedom, Sam Walton articulates the company mission of saving people money so they can live better, shortly before passing away at 74.
Rob Walton becomes chairman of the board.
1993: Walmart celebrates its first $1 billion sales week.
1994: Walmart expands into Canada with the purchase of 122 Woolco stores.
1996: Walmart opens its first stores in China.
1999: Walmart enters the United Kingdom with the acquisition of ASDA.
2009: Walmart enters Chile with the acquisition of a majority stake in D&S S.A.
Mike Duke succeeds Lee Scott as CEO.
For the first time, Walmart exceeds $400 billion in sales.
2010: Walmart commits $2 billion to help end hunger in the United States and launches a global commitment to sustainable agriculture.
Bharti Walmart, a joint venture, opens its first store in India.
2011: With the acquisition of MassMart, Walmart surpasses 10,000 retail units around the world.
2012: Walmart celebrates 50 years of helping customers save money and live better.
2000s2000: H. Lee Scott, Jr. succeeds David Glass as CEO.
2002: For the first time, Walmart tops the Fortune 500 ranking of America’s largest companies.
Walmart enters the Japanese market through its investment in Seiyu.
2005: Walmart takes a leading role in disaster relief, contributing $18 million and 2,450 truckloads of supplies to victims of hurricanes Katrina and Rita.
Walmart intensifies its sustainability commitment, announcing goals to create zero waste, use only sustain-able energy and sell products that sustain the environment.
2006: Walmart U.S. introduces its $4 generic drug prescription program.
Walmart 2012 Annual Report 1
2 Walmart 2012 Annual Report
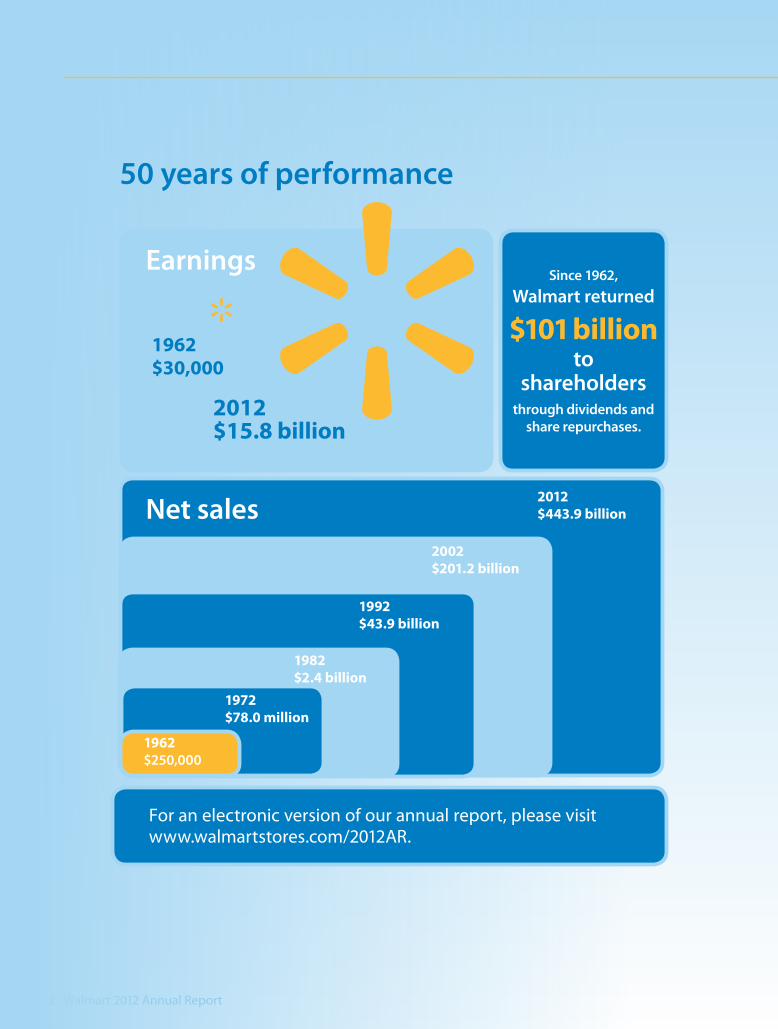
50 years of performance
2002$201.2 billion
2012$443.9 billionNet sales
Earnings
2012$15.8 billion
1962$30,000
Since 1962, Walmart returned
$101 billionto
shareholdersthrough dividends and
share repurchases.
1992$43.9 billion
1972$78.0 million
1982$2.4 billion
1962$250,000
For an electronic version of our annual report, please visit www.walmartstores.com/2012AR.
Walmart 2012 Annual Report 3
To our shareholders, associates and customers
Almost 50 years ago, Sam Walton started Walmart with a single store in Rogers, Ark., dedicated to providing customers with a broad assortment of merchandise at great prices. Sam told Walmart associates: “Customers are the reason why we’re in business. And when we exceed their expectations, we’re at our best.” From the day the doors opened in Rogers, on July 2, 1962, Walmart’s culture has been built on a common purpose: saving people money so they can live better. That one store changed the way that retail works, and that change continues to this day.
Today Walmart operates more than 10,000 retail units under 69 different banners in 27 countries. We have more than 2 million hard-working associates who serve 200 million customers and members every week. We appreciate all that our associates do in delivering on our mission and in growing our business.
Our growth is a remarkable achievement. But as far as we have come, there is so much more that we will do to make a difference for our shareholders, customers, associates and communities around the world.
Fiscal 2012 review and key strategiesLast year, Walmart delivered a strong financial performance. Net sales increased by 5.9 percent to $443.9 billion, and consolidated operating income grew by 4 percent to $26.6 billion. Our diluted earnings per share from continuing operations attributable to Walmart were $4.54 per share, up from $4.18 the previous year. We leveraged operating expenses for two consecutive years. Our strong financial position is best illustrated by our ability to
grow. We added 52.2 million square feet through 1,160 additional units, including acquisitions in the U.K. and South Africa.
We continue to deliver strong returns to shareholders and returned $11.3 billion to them through dividends and share repurchases during the year. We were disciplined and focused on improving our business, and we made good progress.
Our Walmart U.S. strategy is working. Assortments are back. We are making real improvements in merchandising and operations and investing in lower prices. We were pleased to close the year with two quarters of positive sales comps, including positive traffic in the fourth quarter. We remain focused on improving comp sales in the year ahead and are confident that positive trends will continue. Our commitment to price leadership has never been stronger. Beginning in February, we initiated our quest to invest $2 billion in price through expense reductions and productivity improvements during the next two years.
Walmart International is delivering strong sales and remains our company’s primary growth engine. With $125 billion in sales, it is remarkable that our international business alone would now be among the three largest retailers in the world. Our top priority is improving returns through increased profitability, especially in Brazil and China. We are gaining share and are well-positioned to serve the expanding needs of middle-income customers in high-growth markets. The “Powered by Walmart” initiatives will strengthen productivity and reduce expenses.
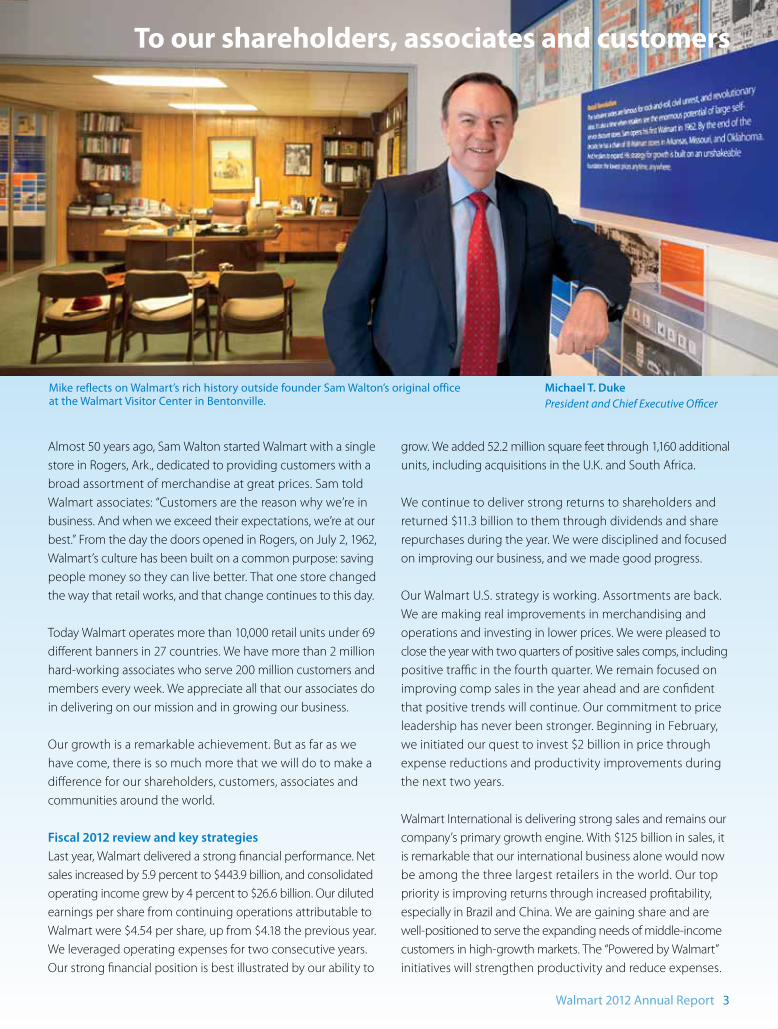
Michael T. DukePresident and Chief Executive Officer
Mike reflects on Walmart’s rich history outside founder Sam Walton’s original office at the Walmart Visitor Center in Bentonville.
4 Walmart 2012 Annual Report
Sam’s Club continues to drive sales momentum, increasing comp sales 8.4 percent (which includes 3.4 percent of fuel) in fiscal 2012. We are pleased with the consistency of opera-tions across the U.S. clubs, and merchandise quality and value continue to get better. Sam’s also made real progress in growing the membership base, and that remains a key goal this year.
There is no doubt Walmart is the best-positioned global retailer. We believe that we have all the pieces in place to build on our success and deliver value for our customers and shareholders again this year. We continue to strengthen our next generation Walmart efforts, investing in people, technology, innovation and infrastructure. It is rooted in our culture to stay out in front of change. The world moves more quickly each day, and we aim to be at the forefront of bringing about change in retail, both in our stores and through e-commerce.
Five key strategies are central to our future: 1) Developing our people; 2) Driving the productivity loop; 3) Winning in Global eCommerce; 4) Reinvigorating our customer-focused culture; and 5) Leading on social and environmental issues.
Developing our peopleNothing is more important to delivering on our mission than our people. We have the best talent in global retailing, both at the leadership level and deeper in the organization. We are extremely focused on developing existing talent through programs
like our Business Leadership Series, the Walton Institute and Merchant Development. We are also recruiting exceptional new talent where we need it. One area that I am asking every leader and manager to focus on is appreciating and listening to our front-line associates. More than anyone in our company, our store and club associates take care of our customers and members, and they make incredible contributions to our success.
I’m pleased with the progress that we’ve already made on diversity and inclusion, and especially with our global women’s strategy. We are championing opportunities for women to advance in Walmart, and to develop women at all levels throughout the company.
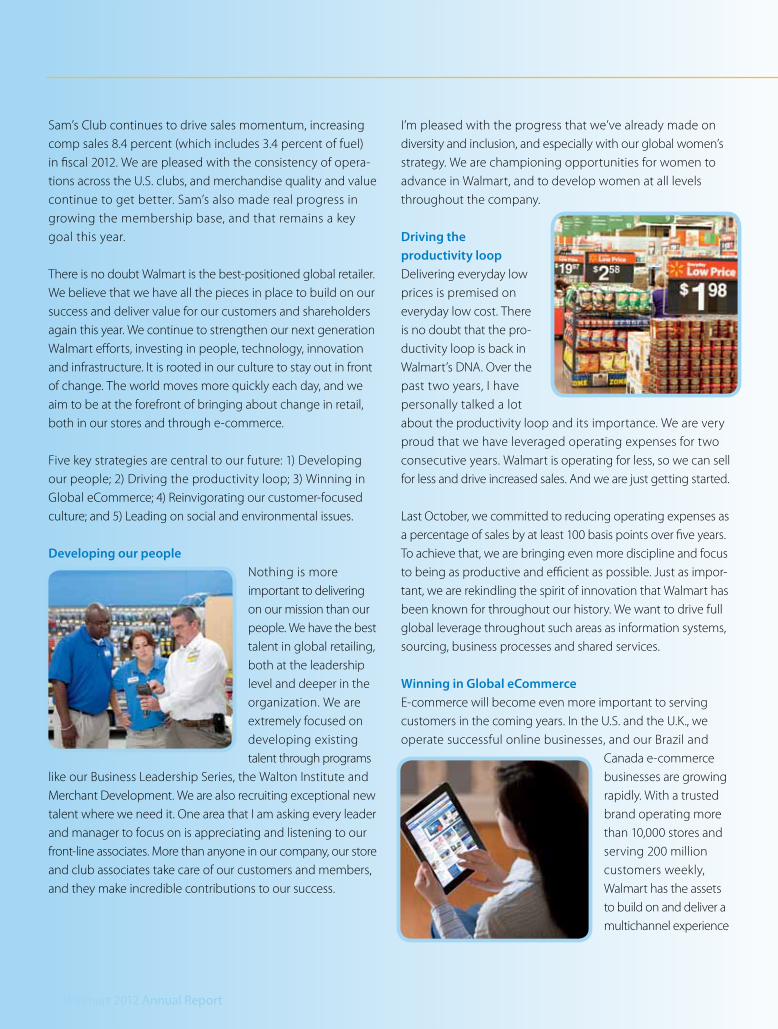
Driving the productivity loop Delivering everyday low prices is premised on everyday low cost. There is no doubt that the pro-ductivity loop is back in Walmart’s DNA. Over the past two years, I have personally talked a lot about the productivity loop and its importance. We are very proud that we have leveraged operating expenses for two consecutive years. Walmart is operating for less, so we can sell for less and drive increased sales. And we are just getting started.
Last October, we committed to reducing operating expenses as a percentage of sales by at least 100 basis points over five years. To achieve that, we are bringing even more discipline and focus to being as productive and efficient as possible. Just as impor-tant, we are rekindling the spirit of innovation that Walmart has been known for throughout our history. We want to drive full global leverage throughout such areas as information systems, sourcing, business processes and shared services.
Winning in Global eCommerceE-commerce will become even more important to serving customers in the coming years. In the U.S. and the U.K., we operate successful online businesses, and our Brazil and
Canada e-commerce businesses are growing rapidly. With a trusted brand operating more than 10,000 stores and serving 200 million customers weekly, Walmart has the assets to build on and deliver a multichannel experience
Walmart 2012 Annual Report 5
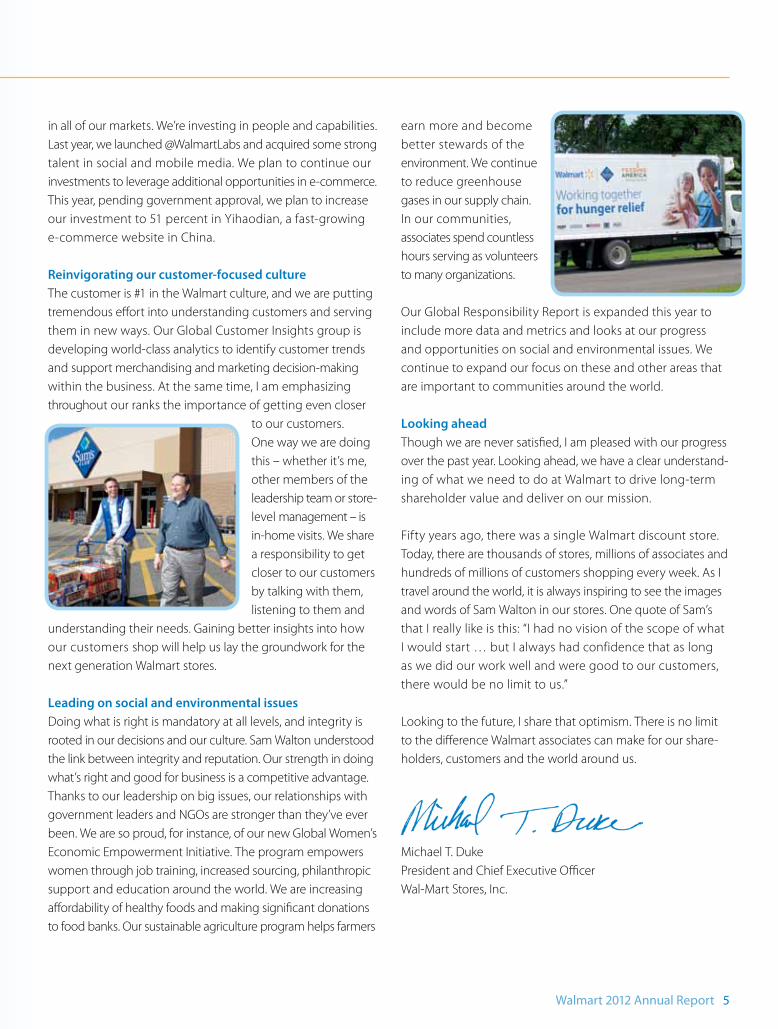
earn more and become better stewards of the environment. We continue to reduce greenhouse gases in our supply chain. In our communities, associates spend countless hours serving as volunteers to many organizations.
Our Global Responsibility Report is expanded this year to include more data and metrics and looks at our progress and opportunities on social and environmental issues. We continue to expand our focus on these and other areas that are important to communities around the world. Looking aheadThough we are never satisfied, I am pleased with our progress over the past year. Looking ahead, we have a clear understand-ing of what we need to do at Walmart to drive long-term shareholder value and deliver on our mission.
Fifty years ago, there was a single Walmart discount store. Today, there are thousands of stores, millions of associates and hundreds of millions of customers shopping every week. As I travel around the world, it is always inspiring to see the images and words of Sam Walton in our stores. One quote of Sam’s that I really like is this: “I had no vision of the scope of what I would start … but I always had confidence that as long as we did our work well and were good to our customers, there would be no limit to us.”
Looking to the future, I share that optimism. There is no limit to the difference Walmart associates can make for our share-holders, customers and the world around us.
Michael T. DukePresident and Chief Executive OfficerWal-Mart Stores, Inc.
in all of our markets. We’re investing in people and capabilities. Last year, we launched @WalmartLabs and acquired some strong talent in social and mobile media. We plan to continue our investments to leverage additional opportunities in e-commerce. This year, pending government approval, we plan to increase our investment to 51 percent in Yihaodian, a fast-growing e-commerce website in China.
Reinvigorating our customer-focused cultureThe customer is #1 in the Walmart culture, and we are putting tremendous effort into understanding customers and serving them in new ways. Our Global Customer Insights group is developing world-class analytics to identify customer trends and support merchandising and marketing decision-making within the business. At the same time, I am emphasizing throughout our ranks the importance of getting even closer
to our customers. One way we are doing this – whether it’s me, other members of the leadership team or store-level management – is in-home visits. We share a responsibility to get closer to our customers by talking with them, listening to them and
understanding their needs. Gaining better insights into how our customers shop will help us lay the groundwork for the next generation Walmart stores.
Leading on social and environmental issuesDoing what is right is mandatory at all levels, and integrity is rooted in our decisions and our culture. Sam Walton understood the link between integrity and reputation. Our strength in doing what’s right and good for business is a competitive advantage. Thanks to our leadership on big issues, our relationships with government leaders and NGOs are stronger than they’ve ever been. We are so proud, for instance, of our new Global Women’s Economic Empowerment Initiative. The program empowers women through job training, increased sourcing, philanthropic support and education around the world. We are increasing affordability of healthy foods and making significant donations to food banks. Our sustainable agriculture program helps farmers
6 Walmart 2012 Annual Report
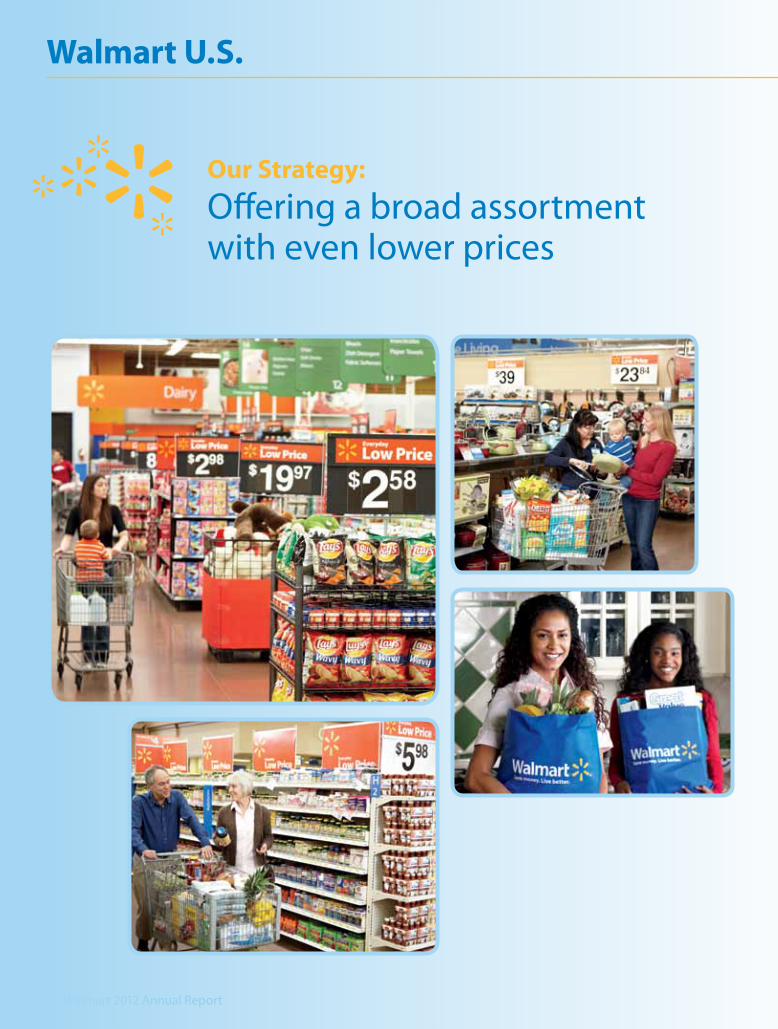
Our Strategy: Offering a broad assortment with even lower prices
Walmart U.S.
Walmart 2012 Annual Report 7
Walmart U.S. achieved positive comparable store sales for fiscal 2012, having posted an increase in customer traffic for the fourth quarter. Net sales surpassed $264 billion, increasing 1.5 percent, while operating income grew to $20.4 billion, a 2.2 percent increase from the prior year. We improved our performance by aligning our strategy with the needs of today’s customer and by operating more efficiently. The expanded merchandise assortment and improved in-stock levels, coupled with strong price leadership and service from our associates, continues to resonate with customers.
A broader assortment. Customers appreciate the opportunity to rely on Walmart for a one-stop shopping experience, so we added back more than 10,000 products across hundreds of merchandise categories during the past year. We work with suppliers to be the first to offer new innovative products and continue to fine-tune our offerings. We offer the right mix of national brands, private brands and opening price point products. We also improved in-stock levels, so customers can count on Walmart more than ever.
Delivering Everyday Low Price (EDLP). We reinvigorated our fundamental price promise: provide low prices day-in and day-out on the broadest assortment. Our price message, backed by the strongest ad match policy in the industry, ensures that we are driving price separation with competitors. The certainty of great values throughout the store has been fundamental to Walmart for 50 years. Fulfilling that brand promise inspires customer trust and loyalty. This February, we kicked off a two-year,
$2 billion investment, funded by expense reductions and productivity initiatives, to further lower prices for customers.
A more efficient organization. EDLP is the result of our everyday low cost (EDLC) philosophy. We lower costs by reducing expenses, increasing productivity and leveraging technology to improve efficiency throughout our supply chain and our operations. This year, we are accelerating and adding many efficiency measures, as we invest the savings to further lower prices.
Formats and channels that serve every need. We continue to invest in growth through a variety of channels – our core supercenters, smaller formats such as Neighborhood Market and Walmart Express, and eCommerce. Our online business continues to grow, driven by strong sales in Site to Store and Pick Up Today, which provide shopping alternatives to Walmart customers.
Our Foundation: Humble beginnings with store 1Using their family home as collateral, Sam and Helen Walton opened the first Walmart in Rogers, Ark. in 1962. The store was just 18,000 square feet of selling space, and had clothing racks made of plumbing pipes. Store 1 was modest – but customers loved the great prices and the wide assortment.
8 Walmart 2012 Annual Report
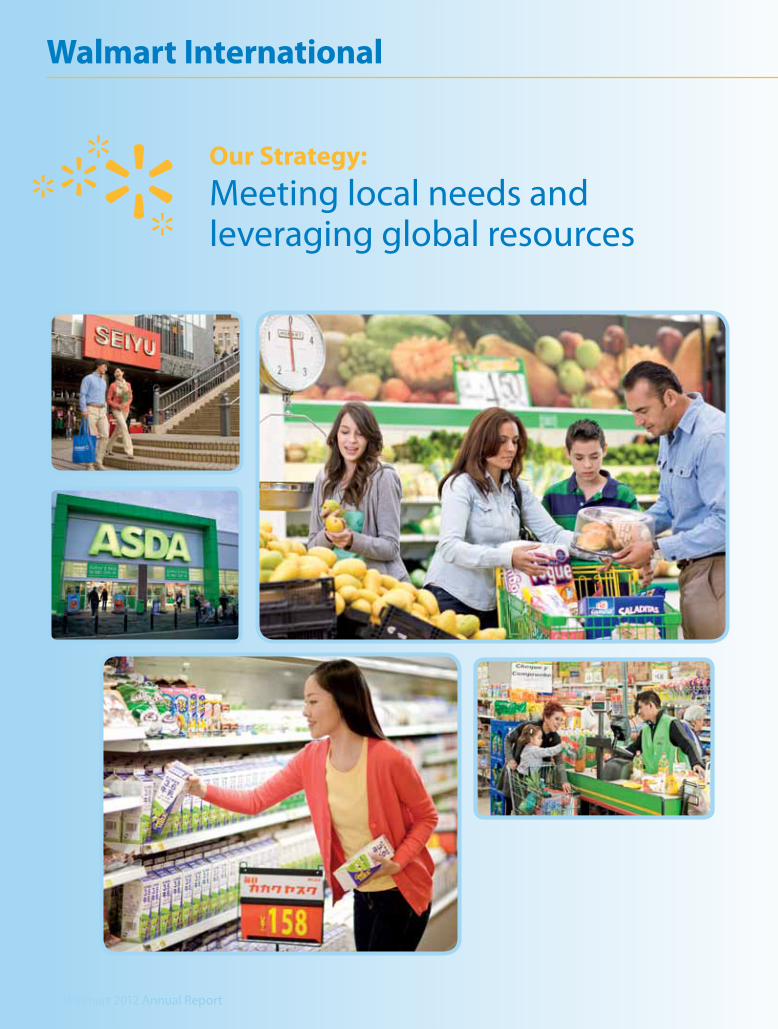
Our Strategy: Meeting local needs and leveraging global resources
Walmart International
Walmart 2012 Annual Report 9
International
Our Foundation: Taking the first step in the global growth journeyFollowing Sam Walton’s suggestion to consider expansion into Mexico, company leaders launched the first initiative: a joint venture to open a Club Aurrera (later, Sam’s Club) wholesale membership store in Mexico City in 1991.
Walmart International is focused on a key objective – driving aggressive growth, while improving return on investment. Net sales, including currency and acquisitions, increased 15.2 percent to $125.9 billion for fiscal 2012. Operating income was $6.2 billion, increasing 10.8 percent from the prior year. In fiscal 2012, we opened a record 612 new stores through organic growth. Including acquisitions, we added 1,094 stores and 42.2 million square feet around the world.
For the past three years, we maintained disciplined growth, with an average square footage increase of 8.0 percent, excluding acquisitions. We believe EDLP is the right business model for our customers in all of our markets, and with a focus on EDLC, we intend to be the low-cost leader in every market where we operate.
Meeting local needs is central to our growth. We align our formats, assortment and service from our associates with the fastest-growing customer demographics in each market. We continue to grow through new stores, comparable store sales and e-commerce. In high-growth markets, such as Brazil, China and Mexico, we pursue middle-income customers who look for quality and value. And in more mature markets, such as Canada and the U.K. , we continue to find ways to expand our customer base. Walmart International will add between 30 and 33 million square feet of retail space in FY 13.
”Powered by Walmart” is the cornerstone of how we maximize value by balancing global leverage. We share best practices across geographies in store operations, logistics, information technology and other areas. Working together where it makes us better allows us to save money, be faster to market and keeps our associates keenly focused on serving customers. Leveraging Walmart’s global scale and expertise allows us to deliver the merchandise our customers want at the lowest price.
Be first in e-commerce solutions. We are building new solutions that strengthen our e-commerce offerings in developed markets and take advantage of the explosive growth of online retailing in emerging markets. ASDA’s online grocery sales continue to grow in the U.K., and e-commerce offerings are expanding in Brazil, Canada, China and Japan.

10 Walmart 2012 Annual Report
Our Strategy: Leveraging Member insights to deliver value and quality
Sam’s Club
Walmart 2012 Annual Report 11
Our Foundation: Building a better wholesale retailerSam Walton was never afraid to try an experiment when growing his business. Sam’s Club is one of his most successful experiments. In 1983, a group of Walmart veterans that he called “mavericks” opened the first Sam’s Club in Midwest City, Okla. Almost 30 years later, Sam’s Club has more than 600 locations across the United States.
After two consecutive years of quality results, Sam’s Club has strong momentum that sets the stage for continued growth in the warehouse club segment. Fiscal 2012 net sales increased 8.8 percent to $53.8 billion, while operating income grew 9.0 percent to $1.9 billion. Members are shopping more frequently, shopping more categories and spending a greater share of their wallet with Sam’s Club.
We connect with Members by leveraging insights about how a Sam’s Club membership can meet and exceed their shopping needs and preferences. High-quality merchandise, price leadership on everyday needs and innovative Member services continue to drive Member engagement.
We deliver quality at a superior value – evidenced by the strong growth in key categories such as produce, fresh and frozen foods, and health and wellness. In an economic environment where more families forego a restaurant trip and eat at home, our assortment of fresh foods, including prepared home meals, provides a convenient solution. In entertainment, home, jewelry and apparel, we provide favorite national brands at a great value. Product sampling and unique road show merchan-dise, combined with superior Member service from our associates, make Sam’s Club a fun and exciting place to shop.
Knowledgeable and dedicated associates help Members and ensure that the club is in stock. We drive the productivity loop and invest operational savings back into membership value. Clean, fast and friendly clubs are important to Members and their feedback says we continue to exceed their expectations. We are growing, with plans to open nine new clubs in fiscal 2013, while relocating or expanding six more.
We help Members shop smarter through e-commerce and the latest technology. The Sam’s Club mobile app allows Members to review and shop our online and in-club inventory, build customized shopping lists, and renew their memberships – all from a smartphone or iPad®.

12 Walmart 2012 Annual Report
The world of retail constantly changes. Customers use smartphones and social media to discover items and check prices. They can find product recom-mendations and share news about popular items. Our goal is to combine online, social and mobile innovations with physical stores to give customers an “anytime, anywhere” shopping experience.
We have successful online businesses in the U.S., the U.K. and Brazil, where we’re already delivering the convenience of multichannel shopping. We also have growing eCommerce businesses in Canada and China. Walmart continues to expand in the fastest-growing markets today, where millions of shoppers are joining the middle class. In China, for example, our pending majority stake in Yihaodian, a leading online retailer, will open our products and brands to consumers.
Our Strategy: Winning in Global eCommerce
E-commerce gives us a great opportunity to bring “anytime, anywhere” access to millions of customers around the globe.
We’re further strengthening our Global eCommerce business by investing in new talent and technology. We formed @WalmartLabs, our hub for developing social, mobile and global platforms, and acquired specialty Internet companies to boost our talent. We introduced several products for Walmart.com in the U.S. that make shopping easier and more fun. Our new iPhone app allows U.S. customers to create smart shopping lists, scan coupons and access product information in real time. In addition, we launched a feature-rich iPad® app, as well as Shopycat, a gift finder on Facebook®.
All of this – along with our trusted brand, our weekly insights into millions of shopper experiences and more than 10,000 stores around the world – positions us strongly to win in e-commerce.
Our Foundation: Technology-driven supply chainIn 1987, Walmart created a bold new competitive advantage with the completion of its satellite network, enabling real-time communication between stores, distribution centers and the Bentonville Home Office.
Global eCommerce
Walmart 2012 Annual Report 13
Global Responsibility
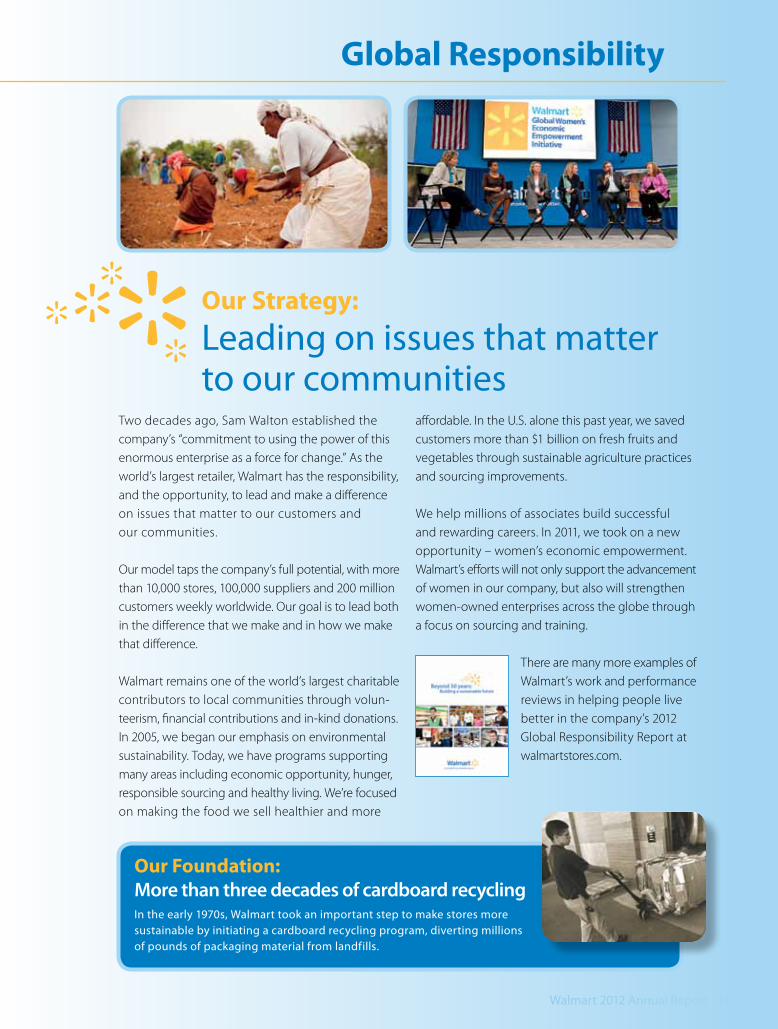
Our Strategy: Leading on issues that matter to our communities
Our Foundation: More than three decades of cardboard recyclingIn the early 1970s, Walmart took an important step to make stores more sustainable by initiating a cardboard recycling program, diverting millions of pounds of packaging material from landfills.
Two decades ago, Sam Walton established the company’s “commitment to using the power of this enormous enterprise as a force for change.” As the world’s largest retailer, Walmart has the responsibility, and the opportunity, to lead and make a difference on issues that matter to our customers and our communities.
Our model taps the company’s full potential, with more than 10,000 stores, 100,000 suppliers and 200 million customers weekly worldwide. Our goal is to lead both in the difference that we make and in how we make that difference.
Walmart remains one of the world’s largest charitable contributors to local communities through volun-teerism, financial contributions and in-kind donations. In 2005, we began our emphasis on environmental sustainability. Today, we have programs supporting many areas including economic opportunity, hunger, responsible sourcing and healthy living. We’re focused on making the food we sell healthier and more
affordable. In the U.S. alone this past year, we saved customers more than $1 billion on fresh fruits and vegetables through sustainable agriculture practices and sourcing improvements.
We help millions of associates build successful and rewarding careers. In 2011, we took on a new opportunity – women’s economic empowerment. Walmart’s efforts will not only support the advancement of women in our company, but also will strengthen women-owned enterprises across the globe through a focus on sourcing and training.
There are many more examples of Walmart’s work and performance reviews in helping people live better in the company’s 2012 Global Responsibility Report at walmartstores.com.
This year, we mark the historic occasion of Walmart’s 50th anniversary. Our success over these five decades reflects the strength of our mission, people, values and culture. My dad would be amazed by how far we’ve come, and he’d be excited about the opportunities ahead to continue our mission to save people money so they can live better.
Nothing is more important to delivering on our mission than Walmart’s people. Our board members, company leaders, managers and associates bring our values to life every day as they serve customers and shareholders. We respect individuals, care for customers and strive for excellence in all we do. Dad established those values and beliefs – simple words, but strong in how they guide us in serving each other and our customers. Those values also guide our commitment to help our communities live better. I am proud of how much progress we’ve made in service to our communities around the world.
Dad never wavered in his belief that integrity was essential. “Personal and moral integrity is one of our basic fundamentals, and it has to start with each of us,” he said. With culture and values like these, there is no limit to the difference Walmart associates can make for shareholders and customers and the world we serve around us.
We also are proud of the service of our board members, and of the processes we have in place to serve our shareholders. Good corporate governance is good business. As your chairman, I am pleased that we continue to strengthen our structure and best practices.
We recognize the importance of board independence. We separated the roles of board chairman and chief executive officer nearly 25 years ago in 1988, when Dad became chair-man and David Glass chief executive officer. This decision promoted even greater accountability and responsibility.
Ten of our current board members are independent, and we have an independent presiding director. All directors must stand for election each year and receive majority votes. Based on the board’s recommendation, we provide shareholders with an annual “say-on-pay” vote, which received overwhelming share-holder approval last year.
We added an additional board meeting to the 2012 calendar to provide more face-to-face time with management. Last year, in fact, we had an attendance rate at board, committee and shareholders’ meetings of 98 percent, an extraordinary measure of our directors’ dedication.
We also added a Technology and eCommerce Committee last year to bring more intensive company focus on Global eCommerce and social and mobile retailing. We are leveraging the knowledge and insights of directors who have deep experience and high expectations in this area.
There’s no doubt that Dad would be proud of Walmart today. He would push us to ensure that Walmart becomes even more trusted and successful in the years ahead. He was always most interested in new areas and challenges that went beyond what we had already done or were doing at the time. I also know that he’d constantly challenge our assumptions about what we can accomplish and how we intend to do it. And he’d absolutely push us to maintain the highest standards of integrity and performance.
I’m proud to be an associate, a director and a shareholder. I’m excited about what the future holds for Walmart as we deliver on our mission. There are many blessings that Dad left our company, including our values and culture. I can’t help but believe that as we represent Walmart’s shareholders, these principles will continue to guide us, and we will be even stronger over the next 50 years.
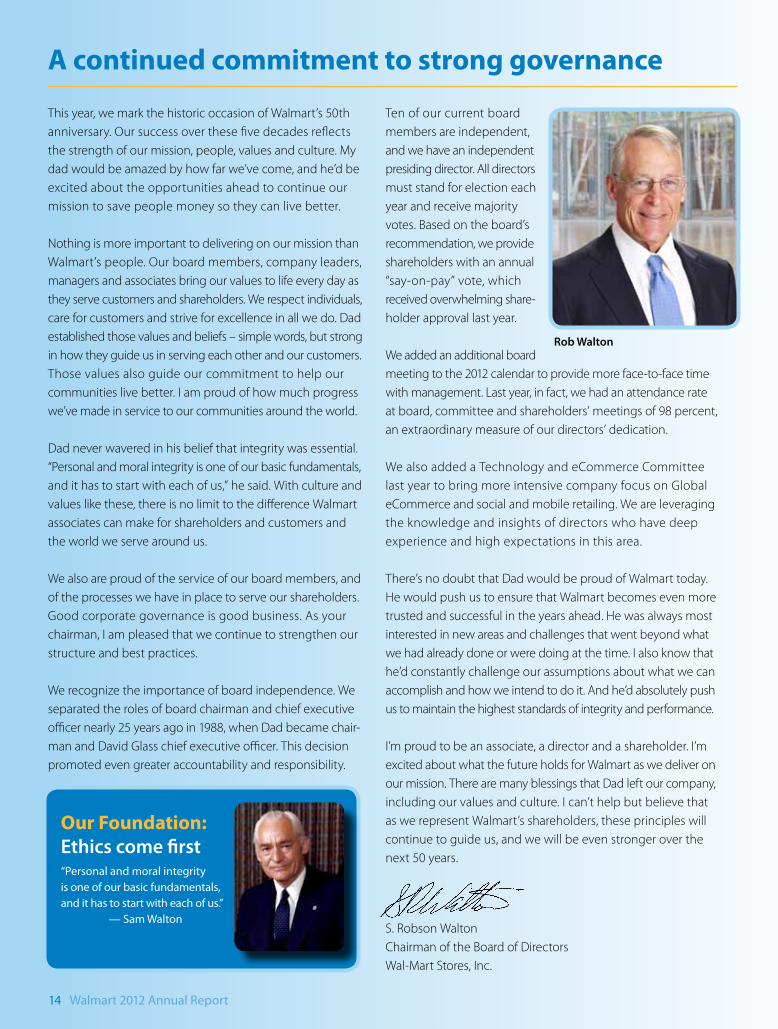
S. Robson WaltonChairman of the Board of DirectorsWal-Mart Stores, Inc.
A continued commitment to strong governance
14 Walmart 2012 Annual Report
Our Foundation: Ethics come first“Personal and moral integrity is one of our basic fundamentals, and it has to start with each of us.” — Sam Walton
Rob Walton
Walmart 2012 Annual Report 15
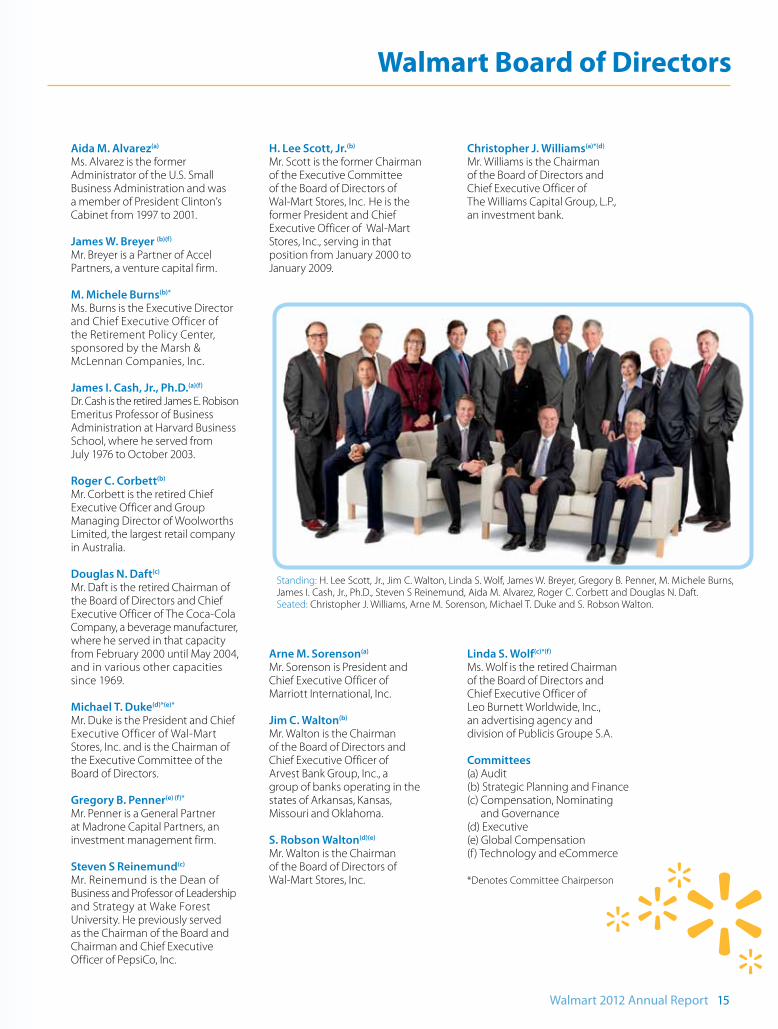
Standing: H. Lee Scott, Jr., Jim C. Walton, Linda S. Wolf, James W. Breyer, Gregory B. Penner, M. Michele Burns, James I. Cash, Jr., Ph.D., Steven S Reinemund, Aida M. Alvarez, Roger C. Corbett and Douglas N. Daft. Seated: Christopher J. Williams, Arne M. Sorenson, Michael T. Duke and S. Robson Walton.
Walmart Board of Directors
Aida M. Alvarez(a)
Ms. Alvarez is the former Administrator of the U.S. Small Business Administration and was a member of President Clinton’s Cabinet from 1997 to 2001.
James W. Breyer (b)(f)
Mr. Breyer is a Partner of Accel Partners, a venture capital firm.
M. Michele Burns(b)*
Ms. Burns is the Executive Director and Chief Executive Officer of the Retirement Policy Center, sponsored by the Marsh & McLennan Companies, Inc.
James I. Cash, Jr., Ph.D.(a)(f)
Dr. Cash is the retired James E. Robison Emeritus Professor of Business Administration at Harvard Business School, where he served from July 1976 to October 2003.
Roger C. Corbett(b)
Mr. Corbett is the retired Chief Executive Officer and Group Managing Director of Woolworths Limited, the largest retail company in Australia.
Douglas N. Daft(c)
Mr. Daft is the retired Chairman of the Board of Directors and Chief Executive Officer of The Coca-Cola Company, a beverage manufacturer, where he served in that capacity from February 2000 until May 2004, and in various other capacities since 1969.
Michael T. Duke(d)*(e)*
Mr. Duke is the President and Chief Executive Officer of Wal-Mart Stores, Inc. and is the Chairman of the Executive Committee of the Board of Directors.
Gregory B. Penner(e) (f)*
Mr. Penner is a General Partner at Madrone Capital Partners, an investment management firm.
Steven S Reinemund(c)
Mr. Reinemund is the Dean of Business and Professor of Leadership and Strategy at Wake Forest University. He previously served as the Chairman of the Board and Chairman and Chief Executive Officer of PepsiCo, Inc.
H. Lee Scott, Jr.(b)
Mr. Scott is the former Chairman of the Executive Committee of the Board of Directors of Wal-Mart Stores, Inc. He is the former President and Chief Executive Officer of Wal-Mart Stores, Inc., serving in that position from January 2000 to January 2009.
Arne M. Sorenson(a)
Mr. Sorenson is President and Chief Executive Officer of Marriott International, Inc.
Jim C. Walton(b)
Mr. Walton is the Chairman of the Board of Directors and Chief Executive Officer of Arvest Bank Group, Inc., a group of banks operating in the states of Arkansas, Kansas, Missouri and Oklahoma.
S. Robson Walton(d)(e)
Mr. Walton is the Chairman of the Board of Directors of Wal-Mart Stores, Inc.
Christopher J. Williams(a)*(d)
Mr. Williams is the Chairman of the Board of Directors and Chief Executive Officer of The Williams Capital Group, L.P., an investment bank.
Linda S. Wolf(c)*(f)
Ms. Wolf is the retired Chairman of the Board of Directors and Chief Executive Officer of Leo Burnett Worldwide, Inc., an advertising agency and division of Publicis Groupe S.A.
Committees(a) Audit(b) Strategic Planning and Finance(c) Compensation, Nominating
and Governance(d) Executive(e) Global Compensation(f) Technology and eCommerce
*Denotes Committee Chairperson
16 Walmart 2012 Annual Report
2012 Financial ReportUnderstanding our financial focusThese are exciting times at Walmart – for shareholders, associates and our customers. We are on track to accelerate the momentum of the past year by adhering to a disciplined strategy for operating and investing in our global business. Walmart’s Everyday Low Cost (EDLC)/Everyday Low Price (EDLP) business model is an approach that wins with our customers.
Walmart’s financial priorities – growth, leverage and returns – drive our decisions and strategies. In Fiscal 2012, Walmart delivered net sales growth in all operating segments. For the second consecutive year, we “leveraged,” meaning the company reduced operating expenses as a percentage of sales. We delivered strong returns to shareholders through dividends and share repurchases. Walmart’s earnings remained strong throughout challenging economic environments. In fact, during the last decade, earnings increased at a com-pound annual growth rate of nearly 12 percent. It is a strong performance record, and one that we intend to build upon.
We’re focused on improving net sales through comparable store growth and new units. We plan to further strengthen Walmart’s price position by leveraging expenses as a percent-age of sales by an additional 100 basis points over the next five years. We are investing these savings in price in our U.S. businesses, while expanding operating margins in international segments. We strengthened technology and optimized our supply chain. This allows us to operate for less, sell for less and grow sales – all part of the “productivity loop” – a virtuous cycle that benefits shareholders and customers alike.
We are proud of our AA credit rating, the highest in the retail industry, as it’s a testament to Walmart’s strong cash flows, efficient use of working capital and sound financial manage-ment. We’ll execute disciplined growth, while incorporating new initiatives to design and build the most cost-effective stores in the world. And, we remain committed to continuing our long history of a growing dividend and share repurchases. In fact, over the last five years, we’ve returned about $61 billion to our shareholders through these means.
As you review our financial results, know that our foremost objective is to deliver shareholder value. We’re focused on increasing earnings per share and returns (through dividends and share repurchase) and maintaining strong stable returns on investment. Through disciplined execution of our key priorities, we are working to ensure that Walmart remains the world’s best-positioned retailer, both for customers and for shareholders.
Charles M. Holley, Jr.Executive Vice President and Chief Financial Officer
Neil M. Ashe Executive Vice President, President and Chief Executive Officer, Global eCommerce
Rosalind G. Brewer Executive Vice President, President and Chief Executive Officer, Sam’s Club
M. Susan Chambers Executive Vice President, Global People
Leslie A. Dach Executive Vice President, Corporate Affairs
Michael T. Duke President and Chief Executive Officer
Rollin L. Ford Executive Vice President and Chief Administrative Officer
Jeffrey J. Gearhart Executive Vice President, General Counsel and Corporate Secretary
Charles M. Holley, Jr. Executive Vice President and Chief Financial Officer
C. Douglas McMillon Executive Vice President, President and Chief Executive Officer, Walmart International
William S. Simon Executive Vice President, President and Chief Executive Officer, Walmart U.S.
S. Robson Walton Chairman of the Board of Directors
Steven P. Whaley Senior Vice President and Controller
Executive Officers
Walmart 2012 Annual Report 17
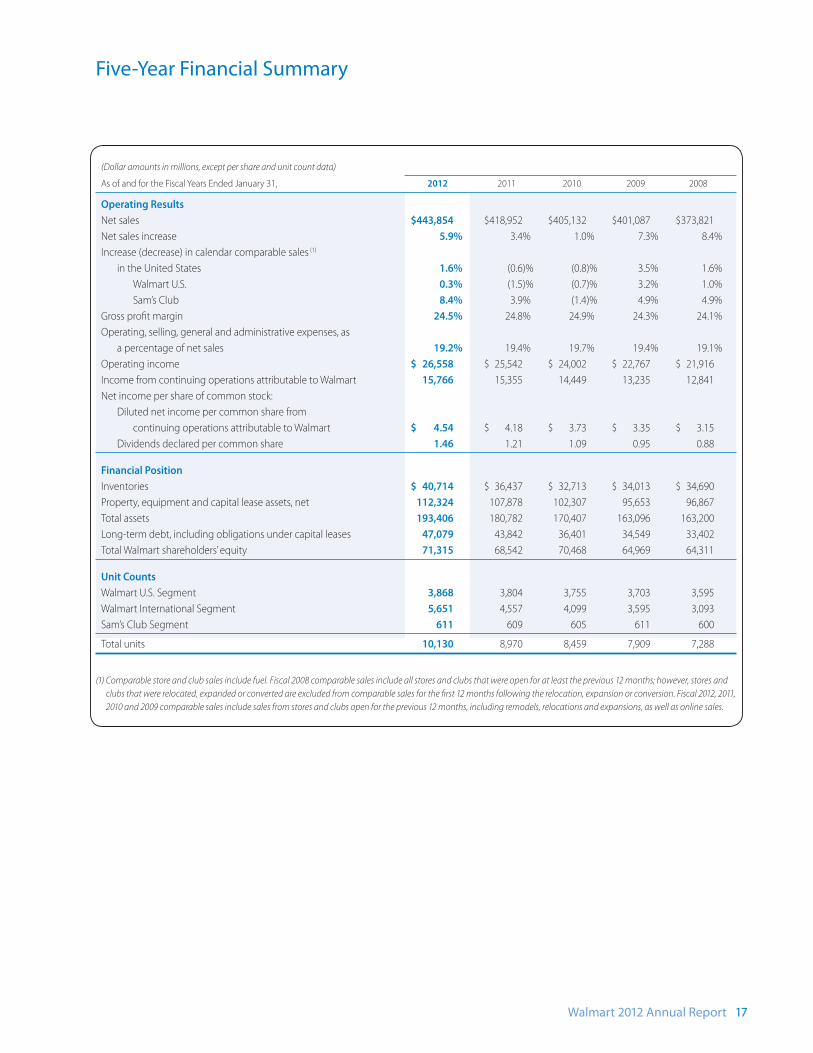
(Dollar amounts in millions, except per share and unit count data)
As of and for the Fiscal Years Ended January 31, 2012 2011 2010 2009 2008
Operating Results
Net sales $443,854 $418,952 $405,132 $401,087 $373,821
Net sales increase 5.9% 3.4% 1.0% 7.3% 8.4%
Increase (decrease) in calendar comparable sales (1)
in the United States 1.6% (0.6)% (0.8)% 3.5% 1.6%
Walmart U.S. 0.3% (1.5)% (0.7)% 3.2% 1.0%
Sam’s Club 8.4% 3.9% (1.4)% 4.9% 4.9%
Gross profi t margin 24.5% 24.8% 24.9% 24.3% 24.1%
Operating, selling, general and administrative expenses, as
a percentage of net sales 19.2% 19.4% 19.7% 19.4% 19.1%
Operating income $ 26,558 $ 25,542 $ 24,002 $ 22,767 $ 21,916
Income from continuing operations attributable to Walmart 15,766 15,355 14,449 13,235 12,841
Net income per share of common stock:
Diluted net income per common share from
continuing operations attributable to Walmart $ 4.54 $ 4.18 $ 3.73 $ 3.35 $ 3.15
Dividends declared per common share 1.46 1.21 1.09 0.95 0.88
Financial Position
Inventories $ 40,714 $ 36,437 $ 32,713 $ 34,013 $ 34,690
Property, equipment and capital lease assets, net 112,324 107,878 102,307 95,653 96,867
Total assets 193,406 180,782 170,407 163,096 163,200
Long-term debt, including obligations under capital leases 47,079 43,842 36,401 34,549 33,402
Total Walmart shareholders’ equity 71,315 68,542 70,468 64,969 64,311
Unit Counts
Walmart U.S. Segment 3,868 3,804 3,755 3,703 3,595
Walmart International Segment 5,651 4,557 4,099 3,595 3,093
Sam’s Club Segment 611 609 605 611 600
Total units 10,130 8,970 8,459 7,909 7,288
(1) Comparable store and club sales include fuel. Fiscal 2008 comparable sales include all stores and clubs that were open for at least the previous 12 months; however, stores and
clubs that were relocated, expanded or converted are excluded from comparable sales for the fi rst 12 months following the relocation, expansion or conversion. Fiscal 2012, 2011,
2010 and 2009 comparable sales include sales from stores and clubs open for the previous 12 months, including remodels, relocations and expansions, as well as online sales.
Five-Year Financial Summary
Management’s Discussion and Analysis of Financial
Condition and Results of Operations
18 Walmart 2012 Annual Report
OverviewWal-Mart Stores, Inc. (“Walmart,” the “Company” or “we”) operates retail
stores in various formats around the world and is committed to saving
people money so they can live better. We earn the trust of our customers
every day by providing a broad assortment of quality merchandise and
services at everyday low prices (“EDLP”), while fostering a culture that
rewards and embraces mutual respect, integrity and diversity. EDLP is our
pricing philosophy under which we price items at a low price every day
so our customers trust that our prices will not change under frequent
promotional activities. Our focus for Sam’s Club is to provide exceptional
value on brand name and private label merchandise at “members only”
prices for both business and personal use. Internationally, we operate
with similar philosophies.
Our fi scal year ends on January 31 for our United States (“U.S.”) and
Canadian operations and on December 31 for all other operations.
We discuss how the results of our various operations are consolidated
for fi nancial reporting purposes in Note 1 in the “Notes to Consolidated
Financial Statements.”
We intend for this discussion to provide the reader with information
that will assist in understanding our fi nancial statements, the changes in
certain key items in those fi nancial statements from year to year, and the
primary factors that accounted for those changes, as well as how certain
accounting principles aff ect our fi nancial statements. We also discuss
certain performance metrics that management uses to assess our per-
formance. Additionally, the discussion provides information about the
fi nancial results of the various segments of our business to provide a
better understanding of how those segments and their results aff ect the
fi nancial condition and results of operations of the Company as a whole.
This discussion should be read in conjunction with our Consolidated
Financial Statements as of and for the fi scal year ended January 31, 2012,
and accompanying notes.
Currently, our operations consist of three reportable business segments:
the Walmart U.S. segment; the Walmart International segment; and the
Sam’s Club segment. The Walmart U.S. segment includes the Company’s
mass merchant concept in the U.S. operating under the “Walmart” or
“Wal-Mart” brand, as well as walmart.com. The Walmart International
segment consists of the Company’s operations outside of the U.S. The
Sam’s Club segment includes the warehouse membership clubs in the
U.S., as well as samsclub.com.
Throughout this Management’s Discussion and Analysis of Financial
Condition and Results of Operations, we discuss segment operating
income and comparable store and club sales. The Company measures
the results of its segments using, among other measures, each segment’s
operating income, including certain corporate overhead allocations.
From time to time, we revise the measurement of each segment’s
operating income, including any corporate overhead allocations, as
dictated by the information regularly reviewed by our chief operating
decision maker. When we do so, the prior period amounts for segment
operating income are reclassifi ed to conform to the current period’s
presentation. The amounts representing “Other unallocated” in the
leverage discussion of the Company Performance Metrics include
unallocated corporate overhead and other items.
Comparable store and club sales is a metric which indicates the
performance of our existing U.S. stores and clubs by measuring the
change in sales for such stores and clubs for a particular period from the
corresponding period in the prior year. Walmart’s defi nition of compa-
rable store and club sales includes sales from stores and clubs open for
the previous 12 months, including remodels, relocations and expansions,
as well as sales initiated online. Changes in format continue to be
excluded from comparable store and club sales when the conversion is
accompanied by a relocation or expansion that results in a change in
square feet of more than fi ve percent. Comparable store and club sales
are also referred to as “same-store” sales by others within the retail
industry. The method of calculating comparable store and club sales
varies across the retail industry. As a result, our calculation of comparable
store and club sales is not necessarily comparable to similarly titled
measures reported by other companies.
In discussing our operating results, we sometimes refer to the impact of
changes in currency exchange rates that we use to convert the operating
results for all countries where the functional currency is not denominated
in the U.S. dollar for fi nancial reporting purposes. We calculate the eff ect
of changes in currency exchange rates as the diff erence between current
period activity translated using the current period’s currency exchange
rates and the comparable prior period’s currency exchange rates. We
exclude the impact of current period acquisitions from our calculation. We
refer to the results of this calculation as currency translation fl uctuations
throughout our discussion. When we refer to constant currency operat-
ing results, we are referring to our operating results without the impact
of the currency translation fl uctuations and without the impact of current
period acquisitions. The disclosure of constant currency amounts or results,
excluding the eff ect of acquisitions, permits investors to understand better
our underlying performance without the eff ects of currency exchange rate
fl uctuations or acquisitions.
We made certain reclassifi cations to prior fi scal year amounts or balances
to conform to the presentation in the current fi scal year. These reclassifi -
cations did not impact consolidated operating income or net income.
Additionally, certain segment asset and expense allocations have been
reclassifi ed among segments in the current period.
The Retail Industry
We operate in the highly competitive retail industry in all of the countries
we serve. We face strong sales competition from other discount, depart-
ment, drug, dollar, variety and specialty stores, warehouse clubs and
supermarkets. Many of these competitors are national, regional or inter-
national chains, as well as internet-based retailers and catalog businesses.
Management’s Discussion and Analysis of Financial
Condition and Results of Operations
Walmart 2012 Annual Report 19
We compete with a number of companies for prime retail site locations,
as well as in attracting and retaining quality employees (whom we call
“associates”). We, along with other retail companies, are infl uenced by a
number of factors including, but not limited to: general economic condi-
tions, cost of goods, consumer disposable income, consumer debt levels
and buying patterns, consumer credit availability, interest rates, customer
preferences, unemployment, labor costs, infl ation, defl ation, currency
exchange fl uctuations, fuel and energy prices, weather patterns, climate
change, catastrophic events, competitive pressures and insurance costs.
Further information on certain risks to our Company can be located in
“Item 1A. Risk Factors” in our Annual Report on Form 10-K for the fi scal
year ended January 31, 2012.
Company Performance MetricsThe Company’s performance metrics emphasize three priorities for
improving shareholder value: growth, leverage and returns. The
Company’s priority of growth focuses on sales through comparable store
and club sales and unit square feet growth; the priority of leverage
encompasses the Company’s objective to increase its operating income
at a faster rate than the growth in net sales by growing its operating,
selling, general and administrative expenses (“operating expenses”) at a
slower rate than the growth of its net sales; and the priority of returns
focuses on how effi ciently the Company employs its assets through
return on investment (“ROI”) and how eff ectively the Company manages
working capital through free cash fl ow.
Growth
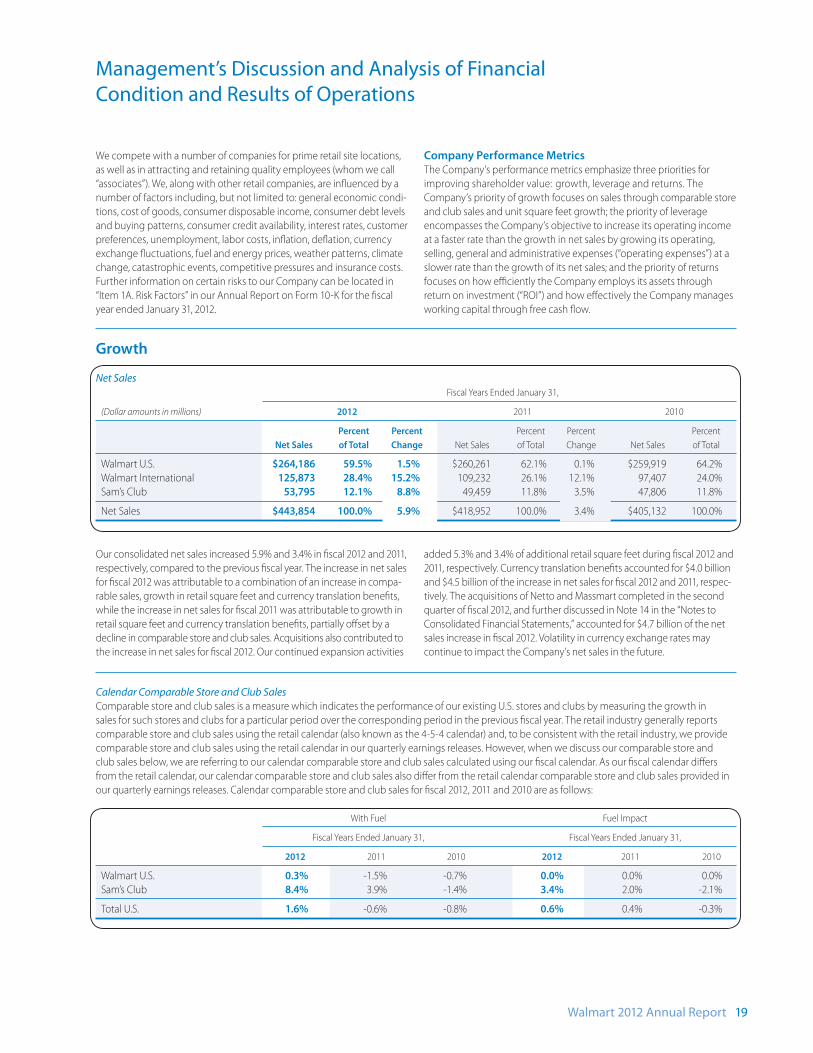
Net Sales
Fiscal Years Ended January 31,
(Dollar amounts in millions) 2012 2011 2010
Percent Percent Percent Percent Percent
Net Sales of Total Change Net Sales of Total Change Net Sales of Total
Walmart U.S. $264,186 59.5% 1.5% $260,261 62.1% 0.1% $259,919 64.2%
Walmart International 125,873 28.4% 15.2% 109,232 26.1% 12.1% 97,407 24.0%
Sam’s Club 53,795 12.1% 8.8% 49,459 11.8% 3.5% 47,806 11.8%
Net Sales $443,854 100.0% 5.9% $418,952 100.0% 3.4% $405,132 100.0%
Calendar Comparable Store and Club Sales
Comparable store and club sales is a measure which indicates the performance of our existing U.S. stores and clubs by measuring the growth in
sales for such stores and clubs for a particular period over the corresponding period in the previous fi scal year. The retail industry generally reports
comparable store and club sales using the retail calendar (also known as the 4-5-4 calendar) and, to be consistent with the retail industry, we provide
comparable store and club sales using the retail calendar in our quarterly earnings releases. However, when we discuss our comparable store and
club sales below, we are referring to our calendar comparable store and club sales calculated using our fi scal calendar. As our fi scal calendar diff ers
from the retail calendar, our calendar comparable store and club sales also diff er from the retail calendar comparable store and club sales provided in
our quarterly earnings releases. Calendar comparable store and club sales for fi scal 2012, 2011 and 2010 are as follows:
With Fuel Fuel Impact
Fiscal Years Ended January 31, Fiscal Years Ended January 31,
2012 2011 2010 2012 2011 2010
Walmart U.S. 0.3% -1.5% -0.7% 0.0% 0.0% 0.0%
Sam’s Club 8.4% 3.9% -1.4% 3.4% 2.0% -2.1%
Total U.S. 1.6% -0.6% -0.8% 0.6% 0.4% -0.3%
Our consolidated net sales increased 5.9% and 3.4% in fi scal 2012 and 2011,
respectively, compared to the previous fi scal year. The increase in net sales
for fi scal 2012 was attributable to a combination of an increase in compa-
rable sales, growth in retail square feet and currency translation benefi ts,
while the increase in net sales for fi scal 2011 was attributable to growth in
retail square feet and currency translation benefi ts, partially off set by a
decline in comparable store and club sales. Acquisitions also contributed to
the increase in net sales for fi scal 2012. Our continued expansion activities
added 5.3% and 3.4% of additional retail square feet during fi scal 2012 and
2011, respectively. Currency translation benefi ts accounted for $4.0 billion
and $4.5 billion of the increase in net sales for fi scal 2012 and 2011, respec-
tively. The acquisitions of Netto and Massmart completed in the second
quarter of fi scal 2012, and further discussed in Note 14 in the “Notes to
Consolidated Financial Statements,” accounted for $4.7 billion of the net
sales increase in fi scal 2012. Volatility in currency exchange rates may
continue to impact the Company’s net sales in the future.
Management’s Discussion and Analysis of Financial
Condition and Results of Operations
20 Walmart 2012 Annual Report
Comparable store and club sales in the U.S., including fuel, increased 1.6% in fi scal 2012 and decreased 0.6% and 0.8% in fi scal 2011 and 2010,
respectively. U.S. comparable store sales increased during fi scal 2012 primarily due to an increase in average ticket, partially off set by a decline in traffi c.
Comparable club sales were higher during fi scal 2012 due to a larger member base driving increased traffi c, as well as a broader assortment of items.
Total U.S. comparable store and club sales decreased during fi scal 2011 primarily due to a decline in customer traffi c. Although customer traffi c
increased in fi scal 2010, comparable store and club sales in the U.S. were lower than those in the previous fi scal year due to defl ation in certain
merchandise categories and lower fuel prices.
As we continue to add new stores and clubs in the U.S., we do so with an understanding that additional stores and clubs may take sales away from
existing units. We estimate the negative impact on comparable store and club sales as a result of opening new stores and clubs was approximately
0.8% in fi scal 2012 and 2011 and 0.6% in fi scal 2010.
Leverage
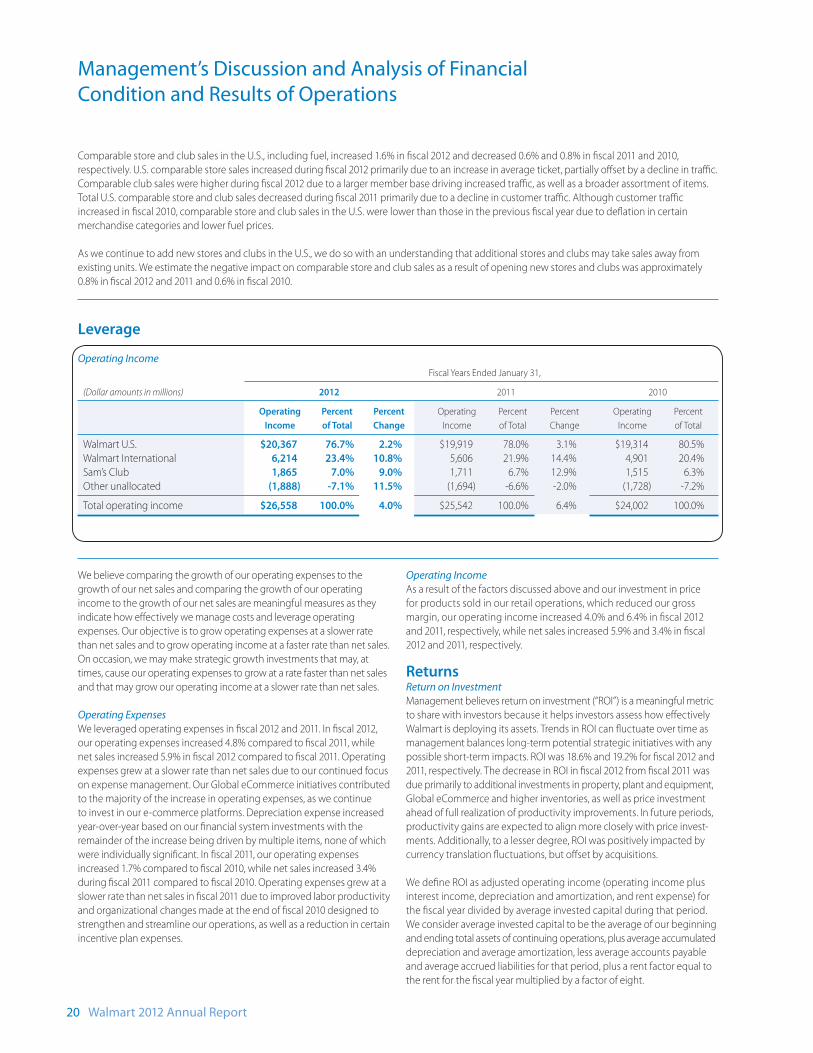
Operating Income
Fiscal Years Ended January 31,
(Dollar amounts in millions) 2012 2011 2010
Operating Percent Percent Operating Percent Percent Operating Percent
Income of Total Change Income of Total Change Income of Total
Walmart U.S. $20,367 76.7% 2.2% $19,919 78.0% 3.1% $19,314 80.5%
Walmart International 6,214 23.4% 10.8% 5,606 21.9% 14.4% 4,901 20.4%
Sam’s Club 1,865 7.0% 9.0% 1,711 6.7% 12.9% 1,515 6.3%
Other unallocated (1,888) -7.1% 11.5% (1,694) -6.6% -2.0% (1,728) -7.2%
Total operating income $26,558 100.0% 4.0% $25,542 100.0% 6.4% $24,002 100.0%
We believe comparing the growth of our operating expenses to the
growth of our net sales and comparing the growth of our operating
income to the growth of our net sales are meaningful measures as they
indicate how eff ectively we manage costs and leverage operating
expenses. Our objective is to grow operating expenses at a slower rate
than net sales and to grow operating income at a faster rate than net sales.
On occasion, we may make strategic growth investments that may, at
times, cause our operating expenses to grow at a rate faster than net sales
and that may grow our operating income at a slower rate than net sales.
Operating Expenses
We leveraged operating expenses in fi scal 2012 and 2011. In fi scal 2012,
our operating expenses increased 4.8% compared to fi scal 2011, while
net sales increased 5.9% in fi scal 2012 compared to fi scal 2011. Operating
expenses grew at a slower rate than net sales due to our continued focus
on expense management. Our Global eCommerce initiatives contributed
to the majority of the increase in operating expenses, as we continue
to invest in our e-commerce platforms. Depreciation expense increased
year-over-year based on our fi nancial system investments with the
remainder of the increase being driven by multiple items, none of which
were individually signifi cant. In fi scal 2011, our operating expenses
increased 1.7% compared to fi scal 2010, while net sales increased 3.4%
during fi scal 2011 compared to fi scal 2010. Operating expenses grew at a
slower rate than net sales in fi scal 2011 due to improved labor productivity
and organizational changes made at the end of fi scal 2010 designed to
strengthen and streamline our operations, as well as a reduction in certain
incentive plan expenses.
Operating Income
As a result of the factors discussed above and our investment in price
for products sold in our retail operations, which reduced our gross
margin, our operating income increased 4.0% and 6.4% in fi scal 2012
and 2011, respectively, while net sales increased 5.9% and 3.4% in fi scal
2012 and 2011, respectively.
ReturnsReturn on Investment
Management believes return on investment (“ROI”) is a meaningful metric
to share with investors because it helps investors assess how eff ectively
Walmart is deploying its assets. Trends in ROI can fl uctuate over time as
management balances long-term potential strategic initiatives with any
possible short-term impacts. ROI was 18.6% and 19.2% for fi scal 2012 and
2011, respectively. The decrease in ROI in fi scal 2012 from fi scal 2011 was
due primarily to additional investments in property, plant and equipment,
Global eCommerce and higher inventories, as well as price investment
ahead of full realization of productivity improvements. In future periods,
productivity gains are expected to align more closely with price invest-
ments. Additionally, to a lesser degree, ROI was positively impacted by
currency translation fl uctuations, but off set by acquisitions.
We defi ne ROI as adjusted operating income (operating income plus
interest income, depreciation and amortization, and rent expense) for
the fi scal year divided by average invested capital during that period.
We consider average invested capital to be the average of our beginning
and ending total assets of continuing operations, plus average accumulated
depreciation and average amortization, less average accounts payable
and average accrued liabilities for that period, plus a rent factor equal to
the rent for the fi scal year multiplied by a factor of eight.
Management’s Discussion and Analysis of Financial
Condition and Results of Operations
Walmart 2012 Annual Report 21
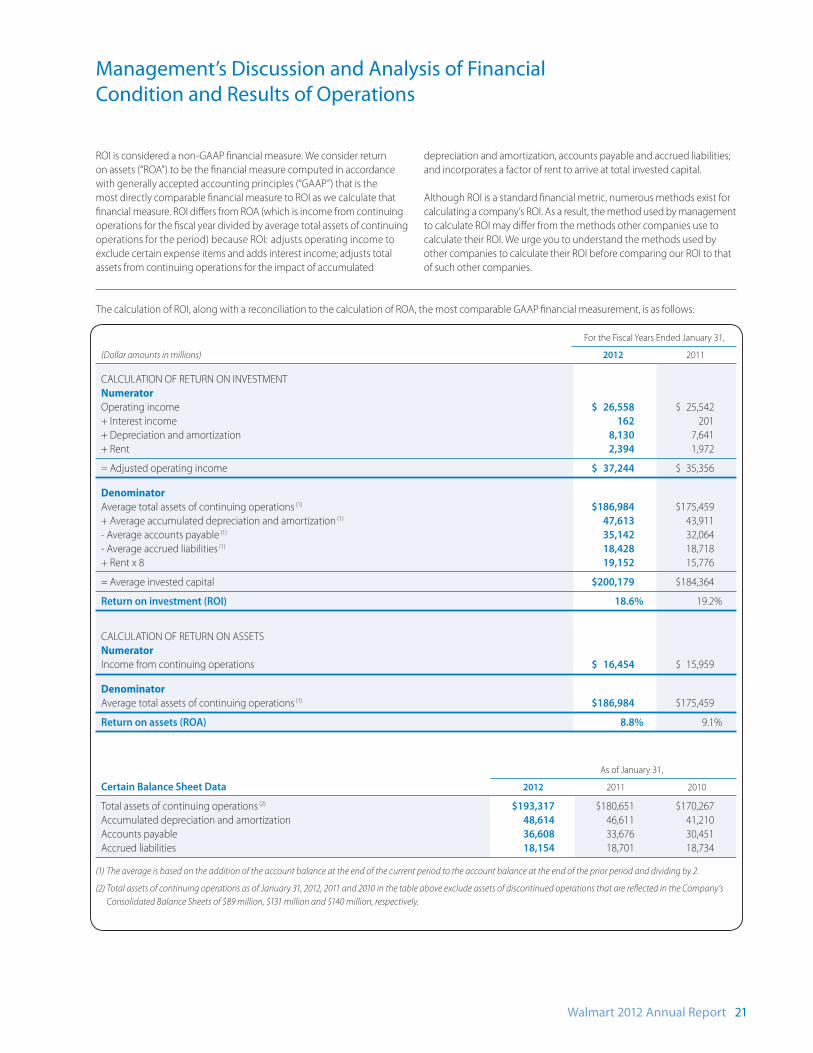
The calculation of ROI, along with a reconciliation to the calculation of ROA, the most comparable GAAP fi nancial measurement, is as follows:
For the Fiscal Years Ended January 31,
(Dollar amounts in millions) 2012 2011
CALCULATION OF RETURN ON INVESTMENT
NumeratorOperating income $ 26,558 $ 25,542
+ Interest income 162 201
+ Depreciation and amortization 8,130 7,641
+ Rent 2,394 1,972
= Adjusted operating income $ 37,244 $ 35,356
DenominatorAverage total assets of continuing operations (1) $186,984 $175,459
+ Average accumulated depreciation and amortization (1) 47,613 43,911
- Average accounts payable (1) 35,142 32,064
- Average accrued liabilities (1) 18,428 18,718
+ Rent x 8 19,152 15,776
= Average invested capital $200,179 $184,364
Return on investment (ROI) 18.6% 19.2%
CALCULATION OF RETURN ON ASSETS
NumeratorIncome from continuing operations $ 16,454 $ 15,959
DenominatorAverage total assets of continuing operations (1) $186,984 $175,459
Return on assets (ROA) 8.8% 9.1%
As of January 31,
Certain Balance Sheet Data 2012 2011 2010
Total assets of continuing operations (2) $193,317 $180,651 $170,267
Accumulated depreciation and amortization 48,614 46,611 41,210
Accounts payable 36,608 33,676 30,451
Accrued liabilities 18,154 18,701 18,734
(1) The average is based on the addition of the account balance at the end of the current period to the account balance at the end of the prior period and dividing by 2.
(2) Total assets of continuing operations as of January 31, 2012, 2011 and 2010 in the table above exclude assets of discontinued operations that are refl ected in the Company’s
Consolidated Balance Sheets of $89 million, $131 million and $140 million, respectively.
ROI is considered a non-GAAP fi nancial measure. We consider return
on assets (“ROA”) to be the fi nancial measure computed in accordance
with generally accepted accounting principles (“GAAP”) that is the
most directly comparable fi nancial measure to ROI as we calculate that
fi nancial measure. ROI diff ers from ROA (which is income from continuing
operations for the fi scal year divided by average total assets of continuing
operations for the period) because ROI: adjusts operating income to
exclude certain expense items and adds interest income; adjusts total
assets from continuing operations for the impact of accumulated
depreciation and amortization, accounts payable and accrued liabilities;
and incorporates a factor of rent to arrive at total invested capital.
Although ROI is a standard fi nancial metric, numerous methods exist for
calculating a company’s ROI. As a result, the method used by management
to calculate ROI may diff er from the methods other companies use to
calculate their ROI. We urge you to understand the methods used by
other companies to calculate their ROI before comparing our ROI to that
of such other companies.
Management’s Discussion and Analysis of Financial
Condition and Results of Operations
22 Walmart 2012 Annual Report
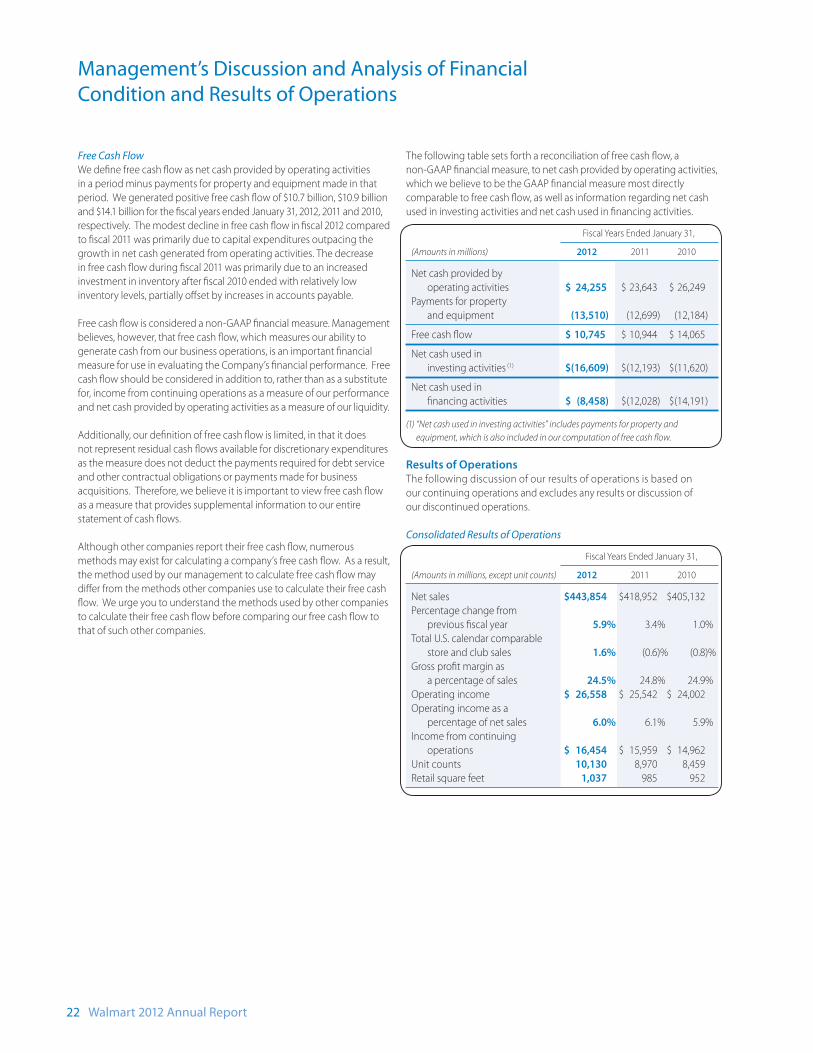
Free Cash Flow
We defi ne free cash fl ow as net cash provided by operating activities
in a period minus payments for property and equipment made in that
period. We generated positive free cash fl ow of $10.7 billion, $10.9 billion
and $14.1 billion for the fi scal years ended January 31, 2012, 2011 and 2010,
respectively. The modest decline in free cash fl ow in fi scal 2012 compared
to fi scal 2011 was primarily due to capital expenditures outpacing the
growth in net cash generated from operating activities. The decrease
in free cash fl ow during fi scal 2011 was primarily due to an increased
investment in inventory after fi scal 2010 ended with relatively low
inventory levels, partially off set by increases in accounts payable.
Free cash fl ow is considered a non-GAAP fi nancial measure. Management
believes, however, that free cash fl ow, which measures our ability to
generate cash from our business operations, is an important fi nancial
measure for use in evaluating the Company’s fi nancial performance. Free
cash fl ow should be considered in addition to, rather than as a substitute
for, income from continuing operations as a measure of our performance
and net cash provided by operating activities as a measure of our liquidity.
Additionally, our defi nition of free cash fl ow is limited, in that it does
not represent residual cash fl ows available for discretionary expenditures
as the measure does not deduct the payments required for debt service
and other contractual obligations or payments made for business
acquisitions. Therefore, we believe it is important to view free cash fl ow
as a measure that provides supplemental information to our entire
statement of cash fl ows.
Although other companies report their free cash fl ow, numerous
methods may exist for calculating a company’s free cash fl ow. As a result,
the method used by our management to calculate free cash fl ow may
diff er from the methods other companies use to calculate their free cash
fl ow. We urge you to understand the methods used by other companies
to calculate their free cash fl ow before comparing our free cash fl ow to
that of such other companies.
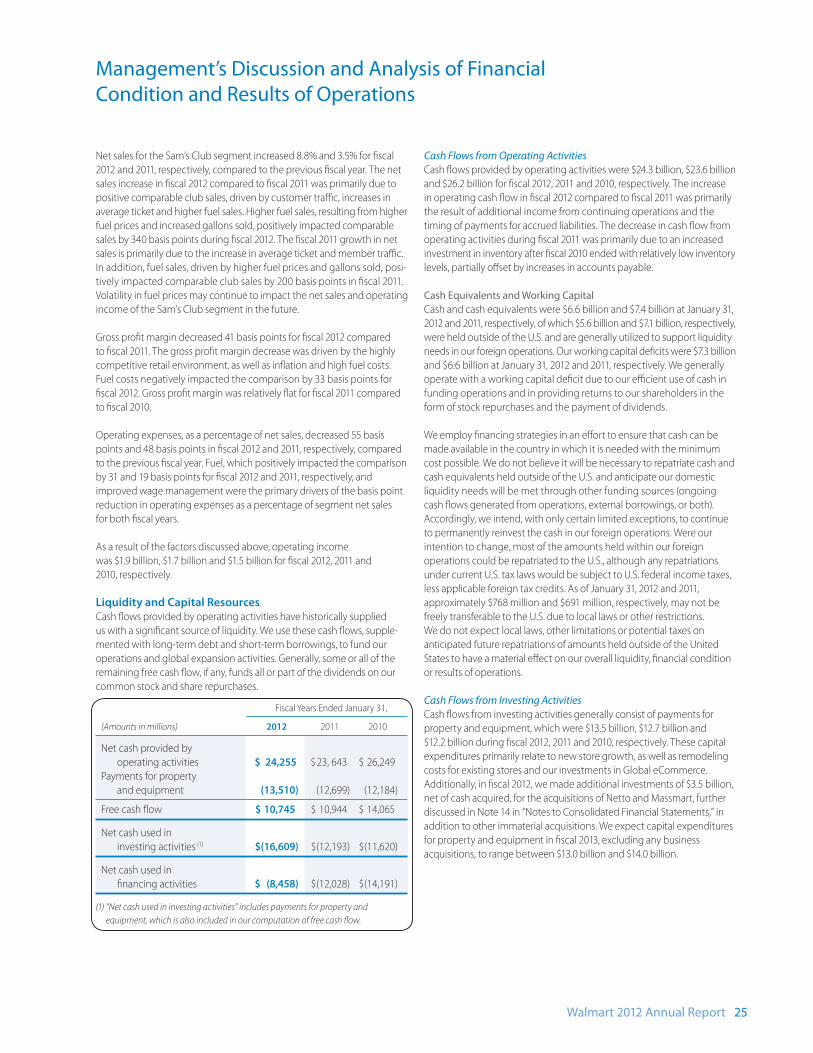
The following table sets forth a reconciliation of free cash fl ow, a
non-GAAP fi nancial measure, to net cash provided by operating activities,
which we believe to be the GAAP fi nancial measure most directly
comparable to free cash fl ow, as well as information regarding net cash
used in investing activities and net cash used in fi nancing activities.
Fiscal Years Ended January 31,
(Amounts in millions) 2012 2011 2010
Net cash provided by
operating activities $ 24,255 $ 23,643 $ 26,249
Payments for property
and equipment (13,510) (12,699) (12,184)
Free cash fl ow $ 10,745 $ 10,944 $ 14,065
Net cash used in
investing activities (1) $(16,609) $(12,193) $(11,620)
Net cash used in
fi nancing activities $ (8,458) $(12,028) $(14,191)
(1) “Net cash used in investing activities” includes payments for property and
equipment, which is also included in our computation of free cash fl ow.
Results of OperationsThe following discussion of our results of operations is based on
our continuing operations and excludes any results or discussion of
our discontinued operations.
Consolidated Results of Operations
Fiscal Years Ended January 31,
(Amounts in millions, except unit counts) 2012 2011 2010
Net sales $443,854 $418,952 $405,132
Percentage change from
previous fi scal year 5.9% 3.4% 1.0%
Total U.S. calendar comparable
store and club sales 1.6% (0.6)% (0.8)%
Gross profi t margin as
a percentage of sales 24.5% 24.8% 24.9%
Operating income $ 26,558 $ 25,542 $ 24,002
Operating income as a
percentage of net sales 6.0% 6.1% 5.9%
Income from continuing
operations $ 16,454 $ 15,959 $ 14,962
Unit counts 10,130 8,970 8,459
Retail square feet 1,037 985 952
Management’s Discussion and Analysis of Financial
Condition and Results of Operations
Walmart 2012 Annual Report 23
Our consolidated net sales increased 5.9% and 3.4% in fi scal 2012 and
2011, respectively, compared to the previous fi scal year. The increase in
net sales for fi scal 2012 was attributable to a combination of an increase
in comparable sales, growth in retail square feet and currency translation
benefi ts, while the increase in net sales for fi scal 2011 was attributable to
growth in retail square feet and currency translation benefi ts, partially
off set by a decline in comparable store and club sales. Acquisitions also
contributed to the increase in net sales for fi scal 2012. Our continued
expansion activities, including acquisitions, added 5.3% and 3.4% of
additional retail square feet during fi scal 2012 and 2011, respectively.
Currency translation benefi ts accounted for $4.0 billion and $4.5 billion
of the increase in net sales for fi scal 2012 and 2011, respectively. The
acquisitions of Netto and Massmart completed in the second quarter of
fi scal 2012, and further discussed in Note 14 in the “Notes to Consolidated
Financial Statements,” accounted for $4.7 billion of the net sales increase
in fi scal 2012. Volatility in currency exchange rates may continue to
impact the Company’s net sales in the future.
Our gross profi t, as a percentage of net sales (“gross profi t margin”),
declined 33 and 11 basis points in fi scal 2012 and 2011, respectively,
compared to the previous fi scal year. All three segments realized a
decline in gross profi t margin during fi scal 2012 based on our investment
in price. Our Walmart U.S. segment and Walmart International segment
net sales yield higher gross profi t margins than our Sam’s Club segment,
which operates on lower margins as a membership club warehouse. In
fi scal 2011, gross profi t margin was relatively fl at compared to fi scal 2010.
Operating expenses, as a percentage of net sales, were 19.2%, 19.4% and
19.7% for fi scal 2012, 2011 and 2010, respectively. In fi scal 2012, operating
expenses as a percentage of net sales decreased primarily due to our
focus on expense management. In fi scal 2011, operating expenses as a
percentage of net sales decreased primarily due to improved labor
productivity and organizational changes implemented at the end of
fi scal 2010 designed to strengthen and streamline our operations, as well
as a reduction in certain incentive plan expenses.
Operating income was $26.6 billion, $25.5 billion and $24.0 billion for
fi scal 2012, 2011 and 2010, respectively. Eff ects of currency exchange
fl uctuations positively impacted operating income in fi scal 2012 and
2011 by $105 million and $231 million, respectively. Volatility in currency
exchange rates may continue to impact the Company’s operating
income in the future.
Our eff ective income tax rate on consolidated income from continuing
operations was 32.6% in fi scal 2012 compared with 32.2% and 32.4% in
fi scal 2011 and 2010, respectively. The eff ective income tax rate for fi scal
2012 remained largely consistent with the rates for fi scal 2011 and 2010
primarily as a result of net favorability in various items during fi scal 2012.
The eff ective income tax rate for fi scal 2011 was consistent with that for
fi scal 2010 due to recognizing certain net tax benefi ts totaling $434 million
and $372 million in fi scal 2011 and 2010, respectively, stemming primarily
from the decision to repatriate certain non-U.S. earnings that increased
the Company’s U.S. foreign tax credits and favorable adjustments to
transfer pricing agreements. The reconciliation from the U.S. statutory
rate to the eff ective tax rates for fi scal 2012, 2011 and 2010 is presented in
Note 10 in the “Notes to Consolidated Financial Statements.” We expect
the fiscal 2013 annual effective tax rate to be approximately 32.5%
to 33.5%. Signifi cant factors that may impact the annual eff ective tax
rate include changes in our assessment of certain tax contingencies,
valuation allowances, changes in law, outcomes of administrative audits,
the impact of discrete items and the mix of earnings among our U.S. and
international operations.
As a result of the factors discussed above, we reported $16.5 billion,
$16.0 billion and $15.0 billion of income from continuing operations for
fi scal 2012, 2011 and 2010, respectively.
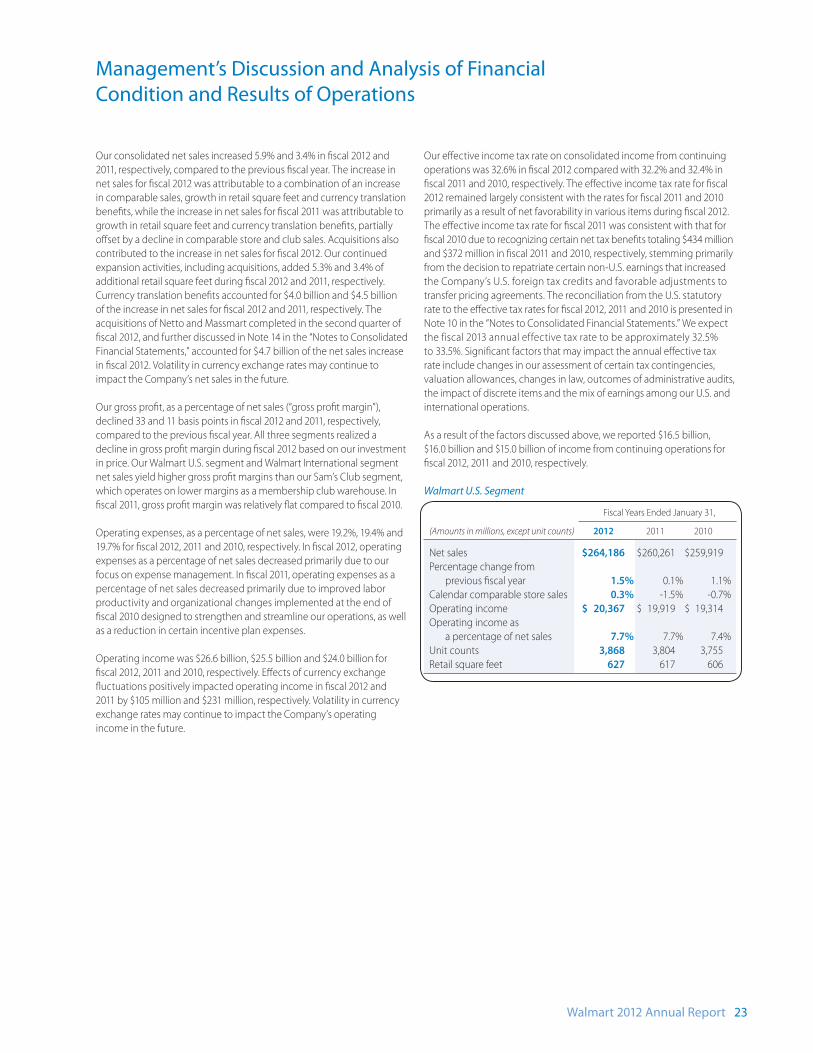
Walmart U.S. Segment
Fiscal Years Ended January 31,
(Amounts in millions, except unit counts) 2012 2011 2010
Net sales $264,186 $260,261 $259,919
Percentage change from
previous fi scal year 1.5% 0.1% 1.1%
Calendar comparable store sales 0.3% -1.5% -0.7%
Operating income $ 20,367 $ 19,919 $ 19,314
Operating income as
a percentage of net sales 7.7% 7.7% 7.4%
Unit counts 3,868 3,804 3,755
Retail square feet 627 617 606
Management’s Discussion and Analysis of Financial
Condition and Results of Operations
24 Walmart 2012 Annual Report
Net sales for the Walmart U.S. segment increased 1.5% and 0.1% in fi scal
2012 and 2011, respectively, compared to the previous fi scal year. The
increase in net sales for fi scal 2012 compared to fi scal 2011 is primarily
due to a 1.6% increase in year-over-year retail square feet. Walmart U.S.
net sales were relatively fl at for fi scal 2011 compared to fi scal 2010 as
growth in retail square feet was off set by a decline in comparable store
sales of 1.5% caused by slower customer traffi c.
Gross profi t margin was relatively fl at in fi scal 2012 and 2011, respectively,
compared to the previous fi scal year.
Operating expenses, as a percentage of segment net sales, declined
10 basis points during fi scal 2012 compared to fi scal 2011, as the segment
focused on improved labor productivity and managing expenses.
Operating expenses, as a percentage of net sales, decreased by 28 basis
points in fi scal 2011 compared to fi scal 2010 due to improved labor
productivity and a reduction in incentive plan expenses.
As a result of the factors discussed above, operating income was
$20.4 billion, $19.9 billion and $19.3 billion for fi scal 2012, 2011 and
2010, respectively.
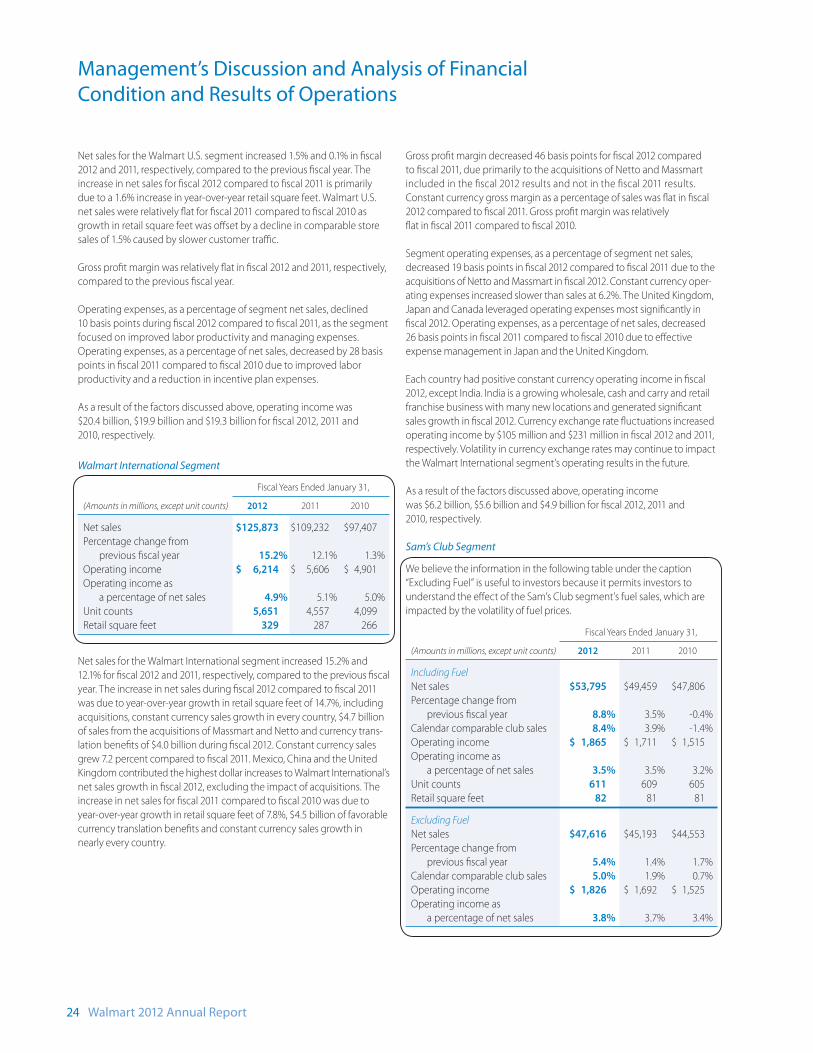
Walmart International Segment
Fiscal Years Ended January 31,
(Amounts in millions, except unit counts) 2012 2011 2010
Net sales $125,873 $109,232 $97,407
Percentage change from
previous fi scal year 15.2% 12.1% 1.3%
Operating income $ 6,214 $ 5,606 $ 4,901
Operating income as
a percentage of net sales 4.9% 5.1% 5.0%
Unit counts 5,651 4,557 4,099
Retail square feet 329 287 266
Net sales for the Walmart International segment increased 15.2% and
12.1% for fi scal 2012 and 2011, respectively, compared to the previous fi scal
year. The increase in net sales during fi scal 2012 compared to fi scal 2011
was due to year-over-year growth in retail square feet of 14.7%, including
acquisitions, constant currency sales growth in every country, $4.7 billion
of sales from the acquisitions of Massmart and Netto and currency trans-
lation benefi ts of $4.0 billion during fi scal 2012. Constant currency sales
grew 7.2 percent compared to fi scal 2011. Mexico, China and the United
Kingdom contributed the highest dollar increases to Walmart International’s
net sales growth in fi scal 2012, excluding the impact of acquisitions. The
increase in net sales for fi scal 2011 compared to fi scal 2010 was due to
year-over-year growth in retail square feet of 7.8%, $4.5 billion of favorable
currency translation benefi ts and constant currency sales growth in
nearly every country.
Gross profi t margin decreased 46 basis points for fi scal 2012 compared
to fi scal 2011, due primarily to the acquisitions of Netto and Massmart
included in the fi scal 2012 results and not in the fi scal 2011 results.
Constant currency gross margin as a percentage of sales was fl at in fi scal
2012 compared to fi scal 2011. Gross profi t margin was relatively
fl at in fi scal 2011 compared to fi scal 2010.
Segment operating expenses, as a percentage of segment net sales,
decreased 19 basis points in fi scal 2012 compared to fi scal 2011 due to the
acquisitions of Netto and Massmart in fi scal 2012. Constant currency oper-
ating expenses increased slower than sales at 6.2%. The United Kingdom,
Japan and Canada leveraged operating expenses most signifi cantly in
fi scal 2012. Operating expenses, as a percentage of net sales, decreased
26 basis points in fi scal 2011 compared to fi scal 2010 due to eff ective
expense management in Japan and the United Kingdom.
Each country had positive constant currency operating income in fi scal
2012, except India. India is a growing wholesale, cash and carry and retail
franchise business with many new locations and generated signifi cant
sales growth in fi scal 2012. Currency exchange rate fl uctuations increased
operating income by $105 million and $231 million in fi scal 2012 and 2011,
respectively. Volatility in currency exchange rates may continue to impact
the Walmart International segment’s operating results in the future.
As a result of the factors discussed above, operating income
was $6.2 billion, $5.6 billion and $4.9 billion for fi scal 2012, 2011 and
2010, respectively.
Sam’s Club Segment
We believe the information in the following table under the caption
“Excluding Fuel” is useful to investors because it permits investors to
understand the eff ect of the Sam’s Club segment’s fuel sales, which are
impacted by the volatility of fuel prices.
Fiscal Years Ended January 31,
(Amounts in millions, except unit counts) 2012 2011 2010
Including Fuel
Net sales $53,795 $49,459 $47,806
Percentage change from
previous fi scal year 8.8% 3.5% -0.4%
Calendar comparable club sales 8.4% 3.9% -1.4%
Operating income $ 1,865 $ 1,711 $ 1,515
Operating income as
a percentage of net sales 3.5% 3.5% 3.2%
Unit counts 611 609 605
Retail square feet 82 81 81
Excluding Fuel
Net sales $47,616 $45,193 $44,553
Percentage change from
previous fi scal year 5.4% 1.4% 1.7%
Calendar comparable club sales 5.0% 1.9% 0.7%
Operating income $ 1,826 $ 1,692 $ 1,525
Operating income as
a percentage of net sales 3.8% 3.7% 3.4%
Management’s Discussion and Analysis of Financial
Condition and Results of Operations
Walmart 2012 Annual Report 25
Net sales for the Sam’s Club segment increased 8.8% and 3.5% for fi scal
2012 and 2011, respectively, compared to the previous fi scal year. The net
sales increase in fi scal 2012 compared to fi scal 2011 was primarily due to
positive comparable club sales, driven by customer traffi c, increases in
average ticket and higher fuel sales. Higher fuel sales, resulting from higher
fuel prices and increased gallons sold, positively impacted comparable
sales by 340 basis points during fi scal 2012. The fi scal 2011 growth in net
sales is primarily due to the increase in average ticket and member traffi c.
In addition, fuel sales, driven by higher fuel prices and gallons sold, posi-
tively impacted comparable club sales by 200 basis points in fi scal 2011.
Volatility in fuel prices may continue to impact the net sales and operating
income of the Sam’s Club segment in the future.
Gross profi t margin decreased 41 basis points for fi scal 2012 compared
to fi scal 2011. The gross profi t margin decrease was driven by the highly
competitive retail environment, as well as infl ation and high fuel costs.
Fuel costs negatively impacted the comparison by 33 basis points for
fi scal 2012. Gross profi t margin was relatively fl at for fi scal 2011 compared
to fi scal 2010.
Operating expenses, as a percentage of net sales, decreased 55 basis
points and 48 basis points in fi scal 2012 and 2011, respectively, compared
to the previous fi scal year. Fuel, which positively impacted the comparison
by 31 and 19 basis points for fi scal 2012 and 2011, respectively, and
improved wage management were the primary drivers of the basis point
reduction in operating expenses as a percentage of segment net sales
for both fi scal years.
As a result of the factors discussed above, operating income
was $1.9 billion, $1.7 billion and $1.5 billion for fi scal 2012, 2011 and
2010, respectively.
Liquidity and Capital ResourcesCash fl ows provided by operating activities have historically supplied
us with a signifi cant source of liquidity. We use these cash fl ows, supple-
mented with long-term debt and short-term borrowings, to fund our
operations and global expansion activities. Generally, some or all of the
remaining free cash fl ow, if any, funds all or part of the dividends on our
common stock and share repurchases.
Fiscal Years Ended January 31,
(Amounts in millions) 2012 2011 2010
Net cash provided by
operating activities $ 24,255 $ 23, 643 $ 26,249
Payments for property
and equipment (13,510) (12,699) (12,184)
Free cash fl ow $ 10,745 $ 10,944 $ 14,065
Net cash used in
investing activities (1) $(16,609) $(12,193) $(11,620)
Net cash used in
fi nancing activities $ (8,458) $(12,028) $(14,191)
(1) “Net cash used in investing activities” includes payments for property and
equipment, which is also included in our computation of free cash fl ow.
Cash Flows from Operating Activities
Cash fl ows provided by operating activities were $24.3 billion, $23.6 billion
and $26.2 billion for fi scal 2012, 2011 and 2010, respectively. The increase
in operating cash fl ow in fi scal 2012 compared to fi scal 2011 was primarily
the result of additional income from continuing operations and the
timing of payments for accrued liabilities. The decrease in cash fl ow from
operating activities during fi scal 2011 was primarily due to an increased
investment in inventory after fi scal 2010 ended with relatively low inventory
levels, partially off set by increases in accounts payable.
Cash Equivalents and Working Capital
Cash and cash equivalents were $6.6 billion and $7.4 billion at January 31,
2012 and 2011, respectively, of which $5.6 billion and $7.1 billion, respectively,
were held outside of the U.S. and are generally utilized to support liquidity
needs in our foreign operations. Our working capital defi cits were $7.3 billion
and $6.6 billion at January 31, 2012 and 2011, respectively. We generally
operate with a working capital defi cit due to our effi cient use of cash in
funding operations and in providing returns to our shareholders in the
form of stock repurchases and the payment of dividends.
We employ fi nancing strategies in an eff ort to ensure that cash can be
made available in the country in which it is needed with the minimum
cost possible. We do not believe it will be necessary to repatriate cash and
cash equivalents held outside of the U.S. and anticipate our domestic
liquidity needs will be met through other funding sources (ongoing
cash fl ows generated from operations, external borrowings, or both).
Accordingly, we intend, with only certain limited exceptions, to continue
to permanently reinvest the cash in our foreign operations. Were our
intention to change, most of the amounts held within our foreign
operations could be repatriated to the U.S., although any repatriations
under current U.S. tax laws would be subject to U.S. federal income taxes,
less applicable foreign tax credits. As of January 31, 2012 and 2011,
approximately $768 million and $691 million, respectively, may not be
freely transferable to the U.S. due to local laws or other restrictions.
We do not expect local laws, other limitations or potential taxes on
anticipated future repatriations of amounts held outside of the United
States to have a material eff ect on our overall liquidity, fi nancial condition
or results of operations.
Cash Flows from Investing Activities
Cash fl ows from investing activities generally consist of payments for
property and equipment, which were $13.5 billion, $12.7 billion and
$12.2 billion during fi scal 2012, 2011 and 2010, respectively. These capital
expenditures primarily relate to new store growth, as well as remodeling
costs for existing stores and our investments in Global eCommerce.
Additionally, in fi scal 2012, we made additional investments of $3.5 billion,
net of cash acquired, for the acquisitions of Netto and Massmart, further
discussed in Note 14 in “Notes to Consolidated Financial Statements,” in
addition to other immaterial acquisitions. We expect capital expenditures
for property and equipment in fi scal 2013, excluding any business
acquisitions, to range between $13.0 billion and $14.0 billion.
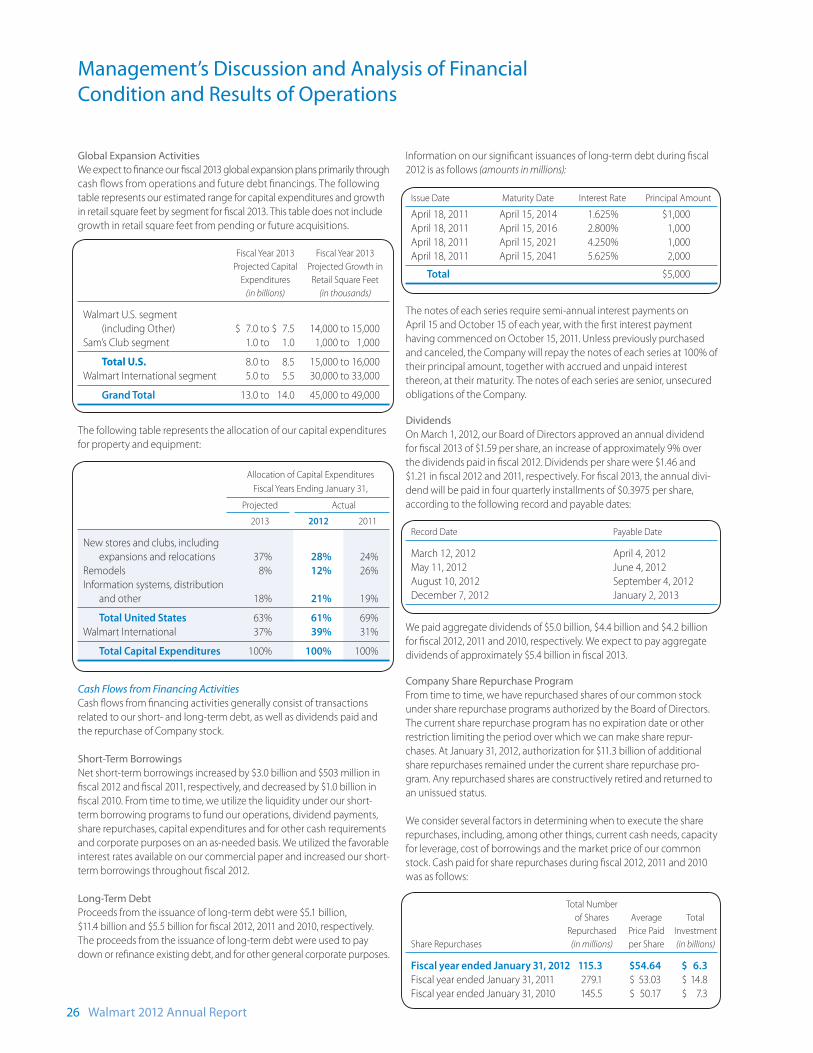
Management’s Discussion and Analysis of Financial
Condition and Results of Operations
26 Walmart 2012 Annual Report
Global Expansion Activities
We expect to fi nance our fi scal 2013 global expansion plans primarily through
cash fl ows from operations and future debt fi nancings. The following
table represents our estimated range for capital expenditures and growth
in retail square feet by segment for fi scal 2013. This table does not include
growth in retail square feet from pending or future acquisitions.
Fiscal Year 2013 Fiscal Year 2013
Projected Capital Projected Growth in
Expenditures Retail Square Feet
(in billions) (in thousands)
Walmart U.S. segment
(including Other) $ 7.0 to $ 7.5 14,000 to 15,000
Sam’s Club segment 1.0 to 1.0 1,000 to 1,000
Total U.S. 8.0 to 8.5 15,000 to 16,000
Walmart International segment 5.0 to 5.5 30,000 to 33,000
Grand Total 13.0 to 14.0 45,000 to 49,000
The following table represents the allocation of our capital expenditures
for property and equipment:
Allocation of Capital Expenditures
Fiscal Years Ending January 31,
Projected Actual
2013 2012 2011
New stores and clubs, including
expansions and relocations 37% 28% 24%
Remodels 8% 12% 26%
Information systems, distribution
and other 18% 21% 19%
Total United States 63% 61% 69%
Walmart International 37% 39% 31%
Total Capital Expenditures 100% 100% 100%
Cash Flows from Financing Activities
Cash fl ows from fi nancing activities generally consist of transactions
related to our short- and long-term debt, as well as dividends paid and
the repurchase of Company stock.
Short-Term Borrowings
Net short-term borrowings increased by $3.0 billion and $503 million in
fi scal 2012 and fi scal 2011, respectively, and decreased by $1.0 billion in
fi scal 2010. From time to time, we utilize the liquidity under our short-
term borrowing programs to fund our operations, dividend payments,
share repurchases, capital expenditures and for other cash requirements
and corporate purposes on an as-needed basis. We utilized the favorable
interest rates available on our commercial paper and increased our short-
term borrowings throughout fi scal 2012.
Long-Term Debt
Proceeds from the issuance of long-term debt were $5.1 billion,
$11.4 billion and $5.5 billion for fi scal 2012, 2011 and 2010, respectively.
The proceeds from the issuance of long-term debt were used to pay
down or refi nance existing debt, and for other general corporate purposes.
Information on our signifi cant issuances of long-term debt during fi scal
2012 is as follows (amounts in millions):
Issue Date Maturity Date Interest Rate Principal Amount
April 18, 2011 April 15, 2014 1.625% $1,000
April 18, 2011 April 15, 2016 2.800% 1,000
April 18, 2011 April 15, 2021 4.250% 1,000
April 18, 2011 April 15, 2041 5.625% 2,000
Total $5,000
The notes of each series require semi-annual interest payments on
April 15 and October 15 of each year, with the fi rst interest payment
having commenced on October 15, 2011. Unless previously purchased
and canceled, the Company will repay the notes of each series at 100% of
their principal amount, together with accrued and unpaid interest
thereon, at their maturity. The notes of each series are senior, unsecured
obligations of the Company.
Dividends
On March 1, 2012, our Board of Directors approved an annual dividend
for fi scal 2013 of $1.59 per share, an increase of approximately 9% over
the dividends paid in fi scal 2012. Dividends per share were $1.46 and
$1.21 in fi scal 2012 and 2011, respectively. For fi scal 2013, the annual divi-
dend will be paid in four quarterly installments of $0.3975 per share,
according to the following record and payable dates:
Record Date Payable Date
March 12, 2012 April 4, 2012
May 11, 2012 June 4, 2012
August 10, 2012 September 4, 2012
December 7, 2012 January 2, 2013
We paid aggregate dividends of $5.0 billion, $4.4 billion and $4.2 billion
for fi scal 2012, 2011 and 2010, respectively. We expect to pay aggregate
dividends of approximately $5.4 billion in fi scal 2013.
Company Share Repurchase Program
From time to time, we have repurchased shares of our common stock
under share repurchase programs authorized by the Board of Directors.
The current share repurchase program has no expiration date or other
restriction limiting the period over which we can make share repur-
chases. At January 31, 2012, authorization for $11.3 billion of additional
share repurchases remained under the current share repurchase pro-
gram. Any repurchased shares are constructively retired and returned to
an unissued status.
We consider several factors in determining when to execute the share
repurchases, including, among other things, current cash needs, capacity
for leverage, cost of borrowings and the market price of our common
stock. Cash paid for share repurchases during fi scal 2012, 2011 and 2010
was as follows:
Total Number
of Shares Average Total
Repurchased Price Paid Investment
Share Repurchases (in millions) per Share (in billions)
Fiscal year ended January 31, 2012 115.3 $54.64 $ 6.3
Fiscal year ended January 31, 2011 279.1 $ 53.03 $ 14.8
Fiscal year ended January 31, 2010 145.5 $ 50.17 $ 7.3
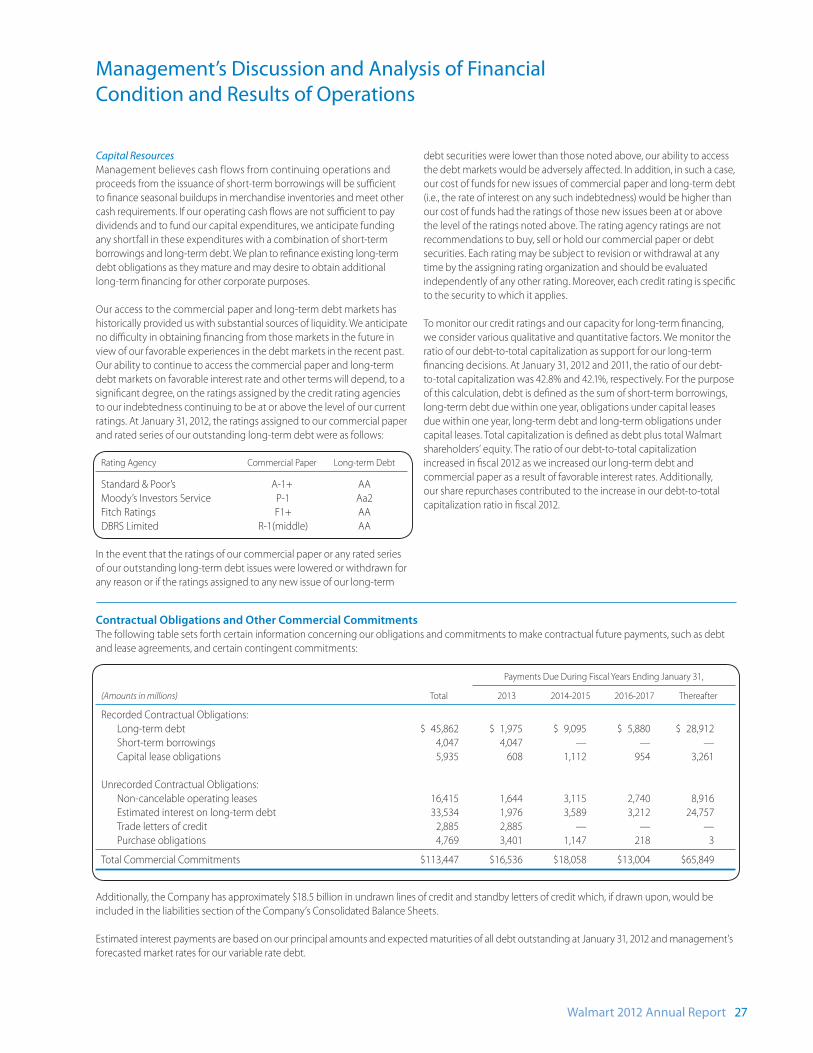
Management’s Discussion and Analysis of Financial
Condition and Results of Operations
Walmart 2012 Annual Report 27
Capital Resources
Management believes cash flows from continuing operations and
proceeds from the issuance of short-term borrowings will be suffi cient
to fi nance seasonal buildups in merchandise inventories and meet other
cash requirements. If our operating cash fl ows are not suffi cient to pay
dividends and to fund our capital expenditures, we anticipate funding
any shortfall in these expenditures with a combination of short-term
borrowings and long-term debt. We plan to refi nance existing long-term
debt obligations as they mature and may desire to obtain additional
long-term fi nancing for other corporate purposes.
Our access to the commercial paper and long-term debt markets has
historically provided us with substantial sources of liquidity. We anticipate
no diffi culty in obtaining fi nancing from those markets in the future in
view of our favorable experiences in the debt markets in the recent past.
Our ability to continue to access the commercial paper and long-term
debt markets on favorable interest rate and other terms will depend, to a
signifi cant degree, on the ratings assigned by the credit rating agencies
to our indebtedness continuing to be at or above the level of our current
ratings. At January 31, 2012, the ratings assigned to our commercial paper
and rated series of our outstanding long-term debt were as follows:
Rating Agency Commercial Paper Long-term Debt
Standard & Poor’s A-1+ AA
Moody’s Investors Service P-1 Aa2
Fitch Ratings F1+ AA
DBRS Limited R-1(middle) AA
In the event that the ratings of our commercial paper or any rated series
of our outstanding long-term debt issues were lowered or withdrawn for
any reason or if the ratings assigned to any new issue of our long-term
debt securities were lower than those noted above, our ability to access
the debt markets would be adversely aff ected. In addition, in such a case,
our cost of funds for new issues of commercial paper and long-term debt
(i.e., the rate of interest on any such indebtedness) would be higher than
our cost of funds had the ratings of those new issues been at or above
the level of the ratings noted above. The rating agency ratings are not
recommendations to buy, sell or hold our commercial paper or debt
securities. Each rating may be subject to revision or withdrawal at any
time by the assigning rating organization and should be evaluated
independently of any other rating. Moreover, each credit rating is specifi c
to the security to which it applies.
To monitor our credit ratings and our capacity for long-term fi nancing,
we consider various qualitative and quantitative factors. We monitor the
ratio of our debt-to-total capitalization as support for our long-term
fi nancing decisions. At January 31, 2012 and 2011, the ratio of our debt-
to-total capitalization was 42.8% and 42.1%, respectively. For the purpose
of this calculation, debt is defi ned as the sum of short-term borrowings,
long-term debt due within one year, obligations under capital leases
due within one year, long-term debt and long-term obligations under
capital leases. Total capitalization is defi ned as debt plus total Walmart
shareholders’ equity. The ratio of our debt-to-total capitalization
increased in fi scal 2012 as we increased our long-term debt and
commercial paper as a result of favorable interest rates. Additionally,
our share repurchases contributed to the increase in our debt-to-total
capitalization ratio in fi scal 2012.
Contractual Obligations and Other Commercial CommitmentsThe following table sets forth certain information concerning our obligations and commitments to make contractual future payments, such as debt
and lease agreements, and certain contingent commitments:
Payments Due During Fiscal Years Ending January 31,
(Amounts in millions) Total 2013 2014-2015 2016-2017 Thereafter
Recorded Contractual Obligations:
Long-term debt $ 45,862 $ 1,975 $ 9,095 $ 5,880 $ 28,912
Short-term borrowings 4,047 4,047 — — —
Capital lease obligations 5,935 608 1,112 954 3,261
Unrecorded Contractual Obligations:
Non-cancelable operating leases 16,415 1,644 3,115 2,740 8,916
Estimated interest on long-term debt 33,534 1,976 3,589 3,212 24,757
Trade letters of credit 2,885 2,885 — — —
Purchase obligations 4,769 3,401 1,147 218 3
Total Commercial Commitments $113,447 $16,536 $18,058 $13,004 $65,849
Additionally, the Company has approximately $18.5 billion in undrawn lines of credit and standby letters of credit which, if drawn upon, would be
included in the liabilities section of the Company’s Consolidated Balance Sheets.
Estimated interest payments are based on our principal amounts and expected maturities of all debt outstanding at January 31, 2012 and management’s
forecasted market rates for our variable rate debt.
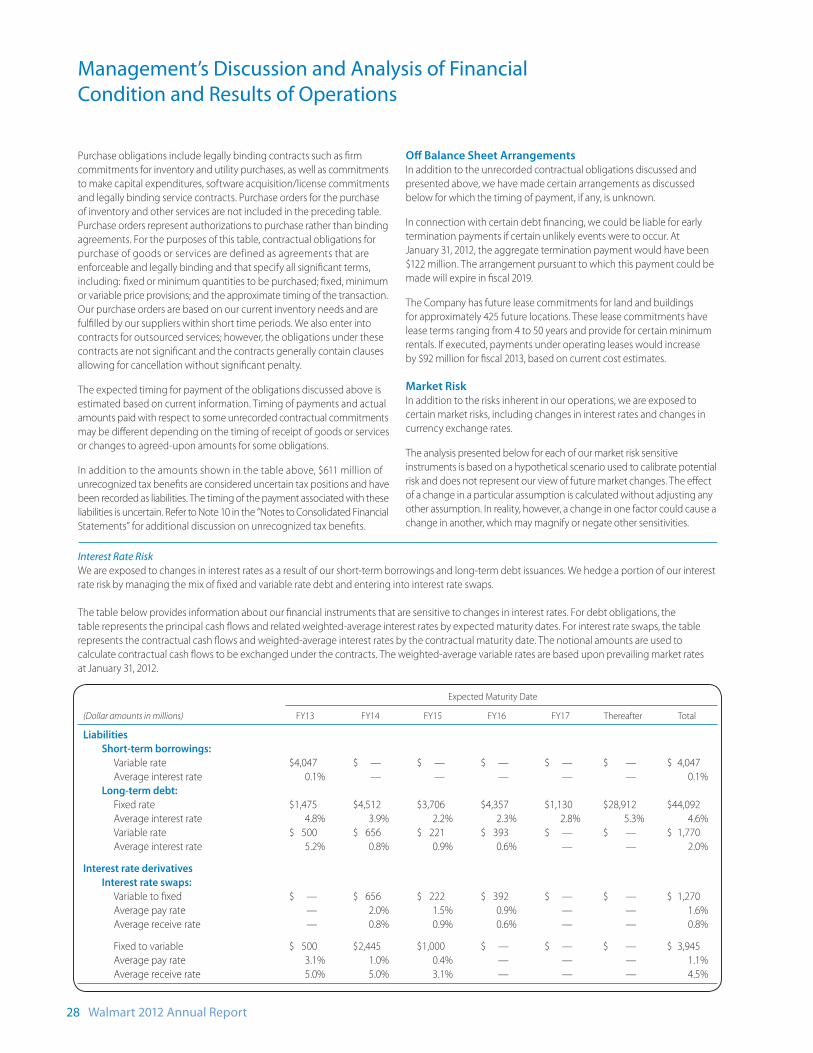
Management’s Discussion and Analysis of Financial
Condition and Results of Operations
28 Walmart 2012 Annual Report
Interest Rate Risk
We are exposed to changes in interest rates as a result of our short-term borrowings and long-term debt issuances. We hedge a portion of our interest
rate risk by managing the mix of fi xed and variable rate debt and entering into interest rate swaps.
The table below provides information about our fi nancial instruments that are sensitive to changes in interest rates. For debt obligations, the
table represents the principal cash fl ows and related weighted-average interest rates by expected maturity dates. For interest rate swaps, the table
represents the contractual cash fl ows and weighted-average interest rates by the contractual maturity date. The notional amounts are used to
calculate contractual cash fl ows to be exchanged under the contracts. The weighted-average variable rates are based upon prevailing market rates
at January 31, 2012.
Expected Maturity Date
(Dollar amounts in millions) FY13 FY14 FY15 FY16 FY17 Thereafter Total
Liabilities
Short-term borrowings:
Variable rate $4,047 $ — $ — $ — $ — $ — $ 4,047
Average interest rate 0.1% — — — — — 0.1%
Long-term debt:
Fixed rate $1,475 $4,512 $3,706 $4,357 $1,130 $28,912 $44,092
Average interest rate 4.8% 3.9% 2.2% 2.3% 2.8% 5.3% 4.6%
Variable rate $ 500 $ 656 $ 221 $ 393 $ — $ — $ 1,770
Average interest rate 5.2% 0.8% 0.9% 0.6% — — 2.0%
Interest rate derivatives
Interest rate swaps:
Variable to fi xed $ — $ 656 $ 222 $ 392 $ — $ — $ 1,270
Average pay rate — 2.0% 1.5% 0.9% — — 1.6%
Average receive rate — 0.8% 0.9% 0.6% — — 0.8%
Fixed to variable $ 500 $2,445 $1,000 $ — $ — $ — $ 3,945
Average pay rate 3.1% 1.0% 0.4% — — — 1.1%
Average receive rate 5.0% 5.0% 3.1% — — — 4.5%
Purchase obligations include legally binding contracts such as fi rm
commitments for inventory and utility purchases, as well as commitments
to make capital expenditures, software acquisition/license commitments
and legally binding service contracts. Purchase orders for the purchase
of inventory and other services are not included in the preceding table.
Purchase orders represent authorizations to purchase rather than binding
agreements. For the purposes of this table, contractual obligations for
purchase of goods or services are defined as agreements that are
enforceable and legally binding and that specify all signifi cant terms,
including: fi xed or minimum quantities to be purchased; fi xed, minimum
or variable price provisions; and the approximate timing of the transaction.
Our purchase orders are based on our current inventory needs and are
fulfi lled by our suppliers within short time periods. We also enter into
contracts for outsourced services; however, the obligations under these
contracts are not signifi cant and the contracts generally contain clauses
allowing for cancellation without signifi cant penalty.
The expected timing for payment of the obligations discussed above is
estimated based on current information. Timing of payments and actual
amounts paid with respect to some unrecorded contractual commitments
may be diff erent depending on the timing of receipt of goods or services
or changes to agreed-upon amounts for some obligations.
In addition to the amounts shown in the table above, $611 million of
unrecognized tax benefi ts are considered uncertain tax positions and have
been recorded as liabilities. The timing of the payment associated with these
liabilities is uncertain. Refer to Note 10 in the “Notes to Consolidated Financial
Statements” for additional discussion on unrecognized tax benefi ts.
Off Balance Sheet ArrangementsIn addition to the unrecorded contractual obligations discussed and
presented above, we have made certain arrangements as discussed
below for which the timing of payment, if any, is unknown.
In connection with certain debt fi nancing, we could be liable for early
termination payments if certain unlikely events were to occur. At
January 31, 2012, the aggregate termination payment would have been
$122 million. The arrangement pursuant to which this payment could be
made will expire in fi scal 2019.
The Company has future lease commitments for land and buildings
for approximately 425 future locations. These lease commitments have
lease terms ranging from 4 to 50 years and provide for certain minimum
rentals. If executed, payments under operating leases would increase
by $92 million for fi scal 2013, based on current cost estimates.
Market RiskIn addition to the risks inherent in our operations, we are exposed to
certain market risks, including changes in interest rates and changes in
currency exchange rates.
The analysis presented below for each of our market risk sensitive
instruments is based on a hypothetical scenario used to calibrate potential
risk and does not represent our view of future market changes. The eff ect
of a change in a particular assumption is calculated without adjusting any
other assumption. In reality, however, a change in one factor could cause a
change in another, which may magnify or negate other sensitivities.
Management’s Discussion and Analysis of Financial
Condition and Results of Operations
Walmart 2012 Annual Report 29
As of January 31, 2012, our variable rate borrowings, including the eff ect
of our commercial paper and interest rate swaps, represented 17% of our
total short-term and long-term debt. Based on January 31, 2012 and 2011
debt levels, a 100 basis point change in prevailing market rates would
cause our annual interest costs to change by approximately $58 million
and $59 million, respectively.
Foreign Currency Risk
We are exposed to changes in foreign currency exchange rates as a result
of our net investments and operations in countries other than the United
States. We hedge a portion of our foreign currency risk by entering into
currency swaps and designating certain long-term debt issued in foreign
currencies as net investment hedges.
We hold currency swaps to hedge the currency exchange component
of our net investments and also to hedge the currency exchange rate
fl uctuation exposure associated with the forecasted payments of principal
and interest of non-U.S. denominated debt. The aggregate fair value of
these swaps was recorded as an asset of $313 million and $471 million
at January 31, 2012 and 2011, respectively. A hypothetical 10% increase or
decrease in the currency exchange rates underlying these swaps from the
market rate would have resulted in a loss or gain in the value of the swaps
of $67 million and $74 million at January 31, 2012 and 2011, respectively.
A hypothetical 10% change in interest rates underlying these swaps from
the market rates in eff ect at January 31, 2012 and 2011 would have resulted
in a loss or gain in value of the swaps of $21 million and $7 million,
respectively, on the value of the swaps.
In addition to currency swaps, we have designated debt of approximately
£3.0 billion as of January 31, 2012 and 2011 as a hedge of our net investment
in the United Kingdom. At January 31, 2012 and 2011, a hypothetical
10% increase or decrease in value of the U.S. dollar relative to the British
pound would have resulted in a gain or loss, respectively, in the value of
the debt of $430 million and $480 million, respectively. In addition, we
have designated debt of approximately ¥275.0 billion and ¥437.0 billion
as of January 31, 2012 and 2011, respectively, as a hedge of our net invest-
ment in Japan. At January 31, 2012 and 2011, a hypothetical 10% increase
or decrease in value of the U.S. dollar relative to the Japanese yen would
have resulted in a gain or loss in the value of the debt of $328 million and
$533 million, respectively.
Summary of Critical Accounting EstimatesManagement strives to report our fi nancial results in a clear and
understandable manner, although in some cases accounting and
disclosure rules are complex and require us to use technical terminology.
In preparing the Company’s Consolidated Financial Statements, we
follow accounting principles generally accepted in the United States.
These principles require us to make certain estimates and apply judgments
that aff ect our fi nancial position and results of operations as refl ected in
our fi nancial statements. These judgments and estimates are based on
past events and expectations of future outcomes. Actual results may
diff er from our estimates.
Management continually reviews our accounting policies, how they
are applied and how they are reported and disclosed in our fi nancial
statements. Following is a summary of our critical accounting estimates
and how they are applied in preparation of the fi nancial statements.
Inventories
We value inventories at the lower of cost or market as determined primarily
by the retail method of accounting, using the last-in, fi rst-out (“LIFO”)
method for substantially all of the Walmart U.S. segment’s merchandise
inventories. The retail method of accounting results in inventory being
valued at the lower of cost or market since permanent markdowns are
currently taken as a reduction of the retail value of inventory. The Sam’s
Club segment’s merchandise is valued based on the weighted-average
cost using the LIFO method. Inventories for the Walmart International
operations are primarily valued by the retail method of accounting and
are stated using the fi rst-in, fi rst-out (“FIFO”) method.
Under the retail method, inventory is stated at cost, which is determined
by applying a cost-to-retail ratio to each merchandise grouping’s retail
value. The FIFO cost-to-retail ratio is based on the initial margin of
beginning inventory plus the fi scal year purchase activity. The cost-to-
retail ratio for measuring any LIFO provision is based on the initial margin
of the fi scal year purchase activity less the impact of any markdowns. The
retail method requires management to make certain judgments and
estimates that may signifi cantly impact the ending inventory valuation at
cost, as well as the amount of gross profi t recognized. Judgments made
include recording markdowns used to sell inventory and shrinkage.
When management determines the salability of inventory has diminished,
markdowns for clearance activity and the related cost impact are recorded.
Factors considered in the determination of markdowns include current
and anticipated demand, customer preferences and age of merchandise,
as well as seasonal and fashion trends. Changes in weather patterns and
customer preferences related to fashion trends could cause material
changes in the amount and timing of markdowns from year to year.
When necessary, we record a LIFO provision for the estimated annual
eff ect of infl ation, and these estimates are adjusted to actual results
determined at year-end. Our LIFO provision is calculated based on
inventory levels, markup rates and internally generated retail price
indices. At January 31, 2012 and 2011, our inventories valued at LIFO
approximated those inventories as if they were valued at FIFO.
We provide for estimated inventory losses (“shrinkage”) between
physical inventory counts on the basis of a percentage of sales. Following
annual inventory counts, the provision is adjusted to refl ect updated
historical results.
Impairment of Assets
We evaluate long-lived assets other than goodwill and assets with
indefi nite lives for indicators of impairment whenever events or changes
in circumstances indicate their carrying amounts may not be recoverable.
Management’s judgments regarding the existence of impairment
indicators are based on market conditions and operational performance,
such as operating income and cash fl ows. The evaluation for long-lived
assets is performed at the lowest level of identifi able cash fl ows, which is
generally at the individual store level or, in certain circumstances, at the
market group level. The variability of these factors depends on a number
of conditions, including uncertainty about future events and changes in
demographics. Thus, our accounting estimates may change from period
to period. These factors could cause management to conclude that
impairment indicators exist and require impairment tests be performed,
which could result in management determining the value of long-lived
assets is impaired, resulting in a write-down of the long-lived assets.
Management’s Discussion and Analysis of Financial
Condition and Results of Operations
30 Walmart 2012 Annual Report
Goodwill and other indefi nite-lived acquired intangible assets are not
amortized, but are evaluated for impairment annually or whenever events
or changes in circumstances indicate that the value of a certain asset may
be impaired. This evaluation begins with a qualitative assessment to determine
whether a quantitative goodwill impairment test is necessary. If we determine,
based on the qualitative factors, that the fair value of the reporting unit is
more likely than not less than the carrying amount, the quantitative goodwill
impairment test would be required. This quantitative test for impairment
requires management to make judgments relating to future cash fl ows,
growth rates, and economic and market conditions. These evaluations
are based on determining the fair value of a reporting unit or asset using
a valuation method such as discounted cash fl ow or a relative, market-
based approach. Historically, we have generated suffi cient returns within
the applicable reporting units to recover the cost of goodwill and other
indefi nite-lived acquired intangible assets. Because of the nature of the
factors used in these tests, if diff erent conditions occur in future periods,
future operating results could be materially impacted.
Income Taxes
Income taxes have a signifi cant eff ect on our net earnings. As a global
commercial enterprise, our tax rates are aff ected by many factors, including
our global mix of earnings, the extent to which those global earnings are
indefi nitely reinvested outside the United States, legislation, acquisitions,
dispositions and tax characteristics of our income. Our tax returns are
routinely audited and settlements of issues raised in these audits sometimes
aff ect our tax provisions. Accordingly, the determination of our provision
for income taxes requires signifi cant judgment, the use of estimates, and
the interpretation and application of complex tax laws. Signifi cant judgment
is required in assessing the timing and amounts of deductible and taxable
items and the probability of sustaining uncertain tax positions. The benefi ts
of uncertain tax positions are recorded in our fi nancial statements only
after determining a more-likely-than-not probability that the uncertain
tax positions will withstand challenge, if any, from taxing authorities. When
facts and circumstances change, we reassess these probabilities and record
any changes in the fi nancial statements as appropriate. We account for
uncertain tax positions by determining the minimum recognition threshold
that a tax position is required to meet before being recognized in the
fi nancial statements. This determination requires the use of judgment
in assessing the timing and amounts of deductible and taxable items.
Forward-Looking StatementsThis Annual Report contains statements that Walmart believes are
“forward-looking statements” within the meaning of the Private Securities
Litigation Reform Act of 1995, as amended. Those statements are intended
to enjoy the protection of the safe harbor for forward-looking statements
provided by that Act. Those forward-looking statements include state-
ments in Management’s Discussion and Analysis of Financial Condition
and Results of Operations: under the captions “Company Performance
Metrics – Growth – Net Sales” and “Results of Operations – Consolidated
Results of Operations” with respect to the volatility of currency exchange
rates possibly continuing to aff ect Walmart’s net sales in the future; under
the caption “Results of Operations – Consolidated Results of Operations”
with respect to the volatility of currency exchange rates possibly continuing
to aff ect Walmart’s operating income in the future and with respect
to Walmart’s fi scal 2013 annual eff ective tax rate and the factors that
may impact that annual eff ective tax rate; under the caption “Results of
Operations – Walmart International Segment” with respect to the volatility
of currency exchange rates possibly continuing to aff ect our Walmart
International segment’s operating results in the future; under the caption
“Results of Operations – Sam’s Club Segment” with respect to the volatility
of fuel prices possibly continuing to aff ect our Sam’s Club segment’s net
sales and operating income in the future; under the caption “Liquidity and
Capital Resources – Cash Equivalents and Working Capital, “ as well as in
Note 1 in the “Notes to Consolidated Financial Statements,” regarding our
ability to meet our liquidity needs through sources other than the cash we
hold outside of the United States, our intention to permanently reinvest
cash held outside of the United States, and our ability to repatriate cash
held outside of the United States; under the caption “Liquidity and Capital
Resources – Cash Flows from Investing Activities” with respect to Walmart’s
expected capital expenditures in fi scal 2013; under the caption “Liquidity
and Capital Resources – Cash Flows from Investing Activities – Global
Expansion Activities” with respect to Walmart’s expectation that it will
fi nance its fi scal 2013 global expansion plans primarily through cash fl ows
from operations and future debt fi nancings, with respect to Walmart’s
projected capital expenditures in fi scal 2013, with respect to the projected
growth in retail square feet in total and by operating segment in fi scal 2013,
and with respect to the projected allocation of capital expenditures for
property and equipment by category in fi scal 2013; under the caption
“Liquidity and Capital Resources – Cash Flows from Financing Activities –
Dividends,” as well as in Note 16 in the “Notes to Consolidated Financial
Statements” and under the caption “Walmart-Corporate and Stock
Information-Dividends payable per share,” with respect to the payment
of dividends in fi scal 2013, Walmart’s expected payment of dividends on
certain dates in fi scal 2013, and the expected total amount of dividends to
be paid in fi scal 2013; under the caption “Liquidity and Capital Resources –
Capital Resources” with respect to Walmart’s ability to fi nance seasonal
build-ups in inventories and to meet other cash requirements with cash
fl ows from operations and short-term borrowings, Walmart’s ability to
fund certain cash fl ow shortfalls by short-term borrowings and long-term
debt, Walmart’s plan to refi nance long-term debt as it matures, Walmart’s
anticipated funding of any shortfall in cash to pay dividends and make
capital expenditures through short-term borrowings and long-term debt,
Walmart’s plan to refi nance existing long-term debt as it matures, the
possibility that Walmart may obtain additional long-term fi nancing for
other corporate purposes, Walmart’s ability to obtain fi nancing from the
commercial paper and long-term debt markets, the factors that infl uence
Walmart’s ability to access those markets on favorable terms, and the factors
that could adversely aff ect Walmart’s ability to access those markets on
favorable terms; and under the caption “Off Balance Sheet Arrangements”
with respect to the amount of increases in payments under operating
leases if certain leases are executed.
These forward-looking statements also include statements in: Note 3 in
the “Notes to Consolidated Financial Statements” regarding the weighted-
average periods over which certain compensation cost is expected to be
recognized; Note 10 in the “Notes to Consolidated Financial Statements”
regarding the possible reduction of U.S. tax liability on accumulated but
undistributed earnings of our non-U.S. subsidiaries, the realization of certain
deferred tax assets, possible reduction of unrecognized tax benefi ts, and
the reasons for such reductions and the magnitude of their impact on our
results of operations and fi nancial condition; and the eff ect of the adverse
resolutions of certain other tax matters; Note 11 in the “Notes to Consolidated
Financial Statements” regarding an adverse decision in, or settlement of,
certain litigation or other legal proceedings to which Walmart is a party or
is subject possibly resulting in liability material to our fi nancial condition or
results of operations; and Note 14 in the “Notes to Consolidated Financial
Statements” with respect to Walmart’s expected completion of a certain
acquisition in the future after certain conditions are satisfi ed. The letter of

Management’s Discussion and Analysis of Financial
Condition and Results of Operations
Walmart 2012 Annual Report 31
our President and Chief Executive Offi cer appearing in this Annual Report
includes forward-looking statements that relate to management’s
expectation that the Walmart International segment’s “Powered by
Walmart” initiatives will strengthen productivity and reduce expenses,
management’s expectation that growing the Sam’s Club segment’s
membership base will remain a key goal for fi scal 2013, and management’s
plans to increase Walmart’s investment in Yihaodian to 51 percent in fi scal
2013 and to continue Walmart’s investments to leverage additional
opportunities in e-commerce. Forward-looking statements appear in this
Annual Report: under the caption “Walmart International-Our Strategy:
Meeting local needs and leveraging global resources” regarding Walmart’s
intention to be the low cost leader in every market where our Walmart
International segment operates and management’s expectation that our
Walmart International segment will add between 30 million and 33 million
square feet of retail space in fi scal 2013; under the caption “Sam’s Club-
Our Strategy: Leveraging Member insights to deliver value and quality”
regarding the plans of our Sam’s Club segment to open nine new clubs and
relocate or expand six other clubs in fi scal 2013; under the caption “Global
eCommerce-Our Strategy: Winning in Global eCommerce” regarding
Walmart’s goal of combining online, social and mobile innovations with
physical stores to give customers a multi-channel shopping experience
and management’s expectation that Walmart’s acquisition of a majority
stake in Yihaodian will open Walmart’s products and brands to consumers
in China; and under the caption “Walmart-2012 Financial Report” regarding
management’s plan to further strengthen Walmart’s price position by
leveraging expenses as a percentage of sales by an additional 100 basis
points over the next fi ve years and management’s expectation that Walmart
will execute disciplined growth while incorporating new initiatives to
design and build the most cost eff ective stores in the world. The forward-
looking statements described above are identifi ed by the use in such
statements of one or more of the words or phrases “anticipate,” “could be,”
“could reduce,” “estimated,” “expansion,” “expect,” “goal,” “grow,” “intend,”
“is expected,” “may continue,” “may impact,” “may result,” “plan,” “plans,”
“projected,” “will add,” “will be,” “will be paid,” “will depend,” “will execute,”
“will open,” “will … reduce,” “will strengthen,” “would be,” and “would
increase,” and other similar words or phrases. Similarly, descriptions of
our objectives, strategies, plans, goals, or targets are also forward-looking
statements. These statements discuss, among other things, expected
growth, future revenues, future cash fl ows, future capital expenditures,
future performance, future initiatives and the anticipation and expectations
of Walmart and its management as to future occurrences and trends.
The forward-looking statements included in this Annual Report and that
we make elsewhere are subject to certain factors, in the United States and
internationally, which could materially aff ect our fi nancial performance,
our fi nancial condition, our results of operations, including our sales,
earnings per share, comparable store sales, or comparable club sales for
any period, our liquidity, our eff ective tax rate for any period, and our
business operations, business strategy, plans, goals, or objectives. These
factors include, but are not limited to: general economic conditions,
including changes in the economy of the United States or other specifi c
markets in which we operate, economic instability, changes in the monetary
policies of the United States, the Board of Governors of the Federal Reserve
System, other governments or central banks, economic crises and disruptions
in the financial markets, including as a result of sovereign debt crises,
governmental budget defi cits, unemployment and partial employment
levels, employment conditions within our markets, credit availability
to consumers and businesses, levels of consumer disposable income,
consumer confi dence, consumer credit availability, consumer spending
patterns. consumer debt levels, infl ation, defl ation, commodity prices,
the cost of the goods we sell, competitive pressures, the seasonality of
our business, seasonal buying patterns in the United States and our other
markets, labor costs, transportation costs, the cost of diesel fuel, gasoline,
natural gas and electricity, the selling prices of fuel, the cost of healthcare
and other benefi ts, accident costs, our casualty and other insurance costs,
information security costs, the cost of construction materials, availability
of acceptable building sites for new stores, clubs and other formats,
availability of qualifi ed labor pools in the specifi c markets in which we
operate, zoning, land use and other regulatory restrictions, competitive
pressures, accident-related costs, weather conditions and events, catastrophic
events and natural disasters, as well as storm and other damage to our
stores, clubs, distribution centers, and other facilities, and store closings
and other limitations on our customer’ access to our stores and clubs
resulting from such events and disasters, disruption in our supply chain,
including availability and transport of goods from domestic and foreign
suppliers, trade restrictions, changes in tariff and freight rates, adoption
of or changes in tax, labor, and other laws and regulations that aff ect our
business, including changes in corporate tax rates, costs of compliance
with laws and regulations, the resolution of tax matters, developments
in and the outcome of legal and regulatory proceedings to which we
are a party or are subject, currency exchange rate fluctuations and
volatility, fl uctuations in market rates of interest, and other conditions
and events aff ecting domestic and global fi nancial and capital markets,
and economic and geopolitical conditions and events, including civil
unrest and disturbances, public health emergencies, and terrorist attacks.
Moreover, we typically earn a disproportionate part of our annual operating
income in our fourth quarter as a result of the seasonal buying patterns.
Those buying patterns are diffi cult to forecast with certainty. The foregoing
list of factors that may affect our business operations and financial
performance is not exclusive. Other factors and unanticipated events
could adversely aff ect our business operations and fi nancial performance.
We discuss certain of these matters more fully, as well as certain risk factors
that may aff ect our business operations, fi nancial condition, results of
operations and liquidity in other of our fi lings with the Securities and
Exchange Commission (the “SEC”), including our Annual Report on Form
10-K. We fi led our Annual Report on Form 10-K for the fi scal year ended
January 31, 2012, with the SEC on March 27, 2012. The forward-looking
statements described above are made based on knowledge of our
business and the environment in which we operate and assumptions
that we believe to be reasonable at the time such forward-looking
statements are made. However, because of the factors described and
listed above, as well as other factors, or as a result of changes in facts,
assumptions not being realized, or other circumstances, actual results
may materially diff er from anticipated results described or implied in
these forward-looking statements. We cannot assure the reader that the
results or developments expected or anticipated by us will be realized
or, even if substantially realized, that those results or developments will
result in the expected consequences for us or aff ect us, our business, our
operations, or our fi nancial performance in the way we expect. You are urged
to consider all of these risks, uncertainties, and other factors carefully in
evaluating the forward-looking statements and not to place undue reliance
on such forward-looking statements. The forward-looking statements
included in this Annual Report speak only as of the date of this report,
and we undertake no obligation to update these forward-looking
statements to reflect subsequent events or circumstances, except as
may be required by applicable law.
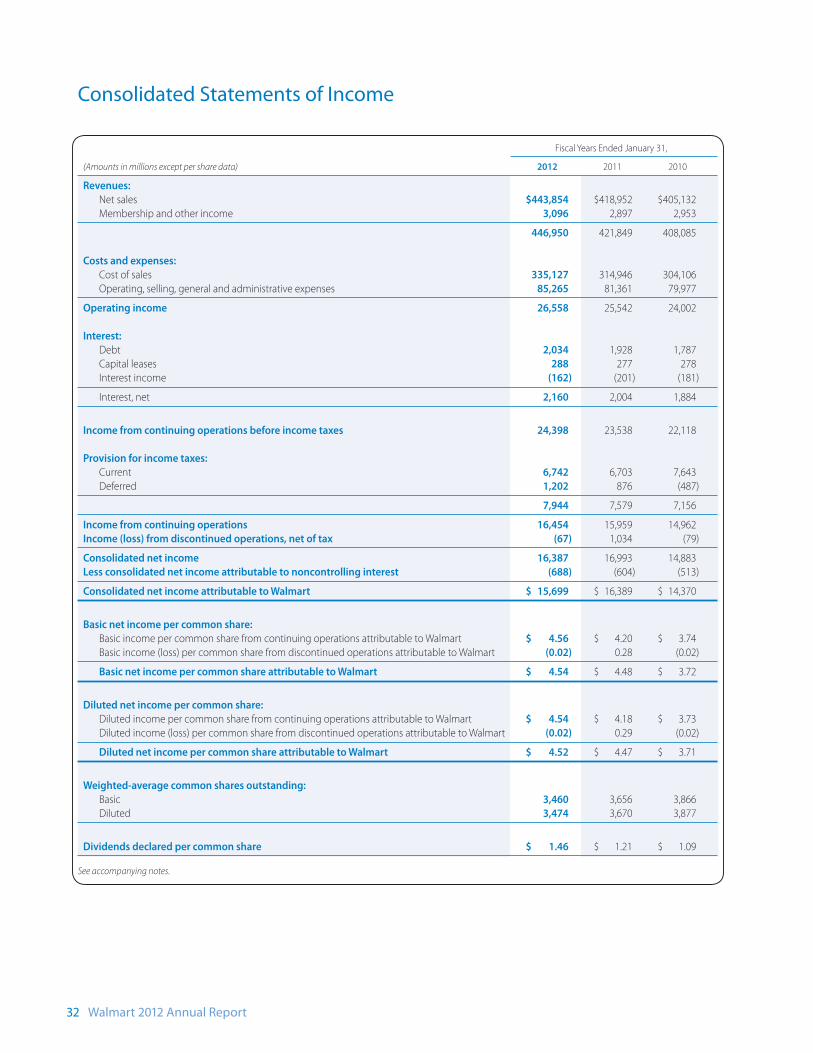
32 Walmart 2012 Annual Report
Consolidated Statements of Income
Fiscal Years Ended January 31,
(Amounts in millions except per share data) 2012 2011 2010
Revenues:
Net sales $443,854 $418,952 $405,132
Membership and other income 3,096 2,897 2,953
446,950 421,849 408,085
Costs and expenses:
Cost of sales 335,127 314,946 304,106
Operating, selling, general and administrative expenses 85,265 81,361 79,977
Operating income 26,558 25,542 24,002
Interest:
Debt 2,034 1,928 1,787
Capital leases 288 277 278
Interest income (162) (201) (181)
Interest, net 2,160 2,004 1,884
Income from continuing operations before income taxes 24,398 23,538 22,118
Provision for income taxes:
Current 6,742 6,703 7,643
Deferred 1,202 876 (487)
7,944 7,579 7,156
Income from continuing operations 16,454 15,959 14,962
Income (loss) from discontinued operations, net of tax (67) 1,034 (79)
Consolidated net income 16,387 16,993 14,883
Less consolidated net income attributable to noncontrolling interest (688) (604) (513)
Consolidated net income attributable to Walmart $ 15,699 $ 16,389 $ 14,370
Basic net income per common share:
Basic income per common share from continuing operations attributable to Walmart $ 4.56 $ 4.20 $ 3.74
Basic income (loss) per common share from discontinued operations attributable to Walmart (0.02) 0.28 (0.02)
Basic net income per common share attributable to Walmart $ 4.54 $ 4.48 $ 3.72
Diluted net income per common share:
Diluted income per common share from continuing operations attributable to Walmart $ 4.54 $ 4.18 $ 3.73
Diluted income (loss) per common share from discontinued operations attributable to Walmart (0.02) 0.29 (0.02)
Diluted net income per common share attributable to Walmart $ 4.52 $ 4.47 $ 3.71
Weighted-average common shares outstanding:
Basic 3,460 3,656 3,866
Diluted 3,474 3,670 3,877
Dividends declared per common share $ 1.46 $ 1.21 $ 1.09
See accompanying notes.
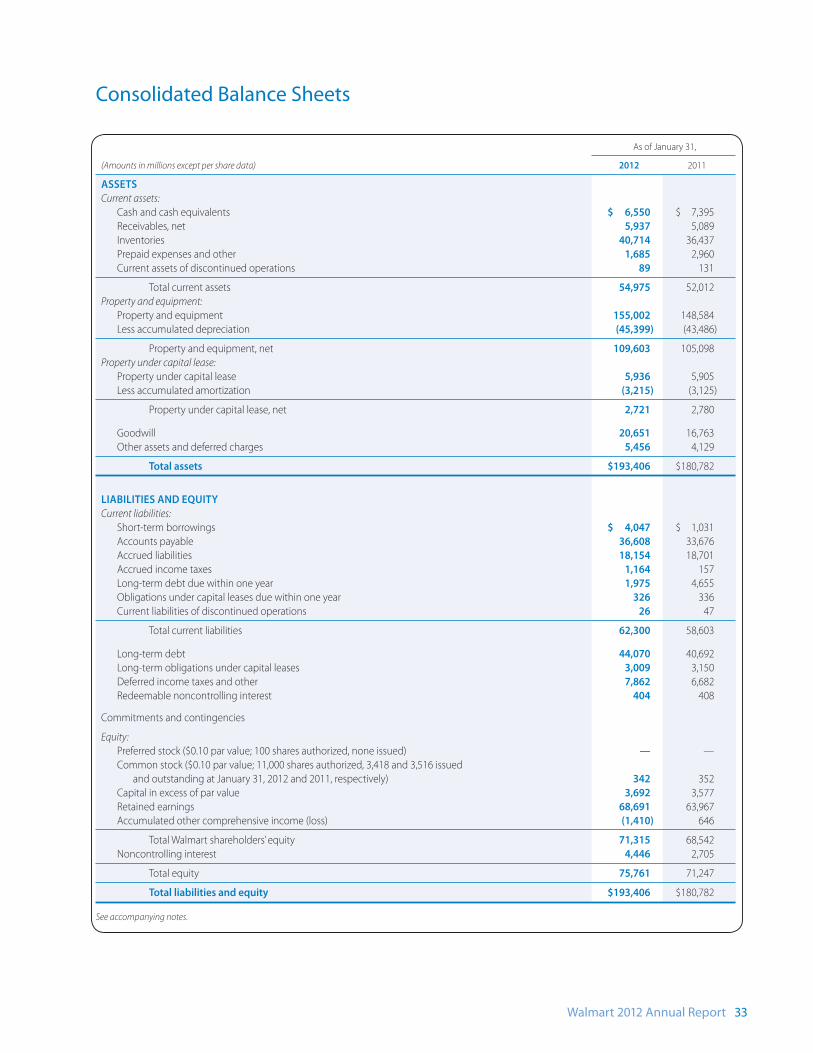
Walmart 2012 Annual Report 33
Consolidated Balance Sheets
As of January 31,
(Amounts in millions except per share data) 2012 2011
ASSETS
Current assets:
Cash and cash equivalents $ 6,550 $ 7,395
Receivables, net 5,937 5,089
Inventories 40,714 36,437
Prepaid expenses and other 1,685 2,960
Current assets of discontinued operations 89 131
Total current assets 54,975 52,012
Property and equipment:
Property and equipment 155,002 148,584
Less accumulated depreciation (45,399) (43,486)
Property and equipment, net 109,603 105,098
Property under capital lease:
Property under capital lease 5,936 5,905
Less accumulated amortization (3,215) (3,125)
Property under capital lease, net 2,721 2,780
Goodwill 20,651 16,763
Other assets and deferred charges 5,456 4,129
Total assets $193,406 $180,782
LIABILITIES AND EQUITY
Current liabilities:
Short-term borrowings $ 4,047 $ 1,031
Accounts payable 36,608 33,676
Accrued liabilities 18,154 18,701
Accrued income taxes 1,164 157
Long-term debt due within one year 1,975 4,655
Obligations under capital leases due within one year 326 336
Current liabilities of discontinued operations 26 47
Total current liabilities 62,300 58,603
Long-term debt 44,070 40,692
Long-term obligations under capital leases 3,009 3,150
Deferred income taxes and other 7,862 6,682
Redeemable noncontrolling interest 404 408
Commitments and contingencies
Equity:
Preferred stock ($0.10 par value; 100 shares authorized, none issued) — —
Common stock ($0.10 par value; 11,000 shares authorized, 3,418 and 3,516 issued
and outstanding at January 31, 2012 and 2011, respectively) 342 352
Capital in excess of par value 3,692 3,577
Retained earnings 68,691 63,967
Accumulated other comprehensive income (loss) (1,410) 646
Total Walmart shareholders’ equity 71,315 68,542
Noncontrolling interest 4,446 2,705
Total equity 75,761 71,247
Total liabilities and equity $193,406 $180,782
See accompanying notes.
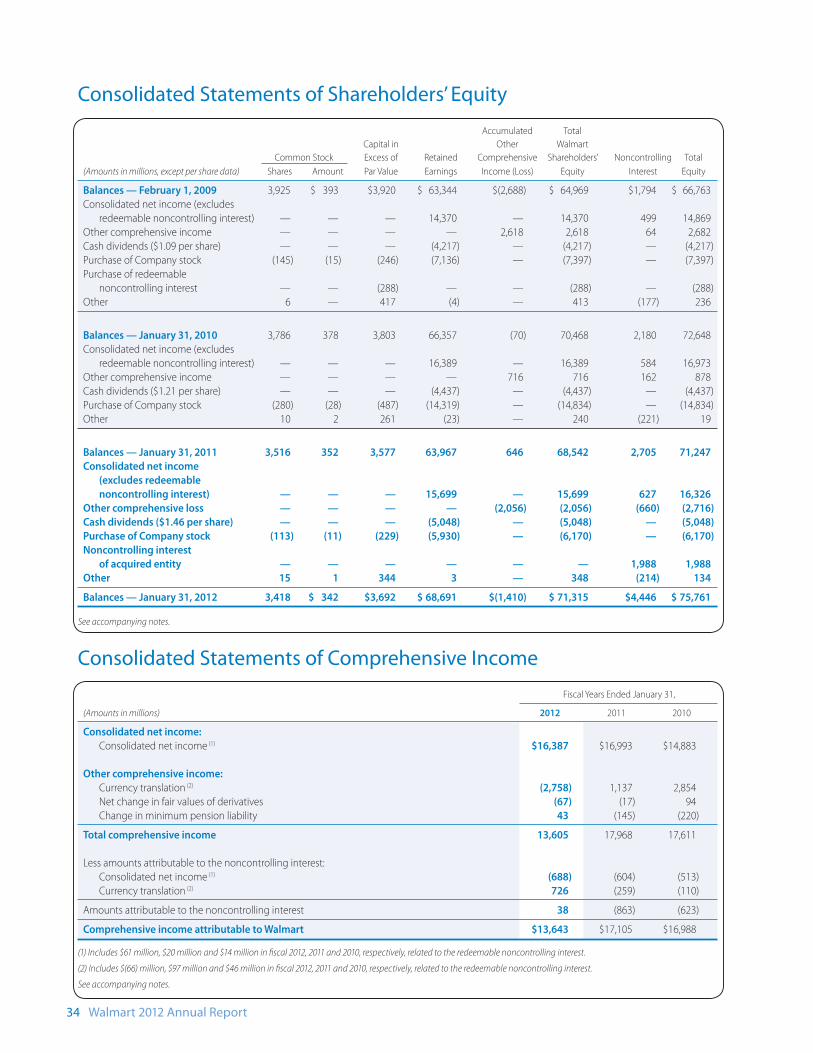
34 Walmart 2012 Annual Report
Accumulated Total
Capital in Other Walmart
Common Stock Excess of Retained Comprehensive Shareholders’ Noncontrolling Total
(Amounts in millions, except per share data) Shares Amount Par Value Earnings Income (Loss) Equity Interest Equity
Balances — February 1, 2009 3,925 $ 393 $3,920 $ 63,344 $(2,688) $ 64,969 $1,794 $ 66,763
Consolidated net income (excludes
redeemable noncontrolling interest) — — — 14,370 — 14,370 499 14,869
Other comprehensive income — — — — 2,618 2,618 64 2,682
Cash dividends ($1.09 per share) — — — (4,217) — (4,217) — (4,217)
Purchase of Company stock (145) (15) (246) (7,136) — (7,397) — (7,397)
Purchase of redeemable
noncontrolling interest — — (288) — — (288) — (288)
Other 6 — 417 (4) — 413 (177) 236
Balances — January 31, 2010 3,786 378 3,803 66,357 (70) 70,468 2,180 72,648
Consolidated net income (excludes
redeemable noncontrolling interest) — — — 16,389 — 16,389 584 16,973
Other comprehensive income — — — — 716 716 162 878
Cash dividends ($1.21 per share) — — — (4,437) — (4,437) — (4,437)
Purchase of Company stock (280) (28) (487) (14,319) — (14,834) — (14,834)
Other 10 2 261 (23) — 240 (221) 19
Balances — January 31, 2011 3,516 352 3,577 63,967 646 68,542 2,705 71,247
Consolidated net income
(excludes redeemable
noncontrolling interest) — — — 15,699 — 15,699 627 16,326
Other comprehensive loss — — — — (2,056) (2,056) (660) (2,716)
Cash dividends ($1.46 per share) — — — (5,048) — (5,048) — (5,048)
Purchase of Company stock (113) (11) (229) (5,930) — (6,170) — (6,170)
Noncontrolling interest
of acquired entity — — — — — — 1,988 1,988
Other 15 1 344 3 — 348 (214) 134
Balances — January 31, 2012 3,418 $ 342 $3,692 $ 68,691 $(1,410) $ 71,315 $4,446 $ 75,761
See accompanying notes.
Consolidated Statements of Comprehensive Income
Fiscal Years Ended January 31,
(Amounts in millions) 2012 2011 2010
Consolidated net income:
Consolidated net income (1) $16,387 $16,993 $14,883
Other comprehensive income:
Currency translation (2) (2,758) 1,137 2,854
Net change in fair values of derivatives (67) (17) 94
Change in minimum pension liability 43 (145) (220)
Total comprehensive income 13,605 17,968 17,611
Less amounts attributable to the noncontrolling interest:
Consolidated net income (1) (688) (604) (513)
Currency translation (2) 726 (259) (110)
Amounts attributable to the noncontrolling interest 38 (863) (623)
Comprehensive income attributable to Walmart $13,643 $17,105 $16,988
(1) Includes $61 million, $20 million and $14 million in fi scal 2012, 2011 and 2010, respectively, related to the redeemable noncontrolling interest.
(2) Includes $(66) million, $97 million and $46 million in fi scal 2012, 2011 and 2010, respectively, related to the redeemable noncontrolling interest.
See accompanying notes.
Consolidated Statements of Shareholders’ Equity
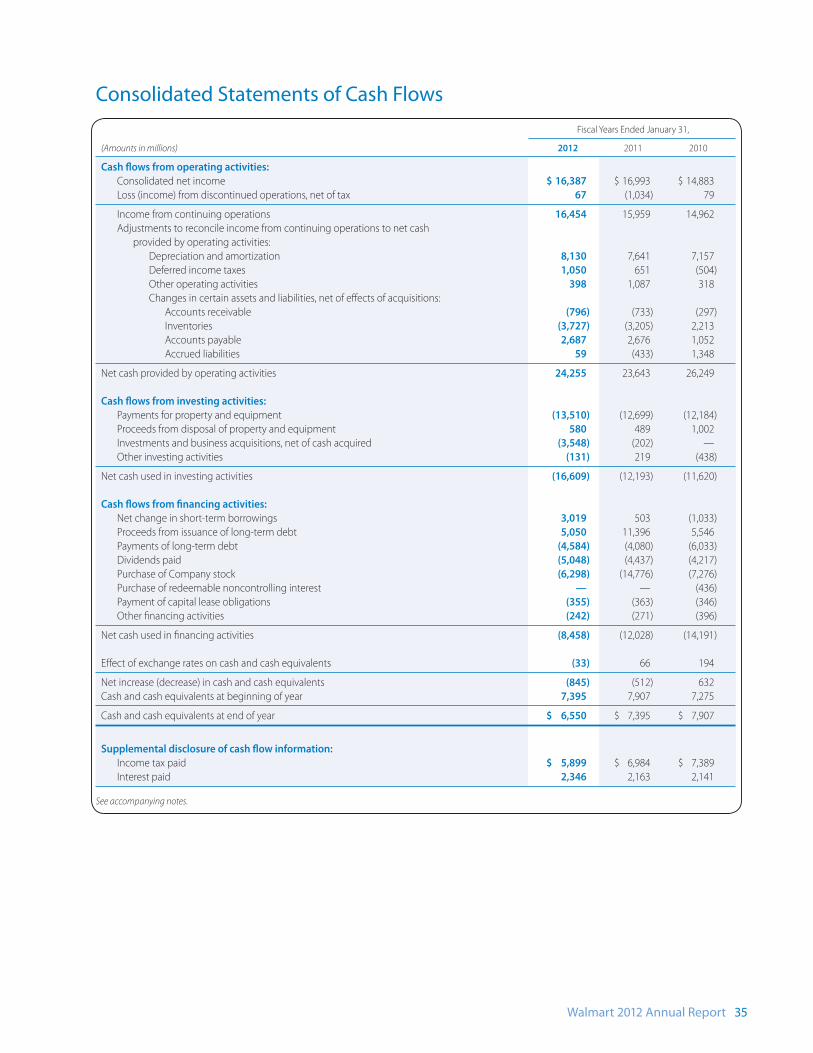
Walmart 2012 Annual Report 35
Fiscal Years Ended January 31,
(Amounts in millions) 2012 2011 2010
Cash fl ows from operating activities:
Consolidated net income $ 16,387 $ 16,993 $ 14,883
Loss (income) from discontinued operations, net of tax 67 (1,034) 79
Income from continuing operations 16,454 15,959 14,962
Adjustments to reconcile income from continuing operations to net cash
provided by operating activities:
Depreciation and amortization 8,130 7,641 7,157
Deferred income taxes 1,050 651 (504)
Other operating activities 398 1,087 318
Changes in certain assets and liabilities, net of eff ects of acquisitions:
Accounts receivable (796) (733) (297)
Inventories (3,727) (3,205) 2,213
Accounts payable 2,687 2,676 1,052
Accrued liabilities 59 (433) 1,348
Net cash provided by operating activities 24,255 23,643 26,249
Cash fl ows from investing activities:
Payments for property and equipment (13,510) (12,699) (12,184)
Proceeds from disposal of property and equipment 580 489 1,002
Investments and business acquisitions, net of cash acquired (3,548) (202) —
Other investing activities (131) 219 (438)
Net cash used in investing activities (16,609) (12,193) (11,620)
Cash fl ows from fi nancing activities:
Net change in short-term borrowings 3,019 503 (1,033)
Proceeds from issuance of long-term debt 5,050 11,396 5,546
Payments of long-term debt (4,584) (4,080) (6,033)
Dividends paid (5,048) (4,437) (4,217)
Purchase of Company stock (6,298) (14,776) (7,276)
Purchase of redeemable noncontrolling interest — — (436)
Payment of capital lease obligations (355) (363) (346)
Other fi nancing activities (242) (271) (396)
Net cash used in fi nancing activities (8,458) (12,028) (14,191)
Eff ect of exchange rates on cash and cash equivalents (33) 66 194
Net increase (decrease) in cash and cash equivalents (845) (512) 632
Cash and cash equivalents at beginning of year 7,395 7,907 7,275
Cash and cash equivalents at end of year $ 6,550 $ 7,395 $ 7,907
Supplemental disclosure of cash fl ow information:
Income tax paid $ 5,899 $ 6,984 $ 7,389
Interest paid 2,346 2,163 2,141
See accompanying notes.
Consolidated Statements of Cash Flows
36 Walmart 2012 Annual Report
1 Summary of Signifi cant Accounting Policies
GeneralWal-Mart Stores, Inc. (“Walmart” or the “Company”) operates retail stores
in various formats around the world, aggregated into three reportable
segments: the Walmart U.S. segment; the Walmart International segment;
and the Sam’s Club segment. Walmart is committed to saving people
money so they can live better. Walmart earns the trust of its customers
every day by providing a broad assortment of quality merchandise and
services at everyday low prices (“EDLP”) while fostering a culture that
rewards and embraces mutual respect, integrity and diversity. EDLP is
the Company’s pricing philosophy under which it prices items at a low
price every day so its customers trust that its prices will not change
under frequent promotional activity.
Principles of Consolidation
The Consolidated Financial Statements include the accounts of Walmart
and its subsidiaries. All material intercompany accounts and transactions
have been eliminated in consolidation. Investments in unconsolidated
affi liates, which are 50% or less owned and do not meet the consolidation
criteria of Topic 810 of the Financial Accounting Standards Codifi cation
(“ASC”), are accounted for using the equity method. These investments
are immaterial to the Company’s Consolidated Financial Statements.
The Company’s operations in the United States (“U.S.”) and Canada
are consolidated using a January 31 fi scal year-end. The Company’s
operations in 12 countries in Africa, Argentina, Brazil, 5 countries in
Central America, Chile, China, India, Japan, Mexico and the United
Kingdom are consolidated using a December 31 fi scal year-end,
generally due to statutory reporting requirements. There were no
signifi cant intervening events during January 2012 which materially
aff ected the Consolidated Financial Statements.
Use of Estimates
The Consolidated Financial Statements have been prepared in
conformity with accounting principles generally accepted in the United
States. Those principles require management to make estimates and
assumptions that aff ect the reported amounts of assets and liabilities.
Management’s estimates and assumptions also aff ect the disclosure of
contingent assets and liabilities at the date of the fi nancial statements
and the reported amounts of revenues and expenses during the reporting
period. Actual results may diff er from those estimates.
Cash and Cash Equivalents
The Company considers investments with a maturity when purchased
of three months or less to be cash equivalents. All credit card, debit card
and electronic benefi ts transfer transactions that process in less than
seven days are classifi ed as cash and cash equivalents. The amounts due
from banks for these transactions classifi ed as cash totaled $1.2 billion at
January 31, 2012 and 2011. In addition, cash and cash equivalents includes
restricted cash primarily related to cash collateral holdings from various
counterparties, as required by certain derivative and trust agreements, of
$547 million and $504 million at January 31, 2012 and 2011, respectively.
The Company’s cash balances are held in various locations around the
world. Of the Company’s $6.6 billion and $7.4 billion of cash and cash
equivalents at January 31, 2012 and 2011, respectively, $5.6 billion and
$7.1 billion, respectively, were held outside of the U.S. and are generally
utilized to support liquidity needs in the Company’s foreign operations.
The Company employs fi nancing strategies in an eff ort to ensure that
cash can be made available in the country in which it is needed with
the minimum cost possible. The Company does not believe it will be
necessary to repatriate cash and cash equivalents held outside of the
U.S. and anticipates its domestic liquidity needs will be met through
other funding sources (ongoing cash fl ows generated from operations,
external borrowings, or both). Accordingly, the Company intends, with
only certain limited exceptions, to continue to permanently reinvest the
cash in its foreign operations. Were the Company’s intention to change,
most of the amounts held within the Company’s foreign operations
could be repatriated to the U.S., although any repatriations under current
U.S. tax laws would be subject to U.S. federal income taxes, less applicable
foreign tax credits. As of January 31, 2012 and 2011, approximately
$768 million and $691 million, respectively, may not be freely transferable
to the U.S. due to local laws or other restrictions. The Company does
not expect local laws, other limitations or potential taxes on anticipated
future repatriations of amounts held outside of the United States to have
a material eff ect on its overall liquidity, fi nancial condition or results
of operations.
Receivables
Receivables are stated at their carrying values, net of a reserve for
doubtful accounts. Receivables consist primarily of amounts due from:
• insurance companies resulting from pharmacy sales;
• banks for customer credit card, debit card and electronic bank transfers
that take in excess of seven days to process;
• suppliers for marketing or incentive programs;
• consumer fi nancing programs in certain international subsidiaries; and
• real estate transactions.
The Company establishes a reserve for doubtful accounts based on
historical trends in collection of past due amounts and write-off history.
The total reserve for doubtful accounts was $323 million and $252 million
at January 31, 2012 and 2011, respectively.
Walmart International off ers a limited amount of consumer credit products,
primarily through its fi nancial institution operations in Chile, Canada and
Mexico. The balance of these receivables was $1,049 million, net of a reserve
for doubtful accounts of $63 million at January 31, 2012, compared to a
receivable balance of $673 million, net of a reserve for doubtful accounts
of $83 million at January 31, 2011. These balances are included in receiv-
ables, net in the Company’s Consolidated Balance Sheets.
Inventories
The Company values inventories at the lower of cost or market as
determined primarily by the retail method of accounting, using the
last-in, fi rst-out (“LIFO”) method for substantially all of the Walmart U.S.
segment’s merchandise inventories. The retail method of accounting
results in inventory being valued at the lower of cost or market since per-
manent markdowns are currently taken as a reduction of the retail value
of inventory. The Sam’s Club segment’s merchandise is valued based on
the weighted-average cost using the LIFO method. Inventories for the
Walmart International operations are primarily valued by the retail
method of accounting and are stated using the fi rst-in, fi rst-out (“FIFO”)
method. At January 31, 2012 and 2011, the Company’s inventories valued
at LIFO approximate those inventories as if they were valued at FIFO.
Notes to Consolidated Financial Statements
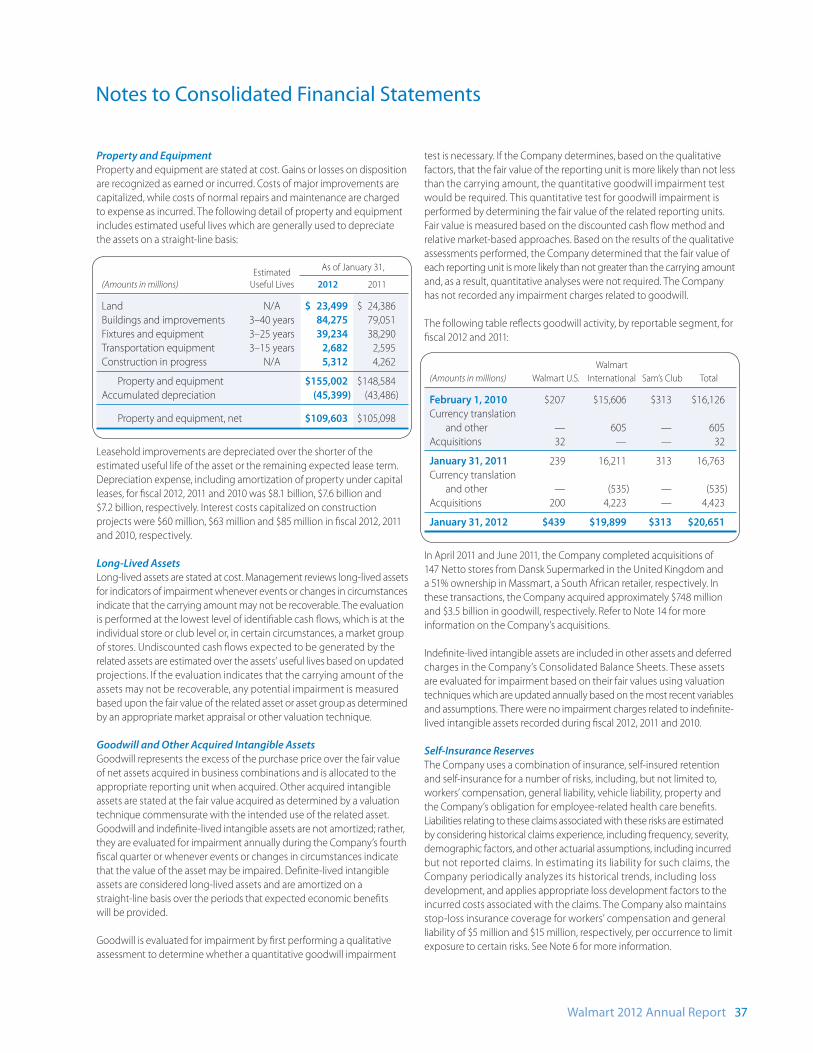
Walmart 2012 Annual Report 37
Property and Equipment
Property and equipment are stated at cost. Gains or losses on disposition
are recognized as earned or incurred. Costs of major improvements are
capitalized, while costs of normal repairs and maintenance are charged
to expense as incurred. The following detail of property and equipment
includes estimated useful lives which are generally used to depreciate
the assets on a straight-line basis:
Estimated
As of January 31,
(Amounts in millions) Useful Lives 2012 2011
Land N/A $ 23,499 $ 24,386
Buildings and improvements 3–40 years 84,275 79,051
Fixtures and equipment 3–25 years 39,234 38,290
Transportation equipment 3–15 years 2,682 2,595
Construction in progress N/A 5,312 4,262
Property and equipment $155,002 $148,584
Accumulated depreciation (45,399) (43,486)
Property and equipment, net $109,603 $105,098
Leasehold improvements are depreciated over the shorter of the
estimated useful life of the asset or the remaining expected lease term.
Depreciation expense, including amortization of property under capital
leases, for fi scal 2012, 2011 and 2010 was $8.1 billion, $7.6 billion and
$7.2 billion, respectively. Interest costs capitalized on construction
projects were $60 million, $63 million and $85 million in fi scal 2012, 2011
and 2010, respectively.
Long-Lived Assets
Long-lived assets are stated at cost. Management reviews long-lived assets
for indicators of impairment whenever events or changes in circumstances
indicate that the carrying amount may not be recoverable. The evaluation
is performed at the lowest level of identifi able cash fl ows, which is at the
individual store or club level or, in certain circumstances, a market group
of stores. Undiscounted cash fl ows expected to be generated by the
related assets are estimated over the assets’ useful lives based on updated
projections. If the evaluation indicates that the carrying amount of the
assets may not be recoverable, any potential impairment is measured
based upon the fair value of the related asset or asset group as determined
by an appropriate market appraisal or other valuation technique.
Goodwill and Other Acquired Intangible Assets
Goodwill represents the excess of the purchase price over the fair value
of net assets acquired in business combinations and is allocated to the
appropriate reporting unit when acquired. Other acquired intangible
assets are stated at the fair value acquired as determined by a valuation
technique commensurate with the intended use of the related asset.
Goodwill and indefi nite-lived intangible assets are not amortized; rather,
they are evaluated for impairment annually during the Company’s fourth
fi scal quarter or whenever events or changes in circumstances indicate
that the value of the asset may be impaired. Defi nite-lived intangible
assets are considered long-lived assets and are amortized on a
straight-line basis over the periods that expected economic benefi ts
will be provided.
Goodwill is evaluated for impairment by fi rst performing a qualitative
assessment to determine whether a quantitative goodwill impairment
test is necessary. If the Company determines, based on the qualitative
factors, that the fair value of the reporting unit is more likely than not less
than the carrying amount, the quantitative goodwill impairment test
would be required. This quantitative test for goodwill impairment is
performed by determining the fair value of the related reporting units.
Fair value is measured based on the discounted cash fl ow method and
relative market-based approaches. Based on the results of the qualitative
assessments performed, the Company determined that the fair value of
each reporting unit is more likely than not greater than the carrying amount
and, as a result, quantitative analyses were not required. The Company
has not recorded any impairment charges related to goodwill.
The following table refl ects goodwill activity, by reportable segment, for
fi scal 2012 and 2011:
Walmart
(Amounts in millions) Walmart U.S. International Sam’s Club Total
February 1, 2010 $207 $15,606 $313 $16,126
Currency translation
and other — 605 — 605
Acquisitions 32 — — 32
January 31, 2011 239 16,211 313 16,763
Currency translation
and other — (535) — (535)
Acquisitions 200 4,223 — 4,423
January 31, 2012 $439 $19,899 $313 $20,651
In April 2011 and June 2011, the Company completed acquisitions of
147 Netto stores from Dansk Supermarked in the United Kingdom and
a 51% ownership in Massmart, a South African retailer, respectively. In
these transactions, the Company acquired approximately $748 million
and $3.5 billion in goodwill, respectively. Refer to Note 14 for more
information on the Company’s acquisitions.
Indefi nite-lived intangible assets are included in other assets and deferred
charges in the Company’s Consolidated Balance Sheets. These assets
are evaluated for impairment based on their fair values using valuation
techniques which are updated annually based on the most recent variables
and assumptions. There were no impairment charges related to indefi nite-
lived intangible assets recorded during fi scal 2012, 2011 and 2010.
Self-Insurance Reserves
The Company uses a combination of insurance, self-insured retention
and self-insurance for a number of risks, including, but not limited to,
workers’ compensation, general liability, vehicle liability, property and
the Company’s obligation for employee-related health care benefi ts.
Liabilities relating to these claims associated with these risks are estimated
by considering historical claims experience, including frequency, severity,
demographic factors, and other actuarial assumptions, including incurred
but not reported claims. In estimating its liability for such claims, the
Company periodically analyzes its historical trends, including loss
development, and applies appropriate loss development factors to the
incurred costs associated with the claims. The Company also maintains
stop-loss insurance coverage for workers’ compensation and general
liability of $5 million and $15 million, respectively, per occurrence to limit
exposure to certain risks. See Note 6 for more information.
Notes to Consolidated Financial Statements
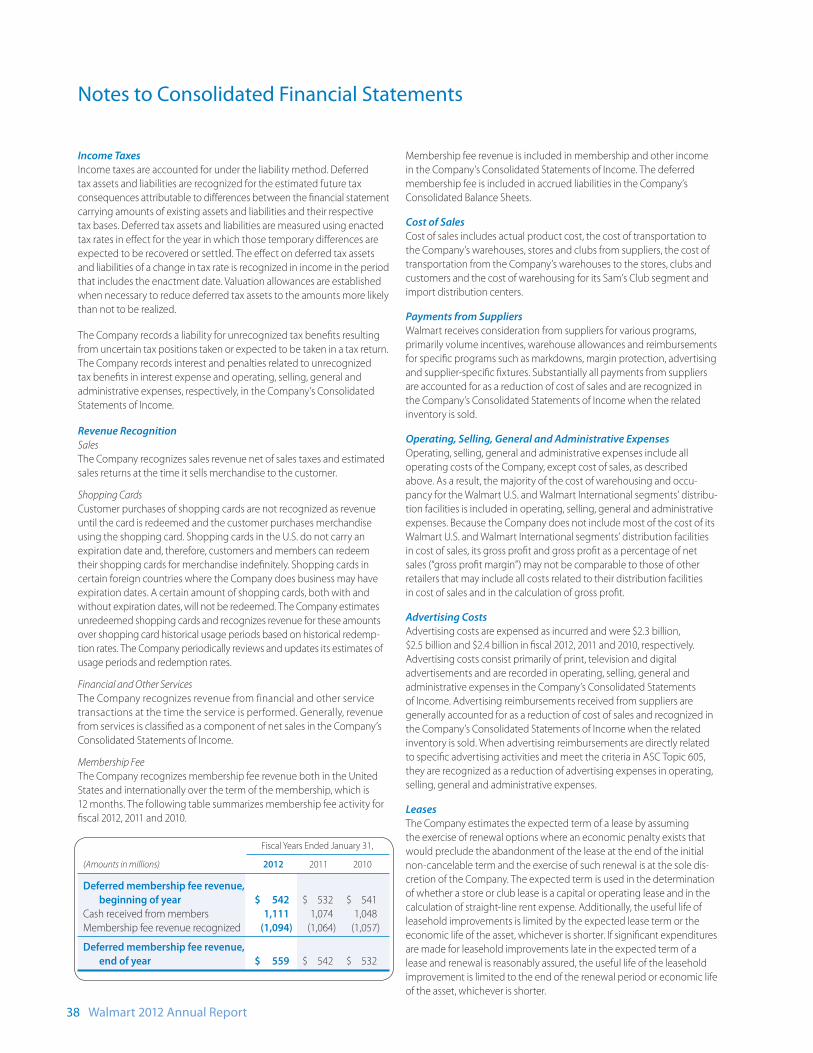
38 Walmart 2012 Annual Report
Income Taxes
Income taxes are accounted for under the liability method. Deferred
tax assets and liabilities are recognized for the estimated future tax
consequences attributable to diff erences between the fi nancial statement
carrying amounts of existing assets and liabilities and their respective
tax bases. Deferred tax assets and liabilities are measured using enacted
tax rates in eff ect for the year in which those temporary diff erences are
expected to be recovered or settled. The eff ect on deferred tax assets
and liabilities of a change in tax rate is recognized in income in the period
that includes the enactment date. Valuation allowances are established
when necessary to reduce deferred tax assets to the amounts more likely
than not to be realized.
The Company records a liability for unrecognized tax benefi ts resulting
from uncertain tax positions taken or expected to be taken in a tax return.
The Company records interest and penalties related to unrecognized
tax benefi ts in interest expense and operating, selling, general and
administrative expenses, respectively, in the Company’s Consolidated
Statements of Income.
Revenue Recognition
Sales
The Company recognizes sales revenue net of sales taxes and estimated
sales returns at the time it sells merchandise to the customer.
Shopping Cards
Customer purchases of shopping cards are not recognized as revenue
until the card is redeemed and the customer purchases merchandise
using the shopping card. Shopping cards in the U.S. do not carry an
expiration date and, therefore, customers and members can redeem
their shopping cards for merchandise indefi nitely. Shopping cards in
certain foreign countries where the Company does business may have
expiration dates. A certain amount of shopping cards, both with and
without expiration dates, will not be redeemed. The Company estimates
unredeemed shopping cards and recognizes revenue for these amounts
over shopping card historical usage periods based on historical redemp-
tion rates. The Company periodically reviews and updates its estimates of
usage periods and redemption rates.
Financial and Other Services
The Company recognizes revenue from financial and other service
transactions at the time the service is performed. Generally, revenue
from services is classifi ed as a component of net sales in the Company’s
Consolidated Statements of Income.
Membership Fee
The Company recognizes membership fee revenue both in the United
States and internationally over the term of the membership, which is
12 months. The following table summarizes membership fee activity for
fi scal 2012, 2011 and 2010.
Fiscal Years Ended January 31,
(Amounts in millions) 2012 2011 2010
Deferred membership fee revenue,
beginning of year $ 542 $ 532 $ 541
Cash received from members 1,111 1,074 1,048
Membership fee revenue recognized (1,094) (1,064) (1,057)
Deferred membership fee revenue,
end of year $ 559 $ 542 $ 532
Membership fee revenue is included in membership and other income
in the Company’s Consolidated Statements of Income. The deferred
membership fee is included in accrued liabilities in the Company’s
Consolidated Balance Sheets.
Cost of Sales
Cost of sales includes actual product cost, the cost of transportation to
the Company’s warehouses, stores and clubs from suppliers, the cost of
transportation from the Company’s warehouses to the stores, clubs and
customers and the cost of warehousing for its Sam’s Club segment and
import distribution centers.
Payments from Suppliers
Walmart receives consideration from suppliers for various programs,
primarily volume incentives, warehouse allowances and reimbursements
for specifi c programs such as markdowns, margin protection, advertising
and supplier-specifi c fi xtures. Substantially all payments from suppliers
are accounted for as a reduction of cost of sales and are recognized in
the Company’s Consolidated Statements of Income when the related
inventory is sold.
Operating, Selling, General and Administrative Expenses
Operating, selling, general and administrative expenses include all
operating costs of the Company, except cost of sales, as described
above. As a result, the majority of the cost of warehousing and occu-
pancy for the Walmart U.S. and Walmart International segments’ distribu-
tion facilities is included in operating, selling, general and administrative
expenses. Because the Company does not include most of the cost of its
Walmart U.S. and Walmart International segments’ distribution facilities
in cost of sales, its gross profi t and gross profi t as a percentage of net
sales (“gross profi t margin”) may not be comparable to those of other
retailers that may include all costs related to their distribution facilities
in cost of sales and in the calculation of gross profi t.
Advertising Costs
Advertising costs are expensed as incurred and were $2.3 billion,
$2.5 billion and $2.4 billion in fi scal 2012, 2011 and 2010, respectively.
Advertising costs consist primarily of print, television and digital
advertisements and are recorded in operating, selling, general and
administrative expenses in the Company’s Consolidated Statements
of Income. Advertising reimbursements received from suppliers are
generally accounted for as a reduction of cost of sales and recognized in
the Company’s Consolidated Statements of Income when the related
inventory is sold. When advertising reimbursements are directly related
to specifi c advertising activities and meet the criteria in ASC Topic 605,
they are recognized as a reduction of advertising expenses in operating,
selling, general and administrative expenses.
Leases
The Company estimates the expected term of a lease by assuming
the exercise of renewal options where an economic penalty exists that
would preclude the abandonment of the lease at the end of the initial
non- cancelable term and the exercise of such renewal is at the sole dis-
cretion of the Company. The expected term is used in the determination
of whether a store or club lease is a capital or operating lease and in the
calculation of straight-line rent expense. Additionally, the useful life of
leasehold improvements is limited by the expected lease term or the
economic life of the asset, whichever is shorter. If signifi cant expenditures
are made for leasehold improvements late in the expected term of a
lease and renewal is reasonably assured, the useful life of the leasehold
improvement is limited to the end of the renewal period or economic life
of the asset, whichever is shorter.
Notes to Consolidated Financial Statements
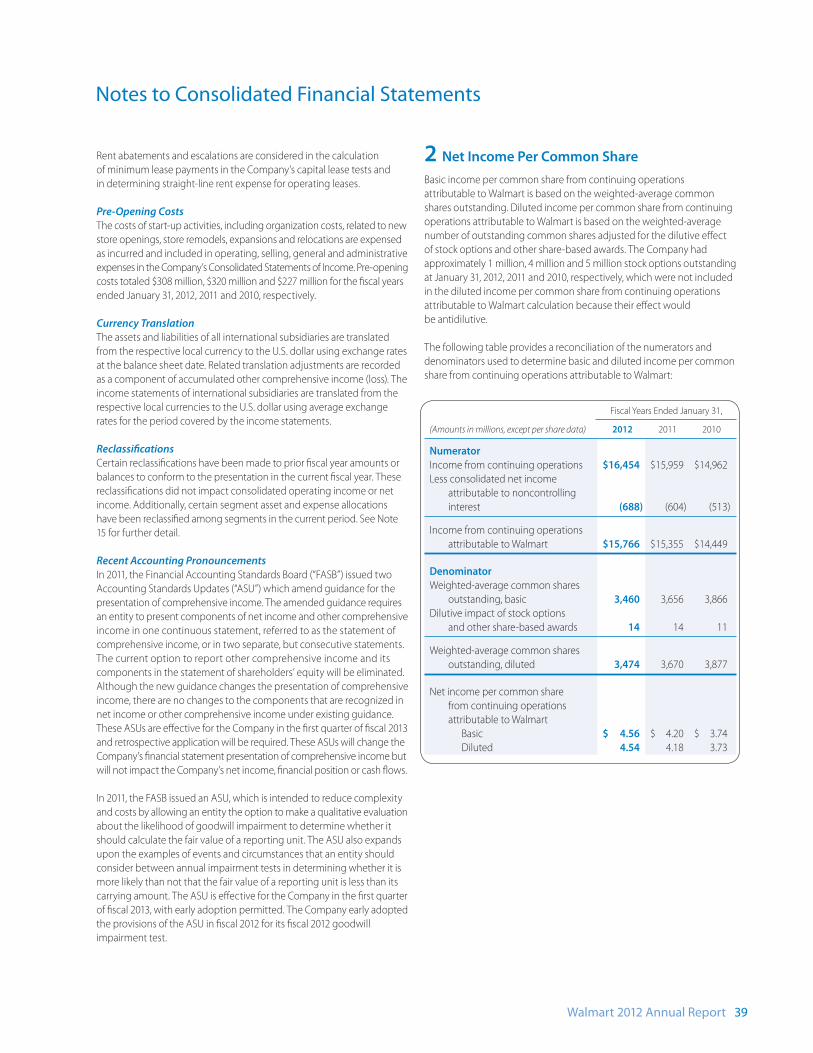
Walmart 2012 Annual Report 39
Rent abatements and escalations are considered in the calculation
of minimum lease payments in the Company’s capital lease tests and
in determining straight-line rent expense for operating leases.
Pre-Opening Costs
The costs of start-up activities, including organization costs, related to new
store openings, store remodels, expansions and relocations are expensed
as incurred and included in operating, selling, general and administrative
expenses in the Company’s Consolidated Statements of Income. Pre-opening
costs totaled $308 million, $320 million and $227 million for the fi scal years
ended January 31, 2012, 2011 and 2010, respectively.
Currency Translation
The assets and liabilities of all international subsidiaries are translated
from the respective local currency to the U.S. dollar using exchange rates
at the balance sheet date. Related translation adjustments are recorded
as a component of accumulated other comprehensive income (loss). The
income statements of international subsidiaries are translated from the
respective local currencies to the U.S. dollar using average exchange
rates for the period covered by the income statements.
Reclassifi cations
Certain reclassifi cations have been made to prior fi scal year amounts or
balances to conform to the presentation in the current fi scal year. These
reclassifi cations did not impact consolidated operating income or net
income. Additionally, certain segment asset and expense allocations
have been reclassifi ed among segments in the current period. See Note
15 for further detail.
Recent Accounting Pronouncements
In 2011, the Financial Accounting Standards Board (“FASB”) issued two
Accounting Standards Updates (“ASU”) which amend guidance for the
presentation of comprehensive income. The amended guidance requires
an entity to present components of net income and other comprehensive
income in one continuous statement, referred to as the statement of
comprehensive income, or in two separate, but consecutive statements.
The current option to report other comprehensive income and its
components in the statement of shareholders’ equity will be eliminated.
Although the new guidance changes the presentation of comprehensive
income, there are no changes to the components that are recognized in
net income or other comprehensive income under existing guidance.
These ASUs are eff ective for the Company in the fi rst quarter of fi scal 2013
and retrospective application will be required. These ASUs will change the
Company’s fi nancial statement presentation of comprehensive income but
will not impact the Company’s net income, fi nancial position or cash fl ows.
In 2011, the FASB issued an ASU, which is intended to reduce complexity
and costs by allowing an entity the option to make a qualitative evaluation
about the likelihood of goodwill impairment to determine whether it
should calculate the fair value of a reporting unit. The ASU also expands
upon the examples of events and circumstances that an entity should
consider between annual impairment tests in determining whether it is
more likely than not that the fair value of a reporting unit is less than its
carrying amount. The ASU is eff ective for the Company in the fi rst quarter
of fi scal 2013, with early adoption permitted. The Company early adopted
the provisions of the ASU in fi scal 2012 for its fi scal 2012 goodwill
impairment test.
2 Net Income Per Common Share
Basic income per common share from continuing operations
attributable to Walmart is based on the weighted-average common
shares outstanding. Diluted income per common share from continuing
operations attributable to Walmart is based on the weighted-average
number of outstanding common shares adjusted for the dilutive eff ect
of stock options and other share-based awards. The Company had
approximately 1 million, 4 million and 5 million stock options outstanding
at January 31, 2012, 2011 and 2010, respectively, which were not included
in the diluted income per common share from continuing operations
attributable to Walmart calculation because their eff ect would
be antidilutive.
The following table provides a reconciliation of the numerators and
denominators used to determine basic and diluted income per common
share from continuing operations attributable to Walmart:
Fiscal Years Ended January 31,
(Amounts in millions, except per share data) 2012 2011 2010
Numerator
Income from continuing operations $16,454 $15,959 $14,962
Less consolidated net income
attributable to noncontrolling
interest (688) (604) (513)
Income from continuing operations
attributable to Walmart $15,766 $15,355 $14,449
Denominator
Weighted-average common shares
outstanding, basic 3,460 3,656 3,866
Dilutive impact of stock options
and other share-based awards 14 14 11
Weighted-average common shares
outstanding, diluted 3,474 3,670 3,877
Net income per common share
from continuing operations
attributable to Walmart
Basic $ 4.56 $ 4.20 $ 3.74
Diluted 4.54 4.18 3.73
Notes to Consolidated Financial Statements
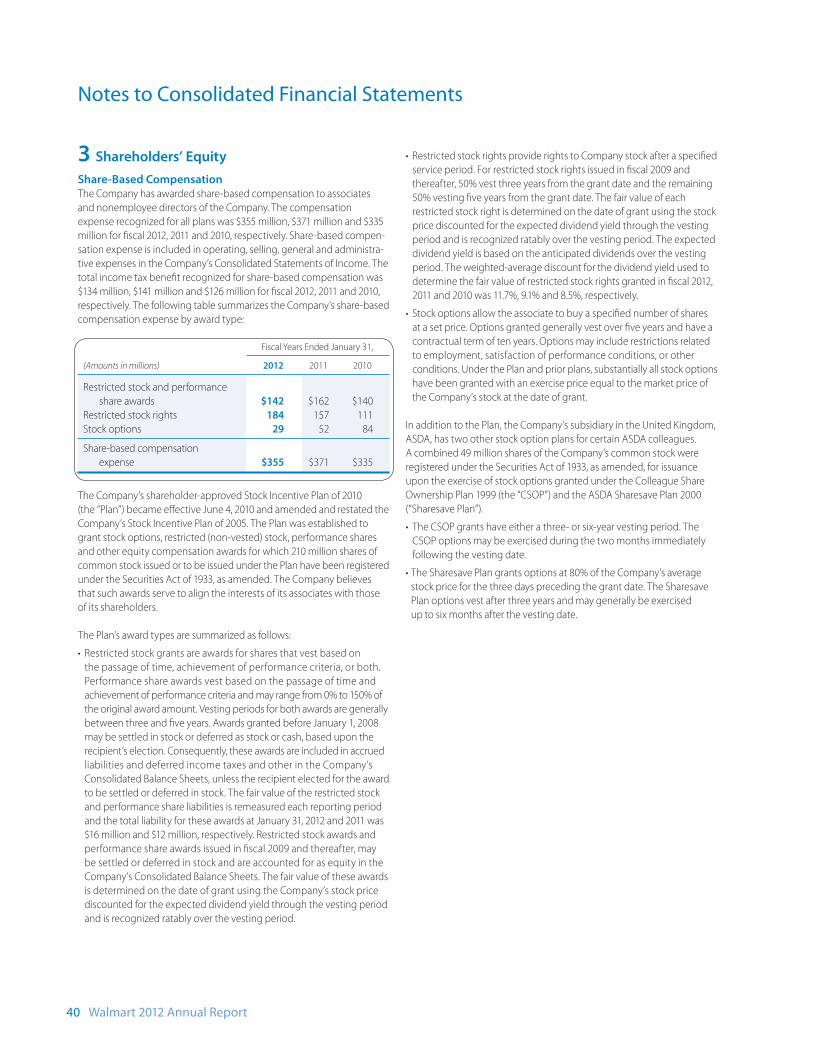
40 Walmart 2012 Annual Report
3 Shareholders’ Equity
Share-Based CompensationThe Company has awarded share-based compensation to associates
and nonemployee directors of the Company. The compensation
expense recognized for all plans was $355 million, $371 million and $335
million for fi scal 2012, 2011 and 2010, respectively. Share-based compen-
sation expense is included in operating, selling, general and administra-
tive expenses in the Company’s Consolidated Statements of Income. The
total income tax benefi t recognized for share-based compensation was
$134 million, $141 million and $126 million for fi scal 2012, 2011 and 2010,
respectively. The following table summarizes the Company’s share-based
compensation expense by award type:
Fiscal Years Ended January 31,
(Amounts in millions) 2012 2011 2010
Restricted stock and performance
share awards $142 $162 $140
Restricted stock rights 184 157 111
Stock options 29 52 84
Share-based compensation
expense $355 $371 $335
The Company’s shareholder-approved Stock Incentive Plan of 2010
(the “Plan”) became eff ective June 4, 2010 and amended and restated the
Company’s Stock Incentive Plan of 2005. The Plan was established to
grant stock options, restricted (non-vested) stock, performance shares
and other equity compensation awards for which 210 million shares of
common stock issued or to be issued under the Plan have been registered
under the Securities Act of 1933, as amended. The Company believes
that such awards serve to align the interests of its associates with those
of its shareholders.
The Plan’s award types are summarized as follows:
• Restricted stock grants are awards for shares that vest based on
the passage of time, achievement of performance criteria, or both.
Performance share awards vest based on the passage of time and
achievement of performance criteria and may range from 0% to 150% of
the original award amount. Vesting periods for both awards are generally
between three and fi ve years. Awards granted before January 1, 2008
may be settled in stock or deferred as stock or cash, based upon the
recipient’s election. Consequently, these awards are included in accrued
liabilities and deferred income taxes and other in the Company’s
Consolidated Balance Sheets, unless the recipient elected for the award
to be settled or deferred in stock. The fair value of the restricted stock
and performance share liabilities is remeasured each reporting period
and the total liability for these awards at January 31, 2012 and 2011 was
$16 million and $12 million, respectively. Restricted stock awards and
performance share awards issued in fi scal 2009 and thereafter, may
be settled or deferred in stock and are accounted for as equity in the
Company’s Consolidated Balance Sheets. The fair value of these awards
is determined on the date of grant using the Company’s stock price
discounted for the expected dividend yield through the vesting period
and is recognized ratably over the vesting period.
• Restricted stock rights provide rights to Company stock after a specifi ed
service period. For restricted stock rights issued in fi scal 2009 and
thereafter, 50% vest three years from the grant date and the remaining
50% vesting fi ve years from the grant date. The fair value of each
restricted stock right is determined on the date of grant using the stock
price discounted for the expected dividend yield through the vesting
period and is recognized ratably over the vesting period. The expected
dividend yield is based on the anticipated dividends over the vesting
period. The weighted-average discount for the dividend yield used to
determine the fair value of restricted stock rights granted in fi scal 2012,
2011 and 2010 was 11.7%, 9.1% and 8.5%, respectively.
• Stock options allow the associate to buy a specifi ed number of shares
at a set price. Options granted generally vest over fi ve years and have a
contractual term of ten years. Options may include restrictions related
to employment, satisfaction of performance conditions, or other
conditions. Under the Plan and prior plans, substantially all stock options
have been granted with an exercise price equal to the market price of
the Company’s stock at the date of grant.
In addition to the Plan, the Company’s subsidiary in the United Kingdom,
ASDA, has two other stock option plans for certain ASDA colleagues.
A combined 49 million shares of the Company’s common stock were
registered under the Securities Act of 1933, as amended, for issuance
upon the exercise of stock options granted under the Colleague Share
Ownership Plan 1999 (the “CSOP”) and the ASDA Sharesave Plan 2000
(“Sharesave Plan”).
• The CSOP grants have either a three- or six-year vesting period. The
CSOP options may be exercised during the two months immediately
following the vesting date.
• The Sharesave Plan grants options at 80% of the Company’s average
stock price for the three days preceding the grant date. The Sharesave
Plan options vest after three years and may generally be exercised
up to six months after the vesting date.
Notes to Consolidated Financial Statements
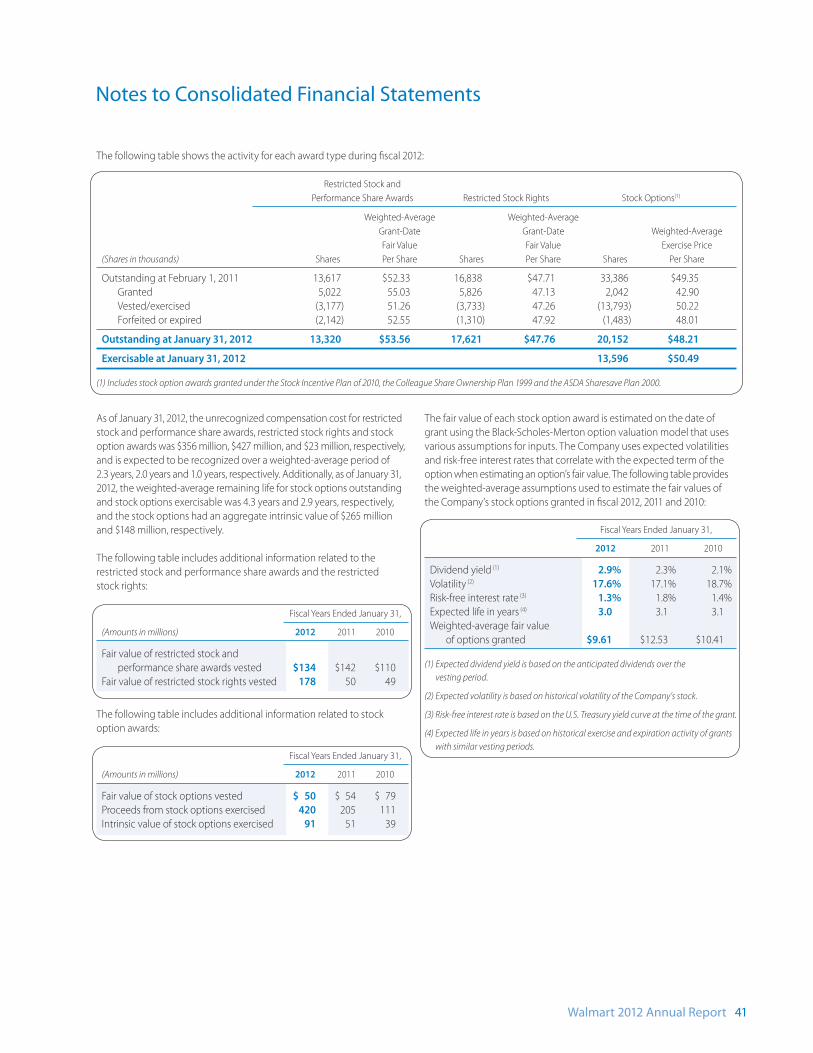
Walmart 2012 Annual Report 41
The following table shows the activity for each award type during fi scal 2012:
Restricted Stock and
Performance Share Awards Restricted Stock Rights Stock Options(1)
Weighted-Average Weighted-Average
Grant-Date Grant-Date Weighted-Average
Fair Value Fair Value Exercise Price
(Shares in thousands) Shares Per Share Shares Per Share Shares Per Share
Outstanding at February 1, 2011 13,617 $52.33 16,838 $47.71 33,386 $49.35
Granted 5,022 55.03 5,826 47.13 2,042 42.90
Vested/exercised (3,177) 51.26 (3,733) 47.26 (13,793) 50.22
Forfeited or expired (2,142) 52.55 (1,310) 47.92 (1,483) 48.01
Outstanding at January 31, 2012 13,320 $53.56 17,621 $47.76 20,152 $48.21
Exercisable at January 31, 2012 13,596 $50.49
(1) Includes stock option awards granted under the Stock Incentive Plan of 2010, the Colleague Share Ownership Plan 1999 and the ASDA Sharesave Plan 2000.
Notes to Consolidated Financial Statements
As of January 31, 2012, the unrecognized compensation cost for restricted
stock and performance share awards, restricted stock rights and stock
option awards was $356 million, $427 million, and $23 million, respectively,
and is expected to be recognized over a weighted-average period of
2.3 years, 2.0 years and 1.0 years, respectively. Additionally, as of January 31,
2012, the weighted-average remaining life for stock options outstanding
and stock options exercisable was 4.3 years and 2.9 years, respectively,
and the stock options had an aggregate intrinsic value of $265 million
and $148 million, respectively.
The following table includes additional information related to the
restricted stock and performance share awards and the restricted
stock rights:
Fiscal Years Ended January 31,
(Amounts in millions) 2012 2011 2010
Fair value of restricted stock and
performance share awards vested $134 $142 $110
Fair value of restricted stock rights vested 178 50 49
The following table includes additional information related to stock
option awards:
Fiscal Years Ended January 31,
(Amounts in millions) 2012 2011 2010
Fair value of stock options vested $ 50 $ 54 $ 79
Proceeds from stock options exercised 420 205 111
Intrinsic value of stock options exercised 91 51 39
The fair value of each stock option award is estimated on the date of
grant using the Black-Scholes-Merton option valuation model that uses
various assumptions for inputs. The Company uses expected volatilities
and risk-free interest rates that correlate with the expected term of the
option when estimating an option’s fair value. The following table provides
the weighted-average assumptions used to estimate the fair values of
the Company’s stock options granted in fi scal 2012, 2011 and 2010:
Fiscal Years Ended January 31,
2012 2011 2010
Dividend yield (1) 2.9% 2.3% 2.1%
Volatility (2) 17.6% 17.1% 18.7%
Risk-free interest rate (3) 1.3% 1.8% 1.4%
Expected life in years (4) 3.0 3.1 3.1
Weighted-average fair value
of options granted $9.61 $12.53 $10.41
(1) Expected dividend yield is based on the anticipated dividends over the
vesting period.
(2) Expected volatility is based on historical volatility of the Company’s stock.
(3) Risk-free interest rate is based on the U.S. Treasury yield curve at the time of the grant.
(4) Expected life in years is based on historical exercise and expiration activity of grants
with similar vesting periods.
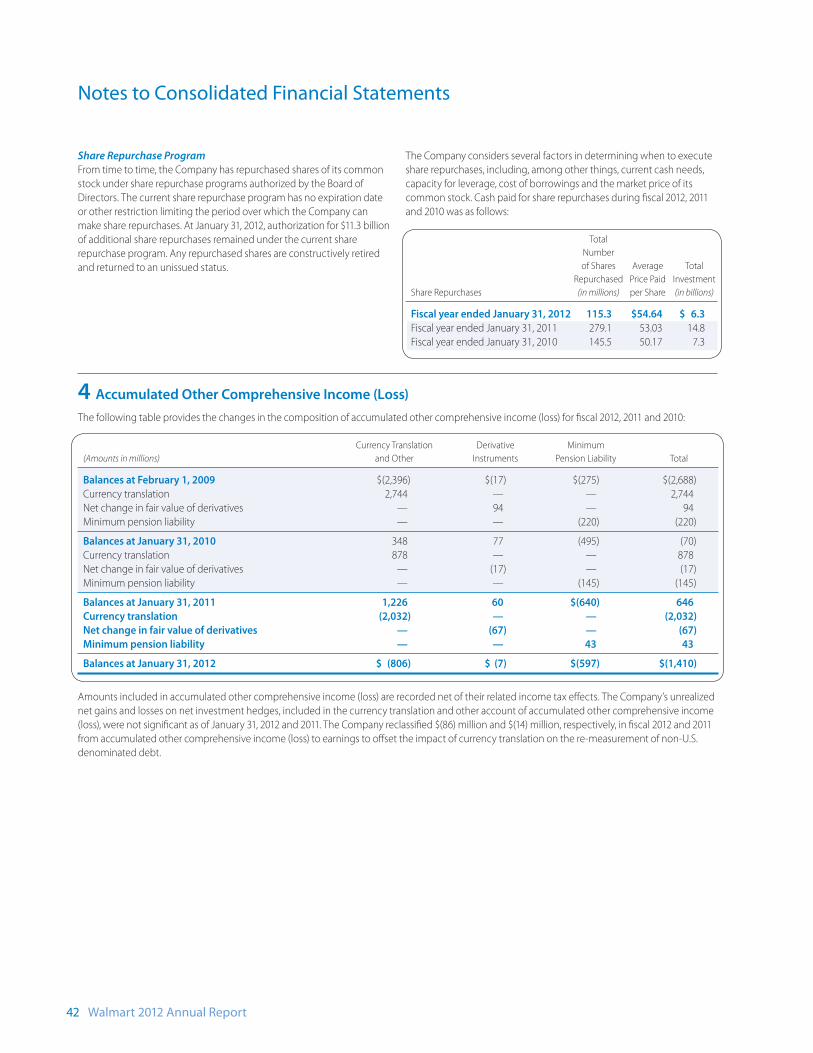
Share Repurchase Program
From time to time, the Company has repurchased shares of its common
stock under share repurchase programs authorized by the Board of
Directors. The current share repurchase program has no expiration date
or other restriction limiting the period over which the Company can
make share repurchases. At January 31, 2012, authorization for $11.3 billion
of additional share repurchases remained under the current share
repurchase program. Any repurchased shares are constructively retired
and returned to an unissued status.
The Company considers several factors in determining when to execute
share repurchases, including, among other things, current cash needs,
capacity for leverage, cost of borrowings and the market price of its
common stock. Cash paid for share repurchases during fi scal 2012, 2011
and 2010 was as follows:
Total
Number
of Shares Average Total
Repurchased Price Paid Investment
Share Repurchases (in millions) per Share (in billions)
Fiscal year ended January 31, 2012 115.3 $54.64 $ 6.3
Fiscal year ended January 31, 2011 279.1 53.03 14.8
Fiscal year ended January 31, 2010 145.5 50.17 7.3
42 Walmart 2012 Annual Report
Notes to Consolidated Financial Statements
4 Accumulated Other Comprehensive Income (Loss)
The following table provides the changes in the composition of accumulated other comprehensive income (loss) for fi scal 2012, 2011 and 2010:
Currency Translation Derivative Minimum
(Amounts in millions) and Other Instruments Pension Liability Total
Balances at February 1, 2009 $(2,396) $(17) $(275) $(2,688)
Currency translation 2,744 — — 2,744
Net change in fair value of derivatives — 94 — 94
Minimum pension liability — — (220) (220)
Balances at January 31, 2010 348 77 (495) (70)
Currency translation 878 — — 878
Net change in fair value of derivatives — (17) — (17)
Minimum pension liability — — (145) (145)
Balances at January 31, 2011 1,226 60 $(640) 646
Currency translation (2,032) — — (2,032)
Net change in fair value of derivatives — (67) — (67)
Minimum pension liability — — 43 43
Balances at January 31, 2012 $ (806) $ (7) $(597) $(1,410)
Amounts included in accumulated other comprehensive income (loss) are recorded net of their related income tax eff ects. The Company’s unrealized
net gains and losses on net investment hedges, included in the currency translation and other account of accumulated other comprehensive income
(loss), were not signifi cant as of January 31, 2012 and 2011. The Company reclassifi ed $(86) million and $(14) million, respectively, in fi scal 2012 and 2011
from accumulated other comprehensive income (loss) to earnings to off set the impact of currency translation on the re-measurement of non-U.S.
denominated debt.
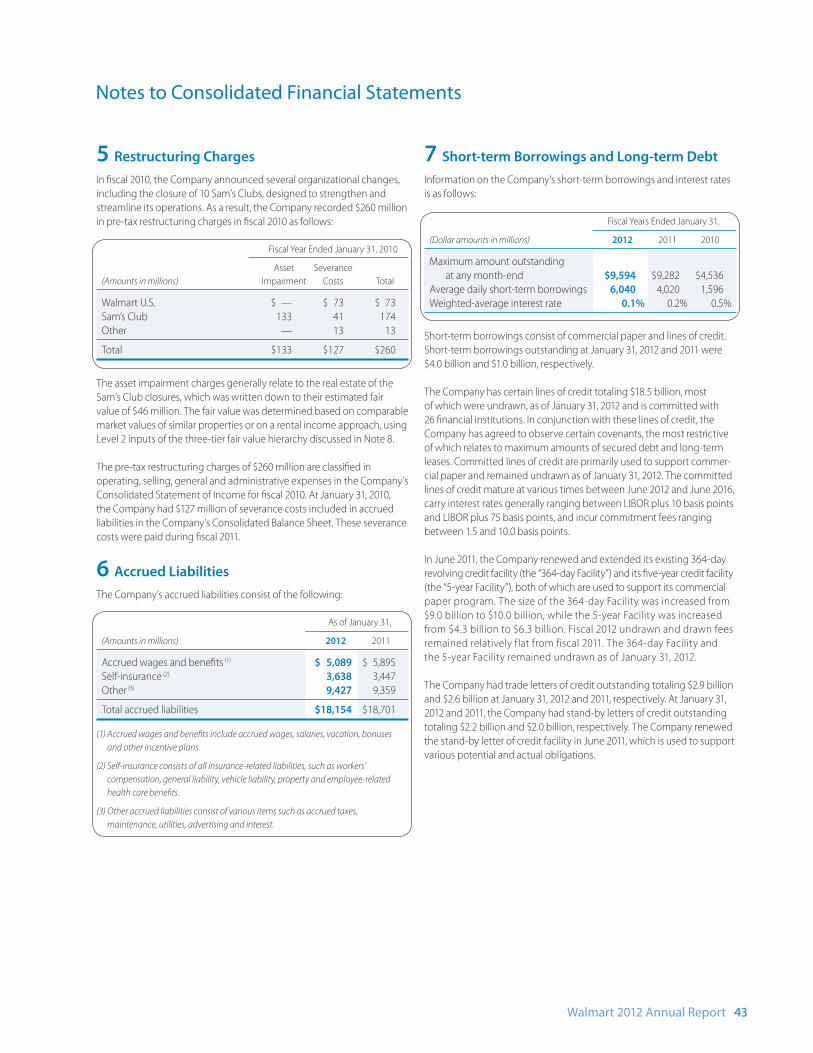
Walmart 2012 Annual Report 43
5 Restructuring Charges
In fi scal 2010, the Company announced several organizational changes,
including the closure of 10 Sam’s Clubs, designed to strengthen and
streamline its operations. As a result, the Company recorded $260 million
in pre-tax restructuring charges in fi scal 2010 as follows:
Fiscal Year Ended January 31, 2010
Asset Severance
(Amounts in millions) Impairment Costs Total
Walmart U.S. $ — $ 73 $ 73
Sam’s Club 133 41 174
Other — 13 13
Total $133 $127 $260
The asset impairment charges generally relate to the real estate of the
Sam’s Club closures, which was written down to their estimated fair
value of $46 million. The fair value was determined based on comparable
market values of similar properties or on a rental income approach, using
Level 2 inputs of the three-tier fair value hierarchy discussed in Note 8.
The pre-tax restructuring charges of $260 million are classifi ed in
operating, selling, general and administrative expenses in the Company’s
Consolidated Statement of Income for fi scal 2010. At January 31, 2010,
the Company had $127 million of severance costs included in accrued
liabilities in the Company’s Consolidated Balance Sheet. These severance
costs were paid during fi scal 2011.
6 Accrued Liabilities
The Company’s accrued liabilities consist of the following:
As of January 31,
(Amounts in millions) 2012 2011
Accrued wages and benefi ts (1) $ 5,089 $ 5,895
Self-insurance (2) 3,638 3,447
Other (3) 9,427 9,359
Total accrued liabilities $18,154 $18,701
(1) Accrued wages and benefi ts include accrued wages, salaries, vacation, bonuses
and other incentive plans.
(2) Self-insurance consists of all insurance-related liabilities, such as workers’
compensation, general liability, vehicle liability, property and employee-related
health care benefi ts.
(3) Other accrued liabilities consist of various items such as accrued taxes,
maintenance, utilities, advertising and interest.
7 Short-term Borrowings and Long-term Debt
Information on the Company’s short-term borrowings and interest rates
is as follows:
Fiscal Years Ended January 31,
(Dollar amounts in millions) 2012 2011 2010
Maximum amount outstanding
at any month-end $9,594 $9,282 $4,536
Average daily short-term borrowings 6,040 4,020 1,596
Weighted-average interest rate 0.1% 0.2% 0.5%
Short-term borrowings consist of commercial paper and lines of credit.
Short-term borrowings outstanding at January 31, 2012 and 2011 were
$4.0 billion and $1.0 billion, respectively.
The Company has certain lines of credit totaling $18.5 billion, most
of which were undrawn, as of January 31, 2012 and is committed with
26 fi nancial institutions. In conjunction with these lines of credit, the
Company has agreed to observe certain covenants, the most restrictive
of which relates to maximum amounts of secured debt and long-term
leases. Committed lines of credit are primarily used to support commer-
cial paper and remained undrawn as of January 31, 2012. The committed
lines of credit mature at various times between June 2012 and June 2016,
carry interest rates generally ranging between LIBOR plus 10 basis points
and LIBOR plus 75 basis points, and incur commitment fees ranging
between 1.5 and 10.0 basis points.
In June 2011, the Company renewed and extended its existing 364-day
revolving credit facility (the “364-day Facility”) and its fi ve-year credit facility
(the “5-year Facility”), both of which are used to support its commercial
paper program. The size of the 364-day Facility was increased from
$9.0 billion to $10.0 billion, while the 5-year Facility was increased
from $4.3 billion to $6.3 billion. Fiscal 2012 undrawn and drawn fees
remained relatively flat from fiscal 2011. The 364-day Facility and
the 5-year Facility remained undrawn as of January 31, 2012.
The Company had trade letters of credit outstanding totaling $2.9 billion
and $2.6 billion at January 31, 2012 and 2011, respectively. At January 31,
2012 and 2011, the Company had stand-by letters of credit outstanding
totaling $2.2 billion and $2.0 billion, respectively. The Company renewed
the stand-by letter of credit facility in June 2011, which is used to support
various potential and actual obligations.
Notes to Consolidated Financial Statements
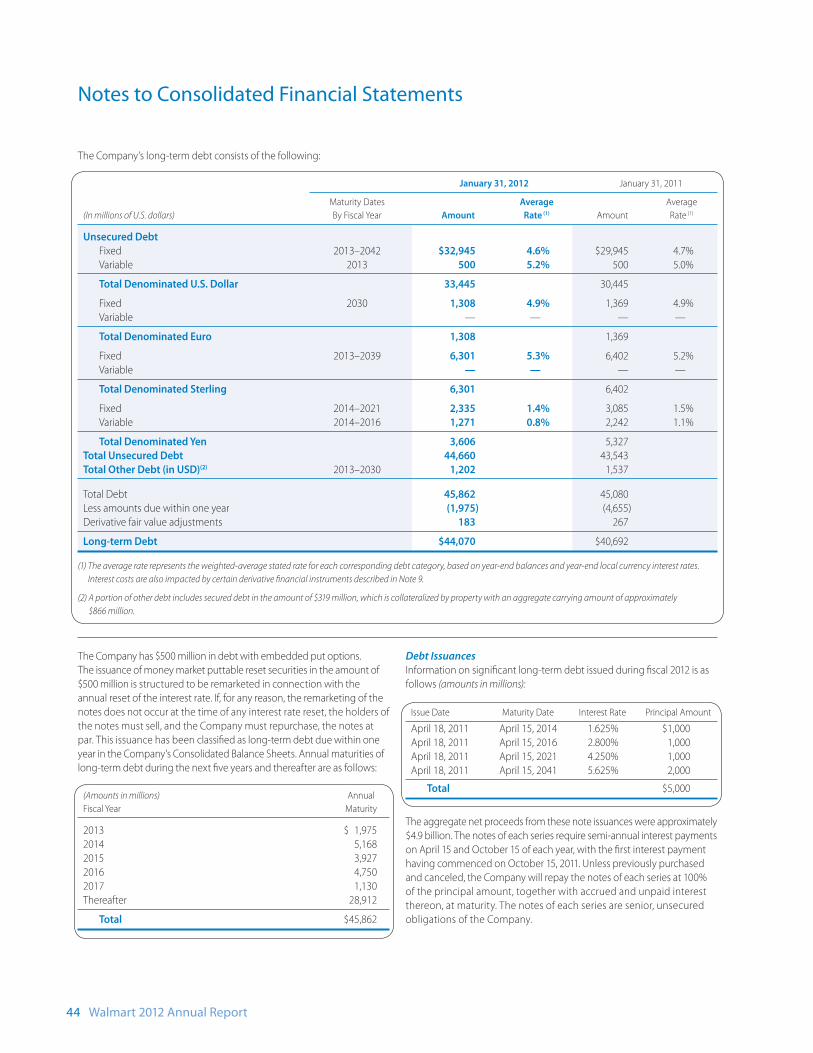
44 Walmart 2012 Annual Report
The Company’s long-term debt consists of the following:
January 31, 2012 January 31, 2011
Maturity Dates Average Average
(In millions of U.S. dollars) By Fiscal Year Amount Rate (1) Amount Rate (1)
Unsecured Debt
Fixed 2013–2042 $32,945 4.6% $29,945 4.7%
Variable 2013 500 5.2% 500 5.0%
Total Denominated U.S. Dollar 33,445 30,445
Fixed 2030 1,308 4.9% 1,369 4.9%
Variable — — — —
Total Denominated Euro 1,308 1,369
Fixed 2013–2039 6,301 5.3% 6,402 5.2%
Variable — — — —
Total Denominated Sterling 6,301 6,402
Fixed 2014–2021 2,335 1.4% 3,085 1.5%
Variable 2014–2016 1,271 0.8% 2,242 1.1%
Total Denominated Yen 3,606 5,327
Total Unsecured Debt 44,660 43,543
Total Other Debt (in USD)(2) 2013–2030 1,202 1,537
Total Debt 45,862 45,080
Less amounts due within one year (1,975) (4,655)
Derivative fair value adjustments 183 267
Long-term Debt $44,070 $40,692
(1) The average rate represents the weighted-average stated rate for each corresponding debt category, based on year-end balances and year-end local currency interest rates.
Interest costs are also impacted by certain derivative fi nancial instruments described in Note 9.
(2) A portion of other debt includes secured debt in the amount of $319 million, which is collateralized by property with an aggregate carrying amount of approximately
$866 million.
Notes to Consolidated Financial Statements
The Company has $500 million in debt with embedded put options.
The issuance of money market puttable reset securities in the amount of
$500 million is structured to be remarketed in connection with the
annual reset of the interest rate. If, for any reason, the remarketing of the
notes does not occur at the time of any interest rate reset, the holders of
the notes must sell, and the Company must repurchase, the notes at
par. This issuance has been classifi ed as long-term debt due within one
year in the Company’s Consolidated Balance Sheets. Annual maturities of
long-term debt during the next fi ve years and thereafter are as follows:
(Amounts in millions) Annual
Fiscal Year Maturity
2013 $ 1,975
2014 5,168
2015 3,927
2016 4,750
2017 1,130
Thereafter 28,912
Total $45,862
Debt Issuances
Information on signifi cant long-term debt issued during fi scal 2012 is as
follows (amounts in millions):
Issue Date Maturity Date Interest Rate Principal Amount
April 18, 2011 April 15, 2014 1.625% $1,000
April 18, 2011 April 15, 2016 2.800% 1,000
April 18, 2011 April 15, 2021 4.250% 1,000
April 18, 2011 April 15, 2041 5.625% 2,000
Total $5,000
The aggregate net proceeds from these note issuances were approximately
$4.9 billion. The notes of each series require semi-annual interest payments
on April 15 and October 15 of each year, with the fi rst interest payment
having commenced on October 15, 2011. Unless previously purchased
and canceled, the Company will repay the notes of each series at 100%
of the principal amount, together with accrued and unpaid interest
thereon, at maturity. The notes of each series are senior, unsecured
obligations of the Company.
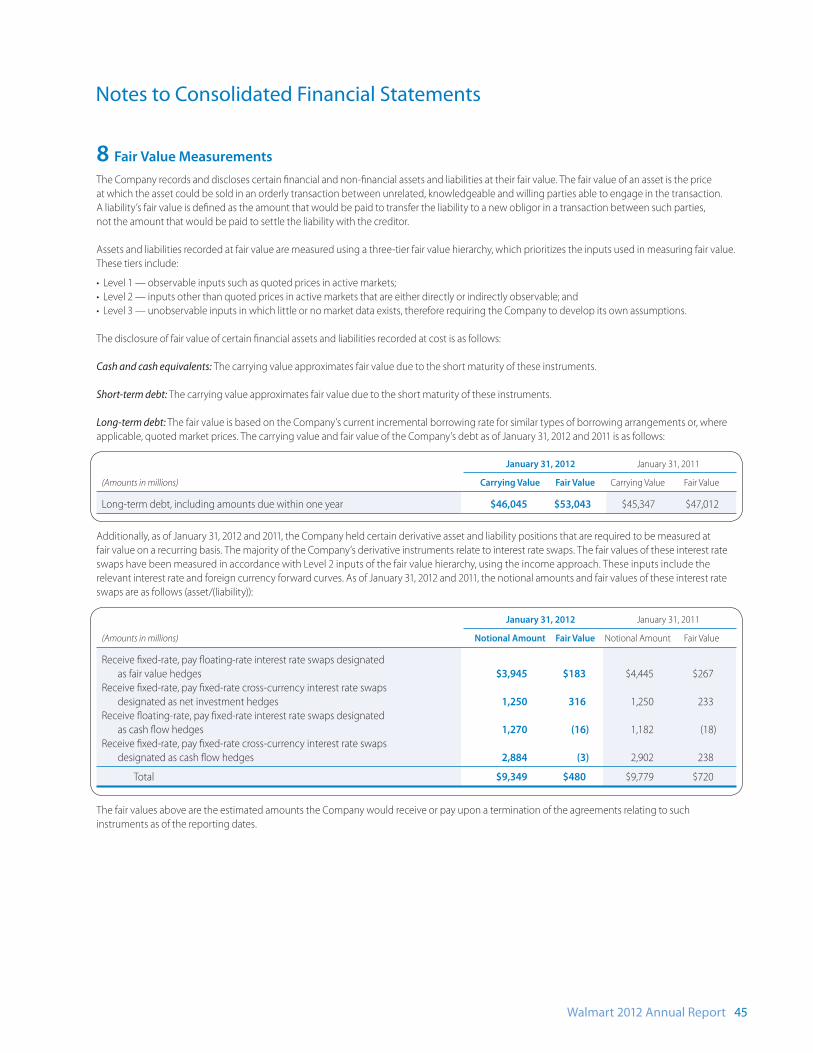
Walmart 2012 Annual Report 45
8 Fair Value Measurements
The Company records and discloses certain fi nancial and non-fi nancial assets and liabilities at their fair value. The fair value of an asset is the price
at which the asset could be sold in an orderly transaction between unrelated, knowledgeable and willing parties able to engage in the transaction.
A liability’s fair value is defi ned as the amount that would be paid to transfer the liability to a new obligor in a transaction between such parties,
not the amount that would be paid to settle the liability with the creditor.
Assets and liabilities recorded at fair value are measured using a three-tier fair value hierarchy, which prioritizes the inputs used in measuring fair value.
These tiers include:
• Level 1 — observable inputs such as quoted prices in active markets;
• Level 2 — inputs other than quoted prices in active markets that are either directly or indirectly observable; and
• Level 3 — unobservable inputs in which little or no market data exists, therefore requiring the Company to develop its own assumptions.
The disclosure of fair value of certain fi nancial assets and liabilities recorded at cost is as follows:
Cash and cash equivalents: The carrying value approximates fair value due to the short maturity of these instruments.
Short-term debt: The carrying value approximates fair value due to the short maturity of these instruments.
Long-term debt: The fair value is based on the Company’s current incremental borrowing rate for similar types of borrowing arrangements or, where
applicable, quoted market prices. The carrying value and fair value of the Company’s debt as of January 31, 2012 and 2011 is as follows:
January 31, 2012 January 31, 2011
(Amounts in millions) Carrying Value Fair Value Carrying Value Fair Value
Long-term debt, including amounts due within one year $46,045 $53,043 $45,347 $47,012
Additionally, as of January 31, 2012 and 2011, the Company held certain derivative asset and liability positions that are required to be measured at
fair value on a recurring basis. The majority of the Company’s derivative instruments relate to interest rate swaps. The fair values of these interest rate
swaps have been measured in accordance with Level 2 inputs of the fair value hierarchy, using the income approach. These inputs include the
relevant interest rate and foreign currency forward curves. As of January 31, 2012 and 2011, the notional amounts and fair values of these interest rate
swaps are as follows (asset/(liability)):
January 31, 2012 January 31, 2011
(Amounts in millions) Notional Amount Fair Value Notional Amount Fair Value
Receive fi xed-rate, pay fl oating-rate interest rate swaps designated
as fair value hedges $3,945 $183 $4,445 $267
Receive fi xed-rate, pay fi xed-rate cross-currency interest rate swaps
designated as net investment hedges 1,250 316 1,250 233
Receive fl oating-rate, pay fi xed-rate interest rate swaps designated
as cash fl ow hedges 1,270 (16) 1,182 (18)
Receive fi xed-rate, pay fi xed-rate cross-currency interest rate swaps
designated as cash fl ow hedges 2,884 (3) 2,902 238
Total $9,349 $480 $9,779 $720
The fair values above are the estimated amounts the Company would receive or pay upon a termination of the agreements relating to such
instruments as of the reporting dates.
Notes to Consolidated Financial Statements
46 Walmart 2012 Annual Report
9 Derivative Financial Instruments
The Company uses derivative fi nancial instruments for hedging and
non-trading purposes to manage its exposure to changes in interest and
currency exchange rates, as well as to maintain an appropriate mix of
fi xed- and fl oating-rate debt. Use of derivative fi nancial instruments in
hedging programs subjects the Company to certain risks, such as market
and credit risks. Market risk represents the possibility that the value of the
derivative instrument will change. In a hedging relationship, the change
in the value of the derivative is off set to a great extent by the change in
the value of the underlying hedged item. Credit risk related to derivatives
represents the possibility that the counterparty will not fulfi ll the terms
of the contract. The notional, or contractual amount of the Company’s
derivative fi nancial instruments, is used to measure interest to be paid or
received and does not represent the Company’s exposure due to credit
risk. Credit risk is monitored through established approval procedures,
including setting concentration limits by counterparty, reviewing credit
ratings and requiring collateral (generally cash) from the counterparty
when appropriate. The Company’s transactions are with counterparties
rated “A-” or better by nationally recognized credit rating agencies. In
connection with various derivative agreements with counterparties, the
Company held cash collateral from these counterparties of $387 million
and $344 million at January 31, 2012 and 2011, respectively. The Company’s
policy is to record cash collateral exclusive of any derivative asset, and
any collateral holdings are refl ected in the Company’s accrued liabilities
as amounts due to the counterparties. Furthermore, as part of the master
netting arrangements with these counterparties, the Company is also
required to post collateral if the derivative liability position exceeds
$150 million. The Company has no outstanding collateral postings; and
in the event of providing cash collateral, the Company would record
the posting as a receivable exclusive of any derivative liability.
When the Company uses derivative fi nancial instruments for the purpose
of hedging its exposure to interest and currency exchange rates, the
contract terms of a hedged instrument closely mirror those of the
hedged item, providing a high degree of risk reduction and correlation.
Contracts that are eff ective at meeting the risk reduction and correlation
criteria are recorded using hedge accounting. If a derivative instrument
is a hedge, depending on the nature of the hedge, changes in the fair
value of the instrument are either off set against the change in fair value
of the hedged assets, liabilities or fi rm commitments through earnings
or recognized in accumulated other comprehensive income (loss) until
the hedged item is recognized in earnings. The ineff ective portion of an
instrument’s change in fair value is immediately recognized in earnings
during the period. Instruments that do not meet the criteria for hedge
accounting, or contracts for which the Company has not elected hedge
accounting, are valued at fair value with unrealized gains or losses
reported in earnings during the period of change.
Fair Value Instruments
The Company is party to receive fi xed-rate, pay fl oating-rate interest rate
swaps to hedge the fair value of fi xed-rate debt. The notional amounts
are used to measure interest to be paid or received and do not represent
the exposure due to credit loss. The Company’s interest rate swaps that
receive fi xed-interest rate payments and pay fl oating-interest rate pay-
ments are designated as fair value hedges. As the specifi c terms and
notional amounts of the derivative instruments match those of the
instruments being hedged, the derivative instruments were assumed to
be perfectly eff ective hedges and all changes in fair value of the hedges
were recorded in long-term debt and accumulated other comprehensive
income (loss) in the Company’s Consolidated Balance Sheets with no net
impact in the Company’s Consolidated Statements of Income. These fair
value instruments will mature on various dates ranging from April 2012
to May 2014.
Net Investment Instruments
The Company is party to cross-currency interest rate swaps that hedge
its net investments, as well as its currency exchange rate fl uctuation
exposure associated with the forecasted payments of principal and
interest of non-U.S. denominated debt. The agreements are contracts to
exchange fi xed-rate payments in one currency for fi xed-rate payments
in another currency. All changes in the fair value of these instruments are
recorded in accumulated other comprehensive income (loss), off setting
the currency translation adjustment that is also recorded in accumulated
other comprehensive income (loss). These instruments will mature on
dates ranging from October 2023 to February 2030.
The Company has outstanding debt of approximately £3.0 billion as of
January 31, 2012 and 2011 that is designated as a hedge of the Company’s
net investment in the United Kingdom. The Company also has outstanding
debt of approximately ¥275.0 billion and ¥437.0 billion as of January 31,
2012 and 2011, respectively, that is designated as a hedge of the Company’s
net investment in Japan. Any translation of non-U.S.-denominated debt
is recorded in accumulated other comprehensive income (loss), off setting
the currency translation adjustment that is also recorded in accumulated
other comprehensive income (loss). These instruments will mature on
dates ranging from January 2013 to January 2039.
Cash Flow Instruments
The Company is party to receive fl oating-rate, pay fi xed-rate interest rate
swaps to hedge the interest rate risk of certain non-U.S.-denominated
debt. The swaps are designated as cash fl ow hedges of interest rate risk.
Amounts reported in accumulated other comprehensive income (loss)
related to derivatives are reclassifi ed from accumulated other comprehensive
income (loss) to earnings as interest payments are made on the Company’s
variable-rate debt, converting the fl oating-rate interest expense into
fi xed-rate interest expense. These cash fl ow instruments will mature on
dates ranging from August 2013 to July 2015.
The Company is also party to receive fi xed-rate, pay fi xed-rate cross-currency
interest rate swaps to hedge the currency exposure associated with the
forecasted payments of principal and interest of non-U.S.-denominated
debt. The swaps are designated as cash fl ow hedges of the currency risk
related to payments on the non-U.S.-denominated debt. The eff ective
portion of changes in the fair value of derivatives designated as cash fl ow
hedges of foreign exchange risk is recorded in other comprehensive
income (loss) and is subsequently reclassifi ed into earnings in the period
that the hedged forecasted transaction aff ects earnings. The hedged
items are recognized foreign-currency denominated liabilities that are
remeasured at spot exchange rates each period, and the assessment of
eff ectiveness (and measurement of any ineff ectiveness) is based on total
changes in the derivative’s cash fl ows. As a result, the amount reclassifi ed
into earnings each period includes an amount that off sets the related
transaction gain or loss arising from that remeasurement and the adjustment
to earnings for the period’s allocable portion of the initial spot-forward
difference associated with the hedging instrument. These cash flow
instruments will mature on dates ranging from September 2029 to
March 2034. Any ineffectiveness with these instruments has been
and is expected to be immaterial.
Notes to Consolidated Financial Statements
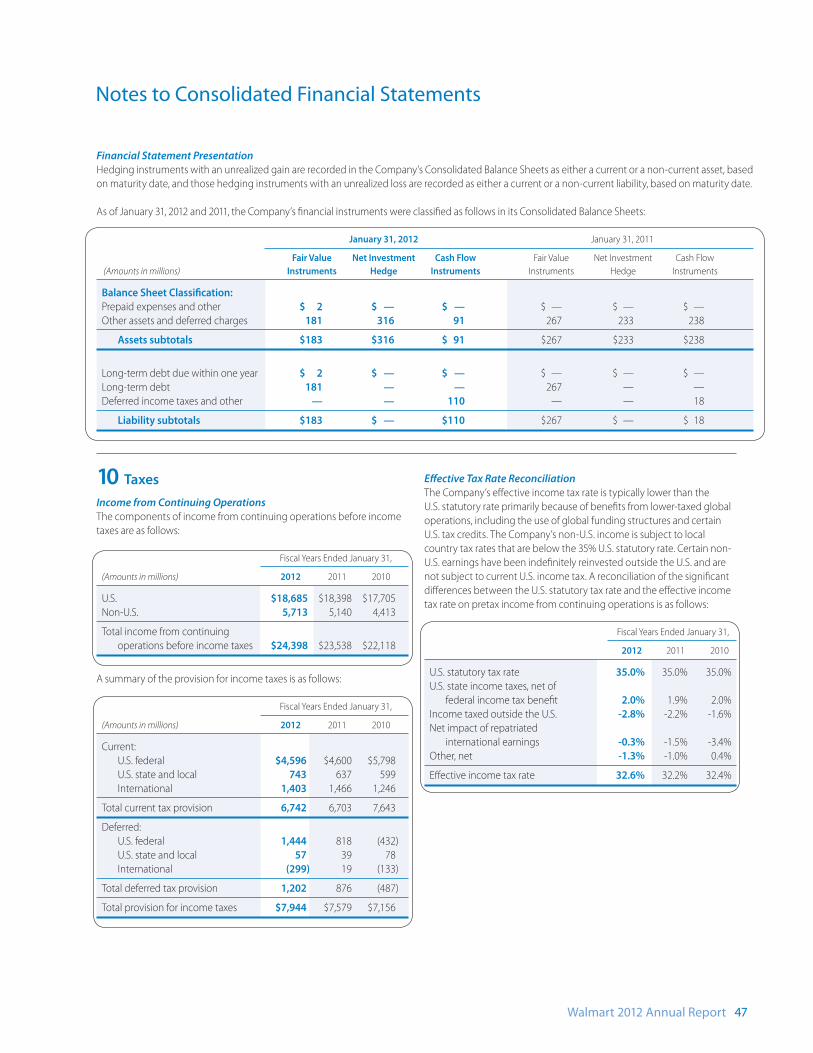
Walmart 2012 Annual Report 47
Financial Statement Presentation
Hedging instruments with an unrealized gain are recorded in the Company’s Consolidated Balance Sheets as either a current or a non-current asset, based
on maturity date, and those hedging instruments with an unrealized loss are recorded as either a current or a non-current liability, based on maturity date.
As of January 31, 2012 and 2011, the Company’s fi nancial instruments were classifi ed as follows in its Consolidated Balance Sheets:
January 31, 2012 January 31, 2011
Fair Value Net Investment Cash Flow Fair Value Net Investment Cash Flow
(Amounts in millions) Instruments Hedge Instruments Instruments Hedge Instruments
Balance Sheet Classifi cation:
Prepaid expenses and other $ 2 $ — $ — $ — $ — $ —
Other assets and deferred charges 181 316 91 267 233 238
Assets subtotals $183 $316 $ 91 $267 $233 $238
Long-term debt due within one year $ 2 $ — $ — $ — $ — $ —
Long-term debt 181 — — 267 — —
Deferred income taxes and other — — 110 — — 18
Liability subtotals $183 $ — $110 $267 $ — $ 18
Notes to Consolidated Financial Statements
10 Taxes
Income from Continuing Operations
The components of income from continuing operations before income
taxes are as follows:
Fiscal Years Ended January 31,
(Amounts in millions) 2012 2011 2010
U.S. $18,685 $18,398 $17,705
Non-U.S. 5,713 5,140 4,413
Total income from continuing
operations before income taxes $24,398 $23,538 $22,118
A summary of the provision for income taxes is as follows:
Fiscal Years Ended January 31,
(Amounts in millions) 2012 2011 2010
Current:
U.S. federal $4,596 $4,600 $5,798
U.S. state and local 743 637 599
International 1,403 1,466 1,246
Total current tax provision 6,742 6,703 7,643
Deferred:
U.S. federal 1,444 818 (432)
U.S. state and local 57 39 78
International (299) 19 (133)
Total deferred tax provision 1,202 876 (487)
Total provision for income taxes $7,944 $7,579 $7,156
Eff ective Tax Rate Reconciliation
The Company’s eff ective income tax rate is typically lower than the
U.S. statutory rate primarily because of benefi ts from lower-taxed global
operations, including the use of global funding structures and certain
U.S. tax credits. The Company’s non-U.S. income is subject to local
country tax rates that are below the 35% U.S. statutory rate. Certain non-
U.S. earnings have been indefi nitely reinvested outside the U.S. and are
not subject to current U.S. income tax. A reconciliation of the signifi cant
diff erences between the U.S. statutory tax rate and the eff ective income
tax rate on pretax income from continuing operations is as follows:
Fiscal Years Ended January 31,
2012 2011 2010
U.S. statutory tax rate 35.0% 35.0% 35.0%
U.S. state income taxes, net of
federal income tax benefi t 2.0% 1.9% 2.0%
Income taxed outside the U.S. -2.8% -2.2% -1.6%
Net impact of repatriated
international earnings -0.3% -1.5% -3.4%
Other, net -1.3% -1.0% 0.4%
Eff ective income tax rate 32.6% 32.2% 32.4%
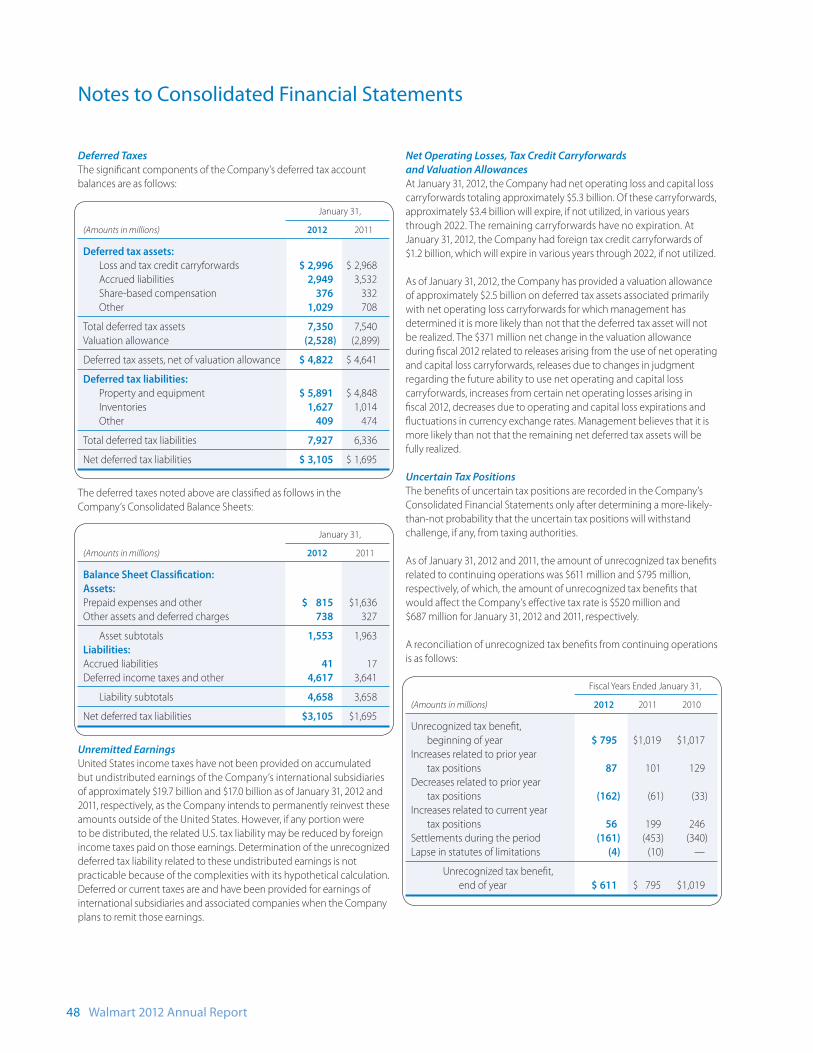
48 Walmart 2012 Annual Report
Deferred Taxes
The signifi cant components of the Company’s deferred tax account
balances are as follows:
January 31,
(Amounts in millions) 2012 2011
Deferred tax assets:
Loss and tax credit carryforwards $ 2,996 $ 2,968
Accrued liabilities 2,949 3,532
Share-based compensation 376 332
Other 1,029 708
Total deferred tax assets 7,350 7,540
Valuation allowance (2,528) (2,899)
Deferred tax assets, net of valuation allowance $ 4,822 $ 4,641
Deferred tax liabilities:
Property and equipment $ 5,891 $ 4,848
Inventories 1,627 1,014
Other 409 474
Total deferred tax liabilities 7,927 6,336
Net deferred tax liabilities $ 3,105 $ 1,695
The deferred taxes noted above are classifi ed as follows in the
Company’s Consolidated Balance Sheets:
January 31,
(Amounts in millions) 2012 2011
Balance Sheet Classifi cation:
Assets:
Prepaid expenses and other $ 815 $1,636
Other assets and deferred charges 738 327
Asset subtotals 1,553 1,963
Liabilities:
Accrued liabilities 41 17
Deferred income taxes and other 4,617 3,641
Liability subtotals 4,658 3,658
Net deferred tax liabilities $3,105 $1,695
Unremitted Earnings
United States income taxes have not been provided on accumulated
but undistributed earnings of the Company’s international subsidiaries
of approximately $19.7 billion and $17.0 billion as of January 31, 2012 and
2011, respectively, as the Company intends to permanently reinvest these
amounts outside of the United States. However, if any portion were
to be distributed, the related U.S. tax liability may be reduced by foreign
income taxes paid on those earnings. Determination of the unrecognized
deferred tax liability related to these undistributed earnings is not
practicable because of the complexities with its hypothetical calculation.
Deferred or current taxes are and have been provided for earnings of
international subsidiaries and associated companies when the Company
plans to remit those earnings.
Net Operating Losses, Tax Credit Carryforwards
and Valuation Allowances
At January 31, 2012, the Company had net operating loss and capital loss
carryforwards totaling approximately $5.3 billion. Of these carryforwards,
approximately $3.4 billion will expire, if not utilized, in various years
through 2022. The remaining carryforwards have no expiration. At
January 31, 2012, the Company had foreign tax credit carryforwards of
$1.2 billion, which will expire in various years through 2022, if not utilized.
As of January 31, 2012, the Company has provided a valuation allowance
of approximately $2.5 billion on deferred tax assets associated primarily
with net operating loss carryforwards for which management has
determined it is more likely than not that the deferred tax asset will not
be realized. The $371 million net change in the valuation allowance
during fi scal 2012 related to releases arising from the use of net operating
and capital loss carryforwards, releases due to changes in judgment
regarding the future ability to use net operating and capital loss
carryforwards, increases from certain net operating losses arising in
fi scal 2012, decreases due to operating and capital loss expirations and
fl uctuations in currency exchange rates. Management believes that it is
more likely than not that the remaining net deferred tax assets will be
fully realized.
Uncertain Tax Positions
The benefi ts of uncertain tax positions are recorded in the Company’s
Consolidated Financial Statements only after determining a more-likely-
than-not probability that the uncertain tax positions will withstand
challenge, if any, from taxing authorities.
As of January 31, 2012 and 2011, the amount of unrecognized tax benefi ts
related to continuing operations was $611 million and $795 million,
respectively, of which, the amount of unrecognized tax benefi ts that
would aff ect the Company’s eff ective tax rate is $520 million and
$687 million for January 31, 2012 and 2011, respectively.
A reconciliation of unrecognized tax benefi ts from continuing operations
is as follows:
Fiscal Years Ended January 31,
(Amounts in millions) 2012 2011 2010
Unrecognized tax benefi t,
beginning of year $ 795 $1,019 $1,017
Increases related to prior year
tax positions 87 101 129
Decreases related to prior year
tax positions (162) (61) (33)
Increases related to current year
tax positions 56 199 246
Settlements during the period (161) (453) (340)
Lapse in statutes of limitations (4) (10) —
Unrecognized tax benefi t,
end of year $ 611 $ 795 $1,019
Notes to Consolidated Financial Statements
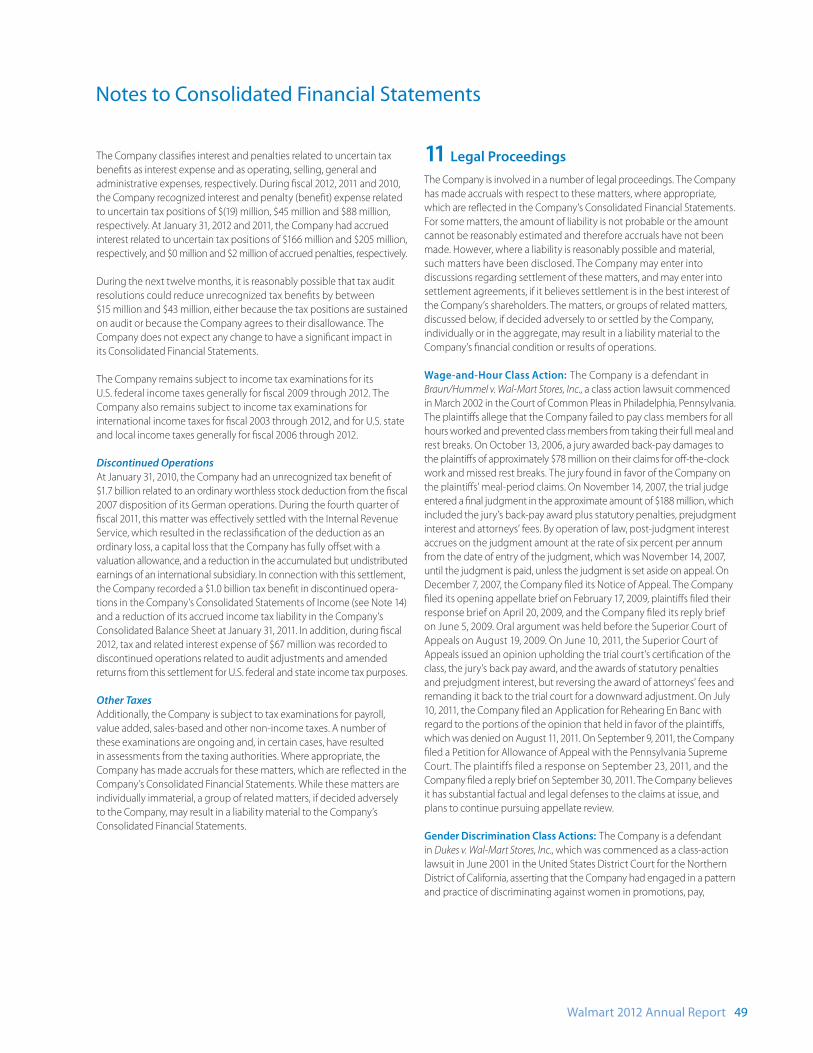
Walmart 2012 Annual Report 49
The Company classifi es interest and penalties related to uncertain tax
benefi ts as interest expense and as operating, selling, general and
administrative expenses, respectively. During fi scal 2012, 2011 and 2010,
the Company recognized interest and penalty (benefi t) expense related
to uncertain tax positions of $(19) million, $45 million and $88 million,
respectively. At January 31, 2012 and 2011, the Company had accrued
interest related to uncertain tax positions of $166 million and $205 million,
respectively, and $0 million and $2 million of accrued penalties, respectively.
During the next twelve months, it is reasonably possible that tax audit
resolutions could reduce unrecognized tax benefi ts by between
$15 million and $43 million, either because the tax positions are sustained
on audit or because the Company agrees to their disallowance. The
Company does not expect any change to have a signifi cant impact in
its Consolidated Financial Statements.
The Company remains subject to income tax examinations for its
U.S. federal income taxes generally for fi scal 2009 through 2012. The
Company also remains subject to income tax examinations for
international income taxes for fi scal 2003 through 2012, and for U.S. state
and local income taxes generally for fi scal 2006 through 2012.
Discontinued Operations
At January 31, 2010, the Company had an unrecognized tax benefi t of
$1.7 billion related to an ordinary worthless stock deduction from the fi scal
2007 disposition of its German operations. During the fourth quarter of
fi scal 2011, this matter was eff ectively settled with the Internal Revenue
Service, which resulted in the reclassifi cation of the deduction as an
ordinary loss, a capital loss that the Company has fully off set with a
valuation allowance, and a reduction in the accumulated but undistributed
earnings of an international subsidiary. In connection with this settlement,
the Company recorded a $1.0 billion tax benefi t in discontinued opera-
tions in the Company’s Consolidated Statements of Income (see Note 14)
and a reduction of its accrued income tax liability in the Company’s
Consolidated Balance Sheet at January 31, 2011. In addition, during fi scal
2012, tax and related interest expense of $67 million was recorded to
discontinued operations related to audit adjustments and amended
returns from this settlement for U.S. federal and state income tax purposes.
Other Taxes
Additionally, the Company is subject to tax examinations for payroll,
value added, sales-based and other non-income taxes. A number of
these examinations are ongoing and, in certain cases, have resulted
in assessments from the taxing authorities. Where appropriate, the
Company has made accruals for these matters, which are refl ected in the
Company’s Consolidated Financial Statements. While these matters are
individually immaterial, a group of related matters, if decided adversely
to the Company, may result in a liability material to the Company’s
Consolidated Financial Statements.
11 Legal Proceedings
The Company is involved in a number of legal proceedings. The Company
has made accruals with respect to these matters, where appropriate,
which are refl ected in the Company’s Consolidated Financial Statements.
For some matters, the amount of liability is not probable or the amount
cannot be reasonably estimated and therefore accruals have not been
made. However, where a liability is reasonably possible and material,
such matters have been disclosed. The Company may enter into
discussions regarding settlement of these matters, and may enter into
settlement agreements, if it believes settlement is in the best interest of
the Company’s shareholders. The matters, or groups of related matters,
discussed below, if decided adversely to or settled by the Company,
individually or in the aggregate, may result in a liability material to the
Company’s fi nancial condition or results of operations.
Wage-and-Hour Class Action: The Company is a defendant in
Braun/Hummel v. Wal-Mart Stores, Inc., a class action lawsuit commenced
in March 2002 in the Court of Common Pleas in Philadelphia, Pennsylvania.
The plaintiff s allege that the Company failed to pay class members for all
hours worked and prevented class members from taking their full meal and
rest breaks. On October 13, 2006, a jury awarded back-pay damages to
the plaintiff s of approximately $78 million on their claims for off -the-clock
work and missed rest breaks. The jury found in favor of the Company on
the plaintiff s’ meal-period claims. On November 14, 2007, the trial judge
entered a fi nal judgment in the approximate amount of $188 million, which
included the jury’s back-pay award plus statutory penalties, prejudgment
interest and attorneys’ fees. By operation of law, post-judgment interest
accrues on the judgment amount at the rate of six percent per annum
from the date of entry of the judgment, which was November 14, 2007,
until the judgment is paid, unless the judgment is set aside on appeal. On
December 7, 2007, the Company fi led its Notice of Appeal. The Company
fi led its opening appellate brief on February 17, 2009, plaintiff s fi led their
response brief on April 20, 2009, and the Company fi led its reply brief
on June 5, 2009. Oral argument was held before the Superior Court of
Appeals on August 19, 2009. On June 10, 2011, the Superior Court of
Appeals issued an opinion upholding the trial court’s certifi cation of the
class, the jury’s back pay award, and the awards of statutory penalties
and prejudgment interest, but reversing the award of attorneys’ fees and
remanding it back to the trial court for a downward adjustment. On July
10, 2011, the Company fi led an Application for Rehearing En Banc with
regard to the portions of the opinion that held in favor of the plaintiff s,
which was denied on August 11, 2011. On September 9, 2011, the Company
fi led a Petition for Allowance of Appeal with the Pennsylvania Supreme
Court. The plaintiffs filed a response on September 23, 2011, and the
Company fi led a reply brief on September 30, 2011. The Company believes
it has substantial factual and legal defenses to the claims at issue, and
plans to continue pursuing appellate review.
Gender Discrimination Class Actions: The Company is a defendant
in Dukes v. Wal-Mart Stores, Inc., which was commenced as a class-action
lawsuit in June 2001 in the United States District Court for the Northern
District of California, asserting that the Company had engaged in a pattern
and practice of discriminating against women in promotions, pay,
Notes to Consolidated Financial Statements
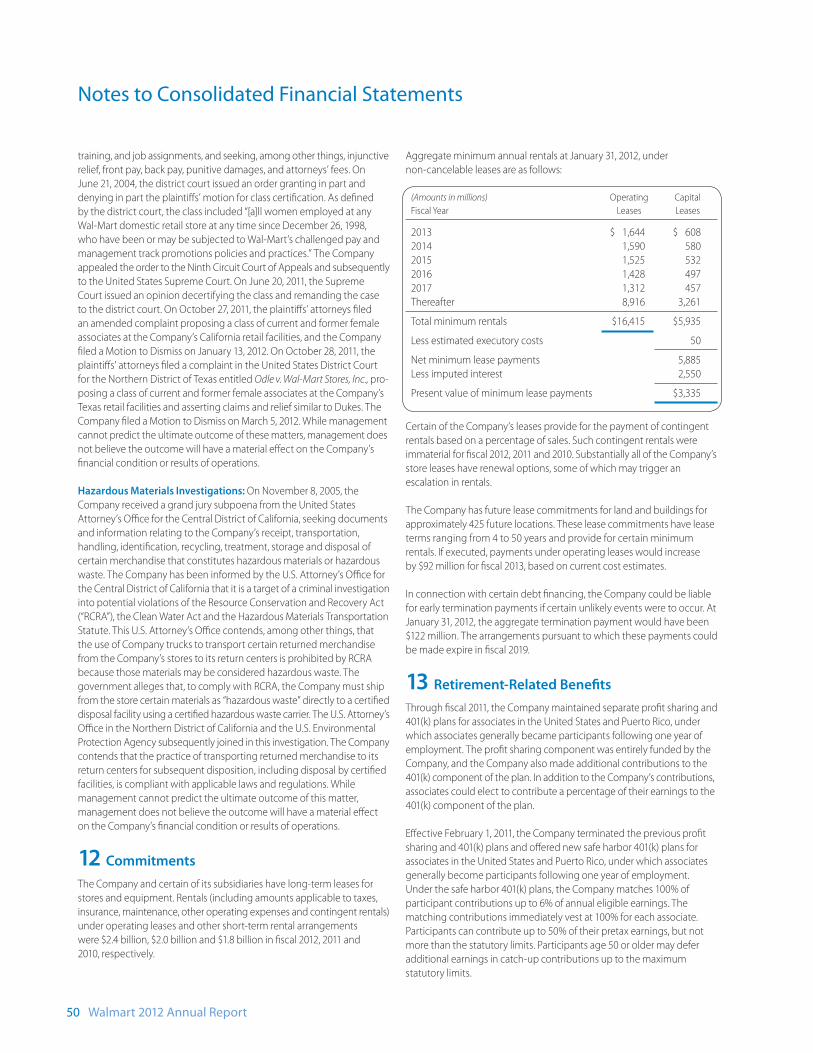
50 Walmart 2012 Annual Report
training, and job assignments, and seeking, among other things, injunctive
relief, front pay, back pay, punitive damages, and attorneys’ fees. On
June 21, 2004, the district court issued an order granting in part and
denying in part the plaintiff s’ motion for class certifi cation. As defi ned
by the district court, the class included “[a]ll women employed at any
Wal-Mart domestic retail store at any time since December 26, 1998,
who have been or may be subjected to Wal-Mart’s challenged pay and
management track promotions policies and practices.” The Company
appealed the order to the Ninth Circuit Court of Appeals and subsequently
to the United States Supreme Court. On June 20, 2011, the Supreme
Court issued an opinion decertifying the class and remanding the case
to the district court. On October 27, 2011, the plaintiff s’ attorneys fi led
an amended complaint proposing a class of current and former female
associates at the Company’s California retail facilities, and the Company
fi led a Motion to Dismiss on January 13, 2012. On October 28, 2011, the
plaintiff s’ attorneys fi led a complaint in the United States District Court
for the Northern District of Texas entitled Odle v. Wal-Mart Stores, Inc., pro-
posing a class of current and former female associates at the Company’s
Texas retail facilities and asserting claims and relief similar to Dukes. The
Company fi led a Motion to Dismiss on March 5, 2012. While management
cannot predict the ultimate outcome of these matters, management does
not believe the outcome will have a material eff ect on the Company’s
fi nancial condition or results of operations.
Hazardous Materials Investigations: On November 8, 2005, the
Company received a grand jury subpoena from the United States
Attorney’s Offi ce for the Central District of California, seeking documents
and information relating to the Company’s receipt, transportation,
handling, identifi cation, recycling, treatment, storage and disposal of
certain merchandise that constitutes hazardous materials or hazardous
waste. The Company has been informed by the U.S. Attorney’s Offi ce for
the Central District of California that it is a target of a criminal investigation
into potential violations of the Resource Conservation and Recovery Act
(“RCRA”), the Clean Water Act and the Hazardous Materials Transportation
Statute. This U.S. Attorney’s Offi ce contends, among other things, that
the use of Company trucks to transport certain returned merchandise
from the Company’s stores to its return centers is prohibited by RCRA
because those materials may be considered hazardous waste. The
government alleges that, to comply with RCRA, the Company must ship
from the store certain materials as “hazardous waste” directly to a certifi ed
disposal facility using a certifi ed hazardous waste carrier. The U.S. Attorney’s
Offi ce in the Northern District of California and the U.S. Environmental
Protection Agency subsequently joined in this investigation. The Company
contends that the practice of transporting returned merchandise to its
return centers for subsequent disposition, including disposal by certifi ed
facilities, is compliant with applicable laws and regulations. While
management cannot predict the ultimate outcome of this matter,
management does not believe the outcome will have a material eff ect
on the Company’s fi nancial condition or results of operations.
12 Commitments
The Company and certain of its subsidiaries have long-term leases for
stores and equipment. Rentals (including amounts applicable to taxes,
insurance, maintenance, other operating expenses and contingent rentals)
under operating leases and other short-term rental arrangements
were $2.4 billion, $2.0 billion and $1.8 billion in fi scal 2012, 2011 and
2010, respectively.
Aggregate minimum annual rentals at January 31, 2012, under
non-cancelable leases are as follows:
(Amounts in millions) Operating Capital
Fiscal Year Leases Leases
2013 $ 1,644 $ 608
2014 1,590 580
2015 1,525 532
2016 1,428 497
2017 1,312 457
Thereafter 8,916 3,261
Total minimum rentals $16,415 $5,935
Less estimated executory costs 50
Net minimum lease payments 5,885
Less imputed interest 2,550
Present value of minimum lease payments $3,335
Certain of the Company’s leases provide for the payment of contingent
rentals based on a percentage of sales. Such contingent rentals were
immaterial for fi scal 2012, 2011 and 2010. Substantially all of the Company’s
store leases have renewal options, some of which may trigger an
escalation in rentals.
The Company has future lease commitments for land and buildings for
approximately 425 future locations. These lease commitments have lease
terms ranging from 4 to 50 years and provide for certain minimum
rentals. If executed, payments under operating leases would increase
by $92 million for fi scal 2013, based on current cost estimates.
In connection with certain debt fi nancing, the Company could be liable
for early termination payments if certain unlikely events were to occur. At
January 31, 2012, the aggregate termination payment would have been
$122 million. The arrangements pursuant to which these payments could
be made expire in fi scal 2019.
13 Retirement-Related Benefi ts
Through fi scal 2011, the Company maintained separate profi t sharing and
401(k) plans for associates in the United States and Puerto Rico, under
which associates generally became participants following one year of
employment. The profi t sharing component was entirely funded by the
Company, and the Company also made additional contributions to the
401(k) component of the plan. In addition to the Company’s contributions,
associates could elect to contribute a percentage of their earnings to the
401(k) component of the plan.
Eff ective February 1, 2011, the Company terminated the previous profi t
sharing and 401(k) plans and off ered new safe harbor 401(k) plans for
associates in the United States and Puerto Rico, under which associates
generally become participants following one year of employment.
Under the safe harbor 401(k) plans, the Company matches 100% of
participant contributions up to 6% of annual eligible earnings. The
matching contributions immediately vest at 100% for each associate.
Participants can contribute up to 50% of their pretax earnings, but not
more than the statutory limits. Participants age 50 or older may defer
additional earnings in catch-up contributions up to the maximum
statutory limits.
Notes to Consolidated Financial Statements
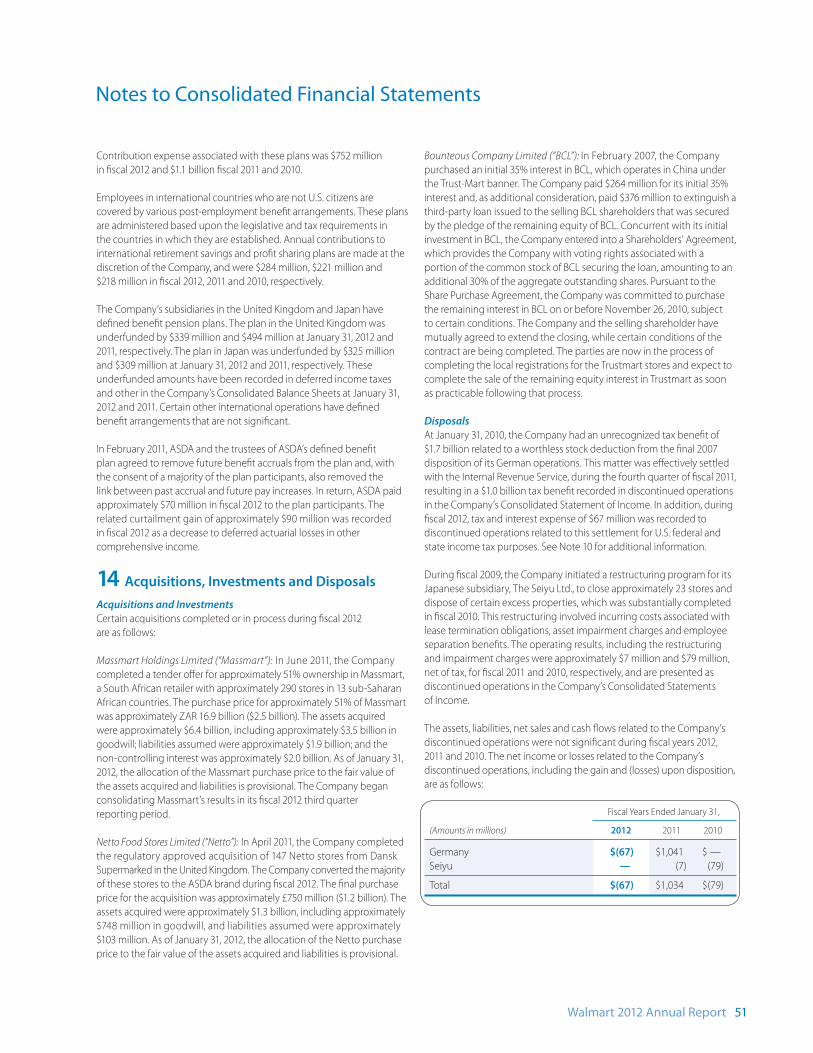
Walmart 2012 Annual Report 51
Contribution expense associated with these plans was $752 million
in fi scal 2012 and $1.1 billion fi scal 2011 and 2010.
Employees in international countries who are not U.S. citizens are
covered by various post-employment benefi t arrangements. These plans
are administered based upon the legislative and tax requirements in
the countries in which they are established. Annual contributions to
international retirement savings and profi t sharing plans are made at the
discretion of the Company, and were $284 million, $221 million and
$218 million in fi scal 2012, 2011 and 2010, respectively.
The Company’s subsidiaries in the United Kingdom and Japan have
defi ned benefi t pension plans. The plan in the United Kingdom was
underfunded by $339 million and $494 million at January 31, 2012 and
2011, respectively. The plan in Japan was underfunded by $325 million
and $309 million at January 31, 2012 and 2011, respectively. These
underfunded amounts have been recorded in deferred income taxes
and other in the Company’s Consolidated Balance Sheets at January 31,
2012 and 2011. Certain other international operations have defi ned
benefi t arrangements that are not signifi cant.
In February 2011, ASDA and the trustees of ASDA’s defi ned benefi t
plan agreed to remove future benefi t accruals from the plan and, with
the consent of a majority of the plan participants, also removed the
link between past accrual and future pay increases. In return, ASDA paid
approximately $70 million in fi scal 2012 to the plan participants. The
related curtailment gain of approximately $90 million was recorded
in fi scal 2012 as a decrease to deferred actuarial losses in other
comprehensive income.
14 Acquisitions, Investments and Disposals
Acquisitions and Investments
Certain acquisitions completed or in process during fi scal 2012
are as follows:
Massmart Holdings Limited (“Massmart”): In June 2011, the Company
completed a tender off er for approximately 51% ownership in Massmart,
a South African retailer with approximately 290 stores in 13 sub-Saharan
African countries. The purchase price for approximately 51% of Massmart
was approximately ZAR 16.9 billion ($2.5 billion). The assets acquired
were approximately $6.4 billion, including approximately $3.5 billion in
goodwill; liabilities assumed were approximately $1.9 billion; and the
non-controlling interest was approximately $2.0 billion. As of January 31,
2012, the allocation of the Massmart purchase price to the fair value of
the assets acquired and liabilities is provisional. The Company began
consolidating Massmart’s results in its fi scal 2012 third quarter
reporting period.
Netto Food Stores Limited (“Netto”): In April 2011, the Company completed
the regulatory approved acquisition of 147 Netto stores from Dansk
Supermarked in the United Kingdom. The Company converted the majority
of these stores to the ASDA brand during fi scal 2012. The fi nal purchase
price for the acquisition was approximately £750 million ($1.2 billion). The
assets acquired were approximately $1.3 billion, including approximately
$748 million in goodwill, and liabilities assumed were approximately
$103 million. As of January 31, 2012, the allocation of the Netto purchase
price to the fair value of the assets acquired and liabilities is provisional.
Bounteous Company Limited (“BCL”): In February 2007, the Company
purchased an initial 35% interest in BCL, which operates in China under
the Trust-Mart banner. The Company paid $264 million for its initial 35%
interest and, as additional consideration, paid $376 million to extinguish a
third-party loan issued to the selling BCL shareholders that was secured
by the pledge of the remaining equity of BCL. Concurrent with its initial
investment in BCL, the Company entered into a Shareholders’ Agreement,
which provides the Company with voting rights associated with a
portion of the common stock of BCL securing the loan, amounting to an
additional 30% of the aggregate outstanding shares. Pursuant to the
Share Purchase Agreement, the Company was committed to purchase
the remaining interest in BCL on or before November 26, 2010, subject
to certain conditions. The Company and the selling shareholder have
mutually agreed to extend the closing, while certain conditions of the
contract are being completed. The parties are now in the process of
completing the local registrations for the Trustmart stores and expect to
complete the sale of the remaining equity interest in Trustmart as soon
as practicable following that process.
Disposals
At January 31, 2010, the Company had an unrecognized tax benefi t of
$1.7 billion related to a worthless stock deduction from the fi nal 2007
disposition of its German operations. This matter was eff ectively settled
with the Internal Revenue Service, during the fourth quarter of fi scal 2011,
resulting in a $1.0 billion tax benefi t recorded in discontinued operations
in the Company’s Consolidated Statement of Income. In addition, during
fi scal 2012, tax and interest expense of $67 million was recorded to
discontinued operations related to this settlement for U.S. federal and
state income tax purposes. See Note 10 for additional information.
During fi scal 2009, the Company initiated a restructuring program for its
Japanese subsidiary, The Seiyu Ltd., to close approximately 23 stores and
dispose of certain excess properties, which was substantially completed
in fi scal 2010. This restructuring involved incurring costs associated with
lease termination obligations, asset impairment charges and employee
separation benefi ts. The operating results, including the restructuring
and impairment charges were approximately $7 million and $79 million,
net of tax, for fi scal 2011 and 2010, respectively, and are presented as
discontinued operations in the Company’s Consolidated Statements
of Income.
The assets, liabilities, net sales and cash fl ows related to the Company’s
discontinued operations were not signifi cant during fi scal years 2012,
2011 and 2010. The net income or losses related to the Company’s
discontinued operations, including the gain and (losses) upon disposition,
are as follows:
Fiscal Years Ended January 31,
(Amounts in millions) 2012 2011 2010
Germany $(67) $1,041 $ —
Seiyu — (7) (79)
Total $(67) $1,034 $(79)
Notes to Consolidated Financial Statements
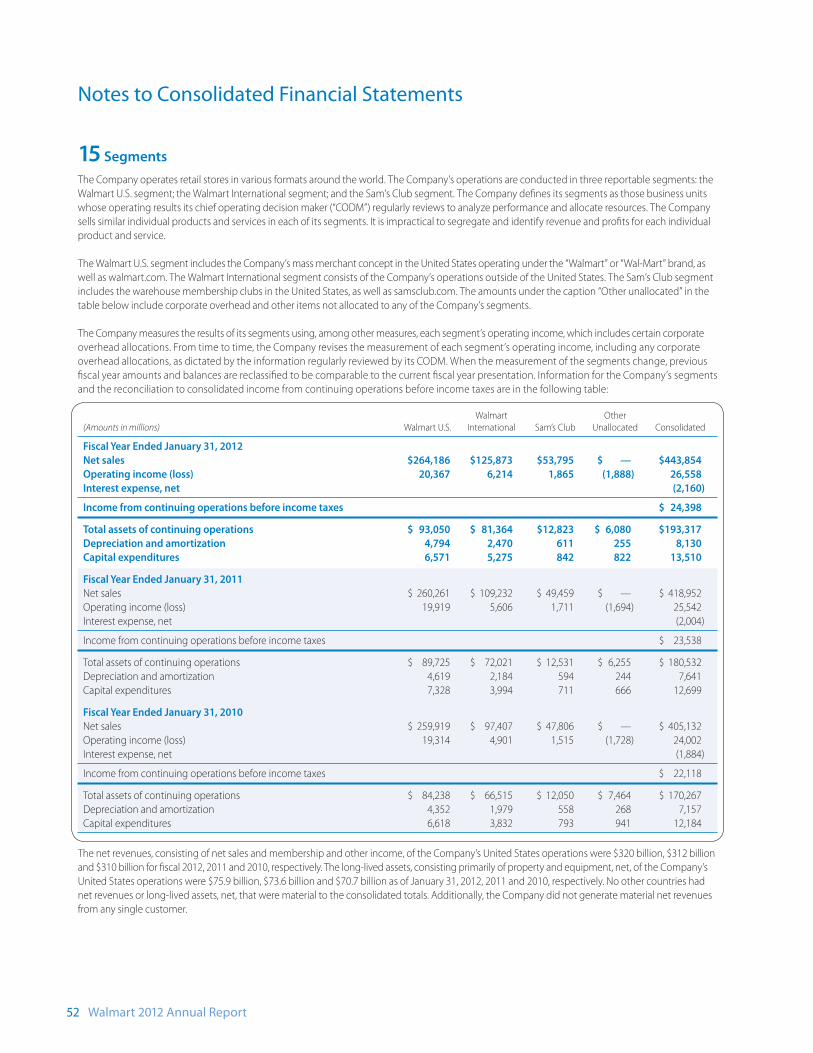
52 Walmart 2012 Annual Report
15 Segments
The Company operates retail stores in various formats around the world. The Company’s operations are conducted in three reportable segments: the
Walmart U.S. segment; the Walmart International segment; and the Sam’s Club segment. The Company defi nes its segments as those business units
whose operating results its chief operating decision maker (“CODM”) regularly reviews to analyze performance and allocate resources. The Company
sells similar individual products and services in each of its segments. It is impractical to segregate and identify revenue and profi ts for each individual
product and service.
The Walmart U.S. segment includes the Company’s mass merchant concept in the United States operating under the “Walmart” or “Wal-Mart” brand, as
well as walmart.com. The Walmart International segment consists of the Company’s operations outside of the United States. The Sam’s Club segment
includes the warehouse membership clubs in the United States, as well as samsclub.com. The amounts under the caption “Other unallocated” in the
table below include corporate overhead and other items not allocated to any of the Company’s segments.
The Company measures the results of its segments using, among other measures, each segment’s operating income, which includes certain corporate
overhead allocations. From time to time, the Company revises the measurement of each segment’s operating income, including any corporate
overhead allocations, as dictated by the information regularly reviewed by its CODM. When the measurement of the segments change, previous
fi scal year amounts and balances are reclassifi ed to be comparable to the current fi scal year presentation. Information for the Company’s segments
and the reconciliation to consolidated income from continuing operations before income taxes are in the following table:
Walmart Other
(Amounts in millions) Walmart U.S. International Sam’s Club Unallocated Consolidated
Fiscal Year Ended January 31, 2012
Net sales $264,186 $125,873 $53,795 $ — $443,854
Operating income (loss) 20,367 6,214 1,865 (1,888) 26,558
Interest expense, net (2,160)
Income from continuing operations before income taxes $ 24,398
Total assets of continuing operations $ 93,050 $ 81,364 $12,823 $ 6,080 $193,317
Depreciation and amortization 4,794 2,470 611 255 8,130
Capital expenditures 6,571 5,275 842 822 13,510
Fiscal Year Ended January 31, 2011
Net sales $ 260,261 $ 109,232 $ 49,459 $ — $ 418,952
Operating income (loss) 19,919 5,606 1,711 (1,694) 25,542
Interest expense, net (2,004)
Income from continuing operations before income taxes $ 23,538
Total assets of continuing operations $ 89,725 $ 72,021 $ 12,531 $ 6,255 $ 180,532
Depreciation and amortization 4,619 2,184 594 244 7,641
Capital expenditures 7,328 3,994 711 666 12,699
Fiscal Year Ended January 31, 2010
Net sales $ 259,919 $ 97,407 $ 47,806 $ — $ 405,132
Operating income (loss) 19,314 4,901 1,515 (1,728) 24,002
Interest expense, net (1,884)
Income from continuing operations before income taxes $ 22,118
Total assets of continuing operations $ 84,238 $ 66,515 $ 12,050 $ 7,464 $ 170,267
Depreciation and amortization 4,352 1,979 558 268 7,157
Capital expenditures 6,618 3,832 793 941 12,184
The net revenues, consisting of net sales and membership and other income, of the Company’s United States operations were $320 billion, $312 billion
and $310 billion for fi scal 2012, 2011 and 2010, respectively. The long-lived assets, consisting primarily of property and equipment, net, of the Company’s
United States operations were $75.9 billion, $73.6 billion and $70.7 billion as of January 31, 2012, 2011 and 2010, respectively. No other countries had
net revenues or long-lived assets, net, that were material to the consolidated totals. Additionally, the Company did not generate material net revenues
from any single customer.
Notes to Consolidated Financial Statements
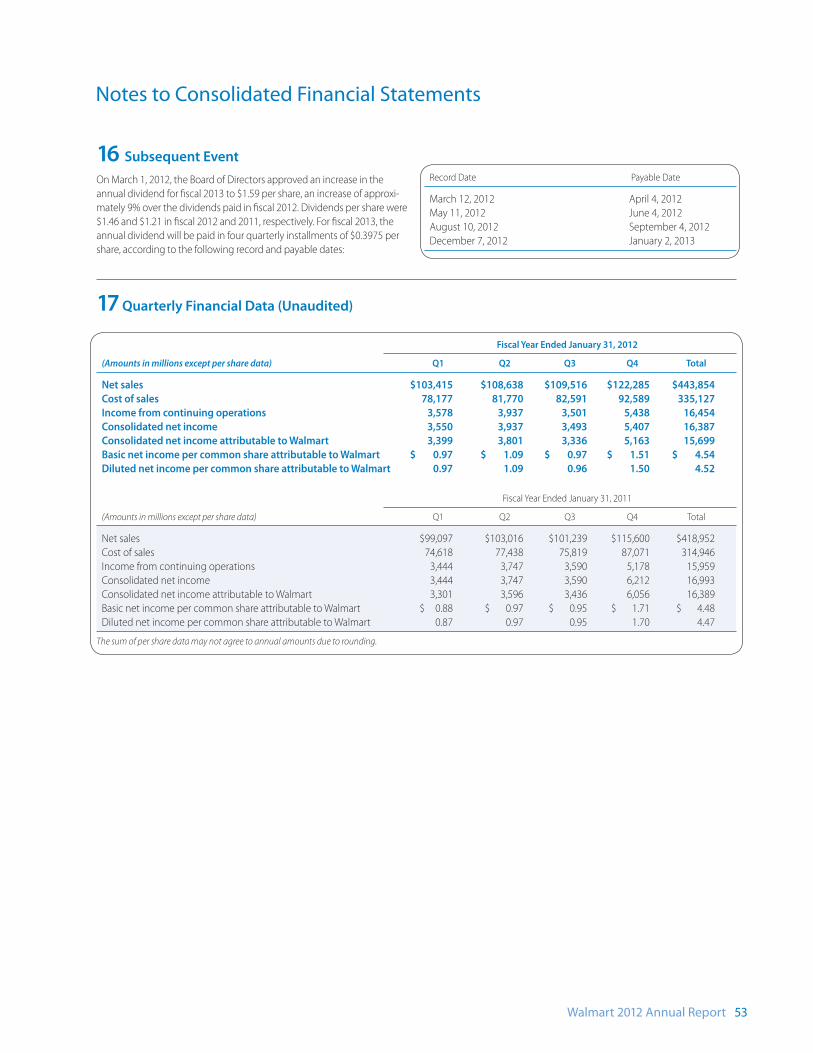
Walmart 2012 Annual Report 53
16 Subsequent Event
On March 1, 2012, the Board of Directors approved an increase in the
annual dividend for fi scal 2013 to $1.59 per share, an increase of approxi-
mately 9% over the dividends paid in fi scal 2012. Dividends per share were
$1.46 and $1.21 in fi scal 2012 and 2011, respectively. For fi scal 2013, the
annual dividend will be paid in four quarterly installments of $0.3975 per
share, according to the following record and payable dates:
Record Date Payable Date
March 12, 2012 April 4, 2012
May 11, 2012 June 4, 2012
August 10, 2012 September 4, 2012
December 7, 2012 January 2, 2013
Notes to Consolidated Financial Statements
17 Quarterly Financial Data (Unaudited)
Fiscal Year Ended January 31, 2012
(Amounts in millions except per share data) Q1 Q2 Q3 Q4 Total
Net sales $103,415 $108,638 $109,516 $122,285 $443,854
Cost of sales 78,177 81,770 82,591 92,589 335,127
Income from continuing operations 3,578 3,937 3,501 5,438 16,454
Consolidated net income 3,550 3,937 3,493 5,407 16,387
Consolidated net income attributable to Walmart 3,399 3,801 3,336 5,163 15,699
Basic net income per common share attributable to Walmart $ 0.97 $ 1.09 $ 0.97 $ 1.51 $ 4.54
Diluted net income per common share attributable to Walmart 0.97 1.09 0.96 1.50 4.52
Fiscal Year Ended January 31, 2011
(Amounts in millions except per share data) Q1 Q2 Q3 Q4 Total
Net sales $99,097 $103,016 $101,239 $115,600 $418,952
Cost of sales 74,618 77,438 75,819 87,071 314,946
Income from continuing operations 3,444 3,747 3,590 5,178 15,959
Consolidated net income 3,444 3,747 3,590 6,212 16,993
Consolidated net income attributable to Walmart 3,301 3,596 3,436 6,056 16,389
Basic net income per common share attributable to Walmart $ 0.88 $ 0.97 $ 0.95 $ 1.71 $ 4.48
Diluted net income per common share attributable to Walmart 0.87 0.97 0.95 1.70 4.47
The sum of per share data may not agree to annual amounts due to rounding.
54 Walmart 2012 Annual Report
The Board of Directors and Shareholders of Wal-Mart Stores, Inc.
We have audited the accompanying consolidated balance sheets of
Wal-Mart Stores, Inc. as of January 31, 2012 and 2011, and the related
consolidated statements of income, comprehensive income, shareholders’
equity, and cash fl ows for each of the three years in the period ended
January 31, 2012. These fi nancial statements are the responsibility of the
Company’s management. Our responsibility is to express an opinion on
these fi nancial statements based on our audits.
We conducted our audits in accordance with the standards of the Public
Company Accounting Oversight Board (United States). Those standards
require that we plan and perform the audit to obtain reasonable
assurance about whether the fi nancial statements are free of material
misstatement. An audit includes examining, on a test basis, evidence
supporting the amounts and disclosures in the fi nancial statements.
An audit also includes assessing the accounting principles used and
signifi cant estimates made by management, as well as evaluating the
overall fi nancial statement presentation. We believe that our audits
provide a reasonable basis for our opinion.
In our opinion, the fi nancial statements referred to above present fairly,
in all material respects, the consolidated fi nancial position of Wal-Mart
Stores, Inc. at January 31, 2012 and 2011, and the consolidated results of
its operations and its cash fl ows for each of the three years in the period
ended January 31, 2012, in conformity with U.S. generally accepted
accounting principles.
We also have audited, in accordance with the standards of the Public
Company Accounting Oversight Board (United States), Wal-Mart Stores,
Inc.’s internal control over fi nancial reporting as of January 31, 2012, based
on criteria established in Internal Control—Integrated Framework issued by
the Committee of Sponsoring Organizations of the Treadway
Commission and our report dated March 27, 2012 expressed an
unqualifi ed opinion thereon.
Rogers, Arkansas
March 27, 2012
Report of Independent Registered Public Accounting Firm
Walmart 2012 Annual Report 55
The Board of Directors and Shareholders of Wal-Mart Stores, Inc.
We have audited Wal-Mart Stores, Inc.’s internal control over fi nancial
reporting as of January 31, 2012, based on criteria established in Internal
Control—Integrated Framework issued by the Committee of Sponsoring
Organizations of the Treadway Commission (the COSO criteria). Wal-Mart
Stores, Inc.’s management is responsible for maintaining eff ective internal
control over fi nancial reporting, and for its assessment of the eff ectiveness
of internal control over fi nancial reporting included in the accompanying
“Management’s Report to Our Shareholders.” Our responsibility is to
express an opinion on the Company’s internal control over fi nancial
reporting based on our audit.
We conducted our audit in accordance with the standards of the Public
Company Accounting Oversight Board (United States). Those standards
require that we plan and perform the audit to obtain reasonable assurance
about whether eff ective internal control over fi nancial reporting was
maintained in all material respects. Our audit included obtaining an
understanding of internal control over fi nancial reporting, assessing the
risk that a material weakness exists, testing and evaluating the design
and operating eff ectiveness of internal control based on the assessed
risk, and performing such other procedures as we considered necessary
in the circumstances. We believe that our audit provides a reasonable
basis for our opinion.
A company’s internal control over financial reporting is a process
designed to provide reasonable assurance regarding the reliability of
financial reporting and the preparation of financial statements for
external purposes in accordance with generally accepted accounting
principles. A company’s internal control over fi nancial reporting includes
those policies and procedures that (1) pertain to the maintenance of
records that, in reasonable detail, accurately and fairly reflect the
transactions and dispositions of the assets of the company; (2) provide
reasonable assurance that transactions are recorded as necessary to
permit preparation of fi nancial statements in accordance with generally
accepted accounting principles, and that receipts and expenditures of
the company are being made only in accordance with authorizations of
management and directors of the company; and (3) provide reasonable
assurance regarding prevention or timely detection of unauthorized
acquisition, use or disposition of the company’s assets that could have a
material eff ect on the fi nancial statements.
Because of its inherent limitations, internal control over financial
reporting may not prevent or detect misstatements. Also, projections of
any evaluation of eff ectiveness to future periods are subject to the risk
that controls may become inadequate because of changes in conditions,
or that the degree of compliance with the policies or procedures
may deteriorate.
As indicated in the accompanying “Management’s Report to Our
Shareholders”, management’s assessment of and conclusion on the
eff ectiveness of internal control over fi nancial reporting did not include
the internal controls of Massmart Holdings Limited and Netto Food Stores
Limited, which are included in the 2012 consolidated fi nancial statements
of Wal-Mart Stores, Inc. and constituted 3.8% and 1.1% of the Company’s
consolidated total assets and consolidated net sales, respectively, as of and
for the year ended January 31, 2012. Our audit of internal control over
fi nancial reporting of Wal-Mart Stores, Inc. also did not include an evaluation
of the internal control over financial reporting of Massmart Holdings
Limited and Netto Food Stores Limited.
In our opinion, Wal-Mart Stores, Inc. maintained, in all material respects,
eff ective internal control over fi nancial reporting as of January 31, 2012,
based on the COSO criteria.
We also have audited, in accordance with the standards of the Public
Company Accounting Oversight Board (United States), the consolidated
balance sheets of Wal-Mart Stores, Inc. as of January 31, 2012 and 2011,
and related consolidated statements of income, comprehensive income,
shareholders’ equity and cash fl ows for each of the three years in the
period ended January 31, 2012 and our report dated March 27, 2012
expressed an unqualifi ed opinion thereon.
Rogers, Arkansas
March 27, 2012
Report of Independent Registered Public Accounting Firm
on Internal Control Over Financial Reporting
56 Walmart 2012 Annual Report
Management’s Report to Our Shareholders
Wal-Mart Stores, Inc.
Management of Wal-Mart Stores, Inc. (“Walmart,” the “company” or “we”)
is responsible for the preparation, integrity and objectivity of Walmart’s
Consolidated Financial Statements and other fi nancial information contained
in this Annual Report to Shareholders. Those Consolidated Financial
Statements were prepared in conformity with accounting principles
generally accepted in the United States. In preparing those Consolidated
Financial Statements, management was required to make certain estimates
and judgments, which are based upon currently available information and
management’s view of current conditions and circumstances.
The Audit Committee of the Board of Directors, which consists solely
of independent directors, oversees our process of reporting fi nancial
information and the audit of our Consolidated Financial Statements. The
Audit Committee stays informed of the fi nancial condition of Walmart
and regularly reviews management’s fi nancial policies and procedures,
the independence of our independent auditors, our internal control over
fi nancial reporting and the objectivity of our fi nancial reporting. Both the
independent auditors and the internal auditors have free access to the
Audit Committee and meet with the Audit Committee periodically, both
with and without management present.
Acting through our Audit Committee, we have retained Ernst & Young LLP,
an independent registered public accounting fi rm, to audit our Consolidated
Financial Statements found in this Annual Report to Shareholders. We have
made available to Ernst & Young LLP all of our fi nancial records and related
data in connection with their audit of our Consolidated Financial Statements.
We have fi led with the Securities and Exchange Commission (“SEC”) the
required certifi cations related to our Consolidated Financial Statements as of
and for the year ended January 31, 2012. These certifi cations are attached as
exhibits to our Annual Report on Form 10-K for the year ended January 31,
2012. Additionally, we have also provided to the New York Stock Exchange
the required annual certifi cation of our Chief Executive Offi cer regarding
our compliance with the New York Stock Exchange’s corporate governance
listing standards.
Report on Internal Control Over Financial ReportingManagement has responsibility for establishing and maintaining adequate
internal control over fi nancial reporting. Internal control over fi nancial report-
ing is a process designed to provide reasonable assurance regarding the
reliability of fi nancial reporting and the preparation of fi nancial statements
for external reporting purposes in accordance with accounting principles
generally accepted in the United States. Because of its inherent limitations,
internal control over fi nancial reporting may not prevent or detect misstate-
ments. Management has assessed the eff ectiveness of the Company’s
internal control over fi nancial reporting as of January 31, 2012. In making its
assessment, management has utilized the criteria set forth by the Committee
of Sponsoring Organizations (“COSO”) of the Treadway Commission in Internal
Control — Integrated Framework. Management concluded that based on its
assessment, Walmart’s internal control over fi nancial reporting was eff ective
as of January 31, 2012. The Company’s internal control over fi nancial reporting
as of January 31, 2012, has been audited by Ernst & Young LLP as stated in
their report which appears in this Annual Report to Shareholders.
Under guidelines established by the SEC, companies are allowed to exclude
acquisitions from their fi rst assessment of internal control over fi nancial
reporting following the date of acquisition. Based on those guidelines,
management’s assessment of the eff ectiveness of the Company’s internal
control over fi nancial reporting excluded Massmart Holdings Limited
(“Massmart”), of which the Company purchased a controlling interest in
fi scal 2012, as well as Netto Food Stores Limited (“Netto”), of which the
Company purchased 147 stores in the United Kingdom in fiscal 2012.
Massmart and Netto represented, in the aggregate, 3.8% and 1.1% of the
Company’s consolidated total assets and consolidated net sales, respectively,
as of and for the year ended January 31, 2012. These acquisitions are more
fully discussed in Note 14 to our Consolidated Financial Statements for fi scal
2012.
Evaluation of Disclosure Controls and ProceduresWe maintain disclosure controls and procedures designed to provide
reasonable assurance that information required to be timely disclosed is
accumulated and communicated to management in a timely fashion.
Management has assessed the eff ectiveness of these disclosure controls
and procedures as of January 31, 2012, and determined they were eff ective
as of that date to provide reasonable assurance that information required
to be disclosed by us in the reports we fi le or submit under the Securities
Exchange Act of 1934, as amended, was accumulated and communicated
to management, as appropriate, to allow timely decisions regarding
required disclosure and were eff ective to provide reasonable assurance
that such information is recorded, processed, summarized and reported
within the time periods specifi ed by the SEC’s rules and forms.
Report on Ethical StandardsOur Company was founded on the belief that open communications and
the highest standards of ethics are necessary to be successful. Our long-
standing “Open Door” communication policy helps management be
aware of and address issues in a timely and eff ective manner. Through
the open door policy all associates are encouraged to inform management
at the appropriate level when they are concerned about any matter
pertaining to Walmart.
Walmart has adopted a Statement of Ethics to guide our associates in the
continued observance of high ethical standards such as honesty, integrity
and compliance with the law in the conduct of Walmart’s business. Familiarity
and compliance with the Statement of Ethics is required of all associates who
are part of management. The Company also maintains a separate Code of
Ethics for our senior fi nancial offi cers. Walmart also has in place a Related-
Party Transaction Policy. This policy applies to Walmart’s senior offi cers and
directors and requires material related-party transactions to be reviewed
by the Audit Committee. The senior offi cers and directors are required to
report material related-party transactions to Walmart. We maintain a global
ethics offi ce which o versees and administers an ethics helpline. The ethics
helpline provides a channel for associates to make confidential and
anonymous complaints regarding potential violations of our statements
of ethics, including violations related to fi nancial or accounting matters.
Michael T. Duke
President and Chief Executive Offi cer
Charles M. Holley, Jr.
Executive Vice President and Chief Financial Offi cer
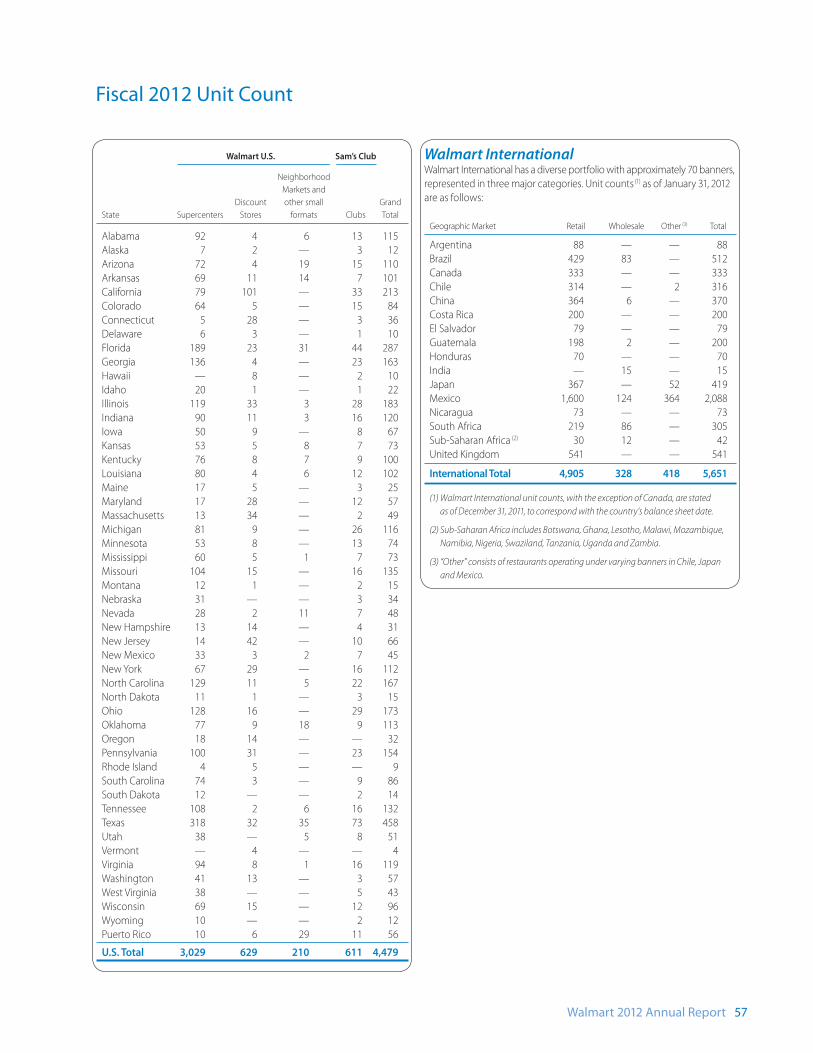
Walmart 2012 Annual Report 57
Fiscal 2012 Unit Count
Walmart U.S. Sam’s Club
Neighborhood
Markets and
Discount other small Grand
State Supercenters Stores formats Clubs Total
Alabama 92 4 6 13 115
Alaska 7 2 — 3 12
Arizona 72 4 19 15 110
Arkansas 69 11 14 7 101
California 79 101 — 33 213
Colorado 64 5 — 15 84
Connecticut 5 28 — 3 36
Delaware 6 3 — 1 10
Florida 189 23 31 44 287
Georgia 136 4 — 23 163
Hawaii — 8 — 2 10
Idaho 20 1 — 1 22
Illinois 119 33 3 28 183
Indiana 90 11 3 16 120
Iowa 50 9 — 8 67
Kansas 53 5 8 7 73
Kentucky 76 8 7 9 100
Louisiana 80 4 6 12 102
Maine 17 5 — 3 25
Maryland 17 28 — 12 57
Massachusetts 13 34 — 2 49
Michigan 81 9 — 26 116
Minnesota 53 8 — 13 74
Mississippi 60 5 1 7 73
Missouri 104 15 — 16 135
Montana 12 1 — 2 15
Nebraska 31 — — 3 34
Nevada 28 2 11 7 48
New Hampshire 13 14 — 4 31
New Jersey 14 42 — 10 66
New Mexico 33 3 2 7 45
New York 67 29 — 16 112
North Carolina 129 11 5 22 167
North Dakota 11 1 — 3 15
Ohio 128 16 — 29 173
Oklahoma 77 9 18 9 113
Oregon 18 14 — — 32
Pennsylvania 100 31 — 23 154
Rhode Island 4 5 — — 9
South Carolina 74 3 — 9 86
South Dakota 12 — — 2 14
Tennessee 108 2 6 16 132
Texas 318 32 35 73 458
Utah 38 — 5 8 51
Vermont — 4 — — 4
Virginia 94 8 1 16 119
Washington 41 13 — 3 57
West Virginia 38 — — 5 43
Wisconsin 69 15 — 12 96
Wyoming 10 — — 2 12
Puerto Rico 10 6 29 11 56
U.S. Total 3,029 629 210 611 4,479
Walmart InternationalWalmart International has a diverse portfolio with approximately 70 banners,
represented in three major categories. Unit counts (1) as of January 31, 2012
are as follows:
Geographic Market Retail Wholesale Other (3) Total
Argentina 88 — — 88
Brazil 429 83 — 512
Canada 333 — — 333
Chile 314 — 2 316
China 364 6 — 370
Costa Rica 200 — — 200
El Salvador 79 — — 79
Guatemala 198 2 — 200
Honduras 70 — — 70
India — 15 — 15
Japan 367 — 52 419
Mexico 1,600 124 364 2,088
Nicaragua 73 — — 73
South Africa 219 86 — 305
Sub-Saharan Africa (2) 30 12 — 42
United Kingdom 541 — — 541
International Total 4,905 328 418 5,651
(1) Walmart International unit counts, with the exception of Canada, are stated
as of December 31, 2011, to correspond with the country’s balance sheet date.
(2) Sub-Saharan Africa includes Botswana, Ghana, Lesotho, Malawi, Mozambique,
Namibia, Nigeria, Swaziland, Tanzania, Uganda and Zambia.
(3) “Other” consists of restaurants operating under varying banners in Chile, Japan
and Mexico.
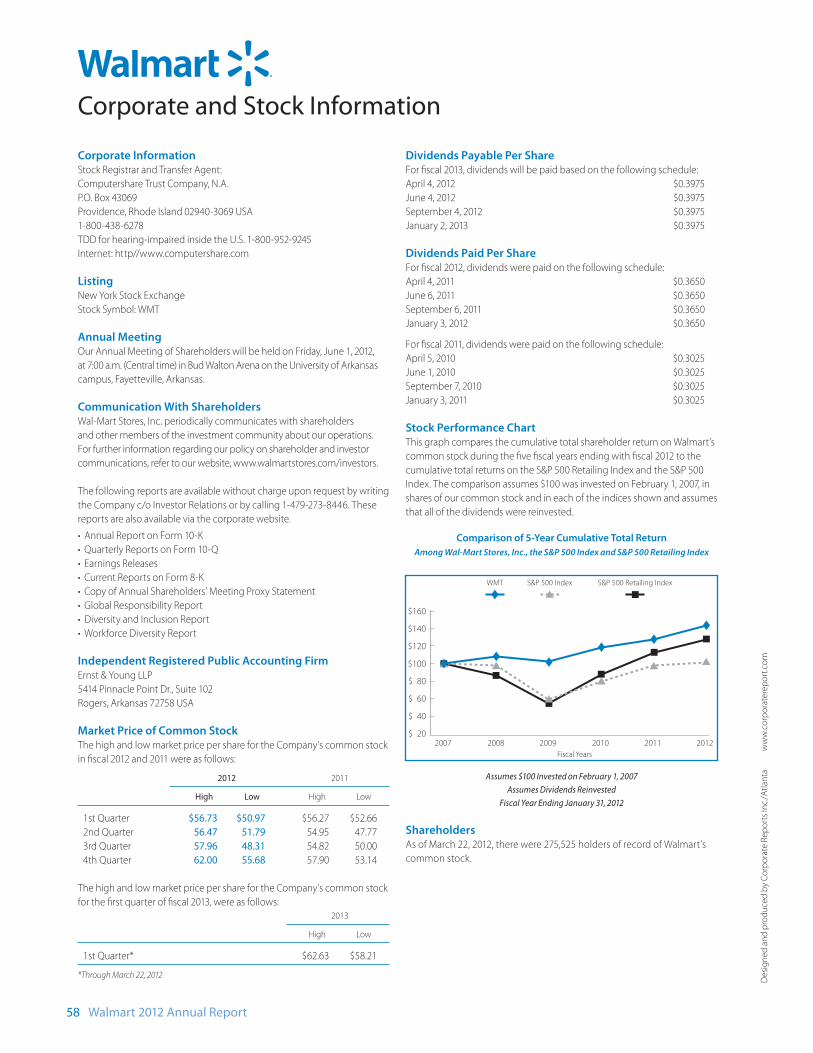
58 Walmart 2012 Annual Report
De
sig
ne
d a
nd
pro
du
ced
by
Co
rpo
rate
Re
po
rts
Inc.
/Atl
anta
ww
w.c
orp
ora
tere
po
rt.c
om
Corporate and Stock Information
Corporate InformationStock Registrar and Transfer Agent:
Computershare Trust Company, N.A.
P.O. Box 43069
Providence, Rhode Island 02940-3069 USA
1-800-438-6278
TDD for hearing-impaired inside the U.S. 1-800-952-9245
Internet: http//www.computershare.com
ListingNew York Stock Exchange
Stock Symbol: WMT
Annual MeetingOur Annual Meeting of Shareholders will be held on Friday, June 1, 2012,
at 7:00 a.m. (Central time) in Bud Walton Arena on the University of Arkansas
campus, Fayetteville, Arkansas.
Communication With ShareholdersWal-Mart Stores, Inc. periodically communicates with shareholders
and other members of the investment community about our operations.
For further information regarding our policy on shareholder and investor
communications, refer to our website, www.walmartstores.com/investors.
The following reports are available without charge upon request by writing
the Company c/o Investor Relations or by calling 1-479-273-8446. These
reports are also available via the corporate website.
• Annual Report on Form 10-K
• Quarterly Reports on Form 10-Q
• Earnings Releases
• Current Reports on Form 8-K
• Copy of Annual Shareholders’ Meeting Proxy Statement
• Global Responsibility Report
• Diversity and Inclusion Report
• Workforce Diversity Report
Independent Registered Public Accounting FirmErnst & Young LLP
5414 Pinnacle Point Dr., Suite 102
Rogers, Arkansas 72758 USA
Market Price of Common StockThe high and low market price per share for the Company’s common stock
in fi scal 2012 and 2011 were as follows:
2012 2011
High Low High Low
1st Quarter $56.73 $50.97 $56.27 $52.66
2nd Quarter 56.47 51.79 54.95 47.77
3rd Quarter 57.96 48.31 54.82 50.00
4th Quarter 62.00 55.68 57.90 53.14
The high and low market price per share for the Company’s common stock
for the fi rst quarter of fi scal 2013, were as follows:
2013
High Low
1st Quarter* $62.63 $58.21
*Through March 22, 2012
Dividends Payable Per ShareFor fi scal 2013, dividends will be paid based on the following schedule:
April 4, 2012 $0.3975
June 4, 2012 $0.3975
September 4, 2012 $0.3975
January 2, 2013 $0.3975
Dividends Paid Per ShareFor fi scal 2012, dividends were paid on the following schedule:
April 4, 2011 $0.3650
June 6, 2011 $0.3650
September 6, 2011 $0.3650
January 3, 2012 $0.3650
For fi scal 2011, dividends were paid on the following schedule:
April 5, 2010 $0.3025
June 1, 2010 $0.3025
September 7, 2010 $0.3025
January 3, 2011 $0.3025
Stock Performance ChartThis graph compares the cumulative total shareholder return on Walmart’s
common stock during the fi ve fi scal years ending with fi scal 2012 to the
cumulative total returns on the S&P 500 Retailing Index and the S&P 500
Index. The comparison assumes $100 was invested on February 1, 2007, in
shares of our common stock and in each of the indices shown and assumes
that all of the dividends were reinvested.
Comparison of 5-Year Cumulative Total Return
Among Wal-Mart Stores, Inc., the S&P 500 Index and S&P 500 Retailing Index
$160
$140
$120
$100
$ 80
$ 60
$ 40
$ 2020122007 2008 2009 20112010
S&P 500 Retailing IndexS&P 500 IndexWMT
Fiscal Years
Assumes $100 Invested on February 1, 2007
Assumes Dividends Reinvested
Fiscal Year Ending January 31, 2012
ShareholdersAs of March 22, 2012, there were 275,525 holders of record of Walmart’s
common stock.
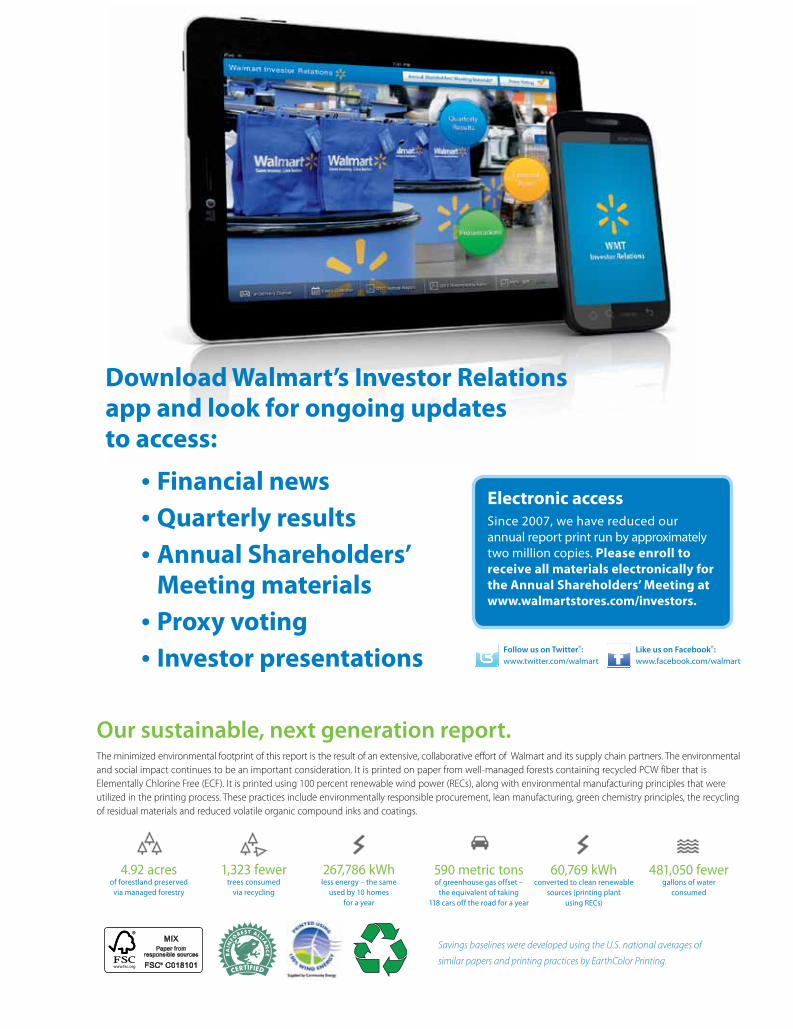
1960s1962: On July 2, Sam Walton opens his first Walmart in Rogers, Ark.
1967: The Waltons now own 24 stores, ringing up $12.7 million in sales.
1969: The company officially incorporates as Wal-Mart Stores, Inc.
1970s1970: Walmart becomes a publicly traded company on October 1.
1971: The company’s first distribution center is opened in Bentonville, Ark.
1972: Walmart is listed on the New York Stock Exchange (ticker: WMT).
Now with 51 stores, Walmart records sales of $78 million.
1975: Inspired by a visit to a Korean manufacturing facility, Sam Walton introduces the Walmart cheer.
1976: David Glass joins the company as EVP of finance.
1979: The Walmart Foundation is established.
1980s1980: Walmart reaches $1 billion in annual sales, faster than any other company at that time.
1983: The first Sam’s Club opens in Midwest City, Okla.
Walmart replaces cash registers with computerized point-of-sale systems, enabling fast and accurate checkout.
1987: The company installs the largest private satellite communica-tion system in the U.S., linking the company’s operations through voice, data and video communication.
1988: The first supercenter opens, in Washington, Mo, combining general merchandise and a full-scale supermarket to provide a one-stop shopping convenience.
David Glass is named CEO.
All trademarks in this report are the property of their respective owners. © 2012 Wal-Mart Stores, Inc.
4.92 acres of forestland preserved
via managed forestry
1,323 fewer trees consumed
via recycling
267,786 kWh less energy – the same
used by 10 homes for a year
590 metric tons of greenhouse gas offset –
the equivalent of taking 118 cars off the road for a year
60,769 kWh converted to clean renewable
sources (printing plant using RECs)
481,050 fewer gallons of water
consumed
Download Walmart’s Investor Relations app and look for ongoing updates to access:
• Financial news• Quarterly results• Annual Shareholders’
Meeting materials • Proxy voting• Investor presentations
Our sustainable, next generation report.The minimized environmental footprint of this report is the result of an extensive, collaborative effort of Walmart and its supply chain partners. The environmental and social impact continues to be an important consideration. It is printed on paper from well-managed forests containing recycled PCW fiber that is Elementally Chlorine Free (ECF). It is printed using 100 percent renewable wind power (RECs), along with environmental manufacturing principles that were utilized in the printing process. These practices include environmentally responsible procurement, lean manufacturing, green chemistry principles, the recycling of residual materials and reduced volatile organic compound inks and coatings.
Follow us on Twitter®: www.twitter.com/walmart
Like us on Facebook®: www.facebook.com/walmart
Electronic accessSince 2007, we have reduced our annual report print run by approximately two million copies. Please enroll to receive all materials electronically for the Annual Shareholders’ Meeting at www.walmartstores.com/investors.
Savings baselines were developed using the U.S. national averages of
similar papers and printing practices by EarthColor Printing.
Rainforest Alliance CertifiedTM
SmartWood Program Labeling Guidelines
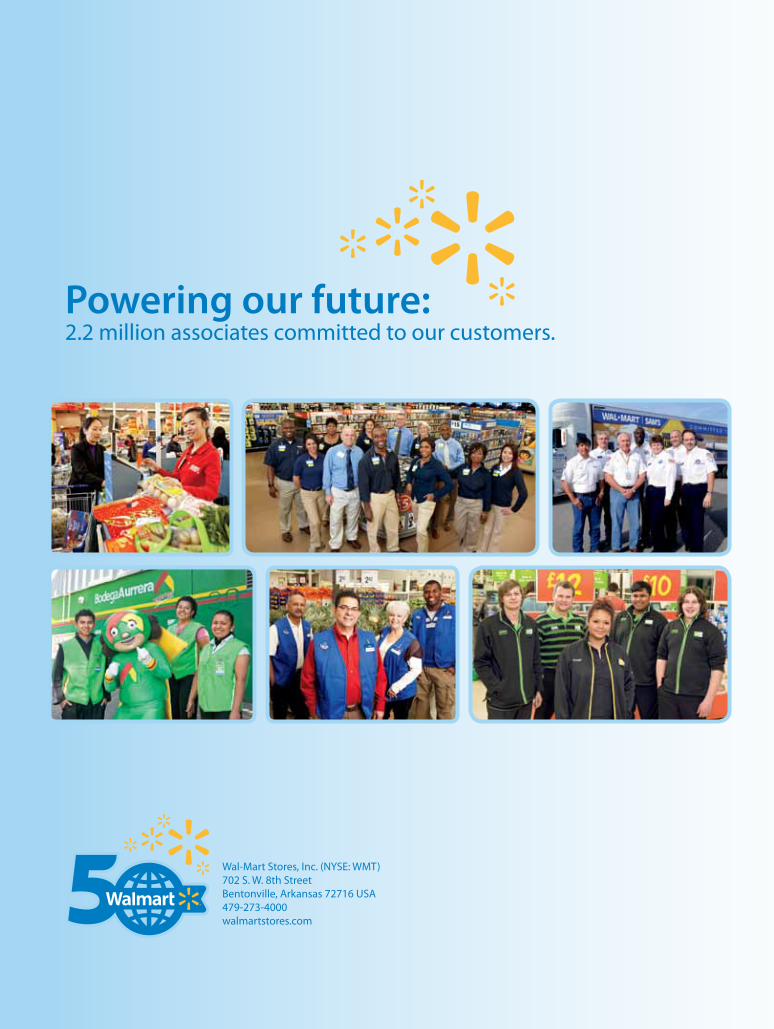
2012 Annual Report
50 yearsof helping customers
save money and live betterPowering our future:2.2 million associates committed to our customers.
Wal-Mart Stores, Inc. (NYSE: WMT)702 S. W. 8th StreetBentonville, Arkansas 72716 USA479-273-4000walmartstores.com
2012 Annual Report