2012 business banking trust trends study final14 · pdf fileponemon institute© research...
TRANSCRIPT

2012 Business Banking Trust
Trends Study
Ponemon Institute© Research Report
Sponsored by Guardian Analytics Independently conducted by Ponemon Institute LLC Publication Date: August 2012

Ponemon Institute© Research Report Page 1
2012 Business Banking Trust Trends Study Ponemon Institute, August 2012
Part 1. Introduction The security of online banking is something that most small and medium-sized businesses (SMBs) believe in and expect their banks to guarantee. This perception is encouraging more businesses to bank online, use their mobile devices for transactions and transfer funds online.
However, when attempted or successful fraud incidents occur, a business wants its bank’s response to be swift and to address the harmful consequences. When that does not happen, the trusted relationship between banks and their business customers is in jeopardy.
With their financial assets at stake, the expectation that banks will take every security measure necessary to provide a safe and secure online banking environment is understandable. However, meeting it is a challenge because the threat landscape is becoming more ominous. Recent Ponemon Institute research found that the majority of financial institutions studied, including retail banks, believe they have been victims of cyber crime.1
Guardian Analytics and Ponemon Institute are pleased to present the results of the 2012 Business Banking Trust Trends Study. This is the third annual study conducted by Ponemon Institute to determine the pervasiveness of online fraud, what is being done by businesses to prevent online fraud and the impact fraud as on their relationship with their banks. For the first time, the study delves into the occurrence of ACH, wireless and mobile banking fraud. As discussed above, businesses represented in this study are holding their banks to high standards. Seventy-two percent of respondents believe their banking institution is ultimately most responsible for ensuring their online accounts are secure. This expectation, held consistently over the past three years, could be based on a strict regulatory environment. Consistent with other Ponemon Institute studies, banks should take this belief seriously. In this study, 56 percent of respondents say that only one successful fraud involving online bank accounts would destroy their confidence in their banks ability to provide adequate security. We surveyed 998 owners and executives of businesses with no more than 200 employees and revenues of less than $100 million. This is an increase from 533 individuals surveyed in 2011. In order to ensure knowledgeable participants in this research, we confirm that they all have access to their company’s bank accounts, including online banking features. Their primary financial institutions are local or community, regional or national banks. The following are the most interesting conclusions from this year’s research: Small businesses are not changing their technologies or processes to keep up with the increasingly
sophisticated and stealthy threats to their online accounts. Small businesses are holding banks accountable for the security of their banking transactions and the
majority (56 percent) will lose trust and confidence if just one successful fraud attack takes place. Fifty-two percent of respondents say their businesses’ bank accounts have been targeted by both foiled
and successful fraud incidents in the past 12 months. However, online fraud is a more serious threat to businesses. Seventy-four percent of respondents say their businesses have experienced online banking fraud.
1 See Cyber Security Readiness Study, conducted by Ponemon Institute and sponsored by HP, September 30, 2010
Ponemon Institute© Research Report Page 2
Often businesses learn about fraud before the bank notifies them. Although improving, banks are slow to respond, often taking more than 24 hours to notify business when they do discover a potential or actual fraud.
In many cases, if funds are stolen banks are not reimbursing the business that was a victim of an
attack. This results in companies losing confidence in the bank’s security practices, switching banks for primary services and even terminating the relationship.
Small businesses are embracing mobile banking to access bank statements and make payments
including those for tax and payroll. Accessing online accounts from mobile devices has increased from 23 percent in 2010 to 54 percent in 2012.
Online banking has increased dramatically since 2010. In 2012, 48 percent of respondents say their
businesses conduct at least 50 percent of their banking online, an increase from 39 percent in 2011 and 29 percent in 2010.
The risk rogue business employees pose to the security of online fraud has increased significantly from
30 percent of respondents citing this as the cause of online fraud to 42 percent in 2012. These findings indicate that businesses are vulnerable to various forms of online fraud and, as a result, banks are at risk of losing their customers if they do not improve their fraud prevention practices. The next section of this report provides a deeper analysis of the survey results. The complete audited findings are presented in the appendix to this paper. This report is organized according to the following topics: What SMBs think about their banks’ actions to stop fraud and protect privacy
Trends in SMBs use of online banking The affect of online fraud on SMBs
The frequency, discovery and affect of ACH, wire transfer and mobile banking fraud on both banks and
SMBs
Ponemon Institute© Research Report Page 3
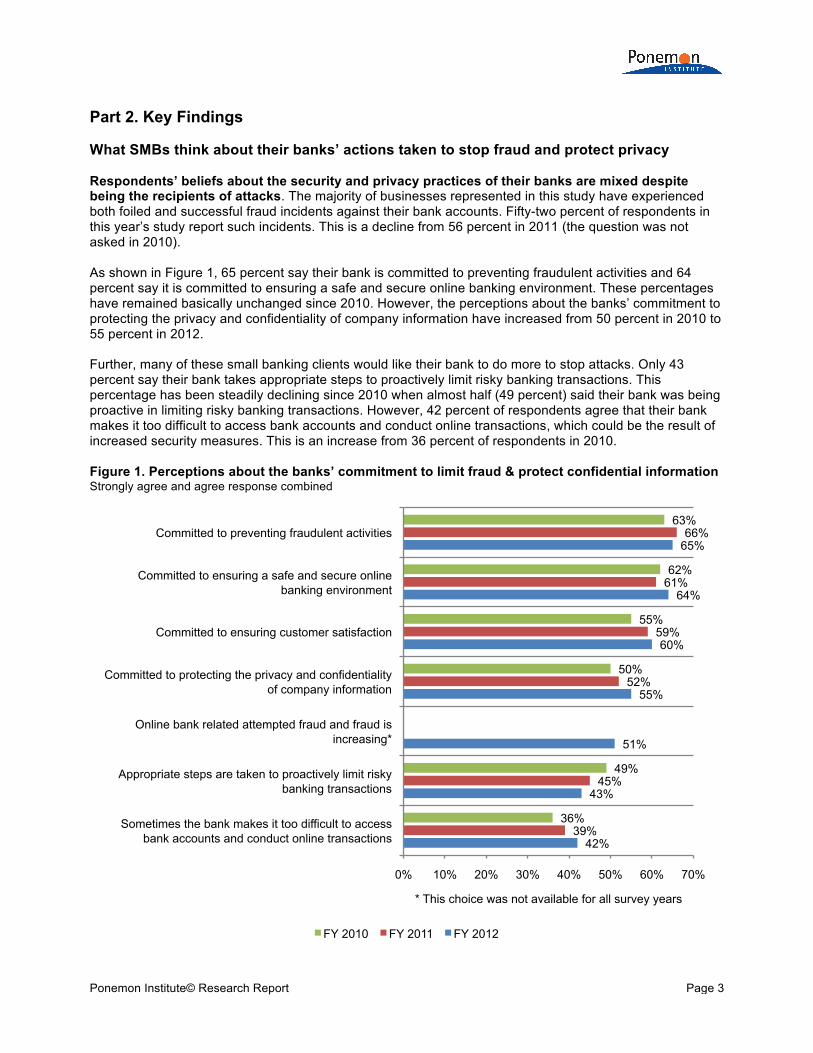
Part 2. Key Findings What SMBs think about their banks’ actions taken to stop fraud and protect privacy Respondents’ beliefs about the security and privacy practices of their banks are mixed despite being the recipients of attacks. The majority of businesses represented in this study have experienced both foiled and successful fraud incidents against their bank accounts. Fifty-two percent of respondents in this year’s study report such incidents. This is a decline from 56 percent in 2011 (the question was not asked in 2010). As shown in Figure 1, 65 percent say their bank is committed to preventing fraudulent activities and 64 percent say it is committed to ensuring a safe and secure online banking environment. These percentages have remained basically unchanged since 2010. However, the perceptions about the banks’ commitment to protecting the privacy and confidentiality of company information have increased from 50 percent in 2010 to 55 percent in 2012. Further, many of these small banking clients would like their bank to do more to stop attacks. Only 43 percent say their bank takes appropriate steps to proactively limit risky banking transactions. This percentage has been steadily declining since 2010 when almost half (49 percent) said their bank was being proactive in limiting risky banking transactions. However, 42 percent of respondents agree that their bank makes it too difficult to access bank accounts and conduct online transactions, which could be the result of increased security measures. This is an increase from 36 percent of respondents in 2010. Figure 1. Perceptions about the banks’ commitment to limit fraud & protect confidential information Strongly agree and agree response combined
42%
43%
51%
55%
60%
64%
65%
39%
45%
52%
59%
61%
66%
36%
49%
50%
55%
62%
63%
0% 10% 20% 30% 40% 50% 60% 70%
Sometimes the bank makes it too difficult to access bank accounts and conduct online transactions
Appropriate steps are taken to proactively limit risky banking transactions
Online bank related attempted fraud and fraud is increasing*
Committed to protecting the privacy and confidentiality of company information
Committed to ensuring customer satisfaction
Committed to ensuring a safe and secure online banking environment
Committed to preventing fraudulent activities
* This choice was not available for all survey years
FY 2010 FY 2011 FY 2012

Ponemon Institute© Research Report Page 4
Trends in SMBs use of online banking Online banking increases significantly. As shown in Figure 2, 48 percent of respondents say their businesses conduct at least 50 percent of their banking online. This is an increase from 29 percent of respondents in 2010 and 39 percent in 2011. Most of the transactions involve credit or debit card management, automated tax and payroll payments and automated statements. The findings also show that the percentage of respondents who do all their transactions online has more than doubled (nine percent in 2010 to 20 percent in 2012). Figure 2. Trends in online banking and mobile banking
With their financial assets at stake, businesses will quickly lose confidence if a fraud occurs. Banks should be concerned about how easy it is to lose the confidence of their customers. According to Figure 3, 56 percent say it would take only one successful fraud involving their online bank accounts to lose confidence in their bank’s ability to provide security. However, this is a decline from 2011. Also, 72 percent of businesses expect their banks to assume responsibility for ensuring that their online accounts are secure (not shown in the figure). This is a very slight but steady increase from 70 percent in 2011 and 67 percent in 2010. Figure 3. The number of successful frauds before confidence in the bank’s security is lost
25% 25% 21%
9% 4% 7% 9%
19% 22% 20% 14%
5% 6% 14% 15% 18% 19% 17%
6% 5%
20%
0%
10%
20%
30%
Less than 10% 11 to 30% 31 to 50% 51 to 70% 71 to 90% More than 90% All transactions are online
FY 2010 FY 2011 FY 2012
54%
35%
11%
0% 0%
61%
27%
10%
2% 0%
56%
26%
14%
3% 1% 0%
10%
20%
30%
40%
50%
60%
70%
Only once 2 to 3 times 4 to 5 times 6 to 7 times More than 7 times
FY 2010 FY 2011 FY 2012

Ponemon Institute© Research Report Page 5
Businesses are embracing the convenience of mobile banking. As shown in Figure 4, accessing online bank accounts from mobile devices has increased from 23 percent in 2010 to 54 percent in 2012. The primary location for accessing online bank accounts is still the office (98 percent) followed by remote locations, including the home office (85 percent). The percentage of respondents who say accounts are accessed from a remote location has increased 13 percent (10 basis points). This finding reveals how online banking is becoming more important to SMBs. Figure 4. How online bank accounts are accessed More than one choice permitted
Given the increase in online banking it is important that companies put resources into making such transactions secure. However, only 44 percent say that the computer they use is very safe or safe and 31 percent are unsure (Figure 5). Fifty-six percent say it is not safe or they are unsure and this has basically stayed the same since the study was first conducted in 2010 despite increasing threats of fraud. This is an area where banks could assist customers in making their online banking transactions secure. Figure 5. Perceptions about the safety of online banking
96%
75%
23%
5%
98%
82%
38%
3%
98%
85%
54%
3% 0%
10% 20% 30% 40% 50% 60% 70% 80% 90%
100%
From office location From remote location including home office
From mobile devices including smartphones and
tablets
Other
FY 2010 FY 2011 FY 2012
16%
29%
22%
33%
15%
26% 24%
35%
14%
30%
25%
31%
0%
5%
10%
15%
20%
25%
30%
35%
40%
Very safe Safe Not safe Unsure
FY 2010 FY 2011 FY 2012

Ponemon Institute© Research Report Page 6
More businesses are transferring funds online. As shown in Figure 6, the highest percentage of businesses in this research continues to transfer funds at their branch (56 percent) followed by 51 percent who say their business transfers funds by paper check. It is interesting to note that the same percentage of respondents (51 percent) say they transfer funds online and this represents an increase from 45 percent in 2011. Figure 6. Trends in how funds are transferred More than one choice permitted
57%
45%
50%
9% 12%
56%
51% 51%
11% 10%
0%
10%
20%
30%
40%
50%
60%
At our branch office By online banking Paper checks ATM FTPs or fax files
FY 2011 FY 2012

Ponemon Institute© Research Report Page 7
Risks rise but technologies used stay stagnant. As can be seen in Figure 7, businesses are basically keeping the same technologies in place despite the increased scale and sophistication of fraud attacks. These are firewalls and perimeter controls, anti-virus/anti-malware solutions, database security tools including scanners and endpoint security solutions. Ten percent say none of these technologies are used. Figure 7. Technologies used to secure computers and networks More than one choice permitted
5%
10%
5%
8%
15%
26%
42%
50%
53%
85%
93%
3%
11%
6%
5%
12%
22%
40%
51%
49%
85%
89%
6%
10%
3%
12%
19%
39%
41%
51%
84%
90%
0% 10% 20% 30% 40% 50% 60% 70% 80% 90% 100%
Other
None of the above
Network & traffic security system*
Event or log management systems
Web application firewalls (WAF)
Identity & access management systems
Encryption including VPN
Endpoint security solutions
Database security tools including scanners
Anti-virus/anti-malware solutions
Firewalls and other perimeter controls
* This choice was not available for all fiscal years
FY 2010 FY 2011 FY 2012
Ponemon Institute© Research Report Page 8
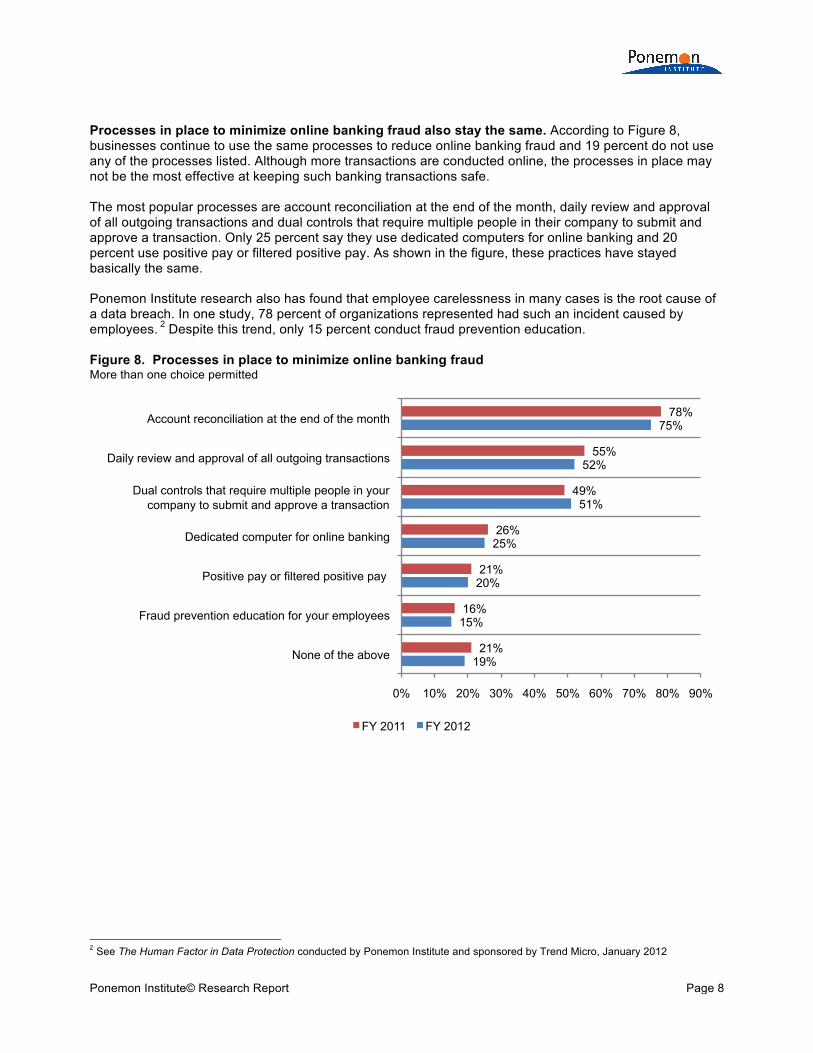
Processes in place to minimize online banking fraud also stay the same. According to Figure 8, businesses continue to use the same processes to reduce online banking fraud and 19 percent do not use any of the processes listed. Although more transactions are conducted online, the processes in place may not be the most effective at keeping such banking transactions safe. The most popular processes are account reconciliation at the end of the month, daily review and approval of all outgoing transactions and dual controls that require multiple people in their company to submit and approve a transaction. Only 25 percent say they use dedicated computers for online banking and 20 percent use positive pay or filtered positive pay. As shown in the figure, these practices have stayed basically the same. Ponemon Institute research also has found that employee carelessness in many cases is the root cause of a data breach. In one study, 78 percent of organizations represented had such an incident caused by employees. 2 Despite this trend, only 15 percent conduct fraud prevention education. Figure 8. Processes in place to minimize online banking fraud More than one choice permitted
2 See The Human Factor in Data Protection conducted by Ponemon Institute and sponsored by Trend Micro, January 2012
19%
15%
20%
25%
51%
52%
75%
21%
16%
21%
26%
49%
55%
78%
0% 10% 20% 30% 40% 50% 60% 70% 80% 90%
None of the above
Fraud prevention education for your employees
Positive pay or filtered positive pay
Dedicated computer for online banking
Dual controls that require multiple people in your company to submit and approve a transaction
Daily review and approval of all outgoing transactions
Account reconciliation at the end of the month
FY 2011 FY 2012

Ponemon Institute© Research Report Page 9
The affect of online banking fraud on SMBs Seventy-four percent of companies in this study have experienced online fraud. This is consistent with the 2011 and 2010 findings (75 percent and 74 percent, respectively). As shown in Figure 9, by far credit or debit card fraud and unauthorized access to accounts are the types of online fraud these companies experienced. The biggest increase is with unauthorized access to online accounts, which could be tied to corporate account takeovers. Figure 9. The type of online fraud experienced More than one choice permitted
19%
36%
85%
85%
32%
81%
83%
34%
73%
75%
0% 10% 20% 30% 40% 50% 60% 70% 80% 90%
Unauthorized online wire transfers *
Information stolen from online banking account was used to commit check fraud
Unauthorized access to accounts
Credit or debit card fraud
* This choice was not available for all survey years
FY 2010 FY 2011 FY 2012

Ponemon Institute© Research Report Page 10
In most cases, businesses discovered the fraud before the bank notified them. This finding can explain why so many businesses lose trust in their bank when an actual or attempted fraud occurs. With high expectations that the bank will be proactive in keeping their accounts secure, it is disconcerting that the discovery is often dependent upon the company’s own scrutiny of its records and contact from vendors. Increasingly businesses found out about the fraud while reviewing the online account or while reviewing or reconciling their monthly account, an increase from 67 percent to 75 percent. For 50 percent of companies it took a call from a merchant, supplier or vendor about insufficient funds to find out about the fraud. Only 44 percent say a bank representative actually called them and this is down from 50 percent in 2011. Further, 34 percent say that they received an automatic fraud alert by telephone, email or instant message. Figure 10. How the online fraud or attempted fraud was discovered More than one choice permitted
0%
5%
33%
34%
44%
50%
65%
75%
2%
6%
34%
29%
50%
49%
68%
73%
4%
4%
40%
31%
43%
54%
71%
67%
0% 10% 20% 30% 40% 50% 60% 70% 80%
Other
Bank sent an encrypted email
Bank sent a letter to your office address by normal or express post
Bank sent an automated fraud alert by telephone, email or instant message
Bank representative contacted your company by telephone
A merchant, supplier or vendor contacted your company (i.e., insufficient funds)
You detected the fraud while reviewing or reconciling your monthly statement
You detected a suspicious transaction while reviewing the online account
FY 2010 FY 2011 FY 2012

Ponemon Institute© Research Report Page 11
If the bank did discover the attempt, 37 percent say it took more than 24 hours and nine percent of respondents cannot recall when they were notified (Figure 11). This delay makes it more difficult to determine the source of the fraud and retrieve the stolen funds. However, 54 percent report that they heard from the bank immediately or within 24 hours. This is an increase from 49 percent in 2010, indicating a small improvement in response time. Figure 11. Time it took to notify the business about the fraud
10%
39%
31%
8%
12%
8%
43%
27%
11% 11% 13%
41%
25%
12% 9%
0%
5%
10%
15%
20%
25%
30%
35%
40%
45%
50%
Immediately Within 24 hours Within one week More than one week Can’t recall
FY 2010 FY 2011 FY 2012

Ponemon Institute© Research Report Page 12
As revealed in Figure 12, 42 percent say it was a malicious or rogue company employee that acquired the necessary credentials to commit the online fraud, an increase from 30 percent in 2010 and 35 percent in 2011. This is consistent with other Ponemon Institute research that points to the malicious insider as one of the most serious threats to sensitive information assets.3 This is followed by a distant 16 percent who say it was due to a virus, malware or botnet attack. However, this is an increase from only seven percent in 2010 and suggests a growing trend in this type of attack. Figure 12. How credentials were acquired to commit the fraud
3 See 2011 Cost of Data Breach Study: United States, Benchmark Research conducted by Ponemon Institute and sponsored by Symantec, March 2012
11%
0%
3%
4%
5%
5%
14%
16%
42%
21%
0%
5%
9%
5%
14%
11%
35%
26%
1%
8%
8%
20%
7%
30%
0% 5% 10% 15% 20% 25% 30% 35% 40% 45%
I don't know *
Unsure*
Malicious or rouge bank employee
Smishing*
Social engineer (someone posing as a legitimate person from your bank who sought credentials to
access account)
Phishing attack (email)
Phishing attack (social networking)*
Malicious or rogue contractor, vendor or supplier
Virus, malware or botnet attack
Malicious or rogue company employee
* This choice was not available for all survey years
FY 2010 FY 2011 FY 2012
Ponemon Institute© Research Report Page 13
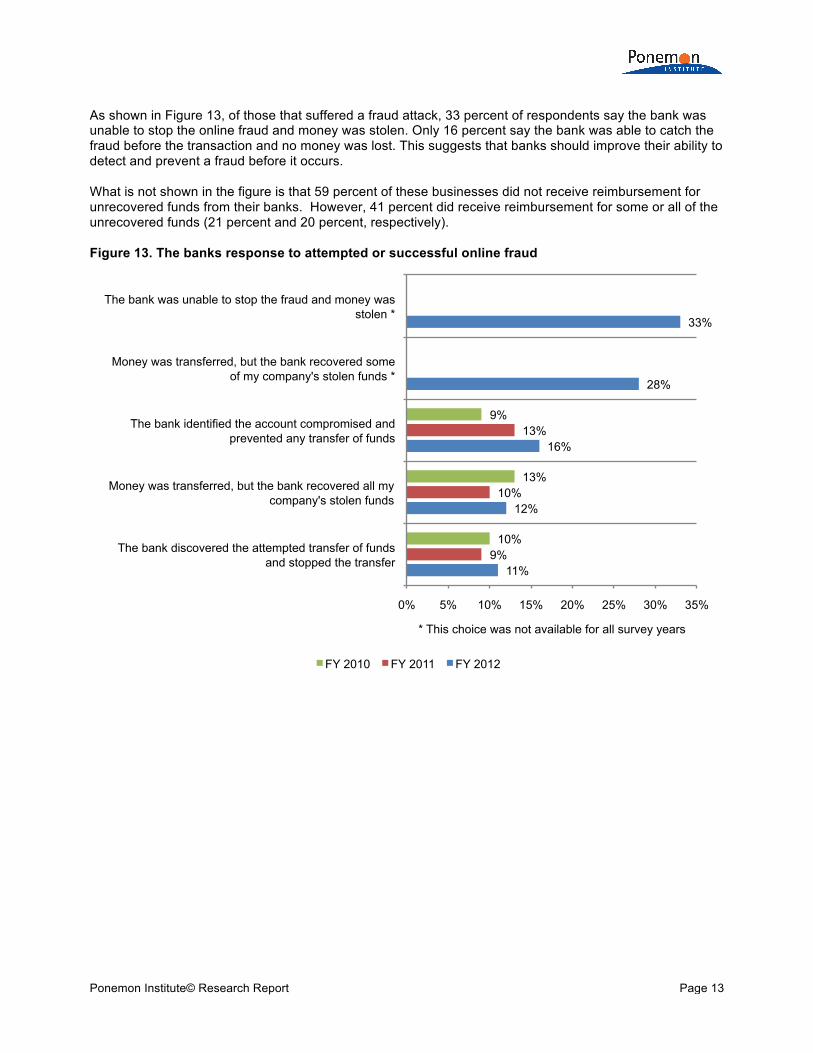
As shown in Figure 13, of those that suffered a fraud attack, 33 percent of respondents say the bank was unable to stop the online fraud and money was stolen. Only 16 percent say the bank was able to catch the fraud before the transaction and no money was lost. This suggests that banks should improve their ability to detect and prevent a fraud before it occurs. What is not shown in the figure is that 59 percent of these businesses did not receive reimbursement for unrecovered funds from their banks. However, 41 percent did receive reimbursement for some or all of the unrecovered funds (21 percent and 20 percent, respectively). Figure 13. The banks response to attempted or successful online fraud
11%
12%
16%
28%
33%
9%
10%
13%
10%
13%
9%
0% 5% 10% 15% 20% 25% 30% 35%
The bank discovered the attempted transfer of funds and stopped the transfer
Money was transferred, but the bank recovered all my company's stolen funds
The bank identified the account compromised and prevented any transfer of funds
Money was transferred, but the bank recovered some of my company's stolen funds *
The bank was unable to stop the fraud and money was stolen *
* This choice was not available for all survey years
FY 2010 FY 2011 FY 2012

Ponemon Institute© Research Report Page 14
In many cases, the bank’s immediate response following the fraud can have a profound impact on the relationship with its customers. According to Figure 14, 30 percent lost trust and confidence in their bank’s ability to secure their online accounts and 28 percent actually switched to another bank. Only 19 percent say it had no affect. However, 11 percent say the bank’s response increased their trust and confidence in the bank’s ability to secure their online accounts and this is an increase from eight percent in 2010. Figure 14. How fraud affected the company’s relationship with its bank
11%
12%
19%
28%
30%
10%
10%
21%
33%
26%
8%
11%
20%
29%
32%
0% 5% 10% 15% 20% 25% 30% 35%
Increased our company’s trust and confidence in the bank’s ability to secure our online accounts
Resulted in the termination of the banking relationship
No affect on the business relationship
Resulted in our company switching to another bank for primary services
Diminished our company’s trust and confidence in the bank’s ability to secure our online accounts
FY 2010 FY 2011 FY 2012

Ponemon Institute© Research Report Page 15
Businesses are often paralyzed by the attack and do not move forward with improving their security practices and procedures. This is an opportunity for banks to regain and retain the trust and loyalty of their business customers by helping them to strengthen their security practices and procedures. However, only 19 percent say their organization partnered with their bank to improve the security of online banking. Almost half (49 percent) did not change any procedures to stop fraud as shown in Figure 15. Fifteen percent began educating employees about not opening email attachments of unknown origin, an increase from 10 percent. Figure 15. Procedures put in place to prevent future online fraud More than one choice permitted
13%
12%
15%
19%
49%
12%
10%
15%
0% 10% 20% 30% 40% 50% 60%
Other *
Educate employees about not downloading dubious programs
Educate employees about not opening email attachments of unkown origin
Partnered with our bank to improve security of online banking
Did not change any procedures *
*This choice was not an option in FY 2011
FY 2011 FY 2012

Ponemon Institute© Research Report Page 16
According to Figure 16, of those businesses that did improve their security practices they most often deployed firewalls with malware detection programs (53 percent) and dual controls (35 percent). A slight improvement is the percentage of respondents who say their businesses are changing their security practices (53 percent in 2011 vs. 43 percent in 2012). Figure 16. Security practices put in place to prevent future online fraud More than one choice permitted
4%
8%
11%
16%
16%
24%
25%
35%
43%
53%
5%
9%
12%
9%
25%
23%
32%
53%
45%
0% 10% 20% 30% 40% 50% 60%
Other
Use one-time passwords
Bank tokens for authentication
Use software that is vetted and tested for security
Designated one dedicated computer for onling banking access*
Enforce the use of strong passwords
Provide physical security for computers and networks
Dual controls
Did not change any security practices
Deploy firewalls with malware detection programs
*This choice was not an option in FY 2011
FY 2011 FY 2012

Ponemon Institute© Research Report Page 17
Reimbursement of unrecovered funds affects customers’ trust and loyalty. Figure 17 reveals that when funds are stolen and not recovered, the bank’s reimbursement can have a significant affect on the trust and loyalty of its customers. Clearly, respondents who say their companies were not reimbursed are more likely to say this incident diminished the banking relationship. However, 20 percent still terminated the relationship if they were fully reimbursed and 13 percent say they quit the bank if they received partial reimbursement. Figure 17. How reimbursement for unrecovered funds affects the banking relationship
ACH, Wire Transfer and Mobile Banking Fraud In this year’s study, we started to examine three different types of banking fraud that can prove devastating to businesses. The study compares the fraud experience, discovery of the fraud, the bank’s response, the business’s reaction and the financial impact when ACH, wire transfer and mobile banking fraud occur. According to the findings, 69 percent of businesses represented in this study use ACH for payment transactions, 70 percent use wire transfers and almost half (49 percent) mobile banking. For purposes of this study, mobile banking entails more than accessing online banking from a mobile device. The most common types of mobile banking transactions include accessing bank statements, processing payments and making automated tax and payroll payments. Twenty-six percent use mobile banking to execute domestic and international fund transfers.
13% 20%
66%
7% 9%
83%
20% 13%
67%
0%
10%
20%
30%
40%
50%
60%
70%
80%
90%
Fully reimbursed Partially reimbursed Not reimbursed
Diminished the company’s trust and confidence in the bank
The company switched to another bank for its primary services
The company terminated the banking relationship
Ponemon Institute© Research Report Page 18
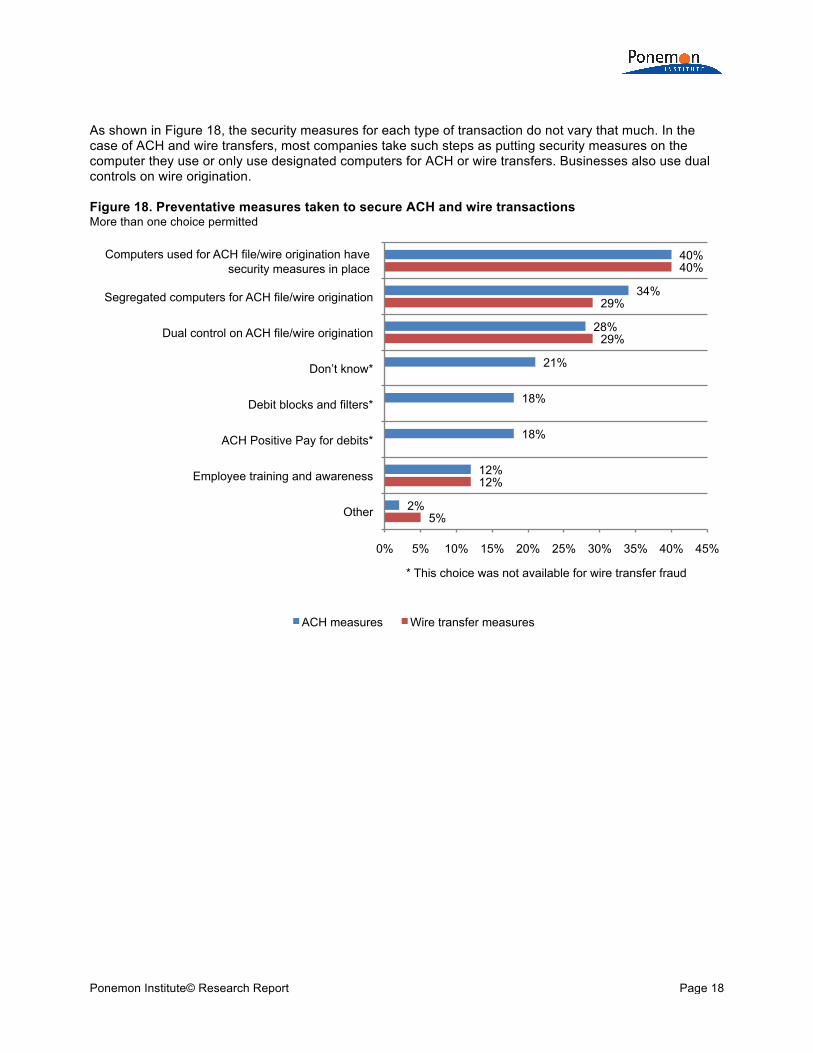
As shown in Figure 18, the security measures for each type of transaction do not vary that much. In the case of ACH and wire transfers, most companies take such steps as putting security measures on the computer they use or only use designated computers for ACH or wire transfers. Businesses also use dual controls on wire origination. Figure 18. Preventative measures taken to secure ACH and wire transactions More than one choice permitted
5%
12%
29%
29%
40%
2%
12%
18%
18%
21%
28%
34%
40%
0% 5% 10% 15% 20% 25% 30% 35% 40% 45%
Other
Employee training and awareness
ACH Positive Pay for debits*
Debit blocks and filters*
Don’t know*
Dual control on ACH file/wire origination
Segregated computers for ACH file/wire origination
Computers used for ACH file/wire origination have security measures in place
* This choice was not available for wire transfer fraud
ACH measures Wire transfer measures

Ponemon Institute© Research Report Page 19
Fraud experience In this section we are looking at the frequency of fraud for each of the payment channels (ACH, wire transfers and mobile banking), as shown in Figure 19. Only those respondents who say their businesses use these channels for banking transactions are included in this analysis. As shown, the majority of businesses have not experienced fraud. Of the 69 percent of companies represented in this study that use ACH for payment transactions, nine percent experienced the unauthorized transfer of funds using the ACH network during the past 12 months. However, 13 percent are unsure, indicating that incidents of fraud could be even higher. As mentioned above, 70 percent say their companies make wire transfers. Of the 70 percent, 10 percent experienced an unauthorized transfer of funds via wire during the past 12 months. Again, there is enough uncertainty (12 percent) to show that many companies may not have the ability to detect fraudulent transfers. Forty-nine percent of respondents say their companies are banking using mobile devices. Although mobile banking is not as widely used as ACH and wire transfers, it already has a high incident of fraud (11 percent). Again a significant number (19 percent) of companies are not certain that they experienced fraud. Businesses may not be able to promptly detect if funds were stolen when using mobile devices. Figure 19. ACH, wire and mobile banking fraud in the past 12 months
9% 10% 11%
78% 78% 70%
13% 12% 19%
0%
10%
20%
30%
40%
50%
60%
70%
80%
90%
Unauthorized transfer of funds using the ACH network
Unauthorized transfer of funds via wire Fraud due to mobile banking
Yes No Unsure

Ponemon Institute© Research Report Page 20
Discovery of fraud How did businesses discover the fraud and did it vary by payment channel? Unfortunately, the most common methods of discovery suggest that businesses would not learn about the fraud until a significant amount of time has lapsed since the crime was committed. In the cases of ACH and wire fraud, one-third or less heard from the bank directly by phone (Figure 20). Other ways they contacted businesses were by mail, automated fraud alerts or encrypted email. According to respondents, online and other types of fraud were mostly discovered when someone noticed it when reviewing the company’s online account or conducting account reconciliation. However, in the case of ACH and wire transfer fraud businesses found out when one of their merchants, suppliers or vendors contacted them. As shown in Figure 20, 40 percent of businesses that had ACH fraud learned about from these third parties. Similar to ACH, 39 percent of businesses learned about the wire transfer fraud in the same manner. Most often, notification of mobile banking fraud came in the form of a letter, according to 35 percent of respondents. Only 29 percent received a call from their banker. As discussed previously, 30 percent of businesses were either victims of mobile banking fraud or are unsure. Figure 20. Discovery of fraud More than one choice permitted
0%
9%
9%
12%
25%
35%
29%
32%
2%
6%
9%
12%
12%
35%
32%
39%
3%
5%
7%
11%
12%
29%
33%
40%
0% 5% 10% 15% 20% 25% 30% 35% 40% 45%
Other
You detected the fraud while reviewing or reconciling your monthly statement
You detected a suspicious transaction while reviewing the online account
Bank sent an encrypted email
Bank sent an automated fraud alert by telephone, email or SMS
Bank sent a letter to your office address by normal or express post
Bank representative contacted your company by telephone
A merchant, supplier or vendor contacted your company
ACH-related fraud Wire transfer fraud Mobile banking fraud

Ponemon Institute© Research Report Page 21
Fifty-six percent of businesses in this study (31 percent + 25 percent) report that the fraud did not result in the unauthorized transfer of funds using the ACH network. Thirty-six percent of respondents say the bank was able to recover all or some of the funds. However, 23 percent (15 percent + 8 percent) say their business lost some or all of their funds (Figure 21). In the case of wire transfers, 30 percent of banks were able to stop unauthorized wire transfers. Forty-eight percent of businesses lost all or some of their funds. As shown in Figure 21, 16 percent report the unauthorized transfer occurred but the bank recovered some of the funds and 32 percent report the theft of their funds. Only 31 percent of cases where funds were illegally transferred by mobile devices were successfully stopped. Twenty-five percent report the funds were stolen but the bank was able to recover all of the funds. However, 44 percent lost some or all of their funds (15 percent + 29 percent). Figure 21. Bank’s response to ACH, wire and mobile banking fraud
29%
15%
25%
31%
32%
16%
22%
30%
8%
15%
21%
25%
31%
0% 5% 10% 15% 20% 25% 30% 35%
The bank was not able to stop the fraud and money was stolen
Money was transferred, but the bank recovered some of the stolen funds
Money was transferred, but the bank recovered all of the stolen funds
Bank discovered the attempted transfer of funds and stopped it from occurring
Bank was able to identify the account compromised and prevent any transfer of funds*
* This choice was not available for wire and mobile banking fraud
ACH-related fraud Wire transfer fraud Mobile banking fraud

Ponemon Institute© Research Report Page 22
Figure 22 shows the percentage of businesses that received compensation for the loss of unrecovered funds. As shown, losses due to mobile fraud received the highest rate of compensation. Figure 22. The bank’s response to the fraud
SMBs’ reaction to the fraud When attempted or successful fraud occurs, the most common reactions, as shown in this study, are to lose confidence in their bank and to even switch to another bank. Thirty-two percent of businesses in this study lost more than $25,000 as a result of the ACH fraud and seven percent were unable to determine their loss. Businesses expressed their displeasure by having diminished trust and confidence in the bank’s ability to prevent ACH fraud (33 percent), switching to another bank for primary services, or terminating the relationship (11 percent), as shown in Figure 23. Thirty percent of businesses in this study lost more than $25,000 as a result of wire transfer fraud and 10 percent were unable to determine. As a consequence, 14 percent terminated their relationship with the bank. Thirty-one percent lost trust and confidence in the bank’s security practices and 25 percent switched their primary services to another bank.
46%
31%
23%
44%
31%
25%
31% 29%
40%
0%
5%
10%
15%
20%
25%
30%
35%
40%
45%
50%
No compensation Partial compensation Full compensation
ACH-related fraud Wire transfer fraud Mobile banking fraud

Ponemon Institute© Research Report Page 23
Of the businesses that were victims of mobile banking fraud, the majority (57 percent) had losses of $10,000 or less due to mobile banking fraud. However, the incident had a serious affect on the company’s relationship with its bank. Twenty percent switched to another bank for its primary services and 15 percent terminated the relationship with its bank. Twenty-five percent say the bank lost their trust and confidence in its ability to prevent mobile banking fraud. Figure 23. SMBs’ reaction to the fraud
7%
9%
15%
24%
20%
25%
0%
8%
14%
22%
25%
31%
0%
8%
11%
21%
27%
33%
0% 5% 10% 15% 20% 25% 30% 35%
Other
Increased our company’s trust and confidence in the bank’s ability to prevent fraud
Resulted in the termination of the banking relationship
No affect on the business relationship
Resulted in our company switching to another bank for primary services
Diminished our company’s trust and confidence in the bank’s ability to prevent fraud
ACH-related fraud Wire transfer fraud Mobile banking fraud
Ponemon Institute© Research Report Page 24
Part 3. Conclusion The rate of actual or attempted payments fraud continues to be significant and the findings of this year’s study show that SMBs have mixed feelings about their primary financial institution. The majority of businesses do believe that their bank is committed to preventing fraudulent activities. However, they are concerned that their bank is not being proactive enough in taking steps to limit risky banking transactions. Some of the primary conclusions from this research are presented below: The use of online and mobile banking is increasing and businesses are using them for a wide range of
services. Recommended, but not covered in this survey, is for mobile devices to use application control, patching and other controls to prevent hacking and surreptitious malware infections. Whenever feasible, SMBs should use remote wipe, mobile device encryption and anti-theft technologies to reduce the risk of fraud.
Fraud is high across all channels. Based on their responses, a majority of respondents have the perception that fraud is increasing.
Banks on the other hand are not being proactive about detecting fraud and notifying customers; most businesses discover fraud themselves or hear about it from suppliers or vendors, not from their bank.
When there is a fraud loss it can be significant (two-thirds of businesses had money stolen and even after some was recovered, about half lost money).
This study reinforces the recommendations in the FFIEC Guidance, that banks need improved technology-based solutions, tighter processes and better customer education.
Banks need to understand that small businesses are holding them accountable for the security of their banking transactions and the majority will lose trust and confidence if just one successful fraud attack takes place. In many cases if funds are stolen banks are not reimbursing the business that was a victim of an attack. To decrease churn and improve relationships with prospective and existing customers, banks should make security a prominent part of their marketing and customer outreach activities.

Ponemon Institute© Research Report Page 25
Part 4. Methods A random sampling frame of 27,058 individuals who reside within the United States was selected as participants to this survey. As shown in Table 1, 1,829 respondents completed the survey. After removing 193 surveys that failed reliability checks, the sample before screening was 1,636 surveys. Of the returned instruments, 998 surveys were screened to identify those respondents that have experienced a data breach notification resulting in a 3.7% response rate. Table 1. Sample response FY 2012 FY 2011 FY 2010 Sampling frame 27,058 14,977 12,055 Bounce back 2,536 1,188 1,506 Total returns 1,829 956 998 Rejected surveys 193 84 114 Sample before screening criteria 1,636 872 884 Final sample 998 533 504 Response rate 3.7% 3.6% 4.2%
Table 2 summarizes the primary functions provided by respondents in our study. The majority (77 percent) of respondent’s function as general management and 61 percent provide services in accounting and finance. The average years of business experience is 9.25 years. Table 2. Primary functions provided in the organization More than one choice permitted FY 2012 FY 2011 FY 2010 General management 77% 75% 71% Accounting & finance 61% 62% 56% Operations 35% 43% 35% Human resources 32% 33% 29% Sales 22% 26% 18% Marketing 20% 19% 21% Logistics 18% 19% 15% Other 4% 3% 5% Total 269% 280% 250%

Ponemon Institute© Research Report Page 26
Pie Chart 1 reports the respondents’ primary industry segments. Fifteen percent of respondents are in retail and fourteen percent are in manufacturing. Another eight percent are in healthcare, hospitality and leisure, financial services and technology and software. Pie Chart 1. Distribution of respondents according to primary industry classification
The majority of respondents (57 percent) are from organizations with an annualized revenue over $11 million, as shown in Pie Chart 2. Pie Chart 2. Total annualized revenue
15%
14%
8%
8% 8% 8%
7%
6%
5%
5%
3%
3% 2%
2% 2% 2% 2% Retailing Manufacturing Healthcare Hospitality & Leisure Professional Services Technology & Software Financial services Education Food Services Non-profit Agriculture General Services Automotive Entertainment & media Internet Pharmaceuticals Research
9%
10%
24%
31%
15%
10% 1%
Less than $1 million
$1 million to $5 million
$6 million to $10 million
$11 million to $20 million
$21 million to $50 million
$51 million to $100 million
More than $100 million

Ponemon Institute© Research Report Page 27
Part 5. Caveats
There are inherent limitations to survey research that need to be carefully considered before drawing inferences from findings. The following items are specific limitations that are germane to most web-based surveys.
Non-response bias: The current findings are based on a sample of survey returns. We sent surveys to a representative sample of individuals, resulting in a large number of usable returned responses. Despite non-response tests, it is always possible that individuals who did not participate are substantially different in terms of underlying beliefs and experience from those who completed the instrument. Sampling-frame bias: The accuracy is based on contact information and the degree to which the list is representative of individuals who are business professionals. We also acknowledge that the results may be biased by external events such as media coverage. We also acknowledge bias caused by compensating subjects to complete this research within a holdout period. Self-reported results: The quality of survey research is based on the integrity of confidential responses received from subjects. While certain checks and balances can be incorporated into the survey process, there is always the possibility that a subject did not provide a truthful response.
Ponemon Institute© Research Report Page 28
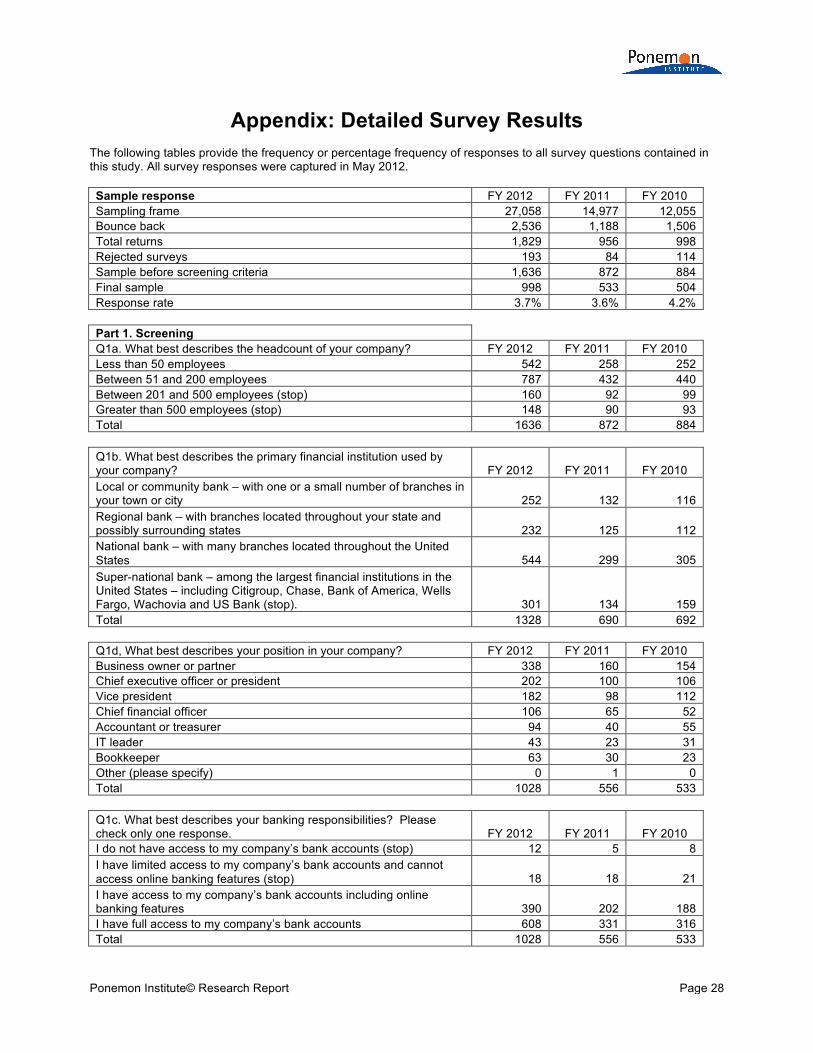
Appendix: Detailed Survey Results The following tables provide the frequency or percentage frequency of responses to all survey questions contained in this study. All survey responses were captured in May 2012. Sample response FY 2012 FY 2011 FY 2010 Sampling frame 27,058 14,977 12,055 Bounce back 2,536 1,188 1,506 Total returns 1,829 956 998 Rejected surveys 193 84 114 Sample before screening criteria 1,636 872 884 Final sample 998 533 504 Response rate 3.7% 3.6% 4.2% Part 1. Screening Q1a. What best describes the headcount of your company? FY 2012 FY 2011 FY 2010 Less than 50 employees 542 258 252 Between 51 and 200 employees 787 432 440 Between 201 and 500 employees (stop) 160 92 99 Greater than 500 employees (stop) 148 90 93 Total 1636 872 884 Q1b. What best describes the primary financial institution used by your company? FY 2012 FY 2011 FY 2010 Local or community bank – with one or a small number of branches in your town or city 252 132 116 Regional bank – with branches located throughout your state and possibly surrounding states 232 125 112 National bank – with many branches located throughout the United States 544 299 305 Super-national bank – among the largest financial institutions in the United States – including Citigroup, Chase, Bank of America, Wells Fargo, Wachovia and US Bank (stop). 301 134 159 Total 1328 690 692 Q1d, What best describes your position in your company? FY 2012 FY 2011 FY 2010 Business owner or partner 338 160 154 Chief executive officer or president 202 100 106 Vice president 182 98 112 Chief financial officer 106 65 52 Accountant or treasurer 94 40 55 IT leader 43 23 31 Bookkeeper 63 30 23 Other (please specify) 0 1 0 Total 1028 556 533 Q1c. What best describes your banking responsibilities? Please check only one response. FY 2012 FY 2011 FY 2010 I do not have access to my company’s bank accounts (stop) 12 5 8 I have limited access to my company’s bank accounts and cannot access online banking features (stop) 18 18 21 I have access to my company’s bank accounts including online banking features 390 202 188 I have full access to my company’s bank accounts 608 331 316 Total 1028 556 533

Ponemon Institute© Research Report Page 29
Final sample 998 533 504 Q2. Was your company's bank accounts targeted by fraud sometime over the past 12 months? This includes both foiled and successful fraud incidents FY 2012 FY 2011* Yes 52% 56% No 38% 44% Unsure 10% Total 100% 100% *In the past 12 months, has your company been the victim of payments fraud or attempted payments fraud? Part 2. Attributions Strongly agree & agree response Please rate the six statements using the scale provided below each item. Also, assume the term “bank” is your company’s primary financial institution. FY 2012 FY 2011 FY 2010 Q3a. My company’s bank is committed to protecting the privacy and confidentiality of company information. 55% 52% 50% Q3b. My company’s bank is committed to ensuring customer satisfaction. 60% 59% 55% Q3c. My company’s bank is committed to preventing fraudulent activities. 65% 66% 63% Q3d. My company’s bank is committed to ensuring a safe and secure online banking environment. 64% 61% 62% Q3e. My company’s bank takes appropriate steps to proactively limit risky banking transactions. 43% 45% 49% Q3f. My company’s bank sometimes makes it too difficult to access bank accounts and conduct online transactions. 42% 39% 36% Q3g. Online bank related attempted fraud and fraud is increasing. 51% Part 3. Online Banking Experience Q4. What percent of your company’s banking transactions are conducted online? FY 2012 FY 2011 FY 2010 Less than 10% 15% 19% 25% Between 11 to 30% 18% 22% 25% Between 31 to 50% 19% 20% 21% Between 51 to 70% 17% 14% 9% Between 71 to 90% 6% 5% 4% More than 90% 5% 6% 7% All transactions are online 20% 14% 9% Total 100% 100% 100% Q5. What are the types of banking transactions conducted online by you and your company? Please select all that apply. FY 2012 FY 2011 FY 2010 Automated bill pay 25% 26% 24% Automated statements 71% 72% 74% Bank account reconciliation 15% 15% 16% Investment and portfolio management 23% 18% 13% Account receivable management 21% 22% 20% Account balance transfers via wire 25% 26% 34% Account balance transfers via ACH 31% 32% Automated tax and payroll payments 72% 74% 69% Credit or debit card management 80% 77% 68% Other (please specify) 3% 0% 2% Total 366% 362% 320% *Wire and ACH response was combined in 2010
Ponemon Institute© Research Report Page 30
Q6. When and where do you access your company’s online bank accounts? Please select all that apply. FY 2012 FY 2011 FY 2010 From office location 98% 98% 96% From remote location including home office 85% 82% 75% From mobile devices including, smartphones and tablets (iPad) 54% 38% 23% Other (please specify) 3% 3% 5% Total 240% 221% 199% Q7. In your opinion, how safe is your office computer (desktop, laptop, notebook, etc.) when accessing your company’s online banking features? FY 2012 FY 2011 FY 2010 Very safe 14% 15% 16% Safe 30% 26% 29% Not safe 25% 24% 22% Unsure 31% 35% 33% Total 100% 100% 100% Q8. What types of security does your bank use to authenticate users? FY 2012 FY 2011 Token authentication 43% 45% Passwords 89% 89% Encryption 43% 36% Security test questions 65% 67% Unsure 9% 10% Total 249% 247% Q9. What technologies does your company have in place to secure its computers and networks? Please select all that apply. FY 2012 FY 2011 FY 2010 Anti-virus/anti-malware solutions 85% 85% 84% Endpoint security solutions 50% 51% 41% Encryption including VPN 42% 40% 39% Firewalls and other perimeter controls 93% 89% 90% Web application firewalls (WAF) 15% 12% 12% Identity & access management systems 26% 22% 19% Event or log management systems (including SIEM) 8% 5% 3% Database security tools including scanners 53% 49% 51% Network & traffic security system 5% 6% Other (please specify) 5% 3% 6% None of the above 10% 11% 10% Total 392% 373% 355% Q10. What processes does your company have in place to minimize online banking fraud? Please check all that apply. FY 2012 FY 2011 Dedicated computer for online banking 25% 26% Dual controls that require multiple people in your company to submit and approve a transaction 51% 49% Daily review and approval of all outgoing transactions 52% 55% Positive pay or filtered positive pay 20% 21% Account reconciliation at the end of the month 75% 78% Fraud prevention education for your employees 15% 16% Other (please specify) 3% 2% None of the above 19% 21% Total 260% 268%

Ponemon Institute© Research Report Page 31
Q11. How does your company typically transfer funds? FY 2012 FY 2011 At our branch office 56% 57% By online banking 51% 45% ATM 11% 9% Paper checks 51% 50% FTPs or fax files 10% 12% Total 179% 173% Q12. In your opinion (best guess), how many successful frauds involving your online bank accounts (including bank issued debit or credit cards) would it take before you lost confidence in your bank’s ability provide security? FY 2012 FY 2011 FY 2010 Only once 56% 61% 54% 2 to 3 times 26% 27% 35% 4 to 5 times 14% 10% 11% 6 to 7 times 3% 2% 0% 7 to 8 times 0% 0% 0% 9 to 10 times 0% 0% 0% More than 10 times 1% 0% 0% Total 100% 100% 100% Q13. In your opinion, who is ultimately most responsible for ensuring that your bank’s online accounts are secure? FY 2012 FY 2011 FY 2010 My company 13% 15% 19% Our banking institution 72% 70% 67% Government regulators 12% 10% 9% Law enforcement 3% 5% 5% Total 100% 100% 100% Part 4. Online Fraud Banking Experience Q14. Has your company ever experienced online banking fraud? (Online banking fraud concerns the movement or attempted movement of your company’s funds from its bank accounts that are accessible on the Internet.) FY 2012 FY 2011 FY 2010 Yes 74% 75% 74% No (Go to Part 5) 15% 13% 19% Unsure (Go to Part 5) 11% 12% 7% Total 100% 100% 100% Q15. Please indicate the type of online fraud your company experienced from the list below. Please check all that apply. FY 2012 FY 2011 FY 2010 Information stolen from online banking account was used to commit check fraud 36% 32% 34% Unauthorized access to accounts 85% 81% 73% Unauthorized transfer of funds using the ACH network 16% 20% Unauthorized online wire transfers* 19% Unauthorized transfer of funds via wire 5% 9% Credit or debit card fraud 85% 83% 75% Unauthorized issuance of lines of credit or loans 6% 4% 8% Fraudulent use of bill pay to unauthorized payee 9% 6% 6% Other (please specify) 6% 4% 5% Total 246% 231% 230% * The item was slightly changed to suit the question.

Ponemon Institute© Research Report Page 32
Q16. How did you discover the fraud or attempted fraud involving your company’s online bank account (s)? Please check all that apply. FY 2012 FY 2011 FY 2010 Bank representative contacted your company by telephone 44% 50% 43% Bank sent an automated fraud alert by telephone, email or instant message 34% 29% 31% Bank sent an encrypted email 5% 6% 4% A merchant, supplier or vendor contacted your company (i.e., insufficient funds) 50% 49% 54% Bank sent a letter to your office address by normal or express post 33% 34% 40% You detected a suspicious transaction while reviewing the online account 75% 73% 67% You detected the fraud while reviewing or reconciling your monthly statement 65% 68% 71% Other (please specify) 0% 2% 4% Total 306% 311% 314% Q17. If your bank did discover the attempt, how quickly after the incident (or attempted incident) did the bank notify your company about the online fraud? FY 2012 FY 2011 FY 2010 Immediately 13% 8% 10% Within 24 hours 41% 43% 39% Within one week 25% 27% 31% More than one week 12% 11% 8% Can’t recall 9% 11% 12% Total 100% 100% 100% Q18. How were the credentials acquired in order to commit the online fraud or attempted online fraud? FY 2012 FY 2011 FY 2010 Phishing attack (email) 5% 9% 8% Phishing attack (social networking) 5% 5% Malicious or rogue bank employee 0% 0% 1% Malicious or rogue company employee 42% 35% 30% Malicious or rogue contractor, vendor or supplier 14% 14% 20% Social engineer (someone posing as a legitimate person from your bank who sought credentials to access account) 4% 5% 8% Virus, malware or botnet attack 16% 11% 7% Smishing (SMS/text message) 3% I don't know 11% Unsure 0% 0% 0% Other (please specify) 21% 26% Total 100% 100% 100% Q19a. What best describes your bank’s response to the online fraud or attempted online fraud? FY 2012 FY 2011 FY 2010 The bank identified the account compromised and prevented any transfer of funds 16% 13% 9% The bank discovered the attempted transfer of funds and stopped the transfer 11% 9% 10% Money was transferred, but the bank recovered all my company's stolen funds 12% 10% 13% Money was transferred, but the bank recovered some of my company's stolen funds 28% The bank was unable to stop the fraud and money was stolen 33% Total 100%

Ponemon Institute© Research Report Page 33
Q19b. If money was stolen, what was the bank's response? FY 2012 FY 2011 FY 2010 The bank reimbursed my company partially for any unrecovered funds 21% The bank reimbursed my company fully for any unrecovered funds 20% The bank did not compensate my company for any unrecovered funds 59% Total 100% Q19c. Approximately (best guess), what was the total cost of the online fraud or online fraud attempt to your company? FY 2012 FY 2011 FY 2010 Nothing 36% 35% 42% Between $1 and $1,000 17% 18% 12% Between $1,001 and $5,000 6% 6% 9% Between $5,001 and $10,000 15% 16% 14% Between $10,001 and $25,000 8% 7% 5% Between $25,001 and $50,000 7% 7% 6% Between $50,001 and $100,000 6% 7% 5% More than $100,000 0% 1% 2% Unable to determine 5% 3% 5% Total 100% 100% 100% Q20. How did this online fraud or attempted online fraud affect the business relationship between your company and its bank? FY 2012 FY 2011 FY 2010 No affect on the business relationship 19% 21% 20% Increased our company’s trust and confidence in the bank’s ability to secure our online accounts 11% 10% 8% Diminished our company’s trust and confidence in the bank’s ability to secure our online accounts 30% 26% 32% Resulted in our company switching to another bank for primary services 28% 33% 29% Resulted in the termination of the banking relationship 12% 10% 11% Other (please specify) 0% 0% 0% Total 100% 100% 100% Q21a. Following the online fraud incident what security practices did you put in place to help prevent future online fraud incidents? (Please check all that apply) FY 2012 FY 2011 Use one-time passwords 8% 9% Dual controls 35% 32% Bank tokens for authentication 11% 12% Use software that is vetted and tested for security 16% 9% Provide physical security for computers and networks 25% 23% Enforce the use of strong passwords 24% 25% Deploy firewalls with malware detection programs 53% 45% Did not change any security practices 43% 53% Designated one dedicated computer for online banking access 16% Other 4% 5% Total 235% 213%
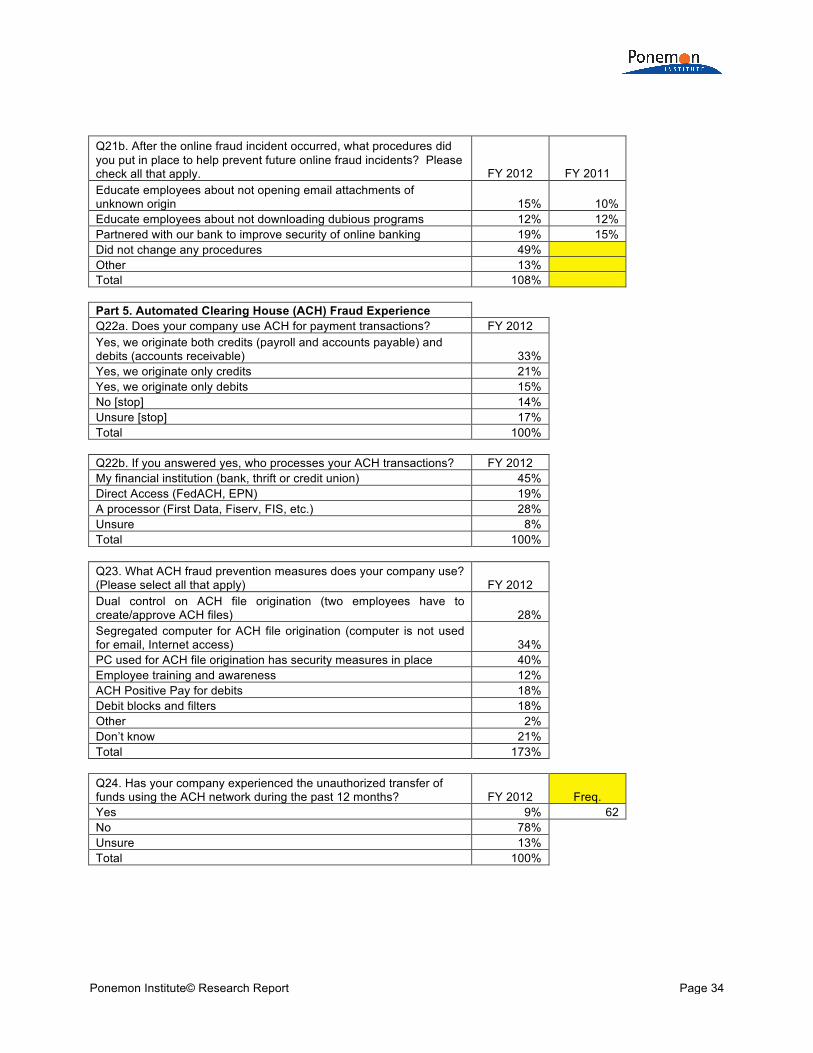
Ponemon Institute© Research Report Page 34
Q21b. After the online fraud incident occurred, what procedures did you put in place to help prevent future online fraud incidents? Please check all that apply. FY 2012 FY 2011 Educate employees about not opening email attachments of unknown origin 15% 10% Educate employees about not downloading dubious programs 12% 12% Partnered with our bank to improve security of online banking 19% 15% Did not change any procedures 49% Other 13% Total 108% Part 5. Automated Clearing House (ACH) Fraud Experience Q22a. Does your company use ACH for payment transactions? FY 2012 Yes, we originate both credits (payroll and accounts payable) and debits (accounts receivable) 33% Yes, we originate only credits 21% Yes, we originate only debits 15% No [stop] 14% Unsure [stop] 17% Total 100% Q22b. If you answered yes, who processes your ACH transactions? FY 2012 My financial institution (bank, thrift or credit union) 45% Direct Access (FedACH, EPN) 19% A processor (First Data, Fiserv, FIS, etc.) 28% Unsure 8% Total 100%
Q23. What ACH fraud prevention measures does your company use? (Please select all that apply) FY 2012 Dual control on ACH file origination (two employees have to create/approve ACH files) 28% Segregated computer for ACH file origination (computer is not used for email, Internet access) 34% PC used for ACH file origination has security measures in place 40% Employee training and awareness 12% ACH Positive Pay for debits 18% Debit blocks and filters 18% Other 2% Don’t know 21% Total 173% Q24. Has your company experienced the unauthorized transfer of funds using the ACH network during the past 12 months? FY 2012 Freq. Yes 9% 62 No 78% Unsure 13% Total 100%
Ponemon Institute© Research Report Page 35
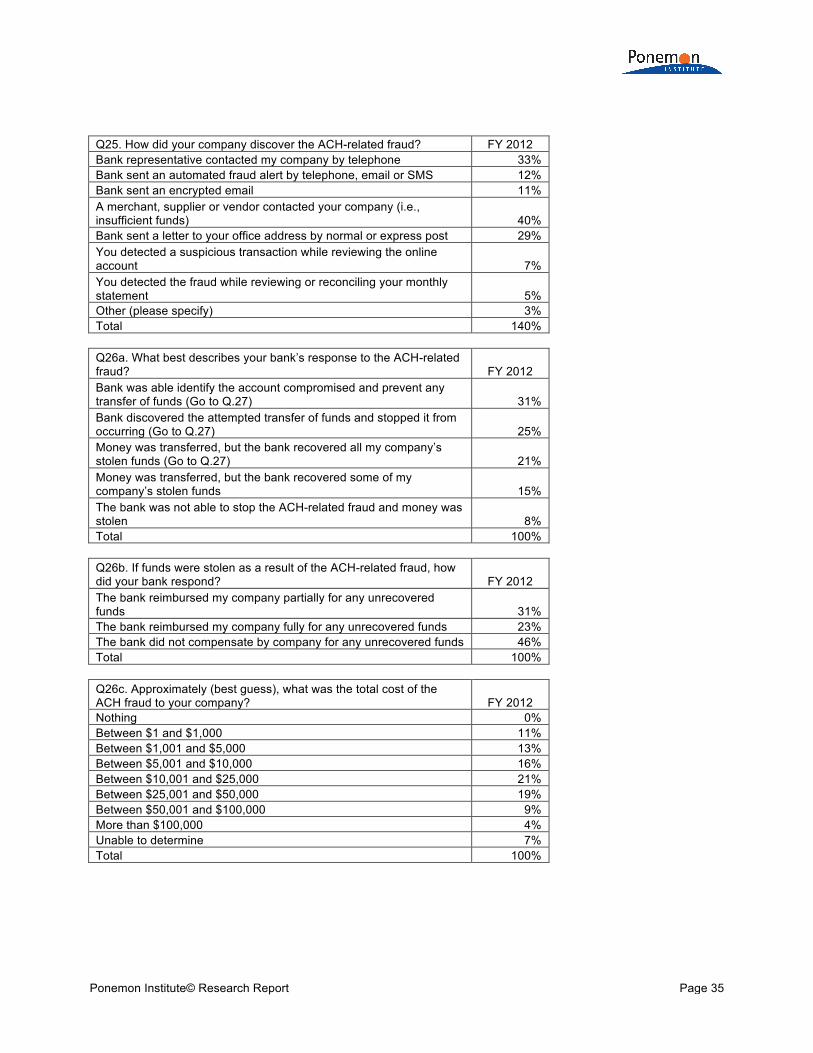
Q25. How did your company discover the ACH-related fraud? FY 2012 Bank representative contacted my company by telephone 33% Bank sent an automated fraud alert by telephone, email or SMS 12% Bank sent an encrypted email 11% A merchant, supplier or vendor contacted your company (i.e., insufficient funds) 40% Bank sent a letter to your office address by normal or express post 29% You detected a suspicious transaction while reviewing the online account 7% You detected the fraud while reviewing or reconciling your monthly statement 5% Other (please specify) 3% Total 140% Q26a. What best describes your bank’s response to the ACH-related fraud? FY 2012 Bank was able identify the account compromised and prevent any transfer of funds (Go to Q.27) 31% Bank discovered the attempted transfer of funds and stopped it from occurring (Go to Q.27) 25% Money was transferred, but the bank recovered all my company’s stolen funds (Go to Q.27) 21% Money was transferred, but the bank recovered some of my company’s stolen funds 15% The bank was not able to stop the ACH-related fraud and money was stolen 8% Total 100% Q26b. If funds were stolen as a result of the ACH-related fraud, how did your bank respond? FY 2012 The bank reimbursed my company partially for any unrecovered funds 31% The bank reimbursed my company fully for any unrecovered funds 23% The bank did not compensate by company for any unrecovered funds 46% Total 100% Q26c. Approximately (best guess), what was the total cost of the ACH fraud to your company? FY 2012 Nothing 0% Between $1 and $1,000 11% Between $1,001 and $5,000 13% Between $5,001 and $10,000 16% Between $10,001 and $25,000 21% Between $25,001 and $50,000 19% Between $50,001 and $100,000 9% More than $100,000 4% Unable to determine 7% Total 100%
Ponemon Institute© Research Report Page 36
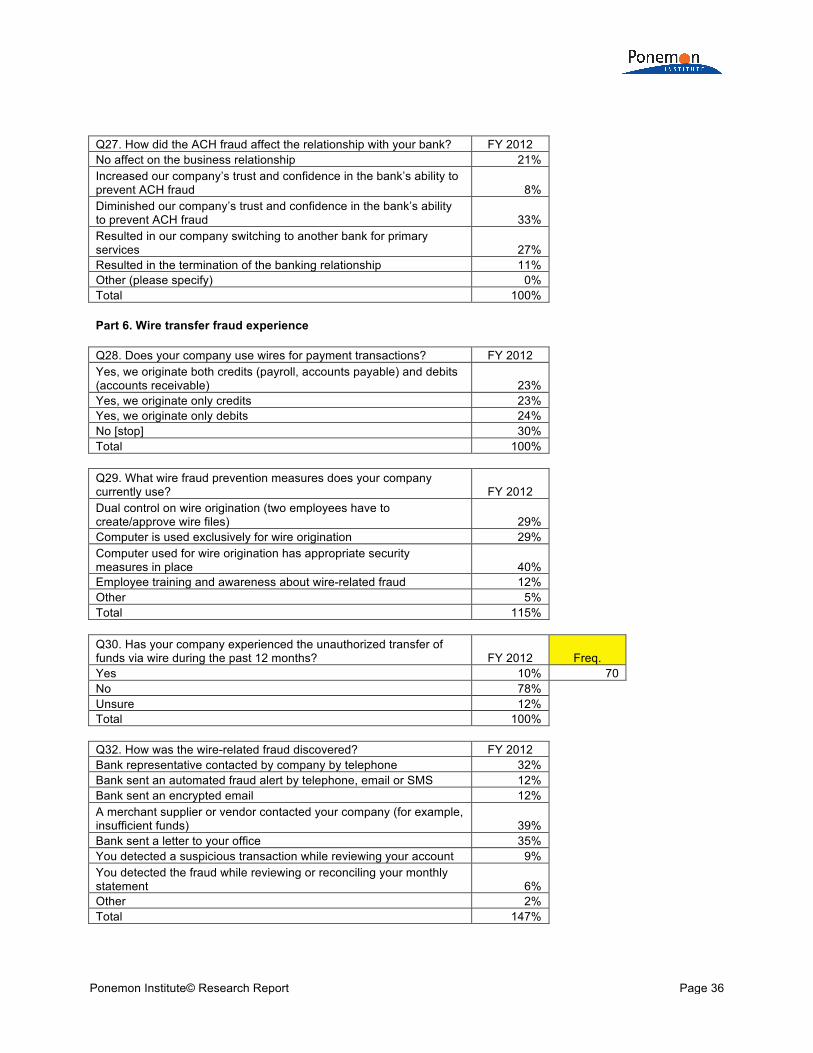
Q27. How did the ACH fraud affect the relationship with your bank? FY 2012 No affect on the business relationship 21% Increased our company’s trust and confidence in the bank’s ability to prevent ACH fraud 8% Diminished our company’s trust and confidence in the bank’s ability to prevent ACH fraud 33% Resulted in our company switching to another bank for primary services 27% Resulted in the termination of the banking relationship 11% Other (please specify) 0% Total 100% Part 6. Wire transfer fraud experience Q28. Does your company use wires for payment transactions? FY 2012 Yes, we originate both credits (payroll, accounts payable) and debits (accounts receivable) 23% Yes, we originate only credits 23% Yes, we originate only debits 24% No [stop] 30% Total 100%
Q29. What wire fraud prevention measures does your company currently use? FY 2012 Dual control on wire origination (two employees have to create/approve wire files) 29% Computer is used exclusively for wire origination 29% Computer used for wire origination has appropriate security measures in place 40% Employee training and awareness about wire-related fraud 12% Other 5% Total 115%
Q30. Has your company experienced the unauthorized transfer of funds via wire during the past 12 months? FY 2012 Freq. Yes 10% 70 No 78% Unsure 12% Total 100% Q32. How was the wire-related fraud discovered? FY 2012 Bank representative contacted by company by telephone 32% Bank sent an automated fraud alert by telephone, email or SMS 12% Bank sent an encrypted email 12% A merchant supplier or vendor contacted your company (for example, insufficient funds) 39% Bank sent a letter to your office 35% You detected a suspicious transaction while reviewing your account 9% You detected the fraud while reviewing or reconciling your monthly statement 6% Other 2% Total 147%
Ponemon Institute© Research Report Page 37
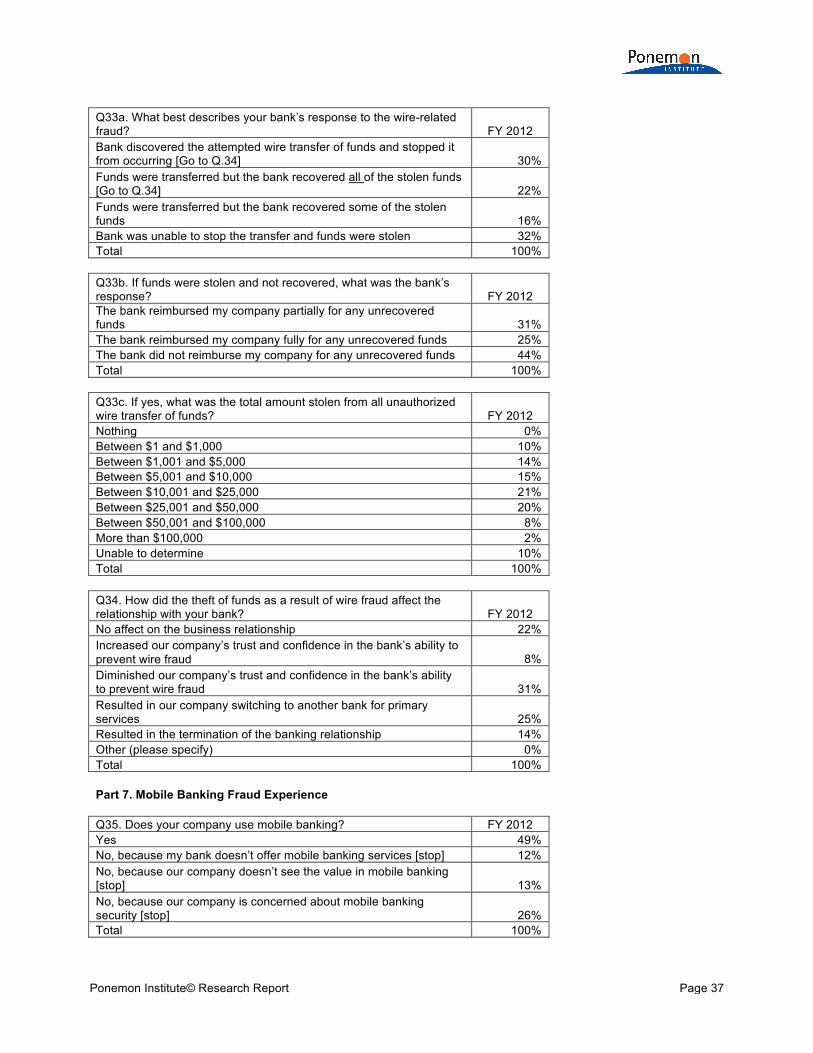
Q33a. What best describes your bank’s response to the wire-related fraud? FY 2012 Bank discovered the attempted wire transfer of funds and stopped it from occurring [Go to Q.34] 30% Funds were transferred but the bank recovered all of the stolen funds [Go to Q.34] 22% Funds were transferred but the bank recovered some of the stolen funds 16% Bank was unable to stop the transfer and funds were stolen 32% Total 100%
Q33b. If funds were stolen and not recovered, what was the bank’s response? FY 2012 The bank reimbursed my company partially for any unrecovered funds 31% The bank reimbursed my company fully for any unrecovered funds 25% The bank did not reimburse my company for any unrecovered funds 44% Total 100%
Q33c. If yes, what was the total amount stolen from all unauthorized wire transfer of funds? FY 2012 Nothing 0% Between $1 and $1,000 10% Between $1,001 and $5,000 14% Between $5,001 and $10,000 15% Between $10,001 and $25,000 21% Between $25,001 and $50,000 20% Between $50,001 and $100,000 8% More than $100,000 2% Unable to determine 10% Total 100% Q34. How did the theft of funds as a result of wire fraud affect the relationship with your bank? FY 2012 No affect on the business relationship 22% Increased our company’s trust and confidence in the bank’s ability to prevent wire fraud 8% Diminished our company’s trust and confidence in the bank’s ability to prevent wire fraud 31% Resulted in our company switching to another bank for primary services 25% Resulted in the termination of the banking relationship 14% Other (please specify) 0% Total 100%
Part 7. Mobile Banking Fraud Experience
Q35. Does your company use mobile banking? FY 2012 Yes 49% No, because my bank doesn’t offer mobile banking services [stop] 12% No, because our company doesn’t see the value in mobile banking [stop] 13% No, because our company is concerned about mobile banking security [stop] 26% Total 100%

Ponemon Institute© Research Report Page 38
Q36. What types of your company’s banking transactions are conducted using a mobile device? FY 2012 Payment process 41% Access to bank statements 43% Domestic and international fund transfer 26% Investment and portfolio management 20% Accounts receivable management 15% Automated tax and payroll payments 30% Credit or debit card management 19% Other 2% Total 196% Q37. Has your company experienced fraud due to mobile banking during the past 12 months? FY 2012 Freq. Yes 11% 54 No [stop] 70% Unsure [stop] 19% Total 100% Q38. How was the mobile banking fraud discovered? FY 2012 Bank representative contacted by company by telephone 29% Bank sent an automated fraud alert by telephone, email or SMS 25% Bank sent an encrypted email 12% A merchant supplier or vendor contacted your company (for example, insufficient funds) 32% Bank sent a letter to your office 35% You detected a suspicious transaction while reviewing your account online 9% You detected the fraud while reviewing or reconciling your monthly statement 9% Other 0% Total 151%
Q39a. What best describes your bank’s response to the mobile banking fraud? FY 2012 Bank discovered the attempted transfer of funds and stopped it from occurring [proceed to Q.40] 31% Funds were transferred but the bank recovered all of the stolen funds [proceed to Q.40] 25% Funds were transferred but the bank recovered some of the stolen funds 15% Bank was unable to stop the transfer and funds were stolen 29% Total 100%
Q39b. If funds were stolen, what was the bank’s response? FY 2012 The bank reimbursed by company partially for any unrecovered funds 29% The bank reimbursed my company fully for an unrecovered funds 40% The bank did not reimburse my company for any unrecovered funds 31% Total 100%

Ponemon Institute© Research Report Page 39
Q39c. If funds were stolen, what was the total amount stolen as a result of mobile banking fraud? FY 2012 Nothing 0% Between $1 and $1,000 15% Between $1,001 and $5,000 19% Between $5,001 and $10,000 23% Between $10,001 and $25,000 18% Between $25,001 and $50,000 12% Between $50,001 and $100,000 3% More than $100,000 0% Unable to determine 10% Total 100%
Q40. How did the theft of funds as a result of mobile banking fraud affect the relationship with your bank? FY 2012 No affect on the business relationship 24% Increased our company’s trust and confidence in the bank’s ability to prevent mobile banking fraud 9% Diminished our company’s trust and confidence in the bank’s ability to prevent mobile banking fraud 25% Resulted in our company switching to another bank for primary services 20% Resulted in the termination of the banking relationship 15% Other (please specify) 7% Total 100% Part 5: Your role and company D1. Check the primary functions you provide in the organization. Check all that apply. FY 2012 FY 2011 FY 2010 General management 77% 75% 71% Operations 35% 43% 35% Logistics 18% 19% 15% Marketing 20% 19% 21% Sales 22% 26% 18% Human resources 32% 33% 29% Accounting & finance 61% 62% 56% Other 4% 3% 5% Total 280% 250% D2. Where is your company headquartered? FY 2012 FY 2011 FY 2010 Northeast 19% 19% 20% Mid-Atlantic 18% 18% 19% Midwest 17% 18% 18% Southeast 13% 14% 13% Southwest 13% 12% 12% Pacific 19% 19% 19% Total 100% 101%
Ponemon Institute© Research Report Page 40
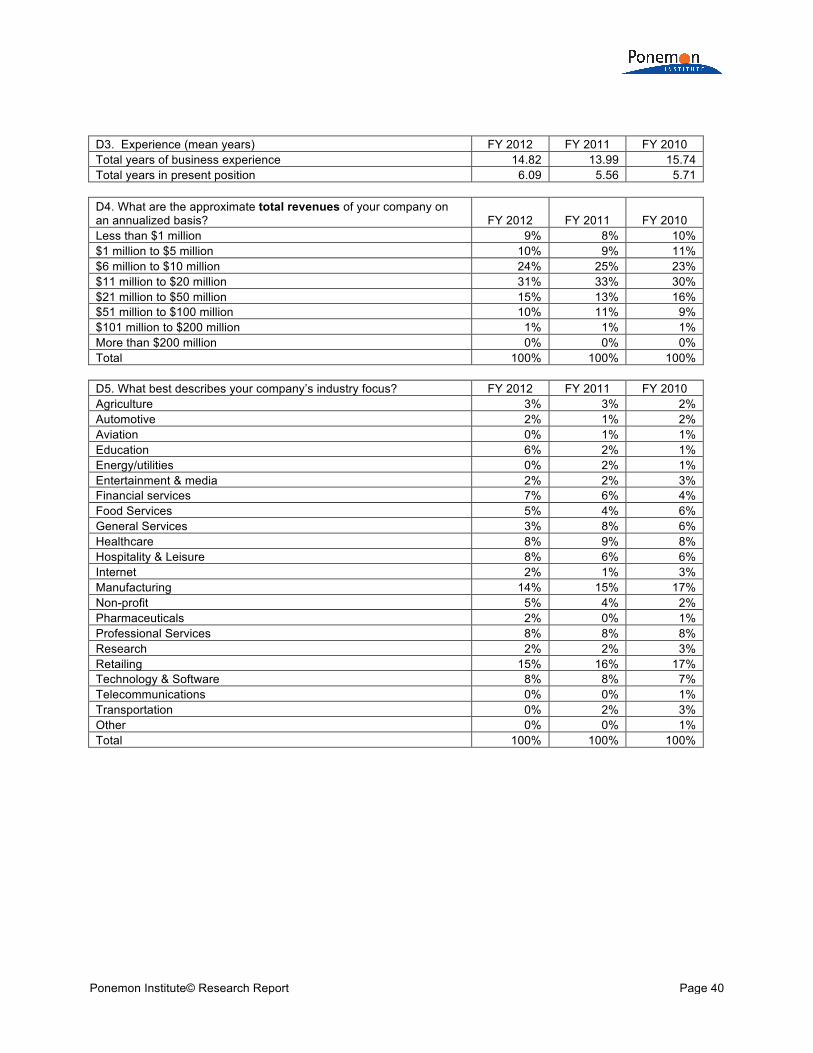
D3. Experience (mean years) FY 2012 FY 2011 FY 2010 Total years of business experience 14.82 13.99 15.74 Total years in present position 6.09 5.56 5.71 D4. What are the approximate total revenues of your company on an annualized basis? FY 2012 FY 2011 FY 2010 Less than $1 million 9% 8% 10% $1 million to $5 million 10% 9% 11% $6 million to $10 million 24% 25% 23% $11 million to $20 million 31% 33% 30% $21 million to $50 million 15% 13% 16% $51 million to $100 million 10% 11% 9% $101 million to $200 million 1% 1% 1% More than $200 million 0% 0% 0% Total 100% 100% 100% D5. What best describes your company’s industry focus? FY 2012 FY 2011 FY 2010 Agriculture 3% 3% 2% Automotive 2% 1% 2% Aviation 0% 1% 1% Education 6% 2% 1% Energy/utilities 0% 2% 1% Entertainment & media 2% 2% 3% Financial services 7% 6% 4% Food Services 5% 4% 6% General Services 3% 8% 6% Healthcare 8% 9% 8% Hospitality & Leisure 8% 6% 6% Internet 2% 1% 3% Manufacturing 14% 15% 17% Non-profit 5% 4% 2% Pharmaceuticals 2% 0% 1% Professional Services 8% 8% 8% Research 2% 2% 3% Retailing 15% 16% 17% Technology & Software 8% 8% 7% Telecommunications 0% 0% 1% Transportation 0% 2% 3% Other 0% 0% 1% Total 100% 100% 100%

Ponemon Institute© Research Report Page 41
For more information about this study, please contact Ponemon Institute by sending an email to [email protected] or calling our toll free line at 1.800.887.3118.
Ponemon Institute
Advancing Responsible Information Management
Ponemon Institute is dedicated to independent research and education that advances responsible information and privacy management practices within business and government. Our mission is to conduct high quality, empirical studies on critical issues affecting the management and security of sensitive information about people and organizations.
As a member of the Council of American Survey Research Organizations (CASRO), we uphold strict data confidentiality, privacy and ethical research standards. We do not collect any personally identifiable information from individuals (or company identifiable information in our business research). Furthermore, we have strict quality standards to ensure that subjects are not asked extraneous, irrelevant or improper questions.