2012 combined
DESCRIPTION
2012 combinedTRANSCRIPT

Investor Conference New York
March 7, 2012
Agenda
Introduction
Automation and Control Solutions
Growth Through Acquisitions
Performance Materials and Technologies
Q&A
Transportation Systems
Honeywell Operating System
Aerospace
Q&A
High Growth Regions
Financial Review
Q&A
Concluding Remarks
Lunch Breakout
Dave Cote
Roger Fradin
Anne Madden, Mark Levy
Andreas Kramvis, Ian Shankland
Alex Ismail
Pasquale Abruzzese, Mike Owens
Tim Mahoney
Shane Tedjarati
Dave Anderson
Dave Cote
Break
10:30
12:20
2:15
3:25 End

The materials to be presented at the Honeywell 2012 Investor Conference contain
“forward-looking statements” within the meaning of Section 21E of the Securities
Exchange Act of 1934. All statements, other than statements of fact, that address
activities, events or developments that we or our management intend, expect,
project, believe or anticipate will or may occur in the future are forward-looking
statements. Forward-looking statements are based on management’s assumptions
and assessments in light of past experience and trends, current economic and
industry conditions, expected future developments and other relevant factors. They
are not guarantees of future performance, and actual results, developments and
business decisions may differ from those envisaged by our forward-looking
statements. Our forward-looking statements are also subject to risks and
uncertainties, which can affect our performance in both the near- and long-term.
We identify the principal risks and uncertainties that affect our performance in our
Form 10-K and other filings with the Securities and Exchange Commission.
Forward Looking Statements

Honeywell Investor Conference – March 7, 2012 Introduction 0
Introduction Dave Cote
Chairman and CEO
Honeywell Investor Conference – March 7, 2012 Introduction 1
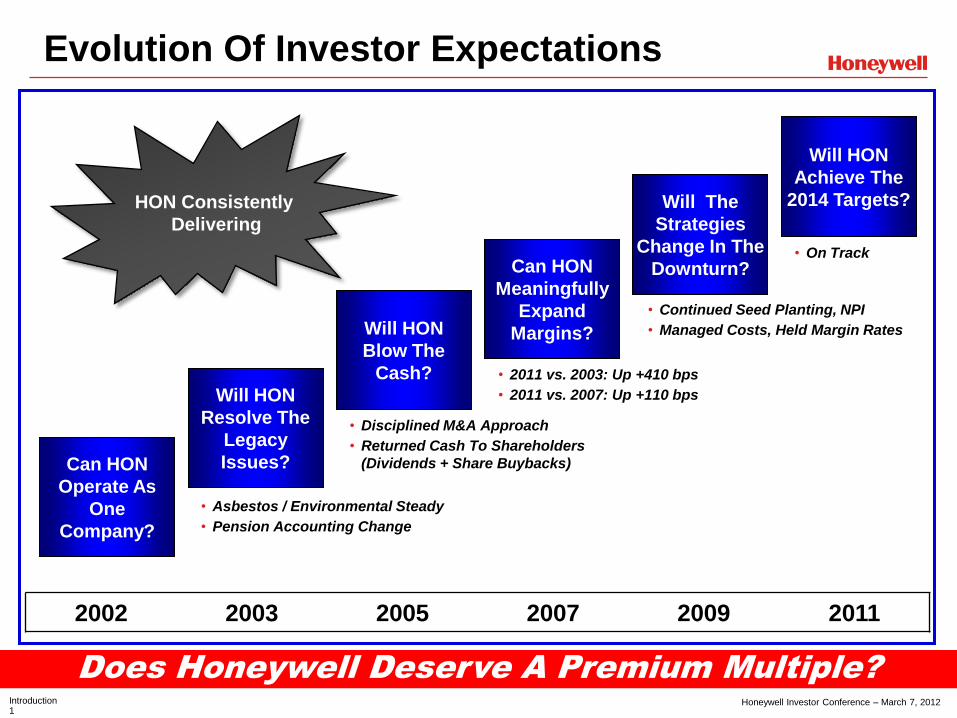
Evolution Of Investor Expectations
Does Honeywell Deserve A Premium Multiple?
Can HON
Operate As
One
Company?
Will HON
Resolve The
Legacy
Issues?
Will HON
Blow The
Cash?
Can HON
Meaningfully
Expand
Margins?
Will The
Strategies
Change In The
Downturn?
Will HON
Achieve The
2014 Targets?
• Asbestos / Environmental Steady
• Pension Accounting Change
2002 2003 2005 2007 2009 2011
• Disciplined M&A Approach
• Returned Cash To Shareholders
(Dividends + Share Buybacks)
• 2011 vs. 2003: Up +410 bps
• 2011 vs. 2007: Up +110 bps
• Continued Seed Planting, NPI
• Managed Costs, Held Margin Rates
HON Consistently
Delivering
• On Track
Honeywell Investor Conference – March 7, 2012 Introduction 2
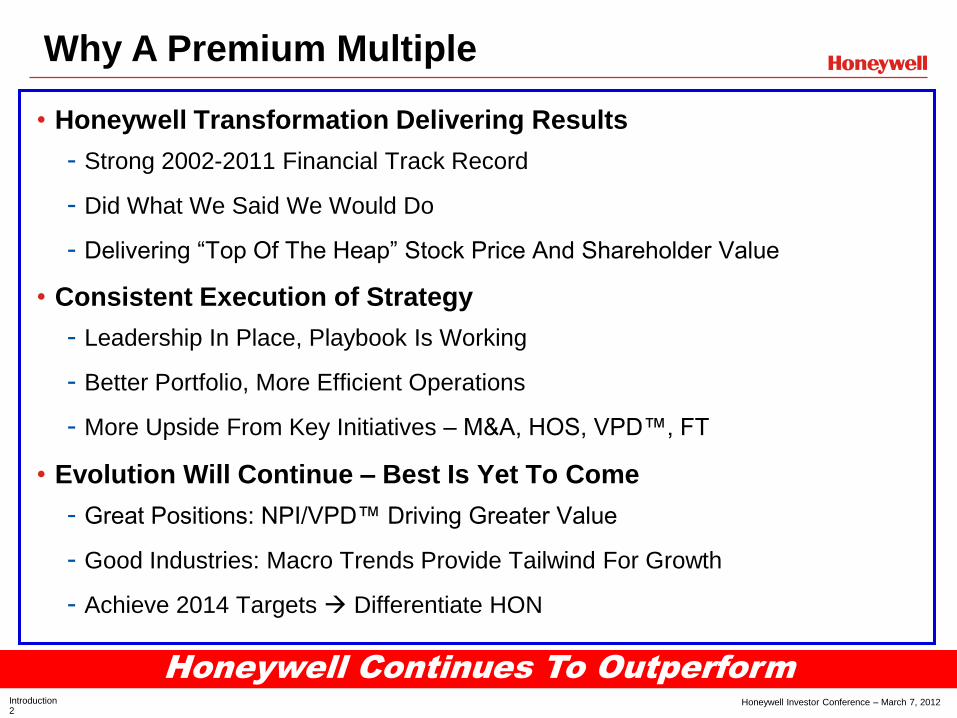
Why A Premium Multiple
Honeywell Continues To Outperform
• Honeywell Transformation Delivering Results
- Strong 2002-2011 Financial Track Record
- Did What We Said We Would Do
- Delivering “Top Of The Heap” Stock Price And Shareholder Value
• Consistent Execution of Strategy
- Leadership In Place, Playbook Is Working
- Better Portfolio, More Efficient Operations
- More Upside From Key Initiatives – M&A, HOS, VPD™, FT
• Evolution Will Continue – Best Is Yet To Come
- Great Positions: NPI/VPD™ Driving Greater Value
- Good Industries: Macro Trends Provide Tailwind For Growth
- Achieve 2014 Targets Differentiate HON

Honeywell Investor Conference – March 7, 2012 Introduction 3
$21.3
41%
$2.01 $1.8
$36.5
54%
$4.05
$3.7
Sales $B Sales Outside The U.S. EPS (Proforma)* FCF $B **
Financial Strength Last 10 Years
Significant Growth In All Key Metrics
2002 2011 2002 2011 2002 2011 2002 2011
* Proforma Excludes one-time / unusual charges; **FCF Prior to U.S. Cash Pension Contributions
+72% +13pts +101% +100%

Honeywell Investor Conference – March 7, 2012 Introduction 4
$0.75
$1.49
2002 2011
HON S&P 500
Shareholder Return
Great Return To Shareholders
Stock Price Appreciation Dividend Growth*
$32.65
$60.10
750
950
1,150
1,350
1,550
1,750
1,950
2,150
2,350
2/19/2002 2/17/2012
HON S&P 500
HON
+84%
S&P
+26%
HON
+98%
S&P
+78%
Outpacing Overall Market Returning Greater Value To Shareholders
Through Dividend Increases
* Based on (dividend yield)*(share price) as of 12/31/2002 and 12/31/2011
Honeywell Investor Conference – March 7, 2012 Introduction 5
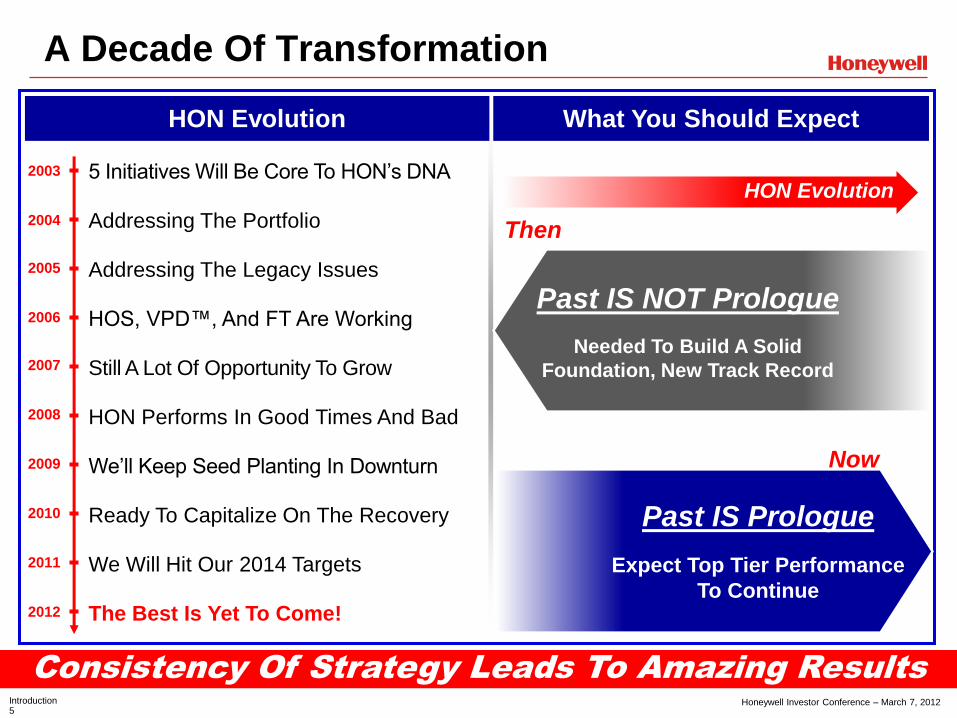
HON Evolution
A Decade Of Transformation
Consistency Of Strategy Leads To Amazing Results
HON Evolution What You Should Expect
5 Initiatives Will Be Core To HON’s DNA 2003
2005
2007
2008
2009
2010
2011
2012
Addressing The Portfolio
HON Performs In Good Times And Bad
2004
2006
The Best Is Yet To Come!
We Will Hit Our 2014 Targets
Ready To Capitalize On The Recovery
We’ll Keep Seed Planting In Downturn
Addressing The Legacy Issues
HOS, VPD™, And FT Are Working
Still A Lot Of Opportunity To Grow
Past IS Prologue
Expect Top Tier Performance
To Continue
Past IS NOT Prologue
Needed To Build A Solid
Foundation, New Track Record
Then
Now
Honeywell Investor Conference – March 7, 2012 Introduction 6
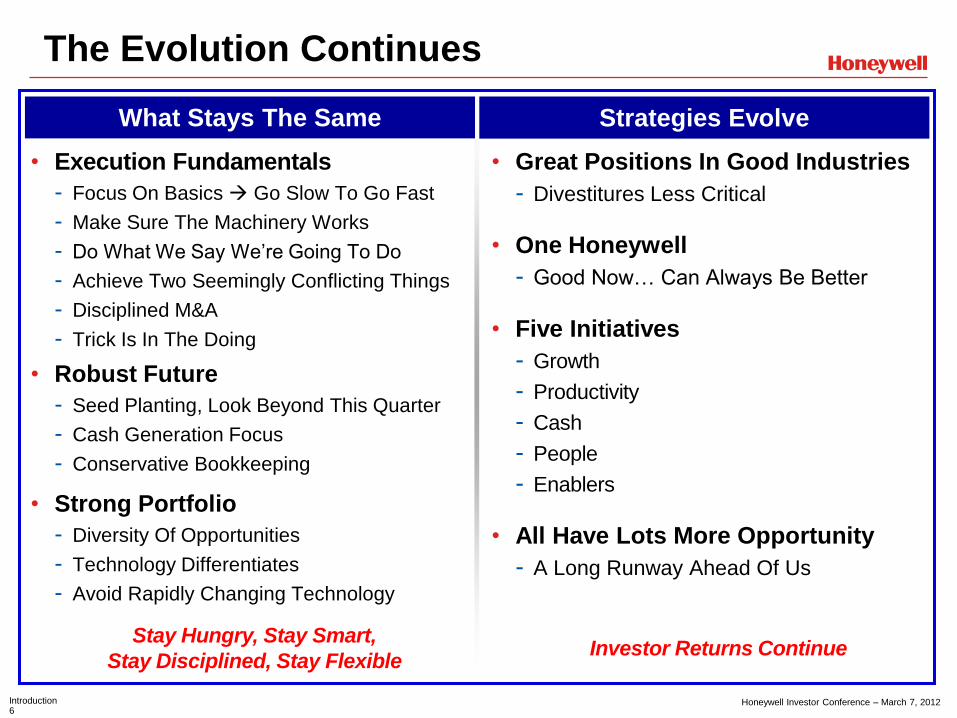
• Execution Fundamentals
- Focus On Basics Go Slow To Go Fast
- Make Sure The Machinery Works
- Do What We Say We’re Going To Do
- Achieve Two Seemingly Conflicting Things
- Disciplined M&A
- Trick Is In The Doing
• Robust Future
- Seed Planting, Look Beyond This Quarter
- Cash Generation Focus
- Conservative Bookkeeping
• Strong Portfolio
- Diversity Of Opportunities
- Technology Differentiates
- Avoid Rapidly Changing Technology
The Evolution Continues
What Stays The Same Strategies Evolve
• Great Positions In Good Industries
- Divestitures Less Critical
• One Honeywell
- Good Now… Can Always Be Better
• Five Initiatives
- Growth
- Productivity
- Cash
- People
- Enablers
• All Have Lots More Opportunity
- A Long Runway Ahead Of Us
Stay Hungry, Stay Smart,
Stay Disciplined, Stay Flexible Investor Returns Continue
Honeywell Investor Conference – March 7, 2012 Introduction 7
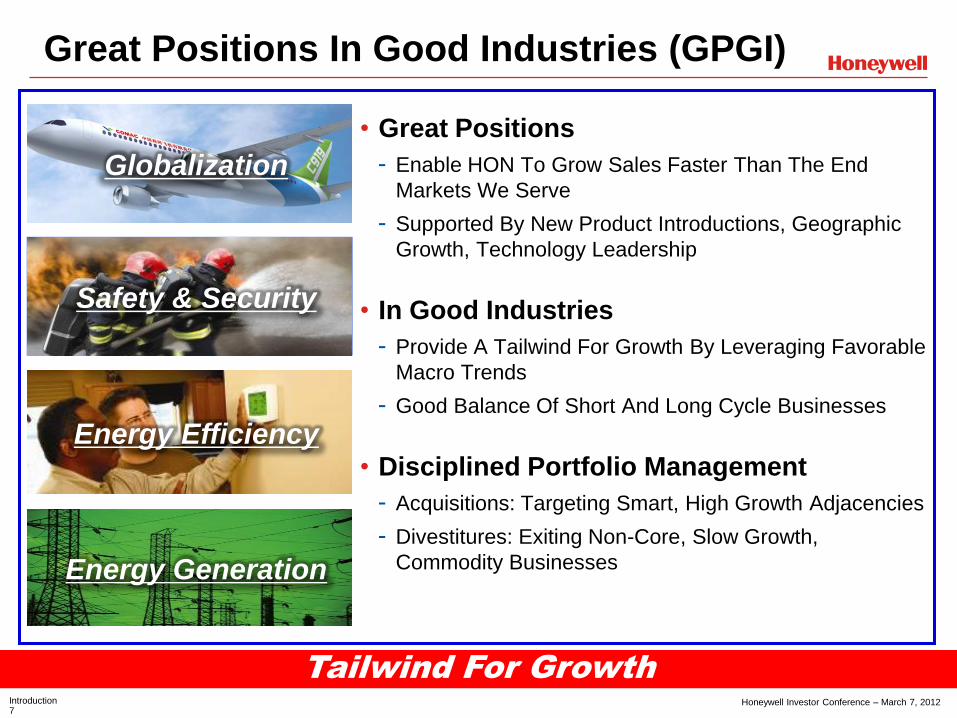
Great Positions In Good Industries (GPGI)
Tailwind For Growth
• Great Positions
- Enable HON To Grow Sales Faster Than The End
Markets We Serve
- Supported By New Product Introductions, Geographic
Growth, Technology Leadership
• In Good Industries
- Provide A Tailwind For Growth By Leveraging Favorable
Macro Trends
- Good Balance Of Short And Long Cycle Businesses
• Disciplined Portfolio Management
- Acquisitions: Targeting Smart, High Growth Adjacencies
- Divestitures: Exiting Non-Core, Slow Growth,
Commodity Businesses
Energy Efficiency
Energy Generation
Safety & Security
Globalization

Honeywell Investor Conference – March 7, 2012 Introduction 8
GPGI Examples
HON Well Aligned With Strong Macro Trends
AERO
ACS
PMT
TS
• Globalization
• Safety & Security
• Energy Efficiency
• Energy Gen
• Global OE Wins Outpacing Platform Growth
• Mix Shift To High Growth Regions
• Unmatched Safety And Efficiency Wins
• D&S International Opportunities
• Top Tier Leadership Position Across Segments
• New Products Driving Growth, Pricing Opportunity
• 50% of Growth Coming From High Growth Regions
• ACS Portfolio Strongly Linked to Energy Efficiency
• Refining / Petrochemical / Gas Investment
• Leading Global Resins Supplier
• New Products / Molecules / Refrigerants
• Regulations Providing Tailwind
• Fuel Efficiency And Emissions Legislation
• Win Rate Exceeds Launches In All Segments
• Global Turbo Penetration Multiyear High
• Leveraging Linkages With Other SBGs
• Globalization
• Safety & Security
• Energy Efficiency
• Energy Gen
• Globalization
• Safety & Security
• Energy Efficiency
• Energy Gen
• Globalization
• Safety & Security
• Energy Efficiency
• Energy Gen
Honeywell Investor Conference – March 7, 2012 Introduction 9
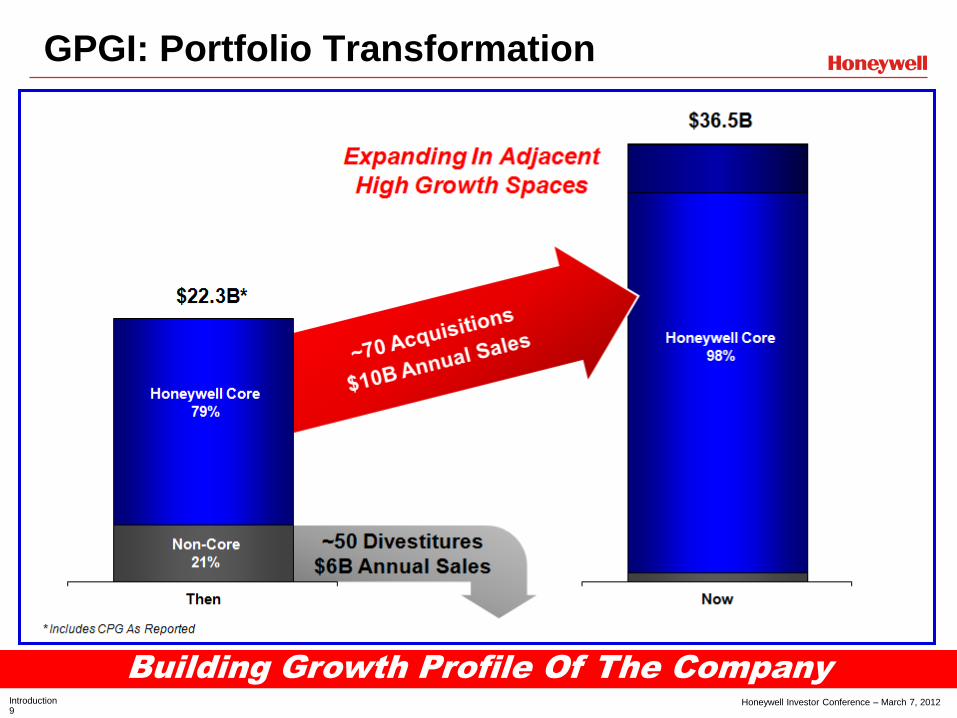
GPGI: Portfolio Transformation
Building Growth Profile Of The Company
Honeywell Investor Conference – March 7, 2012 Introduction 10
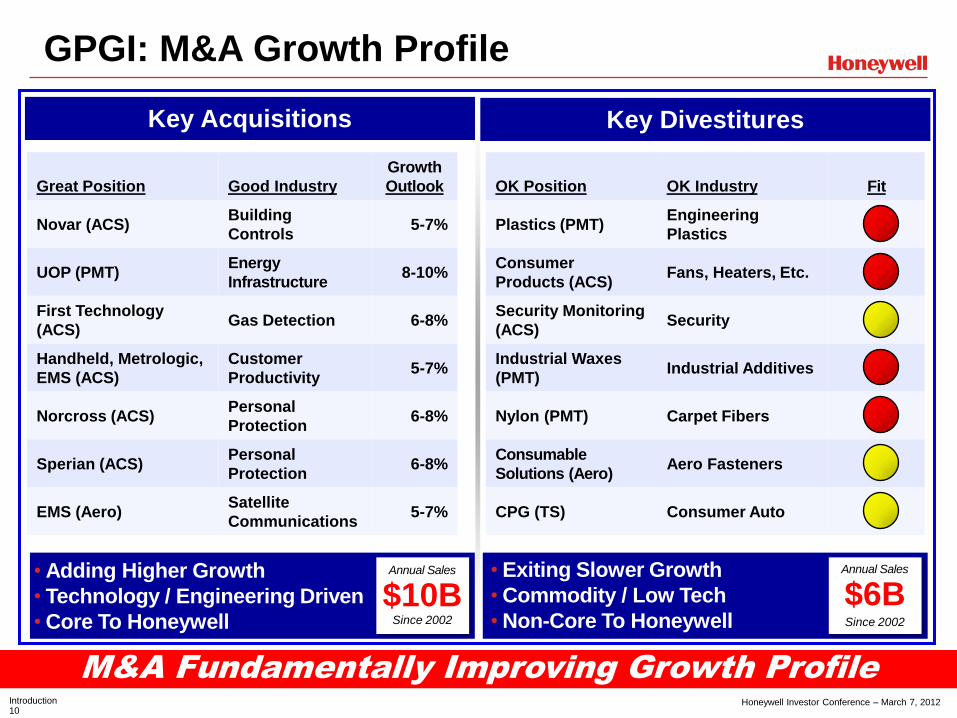
• Adding Higher Growth
• Technology / Engineering Driven
• Core To Honeywell
Great Position Good Industry
Growth
Outlook
Novar (ACS) Building
Controls 5-7%
UOP (PMT) Energy
Infrastructure 8-10%
First Technology
(ACS) Gas Detection 6-8%
Handheld, Metrologic,
EMS (ACS)
Customer
Productivity 5-7%
Norcross (ACS) Personal
Protection 6-8%
Sperian (ACS) Personal
Protection 6-8%
EMS (Aero) Satellite
Communications 5-7%
GPGI: M&A Growth Profile
M&A Fundamentally Improving Growth Profile
Key Acquisitions Key Divestitures
• Exiting Slower Growth
• Commodity / Low Tech
• Non-Core To Honeywell
OK Position OK Industry Fit
Plastics (PMT) Engineering
Plastics
Consumer
Products (ACS) Fans, Heaters, Etc.
Security Monitoring
(ACS) Security
Industrial Waxes
(PMT) Industrial Additives
Nylon (PMT) Carpet Fibers
Consumable
Solutions (Aero) Aero Fasteners
CPG (TS) Consumer Auto
$10B Since 2002
$6B Since 2002
Annual Sales Annual Sales
Honeywell Investor Conference – March 7, 2012 Introduction 11
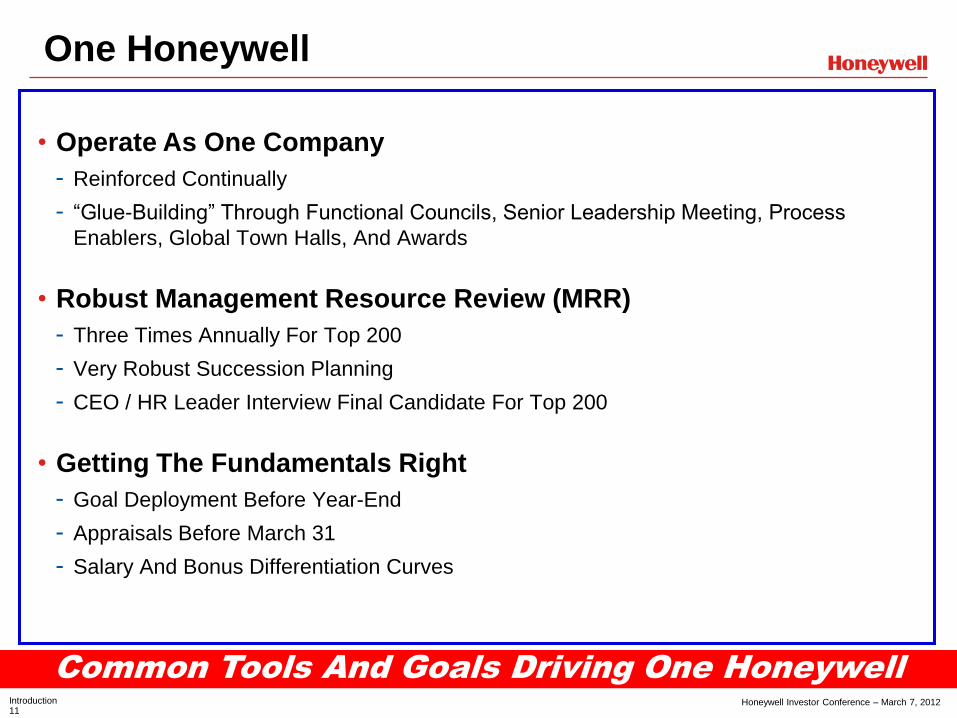
One Honeywell
Common Tools And Goals Driving One Honeywell
• Operate As One Company
- Reinforced Continually
- “Glue-Building” Through Functional Councils, Senior Leadership Meeting, Process
Enablers, Global Town Halls, And Awards
• Robust Management Resource Review (MRR)
- Three Times Annually For Top 200
- Very Robust Succession Planning
- CEO / HR Leader Interview Final Candidate For Top 200
• Getting The Fundamentals Right
- Goal Deployment Before Year-End
- Appraisals Before March 31
- Salary And Bonus Differentiation Curves

Honeywell Investor Conference – March 7, 2012 Introduction 12
Growth: From / To
Pace Continues
New Products Global Expansion
From To
Cupboards
Bare
500+ Launches
Per Year
59% 46%
41% 54%
From To
U.S. Non-U.S.
(% Of HON Sales)
From To
China & India Other HGR
~$7B
~17%
CAGR
High Growth Regions
~$2B
Exposure To Fast
Growing Economies
Expanding
Internationally Seed Planting
Honeywell Investor Conference – March 7, 2012 Introduction 13
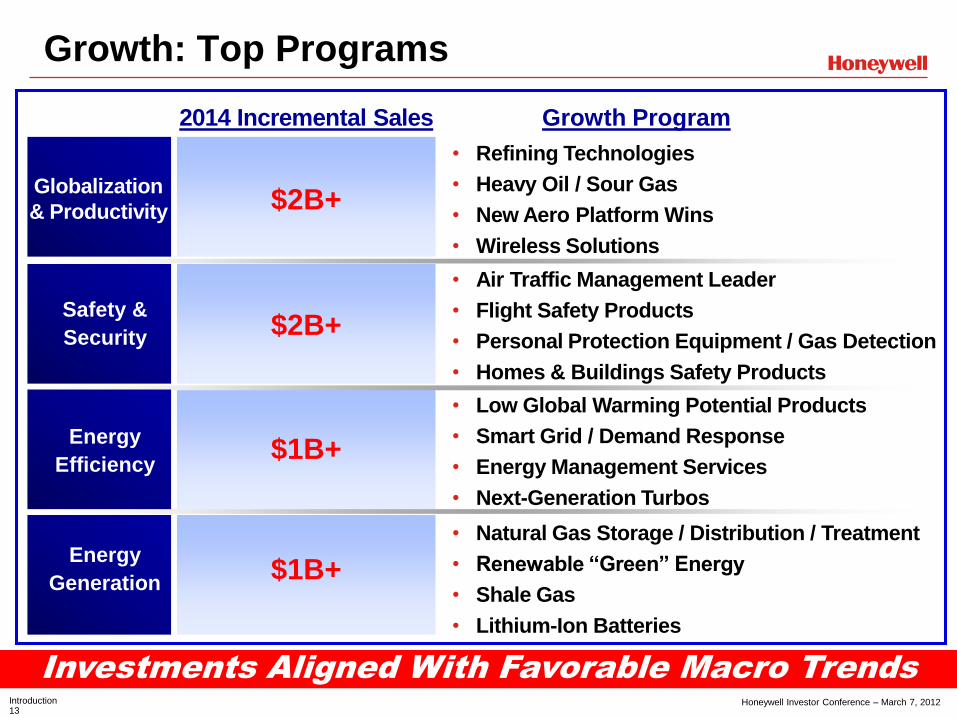
Growth: Top Programs
Investments Aligned With Favorable Macro Trends
Globalization
& Productivity
Safety &
Security
Energy
Efficiency
Energy
Generation
2014 Incremental Sales
• Refining Technologies
• Heavy Oil / Sour Gas
• New Aero Platform Wins
• Wireless Solutions
• Air Traffic Management Leader
• Flight Safety Products
• Personal Protection Equipment / Gas Detection
• Homes & Buildings Safety Products
• Low Global Warming Potential Products
• Smart Grid / Demand Response
• Energy Management Services
• Next-Generation Turbos
• Natural Gas Storage / Distribution / Treatment
• Renewable “Green” Energy
• Shale Gas
• Lithium-Ion Batteries
$2B+
$2B+
$1B+
$1B+
Growth Program
Honeywell Investor Conference – March 7, 2012 Introduction 14
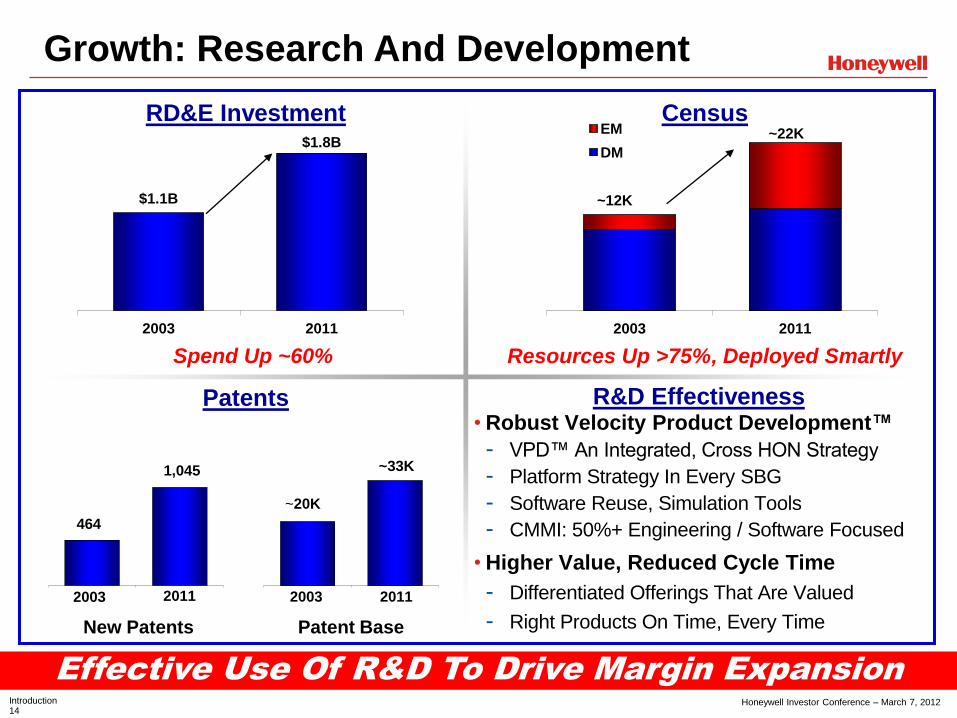
Effective Use Of R&D To Drive Margin Expansion
RD&E Investment
2003 2011
EM
DM
Census
Resources Up >75%, Deployed Smartly
New Patents Patent Base
~12K
~22K
R&D Effectiveness
2003 2009
2003 2011 2003 2010
2003 2011
464
1,045 ~33K
~20K
$1.1B
$1.8B
2003 2011
• Robust Velocity Product Development™
- VPD™ An Integrated, Cross HON Strategy
- Platform Strategy In Every SBG
- Software Reuse, Simulation Tools
- CMMI: 50%+ Engineering / Software Focused
• Higher Value, Reduced Cycle Time
- Differentiated Offerings That Are Valued
- Right Products On Time, Every Time
Growth: Research And Development
Patents
Spend Up ~60%
Honeywell Investor Conference – March 7, 2012 Introduction 15
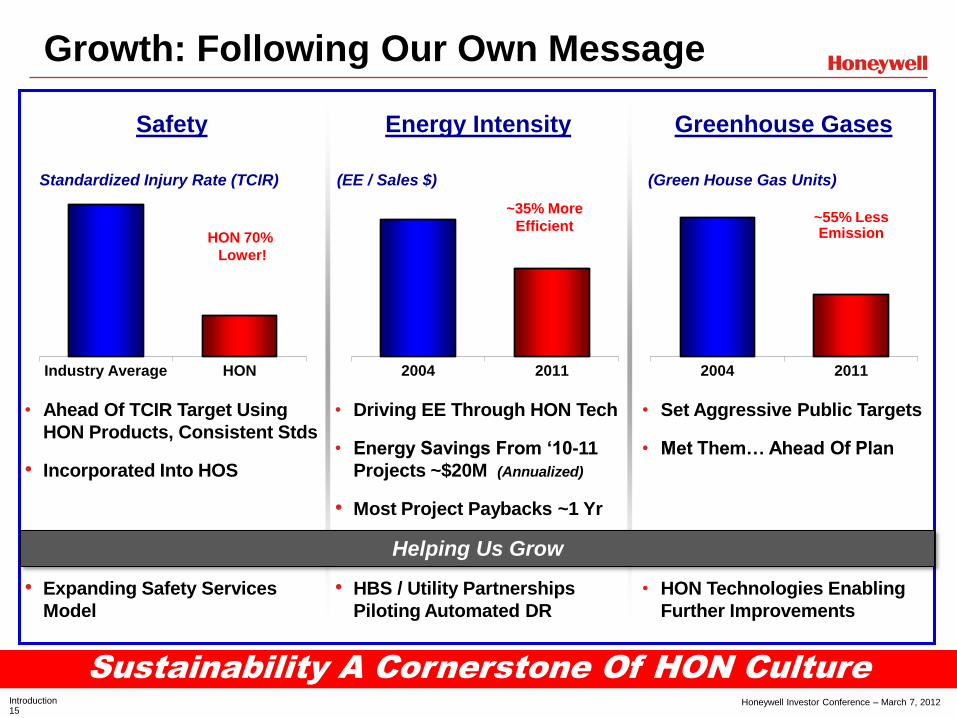
2004 2011
Growth: Following Our Own Message
Sustainability A Cornerstone Of HON Culture
Safety Greenhouse Gases Energy Intensity
• Ahead Of TCIR Target Using
HON Products, Consistent Stds
• Incorporated Into HOS
Industry Average HON
HON 70%
Lower!
• Set Aggressive Public Targets
• Met Them… Ahead Of Plan
Standardized Injury Rate (TCIR) (Green House Gas Units)
~55% Less Emission
(EE / Sales $)
2004 2011
~35% More
Efficient
• Driving EE Through HON Tech
• Energy Savings From ‘10-11
Projects ~$20M (Annualized)
• Most Project Paybacks ~1 Yr
• Expanding Safety Services
Model
• HBS / Utility Partnerships
Piloting Automated DR
• HON Technologies Enabling
Further Improvements
Helping Us Grow
Honeywell Investor Conference – March 7, 2012 Introduction 16
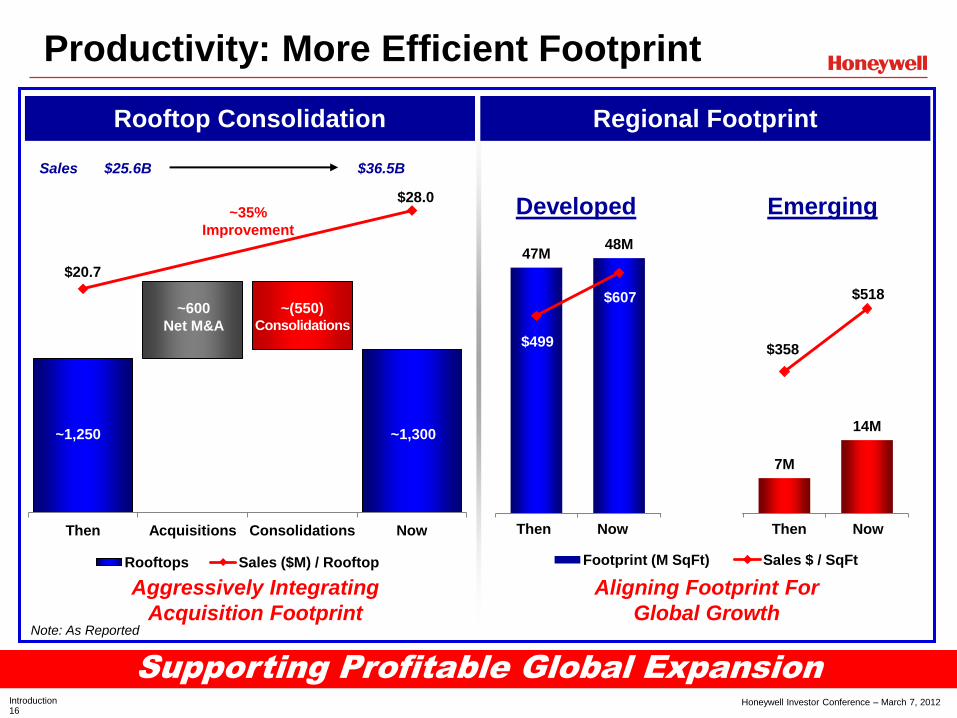
Productivity: More Efficient Footprint
Supporting Profitable Global Expansion
Rooftop Consolidation Regional Footprint
$20.7
$28.0
Then Acquisitions Consolidations Now
Rooftops Sales ($M) / Rooftop
Aggressively Integrating
Acquisition Footprint
47M 48M
7M
14M
$499
$607
$358
$518
Then DM Now DM (skip) Then EM Now EM
Footprint (M SqFt) Sales $ / SqFt
Aligning Footprint For
Global Growth
Then Now Then Now
Emerging Developed
Note: As Reported
$25.6B $36.5B Sales
~35%
Improvement
~1,250 ~1,300
~600
Net M&A
~(550) Consolidations
Honeywell Investor Conference – March 7, 2012 Introduction 17
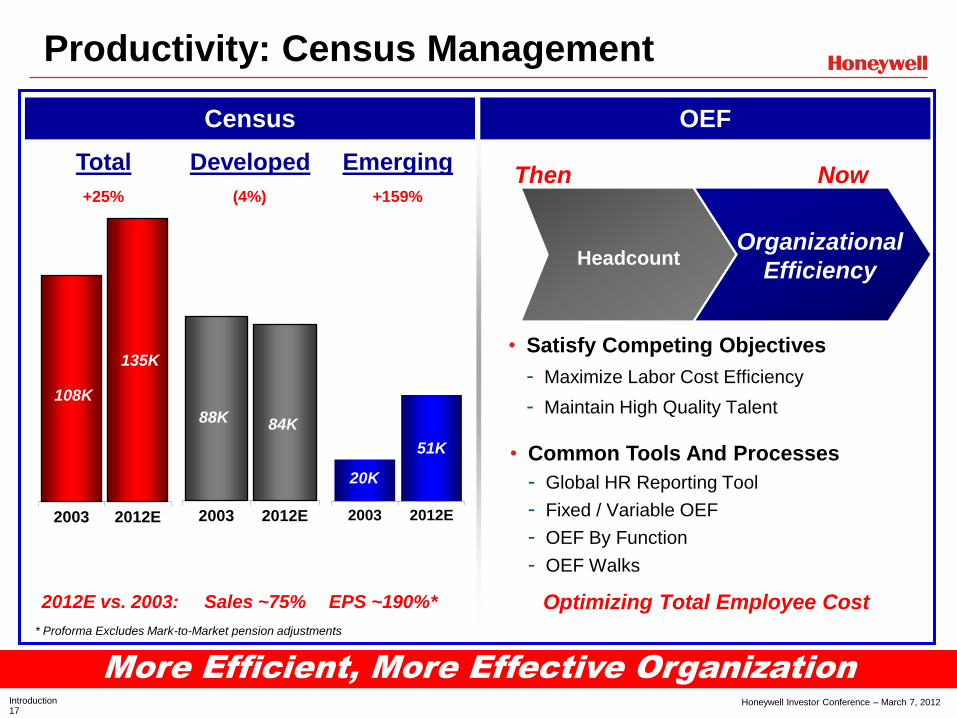
Productivity: Census Management
More Efficient, More Effective Organization
2003 2012E 2003 2012E
Developed
88K
20K
2003 2012E
108K
84K
51K
135K
(4%) +159% +25%
2012E vs. 2003: Sales ~75% EPS ~190%*
Emerging Total
Census OEF
• Satisfy Competing Objectives
- Maximize Labor Cost Efficiency
- Maintain High Quality Talent
• Common Tools And Processes
- Global HR Reporting Tool
- Fixed / Variable OEF
- OEF By Function
- OEF Walks
Headcount Organizational
Efficiency
Then Now
Optimizing Total Employee Cost
* Proforma Excludes Mark-to-Market pension adjustments
Honeywell Investor Conference – March 7, 2012 Introduction 18
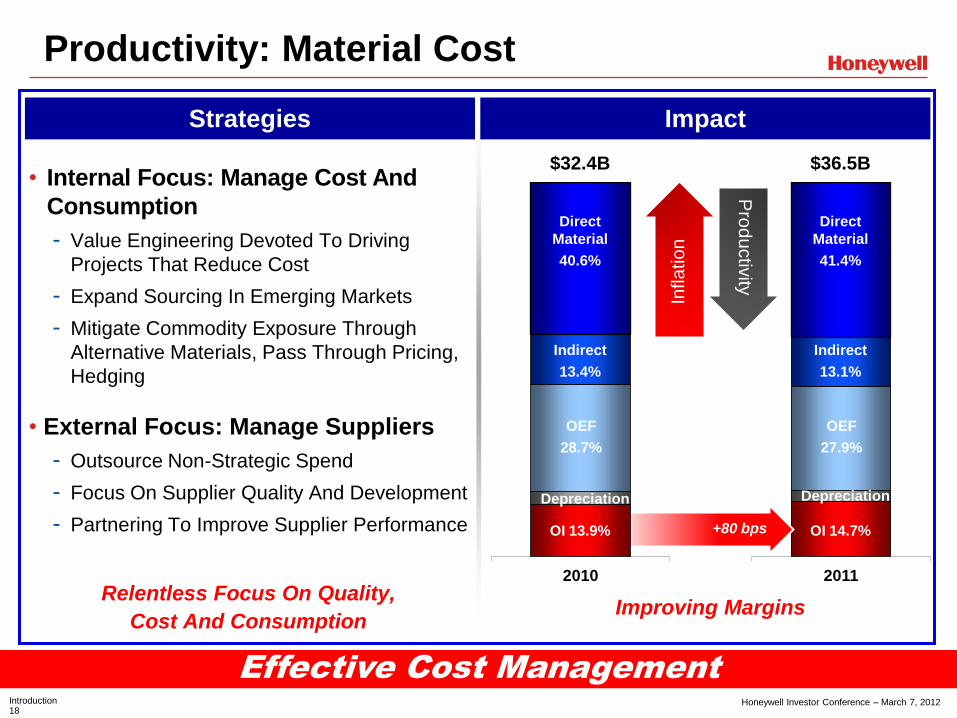
2011
+80 bps
Productivity: Material Cost
Effective Cost Management
Strategies Impact
• Internal Focus: Manage Cost And
Consumption
- Value Engineering Devoted To Driving
Projects That Reduce Cost
- Expand Sourcing In Emerging Markets
- Mitigate Commodity Exposure Through
Alternative Materials, Pass Through Pricing,
Hedging
• External Focus: Manage Suppliers
- Outsource Non-Strategic Spend
- Focus On Supplier Quality And Development
- Partnering To Improve Supplier Performance
$36.5B
Direct
Material
41.4%
Indirect
13.1%
OEF
27.9%
OI 14.7%
Improving Margins Relentless Focus On Quality,
Cost And Consumption
Depreciation
2010
$32.4B
Direct
Material
40.6%
Indirect
13.4%
OEF
28.7%
OI 13.9%
Depreciation
Infla
tio
n
Pro
du
ctiv
ity
Honeywell Investor Conference – March 7, 2012 Introduction 19
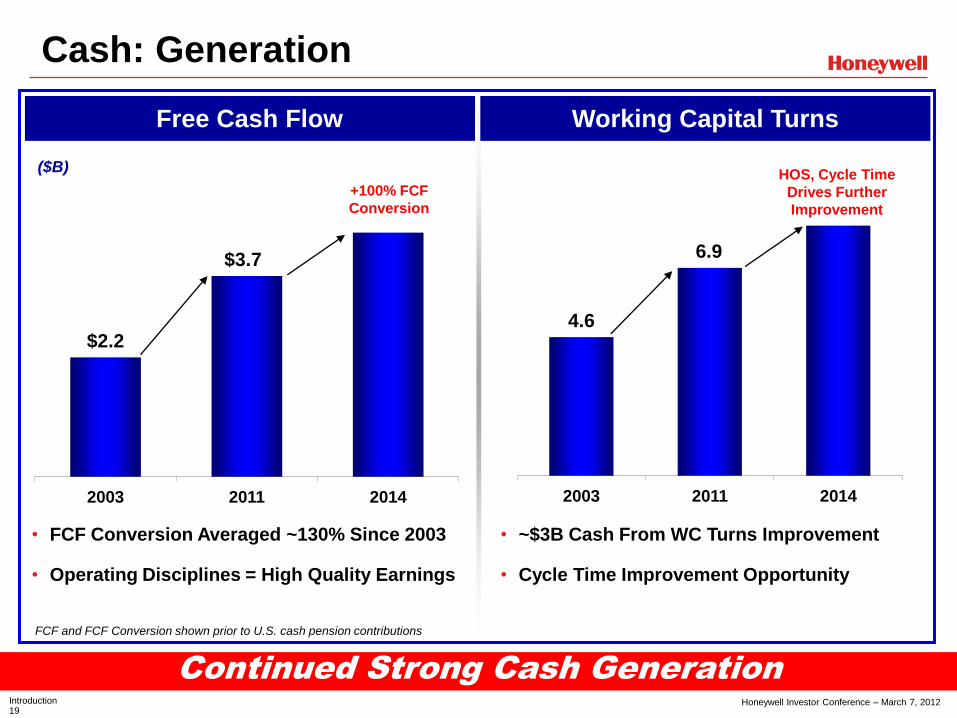
Continued Strong Cash Generation
Cash: Generation
• FCF Conversion Averaged ~130% Since 2003
• Operating Disciplines = High Quality Earnings
$2.2
$3.7
2003 2011 2014
($B)
• ~$3B Cash From WC Turns Improvement
• Cycle Time Improvement Opportunity
4.6
6.9
2003 2011 2014
Free Cash Flow Working Capital Turns
+100% FCF
Conversion
HOS, Cycle Time
Drives Further
Improvement
FCF and FCF Conversion shown prior to U.S. cash pension contributions

Honeywell Investor Conference – March 7, 2012 Introduction 20
2012-2014
Opportunistic,
No Must Haves/Sells
Significant Cash Returned
To Shareholders
Reinvestment Ratio >1
2003-2011
Note: Deployment percentages based on cash flow from operations net of other cash flow activities, primarily change in debt
Cash Providing Flexibility To Generate Excess Returns
Cash: Deployment
24%
Dividends
Share
Buy Back
Net M&A
CAPEX
34%
20%
22%
$29B
~25%
Dividends
~50%
Share
Buy Back,
Net M&A, Other
CAPEX
~25%
~$14 - 16B
From To
Honeywell Investor Conference – March 7, 2012 Introduction 21
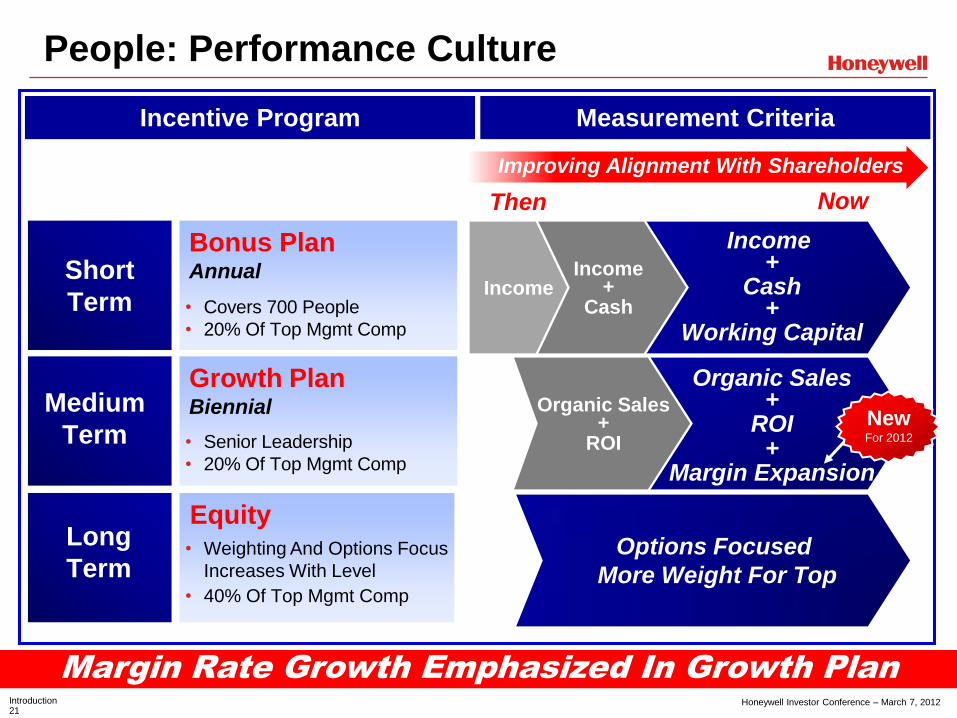
People: Performance Culture
Margin Rate Growth Emphasized In Growth Plan
Improving Alignment With Shareholders
Income Short
Term
Medium
Term
Long
Term
Bonus Plan Annual
Growth Plan Biennial
Equity
Income +
Cash
Income +
Cash +
Working Capital
Then Now
Organic Sales +
ROI
Organic Sales +
ROI +
Margin Expansion
Options Focused
More Weight For Top
• Covers 700 People
• 20% Of Top Mgmt Comp
• Senior Leadership
• 20% Of Top Mgmt Comp
• Weighting And Options Focus
Increases With Level
• 40% Of Top Mgmt Comp
Incentive Program Measurement Criteria
New For 2012

Honeywell Investor Conference – March 7, 2012 Introduction 22
People: Growth Plan
Growth Plan Targets Aligned To Shareholder Returns
Evolution 2012 – 2013 Cycle Targets
From To
Half Organic Sales
Growth
Half ROI
1/3rd ROI
1/3rd Organic Sales
Growth
1/3rd Margin Expansion
Growth Plan Formula Evolving
Linked To Shareholder Interest Aligned To 2014 Targets
P
ayo
ut
100%
50%
200%
2012 – 2013 Cumulative
Margin Expansion: ~130 bps
2014 Target
Segment Margin: 16-18%
New For 2012
Note: Excludes M&A
2011 Actual
Segment Margin: 14.7%

Honeywell Investor Conference – March 7, 2012 Introduction 23
Enablers: Common Tools And Processes
Dramatic Results Already, Still More Opportunity
Honeywell
Operating
System
Functional
Transformation
Velocity
Product
Development
Benefits
• Honeywell Operating System (HOS)
- Driving Sustainable Improvements In
Safety, Quality, Delivery, Cost, And
Inventory Management
- Providing A Rigor That Improves
Service To The Customer And Value
To Honeywell
• Functional Transformation (FT)
- Creating One Honeywell, Common
Processes, Lowering Overhead
- FT Success Enabled By ERP
• Velocity Product Development (VPD™)
- Business Led Cross-Functional
Approach
- Driving Value For The Customer,
Margin Expansion For Honeywell
Building On Prior Expertise
Enablers
Then Now
Lean
Six Sigma
Digital
Works
FO
UN
DA
TIO
N
Honeywell Investor Conference – March 7, 2012 Introduction 24
Gold Silver
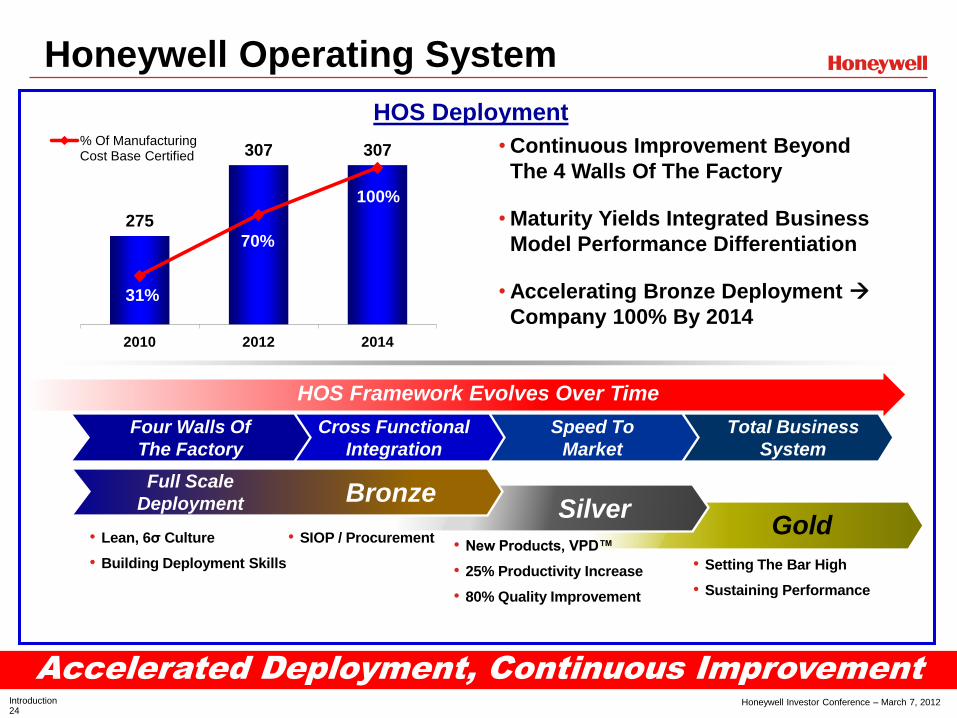
Honeywell Operating System
Accelerated Deployment, Continuous Improvement
275
307 307
31%
70%
100%
235.0
245.0
255.0
265.0
275.0
285.0
295.0
305.0
315.0
2010 2012 2014
% Of Manufacturing Cost Base Certified
• Continuous Improvement Beyond
The 4 Walls Of The Factory
• Maturity Yields Integrated Business
Model Performance Differentiation
• Accelerating Bronze Deployment
Company 100% By 2014
HOS Deployment
HOS Framework Evolves Over Time
Four Walls Of
The Factory
• Lean, 6σ Culture
• Building Deployment Skills
Bronze Full Scale
Deployment
Cross Functional
Integration
Speed To
Market
Total Business
System
• New Products, VPD™
• 25% Productivity Increase
• 80% Quality Improvement
• Setting The Bar High
• Sustaining Performance
• SIOP / Procurement
Honeywell Investor Conference – March 7, 2012 Introduction 25
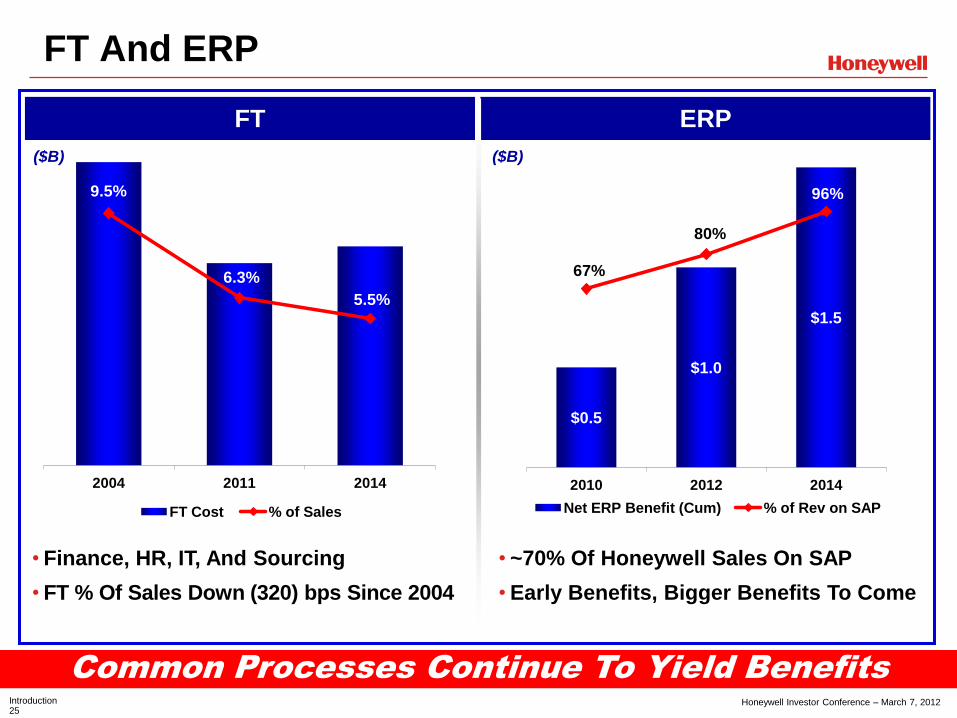
FT And ERP
Common Processes Continue To Yield Benefits
FT ERP
• Finance, HR, IT, And Sourcing
• FT % Of Sales Down (320) bps Since 2004
9.5%
6.3%
5.5%
2004 2011 2014
FT Cost % of Sales
$0.5
$1.0
$1.5
67%
80%
96%
0%
20%
40%
60%
80%
100%
120%
-
0.200
0.400
0.600
0.800
1.000
1.200
1.400
1.600
2010 2012 2014
Net ERP Benefit (Cum) % of Rev on SAP
• ~70% Of Honeywell Sales On SAP
• Early Benefits, Bigger Benefits To Come
($B) ($B)

Honeywell Investor Conference – March 7, 2012 Introduction 26
Long-Term Outlook – At The Halfway Point
On Track To Achieve Long-Term Targets
Long Term Goal: 6 - 8% CAGR Long Term Goal: 300 - 500 bps
($B) Sales Segment Margin
$30.0 $32.4
$36.5
$37.8 - 38.9
$41.0 - 45.0
2009 2010 2011 2012 2013 2014
’09 -’12: 8 – 9% CAGR
13.3% 13.9%
14.7% 15.0 -15.3%
16.0 -18.0%
2009 2010 2011 2012 2013 2014
’09 -’12: 170 – 200 bps

Honeywell Investor Conference – March 7, 2012 Introduction 27
The Best Is Yet To Come
Last 10 Years Great, Next 10 Will Be Even Better
• Building Off Of An Increasingly Robust Foundation
- Accelerated Outperformance From HON During Last Two Years
• Strategies Will Continue To Evolve To Meet Business Needs
- Expectation Of Top Tier Performance Is Constant
• Great Positions In Good Industries
- Solid Portfolio Well Aligned To Leverage Key Macro Trends
• More Upside From Initiatives
- HOS, Acquisition Integrations, Repositioning Benefits
• On Track To Achieve 2014 Targets, Robust Future Beyond
- Seed Planting For Future Growth, Driving New Products And Technologies

Honeywell Investor Conference – March 7, 2012 Introduction 28
Today’s Presenters
Financial Overview Dave Anderson
Senior VP and CFO
Automation and Control Solutions
Roger Fradin
President and CEO
Performance Materials and Technologies
Andreas Kramvis
President and CEO
Aerospace
Tim Mahoney
President and CEO
Transportation Systems
Alex Ismail President and CEO
High Growth Regions
Shane Tedjarati President and CEO
R&D Effectiveness
Ian Shankland
VP and CTO Performance Materials and Technologies
Honeywell Operating System
Pasquale Abruzzese
VP Transportation Systems, Integrated Supply Chain
Mike Owens VP Aerospace, Integrated Supply Chain
Growth Through Acquisitions
Anne Madden
VP Global Mergers and Acquisitions
Mark Levy President Life Safety
Moderator, Q&A
Elena Doom
VP Investor Relations

Automation and Control Solutions 0
Honeywell Investor Conference – March 7, 2012
Automation & Control Solutions
Roger Fradin
President and CEO

Automation and Control Solutions 1
Honeywell Investor Conference – March 7, 2012
$12.6 $13.7
$15.5
12.6% 12.9%
13.4% 13.8
- 14.0%
2009 2010 2011 2012E
Sales Segment Margin %
Honeywell Automation And Control Solutions
Strength And Breadth Of Portfolio Unmatched
• Diversified, Balanced Portfolio
• Aligned to Key Global Macro Trends
• Growth Outpacing Global GDP
• Accelerating Margin Rate Expansion
• Strong Momentum, Winning in the Market
($B) $16.0 – $16.5
Financials Disciplined Execution
ECC 18%
S&C 4%
Life Safety 21%
Security 16%
Scanning & Mobility
3%
Building Solutions
18%
Process Solutions
20%
Americas 48%
Europe 31%
ROW 21%
Comm
25%
Ind
39%
Res
16%
Infra
20%
Business Units
Note: 2011 Sales
Sector Mix Geographic Mix

Automation and Control Solutions 2
Honeywell Investor Conference – March 7, 2012
$7.5
$15.5
2003 2011
$0.8
$2.1
2003 2011 2003 2011
+210
bps
~3X
Growth
~2X
Growth
ACS Track Record
Strong Sales Growth And Margin Expansion
Segment Profit
($B)
11.3%
13.4%
Sales Segment Profit Segment Margin

Automation and Control Solutions 3
Honeywell Investor Conference – March 7, 2012
Balanced Portfolio Mix
ESS ~50%
HPS ~20% BSD ~30%
ACS Portfolio Dynamics
Honeywell
Process Solutions
Building Solutions &
Distribution
Building Solutions, ADI
(Security and Fire Distribution)
Energy, Safety & Security
Environmental and Combustion
Controls, Life Safety, Security,
Scanning and Mobility,
Sensing and Control
Growing Faster Than Served Markets, Continued Margin Expansion Runway
• 10% Sales CAGR (‘06-‘11): NPI, New
Wins, EM Expansion and M&A
• High-teens Margins; +100 bps/yr
Last 3 Years
• 8% Sales CAGR (‘06-’11): Adv.
Solutions and Projects DD Growth
• Low-teens Margins with Room for
Expansion
• 3% Sales CAGR (‘06-‘11): DD
Energy Sales CAGR Last 5 Yrs
• Mid Single-digit Margins Overall;
Service Margins Mid-teens
Automation and Control Solutions 4
Honeywell Investor Conference – March 7, 2012
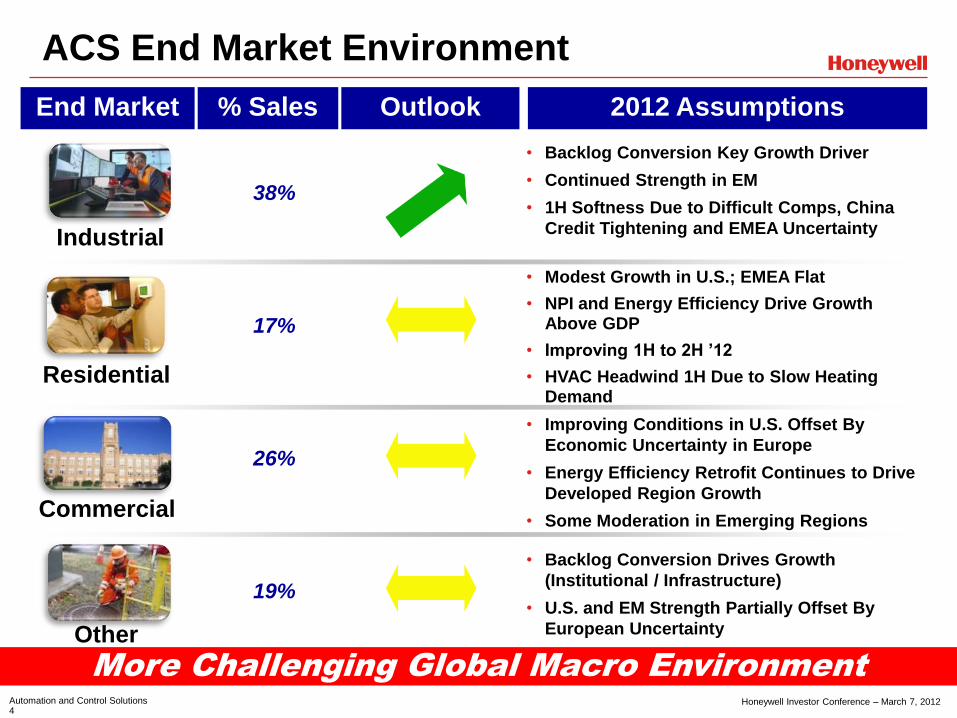
ACS End Market Environment
End Market 2012 Assumptions
Industrial
Residential
Commercial
Other
38%
17%
26%
19%
• Backlog Conversion Key Growth Driver
• Continued Strength in EM
• 1H Softness Due to Difficult Comps, China
Credit Tightening and EMEA Uncertainty
• Modest Growth in U.S.; EMEA Flat
• NPI and Energy Efficiency Drive Growth Above GDP
• Improving 1H to 2H ’12
• HVAC Headwind 1H Due to Slow Heating Demand
• Backlog Conversion Drives Growth
(Institutional / Infrastructure)
• U.S. and EM Strength Partially Offset By
European Uncertainty
• Improving Conditions in U.S. Offset By
Economic Uncertainty in Europe
• Energy Efficiency Retrofit Continues to Drive
Developed Region Growth
• Some Moderation in Emerging Regions
More Challenging Global Macro Environment
Outlook % Sales
Automation and Control Solutions 5
Honeywell Investor Conference – March 7, 2012
ACS Core Strategies
Consistent Strategy And Execution
•Great Positions in Good Industries
•Commercial Excellence / Growth Mindset
• Innovation Through Technology and NPI
•Globalization and High Growth Region Expansion
•Continue to Grow Through Strategic Acquisitions
• Leverage Core Process Initiatives
Automation and Control Solutions 6
Honeywell Investor Conference – March 7, 2012
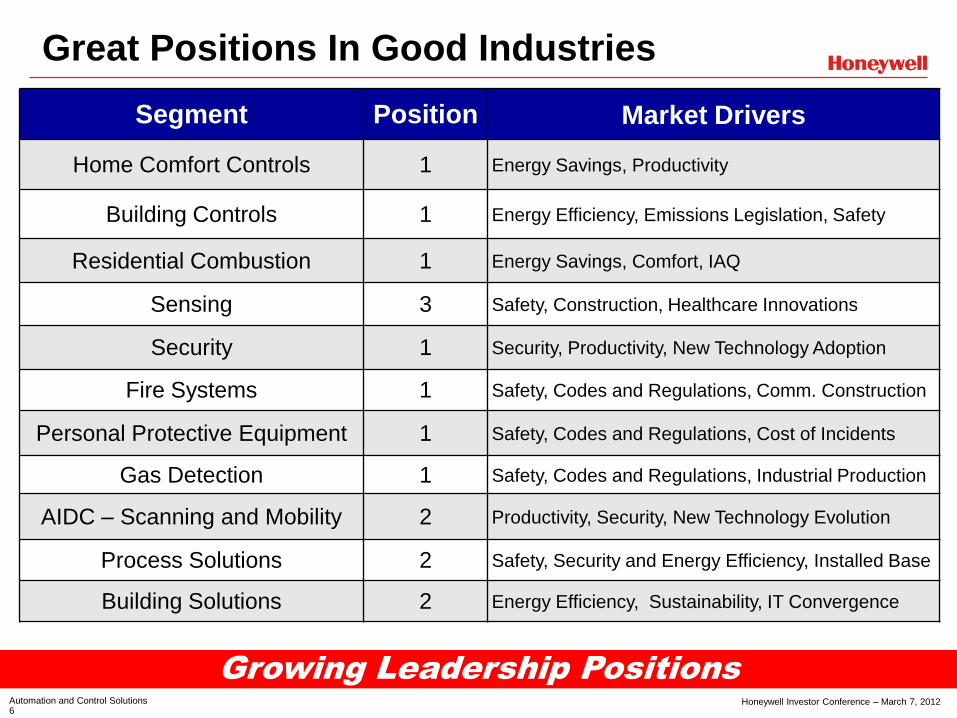
Great Positions In Good Industries
Segment Position Market Drivers
Home Comfort Controls 1 Energy Savings, Productivity
Building Controls 1 Energy Efficiency, Emissions Legislation, Safety
Residential Combustion 1 Energy Savings, Comfort, IAQ
Sensing 3 Safety, Construction, Healthcare Innovations
Security 1 Security, Productivity, New Technology Adoption
Fire Systems 1 Safety, Codes and Regulations, Comm. Construction
Personal Protective Equipment 1 Safety, Codes and Regulations, Cost of Incidents
Gas Detection 1 Safety, Codes and Regulations, Industrial Production
AIDC – Scanning and Mobility 2 Productivity, Security, New Technology Evolution
Process Solutions 2 Safety, Security and Energy Efficiency, Installed Base
Building Solutions 2 Energy Efficiency, Sustainability, IT Convergence
Growing Leadership Positions
Automation and Control Solutions 7
Honeywell Investor Conference – March 7, 2012
1
P
T
+
- Z
A1
A2
5
Live 1 2 3 4
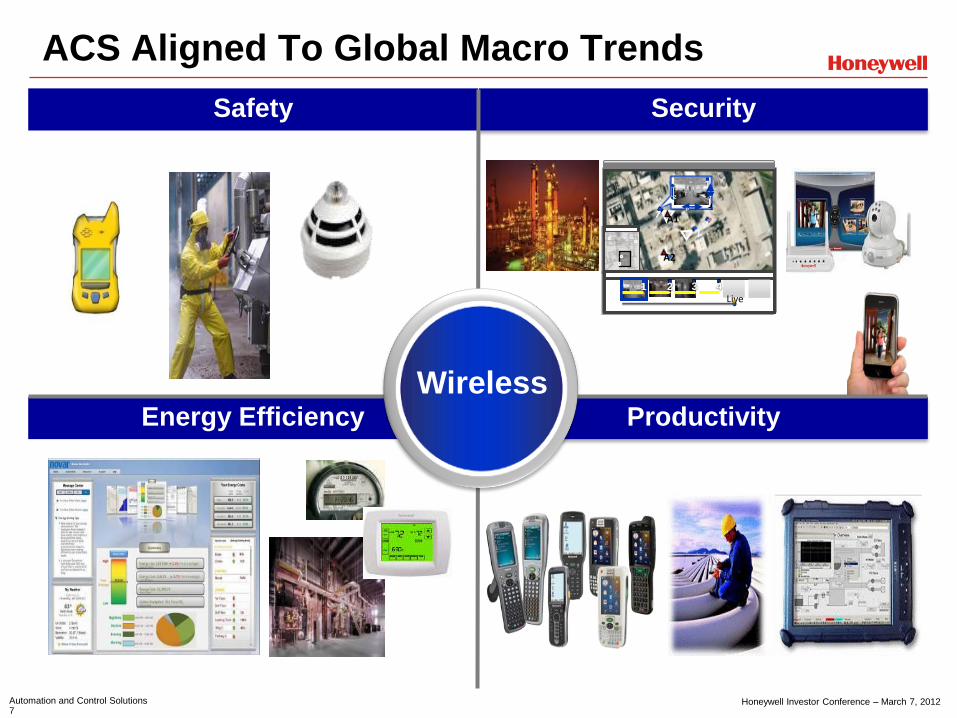
ACS Aligned To Global Macro Trends
Safety Security
Productivity Energy Efficiency
Wireless

Automation and Control Solutions 8
Honeywell Investor Conference – March 7, 2012
Highlights
• Acquired King’s Safetywear, Fire Sentry
• Successful Sperian Integration
• HLS Cross-Selling on Track to $200M Goal
• Key Safety Sensor Wins: Goodrich
Actuation Systems, Boeing, ResMed
Building Our Great Positions: 2011 Progress
Innovations
• 80+ New Safety Products
• Smart PPE: Enabled Safety
Products, Safety Community
• Build-Out Key Platforms:
TruStability® Pressure
Sensors and Limitless™
Wireless Solutions
Highlights
• $300M in Critical Infrastructure Orders
• Key Wins: Casino Niagara, Houston
Airport System, Heathrow Terminal 2,
Belaya Dacha Outlet Village Moscow
Innovations
• Total Connect 2.0
• LynxTouch
• MAXPRO NVR-XE
• Faster Emergency
Response School
Systems
Safety
Security

Automation and Control Solutions 9
Honeywell Investor Conference – March 7, 2012
Energy Efficiency
Productivity
Building Our Great Positions: 2011 Progress
Highlights
• $500M in New Energy Savings
Performance Contracts (ESPCs)
• Smart Grid Wins: China, Europe, Hawaii
• Caspian Pipeline Consortium
• Wal-Mart China
Innovations
• Largest Awardee of DOE Grants
• Attune™ - Advisory Services Launch
• Comfort Point Open – 2nd Generation
Highlights
• $1B in New Oil & Gas Orders
• Shell Pearl GTL Plant: $300M
• City of L.A. Wastewater: $88M
• EMS Technologies Acquisition
• Starbucks
• First UPS DIAD V Units Shipped
Innovations • Universal I/O in Safety Systems,
PlantCruise
• Dolphin 99EX, Scanphone,
Xenon Color, Youjie

Automation and Control Solutions 10
Honeywell Investor Conference – March 7, 2012
Commercial Excellence / Growth Mindset
From To
Customer An Afterthought Customer Focused/
Winning with Customers
Few New Products: 120 in 2003 Lots of New Products: 540 in 2011
Fiefdoms Cross-ACS and HON Collaboration
Global Presence Retrenched Accelerated Global Expansion
Living for the Quarter Short and Long-term Focused
Minimal People Investment
Census: Sales-5,100; Marketing-800
Invested in People – Talent, Training, Compensation
Census: Sales-9,000; Marketing-1,650
Marketing vs. Sales Tight Marketing-to-Sales Linkage
Weak Compensation Linkage Increased Variable Pay, Cost Leverage
Negative Pricing Analytic Pricing Tools – Positive Price
Driving A High Return On Commercial Investment

Automation and Control Solutions 11
Honeywell Investor Conference – March 7, 2012
New Products - #1 Driver Of Honeywell Growth And Profitability
Innovation: Lifeblood For ACS Growth S
ale
s / H
C N
ew
Pro
du
cts
• R&D Investment up 90%
• Resources up 125%
• Cycle Times Reduced 40%
• NPI up ~3X
Sales
New Products
R&D Headcount
Accelerating Scale And Speed Of New Product Introductions
100
200
300
400
500
600
700
3000
6000
9000
12000
15000
18000
2003 2004 2005 2006 2007 2008 2009 2010 2011 2012E
Power of VPD™
Automation and Control Solutions 12
Honeywell Investor Conference – March 7, 2012
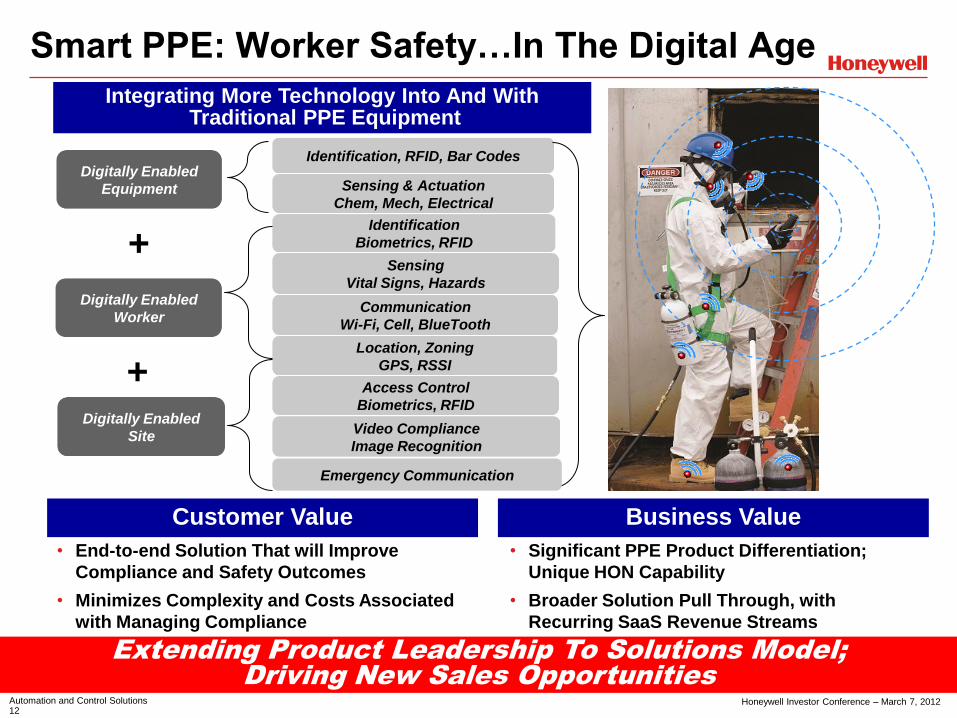
Smart PPE: Worker Safety…In The Digital Age
Integrating More Technology Into And With Traditional PPE Equipment
Digitally Enabled
Equipment
Identification, RFID, Bar Codes
Sensing & Actuation
Chem, Mech, Electrical
Digitally Enabled
Worker
Identification
Biometrics, RFID
Location, Zoning
GPS, RSSI
Communication
Wi-Fi, Cell, BlueTooth
Video Compliance
Image Recognition
Access Control
Biometrics, RFID
Sensing
Vital Signs, Hazards
+
Digitally Enabled
Site
+
Emergency Communication
Extending Product Leadership To Solutions Model;
Driving New Sales Opportunities
• End-to-end Solution That will Improve
Compliance and Safety Outcomes
• Minimizes Complexity and Costs Associated
with Managing Compliance
Customer Value
• Significant PPE Product Differentiation;
Unique HON Capability
• Broader Solution Pull Through, with
Recurring SaaS Revenue Streams
Business Value

Automation and Control Solutions 13
Honeywell Investor Conference – March 7, 2012
The Connected Home: Honeywell Total Connect
• Offers Homeowners and Light Commercial Building
Owners Ability To:
- Remotely Access and Control Security, HVAC, Lighting, Video
Look-In and Locks From Tablet, Smartphone and Web Portal
- Ensure Property is Safe and Secure and Occupants are
Comfortable
- Engage a Contractor for Repair, Replacement Upgrades
- Receive Diagnostic Information on System Performance
• Segment Opportunity
- Current Installed Base: 150M Homes, 10M Buildings
- Security, HVAC and CE Contractors
- Brick & Mortar and Online Retailers
Comfort Management, Security and Alerts & Diagnostics
Leveraging The Prevalence Of Broadband
And Mobile Devices
Customer Value Business Value
User Interface Devices
•Full Suite of Mobility Offerings
•Proactive Decision-Making for Energy,
Repair, Safety and Security Decision
• Expands Reach of Existing Channels and
Offerings
• Extends Applications for Recurring
Revenue
Automation and Control Solutions 14
Honeywell Investor Conference – March 7, 2012
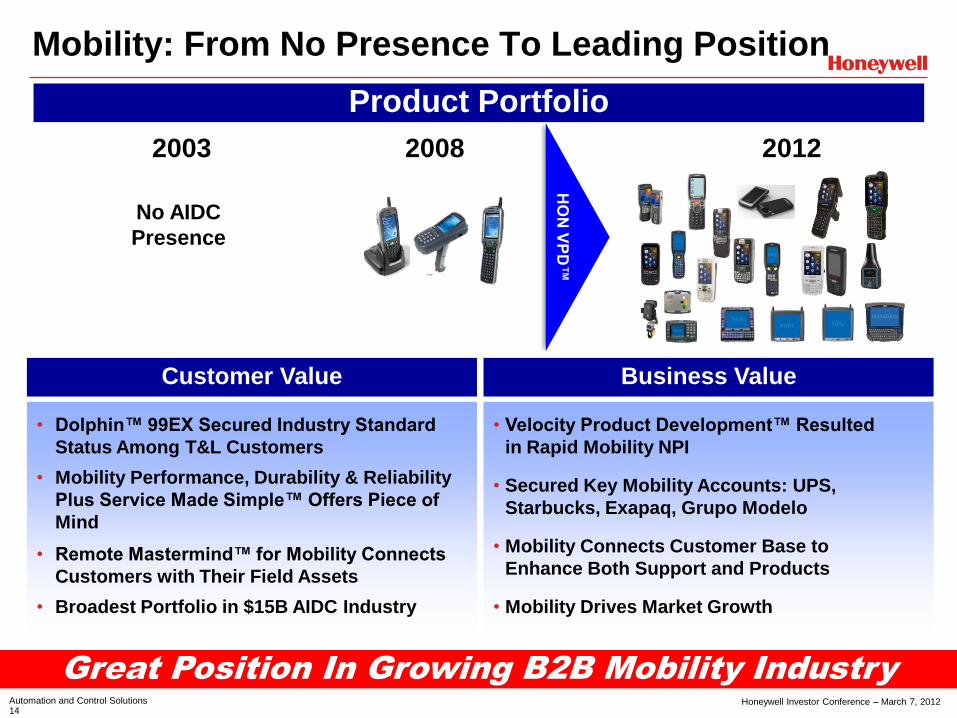
Mobility: From No Presence To Leading Position
HO
N V
PD
™
2008 2012
Great Position In Growing B2B Mobility Industry
• Dolphin™ 99EX Secured Industry Standard
Status Among T&L Customers
• Mobility Performance, Durability & Reliability
Plus Service Made Simple™ Offers Piece of
Mind
• Remote Mastermind™ for Mobility Connects
Customers with Their Field Assets
• Broadest Portfolio in $15B AIDC Industry
Customer Value
• Velocity Product Development™ Resulted
in Rapid Mobility NPI
• Secured Key Mobility Accounts: UPS,
Starbucks, Exapaq, Grupo Modelo
• Mobility Connects Customer Base to
Enhance Both Support and Products
• Mobility Drives Market Growth
Business Value
Product Portfolio
2003
No AIDC
Presence

Automation and Control Solutions 15
Honeywell Investor Conference – March 7, 2012
• Re-Engineered by China and India w/ China Supply
• Monetizing Experion IP: 9 Month Intro - VPD™
• China Launch: $6M in Wins Before Intro!
Next: India, Southeast Asia, Latin America
PlantCruise: New Mid-Market Control System
Mid Markets in Emerging
Countries: $1B Total Market
Experion : Largest Capital
Projects in The World
• Shah Gas
• Shell GTL
PlantCruise
• LA Wastewater
• ExxonMobil PNG
$100M HPS Opportunity In Underserved Market
• Superior Control System Offering Providing
Better Safety, Reliability, Efficiency at Price
Point Competitive with Local Chinese Suppliers
• Easier to Use and Faster to Configure
Customer Value
• Growth in Underserved Chemicals, Power
and Metals Markets in Emerging Regions
• Improved Cost Position to Drive Better
Growth and Increased Margins
Business Value

Automation and Control Solutions 16
Honeywell Investor Conference – March 7, 2012
Globalization
Empowering Local Teams To Drive Growth
High Growth Regions
$3.9
$6.1
$3.6
$9.4
2003 2011
U.S.
ROW
60%
~13
% C
AG
R
40%
~ 6
% C
AG
R
53%
47%
Globalization And High Growth Region Expansion
• Matching Customer Footprint
• Strengthened Leadership Teams
• Scaling Local Market NPI
Projected 2016 Sales:
• China: ~$2B
• India: ~$1B
• Mid. East: ~$1B
2006 2010 2016
($B)
Automation and Control Solutions 17
Honeywell Investor Conference – March 7, 2012
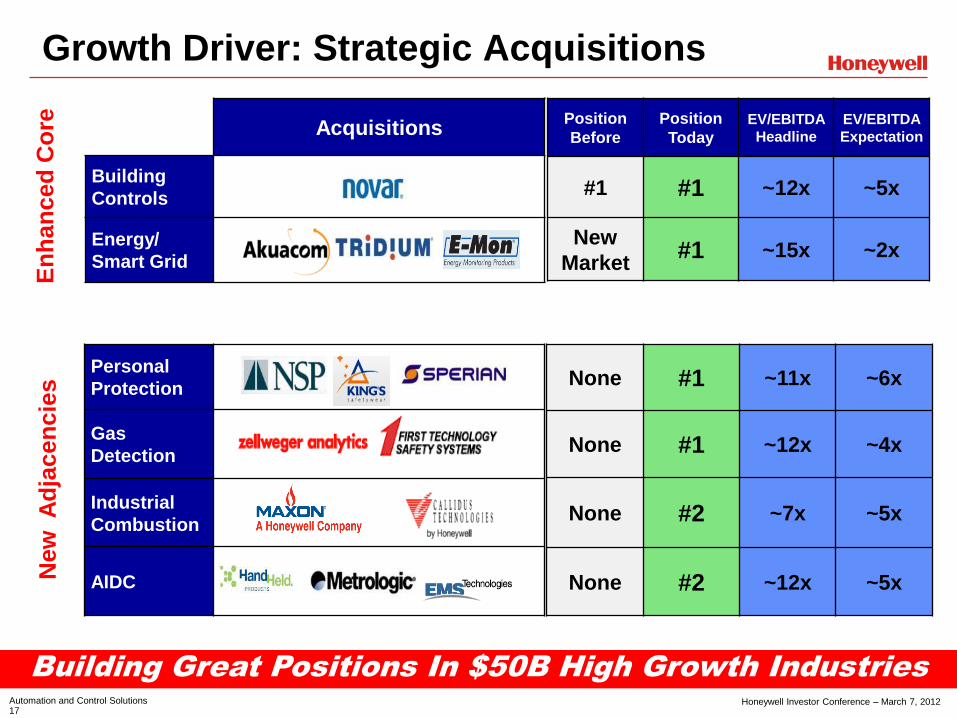
Growth Driver: Strategic Acquisitions
Acquisitions
Building
Controls
Energy/
Smart Grid
Position
Before
Position
Today
EV/EBITDA
Headline
EV/EBITDA
Expectation
#1 #1 ~12x ~5x
New
Market #1 ~15x ~2x
Personal
Protection
Gas
Detection
Industrial
Combustion
AIDC
Building Great Positions In $50B High Growth Industries
None #1 ~11x ~6x
None #1 ~12x ~4x
None #2 ~7x ~5x
None #2 ~12x ~5x
New
A
dja
cen
cie
s
En
han
ced
Co
re

Automation and Control Solutions 18
Honeywell Investor Conference – March 7, 2012
Growth
• Sales Excellence
• Marketing and
Pricing Excellence
• Advanced R&D and
HTS Labs
• NPI/VPD™
• Electronics and
Wireless Excellence
• One Honeywell
• Globalization
• Gov’t Relations
• Acquisitions
Process
Applying Honeywell Process Discipline To M&A
The Honeywell M&A Playbook
Cash
• Receivables, Payables
and Cash Processes
• SIOP
• Cycle Time Reductions
Productivity
• HON Operating
System
• Value Engineering
• Functional
Transformation
• Direct Materials
• Indirect Expenses
• Factory Transitions
• Six Sigma
People
• Respectfully
Combine Cultures
• Best of Both Talent
• Employer of Choice
(Training, Career
Path, Comp.)
• HON Performance
and Development
• Health, Safety,
Environmental
Process Drives Our Successful Track Record

Automation and Control Solutions 19
Honeywell Investor Conference – March 7, 2012
Making Our Business Better
SAP / FT
• Backbone for All
Business Processes
• 58% Complete at End
2012
• Lookback Process for
Continued Enhancements
at Live Sites
Benefits
Process Initiatives Enabling Margin Expansion
• 133 Sites in Full Scale Deployment
- 94% of Conversion Costs
• 7 Silver and 66 Bronze Sites
- 50% of Factory Footprint
• All Global Sites Bronze by 2014; 50% Silver by 2016
Typical HOS Results From Launch To Silver
Honeywell Operating System
$100M
$150M $165M
$200M
2010 2012 2014 2016
363% Improvement 31% Improvement 29% Reduction 11 Pt Improvement
0
200
400
600
800
1000
Prior to
HOS
Silver
Quality (PPM)
86 88 90 92 94 96 98
Prior to
HOS
Silver
Delivery (OTTR)
0 10 20 30 40 50 60
Prior to
HOS
Silver
Inventory (DOS)
0
20
40
60
80
100
Prior to
HOS
Silver
HSE (SAT Audit)
Automation and Control Solutions 20
Honeywell Investor Conference – March 7, 2012
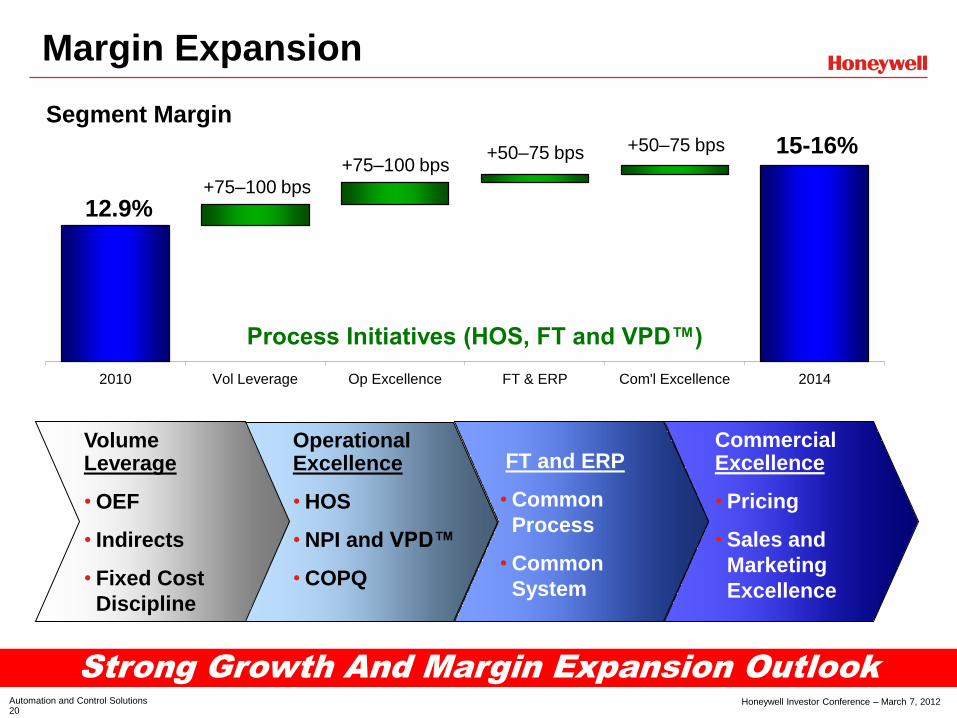
Margin Expansion
Strong Growth And Margin Expansion Outlook
2010 Vol Leverage Op Excellence FT & ERP Com'l Excellence 2014
12.9%
15-16%
Segment Margin
+75–100 bps
+75–100 bps +50–75 bps +50–75 bps
Commercial Excellence
• Pricing
• Sales and
Marketing
Excellence
FT and ERP
• Common
Process
• Common
System
Operational Excellence
• HOS
• NPI and VPD™
• COPQ
Volume Leverage
• OEF
• Indirects
• Fixed Cost
Discipline
Process Initiatives (HOS, FT and VPD™)
Automation and Control Solutions 21
Honeywell Investor Conference – March 7, 2012
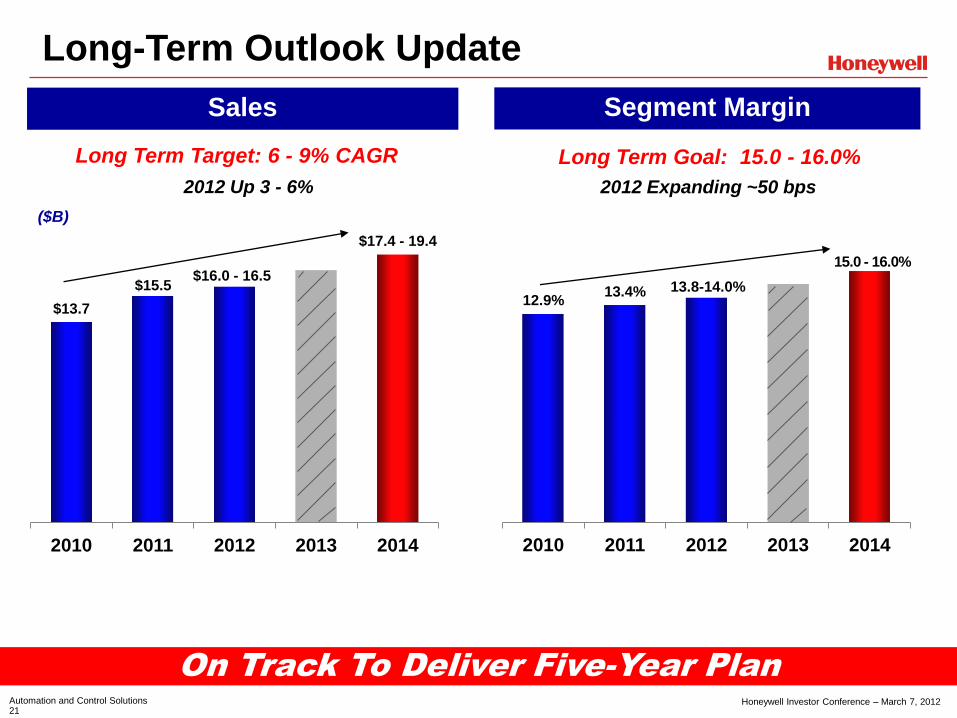
Long-Term Outlook Update
$13.7
$15.5 $16.0 - 16.5
$17.4 - 19.4
2010 2011 2012 2013 2014
12.9% 13.4% 13.8-14.0%
15.0 - 16.0%
2010 2011 2012 2013 2014
Segment Margin Sales
Long Term Target: 6 - 9% CAGR
($B)
2012 Up 3 - 6%
Long Term Goal: 15.0 - 16.0% 2012 Expanding ~50 bps
On Track To Deliver Five-Year Plan
Automation and Control Solutions 22
Honeywell Investor Conference – March 7, 2012
ACS – The Best Is Yet To Come
Significant Growth And Margin Runway
• Diversified, Balanced Portfolio
• Aligned to Key Global Macro Trends
• Growth Outpacing Global GDP
• Accelerating Margin Rate Expansion
• Strong Momentum, Winning in the
Market

Honeywell Investor Conference – March 7, 2012 Growth Through Acquisitions 0
Growth Through Acquisitions
Anne Madden
Vice President Global M&A
Mark Levy
President Life Safety

Honeywell Investor Conference – March 7, 2012 Growth Through Acquisitions 1
M&A Process Transformation
• M&A Critical Element of Long Term Growth Story
- When Done Right, Value Enhancing
• Historically Mixed Track Record
- Discipline Lost in the Zeal for the Deal
• Analyzed 10 Years of Acquisitions (1992-2002)
- Scorecard: Poor Acquisition Performance
• Failure Modes Beyond Strategic Miss
- Poor Ownership/Integration, Overestimated Sales Synergies
• Designed New Core Process
- Identification Due Diligence Valuation Integration
Complete M&A Process Redesign
Honeywell Investor Conference – March 7, 2012 Growth Through Acquisitions 2
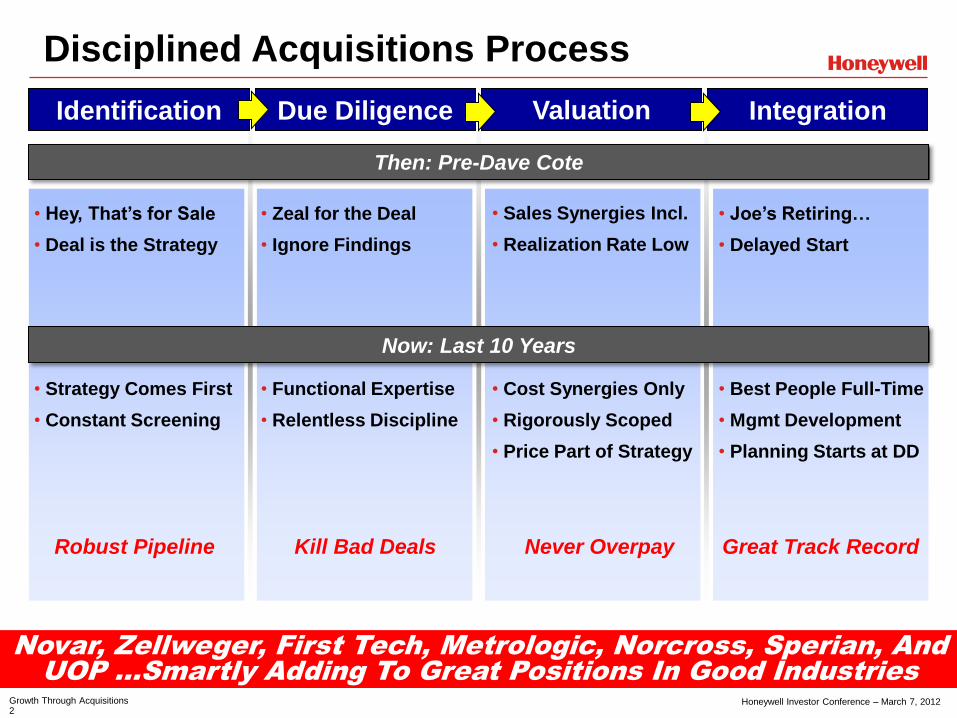
Novar, Zellweger, First Tech, Metrologic, Norcross, Sperian, And
UOP …Smartly Adding To Great Positions In Good Industries
Disciplined Acquisitions Process
Identification Valuation Due Diligence Integration
• Strategy Comes First
• Constant Screening
• Sales Synergies Incl.
• Realization Rate Low
• Cost Synergies Only
• Rigorously Scoped
• Price Part of Strategy
• Zeal for the Deal
• Ignore Findings
• Functional Expertise
• Relentless Discipline
• Joe’s Retiring…
• Delayed Start
• Best People Full-Time
• Mgmt Development
• Planning Starts at DD
Then: Pre-Dave Cote
• Hey, That’s for Sale
• Deal is the Strategy
Now: Last 10 Years
Robust Pipeline Never Overpay Kill Bad Deals Great Track Record

Honeywell Investor Conference – March 7, 2012 Growth Through Acquisitions 3
HON Portfolio Reshaping
Disciplined And Smart: ~70 Acquisitions, ~50 Divestitures
…Great Track Record
Aero ACS PMT TS
• Condition Based
Maintenance
• Satellite Communications
• Performance-based
Logistics
• Consumable Solutions /
Aero Fasteners
• Gas Detection
• AIDC
• PPE
• Building Controls
• Oil and Gas Monitoring
• Industrial Combustion
• Energy / Smart Grid
• Consumer Products
(Fans, Heaters, Etc.)
• Automotive Sensors
• UOP Process Technology
and Catalysts
• Membrane Technology
• Strategic Upstream
Supply
• Plastics
• Industrial Waxes
• Nylon
• Dozens of Others…
• Explore Potential High
Growth, High Margin,
Technology Adjacencies
• CPG: Automotive
Consumer Products
Group
Added: Higher Growth, Technology-Oriented Businesses
Exited: Slower Growth, Low Tech, Non-Core Businesses

Honeywell Investor Conference – March 7, 2012 Growth Through Acquisitions 4
• Full-Time Integration Leader and Cross-Functional Team
• Measuring Performance Against Detailed Written Plan
• Best of the Best Talent Selection
• Realign Personal Goals and Incentives
• Best Practices Transfer From Target
• Visibility of Senior Management
• Develop Annual Operating Plan
• Carefully Vetted IT Integration
• Institute HON Compliance Processes
• Continuous Communications – CEO Reviews
Integration Best Practices
Effective Integration Key To Acquisition Success

Honeywell Investor Conference – March 7, 2012 Growth Through Acquisitions 5
Geographic Growth
Growth By Business Segment
~$0.4B
~$4B
Americas
EMEA
AP
EMEA
AP
Driven By Superior Global Footprint, Sales Synergies
2001 Legacy Novar Analytics FT Norcross Sperian 2012
Americas
Gas
PPE
King’s
2012 2001
Fire
Life Safety – A Decade Of Transformation

Honeywell Investor Conference – March 7, 2012 Growth Through Acquisitions 6
• Highly Regulated by Codes And Standards - OSHA, ANSI, NFPA, NIOSH, CSA, etc.
• High Profitability Potential - Op Margin 15% - 25%
• Great Synergy: Sales and Distribution - Cross Selling in Vertical End Markets
• Large, Growing and Fragmented Space - Attractive Market Opportunity – $38B by 2016
- Growth in All Global Regions
Expanded Addressable Market From $3B To $38B
Attractive Life Safety Space
• Ability to Drive Innovation - Extending Portfolio From Products to Software
and Services
Honeywell Investor Conference – March 7, 2012 Growth Through Acquisitions 7
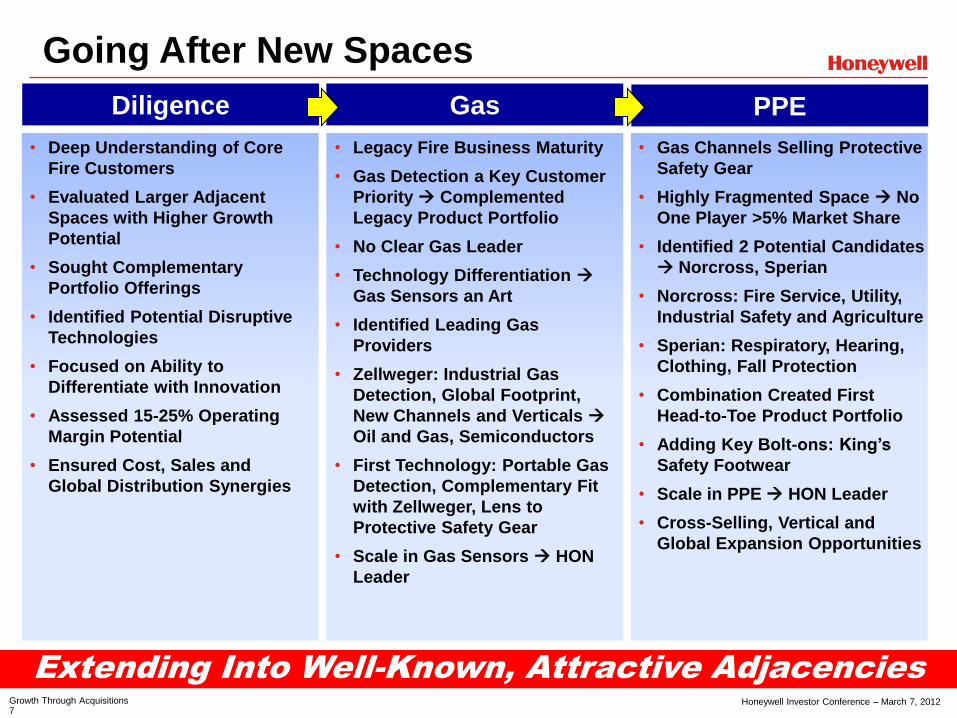
• Gas Channels Selling Protective
Safety Gear
• Highly Fragmented Space No
One Player >5% Market Share
• Identified 2 Potential Candidates
Norcross, Sperian
• Norcross: Fire Service, Utility,
Industrial Safety and Agriculture
• Sperian: Respiratory, Hearing,
Clothing, Fall Protection
• Combination Created First
Head-to-Toe Product Portfolio
• Adding Key Bolt-ons: King’s
Safety Footwear
• Scale in PPE HON Leader
• Cross-Selling, Vertical and
Global Expansion Opportunities
Going After New Spaces
Extending Into Well-Known, Attractive Adjacencies
• Deep Understanding of Core
Fire Customers
• Evaluated Larger Adjacent
Spaces with Higher Growth
Potential
• Sought Complementary
Portfolio Offerings
• Identified Potential Disruptive
Technologies
• Focused on Ability to
Differentiate with Innovation
• Assessed 15-25% Operating
Margin Potential
• Ensured Cost, Sales and
Global Distribution Synergies
• Legacy Fire Business Maturity
• Gas Detection a Key Customer
Priority Complemented
Legacy Product Portfolio
• No Clear Gas Leader
• Technology Differentiation
Gas Sensors an Art
• Identified Leading Gas
Providers
• Zellweger: Industrial Gas
Detection, Global Footprint,
New Channels and Verticals
Oil and Gas, Semiconductors
• First Technology: Portable Gas
Detection, Complementary Fit
with Zellweger, Lens to
Protective Safety Gear
• Scale in Gas Sensors HON
Leader
Diligence Gas PPE
Honeywell Investor Conference – March 7, 2012 Growth Through Acquisitions 8
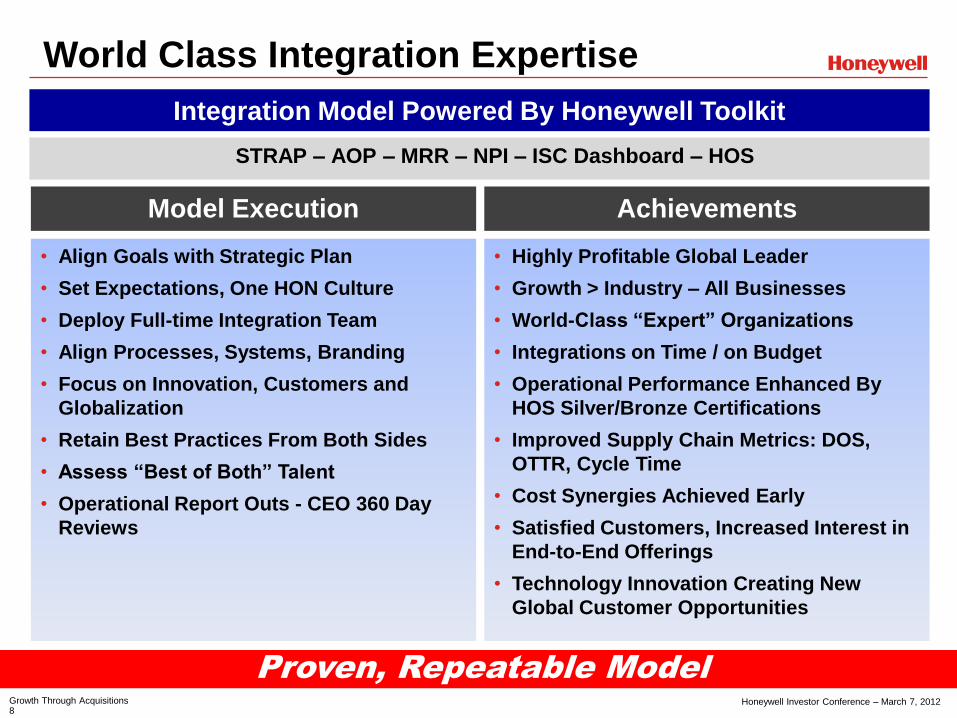
Integration Model Powered By Honeywell Toolkit
STRAP – AOP – MRR – NPI – ISC Dashboard – HOS
Proven, Repeatable Model
World Class Integration Expertise
Model Execution Achievements
• Align Goals with Strategic Plan
• Set Expectations, One HON Culture
• Deploy Full-time Integration Team
• Align Processes, Systems, Branding
• Focus on Innovation, Customers and
Globalization
• Retain Best Practices From Both Sides
• Assess “Best of Both” Talent
• Operational Report Outs - CEO 360 Day
Reviews
• Highly Profitable Global Leader
• Growth > Industry – All Businesses
• World-Class “Expert” Organizations
• Integrations on Time / on Budget
• Operational Performance Enhanced By
HOS Silver/Bronze Certifications
• Improved Supply Chain Metrics: DOS,
OTTR, Cycle Time
• Cost Synergies Achieved Early
• Satisfied Customers, Increased Interest in
End-to-End Offerings
• Technology Innovation Creating New
Global Customer Opportunities

Honeywell Investor Conference – March 7, 2012 Growth Through Acquisitions 9
Gas Detection Performance
Sales Segment Profit
2005* 2011
Outstanding Financial Performance
• Global Leader
• 2X Industry Growth
• Highly Profitable, Cash Follows
• Sustainable Factory Productivity
• Robust Technology Platform
+30%
+175%
*Management Estimate
Honeywell Investor Conference – March 7, 2012 Growth Through Acquisitions 10
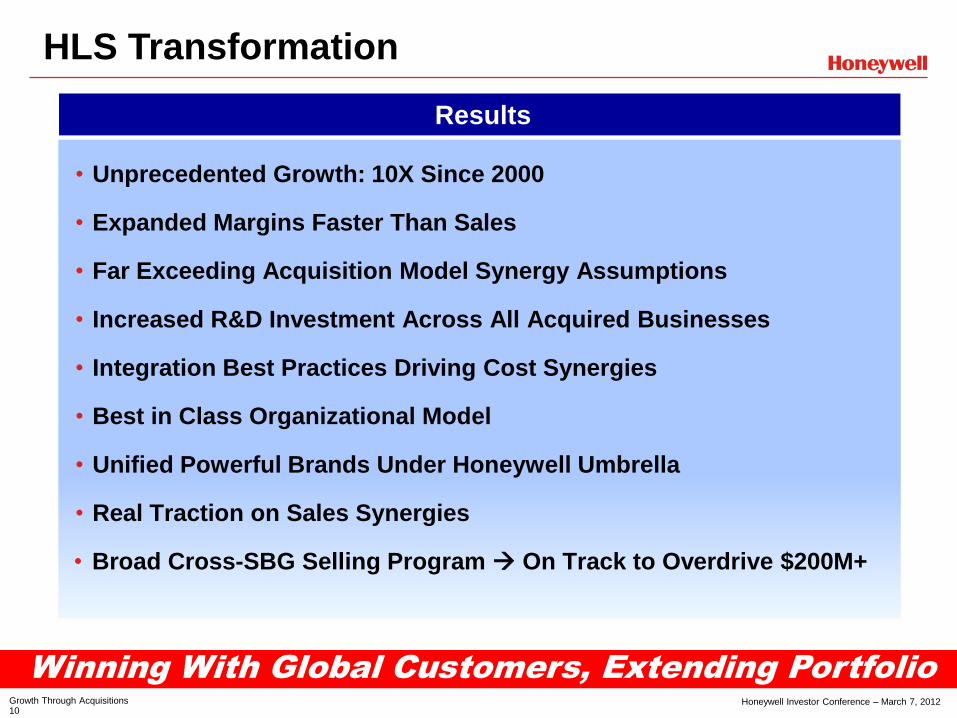
HLS Transformation
• Unprecedented Growth: 10X Since 2000
• Expanded Margins Faster Than Sales
• Far Exceeding Acquisition Model Synergy Assumptions
• Increased R&D Investment Across All Acquired Businesses
• Integration Best Practices Driving Cost Synergies
• Best in Class Organizational Model
• Unified Powerful Brands Under Honeywell Umbrella
• Real Traction on Sales Synergies
• Broad Cross-SBG Selling Program On Track to Overdrive $200M+
Winning With Global Customers, Extending Portfolio
Results
Honeywell Investor Conference – March 7, 2012 Growth Through Acquisitions 11
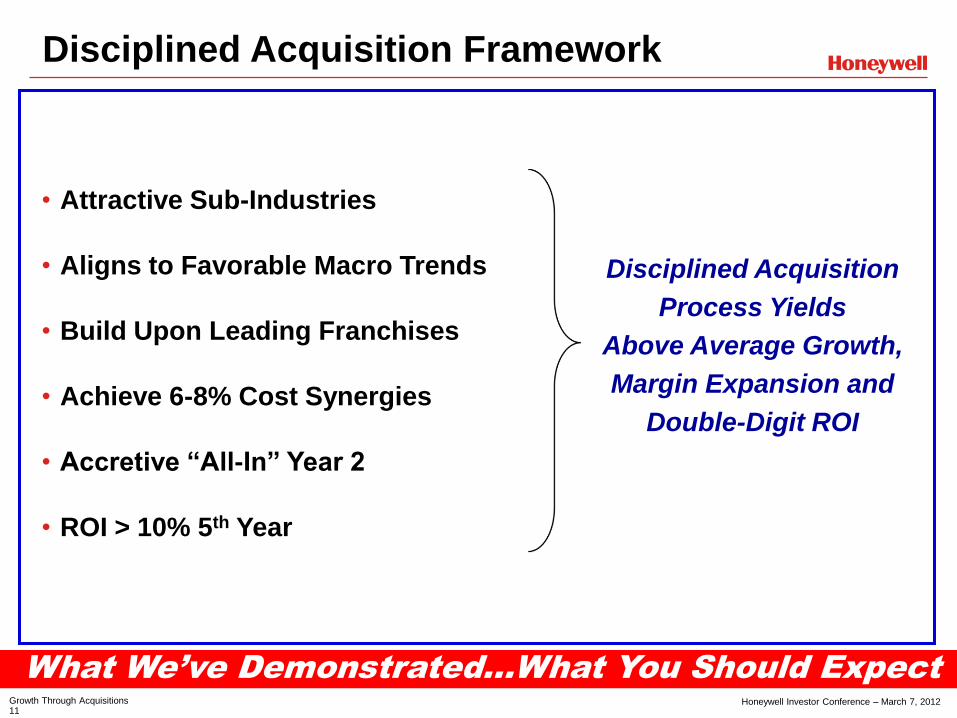
Disciplined Acquisition Framework
What We’ve Demonstrated…What You Should Expect
• Attractive Sub-Industries
• Aligns to Favorable Macro Trends
• Build Upon Leading Franchises
• Achieve 6-8% Cost Synergies
• Accretive “All-In” Year 2
• ROI > 10% 5th Year
Disciplined Acquisition
Process Yields
Above Average Growth,
Margin Expansion and
Double-Digit ROI

Honeywell Investor Conference – March 7, 2012 Growth Through Acquisitions 12
Summary
• Consistent Deployment of Process Disciplines
• Successful Execution Driven by Business Strategy
• Integrating Lessons Learned Across Portfolio
• World Class Integration Yielding Impressive Results
• While Nothing Individually Transformative…
When Taken Together, We’ve Transformed Over Time
Performance Materials and Technologies 0
Honeywell Investor Conference – March 7, 2012
Performance Materials and Technologies Andreas Kramvis
President and CEO

Performance Materials and Technologies 1
Honeywell Investor Conference – March 7, 2012
$4.1 $4.7
$5.7 ~$6.1 - $6.2
14.6%
15.8% 18.4% ~18%
2009 2010 2011 2012E
Sales Segment Margin %
Honeywell Performance Materials And Technologies
Ahead Of Long-Term Targets
Business Units
Recent Highlights Financials
Geographic Mix
• Delivered Record Performance –
Profit, Segment Margin, Cash
• Established New Game-Changing
Technologies
• Improved Plants With Many Running at
Record Levels
• Expanded Global Presence and Sales
Advanced
Materials
UOP
North
America
Asia Pacific
Latin
America
EMEA
($B)
Note: 2011 Sales
Performance Materials and Technologies 2
Honeywell Investor Conference – March 7, 2012
1.7%
2.8%
4.3%
5.3%
7.9%
12.3%
13.5% 13.7%
14.6%
15.8%
18.4%
2001 2002 2003 2004 2005 2006 2007 2008 2009 2010 2011
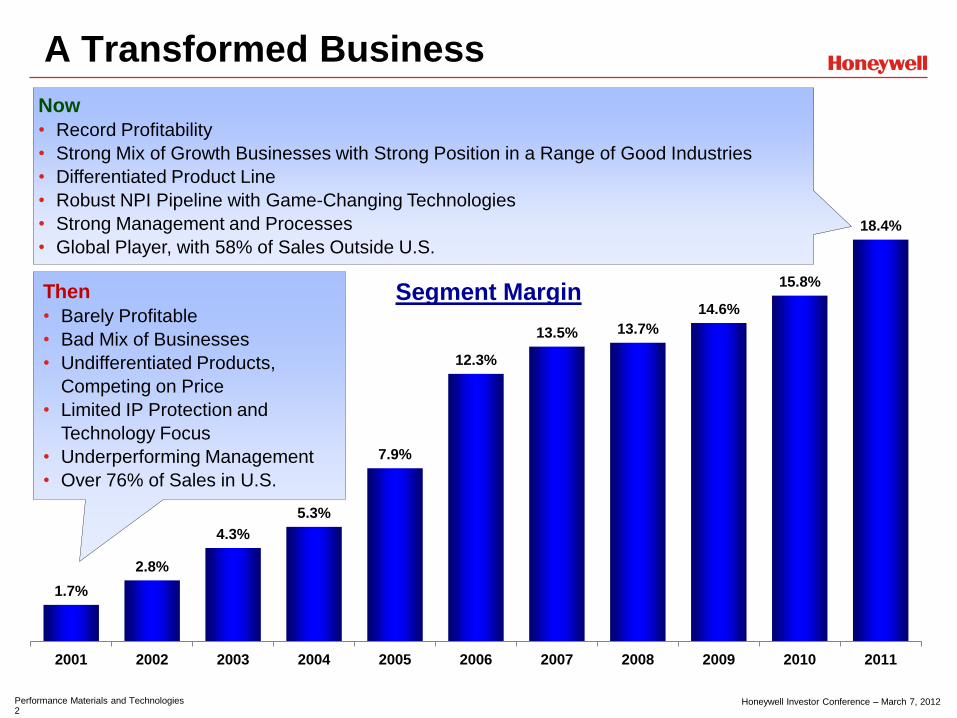
A Transformed Business
Then
• Barely Profitable
• Bad Mix of Businesses
• Undifferentiated Products,
Competing on Price
• Limited IP Protection and
Technology Focus
• Underperforming Management
• Over 76% of Sales in U.S.
Now
• Record Profitability
• Strong Mix of Growth Businesses with Strong Position in a Range of Good Industries
• Differentiated Product Line
• Robust NPI Pipeline with Game-Changing Technologies
• Strong Management and Processes
• Global Player, with 58% of Sales Outside U.S.
Segment Margin

Performance Materials and Technologies 3
Honeywell Investor Conference – March 7, 2012
Analytical Capabilities and Innovation
Engine
Sales and Marketing Excellence
Plant Performance and Process Technology
Differentiator Mechanism
Business Decision
Week
Technology
Investments and
VPDTM Process
HOS and
Plant Strategic
Plans
Strong Management Driving Results
Operating Approach and Leadership
Global Demand
Capture and Sales
Force Deployment
Annual Segment Margin, PMT vs. Industry Peers
Segment Margin, Percent
0%
4%
8%
12%
16%
20%
2005 2006 2007 2008 2009 2010 2011 *
Honeywell
Specialty
Diversified
* Specialty and Diversified based on average of companies reporting FY11 actuals
Performance Materials and Technologies 4
Honeywell Investor Conference – March 7, 2012
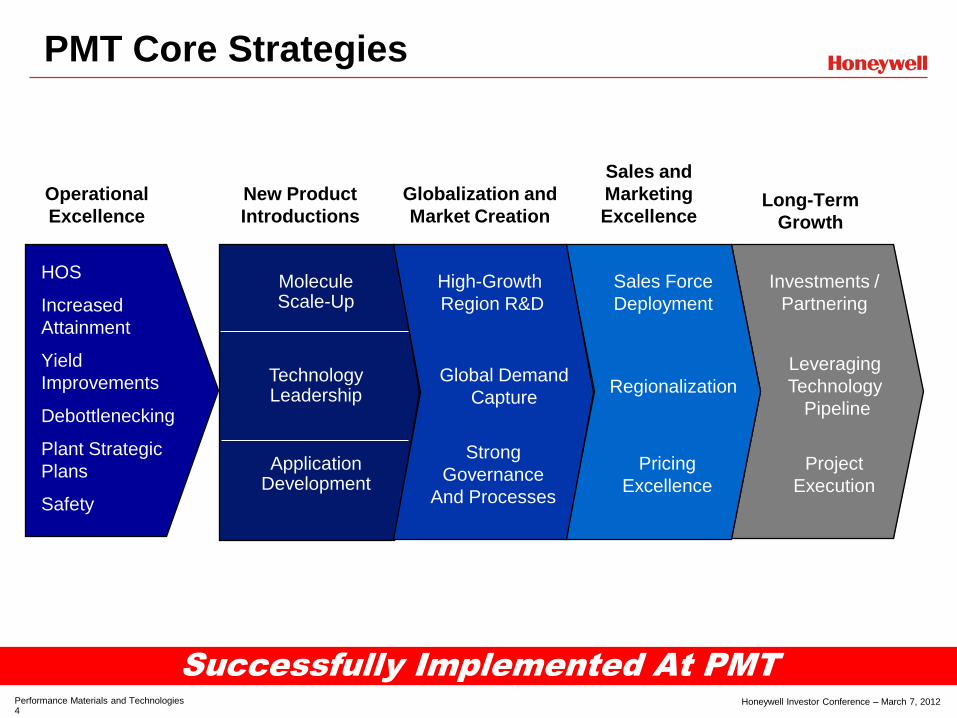
PMT Core Strategies
HOS
Increased
Attainment
Yield
Improvements
Debottlenecking
Plant Strategic
Plans
Safety
Sales and
Marketing
Excellence
Operational
Excellence
New Product
Introductions
Globalization and
Market Creation Long-Term
Growth
Molecule Scale-Up
Technology Leadership
Application Development
High-Growth
Region R&D
Global Demand
Capture
Strong
Governance
And Processes
Sales Force
Deployment
Regionalization
Pricing
Excellence
Leveraging
Technology
Pipeline
Project
Execution
Investments /
Partnering
Successfully Implemented At PMT
Performance Materials and Technologies 5
Honeywell Investor Conference – March 7, 2012
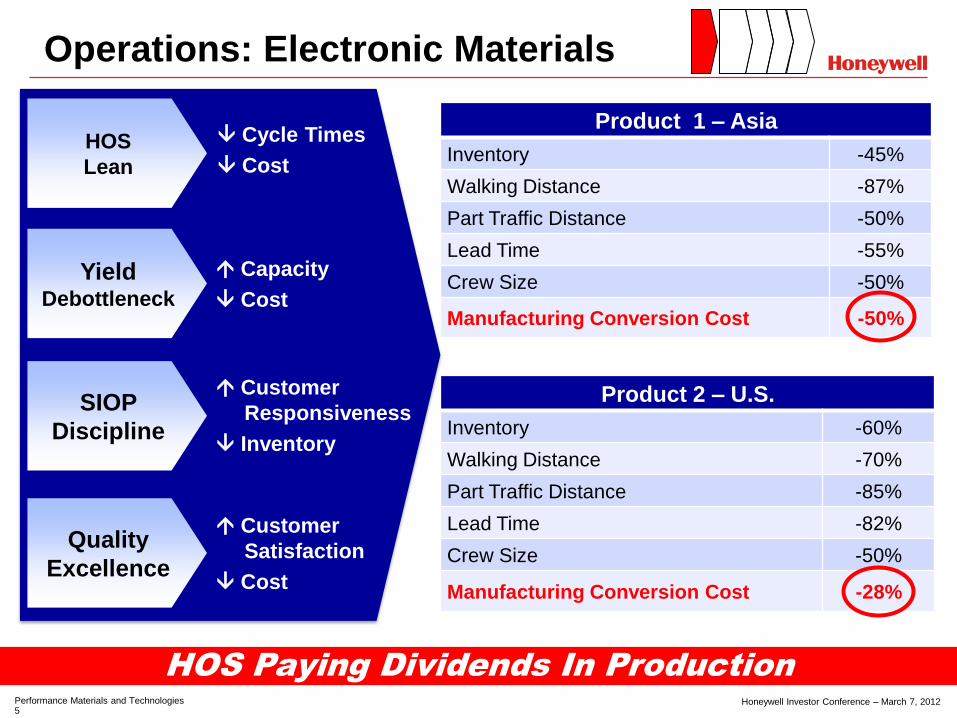
Operations: Electronic Materials
Cycle Times
Cost
Quality
Excellence
HOS
Lean
Yield Debottleneck
SIOP
Discipline
Customer
Satisfaction
Cost
Capacity
Cost
Customer
Responsiveness
Inventory
Product 1 – Asia
Inventory -45%
Walking Distance -87%
Part Traffic Distance -50%
Lead Time -55%
Crew Size -50%
Manufacturing Conversion Cost -50%
Product 2 – U.S.
Inventory -60%
Walking Distance -70%
Part Traffic Distance -85%
Lead Time -82%
Crew Size -50%
Manufacturing Conversion Cost -28%
HOS Paying Dividends In Production
Performance Materials and Technologies 6
Honeywell Investor Conference – March 7, 2012
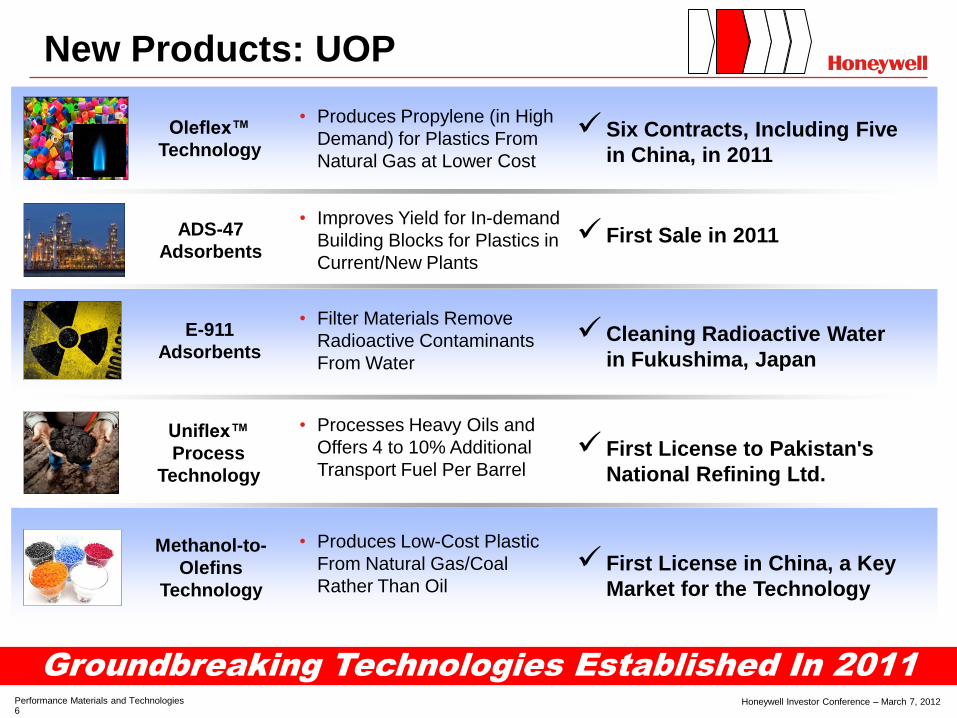
New Products: UOP
Groundbreaking Technologies Established In 2011
Uniflex™
Process
Technology
• Processes Heavy Oils and
Offers 4 to 10% Additional
Transport Fuel Per Barrel First License to Pakistan's
National Refining Ltd.
Methanol-to-
Olefins
Technology
• Produces Low-Cost Plastic
From Natural Gas/Coal
Rather Than Oil First License in China, a Key
Market for the Technology
E-911
Adsorbents
• Filter Materials Remove
Radioactive Contaminants
From Water
Cleaning Radioactive Water
in Fukushima, Japan
Oleflex™
Technology
• Produces Propylene (in High
Demand) for Plastics From
Natural Gas at Lower Cost
Six Contracts, Including Five
in China, in 2011
• Improves Yield for In-demand
Building Blocks for Plastics in
Current/New Plants
ADS-47
Adsorbents First Sale in 2011

Performance Materials and Technologies 7
Honeywell Investor Conference – March 7, 2012
Globalization: Resins And Chemicals
Caprolactam
• Critical Ingredient for
Making Nylon Used in
Carpeting, Clothing,
Engineered Plastics
Ammonium Sulfate
• Effective Fertilizer Used
Globally for a Range of
Plants and Crops
Major U.S. Export
2007 2011
Nylon Resin
• Used in Applications From
Food Packaging to
Automotive
Driving Global Growth
• Moved From Distributors to Direct Sales
to Extract More Value
• >40 New Customers in Asia in 2011
• Leveraging Global Technology Centers
of Excellence to Engineer for Local
Markets
• Doubled Sales
From Outside
U.S. for Key
Products Over
the Last Four
Years
• 41% of Sales
Outside the U.S.
Performance Materials and Technologies 8
Honeywell Investor Conference – March 7, 2012
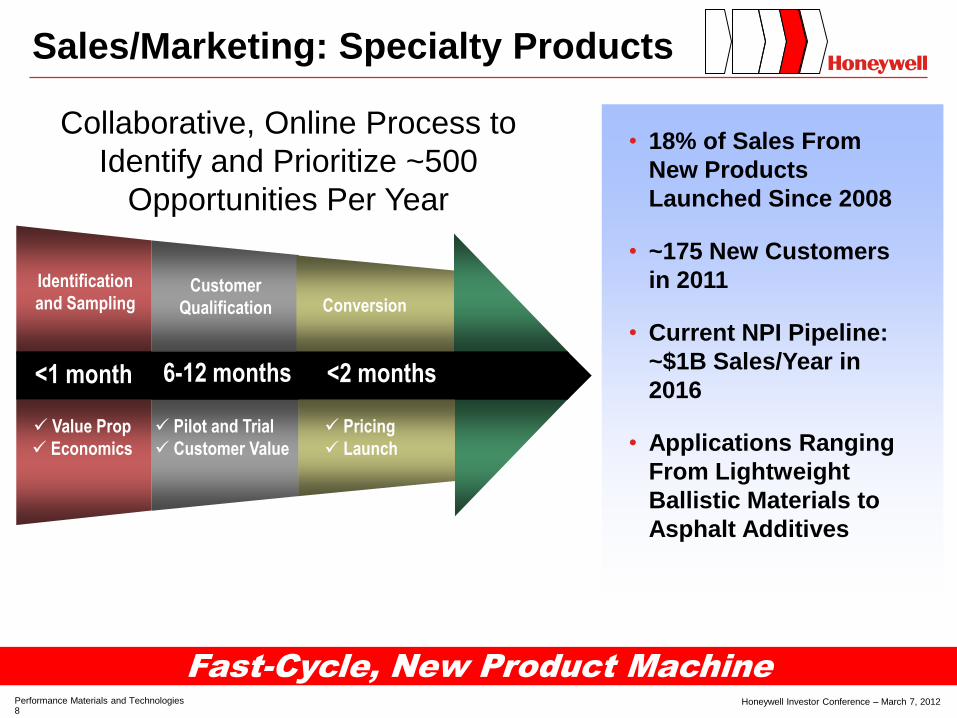
Sales/Marketing: Specialty Products
Customer
Qualification
Value Prop
Economics
Conversion
<2 ms
Pilot and Trial
Customer Value
Pricing
Launch
6-12 months
Identification
and Sampling
<1 month <2 months
Collaborative, Online Process to
Identify and Prioritize ~500
Opportunities Per Year
Fast-Cycle, New Product Machine
• 18% of Sales From
New Products
Launched Since 2008
• ~175 New Customers
in 2011
• Current NPI Pipeline:
~$1B Sales/Year in
2016
• Applications Ranging
From Lightweight
Ballistic Materials to
Asphalt Additives

Performance Materials and Technologies 9
Honeywell Investor Conference – March 7, 2012
New Technology Meets New Industry Need
Growth: Fluorine Products
SolsticeTM 1234yf For Mobile A/C
• Global Warming Potential of 4 vs.
1430 for Current Refrigerant
• Comparable Cooling Efficiency to
Current Refrigerant
• Near Drop-in Replacement,
Saving Significant Cost for
Customer vs. Alternative
• Meeting New European
Regulations
• Significant Customer Wins
• Strong Patent Position
• $1.5B Opportunity
Opportunity
77.6
107
2011E 2020E
Global Light Vehicle
Builds (M)*
1 Vehicle = 1 lb
Refrigerant
Superior Environmental Performance
0
500
1,000
1,500
HFC (Today's Refrigerant)
Solstice 1234yf CO2 (Competing Solution)
AC
re
late
d C
O2e
em
issio
ns
(ve
hic
le life
tim
e)
30% Lower
Emissions vs.
Alternative
• High Growth Opportunity
• HON Only a Minor
Producer of Current
Mobile A/C Refrigerant
Today
Source: Goldman Sachs Japan 2011
Direct Emissions
Indirect Emissions
Performance Materials and Technologies 10
Honeywell Investor Conference – March 7, 2012
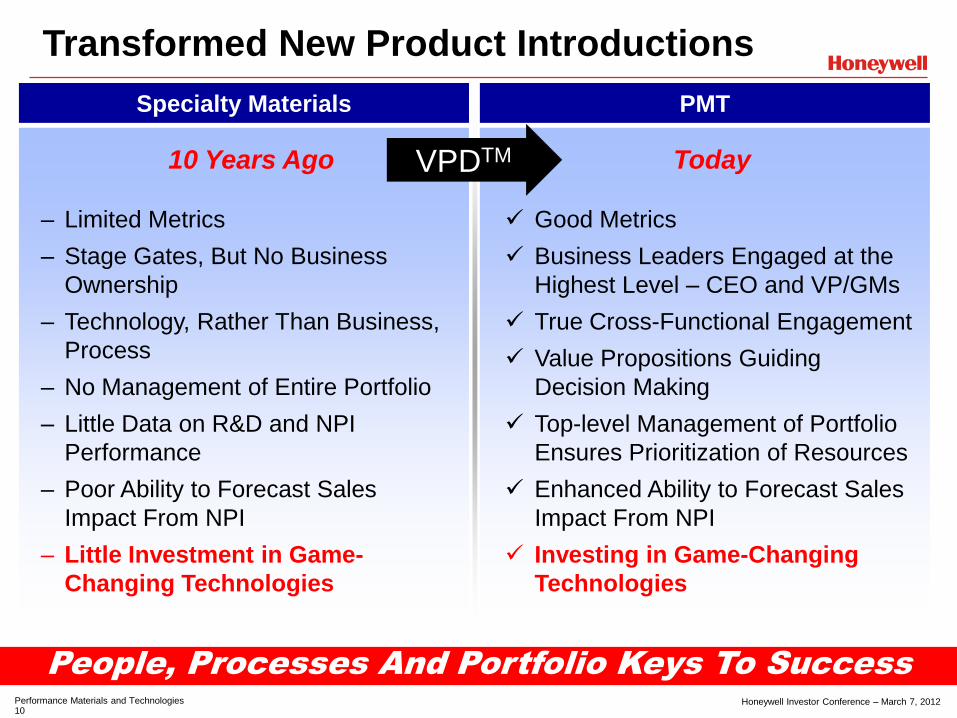
Transformed New Product Introductions
10 Years Ago Today
‒ Limited Metrics
‒ Stage Gates, But No Business
Ownership
‒ Technology, Rather Than Business,
Process
‒ No Management of Entire Portfolio
‒ Little Data on R&D and NPI
Performance
‒ Poor Ability to Forecast Sales
Impact From NPI
‒ Little Investment in Game-
Changing Technologies
Good Metrics
Business Leaders Engaged at the
Highest Level – CEO and VP/GMs
True Cross-Functional Engagement
Value Propositions Guiding
Decision Making
Top-level Management of Portfolio
Ensures Prioritization of Resources
Enhanced Ability to Forecast Sales
Impact From NPI
Investing in Game-Changing
Technologies
People, Processes And Portfolio Keys To Success
VPDTM
Specialty Materials PMT

Performance Materials and Technologies 11
Honeywell Investor Conference – March 7, 2012
People
• 1,100 Scientists
• ~400 Ph.D.s
• 2,800 Process Engineers
• 3,915 Patents Globally
Technology Breadth And Depth
2012: Ben Christolini – ACS Earle B. Barnes Award for
Leadership in Chemical Research Management
2011: Gavin Towler – AIChE Fuels & Petrochemicals
Division Award
2010: UOP-ENI Green Jet & Diesel team – AIChE
Sustainable energy award
2010: Jeff Bricker – ACS National Award for Creative
Invention
2009: Rajiv Singh – ACS Schoellkopf Medal Award
2008: Ian Shankland – Perkin Medal
2005: UOP – National Medal of Technology
The Right People…. … In The Right Places Globally
• 8 Technology Centers of Excellence
• Newest Facilities in India and China, Developing
Products/Applications for Local/Global Markets
• Increased Global Process Engineering
Capabilities
Recognized Researchers In Their Fields “Punching Above Our Weight”
• PMT Ranks No. 4 in Its Sector
for Innovation, Placing it Among
Companies of Much Larger
Scale and Sales
• Issued Patents at Record Levels
• Invention Disclosures at Record
Levels

Performance Materials and Technologies 12
Honeywell Investor Conference – March 7, 2012
Velocity Product Development Process
Definition
of Needs
Business Case
Product And Process
Development
Commercial
Readiness Launch
Stage 1 Stage 2 Stage 3 Stage 4 Stage 5
Scale-Up, Plant
Design and Engineering Proof of Concept
Testing
Voice of the
Customer
Application Testing,
Piloting,
Basic Engineering
Product Qualification,
Regulatory Approvals
Demonstration Runs,
Customer Qualification,
Launch Plan
Technology Leadership New Molecule Fast Cycle Applications
• Leverages Existing
Technologies and Capabilities
• Technology and Marketing
Agility
• Applications Expertise
• Lower Resources and Capital
• Molecule Discovery
• Regulatory Approvals
• Asset and Capital Investments
• Process Development and
Scale-Up
• Front-End Engineering
• Technology Peer Reviews
• Technology Licensing Model
• Strong Research Pipeline
• New Materials Discovery
• Process Development and
Pilot Plants
• Technology Peer Reviews
• Customer / Demonstration
Runs
Common Process Tailored For Three Business Models
General
Manager is
the Owner
Business and
Technology
Co-Leaders
All Functions
Involved
Cycle Time: 6 Months to 2 Years Cycle Time: 2 to 5 Years Cycle Time: 5 to 10 Years

Performance Materials and Technologies 13
Honeywell Investor Conference – March 7, 2012
Law Enforcement and Federal
Agencies
Special Ops Today's High End Vest Vest with Spectra X
Superior Performance
15% Better
Ballistics
Today's High End Vest Vest with Spectra X
15% Lighter
Weight
9m
m V
50 (
fps
) W
eig
ht
(lb
s)
“This is the best stuff we’ve ever shot
… you have a winner.” CEO, Leading
Vest Manufacturer
Military Vests
Military Helmets
Fast Cycle: Spectra® X Ballistic Materials
Leveraging Breakthrough Fiber Technology Across Multiple Segments
Application Market Size
$50M+
$60M+
$100M+
$60M+

Performance Materials and Technologies 14
Honeywell Investor Conference – March 7, 2012
New Molecule: LGWP Materials
Creating Value For Global Customers
Global Warming
Potential of 6 vs. 1430
Non-Flammable
Economic in Use
Today
Meets All
Requirements
Solstice 1233zd
Global Warming
Potential of 7 vs. 1030
Non-Flammable
Improved Energy
Efficiency
Near Drop-in
Replacement
>$300M >$300M
Extending SolsticeTM LGWP Platform
Leveraging Assets
240 245fa
1233zd 1234ze
Using Existing Products/Technology
As Feedstocks for New Products
New
Products
Existing
Products
Solstice 1234ze
Opportunity
• Extends and Expands HON
Position
• Demand for Energy-Efficient
Insulation Driving Future
Growth
• Strong Patent Positions
• Good Customer Acceptance
Aerosol / Insulation Panels
Foam Insulation / Solvents
Environment
Performance
Safety
Cost-to-Serve
Opportunity
Performance Materials and Technologies 15
Honeywell Investor Conference – March 7, 2012
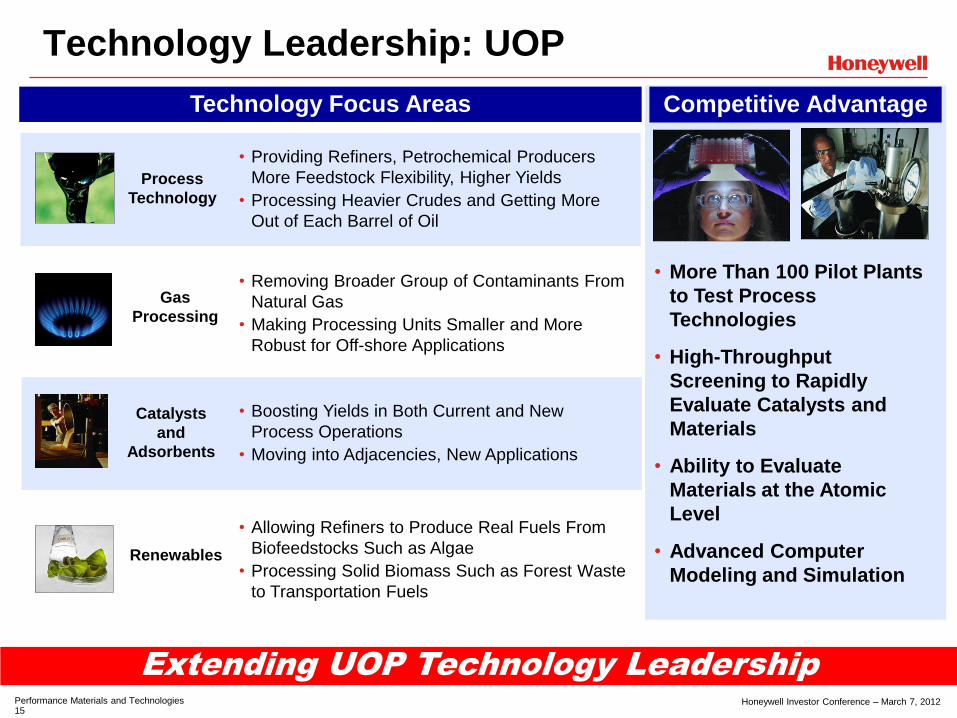
Technology Leadership: UOP
Extending UOP Technology Leadership
Process
Technology
Renewables
Catalysts
and
Adsorbents
Gas
Processing
Technology Focus Areas Competitive Advantage
• Providing Refiners, Petrochemical Producers
More Feedstock Flexibility, Higher Yields
• Processing Heavier Crudes and Getting More
Out of Each Barrel of Oil
• Removing Broader Group of Contaminants From
Natural Gas
• Making Processing Units Smaller and More
Robust for Off-shore Applications
• Boosting Yields in Both Current and New
Process Operations
• Moving into Adjacencies, New Applications
• Allowing Refiners to Produce Real Fuels From
Biofeedstocks Such as Algae
• Processing Solid Biomass Such as Forest Waste
to Transportation Fuels
• More Than 100 Pilot Plants
to Test Process
Technologies
• High-Throughput
Screening to Rapidly
Evaluate Catalysts and
Materials
• Ability to Evaluate
Materials at the Atomic
Level
• Advanced Computer
Modeling and Simulation

Performance Materials and Technologies 16
Honeywell Investor Conference – March 7, 2012
New Product Portfolio Metrics
40
67
2009 2011
100
199
2009 2011
324
213
2009 2011
# Active Projects
2.1
4.0
2009 2011
Yr 5 Gross Sales
Potential ($B)
# Product Launches
↓34%
↑99%
Launch Year Sales ($M)
↑60%
New / Replacement
Product Sales (%) 5 Yr New Product
Sales (%)
↑90%
20
31
2012 2016
50
75
2012 2016
• Prioritized and Reduced Number of Projects
• Concentrated Resources on Top Projects
• Accelerated Execution
• Increased Portfolio Value
• Increasing New Product Sales as % of
Total Sales Over Five-Year Period
• Mix of New Products Shift – More New
vs. Replacement Products
• Track and Measure New Product
Programs Each Month
• Exceeded our New Product Forecast
Each of the Last Two Years

Performance Materials and Technologies 17
Honeywell Investor Conference – March 7, 2012
0
50
100
150
200
2008 2015 2020 2025 2030 2035
Gas Share of Global Energy to Grow From 21% to 25% by 2035
UOP Industry Landscape
Natural Gas Opportunity
Underlying Growth Trends In UOP Sweet Spot
Refining Opportunity
0
100
200
300
400
500
600
700
800
2008 2015 2020 2025 2030 2035
Global Energy Demand Tracks GDP
Source: US Energy Information Administration
Qu
ad
rill
ion
Btu
Base Oil
Demand
Regional
Factors Environ.
Reg.
National
Security
Refining
Growth
Capacity
Replacement
~1.3%
Petrochemical Example
5-8%
Growth
Tri
llio
n c
ub
ic f
eet
Source: US Energy Information Administration
Worldwide Energy
Demand Worldwide Natural
Gas Demand
0
20,000
40,000
60,000
80,000
100,000
120,000
2011 2015 2020
Demand for “On-Purpose”
Propylene Expected to Nearly
Triple From 2010 to 2020
“On-Purpose” Production
Conventional Production
KM
TA
Performance Materials and Technologies 18
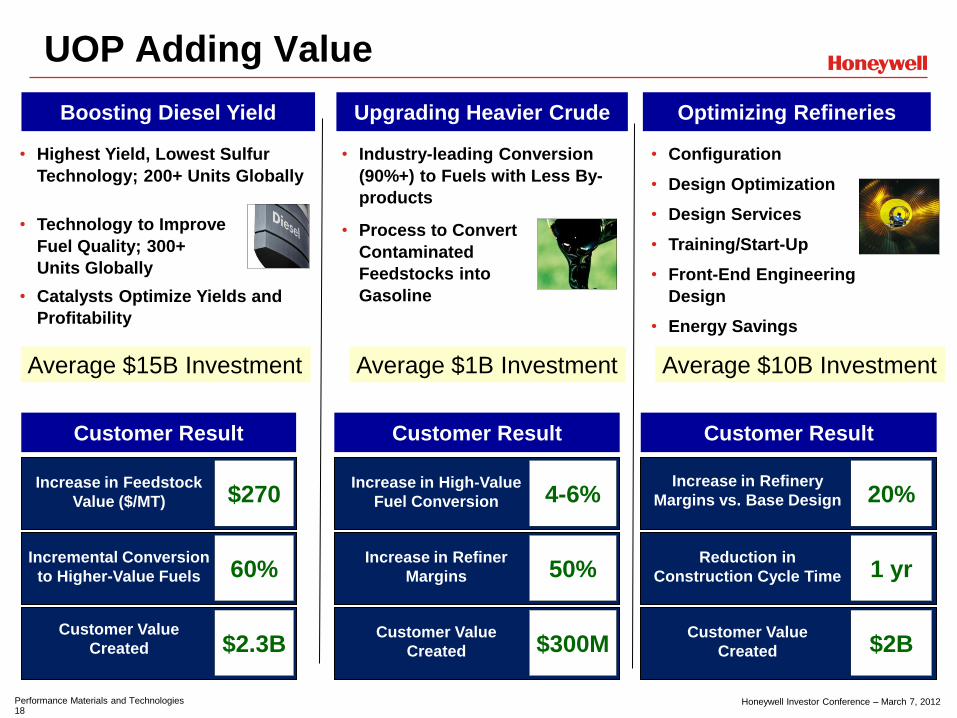
Honeywell Investor Conference – March 7, 2012
• Highest Yield, Lowest Sulfur
Technology; 200+ Units Globally
• Catalysts Optimize Yields and
Profitability
Customer Result
$270 Increase in Feedstock
Value ($/MT)
60% Incremental Conversion
to Higher-Value Fuels
$2.3B Customer Value
Created
4-6% Increase in High-Value
Fuel Conversion
50% Increase in Refiner
Margins
$300M Customer Value
Created
20% Increase in Refinery
Margins vs. Base Design
1 yr Reduction in
Construction Cycle Time
$2B Customer Value
Created
Customer Result Customer Result
UOP Adding Value
• Technology to Improve
Fuel Quality; 300+
Units Globally
• Process to Convert
Contaminated
Feedstocks into
Gasoline
• Industry-leading Conversion
(90%+) to Fuels with Less By-
products
• Configuration
• Design Optimization
• Design Services
• Training/Start-Up
• Front-End Engineering
Design
• Energy Savings
Boosting Diesel Yield Upgrading Heavier Crude Optimizing Refineries
Average $10B Investment Average $1B Investment Average $15B Investment
Performance Materials and Technologies 19
Honeywell Investor Conference – March 7, 2012
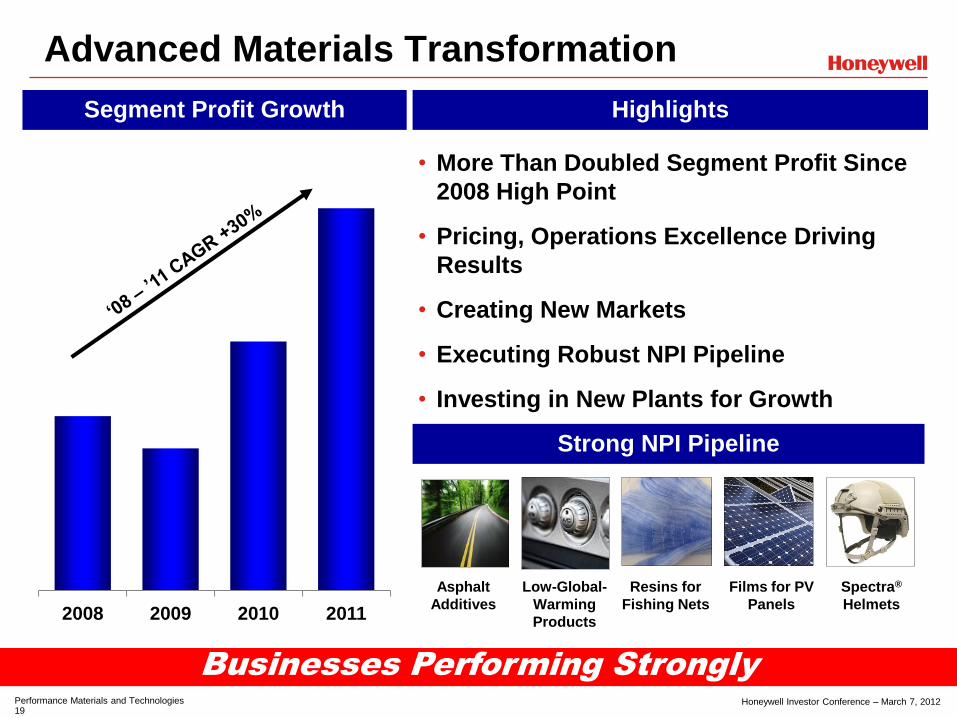
Advanced Materials Transformation
2008 2009 2010 2011
Segment Profit Growth
Low-Global-
Warming
Products
Films for PV
Panels
Resins for
Fishing Nets
Spectra®
Helmets
Strong NPI Pipeline
Highlights
Asphalt
Additives
• More Than Doubled Segment Profit Since
2008 High Point
• Pricing, Operations Excellence Driving
Results
• Creating New Markets
• Executing Robust NPI Pipeline
• Investing in New Plants for Growth
Businesses Performing Strongly

Performance Materials and Technologies 20
Honeywell Investor Conference – March 7, 2012
Advanced Materials Highlights
Fluorine Products Resins And Chemicals
• Achieved Record Profitability • Achieved Record Profitability
• Daily Rigor on Price
• Effective Global Reach
• Designed and Licensed First Sulf-N®
26 Lower Explosive Fertilizer Plant
• Acquired Phenol Facility; Diversified
Cumene Supply for Hopewell
Production
• Achieved Record Profitability and
New Products
• Launched Expansion Plans for
Aclar, Photovoltaics and Asphalt
• Continued Success in New-Product
Commercialization
• Breakthrough Spectra® X Gaining
Traction in the Market
• Major Wins in the Differentiated
Space of Targets, Electronic
Polymers and PV
• Significant Wins in Electronic
Chemicals
• Gains With Key Customers to
Grow in Semiconductor Down
Cycle
Specialty Products Electronic Materials
• Launched SolsticeTM Mobile A/C
Refrigerant (HFO-1234yf), Gas
Blowing Agent (HFO-1234ze) and
Liquid Blowing Agent (HFO-1233zd)
and Secured ~$1B in New Contracts
• Created Sinochem JV to Expand
245fa Blowing Agent in Asia Solstice yf
Refrigerant Sulf-N® 26
Fertilizer
Physical Vapor
Deposition Target
Spectra®
Helmet
Technology
La
rge
Mo
lecu
le
Fa
st-
Cycle
Game-Changing Technology Global Position and Reach
NPI Driving Growth Adjacent Market Growth

Performance Materials and Technologies 21
Honeywell Investor Conference – March 7, 2012
Truly Global
New/Expanded Regional Technical Sales and/or Support
New/Expanded Technology Development Capabilities
New/Expanded Procurement Capabilities
New/Expanded Project Engineering Capabilities
India Technology Center
China /
SE Asia
India Latin
America
Mid
East
FSU
Africa
High Growth Regions
Approaching 50% Of Sales From High Growth Regions In 2012
• Expands Global Research
Capabilities For:
‒ Refining, Petrochemical
‒ Low-Global-Warming Products
‒ Nylon and Additives Applications
• First UOP Pilot Plants Outside
U.S.
• Close-to-Customer
Technology Development

Performance Materials and Technologies 22
Honeywell Investor Conference – March 7, 2012
Becoming The Chinese Competitor
Time
Sale
s
Strongly
Competitive
Import
Goods from
Developed
Regions
Step 1:
Establish Strong R&D
and Technology
Presence
Step 2:
Enhance Sales and
Marketing Presence
Step 3:
Strategic Acquisitions and
In-Country Manufacturing
• Joint Venture With
Sinochem to Produce
Blowing Agents
• Expand SUOP Catalyst
Production
• Expanded Direct
Customer Base for
Caprolactam, Resin
• Doubling UOP Sales
Force in China
• Shanghai Lab Expanded
to Serve Local
Customers
• >$80M in 2011 Sales
From New Products
Developed At the Lab
Strengthening High-Growth Region Leverage

Performance Materials and Technologies 23
Honeywell Investor Conference – March 7, 2012
15
29
38
2
2009 Today 2014E
Honeywell Operating System
HOS Results HOS Deployment Status
Bronze Certified
Sites Deployed
1
14
• Safety (TCIR): 64% Reduction
• Quality (PPM): 65% Reduction
• Delivery (OTTR): 3 pt Improvement
• Inventory (DOS): 7 day Improvement
• Cost Improvement: 12%
Silver Certified
Nearly 50% of Conversion Cost
in Bronze or Silver
Observed Improvement for
Plants Reaching Bronze Status
HOS Driving Gains In Production
Performance Materials and Technologies 24
Honeywell Investor Conference – March 7, 2012
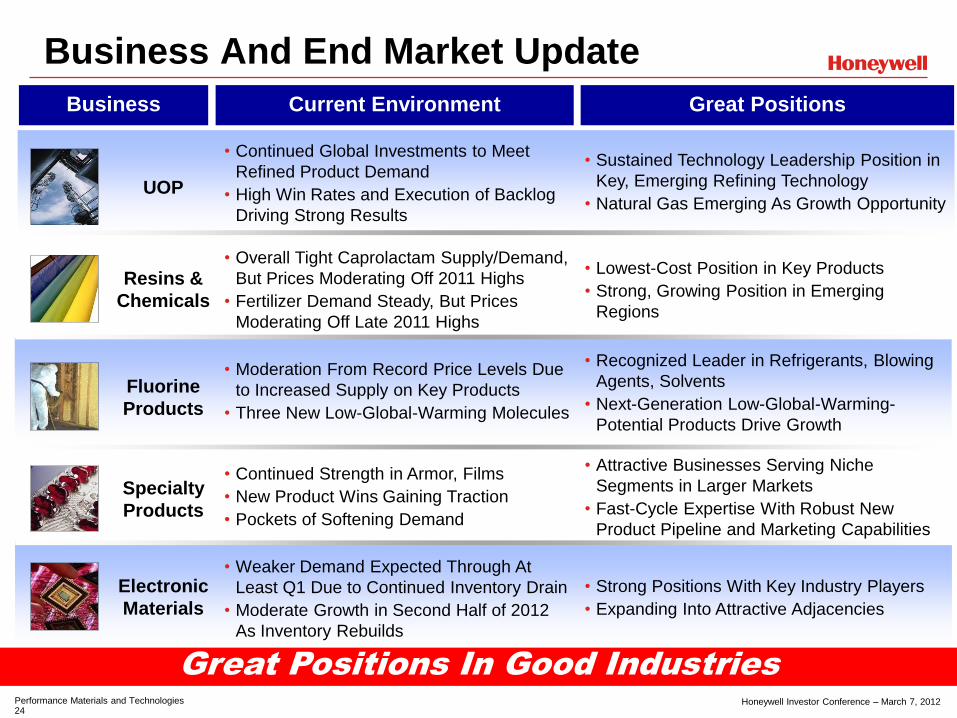
Business And End Market Update
UOP
Fluorine
Products
Resins &
Chemicals
• Continued Global Investments to Meet
Refined Product Demand
• High Win Rates and Execution of Backlog
Driving Strong Results
Current Environment Business Great Positions
Specialty
Products
Electronic
Materials
• Overall Tight Caprolactam Supply/Demand,
But Prices Moderating Off 2011 Highs
• Fertilizer Demand Steady, But Prices
Moderating Off Late 2011 Highs
• Moderation From Record Price Levels Due
to Increased Supply on Key Products
• Three New Low-Global-Warming Molecules
• Continued Strength in Armor, Films
• New Product Wins Gaining Traction
• Pockets of Softening Demand
• Sustained Technology Leadership Position in
Key, Emerging Refining Technology
• Natural Gas Emerging As Growth Opportunity
• Attractive Businesses Serving Niche
Segments in Larger Markets
• Fast-Cycle Expertise With Robust New
Product Pipeline and Marketing Capabilities
Great Positions In Good Industries
• Weaker Demand Expected Through At
Least Q1 Due to Continued Inventory Drain
• Moderate Growth in Second Half of 2012
As Inventory Rebuilds
• Strong Positions With Key Industry Players
• Expanding Into Attractive Adjacencies
• Lowest-Cost Position in Key Products
• Strong, Growing Position in Emerging
Regions
• Recognized Leader in Refrigerants, Blowing
Agents, Solvents
• Next-Generation Low-Global-Warming-
Potential Products Drive Growth

Performance Materials and Technologies 25
Honeywell Investor Conference – March 7, 2012
Long-Term Outlook Update
Overdriving Long-Term Targets
Long Term Target: 7 - 9% CAGR Long Term Goal: 16 - 18%
($B) Sales Segment Margin
2010 2011 2012 2013 2014
2012 Up 8 - 10%
2010 2011 2012 2013T 2014T
$5.6 – 6.3
$4.7
$5.7
$6.1 – 6.2
16.0-18.0% ~18%
18.4%
15.8% target target target target

Performance Materials and Technologies 26
Honeywell Investor Conference – March 7, 2012
Summary
• Operating Margins at Record Levels
• Outperforming Peers
• Strong Management Structure, Disciplined Process
• Robust New Product Pipeline, Investing for Growth
• Growing Globally in Presence, Sales

Honeywell Investor Conference – March 7, 2012 Transportation Systems 0
Transportation Systems Alex Ismail
President and CEO

Honeywell Investor Conference – March 7, 2012 Transportation Systems 1
$3.6
$2.4
$3.2
$3.9
10.8%
2.5%
11.1%
12.6%
2008 2009 2010 2011 2012E
Sales Segment Margin %
Europe 64%
Asia 19%
Honeywell Transportation Systems
OE 76%
AM 24%
Financials Revenue Profile ($B)
Top Stories
Turbo 81%
FM 19%
• Fuel Efficiency and Emissions Regulation Drive Long-Term Growth
• Win Rate and New Launches Supporting Growth Faster Than Industry
• Technology Leadership Across All Fuels, Segments and Geographies
• Operational Transformation: HOS Advantage, FM Turnaround in Progress
Margin Expansion On Flat Revenues
$3.9-$4.0
12.7% -
13.0%
Businesses End Markets Geographic Mix
Americas
17%
Note: 2011 Sales

Honeywell Investor Conference – March 7, 2012 Transportation Systems 2
2012 Automotive Industry Macros
Light Vehicle Production
Commercial Vehicle Production
North America Europe
16.8
Japan
South Korea
Vehicle Production (M Units)
18.0 20.1
1.6
2012
1.4
-8%
2011
18.5
1.0
13.8
2011
+7%
2012
0.9
12.9
2.6
2012
+7%
18.7
2.7
17.2
2011
China
0.50.5
4.2
+15%
2011
3.6
2012
0%
4.6
2012
4.6
2011
8.1
2011
0.7
+14%
2012
0.8
9.3
2012
4.4 4.7
2011
+6%
Headwind Tailwind Impact TBD
•EU Recession
•EU Declining Production
• Tighter Credit for Cars
•Material & Metals Inflation
• $/Euro FX Rate
• ~100 Turbo Launches
•Global Turbo Penetration
•EU Diesel Penetration
15% 18%
11% 11%
67% 70% 19% 20%
12% 13%
35% 35%
40% 43%
Turbo Penetration
India
%
South America
Turbo Penetration Offsetting EU Production Decline
Source: LV - Global Insight; CV - JD Power, PSR

Honeywell Investor Conference – March 7, 2012 Transportation Systems 3
Tightening Fuel Regulation
15
30
45
60 75
2011
2020
67
15
30
45
60 75
2011
2020 55
15
30
45
60 75
2011
2020
47
MPG MPG MPG
• Turbocharging – A “No Compromise” Solution to Consumers
- Small-Engine Fuel Economy – Large-Engine Performance
- Enables Up to 35% Fuel Efficiency with Same Horsepower
More Stringent Regulation Drives Turbo Adoption
Fleet average fuel economy and green house gas emissions standards standardized by CAFE-converted MPG

Honeywell Investor Conference – March 7, 2012 Transportation Systems 4
2016
38M
2014
32M
2012
26M
Turbo Industry Outlook
• Turbo Penetration Accelerates; Significant Upside Remains
• Turbo Gas Growing Quickly, But Turbo Diesel Still Majority of Volume
33%
36%
30%
Turbo Industry By Vehicle
Turbo Penetration
2012
26M
2016
38M
2014
32M
Diesel
Gas
Turbo Industry By Fuel
Industry volume based on number of turbocharged engines.
Source: Global Insight, PSR, JD Power, Honeywell
HON Has Great Position In Good Industry
CNG engines – Part of gas; Hybrids included in gas/diesel
33%
36%
30%
Turbo Penetration
Light Vehicles
Commercial Vehicles
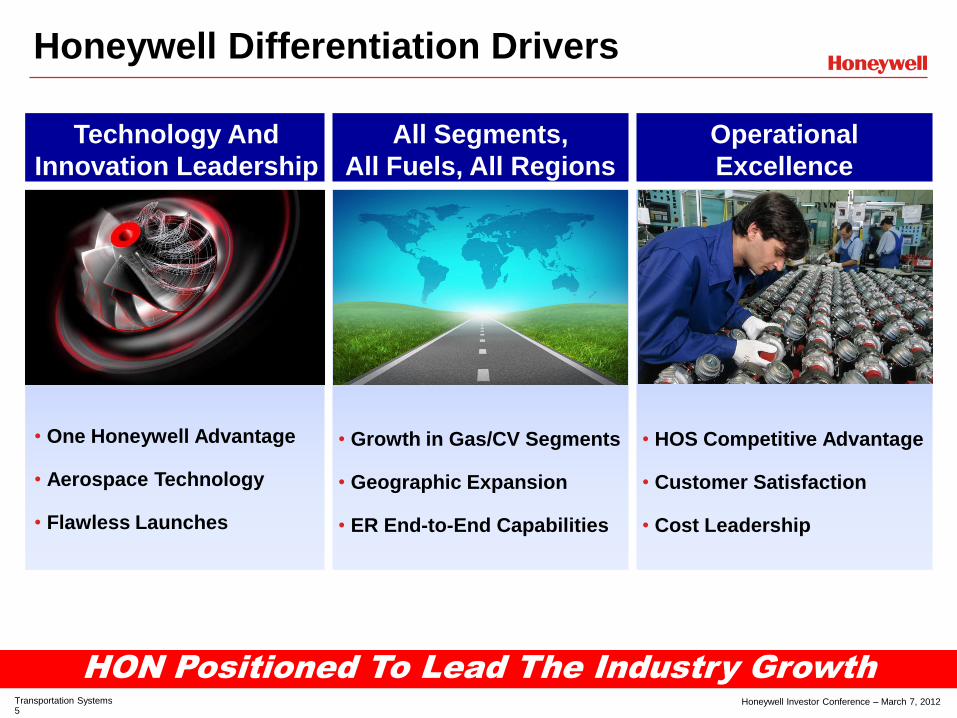
Honeywell Investor Conference – March 7, 2012 Transportation Systems 5
Honeywell Differentiation Drivers
HON Positioned To Lead The Industry Growth
Technology And
Innovation Leadership
All Segments,
All Fuels, All Regions
Operational
Excellence
• One Honeywell Advantage
• Aerospace Technology
• Flawless Launches
• Growth in Gas/CV Segments
• Geographic Expansion
• ER End-to-End Capabilities
• HOS Competitive Advantage
• Customer Satisfaction
• Cost Leadership

Honeywell Investor Conference – March 7, 2012 Transportation Systems 6
Honeywell Advantage
• One Honeywell – Jet Engines (AERO), Controls (ACS), Green Fuels (PMT)
• Largest Global Customer Base – Unique Engineering Insight
• 100+ Million Turbos Shipped – Launch Expertise and Field Experience
Setting Turbo Industry Standards For All Vehicles

Honeywell Investor Conference – March 7, 2012 Transportation Systems 7
Key Turbo Launches
THIS PAGE LEFT INTENTIONALLY BLANK

Honeywell Investor Conference – March 7, 2012 Transportation Systems 8
Gasoline Turbo Growth
Flagship Platforms Key Launches
• 20% Industry Volume CAGR Through 2016 From Increased Turbo Pen.
• Strong Growth Through New Launches in US, EU, China
Mercedes-AMG S63 5.5L High Performance Twin Turbo
Chevy Cruze 1.4L U.S. Bestseller – 42MPG
VW Passat 1.8L Driving U.S. Gas Growth
SAIC/Roewe 550 1.8L Gasoline Turbo for China
Highlights
New Product Range Drives HON Growth Globally
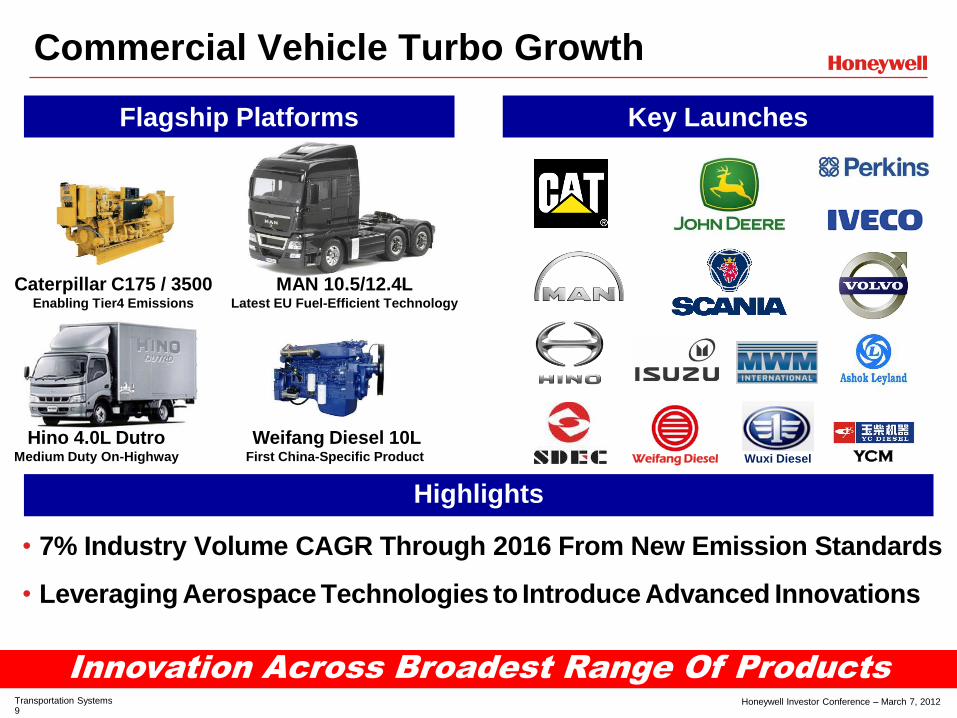
Honeywell Investor Conference – March 7, 2012 Transportation Systems 9
Commercial Vehicle Turbo Growth
Flagship Platforms Key Launches
• 7% Industry Volume CAGR Through 2016 From New Emission Standards
• Leveraging Aerospace Technologies to Introduce Advanced Innovations
MAN 10.5/12.4L Latest EU Fuel-Efficient Technology
Hino 4.0L Dutro Medium Duty On-Highway
Caterpillar C175 / 3500 Enabling Tier4 Emissions
Weifang Diesel 10L First China-Specific Product
Highlights
Wuxi Diesel Weifang Diesel YCM
Innovation Across Broadest Range Of Products

Honeywell Investor Conference – March 7, 2012 Transportation Systems 10
2020 Target
67 MPG
Europe Turbo Growth
Regulation Turbo Industry Sales
• 8% Industry Volume CAGR; Diesel Volume More Than Double Gasoline
• Technology Lead in Premium and Small Engines with New Products
Highlights
Source: Global Insight, PSR, JD Power, Honeywell
15
30
45
60
75
2011
2020
67
MPG
Strengthening Leadership In Largest Turbo Region
+8% CAGR
Diesel
Gasoline
2016
19M
2014
17M
2012
14M
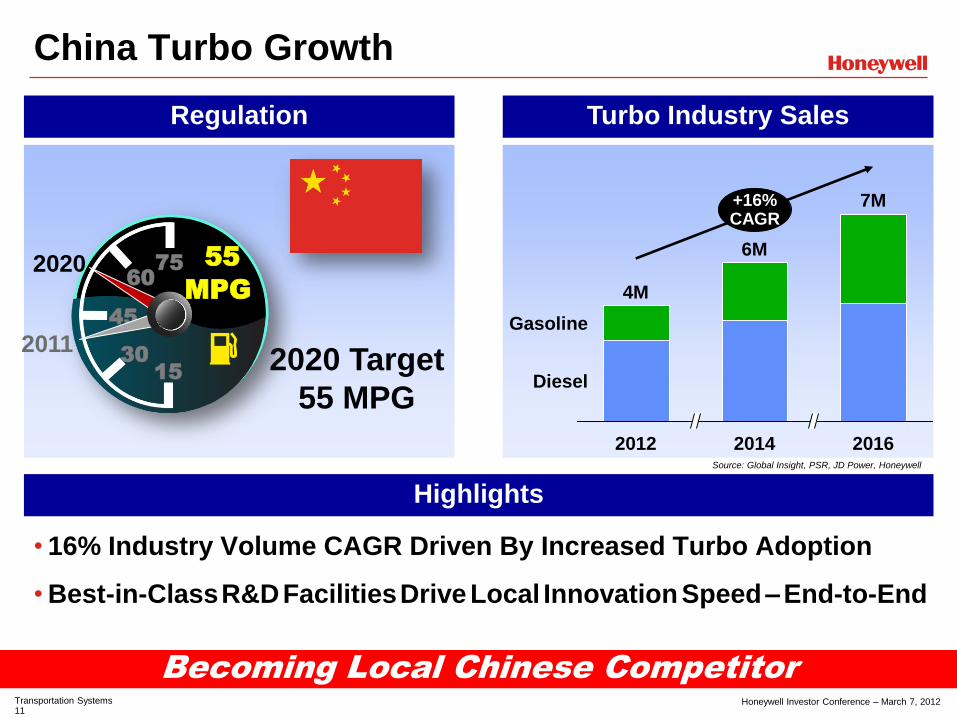
Honeywell Investor Conference – March 7, 2012 Transportation Systems 11
China Turbo Growth
2020 Target
55 MPG
Regulation Turbo Industry Sales
15
30
45
60
75
2011
2020 55
MPG
Highlights
• 16% Industry Volume CAGR Driven By Increased Turbo Adoption
•Best-in-Class R&D Facilities Drive Local Innovation Speed – End-to-End
Source: Global Insight, PSR, JD Power, Honeywell
Becoming Local Chinese Competitor
+16% CAGR
Diesel
Gasoline
2016
7M
2014
6M
2012
4M

Honeywell Investor Conference – March 7, 2012 Transportation Systems 12
2020 Target
47 MPG
North America Turbo Growth
15
30
45
60
75
2011
2020
47
MPG
Regulation Turbo Industry Sales
• 17% Industry Volume CAGR Driven By Increased Turbo Adoption
• Leading Turbo Adoption in Passenger Cars – Chevrolet, VW, Ford
Highlights
Source: Global Insight, PSR, JD Power, Honeywell
Flagship Launches Across All Segments
+17% CAGR
Diesel
Gasoline
2016
5M
2014
4M
2012
2M

Honeywell Investor Conference – March 7, 2012 Transportation Systems 13
Friction Materials Transformation
THIS PAGE LEFT INTENTIONALLY BLANK

Honeywell Investor Conference – March 7, 2012 Transportation Systems 14
HOS – Honeywell Operating System
Twenty-Year Competitive Advantage
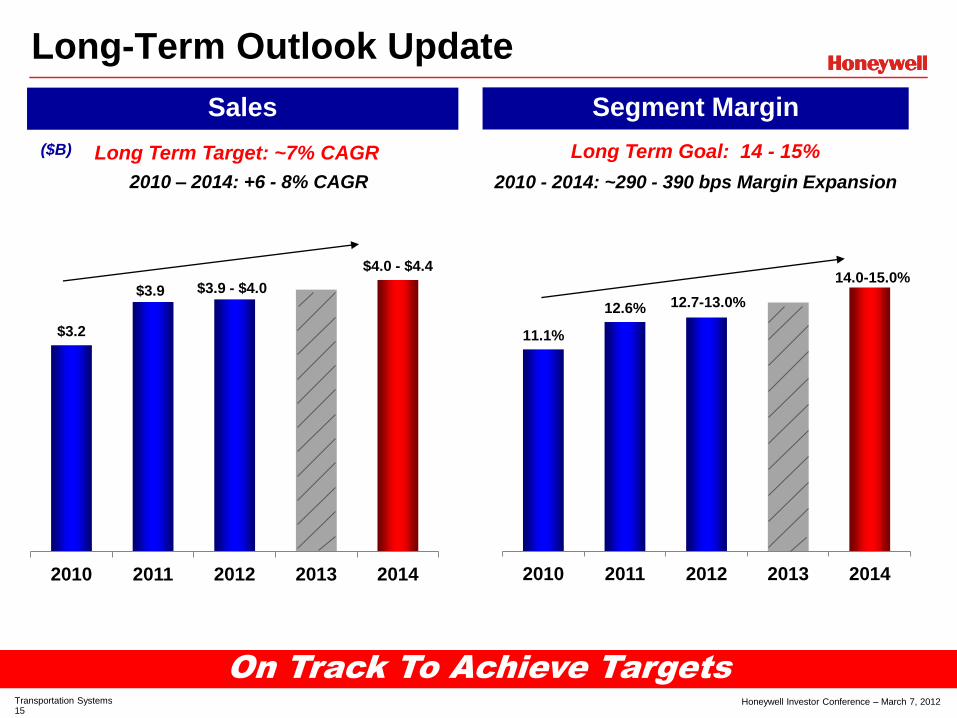
Honeywell Investor Conference – March 7, 2012 Transportation Systems 15
On Track To Achieve Targets
Long Term Target: ~7% CAGR Long Term Goal: 14 - 15%
($B)
$3.2
$3.9 $3.9 - $4.0
$4.0 - $4.4
2010 2011 2012 2013 2014
11.1%
12.6% 12.7-13.0%
14.0-15.0%
2010 2011 2012 2013 2014
Long-Term Outlook Update
2010 – 2014: +6 - 8% CAGR 2010 - 2014: ~290 - 390 bps Margin Expansion
Segment Margin Sales

Honeywell Investor Conference – March 7, 2012 Transportation Systems 16
• Fuel Efficiency Regulations Drive Long-Term Growth
• Win Rate and Launches Drive Growth Faster Than Industry
• Leadership in All Fuels, Segments, Geographies
• Operational Excellence Through HOS
Multi-Year Profitable Growth
Summary

Honeywell Operating System
Pasquale Abruzzese
VP Transportation Systems
Integrated Supply Chain
Mike Owens
VP Aerospace
Integrated Supply Chain
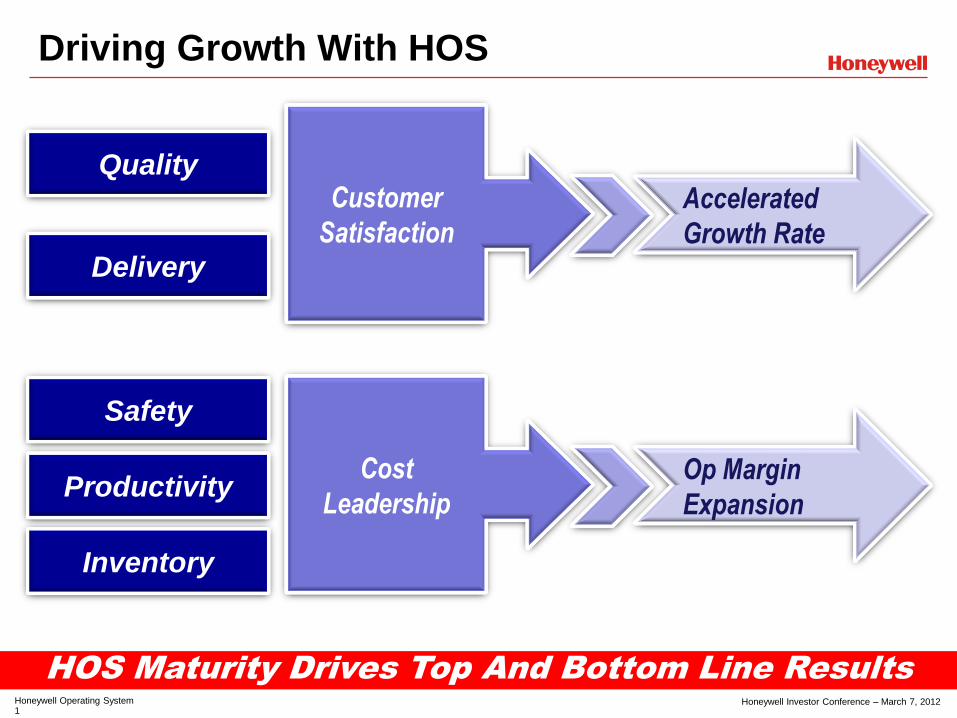
Honeywell Investor Conference – March 7, 2012 Honeywell Operating System 1
HOS Maturity Drives Top And Bottom Line Results
Driving Growth With HOS
Quality
Productivity
Delivery
Inventory
Customer
Satisfaction
Accelerated
Growth Rate
Cost
Leadership
Op Margin
Expansion
Safety
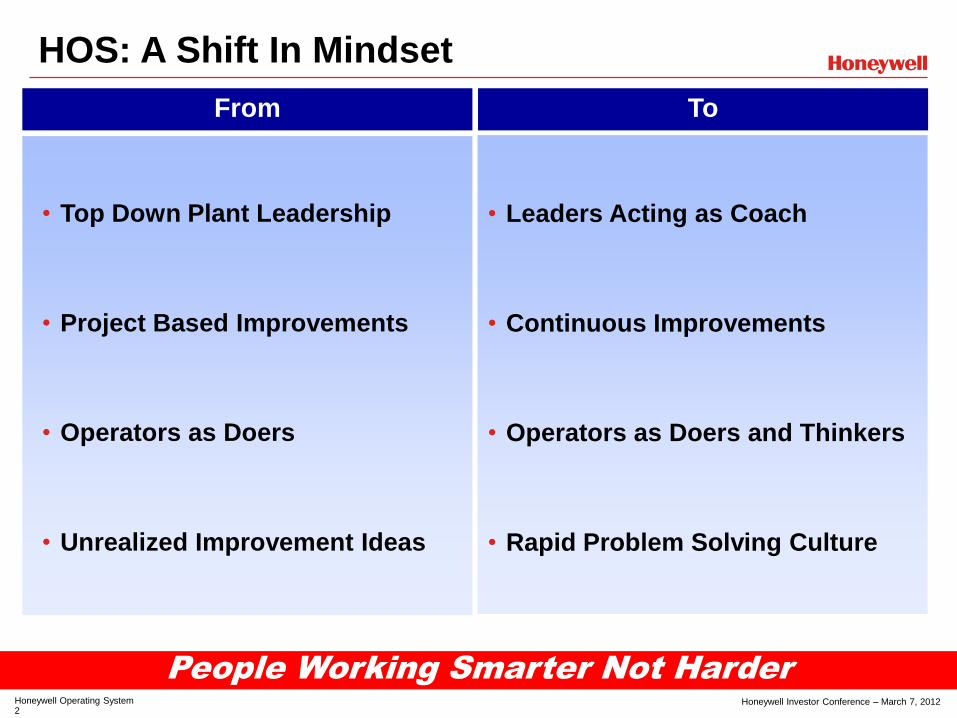
Honeywell Investor Conference – March 7, 2012 Honeywell Operating System 2
HOS: A Shift In Mindset
People Working Smarter Not Harder
From To
• Leaders Acting as Coach
• Continuous Improvements
• Operators as Doers and Thinkers
• Rapid Problem Solving Culture
• Top Down Plant Leadership
• Project Based Improvements
• Operators as Doers
• Unrealized Improvement Ideas

Honeywell Investor Conference – March 7, 2012 Honeywell Operating System 3
Driving Continuous Improvement
Continuous Improvement Culture Ingrained
After Before
Process
• Reduced Inventory by 50%
• Operator Led Improvements
Daily walk of
2.7km
Daily walk of
150 meters
• 100,000+ New Ideas Annually
• Input Locally/Implemented Globally
Improvement Ideas

Honeywell Investor Conference – March 7, 2012 Honeywell Operating System 4
HOS Implementation From 3 Years To 1 Year
• Rapid Problem Solving on Floor
• Learning Shared Across Sites
Visual Management
• +25% Output / Square Feet
• Space Available for Growth
Capacity Optimization
After Before
SPACE AVAILABLE
FOR GROWTH
MACHINES MACHINES
MACHINES MACHINES
MACHINES MACHINES MACHINES
MACHINES
MACHINES
MACHINES
MA
CH
INE
S
MA
CH
INE
S
MA
CH
INE
S
MA
CH
INE
S
Process Standardization
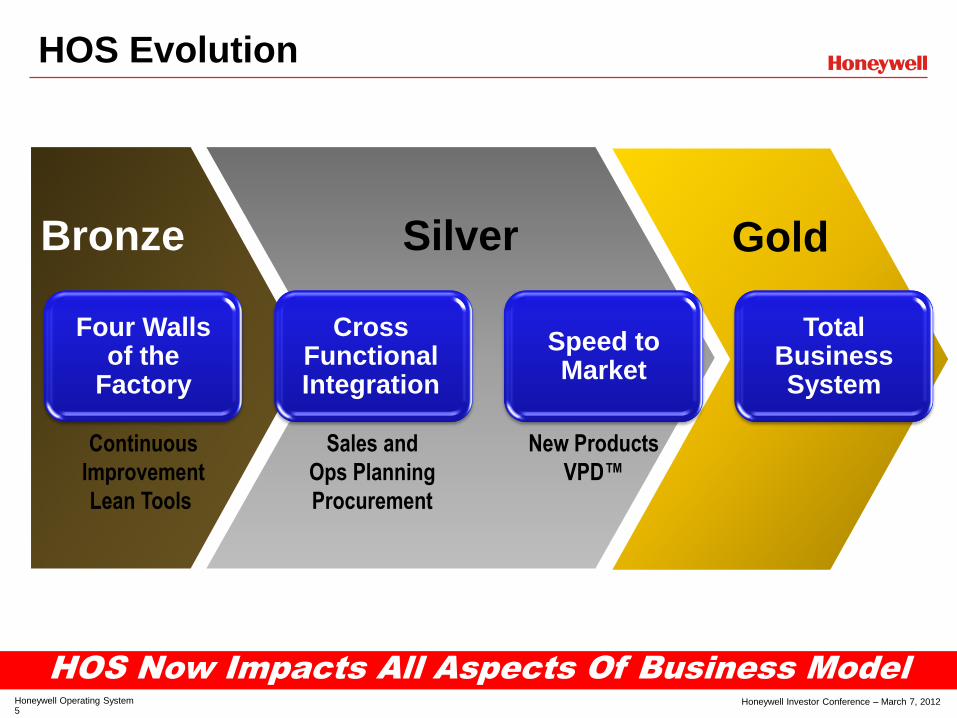
Honeywell Investor Conference – March 7, 2012 Honeywell Operating System 5
Gold
Bronze
Silver
HOS Evolution
Continuous
Improvement
Lean Tools
Sales and
Ops Planning
Procurement
New Products
VPD™
HOS Now Impacts All Aspects Of Business Model
Four Walls of the
Factory
Cross Functional Integration
Speed to Market
Total Business System

Honeywell Investor Conference – March 7, 2012 Honeywell Operating System 6
People Culture
Turbo Operations Overview
• Full Product Range 1L to 100L
• Global Footprint – 13 Countries
• Global Sourcing – 30 Countries
• Just in Time Delivery
• 10,000 SKUs
• 1,000+ Suppliers
Manufacturing
CORE
Technology
Component
Suppliers
Supply
Chain
Broad Portfolio; Complex Global Supply Chain
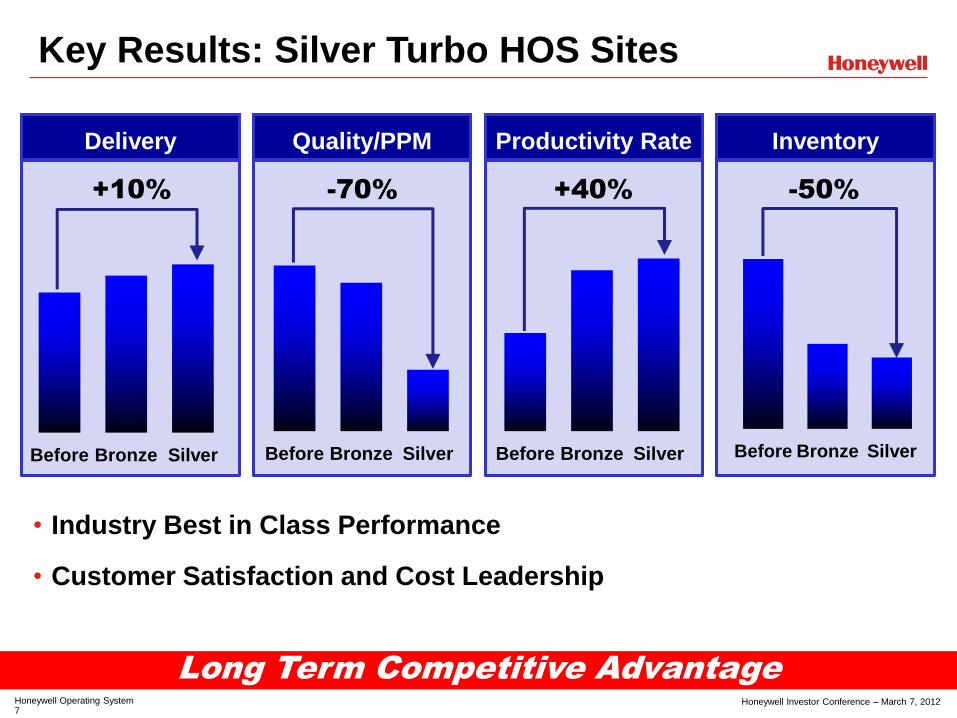
Honeywell Investor Conference – March 7, 2012 Honeywell Operating System 7
Delivery Quality/PPM Productivity Rate Inventory
Key Results: Silver Turbo HOS Sites
Long Term Competitive Advantage
Before Bronze Silver Before Bronze Silver Before Bronze Silver
• Industry Best in Class Performance
• Customer Satisfaction and Cost Leadership
+10% -70% +40% -50%
Before Bronze Silver

Honeywell Investor Conference – March 7, 2012 Honeywell Operating System 8
HOS: Turbocharging Growth
Great Position In Growing Industry
Quality
Productivity
Delivery
Inventory
Customer
Satisfaction Accelerated
Growth Rate
Cost
Leadership Op Margin
Expansion
Safety
Transportation Systems Sales
Transportation Systems Segment Margin
$3.2
$3.9 $3.9-$4.0 $4.0-$4.4
2010 2011 2012 2013 2014
11.1% 12.6%
2010 2011 2012 2013 2014
12.7-13.0%
14.0-15.0%
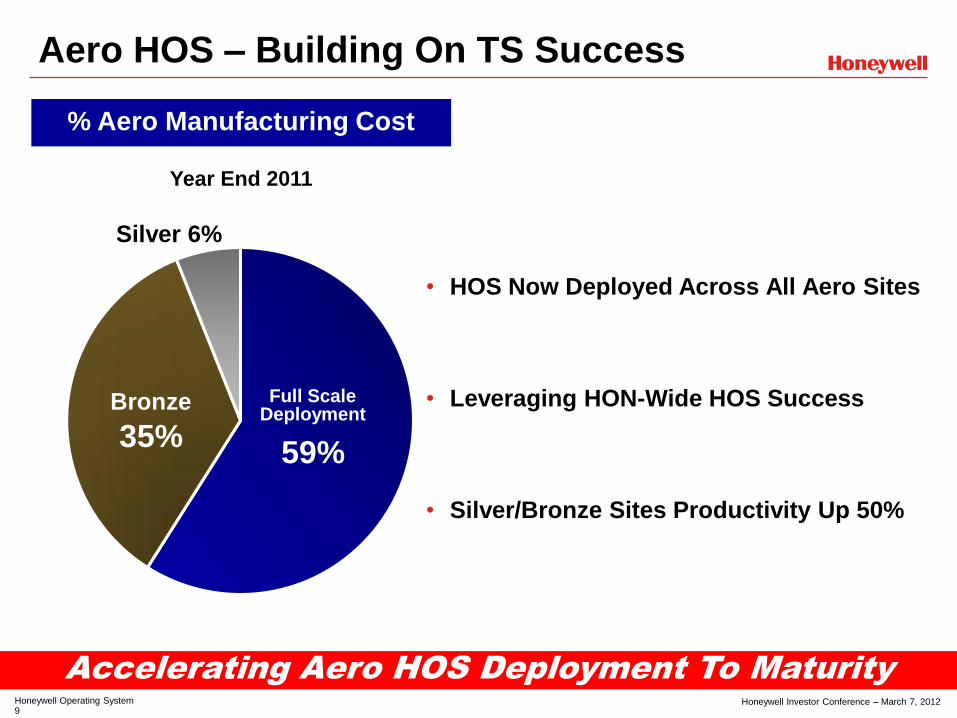
Honeywell Investor Conference – March 7, 2012 Honeywell Operating System 9
Aero HOS – Building On TS Success
Accelerating Aero HOS Deployment To Maturity
% Aero Manufacturing Cost
Year End 2011
• HOS Now Deployed Across All Aero Sites
• Leveraging HON-Wide HOS Success
• Silver/Bronze Sites Productivity Up 50%
Bronze
35%
Full Scale Deployment
59%
Silver 6%

Honeywell Investor Conference – March 7, 2012 Honeywell Operating System 10
67%
33%
51% 49%
32%
68%
15%
71%
14%
30% 59%
11%
100% Of Manufacturing HOS Bronze+ By 2014
Accelerating Aero HOS Deployment
HOS Deployed Bronze Sites Silver Sites
2013 2014 2015 2012 2016
% of Conversion
Costs By Phase
20
30
40
50
60
2006 2007 2008 2009 2010 2011
Mo
nth
s t
o B
ron
ze
Deployment Timing – Honeywell Aerospace
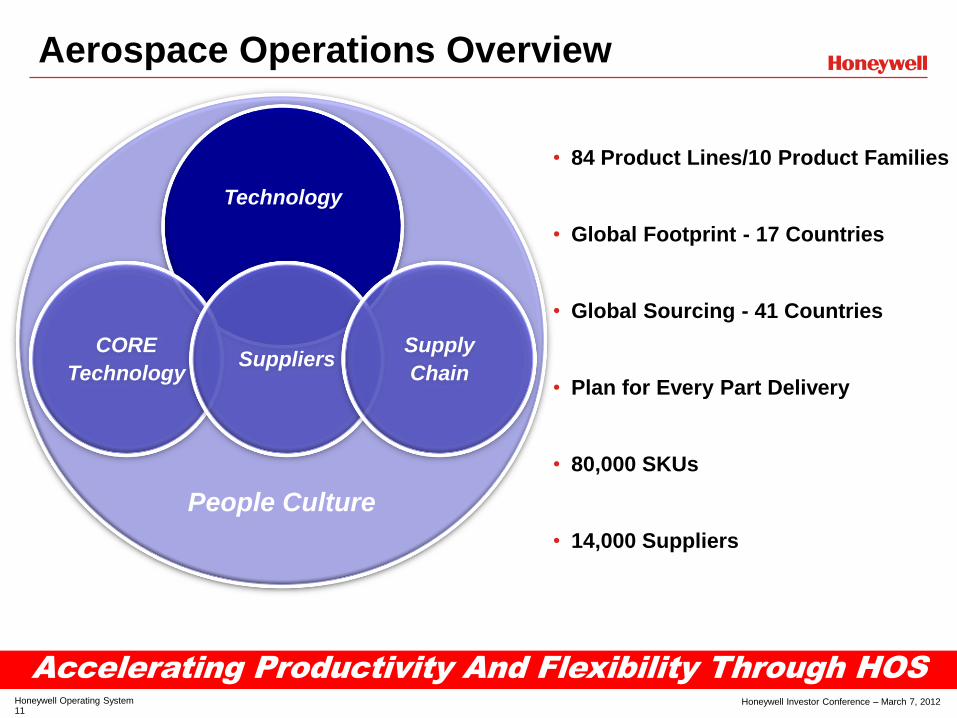
Honeywell Investor Conference – March 7, 2012 Honeywell Operating System 11
Aerospace Operations Overview
• 84 Product Lines/10 Product Families
• Global Footprint - 17 Countries
• Global Sourcing - 41 Countries
• Plan for Every Part Delivery
• 80,000 SKUs
• 14,000 Suppliers
Accelerating Productivity And Flexibility Through HOS
People Culture
Technology
CORE
Technology Suppliers
Supply
Chain

Honeywell Investor Conference – March 7, 2012 Honeywell Operating System 12
HOS Silver – Minneapolis Site
Customer Improvement Without Walls
• Accountability Down to Shop Floor
• Processes to Enables Issue Escalation
• Sites Connected to WW Functions
• Empowerment of Operators
• Leadership Support and Coaching
• Employee Driven Improvements
Delivery Quality/PPM Productivity Rate Inventory
Before Bronze Silver Before Bronze Silver Before Bronze Silver Before Bronze Silver
-60% +125% -26%
Best Practices Employee Culture
+240bps

Honeywell Investor Conference – March 7, 2012 Honeywell Operating System 13
Customer Feedback
Customers Seeing Real Value Of HOS
“Overall, HOS
provides the
framework for gains in
productivity and
quality beyond that
typical in
manufacturing. It is
an industry best
practice.”
“[Recent] results are
strong evidence that
key ISC initiatives
rolled out at the
site…including HOS
projects are paying
huge dividends.”
“HOS is engrained,
and it is evident that
leadership is
committed.”
Honeywell Investor Conference – March 7, 2012 Honeywell Operating System 14
HOS – A Jet Engine For Growth
• Foundation of Continuous Improvement Culture
• Building Upon Lean Tools and Standardization
• Reaching Beyond the Factory Walls
• Customer Satisfaction and Cost Leadership
HOS Accelerates Growth Rate And Margin Expansion

z
Aerospace Tim Mahoney
President and CEO

Aerospace 1
Honeywell Investor Conference – March 7, 2012
Honeywell Aerospace
Great Position In A Good Industry

Aerospace 2
Honeywell Investor Conference – March 7, 2012
Transformed Organization
From To Product Organized Customer Facing Organization
Bid Everything – Product-led Pursuits
Marketing/Product Management Excellence –
Integrated Platform/Product Pursuits
Non-integrated Portfolio Compete Across Portfolio, RMU Opportunities
Minimal Sales People Outside U.S. Census: ~500 HC, or ~20% S&M
2x Int’l Sales & Marketing Presence Census: ~1000, or ~40% S&M
Federated Engineering Organization Distributed Centers of Excellence
4 Walls of the Factory Network Capacity, Cross-Functional Capability
Higher Cost Structure Less G&A; More Efficient R&D, S&M
Capitalized Sales Incentives 100% Expense Drives Better Decision Making
Customer Centric Organization… Strong Competitive Advantage

Aerospace 3
Honeywell Investor Conference – March 7, 2012
Winning Momentum Drives Aero Growth Outlook
Strong Aerospace Outlook
2011 2014
D&S 45%
Comm’l AM 36%
Comm’l OE 19%
D&S ~40%
Comm’l AM ~35%
Comm’l OE ~25%
$11.5B ~$13B
Sales
• >$20B in Unannounced OEM
Orders Across the Portfolio
- $9B Propulsion, $7B Avionics
- $4B Mechanical Systems
• $2.5B Airline Wins 2011
- $400M in APAC Wins in Q411
• $2.7B in D&S Wins 2011
- Defense Book-to-Bill > 1
Key Recent Wins
CAGR 4%

Aerospace 4
Honeywell Investor Conference – March 7, 2012
Strong Pipeline Of New High Impact Aircraft
Broad, Unmatched Wins

Aerospace 5
Honeywell Investor Conference – March 7, 2012
Expansive Product Breadth
Unmatched Breadth, Uniquely Innovative
• Enhanced Safety Products
• Air Traffic Modernization
• Innovative Mechanical and Electronic Solutions
• Airborne Connectivity
Delivering New Innovations

Aerospace 6
Honeywell Investor Conference – March 7, 2012
Smart Runway - Reduces Runway Incursions Smart Landing - Reduces Landing Risk
“Approaching Runway Three-
Four Left”
New Safety Innovations – Available Now
New Innovations Address Highest Safety Issues
• 3,000 Units Sold
• Certified for 10,000+ Aircraft
• 30,000+ Total Aircraft Available
• $500M Growth Opportunity
• Improves Safety of Landing and Taxi
• Reduces Pilot Workload
• Lowers Incident Costs – Currently 30 Runway Excursions/Year
Smart Runway Smart Landing
Reduces Runway Incursions Reduces Landing Risk
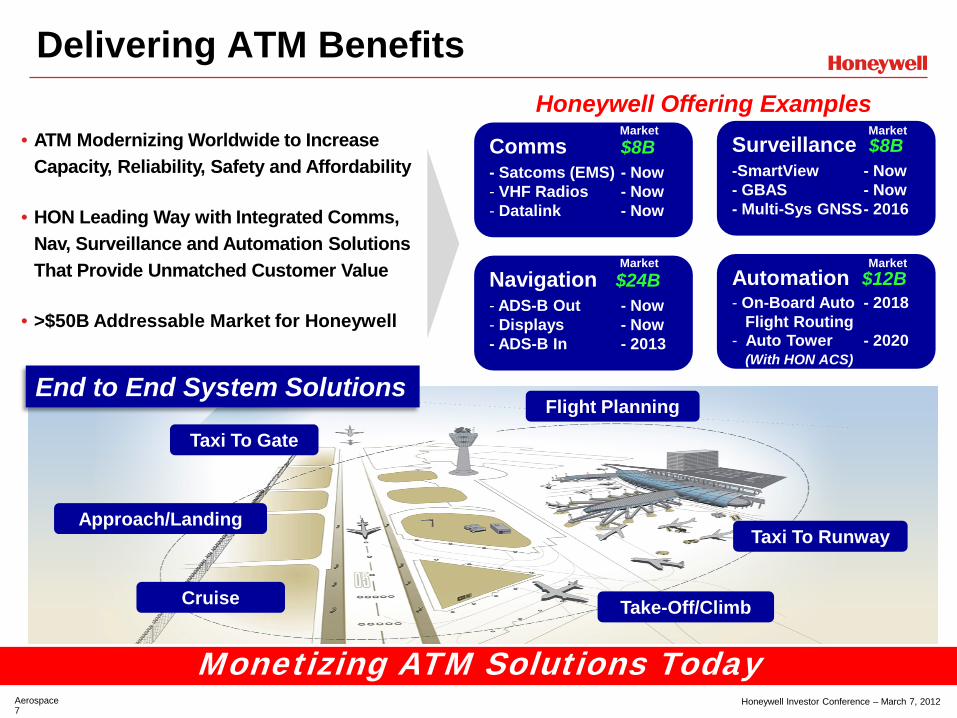
Aerospace 7
Honeywell Investor Conference – March 7, 2012
Delivering ATM Benefits
Monetizing ATM Solutions Today
Taxi To Gate
Flight Planning
Taxi To Runway
Take-Off/Climb Cruise
Approach/Landing
Surveillance $8B -SmartView - Now - GBAS - Now - Multi-Sys GNSS - 2016
Honeywell Offering Examples
Automation $12B - On-Board Auto - 2018 Flight Routing - Auto Tower - 2020 (With HON ACS)
Comms $8B - Satcoms (EMS) - Now - VHF Radios - Now - Datalink - Now
Navigation $24B - ADS-B Out - Now - Displays - Now - ADS-B In - 2013
End to End System Solutions
• ATM Modernizing Worldwide to Increase Capacity, Reliability, Safety and Affordability
• HON Leading Way with Integrated Comms, Nav, Surveillance and Automation Solutions That Provide Unmatched Customer Value
• >$50B Addressable Market for Honeywell
Market Market
Market Market
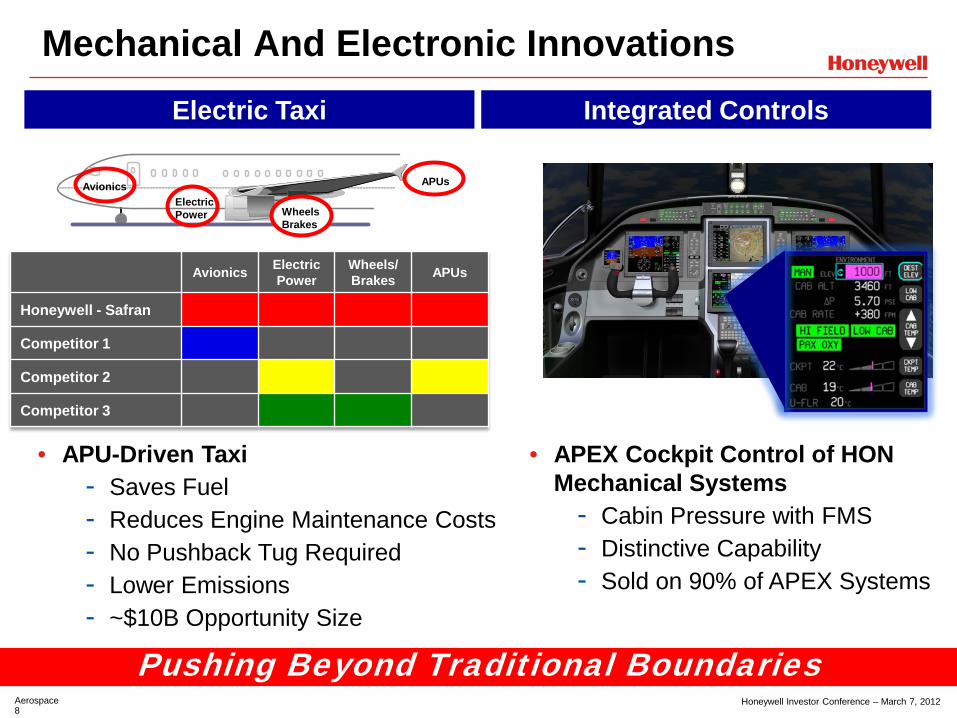
Aerospace 8
Honeywell Investor Conference – March 7, 2012
Mechanical And Electronic Innovations
Pushing Beyond Traditional Boundaries
Avionics Electric
Power
Wheels Brakes
APUs
Avionics Electric Power
Wheels/ Brakes APUs
Honeywell - Safran
Competitor 1
Competitor 2
Competitor 3
• APU-Driven Taxi - Saves Fuel - Reduces Engine Maintenance Costs - No Pushback Tug Required - Lower Emissions - ~$10B Opportunity Size
• APEX Cockpit Control of HON Mechanical Systems
- Cabin Pressure with FMS - Distinctive Capability - Sold on 90% of APEX Systems
Smart Runway - Reduces Runway Incursions Smart Landing - Reduces Landing Risk Electric Taxi Integrated Controls

Aerospace 9
Honeywell Investor Conference – March 7, 2012
Airborne Connectivity Offerings
Great Position With Differentiated Technology
• Demand for Connectivity Rapidly Growing
- Double to >8K Aircraft by 2014
• Integration of EMS Into HON Creates Industry’s Strongest Offering:
- Broadest Product Range
- Industry Leading Technology
- HON “Smarts” Inside >75% of Other’s Products)
- Largest Installed Base – Every ATR Broadband Solution
• Ability to Combine Satcom with Other HON Products to Create New Offerings
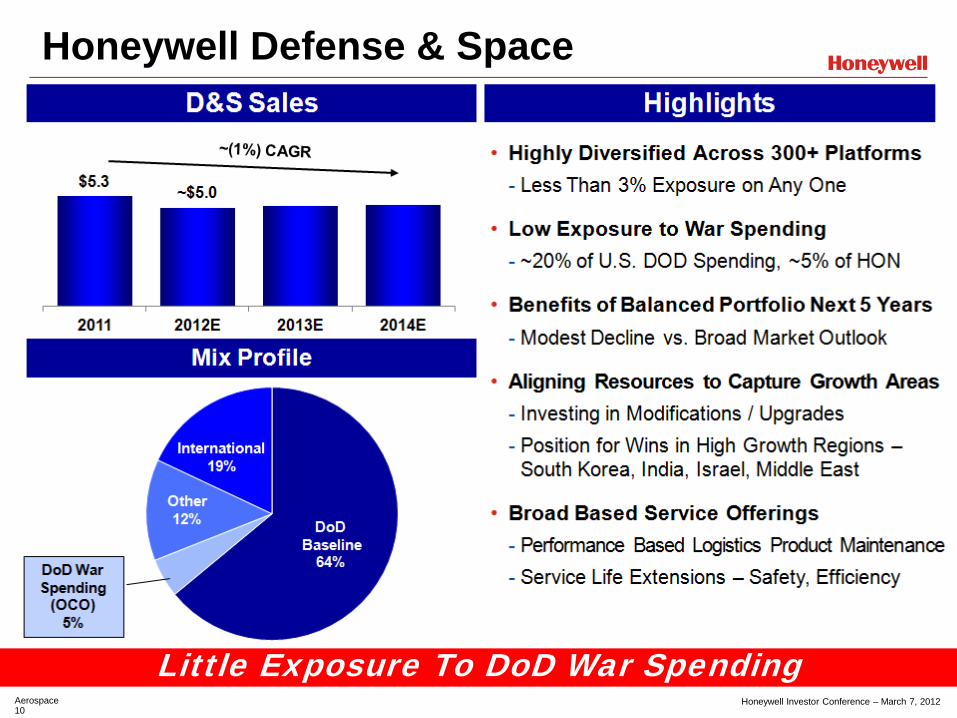
Aerospace 10
Honeywell Investor Conference – March 7, 2012
Honeywell Defense & Space
Little Exposure To DoD War Spending

Aerospace 11
Honeywell Investor Conference – March 7, 2012
Defense & Space Opportunities
Opportunities Offset DoD Budget Declines
Aftermarket / RMU Growth Focused International Growth
• Jaguar Re-Engine
• Modernization
• Local Platforms
• Helicopters
• Fighters
• Upgrades
• Capability: Propulsion, SATCOM, Navigation
• Operational Efficiency: Condition Based Maint.
• Modernization: Navigation, Displays
• Safety: Terrain Avoidance, Weather Radar
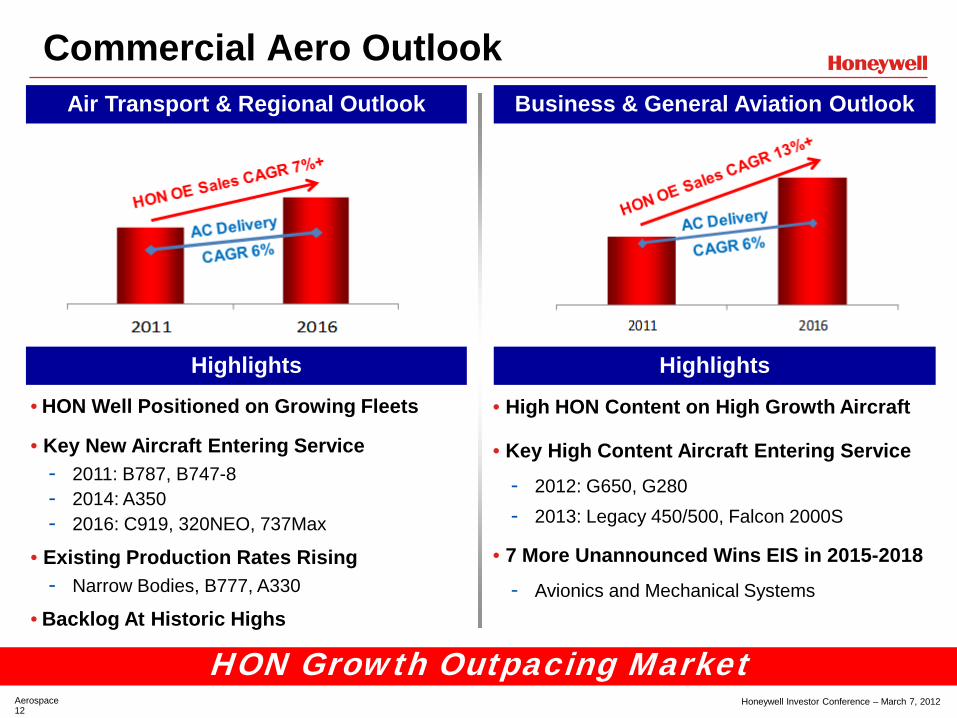
Aerospace 12
Honeywell Investor Conference – March 7, 2012
Commercial Aero Outlook Air Transport & Regional Outlook
HON Growth Outpacing Market
Business & General Aviation Outlook
• HON Well Positioned on Growing Fleets
• Key New Aircraft Entering Service - 2011: B787, B747-8 - 2014: A350 - 2016: C919, 320NEO, 737Max
• Existing Production Rates Rising - Narrow Bodies, B777, A330
• Backlog At Historic Highs
• High HON Content on High Growth Aircraft
• Key High Content Aircraft Entering Service
- 2012: G650, G280 - 2013: Legacy 450/500, Falcon 2000S
• 7 More Unannounced Wins EIS in 2015-2018
- Avionics and Mechanical Systems
Highlights Highlights
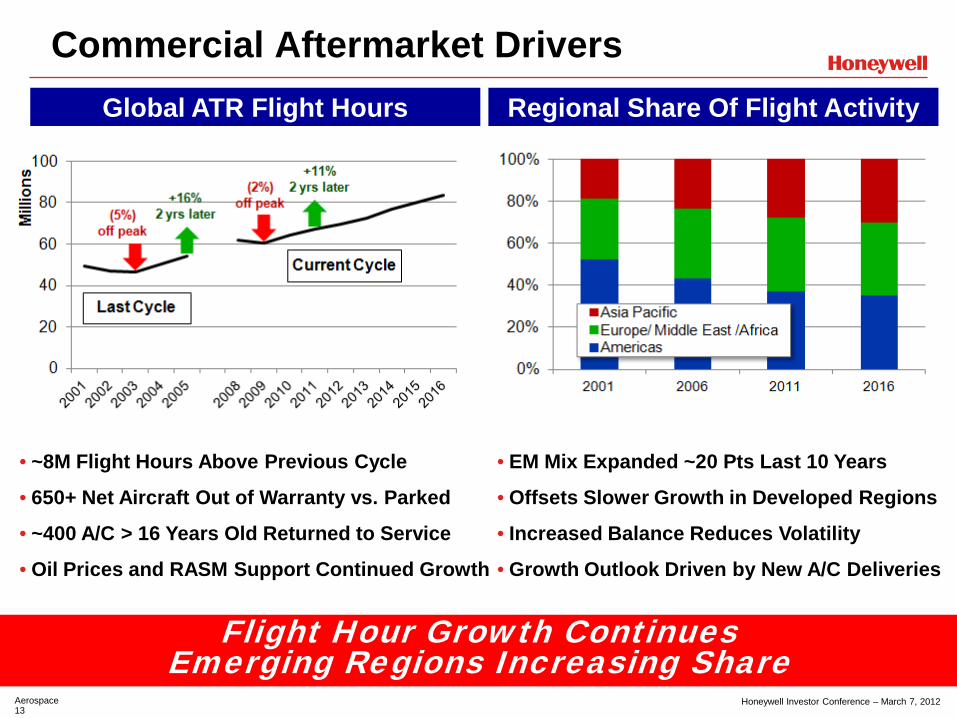
Aerospace 13
Honeywell Investor Conference – March 7, 2012
Commercial Aftermarket Drivers Global ATR Flight Hours Regional Share Of Flight Activity
Flight Hour Growth Continues Emerging Regions Increasing Share
• ~8M Flight Hours Above Previous Cycle
• 650+ Net Aircraft Out of Warranty vs. Parked
• ~400 A/C > 16 Years Old Returned to Service
• Oil Prices and RASM Support Continued Growth
• EM Mix Expanded ~20 Pts Last 10 Years
• Offsets Slower Growth in Developed Regions
• Increased Balance Reduces Volatility
• Growth Outlook Driven by New A/C Deliveries
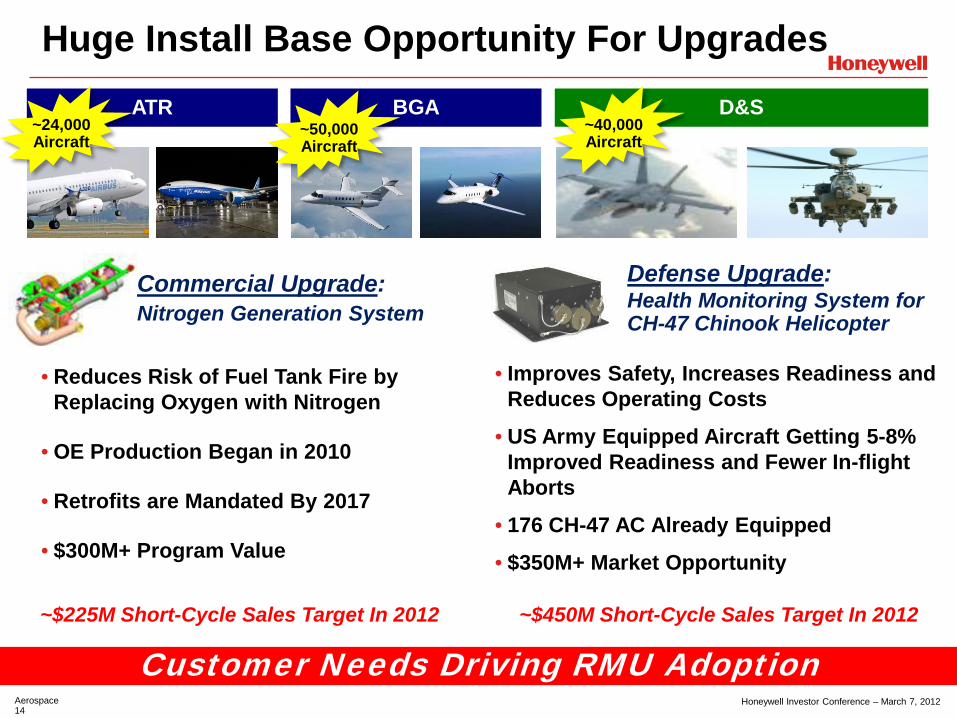
Aerospace 14
Honeywell Investor Conference – March 7, 2012
• Improves Safety, Increases Readiness and Reduces Operating Costs
• US Army Equipped Aircraft Getting 5-8% Improved Readiness and Fewer In-flight Aborts
• 176 CH-47 AC Already Equipped
• $350M+ Market Opportunity
Huge Install Base Opportunity For Upgrades
Customer Needs Driving RMU Adoption
ATR BGA D&S ~50,000 Aircraft
~24,000 Aircraft
~40,000 Aircraft
Defense Upgrade: Health Monitoring System for CH-47 Chinook Helicopter
Commercial Upgrade: Nitrogen Generation System
• Reduces Risk of Fuel Tank Fire by
Replacing Oxygen with Nitrogen
• OE Production Began in 2010
• Retrofits are Mandated By 2017
• $300M+ Program Value
~$450M Short-Cycle Sales Target In 2012 ~$225M Short-Cycle Sales Target In 2012

Aerospace 15
Honeywell Investor Conference – March 7, 2012
China / India Success
Broadening Our Global Reach
Replicating Success Across High Growth Regions
CHINA • Major C919 Winner • High Aftermarket
Win Rate • Local Capabilities
• Supply Chain • RDE Capability • Sales and Support
Coverage
New Growth Regions
BRAZIL • Helicopter RMUs for Oil & Gas • Commercial MRO Licensee • Airline Growth
TURKEY • Airline Selectables • Helo Upgrades • F-16, UAVs, Trainers
INDONESIA • Engines to Indonesian Aero • Airline Selectables • F-16, Helo Safety Upgrades
UNITED ARAB EMIRATES • Emirates Airlines Satcom • Regional Depot Established • Chinook Fleet Modernization
VIETNAM • Developing MRO Capability • Airline Strategic Partnering
In Past
INDIA • Jaguar Re-Engine • HAL Platform Engines
• Helicopter • Trainer
• Commercial MRO Licensee • Mahindra General Aviation
PHOENIX-CENTRIC • Phoenix-based R&D • Limited International
Manufacturing • U.S. DoD Focused • Limited in China • Limited in India • Domestic
Aftermarket Focus

Aerospace 16
Honeywell Investor Conference – March 7, 2012
Execution: Honeywell Enablers Deliver
HOS Delivering Results And Sustaining Our Future
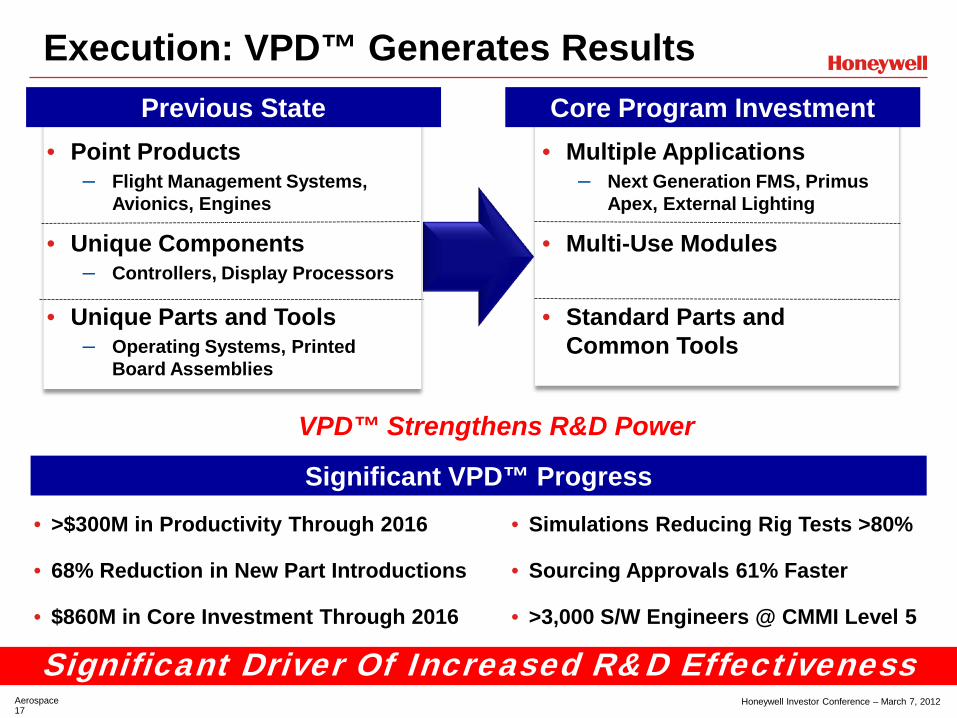
Aerospace 17
Honeywell Investor Conference – March 7, 2012
Execution: VPD™ Generates Results
Significant Driver Of Increased R&D Effectiveness
Significant VPD™ Progress • >$300M in Productivity Through 2016
• 68% Reduction in New Part Introductions
• $860M in Core Investment Through 2016
VPD™ Strengthens R&D Power
~$180M+ $220M
• Point Products – Flight Management Systems,
Avionics, Engines
• Unique Components – Controllers, Display Processors
• Unique Parts and Tools – Operating Systems, Printed
Board Assemblies
• Multi-Use Modules
• Standard Parts and Common Tools
• Multiple Applications – Next Generation FMS, Primus
Apex, External Lighting
• Simulations Reducing Rig Tests >80%
• Sourcing Approvals 61% Faster
• >3,000 S/W Engineers @ CMMI Level 5
Previous State Core Program Investment
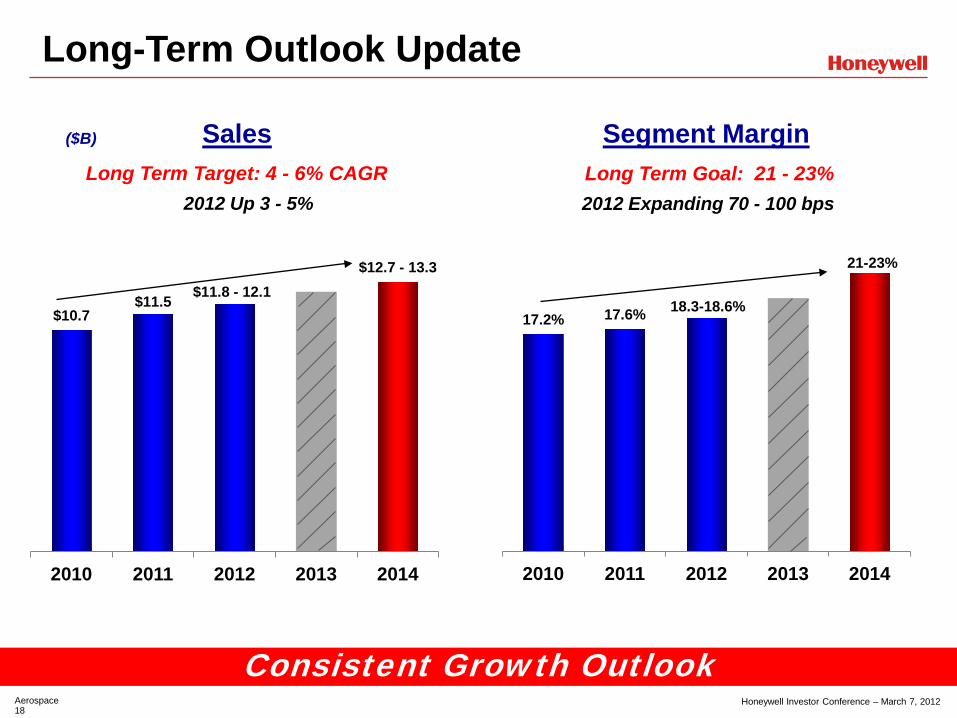
Aerospace 18
Honeywell Investor Conference – March 7, 2012
Long-Term Outlook Update
Consistent Growth Outlook
Long Term Target: 4 - 6% CAGR Long Term Goal: 21 - 23%
($B) Sales Segment Margin
$10.7 $11.5 $11.8 - 12.1
$12.7 - 13.3
2010 2011 2012 2013 2014
2012 Up 3 - 5%
17.2% 17.6% 18.3-18.6%
21-23%
2010 2011 2012 2013 2014
2012 Expanding 70 - 100 bps
Aerospace 19
Honeywell Investor Conference – March 7, 2012
Poised To Outperform
Why We Outperform
• Transformed, Customer-Centric Organization - 2x International Sales and Marketing Presence
- More Efficient Cost Structure, Higher Incremental Margins
• Leading Portfolio And Technologies - Benefiting From Robust Commercial Up-Cycle
- Strong Backlog Growth Outlook Offsetting Defense
• Near- and Long-Term Growth Prospects - Customer Needs Driving Near-Term RMU Sales
- ATR and BGA Outpacing Industry Growth

High Growth Regions 0
Honeywell Investor Conference – March 7, 2012
High Growth Regions Shane Tedjarati
President and CEO
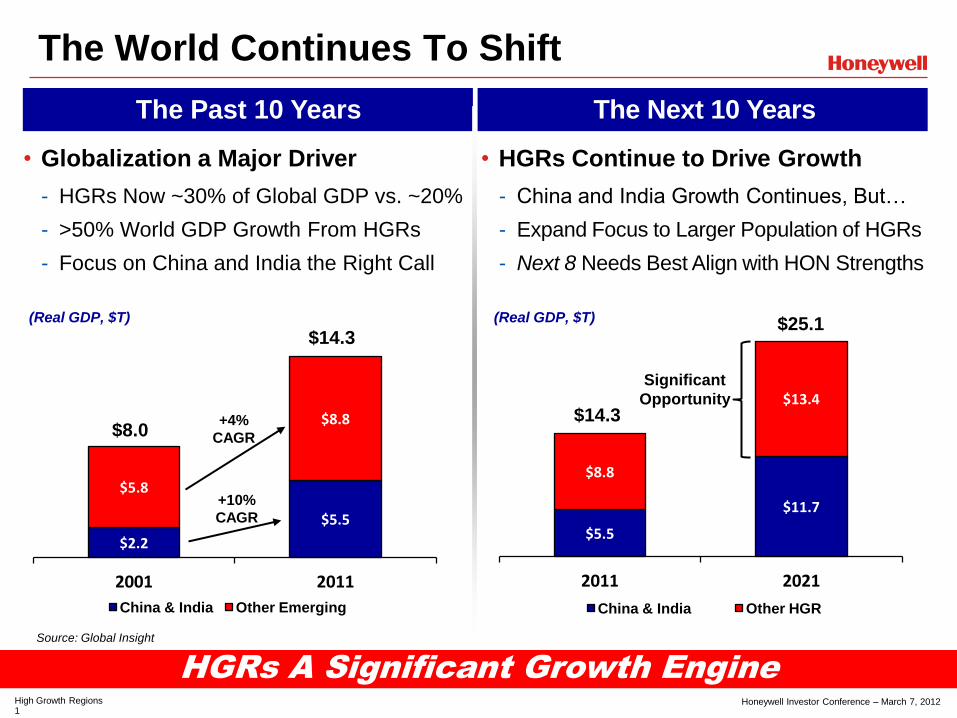
High Growth Regions 1
Honeywell Investor Conference – March 7, 2012
The World Continues To Shift
The Past 10 Years The Next 10 Years
• HGRs Continue to Drive Growth
- China and India Growth Continues, But…
- Expand Focus to Larger Population of HGRs
- Next 8 Needs Best Align with HON Strengths
• Globalization a Major Driver
- HGRs Now ~30% of Global GDP vs. ~20%
- >50% World GDP Growth From HGRs
- Focus on China and India the Right Call
HGRs A Significant Growth Engine
$2.2
$5.5
$5.8
$8.8
2001 2011
China & India Other Emerging
$8.0
$14.3
+10%
CAGR $5.5
$11.7
$8.8
$13.4
2011 2021
China & India Other HGR
$14.3
$25.1 (Real GDP, $T) (Real GDP, $T)
Significant
Opportunity
+4%
CAGR
Source: Global Insight
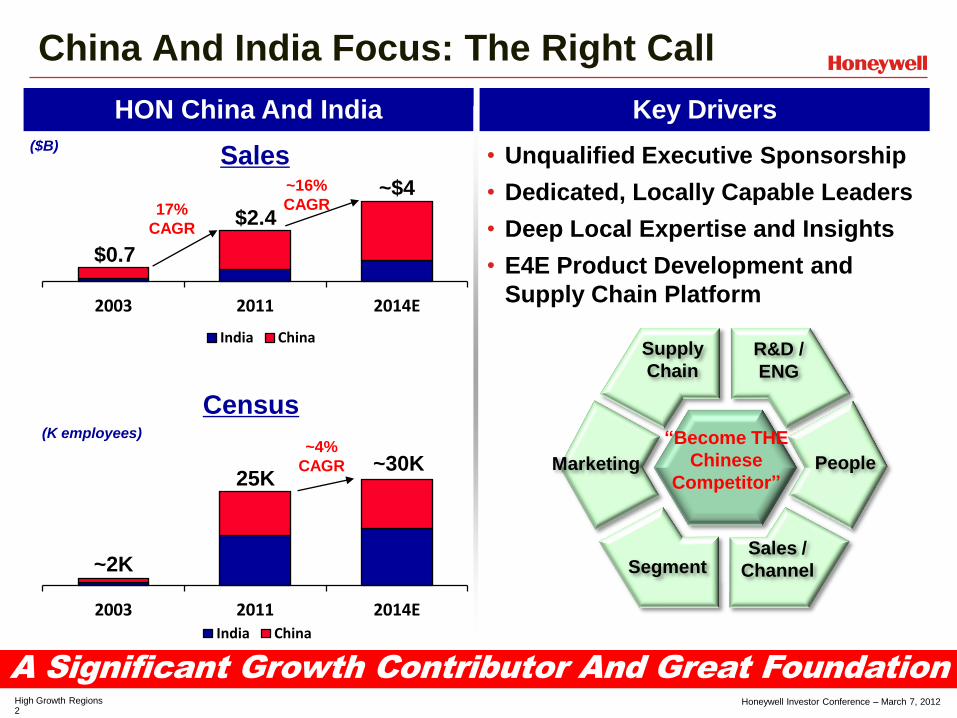
High Growth Regions 2
Honeywell Investor Conference – March 7, 2012
China And India Focus: The Right Call
“Become THE
Chinese
Competitor”
Segment Sales /
Channel
Marketing People
Supply
Chain R&D /
ENG
• Unqualified Executive Sponsorship
• Dedicated, Locally Capable Leaders
• Deep Local Expertise and Insights
• E4E Product Development and
Supply Chain Platform
A Significant Growth Contributor And Great Foundation
HON China And India Key Drivers
($B)
2003 2011 2014E India China
~30K 25K
~2K
2003 2011 2014E
India China
$2.4
~$4
$0.7
Sales ~16%
CAGR
Census (K employees)
17%
CAGR
~4%
CAGR
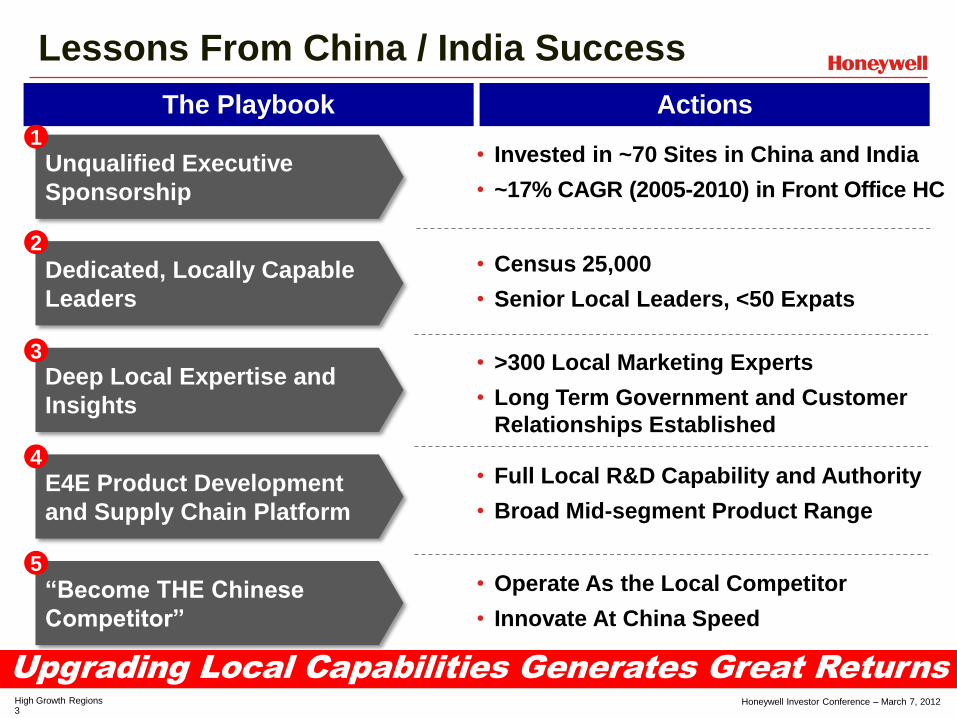
High Growth Regions 3
Honeywell Investor Conference – March 7, 2012
Lessons From China / India Success
Unqualified Executive
Sponsorship
Dedicated, Locally Capable
Leaders
Deep Local Expertise and
Insights
E4E Product Development
and Supply Chain Platform
2
3
4
“Become THE Chinese
Competitor”
5
• Invested in ~70 Sites in China and India
• ~17% CAGR (2005-2010) in Front Office HC
• Census 25,000
• Senior Local Leaders, <50 Expats
• >300 Local Marketing Experts
• Long Term Government and Customer
Relationships Established
• Full Local R&D Capability and Authority
• Broad Mid-segment Product Range
• Operate As the Local Competitor
• Innovate At China Speed
Upgrading Local Capabilities Generates Great Returns
The Playbook Actions 1

High Growth Regions 4
Honeywell Investor Conference – March 7, 2012
Growth Geographies • China and India Provide a Strong Base
• Take HGR “Playbook” to Other Key Regions
• Leverage Existing HGR Platform
Global Energy And
Resources • Resource-led Entry and
Pull Through of Other Businesses
• ONE-HON Focus on Major Energy Trends
Global D&S
• Focus on Fast Growing HGR Defense Markets
• Targeted Entry and Resourcing
Follow The Money
• Follow HGR Companies Investing / Building Abroad
• >80 Chinese and Turkish Contractors in Top 225
Integrated Strategy To Accelerate HGRs
Global Foundation for Functional Support Government Relations, Human Resources, Legal, Communications
E4E / E2W Platform
Manufacturing Supply Chain R&D
HGR Core Strategies
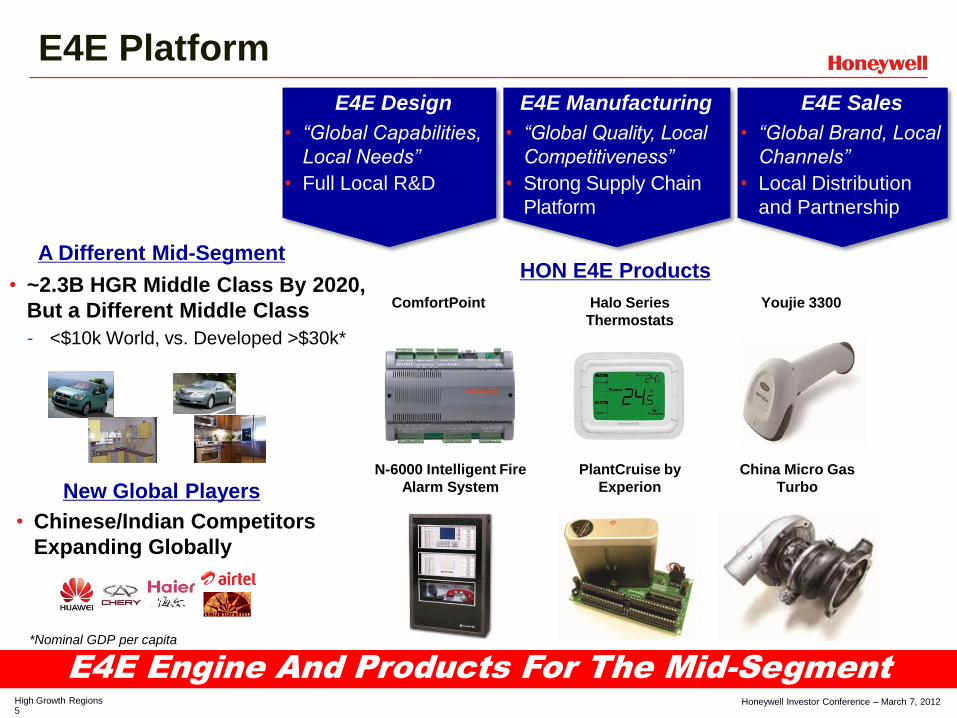
High Growth Regions 5
Honeywell Investor Conference – March 7, 2012
E4E Platform
A Different Mid-Segment
• ~2.3B HGR Middle Class By 2020,
But a Different Middle Class
- <$10k World, vs. Developed >$30k*
*Nominal GDP per capita
New Global Players
• Chinese/Indian Competitors
Expanding Globally
E4E Design E4E Manufacturing E4E Sales
• “Global Capabilities,
Local Needs”
• Full Local R&D
• “Global Quality, Local
Competitiveness”
• Strong Supply Chain
Platform
• “Global Brand, Local
Channels”
• Local Distribution
and Partnership
HON E4E Products
ComfortPoint Halo Series
Thermostats
N-6000 Intelligent Fire
Alarm System
PlantCruise by
Experion
Youjie 3300
China Micro Gas
Turbo
E4E Engine And Products For The Mid-Segment

High Growth Regions 6
Honeywell Investor Conference – March 7, 2012
$0.5
$0.7
$0.5
$1.0
$1.4
$3.2
$1.3
$2.8
Incre
asin
g L
evel
Of
Co
mm
itm
en
t
Poland
Thailand
Brazil
Russia
Turkey
Mexico
Indonesia
South Africa
• Focused
Mgmt
Attention
• In-country
“Adults”
• Strong Local
Marketing
• Use Existing
Supply Chain,
and R&D
Platform
• Expand Into
Mid-segment
• Expand Sales,
Channels
Growth: Next 8 + Singles And Doubles
+
Africa • Many Emerging
Economies
• Resource Play
• Follow the Money
Stans • Resource Play
• Accelerate
Other Latin America
• Pick Emerging Winners
Middle East
• Bolster Existing
Footprint
Apply Proven Formula To Key Geographies
The Next 8 Singles And Doubles
2015 GDP ($T)
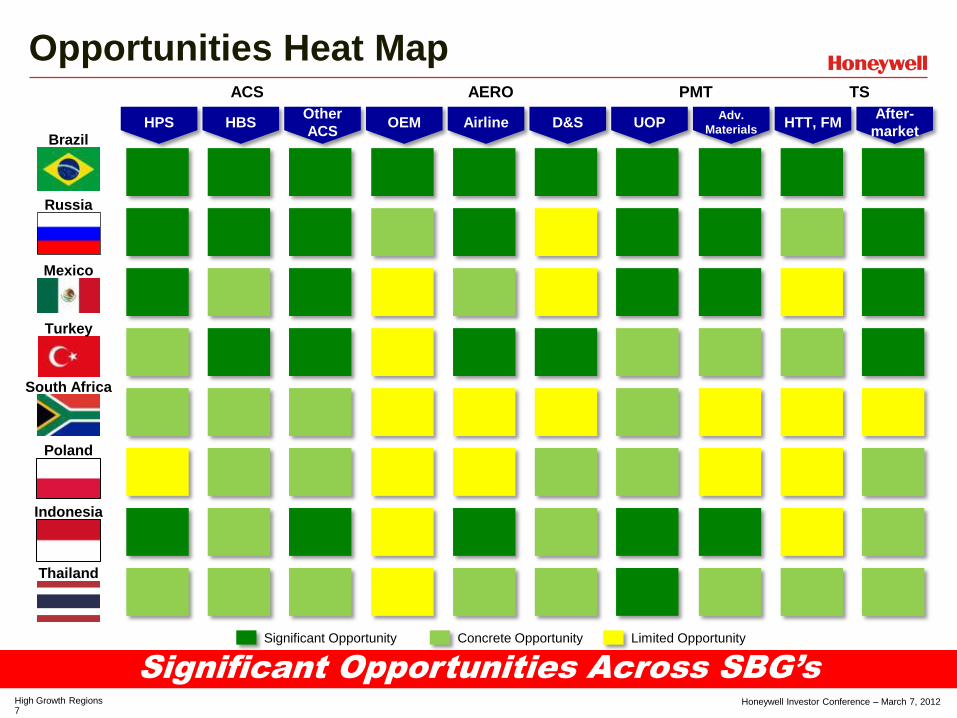
High Growth Regions 7
Honeywell Investor Conference – March 7, 2012
Significant Opportunity Concrete Opportunity Limited Opportunity
ACS AERO PMT TS
Brazil
Russia
Mexico
Turkey
Indonesia
South Africa
Poland
Thailand
HPS Other
ACS UOP OEM
Adv.
Materials HBS Airline HTT, FM
After-
market D&S
Opportunities Heat Map
Significant Opportunities Across SBG’s
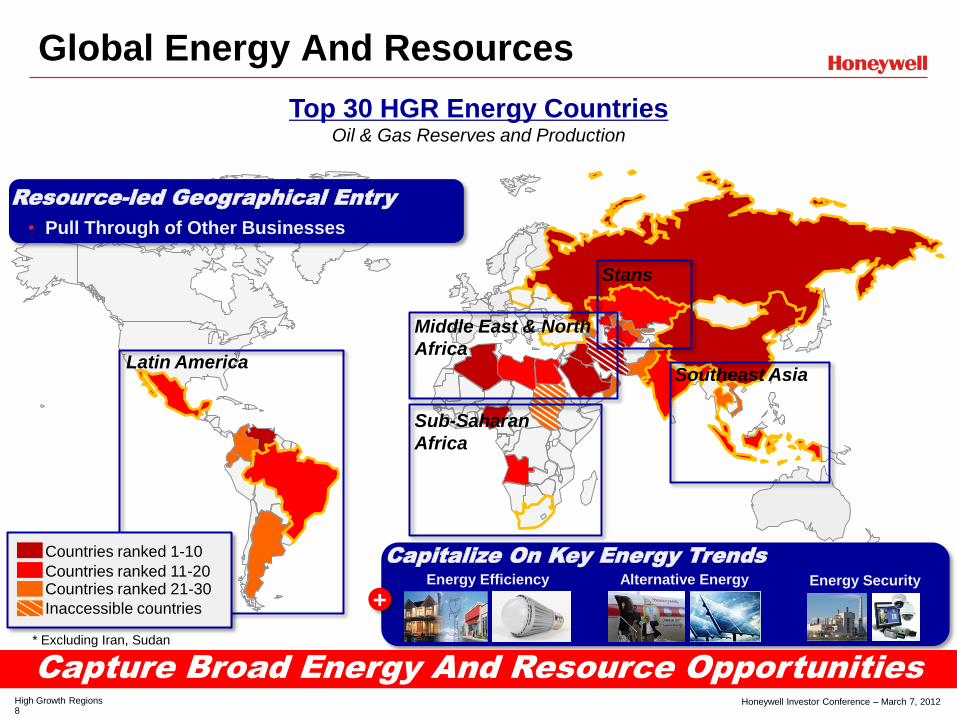
High Growth Regions 8
Honeywell Investor Conference – March 7, 2012
Global Energy And Resources
* Excluding Iran, Sudan
Capitalize On Key Energy Trends
Energy Efficiency Alternative Energy Energy Security
Latin America Southeast Asia
Sub-Saharan
Africa
Middle East & North
Africa
Stans
Resource-led Geographical Entry
• Pull Through of Other Businesses
Capture Broad Energy And Resource Opportunities
Top 30 HGR Energy Countries Oil & Gas Reserves and Production
+
Countries ranked 1-10
Countries ranked 11-20 Countries ranked 21-30
Inaccessible countries

High Growth Regions 9
Honeywell Investor Conference – March 7, 2012
Global D&S Heat Map
Top 30 HGR Countries By Defense Spend Selected 2010 Military Expenditure (USD $B)
Required Elements for Success
Country
Executive Local GR
Local D&S
Executives
D.C.
Coordination
Middle East &
North Africa: $92B
India
$41B
South Korea
$28B
Brazil
$34B
Southeast Asia
$28B
Turkey $18B
Global – Local Effort
+ + + Countries ranked 1-10
Countries ranked 11-20 Countries ranked 21-30

High Growth Regions 10
Honeywell Investor Conference – March 7, 2012
Key Partnerships
One-HON Joint Project Pursuits
Gov’t projects
Commercial Buildings
5* Hotel/ Resorts
• One Honeywell Team
- Country Leader with Extensive O&G Experience
- Training for Staff and Agents / Distributors
• Continue To Build Capabilities
- Government Relations (Ministry of Industry &
Trade, Ministry of Construction)
- Technical Project Support
- Set up Channels for Spec-In Projects
• Reinforce Compliance
- Processes, Code of Conduct
- Training for Staff and Agents / Distributors
Civil Aviation
Administration PetroVietnam Ministry of
Construction
Vietnam Example
• One-HON Project WINs
- Nghi Son Refinery (>$200M next 4 years,
UOP/HPS/ Callidus/HLS/Maxon/HSG)
- Nam Con Son LPG 2 ($13M, UOP/HPS)
• Sales Growing Fast
$28 $45
$103
2010 2011 2012E
Vietnam An Example Of Success For Approach
+63% +127%
Capabilities Approach
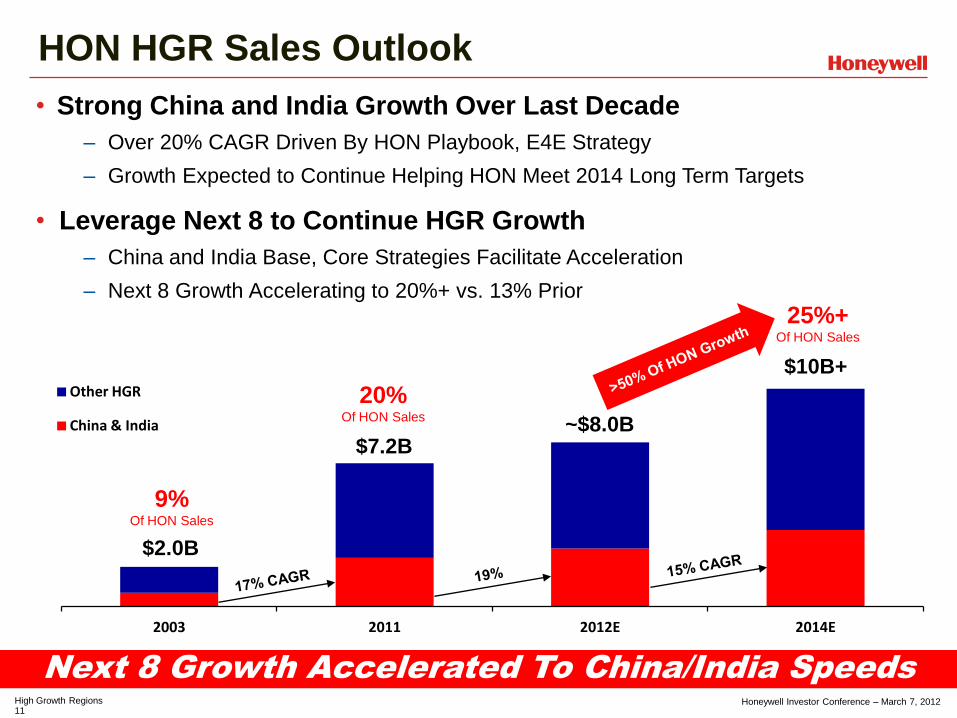
High Growth Regions 11
Honeywell Investor Conference – March 7, 2012
2003 2011 2012E 2014E
Other HGR
China & India
HON HGR Sales Outlook
Next 8 Growth Accelerated To China/India Speeds
$10B+
$7.2B
$2.0B
• Strong China and India Growth Over Last Decade
– Over 20% CAGR Driven By HON Playbook, E4E Strategy
– Growth Expected to Continue Helping HON Meet 2014 Long Term Targets
• Leverage Next 8 to Continue HGR Growth
– China and India Base, Core Strategies Facilitate Acceleration
– Next 8 Growth Accelerating to 20%+ vs. 13% Prior
9% Of HON Sales
20% Of HON Sales
25%+ Of HON Sales
~$8.0B

High Growth Regions 12
Honeywell Investor Conference – March 7, 2012
Summary
• Great Progress in Globalization Over Past 10 Years
– 20% of HON Sales From High Growth Regions, Up 11 Pts
– HGR Organization Census in Place to Support Future Growth
• Initial Focus on China and India the Right Call
– Driver of More Than 25% of Global Growth
– A Strong Foundation and a “Playbook” for Other High Growth Regions
• East for East - Foundation for the New Global Mid-Segment
– Serve Both the <$10K and the >$30K Middle Class
• Integrated HGR Approach Contributing Over 50% of HON Growth
– Growth Geographies
– Global Energy and Resources
– Global Defense and Space
– Follow the Money
HON Well Positioned To Capitalize On HGR Expansion

z
Financial Review
Dave Anderson
Senior Vice President and CFO

Financial Review 1
Honeywell Investor Conference – March 7, 2012
Today’s Discussion
• Honeywell’s Transformation 2003 - 2011
– Portfolio Management, Emerging Region Growth
– Execution Of Key Initiatives, Significant Productivity
• 2011 Performance And 2012 Outlook
– Delivered Top-Tier Performance In 2011
– Prepared For Tougher 2012
• Compelling Investment Opportunity
– Consistency Of Strategy, Execution, Value Creation
– On Track To 2014 Sales, Margin And Cash Targets
Consistent Strategy, Focus On Outperformance
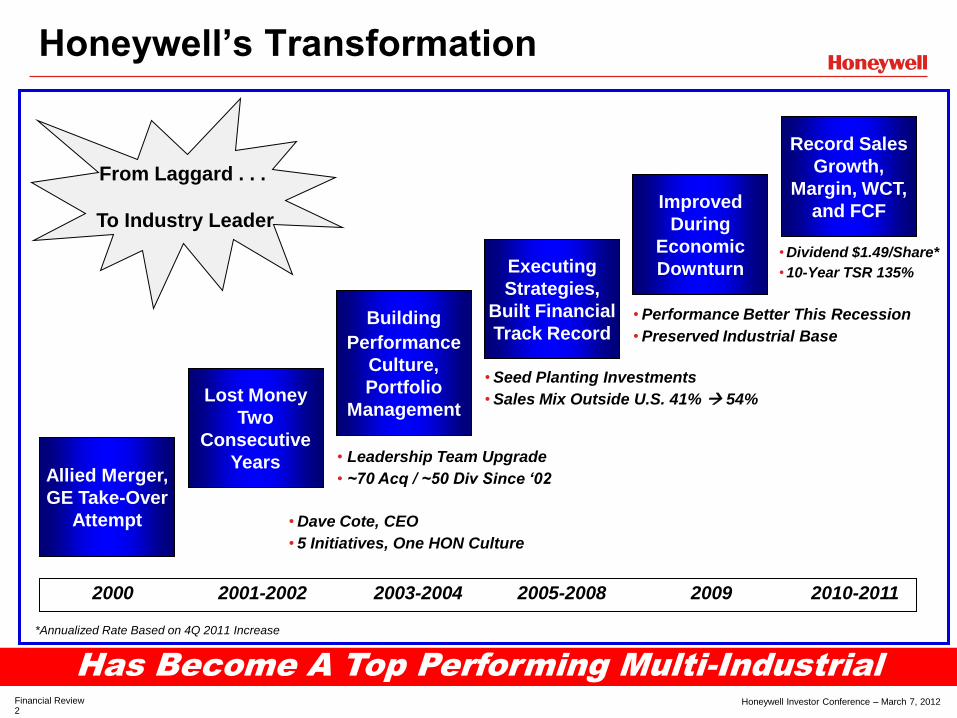
Financial Review 2
Honeywell Investor Conference – March 7, 2012
Has Become A Top Performing Multi-Industrial
Allied Merger,
GE Take-Over
Attempt
Lost Money
Two
Consecutive
Years
Building
Performance
Culture,
Portfolio
Management
Executing
Strategies,
Built Financial
Track Record
Improved
During
Economic
Downturn
2000 2001-2002 2003-2004 2005-2008 2009 2010-2011
Record Sales
Growth,
Margin, WCT,
and FCF
Honeywell’s Transformation
• Leadership Team Upgrade
• ~70 Acq / ~50 Div Since ‘02
•Dave Cote, CEO
• 5 Initiatives, One HON Culture
•Seed Planting Investments
•Sales Mix Outside U.S. 41% 54%
•Performance Better This Recession
•Preserved Industrial Base
•Dividend $1.49/Share*
•10-Year TSR 135%
From Laggard . . .
To Industry Leader
*Annualized Rate Based on 4Q 2011 Increase

Financial Review 3
Honeywell Investor Conference – March 7, 2012
$22.1 10.6%
$1.3
$2.2
$36.5
14.7%
$3.2
$3.7
Sales Segment Margin Net Income (Proforma)* FCF**
2003 – 2011 Track Record
Significant Growth All Key Metrics
2003 2011
+7% CAGR
+50 bps/year
+12% CAGR
+7% CAGR
2003 2011 2003 2011 2003 2011
($B)
*Proforma Excludes Mark-to-Market Pension Adjustments; **FCF Prior to U.S. Cash Pension Contributions
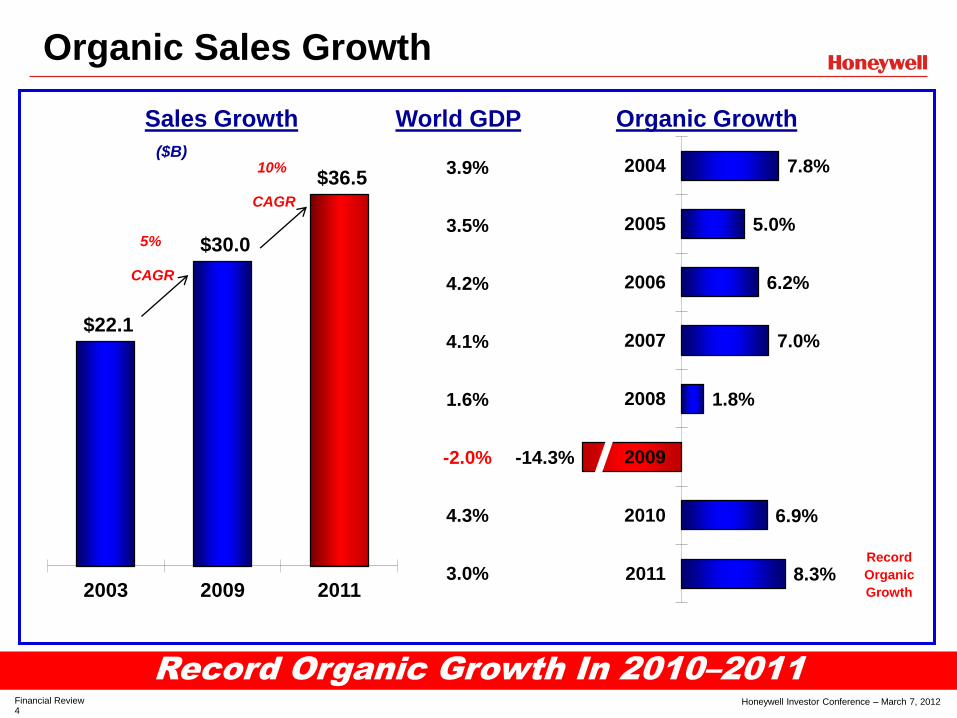
Financial Review 4
Honeywell Investor Conference – March 7, 2012
Organic Sales Growth
$22.1
$30.0
$36.5
2003 2009 2011
Sales Growth
8.3%
6.9%
-14.3%
1.8%
7.0%
6.2%
5.0%
7.8%
2011
2010
2009
2008
2007
2006
2005
2004
Organic Growth
Record Organic Growth In 2010–2011
5%
CAGR
10%
CAGR
Record
Organic
Growth
3.9%
3.5%
4.2%
4.1%
1.6%
-2.0%
4.3%
3.0%
World GDP
($B)

Financial Review 5
Honeywell Investor Conference – March 7, 2012
Sales / Segment Profit Per Employee
Simple (But Powerful) Measures Of Productivity
Sales / Employee ($K) Segment Profit / Employee ($K)
22
32
37
2002* 2009* 2011
5%
CAGR
9%
CAGR
72% Growth, 6% CAGR
199
238 255
2002* 2009* 2011
3%
CAGR
3%
CAGR
28% Growth, 3% CAGR
* Includes CPG

Financial Review 6
Honeywell Investor Conference – March 7, 2012
OEF Productivity
Labor Cost (OEF)
As % Of Sales
Full Time
Headcount (K)
Operating Performance Delivered Through OEF
2008 2011 2012E
Emerging Regions
Developed Regions
128 132
30%
37%
70% 63%
30%
28% ~27%
2008 2011 2012E
62%
38%
~135
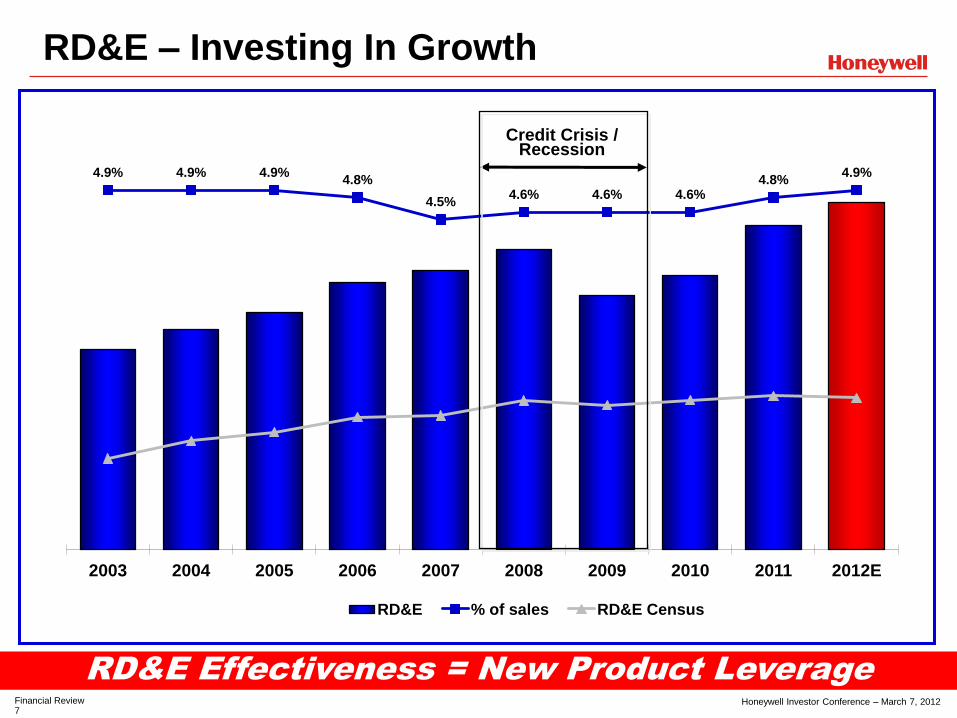
Financial Review 7
Honeywell Investor Conference – March 7, 2012
RD&E – Investing In Growth
RD&E Effectiveness = New Product Leverage
4.9% 4.9% 4.9% 4.8%
4.5% 4.6% 4.6% 4.6%
4.8% 4.9%
0.0%
0.5%
1.0%
1.5%
2.0%
2.5%
3.0%
3.5%
4.0%
4.5%
5.0%
-
200
400
600
800
1,000
1,200
1,400
1,600
1,800
2,000
2003 2004 2005 2006 2007 2008 2009 2010 2011 2012E
RD&E % of sales RD&E Census
Credit Crisis / Recession

Financial Review 8
Honeywell Investor Conference – March 7, 2012
Segment Margin Expansion
10.6%
11.4%
12.2%
13.1%
13.6% 13.5% 13.3%
13.9%
14.7%
2003 2004 2005 2006 2007 2008 2009 2010 2011
Accelerating Margin Expansion
Note: All Years Exclude CPG

Financial Review 9
Honeywell Investor Conference – March 7, 2012
Investing In Growth – Capex
Capital Spend
Funding High Return Growth Projects
114%
137%
-200.0%
-150.0%
-100.0%
-50.0%
0.0%
50.0%
100.0%
150.0%
200.0%
-
200
400
600
800
1,000
1,200
2011 2012E
Capex % of Depreciation
2012 Spend Profile
2012E
48% Growth
17% Productivity
11% HS&E
10% Maintenance
14% Other
Major Growth Projects
• PMT LGWP Refrigerants
• ACS New Product Introductions
• PMT Photovoltaics
• TS HTT Slovakia Plant
• Aero COMAC C-919 Development
• TS FM Romania Plant
• TS FM Chongqing, China Plant
• PMT Hopewell Factory Expansion
• ACS HLS Nantong Glove Factory

Financial Review 10
Honeywell Investor Conference – March 7, 2012
2012 Outlook
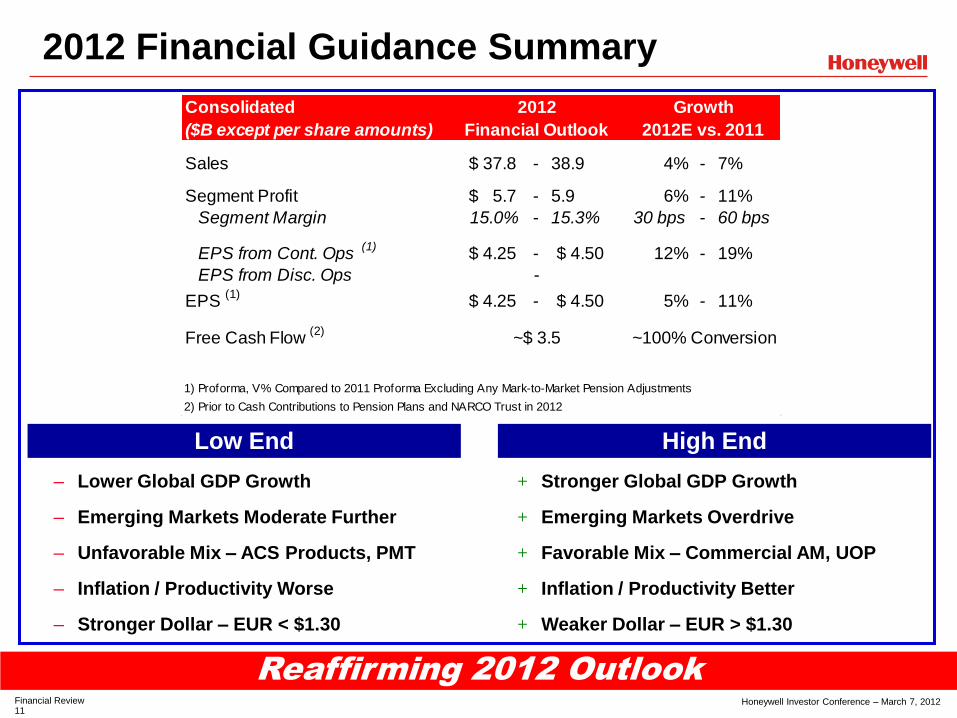
Financial Review 11
Honeywell Investor Conference – March 7, 2012
2012 Financial Guidance Summary
Reaffirming 2012 Outlook
– Lower Global GDP Growth
– Emerging Markets Moderate Further
– Unfavorable Mix – ACS Products, PMT
– Inflation / Productivity Worse
– Stronger Dollar – EUR < $1.30
+ Stronger Global GDP Growth
+ Emerging Markets Overdrive
+ Favorable Mix – Commercial AM, UOP
+ Inflation / Productivity Better
+ Weaker Dollar – EUR > $1.30
High End Low End
Sales 37.8$ - 38.9 4% - 7%
Segment Profit 5.7$ - 5.9 6% - 11%
Segment Margin 15.0% - 15.3% 30 bps - 60 bps
EPS from Cont. Ops (1)
4.25$ - 4.50$ 12% - 19%
EPS from Disc. Ops
EPS (1)
4.25$ - 4.50$ 5% - 11%
Free Cash Flow (2)
1) Proforma, V% Compared to 2011 Proforma Excluding Any Mark-to-Market Pension Adjustments
2) Prior to Cash Contributions to Pension Plans and NARCO Trust in 2012
~$ 3.5 ~100% Conversion
Consolidated
($B except per share amounts)
2012 Growth
Financial Outlook 2012E vs. 2011
-
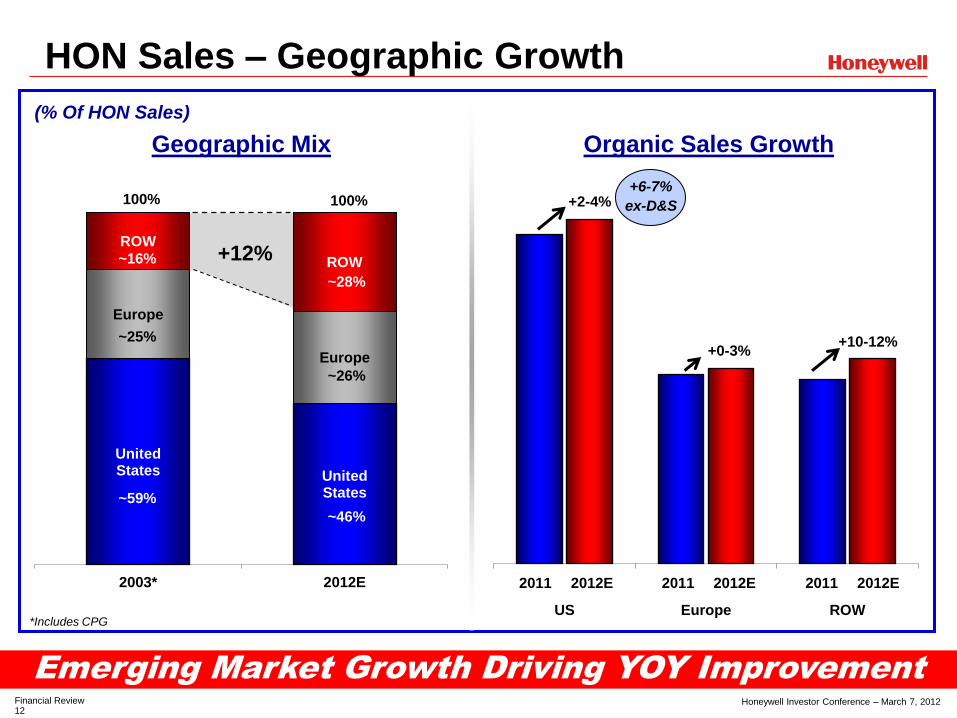
Financial Review 12
Honeywell Investor Conference – March 7, 2012
United States United
States
Europe
Europe
ROW
ROW
2003* 2012E
HON Sales – Geographic Growth
(% Of HON Sales)
US Europe ROW
+10-12%
+2-4%
Emerging Market Growth Driving YOY Improvement
Organic Sales Growth Geographic Mix
+12%
100% 100%
~28%
~26%
~46%
~16%
~25%
~59%
2011 2012E
+0-3%
*Includes CPG
+6-7%
ex-D&S
2011 2012E 2011 2012E
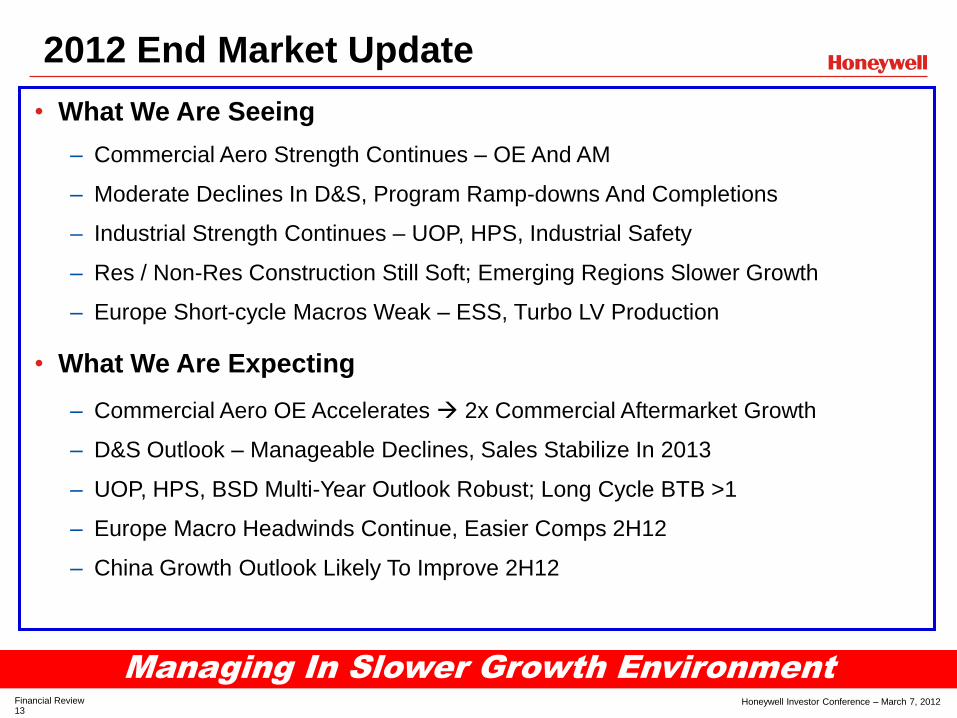
Financial Review 13
Honeywell Investor Conference – March 7, 2012
• What We Are Seeing
– Commercial Aero Strength Continues – OE And AM
– Moderate Declines In D&S, Program Ramp-downs And Completions
– Industrial Strength Continues – UOP, HPS, Industrial Safety
– Res / Non-Res Construction Still Soft; Emerging Regions Slower Growth
– Europe Short-cycle Macros Weak – ESS, Turbo LV Production
• What We Are Expecting
– Commercial Aero OE Accelerates 2x Commercial Aftermarket Growth
– D&S Outlook – Manageable Declines, Sales Stabilize In 2013
– UOP, HPS, BSD Multi-Year Outlook Robust; Long Cycle BTB >1
– Europe Macro Headwinds Continue, Easier Comps 2H12
– China Growth Outlook Likely To Improve 2H12
2012 End Market Update
Managing In Slower Growth Environment

Financial Review 14
Honeywell Investor Conference – March 7, 2012
Reported EPS $0.96 - $0.98, Up 9-11%
Continuing Ops EPS $0.96 - $0.98, Up 12-14%
1Q12 Update
• Commercial Strength Continues
• Defense Flat YoY, Down Sequentially
• Short Cycle Growth Moderates in ESS*
• BSD*, Process Solutions Accelerate
• EU LV Production Down ~(8%)
• New Launches, Diesel Penetration Offset
• UOP Strength, Adv. Materials Moderates
• ~8-9% M&A Impact (Phenol Plant)
Comments
Aerospace
ACS
PMT
Transportation
Sales Change
* ESS: Energy, Safety and Security (ACS Products Less ADI), HPS: Honeywell Process Solutions, BSD: Building Solutions and Distribution (Includes ADI)
7 - 9%
2 - 4%
12 - 15%
~ Flat
• Total ~$9.0 - $9.2B Honeywell 4 - 6%

Financial Review 15
Honeywell Investor Conference – March 7, 2012
Valuation Perspective

Financial Review 16
Honeywell Investor Conference – March 7, 2012
Valuation Metrics – 5 Years Ago
0.9
3.8
1.5
1.0
Range Average HON
0.1%
2.9%
1.5%
2.1%
Range Average HON
Good Performance And Undervalued = Upside
2007 P/E Ratio 2007 FCF Multiple 2006 ROIC
15%
37%
21% 19%
Range Average HON
HON Lowest HON 2nd Lowest HON 3rd Highest
2007 PEG Ratio Dividend Yield TSR*
14
23
19
15
Range Average HON
16
20
17 16
Range Average HON
Honeywell S&P 500
Compounded 107% 74%
2006 24 16
2005 8 5
2004 8 11
2003 43 29
HON 2nd Lowest HON 3rd Highest Good Call Historically
Range, average calculated using eight multi-industry peers; Honeywell 2/23/2007 closing stock price: $47.69
*Total Shareholder Return

Financial Review 17
Honeywell Investor Conference – March 7, 2012
40
60
80
100
120
140
Jan-07 Jun-07 Dec-07 Jun-08 Dec-08 Jun-09 Dec-09 Jun-10 Dec-10 Jun-11 Dec-11
5 Year Share Price Performance
Significantly Outperformed S&P And Peers
HON 120
S&P 89
Peers 99
Indexed (January 1, 2007 to December 31, 2011)
HON S&P Peers
TSR - Cum. Growth 37% (-1%) 10%

Financial Review 18
Honeywell Investor Conference – March 7, 2012
Valuation Metrics – 2 Years Ago
Good Performance And Undervalued = Upside
0.2%
3.0%
2.0%
3.0%
Range Average HON
2010 P/E Ratio 2010 FCF Multiple 2009 ROIC
HON Highest HON Highest
HON 2nd Highest
2009 Margin Change Dividend Yield TSR*
10
16
13
11
Range Average HON
13 14
20
16 17
Range Average HON
Honeywell S&P 500
Compounded 94% 46%
2009 24 26
2008 (45) (37)
2007 39 5
2006 24 16
2005 8 5
2004 8 11
2003 43 29
HON 2nd Lowest Pension Adjusted HON 14x
Good Call Historically
Range, average calculated using eight multi-industry peers; Honeywell 2/18/2010 closing stock price: $39.85
*Total Shareholder Return
HON Average Range
(210) bps
(80) bps
Held Flat
5%
32%
15%
20%
Range Average HON

Financial Review 19
Honeywell Investor Conference – March 7, 2012
50
75
100
125
150
175
200
Jan-10 Apr-10 Jul-10 Oct-10 Dec-10 Apr-11 Jul-11 Sep-11 Dec-11
2 Year Share Price Performance
$12B Increase In HON Market Cap
HON 139
S&P 113
Peers 111
Indexed (January 1, 2010 to December 31, 2011)
*Illustrative Market Cap Growth Based on HON 1/1/2010 Market Cap and Peer Group Avg Share Price Performance
Market Cap Growth Comparison
HON Peer Avg*
12/31/11 $42.7B $34.0B
1/1/10 $30.7B $30.7B
Increase $12.0B $ 3.3B

Financial Review 20
Honeywell Investor Conference – March 7, 2012
Valuation Metrics Today
0.2%
3.5%
2.2% 2.5%
Range Average HON
4%
32%
16% 19%
Range Average HON
Compelling Investment Opportunity
2012 P/E Ratio 2011 ROIC
HON Lowest HON Above Average
HON 3rd Highest
2012 PEG Ratio Dividend Yield
12
16 14
Range Average HON
Honeywell S&P 500
TSR* 213% 87%
2011 5 2
2010 39 15
2009 24 26
2008 (45) (37)
2007 39 5
2006 24 16
2005 8 5
2004 8 11
2003 43 29
HON 3rd Lowest
HON Outperformed
Range, average calculated using eight multi-industry peers; Honeywell 2/29/2012 closing stock price: $59.57
*Total Shareholder Return 12/31/02 Through 2/29/2012
TSR*
0.98
1.40
1.20
0.93
Range Average HON
2012 FCF Multiple
10
17
15
Range Average HON
HON 2nd Lowest
13 12
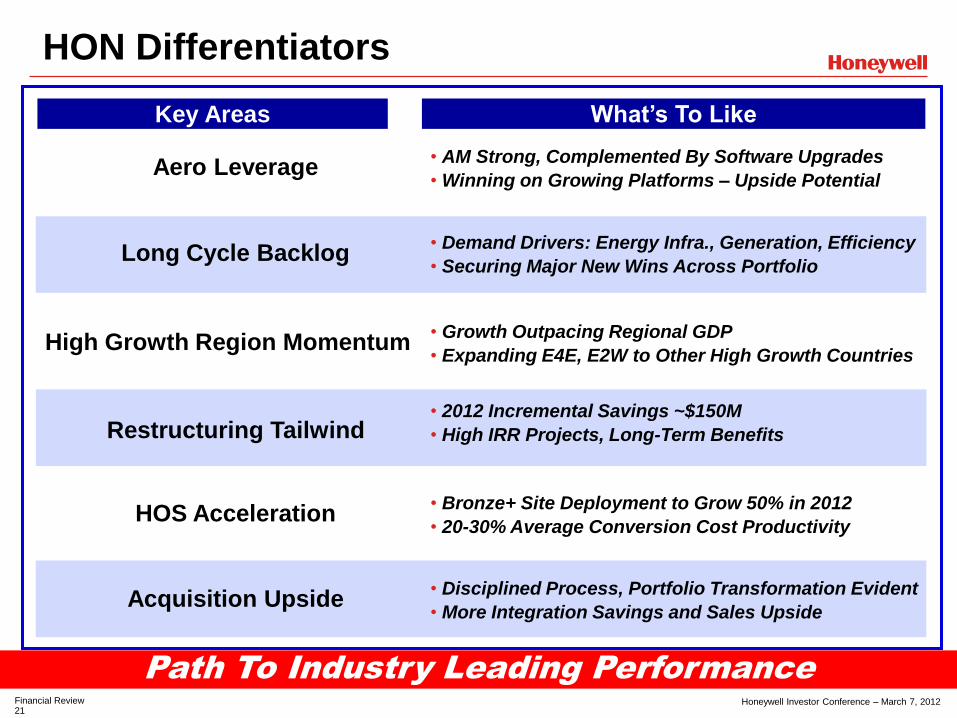
Financial Review 21
Honeywell Investor Conference – March 7, 2012
Path To Industry Leading Performance
HON Differentiators
Aero Leverage • AM Strong, Complemented By Software Upgrades
• Winning on Growing Platforms – Upside Potential
Long Cycle Backlog • Demand Drivers: Energy Infra., Generation, Efficiency
• Securing Major New Wins Across Portfolio
High Growth Region Momentum • Growth Outpacing Regional GDP
• Expanding E4E, E2W to Other High Growth Countries
Restructuring Tailwind • 2012 Incremental Savings ~$150M
• High IRR Projects, Long-Term Benefits
HOS Acceleration • Bronze+ Site Deployment to Grow 50% in 2012
• 20-30% Average Conversion Cost Productivity
Acquisition Upside • Disciplined Process, Portfolio Transformation Evident
• More Integration Savings and Sales Upside
Key Areas What’s To Like
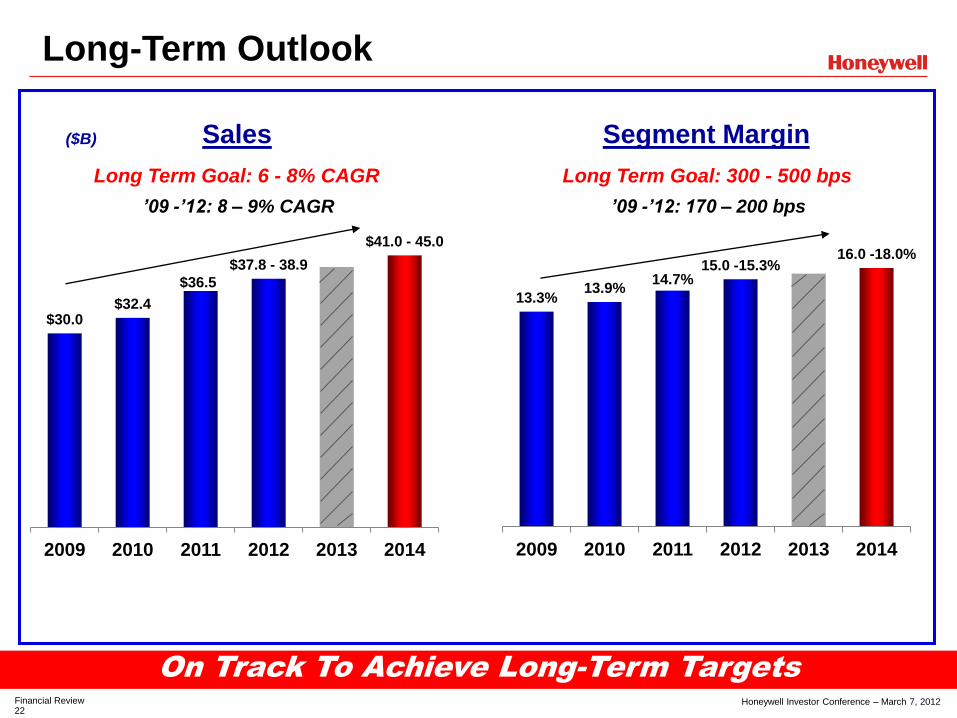
Financial Review 22
Honeywell Investor Conference – March 7, 2012
Long-Term Outlook
On Track To Achieve Long-Term Targets
Long Term Goal: 6 - 8% CAGR Long Term Goal: 300 - 500 bps
($B) Sales Segment Margin
$30.0 $32.4
$36.5
$37.8 - 38.9
$41.0 - 45.0
2009 2010 2011 2012 2013 2014
’09 -’12: 8 – 9% CAGR
13.3% 13.9%
14.7% 15.0 -15.3%
16.0 -18.0%
2009 2010 2011 2012 2013 2014
’09 -’12: 170 – 200 bps

Financial Review 23
Honeywell Investor Conference – March 7, 2012
Honeywell Investment Thesis
• Consistency Of Strategy And Execution
– Robust New Product Pipeline Driving Organic Growth
– Aero OE / AM Momentum, Long-Cycle Demand Drivers
• Accelerated Penetration Of High Growth Markets
– China / India Remain Core To Growth E4E Strategy Working
– HGRs Driving >50% Of Honeywell Growth Through 2014
• Path To 2014 Performance Targets
– Focus On Growth Investments And Operating Discipline
– Acceleration Of HOS, Restructuring Tailwind, M&A Integration Upside
• Strong Cash Generation / Effective Deployment
– Ongoing Working Capital Improvement, Disciplined Investments
– Attractive Returns To Shareholders – Dividends, Share Repurchases
Honeywell – A Premier Multi-Industrial

Honeywell Investor Conference – March 7, 2012 Summary 0
Summary Dave Cote
Chairman and CEO

Honeywell Investor Conference – March 7, 2012 Summary 1
Summary
Honeywell A Top Tier Performer, Now And Future
• Building Off Of An Increasingly Robust Foundation
- Strong Set Of Tools And Enablers Driving Benefits
- Great Leadership In Place, Organized The Right Way
- Accelerated Outperformance From HON During Last Two Years
•Honeywell Will Continue To Evolve
- Great Positions In Good Industries, One Honeywell, 5 Initiatives
- Execution Fundamentals Persist, Improvement Pace Continues
- Stay Hungry, Smart, Disciplined and Flexible
•Unparalleled Commitment To Shareholders Will Persist
- On Track To Meet Long Term Targets
- Strong Cash Generation, Returning Value To Shareholders
- Generating Strong Results Today, Seed Planting For Tomorrow

Honeywell Investor Conference – March 7, 2012 Summary 0
Appendix Reconciliation Of Non-GAAP
Measures To GAAP Measures
Honeywell Investor Conference – March 7, 2012 Appendix 1
Appendix
Reconciliation of non-GAAP Measures
to GAAP Measures
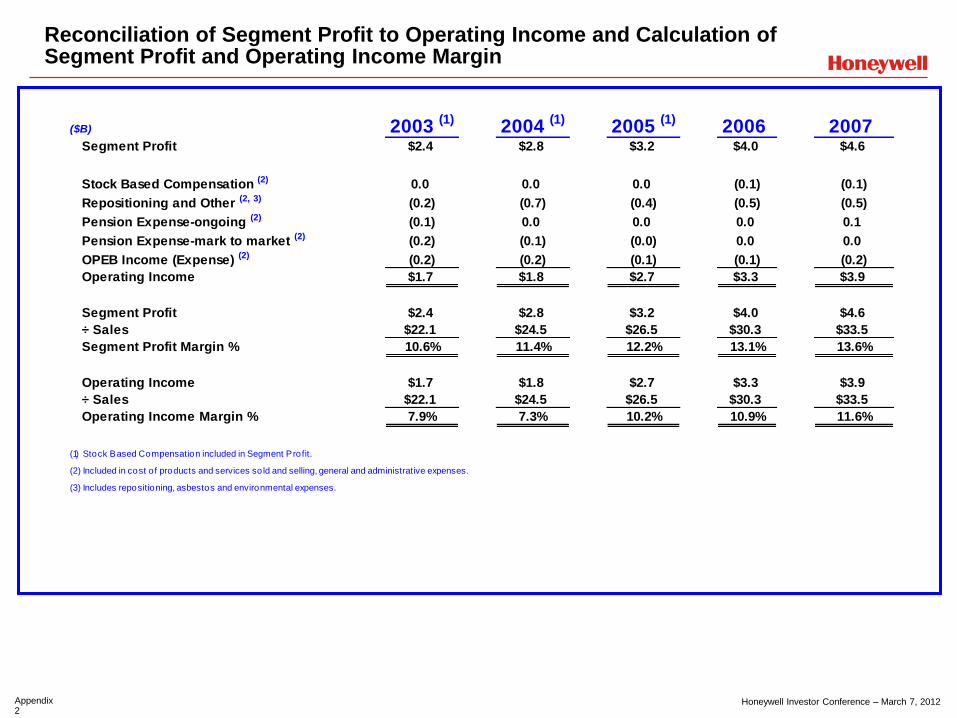
Honeywell Investor Conference – March 7, 2012 Appendix 2
Reconciliation of Segment Profit to Operating Income and Calculation of Segment Profit and Operating Income Margin
($B) 2003 (1)
2004 (1)
2005 (1)
2006 2007Segment Profit $2.4 $2.8 $3.2 $4.0 $4.6
Stock Based Compensation (2) 0.0 0.0 0.0 (0.1) (0.1)
Repositioning and Other (2, 3) (0.2) (0.7) (0.4) (0.5) (0.5)
Pension Expense-ongoing (2) (0.1) 0.0 0.0 0.0 0.1
Pension Expense-mark to market (2) (0.2) (0.1) (0.0) 0.0 0.0
OPEB Income (Expense) (2) (0.2) (0.2) (0.1) (0.1) (0.2)
Operating Income $1.7 $1.8 $2.7 $3.3 $3.9
Segment Profit $2.4 $2.8 $3.2 $4.0 $4.6
÷ Sales $22.1 $24.5 $26.5 $30.3 $33.5
Segment Profit Margin % 10.6% 11.4% 12.2% 13.1% 13.6%
Operating Income $1.7 $1.8 $2.7 $3.3 $3.9
÷ Sales $22.1 $24.5 $26.5 $30.3 $33.5
Operating Income Margin % 7.9% 7.3% 10.2% 10.9% 11.6%
(1) Stock Based Compensation included in Segment Profit.
(2) Included in cost of products and services sold and selling, general and administrative expenses.
(3) Includes repositioning, asbestos and environmental expenses.
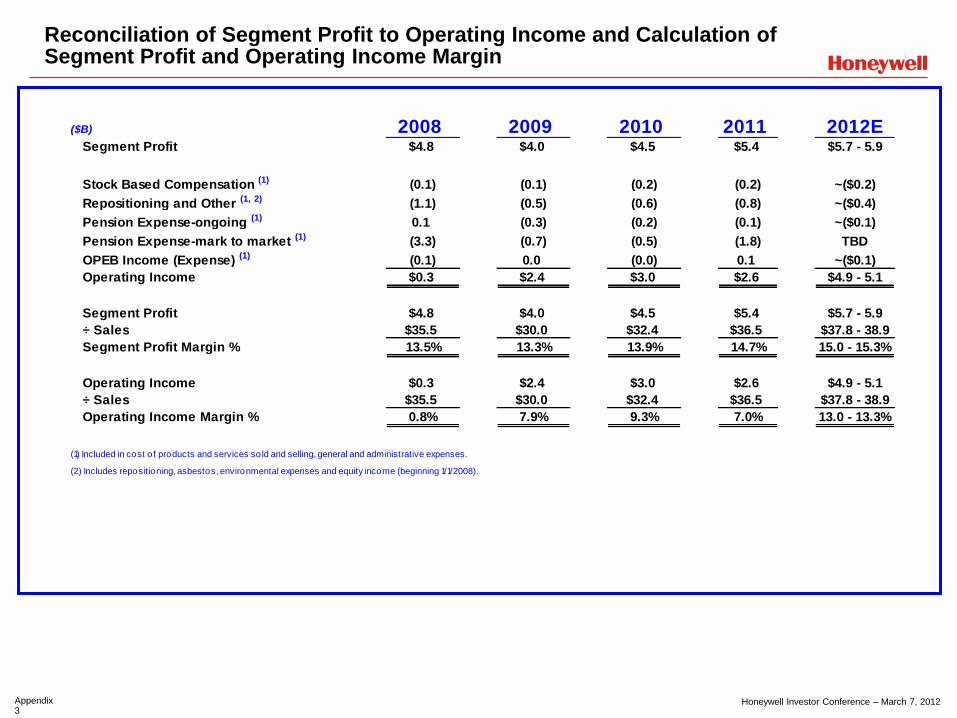
Honeywell Investor Conference – March 7, 2012 Appendix 3
Reconciliation of Segment Profit to Operating Income and Calculation of Segment Profit and Operating Income Margin
($B) 2008 2009 2010 2011 2012ESegment Profit $4.8 $4.0 $4.5 $5.4 $5.7 - 5.9
Stock Based Compensation (1) (0.1) (0.1) (0.2) (0.2) ~($0.2)
Repositioning and Other (1, 2) (1.1) (0.5) (0.6) (0.8) ~($0.4)
Pension Expense-ongoing (1) 0.1 (0.3) (0.2) (0.1) ~($0.1)
Pension Expense-mark to market (1) (3.3) (0.7) (0.5) (1.8) TBD
OPEB Income (Expense) (1) (0.1) 0.0 (0.0) 0.1 ~($0.1)
Operating Income $0.3 $2.4 $3.0 $2.6 $4.9 - 5.1
Segment Profit $4.8 $4.0 $4.5 $5.4 $5.7 - 5.9
÷ Sales $35.5 $30.0 $32.4 $36.5 $37.8 - 38.9
Segment Profit Margin % 13.5% 13.3% 13.9% 14.7% 15.0 - 15.3%
Operating Income $0.3 $2.4 $3.0 $2.6 $4.9 - 5.1
÷ Sales $35.5 $30.0 $32.4 $36.5 $37.8 - 38.9
Operating Income Margin % 0.8% 7.9% 9.3% 7.0% 13.0 - 13.3%
(1) Included in cost of products and services sold and selling, general and administrative expenses.
(2) Includes repositioning, asbestos, environmental expenses and equity income (beginning 1/1/2008).

Honeywell Investor Conference – March 7, 2012 Appendix 4
Reconciliation of EPS to EPS, Excluding Mark-to-Market Pension Adjustment (Proforma)
2002 (1)
EPS, Previously Reported ($0.31)
Effect of Pension Accounting Change (1.95)
EPS ($2.26)
Mark-To-Market Pension Adjustment 1.87
Asbestos Related Litigation Charges, net of tax 1.23
Business Impairment Charges, net of tax 0.69
Repositioning Charges, net of tax 0.48
EPS, Excluding Mark-to Market Pension Adjustment (Proforma) $2.01
(1) Utilizes weighted average shares outstanding and the effective tax rate for the period. M ark-to-market uses a tax rate of 38% for 2002.

Honeywell Investor Conference – March 7, 2012 Appendix 5
Reconciliation of EPS to EPS, Excluding Mark-to-Market Pension Adjustment (Proforma)
2003 (1) 2011 (1)
EPS $1.39 $2.61
Mark-To-Market Pension Adjustment 0.12 1.44
EPS, Excluding Mark-to Market Pension Adjustment (Proforma) $1.51 $4.05
(1) Utilizes weighted average shares outstanding and the effective tax rate for the period. M ark-to-market uses a tax rate of 33.5% and 36.9% for 2003 and 2011, respectively.

Honeywell Investor Conference – March 7, 2012 Appendix 6
Reconciliation of Free Cash Flow, Prior to U.S. Pension Cash Contributions, to Cash Provided By Operating Activities and Calculation of Cash Flow Conversion
($B) 2002 2003 2011Cash Provided by Operating Activities $2.4 $2.2 $2.8
Expenditures for Property, Plant and Equipment (0.7) (0.7) (0.8)
Free Cash Flow $1.7 $1.5 $2.0
US Pension Cash Contributions 0.1 0.7 1.7
Free Cash Flow, prior to U.S. Pension Cash Contributions $1.8 $2.2 $3.7
Net Income Attributable to Honeywell ($1.8) $1.2 $2.1
Mark-to-Market pension adjustment, net of tax (1) 1.5 0.1 1.1
Net Income Attributable to Honeywell
Excluding Mark-to-Market Pension Adjustment (Proforma) ($0.3) $1.3 $3.2
Cash Provided by Operating Activities $2.4 $2.2 $2.8
÷ Net Income Attributable to Honeywell (1.8) 1.2 2.1
Operating Cash Flow Conversion % N/A 183% 137%
Free Cash Flow, prior to U.S. Pension Cash Contributions $1.8 $2.2 $3.7
÷ Net Income Attributable to Honeywell
Excluding Mark-to-Market Pension Adjustment (Proforma) ($0.3) $1.3 $3.2
Free Cash Flow Conversion % (2)N/A 170% 115%
(1) M ark-to-market uses a tax rate of 38%, 33.5% and 36.9% for 2002, 2003 and 2011, respectively.
(2) Reflects Free Cash Flow prior to U.S. pension cash contributions and net income excluding the impact of mark-to-market pension adjustment.
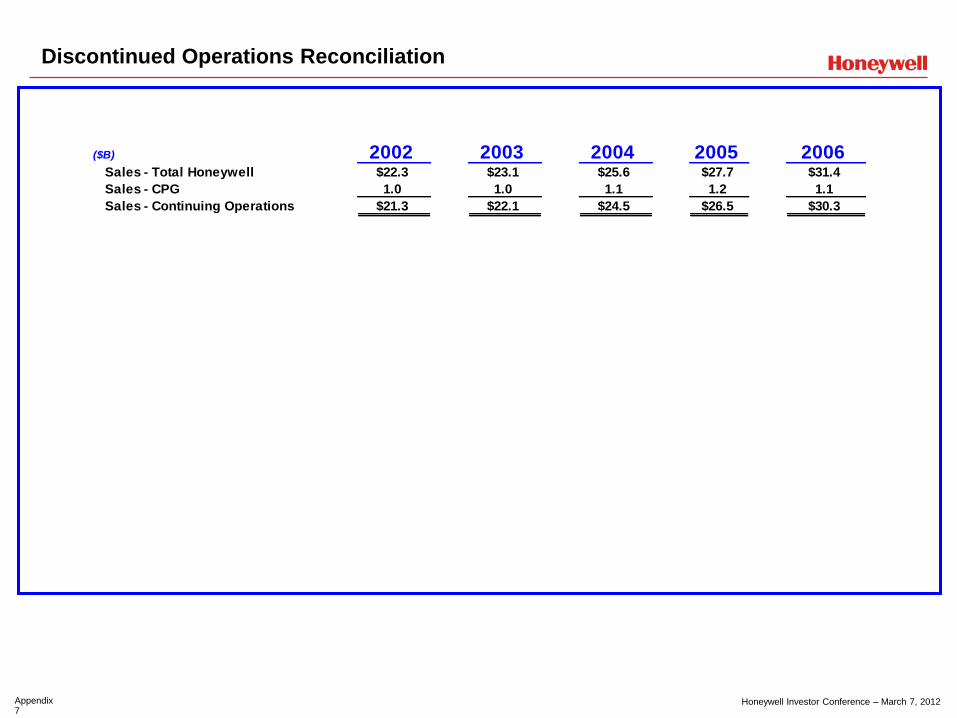
Honeywell Investor Conference – March 7, 2012 Appendix 7
Discontinued Operations Reconciliation
($B) 2002 2003 2004 2005 2006Sales - Total Honeywell $22.3 $23.1 $25.6 $27.7 $31.4
Sales - CPG 1.0 1.0 1.1 1.2 1.1
Sales - Continuing Operations $21.3 $22.1 $24.5 $26.5 $30.3

Honeywell Investor Conference – March 7, 2012 Appendix 8
Valuation Metrics
Calculation Methodology
• Dividend Yield
= Annualized Dividend per Share (Last Announced) 2/29/2012 Closing Stock Price
• FCF Multiple
= 2/29/2012 Market Capitalization at Closing 2011 FCF*
• ROIC
= Net Income Before Interest** Net Investment (2-Point Average)
Net Income Before Interest = Net Income Attributable to Honeywell (or Peer) + After-Tax Interest
Net Investment = Book Value of Equity + Total Debt
• P/E Ratio (2012)
= 2/29/2012 Closing Stock Price 2012 Consensus Estimate EPS
• PEG Ratio
= 2012 P/E Analysis for Consensus Five Year EPS Growth Rate
Eight Industry Peers
• COL, DHR, EMR, GE, ITW, MMM, TYC, UTX
*HON FCF Prior to U.S. Cash Pension Contributions; **HON Reflects Proforma Excluding Mark-to-Market Pension Adjustment