2012 full-year results - marketscreener.comĩa_slide... 2012 full-year results march 2013 dr...
TRANSCRIPT
2012 Full-Year results
March 2013
Dr Jean-Claude Marian M.D. – Chairman
Yves Le Masne – Chief Executive Officer
Jean-Claude Brdenk – Deputy Chief Executive Officer
Steve Grobet – Investor Relations Officer
Content
2
1. Regulatory environment
2. Last development
3. ORPEA network
4. 2012 Full-Year results
5. Strategy and outlook

Overview
Dr Jean-Claude Marian M.D. – Chairman

ORPEA: European leader in global dependency care
431 facilities 40,374 beds
Quality oriented strategy
European expansion
€2.4bn in owned buildings
25,000 employees
Nursing homes
Post-acute and rehabilitation facilities
Psychiatric care facilities
20-year track record Quality of care Quality of accommodation
5 countries 27% of the network abroad
824,000 sqm Recent buildings in prime locations
7,000 created jobs in 5 years 85% on permanent contracts 210,000 hours of training in 2012
4
European leader in global Dependency care

2002 – 2012: 10 years of growth and value creation
Revenue (€m)
0
200
400
600
800
1,000
1,200
1,400
2002 2003 2004 2005 2006 2007 2008 2009 2010 2011 2012
1,429
Number of beds
0
10,000
20,000
30,000
40,000
2002 2003 2004 2005 2006 2007 2008 2009 2010 2011 2012
40,374
X 5.0 X 9.2
Net profit(€m)
0
25
50
75
100
2002 2003 2004 2005 2006 2007 2008 2009 2010 2011 2012
X 9.2
0
250
500
750
1,000
1,250
1,500
1,750
2002 2003 2004 2005 2006 2007 2008 2009 2010 2011 2012
Market Cap. (€m)
X 7.4
97 1,775
France International
5
01.03.13

Execution of the group’s stated strategy
STRTEGIC TARGETS ACHIEVEMENTS
Selective acquisition policy
Financial flexibility and property sale
Improvement in profitability
Attractive dividend policy
Increase of the network of 3,660 beds since start of 2012
Acquisition and integration of Artevida in Spain and Medibelge in Belgium
Property sale: €300m Reduction in debt ratio
EBITDAR margin: +60 bp
Recurring EBIT margin: +40 bp (13.6%)
Proposed dividend per share: €0.60 (+20%)
Payout ratio of net profit: 33%
2012
6

Regulatory environment
Dr Jean-Claude Marian M.D. – Chairman

Daily rate in France
CARE & ACCOMMODATION (in a double bedroom) : 70%
Directly paid for by the National Health Insurance
OTHER SUPPLEMENTS INCL. SINGLE PRIVATE ROOM: 30%
Directly paid for by patient and/or private health insurance
Nursing Homes Post-acute and Psychiatric facilities
DEPENDENCY: 10% Paid for by Local Authority (PAA) and resident
CARE: 20% Directly paid for by the National Health Insurance
ACCOMMODATION: 70% Directly paid for by the resident
Price increase regulated for resident present at 1st of January Price increase free for new resident
Direct reimbursement of
costs: NO MARGIN
8
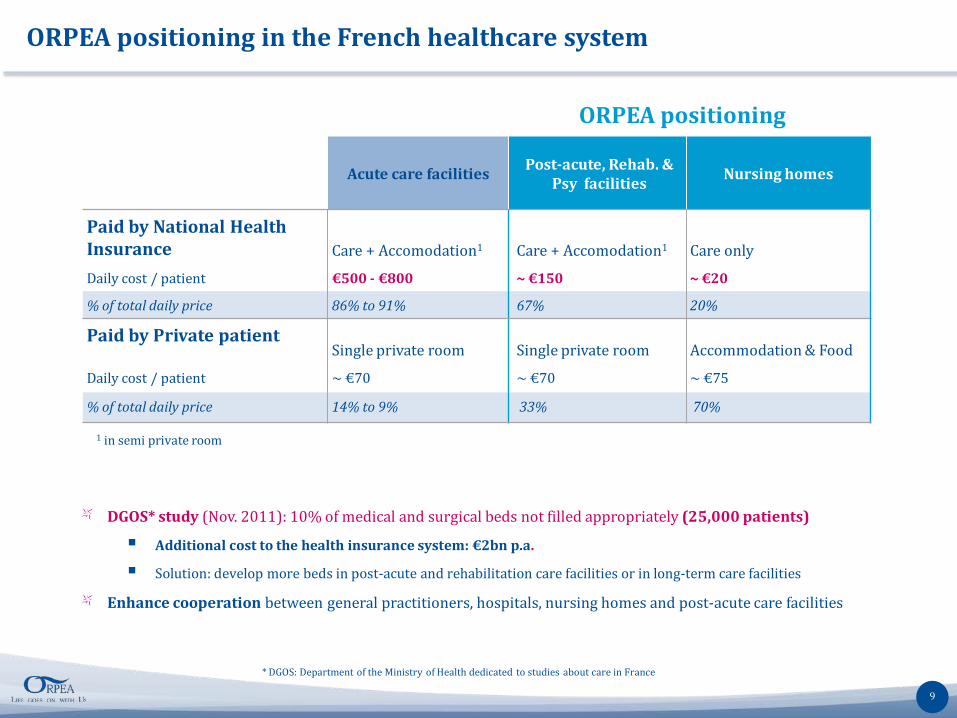
Acute care facilities Post-acute, Rehab. &
Psy facilities Nursing homes
Paid by National Health Insurance Care + Accomodation1 Care + Accomodation1 Care only
Daily cost / patient €500 - €800 ~ €150 ~ €20
% of total daily price 86% to 91% 67% 20%
Paid by Private patient Single private room Single private room Accommodation & Food
Daily cost / patient ~ €70 ~ €70 ~ €75
% of total daily price 14% to 9% 33% 70%
ORPEA positioning
1 in semi private room
ORPEA positioning in the French healthcare system
9
DGOS* study (Nov. 2011): 10% of medical and surgical beds not filled appropriately (25,000 patients)
Additional cost to the health insurance system: €2bn p.a.
Solution: develop more beds in post-acute and rehabilitation care facilities or in long-term care facilities
Enhance cooperation between general practitioners, hospitals, nursing homes and post-acute care facilities
* DGOS: Department of the Ministry of Health dedicated to studies about care in France

Challenges posed by population ageing in France
10
Increase in the population of the very elderly
Higher investment requirements
Increased spending linked to the loss of autonomy
Spending on loss of autonomy: €34bn (including €24bn by public authorities)
Additional spending: €8.5bn to €10.3bn out to 2040
1.3 1.5 2.0
5.4
2007 2011 2015 2060
+33%
Source: INSEE, Population forecasts by 2060
Trend in nbr of people aged over 85 (million)
+170%
+15%
Nbr of beds Cost (excl. land)
Beds to be created (next 5 to 10 years) 20,000 to 30,000 €1.6 to €2.4bn
Beds to be “refurbished” (CNSA)
116,000 €11.7bn
Creation of 350,000 jobs in the care for the elderly sector
Boost to the construction sector: 1 nursing home = €10m in construction sales
Emergence of the gerontological technology sector
Capacity to invest and create jobs
Expertise in providing training for these jobs
Know-how in construction and restructuring
Still limited in size: 20% of nursing home beds in France
OPPORTUNITIES FOR THE ECONOMY
LEGITIMATE OPPORTUNITIES FOR THE PRIVATE SECTOR

French bill on adapting society to the ageing phenomenon
Imperatives of the Reform
State’s and local communities’ limited financial resources (investment and operating budget) Financing based on national solidarity and individual responsibility (F. Hollande) Focus on an integrated approach to the loss of autonomy and ageing
Projects for the nursing home sector
80% of beds are in the public and non-profit sector, and thus controlled by the public authorities Objective: increase the solvency of the middle classes Assumption: concentrate the various different forms of assistance and maximise their impact
3 goals: Prevention Adaptation
Support
Prevention: identify and deal more effectively with vulnerabilities earlier before people lose their autonomy Adaptation: society must adapt to an older population–housing, transport, urban planning, etc. Support to be provided when people lose their autonomy: development of in-home services, introduction of departmental autonomy centres
Real determination to put together integrated solutions for ageing subject to budget constraints
11
Action by ORPEA Prevention: Age Well days, help for
carers, promotion of physical activity,
Facilities proactive in building local gerontological networks

Last development
Jean-Claude Brdenk – Deputy Chief Executive Officer

ORPEA-DOMIDOM: a productive partnership
Win-win partnership Objective: facilitate continuity of care between home, post-acute & rehabilitation facilities and nursing homes
Construction of an innovative integrated range of solutions covering every stage of dependence
Combination of expertise
Sharing of skills and training by teams
Sharing of best practices: introduction of common Quality processes
Successful operational implementation
Introduction of DOMIDOM units in ORPEA’s post-acute & rehabilitation care facilities
DOMIDOM services to be offered in nursing homes
Creation of new DOMIDOM branches in ORPEA facilities (Paris, Lyon, Royan, etc.)
13
Productive partnership and cross fertilisation of capacities and services

An innovative telemedecine project
Origin: call for projects launched by the Paris region health authority
Idea: improve emergency treatment arrangements in nursing homes Medical presence in nursing homes via a virtual medical practice Use specialised medical resources of post-acute & rehabilitation and psychiatric facilities to provide a remote
medical opinion
Objectives: deliver better care and medical treatment Avoid use of emergency services and reduce hospital admissions Reduce movements by residents in nursing homes Help to make spending by French health insurance more efficient
A few examples Electrocardiogram analysed by cardiologists in post-acute & rehabilitation care facilities Psychiatrist consultation
Roll-out Trials at a nursing home and group clinic from May 2013 onwards Open up the telemedicine concept to other non-Group facilities
An innovative solution to improve the well-being of residents and boost the efficiency of public spending
14

Flanders: European region with strong needs
Strongest increase of people aged over 85:
Up 71% between 2010 and 2030 100
148 171
242
325
2010 2020 2030 2040 2050
Flanders
Wallonia
Brussels
Growth of people aged over 85 (Index 100 in 2011)
58% 32%
10%
Wallonia Flanders
Brussels
Breakdown of people aged over 85
Insufficient offer
Low representativity of the commercial sector
53%
36%
11%
Wallonia Flanders
Brussels
Geographical breakdown of beds: 135,000 beds
15%
48%
63%
Flanders Wallonia Brussels
Market share of the Private Commercial Sector
Dynamic region
High purchasing power
16,599 €
14,763 €
12,593 €
Flandres Wallonia Brussels
58% 23%
19%
Wallonia Flanders
Brussels
Geographical breakdown of Belgium GDP Average annual per capita income
Belgium 15,598 €
Source: STATBEL, Population by age at 01.01.2011
Source: INAMI, list of nursing homes at 04.01.2013
Source: STATBEL, 2012 income and Eurostat
15

ORPEA Belgium focuses its development in Flanders
Strategic acquisition of 900 beds
A pipeline of 1,500 beds under construction or
refurbishment
300 beds operational located in Antwerp (3 facilities)
600 beds to be built in Antwerp: opening in 2015 and 2016
Facility in operation
Facility under construction
Project
A growing market share of Flanders in ORPEA
Belgium network
5%
39% 56%
11%
32% 57%
34%
23%
43%
2016 2012 2008
Wallonia Brussels Flanders
16
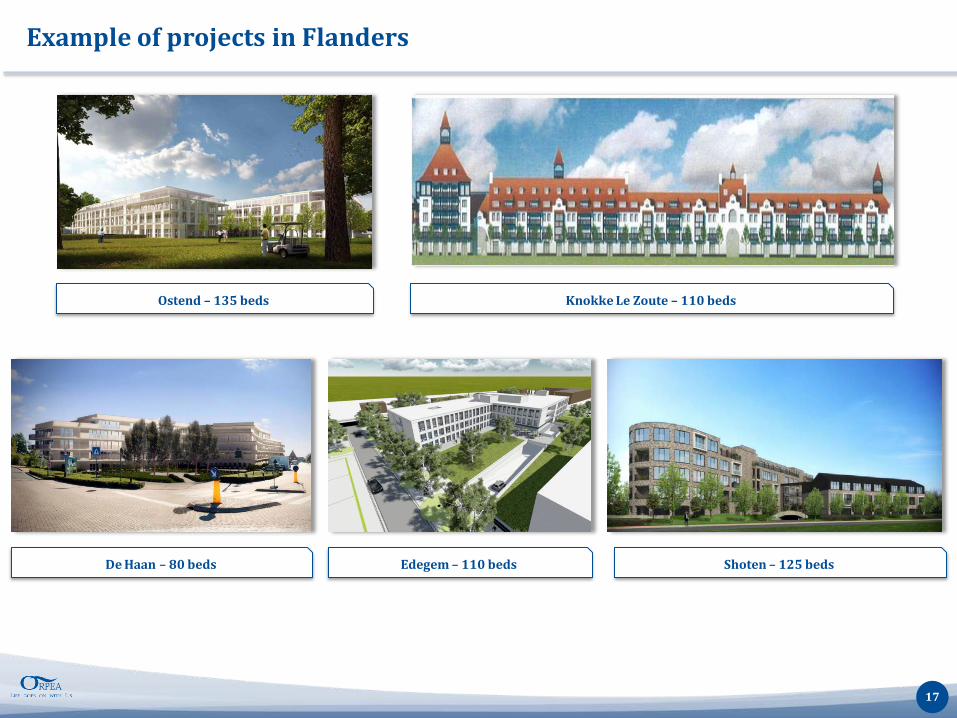
Example of projects in Flanders
Ostend – 135 beds Knokke Le Zoute – 110 beds
De Haan – 80 beds Edegem – 110 beds Shoten – 125 beds
17

ORPEA network
Steve Grobet – Investor Relations Officer

European leader : 40,374 beds at over 431 facilities
19
56 facilities 6,518 beds
Belgium
22 facilities 2,938 beds
Spain 12 facilities 1,276 beds
Italy
339 facilities 29,477 beds
France
2 facilities 165 beds
Switzerland
Geographical breakdown of the network
International France
Europe Nbr of beds
Open beds 31,726
Beds under refurbishment 3,246
Beds under construction 5,402
Total 40,374
73% 27%

A secured pipeline of 8,648 beds
Beds under refurbishment or construction
Open beds
6,208 6,789 7,785 8,264 11,381 13,752 16,008 18,036
23,397 27,197
31,726
1,926 2,517 2,821 3,750 4,622
5,986 7,648
8,490
9,542 9,517
8,648
2002 2003 2004 2005 2006 2007 2008 2009 2010 2011 01.03.2013
40,374
36,714
Network development over 10 years
Ramp-up in mature facilities
20
68%
32%
2009 2012
% Beds under refurbishment or construction / Total nbr. of beds
% Mature beds/ Total nbr. of beds 21%
79%
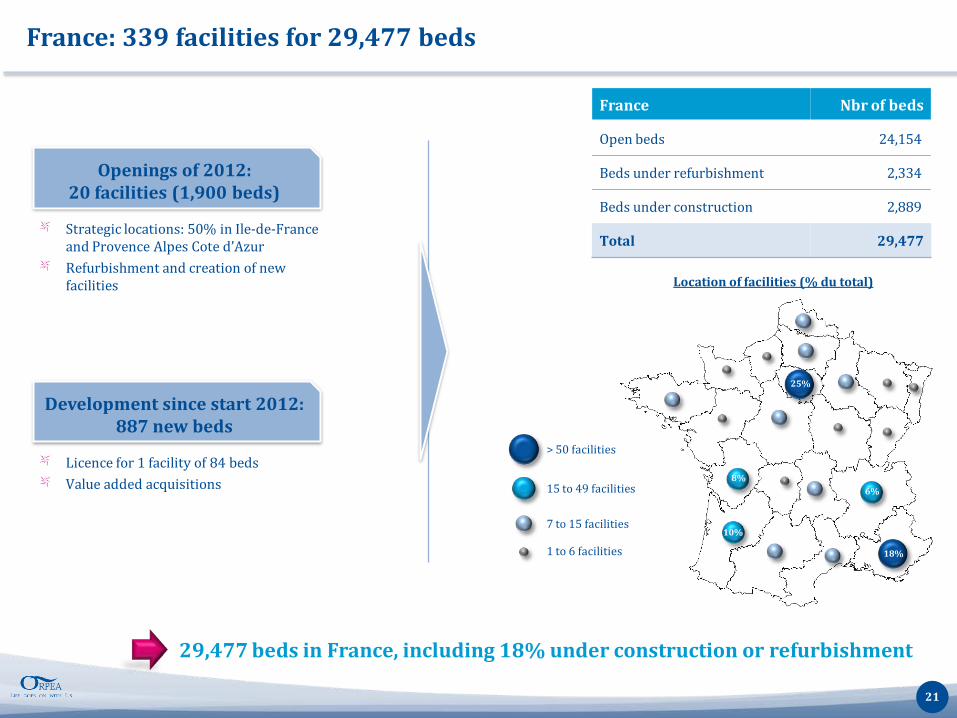
France: 339 facilities for 29,477 beds
Strategic locations: 50% in Ile-de-France and Provence Alpes Cote d’Azur Refurbishment and creation of new facilities
Licence for 1 facility of 84 beds Value added acquisitions
25%
18%
10%
8% 6%
Location of facilities (% du total)
> 50 facilities
15 to 49 facilities
7 to 15 facilities
1 to 6 facilities
21
Openings of 2012: 20 facilities (1,900 beds)
Development since start 2012: 887 new beds
France Nbr of beds
Open beds 24,154
Beds under refurbishment 2,334
Beds under construction 2,889
Total 29,477
29,477 beds in France, including 18% under construction or refurbishment

International: 92 facilities for 10,897 beds
22
Activity during 2012 Beds in
operation Beds under
development Total Prospects
SPAIN Acquisition and integration of Artevida (1,156 beds and places)
2,938 beds n/a 2,938 beds 22 facilities
Acquisition opportunities on attractive terms in major cities
BELGIUM Acquisition of 100% of Medibelge Opening of 1 120-bed facility (Brussels) Selective acquisitions
3,598 beds 2,920 beds 6,518 beds 56 facilities
New licences Selective acquisitions
ITALY Opening of 180-bed facility (Trofarello) Acquisition of 200 beds
871 beds 405 beds 1,276 beds 12 facilities
New licences Selective acquisitions
SWITZERLAND End of work on the post-acute & rehabilitation care facility
165 beds n/a 165 beds 2 facilities
Ramp-up in the rehabilitation care facility
10,897 beds outside France, including 25% under construction or refurbishment

2012 Full-Year results
Yves Le Masne – Chief Executive Officer

2012: increase in profitability
1 Revenues: €1,425m
2 Strong organic growth
3 Higher profitability
4 Property sales on attractive terms
€1,429m +15.8%
+8.2%
Recurring EBIT margin: 13.6% + 40 bp
€300m (Selling price)
2012 INITIAL TARGET 2012 ACHIEVEMENTS
Currently being audited
24

Strong growth of sales in 2011
France 1,227.3 1,094.5 +12.1%
86% 89%
International 201.8 139.6 +44.5%
14% 11%Belgium 105.6 67.5
Spain 48.7 30.5
Italy 32.2 26.8
Switzerland 15.4 14.8
Total 1,429.1 1,234.1 +15.8%
2011 %In €m 2012
Steep rise in 2012 revenue: +15.8%
25
128 156 192 237 309 415
545 702
843 964
1,234
1,429
2001 2002 2003 2004 2005 2006 2007 2008 2009 2010 2011 2012
X 11.2
Historical revenue growth:
Strong organic growth in 2012
+8.2% (Approx. €100m)
Strong increase abroad: +44.5%
(Medibelge, Artevida)
CAGR on 2001 – 2012:
+24.5%
Currently being audited

In €m 2012 2011 %
Revenues 1,429.1 1,234.1 +15.8%
EBITDAR (Recurring EBITDA before rents) 368.5 311.4 +18.4%
Recurring EBITDA 256.3 218.2 +17.5%
Recurring EBIT (Rec. Operating Profit) 193.7 163.2 +18.7%
EBIT (Operating profit) 222.2 190.0 +16.9%
Net financial income/(expense) -72.8 -65.0 (+12.0%)
Profit before tax 149.4 125.0 +19.5%
Net profit (Group share) 97.0 80.3 +20.8%
Strong increase in all profitability indicators
Net profit up 21% to €97m
26
Currently being audited

Impact of new tax laws in France
27
100
150
200
250
300
350
2007 2008 2009 2010 2011 2012
Tax on value added (CVAE and CFE): + €4.4m (€23m in 2012 compared with €6.7m in 2007)
New tax on dividend: + €0.8m Amended Finance Law of 16 August 2012
Non deductibility of financial cost: + €2.5m Finance Law of December 2012
Increase in the Corporate tax rate (34.43% to 36.10%) : + €1.9m
Reform of the Business Tax transformed in Tax on Value added
= CVAE + CFE
Business Tax
CVAE (=Tax on value added)
CFE
Revenue in France
Currently being audited

In €m 2012 2011 %
Revenues 1,429.1 1234.1 +15.8%
Staff costs -715.8 -625.0 +14.5%
Expenses -277.2 -240.8 +15.1%
-67.5 -58.4 +15.5%
Other income and expenses -0.1 1.4 N.S.
EBITDAR (Recurring EBITDA before rents) 368.5 311.4 +18.4%
% of revenues 25.8% 25.2%
-112.2 -93.1 +20.5%
Recurring EBITDA 256.3 218.2 +17.5%
% of revenues 17.9% 17.7%
Depreciation & Amortisation -62.7 -55.1 +13.8%
193.7 163.2 +18.7%
% of revenues 13.6% 13.2%
Non-recurring items 28.5 26.8 N.S.
EBIT (Operating profit) 222.2 190.0 +16.9%
Rents
Recurring EBIT (Rec. Oper. Profit)
Taxes and duties
Rise in operating profitability
28
Currently being audited
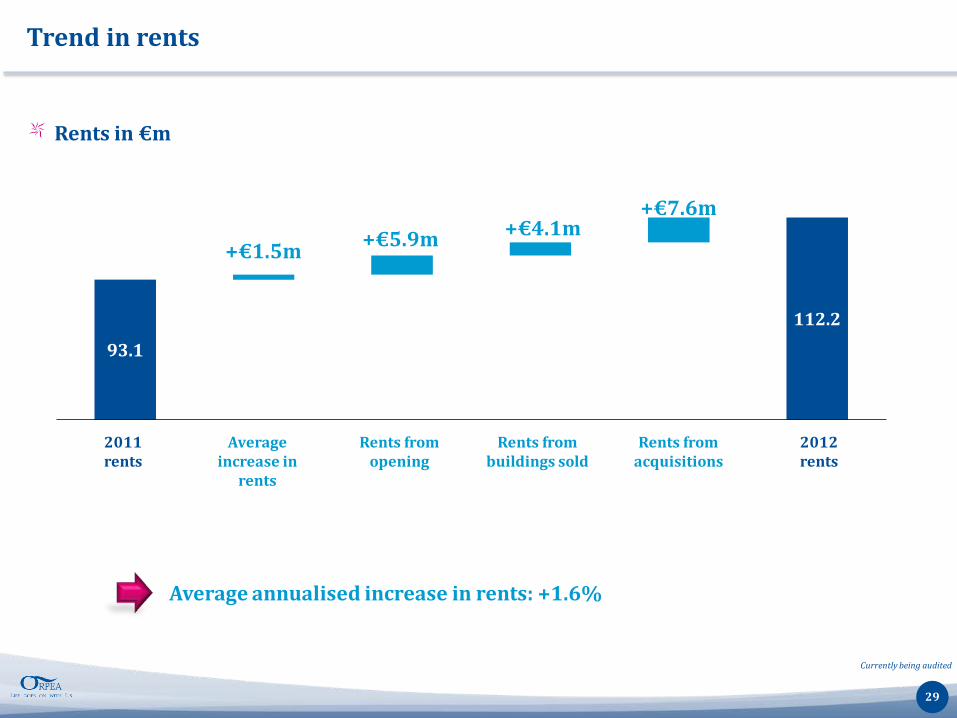
93.1
112.2
+€1.5m +€5.9m +€4.1m +€7.6m
Trend in rents
Rents in €m
Average annualised increase in rents: +1.6%
29
2011 rents
Average increase in
rents
Rents from buildings sold
Rents from acquisitions
2012 rents
Rents from opening
Currently being audited

Rev.Recurring
EBITDA% of Rev.
Rev.Recurring
EBITDA% of Rev
France 1227.3 230.6 18.8% 1094.5 200.5 18.3%
Belgium 105.6 13.1 12.4% 67.5 10.2 15.1%
Spain 48.7 6.1 12.6% 30.5 1.8 6.0%
Italy 32.2 2.3 7.2% 26.8 1.9 7.2%
Switzerland 15.4 4.2 27.2% 14.8 3.8 25.7%
International 201.8 25.8 12.8% 139.6 17.8 12.7%
Grand TOTAL 1429.1 256.3 17.9% 1234.1 218.2 17.7%
In €m2012 2011
Geographical breakdown of profitability
30
Recurring EBIDTA: Recurring operating profit before depreciation and amortisation
Currently being audited

In €m 31-Dec-12 31-Dec-11
Non-current assets 4,151 3,757 Goodwill 380 323 Intangible assets 1,278 1,129 Property, plant & equipment and property under development 2,404 2,217 Other non-current assets 89 88Current assets 619 604 Of which cash, cash equivalents and marketablle securities 362 309
Assets held for sale 121 121
TOTAL ASSETS 4,891 4,482
Sh. equity, Group share and permanent deferred taxes 1,577 1,477 Shareholders' equity Group share 1,209 1,152 Deferred taxes on intangible assets (quasi equity) 369 325Non-controlling interests 1 3
Non-current liabilities 2,038 1,817 Other deferred tax liabilities 321 314 Provision for liabilities and charges 57 42 Long-term financial debt 1,660 1,462Current liabilities 1,153 1,064 Of which short-term debt (bridge loans) 504 466
Debt linked to assets held for sale 121 121
TOTAL LIABILITIES 4,891 4,482
ASS
ETS
LIA
BIL
ITIE
S
Solid financial structure
31
Currently being audited

Optimisation of the Group’s finances
2011 2012
1 Diversification % of non-bank debt = 11% 29%
2 Extension of debt maturity Average maturity = 4.1 years 5.0 years
3 Greater flexibility Restated financial leverage = 2.2 1.7
32
Objectives: diversify sources of financing and extend the maturity of debt on attractive terms Schuldschein (€35m) with a 5-year maturity (due 2017) Examples of Euro private placements in several tranches:
– Maturities: 5-year (€85m), 6-year (€20m) and 6.5-year (€128m) – Coupons: 4.10% over 5 years, 4.20% over 6 years and 4.60% over 6.5 years
2012: arrangement of private placements
Currently being audited
0
1
2
3
4
5
6
0 0.5 1 1.5 2
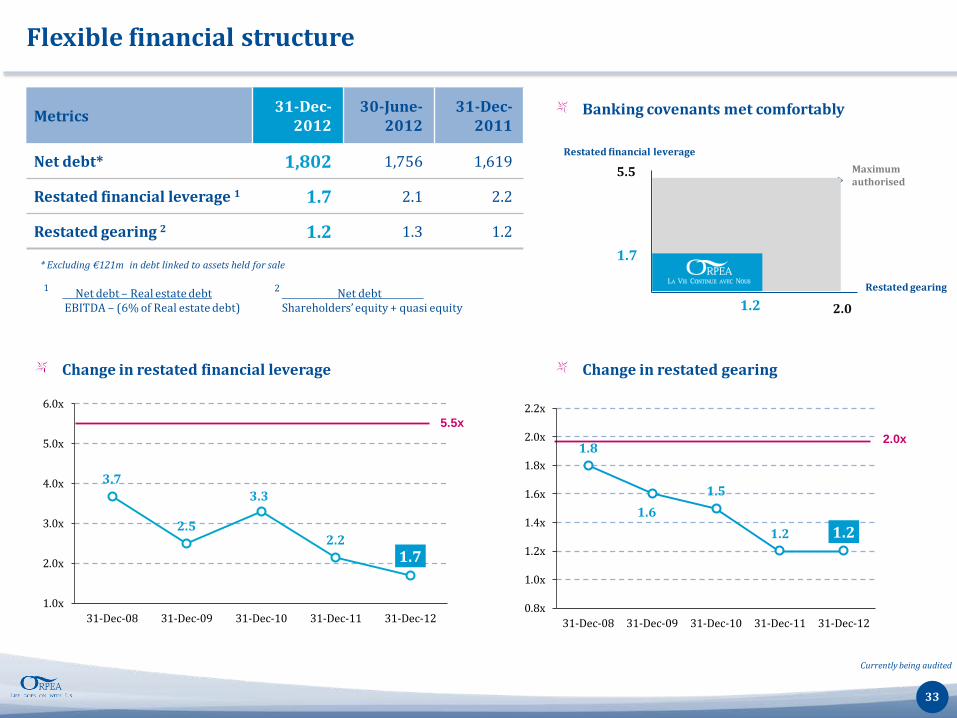
Flexible financial structure
Banking covenants met comfortably Metrics 31-Dec-
2012 30-June-
2012 31-Dec-
2011
Net debt* 1,802 1,756 1,619
Restated financial leverage 1 1.7 2.1 2.2
Restated gearing 2 1.2 1.3 1.2
5.5
1.7
2.0 1.2
3.7
2.5
3.3
2.2 1.7
1.0x
2.0x
3.0x
4.0x
5.0x
6.0x
31-Dec-08 31-Dec-09 31-Dec-10 31-Dec-11 31-Dec-12
1.8
1.6
1.5
1.2 1.2
0.8x
1.0x
1.2x
1.4x
1.6x
1.8x
2.0x
2.2x
31-Dec-08 31-Dec-09 31-Dec-10 31-Dec-11 31-Dec-12
Change in restated gearing Change in restated financial leverage
5.5x 2.0x
33
Net debt – Real estate debt EBITDA – (6% of Real estate debt)
1 Net debt . Shareholders’ equity + quasi equity
2
Maximum authorised
Restated financial leverage
* Excluding €121m in debt linked to assets held for sale
Restated gearing
Currently being audited
0
100
200
300
400
500
600
2013 2014 2015 2016 2017 2018 2019 2020 2021 2022 2023 > 2023
Loans, Financial property leases and Private Bonds
Convertible Bonds
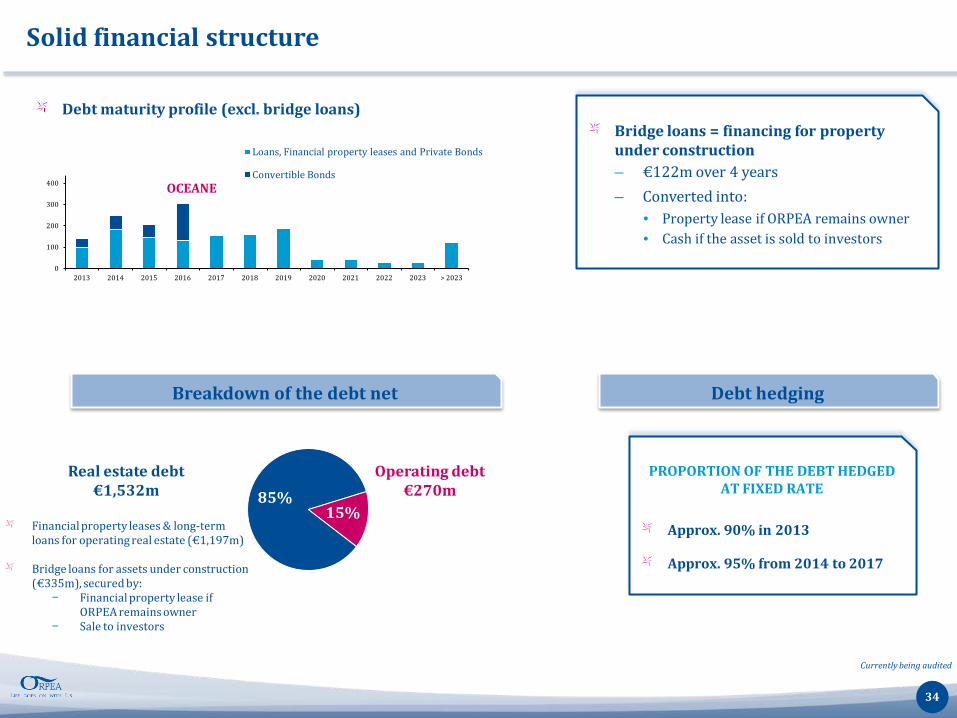
Solid financial structure
OCEANE
PROPORTION OF THE DEBT HEDGED AT FIXED RATE
Approx. 90% in 2013
Approx. 95% from 2014 to 2017
Bridge loans = financing for property under construction – €122m over 4 years – Converted into:
• Property lease if ORPEA remains owner • Cash if the asset is sold to investors
85% 15%
34
Debt maturity profile (excl. bridge loans)
Operating debt €270m
Real estate debt €1,532m
Financial property leases & long-term loans for operating real estate (€1,197m) Bridge loans for assets under construction (€335m), secured by:
− Financial property lease if ORPEA remains owner
− Sale to investors
Currently being audited
Breakdown of the debt net Debt hedging

Operations: securing future growth
35
Financed by medium-term 5- to 7-year loans
No significant installments ahead: amortising loans
Hedged by derivatives: fixed-rate swaps
Network of 40,374 beds – 31,726 open beds in operation – 3,246 open beds under refurbishment – 5,402 beds under construction
Value of intangible assets (licences):
€1,278m
Net operating debt:
€270m
ASSETS LIABILITIES
Network of high-potential beds, partially valued as assets The licences awarded are not valued on the balance sheet
Currently being audited

Increase in real estate portfolio value* to €2.4b
31-Dec-11 31-Dec-11 Change
Number of buildings 248 230 +18 build.
Of which fully owned 142 141 n.s.
Built surface area (in sqm) 824,000 756,000 9%
Total value (€m) 2,404 2,217 8%
Of which assets in operation 2,069 1,835 13%
Of which assets under construction 335 382 -12%
Trend in the value of the real estate portfolio* (€m)
* Excluding €121m in assets held for sale
FEATURES
Average age < 10 years
Strategic locations
Value per sqm: €2,510
1,425 1,835
2,069
485
382 335
31-Dec-10 31-Dec-11 31-Dec-12
Assets in operation Assets under construction
1,910 2,217
36
2,404 +26%
Currently being audited

Recurring EBITDA 256 218 134 122
Net cash flow from operating activities 208 202 130 78
Net cash flow from internal investing act.1 26 -102 54 -28
Investment in construction -274 -226 -87 -187Property sales 300 124 141 159
Total internal cash flow 2 234 101 184 50
Net cash flow from external investing activ. -296 -248 -144 -152
Net cash flow from financing activities -153 -166 -87 -66Acquisitions of operating assets (intangible assets) -143 -82 -57 -86
Net cash flow from financing activities 115 180 102 13
Change in cash during half-year period 53 33 142 -89
En M€ 2012 2011 H2 2012 H1 2012
Cash flow statement
37
Currently being audited
1 Net cash flow from internal investing activities: investments in construction required for maintenance and to harness the growth pipeline, net of disposals and excluding acquisitions 2 Internal cash flow = Net cash flow from operating activities + Net cash flow from internal investing activities

Increase in the dividend per share
38
Proposed dividend to the 2012 AGM: €0.60 / share
Payout ratio of the net profit 33%
Increase in the dividend per share
+ 20%
Share yield* 2%
* Based on the closing price of the share at 22 March 2013
3,7 5.8
9.7
26.5
31.8
0.00 0.00 0.00 0.00 0.00 0.00 0.00
0.10
0.15
0.23
0.50
0.60
1989 2002 2003 2004 2005 2006 2007 2008 2009 2010 2011 2012
Distributed amount (€m) Dividend per share (€)
18 years without any dividend

Strategy and outlook
Yves Le Masne – Chief Executive Officer
Dr Jean-Claude Marian M.D. – Chairman

Openings of 2012: 2,150 beds and 1,300 jobs created
40
St .Maur des Fossés (94), Nursing Home – 80 beds
Berlaimont (59), Nursing Home– 75 beds
Villepinte (93), Psy. facility. – 100 beds
Clamart (92), Nursing Home – 63 beds
Boussy St. Antoine (91), Nursing Home – 80 beds Sainte Maxime (83), Nursing Home – 80 beds
Draguignan (83), Post-acute facility – 50 beds Saintry (91), Nursing Home – 80 beds
Toulon (83), Psy. facility. – 160 beds
Osny (95), Post-acute facility – 60 beds
Boulogne (92), Nursing Home – 110 beds
Roquebrune (06), Nursing Home – 110 beds

Openings of 2013: 2,000 beds and 1,200 jobs created
41
Nyon (Suisse), Post-acute facility – 90 beds
Meyzieu (69), Post-acute facility – 104 beds
Parmain (95), Nursing Home – 70 beds
Cateau Cambresis (59), Nursing Home– 94 beds Le Cannet (06), Nursing Home–120 beds
Saint Sulpice de Royan (17), Nursing Home – 84 beds
Batz sur Mer (44), Nursing Home – 48 beds
Guérande (44), Nursing Home – 80 beds
Espira d’Agly (66), Nursing Home – 70 beds
Chamalières (63), Post-acute facility – 90 beds La Garenne Colombes (92), Nursing Home – 103 beds
Lyon Champvert (69), Psy. facility. – 179 beds

2013: continued growth and cash flow strategy
Value added development
Ramp-up in the number of mature facilities
Pipeline comes on stream: 8,648 beds
Property sales at attractive conditions
Strong increase in revenue and solid organic growth
2013 target: €1,600m (+12%)
Increase in profitability 18,036 23,397 27,197
31,726 53% 59%
65% 79%
31.12.2009 31.12.2010 31.12.2011 01.03.13
Beds open % beds open / beds under redevelopment
STRATEGY OUTLOOK
Debt under control
42
Attractive dividend policy
+
+
+

Appendices

Shareholding structure and Governance
Shareholding structure (% of capital) Board of Directors
– Dr Jean-Claude Marian – Chairman
– Yves Le Masne – CEO
– Brigitte Michel
– Alexandre Malbasa
– Jean Patrick Fortlacroix
– FFP Invest (Thierry Mabille de Poncheville)
– NEO-GEMA (Philippe Austruy)
44
Free float 61.6%
FFP Invest 7.2%
Sempre 8.0%
Marian family 23.1%

Source: Mensuel des Maisons de retraite, January 2013
* As at 01.03.13 ORPEA had a total of 40,374 beds (29,477 beds in France and 10,897 beds abroad), including post-acute, rehab. and psychiatric beds
* 18,285
15,115
11,996 11,152
3,249 3,099 3,018 2,665 2,214 1,865 1,833 1,628 1,572 1,392 1,305
28,000
French nursing home sector
Number of nursing home beds in the private commercial sector in France – January 2013
Fragmented private
commercial sector
Public
Non-profit, private
Private commercial
Breakdown of beds by type of operator
20%
55% 25%
Low market share of the private
sector
Public and non-profit operators: reduction in investment capacity
Private sector: investment capacity and job creation
Reminder: in the UK, the market share of the private sector is 70%
45

Source: Report by Jean De Kervasdoué, Professor of Health Services Economics and Management, CNAM
Trends in income of the elderly by age bracket
Average pension (excluding other income): €1,300 per month with wide disparities
Source: IGAS 2010 report: €110,000 to €160,000
Average cost of nursing home for a resident
€46,200
Assumptions: Average cost: €2,200 per month Average length of stay: 21 months
Average wealth of people aged 85+
€135,000
16,000
18,000
20,000
22,000
24,000
26,000
2000 2005 2010 2015 2020
65-69 70-74 75-79 80-84 85 et +
Strong solvency position of people aged 85+
50% 40%
10% < €1,250
€1,250 - €2,250
> €2,250
Comparison of nursing home cost vs. wealth
Income of elderly
2010-2020 +32%
46

Market data (last 12 months):
– Average daily volume: 78,140 shares (= €2.3m) – Price: €32.40 – High (12-month): €34.00 – Low (12-month): €24.20 – Turnover: 38% in 12 months – Market cap.: €1,717m – Number of shares: 52,998,062
Indices:
– Compartment A of Euronext Paris, NYSE Euronext
– Member of CAC Mid 60 and SBF 120
– Member of SRD
Contacts:
– ORPEA - Yves Le Masne, CEO Steve Grobet, Investor Relations, Tel.: +33 (0)1 47 75 74 66, [email protected]
€
Stock market information
47
20
25
30
35
Dec-11 Feb-12 Apr-12 Jun-12 Aug-12 Oct-12 Dec-12
Data as at March 21, 2013