2012 house results map updated november 12, 2012 producer: jenna fugate director: jessica guzik
TRANSCRIPT

2012 House Results MapUpdated November 12, 2012
Producer: Jenna FugateDirector: Jessica Guzik
Source: National Journal, 2012.
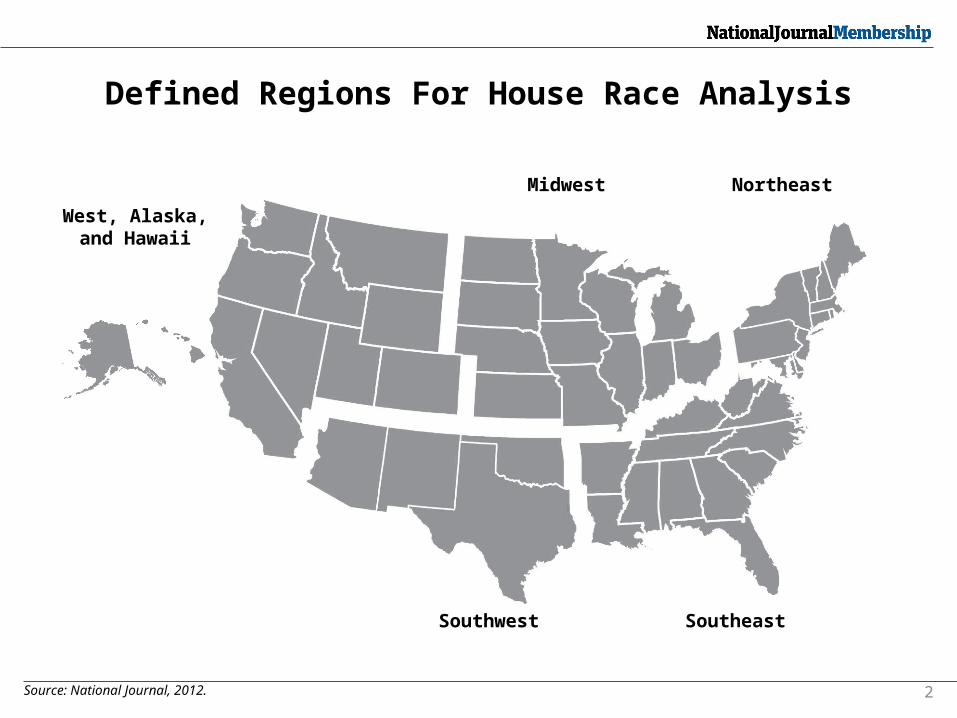
Defined Regions For House Race Analysis
Southwest Southeast
Northeast
2
Midwest
West, Alaska, and Hawaii
Source: National Journal, 2012.
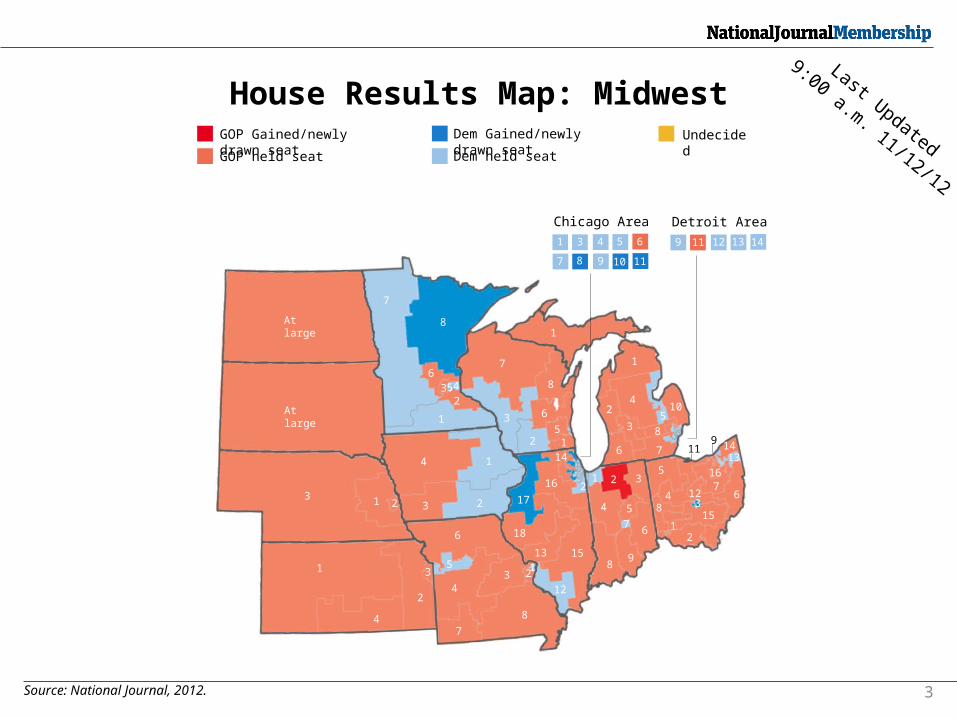
House Results Map: MidwestLast Updated
9:00 a.m. 11/12/12
GOP Gained/newly drawn seat GOP held seat
Dem Gained/newly drawn seat Dem held seat
Undecided
3
At large
At large
3 1 2 3 2
14
1
4
3
24
7
5
8
3
6
21
12
1513
18
17
16
14
21 2
8
7
1
23
645
3
2 15
6
8
1
7 1
24
10
3
6 7
85
4
3
5
67
89
12
315
67
1613
14911
124
5
8
Chicago Area31 54 6
87 109 11
Detroit Area
119 1312 14

6
5 1
At large
18912
14
35
232726
2524
22
19
1011
17
416
15 83
2
47
51
18
4
531
2 2
112
36
21
20
At large
2
11
2
Massachusetts54 87 9
New York City Area32 54 6
87 109 11
1312 1514 16
17
Newark Area86 109 11
12
Maryland32 74 8
Source: National Journal, 2012.
House Results Map: NortheastLast Updated
9:00 a.m. 11/12/12
GOP Gained/newly drawn seat GOP held seat
Dem Gained/newly drawn seat Dem held seat
Undecided
4
Source: National Journal, 2012.
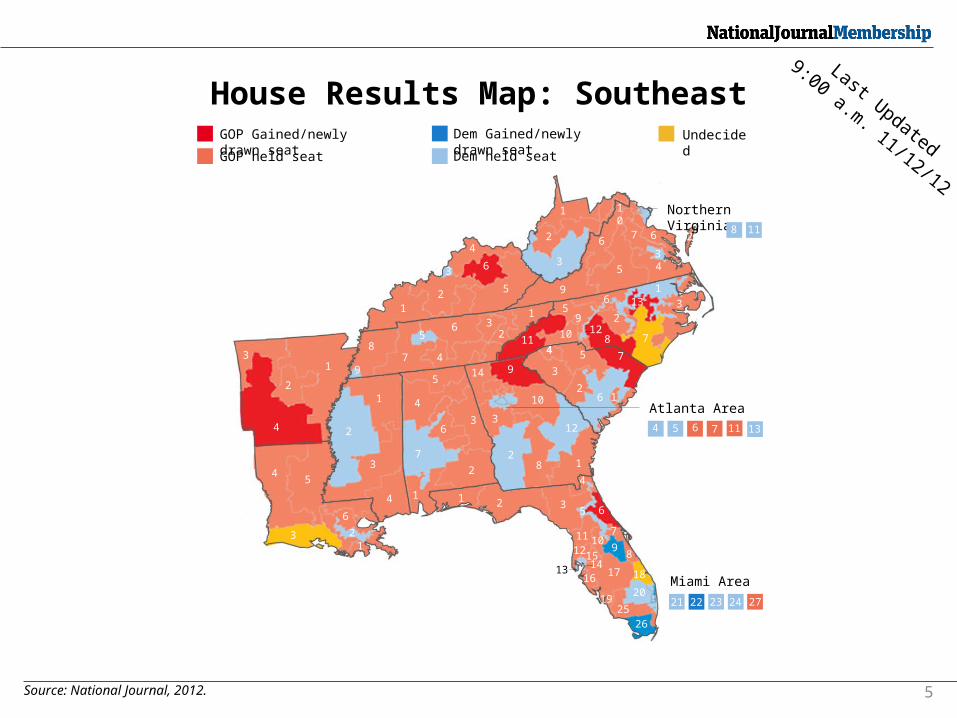
House Results Map: SoutheastLast Updated
9:00 a.m. 11/12/12
GOP Gained/newly drawn seat GOP held seat
Dem Gained/newly drawn seat Dem held seat
Undecided
Miami Area
21 222
23 24 27
Atlanta Area5 6 74 11 13
Northern Virginia 118
4
2
31
45
3
2
1
3
4
16
21
7
1 1
2
36
4
59
87
56
4
32
1
11
56
2
10 128
7
131
3
7
9
54
3
26 1
12
182
3
14 9
10
12
3
4
6
5
3
2
1
6
5
9
43
7 6
10
2 3
4
65
8
7
91011
121514
17 18
2016
1925
26
13
2
5
Source: National Journal, 2012.
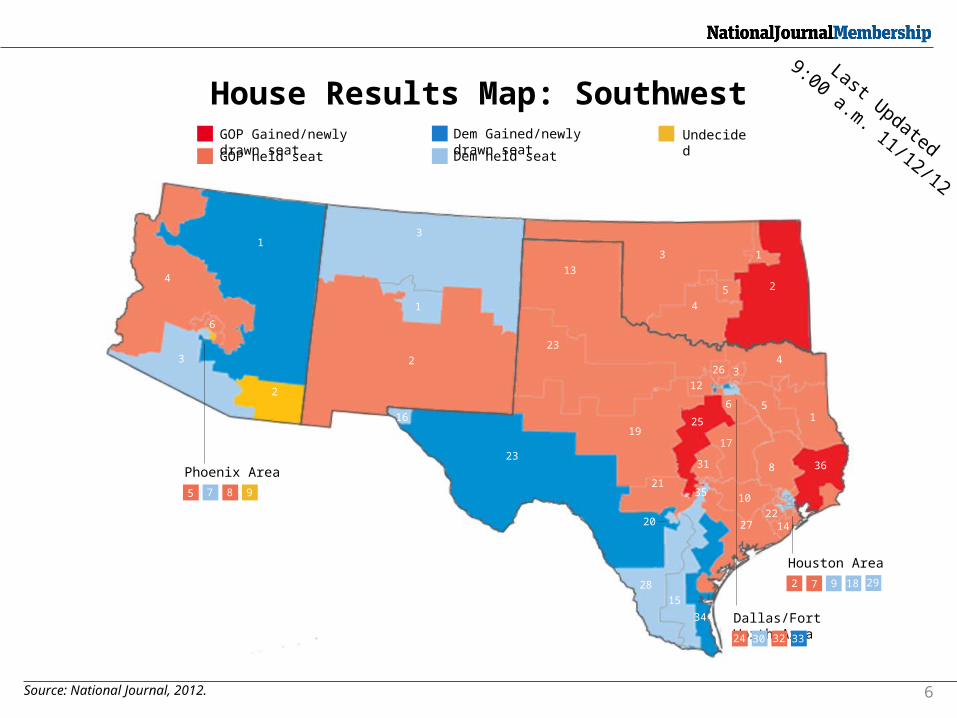
House Results Map: SouthwestLast Updated
9:00 a.m. 11/12/12
1
4
2
3
6
2
1
3
16
23
23
13
3
4
5
1
2
1925
426 3
12
28
15
34
27 1422
10
17
8 36
156
21
31
35
20
Phoenix Area
5 7 8 9
Dallas/Fort Worth Area24 30 32 33
Houston Area
7 9 182 29
GOP Gained/newly drawn seat GOP held seat
Dem Gained/newly drawn seat Dem held seat
Undecided
6

At large
2
1
Source: National Journal, 2012.
House Results Map: West, Alaska and HawaiiLast Updated
9:00 a.m. 11/12/12
6
179
8
4
10 5
At large
At large
1
2
24
1
53
1
2
4
3
1
2
1
43
3 54
2
7
1
6
36
5150
823
4
2221
25
24
20
1610
76
35
2
2627
49
San Francisco Area11 12 13 14 17
Los Angeles Area
28 29 30 31 32
33 34 35 37 38
39 40 41 42 43
44 45 46 47 48
San Diego Area
52 53
GOP Gained/newly drawn seat GOP held seat
Dem Gained/newly drawn seat Dem held seat
Undecided
7