2012 ibm annual report
TRANSCRIPT

2012 IBM Annual Report

I am pleased to report that in 2012, IBM achieved record operating earnings per share, record free cash flow and record profit margins, with revenues that were flat at constant currency. Operating earnings per share were up 13 percent, putting us well on track to our 2015 Road Map objective of at least $20 of operating earnings per share. Importantly, we continued to deliver value to you, our owners. This performance is a testament to our strategic position and capabilities, the discipline of our management systems, and the dedication and expertise of more than 430,000 IBMers around the world. Importantly, it reflects the impact of a distinct choice we have made about IBM’s business and technology model. IBM is an innovation company. Both in what we do and in how we do it, we pursue continuous transformation — always remixing to higher value in our portfolio and skills, in the capabilities we deliver to our clients and in our own operations and management practices. This is not the only path to success in our industry, and it is not the easiest one. But it is ours. In this letter, I will report on our 2012 results, and then put them in context of our model of continuous transformation.
Results in 2012 Earnings per share: Diluted operating earnings per share in 2012 were $15.25, a new record. This marked 10 straight years of double-digit EPS growth.
Margins: IBM’s operating pre-tax income margin rose for the 10th consecutive year — to 22.2 percent, up 12 points since 2000.
Cash flow: IBM has consistently generated strong cash flow, a key indicator of real business performance. In 2012 our free cash flow was $18.2 billion, a record for IBM and $12 billion higher than a decade ago. We ended 2012 with $11.1 billion of cash and marketable securities.
Revenue and income: Our revenue in 2012 was $104.5 billion, down 2 percent as reported and flat at constant currency. We grew operating net income by 8 percent, to $17.6 billion, our highest ever.
Investment and return to shareholders: In 2012 we invested $3.7 billion for 11 acquisitions in key areas of software and services; $4.3 billion in net capital expenditures; and $6.3 billion in R&D. We were able to return $15.8 billion to you — $12 billion through share repurchases and $3.8 billion through dividends. Last year’s dividend increase was 13 percent, marking the 17th year in a row in which we have raised our dividend, and the 97th consecutive year in which we have paid one. Since 2000, we have added $14.6 billion to IBM’s operating pre-tax profit base, and increased our pre-tax income 1.7 times, our operating earnings per share 3.6 times and our free cash flow 1.7 times. Cumulatively, we have generated about $150 billion of free cash flow.
IBM’s Model: Continuous TransformationIn an industry characterized by a relentless cycle of innovation and commoditization, one model for success is that of the commodity player — winning through low
Dear IBM Investor:
1A Letter from the Chairman

2
price, efficiency and economies of scale. Ours is a different choice: the path of innovation, reinvention and shift to higher value.
We remix to higher value: We do so in our portfolio, in our organic R&D investment, and through targeted acquisitions and divestitures. • We remix our research and development: Two decades ago,
70 percent of our researchers were working in materials science, hardware and related technology. Even the one-in-ten working in software were focused on operating systems and compilers. Today, 60 percent are in fields that support our key growth initiatives, such as the 400 mathematicians developing algorithms for business analytics, as well as a diverse group of specialists that include medical doctors, computational biologists, experts in natural language processing, and weather and climate forecasters. Since the beginning of 2010, we have spent $19 billion on R&D, and in 2012 IBM earned the most U.S. patents for the 20th straight year, with a record total of 6,478.
• We acquire new capabilities: Organizations run into trouble when they look to fulfill a new strategy or provide the basis for transformation through acquisitions. We practice a disciplined approach that asks three questions: Does it build on or extend a capability IBM already has? Does the company have scalable intellectual property? Can it take advantage of our reach into 170 countries? Our balanced formula has built a strong track record since 2000, with more than 140 acquisitions.
• We divest nonstrategic assets: Always moving to the future isn’t just about what you invent. It also involves choices about when to move on. Over the past decade we have divested almost $15 billion of annual revenue —
businesses that no longer fit our strategy. If we had not done so, we would be a larger company today, but with lower margins and capabilities less essential to our clients.
2012 Performance($ in billions except per share amounts)
For the year ended December 31: 2012
Operating earnings per share $ 15.25
Revenue $104.50
Operating net income $ 17.60
Free cash flow $ 18.20
Returned to shareholders $ 15.80
We make markets: We create new markets by category, by geography and by client. • We make markets by category: Our software and
services businesses today look very different from just a few years ago, offering new solution categories like MobileFirst, Social Business and Smarter Commerce. In our hardware business, momentum is building for our new PureSystems family, which launched the new category of workload-optimized systems. PureSystems has seen more than 2,300 installations in more than 70 countries in just two quarters.
• We make markets by geography: We are achieving strong results in the world’s growth markets, working closely with businesses, institutions and governments as they seek to modernize their infrastructures and societies. We opened 144 new branches in these markets in 2012. We also continue remixing to more profitable opportunities in these countries, through Smarter Planet solutions such as Smarter Transportation, Smarter Finance and Smarter Cities.

• We make markets by client: We unlock new opportunity within our existing client base by creating capabilities for a new generation of IT buyers — from chief marketing officer to chief financial officer to the head of human resources and more. I discuss this in greater depth below.
We reinvent core franchises: Our System z enterprise server, introduced in 2012, is just the latest reinvention of the mainframe, and it drove System z’s largest capacity shipment ever during the fourth quarter — with more than half of that growth coming from Linux workloads. Core software platforms such as WebSphere have been entirely transformed. And Information Technology Services, which was once a significant reseller of others’ technology — generating good revenue but low margins — has shifted significantly to high-value services such as data center energy efficiency, security, and business continuity and recovery. This has contributed to a 6-point pre-tax income margin improvement in services since 2000.
We remix our skills and expertise: An innovation model means continuously remixing and deepening our expertise. For example, over the past three years we have increased our skill base in analytics by more than 8,100 experts. We have also added nearly 9,500 sellers in key areas of industry expertise — such as healthcare, energy, telecom and banking, as well as emerging sectors such as metals and mining. This year, IBM Global Business Services and IBM Research will launch the IBM Client Experience Lab, as well as joint GBS and Software practices in social business and mobility — including a tripling of our skill base in social and mobile technologies and doubling our skill base in Smarter Commerce.
We reinvent the enterprise itself: We have been highly disciplined about driving productivity — through the adoption of common, shared operations and systems; the streamlining of enterprise-wide processes; and the leveraging of global skills — all in the service of global integration. And we are now taking the next step, becoming a Smarter Enterprise: • In part, this means applying analytics to every part of our
business — changing how we manage risk, drive efficiency, increase marketing effectiveness and infuse business insight across the company.
• In part, it means using social technologies to identify IBM experts and enable them to deliver their knowledge and leverage our entire portfolio to create a seamless, high-value client experience.
This ongoing transformation gives us confidence that we will achieve our goal of $8 billion in productivity savings over the course of our 2015 Road Map. Sixty percent of our productivity savings are reinvested in the business.
Revenue Increase for IBM Growth Initiatives in 2012For the year ended December 31: 2012
Smarter Planet 25%
Business Analytics 13%
Cloud 80%
Growth Markets 7%*
* at constant currency
We use our strong cash flow strategically: Our cash flow generation fuels reinvestment in the business — in R&D, capital expenditures and acquisitions. At the same time, we deliver consistently strong returns to you, our owners.
3A Letter from the Chairman

4
Virginia M. RomettyChAiRMAn, PReSident And ChieF exeCutive OFFiCeR

A New Era of ComputingTo sustain an innovation model in our industry, a company must do more than accommodate major technology shifts. It must lead them. IBM has done this repeatedly over the past century — not only pioneering new technology models, but capturing significant economic value. Today, another new wave is sweeping in — powered by Big Data, analytics, mobile, social and cloud. We anticipated this several years ago with our point of view on building a Smarter Planet — a world that was becoming instrumented, interconnected and intelligent. Now, the IT environment is moving from monolithic applications to dynamic services; from structured data at rest to unstructured data in motion; from PCs to unprecedented numbers and kinds of devices; from stable to unpredictable workloads; from static infrastructure to cloud services; and from proprietary standards to open innovation. This shift plays strongly to IBM’s historic position in enterprise computing. So we are, as we have so often done in the past, reshaping our investment, innovation and market strategies to lead. We see three defining characteristics of this new era — what we call Smarter Computing:
1. Smarter Computing is designed for Big Data. Every two days, as much data is now generated as in all of human history up to 2003. This is “Big Data,” and it constitutes a vast new natural resource that can revolutionize industries and societies — with the right technology, capable of analyzing and extracting value and insight from it. This is one reason IBM’s analytics business is growing so strongly, as we work with clients to drive intelligence into every aspect of their operations. Indeed, we have raised our 2015 Road Map target for Business Analytics from $16 billion to
$20 billion of revenue. We are also rapidly advancing the market place applications for our breakthrough “cognitive” computing system, Watson, which is already demonstrating its potential to transform healthcare and finance. We will introduce our first commercial Watson offerings this year.
to sustain an innovation
model in our industry,
a company must do more
than accommodate
major technology shifts.
2. Smarter Computing is built on software-defined environments. To handle today’s volume, velocity and variety of data, enterprise data centers must become more dynamic and flexible. One way to think about this is to imagine entire IT infrastructures that are as programmable as individual systems. This new model is known as the “software-defined environment,” and cloud computing is its first manifestation. However, it will not be the last. This new model optimizes the entire computing “stack” — compute, storage and network resources — so that it can adapt to the type of work required. Hardware built for these new environments will be of significant business value — exemplified by IBM’s systems today. From System z, to Power Systems, to storage, to our new PureSystems family, IBM systems are software-defined.
5A Letter from the Chairman

6
3. Smarter Computing is open. Only through open standards and platforms can enterprises support an expanding universe of heterogeneous data, devices and services, and engage in today’s rich innovation eco systems. The challenge is how to turn open approaches into successful business. IBM helped do so with Linux, Eclipse and Apache, supporting their growth into standards with vital industry ecosystems, and then developing high- value IBM business on top of them. Today, we are repeating this strategy through a number of collaborations such as OpenStack, a new open source cloud platform; Hadoop, an open source platform for Big Data; and several promising open source hardware projects. Taken together, computing that is open, software-defined, and designed for Big Data constitutes a profound shift in information technology. And as in prior such shifts, it will create new markets and new clients. We are pursuing them aggressively.
New Clients, New MarketsAs I mentioned, to capture the opportunities opened up by this new era of technology, IBM is engaging with new kinds of clients as we make new markets in Big Data/analytics, cloud for the enterprise, emerging economies and Smarter Planet. Indeed, from a business perspective, Smarter Planet is a platform for a growing array of new markets — such as Smarter Commerce, Smarter Cities and Social Business — and these new markets take concrete shape through the engagement and enablement of a new generation of IT clients. Today, we are working around the world and across multiple industries with many new leaders. Perhaps the most active among them in embracing the new era of technology have been chief marketing officers, who are looking to reinvent the practice of marketing —
for example, by understanding and enabling customers as individuals, rather than “segments.” This helped our Global Business Services Smarter Commerce signings grow by nearly 200 percent in 2012 — reaching $2 billion. At the same time, chief procurement officers are expected to increase their annual investment in Supplier Intelligence by 30 percent through 2015, as they reshape their global supply chains. And leaders of human resources are investing in analytics to build smarter workforces and social enterprises. One analyst has ranked IBM as number one in enterprise social business for the past three years.
“Front-office” transformation
has the potential to fuel
the biggest wave of business
technology investment
since the era of enterprise
resource planning.
City mayors are deploying Intelligent Operations Centers to transform public services in Davao, Philippines; Rio de Janeiro, Brazil; and Miami-Dade County, Florida. And urban transportation managers, such as those in Singapore and Eindhoven, Netherlands, are reducing urban congestion by offering drivers alternate route

The era opening before us offers a historic opportunity for both businesses and societies to pursue this higher purpose. A vast new natural resource is being unleashed — promising to do for our century what steam, electricity and fossil fuels did for the Industrial Age. The economic and societal potential of this new gusher of data is incalculable. It is the opportunity of our lifetime — and IBMers are determined to seize it. It is in this spirit that I express my deep pride in the worldwide IBM team for bringing us to where we are, and my gratitude to you, our shareholders, for your unwavering support. I hope you share our excitement about your company’s performance and the way in which IBMers are building a smarter planet and a brighter future.
Virginia M. RomettyChAiRMAn, PReSident And ChieF exeCutive OFFiCeR
recommendations in exchange for their cars’ data on braking, acceleration and location. This list could go on. “Front-office” transformation has the potential to fuel the biggest wave of business technology investment since the era of enterprise resource planning (ERP). And that creates a powerful set of conditions for the tens of thousands of business advisors and industry experts embedded in the world’s greatest engine of technical innovation. In sum, our strong strategic positioning, solid balance sheet, recurring revenue, robust profit streams, global reach — and especially our institutional capacity for innovation and continuous transformation — give us confidence that we will continue to provide differentiating value to our clients, employees, partners and communities — and therefore to you, our owners. “Generating Higher Value at IBM” (pp. 8–15) summarizes how.
On Being EssentialIn closing, let me say a few words on the deeper meaning of this model of continuous transformation to higher value, at this particular moment in history. As I have noted, an innovation model does not present an easy path, especially in an industry as fast-changing as ours. But once you are clear on your choice, it shapes everything you do: your business strategy, how you recruit talent, how you develop skills, how you invent, how you run the company. And for IBM, it means something more. It speaks to IBMers’ aspiration to be essential to each of our vital constituencies — our clients, our communities, our partners, our investors, and one another. We see this as our purpose as an enterprise — to serve their plans for success, their need to transform and their own unique sense of purpose.
this letter includes selected references to certain non-GAAP financial measures that are made to facilitate a comparative view of the company’s ongoing operational performance. For information about the company’s financial results related to (i) operating pre-tax income, operating pre-tax income margin and operating earnings per share and (ii) free cash flow, which are in each case non-GAAP measures, see the company’s Forms 8-K dated January 22, 2013 and February 28, 2013 (Attachment ii—non-GAAP Supplementary Materials).
7A Letter from the Chairman
8
Generating Higher Value at IBM
iBM is an innovation company. We pursue continuous transformation
both in what we do and how we do it—always remixing to higher value
in our offerings and skills, in our operations and management practices,
and in the transformational capabilities we deliver to our clients.

iBM operations in more than 170 countries leverage the company’s
global scale and expertise.
A globally integrated model allows us to focus resources
on client-oriented work and enables rapid deployment of iBM
capabilities to growth markets. in 2012, we continued our rapid
geographic expansion—opening 144 branch offices. Our growth
markets delivered more than 60 percent of our geographic
gross profit growth between 2010 and 2012.
Global integration of all our major enterprise functions—from
service delivery to marketing—has enabled iBM to deliver enterprise
productivity savings while improving quality.
2. We have become a globally integrated enterprise to capture new growth and productivity.
Approaching 30% of geographic revenue from growth markets by 2015.
1. We continuously change our business mix toward higher-value, more profitable technologies and market opportunities.
Segment Pre-tax Income*($ in billions)
About 50% of iBM segment profit expected to come from Software by 2015.
* Sum of external segment pre-tax income not equal to iBM pre-tax income.
** excludes enterprise investments and not restated for stock-based compensation. 2000 Segment Pti is reclassified to conform with 2012 presentation.
hardware/Financing Services Software
2000**
3.3 3.7 2.6
35% 38% 27%
3.3 9.9 10.8
14% 41% 45%2012
Growth Markets Share of Geographic Revenue
24%2011
2010
2009
2000*
2012
* excluding divested businesses of PCs and printers.
2015 Road Map each year iBM describes how the company manages its business
and serves its shareholders in a detailed financial road map.
A long-term perspective ensures iBM is well positioned to take
advantage of major shifts occurring in technology, business and
the global economy.
22 %
21 %
19 %
11 %
9Generating Higher Value at IBM

10
4
8
$20
16
12
0
00 12
18.2
6.7
10.1%
22.2%
Our operating (non-GAAP) pre-tax income margin in 2012 was
22.2 percent, 12 points higher than in 2000. the primary driver
of this performance was gross profit margin expansion, as a result
of the shift in our business mix to more profitable, higher-value
segments and improved productivity.
At the same time, we’ve increased R&d investment. Since the
beginning of 2000, we’ve spent $75 billion in R&d, enabling
us to deliver key innovations and maintain u.S. patent leadership
for our 20th consecutive year in 2012.
Our solid business model performance has resulted in
consistently strong free cash flow. in 2012 our free cash flow
was $18.2 billion, $12 billion higher than a decade ago.
3. By aligning our business model with our clients’ needs, we achieve our financial goals.
4. This allows us to invest in future sources of growth and provide strong returns to our shareholders.
Primary Uses of Cash Since the Beginning of 2000($ in billions)
Free Cash Flow and Operating Pre-tax Income Margin*($ in billions)
Free Cash Flow
Operating Pre-tax income Margin
$237Acquisitions
dividends
Capital expenditures
Share repurchases (gross)
Acquisitions: Since the beginning of 2000, we have acquired
more than 140 companies in strategic areas including analytics,
cloud, security and Smarter Commerce. We expect to spend
$20 billion in acquisitions over the 2015 Road Map period to
support growth initiatives.
Capital Expenditures: We have invested more than $55 billion
since 2000 to advance our capabilities.
Share Repurchase and Dividends: Since 2000, we have
returned almost $150 billion to shareholders—paying $26 billion
in dividends and reducing the outstanding share count by
over 35 percent. We expect to return $70 billion to shareholders
in our 2015 Road Map period—$50 billion through gross share
repurchases and $20 billion in dividends.
$123
$26
$55
$33
* excludes acquisition-related and nonoperating retirement-related charges.
$ 70 billion expected to be returned to shareholders through 2015.
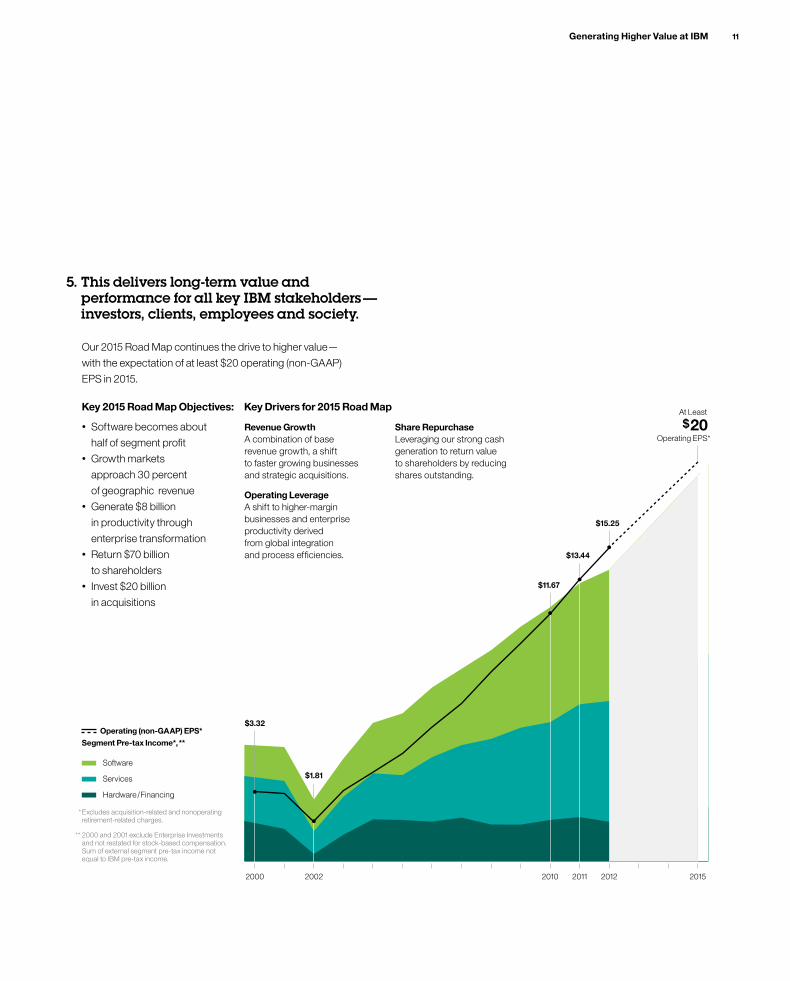
Our 2015 Road Map continues the drive to higher value—
with the expectation of at least $20 operating (non-GAAP)
ePS in 2015.
5. This delivers long-term value and performance for all key IBM stakeholders — investors, clients, employees and society.
* excludes acquisition-related and nonoperating retirement-related charges.
** 2000 and 2001 exclude enterprise investments and not restated for stock-based compensation. Sum of external segment pre-tax income not equal to iBM pre-tax income.
• Software becomes about
half of segment profit • Growth markets
approach 30 percent
of geographic revenue• Generate $8 billion
in productivity through
enterprise transformation• Return $70 billion
to shareholders • invest $20 billion
in acquisitions
2000 2002 2010 2011 2012 2015
$13.44
$15.25
$11.67
$3.32
$1.81Services
Software
Hardware / Financing
Operating (non-GAAP) EPS*Segment Pre-tax Income*, **
$ 20At Least
Operating ePS*Revenue GrowthA combination of base revenue growth, a shift to faster growing businesses and strategic acquisitions.
Share RepurchaseLeveraging our strong cash generation to return value to shareholders by reducing shares outstanding.
Operating LeverageA shift to higher-margin businesses and enterprise productivity derived from global integration and process efficiencies.
Key Drivers for 2015 Road MapKey 2015 Road Map Objectives:
11Generating Higher Value at IBM
12
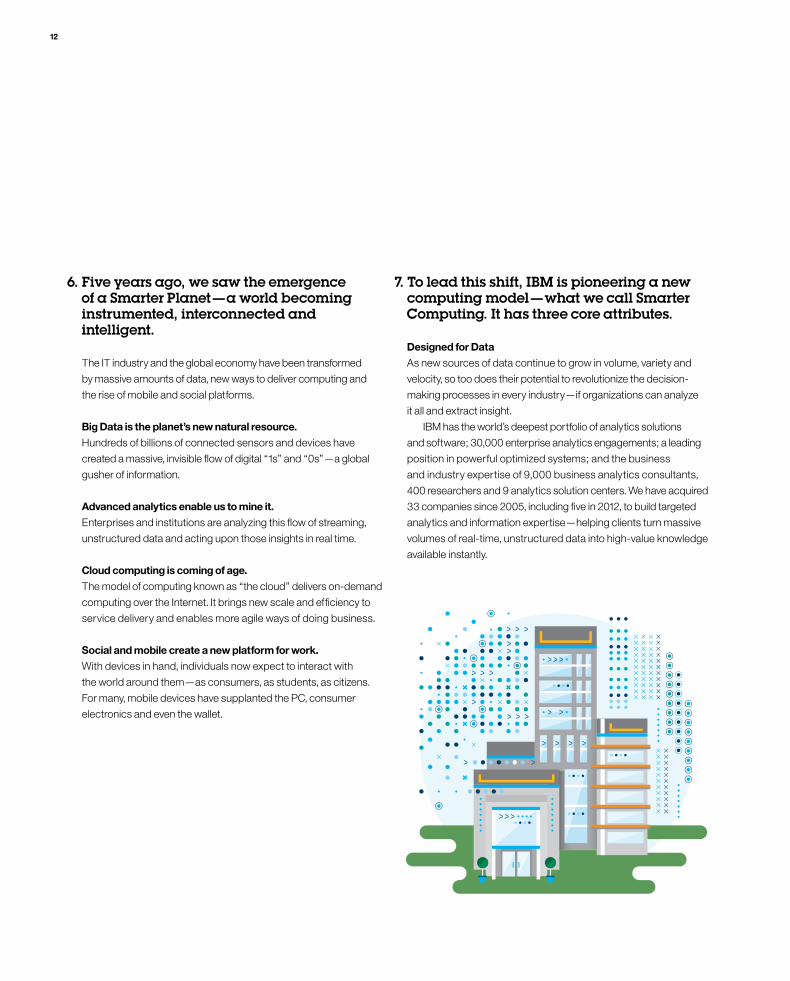
Designed for DataAs new sources of data continue to grow in volume, variety and
velocity, so too does their potential to revolutionize the decision-
making processes in every industry—if organizations can analyze
it all and extract insight.
iBM has the world’s deepest portfolio of analytics solutions
and software; 30,000 enterprise analytics engagements; a leading
position in powerful optimized systems; and the business
and industry expertise of 9,000 business analytics consultants,
400 researchers and 9 analytics solution centers. We have acquired
33 companies since 2005, including five in 2012, to build targeted
analytics and information expertise—helping clients turn massive
volumes of real-time, unstructured data into high-value knowledge
available instantly.
the it industry and the global economy have been transformed
by massive amounts of data, new ways to deliver computing and
the rise of mobile and social platforms.
Big Data is the planet’s new natural resource. hundreds of billions of connected sensors and devices have
created a massive, invisible flow of digital “1s” and “0s”—a global
gusher of information.
Advanced analytics enable us to mine it. enterprises and institutions are analyzing this flow of streaming,
unstructured data and acting upon those insights in real time.
Cloud computing is coming of age. the model of computing known as “the cloud” delivers on-demand
computing over the internet. it brings new scale and efficiency to
service delivery and enables more agile ways of doing business.
Social and mobile create a new platform for work. With devices in hand, individuals now expect to interact with
the world around them—as consumers, as students, as citizens.
For many, mobile devices have supplanted the PC, consumer
electronics and even the wallet.
6. Five years ago, we saw the emergence of a Smarter Planet — a world becoming instrumented, interconnected and intelligent.
7. To lead this shift, IBM is pioneering a new computing model — what we call Smarter Computing. It has three core attributes.
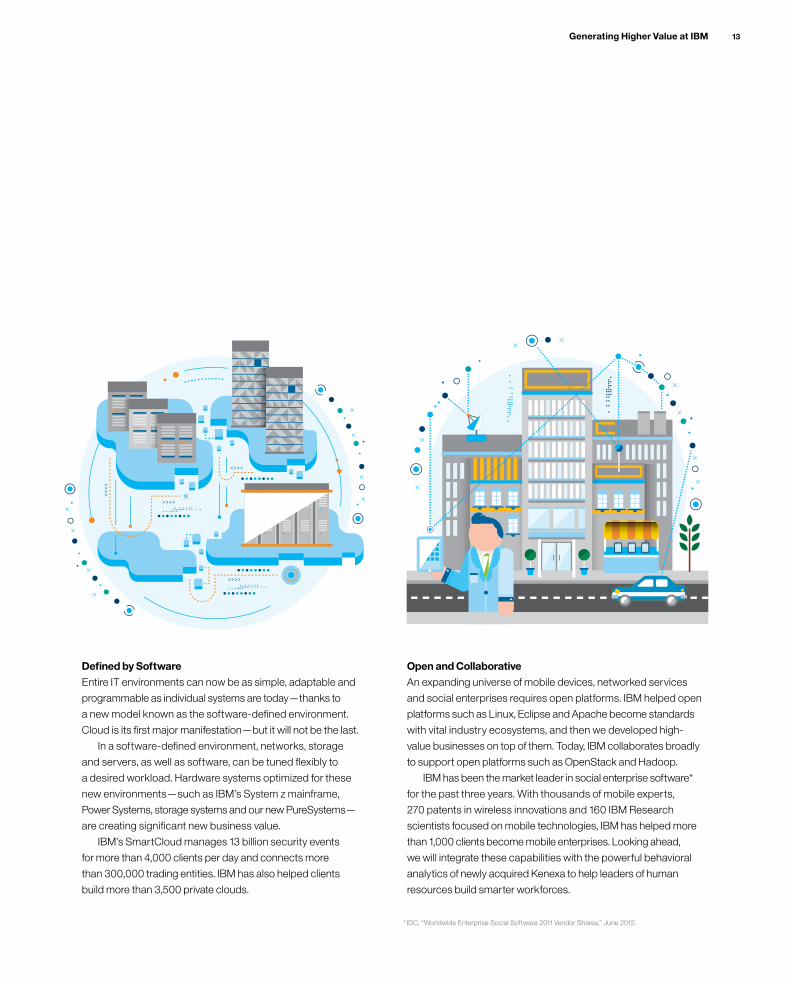
Open and CollaborativeAn expanding universe of mobile devices, networked services
and social enterprises requires open platforms. iBM helped open
platforms such as Linux, eclipse and Apache become standards
with vital industry ecosystems, and then we developed high-
value businesses on top of them. today, iBM collaborates broadly
to support open platforms such as OpenStack and hadoop.
iBM has been the market leader in social enterprise software*
for the past three years. With thousands of mobile experts,
270 patents in wireless innovations and 160 iBM Research
scientists focused on mobile technologies, iBM has helped more
than 1,000 clients become mobile enterprises. Looking ahead,
we will integrate these capabilities with the powerful behavioral
analytics of newly acquired Kenexa to help leaders of human
resources build smarter workforces.
* idC, “Worldwide enterprise Social Software 2011 vendor Shares,” June 2012.
Defined by Softwareentire it environments can now be as simple, adaptable and
programmable as individual systems are today—thanks to
a new model known as the software-defined environment.
Cloud is its first major manifestation—but it will not be the last.
in a software-defined environment, networks, storage
and servers, as well as software, can be tuned flexibly to
a desired workload. hardware systems optimized for these
new environments—such as iBM’s System z mainframe,
Power Systems, storage systems and our new PureSystems—
are creating significant new business value.
iBM’s SmartCloud manages 13 billion security events
for more than 4,000 clients per day and connects more
than 300,000 trading entities. iBM has also helped clients
build more than 3,500 private clouds.
13Generating Higher Value at IBM
14
0176.980
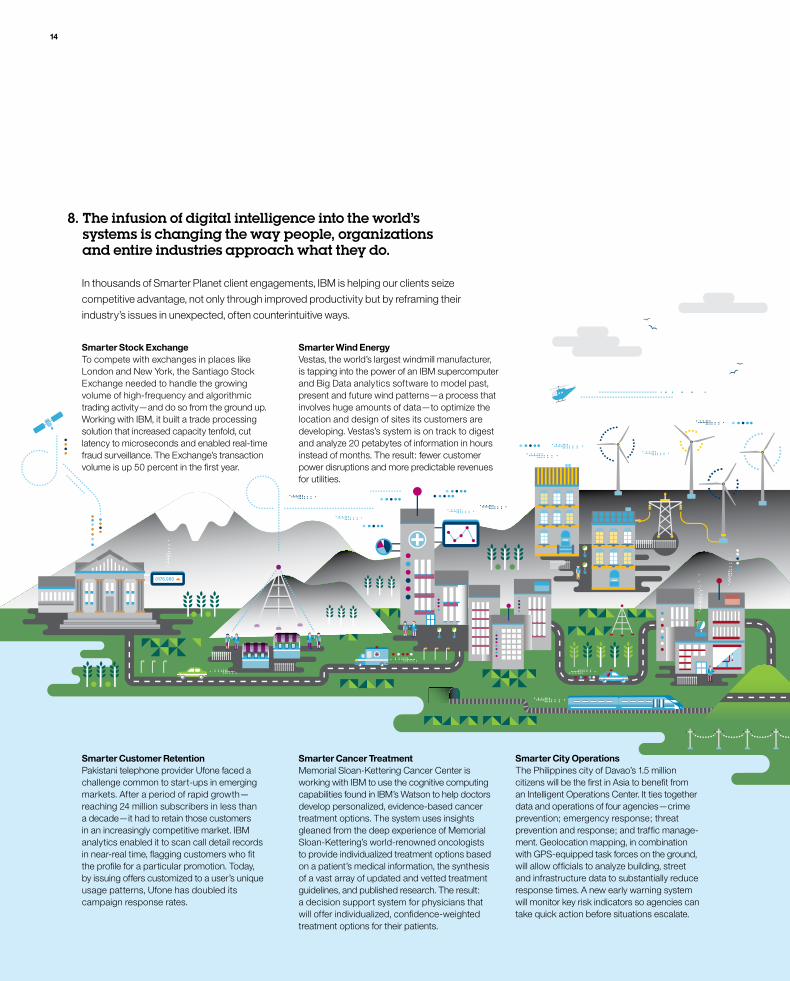
Smarter City Operations the Philippines city of davao’s 1.5 million citizens will be the first in Asia to benefit from an intelligent Operations Center. it ties together data and operations of four agencies—crime prevention; emergency response; threat prevention and response; and traffic manage-ment. Geolocation mapping, in combination with GPS-equipped task forces on the ground, will allow officials to analyze building, street and infrastructure data to substantially reduce response times. A new early warning system will monitor key risk indicators so agencies can take quick action before situations escalate.
Smarter Customer RetentionPakistani telephone provider ufone faced a challenge common to start-ups in emerging markets. After a period of rapid growth— reaching 24 million subscribers in less than a decade—it had to retain those customers in an increasingly competitive market. iBM analytics enabled it to scan call detail records in near-real time, flagging customers who fit the profile for a particular promotion. today, by issuing offers customized to a user’s unique usage patterns, ufone has doubled its campaign response rates.
Smarter Cancer TreatmentMemorial Sloan-Kettering Cancer Center is working with iBM to use the cognitive computing capabilities found in iBM’s Watson to help doctors develop personalized, evidence-based cancer treatment options. the system uses insights gleaned from the deep experience of Memorial Sloan-Kettering’s world-renowned oncologists to provide individualized treatment options based on a patient’s medical information, the synthesis of a vast array of updated and vetted treatment guidelines, and published research. the result: a decision support system for physicians that will offer individualized, confidence-weighted treatment options for their patients.
in thousands of Smarter Planet client engagements, iBM is helping our clients seize
competitive advantage, not only through improved productivity but by reframing their
industry’s issues in unexpected, often counterintuitive ways.
Smarter Wind Energy vestas, the world’s largest windmill manufacturer, is tapping into the power of an iBM supercomputer and Big data analytics software to model past, present and future wind patterns—a process that involves huge amounts of data—to optimize the location and design of sites its customers are developing. vestas’s system is on track to digest and analyze 20 petabytes of information in hours instead of months. the result: fewer customer power disruptions and more predictable revenues for utilities.
Smarter Stock Exchangeto compete with exchanges in places like London and new York, the Santiago Stock exchange needed to handle the growing volume of high-frequency and algorithmic trading activity—and do so from the ground up. Working with iBM, it built a trade processing solution that increased capacity tenfold, cut latency to microseconds and enabled real-time fraud surveillance. the exchange’s transaction volume is up 50 percent in the first year.
8. The infusion of digital intelligence into the world’s systems is changing the way people, organizations and entire industries approach what they do.

Accelerated Discovery iBM researchers are unlocking data-
driven “white spaces,” such as finding new uses for drugs already
proven safe in the data of 15 million patents, 18 million scientific
papers, 10 million chemical compounds and 100 million genes.
Atomic-Scale Memory iBM researchers have extended the
frontiers of the unimaginably small by showing the possibility
of storing a “bit” of memory on just 12 atoms. Such a break through
holds the potential to increase storage capacity one thousandfold.
Quantum Computing iBM researchers have taken a step closer
to a practical quantum computer, based not only on digital “1s”
and “0s” but also on multiphased “qubits” that enable millions
of computations at once.
“Synapse” Chip iBM researchers are now developing cognitive
computer chips that learn without programming. Modeled on
the human brain, they have already simulated more than 500 billion
neurons and 100 trillion synapses.
For all its remarkable advances, computation in the past half-
century—the era of “programmable” computers—has been
limited to “yes/no” decisions. the new era now emerging
will unlock far deeper understanding of the complexities and
ambiguities of the real world—both natural and man-made.
doing so will require both steady incremental advances
and true scientific breakthroughs that come only from deep,
multidisciplinary research—such as that underway today
in iBM’s labs.
Massive-Scale Analytics for Cybersecurity iBM researchers
have found cyber criminals hiding in billions of log files by surfacing
small “tells” in the actions of attackers who elude even the most
advanced virus detection.
9. Looking ahead, IBM Research is probing the future of information technology.
“Generating higher value at iBM” includes selected references to certain non-GAAP financial measures that are made to facilitate a comparative view of the company’s ongoing operational performance. For information about the company’s financial results related to (i) operating pre-tax income, operating pre-tax income margin and operating earnings per share and (ii) free cash flow for 2012, see the company’s Forms 8-K dated on January 22, 2013 and February 28, 2013 (Attachment ii—non-GAAP Supplementary Materials). For information about the company’s financial results related to (i) growth markets share of geographic revenue excluding divested PCs and printers and (ii) free cash flow, in each case for 2000, see the company’s Form 8-K submitted to the SeC on May 12, 2010 (Attachment ii—non-GAAP Supplementary Materials).
15Generating Higher Value at IBM

1616 Financial Highlights International Business Machines Corporation and Subsidiary Companies
($ in millions except per share amounts)
For the year ended December 31: 2012 2011
Revenue $104,507 $106,916
Net income $ 16,604 $ 15,855
Operating (non-GAAP) earnings* $ 17,627 $ 16,318
Earnings per share of common stock
Assuming dilution $ 14.37 $ 13.06
Basic $ 14.53 $ 13.25
Diluted operating (non-GAAP)* $ 15.25 $ 13.44
Net cash provided by operating activities $ 19,586 $ 19,846
Capital expenditures, net 4,307 4,059
Share repurchases 11,995 15,046
Cash dividends paid on common stock 3,773 3,473
Per share of common stock 3.30 2.90
At December 31: 2012 2011
Cash, cash equivalents and marketable securities $ 11,128 $ 11,922
Total assets 119,213 116,433
Working capital 5,807 8,805
Total debt 33,269 31,320
Total equity 18,984 20,236
Common shares outstanding (in millions) 1,117 1,163
Market capitalization $214,032 $213,886
Stock price per common share $ 191.55 $ 183.88
Number of employees in IBM/wholly owned subsidiaries 434,246 433,362
* See page 38 for a reconciliation of net income to operating earnings.

17Report of Financials International Business Machines Corporation and Subsidiary Companies
Management DiscussionOverview 18Forward-Looking and Cautionary Statements 18Management Discussion Snapshot 19Description of Business 21Year in Review 26Prior Year in Review 44Other Information 55 Looking Forward 55 Liquidity and Capital Resources 56 Critical Accounting Estimates 59 Currency Rate Fluctuations 61 Market Risk 62 Financing Risks 62 Employees and Related Workforce 63Global Financing 63
Report of Management 68
Report of Independent Registered Public Accounting Firm 69
Consolidated Financial StatementsEarnings 70Comprehensive Income 71Financial Position 72Cash Flows 73Changes in Equity 74
Notes to Consolidated Financial Statements A Significant Accounting Policies 76 B Accounting Changes 86 C Acquisitions/Divestitures 87 D Financial Instruments 92 E Inventories 98 F Financing Receivables 99 G Property, Plant and Equipment 102 H Investments and Sundry Assets 102 I Intangible Assets Including Goodwill 102 J Borrowings 104 K Other Liabilities 106 L Equity Activity 107 M Contingencies and Commitments 110 N Taxes 113 O Research, Development and Engineering 115 P Earnings Per Share of Common Stock 116 Q Rental Expense and Lease Commitments 116 R Stock-Based Compensation 117 S Retirement-Related Benefits 120 T Segment Information 134 U Subsequent Events 138
Five-Year Comparison of Selected Financial Data 139
Selected Quarterly Data 140
Performance Graph 141
Board of Directors and Senior Leadership 142
Stockholder Information 143
1818 Management Discussion International Business Machines Corporation and Subsidiary Companies
OverviewThe financial section of the International Business Machines Cor por ation (IBM or the company) 2012 Annual Report includes the Management Discussion, the Consolidated Financial State ments and the Notes to the Consolidated Financial State ments. This Over view is designed to provide the reader with some perspective regarding the information contained in the financial section.
Organization of Information• The Management Discussion is designed to provide readers with
an overview of the business and a narrative on the company’s financial results and certain factors that may affect its future prospects from the perspective of the company’s management. The “Management Discussion Snap shot,” on pages 19 to 21, presents an overview of the key performance drivers in 2012.
• Beginningwiththe“YearinReview”onpage 26, the Manage ment Discussion contains the results of operations for each reportable segment of the business and a discussion of the company’s finan-cial position and cash flows. Other key sections within the Management Discussion include: “Looking Forward” on page 55, and “Liquidity and Capital Resources” on pages 56 through 58.
• GlobalFinancingisareportablesegmentthatismeasuredasastand-alone entity. A separate “Global Financing” section is included beginning on page 63.
• TheConsolidatedFinancialStatementsarepresentedonpages 70 through 75. These statements provide an overview of the company’s income and cash flow performance and its financial position.
• The Notes follow the Consolidated Financial Statements. Among other items, the Notes contain the company’s accounting policies (pages 76 to 86), acquisitions and divestitures (pages 87 through 91), detailed information on specific items within the financial statements, certain contingencies and commitments (pages 110 to 113) and retirement-related benefits information (pages 120 to 134).
• The Consolidated Financial Statements and the Notes have been prepared in accordance with accounting principles generally accepted in the United States (GAAP).
• The references to “adjusted for currency” or “at constant cur-rency” in the Management Discussion do not include operational impacts that could result from fluctuations in foreign currency rates. Certain financial results are adjusted based on a simple mathematical model that translates current period results in local currency using the comparable prior year period’s currency con-version rate. This approach is used for countries where the functional currency is the local country currency. This informa-tion is provided so that certain financial results can be viewed without the impact of fluctuations in foreign currency rates, thereby facilitating period-to-period comparisons of business performance. See “Currency Rate Fluctuations” on page 61 for additional information.
• Within the financial statements and tables in this Annual Report, certain columns and rows may not add due to the use of rounded numbers for disclosure purposes. Percentages reported are calculated from the underlying whole-dollar numbers.
Operating (non-GAAP) EarningsIn an effort to provide better transparency into the operational results of the business, the company separates business results into oper-ating and non-operating categories. Operating earnings is a non-GAAP measure that excludes the effects of certain acquisition-related charges and retirement-related costs, and their related tax impacts. For acquisitions, operating earnings exclude the amortiza-tion of purchased intangible assets and acquisition-related charges such as in-process research and development, transac-tion costs, applicable restructuring and related expenses and tax charges related to acquisition integration. For retirement-related costs, the company characterizes certain items as operating and others as non-operating. The company includes defined benefit plan and nonpension postretirement benefit plan service cost, amortiza-tion of prior service cost and the cost of defined contribution plans in operating earnings. Non-operating retirement-related cost includes defined benefit plan and nonpension postretirement benefit plan interest cost, expected return on plan assets, amortized actuarial gains/losses, the impacts of any plan curtailments/settlements and multi-employer plan costs, pension insolvency costs and other costs. Non-operating costs are primarily related to changes in pen-sion plan assets and liabilities which are tied to financial market performance and the company considers these costs to be outside the operational performance of the business. Overall, the company believes that providing investors with a view of operating earnings as described above provides increased trans-parency and clarity into both the operational results of the business and the performance of the company’s pension plans; improves visibility to management decisions and their impacts on operational performance; enables better comparison to peer companies; and allows the company to provide a long-term strategic view of the business going forward. For its 2015 earnings per share road map, the company is utilizing an operating view to establish its objectives and track its progress. The company’s reportable segment financial results reflect operating earnings, consistent with the company’s management and measurement system.
Forward-Looking and Cautionary StatementsCertain statements contained in this Annual Report may constitute forward-looking statements within the meaning of the Private Secur ities Litigation Reform Act of 1995. Any forward-looking state-ment in this Annual Report speaks only as of the date on which it is made; the company assumes no obligation to update or revise any such statements. Forward-looking statements are based on the company’s current assumptions regarding future business and financial performance; these statements, by their nature, address matters that are uncertain to different degrees. Forward-looking statements involve a number of risks, uncertainties and other factors that could cause actual results to be materially different, as discussed more fully elsewhere in this Annual Report and in the company’s filings with the Securities and Exchange Commission (SEC), includ-ing the company’s 2012 Form 10-K filed on February 26, 2013.
19Management Discussion International Business Machines Corporation and Subsidiary Companies
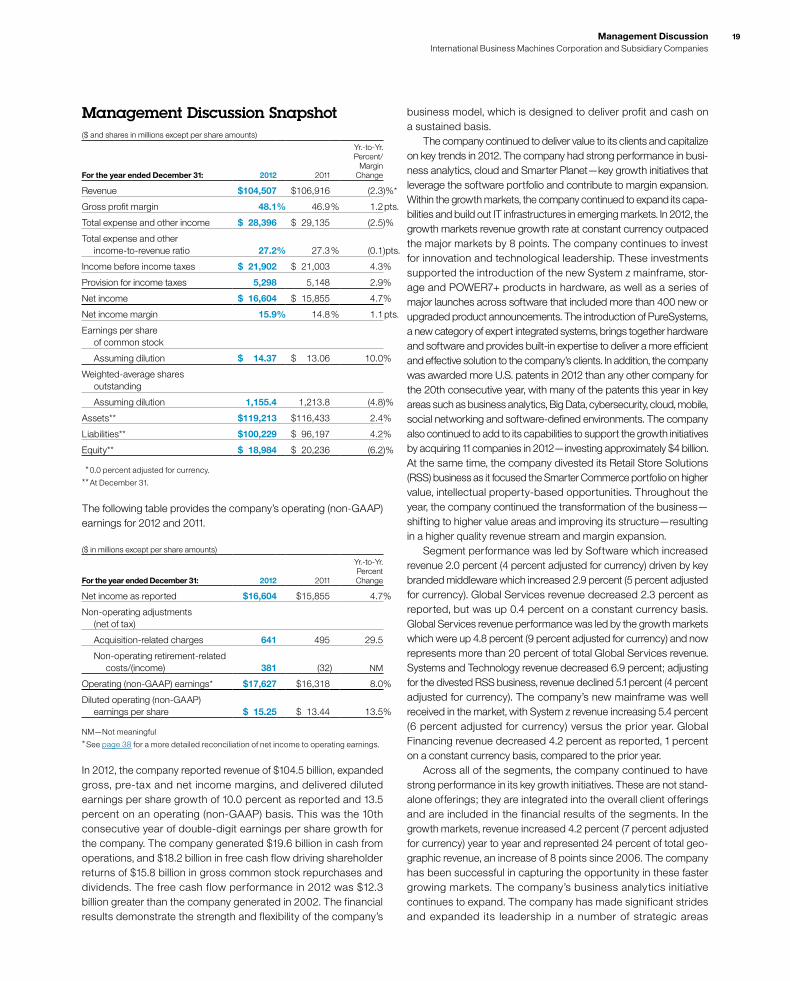
Management Discussion Snapshot($ and shares in millions except per share amounts)
For the year ended December 31: 2012 2011
Yr.-to-Yr. Percent/
Margin Change
Revenue $104,507 $106,916 (2.3)%*
Gross profit margin 48.1% 46.9% 1.2 pts.
Total expense and other income $ 28,396 $ 29,135 (2.5)%
Total expense and other income-to-revenue ratio 27.2% 27.3% (0.1)pts.
Income before income taxes $ 21,902 $ 21,003 4.3%
Provision for income taxes 5,298 5,148 2.9%
Net income $ 16,604 $ 15,855 4.7%
Net income margin 15.9% 14.8% 1.1 pts.
Earnings per share of common stock
Assuming dilution $ 14.37 $ 13.06 10.0%
Weighted-average shares outstanding
Assuming dilution 1,155.4 1,213.8 (4.8)%
Assets** $119,213 $116,433 2.4%
Liabilities** $100,229 $ 96,197 4.2%
Equity** $ 18,984 $ 20,236 (6.2)%
* 0.0 percent adjusted for currency.
** At December 31.
The following table provides the company’s operating (non-GAAP) earnings for 2012 and 2011.
($ in millions except per share amounts)
For the year ended December 31: 2012 2011
Yr.-to-Yr. Percent Change
Net income as reported $16,604 $15,855 4.7%
Non-operating adjustments (net of tax)
Acquisition-related charges 641 495 29.5
Non-operating retirement-related costs/(income) 381 (32) NM
Operating (non-GAAP) earnings* $17,627 $16,318 8.0%
Diluted operating (non-GAAP) earnings per share $ 15.25 $ 13.44 13.5%
NM—Not meaningful
* See page 38 for a more detailed reconciliation of net income to operating earnings.
In 2012, the company reported revenue of $104.5 billion, expanded gross, pre-tax and net income margins, and delivered diluted earnings per share growth of 10.0 percent as reported and 13.5 percent on an operating (non-GAAP) basis. This was the 10th consecutive year of double-digit earnings per share growth for the company. The company generated $19.6 billion in cash from operations, and $18.2 billion in free cash flow driving shareholder returns of $15.8 billion in gross common stock repurchases and dividends. The free cash flow performance in 2012 was $12.3 billion greater than the company generated in 2002. The financial results demonstrate the strength and flexibility of the company’s
business model, which is designed to deliver profit and cash on a sustained basis. The company continued to deliver value to its clients and capitalize on key trends in 2012. The company had strong performance in busi-ness analytics, cloud and Smarter Planet—key growth initiatives that leverage the software portfolio and contribute to margin expansion. Within the growth markets, the company continued to expand its capa-bilities and build out IT infrastructures in emerging markets. In 2012, the growth markets revenue growth rate at constant currency outpaced the major markets by 8 points. The company continues to invest for innovation and technological leadership. These investments supported the introduction of the new System z mainframe, stor-age and POWER7+ products in hardware, as well as a series of major launches across software that included more than 400 new or upgraded product announcements. The introduction of PureSystems, a new category of expert integrated systems, brings together hardware and software and provides built-in expertise to deliver a more efficient and effective solution to the company’s clients. In addition, the company was awarded more U.S. patents in 2012 than any other company for the 20th consecutive year, with many of the patents this year in key areas such as business analytics, Big Data, cybersecurity, cloud, mobile, social networking and software-defined environments. The company also continued to add to its capabilities to support the growth initiatives by acquiring 11 companies in 2012—investing approximately $4 billion. At the same time, the company divested its Retail Store Solutions (RSS) business as it focused the Smarter Commerce portfolio on higher value, intellectual property-based opportunities. Throughout the year, the company continued the transformation of the business—shifting to higher value areas and improving its structure—resulting in a higher quality revenue stream and margin expansion. Segment performance was led by Software which increased revenue 2.0 percent (4 percent adjusted for currency) driven by key branded middleware which increased 2.9 percent (5 percent adjusted for currency). Global Services revenue decreased 2.3 percent as reported, but was up 0.4 percent on a constant currency basis. Global Services revenue performance was led by the growth markets which were up 4.8 percent (9 percent adjusted for currency) and now represents more than 20 percent of total Global Services revenue. Systems and Technology revenue decreased 6.9 percent; adjusting for the divested RSS business, revenue declined 5.1 percent (4 percent adjusted for currency). The company’s new mainframe was well received in the market, with System z revenue increasing 5.4 percent (6 percent adjusted for currency) versus the prior year. Global Financing revenue decreased 4.2 percent as reported, 1 percent on a constant currency basis, compared to the prior year. Across all of the segments, the company continued to have strong performance in its key growth initiatives. These are not stand-alone offerings; they are integrated into the overall client offerings and are included in the financial results of the segments. In the growth markets, revenue increased 4.2 percent (7 percent adjusted for currency) year to year and represented 24 percent of total geo-graphic revenue, an increase of 8 points since 2006. The company has been successful in capturing the opportunity in these faster growing markets. The company’s business analytics initiative continues to expand. The company has made significant strides and expanded its leadership in a number of strategic areas
2020 Management Discussion International Business Machines Corporation and Subsidiary Companies
including Risk Management, Price and Promotion Optimization and Sales Performance Management. The value proposition in busi-ness analytics uniquely leverages the integration between the software portfolio and the Global Business Services (GBS) con-sulting expertise. In 2012, business analytics revenue increased 13 percent compared to the prior year, led by the GBS consulting prac-tice. Within cloud computing, the company’s SmartCloud portfolio addresses the full scope of enterprise client requirements. In 2012, the company continued to see strong demand for the foundational offerings in hardware and software that help clients build and run their private clouds, as well as for cloud-based solutions, like the company’s Software as a Service (SaaS) offerings. With strong global growth, cloud revenue for 2012 increased 80 percent com-pared to the prior year. The Smarter Planet growth initiative expanded significantly in the past year—measured in terms of offerings, mar-kets, clients and revenue performance. Clients are leveraging the company’s growing capabilities in areas like: Smarter Commerce, Social Business and Smarter Cities, and in next generation systems, like Watson, which are helping clients with their complex challenges. For the year, Smarter Planet solutions generated revenue growth of over 25 percent versus the prior year. Overall, within the offerings in business analytics, cloud and Smarter Planet, approximately half of the revenue is software. Therefore, as these offerings become a larger percentage of total revenue, they are driving the higher quality revenue stream and improved mix and margins. The consolidated gross profit margin increased 1.2 points versus 2011 to 48.1 percent. This was the ninth consecutive year of improvement in the gross profit margin. The operating (non-GAAP) gross margin of 48.7 percent increased 1.5 points compared to the prior year. The increase in gross margin in 2012 was driven by margin improvements in Software and both Global Services segments, and an improved revenue mix driven by Software. Total expense and other income decreased 2.5 percent in 2012 versus the prior year. Total operating (non-GAAP) expense and other income decreased 3.9 percent compared to the prior year. The year-to-year drivers were approximately:
Total Operating Consolidated (non-GAAP)
• Currency* (5) points (5) points• Acquisitions** 3 points 2 points• Base expense (0) points (2) points
* Reflects impacts of translation and hedging programs.
** Includes acquisitions completed in prior 12-month period.
Pre-tax income grew 4.3 percent and the pre-tax margin was 21.0 percent, an increase of 1.3 points versus 2011. Net income increased 4.7 percent and the net income margin was 15.9 percent, an increase of 1.1 points versus 2011. The effective tax rate for 2012 was 24.2 percent compared with 24.5 percent in the prior year. Operating (non-GAAP) pre-tax income grew 7.3 percent and the operating (non-GAAP) pre-tax margin was 22.2 percent, an increase of 2.0 points versus the prior year. Operating (non-GAAP) net income increased 8.0 percent and the operating (non-GAAP) net income margin of 16.9 percent increased 1.6 points versus the prior year.
The operating (non-GAAP) effective tax rate was 24.0 percent versus 24.5 percent in 2011. Diluted earnings per share improved 10.0 percent year to year reflecting the growth in net income and the benefits of the common stock repurchase program. In 2012, the company repurchased approximately 61 million shares of its common stock. Diluted earn-ings per share of $14.37 increased $1.31 from the prior year. Operating (non-GAAP) diluted earnings per share of $15.25 increased $1.81 versus 2011 driven by the following factors:
• Revenue decrease at actual rates $ (0.30)• Margin expansion $ 1.38• Common stock repurchases $ 0.73
At December 31, 2012, the company’s balance sheet and liquidity positions remained strong and were well positioned to support the company’s objectives. Cash and marketable securities at year end was $11,128 million. Key drivers in the balance sheet and total cash flows are highlighted below. Total assets increased $2,780 million ($3,242 million adjusted for currency) from December 31, 2011 driven by:
• Increases in total receivables ($3,053 million), goodwill ($3,034 million), marketable securities ($717 million) and intangible assets ($395 million), partially offset by
• Decreases in prepaid pension assets ($1,899 million), cash and cash equivalents ($1,511 million) and prepaid expenses and other current assets ($1,224 million).
Total liabilities increased $4,032 million ($4,511 million adjusted for currency) from December 31, 2011 driven by:
• Increased retirement and nonpension postretirement benefit obligations ($2,044 million), total debt ($1,949 million), taxes ($1,635 million) and total deferred income ($399 million), partially offset by
• Decreases in other liabilities ($1,389 million) and accounts payable ($565 million).
Total equity of $18,984 million decreased $1,252 million from December 31, 2011 as a result of:
• Increased treasury stock ($12,168 million) driven by share repur-chases and increased losses in accumulated other comprehensive income/(loss) of ($3,874 million) driven by pension remeasurements, partially offset by
• Higher retained earnings ($12,783 million) and common stock ($1,980 million).
The company generated $19,586 million in cash flow provided by operating activities, a decrease of $260 million when compared to 2011, primarily driven by a decrease in cash due to receivables ($1,290 million) and an increased use of cash for accounts payable ($675 million), partially offset by a decrease in net taxes paid ($999 million) and the increase in net income ($749 million). Net cash used in investing activities of $9,004 million was $4,608 million higher than 2011, primarily due to an increase in cash used of $2,719 million associated with net purchases and sales of marketable securities
21Management Discussion International Business Machines Corporation and Subsidiary Companies
and other investments, increased cash used for acquisitions ($1,911 million) and increased net capital investments ($248 million), partially offset by increased cash from divestitures ($585 million). Net cash used in financing activities of $11,976 million was $1,719 million lower, compared to 2011, primarily due to lower cash used for common stock repurchases ($3,051 million), partially offset by lower cash provided by common stock transactions ($914 million) and increased dividend payments ($300 million). In January 2013, the company disclosed that it is expecting GAAP earnings of at least $15.53 and operating (non-GAAP) earn-ings of at least $16.70 per diluted share for the full year 2013. For additional information and details, see the “Year in Review” section on pages 26 through 43. For additional information regard-ing 2002 free cash flow, see the company’s Form 8-K filed with the SEC on January 22, 2013.
Description of BusinessPlease refer to IBM’s Annual Report on Form 10-K filed with the SEC on February 26, 2013 for a more detailed version of this Des cription of Business, especially Item 1A. entitled “Risk Factors.” The company creates business value for clients and solves business problems through integrated solutions that leverage information technology and deep knowledge of business processes. IBM solutions typically create value by reducing a client’s operational costs or by enabling new capabilities that generate revenue. These solutions draw from an industry-leading portfolio of consulting, delivery and implementation services, enterprise software, systems and financing.
StrategyDespite the volatility of the information technology (IT) industry over the past decade, IBM has consistently delivered strong perfor-mance, with a steady track record of sustained earnings per share growth and cash generation. The company has shifted its business mix, exiting certain segments while increasing its presence in higher-value areas such as services, software and integrated solutions. As part of this shift, the company has acquired more than 140 companies since 2000, complementing and scaling its portfolio of products and offerings. IBM’s strategy of delivering high value solutions to enterprise clients has yielded consistent business results. Working with enter-prise clients across the full spectrum of their business and technical opportunities, IBM delivers leadership innovation in tech-nology, high value solutions and insights that improve client and industry outcomes. A highly engaged, global workforce with deep technical and business skills, teamed with an unmatched eco-system of partners provides a world-class client experience. These priorities reflect a broad shift in client spending toward innovation and efficiency, as companies seek higher levels of busi-ness value from their IT investments. IBM has been able to deliver this enhanced client value thanks to its industry expertise, under-standing of clients’ businesses, sustained investment in core and applied research and development (R&D), global reach and the breadth and depth of the company’s capabilities.
New types of solutions, new market opportunities and new deci-sion makers are emerging as clients look to make use of technology to generate innovation and competitive advantage. These opportuni-ties are driven by a new era of computing that is enabled by analytics, cloud computing, Big Data, mobility, social computing and supported by enterprise grade security solutions. The com-pany’s strategy is to establish leadership in this new era of smarter computing—computing that is designed for Big Data, built on soft-ware-defined environments and open—in order to enhance the value we deliver, create new markets and engage new clients. To capture the opportunities arising from these market trends, IBM is focused on four key growth initiatives: Smarter Planet, Growth Markets, Business Analytics and Optimization and Cloud Comput-ing. Each initiative represents a significant growth opportunity with attractive profit margins for IBM.
Smarter PlanetSmarter Planet is IBM’s vision of a technology-enabled world that is more instrumented, interconnected and intelligent than ever before, enabling people and organizations to tackle significant busi-ness and societal challenges. At the heart of this vision is the opportunity for meaningful innovation—exploring and extending the boundaries of businesses, industries and communities. It’s about helping the company’s clients become better at what they do for their clients. IBM’s strategy is to accelerate progress toward a “smarter planet” by equipping clients with the advanced, integrated capabilities they need to thrive in this exciting new world that is unfolding before us—capabilities such as analytics for business and physical systems, business process management, social business, mobile computing and cloud computing. IBM has continued to deepen its commitment to understanding and delivering on the promise of Smarter Planet for both line of business and IT executives across a broad range of industries. An industry-based approach is central to the strategy, since every industry confronts a distinct set of challenges and opportunities in today’s constantly transforming world. Whether “smarter” means helping a hospital group to deliver improved healthcare, a local gov-ernment to ease traffic congestion, or a retail chain to execute a successful cross-channel campaign, IBM is aggressively developing and investing in a portfolio of industry solutions that helps these clients achieve their goals. Three initiatives that drive significant value illustrate IBM’s deep commitment to building a smarter planet: Smarter Commerce, Smarter Cities and Social Business. IBM’s Smarter Commerce model integrates and transforms how companies manage and adapt their buy, market, sell and service processes, placing the customer squarely at the center of their business. IBM’s Smarter Cities initiative enables federal, state and local governments to make smarter deci-sions, anticipate issues and coordinate resources more effectively, while delivering citizen-centric services that underpin sustainable economic growth. IBM’s Social Business initiative helps clients inte-grate social technologies and practices into their front-end processes to more effectively create and share knowledge to accelerate innova-tion, improve customer service, and build a smarter workforce. Each of these initiatives is powered by market-leading IBM innovations and software, developed both by IBM and through acquisitions.

2222 Management Discussion International Business Machines Corporation and Subsidiary Companies
Growth MarketsThe company has benefited from its investments over the past sev-eral years in the growth markets. The focus now is on geographic expansion of IBM’s presence; on selected industries of the highest impact and opportunity; on countries’ build-outs of infrastructure aligned with their national agendas; and, on creating markets and new business models to serve the different requirements that exist in these emerging countries. The company’s effort in developing new growth markets within the African continent is a good example of this focus. Many of these initiatives are leading-edge, both in tech-nologies and business models, and are delivering both increased revenue and margin expansion. In order to support this growth, IBM continues to invest signifi-cantly in these markets to expand capacity, to develop talent and to deepen its R&D capabilities on the ground. At the same time, IBM continues to leverage talent across the growth markets under its globally integrated enterprise model to the benefit of both its clients and the company worldwide.
Business Analytics and OptimizationBusiness Analytics and Optimization (BAO) is the category of soft-ware, systems and services that help organizations take advantage of all the data available to them for better and faster decision making and process optimization. This includes data that is being labeled “Big Data,” which is data of extreme volume, data being generated at a high velocity, and newer varieties of data like blogs, tweets, pictures, videos, unstructured text created by the explosion of social media websites and the instrumentation of nearly everything. BAO is core to achieving a smarter planet, helping leaders of this new information-centric and insight-driven world infuse intelligence into their business processes. Smarter Analytics is IBM’s unique offering for the BAO category. With Smarter Analytics and the company’s deep expertise, IBM can help organizations: 1) grow, retain and satisfy customers through deep insight on individual customers and similar segments; 2) increase operational efficiency through, for example, supply chain optimization, predictive maintenance, fraud reduction and optimization of sales incentives and compensation; 3) transform their financial processes such as planning, budgeting, forecasting, financial consolidation, regulatory filing and financial reporting; and 4) better manage risk and regulatory compliance. The company’s approach to analytics is to ensure clients have complete end-to-end solutions across industries and functional focus areas like finance, sales, marketing, operations and risk. These solutions are designed to help organizations: 1) align around all their data—both traditional and big data—and establish a strong informa-tion foundation; 2) apply analytics to their data so they can anticipate and shape business outcomes, identify patterns and gain insights into future performance; 3) enable workers on the front lines who collectively make thousands and even millions of decisions daily with insight that is immediately actionable so they can make the best possible decision—decisions like what claims to fast track in an insurance call center, or what offer is the best for each individual customer who calls a call center; and 4) create a culture that takes action on analytics and that truly transforms.
IBM is committed to continually innovating across the spectrum of analytic capabilities, systems, research, services, deployment and skills. For example, in 2012, the game changing innovations in Watson were applied to Healthcare and Financial Services, analytic research like the ground-breaking work being done on temporal causal modeling and visualization, and investments in analytic skills and deployment ability in our new Analytics research centers in Columbus, Ohio and Halifax, Nova Scotia.
Cloud ComputingCloud is a model for consuming and delivering business and IT services. It can deliver significant economies, enable new levels of speed, flexibility and agility and even serve as a transformative plat-form for business innovation. From a business perspective, cloud computing is reshaping industry ecosystems, invigorating product innovation and enabling new business models that leverage new sources of competitive differentiation. From an IT perspective, cloud offers improved access to and utilization of information technology through use of highly efficient virtualization and management tech-nology, consumer-style user interfaces and ubiquitous connectivity, including via mobile technologies. IBM has already helped thousands of its clients adopt and lever-age cloud computing through its broad portfolio of IBM SmartCloud products, solutions and services. Organizations moving beyond initial exploration of cloud computing seek solutions that align with their specific needs. IBM’s breadth of cloud capabilities gives it a unique ability to help clients exploit the advantages of cloud. IBM has cloud solutions that span infrastructure, platform, applications and busi-ness process services all geared to enable clients to drive significant business value through the rapid adoption and exploitation of new cloud capabilities. IBM’s expert consulting, breakthrough technolo-gies and a portfolio of cloud-based services are squarely focused on the requirements of the enterprise. The company offers a full array of cloud delivery models, includ-ing private clouds, public clouds and a hybrid of both. IBM helps build out private, on-premises cloud-based environments that pro-vide the control, security and isolation that clients require for their most mission-critical workloads. IBM public clouds provide infra-structure, platforms and applications as rapidly provisioned and highly-scalable cloud services on a pay-as-you-go basis. Hybrid clouds provide seamless integration across private and public cloud models, ensuring the interoperability, portability and scalability that clients need to realize the full value of cloud.
Business ModelThe company’s business model is built to support two principal goals: helping clients to become more innovative, efficient and com-petitive through the application of business insight and IT solutions; and providing long-term value to shareholders. The business model has been developed over time through strategic investments in capabilities and technologies that have superior long-term growth and profitability prospects based on the value they deliver to clients. The company’s global capabilities include services, software, systems, fundamental research and related financing. The broad mix of businesses and capabilities are combined to provide inte-grated solutions to the company’s clients.
23Management Discussion International Business Machines Corporation and Subsidiary Companies
The business model is resilient, adapting to the continuously changing market and economic environment. The company con-tinues to divest certain businesses and strengthen its position through strategic organic investments and acquisitions in higher-value segments like business analytics, Smarter Planet and cloud computing. In addition, the company has transformed itself into a globally integrated enterprise which has improved overall productivity and is driving investment and expanding participation in the world’s fastest growing markets. This business model, supported by the company’s financial model, has enabled the company to deliver strong earnings, cash flows and returns to shareholders over the long term.
Business Segments and CapabilitiesThe company’s major operations consists of five business seg-ments: Global Tech nology Services and Global Business Services, which the company collectively calls Global Services, Soft ware, Systems and Technology and Global Finan cing.
Global Services is a critical component of the company’s strategy of providing IT infrastructure and business insight and solutions to clients. While solutions often include industry-leading IBM software and systems, other suppliers’ products are also used if a client solu-tion requires it. Approximately 60 percent of external Global Services segment revenue is annuity based, coming primarily from outsourcing and maintenance arrangements. The Global Services backlog provides a solid revenue base entering each year. Within Global Services, there are two reportable segments: Global Tech nology Services and Global Business Services.
Global Technology Services (GTS) primarily provides IT infra-structure and business process services, creating business value for clients through unique technology and IP integrated services within its global delivery model. By leveraging insights and experience drawn from IBM’s global scale, skills and technology, with applied innova-tion from IBM Research, clients gain access to leading-edge, high-quality services with improved productivity, flexibility, cost and outcomes.
GTS CapabilitiesStrategic Outsourcing Services: delivers comprehensive IT out-sourcing services dedicated to transforming clients’ existing infrastructures to consistently deliver improved quality, flexibility, risk management and financial value. The company integrates long-standing expertise in service management and technology with the ability to exploit the power of new technologies from IBM systems and software, such as cloud computing, analytics and virtualization, to deliver high performance, innovation and improved ability to achieve business objectives.
Global Process Services: delivers a range of offerings consisting of standardized through transformational solutions including process-ing platforms and business process outsourcing. These services deliver improved business results to clients through the strategic change and/or operation of the client’s business processes, applica-tions and infrastructure.
Integrated Technology Services: delivers a portfolio of project-based and managed services that enable clients to transform and
optimize their IT environments by driving efficiency, flexibility and productivity, while reducing costs. The standardized portfolio is built around key assets and patented software, and incorporates best practices and proven methodologies that ensure predictive quality of delivery, security and compliance.
Technology Support Services: delivers a complete line of support services from product maintenance through solution support to maintain and improve the availability of clients’ IT infrastructures.
Global Business Services (GBS) has the mission to deliver pre-dictable business outcomes to the company’s clients across two primary business areas: Consulting and Application Management Services. These professional services deliver business value and innovation to clients through solutions which leverage industry and business process expertise. The role of GBS is to drive initiatives that integrate IBM content and solutions and drive the progress of the company’s four primary growth initiatives. As clients transform themselves in response to market trends like Big Data, social and mobile computing, GBS is aligning its exper-tise and capabilities to address two interdependent categories of opportunity: Front Office Digitization, which describes the markets forming around new models of engagement with all audiences; and the Globally Integrated Enterprise, which describes the mandate to integrate data and processes in support of the new front-office pro-grams, and build far more flexible information applications.
GBS CapabilitiesConsulting: delivering client value with solutions in Strategy and Transformation; Application Innovation Services; Enterprise Applica-tions and Smarter Analytics. Consulting is also focused on bringing to market client solutions that drive Front Office Digitization in Smarter Commerce, Cloud, Mobile and Social Business.
Application Management Services: application management, main-tenance and support services for packaged software, as well as custom and legacy applications. Value is delivered through advanced capabilities in areas such as application testing and modernization, cloud application services, the company’s highly differentiated glob-ally integrated capability model, industry knowledge and the standardization and automation of application management.
Software consists primarily of middleware and operating systems software. Middleware software enables clients to integrate systems, processes and applications across a standard software platform to improve their business results, solve critical problems and gain com-petitive advantage within their industries. IBM middleware is designed on open standards, making it easier to integrate disparate business applications, developed by different methods and imple-mented at different times. Operating systems are the software engines that run computers. Approximately two-thirds of external Software segment revenue is annuity based, coming from recurring license charges and ongoing post-contract support. The remaining one-third relates to one-time charge (OTC) arrangements in which clients pay one, up-front payment for a perpetual license. Typically, the sale of OTC software includes one year of post-contract sup-port. Clients can also purchase ongoing post-contract support after the first year, which includes unspecified product upgrades and technical support.

2424 Management Discussion International Business Machines Corporation and Subsidiary Companies
Software CapabilitiesWebSphere Software: delivers capabilities that enable organizations to run high-performance business applications. With these applica-tions, clients can integrate and manage business processes across their organizations with the flexibility and agility they need to respond to changing conditions. Built on services-oriented architecture (SOA), and open standards support for cloud, mobile and social interactions, the WebSphere platform enables enterprises to extend their reach and optimize interactions with their key constituents. Smarter Commerce software helps companies better manage and improve each step of their value chain and capitalize on opportunities for profitable growth, efficiency and increased customer loyalty.
Information Management Software: enables clients to integrate, manage and analyze enormous amounts of data from a large variety of sources in order to gain competitive advantage and improve their business outcomes. With this approach, clients can extract real value out of their data and use it to make better business decisions. IBM’s middleware and integrated solutions include advanced database management, information integration, data governance, enterprise content management, data warehousing, business analytics and intel-ligence, predictive analytics and big data analytics.
Tivoli Software: helps clients optimize the value they get from their infrastructures and technology assets through greater visibility, control and automation across their end-to-end business opera-tions. These asset management solutions foster integrated service delivery for cloud and datacenter management, enterprise endpoint and mobile device management, asset and facilities management, and storage management. Tivoli includes security systems software that provides clients with a single security intelligence platform that enables them to better secure all aspects of their enterprise and prevent security breaches.
Lotus Software: enables businesses to connect people and pro-cesses for more effective communication and increased productivity through collaboration, messaging and social networking software. By remaining at the forefront of collaboration tools, IBM’s social business offerings help organizations reap real benefits associated with social networking, as well as create a more efficient and effective workforce.
Rational Software: supports software development for both IT, as well as complex and embedded system solutions, with a suite of Collaborative Lifecycle Management products. Jazz, Rational’s tech-nology platform, transforms the way people work together to build software, making software delivery more integrated and collabora-tive, while optimizing for successful business outcomes.
Operating Systems: software that manages the fundamental processes that make computers run.
Systems and Technology (STG) provides clients with business solutions requiring advanced computing power and storage capa-bilities. Approximately half of Systems and Technology’s server and storage sales transactions are through the company’s business partners; with the balance direct to end-user clients. In addition, Systems and Technology provides leading semiconductor technology, products and pack aging solutions for IBM’s own advanced technol-ogy needs and for external clients.
Systems and Technology CapabilitiesSystems: a range of general purpose and integrated systems designed and optimized for specific business, public and scientific computing needs. These systems—System z, Power Systems and System x—are typically the core technology in data centers that provide required infrastructure for business and institutions. Also, these systems form the foundation for IBM’s integrated offerings, such as IBM PureSystems, IBM Smart Analytics, IBM Netezza, IBM SmartCloud Entry and IBM BladeCenter for Cloud. IBM serv-ers use both IBM and non-IBM microprocessor technology and operating systems. All IBM servers run Linux, a key open-source operating system.
Storage: data storage products and solutions that allow clients to retain and manage rapidly growing, complex volumes of digital infor-mation. These solutions address critical client requirements for information retention and archiving, security, compliance and stor-age optimization including data deduplication, availability and virtualization. The portfolio consists of a broad range of disk and tape storage systems and software.
Microelectronics: semiconductor design and manufacturing primarily for use in IBM systems and storage products as well as delivering semiconductors and related services to external clients.
Global Financing facilitates clients’ acquisition of IBM systems, software and services. Global Financing invests in financing assets, leverages with debt and manages the associated risks with the objective of generating consistently strong returns on equity. The primary focus on the company’s offerings and clients mitigates many of the risks normally associated with a financing company. Global Financing has the benefit of both a deep knowledge of its client base and a clear insight into the products and services that are being financed. This combination allows Global Financing to effectively manage two of the major risks (credit and residual value) that are normally associated with financing.
Global Financing CapabilitiesClient Financing: lease and loan financing to end users and internal clients for terms generally between one and seven years. Internal financing is predominantly in support of Global Services’ long-term client service contracts. Global Financing also factors a selected portion of the company’s accounts receivable, primarily for cash management purposes. All internal financing arrangements are at arm’s-length rates and are based upon market conditions.
Commercial Financing: short-term inventory and accounts receiv-able financing to dealers and remarketers of IT products.
Remanufacturing and Remarketing: as equipment is returned at the conclusion of a lease transaction, these assets are refurbished and sold or leased to new or existing clients both externally and internally. Exter nally remarketed equipment revenue represents sales or leases to clients and resellers. Internally remarketed equip-ment revenue primarily represents used equipment that is sold internally to Systems and Technology and Global Services. Systems and Technology may also sell the equipment that it purchases from Global Financing to external clients.
25Management Discussion International Business Machines Corporation and Subsidiary Companies
IBM Worldwide OrganizationsThe following worldwide organizations play key roles in IBM’s delivery of value to its clients:
• Sales and Distribution• Research, Development and Intellectual Property• Enterprise Transformation• Integrated Supply Chain
Sales and DistributionIBM has a significant global presence, operating in more than 170 countries, with an increasingly broad-based geographic distribu-tion of revenue. The company’s Sales and Distribution organization manages a strong global footprint, with dedicated country-based operating units focused on delivering client value. Within these units, client relationship professionals work with integrated teams of con-sultants, product specialists and delivery fulfillment teams to improve clients’ business performance. These teams deliver value by under-standing the clients’ businesses and needs, and then bring together capabilities from across IBM and an extensive network of Business Partners to develop and implement solutions. By combining global expertise with local experience, IBM’s geographic structure enables dedicated management focus for local clients, speed in addressing new market opportunities and timely investments in emerging opportunities. The geographic units align industry-skilled resources to serve clients’ agendas. IBM extends capabilities to mid-market client segments by lever-aging industry skills with marketing, Inside Sales and local Business Partner resources. Through its growth markets organization, the company continues to increase its focus on the emerging markets around the world that have market growth rates greater than the global average—countries within Southeast Asia, Eastern Europe, the Middle East and Latin America. The company’s major markets include the G7 countries of Canada, France, Germany, Italy, Japan, the United States (U.S.) and the United Kingdom (UK) plus Austria, the Bahamas, Belgium, the Caribbean region, Cyprus, Denmark, Finland, Greece, Iceland, Ireland, Israel, Malta, the Netherlands, Norway, Portugal, Spain, Sweden and Switzerland. The majority of IBM’s revenue, excluding the company’s original equipment manufacturer (OEM) technology business, occurs in industries that are broadly grouped into six sectors:
• Financial Services: Banking, Financial Markets, Insurance• Public: Education, Government, Healthcare, Life Sciences• Industrial: Aerospace and Defense, Automotive,
Chemical and Petroleum, Electronics• Distribution: Consumer Products, Retail,
Travel and Trans portation• Communications: Telecommunications,
Media and Entertain ment, Energy and Utilities• General Business: Cross-sector representation of intermediate-
sized large enterprises as well as mid-market clients (less than 1,000 employees)
Research, Development and Intellectual PropertyIBM’s R&D operations differentiate the company from its competitors. IBM annually invests over $6 billion for R&D, focusing on high-growth, high-value opportunities. IBM Research works with clients and the company’s business units through 12 global labs on near-term and mid-term innovations. It contributes many new technologies to IBM’s portfolio every year and helps clients address their most difficult challenges. IBM Research also explores the boundaries of science and technol-ogy—from nanotechnology, to future systems, to big data analytics, to secure clouds, to IBM Watson, a “cognitive” learning system that applied advanced analytics to defeat the all-time champions on the television quiz show, Jeopardy!. The Watson system is being intro-duced to the market for advanced healthcare applications and is being further developed and extended within healthcare and in other industries. IBM Research also focuses on differentiating IBM’s services businesses providing new capabilities and solutions. It has the world’s largest mathematics department of any public company, enabling IBM to create unique analytic solutions and actively engage with clients on their toughest challenges. In 2012, IBM was awarded more U.S. patents than any other company for the 20th consecutive year. IBM’s 6,478 patents in 2012 included inventions that will enable fundamental advancements in analytics, big data, cybersecurity, cloud, mobile, social networking and software defined environments, as well as industry solutions for retail, banking, healthcare and transportation. It was the most U.S. patents ever awarded to one company in a single year. The company continues to actively seek intellectual property protection for its innovations, while increasing emphasis on other initiatives designed to leverage its intellectual property leadership. Some of IBM’s technological breakthroughs are used exclusively in IBM products, while others are licensed and may be used in either/both IBM products and/or the products of the licensee. While the company’s various proprietary intellectual property rights are important to its success, IBM believes its business as a whole is not materially dependent on any particular patent or license, or any particular group of patents or licenses. IBM owns or is licensed under a number of patents, which vary in duration, relating to its products.
Enterprise TransformationA key element of the company’s strategy has been focused on becoming the premier globally integrated enterprise. The company has implemented a consistent set of processes and standards worldwide to reduce inefficiencies and improve collaboration. With its processes fully standardized, the company implemented a new operating model with work shared in global resource centers of excellence located where it made the most business sense. The company has shifted resources toward building client relationships and employee skills, while positioning the company for new market opportunities. During this transformation, IBM pioneered this new operating model, changing from a classic “multinational,” with smaller versions of the parent company replicated in countries around the world, to a global model with one set of processes, shared services and broadly distributed decision making.
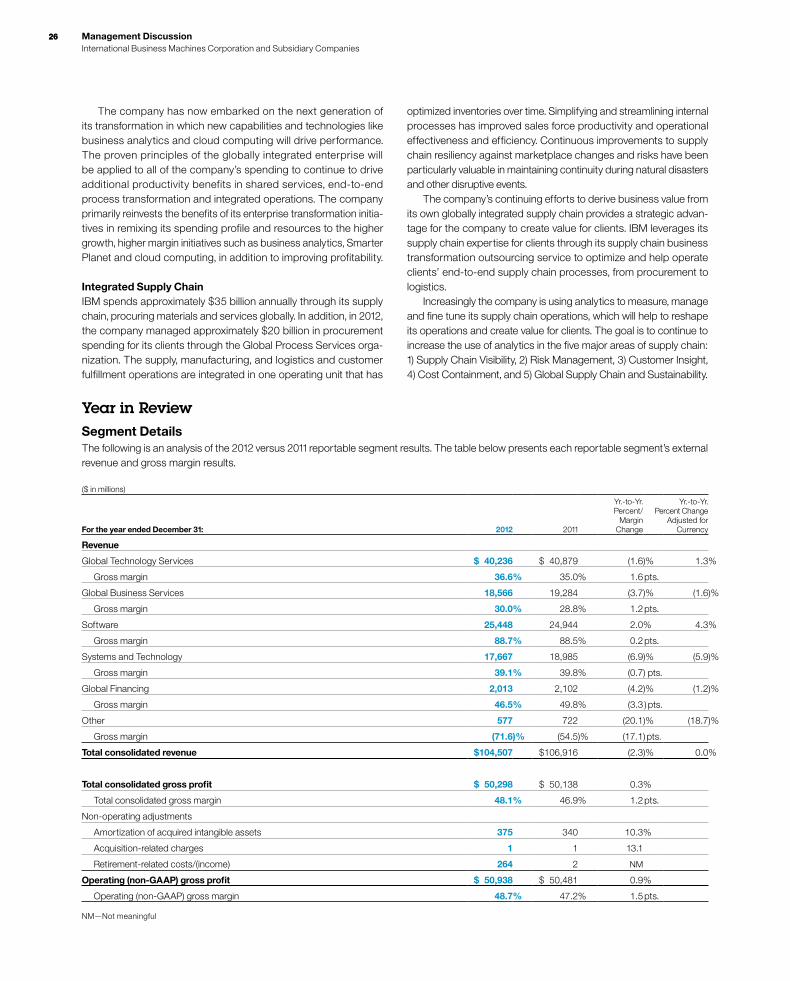
2626 Management Discussion International Business Machines Corporation and Subsidiary Companies
Year in ReviewSegment DetailsThe following is an analysis of the 2012 versus 2011 reportable segment results. The table below presents each reportable segment’s external revenue and gross margin results.
($ in millions)
For the year ended December 31: 2012 2011
Yr.-to-Yr. Percent/
Margin Change
Yr.-to-Yr. Percent Change
Adjusted for Currency
Revenue
Global Technology Services $ 40,236 $ 40,879 (1.6)% 1.3%
Gross margin 36.6% 35.0% 1.6 pts.
Global Business Services 18,566 19,284 (3.7)% (1.6)%
Gross margin 30.0% 28.8% 1.2 pts.
Software 25,448 24,944 2.0% 4.3%
Gross margin 88.7% 88.5% 0.2 pts.
Systems and Technology 17,667 18,985 (6.9)% (5.9)%
Gross margin 39.1% 39.8% (0.7) pts.
Global Financing 2,013 2,102 (4.2)% (1.2)%
Gross margin 46.5% 49.8% (3.3 ) pts.
Other 577 722 (20.1)% (18.7)%
Gross margin (71.6)% (54.5)% (17.1) pts.
Total consolidated revenue $104,507 $106,916 (2.3)% 0.0%
Total consolidated gross profit $ 50,298 $ 50,138 0.3%
Total consolidated gross margin 48.1% 46.9% 1.2 pts.
Non-operating adjustments
Amortization of acquired intangible assets 375 340 10.3%
Acquisition-related charges 1 1 13.1
Retirement-related costs/(income) 264 2 NM
Operating (non-GAAP) gross profit $ 50,938 $ 50,481 0.9%
Operating (non-GAAP) gross margin 48.7% 47.2% 1.5 pts.
NM—Not meaningful
The company has now embarked on the next generation of its transformation in which new capabilities and technologies like business analytics and cloud computing will drive performance. The proven principles of the globally integrated enterprise will be applied to all of the company’s spending to continue to drive additional productivity benefits in shared services, end-to-end process transformation and integrated operations. The company primarily reinvests the benefits of its enterprise transformation initia-tives in remixing its spending profile and resources to the higher growth, higher margin initiatives such as business analytics, Smarter Planet and cloud computing, in addition to improving profitability.
Integrated Supply ChainIBM spends approximately $35 billion annually through its supply chain, procuring materials and services globally. In addition, in 2012, the company managed approximately $20 billion in procurement spending for its clients through the Global Process Services orga-nization. The supply, manufacturing, and logistics and customer fulfillment operations are integrated in one operating unit that has
optimized inventories over time. Simplifying and streamlining internal processes has improved sales force productivity and operational effectiveness and efficiency. Continuous improvements to supply chain resiliency against marketplace changes and risks have been particularly valuable in maintaining continuity during natural disasters and other disruptive events. The company’s continuing efforts to derive business value from its own globally integrated supply chain provides a strategic advan-tage for the company to create value for clients. IBM leverages its supply chain expertise for clients through its supply chain business transformation outsourcing service to optimize and help operate clients’ end-to-end supply chain processes, from procurement to logistics. Increasingly the company is using analytics to measure, manage and fine tune its supply chain operations, which will help to reshape its operations and create value for clients. The goal is to continue to increase the use of analytics in the five major areas of supply chain: 1) Supply Chain Visibility, 2) Risk Management, 3) Customer Insight, 4) Cost Containment, and 5) Global Supply Chain and Sustainability.
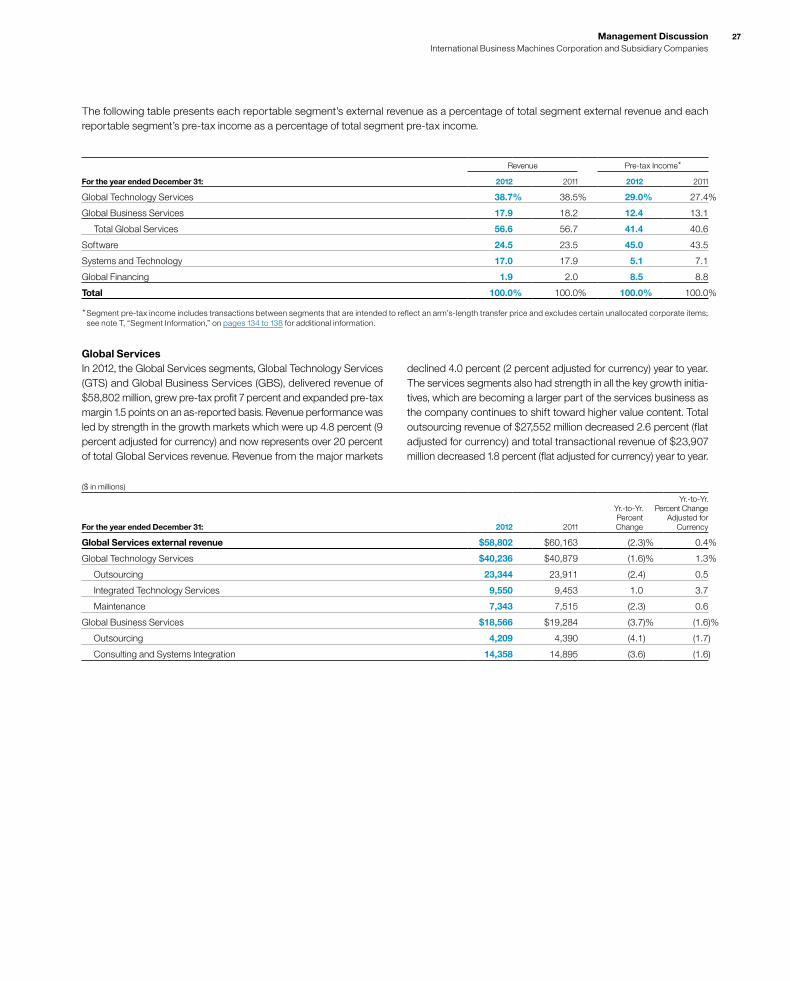
27Management Discussion International Business Machines Corporation and Subsidiary Companies
The following table presents each reportable segment’s external revenue as a percentage of total segment external revenue and each reportable segment’s pre-tax income as a percentage of total segment pre-tax income.
Revenue Pre-tax Income*
For the year ended December 31: 2012 2011 2012 2011
Global Technology Services 38.7% 38.5% 29.0% 27.4%
Global Business Services 17.9 18.2 12.4 13.1
Total Global Services 56.6 56.7 41.4 40.6
Software 24.5 23.5 45.0 43.5
Systems and Technology 17.0 17.9 5.1 7.1
Global Financing 1.9 2.0 8.5 8.8
Total 100.0% 100.0% 100.0% 100.0%
* Segment pre-tax income includes transactions between segments that are intended to reflect an arm’s-length transfer price and excludes certain unallocated corporate items; see note T, “Segment Information,” on pages 134 to 138 for additional information.
declined 4.0 percent (2 percent adjusted for currency) year to year. The services segments also had strength in all the key growth initia-tives, which are becoming a larger part of the services business as the company continues to shift toward higher value content. Total outsourcing revenue of $27,552 million decreased 2.6 percent (flat adjusted for currency) and total transactional revenue of $23,907 million decreased 1.8 percent (flat adjusted for currency) year to year.
($ in millions)
For the year ended December 31: 2012 2011
Yr.-to-Yr. Percent Change
Yr.-to-Yr. Percent Change
Adjusted for Currency
Global Services external revenue $58,802 $60,163 (2.3)% 0.4%
Global Technology Services $40,236 $40,879 (1.6)% 1.3%
Outsourcing 23,344 23,911 (2.4) 0.5
Integrated Technology Services 9,550 9,453 1.0 3.7
Maintenance 7,343 7,515 (2.3) 0.6
Global Business Services $18,566 $19,284 (3.7)% (1.6)%
Outsourcing 4,209 4,390 (4.1) (1.7)
Consulting and Systems Integration 14,358 14,895 (3.6) (1.6)
Global ServicesIn 2012, the Global Services segments, Global Technology Services (GTS) and Global Business Services (GBS), delivered revenue of $58,802 million, grew pre-tax profit 7 percent and expanded pre-tax margin 1.5 points on an as-reported basis. Revenue performance was led by strength in the growth markets which were up 4.8 percent (9 percent adjusted for currency) and now represents over 20 percent of total Global Services revenue. Revenue from the major markets
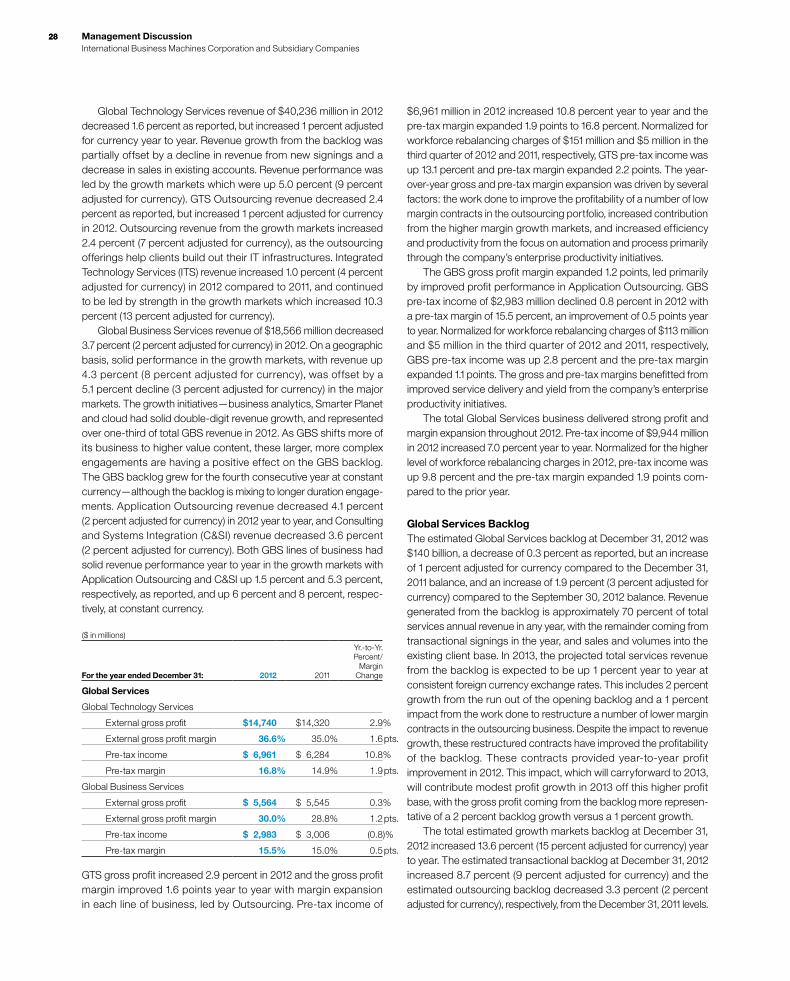
2828 Management Discussion International Business Machines Corporation and Subsidiary Companies
Global Technology Services revenue of $40,236 million in 2012 decreased 1.6 percent as reported, but increased 1 percent adjusted for currency year to year. Revenue growth from the backlog was partially offset by a decline in revenue from new signings and a decrease in sales in existing accounts. Revenue performance was led by the growth markets which were up 5.0 percent (9 percent adjusted for currency). GTS Outsourcing revenue decreased 2.4 percent as reported, but increased 1 percent adjusted for currency in 2012. Outsourcing revenue from the growth markets increased 2.4 percent (7 percent adjusted for currency), as the outsourcing offerings help clients build out their IT infrastructures. Integrated Technology Services (ITS) revenue increased 1.0 percent (4 percent adjusted for currency) in 2012 compared to 2011, and continued to be led by strength in the growth markets which increased 10.3 percent (13 percent adjusted for currency). Global Business Services revenue of $18,566 million decreased 3.7 percent (2 percent adjusted for currency) in 2012. On a geographic basis, solid performance in the growth markets, with revenue up 4.3 percent (8 percent adjusted for currency), was of fset by a 5.1 percent decline (3 percent adjusted for currency) in the major markets. The growth initiatives—business analytics, Smarter Planet and cloud had solid double-digit revenue growth, and represented over one-third of total GBS revenue in 2012. As GBS shifts more of its business to higher value content, these larger, more complex engagements are having a positive effect on the GBS backlog. The GBS backlog grew for the fourth consecutive year at constant currency—although the backlog is mixing to longer duration engage-ments. Application Outsourcing revenue decreased 4.1 percent (2 percent adjusted for currency) in 2012 year to year, and Consulting and Systems Integration (C&SI) revenue decreased 3.6 percent (2 percent adjusted for currency). Both GBS lines of business had solid revenue performance year to year in the growth markets with Application Outsourcing and C&SI up 1.5 percent and 5.3 percent, respectively, as reported, and up 6 percent and 8 percent, respec-tively, at constant currency.
($ in millions)
For the year ended December 31: 2012 2011
Yr.-to-Yr. Percent/
Margin Change
Global Services
Global Technology Services
External gross profit $14,740 $14,320 2.9%
External gross profit margin 36.6% 35.0% 1.6 pts.
Pre-tax income $ 6,961 $ 6,284 10.8%
Pre-tax margin 16.8% 14.9% 1.9 pts.
Global Business Services
External gross profit $ 5,564 $ 5,545 0.3%
External gross profit margin 30.0% 28.8% 1.2 pts.
Pre-tax income $ 2,983 $ 3,006 (0.8)%
Pre-tax margin 15.5% 15.0% 0.5 pts.
GTS gross profit increased 2.9 percent in 2012 and the gross profit margin improved 1.6 points year to year with margin expansion in each line of business, led by Outsourcing. Pre-tax income of
$6,961 million in 2012 increased 10.8 percent year to year and the pre-tax margin expanded 1.9 points to 16.8 percent. Normalized for workforce rebalancing charges of $151 million and $5 million in the third quarter of 2012 and 2011, respectively, GTS pre-tax income was up 13.1 percent and pre-tax margin expanded 2.2 points. The year-over-year gross and pre-tax margin expansion was driven by several factors: the work done to improve the profitability of a number of low margin contracts in the outsourcing portfolio, increased contribution from the higher margin growth markets, and increased efficiency and productivity from the focus on automation and process primarily through the company’s enterprise productivity initiatives. The GBS gross profit margin expanded 1.2 points, led primarily by improved profit performance in Application Outsourcing. GBS pre-tax income of $2,983 million declined 0.8 percent in 2012 with a pre-tax margin of 15.5 percent, an improvement of 0.5 points year to year. Normalized for workforce rebalancing charges of $113 million and $5 million in the third quarter of 2012 and 2011, respectively, GBS pre-tax income was up 2.8 percent and the pre-tax margin expanded 1.1 points. The gross and pre-tax margins benefitted from improved service delivery and yield from the company’s enterprise productivity initiatives. The total Global Services business delivered strong profit and margin expansion throughout 2012. Pre-tax income of $9,944 million in 2012 increased 7.0 percent year to year. Normalized for the higher level of workforce rebalancing charges in 2012, pre-tax income was up 9.8 percent and the pre-tax margin expanded 1.9 points com-pared to the prior year.
Global Services BacklogThe estimated Global Services backlog at December 31, 2012 was $140 billion, a decrease of 0.3 percent as reported, but an increase of 1 percent adjusted for currency compared to the December 31, 2011 balance, and an increase of 1.9 percent (3 percent adjusted for currency) compared to the September 30, 2012 balance. Revenue generated from the backlog is approximately 70 percent of total services annual revenue in any year, with the remainder coming from transactional signings in the year, and sales and volumes into the existing client base. In 2013, the projected total services revenue from the backlog is expected to be up 1 percent year to year at consistent foreign currency exchange rates. This includes 2 percent growth from the run out of the opening backlog and a 1 percent impact from the work done to restructure a number of lower margin contracts in the outsourcing business. Despite the impact to revenue growth, these restructured contracts have improved the profitability of the backlog. These contracts provided year-to-year profit improvement in 2012. This impact, which will carryforward to 2013, will contribute modest profit growth in 2013 off this higher profit base, with the gross profit coming from the backlog more represen-tative of a 2 percent backlog growth versus a 1 percent growth. The total estimated growth markets backlog at December 31, 2012 increased 13.6 percent (15 percent adjusted for currency) year to year. The estimated transactional backlog at December 31, 2012 increased 8.7 percent (9 percent adjusted for currency) and the estimated outsourcing backlog decreased 3.3 percent (2 percent adjusted for currency), respectively, from the December 31, 2011 levels.

29Management Discussion International Business Machines Corporation and Subsidiary Companies
Total Global Services backlog includes GTS Outsourcing, ITS, GBS Outsourcing, Consulting and Systems Integration and Maintenance. Outsourcing backlog includes GTS Outsourcing and GBS Outsourc-ing. Transactional backlog includes ITS and Consulting and Systems Integration.Total backlog is intended to be a statement of overall work under contract and therefore does include Maintenance. Backlog estimates are subject to change and are affected by several factors, including terminations, changes in the scope of contracts, periodic revalidations, adjustments for revenue not materialized and adjust-ments for currency. Global Services signings are management’s initial estimate of the value of a client’s commitment under a Global Services contract. There are no third-party standards or requirements governing the calculation of signings. The calculation used by management involves
Software revenue of $25,448 million increased 2.0 percent (4 percent adjusted for currency) in 2012 compared to 2011. Software revenue growth continued to be led by the key branded middleware products with constant currency growth in all the brands, and particular
strength and share gains in WebSphere and Tivoli. Software contin-ued its momentum throughout 2012 in the growth initiatives with strong performance in business analytics, Smarter Commerce and cloud. The Software business delivered $10.8 billion in segment
estimates and judgments to gauge the extent of a client’s commit-ment, including the type and duration of the agreement, and the presence of termination charges or wind-down costs. Signings include GTS Outsourcing, ITS, GBS Outsourcing and Consulting and Systems Integration contracts. Contract extensions and increases in scope are treated as signings only to the extent of the incremental new value. Maintenance is not included in signings as maintenance contracts tend to be more steady state, where revenues equal renewals. Contract portfolios purchased in an acquisition are treated as positive backlog adjustments provided those contracts meet the company’s requirements for initial signings. A new signing will be recognized if a new services agreement is signed incidental or coin-cidental to an acquisition or divestiture.
($ in millions)
For the year ended December 31: 2012 2011
Yr.-to-Yr. Percent Change
Yr.-to-Yr. Percent Change
Adjusted for Currency
Total signings $56,595 $57,435 (1.5)% 1.1%
Outsourcing signings $27,891 $29,251 (4.6)% (1.9)%
Transactional signings 28,703 28,184 1.8 4.1
Software
($ in millions)
For the year ended December 31: 2012 2011*
Yr.-to-Yr. Percent Change
Yr.-to-Yr. Percent Change
Adjusted for Currency
Software external revenue $25,448 $24,944 2.0% 4.3%
Middleware $20,983 $20,650 1.6% 3.9%
Key Branded Middleware 16,528 16,055 2.9 5.2
WebSphere Family 7.8 9.9
Information Management 1.5 3.8
Lotus (2.1) 0.3
Tivoli 4.1 6.2
Rational (1.6) 0.6
Other middleware 4,455 4,596 (3.1) (0.6)
Operating systems 2,525 2,480 1.8 4.3
Other 1,940 1,813 7.0 9.2
* Reclassified to conform with 2012 presentation.
($ in billions)
At December 31: 2012 2011
Yr.-to-Yr.Percent Change
Yr.-to-Yr. Percent Change
Adjusted forCurrency
Backlog
Total backlog $140.3 $140.6 (0.3)% 0.6%
Outsourcing backlog 89.4 92.5 (3.3) (2.4)
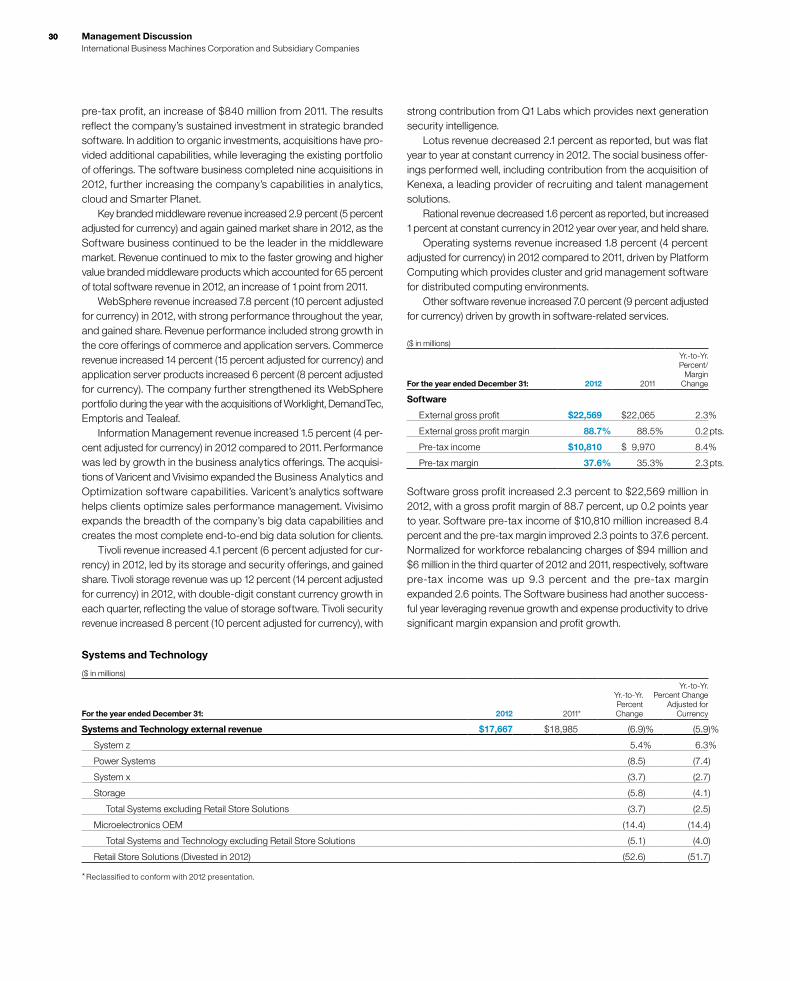
3030 Management Discussion International Business Machines Corporation and Subsidiary Companies
pre-tax profit, an increase of $840 million from 2011. The results reflect the company’s sustained investment in strategic branded software. In addition to organic investments, acquisitions have pro-vided additional capabilities, while leveraging the existing portfolio of offerings. The software business completed nine acquisitions in 2012, further increasing the company’s capabilities in analytics, cloud and Smarter Planet. Key branded middleware revenue increased 2.9 percent (5 percent adjusted for currency) and again gained market share in 2012, as the Software business continued to be the leader in the middleware market. Revenue continued to mix to the faster growing and higher value branded middleware products which accounted for 65 percent of total software revenue in 2012, an increase of 1 point from 2011. WebSphere revenue increased 7.8 percent (10 percent adjusted for currency) in 2012, with strong performance throughout the year, and gained share. Revenue performance included strong growth in the core offerings of commerce and application servers. Commerce revenue increased 14 percent (15 percent adjusted for currency) and application server products increased 6 percent (8 percent adjusted for currency). The company further strengthened its WebSphere portfolio during the year with the acquisitions of Worklight, DemandTec, Emptoris and Tealeaf. Information Management revenue increased 1.5 percent (4 per-cent adjusted for currency) in 2012 compared to 2011. Performance was led by growth in the business analytics offerings. The acquisi-tions of Varicent and Vivisimo expanded the Business Analytics and Optimization software capabilities. Varicent’s analytics software helps clients optimize sales performance management. Vivisimo expands the breadth of the company’s big data capabilities and creates the most complete end-to-end big data solution for clients. Tivoli revenue increased 4.1 percent (6 percent adjusted for cur-rency) in 2012, led by its storage and security offerings, and gained share. Tivoli storage revenue was up 12 percent (14 percent adjusted for currency) in 2012, with double-digit constant currency growth in each quarter, reflecting the value of storage software. Tivoli security revenue increased 8 percent (10 percent adjusted for currency), with
strong contribution from Q1 Labs which provides next generation security intelligence. Lotus revenue decreased 2.1 percent as reported, but was flat year to year at constant currency in 2012. The social business offer-ings performed well, including contribution from the acquisition of Kenexa, a leading provider of recruiting and talent management solutions. Rational revenue decreased 1.6 percent as reported, but increased 1 percent at constant currency in 2012 year over year, and held share. Operating systems revenue increased 1.8 percent (4 percent adjusted for currency) in 2012 compared to 2011, driven by Platform Computing which provides cluster and grid management software for distributed computing environments. Other software revenue increased 7.0 percent (9 percent adjusted for currency) driven by growth in software-related services.
($ in millions)
For the year ended December 31: 2012 2011
Yr.-to-Yr. Percent/
Margin Change
Software
External gross profit $22,569 $22,065 2.3%
External gross profit margin 88.7% 88.5% 0.2 pts.
Pre-tax income $10,810 $ 9,970 8.4%
Pre-tax margin 37.6% 35.3% 2.3 pts.
Software gross profit increased 2.3 percent to $22,569 million in 2012, with a gross profit margin of 88.7 percent, up 0.2 points year to year. Software pre-tax income of $10,810 million increased 8.4 percent and the pre-tax margin improved 2.3 points to 37.6 percent. Normalized for workforce rebalancing charges of $94 million and $6 million in the third quarter of 2012 and 2011, respectively, software pre-tax income was up 9.3 percent and the pre-tax margin expanded 2.6 points. The Software business had another success-ful year leveraging revenue growth and expense productivity to drive significant margin expansion and profit growth.
Systems and Technology
($ in millions)
For the year ended December 31: 2012 2011*
Yr.-to-Yr. Percent Change
Yr.-to-Yr. Percent Change
Adjusted for Currency
Systems and Technology external revenue $17,667 $18,985 (6.9)% (5.9)%
System z 5.4% 6.3%
Power Systems (8.5) (7.4)
System x (3.7) (2.7)
Storage (5.8) (4.1)
Total Systems excluding Retail Store Solutions (3.7) (2.5)
Microelectronics OEM (14.4) (14.4)
Total Systems and Technology excluding Retail Store Solutions (5.1) (4.0)
Retail Store Solutions (Divested in 2012) (52.6) (51.7)
* Reclassified to conform with 2012 presentation.
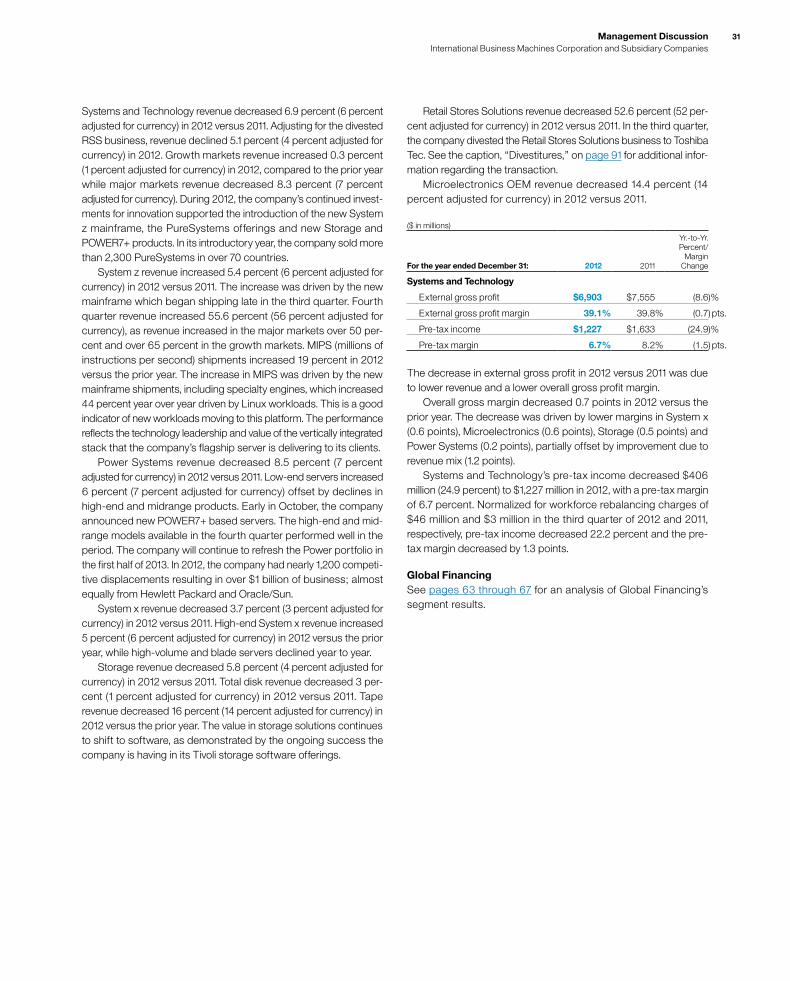
31Management Discussion International Business Machines Corporation and Subsidiary Companies
Systems and Technology revenue decreased 6.9 percent (6 percent adjusted for currency) in 2012 versus 2011. Adjusting for the divested RSS business, revenue declined 5.1 percent (4 percent adjusted for currency) in 2012. Growth markets revenue increased 0.3 percent (1 percent adjusted for currency) in 2012, compared to the prior year while major markets revenue decreased 8.3 percent (7 percent adjusted for currency). During 2012, the company’s continued invest-ments for innovation supported the introduction of the new System z mainframe, the PureSystems offerings and new Storage and POWER7+ products. In its introductory year, the company sold more than 2,300 PureSystems in over 70 countries. System z revenue increased 5.4 percent (6 percent adjusted for currency) in 2012 versus 2011. The increase was driven by the new mainframe which began shipping late in the third quarter. Fourth quarter revenue increased 55.6 percent (56 percent adjusted for currency), as revenue increased in the major markets over 50 per-cent and over 65 percent in the growth markets. MIPS (millions of instructions per second) shipments increased 19 percent in 2012 versus the prior year. The increase in MIPS was driven by the new mainframe shipments, including specialty engines, which increased 44 percent year over year driven by Linux workloads. This is a good indicator of new workloads moving to this platform. The performance reflects the technology leadership and value of the vertically integrated stack that the company’s flagship server is delivering to its clients. Power Systems revenue decreased 8.5 percent (7 percent adjusted for currency) in 2012 versus 2011. Low-end servers increased 6 percent (7 percent adjusted for currency) offset by declines in high-end and midrange products. Early in October, the company announced new POWER7+ based servers. The high-end and mid-range models available in the fourth quarter performed well in the period. The company will continue to refresh the Power portfolio in the first half of 2013. In 2012, the company had nearly 1,200 competi-tive displacements resulting in over $1 billion of business; almost equally from Hewlett Packard and Oracle/Sun. System x revenue decreased 3.7 percent (3 percent adjusted for currency) in 2012 versus 2011. High-end System x revenue increased 5 percent (6 percent adjusted for currency) in 2012 versus the prior year, while high-volume and blade servers declined year to year. Storage revenue decreased 5.8 percent (4 percent adjusted for currency) in 2012 versus 2011. Total disk revenue decreased 3 per-cent (1 percent adjusted for currency) in 2012 versus 2011. Tape revenue decreased 16 percent (14 percent adjusted for currency) in 2012 versus the prior year. The value in storage solutions continues to shift to software, as demonstrated by the ongoing success the company is having in its Tivoli storage software offerings.
Retail Stores Solutions revenue decreased 52.6 percent (52 per-cent adjusted for currency) in 2012 versus 2011. In the third quarter, the company divested the Retail Stores Solutions business to Toshiba Tec. See the caption, “Divestitures,” on page 91 for additional infor-mation regarding the transaction. Microelectronics OEM revenue decreased 14.4 percent (14 percent adjusted for currency) in 2012 versus 2011.
($ in millions)
For the year ended December 31: 2012 2011
Yr.-to-Yr. Percent/
Margin Change
Systems and Technology
External gross profit $6,903 $7,555 (8.6)%
External gross profit margin 39.1% 39.8% (0.7) pts.
Pre-tax income $1,227 $1,633 (24.9)%
Pre-tax margin 6.7% 8.2% (1.5) pts.
The decrease in external gross profit in 2012 versus 2011 was due to lower revenue and a lower overall gross profit margin. Overall gross margin decreased 0.7 points in 2012 versus the prior year. The decrease was driven by lower margins in System x (0.6 points), Microelectronics (0.6 points), Storage (0.5 points) and Power Systems (0.2 points), partially offset by improvement due to revenue mix (1.2 points). Systems and Technology’s pre-tax income decreased $406 million (24.9 percent) to $1,227 million in 2012, with a pre-tax margin of 6.7 percent. Normalized for workforce rebalancing charges of $46 million and $3 million in the third quarter of 2012 and 2011, respectively, pre-tax income decreased 22.2 percent and the pre-tax margin decreased by 1.3 points.
Global FinancingSee pages 63 through 67 for an analysis of Global Financing’s segment results.
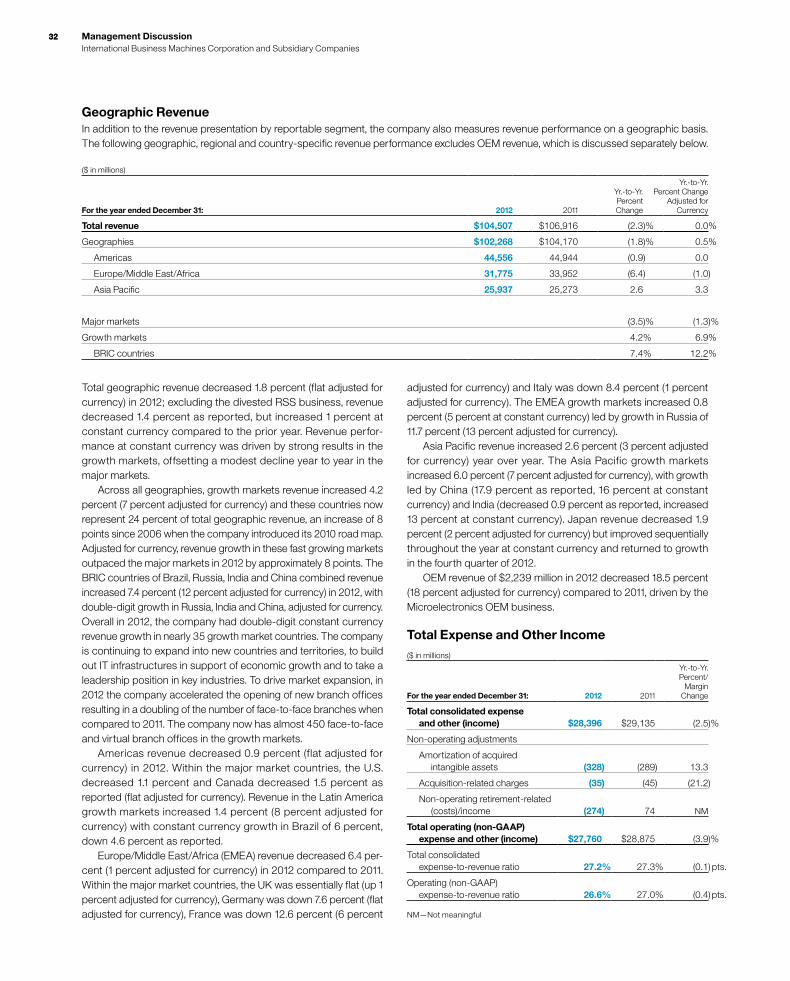
3232 Management Discussion International Business Machines Corporation and Subsidiary Companies
Geographic RevenueIn addition to the revenue presentation by reportable segment, the company also measures revenue performance on a geographic basis. The following geographic, regional and country-specific revenue performance excludes OEM revenue, which is discussed separately below.
($ in millions)
For the year ended December 31: 2012 2011
Yr.-to-Yr. Percent Change
Yr.-to-Yr. Percent Change
Adjusted for Currency
Total revenue $104,507 $106,916 (2.3)% 0.0%
Geographies $102,268 $104,170 (1.8)% 0.5%
Americas 44,556 44,944 (0.9) 0.0
Europe/Middle East/Africa 31,775 33,952 (6.4) (1.0)
Asia Pacific 25,937 25,273 2.6 3.3
Major markets (3.5)% (1.3)%
Growth markets 4.2% 6.9%
BRIC countries 7.4% 12.2%
Total geographic revenue decreased 1.8 percent (flat adjusted for currency) in 2012; excluding the divested RSS business, revenue decreased 1.4 percent as reported, but increased 1 percent at constant currency compared to the prior year. Revenue perfor-mance at constant currency was driven by strong results in the growth markets, offsetting a modest decline year to year in the major markets. Across all geographies, growth markets revenue increased 4.2 percent (7 percent adjusted for currency) and these countries now represent 24 percent of total geographic revenue, an increase of 8 points since 2006 when the company introduced its 2010 road map. Adjusted for currency, revenue growth in these fast growing markets outpaced the major markets in 2012 by approximately 8 points. The BRIC countries of Brazil, Russia, India and China combined revenue increased 7.4 percent (12 percent adjusted for currency) in 2012, with double-digit growth in Russia, India and China, adjusted for currency. Overall in 2012, the company had double-digit constant currency revenue growth in nearly 35 growth market countries. The company is continuing to expand into new countries and territories, to build out IT infrastructures in support of economic growth and to take a leadership position in key industries. To drive market expansion, in 2012 the company accelerated the opening of new branch offices resulting in a doubling of the number of face-to-face branches when compared to 2011. The company now has almost 450 face-to-face and virtual branch offices in the growth markets. Americas revenue decreased 0.9 percent (flat adjusted for currency) in 2012. Within the major market countries, the U.S. decreased 1.1 percent and Canada decreased 1.5 percent as reported (flat adjusted for currency). Revenue in the Latin America growth markets increased 1.4 percent (8 percent adjusted for currency) with constant currency growth in Brazil of 6 percent, down 4.6 percent as reported. Europe/Middle East/Africa (EMEA) revenue decreased 6.4 per-cent (1 percent adjusted for currency) in 2012 compared to 2011. Within the major market countries, the UK was essentially flat (up 1 percent adjusted for currency), Germany was down 7.6 percent (flat adjusted for currency), France was down 12.6 percent (6 percent
adjusted for currency) and Italy was down 8.4 percent (1 percent adjusted for currency). The EMEA growth markets increased 0.8 percent (5 percent at constant currency) led by growth in Russia of 11.7 percent (13 percent adjusted for currency). Asia Pacific revenue increased 2.6 percent (3 percent adjusted for currency) year over year. The Asia Pacific growth markets increased 6.0 percent (7 percent adjusted for currency), with growth led by China (17.9 percent as reported, 16 percent at constant currency) and India (decreased 0.9 percent as reported, increased 13 percent at constant currency). Japan revenue decreased 1.9 percent (2 percent adjusted for currency) but improved sequentially throughout the year at constant currency and returned to growth in the fourth quarter of 2012. OEM revenue of $2,239 million in 2012 decreased 18.5 percent (18 percent adjusted for currency) compared to 2011, driven by the Microelectronics OEM business.
Total Expense and Other Income($ in millions)
For the year ended December 31: 2012 2011
Yr.-to-Yr. Percent/
Margin Change
Total consolidated expense and other (income) $28,396 $29,135 (2.5)%
Non-operating adjustments
Amortization of acquired intangible assets (328) (289) 13.3
Acquisition-related charges (35) (45) (21.2)
Non-operating retirement-related (costs)/income (274) 74 NM
Total operating (non-GAAP) expense and other (income) $27,760 $28,875 (3.9)%
Total consolidated expense-to-revenue ratio 27.2% 27.3% (0.1) pts.
Operating (non-GAAP) expense-to-revenue ratio 26.6% 27.0% (0.4) pts.
NM—Not meaningful

33Management Discussion International Business Machines Corporation and Subsidiary Companies
Total expense and other (income) decreased 2.5 percent in 2012 versus 2011. Total operating (non-GAAP) expense and other (income) decreased 3.9 percent versus the prior year. The key drivers of the year-to-year change in total expense and other (income) were approximately:
Total Operating Consolidated (non-GAAP)
• Currency* (5) points (5) points• Acquisitions** 3 points 2 points• Base expense (0) points (2) points
* Reflects impacts of translation and hedging programs.
** Includes acquisitions completed in prior 12-month period.
In the execution of its strategy, the company continues to invest in its growth initiatives, innovation and strategic acquisitions. The company also has had an ongoing focus on increasing efficiency and productivity across the business. For additional information regarding total expense and other income, see the following analyses by category.
Selling, General and Administrative
($ in millions)
For the year ended December 31: 2012 2011
Yr.-to-Yr. Percent Change
Selling, general and administrative expense
Selling, general and administrative—other $19,589 $20,287 (3.4)%
Advertising and promotional expense 1,339 1,373 (2.5)
Workforce rebalancing charges 803 440 82.5
Retirement-related costs 945 603 56.7
Amortization of acquired intangible assets 328 289 13.3
Stock-based compensation 498 514 (3.0)
Bad debt expense 50 88 (42.5)
Total consolidated selling, general and administrative expense $23,553 $23,594 (0.2)%
Non-operating adjustments
Amortization of acquired intangible assets (328) (289) 13.3
Acquisition-related charges (22) (20) 10.2
Non-operating retirement-related (costs)/income (294) (13) NM
Operating (non-GAAP) selling, general and administrative expense $22,910 $23,272 (1.6)%
NM—Not meaningful
Total Selling, general and administrative (SG&A) expense decreased 0.2 percent in 2012 versus 2011. The decrease was primarily driven by the effects of currency (3 points), partially offset by acquisition-related spending (2 points), while base spending was essentially flat.
Operating (non-GAAP) SG&A expense decreased 1.6 percent pri-marily driven by the effects of currency (3 points) and lower base spending (1 point), partially offset by acquisition-related spending (2 points). The increase in workforce rebalancing charges was due to actions primarily focused on the company’s non-U.S. operations in the third quarter of 2012. The increase in retirement-related costs was primarily driven by the charge related to a court decision regarding one of IBM UK’s defined benefit plans. As a result of the ruling, the company recorded an additional retirement-related obli-gation of $162 million in the third quarter of 2012. This charge is not reflected in operating (non-GAAP) SG&A expense. See note M, “Contingencies and Commitments,” on pages 110 through 112 for additional information. Bad debt expense decreased $37 million in 2012 versus 2011, as the company increased its provisions in 2011 reflecting the European credit environment. The accounts receivable provision coverage is 1.4 percent at December 31, 2012, a decrease of 10 basis points from year-end 2011.
Other (Income) and Expense
($ in millions)
For the year ended December 31: 2012 2011
Yr.-to-Yr. Percent Change
Other (income) and expense
Foreign currency transaction losses/(gains) $(240) $ 513 NM%
(Gains)/losses on derivative instruments 72 (113) NM
Interest income (109) (136) (20.2)
Net (gains)/losses from securities and investment assets (55) (227) (75.5)
Other (511) (58) NM
Total consolidated other (income) and expense $(843) $ (20) NM%
Non-operating adjustment
Acquisition-related charges (13) (25) (46.0)
Operating (non-GAAP) other (income) and expense $(857) $ (45) NM%
NM—Not meaningful
Other (income) and expense was income of $843 million and $20 million in 2012 and 2011, respectively. The increase in income of $823 million in 2012 was primarily driven by higher gains from foreign currency transactions ($753 million) due to rate volatility year to year, and the gain associated with the divested RSS business ($446 million) reflected in Other in the table above. These increases in income were partially offset by increased losses on derivative instru-ments ($184 million) and lower gains from securities and investment asset sales ($171 million). In 2011, the company had investment gains of over $200 million, primarily from the sale of Lenovo shares.

3434 Management Discussion International Business Machines Corporation and Subsidiary Companies
Research, Development and Engineering
($ in millions)
For the year ended December 31: 2012 2011
Yr.-to-Yr. Percent Change
Total consolidated research, development and engineering $6,302 $6,258 0.7%
Non-operating adjustment
Non-operating retirement-related (costs)/income 20 88 (76.9)
Operating (non-GAAP) research, development and engineering $6,322 $6,345 (0.4)%
The company continues to invest in research and development, focusing its investments on high-value, high-growth opportunities and extending its technology leadership. Total research, development and engineering (RD&E) expense increased 0.7 percent in 2012 versus 2011, primarily driven by acquisitions (3 points), partially offset by the effects of currency (2 points) and lower base spending (1 point). Operating (non-GAAP) RD&E expense decreased 0.4 percent in 2012 compared to the prior year primarily driven by the effects of currency (2 points) and lower base spending (2 points), partially offset by acquisitions (3 points). RD&E investments represented 6.0 percent of revenue in 2012, compared to 5.9 percent in 2011.
Intellectual Property and Custom Development Income
($ in millions)
For the year ended December 31: 2012 2011
Yr.-to-Yr. Percent Change
Sales and other transfers of intellectual property $ 324 $ 309 4.7%
Licensing/royalty-based fees 251 211 19.0
Custom development income 500 588 (14.9)
Total $1,074 $1,108 (3.0)%
The timing and amount of sales and other transfers of IP may vary significantly from period to period depending upon timing of dives-titures, industry consolidation, economic conditions and the timing of new patents and know-how development. There were no signifi-cant individual IP transactions in 2012 or 2011.
Interest Expense
($ in millions)
For the year ended December 31: 2012 2011
Yr.-to-Yr. Percent Change
Interest expense
Total $459 $411 11.8%
The increase in interest expense in 2012 versus 2011 was primarily driven by higher average debt levels, partially offset by lower average interest rates. Interest expense is presented in cost of financing in the Consolidated State ment of Earnings only if the related external borrowings are to support the Global Financing external business. See pages 66 and 67 for additional information regarding Global Financing debt and interest expense. Overall interest expense (excluding capitalized interest) for 2012 was $1,004 million, an increase of $40 million year to year.
Stock-Based CompensationTotal pre-tax stock-based compensation cost of $688 million decreased $9 million compared to 2011. The decrease was primarily related to the company’s performance share units ($30 million), par-tially offset by increases related to restricted stock units ($16 million) and the assumption of stock-based awards previously issued by acquired entities ($5 million). Cost, and the year-to-year change, was reflected in the following categories: Cost: $132 million, up $11 million; SG&A expense: $498 million, down $16 million; and RD&E expense: $59 million, down $4 million. See note R, “Stock-Based Compensation,” on pages 117 to 120 for additional information on stock-based incentive awards.
Retirement-Related Plans The following table provides the total pre-tax cost for all retirement-related plans. These amounts are included in the Consolidated Statement of Earnings within the caption (e.g., Cost, SG&A, RD&E) relating to the job function of the plan participants.
($ in millions)
For the year ended December 31: 2012 2011
Yr.-to-Yr. Percent Change
Retirement-related plans—cost
Service cost $ 493 $ 549 (10.2)%
Amortization of prior service cost/(credits) (148) (157) (5.5)
Cost of defined contribution plans 1,506 1,513 (0.4)
Total operating costs $ 1,851 $ 1,905 (2.8)%
Interest cost 4,238 4,601 (7.9)
Expected return on plan assets (6,356) (6,574) (3.3)
Recognized actuarial losses 2,407 1,788 34.6
Plan amendments/curtailments/ settlements 1 1 14.4
Multi-employer plan/other costs 247 112 121.3
Total non-operating costs/(income) $ 538 $ (72) NM%
Total retirement-related plans—cost $ 2,389 $ 1,832 30.3%
NM—Not meaningful
In 2012, total retirement-related plans cost increased by $556 million compared to 2011, primarily driven by an increase in recognized actuarial losses of $619 million, lower expected return on plan assets ($219 million) and the charge related to the UK pension litigation ($162 million). These increases were partially offset by lower interest cost of $363 million and lower service cost of $56 million.
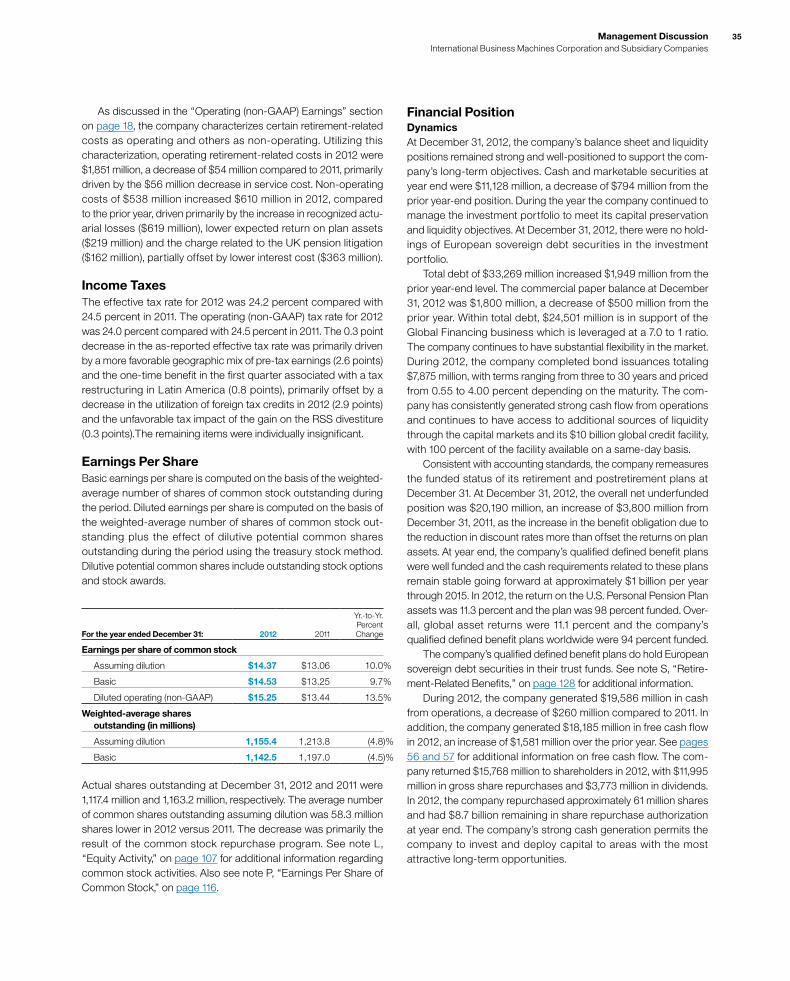
35Management Discussion International Business Machines Corporation and Subsidiary Companies
As discussed in the “Operating (non-GAAP) Earnings” section on page 18, the company characterizes certain retirement-related costs as operating and others as non-operating. Utilizing this characterization, operating retirement-related costs in 2012 were $1,851 million, a decrease of $54 million compared to 2011, primarily driven by the $56 million decrease in service cost. Non-operating costs of $538 million increased $610 million in 2012, compared to the prior year, driven primarily by the increase in recognized actu-arial losses ($619 million), lower expected return on plan assets ($219 million) and the charge related to the UK pension litigation ($162 million), partially offset by lower interest cost ($363 million).
Income TaxesThe effective tax rate for 2012 was 24.2 percent compared with24.5 percent in 2011. The operating (non-GAAP) tax rate for 2012was 24.0 percent compared with 24.5 percent in 2011. The 0.3 pointdecrease in the as-reported effective tax rate was primarily drivenby a more favorable geographic mix of pre-tax earnings (2.6 points) and the one-time benefit in the first quarter associated with a tax restructuring in Latin America (0.8 points), primarily offset by a decrease in the utilization of foreign tax credits in 2012 (2.9 points) and the unfavorable tax impact of the gain on the RSS divestiture (0.3 points).The remaining items were individually insignificant.
Earnings Per ShareBasic earnings per share is computed on the basis of the weighted-average number of shares of common stock outstanding during the period. Diluted earnings per share is computed on the basis of the weighted-average number of shares of common stock out-standing plus the effect of dilutive potential common shares outstanding during the period using the treasury stock method. Dilutive potential common shares include outstanding stock options and stock awards.
For the year ended December 31: 2012 2011
Yr.-to-Yr. Percent Change
Earnings per share of common stock
Assuming dilution $14.37 $13.06 10.0%
Basic $14.53 $13.25 9.7%
Diluted operating (non-GAAP) $15.25 $13.44 13.5%
Weighted-average shares outstanding (in millions)
Assuming dilution 1,155.4 1,213.8 (4.8)%
Basic 1,142.5 1,197.0 (4.5)%
Actual shares outstanding at December 31, 2012 and 2011 were 1,117.4 million and 1,163.2 million, respectively. The average number of common shares outstanding assuming dilution was 58.3 million shares lower in 2012 versus 2011. The decrease was primarily the result of the common stock repurchase program. See note L, “Equity Activity,” on page 107 for additional information regarding common stock activities. Also see note P, “Earnings Per Share of Common Stock,” on page 116.
Financial PositionDynamicsAt December 31, 2012, the company’s balance sheet and liquidity positions remained strong and well-positioned to support the com-pany’s long-term objectives. Cash and marketable securities at year end were $11,128 million, a decrease of $794 million from the prior year-end position. During the year the company continued to manage the investment portfolio to meet its capital preservation and liquidity objectives. At December 31, 2012, there were no hold-ings of European sovereign debt securities in the investment portfolio. Total debt of $33,269 million increased $1,949 million from the prior year-end level. The commercial paper balance at December 31, 2012 was $1,800 million, a decrease of $500 million from the prior year. Within total debt, $24,501 million is in support of the Global Financing business which is leveraged at a 7.0 to 1 ratio. The company continues to have substantial flexibility in the market. During 2012, the company completed bond issuances totaling $7,875 million, with terms ranging from three to 30 years and priced from 0.55 to 4.00 percent depending on the maturity. The com-pany has consistently generated strong cash flow from operations and continues to have access to additional sources of liquidity through the capital markets and its $10 billion global credit facility, with 100 percent of the facility available on a same-day basis. Consistent with accounting standards, the company remeasures the funded status of its retirement and postretirement plans at December 31. At December 31, 2012, the overall net underfunded position was $20,190 million, an increase of $3,800 million from December 31, 2011, as the increase in the benefit obligation due to the reduction in discount rates more than offset the returns on plan assets. At year end, the company’s qualified defined benefit plans were well funded and the cash requirements related to these plans remain stable going forward at approximately $1 billion per year through 2015. In 2012, the return on the U.S. Personal Pension Plan assets was 11.3 percent and the plan was 98 percent funded. Over-all, global asset returns were 11.1 percent and the company’s qualified defined benefit plans worldwide were 94 percent funded. The company’s qualified defined benefit plans do hold European sovereign debt securities in their trust funds. See note S, “Retire-ment-Related Benefits,” on page 128 for additional information. During 2012, the company generated $19,586 million in cash from operations, a decrease of $260 million compared to 2011. In addition, the company generated $18,185 million in free cash flow in 2012, an increase of $1,581 million over the prior year. See pages 56 and 57 for additional information on free cash flow. The com-pany returned $15,768 million to shareholders in 2012, with $11,995 million in gross share repurchases and $3,773 million in dividends. In 2012, the company repurchased approximately 61 million shares and had $8.7 billion remaining in share repurchase authorization at year end. The company’s strong cash generation permits the company to invest and deploy capital to areas with the most attractive long-term opportunities.
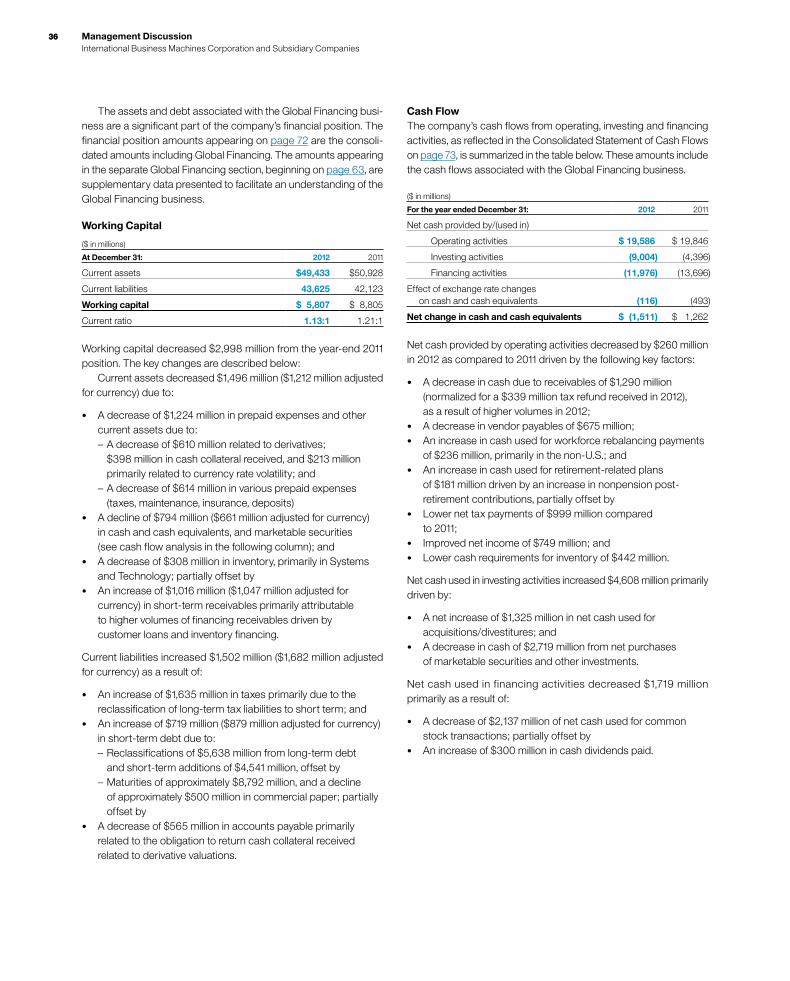
3636 Management Discussion International Business Machines Corporation and Subsidiary Companies
The assets and debt associated with the Global Financing busi-ness are a significant part of the company’s financial position. The financial position amounts appearing on page 72 are the consoli-dated amounts including Global Financing. The amounts appearing in the separate Global Financing section, beginning on page 63, are supplementary data presented to facilitate an understanding of the Global Financing business.
Working Capital
($ in millions)
At December 31: 2012 2011
Current assets $49,433 $50,928
Current liabilities 43,625 42,123
Working capital $ 5,807 $ 8,805
Current ratio 1.13:1 1.21:1
Working capital decreased $2,998 million from the year-end 2011 position. The key changes are described below: Current assets decreased $1,496 million ($1,212 million adjusted for currency) due to:
• A decrease of $1,224 million in prepaid expenses and other current assets due to:
– A decrease of $610 million related to derivatives; $398 million in cash collateral received, and $213 million primarily related to currency rate volatility; and
– A decrease of $614 million in various prepaid expenses (taxes, maintenance, insurance, deposits)
• A decline of $794 million ($661 million adjusted for currency) in cash and cash equivalents, and marketable securities (see cash flow analysis in the following column); and
• A decrease of $308 million in inventory, primarily in Systems and Technology; partially offset by
• An increase of $1,016 million ($1,047 million adjusted for currency) in short-term receivables primarily attributable to higher volumes of financing receivables driven by customer loans and inventory financing.
Current liabilities increased $1,502 million ($1,682 million adjusted for currency) as a result of:
• An increase of $1,635 million in taxes primarily due to the reclassification of long-term tax liabilities to short term; and
• An increase of $719 million ($879 million adjusted for currency) in short-term debt due to:
– Reclassifications of $5,638 million from long-term debt and short-term additions of $4,541 million, offset by
– Maturities of approximately $8,792 million, and a decline of approximately $500 million in commercial paper; partially offset by
• A decrease of $565 million in accounts payable primarily related to the obligation to return cash collateral received related to derivative valuations.
Cash FlowThe company’s cash flows from operating, investing and financing activities, as reflected in the Consolidated Statement of Cash Flows on page 73, is summarized in the table below. These amounts include the cash flows associated with the Global Financing business.
($ in millions)
For the year ended December 31: 2012 2011
Net cash provided by/(used in)
Operating activities $ 19,586 $ 19,846
Investing activities (9,004) (4,396)
Financing activities (11,976) (13,696)
Effect of exchange rate changes on cash and cash equivalents (116) (493)
Net change in cash and cash equivalents $ (1,511) $ 1,262
Net cash provided by operating activities decreased by $260 million in 2012 as compared to 2011 driven by the following key factors:
• A decrease in cash due to receivables of $1,290 million (normalized for a $339 million tax refund received in 2012), as a result of higher volumes in 2012;
• A decrease in vendor payables of $675 million; • An increase in cash used for workforce rebalancing payments
of $236 million, primarily in the non-U.S.; and • An increase in cash used for retirement-related plans
of $181 million driven by an increase in nonpension post-retirement contributions, partially offset by
• Lower net tax payments of $999 million compared to 2011;
• Improved net income of $749 million; and • Lower cash requirements for inventory of $442 million.
Net cash used in investing activities increased $4,608 million primarily driven by:
• A net increase of $1,325 million in net cash used for acquisitions/divestitures; and
• A decrease in cash of $2,719 million from net purchases of marketable securities and other investments.
Net cash used in financing activities decreased $1,719 million primarily as a result of:
• A decrease of $2,137 million of net cash used for common stock transactions; partially offset by
• An increase of $300 million in cash dividends paid.
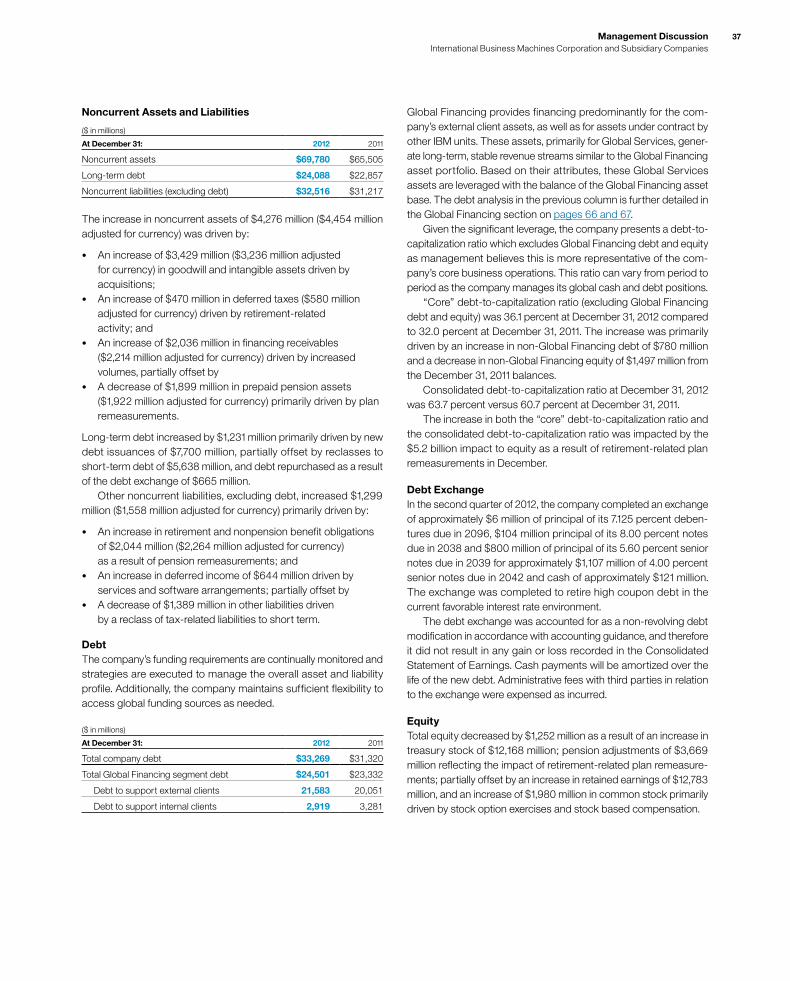
37Management Discussion International Business Machines Corporation and Subsidiary Companies
Noncurrent Assets and Liabilities
($ in millions)
At December 31: 2012 2011
Noncurrent assets $69,780 $65,505
Long-term debt $24,088 $22,857
Noncurrent liabilities (excluding debt) $32,516 $31,217
The increase in noncurrent assets of $4,276 million ($4,454 million adjusted for currency) was driven by:
• An increase of $3,429 million ($3,236 million adjusted for currency) in goodwill and intangible assets driven by acquisitions;
• An increase of $470 million in deferred taxes ($580 million adjusted for currency) driven by retirement-related activity; and
• An increase of $2,036 million in financing receivables ($2,214 million adjusted for currency) driven by increased volumes, partially offset by
• A decrease of $1,899 million in prepaid pension assets ($1,922 million adjusted for currency) primarily driven by plan remeasurements.
Long-term debt increased by $1,231 million primarily driven by new debt issuances of $7,700 million, partially offset by reclasses to short-term debt of $5,638 million, and debt repurchased as a result of the debt exchange of $665 million. Other noncurrent liabilities, excluding debt, increased $1,299 million ($1,558 million adjusted for currency) primarily driven by:
• An increase in retirement and nonpension benefit obligations of $2,044 million ($2,264 million adjusted for currency) as a result of pension remeasurements; and
• An increase in deferred income of $644 million driven by services and software arrangements; partially offset by
• A decrease of $1,389 million in other liabilities driven by a reclass of tax-related liabilities to short term.
DebtThe company’s funding requirements are continually monitored and strategies are executed to manage the overall asset and liability profile. Additionally, the company maintains sufficient flexibility to access global funding sources as needed.
($ in millions)
At December 31: 2012 2011
Total company debt $33,269 $31,320
Total Global Financing segment debt $24,501 $23,332
Debt to support external clients 21,583 20,051
Debt to support internal clients 2,919 3,281
Global Financing provides financing predominantly for the com-pany’s external client assets, as well as for assets under contract by other IBM units. These assets, primarily for Global Services, gener-ate long-term, stable revenue streams similar to the Global Financing asset portfolio. Based on their attributes, these Global Services assets are leveraged with the balance of the Global Financing asset base. The debt analysis in the previous column is further detailed in the Global Financing section on pages 66 and 67. Given the significant leverage, the company presents a debt-to-capitalization ratio which excludes Global Financing debt and equity as management believes this is more representative of the com-pany’s core business operations. This ratio can vary from period to period as the company manages its global cash and debt positions. “Core” debt-to-capitalization ratio (excluding Global Financing debt and equity) was 36.1 percent at December 31, 2012 compared to 32.0 percent at December 31, 2011. The increase was primarily driven by an increase in non-Global Financing debt of $780 million and a decrease in non-Global Financing equity of $1,497 million from the December 31, 2011 balances. Consolidated debt-to-capitalization ratio at December 31, 2012 was 63.7 percent versus 60.7 percent at December 31, 2011. The increase in both the “core” debt-to-capitalization ratio and the consolidated debt-to-capitalization ratio was impacted by the $5.2 billion impact to equity as a result of retirement-related plan remeasurements in December.
Debt ExchangeIn the second quarter of 2012, the company completed an exchange of approximately $6 million of principal of its 7.125 percent deben-tures due in 2096, $104 million principal of its 8.00 percent notes due in 2038 and $800 million of principal of its 5.60 percent senior notes due in 2039 for approximately $1,107 million of 4.00 percent senior notes due in 2042 and cash of approximately $121 million. The exchange was completed to retire high coupon debt in the current favorable interest rate environment. The debt exchange was accounted for as a non-revolving debt modification in accordance with accounting guidance, and therefore it did not result in any gain or loss recorded in the Consolidated Statement of Earnings. Cash payments will be amortized over the life of the new debt. Administrative fees with third parties in relation to the exchange were expensed as incurred.
EquityTotal equity decreased by $1,252 million as a result of an increase in treasury stock of $12,168 million; pension adjustments of $3,669 million reflecting the impact of retirement-related plan remeasure-ments; partially offset by an increase in retained earnings of $12,783 million, and an increase of $1,980 million in common stock primarily driven by stock option exercises and stock based compensation.
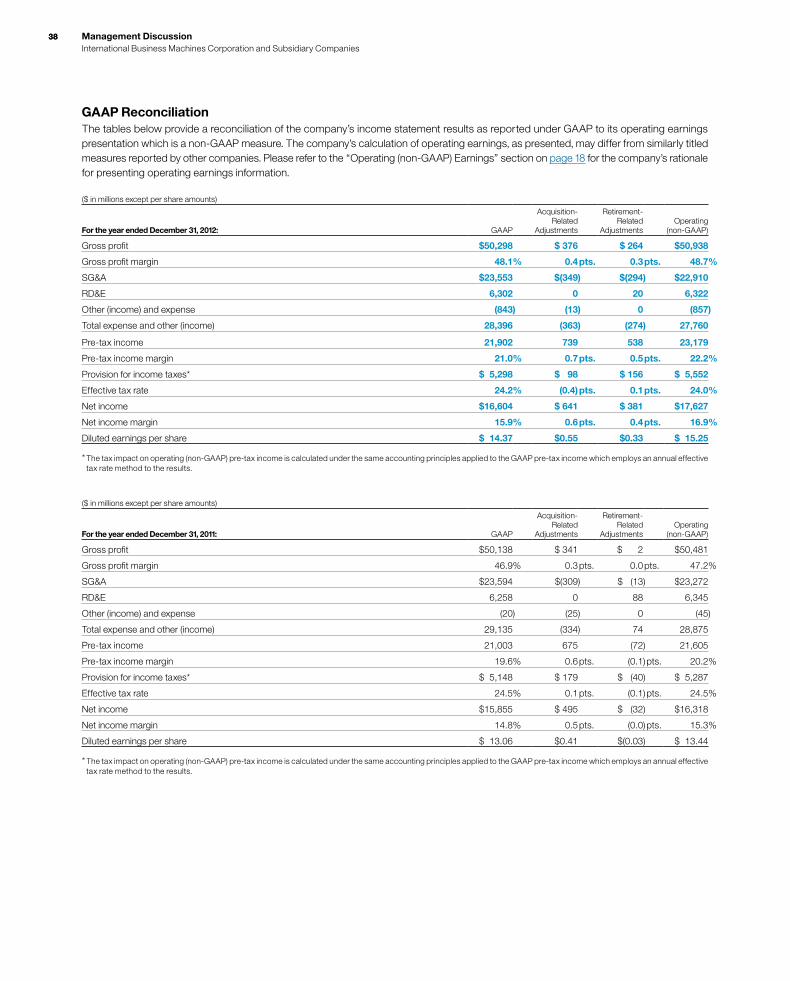
3838 Management Discussion International Business Machines Corporation and Subsidiary Companies
GAAP ReconciliationThe tables below provide a reconciliation of the company’s income statement results as reported under GAAP to its operating earnings presentation which is a non-GAAP measure. The company’s calculation of operating earnings, as presented, may differ from similarly titled measures reported by other companies. Please refer to the “Operating (non-GAAP) Earnings” section on page 18 for the company’s rationale for presenting operating earnings information.
($ in millions except per share amounts)
For the year ended December 31, 2012: GAAP
Acquisition-Related
Adjustments
Retirement-Related
AdjustmentsOperating
(non-GAAP)
Gross profit $50,298 $ 376 $ 264 $50,938
Gross profit margin 48.1% 0.4 pts. 0.3 pts. 48.7%
SG&A $23,553 $(349) $(294) $22,910
RD&E 6,302 0 20 6,322
Other (income) and expense (843) (13) 0 (857)
Total expense and other (income) 28,396 (363) (274) 27,760
Pre-tax income 21,902 739 538 23,179
Pre-tax income margin 21.0% 0.7 pts. 0.5 pts. 22.2%
Provision for income taxes* $ 5,298 $ 98 $ 156 $ 5,552
Effective tax rate 24.2% (0.4) pts. 0.1 pts. 24.0%
Net income $16,604 $ 641 $ 381 $17,627
Net income margin 15.9% 0.6 pts. 0.4 pts. 16.9%
Diluted earnings per share $ 14.37 $0.55 $0.33 $ 15.25
* The tax impact on operating (non-GAAP) pre-tax income is calculated under the same accounting principles applied to the GAAP pre-tax income which employs an annual effective tax rate method to the results.
($ in millions except per share amounts)
For the year ended December 31, 2011: GAAP
Acquisition-Related
Adjustments
Retirement-Related
AdjustmentsOperating
(non-GAAP)
Gross profit $50,138 $ 341 $ 2 $50,481
Gross profit margin 46.9% 0.3 pts. 0.0 pts. 47.2%
SG&A $23,594 $(309) $ (13 ) $23,272
RD&E 6,258 0 88 6,345
Other (income) and expense (20) (25) 0 (45)
Total expense and other (income) 29,135 (334) 74 28,875
Pre-tax income 21,003 675 (72) 21,605
Pre-tax income margin 19.6% 0.6 pts. (0.1) pts. 20.2%
Provision for income taxes* $ 5,148 $ 179 $ (40) $ 5,287
Effective tax rate 24.5% 0.1 pts. (0.1) pts. 24.5%
Net income $15,855 $ 495 $ (32) $16,318
Net income margin 14.8% 0.5 pts. (0.0) pts. 15.3%
Diluted earnings per share $ 13.06 $0.41 $(0.03) $ 13.44
* The tax impact on operating (non-GAAP) pre-tax income is calculated under the same accounting principles applied to the GAAP pre-tax income which employs an annual effective tax rate method to the results.
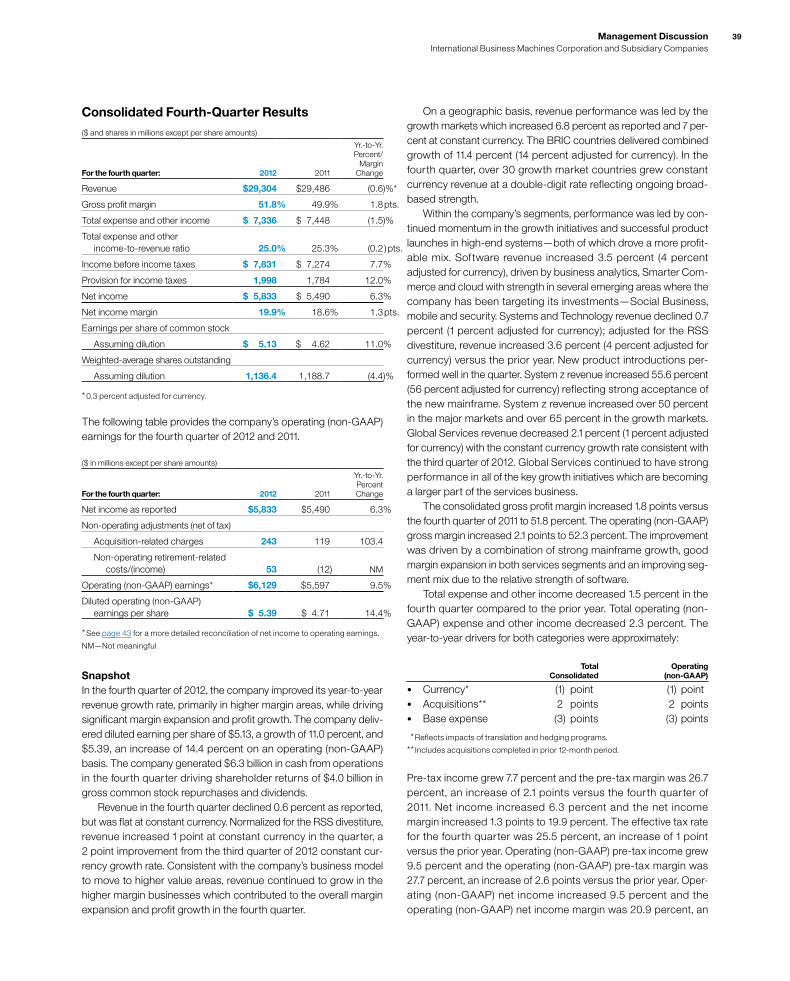
39Management Discussion International Business Machines Corporation and Subsidiary Companies
Consolidated Fourth-Quarter Results($ and shares in millions except per share amounts)
For the fourth quarter: 2012 2011
Yr.-to-Yr. Percent/
Margin Change
Revenue $29,304 $29,486 (0.6)%*
Gross profit margin 51.8% 49.9% 1.8 pts.
Total expense and other income $ 7,336 $ 7,448 (1.5)%
Total expense and other income-to-revenue ratio 25.0% 25.3% (0.2 ) pts.
Income before income taxes $ 7,831 $ 7,274 7.7%
Provision for income taxes 1,998 1,784 12.0%
Net income $ 5,833 $ 5,490 6.3%
Net income margin 19.9% 18.6% 1.3 pts.
Earnings per share of common stock
Assuming dilution $ 5.13 $ 4.62 11.0%
Weighted-average shares outstanding
Assuming dilution 1,136.4 1,188.7 (4.4)%
* 0.3 percent adjusted for currency.
The following table provides the company’s operating (non-GAAP) earnings for the fourth quarter of 2012 and 2011.
($ in millions except per share amounts)
For the fourth quarter: 2012 2011
Yr.-to-Yr. Percent Change
Net income as reported $5,833 $5,490 6.3%
Non-operating adjustments (net of tax)
Acquisition-related charges 243 119 103.4
Non-operating retirement-related costs/(income) 53 (12) NM
Operating (non-GAAP) earnings* $6,129 $ 5,597 9.5%
Diluted operating (non-GAAP) earnings per share $ 5.39 $ 4.71 14.4%
* See page 43 for a more detailed reconciliation of net income to operating earnings.
NM—Not meaningful
SnapshotIn the fourth quarter of 2012, the company improved its year-to-year revenue growth rate, primarily in higher margin areas, while driving significant margin expansion and profit growth. The company deliv-ered diluted earning per share of $5.13, a growth of 11.0 percent, and $5.39, an increase of 14.4 percent on an operating (non-GAAP) basis. The company generated $6.3 billion in cash from operations in the fourth quarter driving shareholder returns of $4.0 billion in gross common stock repurchases and dividends. Revenue in the fourth quarter declined 0.6 percent as reported, but was flat at constant currency. Normalized for the RSS divestiture, revenue increased 1 point at constant currency in the quarter, a 2 point improvement from the third quarter of 2012 constant cur-rency growth rate. Consistent with the company’s business model to move to higher value areas, revenue continued to grow in the higher margin businesses which contributed to the overall margin expansion and profit growth in the fourth quarter.
On a geographic basis, revenue performance was led by the growth markets which increased 6.8 percent as reported and 7 per-cent at constant currency. The BRIC countries delivered combined growth of 11.4 percent (14 percent adjusted for currency). In the fourth quarter, over 30 growth market countries grew constant currency revenue at a double-digit rate reflecting ongoing broad-based strength. Within the company’s segments, performance was led by con-tinued momentum in the growth initiatives and successful product launches in high-end systems—both of which drove a more profit-able mix. Software revenue increased 3.5 percent (4 percent adjusted for currency), driven by business analytics, Smarter Com-merce and cloud with strength in several emerging areas where the company has been targeting its investments—Social Business, mobile and security. Systems and Technology revenue declined 0.7 percent (1 percent adjusted for currency); adjusted for the RSS divestiture, revenue increased 3.6 percent (4 percent adjusted for currency) versus the prior year. New product introductions per-formed well in the quarter. System z revenue increased 55.6 percent (56 percent adjusted for currency) reflecting strong acceptance of the new mainframe. System z revenue increased over 50 percent in the major markets and over 65 percent in the growth markets. Global Services revenue decreased 2.1 percent (1 percent adjusted for currency) with the constant currency growth rate consistent with the third quarter of 2012. Global Services continued to have strong performance in all of the key growth initiatives which are becoming a larger part of the services business. The consolidated gross profit margin increased 1.8 points versus the fourth quarter of 2011 to 51.8 percent. The operating (non-GAAP) gross margin increased 2.1 points to 52.3 percent. The improvement was driven by a combination of strong mainframe growth, good margin expansion in both services segments and an improving seg-ment mix due to the relative strength of software. Total expense and other income decreased 1.5 percent in the fourth quarter compared to the prior year. Total operating (non-GAAP) expense and other income decreased 2.3 percent. The year-to-year drivers for both categories were approximately:
Total Operating Consolidated (non-GAAP)
• Currency* (1) point (1) point• Acquisitions** 2 points 2 points• Base expense (3) points (3) points
* Reflects impacts of translation and hedging programs.
** Includes acquisitions completed in prior 12-month period.
Pre-tax income grew 7.7 percent and the pre-tax margin was 26.7 percent, an increase of 2.1 points versus the fourth quarter of 2011. Net income increased 6.3 percent and the net income margin increased 1.3 points to 19.9 percent. The effective tax rate for the fourth quarter was 25.5 percent, an increase of 1 point versus the prior year. Operating (non-GAAP) pre-tax income grew 9.5 percent and the operating (non-GAAP) pre-tax margin was 27.7 percent, an increase of 2.6 points versus the prior year. Oper-ating (non-GAAP) net income increased 9.5 percent and the operating (non-GAAP) net income margin was 20.9 percent, an
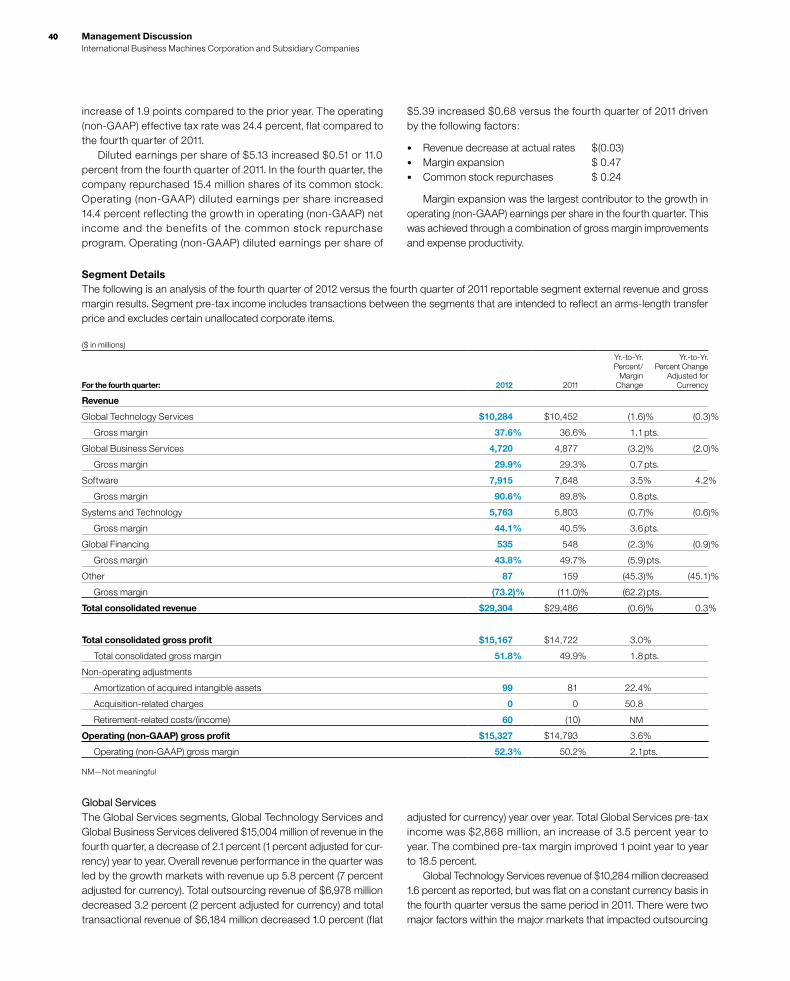
4040 Management Discussion International Business Machines Corporation and Subsidiary Companies
Segment DetailsThe following is an analysis of the fourth quarter of 2012 versus the fourth quarter of 2011 reportable segment external revenue and gross margin results. Segment pre-tax income includes transactions between the segments that are intended to reflect an arms-length transfer price and excludes certain unallocated corporate items.
($ in millions)
For the fourth quarter: 2012 2011
Yr.-to-Yr. Percent/
Margin Change
Yr.-to-Yr. Percent Change
Adjusted for Currency
Revenue
Global Technology Services $10,284 $10,452 (1.6)% (0.3)%
Gross margin 37.6% 36.6% 1.1 pts.
Global Business Services 4,720 4,877 (3.2)% (2.0)%
Gross margin 29.9% 29.3% 0.7 pts.
Software 7,915 7,648 3.5% 4.2%
Gross margin 90.6% 89.8% 0.8 pts.
Systems and Technology 5,763 5,803 (0.7)% (0.6)%
Gross margin 44.1% 40.5% 3.6 pts.
Global Financing 535 548 (2.3)% (0.9)%
Gross margin 43.8% 49.7% (5.9) pts.
Other 87 159 (45.3)% (45.1)%
Gross margin (73.2)% (11.0)% (62.2) pts.
Total consolidated revenue $29,304 $29,486 (0.6)% 0.3%
Total consolidated gross profit $15,167 $14,722 3.0%
Total consolidated gross margin 51.8% 49.9% 1.8 pts.
Non-operating adjustments
Amortization of acquired intangible assets 99 81 22.4%
Acquisition-related charges 0 0 50.8
Retirement-related costs/(income) 60 (10) NM
Operating (non-GAAP) gross profit $15,327 $14,793 3.6%
Operating (non-GAAP) gross margin 52.3% 50.2% 2.1 pts.
NM—Not meaningful
Global ServicesThe Global Services segments, Global Technology Services and Global Business Services delivered $15,004 million of revenue in the fourth quarter, a decrease of 2.1 percent (1 percent adjusted for cur-rency) year to year. Overall revenue performance in the quarter was led by the growth markets with revenue up 5.8 percent (7 percent adjusted for currency). Total outsourcing revenue of $6,978 million decreased 3.2 percent (2 percent adjusted for currency) and total transactional revenue of $6,184 million decreased 1.0 percent (flat
adjusted for currency) year over year. Total Global Services pre-tax income was $2,868 million, an increase of 3.5 percent year to year. The combined pre-tax margin improved 1 point year to year to 18.5 percent. Global Technology Services revenue of $10,284 million decreased 1.6 percent as reported, but was flat on a constant currency basis in the fourth quarter versus the same period in 2011. There were two major factors within the major markets that impacted outsourcing
increase of 1.9 points compared to the prior year. The operating (non-GAAP) effective tax rate was 24.4 percent, flat compared to the fourth quarter of 2011. Diluted earnings per share of $5.13 increased $0.51 or 11.0 percent from the fourth quarter of 2011. In the fourth quarter, the company repurchased 15.4 million shares of its common stock. Operating (non-GAAP) diluted earnings per share increased 14.4 percent reflecting the growth in operating (non-GAAP) net income and the benefits of the common stock repurchase program. Operating (non-GAAP) diluted earnings per share of
$5.39 increased $0.68 versus the fourth quarter of 2011 driven by the following factors:
• Revenue decrease at actual rates $ (0.03)• Margin expansion $ 0.47• Common stock repurchases $ 0.24
Margin expansion was the largest contributor to the growth in operating (non-GAAP) earnings per share in the fourth quarter. This was achieved through a combination of gross margin improvements and expense productivity.
41Management Discussion International Business Machines Corporation and Subsidiary Companies
revenue growth in the quarter. First, GTS did a tremendous amount of work to address a number of low margin contracts to improve the profitability of the outsourcing portfolio. The benefits of that work were realized in profit and margin performance, though it did have some impact on revenue. In the fourth quarter, the impact was 1 point of year-to-year revenue growth to GTS, and to Global Services in total. Second, revenue from sales and volumes into existing base accounts declined year to year in the fourth quarter. This activity tends to be more transactional in nature and economically sensitive. The impact of these factors are reflected in GTS Outsourcing revenue, which decreased 3.1 percent (2 percent adjusted for currency) in the fourth quarter. Outsourcing revenue in the growth markets increased 6.1 percent, 8 percent at constant currency, and the outsourcing backlog in these markets was up 9 percent at constant currency. The backlog growth reflects an ongoing trend as clients are building out their infra-structures and scaling to meet the growth objectives of their businesses. ITS revenue of $2,542 million increased 2.1 percent (3 percent adjusted for currency) in the fourth quarter with the growth markets up 10.1 percent (10 percent at constant currency). GTS gross profit increased 1.3 percent and the gross profit margin improved 1.1 points to 37.6 percent with margin improvement across all lines of business. GTS fourth-quarter 2012 pre-tax income increased 5.0 percent to $2,027 million with the pre-tax margin expanding 1.2 points to 19.2 percent, versus the fourth quarter of 2011. Margin expansion resulted from increased efficiency and productivity from the focus on automation and process, primarily through the company’s enterprise productivity initiatives. Global Business Services revenue of $4,720 million decreased 3.2 percent (2 percent adjusted for currency) in the fourth quarter of 2012. From a geographic perspective, the growth markets increased 2.0 percent (3 percent at constant currency) and Japan improved 0.3 percent (6 percent at constant currency)—the second consecutive quarter of revenue growth in Japan. The growth initia-tives continued to drive strong performance with double-digit revenue growth in business analytics, Smarter Planet and cloud offerings in the quarter. Application Outsourcing revenue decreased 3.8 percent (2 percent adjusted for currency) and C&SI revenue decreased 3.0 percent (2 percent adjusted for currency). GBS has been taking actions to address the more traditional customized packaged application work including: adding partners, increasing sales capability and targeting and closing large transformational opportunities in the growth markets. GBS gross profit decreased 1.0 percent in the fourth quarter with the gross profit margin expanding 0.7 points versus the prior year. GBS pre-tax income of $841 million was essentially flat year to year with a pre-tax margin of 17.2 percent, an improvement of 0.6 points. Improved utilization and improved services delivery more than offset the impact from revenue.
SoftwareSoftware revenue of $7,915 million increased 3.5 percent (4 percent adjusted for currency) in the fourth quarter with growth in all the key brands, and particular strength and share gains in WebSphere, Lotus and Rational. Key branded middleware revenue increased 5.4 percent (6 percent adjusted for currency) year to year and gained share as the software business continued to be the leader in the middleware market. The software business had continued
momentum across its brands in the growth initiatives in the fourth quarter with strong performance in business analytics, Smarter Commerce and cloud. WebSphere revenue increased 10.6 percent (11 percent adjusted for currency) in the fourth quarter year to year and gained share. The company continued to expand its portfolio to capture the emerging opportunity around mobile computing and had solid revenue growth in several of its core WebSphere offerings, such as application servers and commerce in the fourth quarter. Information Management revenue increased 2.2 percent (3 percent adjusted for currency) and held share with strong performance in Information Integration and predictive analytics, both driven by big data. Tivoli revenue increased 4.3 percent (5 percent adjusted for currency) and held share, led by its storage and security offerings. Revenue from the storage portfolio increased 12 percent (13 percent adjusted for currency), reflecting the continued value of storage software. Tivoli security increased 16 percent (16 percent adjusted for currency) driven by Q1 Labs. Lotus revenue increased 8.6 per-cent (9 percent adjusted for currency) and gained share as the Lotus portfolio continues to transform to the faster-growing social busi-ness offerings. Revenue growth was driven by strong performance from the existing social business offerings and the recent acquisition of Kenexa, which closed in December 2012. Kenexa helps clients create a more efficient and effective workforce, and brings a unique combination of cloud-based technology and consulting services to an already extensive portfolio of social business solutions. Rational revenue increased 11.6 percent (12 percent adjusted for currency) in the fourth quarter and gained share. Growth was driven by double-digit growth in both analysis, modeling and design software and the Automated Software Quality business. Software gross profit increased 4.5 percent and the gross profit margin expanded 0.8 points to 90.6 percent. Software delivered pre-tax income of $4,017 million in the fourth quarter, a growth of 8.3 percent compared to the fourth quarter of 2011, with a pre-tax margin of 46.0 percent, up 2.4 points.
Systems and TechnologySystems and Technology revenue of $5,763 million decreased 0.7 percent (1 percent adjusted for currency); adjusted for the RSS divestiture, revenue increased 3.6 percent (4 percent adjusted for currency). Performance was driven by the company’s new main-frame and momentum in PureSystems—the company’s new expert integrated systems. System z revenue increased 55.6 per-cent (56 percent adjusted for currency) driven by the first full quarter of the new mainframe product. MIPS shipments increased 66 percent year to year; the largest quarter of MIPS shipments in history. Approximately half of these MIPS were specialty engines, which were up over 80 percent year to year driven by Linux work-loads. Revenue growth in System z was over 50 percent in the major markets and over 65 percent in the growth markets. In the growth markets, the company had strong sales to established as well as new mainframe customers. Power Systems revenue decreased 18.9 percent (19 percent adjusted for currency), although both the new POWER7+ midrange and high-end Power servers performed well in the quarter. In the fourth quarter, the company had over 350 competitive displacements resulting in over $335 million of business; approximately half of which came from

4242 Management Discussion International Business Machines Corporation and Subsidiary Companies
Oracle/Sun and half from Hewlett Packard. System x revenue decreased 2.5 percent (3 percent adjusted for currency) in the fourth quarter year to year. Storage hardware revenue decreased 5.4 per-cent (5 percent adjusted for currency) driven by tape products. Total tape revenue decreased 23 percent (23 percent adjusted for cur-rency) while total disk revenue was essentially flat year to year. Within disk, the company announced the new high-end DS8870 in October 2012, and the product was sold out in the fourth quarter. Systems and Technology gross margin increased 3.6 points to 44.1 percent driven primarily by a mix to the higher margin System z in the fourth quarter of 2012. Systems and Technology’s pre-tax income increased 23.2 percent to $974 million in the fourth quarter and the pre-tax margin increased 3.2 points to 16.4 percent. Systems and Technology’s profit performance was driven by the new product introductions in mainframe, Power, Storage and PureSystems.
Global FinancingGlobal Financing revenue of $535 million decreased 2.3 percent (1 percent adjusted for currency), driven by a decrease in financing revenue, partially offset by an increase in used equipment sales revenue. The Global Financing fourth-quarter pre-tax income increased 0.7 percent to $518 million and the pre-tax margin increased 0.9 points to 46.9 percent.
Geographic RevenueTotal geographic revenue of $28,624 million decreased 0.5 percent (flat adjusted for currency) in the fourth quarter of 2012 compared to the prior year. Americas revenue of $12,550 million increased 0.3 percent (1 percent adjusted for currency) in 2012, led by strong growth in Latin America (up 13.5 percent as reported and 18 percent adjusted for currency). The U.S. was down 0.7 percent, but the growth rate improved 3 points compared to the third quarter of 2012. Canada was down 6.2 percent (9 percent adjusted for currency) compared to strong year-to-year growth of 13 percent at constant currency in the fourth quarter of 2011. EMEA revenue of $9,091 million decreased 5.0 percent (3 percent adjusted for currency), reflecting the macroeconomic climate in that region. Germany was down 7.0 percent (4 percent adjusted for currency) and the UK was down 4.7 percent (7 percent adjusted for currency). Italy revenue decreased 3.4 percent (flat adjusted for currency), an improvement sequentially from the third-quarter constant currency growth rate. Asia Pacific revenue of $6,984 million increased 4.2 percent (5 per-cent adjusted for currency) led by Japan, which returned to growth (0.2 percent as reported, 5 percent at constant currency) in the fourth quarter of 2012. Across all geographies, revenue from the growth markets increased 6.8 percent (7 percent adjusted for cur-rency) in the fourth quarter and outpaced growth in the major markets by 9 points on a constant currency basis. Revenue perfor-mance was again broad based with over 30 growth market countries delivering double-digit revenue growth year to year, adjusted for currency. Within the BRIC countries, combined revenue increased 11.4 percent (14 percent adjusted for currency), the stron-gest quarterly growth in 2012. Brazil returned to growth in the fourth quarter with revenue up 15.5 percent (24 percent adjusted for cur-rency). The growth markets also had good performance in Africa, led by South Africa, and in the Middle East.
OEM revenue of $679 million in the fourth quarter decreased 4.9 percent (5 percent adjusted for currency) compared to the prior year.
Total Expense and Other Income
($ in millions)
For the fourth quarter: 2012 2011
Yr.-to-Yr. Percent/
Margin Change
Total consolidated expense and other (income) $7,336 $7,448 (1.5)%
Non-operating adjustments
Amortization of acquired intangible assets (86) (72) 19.6
Acquisition-related charges (12) (13) (8.2)
Non-operating retirement-related (costs)/income (23) 25 NM
Total operating (non-GAAP) expense and other (income) $7,215 $7,388 (2.3)%
Total consolidated expense-to-revenue ratio 25.0% 25.3% (0.2) pts.
Operating (non-GAAP) expense-to-revenue ratio 24.6% 25.1% (0.4) pts.
NM—Not meaningful
Total expense and other income decreased 1.5 percent year to year in the fourth quarter with an expense-to-revenue-ratio of 25.0 per-cent compared to 25.3 percent in the fourth quarter of 2011. Total operating (non-GAAP) expense and other income decreased 2.3 percent in the fourth quarter. The decrease in total expense and other income was primarily driven by lower base expense (3 points) and currency (1 point), partially offset by increased expense from the company’s acquisitions over the past 12 months (2 points). Within Selling, general and administrative expense, accounts receiv-able provisions were approximately $20 million in the fourth quarter of 2012 an improvement of nearly $70 million from the fourth quarter of 2011 when provisions were increased to reflect the European credit environment.
Cash FlowThe company generated $6,346 million in cash flow provided by operating activities, a decrease of $751 million compared to the fourth quarter of 2011, driven primarily by an increase in cash used in operating assets and liabilities ($889 million). Net cash used in investing activities of $4,092 million increased $587 million primarily due to an increase in cash used by non-operating finance receiv-ables ($501 million) and an increase in cash used from net purchases of marketable securities and other investments ($300 million). Net cash used in financing activities of $3,791 million increased $982 million compared to the prior year primarily due to a net decrease in cash from total debt ($1,397 million); partially offset by a decrease in cash used for gross common stock repurchases ($575 million).
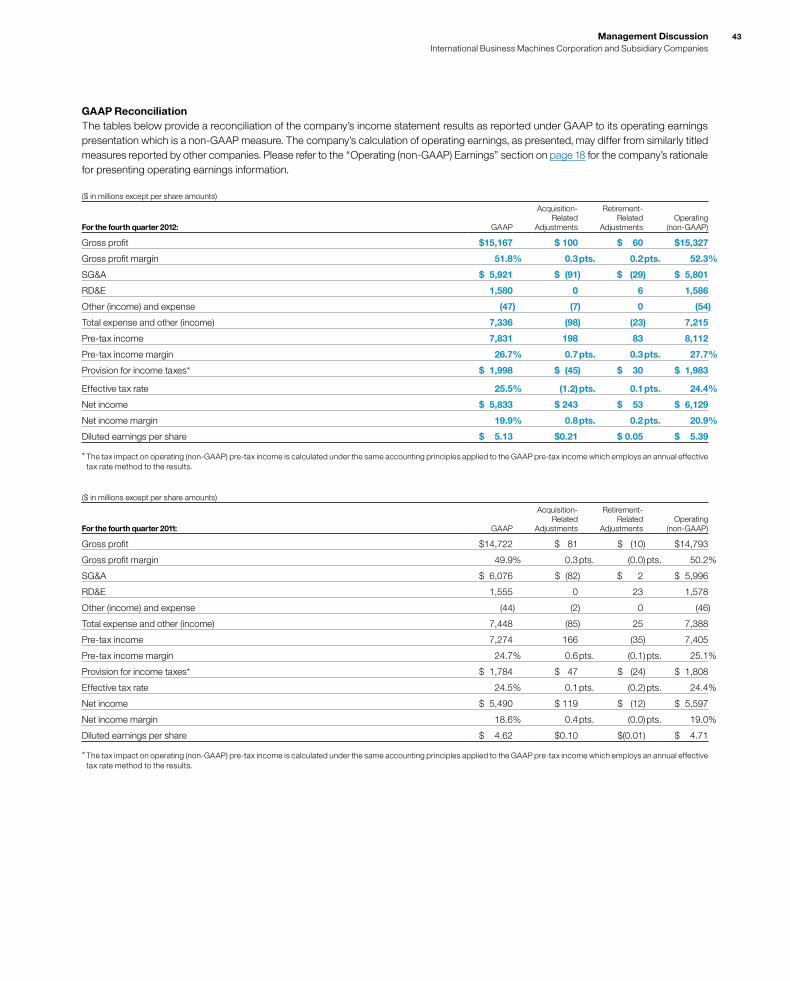
43Management Discussion International Business Machines Corporation and Subsidiary Companies
GAAP ReconciliationThe tables below provide a reconciliation of the company’s income statement results as reported under GAAP to its operating earnings presentation which is a non-GAAP measure. The company’s calculation of operating earnings, as presented, may differ from similarly titled measures reported by other companies. Please refer to the “Operating (non-GAAP) Earnings” section on page 18 for the company’s rationale for presenting operating earnings information.
($ in millions except per share amounts)
For the fourth quarter 2012: GAAP
Acquisition-Related
Adjustments
Retirement-Related
AdjustmentsOperating
(non-GAAP)
Gross profit $15,167 $ 100 $ 60 $15,327
Gross profit margin 51.8% 0.3 pts. 0.2 pts. 52.3%
SG&A $ 5,921 $ (91) $ (29) $ 5,801
RD&E 1,580 0 6 1,586
Other (income) and expense (47) (7) 0 (54)
Total expense and other (income) 7,336 (98) (23) 7,215
Pre-tax income 7,831 198 83 8,112
Pre-tax income margin 26.7% 0.7 pts. 0.3 pts. 27.7%
Provision for income taxes* $ 1,998 $ (45) $ 30 $ 1,983
Effective tax rate 25.5% (1.2) pts. 0.1 pts. 24.4%
Net income $ 5,833 $ 243 $ 53 $ 6,129
Net income margin 19.9% 0.8 pts. 0.2 pts. 20.9%
Diluted earnings per share $ 5.13 $0.21 $ 0.05 $ 5.39
* The tax impact on operating (non-GAAP) pre-tax income is calculated under the same accounting principles applied to the GAAP pre-tax income which employs an annual effective tax rate method to the results.
($ in millions except per share amounts)
For the fourth quarter 2011: GAAP
Acquisition-Related
Adjustments
Retirement-Related
AdjustmentsOperating
(non-GAAP)
Gross profit $14,722 $ 81 $ (10) $14,793
Gross profit margin 49.9% 0.3 pts. (0.0) pts. 50.2%
SG&A $ 6,076 $ (82) $ 2 $ 5,996
RD&E 1,555 0 23 1,578
Other (income) and expense (44) (2) 0 (46)
Total expense and other (income) 7,448 (85) 25 7,388
Pre-tax income 7,274 166 (35) 7,405
Pre-tax income margin 24.7% 0.6 pts. (0.1) pts. 25.1%
Provision for income taxes* $ 1,784 $ 47 $ (24) $ 1,808
Effective tax rate 24.5% 0.1 pts. (0.2) pts. 24.4%
Net income $ 5,490 $ 119 $ (12) $ 5,597
Net income margin 18.6% 0.4 pts. (0.0) pts. 19.0%
Diluted earnings per share $ 4.62 $0.10 $(0.01) $ 4.71
* The tax impact on operating (non-GAAP) pre-tax income is calculated under the same accounting principles applied to the GAAP pre-tax income which employs an annual effective tax rate method to the results.
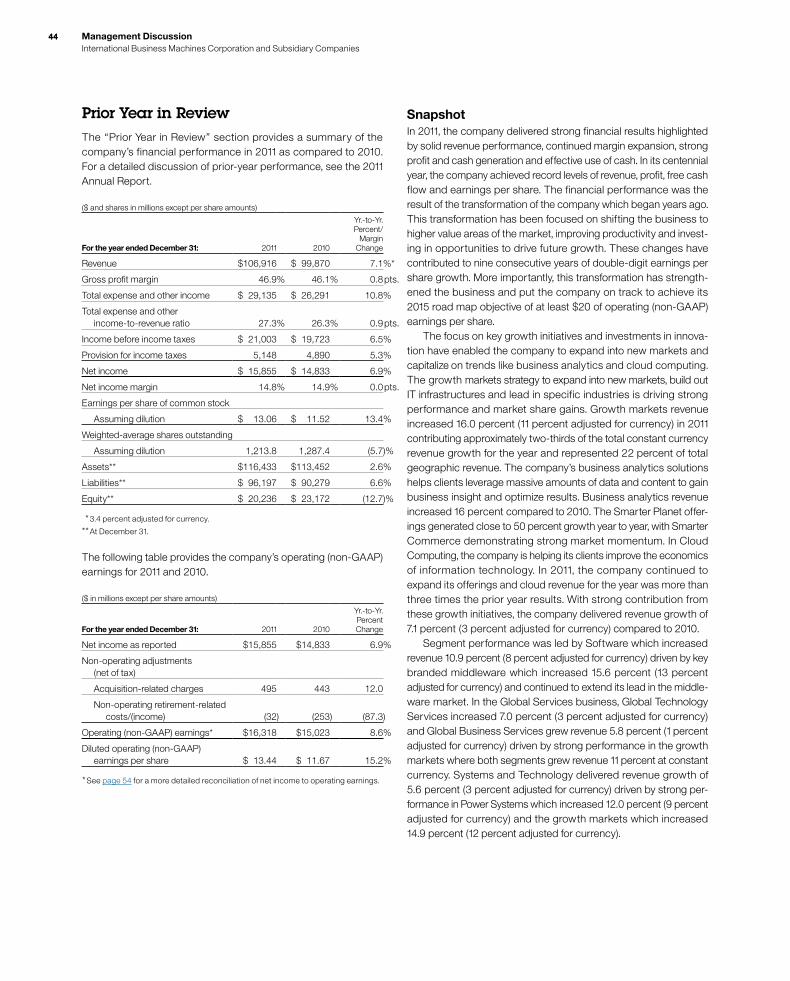
4444 Management Discussion International Business Machines Corporation and Subsidiary Companies
Prior Year in ReviewThe “Prior Year in Review” section provides a summary of the company’s financial performance in 2011 as compared to 2010. For a detailed discussion of prior-year performance, see the 2011 Annual Report.
($ and shares in millions except per share amounts)
For the year ended December 31: 2011 2010
Yr.-to-Yr. Percent/
Margin Change
Revenue $106,916 $ 99,870 7.1%*
Gross profit margin 46.9% 46.1% 0.8 pts.
Total expense and other income $ 29,135 $ 26,291 10.8%
Total expense and other income-to-revenue ratio 27.3% 26.3% 0.9 pts.
Income before income taxes $ 21,003 $ 19,723 6.5%
Provision for income taxes 5,148 4,890 5.3%
Net income $ 15,855 $ 14,833 6.9%
Net income margin 14.8% 14.9% 0.0 pts.
Earnings per share of common stock
Assuming dilution $ 13.06 $ 11.52 13.4%
Weighted-average shares outstanding
Assuming dilution 1,213.8 1,287.4 (5.7)%
Assets** $116,433 $113,452 2.6%
Liabilities** $ 96,197 $ 90,279 6.6%
Equity** $ 20,236 $ 23,172 (12.7)%
* 3.4 percent adjusted for currency.
** At December 31.
The following table provides the company’s operating (non-GAAP) earnings for 2011 and 2010.
($ in millions except per share amounts)
For the year ended December 31: 2011 2010
Yr.-to-Yr. Percent Change
Net income as reported $15,855 $14,833 6.9%
Non-operating adjustments (net of tax)
Acquisition-related charges 495 443 12.0
Non-operating retirement-related costs/(income) (32) (253) (87.3)
Operating (non-GAAP) earnings* $16,318 $15,023 8.6%
Diluted operating (non-GAAP)earnings per share $ 13.44 $ 11.67 15.2%
* See page 54 for a more detailed reconciliation of net income to operating earnings.
SnapshotIn 2011, the company delivered strong financial results highlighted by solid revenue performance, continued margin expansion, strong profit and cash generation and effective use of cash. In its centennial year, the company achieved record levels of revenue, profit, free cash flow and earnings per share. The financial performance was the result of the transformation of the company which began years ago. This transformation has been focused on shifting the business to higher value areas of the market, improving productivity and invest-ing in opportunities to drive future growth. These changes have contributed to nine consecutive years of double-digit earnings per share growth. More importantly, this transformation has strength-ened the business and put the company on track to achieve its 2015 road map objective of at least $20 of operating (non-GAAP) earnings per share. The focus on key growth initiatives and investments in innova-tion have enabled the company to expand into new markets and capitalize on trends like business analytics and cloud computing. The growth markets strategy to expand into new markets, build out IT infrastructures and lead in specific industries is driving strong performance and market share gains. Growth markets revenue increased 16.0 percent (11 percent adjusted for currency) in 2011 contributing approximately two-thirds of the total constant currency revenue growth for the year and represented 22 percent of total geographic revenue. The company’s business analytics solutions helps clients leverage massive amounts of data and content to gain business insight and optimize results. Business analytics revenue increased 16 percent compared to 2010. The Smarter Planet offer-ings generated close to 50 percent growth year to year, with Smarter Commerce demonstrating strong market momentum. In Cloud Computing, the company is helping its clients improve the economics of information technology. In 2011, the company continued to expand its offerings and cloud revenue for the year was more than three times the prior year results. With strong contribution from these growth initiatives, the company delivered revenue growth of 7.1 percent (3 percent adjusted for currency) compared to 2010. Segment performance was led by Software which increased revenue 10.9 percent (8 percent adjusted for currency) driven by key branded middleware which increased 15.6 percent (13 percent adjusted for currency) and continued to extend its lead in the middle-ware market. In the Global Services business, Global Technology Services increased 7.0 percent (3 percent adjusted for currency) and Global Business Services grew revenue 5.8 percent (1 percent adjusted for currency) driven by strong performance in the growth markets where both segments grew revenue 11 percent at constant currency. Systems and Technology delivered revenue growth of 5.6 percent (3 percent adjusted for currency) driven by strong per-formance in Power Systems which increased 12.0 percent (9 percent adjusted for currency) and the growth markets which increased 14.9 percent (12 percent adjusted for currency).

45Management Discussion International Business Machines Corporation and Subsidiary Companies
The consolidated gross profit margin increased 0.8 points versus 2010 to 46.9 percent. This was the eighth consecutive year of improvement in the gross profit margin. The operating (non-GAAP) gross margin of 47.2 percent increased 1.1 points compared to the prior year. The increase in gross margin in 2011 was driven by margin improvements in Software, Systems and Technology and Global Services, and an improved revenue mix driven by Software. Total expense and other income increased 10.8 percent in 2011 versus the prior year. Total operating (non-GAAP) expense and other income increased 10.2 percent compared to the prior year. The year-to-year drivers for both categories were approximately:
• Currency* 4 points• Acquisitions** 3 points• Base expense 3 points
* Reflects impacts of translation and hedging programs.
** Includes acquisitions completed in prior 12-month period.
Pre-tax income grew 6.5 percent and the pre-tax margin was 19.6 percent, a decrease of 0.1 points versus 2010. Net income increased 6.9 percent and the net income margin was 14.8 percent, flat versus 2010. The effective tax rate for 2011 was 24.5 percent, compared with 24.8 percent in the prior year. Operating (non-GAAP) pre-tax income grew 8.7 percent and the operating (non-GAAP) pre-tax margin was 20.2 percent, an increase of 0.3 points versus the prior year. Operating (non-GAAP) earnings increased 8.6 percent and the operating (non-GAAP) earnings margin of 15.3 percent increased 0.2 points versus the prior year. The operating (non-GAAP) effective tax rate was 24.5 percent versus 24.4 percent in 2010. Diluted earnings per share improved 13.4 percent reflecting the growth in net income and the benefits of the common stock repur-chase program. In 2011, the company repurchased approximately 89 million shares of its common stock. Diluted earnings per share of $13.06 increased $1.54 from the prior year. Operating (non-GAAP) diluted earnings per share of $13.44 increased $1.77 versus 2010 driven by the following factors:
• Revenue increase at actual rates $0.82• Margin expansion $0.18• Common stock repurchases $0.77
At December 31, 2011, the company’s balance sheet and liquidity were well positioned to support the company’s objectives. Cash and cash equivalents at year end was $11,922 million. Key drivers in the balance sheet and total cash flows are highlighted below. Total assets increased $2,981 million ($4,636 million adjusted for currency) from December 31, 2010 driven by:
• Increases in total receivables ($1,564 million), cash and cash equivalents ($1,262 million), goodwill ($1,077 million) and prepaid expenses and other assets ($1,022 million), partially offset by
• Decreases in marketable securities ($990 million) and investments and sundry assets ($883 million).
Total liabilities increased $5,918 million ($6,324 million adjusted for currency) from December 31, 2010 driven by:
• Increases in total debt ($2,695 million), retirement and nonpension postretirement benefit obligations ($2,396 million), accounts payable ($713 million) and deferred income ($798 million), partially offset by
• Decreases in taxes payable ($903 million).
Total equity of $20,236 million decreased $2,937 million from December 31, 2010 as a result of:
• Increased treasury stock ($14,803 million) driven by share repurchases, pension adjustments ($2,448 million) and currency translation adjustments ($711 million), partially offset by
• Higher retained earnings ($12,326 million) and common stock ($2,711 million).
The company generated $19,846 million in cash flow from opera-tions, an increase of $298 million compared to 2010, primarily driven by the increase in net income. Net cash used in investing activities of $4,396 million was $4,111 million lower than 2010, driven by less cash used for acquisitions ($4,111 million). Net cash used in financing activities of $13,696 million was $1,267 million higher, compared to 2010, primarily due to lower cash from common stock transactions ($991 million) and increased dividend payments ($296 million).
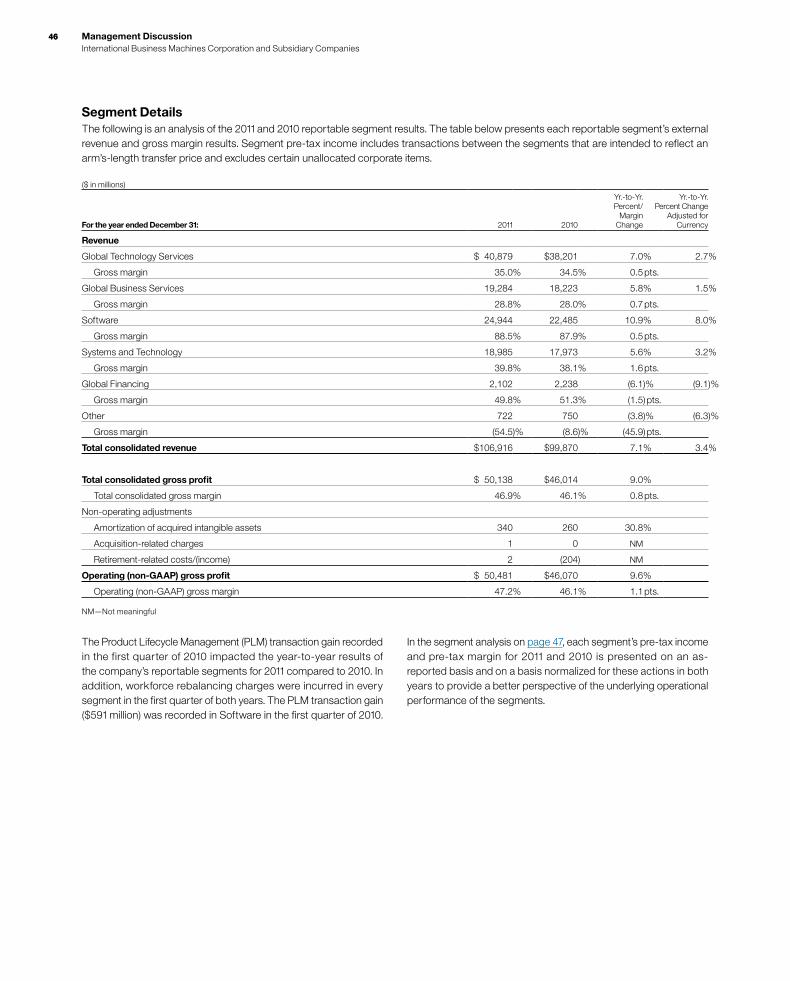
4646 Management Discussion International Business Machines Corporation and Subsidiary Companies
Segment DetailsThe following is an analysis of the 2011 and 2010 reportable segment results. The table below presents each reportable segment’s external revenue and gross margin results. Segment pre-tax income includes transactions between the segments that are intended to reflect an arm’s-length transfer price and excludes certain unallocated corporate items.
($ in millions)
For the year ended December 31: 2011 2010
Yr.-to-Yr. Percent/
Margin Change
Yr.-to-Yr. Percent Change
Adjusted for Currency
Revenue
Global Technology Services $ 40,879 $38,201 7.0% 2.7%
Gross margin 35.0% 34.5% 0.5 pts.
Global Business Services 19,284 18,223 5.8% 1.5%
Gross margin 28.8% 28.0% 0.7 pts.
Software 24,944 22,485 10.9% 8.0%
Gross margin 88.5% 87.9% 0.5 pts.
Systems and Technology 18,985 17,973 5.6% 3.2%
Gross margin 39.8% 38.1% 1.6 pts.
Global Financing 2,102 2,238 (6.1)% (9.1)%
Gross margin 49.8% 51.3% (1.5 ) pts.
Other 722 750 (3.8)% (6.3)%
Gross margin (54.5)% (8.6)% (45.9) pts.
Total consolidated revenue $106,916 $99,870 7.1% 3.4%
Total consolidated gross profit $ 50,138 $46,014 9.0%
Total consolidated gross margin 46.9% 46.1% 0.8 pts.
Non-operating adjustments
Amortization of acquired intangible assets 340 260 30.8%
Acquisition-related charges 1 0 NM
Retirement-related costs/(income) 2 (204) NM
Operating (non-GAAP) gross profit $ 50,481 $46,070 9.6%
Operating (non-GAAP) gross margin 47.2% 46.1% 1.1 pts.
NM—Not meaningful
The Product Lifecycle Management (PLM) transaction gain recorded in the first quarter of 2010 impacted the year-to-year results of the company’s reportable segments for 2011 compared to 2010. In addition, workforce rebalancing charges were incurred in every segment in the first quarter of both years. The PLM transaction gain ($591 million) was recorded in Software in the first quarter of 2010.
In the segment analysis on page 47, each segment’s pre-tax income and pre-tax margin for 2011 and 2010 is presented on an as-reported basis and on a basis normalized for these actions in both years to provide a better perspective of the underlying operational performance of the segments.
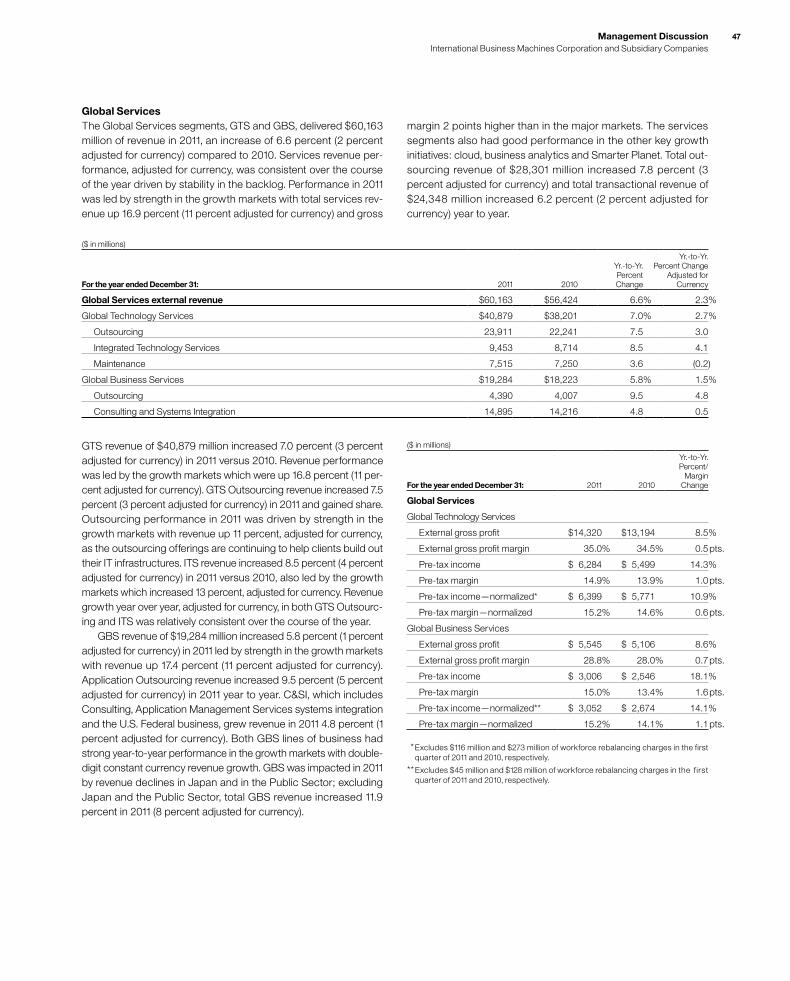
47Management Discussion International Business Machines Corporation and Subsidiary Companies
Global ServicesThe Global Services segments, GTS and GBS, delivered $60,163 million of revenue in 2011, an increase of 6.6 percent (2 percent adjusted for currency) compared to 2010. Services revenue per-formance, adjusted for currency, was consistent over the course of the year driven by stability in the backlog. Performance in 2011 was led by strength in the growth markets with total services rev-enue up 16.9 percent (11 percent adjusted for currency) and gross
GTS revenue of $40,879 million increased 7.0 percent (3 percent adjusted for currency) in 2011 versus 2010. Revenue performance was led by the growth markets which were up 16.8 percent (11 per-cent adjusted for currency). GTS Outsourcing revenue increased 7.5 percent (3 percent adjusted for currency) in 2011 and gained share. Outsourcing performance in 2011 was driven by strength in the growth markets with revenue up 11 percent, adjusted for currency, as the outsourcing offerings are continuing to help clients build out their IT infrastructures. ITS revenue increased 8.5 percent (4 percent adjusted for currency) in 2011 versus 2010, also led by the growth markets which increased 13 percent, adjusted for currency. Revenue growth year over year, adjusted for currency, in both GTS Outsourc-ing and ITS was relatively consistent over the course of the year. GBS revenue of $19,284 million increased 5.8 percent (1 percent adjusted for currency) in 2011 led by strength in the growth markets with revenue up 17.4 percent (11 percent adjusted for currency). Application Outsourcing revenue increased 9.5 percent (5 percent adjusted for currency) in 2011 year to year. C&SI, which includes Consulting, Application Management Services systems integration and the U.S. Federal business, grew revenue in 2011 4.8 percent (1 percent adjusted for currency). Both GBS lines of business had strong year-to-year performance in the growth markets with double-digit constant currency revenue growth. GBS was impacted in 2011 by revenue declines in Japan and in the Public Sector; excluding Japan and the Public Sector, total GBS revenue increased 11.9 percent in 2011 (8 percent adjusted for currency).
margin 2 points higher than in the major markets. The services segments also had good performance in the other key growth initiatives: cloud, business analytics and Smarter Planet. Total out-sourcing revenue of $28,301 million increased 7.8 percent (3 percent adjusted for currency) and total transactional revenue of $24,348 million increased 6.2 percent (2 percent adjusted for currency) year to year.
($ in millions)
For the year ended December 31: 2011 2010
Yr.-to-Yr. Percent/
Margin Change
Global Services
Global Technology Services
External gross profit $14,320 $13,194 8.5%
External gross profit margin 35.0% 34.5% 0.5 pts.
Pre-tax income $ 6,284 $ 5,499 14.3%
Pre-tax margin 14.9% 13.9% 1.0 pts.
Pre-tax income—normalized* $ 6,399 $ 5,771 10.9%
Pre-tax margin—normalized 15.2% 14.6% 0.6 pts.
Global Business Services
External gross profit $ 5,545 $ 5,106 8.6%
External gross profit margin 28.8% 28.0% 0.7 pts.
Pre-tax income $ 3,006 $ 2,546 18.1%
Pre-tax margin 15.0% 13.4% 1.6 pts.
Pre-tax income—normalized** $ 3,052 $ 2,674 14.1%
Pre-tax margin—normalized 15.2% 14.1% 1.1 pts.
* Excludes $116 million and $273 million of workforce rebalancing charges in the first quarter of 2011 and 2010, respectively.
** Excludes $45 million and $128 million of workforce rebalancing charges in the first quarter of 2011 and 2010, respectively.
($ in millions)
For the year ended December 31: 2011 2010
Yr.-to-Yr. Percent Change
Yr.-to-Yr. Percent Change
Adjusted for Currency
Global Services external revenue $60,163 $56,424 6.6% 2.3%
Global Technology Services $40,879 $38,201 7.0% 2.7%
Outsourcing 23,911 22,241 7.5 3.0
Integrated Technology Services 9,453 8,714 8.5 4.1
Maintenance 7,515 7,250 3.6 (0.2)
Global Business Services $19,284 $18,223 5.8% 1.5%
Outsourcing 4,390 4,007 9.5 4.8
Consulting and Systems Integration 14,895 14,216 4.8 0.5
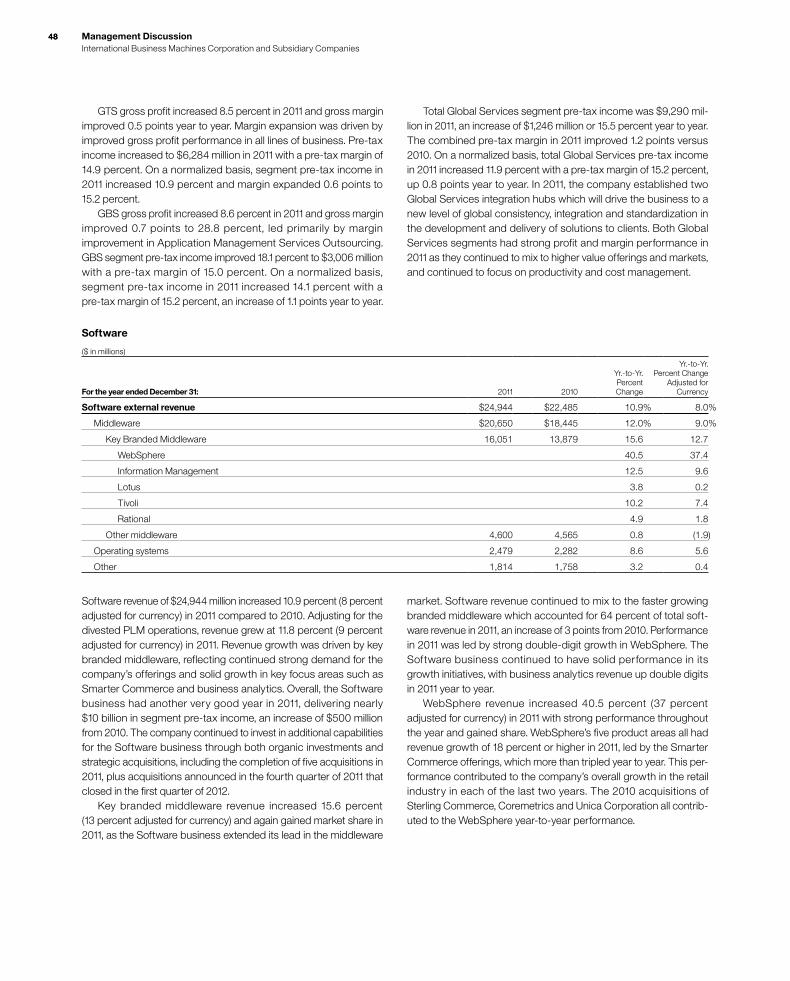
4848 Management Discussion International Business Machines Corporation and Subsidiary Companies
GTS gross profit increased 8.5 percent in 2011 and gross margin improved 0.5 points year to year. Margin expansion was driven by improved gross profit performance in all lines of business. Pre-tax income increased to $6,284 million in 2011 with a pre-tax margin of 14.9 percent. On a normalized basis, segment pre-tax income in 2011 increased 10.9 percent and margin expanded 0.6 points to 15.2 percent. GBS gross profit increased 8.6 percent in 2011 and gross margin improved 0.7 points to 28.8 percent, led primarily by margin improvement in Application Management Services Outsourcing. GBS segment pre-tax income improved 18.1 percent to $3,006 million with a pre-tax margin of 15.0 percent. On a normalized basis, segment pre-tax income in 2011 increased 14.1 percent with a pre-tax margin of 15.2 percent, an increase of 1.1 points year to year.
Total Global Services segment pre-tax income was $9,290 mil-lion in 2011, an increase of $1,246 million or 15.5 percent year to year. The combined pre-tax margin in 2011 improved 1.2 points versus 2010. On a normalized basis, total Global Services pre-tax income in 2011 increased 11.9 percent with a pre-tax margin of 15.2 percent, up 0.8 points year to year. In 2011, the company established two Global Services integration hubs which will drive the business to a new level of global consistency, integration and standardization in the development and delivery of solutions to clients. Both Global Services segments had strong profit and margin performance in 2011 as they continued to mix to higher value offerings and markets, and continued to focus on productivity and cost management.
Software
($ in millions)
For the year ended December 31: 2011 2010
Yr.-to-Yr. Percent Change
Yr.-to-Yr. Percent Change
Adjusted for Currency
Software external revenue $24,944 $22,485 10.9% 8.0%
Middleware $20,650 $18,445 12.0% 9.0%
Key Branded Middleware 16,051 13,879 15.6 12.7
WebSphere 40.5 37.4
Information Management 12.5 9.6
Lotus 3.8 0.2
Tivoli 10.2 7.4
Rational 4.9 1.8
Other middleware 4,600 4,565 0.8 (1.9)
Operating systems 2,479 2,282 8.6 5.6
Other 1,814 1,758 3.2 0.4
Software revenue of $24,944 million increased 10.9 percent (8 percent adjusted for currency) in 2011 compared to 2010. Adjusting for the divested PLM operations, revenue grew at 11.8 percent (9 percent adjusted for currency) in 2011. Revenue growth was driven by key branded middleware, reflecting continued strong demand for the company’s offerings and solid growth in key focus areas such as Smarter Commerce and business analytics. Overall, the Software business had another very good year in 2011, delivering nearly $10 billion in segment pre-tax income, an increase of $500 million from 2010. The company continued to invest in additional capabilities for the Software business through both organic investments and strategic acquisitions, including the completion of five acquisitions in 2011, plus acquisitions announced in the fourth quarter of 2011 that closed in the first quarter of 2012. Key branded middleware revenue increased 15.6 percent (13 percent adjusted for currency) and again gained market share in 2011, as the Software business extended its lead in the middleware
market. Software revenue continued to mix to the faster growing branded middleware which accounted for 64 percent of total soft-ware revenue in 2011, an increase of 3 points from 2010. Performance in 2011 was led by strong double-digit growth in WebSphere. The Software business continued to have solid performance in its growth initiatives, with business analytics revenue up double digits in 2011 year to year. WebSphere revenue increased 40.5 percent (37 percent adjusted for currency) in 2011 with strong performance throughout the year and gained share. WebSphere’s five product areas all had revenue growth of 18 percent or higher in 2011, led by the Smarter Commerce offerings, which more than tripled year to year. This per-formance contributed to the company’s overall growth in the retail industry in each of the last two years. The 2010 acquisitions of Sterling Commerce, Coremetrics and Unica Corporation all contrib-uted to the WebSphere year-to-year performance.
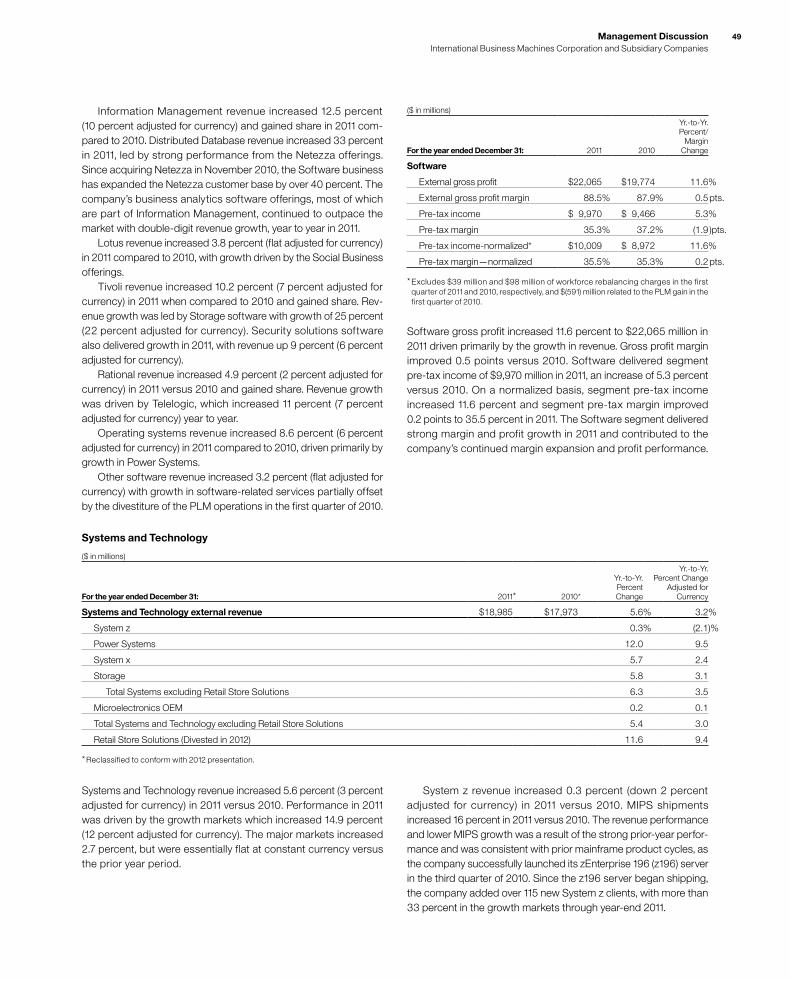
49Management Discussion International Business Machines Corporation and Subsidiary Companies
Information Management revenue increased 12.5 percent (10 percent adjusted for currency) and gained share in 2011 com-pared to 2010. Distributed Database revenue increased 33 percent in 2011, led by strong performance from the Netezza offerings. Since acquiring Netezza in November 2010, the Software business has expanded the Netezza customer base by over 40 percent. The company’s business analytics software offerings, most of which are part of Information Management, continued to outpace the market with double-digit revenue growth, year to year in 2011. Lotus revenue increased 3.8 percent (flat adjusted for currency) in 2011 compared to 2010, with growth driven by the Social Business offerings. Tivoli revenue increased 10.2 percent (7 percent adjusted for currency) in 2011 when compared to 2010 and gained share. Rev-enue growth was led by Storage software with growth of 25 percent (22 percent adjusted for currency). Security solutions software also delivered growth in 2011, with revenue up 9 percent (6 percent adjusted for currency). Rational revenue increased 4.9 percent (2 percent adjusted for currency) in 2011 versus 2010 and gained share. Revenue growth was driven by Telelogic, which increased 11 percent (7 percent adjusted for currency) year to year. Operating systems revenue increased 8.6 percent (6 percent adjusted for currency) in 2011 compared to 2010, driven primarily by growth in Power Systems. Other software revenue increased 3.2 percent (flat adjusted for currency) with growth in software-related services partially offset by the divestiture of the PLM operations in the first quarter of 2010.
($ in millions)
For the year ended December 31: 2011 2010
Yr.-to-Yr. Percent/
Margin Change
Software
External gross profit $22,065 $19,774 11.6%
External gross profit margin 88.5% 87.9% 0.5 pts.
Pre-tax income $ 9,970 $ 9,466 5.3%
Pre-tax margin 35.3% 37.2% (1.9 )pts.
Pre-tax income-normalized* $10,009 $ 8,972 11.6%
Pre-tax margin—normalized 35.5% 35.3% 0.2 pts.
* Excludes $39 million and $98 million of workforce rebalancing charges in the first quarter of 2011 and 2010, respectively, and $(591) million related to the PLM gain in the first quarter of 2010.
Software gross profit increased 11.6 percent to $22,065 million in 2011 driven primarily by the growth in revenue. Gross profit margin improved 0.5 points versus 2010. Software delivered segment pre-tax income of $9,970 million in 2011, an increase of 5.3 percent versus 2010. On a normalized basis, segment pre-tax income increased 11.6 percent and segment pre-tax margin improved 0.2 points to 35.5 percent in 2011. The Software segment delivered strong margin and profit growth in 2011 and contributed to the company’s continued margin expansion and profit performance.
Systems and Technology
($ in millions)
For the year ended December 31: 2011* 2010*
Yr.-to-Yr. Percent Change
Yr.-to-Yr. Percent Change
Adjusted for Currency
Systems and Technology external revenue $18,985 $17,973 5.6% 3.2%
System z 0.3% (2.1)%
Power Systems 12.0 9.5
System x 5.7 2.4
Storage 5.8 3.1
Total Systems excluding Retail Store Solutions 6.3 3.5
Microelectronics OEM 0.2 0.1
Total Systems and Technology excluding Retail Store Solutions 5.4 3.0
Retail Store Solutions (Divested in 2012) 11.6 9.4
* Reclassified to conform with 2012 presentation.
Systems and Technology revenue increased 5.6 percent (3 percent adjusted for currency) in 2011 versus 2010. Performance in 2011 was driven by the growth markets which increased 14.9 percent (12 percent adjusted for currency). The major markets increased 2.7 percent, but were essentially flat at constant currency versus the prior year period.
System z revenue increased 0.3 percent (down 2 percent adjusted for currency) in 2011 versus 2010. MIPS shipments increased 16 percent in 2011 versus 2010. The revenue performance and lower MIPS growth was a result of the strong prior-year perfor-mance and was consistent with prior mainframe product cycles, as the company successfully launched its zEnterprise 196 (z196) server in the third quarter of 2010. Since the z196 server began shipping, the company added over 115 new System z clients, with more than 33 percent in the growth markets through year-end 2011.

5050 Management Discussion International Business Machines Corporation and Subsidiary Companies
Geographic RevenueIn addition to the revenue presentation by reportable segment, the company also measures revenue performance on a geographic basis. The following geographic, regional and country-specific revenue performance excludes OEM revenue, which is discussed separately on page 51.
($ in millions)
For the year ended December 31: 2011 2010
Yr.-to-Yr. Percent Change
Yr.-to-Yr. Percent Change
Adjusted for Currency
Total revenue $106,916 $99,870 7.1% 3.4%
Geographies $104,170 $97,060 7.3% 3.6%
Americas 44,944 42,044 6.9 6.2
Europe/Middle East/Africa 33,952 31,866 6.5 1.6
Asia Pacific 25,273 23,150 9.2 1.7
Major markets 5.1% 1.6%
Growth markets 16.0% 11.4%
BRIC countries 18.6% 16.1%
Total geographic revenue increased 7.3 percent (4 percent adjusted for currency) to $104,170 million in 2011, led by strong performance in the growth markets.
Power Systems revenue increased 12.0 percent (9 percent adjusted for currency) in 2011 versus 2010 with performance driven by strong growth in high-end systems. High-end systems revenue increased 31 percent (28 percent adjusted for currency) in 2011 com-pared to 2010. The company extended its market leadership in 2011, having posted 15 consecutive quarters of year-to-year share gains. In addition, this was the second consecutive year that the company had over 1,000 competitive displacements, which this year gener-ated over $1 billion of business; approximately 50 percent of this business was from Hewlett Packard, with most of the balance from Oracle/Sun. System x revenue increased 5.7 percent (2 percent adjusted for currency) in 2011 compared to 2010. High-end System x revenue increased 35 percent (31 percent adjusted for currency) in 2011 versus the prior year. System x revenue increased 22 percent (18 percent adjusted for currency) in the growth markets and closed the year with its ninth consecutive quarter with a double-digit increase in the growth markets. Storage revenue increased 5.8 percent (3 percent adjusted for currency) in 2011 versus 2010. Total disk revenue increased 7 percent (4 percent adjusted for currency) in 2011 versus 2010, driven by growth in enterprise disk products. Tape revenue increased 3 per-cent (flat adjusted for currency) in 2011 versus 2010. When combined with storage software, total storage revenue increased 10 percent in 2011 compared to the prior year. Retail Stores Solutions revenue increased 11.6 percent (9 percent adjusted for currency) in 2011 versus the prior year. The brand gained share in 2011 and contributed to the company’s overall improved performance in the retail industry. Microelectronics OEM revenue increased 0.2 percent (flat adjusted for currency) in 2011 versus 2010, as the company shifted its production to meet internal demand.
($ in millions)
For the year ended December 31: 2011 2010
Yr.-to-Yr. Percent/
Margin Change
Systems and Technology
External gross profit $7,555 $6,856 10.2%
External gross profit margin 39.8% 38.1% 1.6 pts.
Pre-tax income $1,633 $1,456 12.2%
Pre-tax margin 8.2% 7.8% 0.5 pts.
Pre-tax income—normalized* $1,652 $1,513 9.2%
Pre-tax margin—normalized 8.3% 8.1% 0.3 pts.
* Excludes $19 million and $57 million of workforce rebalancing charges in the first quarter of 2011 and 2010, respectively.
The increase in external gross profit in 2011 versus 2010 was due to higher revenue and an improved overall gross profit margin. Overall gross margin increased 1.6 points in 2011 versus the prior year. The increase was primarily driven by margin improvements in Power Systems (1.2 points), System z (0.4 points) and System x (0.6 points), partially offset by lower margins in Microelectronics (0.6 points) and Storage (0.2 points). Systems and Technology’s pre-tax income increased $177 million (12.2 percent) to $1,633 million in 2011 and on a normalized basis increased $139 million to $1,652 million in 2011, when com-pared to the prior year. Pre-tax margin increased 0.5 points, and on a normalized basis 0.3 points, versus the prior year.
Global FinancingSee pages 63 through 67 for an analysis of Global Financing’s segment results.
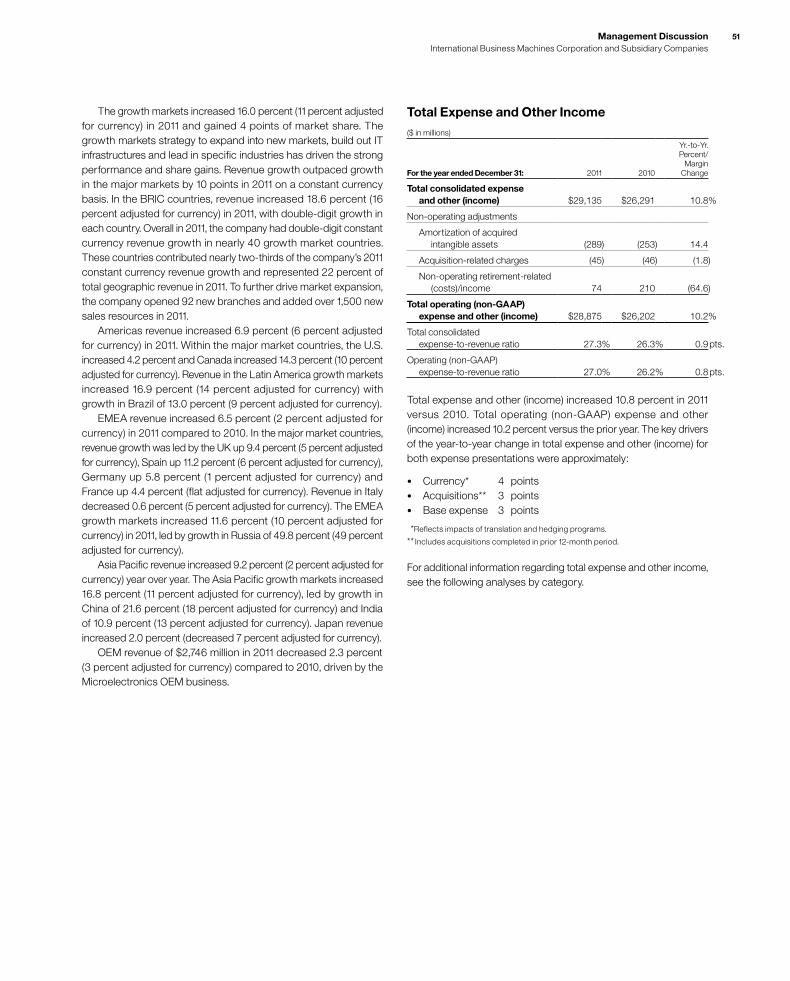
51Management Discussion International Business Machines Corporation and Subsidiary Companies
Total Expense and Other Income($ in millions)
For the year ended December 31: 2011 2010
Yr.-to-Yr. Percent/
Margin Change
Total consolidated expense and other (income) $29,135 $26,291 10.8%
Non-operating adjustments
Amortization of acquired intangible assets (289) (253) 14.4
Acquisition-related charges (45) (46) (1.8)
Non-operating retirement-related (costs)/income 74 210 (64.6)
Total operating (non-GAAP) expense and other (income) $28,875 $26,202 10.2%
Total consolidated expense-to-revenue ratio 27.3% 26.3% 0.9 pts.
Operating (non-GAAP) expense-to-revenue ratio 27.0% 26.2% 0.8 pts.
Total expense and other (income) increased 10.8 percent in 2011 versus 2010. Total operating (non-GAAP) expense and other (income) increased 10.2 percent versus the prior year. The key drivers of the year-to-year change in total expense and other (income) for both expense presentations were approximately:
• Currency* 4 points• Acquisitions** 3 points• Base expense 3 points
*Reflects impacts of translation and hedging programs.
** Includes acquisitions completed in prior 12-month period.
For additional information regarding total expense and other income, see the following analyses by category.
The growth markets increased 16.0 percent (11 percent adjusted for currency) in 2011 and gained 4 points of market share. The growth markets strategy to expand into new markets, build out IT infrastructures and lead in specific industries has driven the strong performance and share gains. Revenue growth outpaced growth in the major markets by 10 points in 2011 on a constant currency basis. In the BRIC countries, revenue increased 18.6 percent (16 percent adjusted for currency) in 2011, with double-digit growth in each country. Overall in 2011, the company had double-digit constant currency revenue growth in nearly 40 growth market countries. These countries contributed nearly two-thirds of the company’s 2011 constant currency revenue growth and represented 22 percent of total geographic revenue in 2011. To further drive market expansion, the company opened 92 new branches and added over 1,500 new sales resources in 2011. Americas revenue increased 6.9 percent (6 percent adjusted for currency) in 2011. Within the major market countries, the U.S. increased 4.2 percent and Canada increased 14.3 percent (10 percent adjusted for currency). Revenue in the Latin America growth markets increased 16.9 percent (14 percent adjusted for currency) with growth in Brazil of 13.0 percent (9 percent adjusted for currency). EMEA revenue increased 6.5 percent (2 percent adjusted for currency) in 2011 compared to 2010. In the major market countries, revenue growth was led by the UK up 9.4 percent (5 percent adjusted for currency), Spain up 11.2 percent (6 percent adjusted for currency), Germany up 5.8 percent (1 percent adjusted for currency) and France up 4.4 percent (flat adjusted for currency). Revenue in Italy decreased 0.6 percent (5 percent adjusted for currency). The EMEA growth markets increased 11.6 percent (10 percent adjusted for currency) in 2011, led by growth in Russia of 49.8 percent (49 percent adjusted for currency). Asia Pacific revenue increased 9.2 percent (2 percent adjusted for currency) year over year. The Asia Pacific growth markets increased 16.8 percent (11 percent adjusted for currency), led by growth in China of 21.6 percent (18 percent adjusted for currency) and India of 10.9 percent (13 percent adjusted for currency). Japan revenue increased 2.0 percent (decreased 7 percent adjusted for currency). OEM revenue of $2,746 million in 2011 decreased 2.3 percent (3 percent adjusted for currency) compared to 2010, driven by the Microelectronics OEM business.
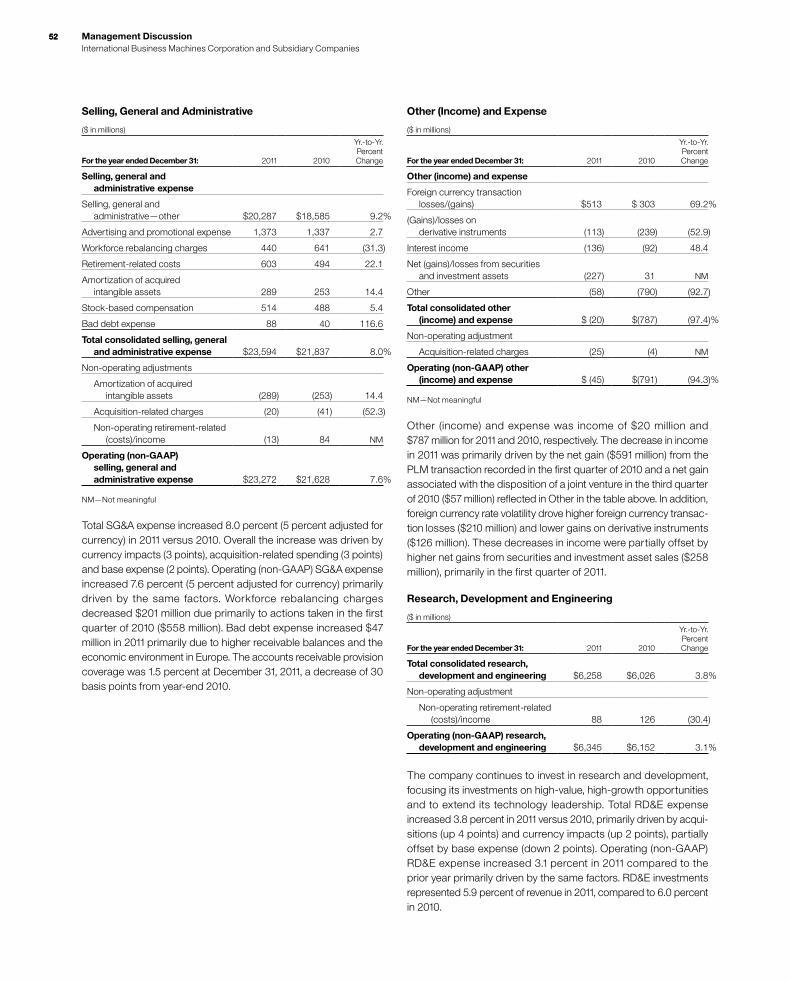
5252 Management Discussion International Business Machines Corporation and Subsidiary Companies
Other (Income) and Expense
($ in millions)
For the year ended December 31: 2011 2010
Yr.-to-Yr. Percent Change
Other (income) and expense
Foreign currency transaction losses/(gains) $513 $ 303 69.2%
(Gains)/losses on derivative instruments (113) (239) (52.9)
Interest income (136) (92) 48.4
Net (gains)/losses from securities and investment assets (227) 31 NM
Other (58) (790) (92.7)
Total consolidated other (income) and expense $ (20) $(787) (97.4)%
Non-operating adjustment
Acquisition-related charges (25) (4) NM
Operating (non-GAAP) other (income) and expense $ (45) $(791) (94.3)%
NM—Not meaningful
Other (income) and expense was income of $20 million and $787 million for 2011 and 2010, respectively. The decrease in income in 2011 was primarily driven by the net gain ($591 million) from the PLM transaction recorded in the first quarter of 2010 and a net gain associated with the disposition of a joint venture in the third quarter of 2010 ($57 million) reflected in Other in the table above. In addition, foreign currency rate volatility drove higher foreign currency transac-tion losses ($210 million) and lower gains on derivative instruments ($126 million). These decreases in income were partially offset by higher net gains from securities and investment asset sales ($258 million), primarily in the first quarter of 2011.
Research, Development and Engineering
($ in millions)
For the year ended December 31: 2011 2010
Yr.-to-Yr. Percent Change
Total consolidated research, development and engineering $6,258 $6,026 3.8%
Non-operating adjustment
Non-operating retirement-related (costs)/income 88 126 (30.4)
Operating (non-GAAP) research, development and engineering $6,345 $6,152 3.1%
The company continues to invest in research and development, focusing its investments on high-value, high-growth opportunities and to extend its technology leadership. Total RD&E expense increased 3.8 percent in 2011 versus 2010, primarily driven by acqui-sitions (up 4 points) and currency impacts (up 2 points), partially offset by base expense (down 2 points). Operating (non-GAAP) RD&E expense increased 3.1 percent in 2011 compared to the prior year primarily driven by the same factors. RD&E investments represented 5.9 percent of revenue in 2011, compared to 6.0 percent in 2010.
Selling, General and Administrative
($ in millions)
For the year ended December 31: 2011 2010
Yr.-to-Yr. Percent Change
Selling, general and administrative expense
Selling, general and administrative—other $20,287 $18,585 9.2%
Advertising and promotional expense 1,373 1,337 2.7
Workforce rebalancing charges 440 641 (31.3)
Retirement-related costs 603 494 22.1
Amortization of acquired intangible assets 289 253 14.4
Stock-based compensation 514 488 5.4
Bad debt expense 88 40 116.6
Total consolidated selling, general and administrative expense $23,594 $21,837 8.0%
Non-operating adjustments
Amortization of acquired intangible assets (289) (253) 14.4
Acquisition-related charges (20) (41) (52.3)
Non-operating retirement-related (costs)/income (13) 84 NM
Operating (non-GAAP) selling, general and administrative expense $23,272 $21,628 7.6%
NM—Not meaningful
Total SG&A expense increased 8.0 percent (5 percent adjusted for currency) in 2011 versus 2010. Overall the increase was driven by currency impacts (3 points), acquisition-related spending (3 points) and base expense (2 points). Operating (non-GAAP) SG&A expense increased 7.6 percent (5 percent adjusted for currency) primarily driven by the same factors. Workforce rebalancing charges decreased $201 million due primarily to actions taken in the first quarter of 2010 ($558 million). Bad debt expense increased $47 million in 2011 primarily due to higher receivable balances and the economic environment in Europe. The accounts receivable provision coverage was 1.5 percent at December 31, 2011, a decrease of 30 basis points from year-end 2010.

53Management Discussion International Business Machines Corporation and Subsidiary Companies
Intellectual Property and Custom Development Income
($ in millions)
For the year ended December 31: 2011 2010
Yr.-to-Yr. Percent Change
Sales and other transfers of intellectual property $ 309 $ 203 52.3%
Licensing/royalty-based fees 211 312 (32.5)
Custom development income 588 638 (8.0)
Total $1,108 $1,154 (4.0)%
The timing and amount of sales and other transfers of IP may vary significantly from period to period depending upon timing of divestitures, industry consolidation, economic conditions and the timing of new patents and know-how development. There were no significant individual IP transactions in 2011 or 2010.
Interest Expense
($ in millions)
For the year ended December 31: 2011 2010
Yr.-to-Yr. Percent Change
Interest expense
Total $411 $368 11.6%
The increase in interest expense in 2011 versus 2010 was primarily driven by higher average debt levels, partially offset by lower average interest rates. Interest expense is presented in cost of financing in the Consolidated State ment of Earnings only if the related external borrowings are to support the Global Financing external business. See pages 66 and 67 for additional information regarding Global Financing debt and interest expense. Overall interest expense (excluding capitalized interest) for 2011 was $964 million, an increase of $41 million year to year.
Income TaxesThe effective tax rate for 2011 was 24.5 percent compared with 24.8 percent in 2010. The operating (non-GAAP) tax rate for 2011 was 24.5 percent compared with 24.4 percent in 2010. The 0.3 point decrease in the as-reported effective tax rate was primarily driven by a more favorable geographic mix of pre-tax earnings (0.6 points), the lack of prior year impacts related to certain intercompany pay-ments made by foreign subsidiaries (6.6 points) and a reduced impact associated with the intercompany licensing of certain intel-lectual property and acquisition integration costs (2.2 points). These benefits were offset by a decrease in the utilization of foreign tax credits (3.7 points) and a decrease in the benefits associated with the settlements of the U.S. federal income tax audit (5.5 points). The remaining items were individually insignificant.
Financial PositionCash and cash equivalents at year end was $11,922 million, an increase of $271 million from the prior year-end position. During 2011, the company continued to manage its investment portfolio to meet its capital preservation and liquidity objectives, which resulted in a shift to higher rated institutions. At year end, a signifi-cant portion of the investment portfolio was invested in U.S. sovereign instruments with no holdings of European sovereign debt securities. Total debt of $31,320 million increased $2,695 million from the prior year-end level. The commercial paper balance at December 31, 2011 was $2,300 million, an increase of $1,156 million from the prior year. Within total debt, $23,332 million is in support of the Global Financing business which is leveraged at a 7.2 to 1 ratio. The company continued to have substantial flexibility in the market. During 2011, the company completed bond issuances totaling $4,850 million, with terms ranging from three to 10 years and priced from 0.875 to 2.90 percent depending on the maturity. In addition, the company renewed its $10 billion global credit facility for five years, with 100 percent of the facility available on a same day basis. Consistent with accounting standards the company remeasured the funded status of its retirement and postretirement plans at December 31. At December 31, 2011, the overall net underfunded position was $16,389 million, an increase of $2,654 million from December 31, 2010 as the increase in the benefit obligation due to the reduction in discount rates more than offset the returns on plan assets. At year end, the company’s qualified defined benefit plans were well funded and its cash requirements related to these plans remained stable going forward. In 2011, the return on the U.S. Personal Pension Plan assets was 8.4 percent and the plan was 98 percent funded. Overall, global asset returns were 6.1 percent and the company’s qualified defined benefit plans worldwide were 96 percent funded. The company’s qualified defined benefit plans do hold European sovereign debt securities in their trust funds. See note S, “Retire-ment-Related Benefits,” on page 128 for additional information. During 2011, the company generated $19,846 million in cash from operations, an increase of $298 million compared to 2010. In addi-tion, the company generated $16,604 million in free cash flow in 2011, an increase of $305 million over the prior year. See pages 56 and 57 for additional information on free cash flow. The company returned $18,519 million to shareholders in 2011, with $15,046 million in gross share repurchases and $3,473 million in dividends. In 2011, the company repurchased approximately 89 million shares and had $8.7 billion remaining in share repurchase authorization at year end. The company has consistently generated strong cash from opera-tions and strong free cash flow and this permits the company to invest and deploy capital to areas with the most attractive long-term opportunities.
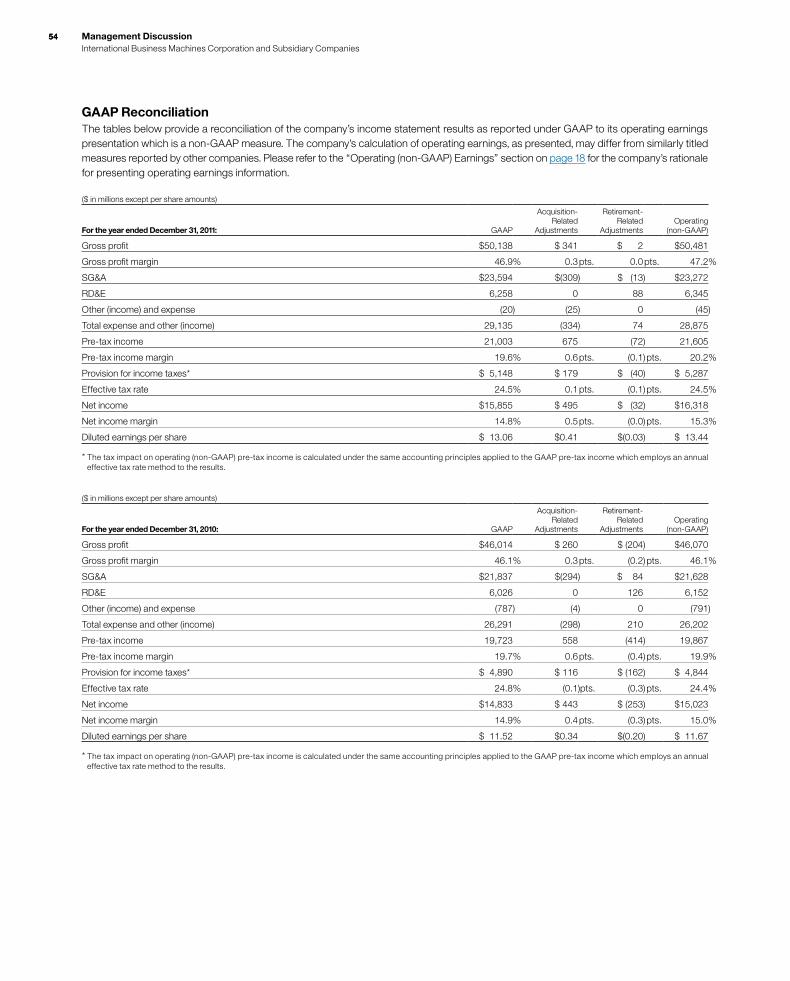
5454 Management Discussion International Business Machines Corporation and Subsidiary Companies
GAAP ReconciliationThe tables below provide a reconciliation of the company’s income statement results as reported under GAAP to its operating earnings presentation which is a non-GAAP measure. The company’s calculation of operating earnings, as presented, may differ from similarly titled measures reported by other companies. Please refer to the “Operating (non-GAAP) Earnings” section on page 18 for the company’s rationale for presenting operating earnings information.
($ in millions except per share amounts)
For the year ended December 31, 2011: GAAP
Acquisition-Related
Adjustments
Retirement-Related
AdjustmentsOperating
(non-GAAP)
Gross profit $50,138 $ 341 $ 2 $50,481
Gross profit margin 46.9% 0.3 pts. 0.0 pts. 47.2%
SG&A $23,594 $(309) $ (13) $23,272
RD&E 6,258 0 88 6,345
Other (income) and expense (20) (25) 0 (45)
Total expense and other (income) 29,135 (334) 74 28,875
Pre-tax income 21,003 675 (72) 21,605
Pre-tax income margin 19.6% 0.6 pts. (0.1) pts. 20.2%
Provision for income taxes* $ 5,148 $ 179 $ (40) $ 5,287
Effective tax rate 24.5% 0.1 pts. (0.1) pts. 24.5%
Net income $15,855 $ 495 $ (32) $16,318
Net income margin 14.8% 0.5 pts. (0.0) pts. 15.3%
Diluted earnings per share $ 13.06 $0.41 $(0.03) $ 13.44
* The tax impact on operating (non-GAAP) pre-tax income is calculated under the same accounting principles applied to the GAAP pre-tax income which employs an annual effective tax rate method to the results.
($ in millions except per share amounts)
For the year ended December 31, 2010: GAAP
Acquisition-Related
Adjustments
Retirement-Related
AdjustmentsOperating
(non-GAAP)
Gross profit $46,014 $ 260 $ (204) $46,070
Gross profit margin 46.1% 0.3 pts. (0.2) pts. 46.1%
SG&A $21,837 $(294) $ 84 $21,628
RD&E 6,026 0 126 6,152
Other (income) and expense (787) (4) 0 (791)
Total expense and other (income) 26,291 (298) 210 26,202
Pre-tax income 19,723 558 (414) 19,867
Pre-tax income margin 19.7% 0.6 pts. (0.4) pts. 19.9%
Provision for income taxes* $ 4,890 $ 116 $ (162) $ 4,844
Effective tax rate 24.8% (0.1)pts. (0.3) pts. 24.4%
Net income $14,833 $ 443 $ (253) $15,023
Net income margin 14.9% 0.4 pts. (0.3) pts. 15.0%
Diluted earnings per share $ 11.52 $0.34 $(0.20) $ 11.67
* The tax impact on operating (non-GAAP) pre-tax income is calculated under the same accounting principles applied to the GAAP pre-tax income which employs an annual effective tax rate method to the results.

55Management Discussion International Business Machines Corporation and Subsidiary Companies
Other InformationLooking ForwardIn 2012, the company delivered revenue of $104.5 billion, net income of $16.6 billion, up 4.7 percent and earnings per share of $14.37, an increase of 10.0 percent compared to 2011. Operating (non-GAAP) earnings per share was $15.25, an increase of 13.5 percent versus the prior year. The 2012 results put the company well on track to its 2015 operating earnings per share road map objective. The company measures the success of its business model over the long term, not any individual quarter or year. The company’s strategies, investments and actions are all taken with an objective of optimizing long-term performance. In May 2010, the company met with investors and introduced a road map for earnings per share in 2015. The objective of the road map for growth is to achieve at least $20 of operating (non-GAAP) earnings per diluted share in 2015. The company has identified the major drivers of financial performance: revenue growth, margin expansion and common stock share repurchase. The revenue growth will come from a combination of base revenue growth, a shift to faster growing businesses and from acquisitions closed between 2010 and 2015. The contribution from margin expansion will be driven by the mix of higher margin businesses and enterprise productivity. The company will also continue to return value to its shareholders, with approximately $50 billion of gross share repurchases and $20 billion of dividends expected during the road map period. Looking forward, the company expects to continue its trans-formation in 2013. The company will continue to acquire key capabilities, divest of certain businesses, rebalance its workforce and invest in innovation. The company continues to retool its skills and offerings to shift to higher value content and meet its clients’ needs. The company’s expectation for 2013 includes all these fac-tors. In January 2013, the company disclosed that it is expecting GAAP earnings of at least $15.53 and operating (non-GAAP) earn-ings of at least $16.70 per diluted share for the full year 2013. The operating (non-GAAP) earnings per share expectation excludes acquisition-related charges of $0.48 per share and non-operating retirement-related costs of $0.69 per share. This expectation results in an increase year to year of 8 percent in GAAP earnings per share and an increase of 10 percent year to year in operating (non-GAAP) earnings per share which keeps the company on track to its 2015 objective. On an operating (non-GAAP) basis, the company expects the first half earnings per share growth rate to be slightly higher than the growth rate in the second half primarily driven by the new System z mainframe content and the resulting year-to-year product cycle impacts. From a segment perspective, the Software business once again delivered strong results in 2012 and continued market leadership. The company expects the Software business to continue its momen-tum in 2013 and deliver revenue growth in the mid single-digits on a constant currency basis with strong profit contribution. Within Global Services, entering 2013, the company will continue to drive its key plays and shift toward higher value content. The company will
continue to invest in the growth markets—which represent over 20 percent of services revenue and where the company sees the most opportunity for growth. The company will continue to transform the services portfolio to higher value content, and away from the more commoditizing labor-based content. Global Services profit and margin performance will continue to benefit from the work being done to infuse more IP content into its offerings. In addition, Global Services will continue to be the prime beneficiary of the focus on enterprise productivity. The company believes that Global Services has a good set of opportunities to continue to drive profit growth and margin expansion in 2013. As a result, the company expects the Global Services business to deliver profit growth in 2013, consistent with its business model expectations, with double-digit profit growth in the first quarter. In addition, with its backlog growth and the mix toward longer duration engagements, the company expects Global Business Services to return to revenue growth at constant currency in 2013. Within Systems and Technology, looking forward to 2013, performance in the first half of the year will be defined by the momen-tum related to the System z mainframe content. The company expects that momentum to drive double-digit profit growth in Sys-tems and Technology in the first half of 2013. The economy could impact the credit quality of the company’s receivables, and therefore the allowance for credit losses. The com-pany will continue to apply its rigorous credit policies and analysis, and will also continue to monitor the current economic environment, particularly in Europe. Total receivables in Portugal, Italy, Ireland, Greece and Spain were approximately $2.7 billion and $2.6 billion, net of allowances, and represented approximately 7 percent of total net trade and financing accounts receivables at December 31, 2012 and 2011, respectively. The company will continue to monitor potential exposures in these countries in conjunction with the application of its credit policies. The company expects 2013 pre-tax retirement-related plan cost to be approximately $3.1 billion, an increase of approximately $700 million compared to 2012. This estimate reflects current pension plan assumptions at December 31, 2012. Within total retirement-related plan cost, operating retirement-related plan cost is expected to be approximately $1.9 billion, an increase of approxi-mately $100 million versus 2012. Non-operating retirement-related plan cost is expected to be approximately $1.1 billion, an increase of approximately $600 million, compared to 2012. See note S, “Retirement-Related Benefits,” on pages 120 to 134 for additional information. The company expects in the normal course of business that its effective tax rate and operating (non-GAAP) tax rate will be approximately 25 percent in 2013. The rate will change year to year based on non-recurring events, such as the settlement of income tax audits and changes in tax laws, as well as recurring factors including the geographic mix of income before taxes, the timing and amount of foreign dividend repatriation, state and local taxes and the effects of various global income tax strategies.

5656 Management Discussion International Business Machines Corporation and Subsidiary Companies
Liquidity and Capital ResourcesThe company has consistently generated strong cash flow from operations, providing a source of funds ranging between $18.8 billion and $20.8 billion per year over the past five years. The company provides for additional liquidity through several sources: maintaining an adequate cash balance, access to global funding sources, a committed global credit facility and other committed and uncommit-ted lines of credit worldwide. The following table provides a summary of the major sources of liquidity for the years ended December 31, 2008 through 2012.
Cash Flow and Liquidity Trends
($ in billions)
2012 2011 2010 2009 2008
Net cash from operating activities $19.6 $19.8 $19.5 $20.8 $18.8
Cash and short-term marketable securities $11.1 $11.9 $11.7 $14.0 $12.9
Committed global credit facility $10.0 $10.0 $10.0 $10.0 $10.0
The major rating agencies’ ratings on the company’s debt securities at December 31, 2012 appear in the following table. The Standard and Poor’s ratings reflect an upgrade on May 30, 2012. The other agency ratings remain unchanged from December 31, 2011. The company’s debt securities do not contain any acceleration clauses which could change the scheduled maturities of the obligation. In addition, the company does not have “ratings trigger” provisions in its debt covenants or documentation, which would allow the holders to declare an event of default and seek to accelerate payments thereunder in the event of a change in credit rating. The company’s contractual agreements governing derivative instruments contain standard market clauses which can trigger the termination of the agreement if the company’s credit rating were to fall below investment grade. At December 31, 2012, the fair value of those instruments that were in a liability position was $503 million, before any applicable netting, and this position is subject to fluctuations in fair value period to period based on the level of the company’s outstanding instru-ments and market conditions. The company has no other contractual arrangements that, in the event of a change in credit rating, would result in a material adverse effect on its financial position or liquidity.
Standard & Poor’s
Moody’s Investors
ServiceFitch
Ratings
Senior long-term debt AA- Aa3 A+
Commercial paper A-1+ Prime-1 F1
The company prepares its Consolidated Statement of Cash Flows in accordance with applicable accounting standards for cash flow presentation on page 73 and highlights causes and events under-lying sources and uses of cash in that format on page 36. For the purpose of running its business, the company manages, monitors and analyzes cash flows in a different format.
Management uses a free cash flow measure to evaluate the company’s operating results, plan share repurchase levels, evaluate strategic investments and assess the company’s ability and need to incur and service debt. Free cash flow is not a defined term under GAAP and it should not be inferred that the entire free cash flow amount is available for discretionary expenditures. The company defines free cash flow as net cash from operating activities less the change in Global Financing receivables and net capital expenditures, including the investment in software. As discussed on page 24, a key objective of the Global Financing business is to generate strong returns on equity. Increasing receivables is the basis for growth in a financing business. Accordingly, management considers Global Financing receivables as a profit-generating investment, not as work-ing capital that should be minimized for efficiency. After considering Global Financing receivables as an investment, the remaining net operational cash flow less net capital expenditures is viewed by the company as free cash flow. Net cash from operating activities per GAAP was $19.6 billion in 2012, a decrease of $0.3 billion from the prior year. As discussed on page 36, a key driver was a decrease in cash provided by receiv-ables, primarily Global Financing receivables, which increased $3.2 billion year to year. The increase in Global Financing receivables resulted from an increase in originations primarily driven by an improved participation rate. From the perspective of how manage-ment views cash flow, in 2012, free cash flow was $18.2 billion, an increase of $1.6 billion compared to 2011. The increase was primarily driven by the increase in net income and a reduction in income tax payments as a result of audit settlements in 2011. Within its strong free cash flow performance, the company increased its capital expenditures by $0.2 billion versus the prior year. In 2012, the company continued to focus its cash utilization on returning value to shareholders including $3.8 billion in dividends and $10.5 billion in net stock transactions, including the common stock repurchase program. In addition, $3.7 billion was utilized to acquire 11 companies. For the full year, the company generated $18.2 billion in free cash flow and utilized $18.0 billion on acquisitions, net share repurchases and dividends. Over the past five years, the company generated over $80 billion in free cash flow. During that period, the company invested nearly $19 billion in strategic acquisitions and returned over $61 billion to shareholders through dividends and net share repurchases. The amount of prospective returns to shareholders in the form of divi-dends and share repurchases will vary based upon several factors including each year’s operating results, capital expenditure require-ments, research and development investments and acquisitions, as well as the factors discussed on page 57. The company’s Board of Directors meets quarterly to consider the dividend payment. In the second quarter of 2012, the Board of Directors increased the company’s quarterly common stock dividend from $0.75 to $0.85 per share.
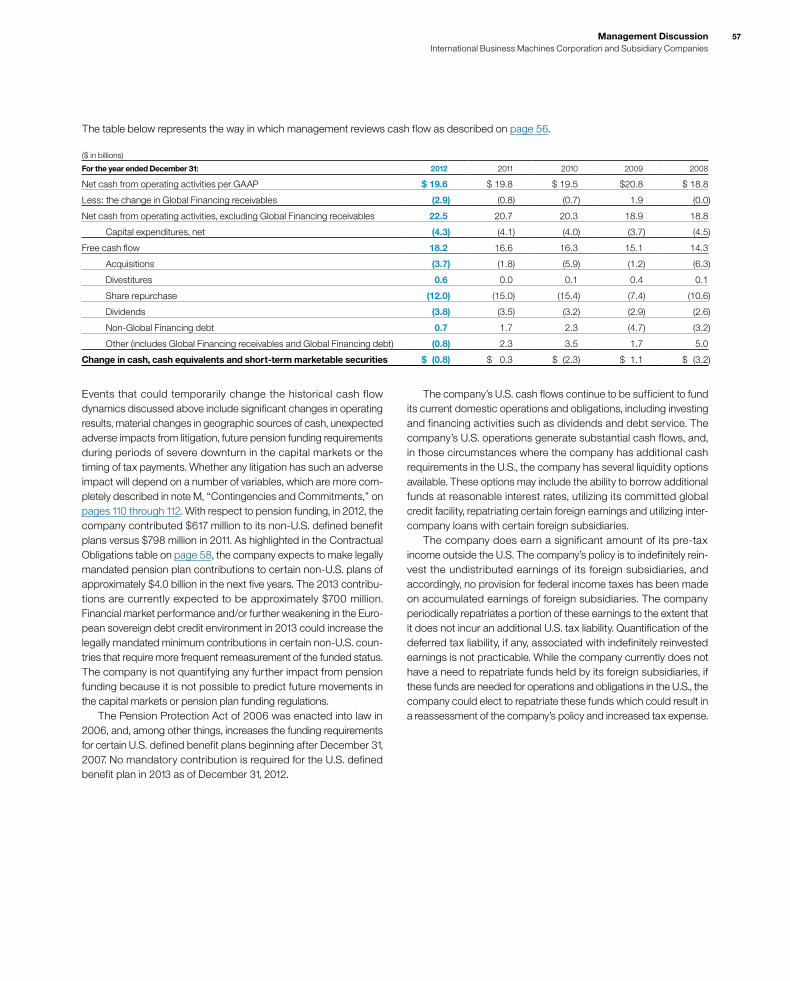
57Management Discussion International Business Machines Corporation and Subsidiary Companies
The table below represents the way in which management reviews cash flow as described on page 56.
($ in billions)
For the year ended December 31: 2012 2011 2010 2009 2008
Net cash from operating activities per GAAP $ 19.6 $ 19.8 $ 19.5 $20.8 $ 18.8
Less: the change in Global Financing receivables (2.9) (0.8) (0.7) 1.9 (0.0)
Net cash from operating activities, excluding Global Financing receivables 22.5 20.7 20.3 18.9 18.8
Capital expenditures, net (4.3) (4.1) (4.0) (3.7) (4.5)
Free cash flow 18.2 16.6 16.3 15.1 14.3
Acquisitions (3.7) (1.8) (5.9) (1.2) (6.3)
Divestitures 0.6 0.0 0.1 0.4 0.1
Share repurchase (12.0) (15.0) (15.4) (7.4) (10.6)
Dividends (3.8) (3.5) (3.2) (2.9) (2.6)
Non-Global Financing debt 0.7 1.7 2.3 (4.7) (3.2)
Other (includes Global Financing receivables and Global Financing debt) (0.8) 2.3 3.5 1.7 5.0
Change in cash, cash equivalents and short-term marketable securities $ (0.8) $ 0.3 $ (2.3) $ 1.1 $ (3.2)
Events that could temporarily change the historical cash flow dynamics discussed above include significant changes in operating results, material changes in geographic sources of cash, unexpected adverse impacts from litigation, future pension funding requirements during periods of severe downturn in the capital markets or the timing of tax payments. Whether any litigation has such an adverse impact will depend on a number of variables, which are more com-pletely described in note M, “Contingencies and Commitments,” on pages 110 through 112. With respect to pension funding, in 2012, the company contributed $617 million to its non-U.S. defined benefit plans versus $798 million in 2011. As highlighted in the Contractual Obligations table on page 58, the company expects to make legally mandated pension plan contributions to certain non-U.S. plans of approximately $4.0 billion in the next five years. The 2013 contribu-tions are currently expected to be approximately $700 million. Financial market performance and/or further weakening in the Euro-pean sovereign debt credit environment in 2013 could increase the legally mandated minimum contributions in certain non-U.S. coun-tries that require more frequent remeasurement of the funded status. The company is not quantifying any further impact from pension funding because it is not possible to predict future movements in the capital markets or pension plan funding regulations. The Pension Protection Act of 2006 was enacted into law in 2006, and, among other things, increases the funding requirements for certain U.S. defined benefit plans beginning after December 31, 2007. No mandatory contribution is required for the U.S. defined benefit plan in 2013 as of December 31, 2012.
The company’s U.S. cash flows continue to be sufficient to fund its current domestic operations and obligations, including investing and financing activities such as dividends and debt service. The company’s U.S. operations generate substantial cash flows, and, in those circumstances where the company has additional cash requirements in the U.S., the company has several liquidity options available. These options may include the ability to borrow additional funds at reasonable interest rates, utilizing its committed global credit facility, repatriating certain foreign earnings and utilizing inter-company loans with certain foreign subsidiaries. The company does earn a significant amount of its pre-tax income outside the U.S. The company’s policy is to indefinitely rein-vest the undistributed earnings of its foreign subsidiaries, and accordingly, no provision for federal income taxes has been made on accumulated earnings of foreign subsidiaries. The company periodically repatriates a portion of these earnings to the extent that it does not incur an additional U.S. tax liability. Quantification of the deferred tax liability, if any, associated with indefinitely reinvested earnings is not practicable. While the company currently does not have a need to repatriate funds held by its foreign subsidiaries, if these funds are needed for operations and obligations in the U.S., the company could elect to repatriate these funds which could result in a reassessment of the company’s policy and increased tax expense.
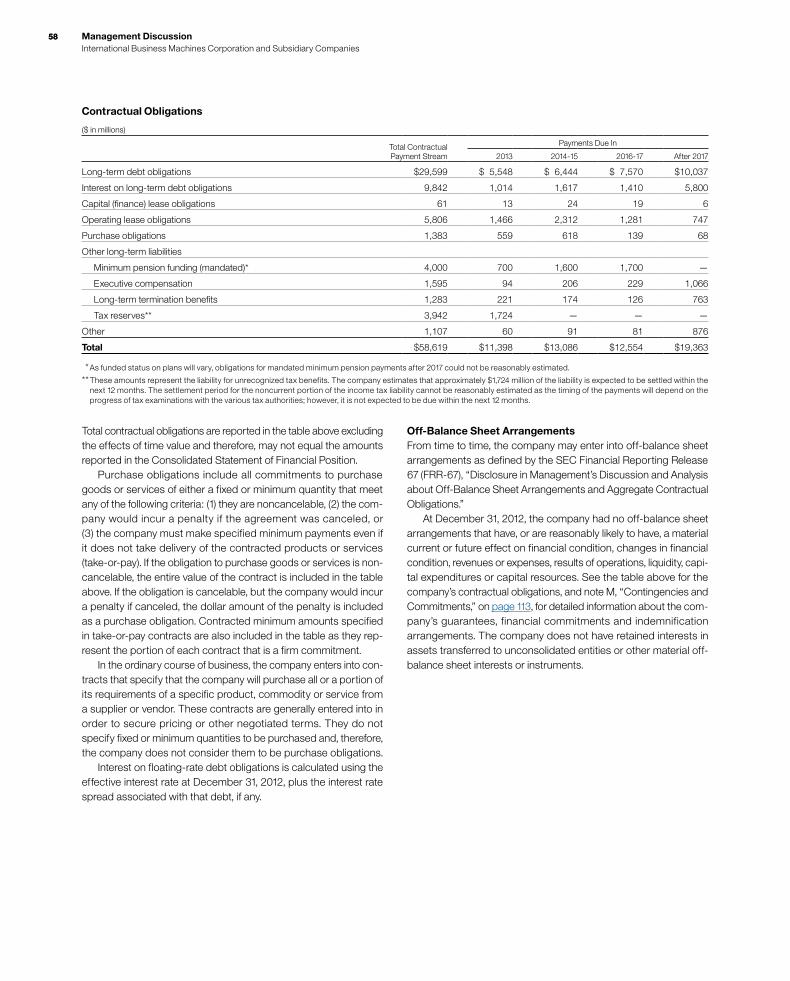
5858 Management Discussion International Business Machines Corporation and Subsidiary Companies
Contractual Obligations
($ in millions)
Total Contractual Payment Stream
Payments Due In
2013 2014-15 2016-17 After 2017
Long-term debt obligations $29,599 $ 5,548 $ 6,444 $ 7,570 $10,037
Interest on long-term debt obligations 9,842 1,014 1,617 1,410 5,800
Capital (finance) lease obligations 61 13 24 19 6
Operating lease obligations 5,806 1,466 2,312 1,281 747
Purchase obligations 1,383 559 618 139 68
Other long-term liabilities
Minimum pension funding (mandated)* 4,000 700 1,600 1,700 —
Executive compensation 1,595 94 206 229 1,066
Long-term termination benefits 1,283 221 174 126 763
Tax reserves** 3,942 1,724 — — —
Other 1,107 60 91 81 876
Total $58,619 $11,398 $13,086 $12,554 $19,363
* As funded status on plans will vary, obligations for mandated minimum pension payments after 2017 could not be reasonably estimated.
** These amounts represent the liability for unrecognized tax benefits. The company estimates that approximately $1,724 million of the liability is expected to be settled within the next 12 months. The settlement period for the noncurrent portion of the income tax liability cannot be reasonably estimated as the timing of the payments will depend on the progress of tax examinations with the various tax authorities; however, it is not expected to be due within the next 12 months.
Total contractual obligations are reported in the table above excluding the effects of time value and therefore, may not equal the amounts reported in the Consolidated Statement of Financial Position. Purchase obligations include all commitments to purchase goods or services of either a fixed or minimum quantity that meet any of the following criteria: (1) they are noncancelable, (2) the com-pany would incur a penalty if the agreement was canceled, or (3) the company must make specified minimum payments even if it does not take delivery of the contracted products or services (take-or-pay). If the obligation to purchase goods or services is non-cancelable, the entire value of the contract is included in the table above. If the obligation is cancelable, but the company would incur a penalty if canceled, the dollar amount of the penalty is included as a purchase obligation. Contracted minimum amounts specified in take-or-pay contracts are also included in the table as they rep-resent the portion of each contract that is a firm commitment. In the ordinary course of business, the company enters into con-tracts that specify that the company will purchase all or a portion of its requirements of a specific product, commodity or service from a supplier or vendor. These contracts are generally entered into in order to secure pricing or other negotiated terms. They do not specify fixed or minimum quantities to be purchased and, therefore, the company does not consider them to be purchase obligations. Interest on floating-rate debt obligations is calculated using the effective interest rate at December 31, 2012, plus the interest rate spread associated with that debt, if any.
Off-Balance Sheet ArrangementsFrom time to time, the company may enter into off-balance sheet arrangements as defined by the SEC Financial Reporting Release 67 (FRR-67), “Disclosure in Management’s Discussion and Analysis about Off-Balance Sheet Arrangements and Aggregate Con tractual Obligations.” At December 31, 2012, the company had no off-balance sheet arrangements that have, or are reasonably likely to have, a material current or future effect on financial condition, changes in financial condition, revenues or expenses, results of operations, liquidity, capi-tal expenditures or capital resources. See the table above for the company’s contractual obligations, and note M, “Contingencies and Commitments,” on page 113, for detailed information about the com-pany’s guarantees, financial commitments and indemnification arrangements. The company does not have retained interests in assets transferred to unconsolidated entities or other material off-balance sheet interests or instruments.

59Management Discussion International Business Machines Corporation and Subsidiary Companies
Critical Accounting EstimatesThe application of GAAP requires the company to make estimates and assumptions about certain items and future events that directly affect its reported financial condition. The accounting estimates and assumptions discussed in this section are those that the company considers to be the most critical to its financial statements. An accounting estimate is considered critical if both (a) the nature of the estimate or assumption is material due to the levels of subjectiv-ity and judgment involved, and (b) the impact within a reasonable range of outcomes of the estimate and assumption is material to the company’s financial condition. Senior management has discussed the development, selection and disclosure of these estimates with the Audit Committee of the company’s Board of Directors. The company’s significant accounting policies are described in note A, “Significant Accounting Policies,” on pages 76 to 86. A quantitative sensitivity analysis is provided where that informa-tion is reasonably available, can be reliably estimated and provides material information to investors. The amounts used to assess sen-sitivity (e.g., 1 percent, 10 percent, etc.) are included to allow users of the Annual Report to understand a general direction cause and effect of changes in the estimates and do not represent manage-ment’s predictions of variability. For all of these estimates, it should be noted that future events rarely develop exactly as forecasted, and estimates require regular review and adjustment.
Pension AssumptionsFor the company’s defined benefit pension plans, the measurement of the company’s benefit obligation to employees and net periodic pension (income)/cost requires the use of certain assumptions, including, among others, estimates of discount rates and expected return on plan assets. Changes in the discount rate assumptions will impact the (gain)/loss amortization and interest cost components of the net periodic pension (income)/cost calculation (see page 126 for information regarding the discount rate assumptions) and the projected benefit obligation (PBO). The company decreased the discount rate assumption for the IBM Personal Pension Plan (PPP), a U.S.-based defined benefit plan, by 60 basis points to 3.60 percent on Decem-ber 31, 2012. This change will increase pre-tax cost and expense recognized in 2013 by an estimated $156 million. If the discount rate assumption for the PPP increased by 60 basis points on December 31, 2012, pre-tax cost and expense recognized in 2013 would have decreased by an estimated $200 million. Changes in the discount rate assumptions will impact the PBO which, in turn, may impact the company’s funding decisions if the PBO exceeds plan assets. Each 25 basis point increase or decrease in the discount rate will cause a corresponding decrease or increase, respectively, in the PPP’s PBO of an estimated $1.4 billion based upon December 31, 2012 data.
The expected long-term return on plan assets assumption is used in calculating the net periodic pension (income)/cost (see page 126 for information regarding the expected long-term return on plan assets assumption). Expected returns on plan assets are calculated based on the market-related value of plan assets, which recognizes changes in the fair value of plan assets systematically over a five-year period in the expected return on plan assets line in net periodic pension (income)/cost. The differences between the actual return on plan assets and the expected long-term return on plan assets are recognized over five years in the expected return on plan assets line in net periodic pension (income)/cost and also as a component of actuarial gains/losses, which are recognized over the service lives of the employees in the plan, provided such amounts exceed thresh-olds which are based upon the obligation or the value of plan assets, as provided by accounting standards. To the extent the outlook for long-term returns changes such that management changes its expected long-term return on plan assets assumption, each 50 basis point increase or decrease in the expected long-term return on PPP plan assets assumption will have an estimated increase or decrease, respectively, of $249 million on the following year’s pre-tax net periodic pension (income)/cost (based upon the PPP’s plan assets at December 31, 2012 and assuming no contributions are made in 2013). The company may voluntarily make contributions or be required, by law, to make contributions to its pension plans. Actual results that differ from the estimates may result in more or less future company funding into the pension plans than is planned by management. Impacts of these types of changes on the company’s pension plans in other countries worldwide will vary depending upon the status of each respective plan.
Revenue RecognitionApplication of the various accounting principles in GAAP related to the measurement and recognition of revenue requires the company to make judgments and estimates. Specifically, complex arrange-ments with nonstandard terms and conditions may require significant contract interpretation to determine the appropriate accounting, including whether the deliverables specified in a multiple element arrangement should be treated as separate units of accounting. Other significant judgments include determining whether IBM or a reseller is acting as the principal in a transaction and whether separate contracts are considered part of one arrangement. Revenue recognition is also impacted by the company’s ability to estimate sales incentives, expected returns and collectibility. The company considers various factors, including a review of specific transactions, the creditworthiness of the customers, historical experi-ence and market and economic conditions when calculating these provisions and allowances. Evaluations are conducted each quarter to assess the adequacy of the estimates. If these estimates were changed by 10 percent in 2012, net income would have been impacted by $79 million (excluding Global Financing receivables discussed on page 65).
6060 Management Discussion International Business Machines Corporation and Subsidiary Companies
Costs to Complete Service ContractsThe company enters into numerous service contracts through its Global Services business. During the contractual period, revenue, cost and profits may be impacted by estimates of the ultimate profit-ability of each contract, especially contracts for which the company uses the percentage-of-completion (POC) method of accounting. If at any time these estimates indicate the POC contract will be unprof-itable, the entire estimated loss for the remainder of the contract is recorded immediately in cost. The company performs ongoing profitability analyses of its services contracts in order to deter-mine whether the latest estimates require updating. Key factors reviewed by the company to estimate the future costs to complete each contract are future labor costs, future product costs and expected productivity efficiencies. Contract loss provisions recorded as a component of other accrued expenses and liabilities were approximately $54 million and $52 million at December 31, 2012 and 2011, respectively.
Income TaxesThe company is subject to income taxes in the U.S. and numerous foreign jurisdictions. Significant judgments are required in determin-ing the consolidated provision for income taxes. During the ordinary course of business, there are many trans-actions and calculations for which the ultimate tax determination is uncertain. As a result, the company recognizes tax liabilities based on estimates of whether additional taxes and interest will be due. These tax liabilities are recognized when, despite the company’s belief that its tax return positions are supportable, the company believes that certain positions may not be fully sustained upon review by tax authorities. The company believes that its accruals for tax liabilities are adequate for all open audit years based on its assessment of many factors, including past experience and inter-pretations of tax law. This assessment relies on estimates and assumptions, and may involve a series of complex judgments about future events. To the extent that new information becomes available which causes the company to change its judgment regarding the adequacy of existing tax liabilities, such changes to tax liabilities will impact income tax expense in the period in which such determination is made. Significant judgment is also required in determining any valuation allowance recorded against deferred tax assets. In assessing the need for a valuation allowance, management considers all available evidence for each jurisdiction including past operating results, esti-mates of future taxable income and the feasibility of ongoing tax planning strategies. In the event that the company changes its deter-mination as to the amount of deferred tax assets that can be realized, the company will adjust its valuation allowance with a cor-responding impact to income tax expense in the period in which such determination is made. The consolidated provision for income taxes will change period to period based on nonrecurring events, such as the settlement of income tax audits and changes in tax laws, as well as recurring factors including the geographic mix of income before taxes, the timing and amount of foreign dividend repatriation, state and local taxes and the effects of various global income tax strategies.
To the extent that the provision for income taxes increases/decreases by 1 percent of income before income taxes, consolidated net income would have decreased/improved by $219 million in 2012.
Valuation of AssetsThe application of business combination and impairment accounting requires the use of significant estimates and assumptions. The acqui-sition method of accounting for business combinations requires the company to estimate the fair value of assets acquired, liabilities assumed, and any non-controlling interest in the acquiree to properly allocate purchase price consideration between assets that are depreciated and amortized from goodwill and indefinite-lived intan-gible assets. Impairment testing for assets, other than goodwill and indefinite-lived intangible assets, requires the allocation of cash flows to those assets or group of assets and if required, an estimate of fair value for the assets or group of assets. The company’s estimates are based upon assumptions believed to be reasonable, but which are inherently uncertain and unpredictable. These valuations require the use of management’s assumptions, which would not reflect unanticipated events and circumstances that may occur.
Valuation of GoodwillThe company reviews goodwill for impairment annually, in the fourth quarter, and whenever events or changes in circumstances indicate the carrying value of goodwill may not be recoverable. The company assesses qualitative factors in each of its reporting units that carry goodwill. Among other relevant events and circum-stances that affect the fair value of reporting units, the company assesses individual factors such as:
• A significant adverse change in legal factors or the business climate;
• An adverse action or assessment by a regulator;• Unanticipated competition;• A loss of key personnel; and• A more likely than not expectation that a reporting
unit or a significant portion of a reporting unit will be sold or otherwise disposed of.
The company assesses these qualitative factors to determine whether it is necessary to perform the two-step quantitative goodwill impairment test. This quantitative test is required only if the com-pany concludes that it is more likely than not that a reporting unit’s fair value is less than its carrying amount. After performing the annual goodwill impairment qualitative analysis during the fourth quarter of 2012, the company determined it was not necessary to perform the two-step goodwill impairment test.
Loss ContingenciesThe company is currently involved in various claims and legal proceedings. Quarterly, the company reviews the status of each significant matter and assesses its potential financial exposure. If the potential loss from any claim or legal proceeding is considered probable and the amount can be reasonably estimated, the com-pany accrues a liability for the estimated loss. Significant judgment is required in both the determination of probability and the determi-nation as to whether an exposure is reasonably estimable. Because

61Management Discussion International Business Machines Corporation and Subsidiary Companies
of uncertainties related to these matters, accruals are based only on the best information available at the time. As additional informa-tion becomes available, the company reassesses the potential liability related to its pending claims and litigation, and may revise its estimates. These revisions in the estimates of the potential liabilities could have a material impact on the company’s results of operations and financial position.
Global Financing Receivables Allowance for Credit Losses The Global Financing business reviews its financing receivables port folio at least quarterly in order to assess collectibility. A description of the methods used by management to estimate the amount of uncollectible receivables is included in note A, “Significant Accounting Policies,” on page 85. Factors that could result in actual receivable losses that are materially different from the estim ated reserve include sharp changes in the economy, or a significant change in the economic health of a particular client that represents a concentration in Global Financing’s receivables portfolio. To the extent that actual collectibility differs from manage-ment’s estimates currently provided for by 10 percent, Global Financing’s segment pre-tax income and the company’s consoli-dated income before income taxes would be higher or lower by an estimated $36 million (using 2012 data), depending upon whether the actual collectibility was better or worse, respectively, than the estimates.
Residual Value Residual value represents the estimated fair value of equipment under lease as of the end of the lease. Residual value estimates impact the determination of whether a lease is classified as operat-ing or capital. Global Financing estimates the future fair value of leased equipment by using historical models, analyzing the current market for new and used equipment, and obtaining forward-looking product information such as marketing plans and technological innovations. Residual value estimates are periodically reviewed and “other than temporary” declines in estimated future residual values are recognized upon identification. Anticipated increases in future residual values are not recognized until the equipment is remarketed. Factors that could cause actual results to materially differ from the estimates include significant changes in the used-equipment market brought on by unforeseen changes in technology innovations and any resulting changes in the useful lives of used equipment. To the extent that actual residual value recovery is lower than management’s estimates by 10 percent, Global Financing’s segment pre-tax income and the company’s consolidated income before income taxes for 2012 would have been lower by an estimated $105 million. If the actual residual value recovery is higher than management’s estimates, the increase in income will be realized at the end of lease when the equipment is remarketed.
Currency Rate FluctuationsChanges in the relative values of non-U.S. currencies to the U.S. dollar affect the company’s financial results and financial position. At December 31, 2012, currency changes resulted in assets and liabilities denominated in local currencies being translated into fewer
dollars than at year-end 2011. The company uses financial hedging instruments to limit specific currency risks related to financing trans-actions and other foreign currency-based transactions. Further discussion of currency and hedging appears in note D, “Financial Instruments,” on pages 94 to 98. Foreign currency fluctuations often drive operational responses that mitigate the simple mechanical translation of earnings. During periods of sustained movements in currency, the marketplace and competition adjust to the changing rates. For example, when pricing offerings in the marketplace, the company may use some of the advantage from a weakening U.S. dollar to improve its position com-petitively, and price more aggressively to win the business, essentially passing on a portion of the currency advantage to its customers. Competition will frequently take the same action. Consequently, the company believes that some of the currency-based changes in cost impact the prices charged to clients. The company also maintains currency hedging programs for cash man-agement purposes which mitigate, but do not eliminate, the volatility of currency impacts on the company’s financial results. The company translates revenue, cost and expense in its non-U.S. operations at current exchange rates in the reported period. References to “adjusted for currency” or “constant currency” reflect adjustments based upon a simple constant currency mathematical translation of local currency results using the comparable prior period’s currency conversion rate. However, this constant currency methodology that the company utilizes to disclose this information does not incorporate any operational actions that management may take in reaction to fluctuating currency rates. Based on the currency rate movements in 2012, total revenue decreased 2.3 percent as reported and was flat at constant currency versus 2011. On a pre-tax income basis, these translation impacts offset by the net impact of hedging activities resulted in a theoretical maximum (assuming no pricing or sourcing actions) decrease of approximately $100 million in 2012. The same mathematical exercise resulted in an increase of approximately $600 million in 2011. The company views these amounts as a theoretical maximum impact to its as-reported finan-cial results. Considering the operational responses mentioned above, movements of exchange rates, and the nature and timing of hedging instruments, it is difficult to predict future currency impacts on any particular period, but the company believes it could be sub-stantially less than the theoretical maximum given the competitive pressure in the marketplace. For non-U.S. subsidiaries and branches that operate in U.S. dol-lars or whose economic environment is highly inflationary, translation adjustments are reflected in results of operations. Generally, the company manages currency risk in these entities by linking prices and contracts to U.S. dollars. The company continues to monitor the economic conditions in Venezuela. On December 30, 2010, the official rate for essential goods was eliminated, with no change to the SITME rate. The SITME rate remained constant throughout 2012 and 2011. In February 2013, the SITME rate was eliminated, and the official rate was set at 6.3 bolivars fuerte (BsF) to the U.S. dollar. This devaluation is not expected to have a material impact given the size of the company’s operations in Venezuela (less than 1 percent of total 2011 and 2012 revenue, respectively).
6262 Management Discussion International Business Machines Corporation and Subsidiary Companies
Market RiskIn the normal course of business, the financial position of the company is routinely subject to a variety of risks. In addition to the market risk associated with interest rate and currency movements on outstanding debt and non-U.S. dollar denominated assets and liabilities, other examples of risk include collectibility of accounts receivable and recoverability of residual values on leased assets. The company regularly assesses these risks and has established policies and business practices to protect against the adverse effects of these and other potential exposures. As a result, the com-pany does not anticipate any material losses from these risks. The company’s debt, in support of the Global Financing business and the geographic breadth of the company’s operations, contains an element of market risk from changes in interest and currency rates. The company manages this risk, in part, through the use of a variety of financial instruments including derivatives, as described in note D, “Financial Instruments,” on pages 94 to 98. To meet disclosure requirements, the company performs a sen-sitivity analysis to determine the effects that market risk exposures may have on the fair values of the company’s debt and other finan-cial instruments. The financial instruments that are included in the sensitivity analysis comprise all of the company’s cash and cash equivalents, marketable securities, short-term and long-term loans, commercial financing and installment payment receivables, investments, long-term and short-term debt and all derivative financial instruments. The company’s derivative financial instruments generally include interest rate swaps, foreign currency swaps and forward contracts. To perform the sensitivity analysis, the company assesses the risk of loss in fair values from the effect of hypothetical changes in interest rates and foreign currency exchange rates on market-sen-sitive instruments. The market values for interest and foreign currency exchange risk are computed based on the present value of future cash flows as affected by the changes in rates that are attributable to the market risk being measured. The discount rates used for the present value computations were selected based on market interest and foreign currency exchange rates in effect at December 31, 2012 and 2011. The differences in this com-parison are the hypothetical gains or losses associated with each type of risk. Information provided by the sensitivity analysis does not neces-sarily represent the actual changes in fair value that the company would incur under normal market conditions because, due to practi-cal limitations, all variables other than the specific market risk factor are held constant. In addition, the results of the model are con-strained by the fact that certain items are specifically excluded from the analysis, while the financial instruments relating to the financing or hedging of those items are included by definition. Excluded items include short-term and long-term receivables from sales-type and direct financing leases, forecasted foreign currency cash flows and the company’s net investment in foreign operations. As a conse-quence, reported changes in the values of some of the financial instruments impacting the results of the sensitivity analysis are not matched with the offsetting changes in the values of the items that those instruments are designed to finance or hedge.
The results of the sensitivity analysis at December 31, 2012 and 2011, are as follows:
Interest Rate RiskAt December 31, 2012, a 10 percent decrease in the levels of interest rates with all other variables held constant would result in a decrease in the fair market value of the company’s financial instruments of $192 million as compared with a decrease of $310 million at Decem-ber 31, 2011. A 10 percent increase in the levels of interest rates with all other variables held constant would result in an increase in the fair value of the company’s financial instruments of $181 million as compared to an increase of $290 million at December 31, 2011. Changes in the relative sensitivity of the fair value of the company’s financial instrument portfolio for these theoretical changes in the level of interest rates are primarily driven by changes in the com-pany’s debt maturities, interest rate profile and amount.
Foreign Currency Exchange Rate RiskAt December 31, 2012, a 10 percent weaker U.S. dollar against for-eign currencies, with all other variables held constant, would result in an increase in the fair value of the company’s financial instruments of $1,203 million as compared with an increase of $1,303 million at December 31, 2011. Conversely, a 10 percent stronger U.S. dollar against foreign currencies, with all other variables held constant, would result in a decrease in the fair value of the company’s financial instruments of $1,203 million compared with a decrease of $1,303 million at December 31, 2011. The change in impact from 2011 to 2012 was comprised of: assets ($84 million), debt ($216 million) and derivatives ($202 million).
Financing RisksSee the “Description of Business” on page 24 for a discussion of the financing risks associated with the Global Financing business and management’s actions to mitigate such risks.
CybersecurityWhile neither a business unit nor a worldwide organization, the com-pany’s approach on cybersecurity demonstrates its ability to adapt to a changing environment, as well as the depth and breadth of its global capabilities. IBM has leveraged its extensive knowledge and experience on cybersecurity matters to help its customers. The company has a suite of software solutions that showcase IBM’s broad capabilities in identity and access management, data security, application security, network security and endpoint security. IBM’s software solutions include a security intelligence dashboard that can collect information on customer IT security events and provide detailed information to customers about potential threats and secu-rity posture. The company’s services businesses offer professional solutions for security from assessment to deployment. In addition, the company offers managed and outsourced security solutions from multiple security operations centers around the world. Finally, security is embedded in a multitude of IBM offerings through secure engineer-ing processes and by critical functions (encryption, access control, etc.) in servers, storage, software, services and other solutions.
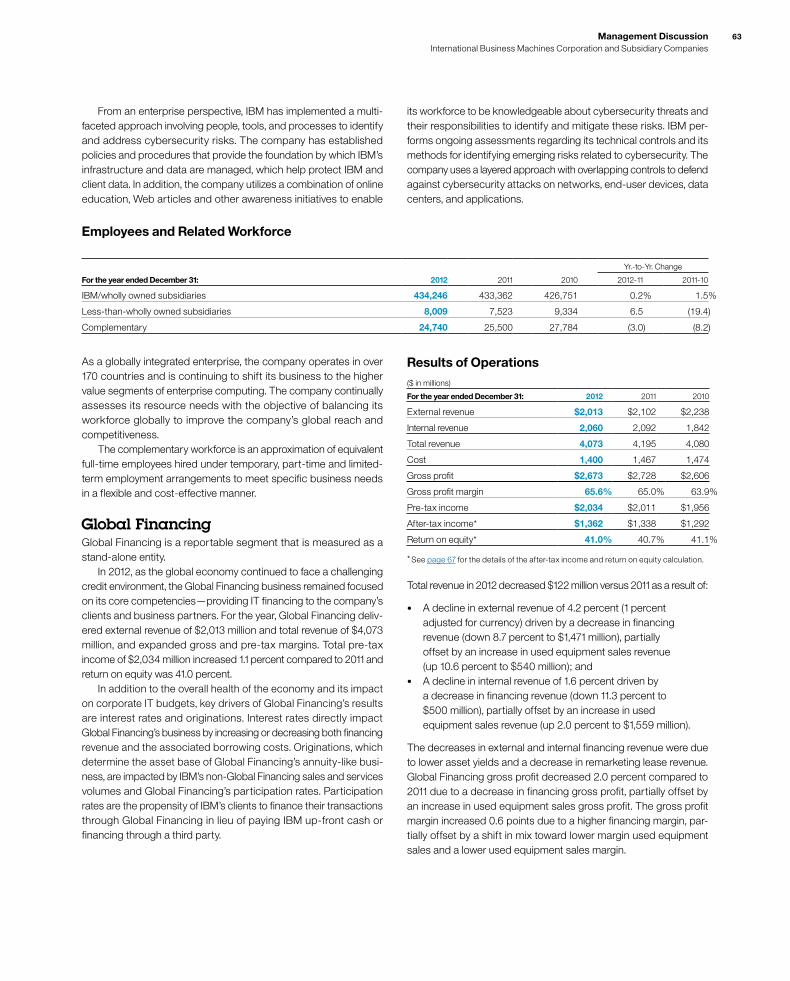
63Management Discussion International Business Machines Corporation and Subsidiary Companies
From an enterprise perspective, IBM has implemented a multi-faceted approach involving people, tools, and processes to identify and address cybersecurity risks. The company has established policies and procedures that provide the foundation by which IBM’s infrastructure and data are managed, which help protect IBM and client data. In addition, the company utilizes a combination of online education, Web articles and other awareness initiatives to enable
its workforce to be knowledgeable about cybersecurity threats and their responsibilities to identify and mitigate these risks. IBM per-forms ongoing assessments regarding its technical controls and its methods for identifying emerging risks related to cybersecurity. The company uses a layered approach with overlapping controls to defend against cybersecurity attacks on networks, end-user devices, data centers, and applications.
Employees and Related Workforce
Yr.-to-Yr. Change
For the year ended December 31: 2012 2011 2010 2012-11 2011-10
IBM/wholly owned subsidiaries 434,246 433,362 426,751 0.2% 1.5%
Less-than-wholly owned subsidiaries 8,009 7,523 9,334 6.5 (19.4)
Complementary 24,740 25,500 27,784 (3.0) (8.2)
As a globally integrated enterprise, the company operates in over 170 countries and is continuing to shift its business to the higher value segments of enterprise computing. The company continually assesses its resource needs with the objective of balancing its workforce globally to improve the company’s global reach and competitiveness. The complementary workforce is an approximation of equivalent full-time employees hired under temporary, part-time and limited- term employment arrangements to meet specific business needs in a flexible and cost-effective manner.
Global Financing Global Financing is a reportable segment that is measured as a stand-alone entity. In 2012, as the global economy continued to face a challenging credit environment, the Global Financing business remained focused on its core competencies—providing IT financing to the company’s clients and business partners. For the year, Global Financing deliv-ered external revenue of $2,013 million and total revenue of $4,073 million, and expanded gross and pre-tax margins. Total pre-tax income of $2,034 million increased 1.1 percent compared to 2011 and return on equity was 41.0 percent. In addition to the overall health of the economy and its impact on corporate IT budgets, key drivers of Global Financing’s results are interest rates and originations. Interest rates directly impact Global Financing’s business by increasing or decreasing both financing revenue and the associated borrowing costs. Originations, which determine the asset base of Global Financing’s annuity-like busi-ness, are impacted by IBM’s non-Global Financing sales and services volumes and Global Financing’s participation rates. Participation rates are the propensity of IBM’s clients to finance their transactions through Global Financing in lieu of paying IBM up-front cash or financing through a third party.
Results of Operations($ in millions)
For the year ended December 31: 2012 2011 2010
External revenue $2,013 $2,102 $2,238
Internal revenue 2,060 2,092 1,842
Total revenue 4,073 4,195 4,080
Cost 1,400 1,467 1,474
Gross profit $2,673 $2,728 $2,606
Gross profit margin 65.6% 65.0% 63.9%
Pre-tax income $2,034 $2,011 $1,956
After-tax income* $1,362 $1,338 $1,292
Return on equity* 41.0% 40.7% 41.1%
* See page 67 for the details of the after-tax income and return on equity calculation.
Total revenue in 2012 decreased $122 million versus 2011 as a result of:
• A decline in external revenue of 4.2 percent (1 percent adjusted for currency) driven by a decrease in financing revenue (down 8.7 percent to $1,471 million), partially offset by an increase in used equipment sales revenue (up 10.6 percent to $540 million); and
• A decline in internal revenue of 1.6 percent driven by a decrease in financing revenue (down 11.3 percent to $500 million), partially offset by an increase in used equipment sales revenue (up 2.0 percent to $1,559 million).
The decreases in external and internal financing revenue were due to lower asset yields and a decrease in remarketing lease revenue.Global Financing gross profit decreased 2.0 percent compared to 2011 due to a decrease in financing gross profit, partially offset by an increase in used equipment sales gross profit. The gross profit margin increased 0.6 points due to a higher financing margin, par-tially offset by a shift in mix toward lower margin used equipment sales and a lower used equipment sales margin.
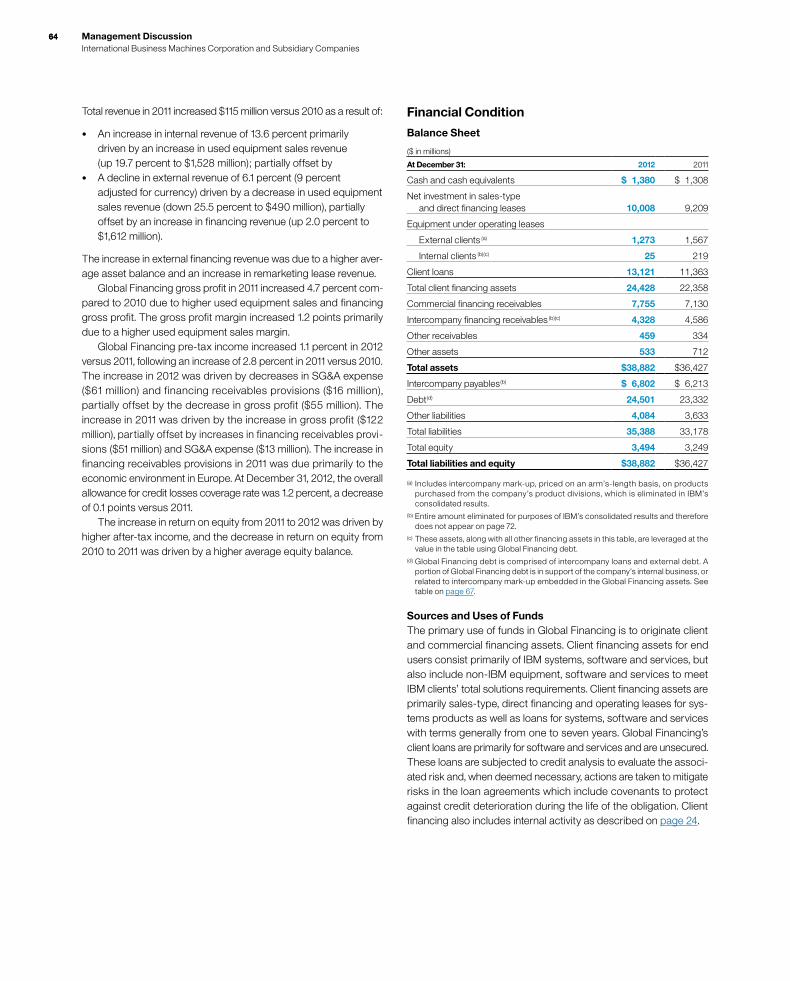
6464 Management Discussion International Business Machines Corporation and Subsidiary Companies
Total revenue in 2011 increased $115 million versus 2010 as a result of:
• An increase in internal revenue of 13.6 percent primarily driven by an increase in used equipment sales revenue (up 19.7 percent to $1,528 million); partially offset by
• A decline in external revenue of 6.1 percent (9 percent adjusted for currency) driven by a decrease in used equipment sales revenue (down 25.5 percent to $490 million), partially offset by an increase in financing revenue (up 2.0 percent to $1,612 million).
The increase in external financing revenue was due to a higher aver-age asset balance and an increase in remarketing lease revenue. Global Financing gross profit in 2011 increased 4.7 percent com-pared to 2010 due to higher used equipment sales and financing gross profit. The gross profit margin increased 1.2 points primarily due to a higher used equipment sales margin. Global Financing pre-tax income increased 1.1 percent in 2012 versus 2011, following an increase of 2.8 percent in 2011 versus 2010. The increase in 2012 was driven by decreases in SG&A expense ($61 million) and financing receivables provisions ($16 million), partially offset by the decrease in gross profit ($55 million). The increase in 2011 was driven by the increase in gross profit ($122 million), partially offset by increases in financing receivables provi-sions ($51 million) and SG&A expense ($13 million). The increase in financing receivables provisions in 2011 was due primarily to the economic environment in Europe. At December 31, 2012, the overall allowance for credit losses coverage rate was 1.2 percent, a decrease of 0.1 points versus 2011. The increase in return on equity from 2011 to 2012 was driven by higher after-tax income, and the decrease in return on equity from 2010 to 2011 was driven by a higher average equity balance.
Financial Condition
Balance Sheet
($ in millions)
At December 31: 2012 2011
Cash and cash equivalents $ 1,380 $ 1,308
Net investment in sales-type and direct financing leases 10,008 9,209
Equipment under operating leases
External clients (a) 1,273 1,567
Internal clients (b)(c) 25 219
Client loans 13,121 11,363
Total client financing assets 24,428 22,358
Commercial financing receivables 7,755 7,130
Intercompany financing receivables (b)(c) 4,328 4,586
Other receivables 459 334
Other assets 533 712
Total assets $38,882 $36,427
Intercompany payables (b) $ 6,802 $ 6,213
Debt (d) 24,501 23,332
Other liabilities 4,084 3,633
Total liabilities 35,388 33,178
Total equity 3,494 3,249
Total liabilities and equity $38,882 $36,427
(a) Includes intercompany mark-up, priced on an arm’s-length basis, on products purchased from the company’s product divisions, which is eliminated in IBM’s consolidated results.
(b) Entire amount eliminated for purposes of IBM’s consolidated results and therefore does not appear on page 72.
(c) These assets, along with all other financing assets in this table, are leveraged at the value in the table using Global Financing debt.
(d) Global Financing debt is comprised of intercompany loans and external debt. A portion of Global Financing debt is in support of the company’s internal business, or related to intercompany mark-up embedded in the Global Financing assets. See table on page 67.
Sources and Uses of Funds The primary use of funds in Global Financing is to originate client and commercial financing assets. Client financing assets for end users consist primarily of IBM systems, software and services, but also include non-IBM equipment, software and services to meet IBM clients’ total solutions requirements. Client financing assets are primarily sales-type, direct financing and operating leases for sys-tems products as well as loans for systems, software and services with terms generally from one to seven years. Global Financing’s client loans are primarily for software and services and are unsecured. These loans are subjected to credit analysis to evaluate the associ-ated risk and, when deemed necessary, actions are taken to mitigate risks in the loan agreements which include covenants to protect against credit deterioration during the life of the obligation. Client financing also includes internal activity as described on page 24.

65Management Discussion International Business Machines Corporation and Subsidiary Companies
Commercial financing receivables arise primarily from inventory and accounts receivable financing for dealers and remarketers of IBM and non-IBM products. Payment terms for inventory financing and accounts receivable financing generally range from 30 to 90 days. These short-term receivables are primarily unsecured and are also subjected to additional credit analysis in order to evaluate the associated risk. In addition to the actions described above, in certain circum-stances, the company may take mitigation actions to transfer credit risk to third parties. At December 31, 2012, substantially all financing assets were IT related assets, and approximately 60 percent of the external port-folio was with investment grade clients with no direct exposure to consumers or mortgage assets.
Originations The following are total financing originations.
($ in millions)
For the year ended December 31: 2012 2011 2010
Client financing $16,277 $14,390 $12,748
Commercial financing 36,944 35,282 32,366
Total $53,222 $49,673 $45,113
In 2012, new financing originations exceeded cash collections for both client and commercial financing. This resulted in a net increase in total financing assets from December 31, 2011. The increase in originations in both 2012 versus 2011 and 2011 versus 2010 was due to improving external volumes in both client and commercial financ-ing. Internal loan financing with Global Services is executed under a loan facility and is not considered originations. Cash generated by Global Financing in 2012 was primarily deployed to pay the intercompany payables and dividends to IBM.
Global Financing Receivables and AllowancesThe following table presents external financing receivables excluding residual values, and the allowance for credit losses.
($ in millions)
At December 31: 2012 2011
Gross financing receivables $30,621 $27,366
Specific allowance for credit losses 240 226
Unallocated allowance for credit losses 115 124
Total allowance for credit losses 355 350
Net financing receivables $30,266 $27,016
Allowance for credit losses coverage 1.2% 1.3%
Roll Forward of Global Financing Receivables Allowance for Credit Losses
($ in millions)
January 1, 2012Allowance
Used*Additions/
(Reductions) Other**December 31,
2012
$350 $(19 ) $26 $(1 ) $355
* Represents reserved receivables, net of recoveries, that were disposed of during the period.
** Primarily represents translation adjustments.
The percentage of Global Financing receivables reserved decreased from 1.3 percent at December 31, 2011 to 1.2 percent at December 31, 2012 primarily due to the disposition of receiv-ables previously reserved, and the increase in gross financing receivables. Specific reserves increased 6.2 percent from $226 million at December 31, 2011 to $240 million at December 31, 2012. Unallocated reserves decreased 7.3 percent from $124 million at December 31, 2011, to $115 million at December 31, 2012. Global Financing’s bad debt expense was an increase of $26 million for 2012, compared to an increase of $42 million for 2011. The higher bad debt expense in 2011 was attributed to the economic environ-ment in Europe.
Residual Value Residual value is a risk unique to the financing business and man-agement of this risk is dependent upon the ability to accurately project future equipment values at lease inception. Global Financing has insight into product plans and cycles for the IBM products under lease. Based upon this product information, Global Financing con-tinually monitors projections of future equipment values and compares them with the residual values reflected in the portfolio. See note A, “Significant Accounting Policies,” on page 86 for the company’s accounting policy for residual values. Global Financing optimizes the recovery of residual values by selling assets sourced from end of lease, leasing used equipment to new clients, or extending lease arrangements with current clients. Sales of equipment, which are primarily sourced from equipment returned at the end of a lease, represented 51.6 percent of Global Financing’s revenue in 2012 and 48.1 percent in 2011. The gross profit margins on these sales were 53.6 percent and 54.8 percent in 2012 and 2011, respectively. The decrease in gross margin was driven by a lower internal sales margin and a shift in mix toward lower margin external sales, partially offset by a higher external sales margin.
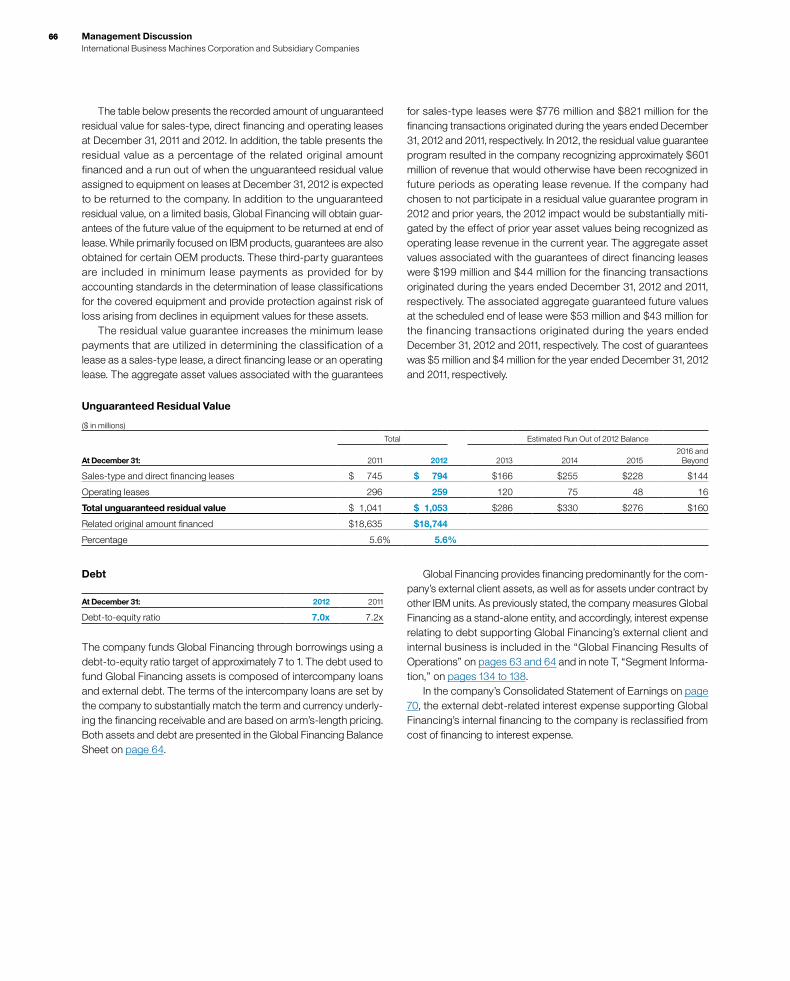
6666 Management Discussion International Business Machines Corporation and Subsidiary Companies
The table below presents the recorded amount of unguaranteed residual value for sales-type, direct financing and operating leases at December 31, 2011 and 2012. In addition, the table presents the residual value as a percentage of the related original amount financed and a run out of when the unguaranteed residual value assigned to equipment on leases at December 31, 2012 is expected to be returned to the company. In addition to the unguaranteed residual value, on a limited basis, Global Financing will obtain guar-antees of the future value of the equipment to be returned at end of lease. While primarily focused on IBM products, guarantees are also obtained for certain OEM products. These third-party guarantees are included in minimum lease payments as provided for by accounting standards in the determination of lease classifications for the covered equipment and provide protection against risk of loss arising from declines in equipment values for these assets. The residual value guarantee increases the minimum lease payments that are utilized in determining the classification of a lease as a sales-type lease, a direct financing lease or an operating lease. The aggregate asset values associated with the guarantees
for sales-type leases were $776 million and $821 million for the financing transactions originated during the years ended December 31, 2012 and 2011, respectively. In 2012, the residual value guarantee program resulted in the company recognizing approximately $601 million of revenue that would otherwise have been recognized in future periods as operating lease revenue. If the company had chosen to not participate in a residual value guarantee program in 2012 and prior years, the 2012 impact would be substantially miti-gated by the effect of prior year asset values being recognized as operating lease revenue in the current year. The aggregate asset values associated with the guarantees of direct financing leases were $199 million and $44 million for the financing transactions originated during the years ended December 31, 2012 and 2011, respectively. The associated aggregate guaranteed future values at the scheduled end of lease were $53 million and $43 million for the financing transactions originated during the years ended December 31, 2012 and 2011, respectively. The cost of guarantees was $5 million and $4 million for the year ended December 31, 2012 and 2011, respectively.
Unguaranteed Residual Value
($ in millions)
Total Estimated Run Out of 2012 Balance
At December 31: 2011 2012 2013 2014 20152016 and
Beyond
Sales-type and direct financing leases $ 745 $ 794 $166 $255 $228 $144
Operating leases 296 259 120 75 48 16
Total unguaranteed residual value $ 1,041 $ 1,053 $286 $330 $276 $160
Related original amount financed $18,635 $18,744
Percentage 5.6% 5.6%
Debt
At December 31: 2012 2011
Debt-to-equity ratio 7.0x 7.2x
The company funds Global Financing through borrowings using a debt-to-equity ratio target of approximately 7 to 1. The debt used to fund Global Financing assets is composed of intercompany loans and external debt. The terms of the intercompany loans are set by the company to substantially match the term and currency underly-ing the financing receivable and are based on arm’s-length pricing. Both assets and debt are presented in the Global Financing Balance Sheet on page 64.
Global Financing provides financing predominantly for the com-pany’s external client assets, as well as for assets under contract by other IBM units. As previously stated, the company measures Global Financing as a stand-alone entity, and accordingly, interest expense relating to debt supporting Global Financing’s external client and internal business is included in the “Global Financing Results of Operations” on pages 63 and 64 and in note T, “Segment Informa-tion,” on pages 134 to 138. In the company’s Consolidated Statement of Earnings on page 70, the external debt-related interest expense supporting Global Financing’s internal financing to the company is reclassified from cost of financing to interest expense.

67Management Discussion International Business Machines Corporation and Subsidiary Companies
Liquidity and Capital ResourcesGlobal Financing is a segment of the company, and therefore is sup-ported by the company’s overall liquidity position and access to capital markets. Cash generated by Global Financing was primarily deployed to pay intercompany payables and dividends to the com-pany in order to maintain an appropriate debt-to-equity ratio.
Return on Equity($ in millions)
At December 31: 2012 2011
Numerator
Global Financing after-tax income (a)* $1,362 $1,338
Denominator
Average Global Financing equity (b)** $3,322 $3,286
Global Financing return on equity (a) /(b) 41.0% 40.7%
* Calculated based upon an estimated tax rate principally based on Global Financing’s geographic mix of earnings as IBM’s provision for income taxes is determined on a consolidated basis.
** Average of the ending equity for Global Financing for the last five quarters.
Looking ForwardGlobal Financing’s financial position provides flexibility and funding capacity which enables the company to be well positioned in the current environment. Global Financing’s assets and new financing volumes are primarily IBM products and services financed to the company’s clients and business partners, and substantially all financing assets are IT related assets which provide a stable base of business for future growth. Global Financing’s offerings are com-petitive and available to clients as a result of the company’s borrowing cost and access to the capital markets. Overall, Global Financing’s originations will be dependent upon the demand for IT products and services as well as client participation rates. IBM continues to access both the short-term commercial paper market and the medium- and long-term debt markets. A protracted period where IBM could not access the capital markets would likely lead to a slowdown in originations. Interest rates and the overall economy (including currency fluc-tuations) will have an effect on both revenue and gross profit. The company’s interest rate risk management policy, however, combined with the Global Financing pricing strategy should mitigate gross margin erosion due to changes in interest rates. The economy could impact the credit quality of the Global Financing receivables portfolio and therefore the level of provision for credit losses. Global Financing will continue to apply rigorous credit policies in both the origination of new business and the evalu-ation of the existing portfolio. As discussed on pages 65 and 66, Global Financing has histori-cally been able to manage residual value risk both through insight into the company’s product cycles, as well as through its remarketing business. Global Financing has policies in place to manage each of the key risks involved in financing. These policies, combined with prod-uct and client knowledge, should allow for the prudent management of the business going forward, even during periods of uncertainty with respect to the global economy.
The following table provides additional information on total company debt. In this table, intercompany activity includes internal loans and leases at arm’s-length pricing in support of Global Services’ long-term contracts and other internal activity. The company believes these assets should be appropriately leveraged in line with the overall Global Financing business model.
($ in millions)
December 31, 2012 December 31, 2011
Global Financing Segment $24,501 $23,332
Debt to support external clients $21,583 $20,051
Debt to support internal clients 2,919 3,281
Non-Global Financing Segments 8,767 7,987
Debt supporting operations 11,686 11,269
Intercompany activity (2,919) (3,281)
Total company debt $33,269 $31,320
6868 Report of Management International Business Machines Corporation and Subsidiary Companies
Management Responsibility for Financial InformationResponsibility for the integrity and objectivity of the financial informa-tion presented in this Annual Report rests with IBM management. The accompanying financial statements have been prepared in accordance with accounting principles generally accepted in the United States of America, applying certain estimates and judgments as required. IBM maintains an effective internal control structure. It consists, in part, of organizational arrangements with clearly defined lines of responsibility and delegation of authority, and comprehensive systems and control procedures. An important element of the control environment is an ongoing internal audit program. Our system also contains self-monitoring mechanisms, and actions are taken to correct deficiencies as they are identified. To assure the effective administration of internal controls, we carefully select and train our employees, develop and disseminate written policies and procedures, provide appropriate communication channels and foster an environment conducive to the effective func-tioning of controls. We believe that it is essential for the company to conduct its business affairs in accordance with the highest ethical standards, as set forth in the IBM Business Conduct Guidelines. These guidelines, translated into numerous languages, are distrib-uted to employees throughout the world, and reemphasized through internal programs to assure that they are understood and followed. PricewaterhouseCoopers LLP, an independent registered public accounting firm, is retained to audit IBM’s Consolidated Financial Statements and the effectiveness of the internal control over financial reporting. Its accompanying report is based on audits conducted in accordance with the standards of the Public Company Accounting Oversight Board (United States). The Audit Committee of the Board of Directors is composed solely of independent, non-management directors, and is respon-sible for recommending to the Board the independent registered public accounting firm to be retained for the coming year, subject to stockholder ratification. The Audit Committee meets periodically and privately with the independent registered public accounting firm, with the company’s internal auditors, as well as with IBM manage-ment, to review accounting, auditing, internal control structure and financial reporting matters.
Management’s Report on Internal Control Over Financial ReportingManagement is responsible for establishing and maintaining adequate internal control over financial reporting of the company. Internal control over financial reporting is a process designed to provide reasonable assurance regarding the reliability of financial reporting and the preparation of financial statements for external purposes in accordance with accounting principles generally accepted in the United States of America. The company’s internal control over financial reporting includes those policies and procedures that (i) pertain to the maintenance of records that, in reasonable detail, accurately and fairly reflect the transactions and dispositions of the assets of the company; (ii) provide reasonable assurance that transactions are recorded as necessary to permit preparation of financial statements in accor-dance with accounting principles generally accepted in the United States of America, and that receipts and expenditures of the com-pany are being made only in accordance with authorizations of management and directors of the company; and (iii) provide reason-able assurance regarding prevention or timely detection of unauthorized acquisition, use, or disposition of the company’s assets that could have a material effect on the financial statements. Because of its inherent limitations, internal control over financial reporting may not prevent or detect misstatements. Also, projections of any evaluation of effectiveness to future periods are subject to the risk that controls may become inadequate because of changes in conditions, or that the degree of compliance with the policies or procedures may deteriorate. Management conducted an evaluation of the effectiveness of internal control over financial reporting based on the framework in Internal Control—Integrated Framework issued by the Committee of Sponsoring Organizations of the Treadway Commission (COSO). Based on this evaluation, management concluded that the com-pany’s internal control over financial reporting was effective as of December 31, 2012.
Virginia M. RomettyChairman, President and Chief Executive OfficerFebruary 26, 2013
Mark LoughridgeSenior Vice President and Chief Financial Officer,Finance and Enterprise TransformationFebruary 26, 2013

69Report of Independent Registered Public Accounting Firm International Business Machines Corporation and Subsidiary Companies
To the Stockholders and Board of Directors of International Business Machines Corporation:In our opinion, the accompanying Consolidated Financial State-ments appearing on pages 70 through 138 present fairly, in all material respects, the financial position of International Business Machines Corporation and its subsidiaries at December 31, 2012 and 2011 and the results of their operations and their cash flows for each of the three years in the period ended December 31, 2012 in conformity with accounting principles generally accepted in the United States of America. Also in our opinion, the Company main-tained, in all material respects, effective internal control over financial reporting as of December 31, 2012, based on criteria established in Internal Control—Integrated Framework issued by the Committee of Sponsoring Organ izations of the Treadway Com-mission (COSO). The Company’s management is responsible for these financial statements, for maintaining effective internal control over financial reporting and for its assessment of the effectiveness of internal control over financial reporting, included in the accom-panying Management’s Report on Internal Control over Financial Reporting appearing on page 68. Our responsibility is to express opinions on these financial statements and on the Company’s inter-nal control over financial reporting based on our integrated audits. We conducted our audits in accordance with the standards of the Public Company Accounting Oversight Board (United States). Those standards require that we plan and perform the audits to obtain reasonable assurance about whether the financial statements are free of material misstatement and whether effective internal con-trol over financial reporting was maintained in all material respects. Our audits of the financial statements included examining, on a test basis, evidence supporting the amounts and disclosures in the financial statements, assessing the accounting principles used and significant estimates made by management, and evaluating the overall financial statement presentation. Our audit of internal control over financial reporting included obtaining an understanding of inter-nal control over financial reporting, assessing the risk that a material weakness exists, and testing and evaluating the design and operat-ing effectiveness of internal control based on the assessed risk. Our audits also included performing such other procedures as we considered necessary in the circumstances. We believe that our audits provide a reasonable basis for our opinions.
A company’s internal control over financial reporting is a process designed to provide reasonable assurance regarding the reliability of financial reporting and the preparation of financial statements for external purposes in accordance with generally accepted accounting principles. A company’s internal control over financial reporting includes those policies and procedures that (i) pertain to the maintenance of records that, in reasonable detail, accurately and fairly reflect the transactions and dispositions of the assets of the company; (ii) provide reasonable assurance that transactions are recorded as necessary to permit preparation of financial state-ments in accordance with generally accepted accounting principles, and that receipts and expenditures of the company are being made only in accordance with authorizations of management and direc-tors of the company; and (iii) provide reasonable assurance regarding prevention or timely detection of unauthorized acquisition, use, or disposition of the company’s assets that could have a material effect on the financial statements. Because of its inherent limitations, internal control over financial reporting may not prevent or detect misstatements. Also, projections of any evaluation of effectiveness to future periods are subject to the risk that controls may become inadequate because of changes in conditions, or that the degree of compliance with the policies or procedures may deteriorate.
PricewaterhouseCoopers LLPNew York, New YorkFebruary 26, 2013

7070 Consolidated Statement of Earnings International Business Machines Corporation and Subsidiary Companies
($ in millions except per share amounts)
For the year ended December 31: Notes 2012 2011 2010
Revenue
Services $ 59,453 $ 60,721 $56,868
Sales 43,014 44,063 40,736
Financing 2,040 2,132 2,267
Total revenue 104,507 106,916 99,870
Cost
Services 39,166 40,740 38,383
Sales 13,956 14,973 14,374
Financing 1,087 1,065 1,100
Total cost 54,209 56,778 53,857
Gross profit 50,298 50,138 46,014
Expense and other income
Selling, general and administrative 23,553 23,594 21,837
Research, development and engineering O 6,302 6,258 6,026
Intellectual property and custom development income (1,074) (1,108) (1,154)
Other (income) and expense (843) (20) (787)
Interest expense D&J 459 411 368
Total expense and other income 28,396 29,135 26,291
Income before income taxes 21,902 21,003 19,723
Provision for income taxes N 5,298 5,148 4,890
Net income $ 16,604 $ 15,855 $14,833
Earnings per share of common stock
Assuming dilution P $ 14.37 $ 13.06 $ 11.52
Basic P $ 14.53 $ 13.25 $ 11.69
Weighted-average number of common shares outstanding
Assuming dilution 1,155,449,317 1,213,767,985 1,287,355,388
Basic 1,142,508,521 1,196,951,006 1,268,789,202
Amounts may not add due to rounding.
The accompanying notes on pages 76 through 138 are an integral part of the financial statements.
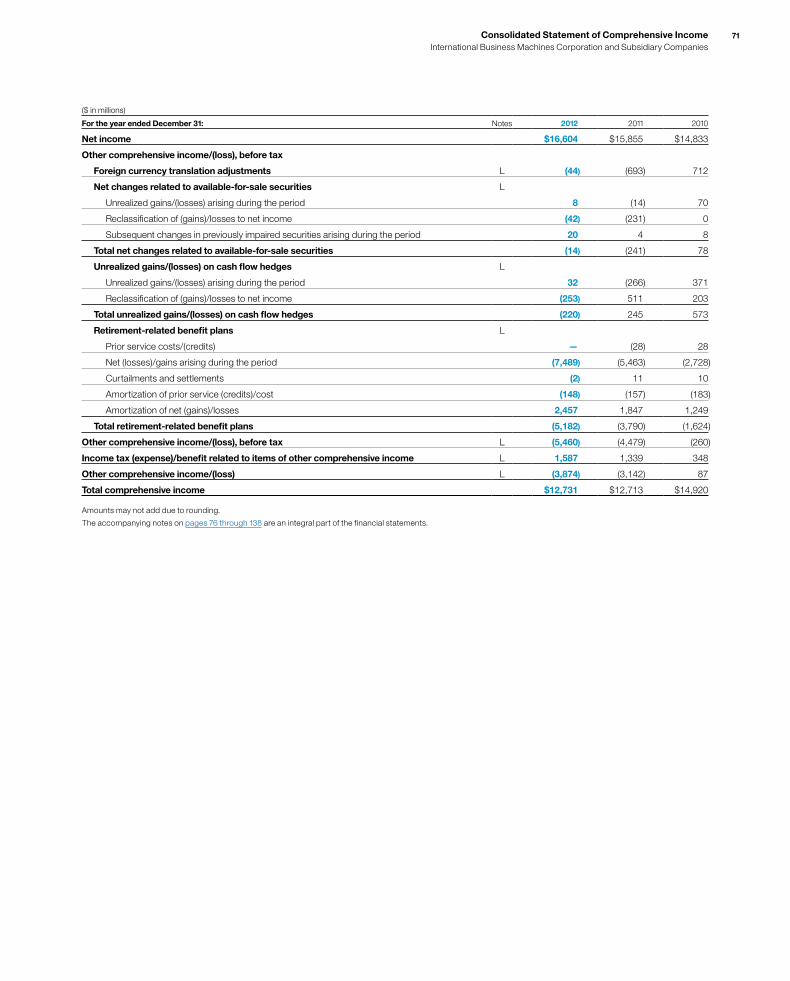
71Consolidated Statement of Comprehensive Income International Business Machines Corporation and Subsidiary Companies
($ in millions)
For the year ended December 31: Notes 2012 2011 2010
Net income $16,604 $15,855 $14,833
Other comprehensive income/(loss), before tax
Foreign currency translation adjustments L (44) (693) 712
Net changes related to available-for-sale securities L
Unrealized gains/(losses) arising during the period 8 (14) 70
Reclassification of (gains)/losses to net income (42) (231) 0
Subsequent changes in previously impaired securities arising during the period 20 4 8
Total net changes related to available-for-sale securities (14) (241) 78
Unrealized gains/(losses) on cash flow hedges L
Unrealized gains/(losses) arising during the period 32 (266) 371
Reclassification of (gains)/losses to net income (253) 511 203
Total unrealized gains/(losses) on cash flow hedges (220) 245 573
Retirement-related benefit plans L
Prior service costs/(credits) — (28) 28
Net (losses)/gains arising during the period (7,489) (5,463) (2,728)
Curtailments and settlements (2) 11 10
Amortization of prior service (credits)/cost (148) (157) (183)
Amortization of net (gains)/losses 2,457 1,847 1,249
Total retirement-related benefit plans (5,182) (3,790) (1,624)
Other comprehensive income/(loss), before tax L (5,460) (4,479) (260)
Income tax (expense)/benefit related to items of other comprehensive income L 1,587 1,339 348
Other comprehensive income/(loss) L (3,874) (3,142) 87
Total comprehensive income $12,731 $12,713 $14,920
Amounts may not add due to rounding.
The accompanying notes on pages 76 through 138 are an integral part of the financial statements.
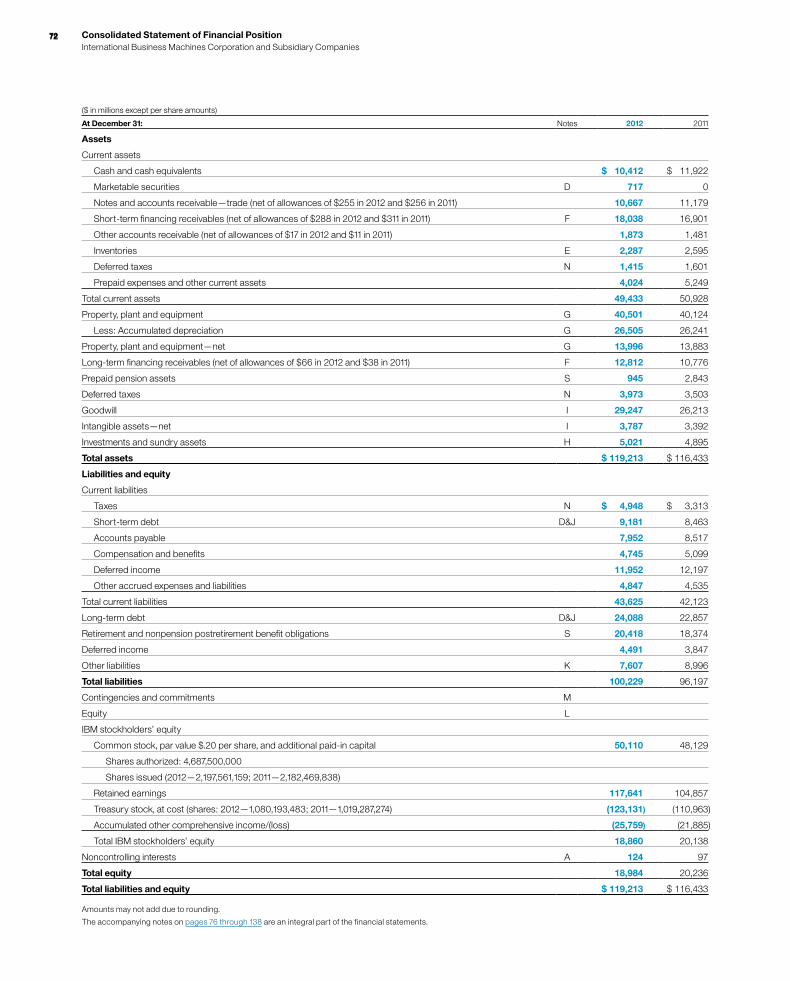
7272 Consolidated Statement of Financial Position International Business Machines Corporation and Subsidiary Companies
($ in millions except per share amounts)
At December 31: Notes 2012 2011
Assets
Current assets
Cash and cash equivalents $ 10,412 $ 11,922
Marketable securities D 717 0
Notes and accounts receivable—trade (net of allowances of $255 in 2012 and $256 in 2011) 10,667 11,179
Short-term financing receivables (net of allowances of $288 in 2012 and $311 in 2011) F 18,038 16,901
Other accounts receivable (net of allowances of $17 in 2012 and $11 in 2011) 1,873 1,481
Inventories E 2,287 2,595
Deferred taxes N 1,415 1,601
Prepaid expenses and other current assets 4,024 5,249
Total current assets 49,433 50,928
Property, plant and equipment G 40,501 40,124
Less: Accumulated depreciation G 26,505 26,241
Property, plant and equipment—net G 13,996 13,883
Long-term financing receivables (net of allowances of $66 in 2012 and $38 in 2011) F 12,812 10,776
Prepaid pension assets S 945 2,843
Deferred taxes N 3,973 3,503
Goodwill I 29,247 26,213
Intangible assets—net I 3,787 3,392
Investments and sundry assets H 5,021 4,895
Total assets $ 119,213 $ 116,433
Liabilities and equity
Current liabilities
Taxes N $ 4,948 $ 3,313
Short-term debt D&J 9,181 8,463
Accounts payable 7,952 8,517
Compensation and benefits 4,745 5,099
Deferred income 11,952 12,197
Other accrued expenses and liabilities 4,847 4,535
Total current liabilities 43,625 42,123
Long-term debt D&J 24,088 22,857
Retirement and nonpension postretirement benefit obligations S 20,418 18,374
Deferred income 4,491 3,847
Other liabilities K 7,607 8,996
Total liabilities 100,229 96,197
Contingencies and commitments M
Equity L
IBM stockholders’ equity
Common stock, par value $.20 per share, and additional paid-in capital 50,110 48,129
Shares authorized: 4,687,500,000
Shares issued (2012—2,197,561,159; 2011—2,182,469,838)
Retained earnings 117,641 104,857
Treasury stock, at cost (shares: 2012—1,080,193,483; 2011—1,019,287,274) (123,131) (110,963)
Accumulated other comprehensive income/(loss) (25,759) (21,885)
Total IBM stockholders’ equity 18,860 20,138
Noncontrolling interests A 124 97
Total equity 18,984 20,236
Total liabilities and equity $ 119,213 $ 116,433
Amounts may not add due to rounding.
The accompanying notes on pages 76 through 138 are an integral part of the financial statements.
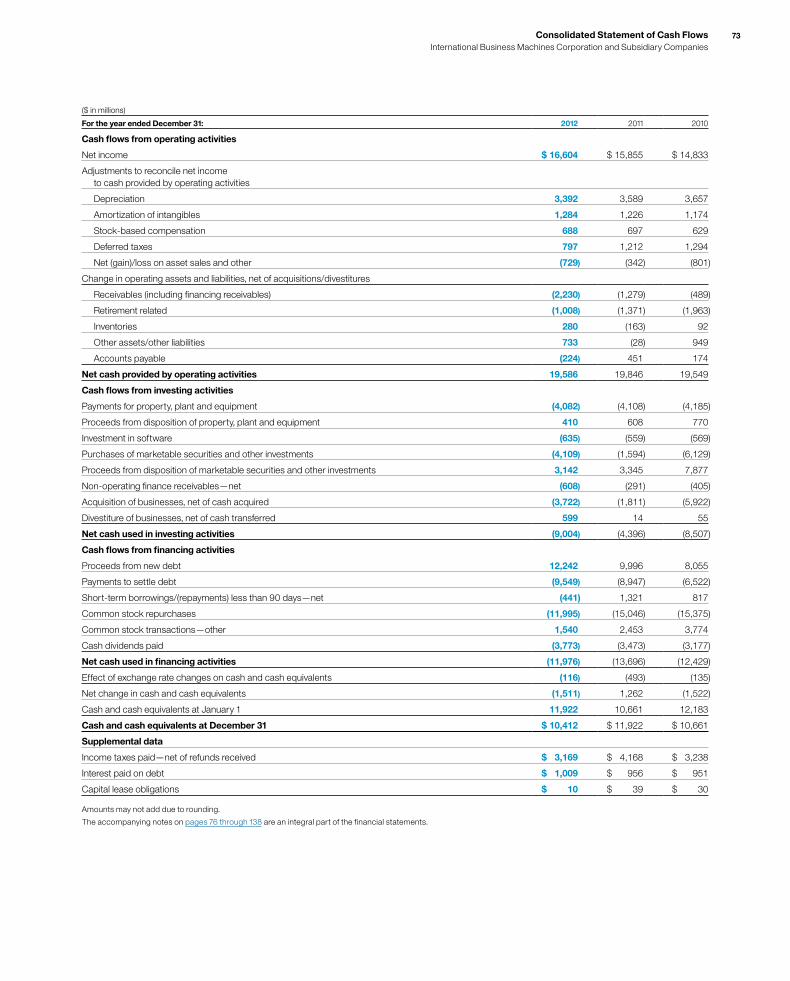
73Consolidated Statement of Cash Flows International Business Machines Corporation and Subsidiary Companies
($ in millions)
For the year ended December 31: 2012 2011 2010
Cash flows from operating activities
Net income $ 16,604 $ 15,855 $ 14,833
Adjustments to reconcile net income to cash provided by operating activities
Depreciation 3,392 3,589 3,657
Amortization of intangibles 1,284 1,226 1,174
Stock-based compensation 688 697 629
Deferred taxes 797 1,212 1,294
Net (gain)/loss on asset sales and other (729) (342) (801)
Change in operating assets and liabilities, net of acquisitions/divestitures
Receivables (including financing receivables) (2,230) (1,279) (489)
Retirement related (1,008) (1,371) (1,963)
Inventories 280 (163) 92
Other assets/other liabilities 733 (28) 949
Accounts payable (224) 451 174
Net cash provided by operating activities 19,586 19,846 19,549
Cash flows from investing activities
Payments for property, plant and equipment (4,082) (4,108) (4,185)
Proceeds from disposition of property, plant and equipment 410 608 770
Investment in software (635) (559) (569)
Purchases of marketable securities and other investments (4,109) (1,594) (6,129)
Proceeds from disposition of marketable securities and other investments 3,142 3,345 7,877
Non-operating finance receivables—net (608) (291) (405)
Acquisition of businesses, net of cash acquired (3,722) (1,811) (5,922)
Divestiture of businesses, net of cash transferred 599 14 55
Net cash used in investing activities (9,004) (4,396) (8,507)
Cash flows from financing activities
Proceeds from new debt 12,242 9,996 8,055
Payments to settle debt (9,549) (8,947) (6,522)
Short-term borrowings/(repayments) less than 90 days—net (441) 1,321 817
Common stock repurchases (11,995) (15,046) (15,375)
Common stock transactions—other 1,540 2,453 3,774
Cash dividends paid (3,773) (3,473) (3,177)
Net cash used in financing activities (11,976) (13,696) (12,429)
Effect of exchange rate changes on cash and cash equivalents (116) (493) (135)
Net change in cash and cash equivalents (1,511) 1,262 (1,522)
Cash and cash equivalents at January 1 11,922 10,661 12,183
Cash and cash equivalents at December 31 $ 10,412 $ 11,922 $ 10,661
Supplemental data
Income taxes paid—net of refunds received $ 3,169 $ 4,168 $ 3,238
Interest paid on debt $ 1,009 $ 956 $ 951
Capital lease obligations $ 10 $ 39 $ 30
Amounts may not add due to rounding.
The accompanying notes on pages 76 through 138 are an integral part of the financial statements.
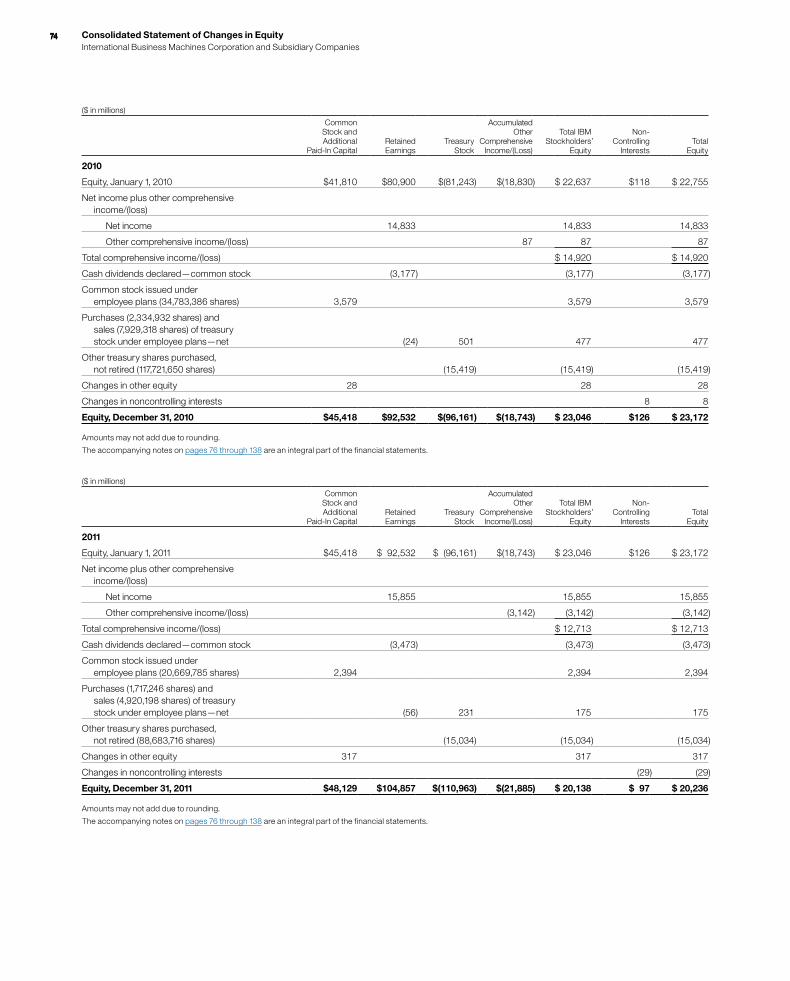
7474 Consolidated Statement of Changes in Equity International Business Machines Corporation and Subsidiary Companies
($ in millions)
Common Stock and Additional
Paid-In CapitalRetained Earnings
Treasury Stock
Accumulated Other
Comprehensive Income/(Loss)
Total IBM Stockholders
Equity’
Non- Controlling
InterestsTotal
Equity
2010
Equity, January 1, 2010 $41,810 $80,900 $(81,243) $(18,830) $ 22,637 $118 $ 22,755
Net income plus other comprehensive income/(loss)
Net income 14,833 14,833 14,833
Other comprehensive income/(loss) 87 87 87
Total comprehensive income/(loss) $ 14,920 $ 14,920
Cash dividends declared—common stock (3,177) (3,177) (3,177)
Common stock issued under employee plans (34,783,386 shares) 3,579 3,579 3,579
Purchases (2,334,932 shares) and sales (7,929,318 shares) of treasury stock under employee plans—net (24) 501 477 477
Other treasury shares purchased, not retired (117,721,650 shares) (15,419) (15,419) (15,419)
Changes in other equity 28 28 28
Changes in noncontrolling interests 8 8
Equity, December 31, 2010 $45,418 $92,532 $(96,161) $(18,743) $ 23,046 $126 $ 23,172
Amounts may not add due to rounding.
The accompanying notes on pages 76 through 138 are an integral part of the financial statements.
($ in millions)
Common Stock and Additional
Paid-In CapitalRetained Earnings
Treasury Stock
Accumulated Other
Comprehensive Income/(Loss)
Total IBM Stockholders
Equity’
Non- Controlling
InterestsTotal
Equity
2011
Equity, January 1, 2011 $45,418 $ 92,532 $ (96,161) $(18,743) $ 23,046 $126 $ 23,172
Net income plus other comprehensive income/(loss)
Net income 15,855 15,855 15,855
Other comprehensive income/(loss) (3,142) (3,142) (3,142)
Total comprehensive income/(loss) $ 12,713 $ 12,713
Cash dividends declared—common stock (3,473) (3,473) (3,473)
Common stock issued under employee plans (20,669,785 shares) 2,394 2,394 2,394
Purchases (1,717,246 shares) and sales (4,920,198 shares) of treasury stock under employee plans—net (56) 231 175 175
Other treasury shares purchased, not retired (88,683,716 shares) (15,034) (15,034) (15,034)
Changes in other equity 317 317 317
Changes in noncontrolling interests (29) (29)
Equity, December 31, 2011 $48,129 $104,857 $(110,963) $(21,885) $ 20,138 $ 97 $ 20,236
Amounts may not add due to rounding.
The accompanying notes on pages 76 through 138 are an integral part of the financial statements.
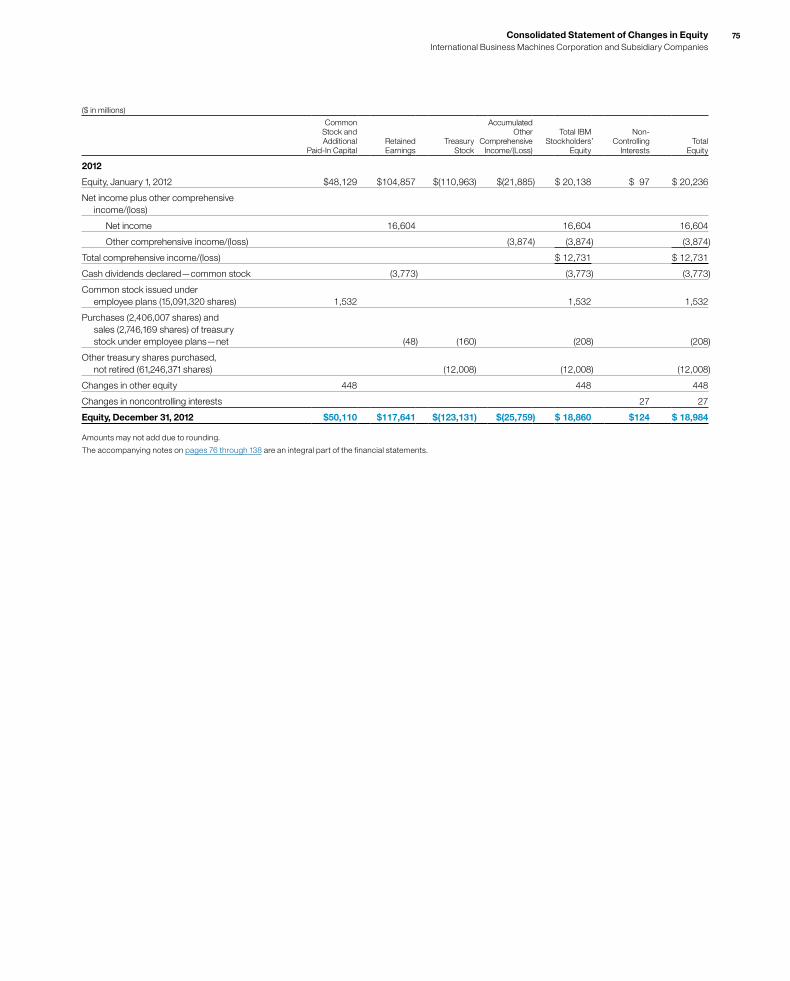
75Consolidated Statement of Changes in Equity International Business Machines Corporation and Subsidiary Companies
($ in millions)
Common Stock and Additional
Paid-In CapitalRetained Earnings
Treasury Stock
Accumulated Other
Comprehensive Income/(Loss)
Total IBM Stockholders
Equity’
Non- Controlling
InterestsTotal
Equity
2012
Equity, January 1, 2012 $48,129 $104,857 $(110,963) $(21,885) $ 20,138 $ 97 $ 20,236
Net income plus other comprehensive income/(loss)
Net income 16,604 16,604 16,604
Other comprehensive income/(loss) (3,874) (3,874) (3,874)
Total comprehensive income/(loss) $ 12,731 $ 12,731
Cash dividends declared—common stock (3,773) (3,773) (3,773)
Common stock issued under employee plans (15,091,320 shares) 1,532 1,532 1,532
Purchases (2,406,007 shares) and sales (2,746,169 shares) of treasury stock under employee plans—net (48) (160) (208) (208)
Other treasury shares purchased, not retired (61,246,371 shares) (12,008) (12,008) (12,008)
Changes in other equity 448 448 448
Changes in noncontrolling interests 27 27
Equity, December 31, 2012 $50,110 $117,641 $(123,131) $(25,759) $ 18,860 $124 $ 18,984
Amounts may not add due to rounding.
The accompanying notes on pages 76 through 138 are an integral part of the financial statements.
76 Notes to Consolidated Financial Statements International Business Machines Corporation and Subsidiary Companies
76
Note A. Significant Accounting PoliciesBasis of PresentationThe accompanying Consolidated Financial Statements and foot-notes of the International Business Machines Corporation (IBM or the company) have been prepared in accordance with accounting principles generally accepted in the United States of America (GAAP). Within the financial statements and tables presented, certain columns and rows may not add due to the use of rounded numbers for disclosure purposes. Percentages presented are calculated from the underlying whole-dollar amounts. Certain prior year amounts have been reclassified to conform to the current year presentation. This is annotated where applicable. Noncontrolling interest amounts in income of $11 million, $6 mil-lion and $9 million, net of tax, for the years ended December 31, 2012, 2011 and 2010, respectively, are included in the Consolidated Statement of Earnings within the other (income) and expense line item.
Principles of ConsolidationThe Consolidated Financial Statements include the accounts of IBM and its controlled subsidiaries, which are generally majority owned. Any noncontrolling interest in the equity of a subsidiary is reported in Equity in the Consolidated Statement of Financial Position. Net income and losses attributable to the noncontrolling interest is reported as described above in the Consolidated Statement of Earn-ings. The accounts of variable interest entities (VIEs) are included in the Consolidated Financial Statements, if required. Investments in business entities in which the company does not have control, but has the ability to exercise significant influence over operating and financial policies, are accounted for using the equity method and the company’s proportionate share of income or loss is recorded in other (income) and expense. The accounting policy for other invest-ments in equity securities is on pages 84 and 85 within “Marketable Securities.” Equity investments in non-publicly traded entities are primarily accounted for using the cost method. All intercompany transactions and accounts have been eliminated in consolidation.
Use of EstimatesThe preparation of financial statements in conformity with GAAP requires management to make estimates and assumptions that affect the amounts of assets, liabilities, revenue, costs, expenses and other comprehensive income/(loss) (OCI) that are reported in the Consolidated Financial Statements and accompanying disclo-sures. These estimates are based on management’s best knowledge of current events, historical experience, actions that the company may undertake in the future and on various other assump-tions that are believed to be reasonable under the circumstances. As a result, actual results may be different from these estimates. See “Critical Accounting Estimates” on pages 59 to 61 for a discussion of the company’s critical accounting estimates.
RevenueThe company recognizes revenue when it is realized or realizable and earned. The company considers revenue realized or realizable and earned when it has persuasive evidence of an arrangement, delivery has occurred, the sales price is fixed or determinable and collectibility is reasonably assured. Delivery does not occur until products have been shipped or services have been provided to the client, risk of loss has transferred to the client, and either client acceptance has been obtained, client acceptance provisions have lapsed, or the company has objective evidence that the criteria specified in the client acceptance provisions have been satisfied. The sales price is not considered to be fixed or determinable until all contingencies related to the sale have been resolved. The company recognizes revenue on sales to solution providers, resellers and distributors (herein referred to as “resellers”) when the reseller has: economic substance apart from the company, credit risk, title and risk of loss to the inventory; and, the fee to the company is not contingent upon resale or payment by the end user, the com-pany has no further obligations related to bringing about resale or delivery and all other revenue recognition criteria have been met. The company reduces revenue for estimated client returns, stock rotation, price protection, rebates and other similar allowances. (See Schedule II, “Valuation and Qualifying Accounts and Reserves” included in the company’s Annual Report on Form 10-K). Revenue is recognized only if these estimates can be reasonably and reliably determined. The company bases its estimates on historical results taking into consideration the type of client, the type of transaction and the specifics of each arrangement. Payments made under cooperative marketing programs are recognized as an expense only if the company receives from the client an identifiable benefit suf-ficiently separable from the product sale whose fair value can be reasonably and reliably estimated. If the company does not receive an identifiable benefit sufficiently separable from the product sale whose fair value can be reasonably estimated, such payments are recorded as a reduction of revenue. Revenue from sales of third-party vendor products or services is recorded net of costs when the company is acting as an agent between the client and the vendor, and gross when the company is a principal to the transaction. Several factors are considered to determine whether the company is an agent or principal, most nota-bly whether the company is the primary obligor to the client, or has inventory risk. Consideration is also given to whether the company adds meaningful value to the vendor’s product or service, was involved in the selection of the vendor’s product or service, has lati-tude in establishing the sales price or has credit risk. The company reports revenue net of any revenue-based taxes assessed by governmental authorities that are imposed on and concurrent with specific revenue-producing transactions. In addition to the aforementioned general policies, the following are the specific revenue recognition policies for multiple-deliverable arrangements and for each major category of revenue.
Notes to Consolidated Financial Statements International Business Machines Corporation and Subsidiary Companies
77
Multiple-Deliverable ArrangementsThe company enters into revenue arrangements that may consist of multiple deliverables of its products and services based on the needs of its clients. These arrangements may include any combina-tion of services, software, hardware and/or financing. For example, a client may purchase a server that includes operating system soft-ware. In addition, the arrangement may include post-contract support for the software and a contract for post-warranty mainte-nance service for the hardware. These types of arrangements can also include financing provided by the company. These arrange-ments consist of multiple deliverables, with the hardware and software delivered in one reporting period and the software support and hardware maintenance services delivered across multiple reporting periods. In another example, a client may outsource the running of its datacenter operations to the company on a long-term, multiple-year basis and periodically purchase servers and/or soft-ware products from the company to upgrade or expand its facility. The outsourcing services are provided on a continuous basis across multiple reporting periods and the hardware and software products are delivered in one reporting period. To the extent that a deliverable in a multiple-deliverable arrangement is subject to specific account-ing guidance that deliverable is accounted for in accordance with such specific guidance. Examples of such arrangements may include leased hardware which is subject to specific leasing guid-ance or software which is subject to specific software revenue recognition guidance on whether and/or how to separate multiple-deliverable arrangements into separate units of accounting (separability) and how to allocate the arrangement consideration among those separate units of accounting (allocation). For all other deliverables in multiple-deliverable arrangements, the guidance below is applied for separability and allocation. A multiple-deliver-able arrangement is separated into more than one unit of accounting if the following criteria are met:
• The delivered item(s) has value to the client on a stand-alone basis; and
• If the arrangement includes a general right of return relative to the delivered item(s), delivery or performance of the undelivered item(s) is considered probable and substantially in the control of the company.
If these criteria are not met, the arrangement is accounted for as one unit of accounting which would result in revenue being recog-nized ratably over the contract term or being deferred until the earlier of when such criteria are met or when the last undelivered element is delivered. If these criteria are met for each element and there is a relative selling price for all units of accounting in an arrangement, the arrangement consideration is allocated to the separate units of accounting based on each unit’s relative selling price. The following revenue policies are then applied to each unit of accounting, as applicable. Revenue from the company’s business analytics, Smarter Planet and cloud offerings follow the specific revenue recognition policies for multiple deliverable arrangements and for each major category of revenue depending on the type of offering which can be com-prised of services, hardware and/or software.
ServicesThe company’s primary services offerings include information tech-nology (IT) datacenter and business process outsourcing, application management services, consulting and systems integration, technol-ogy infrastructure and system maintenance, Web hosting and the design and development of complex IT systems to a client’s speci-fications (design and build). These services are provided on a time-and-material basis, as a fixed-price contract or as a fixed-price per measure of output contract and the contract terms range from less than one year to over 10 years. Revenue from IT datacenter and business process outsourcing contracts is recognized in the period the services are provided using either an objective measure of output or on a straight-line basis over the term of the contract. Under the output method, the amount of revenue recognized is based on the services delivered in the period. Revenue from application management services, technology infrastructure and system maintenance and Web hosting contracts is recognized on a straight-line basis over the terms of the contracts. Revenue from time-and-material contracts is recognized as labor hours are delivered and direct expenses are incurred. Revenue related to extended warranty and product maintenance contracts is recognized on a straight-line basis over the delivery period. Revenue from fixed-price design and build contracts is recog-nized under the percentage-of-completion (POC) method. Under the POC method, revenue is recognized based on the labor costs incurred to date as a percentage of the total estimated labor costs to fulfill the contract. If circumstances arise that change the original estimates of revenues, costs, or extent of progress toward comple-tion, revisions to the estimates are made. These revisions may result in increases or decreases in estimated revenues or costs, and such revisions are reflected in income in the period in which the circumstances that gave rise to the revision become known by the company. The company performs ongoing profitability analyses of its ser-vices contracts accounted for under the POC method in order to determine whether the latest estimates of revenues, costs and prof-its require updating. If at any time these estimates indicate that the contract will be unprofitable, the entire estimated loss for the remain-der of the contract is recorded immediately. For non-POC method services contracts, any losses are recorded as incurred. In some services contracts, the company bills the client prior to recognizing revenue from performing the services. Deferred income of $7,281 million and $7,363 million at December 31, 2012 and 2011, respectively, is included in the Consolidated Statement of Financial Position. In other services contracts, the company performs the services prior to billing the client. Unbilled accounts receivable of $1,998 million and $2,166 million at December 31, 2012 and 2011, respectively, is included in notes and accounts receivable-trade in the Consolidated Statement of Financial Position. Billings usually occur in the month after the company performs the services or in accordance with specific contractual provisions. Unbilled receivables are expected to be billed within four months.
78 Notes to Consolidated Financial Statements International Business Machines Corporation and Subsidiary Companies
78
HardwareThe company’s hardware offerings include the sale or lease of system servers, storage solutions, retail store systems and the sale of semiconductors. The company also offers installation services for its more complex products. Revenue from hardware sales and sales-type leases is recog-nized when risk of loss has transferred to the client and there are no unfulfilled company obligations that affect the client’s final accep-tance of the arrangement. Any cost of standard warranties and remaining obligations that are inconsequential or perfunctory are accrued when the corresponding revenue is recognized. Revenue from rentals and operating leases is recognized on a straight-line basis over the term of the rental or lease.
SoftwareRevenue from perpetual (one-time charge) license software is rec-ognized at the inception of the license term if all revenue recognition criteria have been met. Revenue from term (recurring license charge) license software is recognized on a straight-line basis over the period that the client is entitled to use the license. Revenue from post-contract support, which may include unspecified upgrades on a when-and-if-available basis, is recognized on a straight-line basis over the period such items are delivered. In multiple-deliverable arrangements that include software that is more than incidental to the products or services as a whole (software multiple-deliverable arrangements), software and software-related elements are accounted for in accordance with software revenue recognition guidance. Software-related elements include software products and services for which a software deliverable is essential to its functionality. Tan-gible products containing software components and non-software components that function together to deliver the tangible product’s essential functionality are not within the scope of software revenue recognition guidance and are accounted for based on other appli-cable revenue recognition guidance. A software multiple-deliverable arrangement is separated into more than one unit of accounting if all of the following criteria are met:
• The functionality of the delivered element(s) is not dependent on the undelivered element(s);
• There is vendor-specific objective evidence (VSOE) of fair value of the undelivered element(s). VSOE of fair value is based on the price charged when the deliverable is sold separately by the company on a regular basis and not as part of the multiple-deliverable arrangement; and
• Delivery of the delivered element(s) represents the culmination of the earnings process for that element(s).
If any one of these criteria is not met, the arrangement is accounted for as one unit of accounting which would result in revenue being recognized ratably over the contract term or being deferred until the earlier of when such criteria are met or when the last undelivered element is delivered. If these criteria are met for each element and there is VSOE of fair value for all units of accounting in an arrange-ment, the arrangement consideration is allocated to the separate units of accounting based on each unit’s relative VSOE of fair value. There may be cases, however, in which there is VSOE of fair value of the undelivered item(s) but no such evidence for the delivered item(s). In these cases, the residual method is used to allocate the arrangement consideration. Under the residual method, the amount of consideration allocated to the delivered item(s) equals the total arrangement consideration less the aggregate VSOE of fair value of the undelivered elements. The company’s multiple-deliverable arrangements may have a stand-alone software deliverable that is subject to the existing software revenue recognition guidance. The revenue for these multiple-deliverable arrangements is allocated to the software deliv-erable and the non-software deliverables based on the relative selling prices of all of the deliverables in the arrangement using the hierarchy: VSOE, third-party evidence (TPE) or best estimate of sell-ing price (BESP). In the limited circumstances where the company cannot determine VSOE or TPE of the selling price for all of the deliverables in the arrangement, including the software deliverable, BESP is used for the purpose of performing this allocation.
FinancingFinancing income attributable to sales-type leases, direct financing leases and loans is recognized on the accrual basis using the effec-tive interest method. Operating lease income is recognized on a straight-line basis over the term of the lease.
Best Estimate of Selling PriceIn certain limited instances, the company is not able to establish VSOE for all elements in a multiple-deliverable arrangement. When VSOE cannot be established, the company attempts to establish the selling price of each element based on TPE. TPE is determined based on competitor prices for similar deliverables when sold separately. When the company is unable to establish selling price using VSOE or TPE, the company uses BESP in its allocation of arrange-ment consideration. The objective of BESP is to determine the price at which the company would transact a sale if the product or service were sold on a stand-alone basis. Due to the fact that the company sells its products and services on a stand-alone basis, and therefore has established VSOE for its products and services offerings, the company uses BESP to determine the relative selling price for a product or service in a multiple-deliverable arrangement on an infre-quent basis. An example of when BESP would be used is when the company sells a new product, for which VSOE and TPE does not yet exist, in a multiple-deliverable arrangement prior to selling the new product on a stand-alone basis.
Notes to Consolidated Financial Statements International Business Machines Corporation and Subsidiary Companies
79
The company determines BESP by considering multiple factors including, but not limited to, overall market conditions, including geographic or regional specific factors, competitive positioning, competitor actions, internal costs, profit objectives and pricing practices. The determination of BESP is a formal process that includes review and approval by the company’s management. In addition, the company regularly reviews VSOE and TPE for its products and services, in addition to BESP.
Services CostsRecurring operating costs for services contracts, including costs related to bid and proposal activities, are recognized as incurred. For fixed-price design and build contracts, the costs of external hardware and software accounted for under the POC method are deferred and recognized based on the labor costs incurred to date, as a percentage of the total estimated labor costs to fulfill the con-tract. Certain eligible, nonrecurring costs incurred in the initial phases of outsourcing contracts are deferred and subsequently amortized. These costs consist of transition and setup costs related to the installation of systems and processes and are amortized on a straight-line basis over the expected period of benefit, not to exceed the term of the contract. Additionally, fixed assets associated with outsourcing contracts are capitalized and depreciated on a straight-line basis over the expected useful life of the asset. If an asset is contract specific, then the depreciation period is the shorter of the useful life of the asset or the contract term. Amounts paid to clients in excess of the fair value of acquired assets used in out-sourcing arrangements are deferred and amortized on a straight-line basis as a reduction of revenue over the expected period of benefit not to exceed the term of the contract. The company performs peri-odic reviews to assess the recoverability of deferred contract transition and setup costs. This review is done by comparing the estimated minimum remaining undiscounted cash flows of a contract to the unamortized contract costs. If such minimum undiscounted cash flows are not sufficient to recover the unamortized costs, an impairment loss is recognized. Deferred services transition and setup costs were $2,424 million and $2,589 million at December 31, 2012 and 2011, respectively. Amortization of deferred services transition and setup costs was estimated at December 31, 2012 to be $819 million in 2013, $509 million in 2014, $430 million in 2015, $277 million in 2016 and $390 million thereafter. Deferred amounts paid to clients in excess of the fair value of acquired assets used in outsourcing arrangements were $51 million and $65 million at December 31, 2012 and 2011, respectively. Amor-tization of deferred amounts paid to clients in excess of the fair value of acquired assets is recorded as an offset of revenue and was estimated at December 31, 2012 to be $22 million in 2013, $19 million in 2014, $9 million in 2015, $2 million in 2016 and less than $1 million thereafter. In situations in which an outsourcing contract is termi-nated, the terms of the contract may require the client to reimburse the company for the recovery of unbilled accounts receivable, unam-ortized deferred costs incurred to purchase specific assets utilized in the delivery of services and to pay any additional costs incurred by the company to transition the services.
Software CostsCosts that are related to the conceptual formulation and design of licensed software programs are expensed as incurred to research, development and engineering expense; costs that are incurred to produce the finished product after technological feasibility has been established are capitalized as an intangible asset. Capitalized amounts are amortized on a straight-line basis over periods ranging up to three years and are recorded in software cost within cost of sales. The company performs periodic reviews to ensure that unam-ortized program costs remain recoverable from future revenue. Costs to support or service licensed programs are charged to soft-ware cost within cost of sales as incurred. The company capitalizes certain costs that are incurred to pur-chase or to create and implement internal-use software programs, including software coding, installation, testing and certain data conversions. These capitalized costs are amortized on a straight-line basis over periods up to two years and are recorded in selling, general and administrative expense.
Product WarrantiesThe company offers warranties for its hardware products that gener-ally range up to three years, with the majority being either one or three years. Estimated costs for warranty terms standard to the deliverable are recognized when revenue is recorded for the related deliverable. The company estimates its warranty costs standard to the deliverable based on historical warranty claim experience and estimates of future spending, and applies this estimate to the rev-enue stream for products under warranty. Estimated future costs for warranties applicable to revenue recognized in the current period are charged to cost of sales. The warranty liability is reviewed quar-terly to verify that it properly reflects the remaining obligation based on the anticipated expenditures over the balance of the obligation period. Adjustments are made when actual warranty claim experi-ence differs from estimates. Costs from fixed-price support or maintenance contracts, including extended warranty contracts, are recognized as incurred.
80 Notes to Consolidated Financial Statements International Business Machines Corporation and Subsidiary Companies
80
Revenue from separately priced extended warranty contracts is recorded as deferred income and subsequently recognized on a straight-line basis over the delivery period. Changes in deferred income for extended warranty contracts, and in the warranty liability for standard warranties, which are included in other accrued expenses and liabilities and other liabilities in the Consolidated Statement of Financial Position, are presented in the following tables:
Standard Warranty Liability
($ in millions)
2012 2011
Balance at January 1 $ 407 $ 375
Current period accruals 394 435
Accrual adjustments to reflect actual experience (15) 18
Charges incurred (392) (420)
Balance at December 31 $ 394 $ 407
Extended Warranty Liability (Deferred Income)
($ in millions)
2012 2011
Balance at January 1 $ 636 $ 670
Revenue deferred for new extended warranty contracts 268 314
Amortization of deferred revenue (301) (330)
Other* 4 (19)
Balance at December 31 $ 606 $ 636
Current portion $ 289 $ 301
Noncurrent portion 317 335
Balance at December 31 $ 606 $ 636
* Other consists primarily of foreign currency translation adjustments.
Shipping and HandlingCosts related to shipping and handling are recognized as incurred and included in cost in the Consolidated Statement of Earnings.
Expense and Other IncomeSelling, General and AdministrativeSelling, general and administrative (SG&A) expense is charged to income as incurred. Expenses of promoting and selling products and services are classified as selling expense and include such items as compensation, advertising, sales commissions and travel. General and administrative expense includes such items as com-pensation, legal costs, office supplies, non-income taxes, insurance and office rental. In addition, general and administrative expense includes other operating items such as an allowance for credit losses, workforce rebalancing accruals for contractually obligated payments to employees terminated in the ongoing course of business, acquisi-tion costs related to business combinations, amortization of certain intangible assets and environmental remediation costs.
Advertising and Promotional ExpenseThe company expenses advertising and promotional costs as incurred. Cooperative advertising reimbursements from vendors are recorded net of advertising and promotional expense in the period in which the related advertising and promotional expense is incurred. Advertising and promotional expense, which includes media, agency and promotional expense, was $1,339 million, $1,373 million and $1,337 million in 2012, 2011 and 2010, respectively, and is recorded in SG&A expense in the Consolidated Statement of Earnings.
Research, Development and EngineeringResearch, development and engineering (RD&E) costs are expensed as incurred. Software costs that are incurred to produce the finished product after technological feasibility has been established are capi-talized as an intangible asset. See “Software Costs” on page 79.
Intellectual Property and Custom Development IncomeThe company licenses and sells the rights to certain of its intellectual property (IP) including internally developed patents, trade secrets and technological know-how. Certain IP transactions to third parties are licensing/royalty-based and others are transaction-based sales and other transfers. Licensing/royalty-based fees involve transfers in which the company earns the income over time, or the amount of income is not fixed or determinable until the licensee sells future related products (i.e., variable royalty, based upon licensee’s revenue). Sales and other transfers typically include transfers of IP whereby the company has fulfilled its obligations and the fee received is fixed or determinable at the transfer date. The company also enters into cross-licensing arrangements of patents, and income from these arrangements is recorded when earned. In addi-tion, the company earns income from certain custom development projects for strategic technology partners and specific clients. The company records the income from these projects when the fee is realized and earned, is not refundable and is not dependent upon the success of the project.
Other (Income) and ExpenseOther (income) and expense includes interest income (other than from Global Financing external business transactions), gains and losses on certain derivative instruments, gains and losses from securities and other investments, gains and losses from certain real estate transactions, foreign currency transaction gains and losses, gains and losses from the sale of businesses and amounts related to accretion of asset retirement obligations.
Notes to Consolidated Financial Statements International Business Machines Corporation and Subsidiary Companies
81
Business Combinations and Intangible Assets Including GoodwillThe company accounts for business combinations using the acqui-sition method and accordingly, the identifiable assets acquired, the liabilities assumed, and any noncontrolling interest in the acquiree are recorded at their acquisition date fair values. Goodwill represents the excess of the purchase price over the fair value of net assets, including the amount assigned to identifiable intangible assets. The primary drivers that generate goodwill are the value of synergies between the acquired entities and the company and the acquired assembled workforce, neither of which qualifies as an identifiable intangible asset. Goodwill recorded in an acquisition is assigned to applicable reporting units based on expected revenues. Identifiable intangible assets with finite lives are amortized over their useful lives. Amortization of completed technology is recorded in Cost, and amortization of all other intangible assets is recorded in SG&A expense. Acquisition-related costs, including advisory, legal, accounting, valuation and other costs, are expensed in the periods in which the costs are incurred. The results of operations of acquired businesses are included in the Consolidated Financial Statements from the acquisition date.
ImpairmentLong-lived assets, other than goodwill and indefinite-lived intangible assets, are tested for impairment based on undiscounted cash flows and, if impaired, written down to fair value based on either discounted cash flows or appraised values. Goodwill and indefinite-lived intan-gible assets are tested annually, in the fourth quarter, for impairment and whenever changes in circumstances indicate an impairment may exist. Goodwill is tested at the reporting unit level which is the operat-ing segment, or a business, which is one level below that operating segment (the “component” level) if discrete financial information is prepared and regularly reviewed by management at the segment level. Components are aggregated as a single reporting unit if they have similar economic characteristics.
Depreciation and AmortizationProperty, plant and equipment are carried at cost and depreciated over their estimated useful lives using the straight-line method. The estimated useful lives of certain depreciable assets are as follows: buildings, 30 to 50 years; building equipment, 10 to 20 years; land improvements, 20 years; plant, laboratory and office equipment, 2 to 20 years; and computer equipment, 1.5 to 5 years. Leasehold improvements are amortized over the shorter of their estimated useful lives or the related lease term, rarely exceeding 25 years. Capitalized software costs incurred or acquired after techno-logical feasibility has been established are amortized over periods ranging up to 3 years. Capitalized costs for internal-use software are amortized on a straight-line basis over periods up to 2 years. Other intangible assets are amortized over periods between 1 and 7 years.
EnvironmentalThe cost of internal environmental protection programs that are preventative in nature are expensed as incurred. When a cleanup program becomes likely, and it is probable that the company will incur cleanup costs and those costs can be reasonably estimated, the company accrues remediation costs for known environmental liabilities. The company’s maximum exposure for all environmental liabilities cannot be estimated and no amounts are recorded for environmental liabilities that are not probable or estimable.
Asset Retirement ObligationsAsset retirement obligations (ARO) are legal obligations associated with the retirement of long-lived assets. These liabilities are initially recorded at fair value and the related asset retirement costs are capitalized by increasing the carrying amount of the related assets by the same amount as the liability. Asset retirement costs are sub-sequently depreciated over the useful lives of the related assets. Subsequent to initial recognition, the company records period-to-period changes in the ARO liability resulting from the passage of time in interest expense and revisions to either the timing or the amount of the original expected cash flows to the related assets.
Defined Benefit Pension and Nonpension Postretirement Benefit PlansThe funded status of the company’s defined benefit pension plans and nonpension postretirement benefit plans (retirement-related benefit plans) is recognized in the Consolidated Statement of Finan-cial Position. The funded status is measured as the difference between the fair value of plan assets and the benefit obligation at December 31, the measurement date. For defined benefit pension plans, the benefit obligation is the projected benefit obligation (PBO), which represents the actuarial present value of benefits expected to be paid upon retirement based on employee services already rendered and estimated future compensation levels. For the non-pension postretirement benefit plans, the benefit obligation is the accumulated postretirement benefit obligation (APBO), which rep-resents the actuarial present value of postretirement benefits attributed to employee services already rendered. The fair value of plan assets represents the current market value of cumulative com-pany and participant contributions made to an irrevocable trust fund, held for the sole benefit of participants, which are invested by the trust fund. Overfunded plans, with the fair value of plan assets exceeding the benefit obligation, are aggregated and recorded as a prepaid pension asset equal to this excess. Underfunded plans, with the benefit obligation exceeding the fair value of plan assets, are aggregated and recorded as a retirement and nonpension post-retirement benefit obligation equal to this excess. The current portion of the retirement and nonpension postretire-ment benefit obligations represents the actuarial present value of benefits payable in the next 12 months exceeding the fair value of plan assets, measured on a plan-by-plan basis. This obligation is recorded in compensation and benefits in the Consolidated State-ment of Financial Position.
82 Notes to Consolidated Financial Statements International Business Machines Corporation and Subsidiary Companies
82
Net periodic pension and nonpension postretirement benefit cost/(income) is recorded in the Consolidated Statement of Earnings and includes service cost, interest cost, expected return on plan assets, amortization of prior service costs/(credits) and (gains)/losses previ-ously recognized as a component of OCI and amortization of the net transition asset remaining in accumulated other comprehensive income/(loss) (AOCI). Service cost represents the actuarial present value of participant benefits earned in the current year. Interest cost represents the time value of money cost associated with the pas-sage of time. Certain events, such as changes in the employee base, plan amendments and changes in actuarial assumptions, result in a change in the benefit obligation and the corresponding change in OCI. The result of these events is amortized as a component of net periodic cost/(income) over the service lives or life expectancy of the participants, depending on the plan, provided such amounts exceed thresholds which are based upon the benefit obligation or the value of plan assets. Net periodic cost/(income) is recorded in Cost, SG&A and RD&E in the Consolidated Statement of Earnings based on the employees’ respective functions. (Gains)/losses and prior service costs/(credits) not recognized as a component of net periodic cost/(income) in the Consolidated Statement of Earnings as they arise are recognized as a component of OCI in the Consolidated Statement of Comprehensive Income. Those (gains)/losses and prior service costs/(credits) are subse-quently recognized as a component of net periodic cost/(income) pursuant to the recognition and amortization provisions of appli-cable accounting guidance. (Gains)/losses arise as a result of differences between actual experience and assumptions or as a result of changes in actuarial assumptions. Prior service costs/(credits) represent the cost of benefit changes attributable to prior service granted in plan amendments. The measurement of benefit obligations and net periodic cost/ (income) is based on estimates and assumptions approved by the company’s management. These valuations reflect the terms of the plans and use participant-specific information such as compensa-tion, age and years of service, as well as certain assumptions, including estimates of discount rates, expected return on plan assets, rate of compensation increases, interest crediting rates and mortality rates.
Defined Contribution PlansThe company’s contribution for defined contribution plans is recorded when the employee renders service to the company. The charge is recorded in Cost, SG&A and RD&E in the Consolidated Statement of Earnings based on the employees’ respective functions.
Stock-Based CompensationStock-based compensation represents the cost related to stock-based awards granted to employees. The company measures stock-based compensation cost at the grant date, based on the estimated fair value of the award and recognizes the cost on a straight-line basis (net of estimated forfeitures) over the employee
requisite service period. The company estimates the fair value of stock options using a Black-Scholes valuation model. The company also grants its employees Restricted Stock Units (RSUs), including Retention Restricted Stock Units (RRSUs) and Performance Share Units (PSUs). RSUs are stock awards granted to employees that entitle the holder to shares of common stock as the award vests, typically over a one- to five-year period. The fair value of the awards is determined and fixed on the grant date based on the company’s stock price, adjusted for the exclusion of dividend equivalents. All stock-based compensation cost is recorded in Cost, SG&A, and RD&E in the Consolidated Statement of Earnings based on the employees’ respective functions. The company records deferred tax assets for awards that result in deductions on the company’s income tax returns, based on the amount of compensation cost recognized and the statutory tax rate in the jurisdiction in which it will receive a deduction. Differences between the deferred tax assets recognized for financial reporting purposes and the actual tax deduction reported on the income tax return are recorded in additional paid-in capital (if the tax deduction exceeds the deferred tax asset) or in the Consolidated Statement of Earnings (if the deferred tax asset exceeds the tax deduction and no additional paid-in capital exists from previous awards).
Income TaxesIncome tax expense is based on reported income before income taxes. Deferred income taxes reflect the tax effect of temporary differences between asset and liability amounts that are recognized for financial reporting purposes and the amounts that are recog-nized for income tax purposes. These deferred taxes are measured by applying currently enacted tax laws. Valuation allowances are recognized to reduce deferred tax assets to the amount that will more likely than not be realized. In assessing the need for a valuation allowance, management considers all available evidence for each jurisdiction including past operating results, estimates of future tax-able income and the feasibility of ongoing tax planning strategies. When the company changes its determination as to the amount of deferred tax assets that can be realized, the valuation allowance is adjusted with a corresponding impact to income tax expense in the period in which such determination is made. The company recognizes tax liabilities when, despite the com-pany’s belief that its tax return positions are supportable, the company believes that certain positions may not be fully sustained upon review by tax authorities. Benefits from tax positions are measured at the largest amount of benefit that is greater than 50 percent likely of being realized upon settlement. The current portion of tax liabilities is included in taxes and the noncurrent portion of tax liabilities is included in other liabilities in the Consolidated Statement of Financial Position. To the extent that new information becomes available which causes the company to change its judgment regarding the adequacy of existing tax liabilities, such changes to tax liabilities will impact income tax expense in the period in which such determination is made. Interest and penalties, if any, related to accrued liabilities for potential tax assessments are included in income tax expense.

Notes to Consolidated Financial Statements International Business Machines Corporation and Subsidiary Companies
83
Translation of Non-U.S. Currency AmountsAssets and liabilities of non-U.S. subsidiaries that have a local func-tional currency are translated to United States (U.S.) dollars at year-end exchange rates. Translation adjustments are recorded in OCI. Income and expense items are translated at weighted-aver-age rates of exchange prevailing during the year. Inventories, property, plant and equipment—net and other non-monetary assets and liabilities of non-U.S. subsidiaries and branches that operate in U.S. dollars are translated at the approxi-mate exchange rates prevailing when the company acquired the assets or liabilities. All other assets and liabilities denominated in a currency other than U.S. dollars are translated at year-end exchange rates with the transaction gain or loss recognized in other (income) and expense. Income and expense items are translated at the weighted-average rates of exchange prevailing during the year. These translation gains and losses are included in net income for the period in which exchange rates change.
Derivative Financial InstrumentsAll derivatives are recognized in the Consolidated Statement of Financial Position at fair value and are reported in prepaid expenses and other current assets, investments and sundry assets, other accrued expenses and liabilities or other liabilities. Classification of each derivative as current or noncurrent is based upon whether the maturity of the instrument is less than or greater than 12 months. To qualify for hedge accounting, the company requires that the instruments be effective in reducing the risk exposure that they are designated to hedge. For instruments that hedge cash flows, hedge designation criteria also require that it be probable that the under-lying transaction will occur. Instruments that meet established accounting criteria are formally designated as hedges. These criteria demonstrate that the derivative is expected to be highly effective at offsetting changes in fair value or cash flows of the underlying exposure both at inception of the hedging relationship and on an ongoing basis. The method of assessing hedge effectiveness and measuring hedge ineffectiveness is formally documented at hedge inception. The company assesses hedge effectiveness and measures hedge ineffectiveness at least quarterly throughout the designated hedge period. Where the company applies hedge accounting, the company designates each derivative as a hedge of: (1) the fair value of a rec-ognized financial asset or liability, or of an unrecognized firm commitment (fair value hedge attributable to interest rate or foreign currency risk); (2) the variability of anticipated cash flows of a forecasted transaction, or the cash flows to be received or paid related to a recognized financial asset or liability (cash flow hedge attributable to interest rate or foreign currency risk); or (3) a hedge of a long-term investment (net investment hedge) in a foreign opera-tion. In addition, the company may enter into derivative contracts that economically hedge certain of its risks, even though hedge accounting does not apply or the company elects not to apply hedge accounting. In these cases, there exists a natural hedging relationship in which changes in the fair value of the derivative, which are recognized currently in net income, act as an economic offset to changes in the fair value of the underlying hedged item(s).
Changes in the fair value of a derivative that is designated as a fair value hedge, along with offsetting changes in the fair value of the underlying hedged exposure, are recorded in earnings each period. For hedges of interest rate risk, the fair value adjustments are recorded as adjustments to interest expense and cost of financing in the Consolidated Statement of Earnings. For hedges of currency risk associated with recorded financial assets or liabilities, derivative fair value adjustments are recognized in other (income) and expense in the Consolidated Statement of Earnings. Changes in the fair value of a derivative that is designated as a cash flow hedge are recorded, net of applicable taxes, in OCI, in the Consolidated Statement of Com-prehensive Income. When net income is affected by the variability of the underlying cash flow, the applicable offsetting amount of the gain or loss from the derivative that is deferred in AOCI is released to net income and reported in interest expense, cost, SG&A expense or other (income) and expense in the Consolidated Statement of Earn-ings based on the nature of the underlying cash flow hedged. Effectiveness for net investment hedging derivatives is measured on a spot-to-spot basis. The effective portion of changes in the fair value of net investment hedging derivatives and other non-derivative finan-cial instruments designated as net investment hedges are recorded as foreign currency translation adjustments in OCI. Changes in the fair value of the portion of a net investment hedging derivative excluded from the effectiveness assessment are recorded in interest expense. If the underlying hedged item in a fair value hedge ceases to exist, all changes in the fair value of the derivative are included in net income each period until the instrument matures. When the derivative transaction ceases to exist, a hedged asset or liability is no longer adjusted for changes in its fair value except as required under other relevant accounting standards. Derivatives that are not desig-nated as hedges, as well as changes in the fair value of derivatives that do not effectively offset changes in the fair value of the underlying hedged item throughout the designated hedge period (collectively, “ineffectiveness”), are recorded in net income each period and are reported in other (income) and expense. When a cash flow hedging relationship is discontinued, the net gain or loss in AOCI must gener-ally remain in AOCI until the item that was hedged affects earnings. However, when it is probable that a forecasted transaction will not occur by the end of the originally specified time period or within an additional two-month period thereafter, the net gain or loss in AOCI must be reclassified into earnings immediately. The company reports cash flows arising from derivative financial instruments designated as fair value or cash flow hedges consistent with the classification of cash flows from the underlying hedged items that these derivatives are hedging. Accordingly, the cash flows associated with derivatives des-ignated as fair value or cash flow hedges are classified in cash flows from operating activities in the Consolidated Statement of Cash Flows. Cash flows from derivatives designated as net investment hedges and derivatives that do not qualify as hedges are reported in cash flows from investing activities. For currency swaps designated as hedges of foreign currency denominated debt (included in the com-pany’s debt risk management program as addressed in note D, “Financial Instruments,” on pages 94 to 98), cash flows directly asso-ciated with the settlement of the principal element of these swaps are reported in payments to settle debt in cash flows from financing activities in the Consolidated Statement of Cash Flows.
84 Notes to Consolidated Financial Statements International Business Machines Corporation and Subsidiary Companies
84
Financial InstrumentsIn determining the fair value of its financial instruments, the com-pany uses a variety of methods and assumptions that are based on market conditions and risks existing at each balance sheet date. See note D, “Financial Instruments,” on pages 92 to 94 for further information. All methods of assessing fair value result in a general approximation of value, and such value may never actually be realized.
Fair Value Measurement Accounting guidance defines fair value as the price that would be received to sell an asset or paid to transfer a liability in an orderly transaction between market participants at the measurement date. Under this guidance, the company is required to classify certain assets and liabilities based on the following fair value hierarchy:
• Level 1—Quoted prices (unadjusted) in active markets for identical assets or liabilities that can be accessed at the measurement date;
• Level 2—Inputs other than quoted prices included within Level 1 that are observable for the asset or liability, either directly or indirectly; and
• Level 3—Unobservable inputs for the asset or liability.
The guidance requires the use of observable market data if such data is available without undue cost and effort. When available, the company uses unadjusted quoted market prices in active markets to measure the fair value and classifies such items within Level 1. If quoted market prices are not available, fair value is based upon internally developed models that use current market-based or independently sourced market parameters such as interest rates and currency rates. Items valued using internally generated models are classified according to the lowest level input or value driver that is significant to the valuation. The determination of fair value considers various factors includ-ing interest rate yield curves and time value underlying the financial instruments. For derivatives and debt securities, the company uses a discounted cash flow analysis using discount rates commensurate with the duration of the instrument.
In determining the fair value of financial instruments, the com-pany considers certain market valuation adjustments to the “base valuations” calculated using the methodologies described below for several parameters that market participants would consider in determining fair value:
• Counterparty credit risk adjustments are applied to financial instruments, taking into account the actual credit risk of a counterparty as observed in the credit default swap market to determine the true fair value of such an instrument.
• Credit risk adjustments are applied to reflect the company’s own credit risk when valuing all liabilities measured at fair value. The methodology is consistent with that applied in developing counterparty credit risk adjustments, but incorporates the company’s own credit risk as observed in the credit default swap market.
As an example, the fair value of derivatives is derived utilizing a discounted cash flow model that uses observable market inputs such as known notional value amounts, yield curves, spot and forward exchange rates as well as discount rates. These inputs relate to liquid, heavily traded currencies with active markets which are available for the full term of the derivative. Certain financial assets are measured at fair value on a nonrecur-ring basis. These assets include equity method investments that are recognized at fair value at the measurement date to the extent that they are deemed to be other-than-temporarily impaired. Certain assets that are measured at fair value on a recurring basis can be subject to nonrecurring fair value measurements. These assets include available-for-sale equity investments that are deemed to be other-than-temporarily impaired. In the event of an other-than-temporary impairment of a financial instrument, fair value is measured using a model described above. Accounting guidance permits the measurement of eligible finan-cial assets, financial liabilities and firm commitments at fair value, on an instrument-by-instrument basis, that are otherwise not permitted to be accounted for at fair value under other accounting standards. This election is irrevocable. The company does not apply the fair value option to any eligible assets or liabilities.
Cash EquivalentsAll highly liquid investments with maturities of three months or less at the date of purchase are considered to be cash equivalents.
Marketable SecuritiesDebt securities included in current assets represent securities that are expected to be realized in cash within one year of the balance sheet date. Long-term debt securities that are not expected to be realized in cash within one year and alliance equity securities are included in investments and sundry assets. Debt and marketable equity securities are considered available for sale and are reported at fair value with unrealized gains and losses, net of applicable taxes, in OCI. The realized gains and losses for available-for-sale securities are included in other (income) and expense in the Consolidated Statement of Earnings. Realized gains and losses are calculated based on the specific identification method.

Notes to Consolidated Financial Statements International Business Machines Corporation and Subsidiary Companies
85
In determining whether an other-than-temporary decline in market value has occurred, the company considers the duration that, and extent to which, the fair value of the investment is below its cost, the financial condition and near-term prospects of the issuer or underly-ing collateral of a security; and the company’s intent and ability to retain the security in order to allow for an anticipated recovery in fair value. Other-than-temporary declines in fair value from amortized cost for available-for-sale equity and debt securities that the company intends to sell or would more likely than not be required to sell before the expected recovery of the amortized cost basis are charged to other (income) and expense in the period in which the loss occurs. For debt securities that the company has no intent to sell and believes that it more likely than not will not be required to sell prior to recovery, only the credit loss component of the impairment is recognized in other (income) and expense, while the remaining loss is recognized in OCI. The credit loss component recognized in other (income) and expense is identified as the amount of the principal cash flows not expected to be received over the remaining term of the debt security as projected using the company’s cash flow projections.
InventoriesRaw materials, work in process and finished goods are stated at the lower of average cost or market. Cash flows related to the sale of inventories are reflected in net cash provided by operating activities in the Consolidated Statement of Cash Flows.
Allowance for Credit LossesReceivables are recorded concurrent with billing and shipment of a product and/or delivery of a service to customers. A reasonable estimate of probable net losses on the value of customer receivables is recognized by establishing an allowance for credit losses.
Notes and Accounts Receivable—TradeAn allowance for uncollectible trade receivables is estimated based on a combination of write-off history, aging analysis and any specific, known troubled accounts.
Financing ReceivablesFinancing receivables include sales-type leases, direct financing leases and loans. Leases are accounted for in accordance with lease accounting standards. Loan receivables are financial assets recorded at amortized cost which approximates fair value. The com-pany determines its allowances for credit losses on financing receivables based on two portfolio segments: lease receivables and loan receivables. The company further segments the portfolio into two classes: major markets and growth markets. When calculating the allowances, the company considers its abil-ity to mitigate a potential loss by repossessing leased equipment and by considering the current fair market value of any other collateral. The value of the equipment is the net realizable value. The allowance for credit losses for capital leases, installment sales and customer loans includes an assessment of the entire balance of the capital lease or loan, including amounts not yet due. The methodologies that the company uses to calculate its receivables reserves, which are applied consistently to its different portfolios, are as follows:
Individually Evaluated—The company reviews all financing receiv-ables considered at risk on a quarterly basis. The review primarily consists of an analysis based upon current information available about the client, such as financial statements, news reports, pub-lished credit ratings, current market-implied credit analysis, as well as the current economic environment, collateral net of repossession cost and prior collection history. For loans that are collateral depen-dent, impairment is measured using the fair value of the collateral when foreclosure is probable. Using this information, the company determines the expected cash flow for the receivable and calculates an estimate of the potential loss and the probability of loss. For those accounts in which the loss is probable, the company records a specific reserve.
Collectively Evaluated—The company records an unallocated reserve that is calculated by applying a reserve rate to its different portfolios, excluding accounts that have been specifically reserved. This reserve rate is based upon credit rating, probability of default, term, characteristics (lease/loan) and loss history. Factors that could result in actual receivable losses that are materially different from the estimated reserve include sharp changes in the economy, or a significant change in the economic health of a particular client that represents a concentration in the company’s receivables portfolio.
Other Credit-Related PoliciesNon-Accrual—Certain receivables for which the company has recorded a specific reserve may also be placed on non-accrual status. Non-accrual assets are those receivables (impaired loans or nonperforming leases) with specific reserves and other accounts for which it is likely that the company will be unable to collect all amounts due according to original terms of the lease or loan agree-ment. Income recognition is discontinued on these receivables. Cash collections are first applied as a reduction to principal outstanding. Any cash received in excess of principal payments outstanding is recognized as interest income. Receivables may be removed from non-accrual status, if appropriate, based upon changes in client circumstances.
Write Off—Receivable losses are charged against the allowance when management believes the uncollectibility of the receivable is confirmed. Subsequent recoveries, if any, are credited to the allowance.
Past Due—The company views receivables as past due when payment has not been received after 90 days, measured from the original billing date.
Impaired Loans—As stated above, the company evaluates all financ-ing receivables considered at-risk, including loans, for impairment on a quarterly basis. The company considers any loan with an indi-vidually evaluated reserve as an impaired loan. Depending on the level of impairment, loans will also be placed on non-accrual status as appropriate. Client loans are primarily for software and services and are unsecured. These loans are subjected to credit analysis to evaluate the associated risk and, when deemed necessary, actions are taken to mitigate risks in the loan agreements which include covenants to protect against credit deterioration during the life of the obligation.
86 Notes to Consolidated Financial Statements International Business Machines Corporation and Subsidiary Companies
86
Estimated Residual Values of Lease AssetsThe recorded residual values of lease assets are estimated at the inception of the lease to be the expected fair value of the assets at the end of the lease term. The company periodically reassesses the realizable value of its lease residual values. Any anticipated increases in specific future residual values are not recognized before realiza-tion through remarketing efforts. Anticipated decreases in specific future residual values that are considered to be other-than-temporary are recognized immediately upon identification and are recorded as an adjustment to the residual value estimate. For sales-type and direct-financing leases, this reduction lowers the recorded net investment and is recognized as a loss charged to financing income in the period in which the estimate is changed, as well as an adjust-ment to unearned income to reduce future-period financing income.
Common StockCommon stock refers to the $.20 par value per share capital stock as designated in the company’s Certificate of Incorporation. Trea-sury stock is accounted for using the cost method. When treasury stock is reissued, the value is computed and recorded using a weighted-average basis.
Earnings Per Share of Common StockEarnings per share (EPS) is computed using the two-class method. The two-class method determines EPS for each class of common stock and participating securities according to dividends and dividend equivalents and their respective participation rights in undistributed earnings. Basic EPS of common stock is computed by dividing net income by the weighted-average number of common shares out-standing for the period. Diluted EPS of common stock is computed on the basis of the weighted-average number of shares of common stock plus the effect of dilutive potential common shares outstanding during the period using the treasury stock method. Dilutive potential common shares include outstanding stock options, stock awards and convertible notes.
Note B. Accounting ChangesStandards ImplementedIn February 2013, the Financial Accounting Standards Board (FASB) issued additional guidance regarding reclassifications out of AOCI. The new guidance requires entities to report the effect of significant reclassifications out of AOCI on the respective line items in net income unless the amounts are not reclassified in their entirety to net income. For amounts that are not required to be reclassified in their entirety to net income in the same reporting period, entities are required to cross-reference other disclosures that provide additional detail about those amounts. For the company, the new guidance is effective prospectively for all interim and annual periods beginning January 1, 2013 with early adoption permitted. The company elected to early adopt the guidance. There was no impact in the consoli-dated financial results as the guidance related only to additional disclosures. See note L, “Equity Activity,” on pages 107 to 110 for further information.
In July 2012, the FASB issued amended guidance that simplifies how entities test indefinite-lived intangible assets other than goodwill for impairment. After an assessment of certain qualitative factors, if it is determined to be more likely than not that an indefinite-lived intangible asset is impaired, entities must perform the quantitative impairment test. Otherwise, the quantitative test is optional. The amended guidance was effective for annual and interim impairment tests performed for fiscal years beginning after September 15, 2012, with early adoption permitted. The company elected to adopt this guidance for its 2012 impairment testing of indefinite-lived intan-gible assets performed in the fourth quarter. There was no impact in the consolidated financial results. In May 2011, the FASB issued amended guidance and disclosure requirements for fair value measurements. These changes were effective January 1, 2012 on a prospective basis. These amendments did not have a material impact in the consolidated financial results. In September 2011, the FASB issued additional disclosure requirements for entities which participate in multi-employer pension plans. The purpose of the new disclosures was to provide financial statement users with information about an employer’s level of par-ticipation in these plans and the financial health of significant plans. The new disclosures were effective beginning with the full year 2011 financial statements. The company does not participate in any mate-rial multi-employer plans. There was no impact in the consolidated financial results as the changes relate only to additional disclosures. In September 2011, the FASB issued amended guidance that sim-plified how entities test goodwill for impairment. After an assessment of certain qualitative factors, if it is determined to be more likely than not that the fair value of a reporting unit is less than its carrying amount, entities must perform the quantitative analysis of the goodwill impairment test. Otherwise, the quantitative test(s) is optional. The guidance was effective January 1, 2012 with early adoption permitted. The company adopted this guidance for the 2011 goodwill impairment test. There was no impact in the consolidated financial results. In June 2011, the FASB issued amended disclosure requirements for the presentation of OCI and AOCI. OCI is comprised of costs, expenses, gains and losses that are included in comprehensive income but excluded from net income, and AOCI comprises the aggregated balances of OCI in equity. The amended guidance elimi-nated the option to present period changes in OCI as part of the Statement of Changes in Equity. Under the amended guidance, all period changes in OCI are to be presented either in a single continu-ous statement of comprehensive income, or in two separate, but consecutive financial statements. Only summary totals are to be included in the AOCI section of the Statement of Changes in Equity. In December 2011, the FASB deferred the requirement to present reclassifications from AOCI on the face of the Consolidated State-ment of Earnings. The changes were effective January 1, 2012 with early adoption permitted. The company adopted the two statement approach effective with its full year 2011 financial statements. There was no impact in the consolidated financial results as the amend-ments related only to changes in financial statement presentation.
Notes to Consolidated Financial Statements International Business Machines Corporation and Subsidiary Companies
87
In December 2010, the FASB issued amended guidance to clarify the acquisition date that should be used for reporting pro-forma financial information for business combinations. If comparative financial statements are presented, the pro-forma revenue and earn-ings of the combined entity for the comparable prior reporting period should be reported as though the acquisition date for all business combinations that occurred during the current year had been completed as of the beginning of the comparable prior annual reporting period. The amendments in this guidance were effective on a prospective basis for business combinations for which the acquisition date was on or after January 1, 2011. There was no impact in the consolidated financial results as the amendments relate only to additional disclosures. In addition, the company has had no acquisitions which required pro-forma financial information. In December 2010, the FASB issued amendments to the guid-ance on goodwill impairment testing. The amendments modified step 1 of the goodwill impairment test for reporting units with zero or negative carrying amounts. For those reporting units, an entity is required to perform step 2 of the goodwill impairment test if it is more likely than not that a goodwill impairment exists. In making that determination, an entity should consider whether there are any adverse qualitative factors indicating that impairment may exist. The amendments were effective January 1, 2011 and did not have an impact in the consolidated financial results. In July 2010, the FASB issued amendments to the disclosure requirements about the credit quality of financing receivables and the allowance for credit losses. The purpose of the additional dis-closures was to enable users of financial statements to better understand the nature of credit risk inherent in an entity’s portfolio of financing receivables and how that risk is analyzed. For end-of-period balances, the new disclosures were required to be made in all interim and annual periods ending on or after December 15, 2010. For activity during a reporting period, the disclosures were required to be included in all interim and annual periods after January 1, 2011. In January 2011, the FASB temporarily deferred the disclosures regarding troubled debt restructurings which were included in the requirements of this amendment. Subsequently, in April 2011, the FASB issued additional guidance and clarifications to help creditors in determining whether a creditor has granted a concession, and whether a debtor is experiencing financial difficulties for purposes of determining whether a restructuring constitutes a troubled debt restructuring. The new guidance and the previously deferred dis-closures were effective July 1, 2011 applied retrospectively to January 1, 2011. Prospective application was required for any new impairments identified as a result of this guidance. These changes did not have a material impact in the consolidated financial results.
In January 2010, the FASB issued additional disclosure require-ments for fair value measurements. According to the guidance, the fair value hierarchy disclosures should be disaggregated by class of assets and liabilities. A class is often a subset of assets or liabilities within a line item in the statement of financial position. In addition, significant transfers between Levels 1 and 2 of the fair value hierar-chy are required to be disclosed. These additional requirements were effective January 1, 2010 for quarterly and annual reporting. These amendments did not have an impact in the consolidated financial results as this guidance relates only to additional disclo-sures. Certain disclosure requirements relating to fair value measurements using significant unobservable inputs (Level 3) were deferred until January 1, 2011. These additional requirements also did not have an impact in the consolidated financial results as they related only to additional disclosures.
Note C. Acquisitions/DivestituresAcquisitionsPurchase price consideration for all acquisitions, as reflected in the tables in this note, is paid primarily in cash. All acquisitions are reported in the Consolidated Statement of Cash Flows net of acquired cash and cash equivalents.
2012In 2012, the company completed 11 acquisitions at an aggregate cost of $3,964 million.
Kenexa Corporation (Kenexa)—On December 3, 2012, the com-pany completed the acquisition of 100 percent of Kenexa, a publicly held company, for cash consideration of $1,351 million. Kenexa, a leading provider of recruiting and talent management solutions, brings a unique combination of cloud-based technology and consult-ing services that integrates both people and processes, providing solutions to engage a smarter, more effective workforce across their most critical businesses functions. Goodwill of $1,014 million has been assigned to the Software ($771 million) and Global Technology Services (GTS) ($243 million) segments. As of the acquisition date, it is expected that approximately 10 percent of the goodwill will be deductible for tax purposes. The overall weighted-average useful life of the identified intangible assets acquired is 6.5 years.
Other Acquisitions—The Software segment also completed eight other acquisitions: in the first quarter, Green Hat Software Limited (Green Hat), Emptoris Inc. (Emptoris) and Worklight, Inc. (Worklight), all privately held companies, and DemandTec, Inc. (DemandTec), a publicly held company; in the second quarter, Varicent Software Inc. (Varicent), Vivisimo Inc. (Vivisimo) and Tealeaf Technology Inc. (Tealeaf), all privately held companies; and in the third quarter, Butterfly Software, Ltd. (Butterfly), a privately held company. Systems and Technology (STG) completed two acquisitions: in the first quarter, Platform Computing Corporation (Platform Computing), a privately held company; and in the third quarter, Texas Memory Systems (TMS), a privately held company. All acquisitions were for 100 percent of the acquired companies.

88 Notes to Consolidated Financial Statements International Business Machines Corporation and Subsidiary Companies
88
Each acquisition further complemented and enhanced the company’s portfolio of product and services offerings. Green Hat helps custom-ers improve the quality of software applications by enabling developers to use cloud computing technologies to conduct testing of a software application prior to its delivery. Emptoris expands the company’s cloud-based analytics offerings that provide supply chain intelligence leading to better inventory management and cost efficien-cies. Worklight delivers mobile application management capabilities to clients across a wide range of industries. The acquisition enhances the company’s comprehensive mobile portfolio, which is designed to help global corporations leverage the proliferation of all mobile devices—from laptops and smartphones to tablets. DemandTec delivers cloud-based analytics software to help organizations improve their price, promotion and product mix within the broad context of enterprise commerce. Varicent’s software automates and analyzes data across sales, finance, human resources and IT departments to uncover trends and optimize sales performance and operations. Vivi-simo software automates the discovery of big data, regardless of its format or where it resides, providing decision makers with a view of
key business information necessary to drive new initiatives. Tealeaf provides a full suite of customer experience management software, which analyzes interactions on websites and mobile devices. Butterfly offers storage planning software and storage migration tools, helping companies save storage space, operational time, IT budget and power consumption. Platform Computing’s focused technical and distributed computing management software helps clients create, integrate and manage shared computing environments that are used in compute-and-data intensive applications such as simulations, computer modeling and analytics. TMS designs and sells high-performance solid state storage solutions. For the “Other Acquisitions,” the overall weighted-average life of the identified amortizable intangible assets acquired is 6.6 years. These identified intangible assets will be amortized on a straight-line basis over their useful lives. Goodwill of $1,880 million has been assigned to the Software ($1,412 million), Global Business Services (GBS) ($5 million), GTS ($21 million) and STG ($443 million) seg-ments. As of the acquisition dates, it is expected that approximately 15 percent of the goodwill will be deductible for tax purposes.
The table below reflects the purchase price related to these acquisitions and the resulting purchase price allocations as of December 31, 2012.
2012 Acquisitions
($ in millions)
Amortization Life (in Years)
Kenexa
Other Acquisitions
Current assets $ 133 $ 278
Fixed assets/noncurrent assets 98 217
Intangible assets
Goodwill N/A 1,014 1,880
Completed technology 3 to 7 169 403
Client relationships 4 to 7 179 194
In-process R&D N/A — 11
Patents/trademarks 1 to 7 39 37
Total assets acquired 1,632 3,020
Current liabilities (93) (143)
Noncurrent liabilities (188) (264)
Total liabilities assumed (281) (407)
Total purchase price $1,351 $2,613
N/A—Not applicable
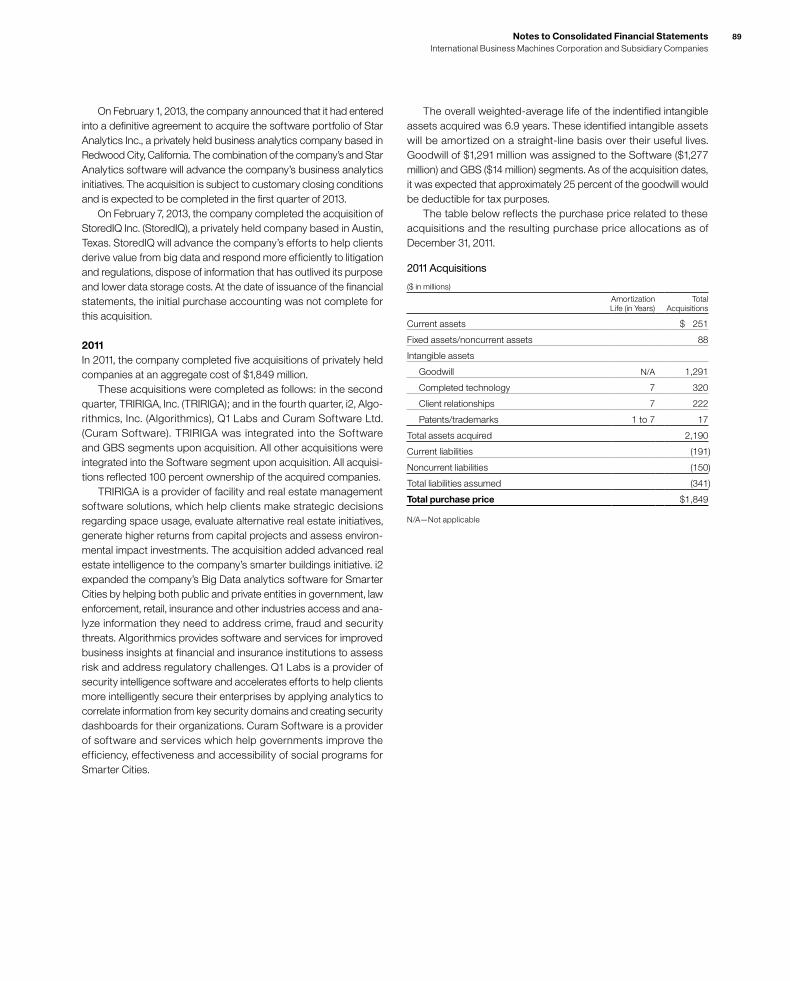
Notes to Consolidated Financial Statements International Business Machines Corporation and Subsidiary Companies
89
On February 1, 2013, the company announced that it had entered into a definitive agreement to acquire the software portfolio of Star Analytics Inc., a privately held business analytics company based in Redwood City, California. The combination of the company’s and Star Analytics software will advance the company’s business analytics initiatives. The acquisition is subject to customary closing conditions and is expected to be completed in the first quarter of 2013. On February 7, 2013, the company completed the acquisition of StoredIQ Inc. (StoredIQ), a privately held company based in Austin, Texas. StoredIQ will advance the company’s efforts to help clients derive value from big data and respond more efficiently to litigation and regulations, dispose of information that has outlived its purpose and lower data storage costs. At the date of issuance of the financial statements, the initial purchase accounting was not complete for this acquisition.
2011In 2011, the company completed five acquisitions of privately held companies at an aggregate cost of $1,849 million. These acquisitions were completed as follows: in the second quarter, TRIRIGA, Inc. (TRIRIGA); and in the fourth quarter, i2, Algo-rithmics, Inc. (Algorithmics), Q1 Labs and Curam Software Ltd. (Curam Software). TRIRIGA was integrated into the Software and GBS segments upon acquisition. All other acquisitions were integrated into the Software segment upon acquisition. All acquisi-tions reflected 100 percent ownership of the acquired companies. TRIRIGA is a provider of facility and real estate management software solutions, which help clients make strategic decisions regarding space usage, evaluate alternative real estate initiatives, generate higher returns from capital projects and assess environ-mental impact investments. The acquisition added advanced real estate intelligence to the company’s smarter buildings initiative. i2 expanded the company’s Big Data analytics software for Smarter Cities by helping both public and private entities in government, law enforcement, retail, insurance and other industries access and ana-lyze information they need to address crime, fraud and security threats. Algorithmics provides software and services for improved business insights at financial and insurance institutions to assess risk and address regulatory challenges. Q1 Labs is a provider of security intelligence software and accelerates efforts to help clients more intelligently secure their enterprises by applying analytics to correlate information from key security domains and creating security dashboards for their organizations. Curam Software is a provider of software and services which help governments improve the efficiency, effectiveness and accessibility of social programs for Smarter Cities.
The overall weighted-average life of the indentified intangible assets acquired was 6.9 years. These identified intangible assets will be amortized on a straight-line basis over their useful lives. Goodwill of $1,291 million was assigned to the Software ($1,277 million) and GBS ($14 million) segments. As of the acquisition dates, it was expected that approximately 25 percent of the goodwill would be deductible for tax purposes. The table below reflects the purchase price related to these acquisitions and the resulting purchase price allocations as of December 31, 2011.
2011 Acquisitions
($ in millions)
Amortization Life (in Years)
Total Acquisitions
Current assets $ 251
Fixed assets/noncurrent assets 88
Intangible assets
Goodwill N/A 1,291
Completed technology 7 320
Client relationships 7 222
Patents/trademarks 1 to 7 17
Total assets acquired 2,190
Current liabilities (191)
Noncurrent liabilities (150)
Total liabilities assumed (341)
Total purchase price $1,849
N/A—Not applicable
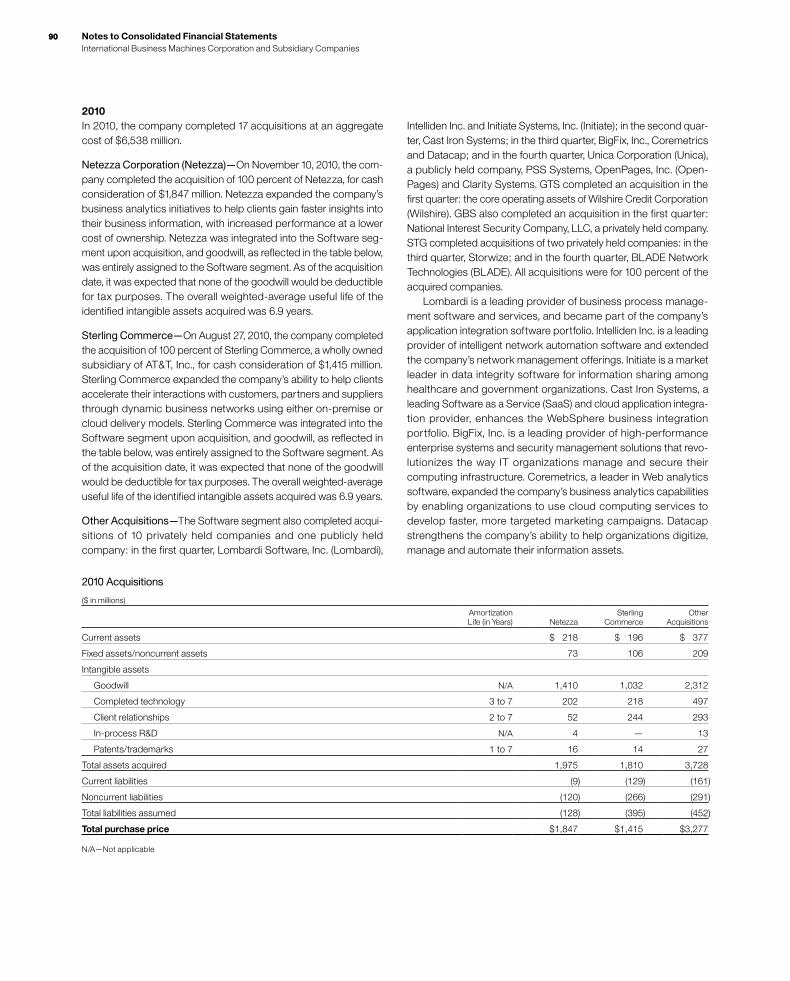
90 Notes to Consolidated Financial Statements International Business Machines Corporation and Subsidiary Companies
90
2010In 2010, the company completed 17 acquisitions at an aggregate cost of $6,538 million.
Netezza Corporation (Netezza)—On November 10, 2010, the com-pany completed the acquisition of 100 percent of Netezza, for cash consideration of $1,847 million. Netezza expanded the company’s business analytics initiatives to help clients gain faster insights into their business information, with increased performance at a lower cost of ownership. Netezza was integrated into the Software seg-ment upon acquisition, and goodwill, as reflected in the table below, was entirely assigned to the Software segment. As of the acquisition date, it was expected that none of the goodwill would be deductible for tax purposes. The overall weighted-average useful life of the identified intangible assets acquired was 6.9 years.
Sterling Commerce—On August 27, 2010, the company completed the acquisition of 100 percent of Sterling Commerce, a wholly owned subsidiary of AT&T, Inc., for cash consideration of $1,415 million. Sterling Commerce expanded the company’s ability to help clients accelerate their interactions with customers, partners and suppliers through dynamic business networks using either on-premise or cloud delivery models. Sterling Commerce was integrated into the Software segment upon acquisition, and goodwill, as reflected in the table below, was entirely assigned to the Software segment. As of the acquisition date, it was expected that none of the goodwill would be deductible for tax purposes. The overall weighted-average useful life of the identified intangible assets acquired was 6.9 years.
Other Acquisitions—The Software segment also completed acqui-sitions of 10 privately held companies and one publicly held company: in the first quarter, Lombardi Software, Inc. (Lombardi),
Intelliden Inc. and Initiate Systems, Inc. (Initiate); in the second quar-ter, Cast Iron Systems; in the third quarter, BigFix, Inc., Coremetrics and Datacap; and in the fourth quarter, Unica Corporation (Unica), a publicly held company, PSS Systems, OpenPages, Inc. (Open-Pages) and Clarity Systems. GTS completed an acquisition in the first quarter: the core operating assets of Wilshire Credit Corporation (Wilshire). GBS also completed an acquisition in the first quarter: National Interest Security Company, LLC, a privately held company. STG completed acquisitions of two privately held companies: in the third quarter, Storwize; and in the fourth quarter, BLADE Network Technologies (BLADE). All acquisitions were for 100 percent of the acquired companies. Lombardi is a leading provider of business process manage-ment software and services, and became part of the company’s application integration software portfolio. Intelliden Inc. is a leading provider of intelligent network automation software and extended the company’s network management offerings. Initiate is a market leader in data integrity software for information sharing among healthcare and government organizations. Cast Iron Systems, a leading Software as a Service (SaaS) and cloud application integra-tion provider, enhances the WebSphere business integration portfolio. BigFix, Inc. is a leading provider of high-performance enterprise systems and security management solutions that revo-lutionizes the way IT organizations manage and secure their computing infrastructure. Coremetrics, a leader in Web analytics software, expanded the company’s business analytics capabilities by enabling organizations to use cloud computing services to develop faster, more targeted marketing campaigns. Datacap strengthens the company’s ability to help organizations digitize, manage and automate their information assets.
2010 Acquisitions
($ in millions)
Amortization Life (in Years) Netezza
Sterling Commerce
Other Acquisitions
Current assets $ 218 $ 196 $ 377
Fixed assets/noncurrent assets 73 106 209
Intangible assets
Goodwill N/A 1,410 1,032 2,312
Completed technology 3 to 7 202 218 497
Client relationships 2 to 7 52 244 293
In-process R&D N/A 4 — 13
Patents/trademarks 1 to 7 16 14 27
Total assets acquired 1,975 1,810 3,728
Current liabilities (9) (129) (161)
Noncurrent liabilities (120) (266) (291)
Total liabilities assumed (128) (395) (452)
Total purchase price $1,847 $1,415 $3,277
N/A—Not applicable
Notes to Consolidated Financial Statements International Business Machines Corporation and Subsidiary Companies
91
Unica, a leading provider of software and services used to auto-mate marketing processes, expanded the company’s ability to help organizations analyze and predict customer preferences and develop more targeted marketing campaigns. PSS Systems is a leading provider of legal information governance and information management software. OpenPages is a leading provider of software that helps companies more easily identify and manage risk and compliance activities across the enterprise through a single man-agement system. Clarity Systems delivers financial governance software that enables organizations to automate the process of col-lecting, preparing, certifying and controlling financial statements for electronic filing. Wilshire’s mortgage servicing platform continues the strategic focus on the mortgage services industry and strengthens the commitment to deliver mortgage business process outsourcing solutions. National Interest Security Company strength-ens the ability to deliver advanced analytics and IT solutions to the public sector. Storwize, a provider of in-line data compression appli-ance solutions, helps the company to make it more affordable for clients to analyze massive amounts of data in order to provide new insights and business outcomes. BLADE provides server and top-of-rack switches as well as software to virtualize and manage cloud computing and other workloads. For the “Other Acquisitions,” the overall weighted-average life of the identified intangible assets acquired was 6.4 years. These identified intangible assets will be amortized on a straight-line basis over their useful lives. Goodwill of $2,312 million was assigned to the Software ($1,653 million), GTS ($32 million), GBS ($252 million) and STG ($375 million) segments. As of the acquisition dates, it was expected that none of the goodwill would be deductible for tax purposes.
Divestitures2012On April 17, 2012, the company announced that it had signed a definitive agreement with Toshiba TEC for the sale of its Retail Store Solutions business to Toshiba TEC. As part of the transaction, Toshiba TEC and the company also signed a multi-year business partner agreement to integrate retail store solutions for Smarter Commerce. The transaction price was $850 millon, and the com-pany will receive approximately $800 million in cash, net of closing date working capital adjustments. Through December 31, 2012, the company completed the first three phases of the sale. For the completed phases, the company received net proceeds of $546 million, recorded a note receivable of $251 million and recognized a net pre-tax gain of $446 million. The gain was net of the fair value of certain contractual terms, certain transaction costs and the assets and liabilities sold. The gain was recorded in other (income) and expense in the Consolidated State-ment of Earnings and the net proceeds are reflected within divestitures of businesses, net of cash transferred within cash flows from investing activities in the Consolidated Statement of Cash Flows. In addition, in the third quarter, the company acquired a 19.9 percent ownership interest for $161 million in Toshiba Global Com-merce Solutions Holding Corporation, the new holding company that Toshiba TEC established for the business. The company will
retain this ownership for a period of three years at which time Toshiba TEC will purchase the company’s equity interest for the initial acquisition value. This investment was recorded in investments and sundry assets in the Consolidated Statement of Financial Posi-tion and the payment was reflected within purchases of marketable securities and other investments within cash flows from investing activities in the Consolidated Statement of Cash Flows. The company expects to close the next phase of the divestiture in the first quarter of 2013 with subsequent closings expected in future periods. Overall, the company expects to recognize a total pre-tax gain on the sale of approximately $500 million.
2011During the fourth quarter of 2011, the company completed the divestiture of the iCluster business to Rocket Software. iCluster, which was acquired in the Data Mirror acquisition in 2007, was part of the Software business. This transaction was not material to the Consolidated Financial Statements. During the second quarter of 2011, the company completed two divestitures related to subsidiaries of IBM Japan. The impact of these transactions was not material to the Consolidated Financial Statements.
2010On March 31, 2010, the company completed the sale of its activities associated with the sales and support of Dassault Systemes’ (Das-sault) product lifecycle management (PLM) software, including customer contracts and related assets to Dassault. The company received net proceeds of $459 million and recognized a net gain of $591 million on the transaction in the first quarter of 2010. The gain was net of the fair value of certain contractual terms, certain transaction costs and the assets and liabilities sold. The gain was recorded in other (income) and expense in the Consolidated State-ment of Earnings and the net proceeds were reflected in proceeds from disposition of marketable securities and other investments within cash flow from investing activities in the Consolidated State-ment of Cash Flows.
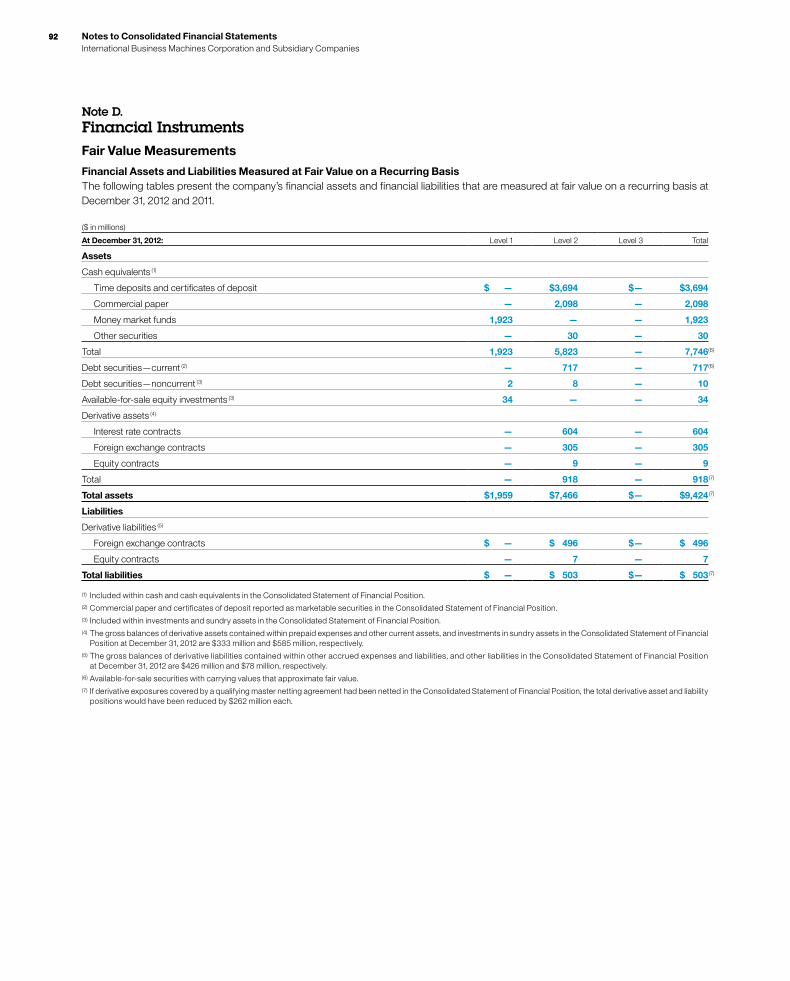
92 Notes to Consolidated Financial Statements International Business Machines Corporation and Subsidiary Companies
92
Note D. Financial InstrumentsFair Value Measurements
Financial Assets and Liabilities Measured at Fair Value on a Recurring BasisThe following tables present the company’s financial assets and financial liabilities that are measured at fair value on a recurring basis at December 31, 2012 and 2011.
($ in millions)
At December 31, 2012: Level 1 Level 2 Level 3 Total
Assets
Cash equivalents (1)
Time deposits and certificates of deposit $ — $3,694 $— $3,694
Commercial paper — 2,098 — 2,098
Money market funds 1,923 — — 1,923
Other securities — 30 — 30
Total 1,923 5,823 — 7,746(6)
Debt securities—current (2) — 717 — 717(6)
Debt securities—noncurrent (3) 2 8 — 10
Available-for-sale equity investments (3) 34 — — 34
Derivative assets (4)
Interest rate contracts — 604 — 604
Foreign exchange contracts — 305 — 305
Equity contracts — 9 — 9
Total — 918 — 918 (7)
Total assets $1,959 $7,466 $— $9,424 (7)
Liabilities
Derivative liabilities (5)
Foreign exchange contracts $ — $ 496 $— $ 496
Equity contracts — 7 — 7
Total liabilities $ — $ 503 $— $ 503 (7)
(1) Included within cash and cash equivalents in the Consolidated Statement of Financial Position.(2) Commercial paper and certificates of deposit reported as marketable securities in the Consolidated Statement of Financial Position. (3) Included within investments and sundry assets in the Consolidated Statement of Financial Position.(4) The gross balances of derivative assets contained within prepaid expenses and other current assets, and investments in sundry assets in the Consolidated Statement of Financial
Position at December 31, 2012 are $333 million and $585 million, respectively. (5) The gross balances of derivative liabilities contained within other accrued expenses and liabilities, and other liabilities in the Consolidated Statement of Financial Position
at December 31, 2012 are $426 million and $78 million, respectively. (6) Available-for-sale securities with carrying values that approximate fair value. (7) If derivative exposures covered by a qualifying master netting agreement had been netted in the Consolidated Statement of Financial Position, the total derivative asset and liability
positions would have been reduced by $262 million each.

Notes to Consolidated Financial Statements International Business Machines Corporation and Subsidiary Companies
93
($ in millions)
At December 31, 2011: Level 1 Level 2 Level 3 Total
Assets
Cash equivalents (1)
Time deposits and certificates of deposit* $ — $1,931 $— $1,931
Commercial paper * — 777 — 777
Money market funds 1,886 — — 1,886
U.S. government securities — 2,750 — 2,750
Canada government securities* — 983 — 983
Other securities — 8 — 8
Total 1,886 6,449 — 8,335(5)
Debt securities—noncurrent (2) 1 7 — 8
Available-for-sale equity investments (2) 69 14 — 83
Derivative assets (3)
Interest rate contracts — 783 — 783
Foreign exchange contracts — 510 — 510
Equity contracts — 7 — 7
Total — 1,300 — 1,300 (6)
Total assets $1,956 $7,770 $— $9,726 (6)
Liabilities
Derivative liabilities (4)
Foreign exchange contracts $ — $ 523 $— $ 523
Equity contracts — 8 — 8
Total liabilities $ — $ 531 $— $ 531 (6)
* Represents a change from the 2011 Annual Report to reflect Canada government securities of $983 million previously reported in Commercial paper, and a reduction of $151 million in Time deposits and certificates of deposit due to certain holdings which were out of the scope of this disclosure.
(1) Included within cash and cash equivalents in the Consolidated Statement of Financial Position.(2) Included within investments and sundry assets in the Consolidated Statement of Financial Position. (3) The gross balances of derivative assets contained within prepaid expenses and other current assets, and investments and sundry assets in the Consolidated Statement
of Financial Position at December 31, 2011 are $546 million and $754 million, respectively. (4) The gross balances of derivative liabilities contained within other accrued expenses and liabilities, and other liabilities in the Consolidated Statement of Financial Position
at December 31, 2011 are $365 million and $166 million, respectively.(5) Available-for-sale securities with carrying values that approximate fair value.(6) If derivative exposures covered by a qualifying master netting agreement had been netted in the Consolidated Statement of Financial Position, the total derivative asset and liability
positions would have been reduced by $324 million each.
There were no transfers between Levels 1 and 2 for the years ended December 31, 2012 and 2011.
Financial Assets and Liabilities Not Measured at Fair Value
Short-Term Receivables and PayablesNotes and other accounts receivable and other investments are financial assets with carrying values that approximate fair value. Accounts payable, other accrued expenses and short-term debt (excluding the current portion of long-term debt) are financial liabili-ties with carrying values that approximate fair value. If measured at fair value in the financial statements, these financial instruments would be classified as Level 3 in the fair value hierarcy.
Loans and Long-Term ReceivablesFair values are based on discounted future cash flows using cur-rent interest rates offered for similar loans to clients with similar credit ratings for the same remaining maturities. At December 31, 2012 and 2011, the difference between the carrying amount and
estimated fair value for loans and long-term receivables was immaterial. If measured at fair value in the financial statements, these financial instruments would be classified as Level 3 in the fair value hierarcy.
Long-Term DebtFair value of publicly traded long-term debt is based on quoted market prices for the identical liability when traded as an asset in an active market. For other long-term debt for which a quoted market price is not available, an expected present value technique that uses rates currently available to the company for debt with similar terms and remaining maturities is used to estimate fair value. The carrying amount of long-term debt is $24,088 million and $22,857 million and the estimated fair value is $27,119 million and $27,383 million at December 31, 2012 and 2011, respectively. If mea-sured at fair value in the financial statements, long-term debt (including the current portion) would be classified as Level 2 in the fair value hierarcy.
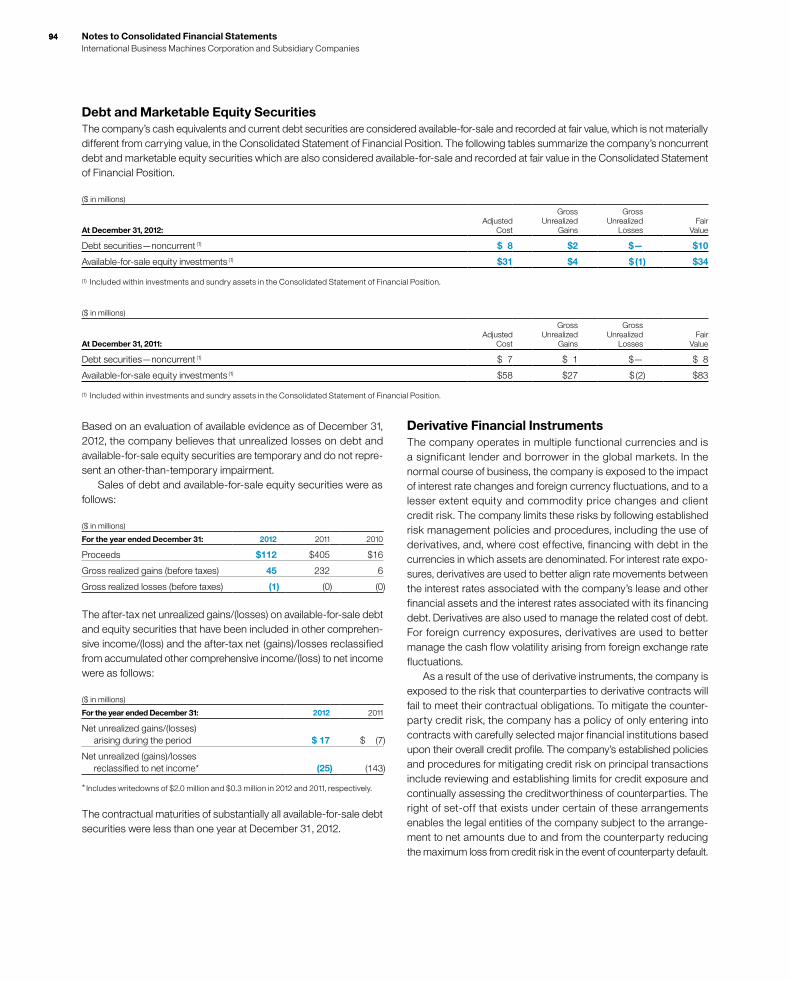
94 Notes to Consolidated Financial Statements International Business Machines Corporation and Subsidiary Companies
94
Based on an evaluation of available evidence as of December 31, 2012, the company believes that unrealized losses on debt and available-for-sale equity securities are temporary and do not repre-sent an other-than-temporary impairment. Sales of debt and available-for-sale equity securities were as follows:
($ in millions)
For the year ended December 31: 2012 2011 2010
Proceeds $112 $405 $16
Gross realized gains (before taxes) 45 232 6
Gross realized losses (before taxes) (1) (0) (0)
The after-tax net unrealized gains/(losses) on available-for-sale debt and equity securities that have been included in other comprehen-sive income/(loss) and the after-tax net (gains)/losses reclassified from accumulated other comprehensive income/(loss) to net income were as follows:
($ in millions)
For the year ended December 31: 2012 2011
Net unrealized gains/(losses) arising during the period $ 17 $ (7)
Net unrealized (gains)/losses reclassified to net income* (25) (143)
* Includes writedowns of $2.0 million and $0.3 million in 2012 and 2011, respectively.
The contractual maturities of substantially all available-for-sale debt securities were less than one year at December 31 , 2012.
Derivative Financial InstrumentsThe company operates in multiple functional currencies and is a significant lender and borrower in the global markets. In the normal course of business, the company is exposed to the impact of interest rate changes and foreign currency fluctuations, and to a lesser extent equity and commodity price changes and client credit risk. The company limits these risks by following established risk management policies and procedures, including the use of derivatives, and, where cost effective, financing with debt in the currencies in which assets are denominated. For interest rate expo-sures, derivatives are used to better align rate movements between the interest rates associated with the company’s lease and other financial assets and the interest rates associated with its financing debt. Derivatives are also used to manage the related cost of debt. For foreign currency exposures, derivatives are used to better manage the cash flow volatility arising from foreign exchange rate fluctuations. As a result of the use of derivative instruments, the company is exposed to the risk that counterparties to derivative contracts will fail to meet their contractual obligations. To mitigate the counter-party credit risk, the company has a policy of only entering into contracts with carefully selected major financial institutions based upon their overall credit profile. The company’s established policies and procedures for mitigating credit risk on principal transactions include reviewing and establishing limits for credit exposure and continually assessing the creditworthiness of counterparties. The right of set-off that exists under certain of these arrangements enables the legal entities of the company subject to the arrange-ment to net amounts due to and from the counterparty reducing the maximum loss from credit risk in the event of counterparty default.
Debt and Marketable Equity SecuritiesThe company’s cash equivalents and current debt securities are considered available-for-sale and recorded at fair value, which is not materially different from carrying value, in the Consolidated Statement of Financial Position. The following tables summarize the company’s noncurrent debt and marketable equity securities which are also considered available-for-sale and re cord ed at fair value in the Consolidated Statement of Finan cial Position.
($ in millions)
At December 31, 2012:Adjusted
Cost
Gross Unrealized
Gains
Gross Unrealized
LossesFair
Value
Debt securities—noncurrent (1) $ 8 $2 $— $10
Available-for-sale equity investments (1) $31 $4 $ (1 ) $34
(1) Included within investments and sundry assets in the Consolidated Statement of Financial Position.
($ in millions)
At December 31, 2011:Adjusted
Cost
Gross Unrealized
Gains
Gross Unrealized
LossesFair
Value
Debt securities—noncurrent (1) $ 7 $ 1 $— $ 8
Available-for-sale equity investments (1) $58 $27 $ (2 ) $83
(1) Included within investments and sundry assets in the Consolidated Statement of Financial Position.

Notes to Consolidated Financial Statements International Business Machines Corporation and Subsidiary Companies
95
The company is also a party to collateral security arrangements with most of its major counterparties. These arrangements require the company to hold or post collateral (cash or U.S. Treasury securi-ties) when the derivative fair values exceed contractually established thresholds. Posting thresholds can be fixed or can vary based on credit default swap pricing or credit ratings received from the major credit agencies. The aggregate fair value of all derivative instru-ments under these collateralized arrangements that were in a liability position at December 31, 2012 and 2011 was $94 million and $131 million, respectively, for which no collateral was posted at December 31, 2012 and December 31, 2011. Full collateralization of these agreements would be required in the event that the com-pany’s credit rating falls below investment grade or if its credit default swap spread exceeds 250 basis points, as applicable, pursuant to the terms of the collateral security arrangements. The aggregate fair value of derivative instruments in net asset posi-tions as of December 31, 2012 and 2011 was $918 million and $1,300 million, respectively. This amount represents the maximum exposure to loss at the reporting date as a result of the counter-parties failing to perform as contracted. This exposure was reduced by $262 million and $324 million at December 31, 2012 and 2011, respectively, of liabilities included in master netting arrangements with those counterparties. Additionally, at December 31, 2012 and 2011, this exposure was reduced by $69 million and $466 million of cash collateral, respectively, received by the com-pany. In addition to cash collateral, the company held $31 million in non-cash collateral, in U.S. Treasury securities at December 31, 2012. Per accounting guidance, non-cash collateral is not recorded on the Statement of Financial Position. The company does not offset derivative assets against liabilities in master netting arrangements nor does it offset receivables or payables recognized upon payment or receipt of cash collateral against the fair values of the related derivative instruments. No amount was recognized in other receivables at December 31, 2012 and December 31, 2011 for the right to reclaim cash collateral. The amount recognized in accounts payable for the obligation to return cash collateral totaled $69 million and $466 million at December 31, 2012 and 2011, respectively. The company restricts the use of cash collateral received to rehypothecation, and therefore reports it in prepaid expenses and other current assets in the Consolidated Statement of Financial Position. No amount was rehypothecated at December 31, 2012 and December 31, 2011. The company may employ derivative instruments to hedge the volatility in stockholders’ equity resulting from changes in currency exchange rates of significant foreign subsidiaries of the company with respect to the U.S. dollar. These instruments, designated as net investment hedges, expose the company to liquidity risk as the derivatives have an immediate cash flow impact upon maturity which is not offset by a cash flow from the translation of the under-lying hedged equity. The company monitors this cash loss potential on an ongoing basis, and may discontinue some of these hedging relationships by de-designating the derivative instrument in order to manage the liquidity risk. Although not designated as accounting hedges, the company may utilize derivatives to offset the changes in the fair value of the de-designated instruments from the date of de-designation until maturity.
In its hedging programs, the company uses forward contracts, futures contracts, interest-rate swaps and cross-currency swaps, depending upon the underlying exposure. The company is not a party to leveraged derivative instruments. A brief description of the major hedging programs, categorized by underlying risk, follows.
Interest Rate RiskFixed and Variable Rate BorrowingsThe company issues debt in the global capital markets, principally to fund its financing lease and loan portfolio. Access to cost-effec-tive financing can result in interest rate mismatches with the underlying assets. To manage these mismatches and to reduce overall interest cost, the company uses interest rate swaps to con-vert specific fixed-rate debt issuances into variable-rate debt (i.e., fair value hedges) and to convert specific variable-rate debt issu-ances into fixed-rate debt (i.e., cash flow hedges). At December 31, 2012 and 2011, the total notional amount of the company’s inter-est rate swaps was $4.3 billion and $5.9 billion, respectively. The weighted-average remaining maturity of these instruments at December 31, 2012 and December 31, 2011 was approximately 5.1 years and 5.5 years, respectively.
Forecasted Debt IssuanceThe company is exposed to interest rate volatility on future debt issuances. To manage this risk, the company may use forward-starting interest rate swaps to lock in the rate on the interest payments related to the forecasted debt issuance. These swaps are accounted for as cash flow hedges. The company did not have any derivative instruments relating to this program outstanding at December 31, 2012 and 2011. At December 31, 2012 and 2011, net gains of approximately $1 million and net losses of approximately $5 million (before taxes), respectively, were recorded in AOCI in connection with cash flow hedges of the company’s borrowings. Within these amounts less than $1 million of gains and $6 million of losses, respectively, are expected to be reclassified to net income within the next 12 months, providing an offsetting economic impact against the underlying transactions.
Foreign Exchange RiskLong-Term Investments in Foreign Subsidiaries (Net Investment)A large portion of the company’s foreign currency denominated debt portfolio is designated as a hedge of net investment in foreign sub-sidiaries to reduce the volatility in stockholders’ equity caused by changes in foreign currency exchange rates in the functional cur-rency of major foreign subsidiaries with respect to the U.S. dollar. The company also uses cross-currency swaps and foreign exchange forward contracts for this risk management purpose. At December 31, 2012 and 2011, the total notional amount of derivative instruments designated as net investment hedges was $3.3 billion and $5.0 billion, respectively. The weighted-average remaining maturity of these instruments at December 31, 2012 and 2011 was approximately 0.4 years for both periods.
96 Notes to Consolidated Financial Statements International Business Machines Corporation and Subsidiary Companies
96
Anticipated Royalties and Cost TransactionsThe company’s operations generate significant nonfunctional cur-rency, third-party vendor payments and intercompany payments for royalties and goods and services among the company’s non-U.S. subsidiaries and with the parent company. In anticipation of these foreign currency cash flows and in view of the volatility of the cur-rency markets, the company selectively employs foreign exchange forward contracts to manage its currency risk. These forward con-tracts are accounted for as cash flow hedges. The maximum length of time over which the company is hedging its exposure to the vari-ability in future cash flows is four years. At December 31, 2012 and 2011, the total notional amount of forward contracts designated as cash flow hedges of forecasted royalty and cost transactions was $10.7 billion and $10.9 billion, respectively, with a weighted-average remaining maturity of 0.7 years at both year-end dates. At December 31, 2012 and December 31, 2011, in connection with cash flow hedges of anticipated royalties and cost transactions, the company recorded net losses of $138 million and net gains of $88 million (before taxes), respectively, in AOCI. Within these amounts $79 million of losses and $191 million of gains, respectively, are expected to be reclassified to net income within the next 12 months, providing an offsetting economic impact against the under-lying anticipated transactions.
Foreign Currency Denominated BorrowingsThe company is exposed to exchange rate volatility on foreign cur-rency denominated debt. To manage this risk, the company employs cross-currency swaps to convert fixed-rate foreign currency denom-inated debt to fixed-rate debt denominated in the functional currency of the borrowing entity. These swaps are accounted for as cash flow hedges. The maximum length of time over which the company hedges its exposure to the variability in future cash flows is approxi-mately three years. At December 31, 2012 and December 31, 2011, no instruments relating to this program were outstanding.
Subsidiary Cash and Foreign Currency Asset/Liability ManagementThe company uses its Global Treasury Centers to manage the cash of its subsidiaries. These centers principally use currency swaps to convert cash flows in a cost-effective manner. In addition, the com-pany uses foreign exchange forward contracts to economically hedge, on a net basis, the foreign currency exposure of a portion of the company’s nonfunctional currency assets and liabilities. The terms of these forward and swap contracts are generally less than one year. The changes in the fair values of these contracts and of the underlying hedged exposures are generally offsetting and are recorded in other (income) and expense in the Consolidated State-ment of Earnings. At December 31, 2012 and 2011, the total notional amount of derivative instruments in economic hedges of foreign currency exposure was $12.9 billion and $13.6 billion, respectively.
Equity Risk ManagementThe company is exposed to market price changes in certain broad market indices and in the company’s own stock primarily related to certain obligations to employees. Changes in the overall value of these employee compensation obligations are recorded in SG&A expense in the Consolidated Statement of Earnings. Although not designated as accounting hedges, the company utilizes derivatives, including equity swaps and futures, to economically hedge the exposures related to its employee compensation obligations. The derivatives are linked to the total return on certain broad market indices or the total return on the company’s common stock. They are recorded at fair value with gains or losses also reported in SG&A expense in the Consolidated Statement of Earnings. At December 31, 2012 and 2011, the total notional amount of deriva-tive instruments in economic hedges of these compensation obligations was $1.2 billion and $1.0 billion, respectively.
Other RisksThe company may hold warrants to purchase shares of common stock in connection with various investments that are deemed derivatives because they contain net share or net cash settlement provisions. The company records the changes in the fair value of these warrants in other (income) and expense in the Consolidated Statement of Earnings. The company did not have any warrants qualifying as derivatives outstanding at December 31, 2012 and 2011. The company is exposed to a potential loss if a client fails to pay amounts due under contractual terms. The company utilizes credit default swaps to economically hedge its credit exposures. These derivatives have terms of one year or less. The swaps are recorded at fair value with gains and losses reported in other (income) and expense in the Consolidated Statement of Earnings. The company did not have any derivative instruments relating to this program out-standing at December 31, 2012 and 2011.

Notes to Consolidated Financial Statements International Business Machines Corporation and Subsidiary Companies
97
The following tables provide a quantitative summary of the derivative and non-derivative instrument related risk management activity as of December 31, 2012 and 2011 as well as for the years ended December 31, 2012, 2011 and 2010, respectively.
Fair Values of Derivative Instruments in the Consolidated Statement of Financial Position($ in millions)
Fair Value of Derivative Assets Fair Value of Derivative Liabilities
At December 31:
Balance Sheet
Classification 2012 2011
Balance Sheet
Classification 2012 2011
Designated as hedging instruments
Interest rate contracts
Prepaid expenses and other
current assets $ 47 $ 50
Other accrued expenses
and liabilities $ — $ —
Investments and sundry assets 557 733 Other liabilities — —
Foreign exchange contracts
Prepaid expenses and other
current assets 135 407
Other accrued expenses
and liabilities 267 273
Investments and sundry assets 5 —
Other liabilities 78 155
Fair value of derivative assets $744 $1,190
Fair value of derivative liabilities $ 345 $ 428
Not designated as hedging instruments
Foreign exchange contracts
Prepaid expenses and other
current assets $142 $ 82
Other accrued expenses
and liabilities $ 152 $ 84
Investments and sundry assets 23 21
Other liabilities — 11
Equity contracts
Prepaid expenses and other
current assets 9 7
Other accrued expenses
and liabilities 7 8
Fair value of derivative assets $174 $ 110
Fair value of derivative liabilities $ 159 $ 103
Total debt designated as hedging instruments
Short-term debt N/A N/A $ 578 $ —
Long-term debt N/A N/A 3,035 1,884
Total $918 $1,300 $4,116 $2,415
N/A—Not applicable
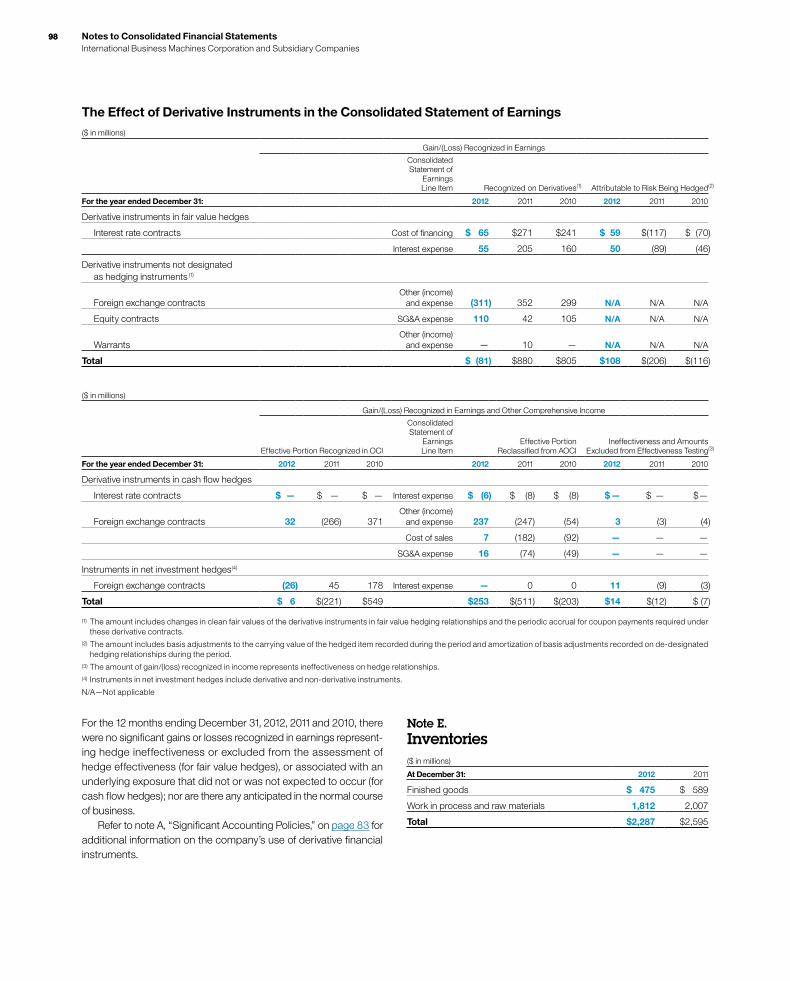
98 Notes to Consolidated Financial Statements International Business Machines Corporation and Subsidiary Companies
98
The Effect of Derivative Instruments in the Consolidated Statement of Earnings($ in millions)
Gain/(Loss) Recognized in Earnings
Consolidated Statement of
Earnings Line Item Recognized on Derivatives(1) Attributable to Risk Being Hedged(2)
For the year ended December 31: 2012 2011 2010 2012 2011 2010
Derivative instruments in fair value hedges
Interest rate contracts Cost of financing $ 65 $271 $241 $ 59 $(117) $ (70)
Interest expense 55 205 160 50 (89) (46)
Derivative instruments not designated as hedging instruments (1)
Foreign exchange contractsOther (income)
and expense (311) 352 299 N/A N/A N/A
Equity contracts SG&A expense 110 42 105 N/A N/A N/A
WarrantsOther (income)
and expense — 10 — N/A N/A N/A
Total $ (81) $880 $805 $108 $(206) $(116)
($ in millions)
Gain/(Loss) Recognized in Earnings and Other Comprehensive Income
Effective Portion Recognized in OCI
Consolidated Statement of
Earnings Line Item
Effective Portion Reclassified from AOCI
Ineffectiveness and Amounts Excluded from Effectiveness Testing(3)
For the year ended December 31: 2012 2011 2010 2012 2011 2010 2012 2011 2010
Derivative instruments in cash flow hedges
Interest rate contracts $ — $ — $ — Interest expense $ (6) $ (8) $ (8) $ — $ — $ —
Foreign exchange contracts 32 (266) 371Other (income)
and expense 237 (247) (54) 3 (3) (4)
Cost of sales 7 (182) (92) — — —
SG&A expense 16 (74) (49) — — —
Instruments in net investment hedges(4)
Foreign exchange contracts (26) 45 178 Interest expense — 0 0 11 (9) (3)
Total $ 6 $(221) $549 $253 $(511) $(203) $14 $(12) $ (7)
(1) The amount includes changes in clean fair values of the derivative instruments in fair value hedging relationships and the periodic accrual for coupon payments required under these derivative contracts.
(2) The amount includes basis adjustments to the carrying value of the hedged item recorded during the period and amortization of basis adjustments recorded on de-designated hedging relationships during the period.
(3) The amount of gain/(loss) recognized in income represents ineffectiveness on hedge relationships.(4) Instruments in net investment hedges include derivative and non-derivative instruments.
N/A—Not applicable
For the 12 months ending December 31, 2012, 2011 and 2010, there were no significant gains or losses recognized in earnings represent-ing hedge ineffectiveness or excluded from the assessment of hedge effectiveness (for fair value hedges), or associated with an underlying exposure that did not or was not expected to occur (for cash flow hedges); nor are there any anticipated in the normal course of business. Refer to note A, “Significant Accounting Policies,” on page 83 for additional information on the company’s use of derivative financial instruments.
Note E. Inventories($ in millions)
At December 31: 2012 2011
Finished goods $ 475 $ 589
Work in process and raw materials 1,812 2,007
Total $2,287 $2,595

Notes to Consolidated Financial Statements International Business Machines Corporation and Subsidiary Companies
99
Note F. Financing ReceivablesThe following table presents financing receivables, net of allowances for credit losses, including residual values.
($ in millions)
At December 31: 2012 2011
Current
Net investment in sales-type and direct financing leases $ 3,862 $ 3,765
Commercial financing receivables 7,750 7,095
Client loan receivables 5,395 5,195
Installment payment receivables 1,031 846
Total $18,038 $16,901
Noncurrent
Net investment in sales-type and direct financing leases $ 6,107 $ 5,406
Commercial financing receivables 5 34
Client loan receivables 5,966 4,925
Installment payment receivables 733 410
Total $12,812 $10,776
Net investment in sales-type and direct financing leases relates principally to the company’s systems products and are for terms ranging generally from two to six years. Net investment in sales-type and direct financing leases includes unguaranteed residual values of $794 million and $745 million at December 31, 2012 and 2011, respectively, and is reflected net of unearned income of $728 million and $733 million, and net of the allowance for credit losses of $114 million and $118 million at those dates, respectively. Scheduled maturities of minimum lease payments outstanding at December 31, 2012, expressed as a percentage of the total, are approximately: 2013, 42 percent; 2014, 29 percent; 2015, 18 percent; 2016, 9 percent; and 2017 and beyond, 3 percent. Commercial financing receivables, net of allowance for credit losses of $46 million and $53 million at December 31, 2012 and 2011, respectively, relate primarily to inventory and accounts receivable financing for dealers and remarketers of IBM and non-IBM products. Payment terms for inventory and accounts receivable financing generally range from 30 to 90 days. Client loan receivables, net of allowance for credit losses of $155 million and $126 million at December 31, 2012 and 2011, respectively, are loans that are provided primarily to clients to finance the pur-chase of software and services. Separate contractual relationships on these financing arrangements are for terms ranging generally from one to seven years. Installment payment receivables, net of allowance for credit losses of $39 million and $51 million at December 31, 2012 and 2011, respectively, are loans that are provided primarily to clients to finance hardware, software and services ranging generally from one to three years. Client loan receivables and installment payment receivables financing contracts are priced independently at competitive market rates. The company has a history of enforcing the terms of these separate financing agreements.
The company utilizes certain of its financing receivables as col-lateral for non-recourse borrowings. Financing receivables pledged as collateral for borrowings were $650 million and $410 million at December 31, 2012 and 2011, respectively. These borrowings are included in note J, “Borrowings,” on pages 104 and 105. The company did not have any financing receivables held for sale as of December 31, 2012 and 2011.
Financing Receivables by Portfolio SegmentThe following tables present financing receivables on a gross basis, excluding the allowance for credit losses and residual value, by port-folio segment and by class, excluding current commercial financing receivables and other miscellaneous current financing receivables at December 31, 2012 and 2011. The company determines its allow-ance for credit losses based on two portfolio segments: lease receivables and loan receivables, and further segments the portfolio into two classes: major markets and growth markets.
($ in millions)
At December 31, 2012:Major
MarketsGrowth
Markets Total
Financing receivables
Lease receivables $ 7,036 $2,138 $ 9,174
Loan receivables 9,666 3,670 13,336
Ending balance $16,701 $5,808 $22,510
Collectively evaluated for impairment $16,570 $5,684 $22,254
Individually evaluated for impairment $ 131 $ 125 $ 256
Allowance for credit losses:
Beginning balance at January 1, 2012
Lease receivables $ 79 $ 40 $ 118
Loan receivables 125 64 189
Total $ 203 $ 104 $ 307
Write-offs (14) (1) (15)
Provision (9) 38 28
Other 0 (2) (2)
Ending balance at December 31, 2012 $ 180 $ 138 $ 318
Lease receivables $ 59 $ 55 $ 114
Loan receivables $ 121 $ 84 $ 204
Collectively evaluated for impairment $ 69 $ 29 $ 98
Individually evaluated for impairment $ 111 $ 109 $ 220
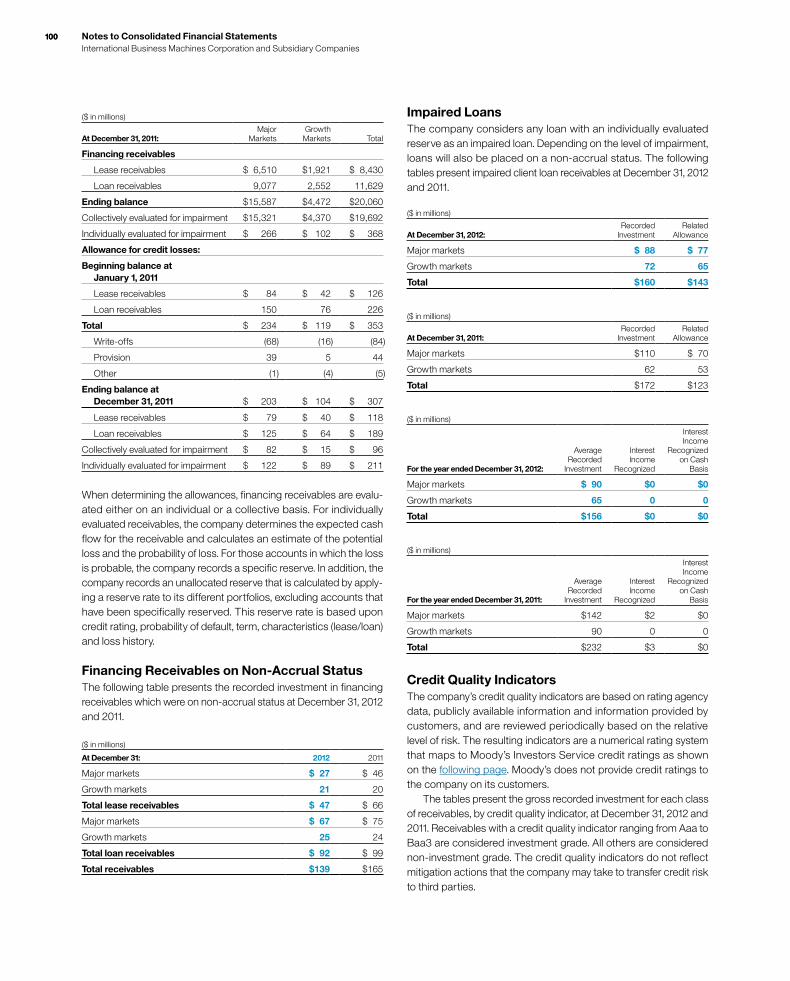
100 Notes to Consolidated Financial Statements International Business Machines Corporation and Subsidiary Companies
100
($ in millions)
At December 31, 2011:Major
MarketsGrowth
Markets Total
Financing receivables
Lease receivables $ 6,510 $1,921 $ 8,430
Loan receivables 9,077 2,552 11,629
Ending balance $15,587 $4,472 $20,060
Collectively evaluated for impairment $15,321 $4,370 $19,692
Individually evaluated for impairment $ 266 $ 102 $ 368
Allowance for credit losses:
Beginning balance at January 1, 2011
Lease receivables $ 84 $ 42 $ 126
Loan receivables 150 76 226
Total $ 234 $ 119 $ 353
Write-offs (68) (16) (84)
Provision 39 5 44
Other (1) (4) (5)
Ending balance at December 31, 2011 $ 203 $ 104 $ 307
Lease receivables $ 79 $ 40 $ 118
Loan receivables $ 125 $ 64 $ 189
Collectively evaluated for impairment $ 82 $ 15 $ 96
Individually evaluated for impairment $ 122 $ 89 $ 211
When determining the allowances, financing receivables are evalu-ated either on an individual or a collective basis. For individually evaluated receivables, the company determines the expected cash flow for the receivable and calculates an estimate of the potential loss and the probability of loss. For those accounts in which the loss is probable, the company records a specific reserve. In addition, the company records an unallocated reserve that is calculated by apply-ing a reserve rate to its different portfolios, excluding accounts that have been specifically reserved. This reserve rate is based upon credit rating, probability of default, term, characteristics (lease/loan) and loss history.
Financing Receivables on Non-Accrual StatusThe following table presents the recorded investment in financing receivables which were on non-accrual status at December 31, 2012 and 2011.
($ in millions)
At December 31: 2012 2011
Major markets $ 27 $ 46
Growth markets 21 20
Total lease receivables $ 47 $ 66
Major markets $ 67 $ 75
Growth markets 25 24
Total loan receivables $ 92 $ 99
Total receivables $139 $165
Impaired LoansThe company considers any loan with an individually evaluated reserve as an impaired loan. Depending on the level of impairment, loans will also be placed on a non-accrual status. The following tables present impaired client loan receivables at December 31, 2012 and 2011.
($ in millions)
At December 31, 2012:Recorded
InvestmentRelated
Allowance
Major markets $ 88 $ 77
Growth markets 72 65
Total $160 $143
($ in millions)
At December 31, 2011:Recorded
InvestmentRelated
Allowance
Major markets $110 $ 70
Growth markets 62 53
Total $172 $123
($ in millions)
For the year ended December 31, 2012:
Average Recorded
Investment
Interest Income
Recognized
Interest Income
Recognized on Cash
Basis
Major markets $ 90 $0 $0
Growth markets 65 0 0
Total $156 $0 $0
($ in millions)
For the year ended December 31, 2011:
Average Recorded
Investment
Interest Income
Recognized
Interest Income
Recognized on Cash
Basis
Major markets $142 $2 $0
Growth markets 90 0 0
Total $232 $3 $0
Credit Quality IndicatorsThe company’s credit quality indicators are based on rating agency data, publicly available information and information provided by customers, and are reviewed periodically based on the relative level of risk. The resulting indicators are a numerical rating system that maps to Moody’s Investors Service credit ratings as shown on the following page. Moody’s does not provide credit ratings to the company on its customers. The tables present the gross recorded investment for each class of receivables, by credit quality indicator, at December 31, 2012 and 2011. Receivables with a credit quality indicator ranging from Aaa to Baa3 are considered investment grade. All others are considered non-investment grade. The credit quality indicators do not reflect mitigation actions that the company may take to transfer credit risk to third parties.
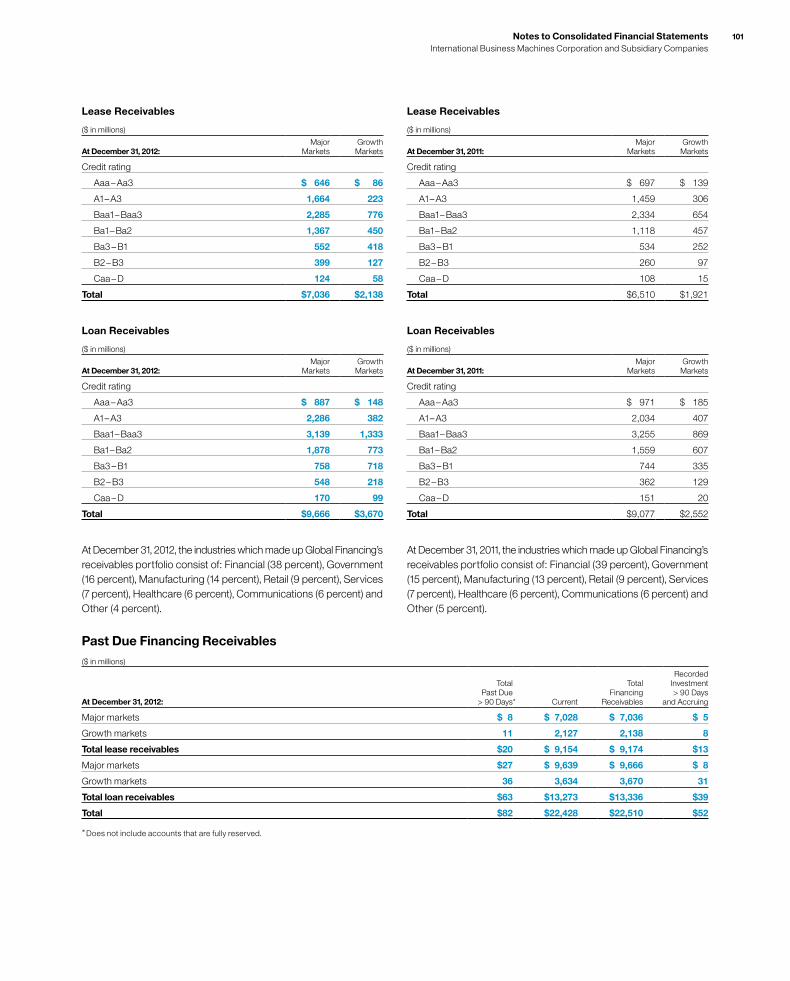
Notes to Consolidated Financial Statements International Business Machines Corporation and Subsidiary Companies
101
Lease Receivables
($ in millions)
At December 31, 2012:Major
MarketsGrowth
Markets
Credit rating
Aaa – Aa3 $ 646 $ 86
A1 – A3 1,664 223
Baa1 – Baa3 2,285 776
Ba1 – Ba2 1,367 450
Ba3 – B1 552 418
B2 – B3 399 127
Caa – D 124 58
Total $7,036 $2,138
Loan Receivables
($ in millions)
At December 31, 2012:Major
MarketsGrowth
Markets
Credit rating
Aaa – Aa3 $ 887 $ 148
A1 – A3 2,286 382
Baa1 – Baa3 3,139 1,333
Ba1 – Ba2 1,878 773
Ba3 – B1 758 718
B2 – B3 548 218
Caa – D 170 99
Total $9,666 $3,670
At December 31, 2012, the industries which made up Global Financing’s receivables portfolio consist of: Financial (38 percent), Government (16 percent), Manufacturing (14 percent), Retail (9 percent), Services (7 percent), Healthcare (6 percent), Communications (6 percent) and Other (4 percent).
Lease Receivables
($ in millions)
At December 31, 2011:Major
MarketsGrowth
Markets
Credit rating
Aaa – Aa3 $ 697 $ 139
A1 – A3 1,459 306
Baa1 – Baa3 2,334 654
Ba1 – Ba2 1,118 457
Ba3 – B1 534 252
B2 – B3 260 97
Caa – D 108 15
Total $6,510 $1,921
Loan Receivables
($ in millions)
At December 31, 2011:Major
MarketsGrowth
Markets
Credit rating
Aaa – Aa3 $ 971 $ 185
A1 – A3 2,034 407
Baa1 – Baa3 3,255 869
Ba1 – Ba2 1,559 607
Ba3 – B1 744 335
B2 – B3 362 129
Caa – D 151 20
Total $9,077 $2,552
At December 31, 2011, the industries which made up Global Financing’s receivables portfolio consist of: Financial (39 percent), Government (15 percent), Manufacturing (13 percent), Retail (9 percent), Services (7 percent), Healthcare (6 percent), Communications (6 percent) and Other (5 percent).
Past Due Financing Receivables($ in millions)
At December 31, 2012:
Total Past Due
> 90 Days* Current
Total Financing
Receivables
Recorded Investment > 90 Days
and Accruing
Major markets $ 8 $ 7,028 $ 7,036 $ 5
Growth markets 11 2,127 2,138 8
Total lease receivables $20 $ 9,154 $ 9,174 $13
Major markets $27 $ 9,639 $ 9,666 $ 8
Growth markets 36 3,634 3,670 31
Total loan receivables $63 $13,273 $13,336 $39
Total $82 $22,428 $22,510 $52
* Does not include accounts that are fully reserved.
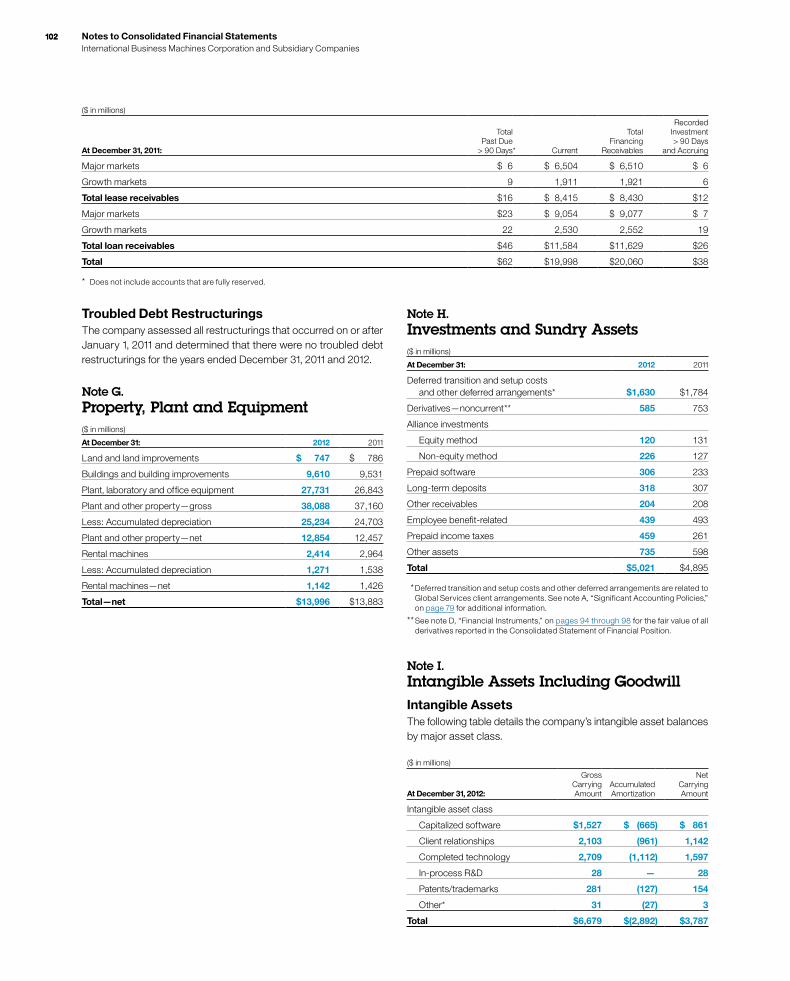
102 Notes to Consolidated Financial Statements International Business Machines Corporation and Subsidiary Companies
102
($ in millions)
At December 31, 2011:
Total Past Due
> 90 Days* Current
Total Financing
Receivables
Recorded Investment > 90 Days
and Accruing
Major markets $ 6 $ 6,504 $ 6,510 $ 6
Growth markets 9 1,911 1,921 6
Total lease receivables $16 $ 8,415 $ 8,430 $12
Major markets $23 $ 9,054 $ 9,077 $ 7
Growth markets 22 2,530 2,552 19
Total loan receivables $46 $11,584 $11,629 $26
Total $62 $19,998 $20,060 $38
* Does not include accounts that are fully reserved.
Troubled Debt RestructuringsThe company assessed all restructurings that occurred on or after January 1, 2011 and determined that there were no troubled debt restructurings for the years ended December 31, 2011 and 2012.
Note G. Property, Plant and Equipment($ in millions)
At December 31: 2012 2011
Land and land improvements $ 747 $ 786
Buildings and building improvements 9,610 9,531
Plant, laboratory and office equipment 27,731 26,843
Plant and other property—gross 38,088 37,160
Less: Accumulated depreciation 25,234 24,703
Plant and other property—net 12,854 12,457
Rental machines 2,414 2,964
Less: Accumulated depreciation 1,271 1,538
Rental machines—net 1,142 1,426
Total—net $13,996 $13,883
Note H. Investments and Sundry Assets($ in millions)
At December 31: 2012 2011
Deferred transition and setup costs and other deferred arrangements* $1,630 $1,784
Derivatives—noncurrent ** 585 753
Alliance investments
Equity method 120 131
Non-equity method 226 127
Prepaid software 306 233
Long-term deposits 318 307
Other receivables 204 208
Employee benefit-related 439 493
Prepaid income taxes 459 261
Other assets 735 598
Total $5,021 $4,895
* Deferred transition and setup costs and other deferred arrangements are related to Global Services client arrangements. See note A, “Significant Accounting Policies,” on page 79 for additional information.
** See note D, “Financial Instruments,” on pages 94 through 98 for the fair value of all derivatives reported in the Consolidated Statement of Financial Position.
Note I. Intangible Assets Including GoodwillIntangible AssetsThe following table details the company’s intangible asset balances by major asset class.
($ in millions)
At December 31, 2012:
Gross Carrying Amount
Accumulated Amortization
Net Carrying Amount
Intangible asset class
Capitalized software $1,527 $ (665) $ 861
Client relationships 2,103 (961) 1,142
Completed technology 2,709 (1,112) 1,597
In-process R&D 28 — 28
Patents/trademarks 281 (127) 154
Other* 31 (27) 3
Total $6,679 $(2,892) $3,787
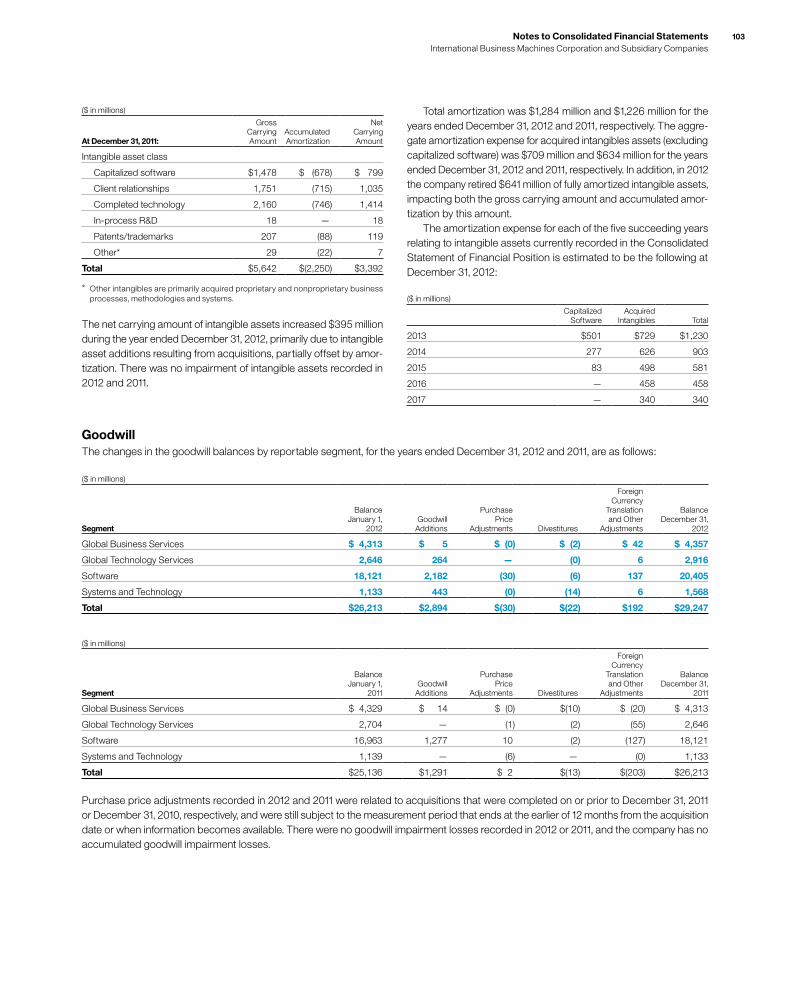
Notes to Consolidated Financial Statements International Business Machines Corporation and Subsidiary Companies
103
($ in millions)
At December 31, 2011:
Gross Carrying Amount
Accumulated Amortization
Net Carrying Amount
Intangible asset class
Capitalized software $1,478 $ (678) $ 799
Client relationships 1,751 (715) 1,035
Completed technology 2,160 (746) 1,414
In-process R&D 18 — 18
Patents/trademarks 207 (88) 119
Other* 29 (22) 7
Total $5,642 $(2,250) $3,392
* Other intangibles are primarily acquired proprietary and nonproprietary business processes, methodologies and systems.
The net carrying amount of intangible assets increased $395 million during the year ended December 31, 2012, primarily due to intangible asset additions resulting from acquisitions, partially offset by amor-tization. There was no impairment of intangible assets recorded in 2012 and 2011.
Total amortization was $1,284 million and $1,226 million for the years ended December 31, 2012 and 2011, respectively. The aggre-gate amortization expense for acquired intangibles assets (excluding capitalized software) was $709 million and $634 million for the years ended December 31, 2012 and 2011, respectively. In addition, in 2012 the company retired $641 million of fully amortized intangible assets, impacting both the gross carrying amount and accumulated amor-tization by this amount. The amortization expense for each of the five succeeding years relating to intangible assets currently recorded in the Consolidated Statement of Financial Position is estimated to be the following at December 31, 2012:
($ in millions)
Capitalized Software
Acquired Intangibles Total
2013 $501 $729 $1,230
2014 277 626 903
2015 83 498 581
2016 — 458 458
2017 — 340 340
GoodwillThe changes in the goodwill balances by reportable segment, for the years ended December 31, 2012 and 2011, are as follows:
($ in millions)
Segment
Balance January 1,
2012Goodwill
Additions
Purchase Price
Adjustments Divestitures
Foreign Currency
Translation and Other
Adjustments
Balance December 31,
2012
Global Business Services $ 4,313 $ 5 $ (0) $ (2) $ 42 $ 4,357
Global Technology Services 2,646 264 — (0) 6 2,916
Software 18,121 2,182 (30) (6) 137 20,405
Systems and Technology 1,133 443 (0) (14) 6 1,568
Total $26,213 $2,894 $(30) $(22) $192 $29,247
($ in millions)
Segment
Balance January 1,
2011Goodwill
Additions
Purchase Price
Adjustments Divestitures
Foreign Currency
Translation and Other
Adjustments
Balance December 31,
2011
Global Business Services $ 4,329 $ 14 $ (0) $(10) $ (20) $ 4,313
Global Technology Services 2,704 — (1) (2) (55) 2,646
Software 16,963 1,277 10 (2) (127) 18,121
Systems and Technology 1,139 — (6) — (0) 1,133
Total $25,136 $1,291 $ 2 $(13) $(203 ) $26,213
Purchase price adjustments recorded in 2012 and 2011 were related to acquisitions that were completed on or prior to December 31, 2011 or December 31, 2010, respectively, and were still subject to the measurement period that ends at the earlier of 12 months from the acquisition date or when information becomes available. There were no goodwill impairment losses recorded in 2012 or 2011, and the company has no accumulated goodwill impairment losses.

104 Notes to Consolidated Financial Statements International Business Machines Corporation and Subsidiary Companies
104
Long-Term Debt
Pre-Swap Borrowing
($ in millions)
At December 31: Maturities 2012 2011
U.S. dollar notes and debentures (average interest rate at December 31, 2012):
2.79% 2013 – 2014 $ 7,131 $ 8,615
1.46% 2015 – 2016 5,807 2,414
5.29% 2017 –2021 7,457 8,600
1.88% 2022 1,000 500
7.00% 2025 600 600
6.22% 2027 469 469
6.50% 2028 313 313
5.875% 2032 600 600
8.00% 2038 83 187
5.60% 2039 745 1,545
4.00% 2042 1,107 —
7.00% 2045 27 27
7.125% 2096 316 322
25,656 24,192
Other currencies (average interest rate at December 31, 2012, in parentheses):
Euros (3.6%) 2013 – 2019 2,338 1,037
Japanese yen (0.7%) 2013 – 2014 878 1,123
Swiss francs (3.8%) 2015 – 2020 178 173
Canadian (2.2%) 2017 502 —
Other (4.6%) 2013 – 2017 107 177
29,660 26,702
Less: net unamortized discount 865 533
Add: fair value adjustment* 886 994
29,680 27,161
Less: current maturities 5,593 4,306
Total $24,088 $22,857
* The portion of the company’s fixed-rate debt obligations that is hedged is reflected in the Consolidated Statement of Financial Position as an amount equal to the sum of the debt’s carrying value plus a fair value adjustment representing changes in the fair value of the hedged debt obligations attributable to movements in benchmark interest rates.
Note J. BorrowingsShort-Term Debt($ in millions)
At December 31: 2012 2011
Commercial paper $1,800 $2,300
Short-term loans 1,789 1,859
Long-term debt—current maturities 5,593 4,306
Total $9,181 $8,463
The weighted-average interest rate for commercial paper at Decem-ber 31, 2012 and 2011 was 0.1 percent, respectively. The weighted- average interest rates for short-term loans was 1.8 percent and 1.2 percent at December 31, 2012 and 2011, respectively.
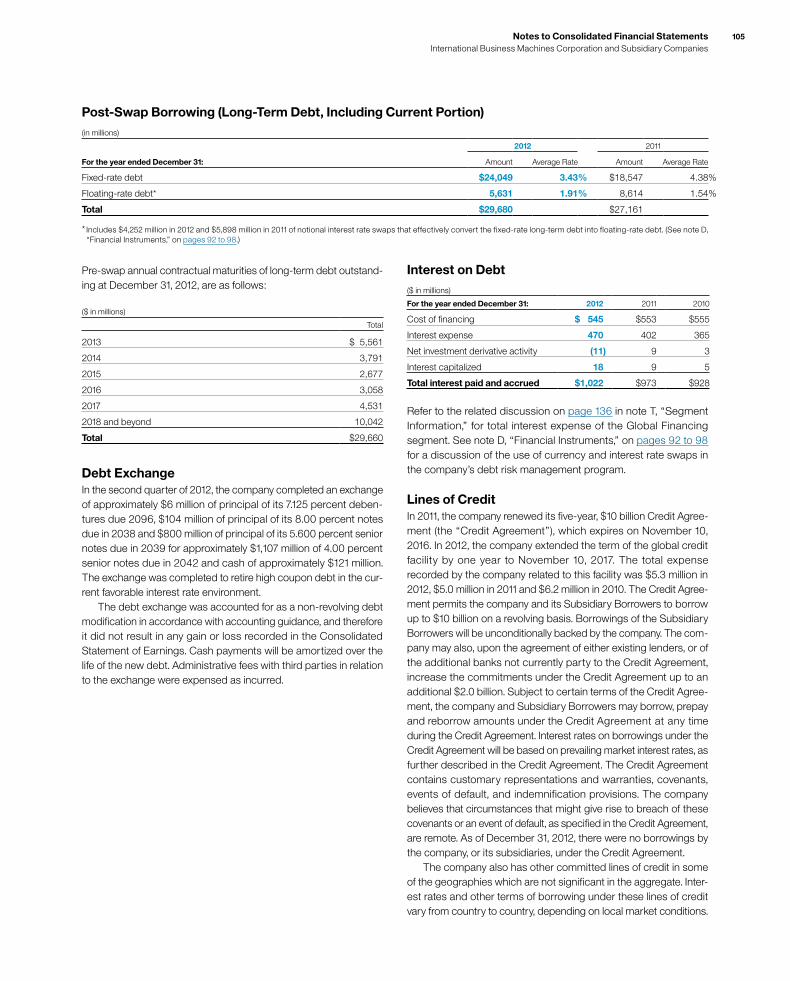
Notes to Consolidated Financial Statements International Business Machines Corporation and Subsidiary Companies
105
Pre-swap annual contractual maturities of long-term debt outstand-ing at December 31, 2012, are as follows:
($ in millions)
Total
2013 $ 5,561
2014 3,791
2015 2,677
2016 3,058
2017 4,531
2018 and beyond 10,042
Total $29,660
Debt ExchangeIn the second quarter of 2012, the company completed an exchange of approximately $6 million of principal of its 7.125 percent deben-tures due 2096, $104 million of principal of its 8.00 percent notes due in 2038 and $800 million of principal of its 5.600 percent senior notes due in 2039 for approximately $1,107 million of 4.00 percent senior notes due in 2042 and cash of approximately $121 million. The exchange was completed to retire high coupon debt in the cur-rent favorable interest rate environment. The debt exchange was accounted for as a non-revolving debt modification in accordance with accounting guidance, and therefore it did not result in any gain or loss recorded in the Consolidated Statement of Earnings. Cash payments will be amortized over the life of the new debt. Administrative fees with third parties in relation to the exchange were expensed as incurred.
Interest on Debt($ in millions)
For the year ended December 31: 2012 2011 2010
Cost of financing $ 545 $553 $555
Interest expense 470 402 365
Net investment derivative activity (11) 9 3
Interest capitalized 18 9 5
Total interest paid and accrued $1,022 $973 $928
Refer to the related discussion on page 136 in note T, “Seg ment Infor mation,” for total interest expense of the Global Financing segment. See note D, “Financial Instruments,” on pages 92 to 98 for a discussion of the use of currency and interest rate swaps in the company’s debt risk management program.
Lines of CreditIn 2011, the company renewed its five-year, $10 billion Credit Agree-ment (the “Credit Agreement”), which expires on November 10, 2016. In 2012, the company extended the term of the global credit facility by one year to November 10, 2017. The total expense recorded by the company related to this facility was $5.3 million in 2012, $5.0 million in 2011 and $6.2 million in 2010. The Credit Agree-ment permits the company and its Subsidiary Borrowers to borrow up to $10 billion on a revolving basis. Borrowings of the Subsidiary Borrowers will be unconditionally backed by the company. The com-pany may also, upon the agreement of either existing lenders, or of the additional banks not currently party to the Credit Agreement, increase the commitments under the Credit Agreement up to an additional $2.0 billion. Subject to certain terms of the Credit Agree-ment, the company and Subsidiary Borrowers may borrow, prepay and reborrow amounts under the Credit Agreement at any time during the Credit Agreement. Interest rates on borrowings under the Credit Agreement will be based on prevailing market interest rates, as further described in the Credit Agreement. The Credit Agreement contains customary representations and warranties, covenants, events of default, and indemnification provisions. The company believes that circumstances that might give rise to breach of these covenants or an event of default, as specified in the Credit Agreement, are remote. As of December 31, 2012, there were no borrowings by the company, or its subsidiaries, under the Credit Agreement. The company also has other committed lines of credit in some of the geographies which are not significant in the aggregate. Inter-est rates and other terms of borrowing under these lines of credit vary from country to country, depending on local market conditions.
Post-Swap Borrowing (Long-Term Debt, Including Current Portion)(in millions)
2012 2011
For the year ended December 31: Amount Average Rate Amount Average Rate
Fixed-rate debt $24,049 3.43% $18,547 4.38%
Floating-rate debt* 5,631 1.91% 8,614 1.54%
Total $29,680 $27,161
* Includes $4,252 million in 2012 and $5,898 million in 2011 of notional interest rate swaps that effectively convert the fixed-rate long-term debt into floating-rate debt. (See note D, “Financial Instruments,” on pages 92 to 98.)
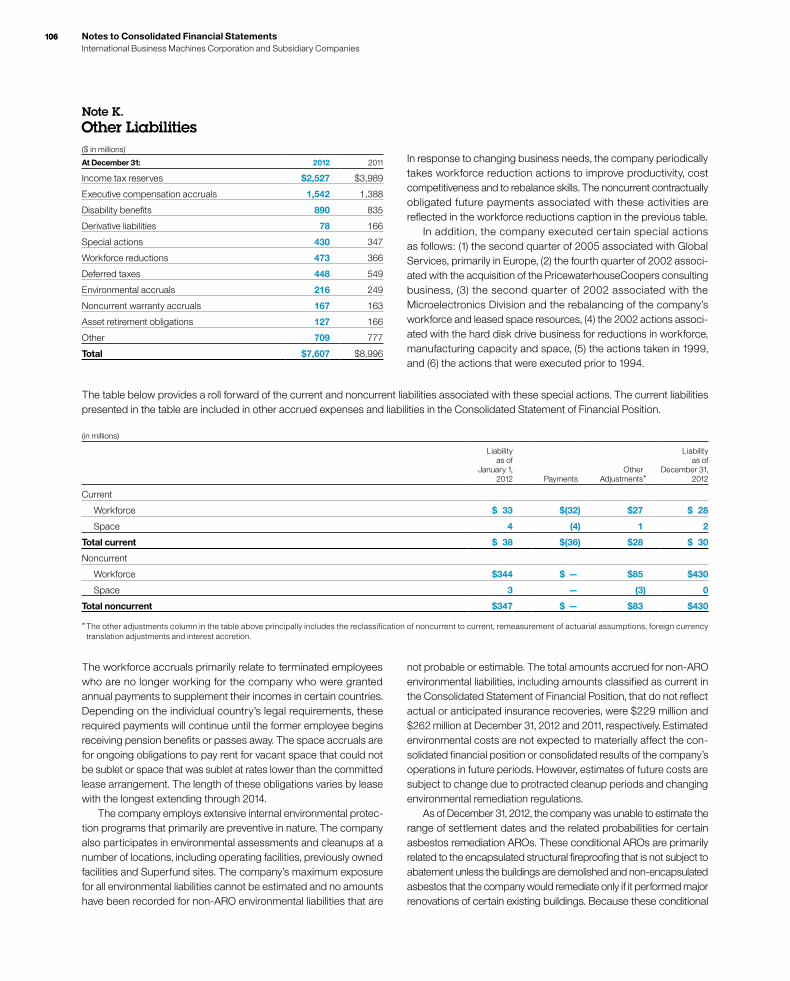
106 Notes to Consolidated Financial Statements International Business Machines Corporation and Subsidiary Companies
106
Note K. Other Liabilities($ in millions)
At December 31: 2012 2011
Income tax reserves $2,527 $3,989
Executive compensation accruals 1,542 1,388
Disability benefits 890 835
Derivative liabilities 78 166
Special actions 430 347
Workforce reductions 473 366
Deferred taxes 448 549
Environmental accruals 216 249
Noncurrent warranty accruals 167 163
Asset retirement obligations 127 166
Other 709 777
Total $7,607 $8,996
In response to changing business needs, the company periodically takes workforce reduction actions to improve productivity, cost competitiveness and to rebalance skills. The noncurrent contractually obligated future payments associated with these activities are reflected in the workforce reductions caption in the previous table. In addition, the company executed certain special actions as follows: (1) the second quarter of 2005 associated with Global Services, primarily in Europe, (2) the fourth quarter of 2002 associ-ated with the acquisition of the PricewaterhouseCoopers consulting business, (3) the second quarter of 2002 associated with the Microelectronics Division and the rebalancing of the company’s workforce and leased space resources, (4) the 2002 actions associ-ated with the hard disk drive business for reductions in workforce, manufacturing capacity and space, (5) the actions taken in 1999, and (6) the actions that were executed prior to 1994.
The table below provides a roll forward of the current and noncurrent liabilities associated with these special actions. The current liabilities presented in the table are included in other accrued expenses and liabilities in the Consolidated Statement of Financial Position.
(in millions)
Liability as of
January 1, 2012 Payments
Other Adjustments*
Liability as of
December 31, 2012
Current
Workforce $ 33 $(32) $27 $ 28
Space 4 (4) 1 2
Total current $ 38 $(36) $28 $ 30
Noncurrent
Workforce $344 $ — $85 $430
Space 3 — (3) 0
Total noncurrent $347 $ — $83 $430
* The other adjustments column in the table above principally includes the reclassification of noncurrent to current, remeasurement of actuarial assumptions, foreign currency translation adjustments and interest accretion.
The workforce accruals primarily relate to terminated employees who are no longer working for the company who were granted annual payments to supplement their incomes in certain countries. Depending on the individual country’s legal requirements, these required payments will continue until the former employee begins receiving pension benefits or passes away. The space accruals are for ongoing obligations to pay rent for vacant space that could not be sublet or space that was sublet at rates lower than the committed lease arrangement. The length of these obligations varies by lease with the longest extending through 2014. The company employs extensive internal environmental protec-tion programs that primarily are preventive in nature. The company also participates in environmental assessments and cleanups at a number of locations, including operating facilities, previously owned facilities and Superfund sites. The company’s maximum exposure for all environmental liabilities cannot be estimated and no amounts have been recorded for non-ARO environmental liabilities that are
not probable or estimable. The total amounts accrued for non-ARO environmental liabilities, including amounts classified as current in the Consolidated Statement of Financial Position, that do not reflect actual or anticipated insurance recoveries, were $229 million and $262 million at December 31, 2012 and 2011, respectively. Estimated environmental costs are not expected to materially affect the con-solidated financial position or consolidated results of the company’s operations in future periods. However, estimates of future costs are subject to change due to protracted cleanup periods and changing environmental remediation regulations. As of December 31, 2012, the company was unable to estimate the range of settlement dates and the related probabilities for certain asbestos remediation AROs. These conditional AROs are primarily related to the encapsulated structural fireproofing that is not subject to abatement unless the buildings are demolished and non-encapsulated asbestos that the company would remediate only if it performed major renovations of certain existing buildings. Because these conditional

Notes to Consolidated Financial Statements International Business Machines Corporation and Subsidiary Companies
107
obligations have indeterminate settlement dates, the company could not develop a reasonable estimate of their fair values. The company will continue to assess its ability to estimate fair values at each future reporting date. The related liability will be recognized once sufficient additional information becomes available. The total amounts accrued for ARO liabilities, including amounts classified as current in the Consolidated Statement of Financial Position, were $171 million and $187 million at December 31, 2012 and 2011, respectively.
Note L. Equity ActivityThe authorized capital stock of IBM consists of 4,687,500,000 shares of common stock with a $.20 per share par value, of which 1,117,367,676 shares were outstanding at December 31, 2012 and 150,000,000 shares of preferred stock with a $.01 per share par value, none of which were outstanding at December 31, 2012.
Stock RepurchasesThe Board of Directors authorizes the company to repurchase IBM common stock. The company repurchased 61,246,371 common shares at a cost of $12,008 million, 88,683,716 common shares at a cost of $15,034 million and 117,721,650 common shares at a cost of $15,419 million in 2012, 2011 and 2010, respectively. These amounts reflect transactions executed through December 31 of
each year. Actual cash disbursements for repurchased shares may differ due to varying settlement dates for these transactions. At December 31, 2012, $8,652 million of Board common stock repur-chase authorization was still available. The company plans to purchase shares on the open market or in private transactions from time to time, depending on market conditions.
Other Stock TransactionsThe company issued the following shares of common stock as part of its stock-based compensation plans and employees stock pur-chase plan: 15,091,320 shares in 2012, 20,669,785 shares in 2011 and 34,783,386 shares in 2010.The company issued 2,746,169 treasury shares in 2012, 4,920,198 treasury shares in 2011 and 7,929,318 treasury shares in 2010, as a result of exercises of stock options by employees of certain acquired businesses and by non-U.S. employees. Also, as part of the company’s stock-based compensation plans, 2,406,007 common shares at a cost of $468 million, 1,717,246 common shares at a cost of $289 million and 2,334,932 common shares at a cost of $297 million in 2012, 2011 and 2010, respectively, were remitted by employees to the company in order to satisfy minimum statutory tax withholding requirements. These amounts are included in the treasury stock balance in the Consolidated Statement of Financial Position and the Consolidated Statement of Changes in Equity.
Reclassifications and Taxes Related to Items of Other Comprehensive Income($ in millions)
For the year ended December 31, 2012:Before Tax
AmountTax (Expense)/
BenefitNet of Tax
Amount
Other comprehensive income/(loss)
Foreign currency translation adjustments $ (44) $ 10 $ (34)
Net changes related to available-for-sale securities
Unrealized gains/(losses) arising during the period $ 8 $ (4) $ 4
Reclassification of (gains)/losses to other (income) and expense (42) 17 (25)
Subsequent changes in previously impaired securities arising during the period 20 (8) 12
Total net changes related to available-for-sale securities $ (14) $ 5 $ (9)
Unrealized gains/(losses) on cash flow hedges
Unrealized gains/(losses) arising during the period $ 32 $ (27) $ 5
Reclassification of (gains)/losses to:
Cost of sales (7) (6) (13)
SG&A expense (16) 4 (12)
Other (income) and expense (237) 91 (146)
Interest expense 6 (3) 3
Total unrealized gains/(losses) on cash flow hedges $ (220) $ 59 $ (161)
Retirement-related benefit plans(1)
Net (losses)/gains arising during the period $(7,489) $2,327 $(5,162)
Curtailments and settlements (2) 0 (2)
Amortization of prior service (credits)/cost (148) 59 (89)
Amortization of net gains/(losses) 2,457 (874) 1,583
Total retirement-related benefit plans $(5,182) $1,513 $(3,669)
Other comprehensive income/(loss) $(5,460) $1,587 $(3,874)
(1) These AOCI components are included in the computation of net periodic pension cost. (See note S, “Retirement-Related Benefits,” on pages 120 to 134 for additional information.)
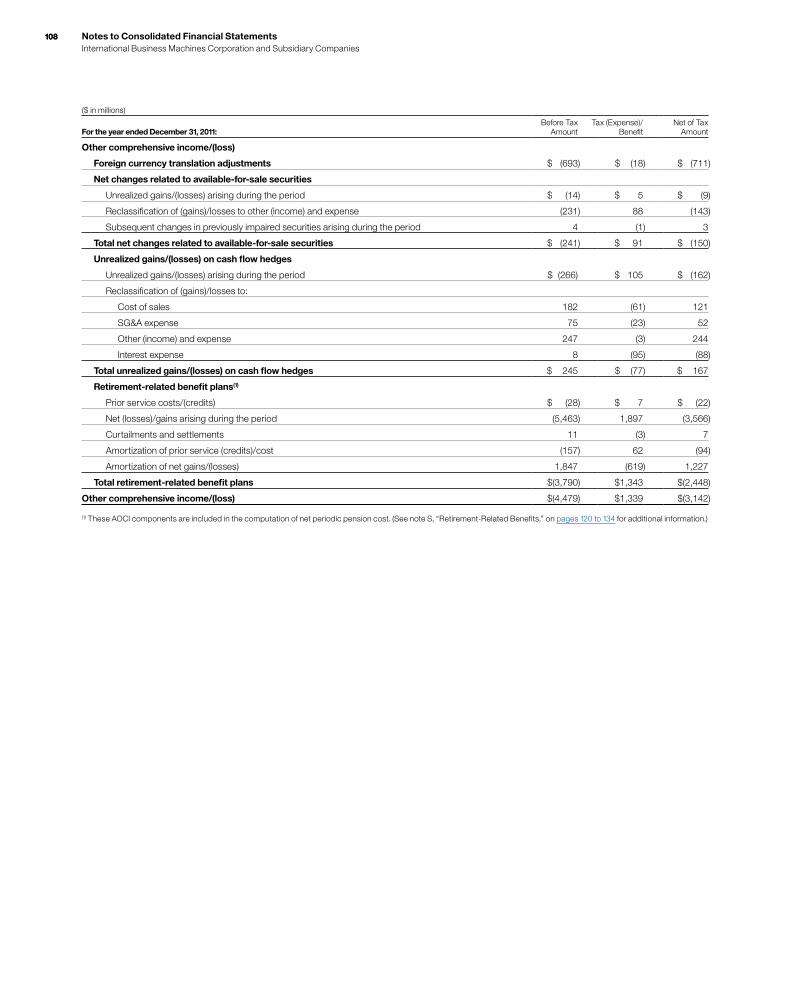
108 Notes to Consolidated Financial Statements International Business Machines Corporation and Subsidiary Companies
108
($ in millions)
For the year ended December 31, 2011:Before Tax
AmountTax (Expense)/
BenefitNet of Tax
Amount
Other comprehensive income/(loss)
Foreign currency translation adjustments $ (693) $ (18) $ (711)
Net changes related to available-for-sale securities
Unrealized gains/(losses) arising during the period $ (14) $ 5 $ (9)
Reclassification of (gains)/losses to other (income) and expense (231) 88 (143)
Subsequent changes in previously impaired securities arising during the period 4 (1) 3
Total net changes related to available-for-sale securities $ (241) $ 91 $ (150)
Unrealized gains/(losses) on cash flow hedges
Unrealized gains/(losses) arising during the period $ (266) $ 105 $ (162)
Reclassification of (gains)/losses to:
Cost of sales 182 (61) 121
SG&A expense 75 (23) 52
Other (income) and expense 247 (3) 244
Interest expense 8 (95) (88)
Total unrealized gains/(losses) on cash flow hedges $ 245 $ (77) $ 167
Retirement-related benefit plans(1)
Prior service costs/(credits) $ (28) $ 7 $ (22)
Net (losses)/gains arising during the period (5,463) 1,897 (3,566)
Curtailments and settlements 11 (3) 7
Amortization of prior service (credits)/cost (157) 62 (94)
Amortization of net gains/(losses) 1,847 (619) 1,227
Total retirement-related benefit plans $(3,790) $1,343 $(2,448)
Other comprehensive income/(loss) $(4,479) $1,339 $(3,142)
(1) These AOCI components are included in the computation of net periodic pension cost. (See note S, “Retirement-Related Benefits,” on pages 120 to 134 for additional information.)
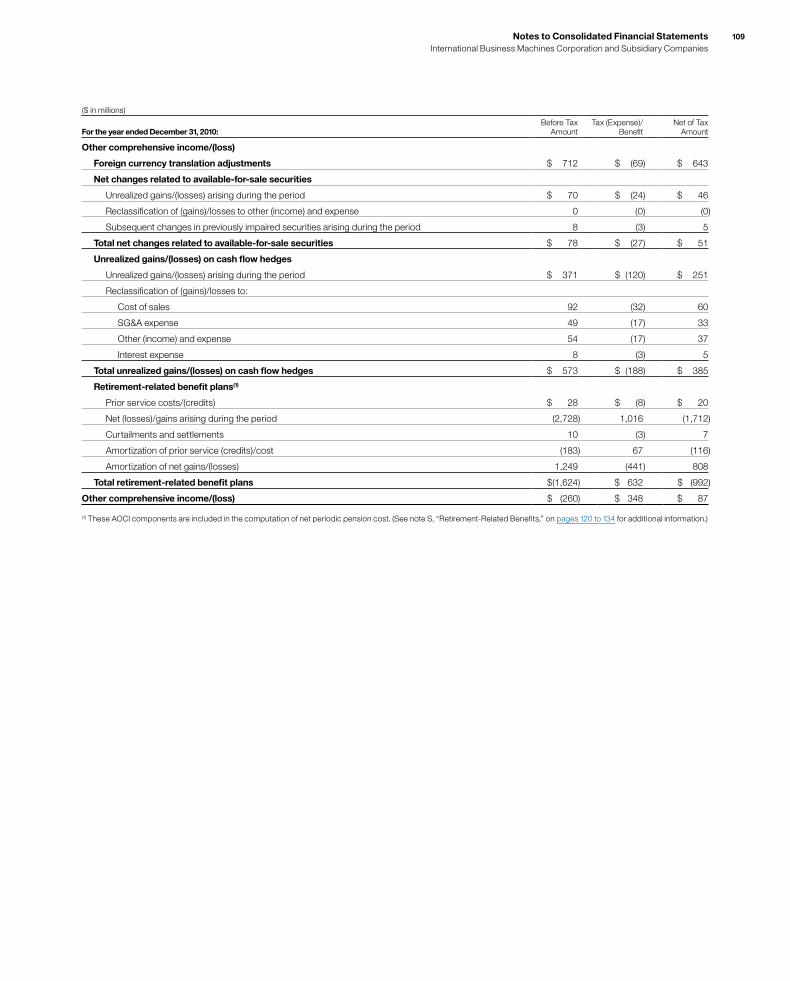
Notes to Consolidated Financial Statements International Business Machines Corporation and Subsidiary Companies
109
($ in millions)
For the year ended December 31, 2010:Before Tax
AmountTax (Expense)/
BenefitNet of Tax
Amount
Other comprehensive income/(loss)
Foreign currency translation adjustments $ 712 $ (69) $ 643
Net changes related to available-for-sale securities
Unrealized gains/(losses) arising during the period $ 70 $ (24) $ 46
Reclassification of (gains)/losses to other (income) and expense 0 (0) (0)
Subsequent changes in previously impaired securities arising during the period 8 (3) 5
Total net changes related to available-for-sale securities $ 78 $ (27) $ 51
Unrealized gains/(losses) on cash flow hedges
Unrealized gains/(losses) arising during the period $ 371 $ (120) $ 251
Reclassification of (gains)/losses to:
Cost of sales 92 (32) 60
SG&A expense 49 (17) 33
Other (income) and expense 54 (17) 37
Interest expense 8 (3) 5
Total unrealized gains/(losses) on cash flow hedges $ 573 $ (188) $ 385
Retirement-related benefit plans(1)
Prior service costs/(credits) $ 28 $ (8) $ 20
Net (losses)/gains arising during the period (2,728) 1,016 (1,712)
Curtailments and settlements 10 (3) 7
Amortization of prior service (credits)/cost (183) 67 (116)
Amortization of net gains/(losses) 1,249 (441) 808
Total retirement-related benefit plans $(1,624) $ 632 $ (992)
Other comprehensive income/(loss) $ (260) $ 348 $ 87
(1) These AOCI components are included in the computation of net periodic pension cost. (See note S, “Retirement-Related Benefits,” on pages 120 to 134 for additional information.)

110 Notes to Consolidated Financial Statements International Business Machines Corporation and Subsidiary Companies
110
Accumulated Other Comprehensive Income/(Loss) (net of tax)($ in millions)
Net Unrealized Gains/(Losses)
on Cash Flow Hedges
Foreign Currency
Translation Adjustments*
Net Change Retirement-
Related Benefit
Plans
Net Unrealized Gains/(Losses)
on Available- For-Sale
Securities
Accumulated Other
Comprehensive Income/(Loss)
December 31, 2009 $(481) $1,836 $(20,297) $ 113 $(18,830)
Other comprehensive income before reclassifications 251 643 (1,684) 51 (739)
Amount reclassified from accumulated other comprehensive income 134 0 692 0 826
Total change for the period 385 643 (992) 51 87
December 31, 2010 (96) 2,478 (21,289) 164 (18,743)
Other comprehensive income before reclassifications (162) (711) (3,581) (7) (4,461)
Amount reclassified from accumulated other comprehensive income 329 0 1,133 (143) 1,319
Total change for the period 167 (711) (2,448) (150) (3,142)
December 31, 2011 71 1,767 (23,737) 13 (21,885)
Other comprehensive income before reclassifications 5 (34) (5,164) 16 (5,177)
Amount reclassified from accumulated other comprehensive income (167) 0 1,495 (25) 1,303
Total change for the period (161) (34) (3,669) (9) (3,874)
December 31, 2012 $ (90) $1,733 $(27,406) $ 4 $(25,759)
* Foreign currency translation adjustments are presented gross except for any associated hedges which are presented net of tax.
Note M. Contingencies and CommitmentsContingenciesAs a company with a substantial employee population and with clients in more than 170 countries, IBM is involved, either as plaintiff or defendant, in a variety of ongoing claims, demands, suits, inves-tigations, tax matters and proceedings that arise from time to time in the ordinary course of its business. The company is a leader in the information technology industry and, as such, has been and will continue to be subject to claims challenging its IP rights and associ-ated products and offerings, including claims of copyright and patent infringement and violations of trade secrets and other IP rights. In addition, the company enforces its own IP against infringement, through license negotiations, lawsuits or otherwise. Also, as is typical for companies of IBM’s scope and scale, the company is party to actions and proceedings in various jurisdictions involving a wide range of labor and employment issues (including matters related to contested employment decisions, country-specific labor and employment laws, and the company’s pension, retirement and other benefit plans), as well as actions with respect to contracts, product liability, securities, foreign operations, competition law and environ-mental matters. These actions may be commenced by a number of different parties, including competitors, clients, current or former employees, government and regulatory agencies, stockholders and representatives of the locations in which the company does busi-ness. Some of the actions to which the company is party may involve particularly complex technical issues, and some actions may raise novel questions under the laws of the various jurisdictions in which these matters arise.
The company records a provision with respect to a claim, suit, investigation or proceeding when it is probable that a liability has been incurred and the amount of the loss can be reasonably esti-mated. Any recorded liabilities, including any changes to such liabilities for the years ended December 31, 2012, 2011 and 2010 were not material to the Consolidated Financial Statements. In accordance with the relevant accounting guidance, the com-pany provides disclosures of matters for which the likelihood of material loss is at least reasonably possible. In addition, the com-pany also discloses matters based on its consideration of other matters and qualitative factors, including the experience of other companies in the industry, and investor, customer and employee relations considerations. With respect to certain of the claims, suits, investigations and proceedings discussed herein, the company believes at this time that the likelihood of any material loss is remote, given, for example, the procedural status, court rulings, and/or the strength of the com-pany’s defenses in those matters. With respect to the remaining claims, suits, investigations and proceedings discussed in this note, the company is unable to provide estimates of reasonably possible losses or range of losses, including losses in excess of amounts accrued, if any, for the following reasons. Claims, suits, investigations and proceedings are inherently uncertain, and it is not possible to predict the ultimate outcome of these matters. It is the company’s experience that damage amounts claimed in litigation against it are unreliable and unrelated to possible outcomes, and as such are not meaningful indicators of the company’s potential liability. Further, the company is unable to provide such an estimate due to a number of other factors with respect to these claims, suits, investigations and proceedings, including considerations of the procedural status of
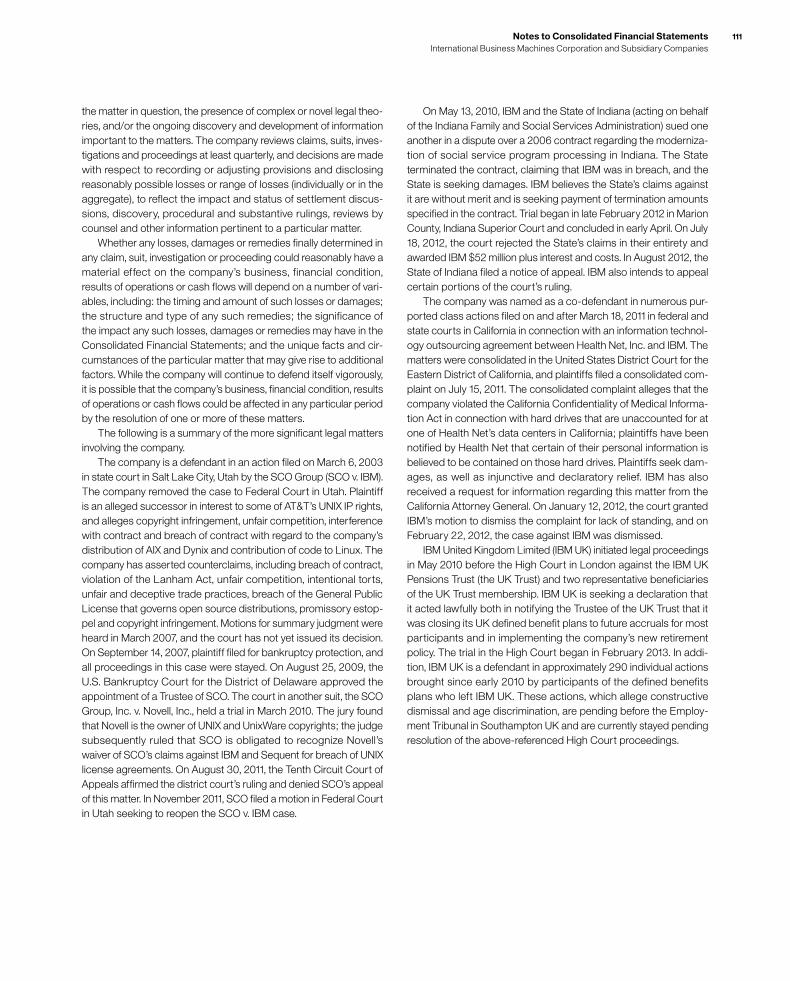
Notes to Consolidated Financial Statements International Business Machines Corporation and Subsidiary Companies
111
the matter in question, the presence of complex or novel legal theo-ries, and/or the ongoing discovery and development of information important to the matters. The company reviews claims, suits, inves-tigations and proceedings at least quarterly, and decisions are made with respect to recording or adjusting provisions and disclosing reasonably possible losses or range of losses (individually or in the aggregate), to reflect the impact and status of settlement discus-sions, discovery, procedural and substantive rulings, reviews by counsel and other information pertinent to a particular matter. Whether any losses, damages or remedies finally determined in any claim, suit, investigation or proceeding could reasonably have a material effect on the company’s business, financial condition, results of operations or cash flows will depend on a number of vari-ables, including: the timing and amount of such losses or damages; the structure and type of any such remedies; the significance of the impact any such losses, damages or remedies may have in the Consolidated Financial Statements; and the unique facts and cir-cumstances of the particular matter that may give rise to additional factors. While the company will continue to defend itself vigorously, it is possible that the company’s business, financial condition, results of operations or cash flows could be affected in any particular period by the resolution of one or more of these matters. The following is a summary of the more significant legal matters involving the company. The company is a defendant in an action filed on March 6, 2003 in state court in Salt Lake City, Utah by the SCO Group (SCO v. IBM). The company removed the case to Federal Court in Utah. Plaintiff is an alleged successor in interest to some of AT&T’s UNIX IP rights, and alleges copyright infringement, unfair competition, interference with contract and breach of contract with regard to the company’s distribution of AIX and Dynix and contribution of code to Linux. The company has asserted counterclaims, including breach of contract, violation of the Lanham Act, unfair competition, intentional torts, unfair and deceptive trade practices, breach of the General Public License that governs open source distributions, promissory estop-pel and copyright infringement. Motions for summary judgment were heard in March 2007, and the court has not yet issued its decision. On September 14, 2007, plaintiff filed for bankruptcy protection, and all proceedings in this case were stayed. On August 25, 2009, the U.S. Bankruptcy Court for the District of Delaware approved the appointment of a Trustee of SCO. The court in another suit, the SCO Group, Inc. v. Novell, Inc., held a trial in March 2010. The jury found that Novell is the owner of UNIX and UnixWare copyrights; the judge subsequently ruled that SCO is obligated to recognize Novell’s waiver of SCO’s claims against IBM and Sequent for breach of UNIX license agreements. On August 30, 2011, the Tenth Circuit Court of Appeals affirmed the district court’s ruling and denied SCO’s appeal of this matter. In November 2011, SCO filed a motion in Federal Court in Utah seeking to reopen the SCO v. IBM case.
On May 13, 2010, IBM and the State of Indiana (acting on behalf of the Indiana Family and Social Services Administration) sued one another in a dispute over a 2006 contract regarding the moderniza-tion of social service program processing in Indiana. The State terminated the contract, claiming that IBM was in breach, and the State is seeking damages. IBM believes the State’s claims against it are without merit and is seeking payment of termination amounts specified in the contract. Trial began in late February 2012 in Marion County, Indiana Superior Court and concluded in early April. On July 18, 2012, the court rejected the State’s claims in their entirety and awarded IBM $52 million plus interest and costs. In August 2012, the State of Indiana filed a notice of appeal. IBM also intends to appeal certain portions of the court’s ruling. The company was named as a co-defendant in numerous pur-ported class actions filed on and after March 18, 2011 in federal and state courts in California in connection with an information technol-ogy outsourcing agreement between Health Net, Inc. and IBM. The matters were consolidated in the United States District Court for the Eastern District of California, and plaintiffs filed a consolidated com-plaint on July 15, 2011. The consolidated complaint alleges that the company violated the California Confidentiality of Medical Informa-tion Act in connection with hard drives that are unaccounted for at one of Health Net’s data centers in California; plaintiffs have been notified by Health Net that certain of their personal information is believed to be contained on those hard drives. Plaintiffs seek dam-ages, as well as injunctive and declaratory relief. IBM has also received a request for information regarding this matter from the California Attorney General. On January 12, 2012, the court granted IBM’s motion to dismiss the complaint for lack of standing, and on February 22, 2012, the case against IBM was dismissed. IBM United Kingdom Limited (IBM UK) initiated legal proceedings in May 2010 before the High Court in London against the IBM UK Pensions Trust (the UK Trust) and two representative beneficiaries of the UK Trust membership. IBM UK is seeking a declaration that it acted lawfully both in notifying the Trustee of the UK Trust that it was closing its UK defined benefit plans to future accruals for most participants and in implementing the company’s new retirement policy. The trial in the High Court began in February 2013. In addi-tion, IBM UK is a defendant in approximately 290 individual actions brought since early 2010 by participants of the defined benefits plans who left IBM UK. These actions, which allege constructive dismissal and age discrimination, are pending before the Employ-ment Tribunal in Southampton UK and are currently stayed pending resolution of the above-referenced High Court proceedings.

112 Notes to Consolidated Financial Statements International Business Machines Corporation and Subsidiary Companies
112
In a separate but related proceeding, in March 2011, the Trustee of the IBM UK Trust was granted leave to initiate a claim before the High Court in London against IBM UK and one member of the UK Trust membership, seeking an order modifying certain documents and terms relating to retirement provisions in IBM UK’s largest defined benefit plan (the C Plan) dating back to 1983. The trial of these proceedings began in May 2012 and finished in early June. On October 12, 2012, the High Court in London issued its ruling, holding that the 1983 Trust Deeds and Rules should be modified to allow certain categories of current IBM UK employees who are members of the C Plan to retire from the age of 60 (rather than from the age of 63) without actuarial reduction of their defined benefit pension. In a supplementary ruling on December 13, 2012, the Court declined to similarly modify the Trust Deeds and Rules for former employees who were C Plan members and who left the company prior to retirement. On February 7, 2013, the Court issued an order agreed to by all parties, under which there will be no appeals of the October 2012 and December 2012 judgments. As a result of the October 2012 ruling, IBM recorded an additional pre-tax retirement-related obligation of $162 million in the third quarter of 2012. In March 2011, the company announced that it has agreed to settle a civil enforcement action with the Securities and Exchange Commission (SEC) relating to activities by employees of IBM Korea, LG IBM, IBM (China) Investment Company Limited and IBM Global Services (China) Co., Ltd., during the period from 1998 through 2009, allegedly in violation of the Foreign Corrupt Practices Act of 1977. As part of the settlement, IBM has consented to the entry of a judgment relating to the books and records and internal control provisions of the securities laws. IBM has also agreed to pay a total of $10 million, categorized by the SEC as follows: (i) $5.3 million, representing profits gained as a result of the conduct alleged in the SEC’s complaint, (ii) prejudgment interest on that amount of $2.7 million, and (iii) a civil penalty of $2 million. The settlement is subject to court approval.
The company is a defendant in numerous actions filed after January 1, 2008 in the Supreme Court for the State of New York, county of Broome, on behalf of hundreds of plaintiffs. The com-plaints allege numerous and different causes of action, including for negligence and recklessness, private nuisance and trespass. Plain-tiffs in these cases seek medical monitoring and claim damages in unspecified amounts for a variety of personal injuries and property damages allegedly arising out of the presence of groundwater con-tamination and vapor intrusion of groundwater contaminants into certain structures in which plaintiffs reside or resided, or conducted business, allegedly resulting from the release of chemicals into the environment by the company at its former manufacturing and devel-opment facility in Endicott. These complaints also seek punitive damages in an unspecified amount. The company is party to, or otherwise involved in, proceedings brought by U.S. federal or state environmental agencies under the Comprehensive Environmental Response, Compensation and Liability Act (CERCLA), known as “Superfund,” or laws similar to CERCLA. Such statutes require potentially responsible parties to participate in remediation activities regardless of fault or ownership of sites. The company is also conducting environmental investiga-tions, assessments or remediations at or in the vicinity of several current or former operating sites globally pursuant to permits, administrative orders or agreements with country, state or local environmental agencies, and is involved in lawsuits and claims con-cerning certain current or former operating sites. The company is also subject to ongoing tax examinations and governmental assessments in various jurisdictions. Along with many other U.S. companies doing business in Brazil, the company is involved in various challenges with Brazilian authorities regarding non-income tax assessments and non-income tax litigation matters. These matters include claims for taxes on the importation of com-puter software. In November 2008, the company won a significant case in the Superior Chamber of the federal administrative tax court in Brazil, and in late July 2009, the company received written con-firmation regarding this decision. The total potential amount related to the remaining matters for all applicable years is approximately $575 million. The company believes it will prevail on these matters and that this amount is not a meaningful indicator of liability.
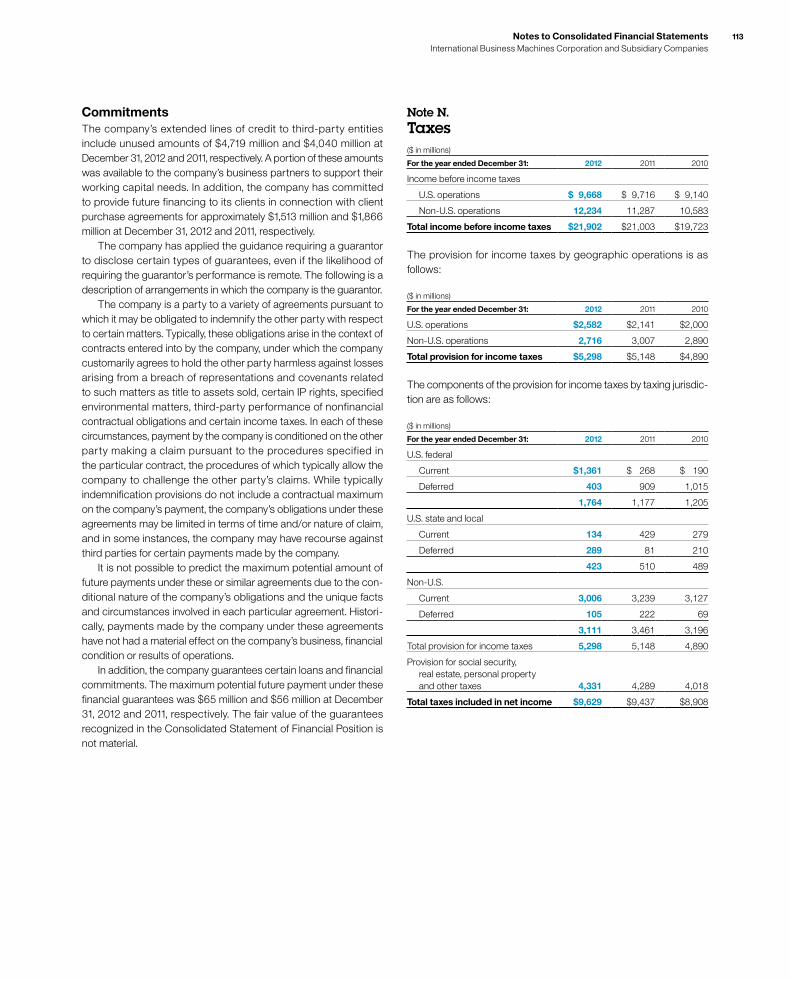
Notes to Consolidated Financial Statements International Business Machines Corporation and Subsidiary Companies
113
Note N. Taxes($ in millions)
For the year ended December 31: 2012 2011 2010
Income before income taxes
U.S. operations $ 9,668 $ 9,716 $ 9,140
Non-U.S. operations 12,234 11,287 10,583
Total income before income taxes $21,902 $21,003 $19,723
The provision for income taxes by geographic operations is as follows:
($ in millions)
For the year ended December 31: 2012 2011 2010
U.S. operations $2,582 $2,141 $2,000
Non-U.S. operations 2,716 3,007 2,890
Total provision for income taxes $5,298 $5,148 $4,890
The components of the provision for income taxes by taxing jurisdic-tion are as follows:
($ in millions)
For the year ended December 31: 2012 2011 2010
U.S. federal
Current $1,361 $ 268 $ 190
Deferred 403 909 1,015
1,764 1,177 1,205
U.S. state and local
Current 134 429 279
Deferred 289 81 210
423 510 489
Non-U.S.
Current 3,006 3,239 3,127
Deferred 105 222 69
3,111 3,461 3,196
Total provision for income taxes 5,298 5,148 4,890
Provision for social security, real estate, personal property and other taxes 4,331 4,289 4,018
Total taxes included in net income $9,629 $9,437 $8,908
CommitmentsThe company’s extended lines of credit to third-party entities include unused amounts of $4,719 million and $4,040 million at December 31, 2012 and 2011, respectively. A portion of these amounts was available to the company’s business partners to support their working capital needs. In addition, the company has committed to provide future financing to its clients in connection with client purchase agreements for approximately $1,513 million and $1,866 million at December 31, 2012 and 2011, respectively. The company has applied the guidance requiring a guarantor to disclose certain types of guarantees, even if the likelihood of requiring the guarantor’s performance is remote. The following is a description of arrangements in which the company is the guarantor. The company is a party to a variety of agreements pursuant to which it may be obligated to indemnify the other party with respect to certain matters. Typically, these obligations arise in the context of contracts entered into by the company, under which the company customarily agrees to hold the other party harmless against losses arising from a breach of representations and covenants related to such matters as title to assets sold, certain IP rights, specified environmental matters, third-party performance of nonfinancial contractual obligations and certain income taxes. In each of these circumstances, payment by the company is conditioned on the other party making a claim pursuant to the procedures specified in the particular contract, the procedures of which typically allow the company to challenge the other party’s claims. While typically indemnification provisions do not include a contractual maximum on the company’s payment, the company’s obligations under these agreements may be limited in terms of time and/or nature of claim, and in some instances, the company may have recourse against third parties for certain payments made by the company. It is not possible to predict the maximum potential amount of future payments under these or similar agreements due to the con-ditional nature of the company’s obligations and the unique facts and circumstances involved in each particular agreement. Histori-cally, payments made by the company under these agreements have not had a material effect on the company’s business, financial condition or results of operations. In addition, the company guarantees certain loans and financial commitments. The maximum potential future payment under these financial guarantees was $65 million and $56 million at December 31, 2012 and 2011, respectively. The fair value of the guarantees recognized in the Consolidated Statement of Financial Position is not material.

114 Notes to Consolidated Financial Statements International Business Machines Corporation and Subsidiary Companies
114
Deferred Tax Liabilities($ in millions)
At December 31: 2012 2011
Leases $2,216 $2,149
Depreciation 1,378 1,421
Goodwill and intangible assets 957 796
Software development costs 542 466
Retirement benefits 257 551
Other 1,158 1,121
Gross deferred tax liabilities $6,508 $6,504
For income tax return purposes, the company has foreign and domestic loss carryforwards, the tax effect of which is $706 million, as well as domestic and foreign credit carryforwards of $929 million. Substantially all of these carryforwards are available for at least two years or are available for 10 years or more. The valuation allowance at December 31, 2012 principally applies to certain foreign, state and local loss carryforwards that, in the opinion of management, are more likely than not to expire unutilized. However, to the extent that tax benefits related to these carry-forwards are realized in the future, the reduction in the valuation allowance will reduce income tax expense. The amount of unrecognized tax benefits at December 31, 2012 increased by $97 million in 2012 to $5,672 million. A reconciliation of the beginning and ending amount of unrecognized tax benefits is as follows:
($ in millions)
2012 2011 2010
Balance at January 1 $5,575 $5,293 $ 4,790
Additions based on tax positions related to the current year 401 672 1,054
Additions for tax positions of prior years 215 379 1,768
Reductions for tax positions of prior years (including impacts due to a lapse in statute) (425) (538) (1,659)
Settlements (94) (231) (660)
Balance at December 31 $5,672 $5,575 $ 5,293
The additions to unrecognized tax benefits related to the current and prior years are primarily attributable to non-U.S. issues, certain tax incentives and credits, acquisition-related matters and state issues. The settlements and reductions to unrecognized tax benefits for tax positions of prior years are primarily attributable to the con-clusion of the company’s various U.S., state and non-U.S. income tax examinations and various non-U.S. matters, as well as impacts due to lapses in statutes of limitation.
A reconciliation of the statutory U.S. federal tax rate to the company’s effective tax rate is as follows:
For the year ended December 31: 2012 2011 2010
Statutory rate 35% 35% 35%
Foreign tax differential (11) (10) (10)
State and local 1 2 2
Other (1) (2) (2)
Effective rate 24% 25% 25%
The significant components reflected within the tax rate reconcili-ation above labeled “Foreign tax differential” include the effects of foreign subsidiaries’ earnings taxed at rates other than the U.S. statutory rate, foreign export incentives, the U.S. tax impacts of non-U.S. earnings repatriation and any net impacts of intercom-pany transactions. These items also reflect audit settlements or changes in the amount of unrecognized tax benefits associated with each of these items. In the fourth quarter of 2011, the IRS commenced its audit of the company’s U.S. tax returns for the years 2008 through 2010. The company anticipates that this audit will be completed by the end of 2013. The effect of tax law changes on deferred tax assets and liabilities did not have a material impact on the company’s effective tax rate. The significant components of deferred tax assets and liabilities that are recorded in the Consolidated Statement of Financial Position were as follows:
Deferred Tax Assets($ in millions)
At December 31: 2012 2011*
Retirement benefits $ 5,870 $ 5,169
Share-based and other compensation 1,666 1,598
Deferred income 1,018 834
Domestic tax loss/credit carryforwards 954 914
Foreign tax loss/credit carryforwards 681 752
Bad debt, inventory and warranty reserves 586 608
Depreciation 456 474
Other 1,384 1,479
Gross deferred tax assets 12,615 11,828
Less: valuation allowance 1,187 912
Net deferred tax assets $11,428 $10,916
* Reclassed to conform with 2012 presentation.
Notes to Consolidated Financial Statements International Business Machines Corporation and Subsidiary Companies
115
In April 2010, the company appealed the determination of a non-U.S. taxing authority with respect to certain foreign tax losses. The tax benefit of these losses, approximately $1,475 million, had been included in unrecognized tax benefits within 2010 additions for tax positions of prior years. The tax benefit of these losses total $1,386 million as of December 31, 2012. The 2012 decrease was driven by currency and has been included in the 2012 reductions for tax posi-tions of prior years. In April 2011, the company had received notification that the appeal was denied. In June 2011, the company filed a lawsuit challenging this decision. The next court hearing is scheduled for March 2013. No final determination has been reached on this matter. The liability at December 31, 2012 of $5,672 million can be reduced by $573 million of offsetting tax benefits associated with the correlative effects of potential transfer pricing adjustments, state income taxes and timing adjustments. The net amount of $5,099 million, if recognized, would favorably affect the company’s effective tax rate. The net amounts at December 31, 2011 and 2010 were $5,090 million and $4,849 million, respectively. Interest and penalties related to income tax liabilities are included in income tax expense. During the year ended December 31, 2012, the company recognized $134 million in interest expense and penalties; in 2011, the company recognized $129 million in interest expense and penalties, and in 2010, the company recognized a $15 million ben-efit in interest expense and penalties. The company has $533 million for the payment of interest and penalties accrued at December 31, 2012, and had $461 million accrued at December 31, 2011. Within the next 12 months, the company believes it is reasonably possible that the total amount of unrecognized tax benefits associ-ated with certain positions may be significantly reduced. The potential decrease in the amount of unrecognized tax benefits is primarily associated with the anticipated resolution of the com-pany’s U.S. income tax audit for 2008 through 2010, as well as various non-U.S. audits. Specific positions that may be resolved, and may reduce the amount of unrecognized tax benefits, include transfer pricing matters, tax incentives and credits as well as vari-ous other foreign tax matters. The company estimates that the unrecognized tax benefits at December 31, 2012 could be reduced by approximately $1,700 million. With limited exception, the company is no longer subject to U.S. federal, state and local or non-U.S. income tax audits by taxing authorities for years through 2007. The years subsequent to 2007 contain matters that could be subject to differing interpretations of applicable tax laws and regulations related to the amount and/or timing of income, deductions and tax credits. Although the outcome of tax audits is always uncertain, the company believes that ade-quate amounts of tax and interest have been provided for any adjustments that are expected to result for these years. The company has not provided deferred taxes on $44.4 billion of undistributed earnings of non-U.S. subsidiaries at December 31, 2012, as it is the company’s policy to indefinitely reinvest these earn-ings in non-U.S. operations. However, the company periodically repatriates a portion of these earnings to the extent that it does not incur an additional U.S. tax liability. Quantification of the deferred tax liability, if any, associated with indefinitely reinvested earnings is not practicable.
Note O. Research, Development and EngineeringRD&E expense was $6,302 million in 2012, $6,258 million in 2011 and $6,026 million in 2010. The company incurred expense of $6,034 million, $5,990 million and $5,720 million in 2012, 2011 and 2010, respectively, for scientific research and the application of scientific advances to the develop-ment of new and improved products and their uses, as well as services and their application. Within these amounts, software-related expense was $3,078 million, $3,097 million and $3,028 million in 2012, 2011 and 2010, respectively. Expense for product-related engineering was $268 million, $267 million and $306 million in 2012, 2011 and 2010, respectively.

116 Notes to Consolidated Financial Statements International Business Machines Corporation and Subsidiary Companies
116
Note P. Earnings Per Share of Common StockThe following table presents the computation of basic and diluted earnings per share of common stock.
($ in millions except per share amounts)
For the year ended December 31: 2012 2011 2010
Weighted-average number of shares on which earnings per share calculations are based
Basic 1,142,508,521 1,196,951,006 1,268,789,202
Add—incremental shares under stock-based compensation plans 10,868,426 14,241,131 16,189,053
Add—incremental shares associated with contingently issuable shares 2,072,370 2,575,848 2,377,133
Assuming dilution 1,155,449,317 1,213,767,985 1,287,355,388
Net income on which basic earnings per share is calculated $16,604 $15,855 $14,833
Less—net income applicable to contingently issuable shares (1) 0 0
Net income on which diluted earnings per share is calculated $16,603 $15,855 $14,833
Earnings/(loss) per share of common stock
Assuming dilution $ 14.37 $ 13.06 $ 11.52
Basic $ 14.53 $ 13.25 $ 11.69
There were no stock options outstanding in 2012, 2011 and 2010 that were considered antidilutive and not included in the diluted earnings per share calculation.
Note Q. Rental Expense and Lease CommitmentsRental expense, including amounts charged to inventories and fixed assets, and excluding amounts previously reserved, was $1,767 mil-lion in 2012, $1,836 million in 2011 and $1,727 million in 2010. Rental expense in agreements with rent holidays and scheduled rent increases is recorded on a straight-line basis over the lease term. Contingent rentals are included in the determination of rental expense as accruable. The table below depicts gross minimum
rental commitments under noncancelable leases, amounts related to vacant space associated with infrastructure reductions and spe-cial actions taken through 1994, and in 1999, 2002 and 2005 (previously reserved), sublease income commitments and capital lease commitments. These amounts reflect activities primarily related to office space, as well as manufacturing facilities.
($ in millions)
2013 2014 2015 2016 2017 Beyond 2017
Operating lease commitments
Gross minimum rental commitments (including vacant space below) $1,466 $1,268 $1,044 $746 $535 $747
Vacant space $ 21 $ 13 $ 7 $ 3 $ 1 $ 0
Sublease income commitments $ 26 $ 16 $ 11 $ 9 $ 4 $ 1
Capital lease commitments $ 13 $ 12 $ 11 $ 8 $ 10 $ 6
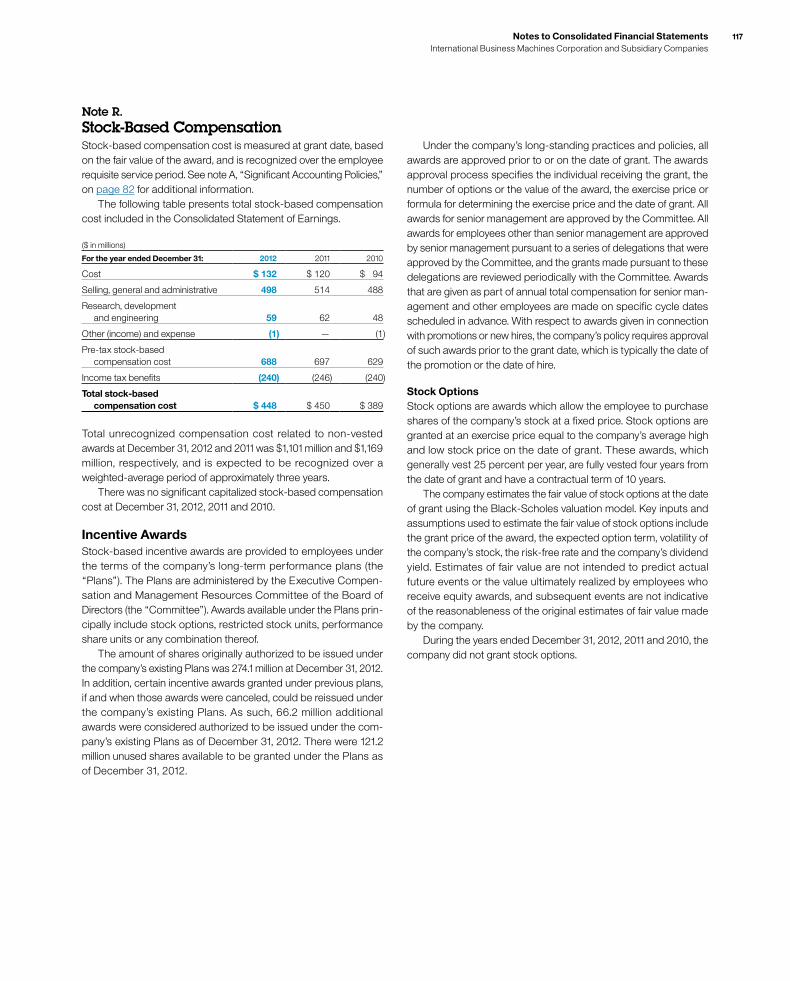
Notes to Consolidated Financial Statements International Business Machines Corporation and Subsidiary Companies
117
Note R. Stock-Based CompensationStock-based compensation cost is measured at grant date, based on the fair value of the award, and is recognized over the employee requisite service period. See note A, “Significant Accounting Policies,” on page 82 for additional information. The following table presents total stock-based compensation cost included in the Consolidated Statement of Earnings.
($ in millions)
For the year ended December 31: 2012 2011 2010
Cost $ 132 $ 120 $ 94
Selling, general and administrative 498 514 488
Research, development and engineering 59 62 48
Other (income) and expense (1) — (1)
Pre-tax stock-based compensation cost 688 697 629
Income tax benefits (240) (246) (240)
Total stock-based compensation cost $ 448 $ 450 $ 389
Total unrecognized compensation cost related to non-vested awards at December 31, 2012 and 2011 was $1,101 million and $1,169 million, respectively, and is expected to be recognized over a weighted-average period of approximately three years. There was no significant capitalized stock-based compensation cost at December 31, 2012, 2011 and 2010.
Incentive AwardsStock-based incentive awards are provided to employees under the terms of the company’s long-term performance plans (the “Plans”). The Plans are administered by the Executive Compen-sation and Management Resources Com mittee of the Board of Directors (the “Committee”). Awards available under the Plans prin-cipally include stock options, restricted stock units, performance share units or any combination thereof. The amount of shares originally authorized to be issued under the company’s existing Plans was 274.1 million at December 31, 2012. In addition, certain incentive awards granted under previous plans, if and when those awards were canceled, could be reissued under the company’s existing Plans. As such, 66.2 million additional awards were considered authorized to be issued under the com-pany’s existing Plans as of December 31, 2012. There were 121.2 million unused shares available to be granted under the Plans as of December 31, 2012.
Under the company’s long-standing practices and policies, all awards are approved prior to or on the date of grant. The awards approval process specifies the individual receiving the grant, the number of options or the value of the award, the exercise price or formula for determining the exercise price and the date of grant. All awards for senior management are approved by the Committee. All awards for employees other than senior management are approved by senior management pursuant to a series of delegations that were approved by the Committee, and the grants made pursuant to these delegations are reviewed periodically with the Committee. Awards that are given as part of annual total compensation for senior man-agement and other employees are made on specific cycle dates scheduled in advance. With respect to awards given in connection with promotions or new hires, the company’s policy requires approval of such awards prior to the grant date, which is typically the date of the promotion or the date of hire.
Stock OptionsStock options are awards which allow the employee to purchase shares of the company’s stock at a fixed price. Stock options are granted at an exercise price equal to the company’s average high and low stock price on the date of grant. These awards, which generally vest 25 percent per year, are fully vested four years from the date of grant and have a contractual term of 10 years. The company estimates the fair value of stock options at the date of grant using the Black-Scholes valuation model. Key inputs and assumptions used to estimate the fair value of stock options include the grant price of the award, the expected option term, volatility of the company’s stock, the risk-free rate and the company’s dividend yield. Estimates of fair value are not intended to predict actual future events or the value ultimately realized by employees who receive equity awards, and subsequent events are not indicative of the reasonableness of the original estimates of fair value made by the company. During the years ended December 31, 2012, 2011 and 2010, the company did not grant stock options.
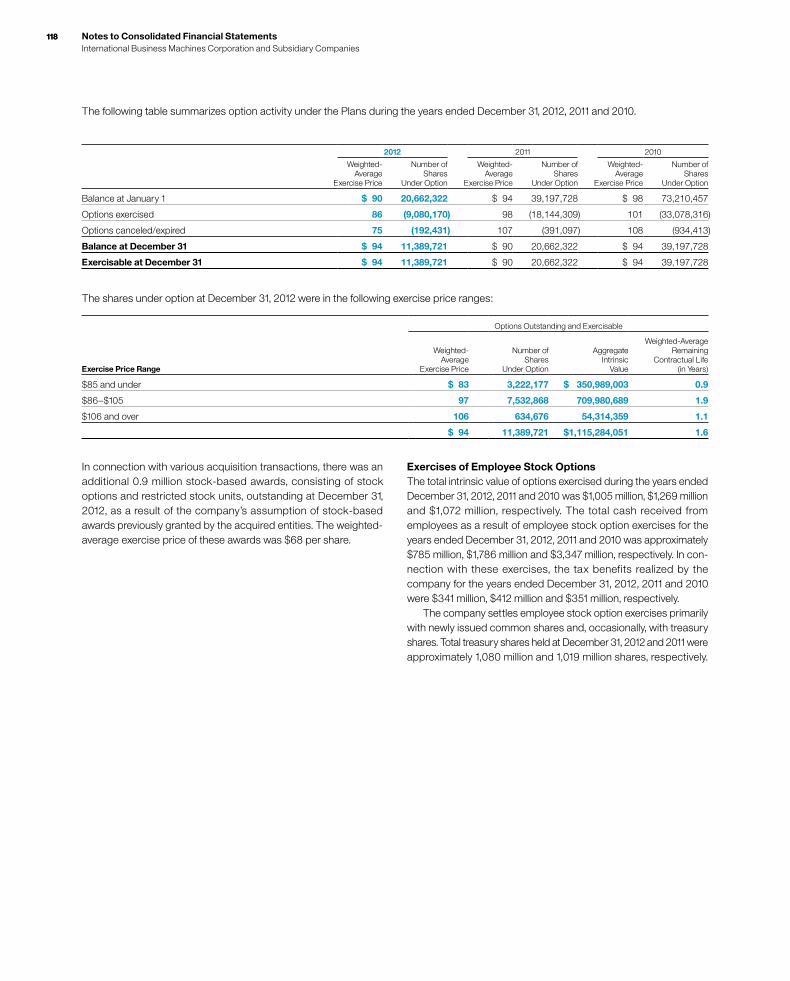
118 Notes to Consolidated Financial Statements International Business Machines Corporation and Subsidiary Companies
118
The following table summarizes option activity under the Plans during the years ended December 31, 2012, 2011 and 2010.
2012 2011 2010
Weighted- Average
Exercise Price
Number of Shares
Under Option
Weighted- Average
Exercise Price
Number of Shares
Under Option
Weighted- Average
Exercise Price
Number of Shares
Under Option
Balance at January 1 $ 90 20,662,322 $ 94 39,197,728 $ 98 73,210,457
Options exercised 86 (9,080,170) 98 (18,144,309) 101 (33,078,316)
Options canceled/expired 75 (192,431) 107 (391,097) 108 (934,413)
Balance at December 31 $ 94 11,389,721 $ 90 20,662,322 $ 94 39,197,728
Exercisable at December 31 $ 94 11,389,721 $ 90 20,662,322 $ 94 39,197,728
The shares under option at December 31, 2012 were in the following exercise price ranges:
Options Outstanding and Exercisable
Exercise Price Range
Weighted- Average
Exercise Price
Number of Shares
Under Option
Aggregate Intrinsic
Value
Weighted-Average Remaining
Contractual Life (in Years)
$85 and under $ 83 3,222,177 $ 350,989,003 0.9
$86 – $105 97 7,532,868 709,980,689 1.9
$106 and over 106 634,676 54,314,359 1.1
$ 94 11,389,721 $1,115,284,051 1.6
In connection with various acquisition transactions, there was an additional 0.9 million stock-based awards, consisting of stock options and restricted stock units, outstanding at December 31, 2012, as a result of the company’s assumption of stock-based awards previously granted by the acquired entities. The weighted-average exercise price of these awards was $68 per share.
Exercises of Employee Stock OptionsThe total intrinsic value of options exercised during the years ended December 31, 2012, 2011 and 2010 was $1,005 million, $1,269 million and $1,072 million, respectively. The total cash received from employees as a result of employee stock option exercises for the years ended December 31, 2012, 2011 and 2010 was approximately $785 million, $1,786 million and $3,347 million, respectively. In con-nection with these exercises, the tax benefits realized by the company for the years ended December 31, 2012, 2011 and 2010 were $341 million, $412 million and $351 million, respectively. The company settles employee stock option exercises primarily with newly issued common shares and, occasionally, with treasury shares. Total treasury shares held at December 31, 2012 and 2011 were approximately 1,080 million and 1,019 million shares, respectively.
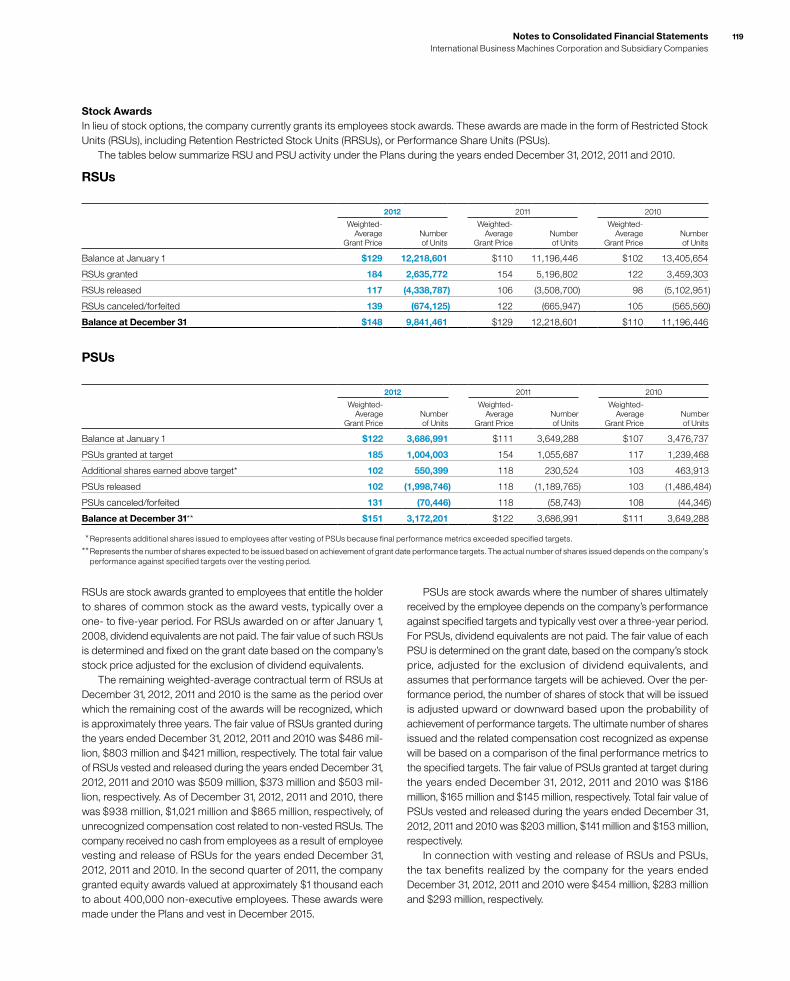
Notes to Consolidated Financial Statements International Business Machines Corporation and Subsidiary Companies
119
RSUs are stock awards granted to employees that entitle the holder to shares of common stock as the award vests, typically over a one- to five-year period. For RSUs awarded on or after January 1, 2008, dividend equivalents are not paid. The fair value of such RSUs is determined and fixed on the grant date based on the company’s stock price adjusted for the exclusion of dividend equivalents. The remaining weighted-average contractual term of RSUs at December 31, 2012, 2011 and 2010 is the same as the period over which the remaining cost of the awards will be recognized, which is approximately three years. The fair value of RSUs granted during the years ended December 31, 2012, 2011 and 2010 was $486 mil-lion, $803 million and $421 million, respectively. The total fair value of RSUs vested and released during the years ended December 31, 2012, 2011 and 2010 was $509 million, $373 million and $503 mil-lion, respectively. As of December 31, 2012, 2011 and 2010, there was $938 million, $1,021 million and $865 million, respectively, of unrecognized compensation cost related to non-vested RSUs. The company received no cash from employees as a result of employee vesting and release of RSUs for the years ended December 31, 2012, 2011 and 2010. In the second quarter of 2011, the company granted equity awards valued at approximately $1 thousand each to about 400,000 non-executive employees. These awards were made under the Plans and vest in December 2015.
PSUs are stock awards where the number of shares ultimately received by the employee depends on the company’s performance against specified targets and typically vest over a three-year period. For PSUs, dividend equivalents are not paid. The fair value of each PSU is determined on the grant date, based on the company’s stock price, adjusted for the exclusion of dividend equivalents, and assumes that performance targets will be achieved. Over the per-formance period, the number of shares of stock that will be issued is adjusted upward or downward based upon the probability of achievement of performance targets. The ultimate number of shares issued and the related compensation cost recognized as expense will be based on a comparison of the final performance metrics to the specified targets. The fair value of PSUs granted at target during the years ended December 31, 2012, 2011 and 2010 was $186 million, $165 million and $145 million, respectively. Total fair value of PSUs vested and released during the years ended December 31, 2012, 2011 and 2010 was $203 million, $141 million and $153 million, respectively. In connection with vesting and release of RSUs and PSUs, the tax benefits realized by the company for the years ended December 31, 2012, 2011 and 2010 were $454 million, $283 million and $293 million, respectively.
Stock AwardsIn lieu of stock options, the company currently grants its employees stock awards. These awards are made in the form of Restricted Stock Units (RSUs), including Retention Restricted Stock Units (RRSUs), or Performance Share Units (PSUs). The tables below summarize RSU and PSU activity under the Plans during the years ended December 31, 2012, 2011 and 2010.
RSUs
2012 2011 2010
Weighted- Average
Grant PriceNumber of Units
Weighted- Average
Grant PriceNumber of Units
Weighted- Average
Grant PriceNumber of Units
Balance at January 1 $129 12,218,601 $110 11,196,446 $102 13,405,654
RSUs granted 184 2,635,772 154 5,196,802 122 3,459,303
RSUs released 117 (4,338,787) 106 (3,508,700) 98 (5,102,951)
RSUs canceled/forfeited 139 (674,125) 122 (665,947) 105 (565,560)
Balance at December 31 $148 9,841,461 $129 12,218,601 $110 11,196,446
PSUs
2012 2011 2010
Weighted- Average
Grant PriceNumber of Units
Weighted- Average
Grant PriceNumber of Units
Weighted- Average
Grant PriceNumber of Units
Balance at January 1 $122 3,686,991 $111 3,649,288 $107 3,476,737
PSUs granted at target 185 1,004,003 154 1,055,687 117 1,239,468
Additional shares earned above target* 102 550,399 118 230,524 103 463,913
PSUs released 102 (1,998,746) 118 (1,189,765) 103 (1,486,484)
PSUs canceled/forfeited 131 (70,446) 118 (58,743) 108 (44,346)
Balance at December 31** $151 3,172,201 $122 3,686,991 $111 3,649,288
* Represents additional shares issued to employees after vesting of PSUs because final performance metrics exceeded specified targets.
** Represents the number of shares expected to be issued based on achievement of grant date performance targets. The actual number of shares issued depends on the company’s performance against specified targets over the vesting period.
120 Notes to Consolidated Financial Statements International Business Machines Corporation and Subsidiary Companies
120
Benefits provided to the PPP participants are calculated using benefit formulas that vary based on the participant. The first method uses a five-year, final pay formula that determines benefits based on salary, years of service, mortality and other participant-specific factors. The second method is a cash balance formula that calcu-lates benefits using a percentage of employees’ annual salary, as well as an interest crediting rate. Benefit accruals under the IBM Personal Pension Plan ceased December 31, 2007 for all participants.
U.S. Supplemental Executive Retention PlanThe company also sponsors a nonqualified U.S. Supplemental Executive Reten tion Plan (Retention Plan). The Retention Plan, which is unfunded, provides benefits to eligible U.S. executives based on average earnings, years of service and age at termination of employment. Benefit accruals under the Retention Plan ceased December 31, 2007 for all participants.
Defined Contribution PlansIBM 401(k) Plus Plan U.S. regular, full-time and part-time employees are eligible to participate in the IBM 401(k) Plus Plan, which is a qualified defined-contribution plan under section 401(k) of the Internal Revenue Code. Effective January 1, 2008, under the IBM 401(k) Plus Plan, eligible employees receive a dollar-for-dollar match of their contributions up to 6 percent of eligible compensation for those hired prior to January 1, 2005, and up to 5 percent of eligible compensation for those hired on or after January 1, 2005. In addition, eligible employees receive automatic contributions from the company equal to 1, 2 or 4 percent of eligible compensation based on their eligibility to participate in the PPP as of December 31, 2007. Employees receive automatic contributions and matching contributions after the completion of one year of service. Further, through June 30, 2009, IBM contributed transition credits to eligible participants’ 401(k) Plus Plan accounts. The amount of the transition credits was based on a participant’s age and service as of June 30, 1999. The company’s matching contributions vest immediately and participants are always fully vested in their own contributions. All contributions, including the company match, are made in cash and invested in accordance with participants’ investment elections. There are no minimum amounts that must be invested in company stock, and there are no restrictions on transferring amounts out of company stock to another investment choice, other than excessive trading rules applicable to such investments. Effective January 1, 2013, matching and automatic contributions are made once annually at the end of the year. In order to receive such contributions each year, a participant must be employed on December 15 of the plan year. However, if a participant separates from service prior to December 15, and has completed certain service and/or age requirements, then the participant will be eligible to receive such matching and automatic contributions following separation from service.
IBM Employees Stock Purchase PlanThe company maintains a non-compensatory Employees Stock Pur chase Plan (ESPP). The ESPP enables eligible participants to purchase full or fractional shares of IBM common stock at a 5 per-cent discount off the average market price on the day of purchase through payroll deductions of up to 10 percent of eligible compensa-tion. Eligible compensation includes any compensation received by the employee during the year. The ESPP provides for offering peri-ods during which shares may be purchased and continues as long as shares remain available under the ESPP, unless terminated earlier at the discretion of the Board of Directors. Individual ESPP partici-pants are restricted from purchasing more than $25,000 of common stock in one calendar year or 1,000 shares in an offering period. Employees purchased 1.6 million, 1.9 million and 2.4 million shares under the ESPP during the years ended December 31, 2012, 2011 and 2010, respectively. Cash dividends declared and paid by the company on its common stock also include cash dividends on the company stock purchased through the ESPP. Dividends are paid on full and fractional shares and can be reinvested in the ESPP. The company stock purchased through the ESPP is considered out-standing and is included in the weighted-average outstanding shares for purposes of computing basic and diluted earnings per share. Approximately 3.8 million, 5.4 million and 7.2 million shares were available for purchase under the ESPP at December 31, 2012, 2011 and 2010, respectively.
Note S. Retirement-Related BenefitsDescription of PlansIBM sponsors defined benefit pension plans and defined contribution plans that cover substantially all regular employees, a supplemental retention plan that covers certain U.S. executives and nonpension postretirement benefit plans primarily consisting of retiree medical and dental benefits for eligible retirees and dependents.
U.S. Plans
Defined Benefit Pension PlansIBM Personal Pension Plan IBM provides U.S. regular, full-time and part-time employees hired prior to January 1, 2005 with noncontributory defined benefit pen-sion benefits via the IBM Personal Pension Plan. Prior to 2008, the IBM Personal Pension Plan consisted of a tax qualified (qualified) plan and a non-tax qualified (nonqualified) plan. Effective January 1, 2008, the nonqualified plan was renamed the Excess Personal Pension Plan (Excess PPP) and the qualified plan is now referred to as the Qualified PPP. The combined plan is now referred to as the PPP. The Qualified PPP is funded by company contributions to an irrevocable trust fund, which is held for the sole benefit of participants and beneficiaries. The Excess PPP, which is unfunded, provides benefits in excess of IRS limitations for qualified plans.
Notes to Consolidated Financial Statements International Business Machines Corporation and Subsidiary Companies
121
IBM Excess 401(k) Plus PlanEffective January 1, 2008, the company replaced the IBM Exec utive Deferred Compensation Plan, an unfunded, nonqualified, defined contribution plan, with the IBM Excess 401(k) Plus Plan (Excess 401(k)), an unfunded, nonqualified defined contribution plan. Employees who are eligible to participate in the 401(k) Plus Plan and whose eligible compensation is expected to exceed the IRS com-pensation limit for qualified plans are eligible to participate in the Excess 401(k). The purpose of the Excess 401(k) is to provide ben-efits that would be provided under the qualified IBM 401(k) Plus Plan if the compensation limits did not apply. Amounts deferred into the Excess 401(k) are record-keeping (notional) accounts and are not held in trust for the participants. Participants in the Excess 401(k) may invest their notional accounts in investments which mirror the primary investment options available under the 401(k) Plus Plan. Participants in the Excess 401(k) are also eligible to receive company match and automatic contributions on eligible compensation deferred into the Excess 401(k) and on com-pensation earned in excess of the Internal Revenue Code pay limit once they have completed one year of service. Through June 30, 2009, eligible participants also received transition credits. Amounts deferred into the Excess 401(k), including company contributions are recorded as liabilities in the Consolidated Statement of Financial Position. Effective January 1, 2013, matching and automatic contri-butions are made once annually at the end of the year. In order to receive such contributions each year, a participant must be employed on December 15 of the plan year. However, if a participant separates from service prior to December 15, and has completed certain service and/or age requirements, then the participant will be eligible to receive such matching and automatic contributions following separation from service.
Nonpension Postretirement Benefit PlanU.S. Nonpension Postretirement Plan The company sponsors a defined benefit nonpension postretire-ment benefit plan that provides medical and dental benefits to eligible U.S. retirees and eligible dependents, as well as life insurance for eligible U.S. retirees. Effective July 1, 1999, the company estab-lished a Future Health Account (FHA) for employees who were more than five years from retirement eligibility. Employees who were within five years of retirement eligibility are covered under the company’s prior retiree health benefits arrangements. Under either the FHA or the prior retiree health benefit arrangements, there is a maximum cost to the company for retiree health benefits. Since January 1, 2004, new hires, as of that date or later, are not eligible for company subsidized nonpension postretirement benefits.
Non-U.S. PlansMost subsidiaries and branches outside the United States sponsor defined benefit and/or defined contribution plans that cover sub-stantially all regular employees. The company deposits funds under various fiduciary-type arrangements, purchases annuities under group contracts or provides reserves for these plans. Benefits under the defined benefit plans are typically based either on years of service and the employee’s compensation (generally during a fixed number of years immediately before retirement) or on annual credits. The range of assumptions that are used for the non-U.S. defined benefit plans reflect the different economic environments within the various countries. In addition, certain of the company’s non-U.S. subsidiaries spon-sor nonpension postretirement benefit plans that provide medical and dental benefits to eligible non-U.S. retirees and eligible depen-dents, as well as life insurance for certain eligible non-U.S. retirees. However, most non-U.S. retirees are covered by local government-sponsored and -administered programs.

122 Notes to Consolidated Financial Statements International Business Machines Corporation and Subsidiary Companies
122
Plan Financial Information
Summary of Financial InformationThe following table presents a summary of the total retirement-related benefits net periodic (income)/cost recorded in the Consolidated Statement of Earnings.
($ in millions)
U.S. Plans Non-U.S. Plans Total
For the year ended December 31: 2012 2011 2010 2012 2011 2010 2012 2011 2010
Defined benefit pension plans $(526) $(774) $(949) $1,040 $ 734 $ 541 $ 515 $ (40) $ (408)
Retention Plan 18 15 14 — — — 18 15 14
Total defined benefit pension plans (income)/cost $(507) $(759) $(935) $1,040 $ 734 $ 541 $ 533 $ (25) $ (394)
IBM 401(k) Plus Plan and Non-U.S. plans $ 857 $ 875 $ 882 $ 621 $ 608 $ 527 $1,478 $1,483 $1,409
Excess 401(k) 29 30 20 — — — 29 30 20
Total defined contribution plans cost $ 885 $ 905 $ 902 $ 621 $ 608 $ 527 $1,506 $1,513 $1,430
Nonpension postretirement benefit plans cost $ 268 $ 269 $ 281 $ 82 $ 76 $ 66 $ 350 $ 345 $ 347
Total retirement-related benefits net periodic cost $ 646 $ 415 $ 248 $1,743 $1,418 $1,134 $2,389 $1,832 $1,382
The following table presents a summary of the total PBO for defined benefit pension plans, APBO for nonpension postretirement benefit plans, fair value of plan assets and the associated funded status recorded in the Consolidated Statement of Financial Position.
($ in millions)
Benefit Obligations Fair Value of Plan Assets Funded Status*At December 31: 2012 2011 2012 2011 2012 2011
U.S. Plans
Underfunded plans
Qualified PPP $ 54,907 $52,318 $53,630 $51,218 $ (1,277) $ (1,100)
Excess PPP 1,576 1,462 — — (1,576) (1,462)
Retention Plan 327 305 — — (327) (305)
Nonpension postretirement benefit plan 5,282 5,273 433 38 (4,849) (5,235)
Total underfunded U.S. plans $ 62,092 $59,358 $54,063 $51,256 $ (8,029) $ (8,102)
Non-U.S. Plans
Overfunded plans
Qualified defined benefit pension plans $ 6,944 $13,169 $ 7,889 $16,011 $ 945 $ 2,843
Nonpension postretirement benefit plans 12 7 12 7 0 0
Total overfunded non-U.S. plans $ 6,956 $13,175 $ 7,901 $16,018 $ 945 $ 2,843
Underfunded plans
Qualified defined benefit pension plans $ 35,956 $24,659 $30,169 $19,351 $ (5,788) $ (5,308)
Nonqualified defined benefit pension plans 6,418 5,033 — — (6,418) (5,033)
Nonpension postretirement benefit plans 1,007 894 107 105 (900) (789)
Total underfunded non-U.S. plans $ 43,381 $30,587 $30,276 $19,456 $(13,106) $(11,131)
Total overfunded plans $ 6,956 $13,175 $ 7,901 $16,018 $ 945 $ 2,843
Total underfunded plans $105,473 $89,944 $84,338 $70,712 $(21,134) $(19,232)
* Funded status is recognized in the Consolidated Statement of Financial Position as follows: Asset amounts as prepaid pension assets; (Liability) amounts as compensation and benefits (current liability) and retirement and nonpension postretirement benefit obligations (noncurrent liability).
At December 31, 2012, the company’s qualified defined benefit pension plans worldwide were 94 percent funded compared to the benefit obligations, with the U.S. qualified PPP 98 percent funded. Overall, including nonqualifed plans, the company’s defined benefit pension plans were 86 percent funded.
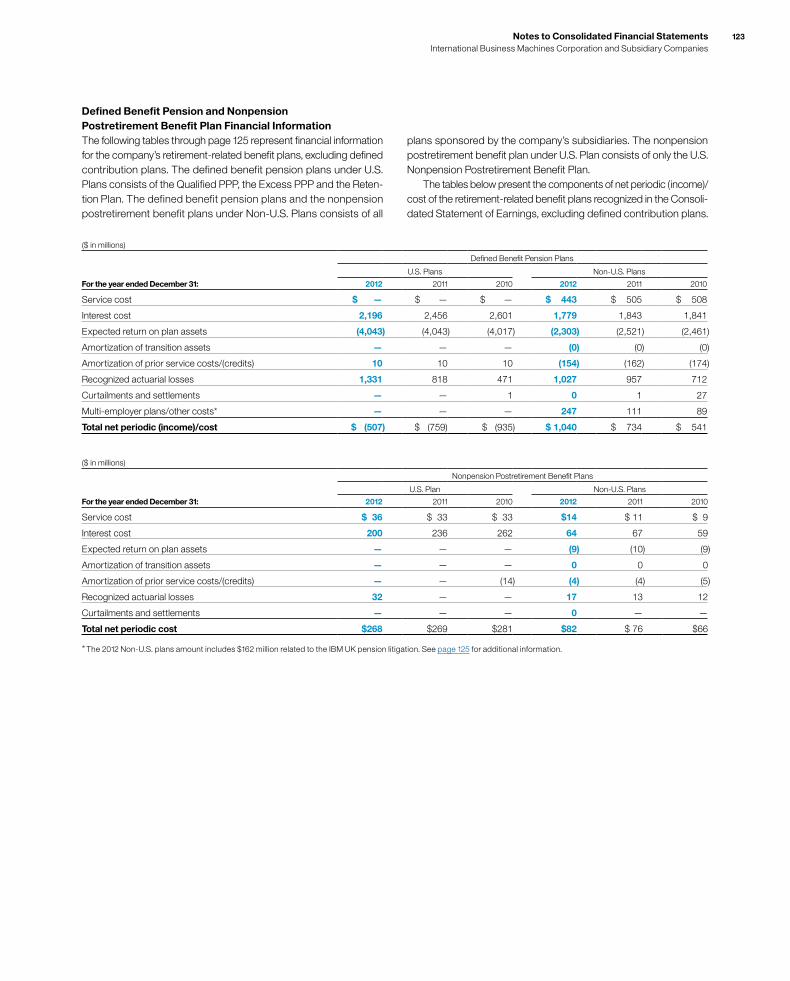
Notes to Consolidated Financial Statements International Business Machines Corporation and Subsidiary Companies
123
Defined Benefit Pension and Nonpension Postretirement Benefit Plan Financial InformationThe following tables through page 125 represent financial information for the company’s retirement-related benefit plans, excluding defined contribution plans. The defined benefit pension plans under U.S. Plans consists of the Qualified PPP, the Excess PPP and the Reten-tion Plan. The defined benefit pension plans and the nonpension postretirement benefit plans under Non-U.S. Plans consists of all
plans sponsored by the company’s subsidiaries. The nonpension postretirement benefit plan under U.S. Plan consists of only the U.S. Non pension Postretirement Benefit Plan. The tables below present the components of net periodic (income)/cost of the retirement-related benefit plans recognized in the Consoli-dated Statement of Earnings, excluding defined contribution plans.
($ in millions)
Defined Benefit Pension Plans
U.S. Plans Non-U.S. Plans
For the year ended December 31: 2012 2011 2010 2012 2011 2010
Service cost $ — $ — $ — $ 443 $ 505 $ 508
Interest cost 2,196 2,456 2,601 1,779 1,843 1,841
Expected return on plan assets (4,043) (4,043) (4,017) (2,303) (2,521) (2,461)
Amortization of transition assets — — — (0) (0) (0)
Amortization of prior service costs/(credits) 10 10 10 (154) (162) (174)
Recognized actuarial losses 1,331 818 471 1,027 957 712
Curtailments and settlements — — 1 0 1 27
Multi-employer plans/other costs* — — — 247 111 89
Total net periodic (income)/cost $ (507) $ (759) $ (935) $ 1,040 $ 734 $ 541
($ in millions)
Nonpension Postretirement Benefit Plans
U.S. Plan Non-U.S. Plans
For the year ended December 31: 2012 2011 2010 2012 2011 2010
Service cost $ 36 $ 33 $ 33 $14 $ 11 $ 9
Interest cost 200 236 262 64 67 59
Expected return on plan assets — — — (9) (10) (9)
Amortization of transition assets — — — 0 0 0
Amortization of prior service costs/(credits) — — (14) (4) (4) (5)
Recognized actuarial losses 32 — — 17 13 12
Curtailments and settlements — — — 0 — —
Total net periodic cost $268 $269 $281 $82 $ 76 $66
* The 2012 Non-U.S. plans amount includes $162 million related to the IBM UK pension litigation. See page 125 for additional information.
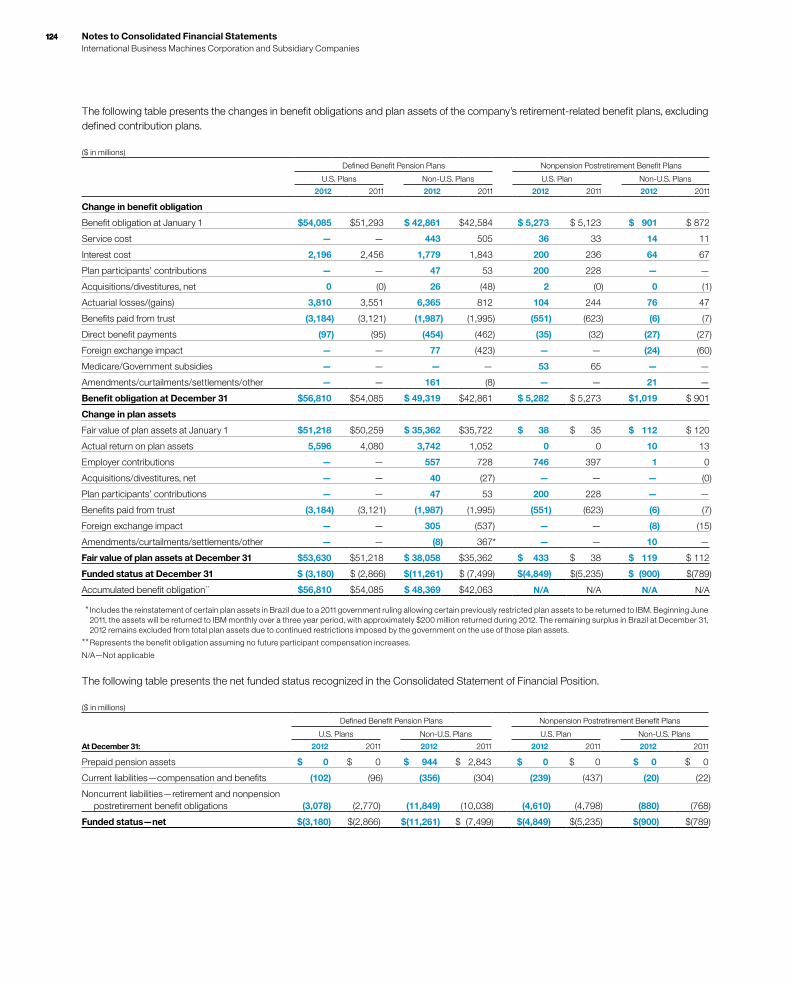
124 Notes to Consolidated Financial Statements International Business Machines Corporation and Subsidiary Companies
124
The following table presents the changes in benefit obligations and plan assets of the company’s retirement-related benefit plans, excluding defined contribution plans.
($ in millions)
Defined Benefit Pension Plans Nonpension Postretirement Benefit Plans
U.S. Plans Non-U.S. Plans U.S. Plan Non-U.S. Plans
2012 2011 2012 2011 2012 2011 2012 2011
Change in benefit obligation
Benefit obligation at January 1 $54,085 $51,293 $ 42,861 $42,584 $ 5,273 $ 5,123 $ 901 $ 872
Service cost — — 443 505 36 33 14 11
Interest cost 2,196 2,456 1,779 1,843 200 236 64 67
Plan participants’ contributions — — 47 53 200 228 — —
Acquisitions/divestitures, net 0 (0) 26 (48) 2 (0) 0 (1)
Actuarial losses/(gains) 3,810 3,551 6,365 812 104 244 76 47
Benefits paid from trust (3,184) (3,121) (1,987) (1,995) (551) (623) (6) (7)
Direct benefit payments (97) (95) (454) (462) (35) (32) (27) (27)
Foreign exchange impact — — 77 (423) — — (24) (60)
Medicare/Government subsidies — — — — 53 65 — —
Amendments/curtailments/settlements/other — — 161 (8) — — 21 —
Benefit obligation at December 31 $56,810 $54,085 $ 49,319 $42,861 $ 5,282 $ 5,273 $1,019 $ 901
Change in plan assets
Fair value of plan assets at January 1 $51,218 $50,259 $ 35,362 $35,722 $ 38 $ 35 $ 112 $ 120
Actual return on plan assets 5,596 4,080 3,742 1,052 0 0 10 13
Employer contributions — — 557 728 746 397 1 0
Acquisitions/divestitures, net — — 40 (27) — — — (0)
Plan participants’ contributions — — 47 53 200 228 — —
Benefits paid from trust (3,184) (3,121) (1,987) (1,995) (551) (623) (6) (7)
Foreign exchange impact — — 305 (537) — — (8) (15)
Amendments/curtailments/settlements/other — — (8) 367* — — 10 —
Fair value of plan assets at December 31 $53,630 $51,218 $ 38,058 $35,362 $ 433 $ 38 $ 119 $ 112
Funded status at December 31 $ (3,180) $ (2,866) $(11,261) $ (7,499) $(4,849) $(5,235) $ (900) $(789)
Accumulated benefit obligation** $56,810 $54,085 $ 48,369 $42,063 N/A N/A N/A N/A
* Includes the reinstatement of certain plan assets in Brazil due to a 2011 government ruling allowing certain previously restricted plan assets to be returned to IBM. Beginning June 2011, the assets will be returned to IBM monthly over a three year period, with approximately $200 million returned during 2012. The remaining surplus in Brazil at December 31, 2012 remains excluded from total plan assets due to continued restrictions imposed by the government on the use of those plan assets.
** Represents the benefit obligation assuming no future participant compensation increases.
N/A—Not applicable
The following table presents the net funded status recognized in the Consolidated Statement of Financial Position.
($ in millions)
Defined Benefit Pension Plans Nonpension Postretirement Benefit Plans
U.S. Plans Non-U.S. Plans U.S. Plan Non-U.S. Plans
At December 31: 2012 2011 2012 2011 2012 2011 2012 2011
Prepaid pension assets $ 0 $ 0 $ 944 $ 2,843 $ 0 $ 0 $ 0 $ 0
Current liabilities—compensation and benefits (102) (96) (356) (304) (239) (437) (20) (22)
Noncurrent liabilities—retirement and nonpension postretirement benefit obligations (3,078) (2,770) (11,849) (10,038) (4,610) (4,798) (880) (768)
Funded status—net $(3,180) $(2,866) $(11,261) $ (7,499) $(4,849) $(5,235) $(900) $(789)
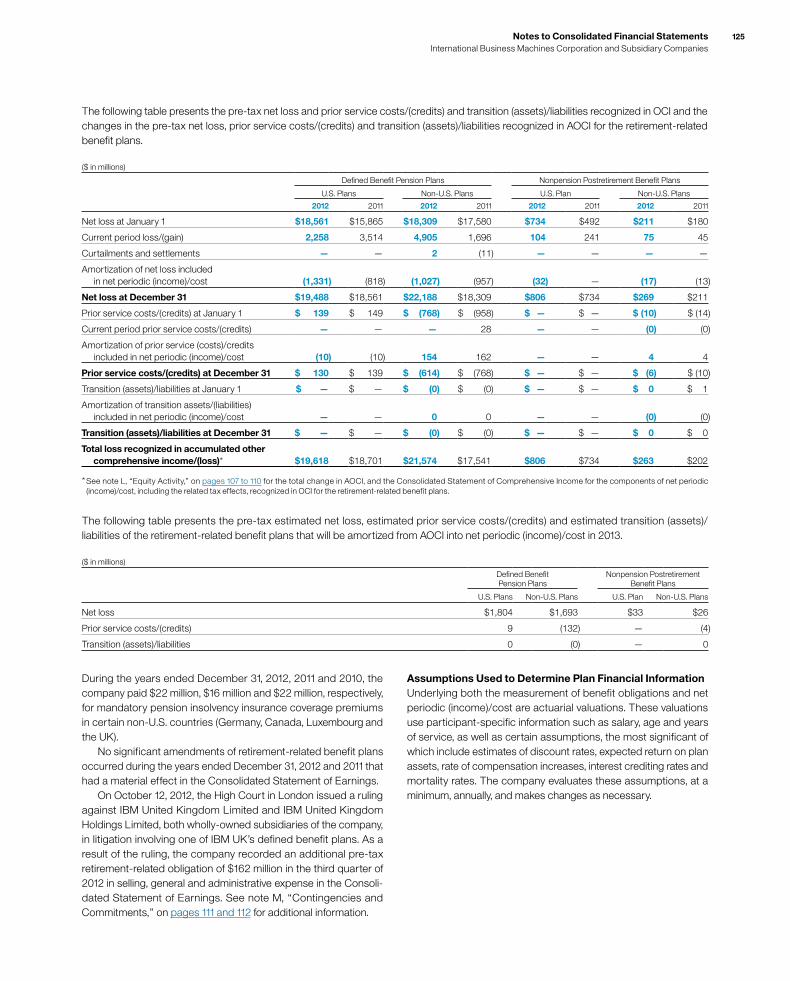
Notes to Consolidated Financial Statements International Business Machines Corporation and Subsidiary Companies
125
The following table presents the pre-tax net loss and prior service costs/(credits) and transition (assets)/liabilities recognized in OCI and the changes in the pre-tax net loss, prior service costs/(credits) and transition (assets)/liabilities recognized in AOCI for the retirement-related benefit plans.
($ in millions)
Defined Benefit Pension Plans Nonpension Postretirement Benefit Plans
U.S. Plans Non-U.S. Plans U.S. Plan Non-U.S. Plans
2012 2011 2012 2011 2012 2011 2012 2011
Net loss at January 1 $18,561 $15,865 $18,309 $17,580 $734 $492 $211 $180
Current period loss/(gain) 2,258 3,514 4,905 1,696 104 241 75 45
Curtailments and settlements — — 2 (11) — — — —
Amortization of net loss included in net periodic (income)/cost (1,331) (818) (1,027) (957) (32) — (17) (13)
Net loss at December 31 $19,488 $18,561 $22,188 $18,309 $806 $734 $269 $211
Prior service costs/(credits) at January 1 $ 139 $ 149 $ (768) $ (958) $ — $ — $ (10) $ (14)
Current period prior service costs/(credits) — — — 28 — — (0) (0)
Amortization of prior service (costs)/credits included in net periodic (income)/cost (10) (10) 154 162 — — 4 4
Prior service costs/(credits) at December 31 $ 130 $ 139 $ (614) $ (768) $ — $ — $ (6) $ (10)
Transition (assets)/liabilities at January 1 $ — $ — $ (0) $ (0) $ — $ — $ 0 $ 1
Amortization of transition assets/(liabilities) included in net periodic (income)/cost — — 0 0 — — (0) (0)
Transition (assets)/liabilities at December 31 $ — $ — $ (0) $ (0) $ — $ — $ 0 $ 0
Total loss recognized in accumulated other comprehensive income/(loss)* $19,618 $18,701 $21,574 $17,541 $806 $734 $263 $202
* See note L, “Equity Activity,” on pages 107 to 110 for the total change in AOCI, and the Consolidated Statement of Comprehensive Income for the components of net periodic (income)/cost, including the related tax effects, recognized in OCI for the retirement-related benefit plans.
The following table presents the pre-tax estimated net loss, estimated prior service costs/(credits) and estimated transition (assets)/ liabilities of the retirement-related benefit plans that will be amortized from AOCI into net periodic (income)/cost in 2013.
($ in millions)
Defined Benefit Pension Plans
Nonpension Postretirement Benefit Plans
U.S. Plans Non-U.S. Plans U.S. Plan Non-U.S. Plans
Net loss $1,804 $1,693 $33 $26
Prior service costs/(credits) 9 (132) — (4)
Transition (assets)/liabilities 0 (0) — 0
During the years ended December 31, 2012, 2011 and 2010, the company paid $22 million, $16 million and $22 million, respectively, for mandatory pension insolvency insurance coverage premiums in certain non-U.S. countries (Germany, Canada, Luxembourg and the UK). No significant amendments of retirement-related benefit plans occurred during the years ended December 31, 2012 and 2011 that had a material effect in the Consolidated Statement of Earnings. On October 12, 2012, the High Court in London issued a ruling against IBM United Kingdom Limited and IBM United Kingdom Holdings Limited, both wholly-owned subsidiaries of the company, in litigation involving one of IBM UK’s defined benefit plans. As a result of the ruling, the company recorded an additional pre-tax retirement-related obligation of $162 million in the third quarter of 2012 in selling, general and administrative expense in the Consoli-dated Statement of Earnings. See note M, “Contingencies and Commitments,” on pages 111 and 112 for additional information.
Assumptions Used to Determine Plan Financial InformationUnderlying both the measurement of benefit obligations and net periodic (income)/cost are actuarial valuations. These valuations use participant-specific information such as salary, age and years of service, as well as certain assumptions, the most significant of which include estimates of discount rates, expected return on plan assets, rate of compensation increases, interest crediting rates and mortality rates. The company evaluates these assumptions, at a minimum, annually, and makes changes as necessary.
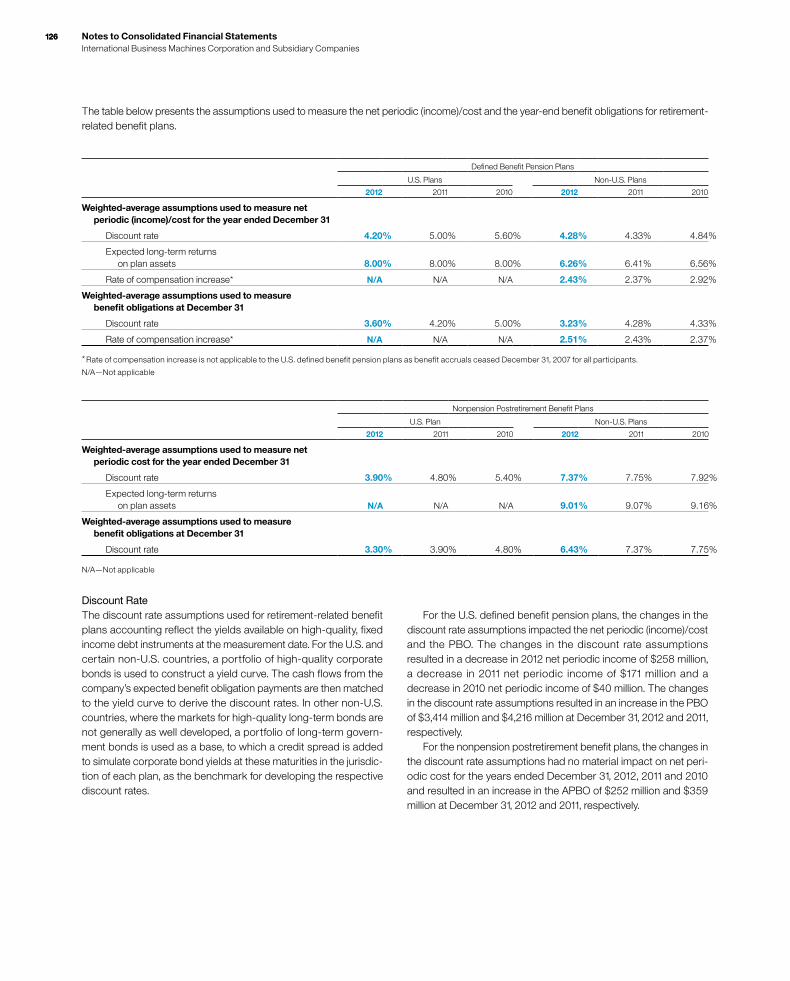
126 Notes to Consolidated Financial Statements International Business Machines Corporation and Subsidiary Companies
126
The table below presents the assumptions used to measure the net periodic (income)/cost and the year-end benefit obligations for retirement-related benefit plans.
Defined Benefit Pension Plans
U.S. Plans Non-U.S. Plans
2012 2011 2010 2012 2011 2010
Weighted-average assumptions used to measure net periodic (income)/cost for the year ended December 31
Discount rate 4.20% 5.00% 5.60% 4.28% 4.33% 4.84%
Expected long-term returns on plan assets 8.00% 8.00% 8.00% 6.26% 6.41% 6.56%
Rate of compensation increase* N/A N/A N/A 2.43% 2.37% 2.92%
Weighted-average assumptions used to measure benefit obligations at December 31
Discount rate 3.60% 4.20% 5.00% 3.23% 4.28% 4.33%
Rate of compensation increase* N/A N/A N/A 2.51% 2.43% 2.37%
* Rate of compensation increase is not applicable to the U.S. defined benefit pension plans as benefit accruals ceased December 31, 2007 for all participants.
N/A—Not applicable
Nonpension Postretirement Benefit Plans
U.S. Plan Non-U.S. Plans
2012 2011 2010 2012 2011 2010
Weighted-average assumptions used to measure net periodic cost for the year ended December 31
Discount rate 3.90% 4.80% 5.40% 7.37% 7.75% 7.92%
Expected long-term returns on plan assets N/A N/A N/A 9.01% 9.07% 9.16%
Weighted-average assumptions used to measure benefit obligations at December 31
Discount rate 3.30% 3.90% 4.80% 6.43% 7.37% 7.75%
N/A—Not applicable
Discount RateThe discount rate assumptions used for retirement-related benefit plans accounting reflect the yields available on high-quality, fixed income debt instruments at the measurement date. For the U.S. and certain non-U.S. countries, a portfolio of high-quality corporate bonds is used to construct a yield curve. The cash flows from the company’s expected benefit obligation payments are then matched to the yield curve to derive the discount rates. In other non-U.S. countries, where the markets for high-quality long-term bonds are not generally as well developed, a portfolio of long-term govern-ment bonds is used as a base, to which a credit spread is added to simulate corporate bond yields at these maturities in the jurisdic-tion of each plan, as the benchmark for developing the respective discount rates.
For the U.S. defined benefit pension plans, the changes in the discount rate assumptions impacted the net periodic (income)/cost and the PBO. The changes in the discount rate assumptions resulted in a decrease in 2012 net periodic income of $258 million, a decrease in 2011 net periodic income of $171 million and a decrease in 2010 net periodic income of $40 million. The changes in the discount rate assumptions resulted in an increase in the PBO of $3,414 million and $4,216 million at December 31, 2012 and 2011, respectively. For the nonpension postretirement benefit plans, the changes in the discount rate assumptions had no material impact on net peri-odic cost for the years ended December 31, 2012, 2011 and 2010 and resulted in an increase in the APBO of $252 million and $359 million at December 31, 2012 and 2011, respectively.
Notes to Consolidated Financial Statements International Business Machines Corporation and Subsidiary Companies
127
Expected Long-Term Returns on Plan AssetsExpected returns on plan assets, a component of net periodic (income)/cost, represent the expected long-term returns on plan assets based on the calculated market-related value of plan assets. Expected long-term returns on plan assets take into account long-term expectations for future returns and the investment policies and strategies as described on page 128. These rates of return are devel-oped by the company and are tested for reasonableness against historical returns. The use of expected long-term returns on plan assets may result in recognized pension income that is greater or less than the actual returns of those plan assets in any given year. Over time, however, the expected long-term returns are designed to approximate the actual long-term returns, and therefore result in a pattern of income and cost recognition that more closely matches the pattern of the services provided by the employees. Differences between actual and expected returns are recognized as a compo-nent of net loss or gain in AOCI, which is amortized as a component of net periodic (income)/cost over the service lives or life expectancy of the plan participants, depending on the plan, provided such amounts exceed certain thresholds provided by accounting standards. The market-related value of plan assets recognizes changes in the fair value of plan assets systematically over a five-year period in the expected return on plan assets line in net periodic (income)/cost. For the U.S. defined benefit pension plan, the Qualified PPP, the expected long-term rate of return on plan assets of 8.00 percent remained constant for the years ended December 31, 2012, 2011 and 2010 and, consequently, had no incremental impact on net periodic (income)/cost. For the nonpension postretirement benefit plans, the company maintains a highly liquid trust fund balance to ensure timely pay-ments are made. As a result, for the years ended December 31, 2012, 2011 and 2010, the expected long-term return on plan assets and the actual return on those assets were not material.
Rate of Compensation Increases and Mortality RateThe rate of compensation increases is determined by the com pany, based upon its long-term plans for such increases. The rate of compensation increase is not applicable to the U.S. defined benefit pension plans as benefit accruals ceased December 31, 2007 for all participants. Mortality rate assumptions are based on life expec-tancy and death rates for different types of participants. Mortality rates are periodically updated based on actual experience.
Interest Crediting RateBenefits for certain participants in the PPP are calculated using a cash balance formula. An assumption underlying this formula is an interest crediting rate, which impacts both net periodic (income)/cost and the PBO. This assumption provides a basis for projecting the expected interest rate that participants will earn on the benefits that they are expected to receive in the following year and is based on the average from August to October of the one-year U.S. Treasury Constant Maturity yield plus one percent. For the PPP, the change in the interest crediting rate to 1.1 percent for the year ended December 31, 2012, from 1.3 percent for the year ended December 31, 2011, resulted in an increase in 2012 net periodic income of $10 million. The change in the interest crediting rate to 1.3 percent for the year ended December 31, 2011, from 1.4 percent for the year ended December 31, 2010, resulted in an increase in 2011 net periodic income of $4 million. The change in the interest crediting rate to 1.4 percent for the year ended December 31, 2010, from 2.8 percent for the year ended December 31, 2009, resulted in an increase in 2010 net periodic income of $62 million.
Healthcare Cost Trend RateFor nonpension postretirement benefit plan accounting, the com-pany reviews external data and its own historical trends for healthcare costs to determine the healthcare cost trend rates. How-ever, the healthcare cost trend rate has an insignificant effect on plan costs and obligations as a result of the terms of the plan which limit the company’s obligation to the participants. The company assumes that the healthcare cost trend rate for 2013 will be 7.0 per-cent. In addition, the company assumes that the same trend rate will decrease to 5 percent over the next four years. A one percentage point increase or decrease in the assumed healthcare cost trend rate would not have had a material effect on 2012, 2011 and 2010 net periodic cost or the benefit obligations as of December 31, 2012 and 2011.
Healthcare LegislationThe expected effects of the U.S. healthcare reform legislation enacted in March 2010 were incorporated into the remeasurements of the U.S. nonpension postretirement benefit plan at December 31, 2012 and 2011. The impact was insignificant as a result of the terms of the plan which limit the company’s obligation to the participants.
Plan AssetsRetirement-related benefit plan assets are recognized and mea-sured at fair value as described in note A, “Significant Accounting Policies,” on page 84. Because of the inherent uncertainty of valuations, these fair value measurements may not necessarily reflect the amounts the company could realize in current market transactions.
128 Notes to Consolidated Financial Statements International Business Machines Corporation and Subsidiary Companies
128
Investment Policies and StrategiesThe investment objectives of the Qualified PPP portfolio are designed to generate returns that will enable the plan to meet its future obligations. The precise amount for which these obligations will be settled depends on future events, including the retirement dates and life expectancy of the plans’ participants. The obliga-tions are estimated using actuarial assumptions, based on the current economic environment and other pertinent factors described on pages 125 to 127. The Qualified PPP portfolio’s investment strat-egy balances the requirement to generate returns, using potentially higher yielding assets such as equity securities, with the need to control risk in the portfolio with less volatile assets, such as fixed income securities. Risks include, among others, inflation, volatility in equity values and changes in interest rates that could cause the plan to become underfunded, thereby increasing its dependence on contributions from the company. To mitigate any potential concen-tration risk, careful consideration is given to balancing the portfolio among industry sectors, companies and geographies, taking into account interest rate sensitivity, dependence on economic growth, currency and other factors that affect investment returns. As a result, the Qualified PPP portfolio’s target allocation is 43 percent equity securities, 47 percent fixed income securities, 5 percent real estate and 5 percent other investments, which is consistent with the alloca-tion decisions made by the company’s management and is similar to the prior year target allocation. The table on page 129 details the actual equity, fixed income, real estate and other types of invest-ments in the Qualified PPP portfolio. The assets are managed by professional investment firms and investment professionals who are employees of the company. They are bound by investment mandates determined by the company’s man-agement and are measured against specific benchmarks. Among these managers, consideration is given, but not limited to, balancing security concentration, issuer concentration, investment style and reliance on particular active and passive investment strategies. Market liquidity risks are tightly controlled, with $6,946 million of the Qualified PPP portfolio invested in private market assets consisting of private equities and private real estate investments, which are less liquid than publicly traded securities. As of December 31, 2012, the Qualified PPP portfolio had $2,509 million in commit-ments for future investments in private markets to be made over a number of years. These commitments are expected to be funded from plan assets.
Derivatives are used as an effective means to achieve investment objectives and/or as a component of the plan’s risk management strategy. The primary reasons for the use of derivatives are fixed income management, including duration, interest rate management and credit exposure, cash equitization and to manage currency and commodity strategies. Outside the U.S., the investment objectives are similar to those described above, subject to local regulations. The weighted-average target allocation for the non-U.S. plans is 35 percent equity securi-ties, 54 percent fixed income securities, 2 percent real estate and 9 percent other investments, which is consistent with the allocation decisions made by the company’s management. The table on page 129 details the actual equity, fixed income, real estate and other types of investments for non-U.S. plans. In some countries, a higher percentage allocation to fixed income is required to manage sol-vency and funding risks. In others, the responsibility for managing the investments typically lies with a board that may include up to 50 percent of members elected by employees and retirees. This can result in slight differences compared with the strategies previously described. Generally, these non-U.S. plans do not invest in illiquid assets and their use of derivatives is consistent with the U.S. plan and mainly for currency hedging, interest rate risk management, credit exposure and alternative investment strategies. The company’s defined benefit pension plans include invest-ments in certain European government securities. At December 31, 2012, the U.S. plan held $847 million and the non-U.S. plans held approximately $11 billion in European sovereign debt invest-ments, primarily in AAA-rated securities. Investments in government debt securities in Italy, Spain and Ireland were de minimis in the U.S. plan and represented less than 1 percent of total non-U.S. plan assets. The plans hold no direct investments in government debt securities of Greece and Portugal. The company’s nonpension postretirement benefit plans are underfunded or unfunded. For some plans, the company maintains a nominal, highly liquid trust fund balance to ensure timely benefit payments.
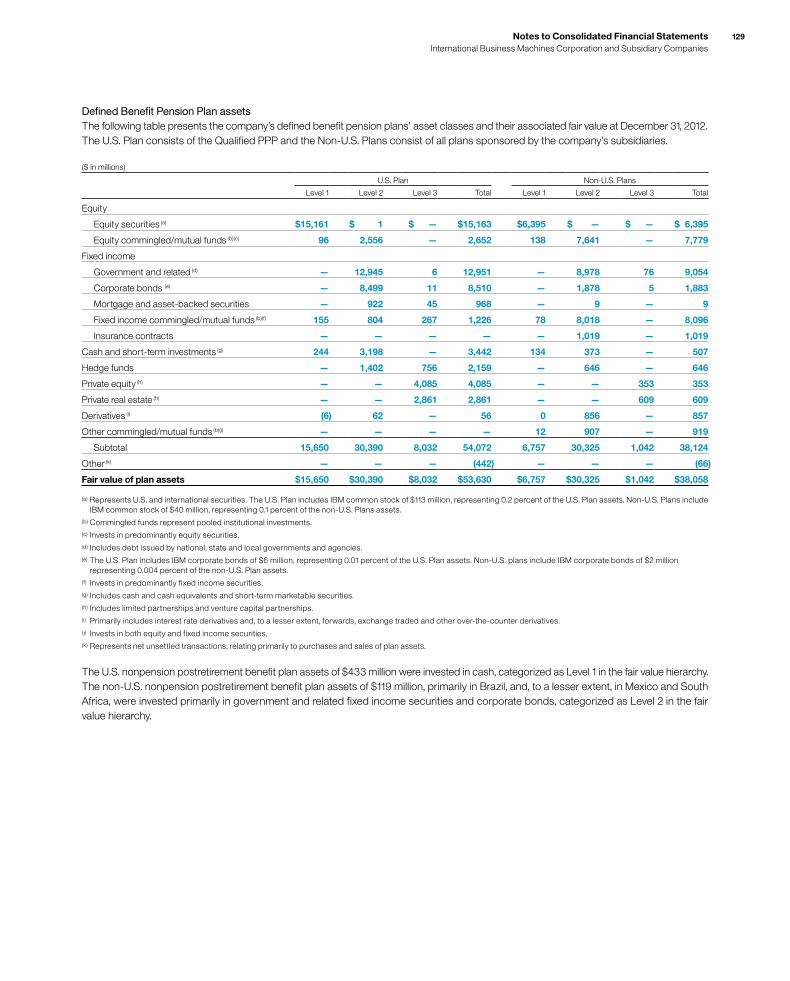
Notes to Consolidated Financial Statements International Business Machines Corporation and Subsidiary Companies
129
Defined Benefit Pension Plan assetsThe following table presents the company’s defined benefit pension plans’ asset classes and their associated fair value at December 31, 2012. The U.S. Plan consists of the Qualified PPP and the Non-U.S. Plans consist of all plans sponsored by the company’s subsidiaries.
($ in millions)
U.S. Plan Non-U.S. Plans
Level 1 Level 2 Level 3 Total Level 1 Level 2 Level 3 Total
Equity
Equity securities (a) $15,161 $ 1 $ — $15,163 $6,395 $ — $ — $ 6,395
Equity commingled/mutual funds (b)(c) 96 2,556 — 2,652 138 7,641 — 7,779
Fixed income
Government and related (d) — 12,945 6 12,951 — 8,978 76 9,054
Corporate bonds (e) — 8,499 11 8,510 — 1,878 5 1,883
Mortgage and asset-backed securities — 922 45 968 — 9 — 9
Fixed income commingled/mutual funds (b)(f) 155 804 267 1,226 78 8,018 — 8,096
Insurance contracts — — — — — 1,019 — 1,019
Cash and short-term investments (g) 244 3,198 — 3,442 134 373 — 507
Hedge funds — 1,402 756 2,159 — 646 — 646
Private equity (h) — — 4,085 4,085 — — 353 353
Private real estate (h) — — 2,861 2,861 — — 609 609
Derivatives (i) (6) 62 — 56 0 856 — 857
Other commingled/mutual funds (b)(j) — — — — 12 907 — 919
Subtotal 15,650 30,390 8,032 54,072 6,757 30,325 1,042 38,124
Other (k) — — — (442) — — — (66)
Fair value of plan assets $15,650 $30,390 $8,032 $53,630 $6,757 $30,325 $1,042 $38,058
(a) Represents U.S. and international securities. The U.S. Plan includes IBM common stock of $113 million, representing 0.2 percent of the U.S. Plan assets. Non-U.S. Plans include IBM common stock of $40 million, representing 0.1 percent of the non-U.S. Plans assets.
(b) Commingled funds represent pooled institutional investments.(c) Invests in predominantly equity securities.(d) Includes debt issued by national, state and local governments and agencies.(e) The U.S. Plan includes IBM corporate bonds of $6 million, representing 0.01 percent of the U.S. Plan assets. Non-U.S. plans include IBM corporate bonds of $2 million representing 0.004 percent of the non-U.S. Plan assets.(f) Invests in predominantly fixed income securities.(g) Includes cash and cash equivalents and short-term marketable securities.(h) Includes limited partnerships and venture capital partnerships.(i) Primarily includes interest rate derivatives and, to a lesser extent, forwards, exchange traded and other over-the-counter derivatives. ( j) Invests in both equity and fixed income securities. (k) Represents net unsettled transactions, relating primarily to purchases and sales of plan assets.
The U.S. nonpension postretirement benefit plan assets of $433 million were invested in cash, categorized as Level 1 in the fair value hierarchy. The non-U.S. nonpension postretirement benefit plan assets of $119 million, primarily in Brazil, and, to a lesser extent, in Mexico and South Africa, were invested primarily in government and related fixed income securities and corporate bonds, categorized as Level 2 in the fair value hierarchy.

130 Notes to Consolidated Financial Statements International Business Machines Corporation and Subsidiary Companies
130
The following table presents the company’s defined benefit pension plans’ asset classes and their associated fair value at December 31, 2011. The U.S. Plan consists of the Qualified PPP and the Non-U.S. Plans consist of all plans sponsored by the company’s subsidiaries.
($ in millions)
U.S. Plan Non-U.S. Plans
Level 1 Level 2 Level 3 Total Level 1 Level 2 Level 3 Total
Equity
Equity securities (a) $13,618 $ 11 $ — $13,629 $6,426 $ — $ — $ 6,427
Equity commingled/mutual funds (b)(c) 32 1,877 — 1,909 240 7,751 — 7,991
Fixed income
Government and related (d) — 15,105 29 15,134 — 8,479 96 8,575
Corporate bonds (e) — 7,387 12 7,398 — 1,409 39 1,447
Mortgage and asset-backed securities — 838 45 883 — 36 — 36
Fixed income commingled/mutual funds (b)(f) 262 715 246 1,223 72 7,136 — 7,209
Insurance contracts — — — — — 988 — 988
Cash and short-term investments (g) 286 2,390 — 2,675 145 361 — 506
Hedge funds — 1,140 713 1,853 — 417 — 417
Private equity (h) 0 — 4,098 4,098 — — 262 262
Private real estate (h) — — 2,790 2,790 — — 580 580
Derivatives (i) 10 (15) — (6) (2) 866 — 864
Other commingled/mutual funds (b)(j) — — — — 9 114 — 123
Subtotal 14,207 29,446 7,932 51,586 6,890 27,557 977 35,425
Other (k) — — — (368) — — — (62)
Fair value of plan assets $14,207 $29,446 $7,932 $51,218 $6,890 $27,557 $977 $35,362
(a) Represents U.S. and international securities. The U.S. Plan includes IBM common stock of $132 million, representing 0.3 percent of the U.S. Plan assets. Non-U.S. Plans include IBM common stock of $35 million, representing 0.1 percent of the non-U.S. Plans assets.
(b) Commingled funds represent pooled institutional investments.(c) Invests in predominantly equity securities.(d) Includes debt issued by national, state and local governments and agencies.(e) The U.S. Plan includes IBM corporate bonds of $13 million, representing 0.03 percent of the U.S. Plan assets.(f) Invests in predominantly fixed income securities.(g) Includes cash and cash equivalents and short-term marketable securities.(h) Includes limited partnerships and venture capital partnerships.(i) Primarily includes interest rate derivatives and, to a lesser extent, forwards, exchange traded and other over-the-counter derivatives. ( j) Invests in both equity and fixed income securities. (k) Represents net unsettled transactions, relating primarily to purchases and sales of plan assets.
The U.S. nonpension postretirement benefit plan assets of $38 million were invested in cash, categorized as Level 1 in the fair value hierarchy. The non-U.S. nonpension postretirement benefit plan assets of $112 million, primarily in Brazil, and, to a lesser extent, in Mexico and South Africa, were invested primarily in government and related fixed income securities and corporate bonds, categorized as Level 2 in the fair value hierarchy.
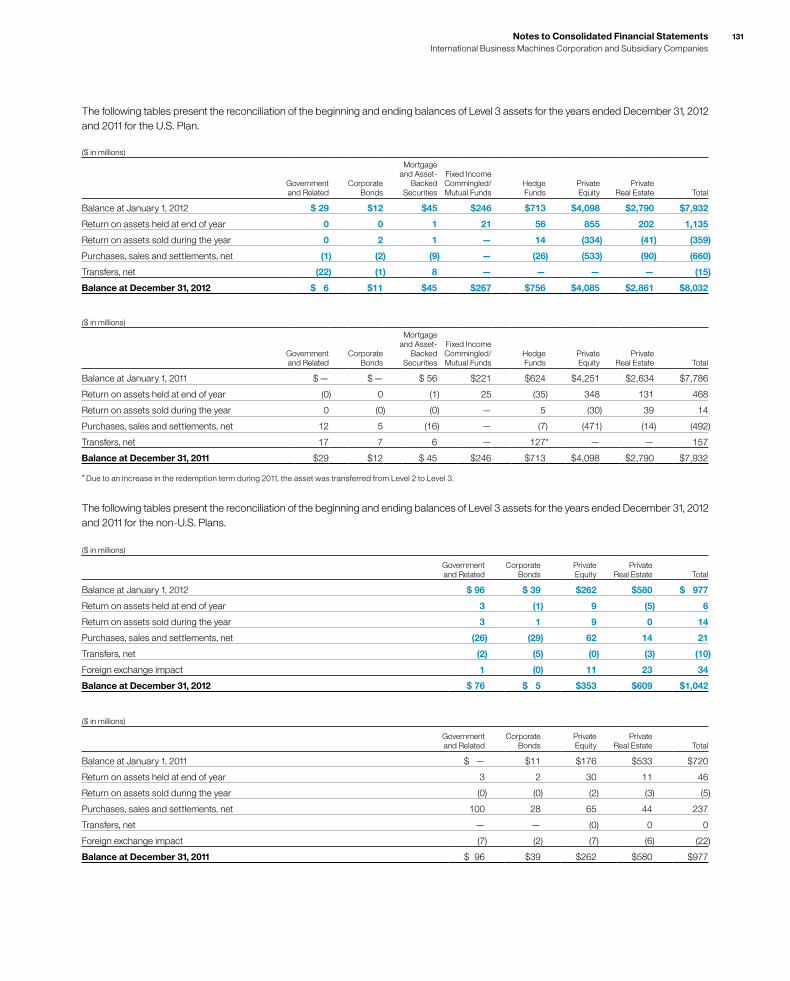
Notes to Consolidated Financial Statements International Business Machines Corporation and Subsidiary Companies
131
The following tables present the reconciliation of the beginning and ending balances of Level 3 assets for the years ended December 31, 2012 and 2011 for the U.S. Plan.
($ in millions)
Government and Related
Corporate Bonds
Mortgage and Asset-
Backed Securities
Fixed Income Commingled/ Mutual Funds
Hedge Funds
Private Equity
Private Real Estate Total
Balance at January 1, 2012 $ 29 $12 $45 $246 $713 $4,098 $2,790 $7,932
Return on assets held at end of year 0 0 1 21 56 855 202 1,135
Return on assets sold during the year 0 2 1 — 14 (334) (41) (359)
Purchases, sales and settlements, net (1) (2) (9) — (26) (533) (90) (660)
Transfers, net (22) (1) 8 — — — — (15)
Balance at December 31, 2012 $ 6 $11 $45 $267 $756 $4,085 $2,861 $8,032
($ in millions)
Government and Related
Corporate Bonds
Mortgage and Asset-
Backed Securities
Fixed Income Commingled/ Mutual Funds
Hedge Funds
Private Equity
Private Real Estate Total
Balance at January 1, 2011 $ — $ — $ 56 $221 $624 $4,251 $2,634 $7,786
Return on assets held at end of year (0) 0 (1) 25 (35) 348 131 468
Return on assets sold during the year 0 (0) (0) — 5 (30) 39 14
Purchases, sales and settlements, net 12 5 (16) — (7) (471) (14) (492)
Transfers, net 17 7 6 — 127* — — 157
Balance at December 31, 2011 $29 $12 $ 45 $246 $713 $4,098 $2,790 $7,932
* Due to an increase in the redemption term during 2011, the asset was transferred from Level 2 to Level 3.
The following tables present the reconciliation of the beginning and ending balances of Level 3 assets for the years ended December 31, 2012 and 2011 for the non-U.S. Plans.
($ in millions)
Government and Related
Corporate Bonds
Private Equity
Private Real Estate Total
Balance at January 1, 2012 $ 96 $ 39 $262 $580 $ 977
Return on assets held at end of year 3 (1) 9 (5) 6
Return on assets sold during the year 3 1 9 0 14
Purchases, sales and settlements, net (26) (29) 62 14 21
Transfers, net (2) (5) (0) (3) (10)
Foreign exchange impact 1 (0) 11 23 34
Balance at December 31, 2012 $ 76 $ 5 $353 $609 $1,042
($ in millions)
Government and Related
Corporate Bonds
Private Equity
Private Real Estate Total
Balance at January 1, 2011 $ — $11 $176 $533 $720
Return on assets held at end of year 3 2 30 11 46
Return on assets sold during the year (0) (0) (2) (3) (5)
Purchases, sales and settlements, net 100 28 65 44 237
Transfers, net — — (0) 0 0
Foreign exchange impact (7) (2) (7) (6) (22)
Balance at December 31, 2011 $ 96 $39 $262 $580 $977
132 Notes to Consolidated Financial Statements International Business Machines Corporation and Subsidiary Companies
132
Valuation TechniquesThe following is a description of the valuation techniques used to measure plan assets at fair value. There were no changes in valua-tion techniques during 2012 and 2011. Equity securities are valued at the closing price reported on the stock exchange on which the individual securities are traded. IBM common stock is valued at the closing price reported on the New York Stock Exchange. Equity commingled/mutual funds are typically valued using the net asset value (NAV) provided by the administrator of the fund and reviewed by the company. The NAV is based on the value of the underlying assets owned by the fund, minus liabilities and divided by the number of shares or units outstanding. These assets are classified as Level 1, Level 2 or Level 3 depending on availability of quoted market prices. The fair value of fixed income securities is typically estimated using pricing models, quoted prices of securities with similar char-acteristics or discounted cash flows and are generally classified as Level 2. If available, they are valued using the closing price reported on the major market on which the individual securities are traded. Cash includes money market accounts that are valued at their cost plus interest on a daily basis, which approximates fair value. Short-term investments represent securities with original maturities of one year or less. These assets are classified as Level 1 or Level 2. Private equity and private real estate partnership valuations require significant judgment due to the absence of quoted market prices, the inherent lack of liquidity and the long-term nature of such assets. These assets are initially valued at cost and are reviewed periodically utilizing available and relevant market data to determine if the carrying value of these assets should be adjusted. These investments are classified as Level 3. The valuation methodology is applied consistently from period to period. Exchange traded derivatives are valued at the closing price reported on the exchange on which the individual securities are traded, while forward contracts are valued using a mid-close price. Over-the-counter derivatives are typically valued using pricing models. The models require a variety of inputs, including, for exam-ple, yield curves, credit curves, measures of volatility and foreign exchange rates. These assets are classified as Level 1 or Level 2 depending on availability of quoted market prices.
Expected Contributions
Defined Benefit Pension PlansIt is the company’s general practice to fund amounts for pensions sufficient to meet the minimum requirements set forth in applicable employee benefits laws and local tax laws. From time to time, the company contributes additional amounts as it deems appropriate. The company contributed $557 million and $728 million in cash to non-U.S. defined benefit pension plans and $60 million and $70 million in cash to non-U.S. multi-employer plans during the years ended December 31, 2012 and 2011, respectively. The cash contributions to multi-employer plans represent the annual cost included in net periodic (income)/cost recognized in the Consoli-dated Statement of Earnings. The company has no liability for participants in multi-employer plans other than its own employees. As a result, the company’s participation in multi-employer plans has no material impact on the company’s financial statements. In 2013, the company is not legally required to make any con-tributions to the U.S. defined benefit pension plans. However, depending on market conditions, or other factors, the company may elect to make discretionary contributions to the Qualified PPP during the year. The Pension Protection Act of 2006 (the Act), enacted into law in 2006, is a comprehensive reform package that, among other provisions, increases pension funding requirements for certain U.S. defined benefit plans, provides guidelines for measuring pension plan assets and pension obligations for funding purposes and raises tax deduction limits for contributions to retirement-related benefit plans. The additional funding requirements by the Act apply to plan years beginning after December 31, 2007. The Act was updated by the Worker, Retiree and Employer Recovery Act of 2008, which revised the funding requirements in the Act by clarifying that pension plans may smooth the value of pension plans over 24 months. At December 31, 2012, no mandatory contribution was required for 2013. In 2013, the company estimates contributions to its non-U.S. defined benefit and multi-employer plans to be approximately $700 million, which will be mainly contributed to defined benefit pension plans in Japan, the UK and Switzerland. This amount represents the legally mandated minimum contributions. Financial market performance in 2013 could increase the legally mandated minimum contribution in certain countries which require monthly or daily remeasurement of the funded status. The company could also elect to contribute more than the legally mandated amount based on market conditions or other factors.
Nonpension Postretirement Benefit PlansThe company contributed $693 million and $362 million to the non-pension postretirement benefit plans during the years ended December 31, 2012 and 2011, respectively. These contribution amounts exclude the Medicare-related subsidy discussed on page 133. The 2012 amount includes a $400 million voluntary cash con-tribution to the U.S. non-pension postretirement benefit plan. This advanced funding will be utilized to fund post-2012 benefit payments for Medicare-eligible prescription drugs.
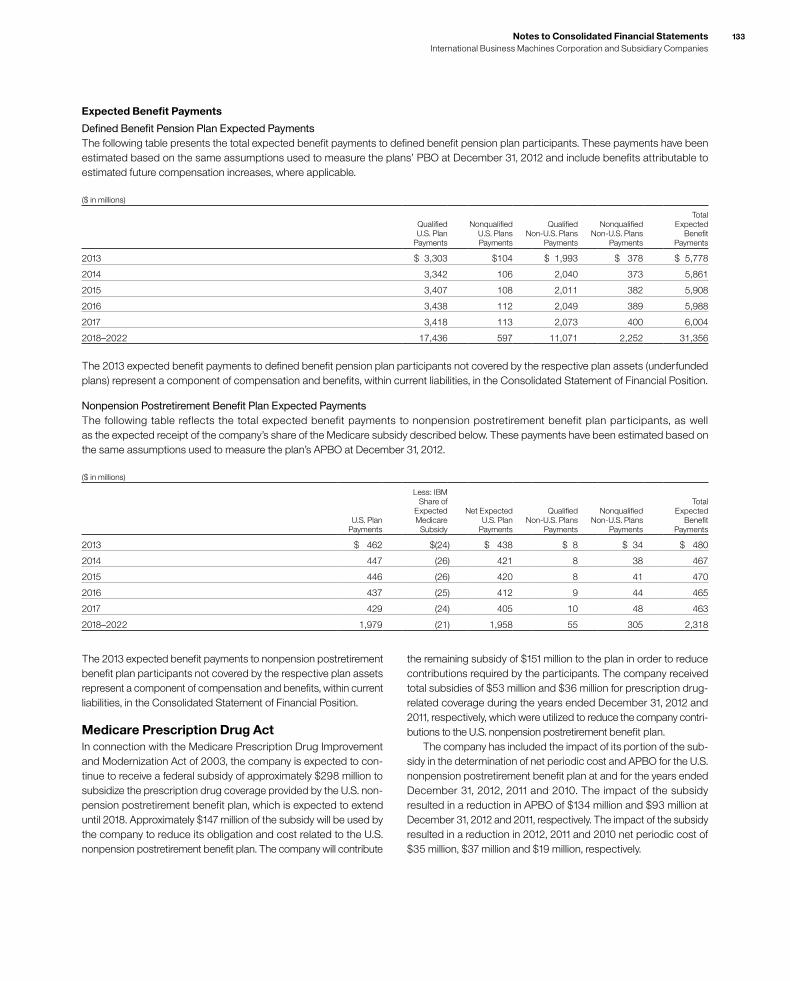
Notes to Consolidated Financial Statements International Business Machines Corporation and Subsidiary Companies
133
Expected Benefit Payments
Defined Benefit Pension Plan Expected PaymentsThe following table presents the total expected benefit payments to defined benefit pension plan participants. These payments have been estimated based on the same assumptions used to measure the plans’ PBO at December 31, 2012 and include benefits attributable to estimated future compensation increases, where applicable.
($ in millions)
Qualified U.S. Plan
Payments
Nonqualified U.S. Plans Payments
Qualified Non-U.S. Plans
Payments
Nonqualified Non-U.S. Plans
Payments
Total Expected
Benefit Payments
2013 $ 3,303 $104 $ 1,993 $ 378 $ 5,778
2014 3,342 106 2,040 373 5,861
2015 3,407 108 2,011 382 5,908
2016 3,438 112 2,049 389 5,988
2017 3,418 113 2,073 400 6,004
2018–2022 17,436 597 11,071 2,252 31,356
The 2013 expected benefit payments to defined benefit pension plan participants not covered by the respective plan assets (underfunded plans) represent a component of compensation and benefits, within current liabilities, in the Consolidated Statement of Financial Position.
Nonpension Postretirement Benefit Plan Expected PaymentsThe following table reflects the total expected benefit payments to nonpension postretirement benefit plan participants, as well as the expected receipt of the company’s share of the Medicare subsidy described below. These payments have been estimated based on the same assumptions used to measure the plan’s APBO at December 31, 2012.
($ in millions)
U.S. Plan Payments
Less: IBM Share of
Expected Medicare
Subsidy
Net Expected U.S. Plan
Payments
Qualified Non-U.S. Plans
Payments
Nonqualified Non-U.S. Plans
Payments
Total Expected
Benefit Payments
2013 $ 462 $(24) $ 438 $ 8 $ 34 $ 480
2014 447 (26) 421 8 38 467
2015 446 (26) 420 8 41 470
2016 437 (25) 412 9 44 465
2017 429 (24) 405 10 48 463
2018–2022 1,979 (21) 1,958 55 305 2,318
The 2013 expected benefit payments to nonpension postretirement benefit plan participants not covered by the respective plan assets represent a component of compensation and benefits, within current liabilities, in the Consolidated Statement of Financial Position.
Medicare Prescription Drug ActIn connection with the Medicare Prescription Drug Improvement and Modernization Act of 2003, the company is expected to con-tinue to receive a federal subsidy of approximately $298 million to subsidize the prescription drug coverage provided by the U.S. non-pension postretirement benefit plan, which is expected to extend until 2018. Approx imately $147 million of the subsidy will be used by the company to reduce its obligation and cost related to the U.S. nonpension postretirement benefit plan. The company will contribute
the remaining subsidy of $151 million to the plan in order to reduce contributions required by the participants. The company received total subsidies of $53 million and $36 million for prescription drug-related coverage during the years ended December 31, 2012 and 2011, respectively, which were utilized to reduce the company contri-butions to the U.S. nonpension postretirement benefit plan. The company has included the impact of its portion of the sub-sidy in the determination of net periodic cost and APBO for the U.S. nonpension postretirement benefit plan at and for the years ended December 31, 2012, 2011 and 2010. The impact of the subsidy resulted in a reduction in APBO of $134 million and $93 million at December 31, 2012 and 2011, respectively. The impact of the subsidy resulted in a reduction in 2012, 2011 and 2010 net periodic cost of $35 million, $37 million and $19 million, respectively.
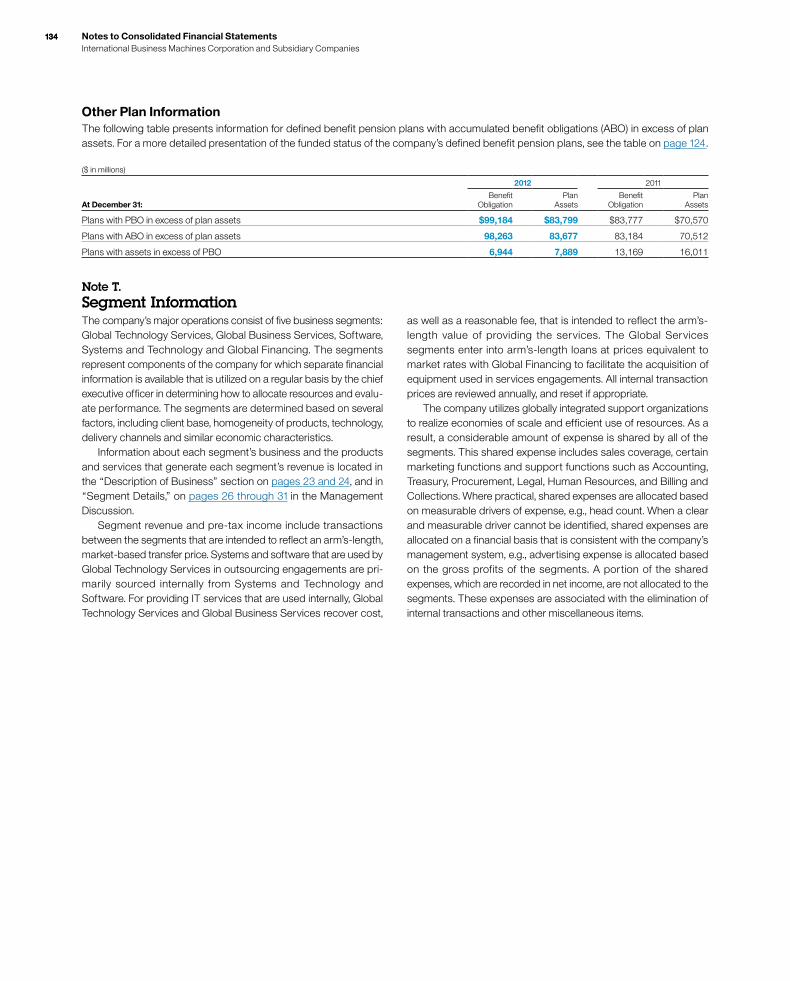
134 Notes to Consolidated Financial Statements International Business Machines Corporation and Subsidiary Companies
134
Other Plan InformationThe following table presents information for defined benefit pension plans with accumulated benefit obligations (ABO) in excess of plan assets. For a more detailed presentation of the funded status of the company’s defined benefit pension plans, see the table on page 124.
($ in millions)
2012 2011
At December 31:Benefit
ObligationPlan
AssetsBenefit
ObligationPlan
Assets
Plans with PBO in excess of plan assets $99,184 $83,799 $83,777 $70,570
Plans with ABO in excess of plan assets 98,263 83,677 83,184 70,512
Plans with assets in excess of PBO 6,944 7,889 13,169 16,011
Note T. Segment InformationThe company’s major operations consist of five business segments: Global Tech nol ogy Services, Global Business Services, Software, Systems and Technology and Global Financing. The segments represent components of the company for which separate financial information is available that is utilized on a regular basis by the chief executive officer in determining how to allocate resources and evalu-ate performance. The segments are determined based on several factors, including client base, homogeneity of products, technology, delivery channels and similar economic characteristics. Information about each segment’s business and the products and services that generate each segment’s revenue is located in the “Description of Business” section on pages 23 and 24, and in “Segment Details,” on pages 26 through 31 in the Management Discussion. Segment revenue and pre-tax income include transactions between the segments that are intended to reflect an arm’s-length, market-based transfer price. Systems and software that are used by Global Technology Services in outsourcing engagements are pri-marily sourced internally from Systems and Technology and Software. For providing IT services that are used internally, Global Technology Services and Global Business Services recover cost,
as well as a reasonable fee, that is intended to reflect the arm’s-length value of providing the services. The Global Services segments enter into arm’s-length loans at prices equivalent to market rates with Global Financing to facilitate the acquisition of equipment used in services engagements. All internal transaction prices are reviewed annually, and reset if appropriate. The company utilizes globally integrated support organizations to realize economies of scale and efficient use of resources. As a result, a considerable amount of expense is shared by all of the segments. This shared expense includes sales coverage, certain marketing functions and support functions such as Accounting, Treasury, Procurement, Legal, Human Re sources, and Billing and Collections. Where practical, shared expenses are allocated based on measurable drivers of expense, e.g., head count. When a clear and measurable driver cannot be identified, shared expenses are allocated on a financial basis that is consistent with the company’s management system, e.g., advertising expense is allocated based on the gross profits of the segments. A portion of the shared expenses, which are recorded in net income, are not allocated to the segments. These expenses are associated with the elimination of internal transactions and other miscellaneous items.
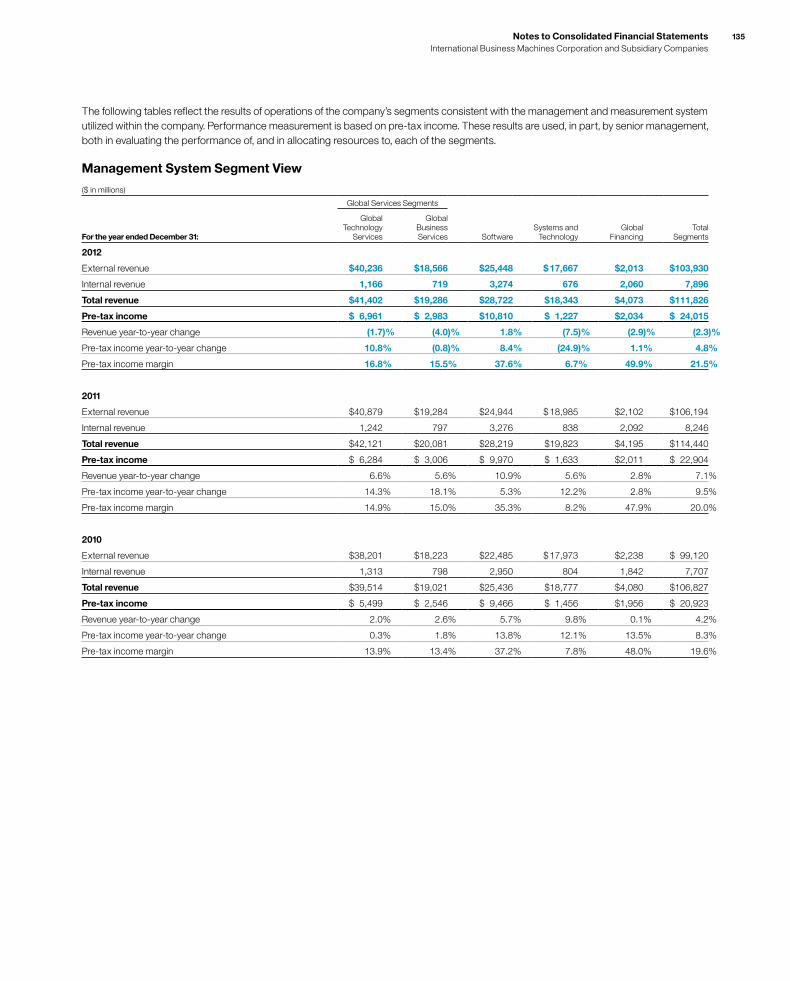
Notes to Consolidated Financial Statements International Business Machines Corporation and Subsidiary Companies
135
The following tables reflect the results of operations of the company’s segments consistent with the management and measurement system utilized within the company. Performance measurement is based on pre-tax income. These results are used, in part, by senior management, both in evaluating the performance of, and in allocating resources to, each of the segments.
Management System Segment View
($ in millions)
Global Services Segments
For the year ended December 31:
Global Technology
Services
Global Business Services Software
Systems and Technology
Global Financing
Total Segments
2012
External revenue $40,236 $18,566 $25,448 $ 17,667 $2,013 $103,930
Internal revenue 1,166 719 3,274 676 2,060 7,896
Total revenue $41,402 $19,286 $28,722 $18,343 $4,073 $111,826
Pre-tax income $ 6,961 $ 2,983 $10,810 $ 1,227 $2,034 $ 24,015
Revenue year-to-year change (1.7)% (4.0)% 1.8% (7.5)% (2.9)% (2.3)%
Pre-tax income year-to-year change 10.8% (0.8)% 8.4% (24.9)% 1.1% 4.8%
Pre-tax income margin 16.8% 15.5% 37.6% 6.7% 49.9% 21.5%
2011
External revenue $40,879 $19,284 $24,944 $ 18,985 $2,102 $106,194
Internal revenue 1,242 797 3,276 838 2,092 8,246
Total revenue $42,121 $20,081 $28,219 $19,823 $4,195 $114,440
Pre-tax income $ 6,284 $ 3,006 $ 9,970 $ 1,633 $2,011 $ 22,904
Revenue year-to-year change 6.6% 5.6% 10.9% 5.6% 2.8% 7.1%
Pre-tax income year-to-year change 14.3% 18.1% 5.3% 12.2% 2.8% 9.5%
Pre-tax income margin 14.9% 15.0% 35.3% 8.2% 47.9% 20.0%
2010
External revenue $38,201 $18,223 $22,485 $ 17,973 $2,238 $ 99,120
Internal revenue 1,313 798 2,950 804 1,842 7,707
Total revenue $39,514 $19,021 $25,436 $18,777 $4,080 $106,827
Pre-tax income $ 5,499 $ 2,546 $ 9,466 $ 1,456 $1,956 $ 20,923
Revenue year-to-year change 2.0% 2.6% 5.7% 9.8% 0.1% 4.2%
Pre-tax income year-to-year change 0.3% 1.8% 13.8% 12.1% 13.5% 8.3%
Pre-tax income margin 13.9% 13.4% 37.2% 7.8% 48.0% 19.6%
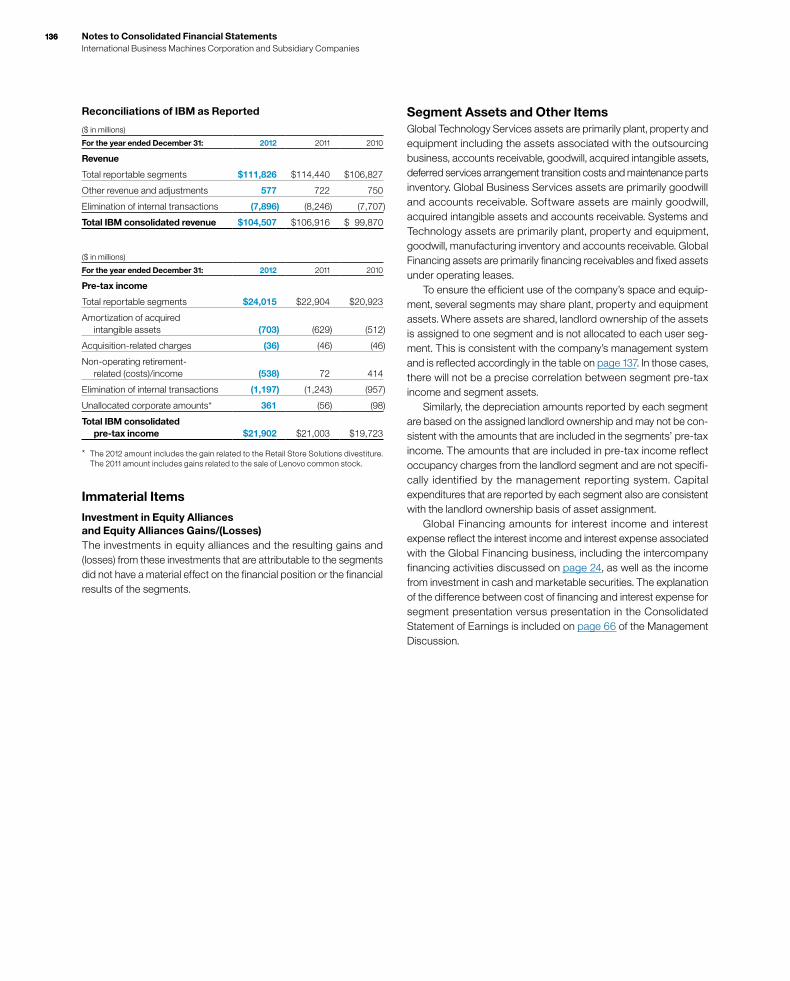
136 Notes to Consolidated Financial Statements International Business Machines Corporation and Subsidiary Companies
136
Reconciliations of IBM as Reported
($ in millions)
For the year ended December 31: 2012 2011 2010
Revenue
Total reportable segments $111,826 $114,440 $106,827
Other revenue and adjustments 577 722 750
Elimination of internal transactions (7,896) (8,246) (7,707)
Total IBM consolidated revenue $104,507 $106,916 $ 99,870
($ in millions)
For the year ended December 31: 2012 2011 2010
Pre-tax income
Total reportable segments $24,015 $22,904 $20,923
Amortization of acquired intangible assets (703) (629) (512)
Acquisition-related charges (36) (46) (46)
Non-operating retirement- related (costs)/income (538) 72 414
Elimination of internal transactions (1,197) (1,243) (957)
Unallocated corporate amounts* 361 (56) (98)
Total IBM consolidated pre-tax income $21,902 $21,003 $19,723
* The 2012 amount includes the gain related to the Retail Store Solutions divestiture. The 2011 amount includes gains related to the sale of Lenovo common stock.
Immaterial Items
Investment in Equity Alliances and Equity Alliances Gains/(Losses)The investments in equity alliances and the resulting gains and (losses) from these investments that are attributable to the segments did not have a material effect on the financial position or the financial results of the segments.
Segment Assets and Other ItemsGlobal Technology Services assets are primarily plant, property and equipment including the assets associated with the outsourcing business, accounts receivable, goodwill, acquired intangible assets, deferred services arrangement transition costs and maintenance parts inventory. Global Business Services assets are primarily goodwill and accounts receivable. Software assets are mainly goodwill, acquired intangible assets and accounts receivable. Systems and Technology assets are primarily plant, property and equipment, goodwill, manufacturing inventory and accounts receivable. Global Financing assets are primarily financing receivables and fixed assets under operating leases. To ensure the efficient use of the company’s space and equip-ment, several segments may share plant, property and equipment assets. Where assets are shared, landlord ownership of the assets is assigned to one segment and is not allocated to each user seg-ment. This is consistent with the company’s management system and is reflected accordingly in the table on page 137. In those cases, there will not be a precise correlation between segment pre-tax income and segment assets. Similarly, the depreciation amounts reported by each segment are based on the assigned landlord ownership and may not be con-sistent with the amounts that are included in the segments’ pre-tax income. The amounts that are included in pre-tax income reflect occupancy charges from the landlord segment and are not specifi-cally identified by the management reporting system. Capital expenditures that are reported by each segment also are consistent with the landlord ownership basis of asset assignment. Global Financing amounts for interest income and interest expense reflect the interest income and interest expense associated with the Global Financing business, including the intercompany financing activities discussed on page 24, as well as the income from investment in cash and marketable securities. The explanation of the difference between cost of financing and interest expense for segment presentation versus presentation in the Consolidated Statement of Earnings is included on page 66 of the Management Discussion.

Notes to Consolidated Financial Statements International Business Machines Corporation and Subsidiary Companies
137
Management System Segment View($ in millions)
Global Services Segments
For the year ended December 31:
Global Technology
Services
Global Business Services Software
Systems and Technology
Global Financing
Total Segments
2012
Assets $15,884 $8,022 $26,291 $8,232 $38,882 $97,310
Depreciation/amortization of intangibles* 1,597 75 1,157 786 853 4,470
Capital expenditures/investments in intangibles 1,760 42 618 1,106 708 4,233
Interest income — — — — 1,942 1,942
Interest expense — — — — 410 410
2011
Assets $15,475 $8,078 $23,926 $7,649 $36,427 $91,557
Depreciation/amortization of intangibles* 1,713 83 1,062 737 1,145 4,739
Capital expenditures/investments in intangibles 1,838 56 469 1,032 930 4,325
Interest income — — — — 2,139 2,139
Interest expense — — — — 538 538
2010
Assets $15,560 $8,007 $22,625 $7,287 $35,813 $89,292
Depreciation/amortization of intangibles* 1,632 75 992 784 1,417 4,900
Capital expenditures/investments in intangibles 1,511 52 463 1,163 1,246 4,434
Interest income — — — — 2,116 2,116
Interest expense — — — — 548 548
* Segment pre-tax income does not include the amortization of intangible assets.
138 Notes to Consolidated Financial Statements International Business Machines Corporation and Subsidiary Companies
138
Reconciliations of IBM as Reported
($ in millions)
At December 31: 2012 2011 2010
Assets
Total reportable segments $ 97,310 $ 91,557 $ 89,292
Elimination of internal transactions (4,943) (5,407) (5,515)
Unallocated amounts
Cash and marketable securities 9,779 10,575 10,113
Notes and accounts receivable 3,769 3,526 3,762
Deferred tax assets 5,194 4,865 4,494
Plant, other property and equipment 2,555 2,918 3,067
Pension assets 945 2,837 3,060
Other 4,604 5,562 5,178
Total IBM consolidated assets $119,213 $116,433 $113,452
Major ClientsNo single client represented 10 percent or more of the company’s total revenue in 2012, 2011 or 2010.
Geographic Information The following provides information for those countries that are 10 percent or more of the specific category.
Revenue*
($ in millions)
For the year ended December 31: 2012 2011 2010
United States $ 36,270 $ 37,041 $35,581
Japan 10,697 10,968 10,701
Other countries 57,540 58,906 53,589
Total IBM consolidated revenue $104,507 $106,916 $99,870
* Revenues are attributed to countries based on the location of the client.
Plant and Other Property-Net
($ in millions)
At December 31: 2012 2011 2010
United States $ 6,555 $ 6,271 $ 6,134
Other countries 6,299 6,186 6,298
Total $12,854 $12,457 $12,432
Revenue by Classes of Similar Products or ServicesThe following table presents external revenue for similar classes of products or services within the company’s reportable segments. Within Global Technology Services and Global Business Services, client solutions often include IBM software and systems and other suppliers’ products if the client solution requires it. Within Software, product license charges and ongoing subscription and support are reported as Software, and software as a service, consulting, educa-tion, training and other product-related services are reported as Services. Within Systems and Technology, Microelectronics original equipment manufacturer (OEM) revenue is primarily from the sale
of semiconductors. Microelectronics Services revenue includes circuit and component design services and technology and manu-facturing consulting services. See “Description of the Business,” beginning on page 21 for additional information.
($ in millions)
For the year ended December 31: 2012 2011 2010
Global Technology Services
Services $31,161 $31,746 $29,367
Maintenance 7,343 7,515 7,250
Systems 1,574 1,478 1,409
Software 159 140 175
Global Business Services
Services $18,216 $18,956 $17,858
Software 208 211 236
Systems 142 118 129
Software
Software $23,144 $22,921 $20,882
Services 2,304 2,022 1,603
Systems and Technology
Servers $11,980 $12,362 $11,619
Storage 3,411 3,619 3,420
Microelectronics OEM 1,572 1,975 1,938
Retail Store Solutions 357 753 674
Microelectronics Services 346 277 321
Global Financing
Financing $ 1,471 $ 1,612 $ 1,580
Used equipment sales 542 490 659
Note U. Subsequent EventsOn January 2, 2013, the American Taxpayer Relief Act of 2012 was signed into law extending several business tax provisions through 2013. Certain of these provisions were reinstated retroac-tively to January 1, 2012. Accounting guidance requires that the effects of new legislation be recognized upon enactment. Accord-ingly, the 2012 retroactive impact of the legislation, which is a tax benefit of approximately $135 million, will be included in the com-pany’s first-quarter 2013 tax provision. On January 29, 2013, the company announced that the Board of Directors approved a quarterly dividend of $0.85 per common share. The dividend is payable March 9, 2013 to shareholders of record on February 8, 2013. On February 5, 2013, the company issued $1 billion of 5-year fixed-rate bonds with a 1.25 percent coupon, and $1 billion of 2-year floating-rate bonds priced at three month London Interbank Offered Rate (LIBOR) minus two basis points.
139
($ in millions except per share amounts)
For the year ended December 31: 2012 2011 2010 2009 2008
Revenue $104,507 $106,916 $ 99,870 $ 95,758 $103,630
Net income $ 16,604 $ 15,855 $ 14,833 $ 13,425 $ 12,334
Operating (non-GAAP) earnings* $ 17,627 $ 16,318 $ 15,023 $ 13,452 $ 12,293
Earnings per share of common stock
Assuming dilution $ 14.37 $ 13.06 $ 11.52 $ 10.01 $ 8.89
Basic $ 14.53 $ 13.25 $ 11.69 $ 10.12 $ 9.02
Diluted operating (non-GAAP)* $ 15.25 $ 13.44 $ 11.67 $ 10.03 $ 8.86
Cash dividends paid on common stock $ 3,773 $ 3,473 $ 3,177 $ 2,860 $ 2,585
Per share of common stock 3.30 2.90 2.50 2.15 1.90
Investment in property, plant and equipment $ 4,082 $ 4,108 $ 4,185 $ 3,447 $ 4,171
Return on IBM stockholders’ equity 81.6% 71.2% 66.8% 80.4% 48.7%
At December 31: 2012 2011 2010 2009 2008
Total assets $119,213 $116,433 $113,452 $109,022 $109,524
Net investment in property, plant and equipment 13,996 13,883 14,096 14,165 14,305
Working capital 5,807 8,805 7,554 12,933 6,568
Total debt 33,269 31,320 28,624 26,099 33,926
Total equity 18,984 20,236 23,172 22,755 13,584
* Refer to page 62 of the company’s first-quarter 2011 Form 10-Q filed on April 26, 2011 for the reconciliation of non-GAAP financial information for the years 2008 through 2010. Also see “GAAP Reconciliation,” on page 38 for the reconciliation of non-GAAP financial information for 2012 and 2011.
Five-Year Comparison of Selected Financial Data International Business Machines Corporation and Subsidiary Companies

140140 Selected Quarterly Data International Business Machines Corporation and Subsidiary Companies
($ in millions except per share amounts and stock prices)
2012First
QuarterSecond Quarter
Third Quarter
Fourth Quarter
Full Year
Revenue $24,673 $25,783 $24,747 $29,304 $104,507
Gross profit $11,118 $12,281 $11,732 $15,167 $ 50,298
Net income $ 3,066 $ 3,881 $ 3,824 $ 5,833 $ 16,604
Operating (non-GAAP) earnings* $ 3,265 $ 4,077 $ 4,155 $ 6,129 $ 17,627
Earnings per share of common stock
Assuming dilution $ 2.61 $ 3.34 $ 3.33 $ 5.13 $ 14.37**
Basic $ 2.65 $ 3.38 $ 3.36 $ 5.19 $ 14.53**
Diluted operating (non-GAAP)* $ 2.78 $ 3.51 $ 3.62 $ 5.39 $ 15.25**
Dividends per share of common stock $ 0.75 $ 0.85 $ 0.85 $ 0.85 $ 3.30
Stock prices+
High $209.12 $210.69 $208.32 $211.79
Low 177.34 187.00 181.85 184.78
($ in millions except per share amounts and stock prices)
2011First
QuarterSecond Quarter
Third Quarter
Fourth Quarter
Full Year
Revenue $24,607 $26,666 $26,157 $29,486 $106,916
Gross profit $10,858 $12,385 $12,173 $14,722 $ 50,138
Net income $ 2,863 $ 3,664 $ 3,839 $ 5,490 $ 15,855
Operating (non-GAAP) earnings* $ 2,990 $ 3,777 $ 3,954 $ 5,597 $ 16,318
Earnings per share of common stock
Assuming dilution $ 2.31 $ 3.00 $ 3.19 $ 4.62 $ 13.06**
Basic $ 2.34 $ 3.04 $ 3.23 $ 4.68 $ 13.25**
Diluted operating (non-GAAP)* $ 2.41 $ 3.09 $ 3.28 $ 4.71 $ 13.44**
Dividends per share of common stock $ 0.65 $ 0.75 $ 0.75 $ 0.75 $ 2.90
Stock prices+
High $166.05 $172.87 $185.21 $194.56
Low 147.05 162.33 157.54 173.29
* Refer to page 61 of the company’s first-quarter 2012 Form 10-Q filed on April 24, 2012, pages 75 and 76 of the company’s second-quarter 2012 Form 10-Q filed on July 31, 2012, pages 75 and 76 of the company’s third-quarter 2012 Form 10-Q filed on October 30, 2012 and page 43 under the heading “GAAP Reconciliation,” for the reconciliation of non-GAAP information for the quarterly periods of 2012 and 2011. Also see “GAAP Reconciliation,” on page 38 for the reconciliation of non-GAAP financial information for full-year 2012 and 2011.
** Earnings Per Share (EPS) in each quarter is computed using the weighted-average number of shares outstanding during that quarter while EPS for the full year is computed using the weighted-average number of shares outstanding during the year. Thus, the sum of the four quarters’ EPS does not equal the full-year EPS.
+ The stock prices reflect the high and low prices for IBM’s common stock on the New York Stock Exchange composite tape for the periods presented.
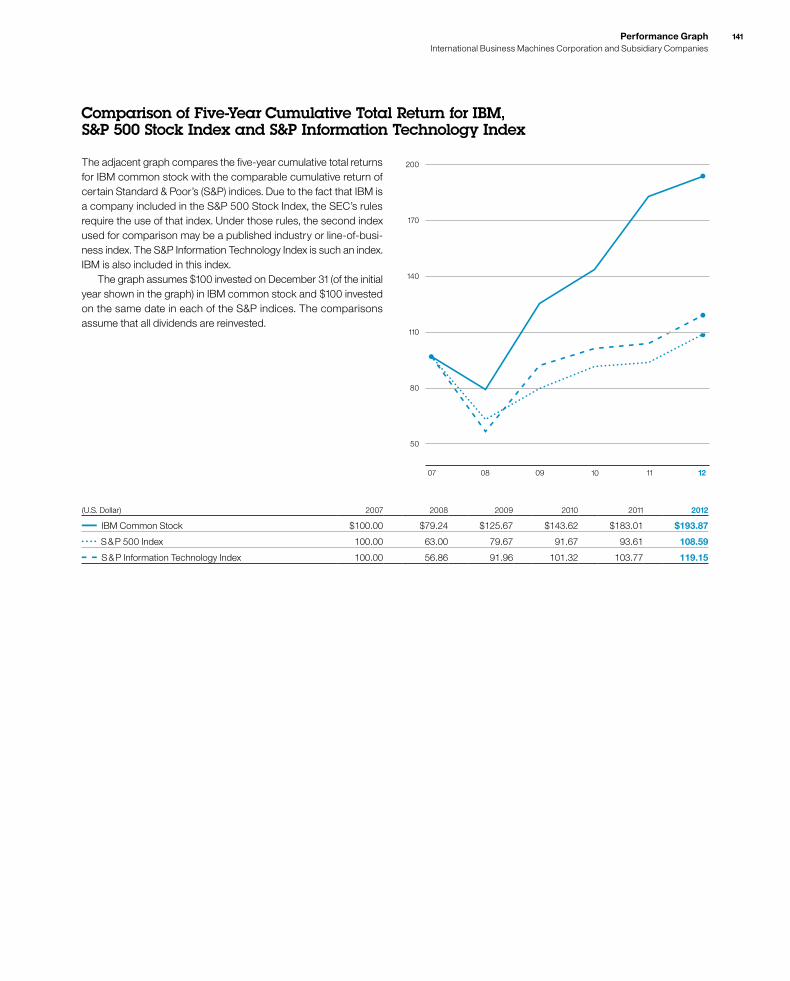
141Performance Graph International Business Machines Corporation and Subsidiary Companies
Comparison of Five-Year Cumulative Total Return for IBM, S&P 500 Stock Index and S&P Information Technology Index
The adjacent graph compares the five-year cumulative total returns for IBM common stock with the comparable cumulative return of certain Standard & Poor’s (S&P) indices. Due to the fact that IBM is a company included in the S&P 500 Stock Index, the SEC’s rules require the use of that index. Under those rules, the second index used for comparison may be a published industry or line-of-busi-ness index. The S&P Information Technology Index is such an index. IBM is also included in this index. The graph assumes $100 invested on December 31 (of the initial year shown in the graph) in IBM common stock and $100 invested on the same date in each of the S&P indices. The comparisons assume that all dividends are reinvested.
(U.S. Dollar) 2007 2008 2009 2010 2011 2012
IBM Common Stock $100.00 $79.24 $125.67 $143.62 $183.01 $193.87
S & P 500 Index 100.00 63.00 79.67 91.67 93.61 108.59
S & P Information Technology Index 100.00 56.86 91.96 101.32 103.77 119.15
80
07 08 09 10 11 12
200
50
110
140
170

142142 Board of Directors and Senior Leadership International Business Machines Corporation and Subsidiary Companies
Senior Leadership
Rodney C. AdkinsSenior Vice President Systems and Technology Group
Colleen F. ArnoldSenior Vice President Application Management Services
James P. BramanteSenior Vice President Growth Markets
Michelle H. BrowdyVice President, Assistant General Counsel and Secretary
Erich ClementiSenior Vice President Global Technology Services
Michael E. DanielsSenior Vice President
Robert F. Del BeneVice President and Treasurer
Bruno V. Di Leo Allen Senior Vice President Sales and Distribution
Jon C. IwataSenior Vice President Marketing and Communications
James J. KavanaughVice President and Controller
John E. Kelly IIISenior Vice President and Director Research
Robert J. LeBlancSenior Vice President Middleware Software Group
Mark LoughridgeSenior Vice President and Chief Financial Officer Finance and Enterprise Transformation
J. Randall MacDonaldSenior Vice President Human Resources
Steven A. MillsSenior Vice President and Group Executive Software and Systems
Michael D. RhodinSenior Vice President Software Solutions Group
Virginia M. RomettyChairman, President and Chief Executive Officer
Linda S. SanfordSenior Vice President Enterprise Transformation
Timothy S. ShaughnessySenior Vice President GTS Services Delivery
Bridget A. van KralingenSenior Vice President Global Business Services
Robert C. WeberSenior Vice President Legal and Regulatory Affairs, and General Counsel
Board of Directors
Alain J.P. BeldaManaging Director Warburg Pincus LLC
William R. BrodyPresident Salk Institute for Biological Studies
Kenneth I. ChenaultChairman and Chief Executive Officer American Express Company
Michael L. EskewRetired Chairman and Chief Executive Officer United Parcel Service, Inc.
David N. FarrChairman and Chief Executive Officer Emerson Electric Co.
Shirley Ann JacksonPresident Rensselaer Polytechnic Institute
Andrew N. LiverisChairman, President and Chief Executive Officer The Dow Chemical Company
W. James McNerney, Jr.Chairman, President and Chief Executive Officer The Boeing Company
James W. OwensRetired Chairman and Chief Executive Officer Caterpillar Inc.
Virginia M. RomettyChairman, President and Chief Executive Officer IBM
Joan E. SperoAdjunct Senior Research Scholar Columbia University School of International and Public Affairs
Sidney TaurelSenior Advisor Capital Royalty L.P.
Lorenzo H. ZambranoChairman and Chief Executive Officer CEMEX, S.A.B. de C.V.
143Stockholder Information International Business Machines Corporation and Subsidiary Companies
IBM Stockholder ServicesStockholders with questions about their accounts should contact:
Computershare Trust Company, N.A., P.O. Box 43078, Providence, Rhode Island 02940-3078 (888) IBM-6700
Investors residing outside the United States, Canada and Puerto Rico should call (781) 575-2727
Stockholders can also reach Computershare Trust Company, N.A. by e-mail at: [email protected]
Hearing-impaired stockholders with access to a telecommunications device (TDD) can communicate directly with Computershare Trust Company, N.A., by calling (800) 490-1493. Stockholders residing outside the United States, Canada and Puerto Rico should call (781) 575-2694.
IBM on the InternetTopics featured in this Annual Report can be found on the IBM home page on the Internet (www.ibm.com). Financial results, news on IBM products, services and other activities can also be found at that address.
IBM files reports with the Securities and Exchange Commission (SEC), including the annual report on Form 10-K, quarterly reports on Form 10-Q, current reports on Form 8-K and any other filings required by the SEC.
IBM’s website (www.ibm.com) contains a significant amount of information about IBM, including the company’s annual report on Form 10-K, quarterly reports on Form 10-Q, current reports on Form 8-K, and all amendments to those reports as soon as reasonably practicable after such material is electronically filed with or furnished to the SEC (www.ibm.com/investor). These materials are available free of charge on or through our website.
The public may read and copy any materials the company files with the SEC at the SEC’s Public Reference Room at 100 F Street, NE, Washington, DC 20549. The public may obtain information on the operation of the Public Reference Room by calling the SEC at (800) SEC-0330. The SEC maintains an Internet site (www.sec.gov) that contains reports, proxy and information statements, and other information regarding issuers that file electronically with the SEC.
IBM Investor Services ProgramThe Investor Services Program brochure outlines a number of services provided for IBM stockholders and potential IBM investors, including the reinvestment of dividends, direct purchase and the deposit of IBM stock certificates for safe keeping. Call (888) IBM-6700 for a copy of the brochure. Investors residing outside the United States, Canada and Puerto Rico should call (781) 575-2727.
Investors with other requests may write to: IBM Stockholder Relations, 1 New Orchard Road, Armonk, New York 10504
IBM StockIBM common stock is listed on the New York Stock Exchange, the Chicago Stock Exchange, and outside the United States.
Stockholder CommunicationsStockholders can get quarterly financial results, a summary of the Annual Meeting remarks, and voting results from the meeting by calling (914) 499-7777, by sending an e-mail to [email protected], or by writing to International Business Machines Corporation, 1 New Orchard Road, M/D 325, Armonk, New York 10504.
Annual MeetingThe IBM Annual Meeting of Stockholders will be held on Tuesday, April 30, 2013, at 10 a.m. in the Von Braun Center, 700 Monroe Street SW, Huntsville, Alabama.
Literature for IBM StockholdersThe literature mentioned below on IBM is available without charge from:
Computershare Trust Company, N.A., P.O. Box 43078, Providence, Rhode Island 02940-3078 (888) IBM-6700
Investors residing outside the United States, Canada and Puerto Rico should call (781) 575-2727
The company’s annual report on Form 10-K and the quarterly reports on Form 10-Q provide additional information on IBM’s business. The 10-K report is released by the end of February; 10-Q reports are released by early May, August and November.
An audio recording of the 2012 Annual Report will be available for sight-impaired stockholders in June 2013.
The IBM Corporate Responsibility Report highlights IBM’s values and its integrated approach to corporate responsibility, including its innovative strategies for transforming communities through global citizenship. The Report Summary is available in printed form and downloadable at www.ibm.com/responsibility. The full Corporate Responsibility Report is online with downloadable sections at www.ibm.com/responsibility.
General InformationStockholders of record can receive online account information and answers to frequently asked questions regarding stockholder accounts on the Internet (www.ibm.com/investor). Stockholders of record can also consent to receive future IBM Annual Reports and Proxy Statements online through the Internet at this site.
For answers to general questions about IBM from within the continental United States, call (800) IBM-4YOU. From outside the United States, Canada and Puerto Rico, call (914) 499-1900.
144
International Business Machines Corporation1 New Orchard Road, Armonk, New York 10504(914) 499-1900
AIX, Algorithmics, BigFix, Cast Iron, Coremetrics, DemandTec, Emptoris, i2, IBM, IBM SmartCloud, iCluster, Initiate Systems, Jazz, Lombardi, Lotus, Netezza, OpenPages, Power, POWER7+, Power Systems, PureSystems, Rational, Smarter Analytics, Smarter Cities, Smarter Commerce, Smarter Planet, Sterling Commerce, Storwize, System x, System z, Tealeaf, Tivoli, TRIRICA, Unica, Vivisimo, Watson, WebSphere, Worklight, XIV and zEnterprise are trademarks or registered trademarks of International Business Machines Corporation or its wholly owned subsidiaries. Jeopardy! is a registered trademark of Jeopardy Productions, Inc. Linux is a registered trademark of Linus Torvalds in the United States, other countries, or both. Oracle is a registered trademark of Oracle Corporation. UNIX is a registered trademark of the Open Group in the United States and other countries. Other company, product and service names may be trademarks or service marks of others.
Printed in the U.S.A. COL03002-USEN-03 Des
ign:
VS
A P
artn
ers,
Inc.
Illust
ratio
n: T
he D
esig
n S
urge
ry
P
hoto
grap
hy: J
ens
Um
bach
Prin
ting:
RR
Don
nelle
y
