2012 municipal budget. it is the expectation of the council to develop community driven policy whose...
TRANSCRIPT

20
12
2
01
2 M
UN
ICIP
AL
MU
NIC
IPA
L
BU
DG
ET
BU
DG
ET

It is the expectation of the Council to develop community driven policy whose intent will be to ensure a safe, clean, secure environment, a well maintained infrastructure system, and a climate of acceptance, friendly caring, and community spirit.
We will make affordable decisions which we believe will lead our township in a progressive, enterprising and sustainable direction within the Legislative framework of the Province of Ontario. At the same time our residents and guests will have the assurance that both old and new cultural traditions will continue to play an integral part in making this community the special place we recognize as home.
Township of Madawaska Township of Madawaska Valley Valley MISSION MISSION
STATEMENTSTATEMENT

2013 PROPOSED 2013 PROPOSED REVENUESREVENUES
$7,001,581$7,001,581
Parks & Recreation Revenues $247,280 - (3.53%)
Other Municipalities - Grants & Fees
$3,800 - ( 0.05%)
Canada Specific Grants
$134,387 - (1.92%)
Fees, S/C & Other Revenues
$336,655 - (4.81%)
Ontario Unconditional
Grants $922,500 - (13.18%)
Payments in Lieu$103,080 -
(1.47%)
Transfer from Reserves - $656,750 -
(9.38%)
Ontario Specific Grants
$1,089,132- (15.56%)
Taxation $3,503,645 -
(50.04%)
2012 Cash Surplus - $4,352 -
(0.06%)

Parks & Recreation Services $714,055-
(10.2%)
Waste Disposal Services
$538,900 - (7.7%)
Municipal Properties Services
$34,500 - (0.49%)
Social & Family Services
$14,280 - (0.20%)
Protection Services $1,064,522 -
(15.2%)
General Administration
$944,350 - (13.49%)
Library Services - $131,574 - (1.88%)
Transportation Services
$3,479,300 - (49.7%)
Planning & Development
Services $80,100 - (1.14%)
2013 PROPOSED 2013 PROPOSED EXPENDITURESEXPENDITURES
$7,001,581$7,001,581

Municipal operating – capital expense comparison
0500000
100000015000002000000250000030000003500000400000045000005000000
Operating Capital Reserves
Operating - 65.12%
Capital - 32.2%
Reserves - 2.68%
$4,558,881 $2,254,700 $188,000

2012/2013 TAXATION 2012/2013 TAXATION LEVY REQUIREMENT LEVY REQUIREMENT
COMPARISONCOMPARISON2012 TAXATION2012 TAXATION
BUDGETED EXPENDITURES $6,363,977.00 BUDGETED REVENUES $3,040,326.00
$3,323,651.00$3,323,651.00
2013 TAXATION2013 TAXATION
PROPOSED EXPENDITURES $7,001,581.00PROPOSED REVENUES $3,497,936.00
LEVY REQUIREMENT FROM LEVY REQUIREMENT FROM TAXATIONTAXATION
LEVY REQUIREMENT FROM LEVY REQUIREMENT FROM TAXATIONTAXATION
$3,503,645.00$3,503,645.00LEVY INCREASE OF $179,994 (or 5.41%)
Increase due in part to: decreased contributions to capital purchases from reserves increased policing costing ($75,351) increased costs associated Septic Inspections & Animal Control increased costs attributed to change to operate Arts & Visitor Centre year-around

2013 MUNICIPAL TAX 2013 MUNICIPAL TAX IMPACT on residential IMPACT on residential properties properties (WITHOUT AREA (WITHOUT AREA
RATES)RATES)2013 2013
MUNICIPALMUNICIPALTAX RATETAX RATE
0.005556900.00555690
INCREASEINCREASE1.11%1.11%
2012 2012 MUNICIPAL TAX RATEMUNICIPAL TAX RATE
0.005495790.00549579

TAX DOLLAR IMPACT
2012 2013Differen
ce
$100,000 Assessment
$ 549.58$
555.69$ 6.11
2012 Average Residential Impact
$ 137,000Assessment $ 752.91
2013 Average Residential Impact
$ 139,500 Assessment
$ 775.19
$ 22.28or 2.87 %
Consideration must be given to the Assessment increases. According to the MunicipalProperty Assessment Corporation (MPAC) the average single family residential assessment has increased by 1.79% from $137,000 in 2012 to $139,500 in 2013. The following willdemonstrate the impact that this assessment change will have on these properties.

2013 GENERAL RESERVE FUND 2013 GENERAL RESERVE FUND STATUSSTATUSACCOUNT ACCOUNT
BALANCE ON BALANCE ON JANUARY 1/13JANUARY 1/13
ADDITIONSADDITIONS WITHDRAWALWITHDRAWALSS
ANTICIPATED ANTICIPATED BALANCE ON BALANCE ON
DECEMBER 31/13DECEMBER 31/13
GENERAL GOVERNMENTGENERAL GOVERNMENT982,486.77982,486.77 6,5006,500 70,00070,000 918,986.77918,986.77
FIRE PROTECTION FIRE PROTECTION SERVICESSERVICES 103,500103,500 65,00065,000 16,00016,000 152,500152,500
TRANSPORTATION TRANSPORTATION SERVICESSERVICES 606,368606,368 50,00050,000 304,998304,998 351,370351,370
ENVIRONMENTAL ENVIRONMENTAL SERVICESSERVICES 1,658,7161,658,716 68,24468,244 145,352145,352 1,581,6081,581,608
LIBRARY SERVICESLIBRARY SERVICES24,50024,500 3,5003,500 21,00021,000
RECREATION & RECREATION & CULTURAL SERVICESCULTURAL SERVICES 331,200331,200 14,00014,000 114,900114,900 230,300230,300
PLANNING & PLANNING & DEVELOPMENT SERVICESDEVELOPMENT SERVICES 240,418240,418 12,50012,500 252,918252,918
TOTAL GENERAL TOTAL GENERAL RESERVESRESERVES
3,947,188.73,947,188.777
216,244216,244 654,750654,750 3,508,682.773,508,682.77

2013 COUNTY OF 2013 COUNTY OF RENFREW RESIDENTIAL RENFREW RESIDENTIAL
TAX LEVYTAX LEVY
20122012 367.50367.50
20132013 361.33361.33
DECREASEDECREASE6.17 6.17
(based on $100,000 (based on $100,000 assessment)assessment)
2013 RESIDENTIAL RATE: 0.00361332 Levy Amount - $2,278,083 up from $2,253,279 (increase of 1.09% from last year)
1.68%1.68%

2013 RESIDENTIAL 2013 RESIDENTIAL EDUCATION TAX LEVYEDUCATION TAX LEVY
2013 Residential Rate: 0.002120002013 Residential Rate: 0.00212000Levy Amount - $1,585,038 up from $1,583,123(increase of 0.12% from last year)Levy Amount - $1,585,038 up from $1,583,123(increase of 0.12% from last year)
4.07%4.07%
20122012 221.00221.00
20132013 212.00212.00
DECREASEDECREASE9.009.00
(based on $100,000 (based on $100,000 assessment)assessment)

IMPACTIMPACT
HOW THESE DECISIONS
IMPACT YOUR 2013 TAX BILL . . .
HOW THESE DECISIONS
IMPACT YOUR 2013 TAX BILL . . .

TOTAL 2013 TAXATION BILLING IMPACT based on $100,000 Residential Assessment
MUNICIPAL MUNICIPAL TAXATION TAXATION
LEVYLEVY
COUNTY COUNTY LEVYLEVY
EDUCATION EDUCATION LEVYLEVY
TOTAL TOTAL PROPERTY PROPERTY
TAXESTAXES
20120122
549.58549.58 367.50367.50 221.00221.00 1,138.081,138.08
20120133
555.69555.69 361.33361.33 212.00212.00 1,129.021,129.02
A $9.06 DECREASE over the amount paid in 2012A $9.06 DECREASE over the amount paid in 2012
(0.8 %)

2012 2013Dollar Difference
Percentage difference
Municipal Portion
549.58 555.69 $ 6.11 1.11 %
County Portion 367.50 361.33 ( $ 6.17 ) ( 1.68 % )
Education Portion
221.00 212.00 ( $ 9.00 ) ( 4.07 % )
Total Taxes(without Area Rates)
1,138.08 1,129.02 ( $ 9.06 ) ( 0.8 % )
TAX IMPACT ON $100,000 TAX IMPACT ON $100,000 ASSESSMENTASSESSMENT

2013 TAXATION 2013 TAXATION INFLUENCESINFLUENCESREASSESSMENT
We are in the first year of an updated four year phase-in Property Assessment update which updated from a 2008 base year to a 2012 base year.
Assessment reductions are not phased-in in the same manner as assessment increases are, total reduction given immediately (2013 taxation year) which means an added stress for the 2013 taxation year.
Taxable Assessments for the Township of Madawaska Valley rose by 4.3% from $583,674,368 in 2012 to $609,884,737 for 2013.
REVENUE SOURCES LIMITED – RISING COSTS
Other than a small number of grant opportunities, in addition to fees and service charges that are levied, other than through property taxation the Township has a very limited ability to raise revenues.
Operation costs continue to raise and the need to replace and rehabilitate existing capital assets without assistance of the upper levels of Government is proving difficult to maintain taxes from rising.
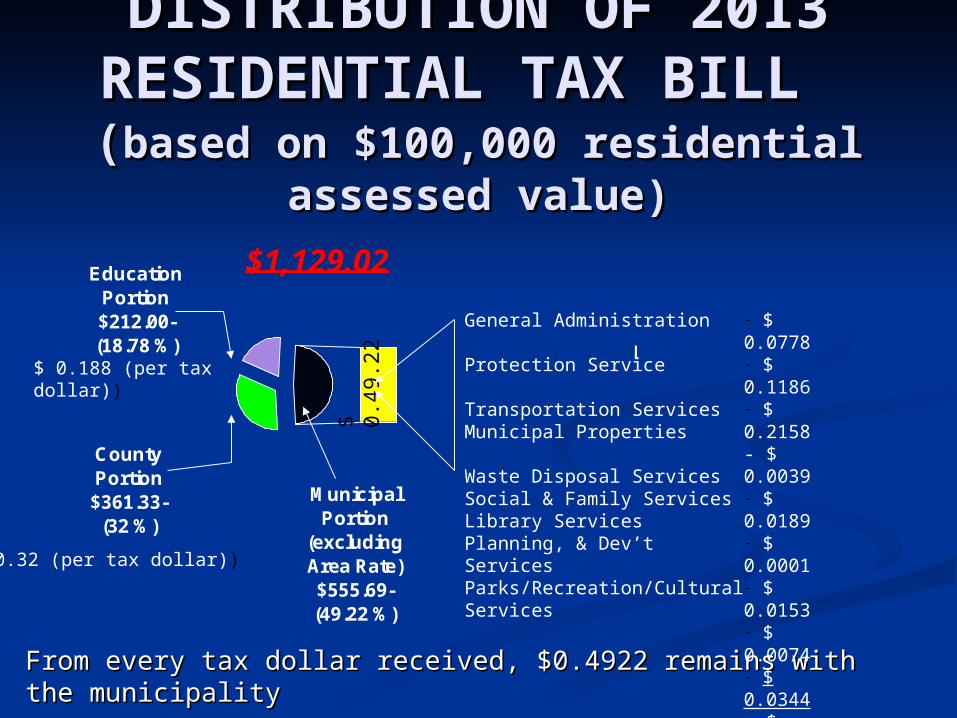
DISTRIBUTION OF 2013 DISTRIBUTION OF 2013 RESIDENTIAL TAX BILLRESIDENTIAL TAX BILL ((based on $100,000 residential based on $100,000 residential
assessed value)assessed value)$1,129.02
County Portion $361.33-
(32 %)
Municipal Portion
(excluding Area Rate) $555.69- (49.22 %)
Education Levy
$296.83- (18.95%)
Education Portion $212.00- (18.78 %)
From every tax dollar received, $0.4922 remains with the From every tax dollar received, $0.4922 remains with the municipalitymunicipality
General Administration
Protection Service Transportation ServicesMunicipal Properties
Waste Disposal ServicesSocial & Family ServicesLibrary ServicesPlanning, & Dev’t ServicesParks/Recreation/Cultural Services
- $ 0.0778- $ 0.1186- $ 0.2158- $ 0.0039- $ 0.0189- $ 0.0001- $ 0.0153- $ 0.0074- $ 0.0344 $ 0.4922
$ 0.188 (per tax dollar))
$ 0.32 (per tax dollar))
$
0.4
9.2
2

HOW THE TAX DOLLAR THAT REMAINS HOW THE TAX DOLLAR THAT REMAINS WITH THE MUNICIPALITY ARE SPENT WITH THE MUNICIPALITY ARE SPENT
General Administration $ 0.1581
Protection Services $ 0.2410
Transportation Services $ 0.4385
Municipal Properties $ 0.0078
Waste Management Services $ 0.0384
Social & Family Services $ 0.0002
Library Services $ 0.0311
Planning/Economic Dev’t/Emergency Preparedness
$ 0.0150
Parks & Recreation Services $ 0.0699
$ 1.000
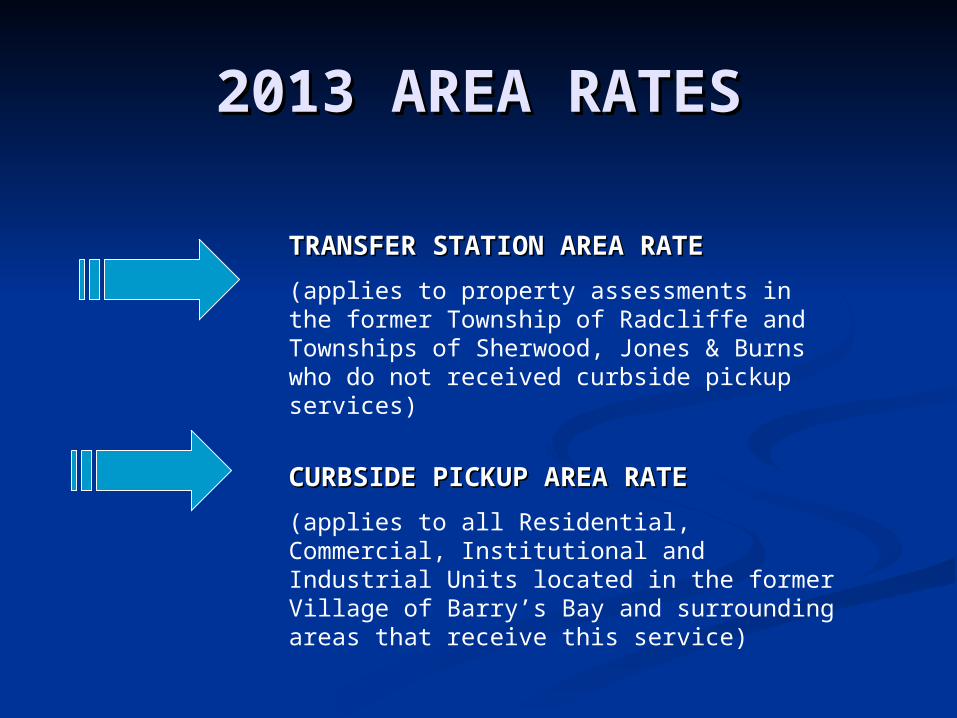
2013 AREA RATES2013 AREA RATES
TRANSFER STATION AREA RATETRANSFER STATION AREA RATE
(applies to property assessments in the former Township of Radcliffe and Townships of Sherwood, Jones & Burns who do not received curbside pickup services)
CURBSIDE PICKUP AREA RATECURBSIDE PICKUP AREA RATE
(applies to all Residential, Commercial, Institutional and Industrial Units located in the former Village of Barry’s Bay and surrounding areas that receive this service)

TRANSFER STATION AREA TRANSFER STATION AREA RATERATE
Capital Reserve $28,322
( 20.69 % )
Operating Expense $108,565
( 79.31 % )
Capital Expense $0
( 0.0 % )
Transfer Station Area Rate Budget decreased by 5.16%Transfer Station Area Rate Budget decreased by 5.16%
$ 136,887

TRANSFER STATION TRANSFER STATION PROPERTIES - BUDGET PROPERTIES - BUDGET
IMPACT IMPACT
Transfer Station Area RateTransfer Station Area Rate
20122012 31.14 (based on $100,000 property 31.14 (based on $100,000 property assessment assessment
20132013* In process of being determined at this time* In process of being determined at this time
(transitioning towards a per unit charge versus (transitioning towards a per unit charge versus a charge based on property assessment)a charge based on property assessment)
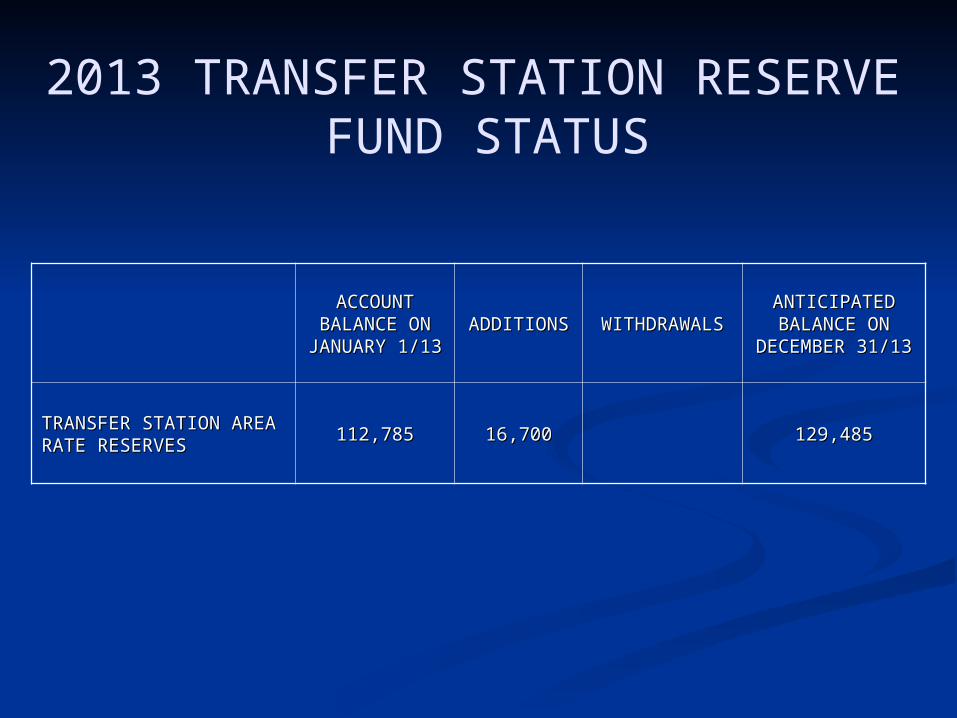
2013 TRANSFER STATION RESERVE FUND STATUS
ACCOUNT ACCOUNT BALANCE ON BALANCE ON JANUARY 1/13JANUARY 1/13
ADDITIONSADDITIONS WITHDRAWALWITHDRAWALSS
ANTICIPATED ANTICIPATED BALANCE ON BALANCE ON
DECEMBER 31/13DECEMBER 31/13
TRANSFER STATION AREA TRANSFER STATION AREA RATE RESERVESRATE RESERVES 112,785112,785 16,70016,700 129,485129,485

CURBSIDE PICKUP AREA CURBSIDE PICKUP AREA RATERATE$151,372$151,372
2013 CURBSIDE AREA RATES:2013 CURBSIDE AREA RATES:
Residential Unit Rate: $ 130.00 Small Industrial, Commercial & Institutional Rate: $ 195.00
Medium Industrial, Commercial & Institutional Rate: $ 910.00 Large Industrial, Commercial & Institutional Rate: $1,820.00
Extra-Large Industrial, Commercial & Institutional Rate: $3,900.00
2013 RATES will remain unchanged

2013 CURBSIDE AREA 2013 CURBSIDE AREA RATE RESERVE FUND RATE RESERVE FUND
STATUSSTATUS
ACCOUNT ACCOUNT BALANCE ON BALANCE ON
JAN 1/13JAN 1/13ADDITIONSADDITIONS WITHDRAWALSWITHDRAWALS
ANTICIPATED ANTICIPATED BALANCE ON BALANCE ON
DECEMBER 31/13DECEMBER 31/13
CURBSIDE CURBSIDE AREA RATE AREA RATE RESERVESRESERVES
$86.730$86.730 $30,000$30,000 $116,730$116,730

As previously noted for the 2013 taxation year, the average Single Family Residential Assessment as determined by the OPTA increased by 1.8%, from $137,000 in 2012 to $139,500.
The percentage assessment increases for individual properties will vary therefore each property will be impacted differently, some less while others more. Keep in mind that properties, including Seasonal Recreational/Waterfront, that are in other property classifications will experience different impacts dependent upon the assessment increase.
Properties that experience up to a 0.8% assessment increase will see their property taxes remain the same or decrease. Any assessment increases above this amount will see increases dependent upon the value of the property increase.
INCREASED ASSESSMENT INCREASED PROPERTY TAXES

TOTAL 2013 TAXATION BILLING TOTAL 2013 TAXATION BILLING IMPACTIMPACT
Based on the average Single Family Residential Assessment for properties that receive curbside pickup services
ASSESSMENTASSESSMENTMUNICIPAL MUNICIPAL TAXATION TAXATION
LEVYLEVY
CURBSIDE CURBSIDE PICKUPPICKUP
AREA RATEAREA RATE
COUNTY COUNTY LEVYLEVY
EDUCATION EDUCATION LEVYLEVY
TOTAL TOTAL PROPERTY PROPERTY
TAXESTAXES
20122012 137,000137,000 752.91752.91 130.00130.00 503.46503.46 302.77302.77 1,689.141,689.14
20132013 139,500139,500 775.19775.19 130.00130.00 504.06504.06 295.74295.74 1,704.991,704.99
A $15.85 INCREASE over the amount paid in 2012A $15.85 INCREASE over the amount paid in 2012
0.93 %
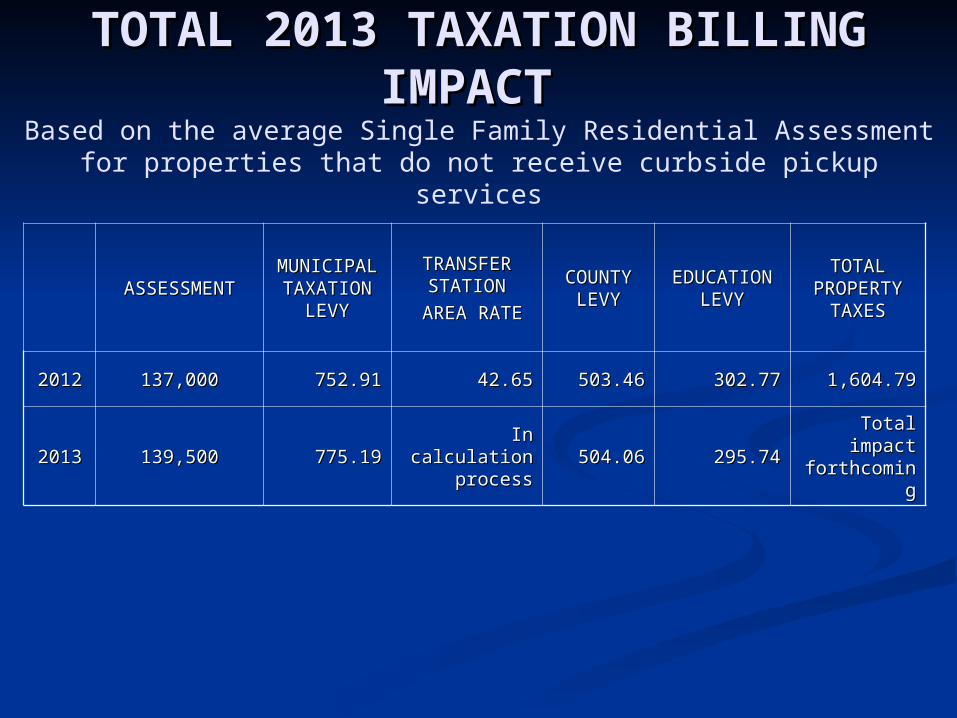
TOTAL 2013 TAXATION BILLING TOTAL 2013 TAXATION BILLING IMPACTIMPACT
Based on the average Single Family Residential Assessment for properties that do not receive curbside pickup services
ASSESSMENTASSESSMENTMUNICIPAL MUNICIPAL TAXATION TAXATION
LEVYLEVY
TRANSFER TRANSFER STATIONSTATION
AREA RATEAREA RATE
COUNTY COUNTY LEVYLEVY
EDUCATION EDUCATION LEVYLEVY
TOTAL TOTAL PROPERTY PROPERTY
TAXESTAXES
20122012 137,000137,000 752.91752.91 42.6542.65 503.46503.46 302.77302.77 1,604.791,604.79
20132013 139,500139,500 775.19775.19 In calculation In calculation processprocess 504.06504.06 295.74295.74
Total Total impact impact
forthcomingforthcoming

THANK YOU !
