2012 natural catastrophe year in review january 3, 2013
TRANSCRIPT

2012 NATURAL CATASTROPHE YEAR IN REVIEW
January 3, 2013

Questions and AnswersQuestions and Answers
Welcome/IntroductionTerese Rosenthal
Welcome/IntroductionTerese Rosenthal
US Natural Catastrophe UpdateCarl Hedde
US Natural Catastrophe UpdateCarl Hedde
Global Natural Catastrophe UpdateErnst Rauch
Global Natural Catastrophe UpdateErnst Rauch
Economic Implications of Natural Catastrophe LossesDr. Robert Hartwig
Economic Implications of Natural Catastrophe LossesDr. Robert Hartwig
Agenda
2

You will have an opportunity to ask questions at the conclusion of the presentation.
To ask a question, please dial 1 4 on your phone.
An operator will facilitate your participation.
You will have an opportunity to ask questions at the conclusion of the presentation.
To ask a question, please dial 1 4 on your phone.
An operator will facilitate your participation.
Webinar Interactivity
3
@iiiorg @lWorter@iiiorg @lWorter
Questions and AnswersQuestions and Answers
Live TweetingLive Tweeting
#NATCAT2012#NATCAT2012
US NATURAL CATASTROPHE UPDATE
Carl Hedde, SVP, Head of Risk AccumulationMunich Reinsurance America, Inc.

From 1980 until today all loss events; for USA and selected countries in Europe all loss events since 1970.
Retrospectively, all great disasters since 1950.
In addition, all major historical events starting from 79 AD – eruption of Mt. Vesuvius (3,000 historical data sets).
Currently more than 31,000 data sets
5
The Database TodayThe Database Today
MR NatCatSERVICEOne of the world‘s largest databases on natural catastrophes

2012 Headlines
Insured losses in the United States in 2012 totaled $57.9 billion – far above the 2000 to 2011 average loss of $27 billion (in 2012 Dollars).
Hurricane Sandy makes landfall in New Jersey, becoming the worst
storm to hit northeastern United States since the Great New England
Hurricane of 1938, causing insured losses in excess of $25 billion.
Despite a relatively quiet year for tornadoes, insured losses from
thunderstorm events exceeded $14 billion, the second highest annual
total on record.
Severe drought cripples agriculture over large section of central United
States.
Dry conditions lead to the most damaging wildfires in Colorado history.
6
US Natural Catastrophe Update
© 2013 Munich Re

Natural Disaster Losses in the United States 2012
7
US Natural Catastrophe Update
© 2013 Munich ReSource: MR NatCatSERVICE† - Includes Federal Crop Insurance Losses.
50
100
150
200
250
300
1980 1982 1984 1986 1988 1990 1992 1994 1996 1998 2000 2002 2004 2006 2008 2010 2012
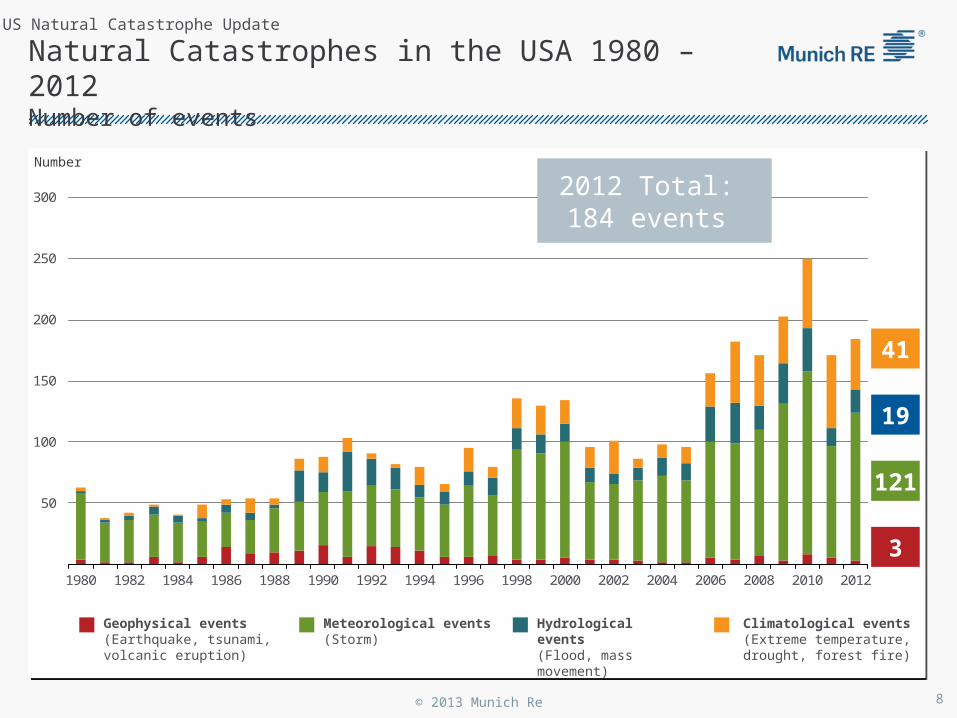
Natural Catastrophes in the USA 1980 – 2012 Number of events
Number
Meteorological events(Storm)
Hydrological events(Flood, mass movement)
Climatological events(Extreme temperature, drought, forest fire)
Geophysical events(Earthquake, tsunami, volcanic eruption)
3
121
19
41
2012 Total: 184 events
8
US Natural Catastrophe Update
© 2013 Munich Re

20
40
60
80
100
120
140
160
180
200
1980 1982 1984 1986 1988 1990 1992 1994 1996 1998 2000 2002 2004 2006 2008 2010 2012
Natural catastrophes in the USA 1980 – 2012 Overall and insured losses
(bn US$)
Overall losses (in 2012 values) Insured losses (in 2012 values)
Insured losses in the U.S. In 2012 were the second highest on record.Insured losses in the U.S. In 2012 were the second highest on record.
9
US Natural Catastrophe Update
© 2013 Munich Re

Significant Natural Catastrophes, June – Sept 2012 $1 billion economic loss and/or 50 fatalities
1010
US Natural Catastrophe Update
© 2013 Munich ReSource: MR NatCatSERVICE† - Includes Federal Crop Insurance Losses.

Eleven significant natural catastrophes occurred in the United States in 2011.Eleven significant natural catastrophes occurred in the United States in 2011.
Sources: MR NatCatSERVICE
Significant Natural Catastrophes, 1950 – 2012Number of Events ($1 billion economic loss and/or 50 fatalities)
11
US Natural Catastrophe Update
© 2013 Munich Re
Photo: NASA
US TROPICAL CYCLONES 2012

Tropical Cyclones Impacting the United States in 2012
Source: NOAA
Isaac
Sandy
Beryl
Debby
13
US Natural Catastrophe Update
© 2013 Munich Re

US Hurricanes in 2012
Landfalls on August 28 over the Mississippi River delta and Port Fourchon, Louisiana
Minor to moderate wind damage in Louisiana and Mississippi, indirect wind damage due to tree fall further north.
Storm surges up to 11 feet in some locations, but New Orleans levees held but some breached south of city; heavy rainfall caused significant inland flooding.
Economic Losses in US of $2 billion, insured losses of $1.2 billion
Landfalls on August 28 over the Mississippi River delta and Port Fourchon, Louisiana
Minor to moderate wind damage in Louisiana and Mississippi, indirect wind damage due to tree fall further north.
Storm surges up to 11 feet in some locations, but New Orleans levees held but some breached south of city; heavy rainfall caused significant inland flooding.
Economic Losses in US of $2 billion, insured losses of $1.2 billion Photo: FEMA
Hurricane IsaacHurricane Isaac
14
US Natural Catastrophe Update
© 2013 Munich Re

US Hurricanes in 2012
Photo: FEMA
Landfalls on October 29 near Atlantic City, NJ
Minor to moderate wind damage along coasts of NY and NJ, widespread indirect wind damage and power outages due to tree fall across 15 states.
Record storm surge of 13.88 feet in Battery Park, NY and 15+ feet along New Jersey coast.
Economic Losses in U.S. of $50 billion, insured losses of $25 billion
Hurricane SandyHurricane Sandy
15
US Natural Catastrophe Update
© 2013 Munich Re

Impacts of Hurricane Sandy
Hurricane Sandy
Add few more bullet points
Photo: FEMA
16
US Natural Catastrophe Update
© 2013 Munich Re

Other US Tropical Cyclones in 2012
Landfall on May 28 near Jacksonville, Florida as a tropical storm with sustained winds of 70 mph; strongest May tropical storm ever to make US landfall.
Minor wind damage and flooding in Florida and Georgia.
Landfall on May 28 near Jacksonville, Florida as a tropical storm with sustained winds of 70 mph; strongest May tropical storm ever to make US landfall.
Minor wind damage and flooding in Florida and Georgia.
Tropical Storm BerylTropical Storm Beryl
Tropical Storm DebbyTropical Storm Debby
Landfall on June 26 near Steinhatchee, Florida as a tropical storm with sustained winds of 40 mph.
Torrential rains of up to 25” caused extensive flooding in the Florida Panhandle, with lesser flooding elsewhere in the state.
Landfall on June 26 near Steinhatchee, Florida as a tropical storm with sustained winds of 40 mph.
Torrential rains of up to 25” caused extensive flooding in the Florida Panhandle, with lesser flooding elsewhere in the state.
17
US Natural Catastrophe Update
© 2013 Munich Re

There has not been a major hurricane landfall in the US since Wilma in 2005.There has not been a major hurricane landfall in the US since Wilma in 2005.
Number of US Landfalling Tropical Cyclones1900 - 2012
Source: NOAA 18
US Natural Catastrophe Update
© 2013 Munich Re
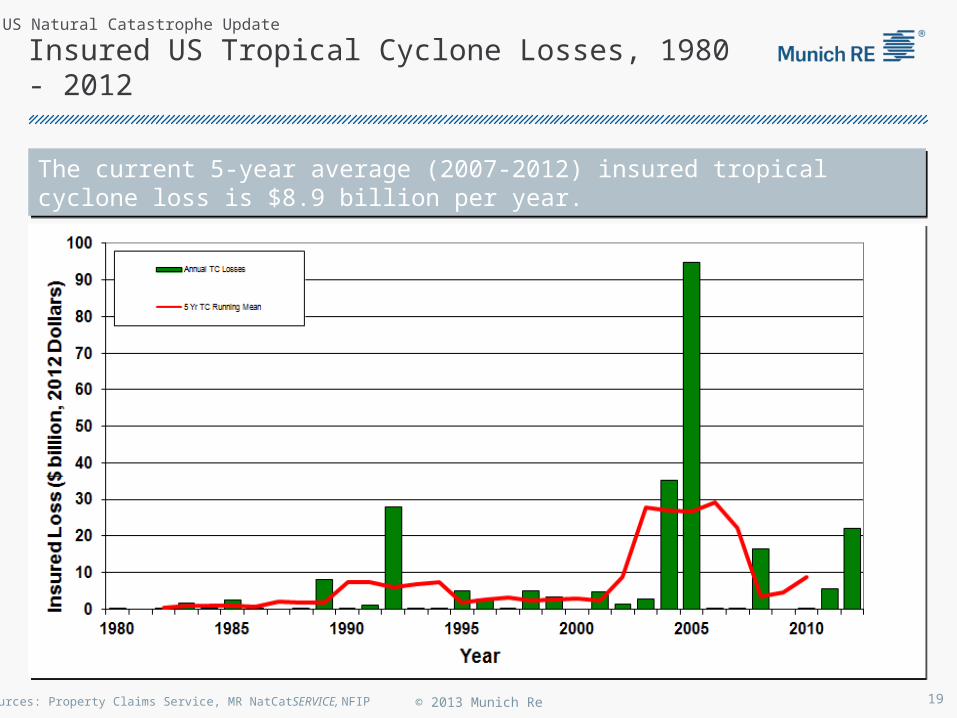
The current 5-year average (2007-2012) insured tropical cyclone loss is $8.9 billion per year.The current 5-year average (2007-2012) insured tropical cyclone loss is $8.9 billion per year.
Insured US Tropical Cyclone Losses, 1980 - 2012
Sources: Property Claims Service, MR NatCatSERVICE, NFIP 19
US Natural Catastrophe Update
© 2013 Munich Re

Source: FEMASource: FEMA
2012 US THUNDERSTORM SEASON

2012 US Tornado Count
21
US Natural Catastrophe Update
© 2013 Munich Re
Source: Property Claims ServiceMR NatCatSERVICE
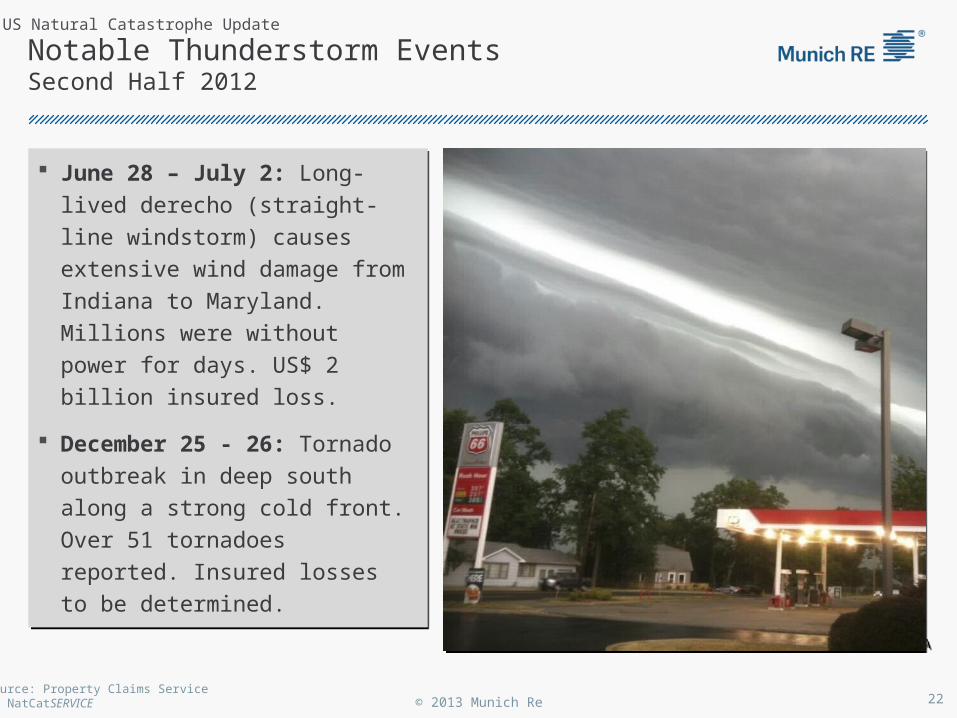
Notable Thunderstorm EventsSecond Half 2012
Source: FEMASource: FEMA
June 28 – July 2: Long-lived
derecho (straight-line windstorm)
causes extensive wind damage
from Indiana to Maryland.
Millions were without power for
days. US$ 2 billion insured loss.
December 25 - 26: Tornado
outbreak in deep south along a
strong cold front. Over 51
tornadoes reported. Insured
losses to be determined.
22
US Natural Catastrophe Update
© 2013 Munich Re

Source: Property Claims ServiceMR NatCatSERVICE
US Thunderstorm Loss TrendsAnnual Totals 1980 – 2012
Average thunderstorm losses have increased sevenfold since 1980.Average thunderstorm losses have increased sevenfold since 1980.
First Half 2011 $16.4 bn
2011 Total: $16.4 bn
23
US Natural Catastrophe Update
© 2013 Munich Re

OTHER US NATURAL CATASTROPHES IN 2012
Source: FEMASource: FEMA

Current US Drought Conditions
25
US Natural Catastrophe Update
© 2013 Munich Re

2012 US Drought Impacts
Worst drought in at least 25 years, dry to severe drought conditions affected over 1,600 counties across 36 states at its peak – over 60% of the United States.
Severe damage to crops (soybeans, corn) and livestock
Low water levels along Mississippi River disrupted shipping.
Economic Losses are estimated at $20 billion.
26
US Natural Catastrophe Update
© 2013 Munich Re

Number of Acres Burned in Wildfires, 1980 – 2012
Source: National Interagency Fire Center 2727
US Natural Catastrophe Update
© 2013 Munich Re

Notable Wildfires in 2012
Colorado: “High Park” fire near Fort Collins destroyed 257 homes and “Waldo Canyon” fire near Colorado Springs destroyed over 300 homes, becoming the most damaging fire in state history. Insured losses from both fires are estimated at $450 million.
New Mexico: “Whitewater-Baldy” fire scorched over 278,000 acres over May and June, becoming the largest wildfire in state history, but with minimal insurance impacts.
Source: FEMA
Source: USFSSource: USFS
28
US Natural Catastrophe Update
© 2013 Munich Re

2012 US Summary
Insured losses in the United States in 2012 totaled $57.9 billion – far above the 2000 to 2011 average loss of $27 billion (in 2012 Dollars).
Hurricane Sandy makes landfall in New Jersey, becoming the worst
storm to hit northeastern United States since the Great New England
Hurricane of 1938, causing insured losses in excess of $25 billion.
Despite a relatively quiet year for tornadoes, insured losses from
thunderstorm events exceeded $14 billion, the second highest annual
total on record.
Severe drought cripples agriculture over large section of central United
States.
Dry conditions lead to the most damaging wildfires in Colorado history.
29
US Natural Catastrophe Update
© 2013 Munich Re

NATURAL CATASTROPHES WORLDWIDE
Ernst RauchHead of Corporate Climate CentreMunich Re
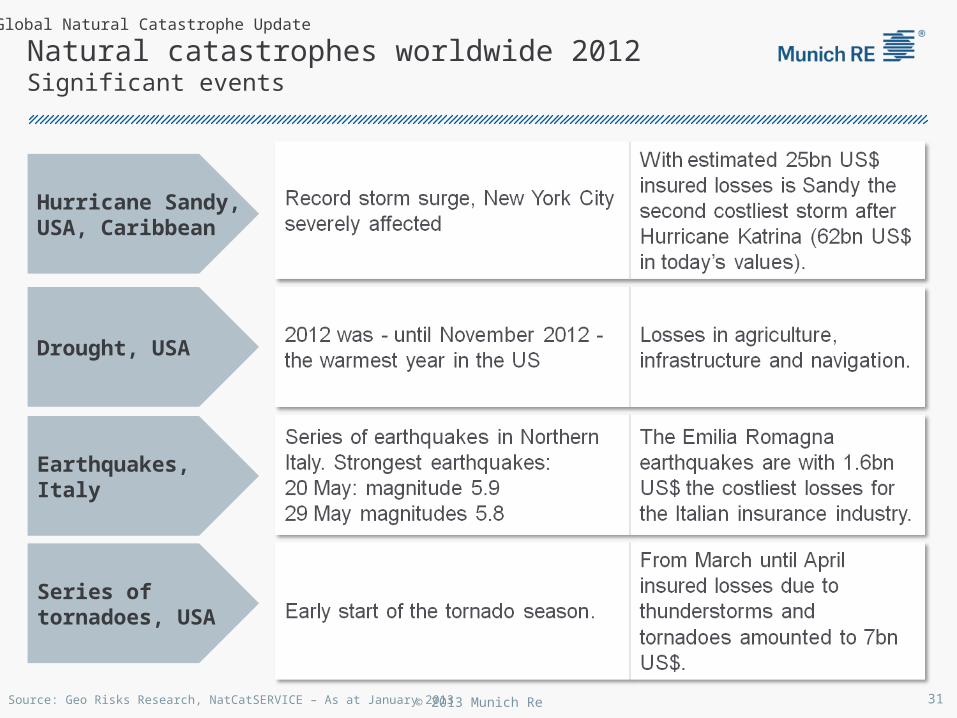
Natural catastrophes worldwide 2012 Significant events
Hurricane Sandy, USA, Caribbean
Drought, USA
Earthquakes, Italy
Series of tornadoes, USA
31
Global Natural Catastrophe Update
© 2013 Munich ReSource: Geo Risks Research, NatCatSERVICE – As at January 2013
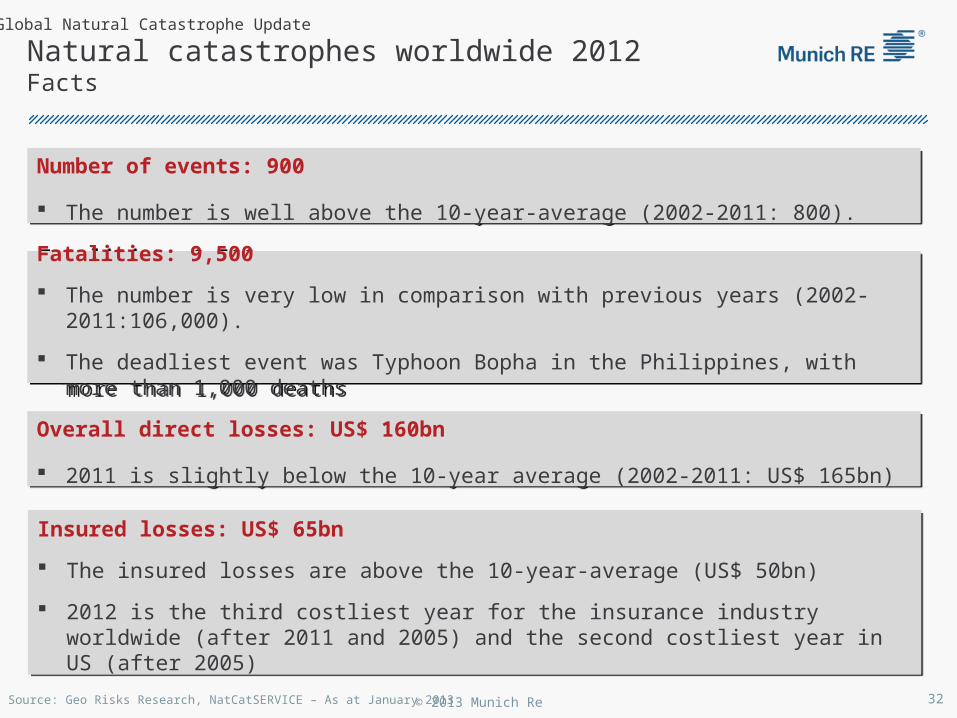
Natural catastrophes worldwide 2012Facts
Number of events: 900
The number is well above the 10-year-average (2002-2011: 800).
Number of events: 900
The number is well above the 10-year-average (2002-2011: 800).
Overall direct losses: US$ 160bn
2011 is slightly below the 10-year average (2002-2011: US$ 165bn)
Overall direct losses: US$ 160bn
2011 is slightly below the 10-year average (2002-2011: US$ 165bn)
Insured losses: US$ 65bn
The insured losses are above the 10-year-average (US$ 50bn)
2012 is the third costliest year for the insurance industry worldwide (after 2011 and 2005) and the second costliest year in US (after 2005)
Insured losses: US$ 65bn
The insured losses are above the 10-year-average (US$ 50bn)
2012 is the third costliest year for the insurance industry worldwide (after 2011 and 2005) and the second costliest year in US (after 2005)
Fatalities: 9,500
The number is very low in comparison with previous years (2002-2011:106,000).
The deadliest event was Typhoon Bopha in the Philippines, with more than 1,000 deaths
Fatalities: 9,500
The number is very low in comparison with previous years (2002-2011:106,000).
The deadliest event was Typhoon Bopha in the Philippines, with more than 1,000 deaths
32
Global Natural Catastrophe Update
© 2013 Munich ReSource: Geo Risks Research, NatCatSERVICE – As at January 2013

Natural catastrophes worldwide 1980 – 2012Number of events
Number
Meteorological events(Storm)
Hydrological events(Flood, mass movement)
Climatological events(Extreme temperature, drought, forest fire)
Geophysical events(Earthquake, tsunami, volcanic eruption)
200
400
600
800
1 000
1 200
1980 1982 1984 1986 1988 1990 1992 1994 1996 1998 2000 2002 2004 2006 2008 2010 2012
33
Global Natural Catastrophe Update
© 2013 Munich ReSource: Geo Risks Research, NatCatSERVICE – As at January 2013

50
100
150
200
250
300
350
400
450
1980 1982 1984 1986 1988 1990 1992 1994 1996 1998 2000 2002 2004 2006 2008 2010 2012
Natural catastrophes worldwide 1980 – 2012Overall and insured losses
(bn US$)
Overall losses (in 2012 values) Insured losses (in 2012 values)
34
Global Natural Catastrophe Update
© 2013 Munich ReSource: Geo Risks Research, NatCatSERVICE – As at January 2013

3%
83%
1%11%13%
63%
14%
10%
*in 2012 values
*in 2012 values
Natural catastrophes worldwide 2012Percentage distribution
Meteorological events(Storm)
Hydrological events(Flood, mass movement)
Climatological events(Extreme temperature, drought, forest fire)
Geophysical events(Earthquake, tsunami, volcanic eruption)
7%
45%36%
12% 7%
27%
48%
18%
905 Loss events905 Loss events 9,600 Fatalities9,600 Fatalities
Overall losses* US$ 160bn Overall losses* US$ 160bn Insured losses* US$ 65bnInsured losses* US$ 65bn
35
Global Natural Catastrophe Update
© 2013 Munich ReSource: Geo Risks Research, NatCatSERVICE – As at January 2013

Natural catastrophes worldwide 2012 The five costliest natural catastrophes for the insurance industry
36
Global Natural Catastrophe Update
© 2013 Munich ReSource: Geo Risks Research, NatCatSERVICE – As at January 2013

Natural catastrophes worldwide 2012Insured losses US$ 65bn - Percentage distribution per continent
Continent Insured losses US$ m
America (North and South America) 60,000
Europe 3,200
Africa 200
Asia 1,700
Australia/Oceania 300
5%
<1%
<1%
91% <3%
37
Global Natural Catastrophe Update
© 2013 Munich ReSource: Geo Risks Research, NatCatSERVICE – As at January 2013

Natural catastrophes worldwide 2012Insured losses US$ 65bn - Percentage distribution per continent
Continent Insured losses US$ m
America (North and South America) 60,000
Europe 3,200
Africa 200
Asia 1,700
Australia/Oceania 300
5%
<1%
<1%
65%
91%2012: 91 %
1980-2011: 65 %<3%
38
Global Natural Catastrophe Update
© 2013 Munich ReSource: Geo Risks Research, NatCatSERVICE – As at January 2013

Natural catastrophes worldwide 2012Overall losses US$ 160bn - Percentage distribution per continent
Continent Overall losses US$ m
America (North and South America) 110,000
Europe 21,000
Africa 1,000
Asia 26,000
Australia/Oceania 1,000
69%
<1%
39
Global Natural Catastrophe Update
© 2013 Munich ReSource: Geo Risks Research, NatCatSERVICE – As at January 2013

EarthquakeMexico, 20 March
EarthquakeItaly, 29 May/3 June
EarthquakeIran, 11 August
Severe Storms, tornadoesUSA, 2–4 March
Severe WeatherUSA, 28–29 April Severe storms
USA, 28 June –2 July
Hurricane IsaacUSA, Caribbean24–31 August
Hurricane SandyUSA, Caribbean24–31 October
Floods, flash floodsAustralia, Jan – Feb
Flash FloodsRussia, 6–8 July
FloodsChina, 21–24 July
DroughtUSA, Summer
Cold WaveEastern Europe, Jan – Feb
Cold WaveAfghanistan, Jan – Mar
FloodsUnited Kingdom, 21–27 November
Typhoon Bopha Philippines, 4–5 December
Floods. flash floodsAustralia, Feb – Mar
Typhoon Haikui China, 8–9 August
FloodsNigeria, Jul – Oct
Floods, hailstormsSouth Africa, 20 –21 October
FloodsPakistan, 3 –27 September
FloodsColumbia, Mar – Jun
Hailstorms, severe weatherCanada, 12–14 August
Number of events: 905Number of events: 905
Natural Catastrophes 2012
Geophysical events(earthquake, tsunami, volcanic activity)
Meteorological events (storm)
Selection of significant Natural catastrophes
Natural catastrophes Hydrological events(flood, mass movement)
Climatological events(extreme temperature, drought, wildfire)
Winter Storm AndreaEurope, 5–6 January
40
Global Natural Catastrophe Update
© 2013 Munich ReSource: Geo Risks Research, NatCatSERVICE – As at January 2013
World map

Earthakes ItalyMay 2012
Region Overall losses Insured losses Fatalities
Northern Italy, Emilia Romagna US$ 16bn US$ 1.6bn 18
Costliest insured loss 2012 outside US
41
Global Natural Catastrophe Update
© 2013 Munich ReSource: Geo Risks Research, NatCatSERVICE – As at January 2013

Typhoon Bopha, Philippines4 – 5 December 2012
Region Overall losses Insured losses Fatalities
South Philippines US$ 600m minor 1,100
Source: Reuters
Deadliest event of 2012
42
Global Natural Catastrophe Update
© 2013 Munich ReSource: Geo Risks Research, NatCatSERVICE – As at January 2013
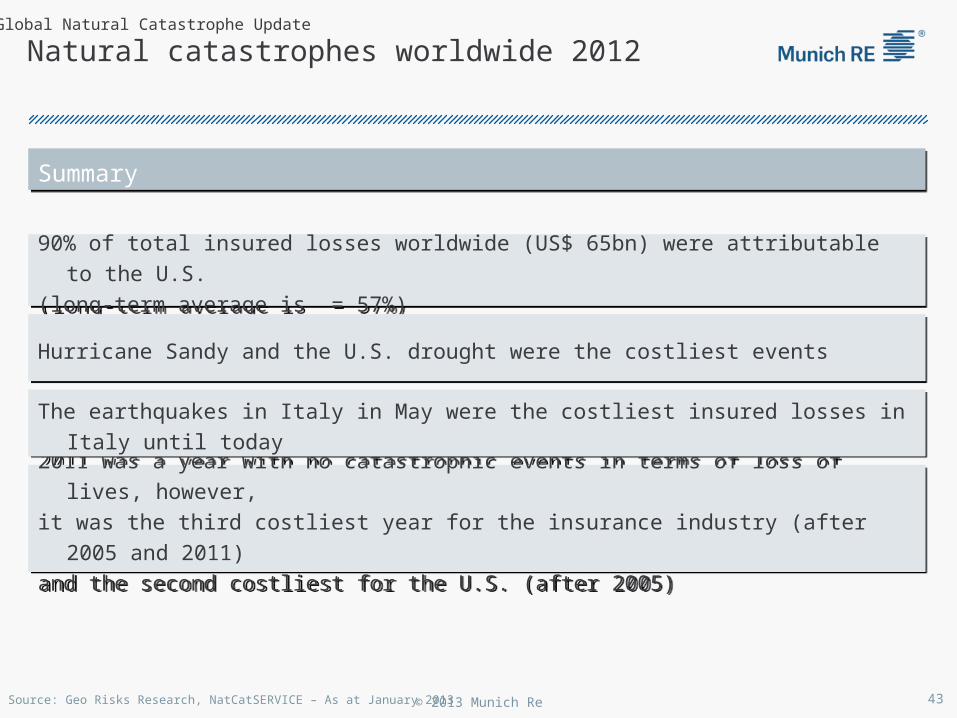
Natural catastrophes worldwide 2012
SummarySummary
90% of total insured losses worldwide (US$ 65bn) were attributable to the U.S.
(long-term average is = 57%)
90% of total insured losses worldwide (US$ 65bn) were attributable to the U.S.
(long-term average is = 57%)
Hurricane Sandy and the U.S. drought were the costliest eventsHurricane Sandy and the U.S. drought were the costliest events
2011 was a year with no catastrophic events in terms of loss of lives, however,
it was the third costliest year for the insurance industry (after 2005 and 2011)
and the second costliest for the U.S. (after 2005)
2011 was a year with no catastrophic events in terms of loss of lives, however,
it was the third costliest year for the insurance industry (after 2005 and 2011)
and the second costliest for the U.S. (after 2005)
The earthquakes in Italy in May were the costliest insured losses in Italy until todayThe earthquakes in Italy in May were the costliest insured losses in Italy until today
43
Global Natural Catastrophe Update
© 2013 Munich ReSource: Geo Risks Research, NatCatSERVICE – As at January 2013
Market & Financial Impact of Catastrophe Loss:
Full Year 2012
Insurance Information InstituteJanuary 3, 2013
Robert P. Hartwig, Ph.D., CPCU, President & EconomistInsurance Information Institute 110 William Street New York, NY 10038
Tel: 212.346.5520 Cell: 917.453.1885 [email protected] www.iii.org

45
P/C Insurance Industry Financial Overview
Industry Was Very Strong When Sandy Struck;
Financial Strength Remains Intact for 2013
45

P/C Net Income After Taxes1991–2012:Q3 ($ Millions)
$1
4,1
78
$5
,84
0
$1
9,3
16
$1
0,8
70
$2
0,5
98
$2
4,4
04 $
36
,81
9
$3
0,7
73
$2
1,8
65
$3
,04
6
$3
0,0
29
$6
2,4
96
$3
,04
3
$3
5,2
04
$1
9,1
50
$2
6,9
81
$2
8,6
72
-$6,970
$6
5,7
77
$4
4,1
55
$2
0,5
59
$3
8,5
01
-$10,000
$0
$10,000
$20,000
$30,000
$40,000
$50,000
$60,000
$70,000
$80,000
91 92 93 94 95 96 97 98 99 00 01 02 03 04 05 06 07 08 09 10 11 12:Q3
2005 ROE*= 9.6% 2006 ROE = 12.7% 2007 ROE = 10.9% 2008 ROE = 0.1% 2009 ROE = 5.0% 2010 ROE = 6.6% 2011 ROAS1 = 3.5% 2012:Q3 ROAS1 = 6.3%
P-C Industry 2012:Q3 profits were up 222% from 2011:Q3, due primarily to lower catastrophe losses
* ROE figures are GAAP; 1Return on avg. surplus. Excluding Mortgage & Financial Guaranty insurers yields a 6.6% ROAS through 2012:Q3, 4.6% ROAS for 2011, 7.6% for 2010 and 7.4% for 2009.Sources: A.M. Best, ISO, Insurance Information Institute
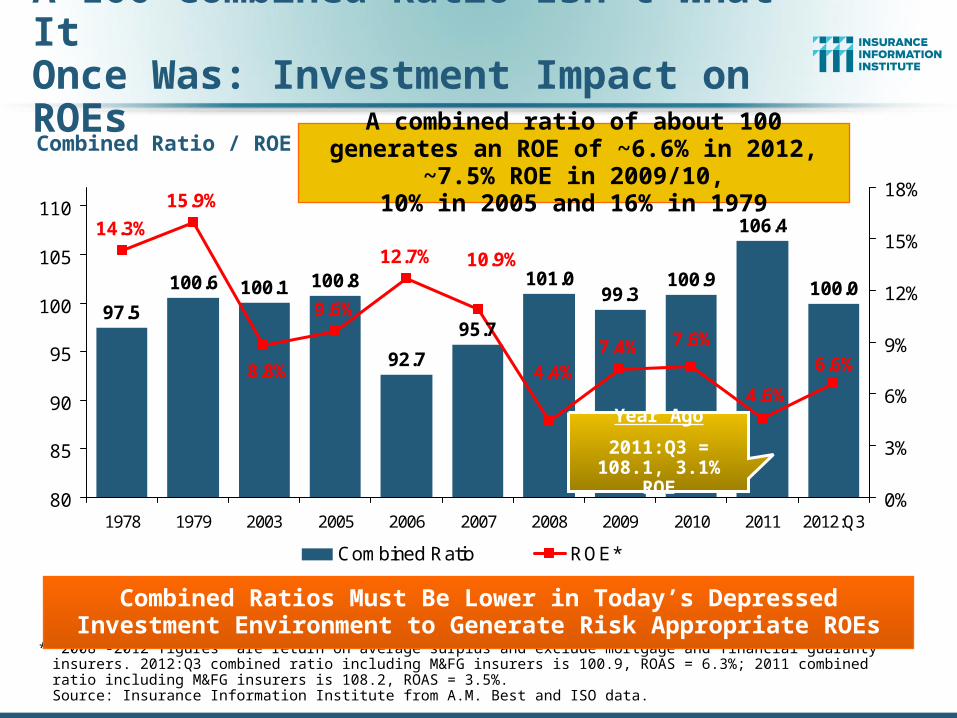
A 100 Combined Ratio Isn’t What ItOnce Was: Investment Impact on ROEs
Combined Ratio / ROE
* 2008 -2012 figures are return on average surplus and exclude mortgage and financial guaranty insurers. 2012:Q3 combined ratio including M&FG insurers is 100.9, ROAS = 6.3%; 2011 combined ratio including M&FG insurers is 108.2, ROAS = 3.5%. Source: Insurance Information Institute from A.M. Best and ISO data.
97.5
100.6 100.1 100.8
92.7
101.099.3
100.9 100.0
106.4
95.7
6.6%
4.6%
7.6%7.4%4.4%
9.6%
15.9%
14.3%
12.7% 10.9%
8.8%
80
85
90
95
100
105
110
1978 1979 2003 2005 2006 2007 2008 2009 2010 2011 2012:Q30%
3%
6%
9%
12%
15%
18%
Combined Ratio ROE*
Combined Ratios Must Be Lower in Today’s DepressedInvestment Environment to Generate Risk Appropriate ROEs
A combined ratio of about 100 generates an ROE of ~6.6% in 2012, ~7.5% ROE in 2009/10,
10% in 2005 and 16% in 1979
Year Ago
2011:Q3 = 108.1, 3.1% ROE

-5%
0%
5%
10%
15%
20%
25%
75
76
77
78
79
80
81
82
83
84
85
86
87
88
89
90
91
92
93
94
95
96
97
98
99
00
01
02
03
04
05
06
07
08
09
10
11
*1
2:
Profitability Peaks & Troughs in the P/C Insurance Industry, 1975 – 2012:Q3*
*Profitability = P/C insurer ROEs. 2011 figure is an estimate based on ROAS data. Note: Data for 2008-2012 exclude mortgage and financial guaranty insurers. 2012:Q3 ROAS = 6.2% including M&FG.Source: Insurance Information Institute; NAIC, ISO, A.M. Best.
1977:19.0% 1987:17.3%
1997:11.6%2006:12.7%
1984: 1.8% 1992: 4.5% 2001: -1.2%
10 Years
10 Years9 Years
2011:4.6%*
History suggests next ROE peak will be in 2016-2017
ROE
1975: 2.4%
2012:Q3: 6.6%
SURPLUS/CAPITAL/CAPACITY
49
Industry Claims Paying Capital Was at a Record High When Hurricane Sandy
Struck; Capacity Remains Close to Historic Highs for 2013;
No “Fiscal Cliff” in the P/C (Re)Insurance Industry
49

50
Policyholder Surplus, 2006:Q4–2012:Q3
Sources: ISO, A.M .Best.
($ Billions)
$487.1$496.6
$512.8$521.8
$478.5
$455.6
$437.1
$463.0
$490.8
$511.5
$540.7$530.5
$544.8
$559.2 $559.1
$538.6
$550.3
$567.8
$583.5
$570.7$566.5
$505.0
$515.6$517.9
$420
$440
$460
$480
$500
$520
$540
$560
$580
06:Q4 07:Q1 07:Q2 07:Q3 07:Q4 08:Q1 08:Q2 08:Q3 08:Q4 09:Q1 09:Q2 09:Q3 09:Q4 10:Q1 10:Q2 10:Q3 10:Q4 11:Q1 11:Q2 11:Q3 11:Q4 12:Q1 12:Q2 12:Q3
2007:Q3Pre-Crisis Peak
Surplus as of 9/30/12 was up $12.8B or 2.2% from the
previous record high of $570.7B set as of 3/31/12.
*Includes $22.5B of paid-in capital from a holding company parent for one insurer’s investment in a non-insurance business in early 2010.
The Industry now has $1 of surplus for every $0.80
of NPW, close to the strongest claims-paying
status in its history.
Drop due to near-record 2011 CAT losses
The P/C Insurance Industry Both Entered and Emerged from the 2012 Hurricane
Season Very Strong Financially. There is No Insurance Industry “Fiscal Cliff”

51
Catastrophe Losses Impact Trajectory of Premium Growth
51
PREMIUM GROWTH

52
-5%
0%
5%
10%
15%
20%
25%
71 72 73 74 75 76 77 78 79 80 81 82 83 84 85 86 87 88 89 90 91 92 93 94 95 96 97 98 99 00 01 02 03 04 05 06 07 08 09 10 11 12
Net Premium Growth: Annual Change, 1971—2012:Q3
(Percent)1975-78 1984-87 2000-03
Shaded areas denote “hard market” periodsSources: A.M. Best (historical and forecast), ISO, Insurance Information Institute.
Net Written Premiums Fell 0.7% in 2007 (First Decline
Since 1943) by 2.0% in 2008, and 4.2% in 2009, the First 3-Year Decline Since 1930-33.
2012:Q3 growth
was +4.2%

53
P/C Net Premiums Written: % Change, Quarter vs. Year-Prior Quarter
Sources: ISO, Insurance Information Institute.
Sustained Growth in Written Premiums(vs. the same quarter, prior year) Will Continue into 2013
10.2
%15
.1%
16.8
%16
.7%
12.5
%10
.1%
9.7%
7.8%
7.2%
5.6%
2.9%
5.5%
-4.6
%-4
.1%
-5.8
%-1
.6%
10.3
%10
.2% 13
.4%
6.6%
-1.6
%2.
1%0.
0%-1
.9%
0.5%
-1.8
%-0
.7%
-4.4
%-3
.7%
-5.3
%-5
.2%
-1.4
%-1
.3%
1.3% 2.
3%1.
7% 3.5%
1.6%
4.1%
3.8%
3.1% 4.
2% 5.1%
-10%
-5%
0%
5%
10%
15%
20%
2002
:Q1
2002
:Q2
2002
:Q3
2002
:Q4
2003
:Q1
2003
:Q2
2003
:Q3
2003
:Q4
2004
:Q1
2004
:Q2
2004
:Q3
2004
:Q4
2005
:Q1
2005
:Q2
2005
:Q3
2005
:Q4
2006
:Q1
2006
:Q2
2006
:Q3
2006
:Q4
2007
:Q1
2007
:Q2
2007
:Q3
2007
:Q4
2008
:Q1
2008
:Q2
2008
:Q3
2008
:Q4
2009
:Q1
2009
:Q2
2009
:Q3
2009
:Q4
2010
:Q1
2010
:Q2
2010
:Q3
2010
:Q4
2011
:Q1
2011
:Q2
2011
:Q3
2011
:Q4
2012
:Q1
2012
:Q2
2012
:Q3
Premium growth in Q3 2012 was up 5.1% over Q3 2011, the strongest growth since Q4 2006

54
Growth in Net Written Premium by Segment, 2012:9 Mos. vs. 2011:9 Mos.*
*Excludes mortgage and financial guaranty insurers.Source: ISO/PCI; Insurance Information Institute
3.2% 3.2%
4.0%
2.4%
4.2%
3.3%
6.1%
3.8%
0%
1%
2%
3%
4%
5%
6%
7%
All Lines Personal LinesPredominating
Commercial LinesPredominating
Diversified Insurers
2011: 9 Mos. 2012: 9 Mos.
(Percent)
UNDERWRITING
55
Underwriting Losses in 2012 (and 2011) Were Elevated by
High Catastrophe Losses
55
56
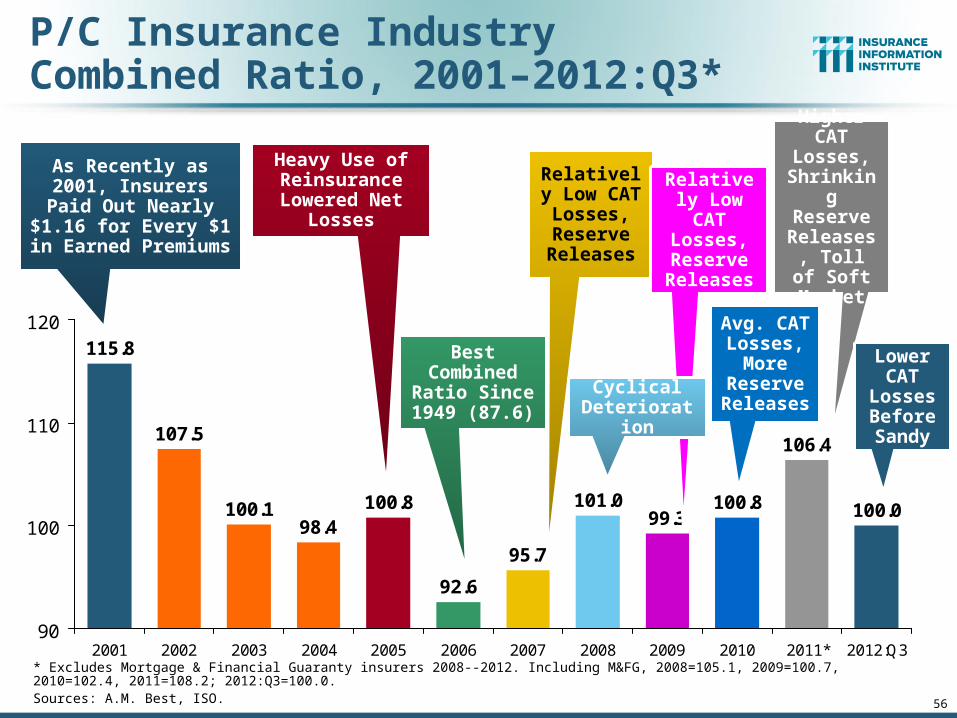
P/C Insurance Industry Combined Ratio, 2001–2012:Q3*
* Excludes Mortgage & Financial Guaranty insurers 2008--2012. Including M&FG, 2008=105.1, 2009=100.7, 2010=102.4, 2011=108.2; 2012:Q3=100.0. Sources: A.M. Best, ISO.
95.7
99.3100.8
106.4
100.0101.0
92.6
100.898.4
100.1
107.5
115.8
90
100
110
120
2001 2002 2003 2004 2005 2006 2007 2008 2009 2010 2011* 2012:Q3
Best Combined
Ratio Since 1949 (87.6)
As Recently as 2001, Insurers Paid Out
Nearly $1.16 for Every $1 in Earned
Premiums
Relatively Low CAT Losses, Reserve Releases
Heavy Use of Reinsurance Lowered Net
Losses
Relatively Low CAT Losses, Reserve Releases
Avg. CAT Losses,
More Reserve Releases
Higher CAT
Losses, Shrinking Reserve
Releases, Toll of Soft
Market
Cyclical Deterioration
Lower CAT
Losses Before Sandy
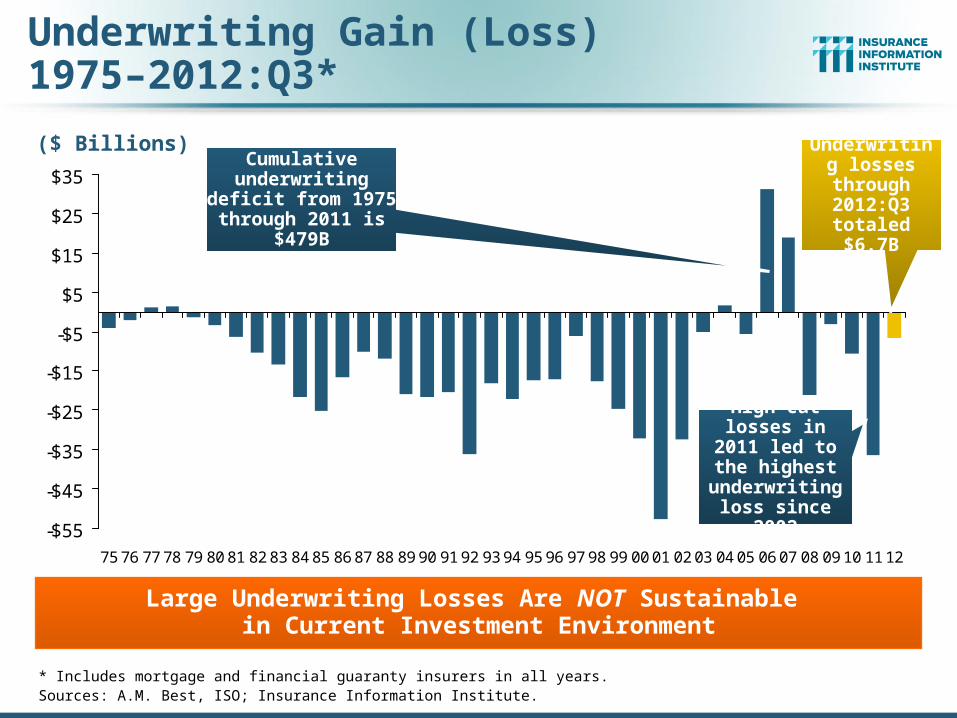
Underwriting Gain (Loss)1975–2012:Q3*
* Includes mortgage and financial guaranty insurers in all years.Sources: A.M. Best, ISO; Insurance Information Institute.
Large Underwriting Losses Are NOT Sustainable in Current Investment Environment
-$55
-$45
-$35
-$25
-$15
-$5
$5
$15
$25
$35
75 76 77 78 79 80 81 82 83 84 85 86 87 88 89 90 91 92 93 94 95 96 97 98 99 00 01 02 03 04 05 06 07 08 09 10 11 12
Cumulative underwriting deficit from 1975 through
2011 is $479B
($ Billions) Underwriting losses
through 2012:Q3
totaled $6.7B
High cat losses in 2011 led to the highest
underwriting loss since 2002

58
Combined Ratios by Predominant Business Segment, 2012:9 Mos. vs. 2011:9 Mos.*
*Excludes mortgage and financial guaranty insurers.Source: ISO/PCI; Insurance Information Institute
109.4108.0
105.4
112.0
100.0 99.498.6
102.7
96
98
100
102
104
106
108
110
112
114
All Lines Personal LinesPredominating
Commercial LinesPredominating
Diversified Insurers
2011:9M 2012:9M
(Percent)
The combined ratios for both personal and commercial lines
improved substantially through 2012:Q3, prior
to Hurricane Sandy

INVESTMENTS: THE NEW REALITY
59
Depressed Yields Will Necessarily Influence Underwriting & Pricing
59

Property/Casualty Insurance Industry Investment Income: 2000–2012E1
$38.9$37.1 $36.7
$38.7
$54.6
$51.2
$47.1 $47.6$49.0
$46.8
$39.6
$49.5
$52.3
$30
$40
$50
$60
00 01 02 03 04 05 06 07 08 09 10 11 12E
Investment Income Fell in 2012 Due to Persistently Low Interest Rates, Putting Additional Pressure on (Re) Insurance Pricing
1 Investment gains consist primarily of interest and stock dividends.*2012F is based on annualized 9M:2012 actual figure of $35.131B.Sources: ISO; Insurance Information Institute.
($ Billions)
Investment earnings in 2012 were running 14% below their 2007 pre-crisis peak

Hurricane Sandy Summary
61
Sandy Will Become One of the Most Expensive Events in
Insurance History
61

Hurricane Sandy Insured Loss Estimates:Late Season Large Loss* ($ Billions)
$10 - $20B
$16 - $22B
$20 - $25B
$0 $5 $10 $15 $20 $25
Eqecat
AIR
RMS
*US insured property and business interruption losses only. Sandy’s landfall in the northeast US occurred Oct. 29, 2012.Sources: RMS (11/14/12 est.), AIR (11/26/12 est.), Eqecat (11/1/12 est.); Compiled by the Insurance Information Institute.
Average of the midpoints of the 3 risk modeler
estimates is $18.8 billion
63
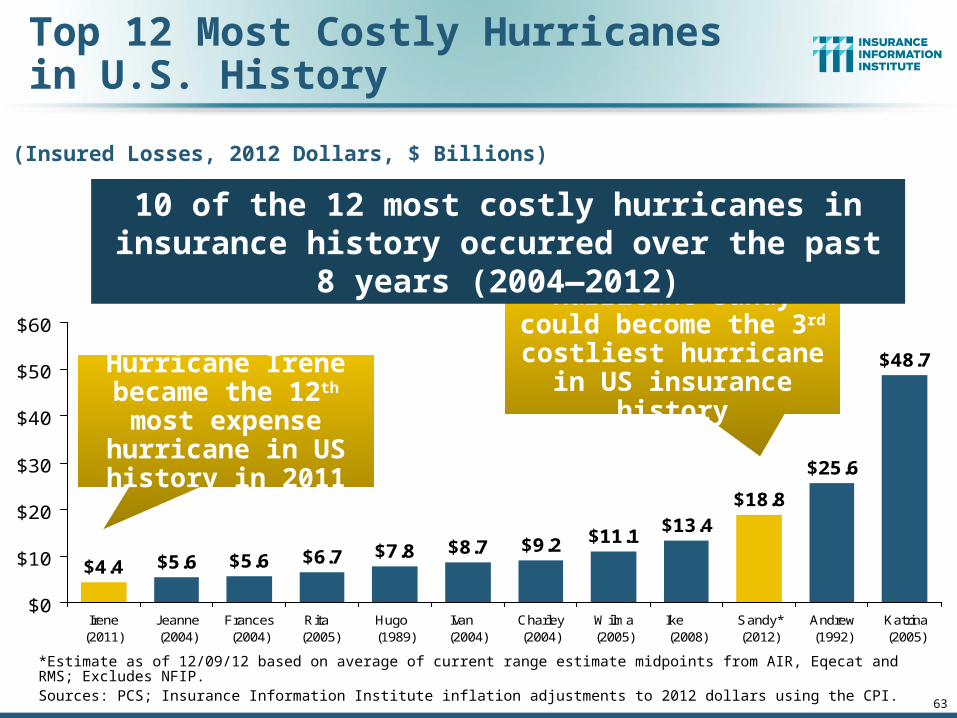
Top 12 Most Costly Hurricanesin U.S. History
(Insured Losses, 2012 Dollars, $ Billions)
*Estimate as of 12/09/12 based on average of current range estimate midpoints from AIR, Eqecat and RMS; Excludes NFIP.Sources: PCS; Insurance Information Institute inflation adjustments to 2012 dollars using the CPI.
$9.2 $11.1$13.4
$18.8
$25.6
$48.7
$8.7$7.8$6.7$5.6$5.6$4.4
$0
$10
$20
$30
$40
$50
$60
Irene(2011)
Jeanne(2004)
Frances(2004)
Rita (2005)
Hugo (1989)
Ivan (2004)
Charley(2004)
Wilma(2005)
Ike (2008)
Sandy*(2012)
Andrew(1992)
Katrina(2005)
Hurricane Sandy could become the 3rd costliest
hurricane in US insurance history
Hurricane Irene became the 12th most expense hurricane in
US history in 2011
10 of the 12 most costly hurricanes in insurance history occurred over the past 8 years (2004—2012)

64
Top 16 Most Costly World Insurance Losses, 1970-2012*
(Insured Losses, 2012 Dollars, $ Billions)
*Figures do not include federally insured flood losses.**Average of range estimates of $35B - $40B as of 1/4/12 adjusted to 2012 dollars; Privately insured losses only.***Estimate as of 12/09/12, based on average of midpoints from range estimates from AIR, RMS and Eqecat.Sources: Swiss Re sigma 1/2011; Munich Re; Insurance Information Institute research.
$11.1$13.4 $13.4$13.4$18.8
$23.9 $24.6$25.6
$38.6
$48.7
$7.8 $8.1 $8.5 $8.7 $9.2 $9.6
$0
$10
$20
$30
$40
$50
$60
Hugo (1989)
WinterStormDaria(1991)
ChileQuake(2010)
Ivan (2004)
Charley(2004)
TyphoonMirielle(1991)
Wilma(2005)
ThailandFloods(2011)
NewZealandQuake(2011)
Ike (2008)
Sandy(2012)**
Northridge(1994)
WTC TerrorAttack(2001)
Andrew(1992)
JapanQuake,
Tsunami(2011)**
Katrina(2005)
5 of the top 14 most expensive
catastrophes in world history have occurred within the past 3 yearsHurricane Sandy could
become the 6th costliest event in global (private)
insurance history

65
Top 16 Most Costly Disastersin U.S. History
(Insured Losses, 2012 Dollars, $ Billions)
*Estimate as of 12/09/12 based on average of range midpoints from AIR, RMS and Eqecat..Sources: PCS; Insurance Information Institute inflation adjustments.
$7.8 $8.7 $9.2 $11.1$13.4$18.8
$23.9 $24.6$25.6
$48.7
$7.5$7.1$6.7$5.6$5.6$4.4
$0
$10
$20
$30
$40
$50
$60
Irene (2011) Jeanne(2004)
Frances(2004)
Rita (2005)
Tornadoes/T-Storms
(2011)
Tornadoes/T-Storms
(2011)
Hugo (1989)
Ivan (2004)
Charley(2004)
Wilma(2005)
Ike (2008)
Sandy*(2012)
Northridge(1994)
9/11 Attack(2001)
Andrew(1992)
Katrina(2005)
Hurricane Sandy could become the 5th
costliest event in US insurance history
Hurricane Irene became the 12th most expense hurricane
in US history in 2011
Includes Tuscaloosa, AL,
tornado
Includes Joplin, MO,
tornado
NY Gov. Andrew Cuomo has requested $42 billion in federal aid. NJ
Gov. Chris Christie has requested $29.4B.

66
$1
2.6
$1
1.0
$3
.8
$1
4.3
$1
1.6
$6
.1
$3
4.7
$7
.6
$1
6.3
$3
3.7
$7
3.4
$1
0.5
$7
.5
$2
9.2
$1
1.5
$1
4.4
$3
3.1
$3
5.0
$1
4.0
$4
.8
$8
.0
$3
7.8
$8
.8
$2
6.4
$0
$10
$20
$30
$40
$50
$60
$70
$80
89 90 91 92 93 94 95 96 97 98 99 00 01 02 03 04 05 06 07 08 09 10 11 12*
US Insured Catastrophe Losses
*As of 1/2/13. Includes $18.8B gross loss estimate for Hurricane Sandy.Note: 2001 figure includes $20.3B for 9/11 losses reported through 12/31/01 ($25.9B 2011 dollars). Includes only business and personal property claims, business interruption and auto claims. Non-prop/BI losses = $12.2B ($15.6B in 2011 dollars.) Sources: Property Claims Service/ISO; Insurance Information Institute.
US CAT Losses in 2012 Could Become the 2nd or 3rd Highest in US History on An Inflation-Adjusted Basis
(Pvt Insured). 2011 Losses Were the 5th Highest
2012 CAT losses were down nearly 50% from 2011 until Sandy struck in late October
Record Tornado Losses Caused
2011 CAT Losses to Surge
($ Billions, 2012 Dollars)
66
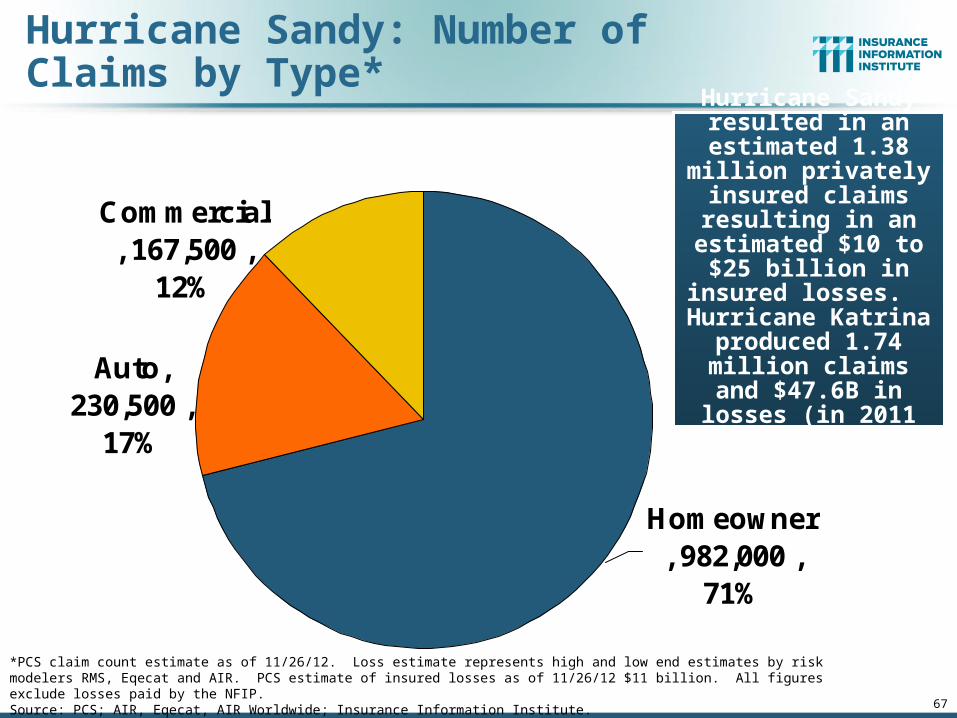
Auto, 230,500 ,
17%
Commercial, 167,500 ,
12%
Homeowner, 982,000 ,
71%
Hurricane Sandy resulted in an
estimated 1.38 million privately insured
claims resulting in an estimated $10 to $25
billion in insured losses. Hurricane
Katrina produced 1.74 million claims and
$47.6B in losses (in 2011 $)
*PCS claim count estimate as of 11/26/12. Loss estimate represents high and low end estimates by risk modelers RMS, Eqecat and AIR. PCS estimate of insured losses as of 11/26/12 $11 billion. All figures exclude losses paid by the NFIP.Source: PCS; AIR, Eqecat, AIR Worldwide; Insurance Information Institute. 67
Hurricane Sandy: Number of Claims by Type*

Hurricane Sandy: Number of Homeowners Claims by State*
New Jersey, 360,000 ,
36%
All Other, 292,000 ,
30%
New York, 330,000 ,
34%
Hurricane Sandy
•Estimated 982,000 homeowners
claims**
•$6.6 billion in insured losses.
•Average loss per claim is $6,718
•About 1/3 of claims in NY, 1/3 in NJ and
1/3 in all other states
*Preliminary as of 11/26/12.Source: PCS. 68

Hurricane Sandy: Value of Homeowners Claims Paid, by State* ($ Millions)
New Jersey, $2,500 , 38%
New York, $2,300 , 35%
All Other, $1,797 , 27%
*Preliminary as of 11/26/12.Source: PCS. 69
Hurricane Sandy
•Estimated 982,000 homeowners
claims**
•$6.6 billion in insured losses.
•Average loss per claim is $6,718
•Claims in NJ estimated at $2.5
billion (38%) and $2.3 billion in NY (35%)
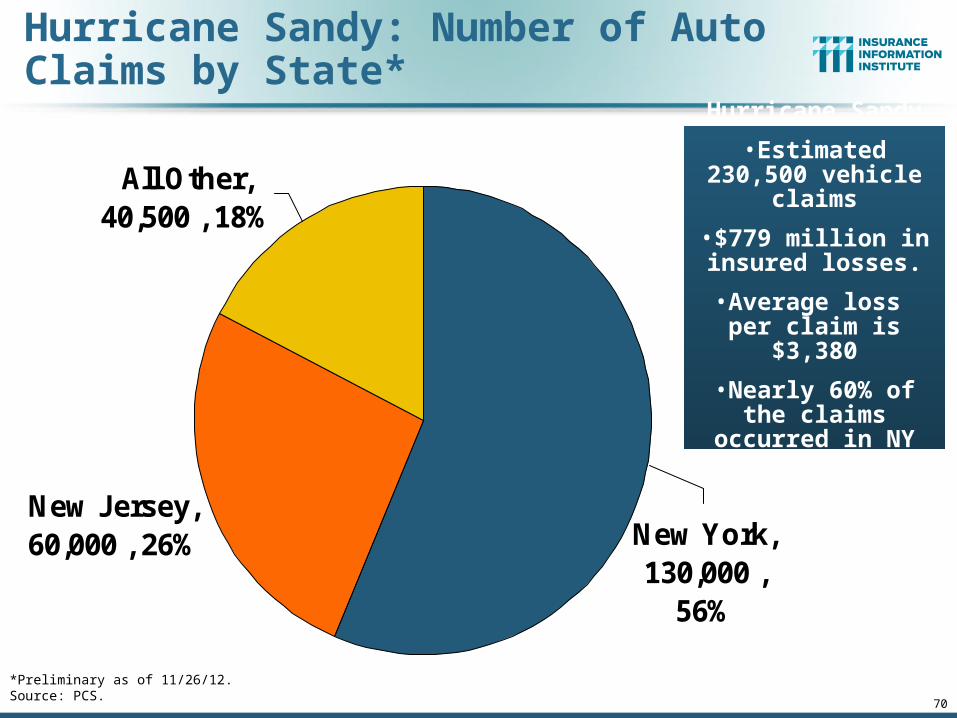
Hurricane Sandy: Number of Auto Claims by State*
New Jersey, 60,000 , 26%
All Other, 40,500 , 18%
New York, 130,000 ,
56%
Hurricane Sandy
•Estimated 230,500 vehicle claims
•$779 million in insured losses.
•Average loss per claim is $3,380
•Nearly 60% of the claims occurred in
NY state.
*Preliminary as of 11/26/12.Source: PCS. 70

Hurricane Sandy: Value of Auto Claims Paid, by State* ($ Millions)
New Jersey, $250 , 32%
All Other, $129 , 17%
New York, $400 , 51%
Hurricane Sandy
•Estimated 230,500 vehicle claims
•$779 million in insured losses.
•Average loss per claim is $3,380
•About 50% of the claim dollars will be paid in NY, 32% in
NJ.
*Preliminary as of 11/26/12.Source: PCS. 71
72
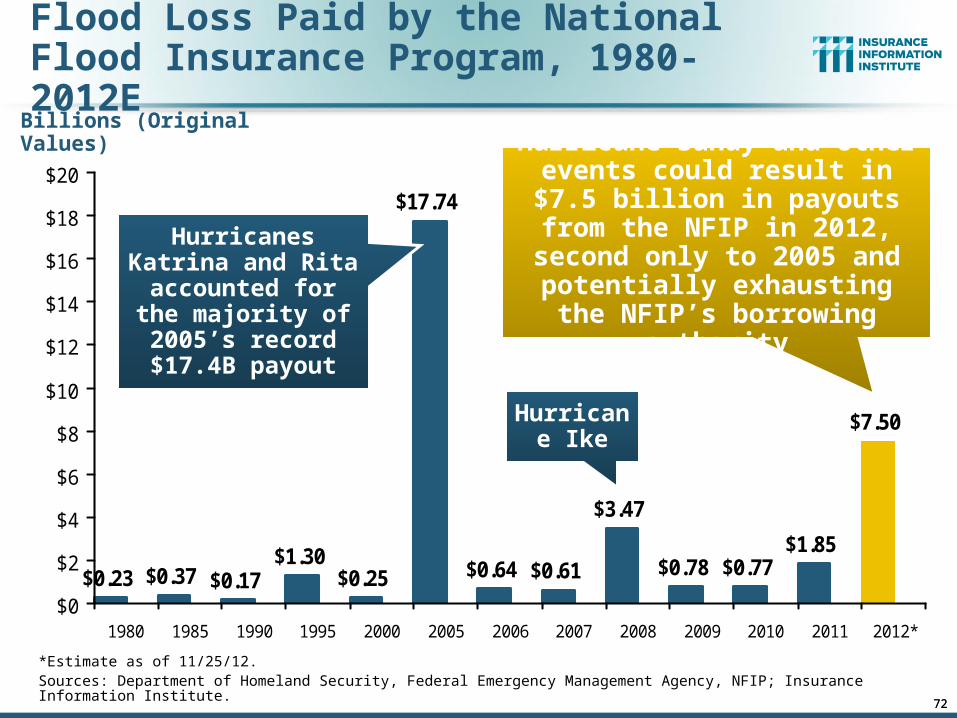
Flood Loss Paid by the National Flood Insurance Program, 1980-2012E
*Estimate as of 11/25/12.Sources: Department of Homeland Security, Federal Emergency Management Agency, NFIP; Insurance Information Institute.
Billions (Original Values)
$0.23 $0.37 $0.17$1.30
$0.25
$17.74
$0.64 $0.61
$3.47
$0.78 $0.77$1.85
$7.50
$0
$2
$4
$6
$8
$10
$12
$14
$16
$18
$20
1980 1985 1990 1995 2000 2005 2006 2007 2008 2009 2010 2011 2012*
Hurricanes Katrina and Rita accounted for the majority of
2005’s record $17.4B payout
Hurricane Ike
72
Hurricane Sandy and other events could result in $7.5
billion in payouts from the NFIP in 2012, second only to 2005
and potentially exhausting the NFIP’s borrowing authority

Source: Wharton Center for Risk Management and Decision Processes, Issue Brief, Nov. 2012; Insurance Information Institute.
Residential NFIP Flood Take-Up Rates in NJ (2010) & Sandy Storm Surge
73
Flood coverage penetration rates were extremely low in
many very vulnerable areas in NJ, with take-up rates far below
50% in many areas

Source: Wharton Center for Risk Management and Decision Processes, Issue Brief, Nov. 2012; Insurance Information Institute.
Residential NFIP Flood Take-Up Rates in NY, CT (2010) & Sandy Storm Surge
74
Flood coverage
penetration rates were
extremely low in many very vulnerable
areas of NY and CT, with take-up rates far below 50% in many areas
75
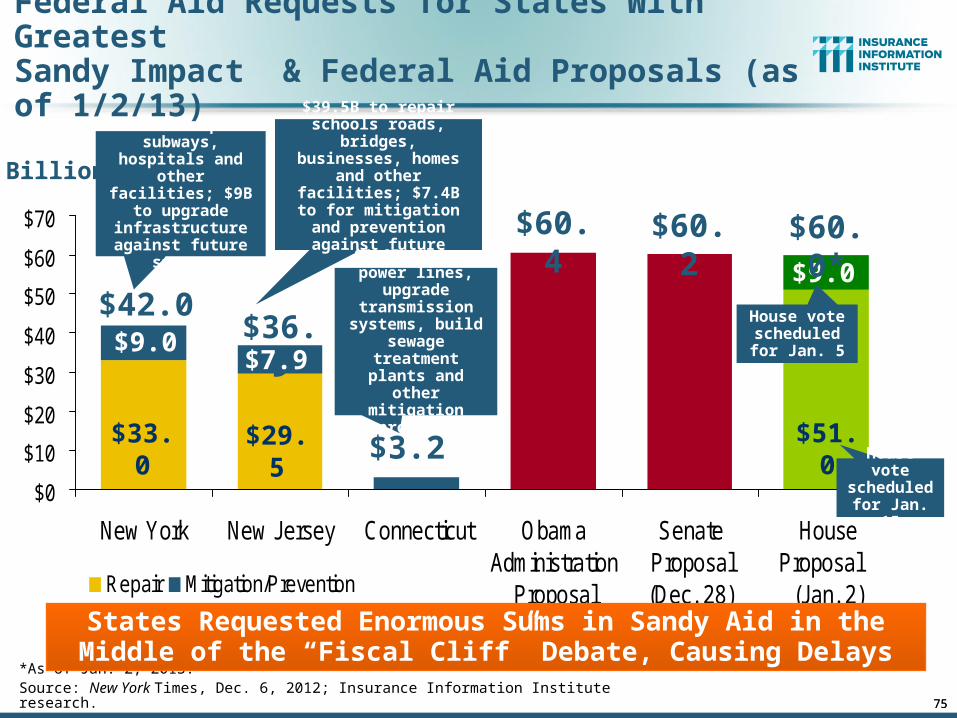
Federal Aid Requests for States With GreatestSandy Impact & Federal Aid Proposals (as of 1/2/13)
*As of Jan. 2, 2013.Source: New York Times, Dec. 6, 2012; Insurance Information Institute research.
Billions
$0
$10
$20
$30
$40
$50
$60
$70
New York New Jersey Connecticut ObamaAdministration
Proposal
SenateProposal(Dec. 28)
HouseProposal
(Jan. 2)Repair Mitigation/Prevention
States Requested Enormous Sums in Sandy Aid in the Middle of the “Fiscal Cliff” Debate, Causing Delays
$33.0
$7.4
$29.5
$42.0$9.0
$6.0
$36.9$7.9
75
$33B to repair subways, hospitals and other facilities;
$9B to upgrade infrastructure against future
storms
$3.2
$60.4
$39.5B to repair schools roads, bridges,
businesses, homes and other facilities; $7.4B to
for mitigation and prevention against
future storms
$3.2B to bury power lines,
upgrade transmission
systems, build sewage treatment plants and other
mitigation projects
$60.2
$9.0
$51.0
House vote scheduled for Jan. 5
$60.0*
House vote scheduled for Jan. 15
Beyond Hurricane Sandy
76
Before Sandy Struck, Privately Insured Catastrophe Losses
Were Down 51% from 2011 Levels
76
77
1,1
33
1,1
32 1
,29
7
1,1
73
1,0
82 1,2
34
1,1
73
1,1
48
1,4
24
1,3
45
1,0
71 1,2
16
94
1
1,3
76
1,2
64
1,1
03
1,0
98
1,6
92
1,1
46 1,2
82
1,0
64
1,819
1,6
91
553
0
200
400
600
800
1,000
1,200
1,400
1,600
1,800
2,000
90 91 92 93 94 95 96 97 98 99 00 01 02 03 04 05 06 07 08 09 10 11 12*
Nu
mb
er
of
To
rna
do
es
0
100
200
300
400
500
600
Nu
mb
er o
f De
ath
s
Number of Tornadoes
Number of Deaths
*Through Dec. 19, 2012.Source: U.S. Department of Commerce, Storm Prediction Center, National Weather Service at http://www.spc.noaa.gov/climo/online/monthly/newm.html
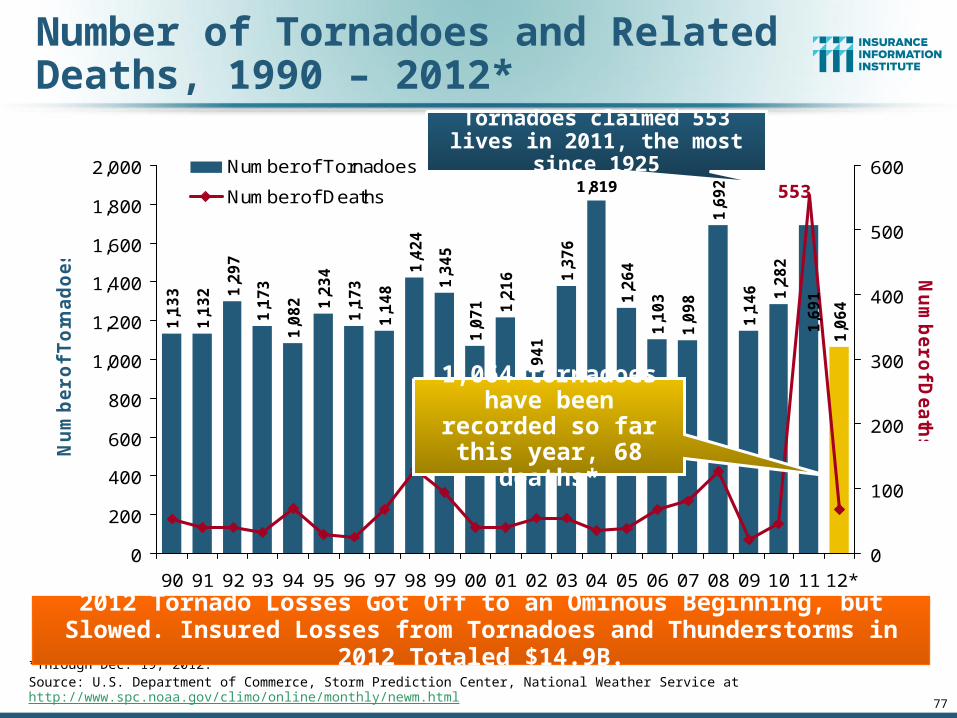
Number of Tornadoes and Related Deaths, 1990 – 2012*
Tornadoes claimed 553 lives in 2011, the most since 1925
1,064 tornadoes have been recorded so far this year, 68 deaths*
2012 Tornado Losses Got Off to an Ominous Beginning, but Slowed. Insured Losses from Tornadoes and Thunderstorms in 2012 Totaled $14.9B.

U.S. Tornado Count, Departure from Inflation-Adjusted Running Total, 2011 vs. 2012*
78
*Through Nov. 30, 2012.Source: http://www.spc.noaa.gov/wcm/
2011 count was far above
average
2012 count was below
average, but damages were
still high
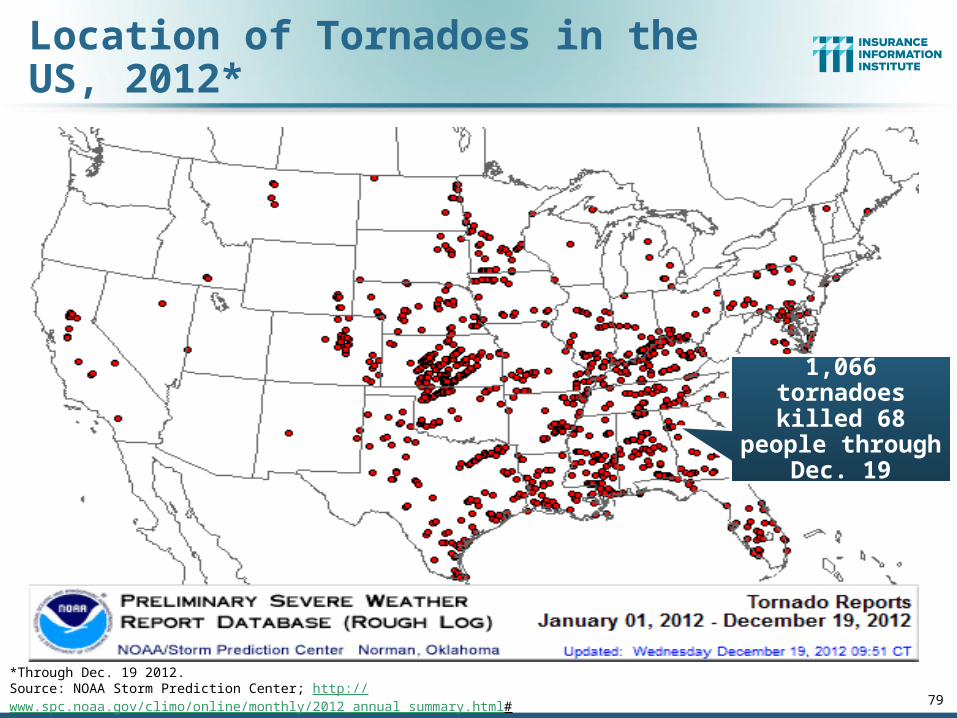
Location of Tornadoes in the US, 2012*
*Through Dec. 19 2012.Source: NOAA Storm Prediction Center; http://www.spc.noaa.gov/climo/online/monthly/2012_annual_summary.html# 79
1,066 tornadoes killed 68 people through Dec. 19

Location of Tornadoes in the US, 2011
Source: NOAA Storm Prediction Center; http://www.spc.noaa.gov/climo/online/monthly/2011_annual_summary.html# 80
1,894 tornadoes killed 553 people in 2011, including
at least 340 on April 26 mostly in the Tuscaloosa area, and 130 in
Joplin on May 22

Location of Large Hail Reports in the US, 2012*
81*Through Dec. 19, 2012.Source: NOAA Storm Prediction Center; http://www.spc.noaa.gov/climo/online/monthly/2012_annual_summary.html#
There were 7,022 “Large Hail”
reports through Dec. 19, 2012,
causing extensive damage to homes,
businesses and vehicles

Location of Large Hail Reports in the US, 2011
Source: NOAA Storm Prediction Center; http://www.spc.noaa.gov/climo/online/monthly/2011_annual_summary.html# 82
There were 9,417 “Large Hail”
reports in 2011, causing extensive damage to homes,
businesses and vehicles
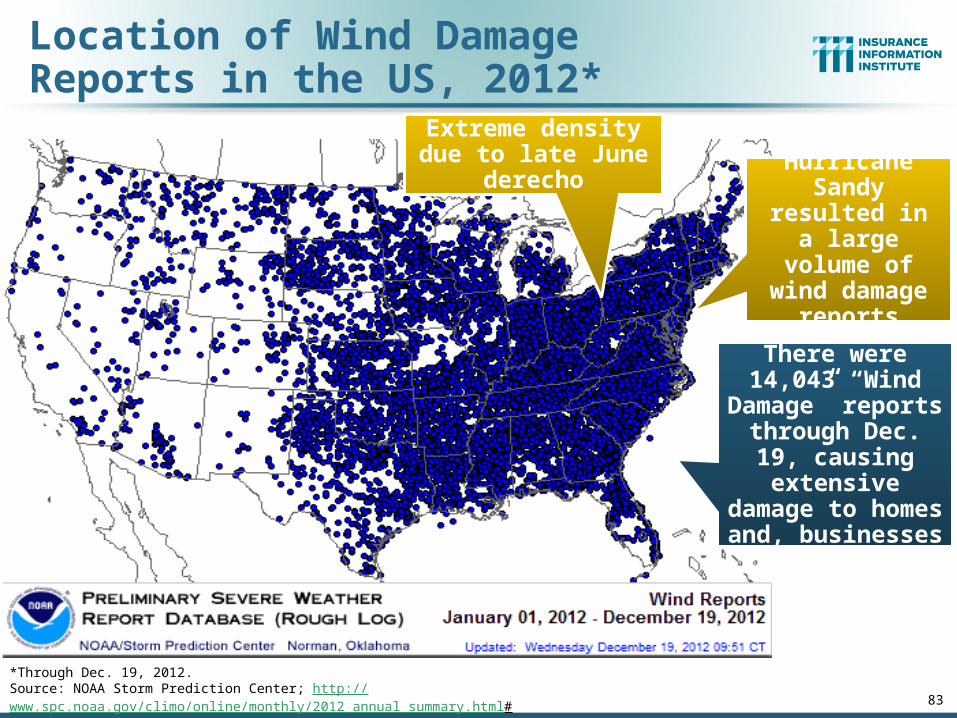
Location of Wind Damage Reports in the US, 2012*
83*Through Dec. 19, 2012.Source: NOAA Storm Prediction Center; http://www.spc.noaa.gov/climo/online/monthly/2012_annual_summary.html#
There were 14,043 “Wind Damage” reports through Dec. 19, causing
extensive damage to homes and,
businesses
Extreme density due to late June derecho
Hurricane Sandy resulted
in a large volume of wind damage reports

Location of Wind Damage Reports in the US, 2011
Source: NOAA Storm Prediction Center; http://www.spc.noaa.gov/climo/online/monthly/2011_annual_summary.html# 84
There were 18,685 “Wind Damage” reports through Dec. 27, causing
extensive damage to homes and,
businesses

Severe Weather Reports, 2012*
85*Through Dec. 19, 2012.Source: NOAA Storm Prediction Center; http://www.spc.noaa.gov/climo/online/monthly/2012_annual_summary.html#
There were 22,131 severe
weather reports through Dec. 19; including
1,066 tornadoes;
7,022 “Large Hail” reports
and 14,043 high wind events
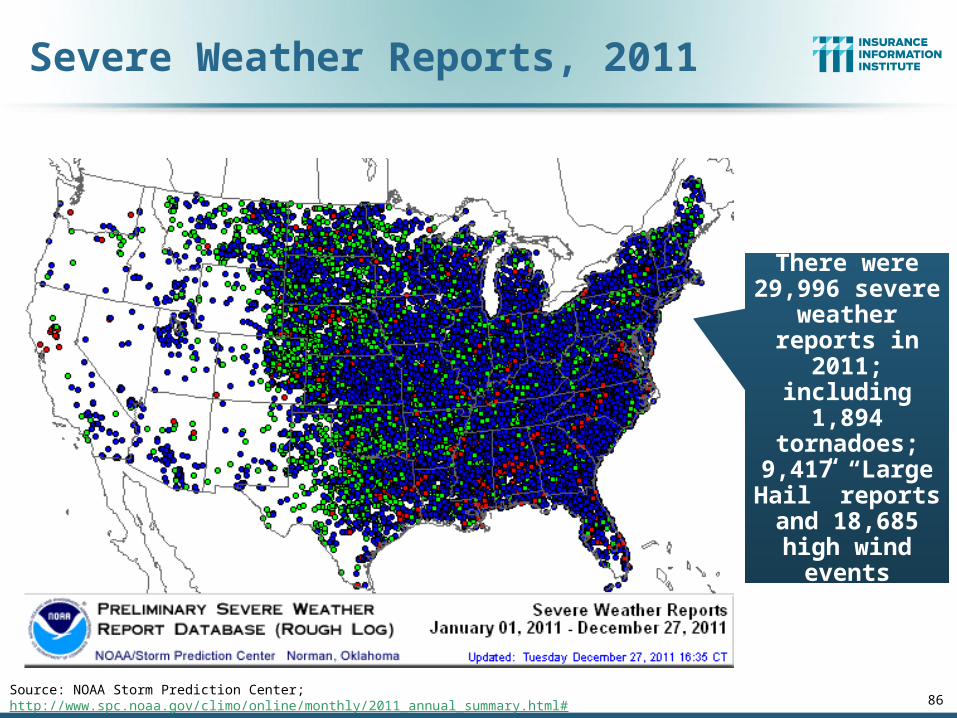
Severe Weather Reports, 2011
86Source: NOAA Storm Prediction Center; http://www.spc.noaa.gov/climo/online/monthly/2011_annual_summary.html#
There were 29,996 severe
weather reports in 2011;
including 1,894 tornadoes;
9,417 “Large Hail” reports
and 18,685 high wind events

Large Hail, 7,022 , 32%
Wind Damage,
14,043 , 63%
Tornadoes, 1,066 , 5%
Tornadoes accounted for just 5% of all Severe
Weather Reports in 2012 compared to
6% in 2011, though they caused less damage and far
fewer deaths
Source: NOAA Storm Prediction Center; http://www.spc.noaa.gov/climo/online/monthly/2011_annual_summary.html# 87
Number of Severe Weather Reports in US, by Type, 2012
www.iii.org
Thank you for your timeand your attention!
Twitter: twitter.com/bob_hartwig
Insurance Information Institute Online:
88

QUESTION AND ANSWER

To ask a question, please dial 1 4 on your phone.
An operator will facilitate your participation.
Press Question and Answer Process
90

More Information
Press InquiriesTerese RosenthalPhone: +1 (609) 243-4339E-mail: [email protected]
91

www.munichre.com/natcatservice/downloadcenter/enwww.munichre.com/natcatservice/downloadcenter/en
0%
50%
100%
150%
200%
250%
300%
350%
400%
450%
500%
1980 1982 1984 1986 1988 1990 1992 1994 1996 1998 2000 2002 2004 2006 2008 2010
Annual statistics
Long-term statistics
Information on significant natural disasters
Focus analyses
NatCatSERVICE methodology, info brochure
Publication Topics Geo
Annual statistics
Long-term statistics
Information on significant natural disasters
Focus analyses
NatCatSERVICE methodology, info brochure
Publication Topics Geo
The downloadcenter provides free access:The downloadcenter provides free access:
200
400
600
800
1 000
1 200
1980 1982 1984 1986 1988 1990 1992 1994 1996 1998 2000 2002 2004 2006 2008 2010
© 2013 Munich Re 92
NatCatSERVICE Downloadcenterfor statistics and analyses on natural disasters

ContentsContents
Natural Catastrophes in North AmericaPerils, Risks and Insurance
Perils Risks
‒ Climate change and climate variability
‒ Risk map of North America Insurance
‒ Insurance aspects in the United States and Canada
‒ Agricultural insurance
‒ Weather derivatives Message to the Market
Perils Risks
‒ Climate change and climate variability
‒ Risk map of North America Insurance
‒ Insurance aspects in the United States and Canada
‒ Agricultural insurance
‒ Weather derivatives Message to the Market
93© 2013 Munich Re
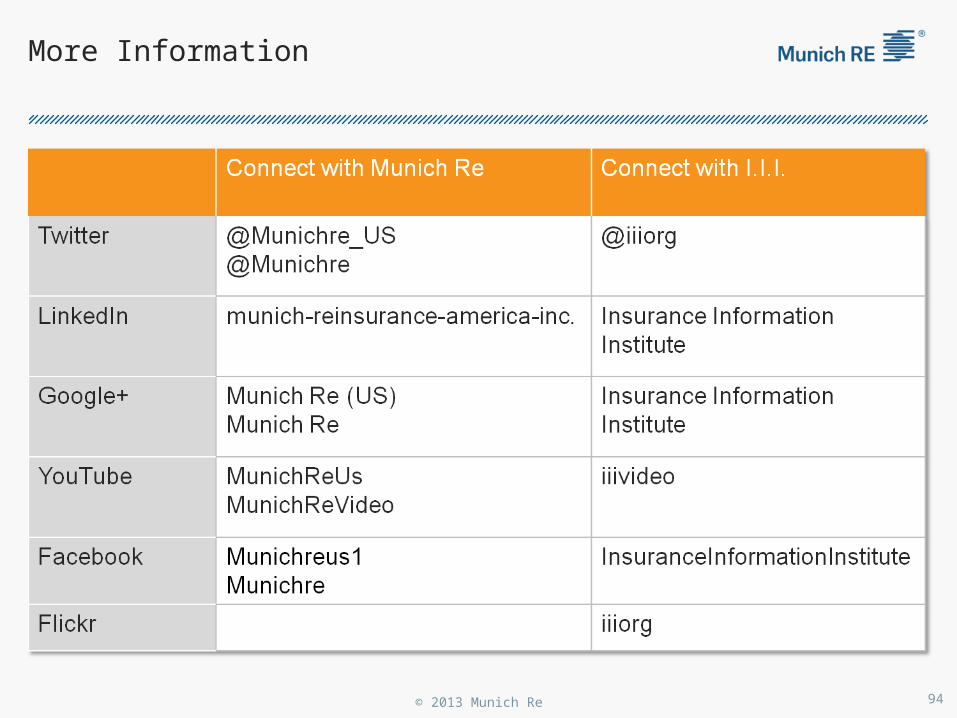
More Information
© 2013 Munich Re 94

THANK YOU FOR ATTENDING TODAY’S WEBINAR.
© Copyright 2013 Munich Reinsurance America, Inc. All rights reserved. "Munich Re" and the Munich Re logo are internationally protected registered trademarks. The material in this presentation is provided for your information only, and is not permitted to be further distributed without the express written permission of Munich Reinsurance America, Inc. or Munich Re. This material is not intended to be legal, underwriting, financial, or any other type of professional advice. Examples given are for illustrative purposes only. Each reader should consult an attorney and other appropriate advisors to determine the applicability of any particular contract language to the reader's specific circumstances.