2012 or 2013 farmbill for 2014 and beyond. signed feb 7, 2014 2 years late 956 billion over 10 years...
TRANSCRIPT

2012 or 2013 FarmBill
For 2014 and Beyond

Signed Feb 7, 2014
• 2 years late• 956 Billion over 10 years• Farm Bill is a mis-nomer
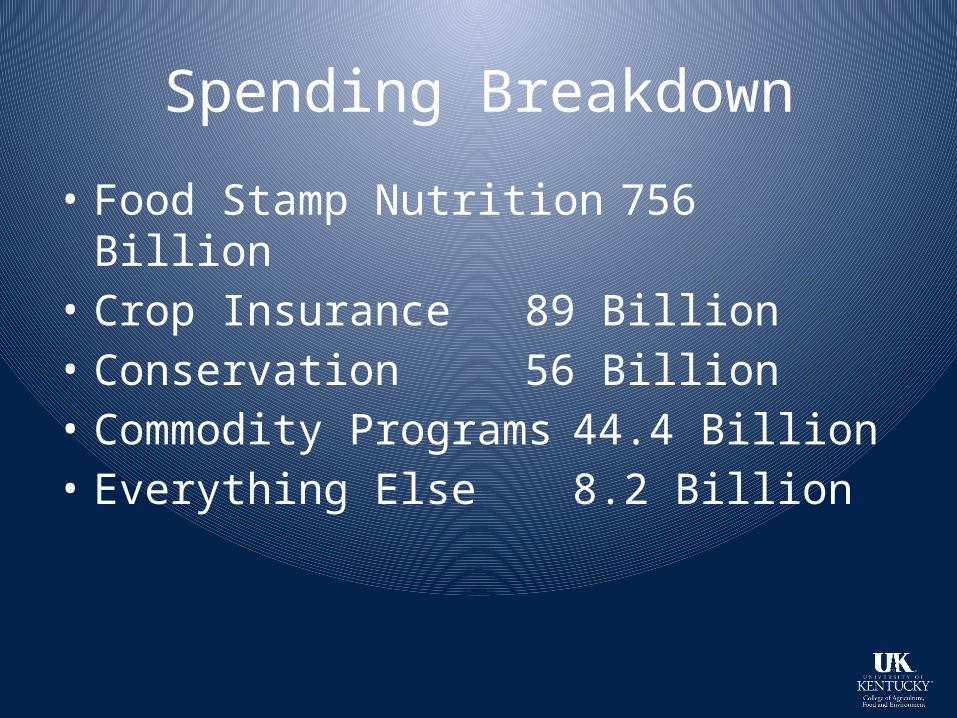
Spending Breakdown
• Food Stamp Nutrition 756 Billion• Crop Insurance 89 Billion• Conservation 56 Billion• Commodity Programs 44.4 Billion• Everything Else 8.2 Billion
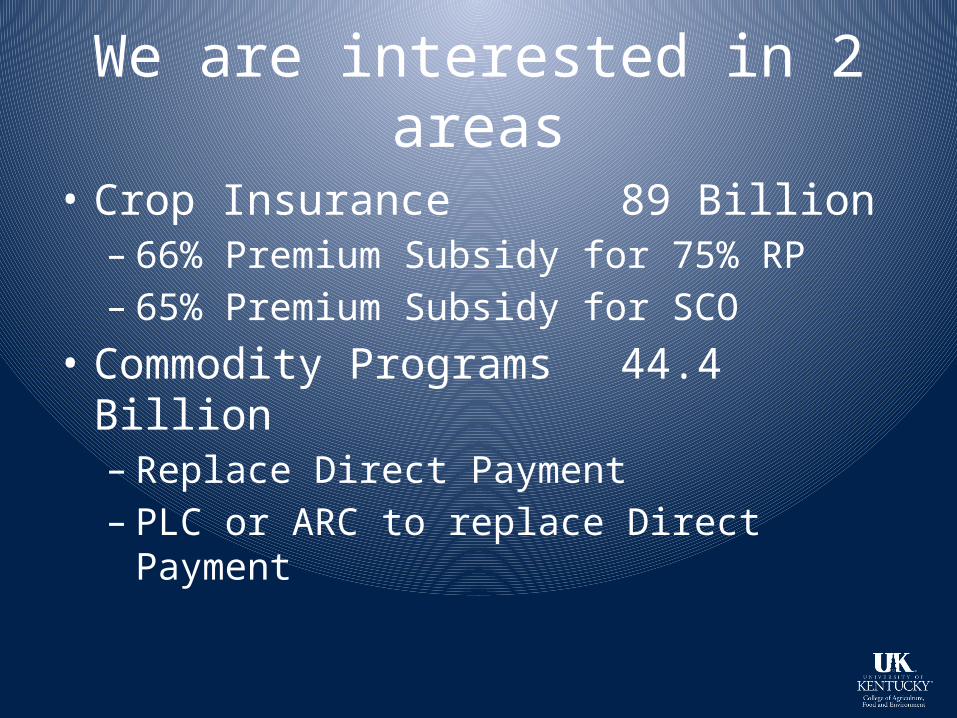
We are interested in 2 areas
• Crop Insurance 89 Billion– 66% Premium Subsidy for 75% RP– 65% Premium Subsidy for SCO
• Commodity Programs 44.4 Billion– Replace Direct Payment– PLC or ARC to replace Direct Payment
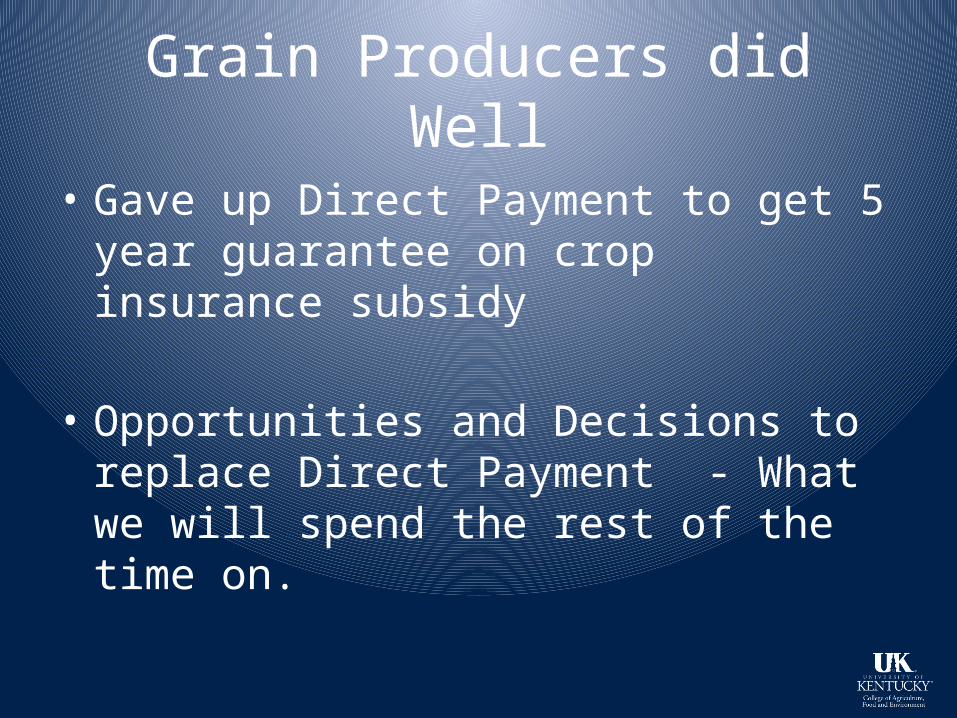
Grain Producers did Well
• Gave up Direct Payment to get 5 year guarantee on crop insurance subsidy
• Opportunities and Decisions to replace Direct Payment - What we will spend the rest of the time on.

Models of the Commodity Title
• Very Complex and Complicated• Gossip
• The final goal is to simplify these models so everyone can follow along
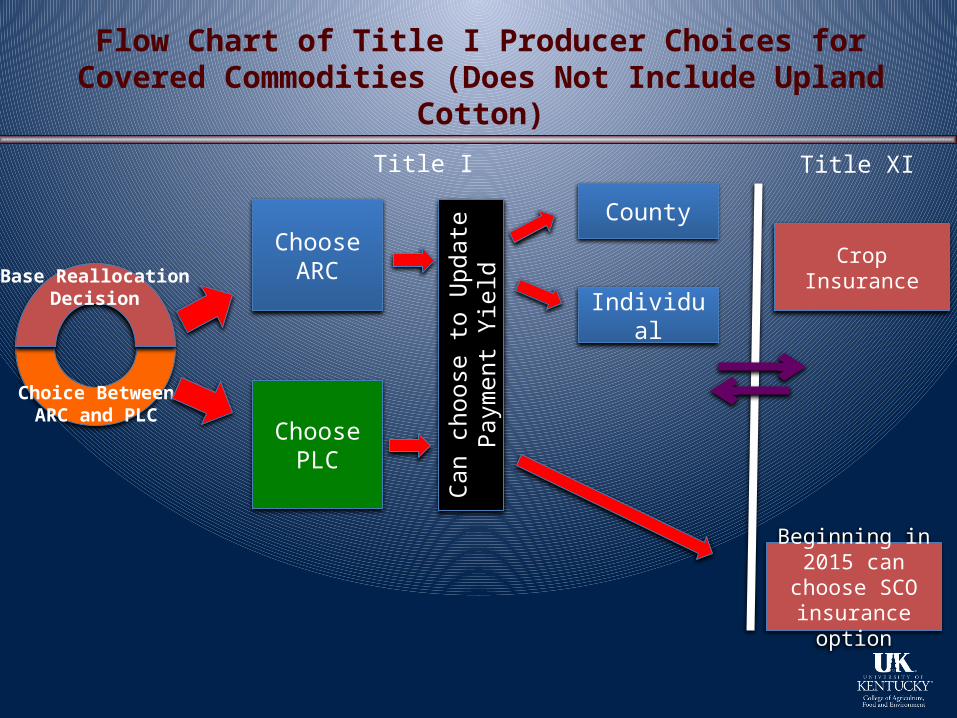
Choose ARC
Choose PLC
County
Can
choo
se to
Upd
ate
Paym
ent Y
ield
Base ReallocationDecision
Choice BetweenARC and PLC
Individual
Beginning in 2015 can choose SCO insurance option
Flow Chart of Title I Producer Choices for Covered Commodities (Does Not Include Upland Cotton)
Crop Insurance
Title XITitle I

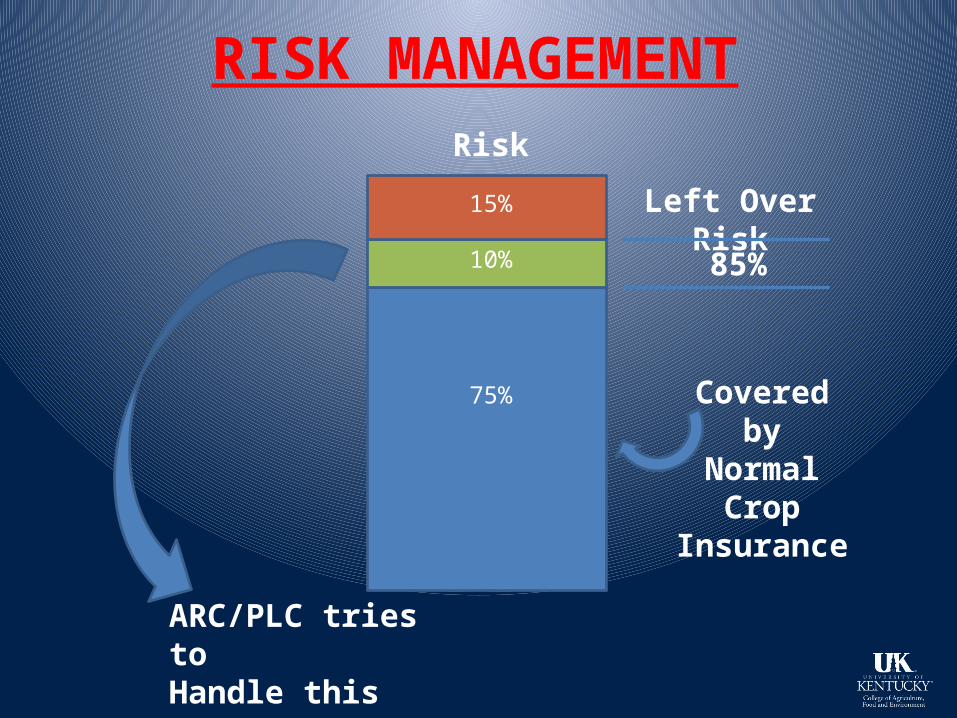
15%
10%
75%
RISK MANAGEMENTRisk
Left Over Risk
85%
Covered by
NormalCrop
Insurance
ARC/PLC tries to Handle this 10%
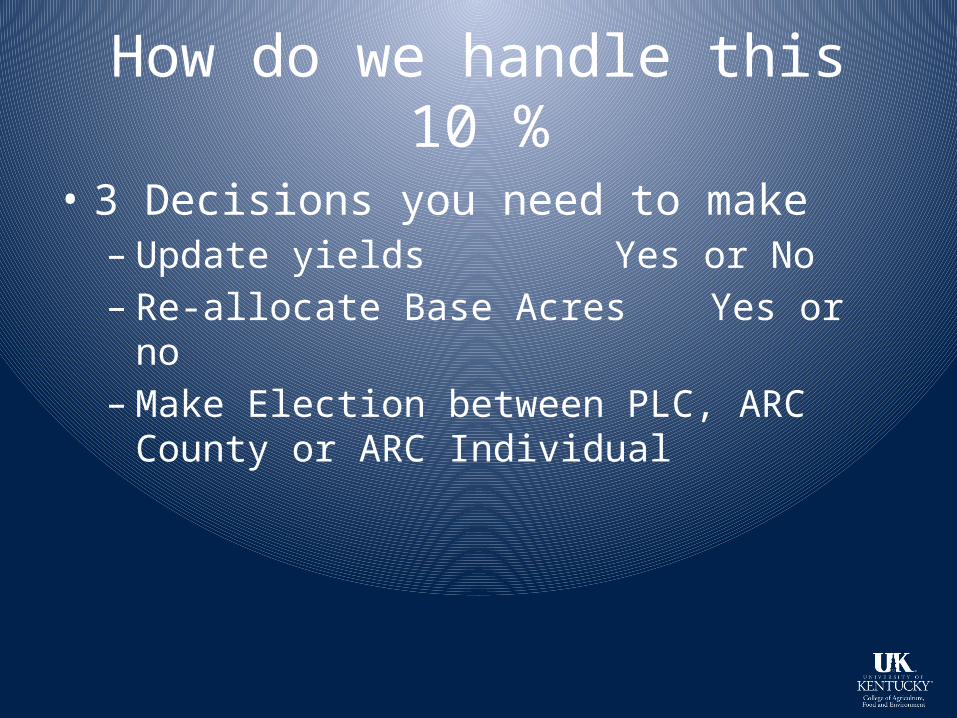
How do we handle this 10 %
• 3 Decisions you need to make– Update yields Yes or No– Re-allocate Base Acres Yes or no– Make Election between PLC, ARC County or ARC
Individual

Update Yields
• Yields come from 1985• Some were redone in 2002• 90 % of the Average (2008-2012)• Only used for PLC, but would get lower yield
off the books for future farm bills• Almost everyone will want to update yield
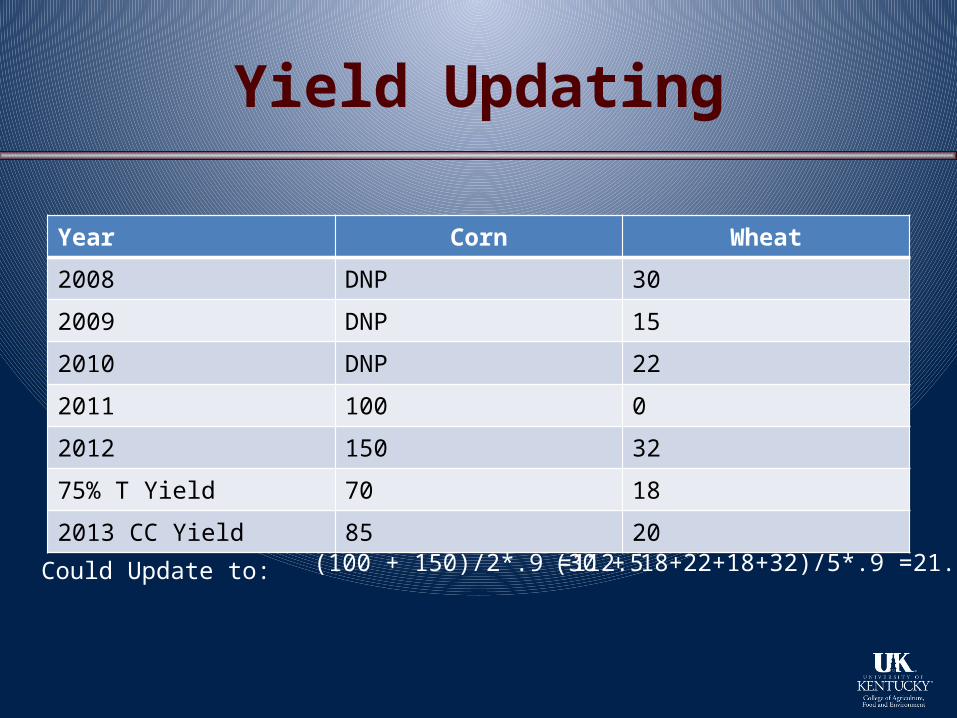
Yield Updating
Year Corn Wheat
2008 DNP 30
2009 DNP 15
2010 DNP 22
2011 100 0
2012 150 32
75% T Yield 70 18
2013 CC Yield 85 20
Could Update to: (100 + 150)/2*.9 =112.5 (30 + 18+22+18+32)/5*.9 =21.6??
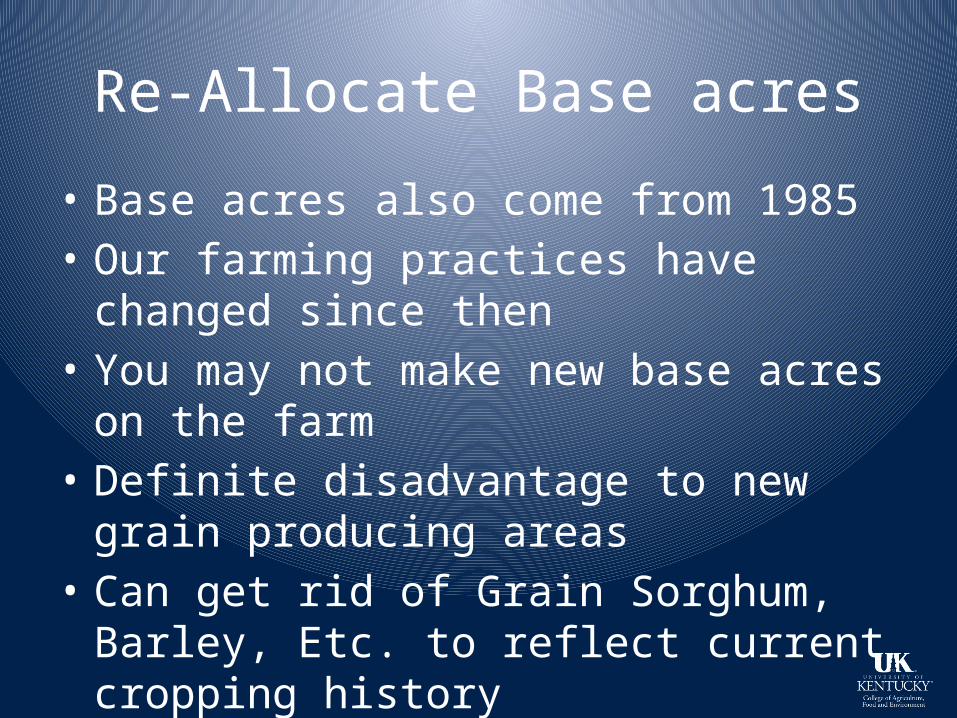
Re-Allocate Base acres
• Base acres also come from 1985• Our farming practices have changed since
then• You may not make new base acres on the farm• Definite disadvantage to new grain producing
areas• Can get rid of Grain Sorghum, Barley, Etc. to
reflect current cropping history

Base Acres (cont.)
• Current thinking– Corn payment> Wheat payment > Soybeans
• To maximize payments – maximize corn acres• Unless you want the bases to more accurately
reflect your farming operation for the future• You can not pick and choose – just keep old or
take new bases

15
Base Acre Updating
Reallocated Current2009 2010 2011 2012 Base Base
Corn 100 100 100 0 75.0 57.0Soybeans 0 0 0 100 25.0 43.0Wheat 0 0 0 0 0.0 0.0Total 100 100 100 100 100.0 100.0
75.0%
0.0%25.0%
Planted Acres by Year 09-12Average
Base Acre Updating
Reallocated Current2009 2010 2011 2012 Base Base
Corn 100 100.0 57.0Soybeans 0 0 0 0 0.0 43.0Wheat 0 0 0 0 0.0 0.0Total 100 100.0 100.0
100.0%
0.0%0.0%
Planted Acres by Year 09-12Average
Base Acre Updating
Reallocated Current2009 2010 2011 2012 Base Base
Corn 100 100 100 100 50.0 57.0Soybeans 100 100 100 100 50.0 43.0Wheat 0 0 0 0 0.0 0.0Total 200 200 200 200 100.0 100.0
50.0%
0.0%50.0%
Planted Acres by Year 09-12Average
Example 1. Multiple years corn
Example 2. Alfalfa 2009 – 2011, corn in 2012
Example 3. Overplant base, same acres

ExampleKentucky FSA # 1370
Planted Acres History
2009 2010 2011 2012
Grain Corn 75.0 135.0 78.0 129.2
Soybeans 135.0 81.0 129.2 78.0
Wheat 0.0 0.0 135.0 0.0
Prevented Planting History
2009 2010 2011 2012
Grain Corn 0.0 0.0 0.0 0.0
Soybeans 0.0 0.0 0.0 0.0
Wheat 0.0 75.0 0.0 0.0
Base Acres
Current Base Potential Reallocated Base
Grain Corn 106.8 83.6
Soybeans 103.8 84.8
Wheat 0.0 42.1

Should I reallocate?
ARC-CO PLC PLC + SCOCrop Reallocate Base Yes No Yes No Yes No
Grain Corn $9,537 $12,176 $11,489 $14,670 $15,432 $18,612 Soybeans $6,953 $8,506 $2,745 $3,358 $4,184 $4,797
Wheat $2,760 $0 $2,518 $0 $4,923 $2,406
Reallocate Base No ReallocationCrop Program Expected Payment Program Expected Payment
Grain Corn PLC + SCO $15,432 PLC + SCO $18,612 Soybeans ARC-CO $6,953 ARC-CO $8,506
Wheat PLC + SCO $4,923 PLC + SCO $2,406 Total $27,308 Total $29,524
Combinations of ARC-CO, PLC, and PLC+SCO to Maximize Total Payments for the Farm

These are Land Owner Decisions
• As a tenant, you need to work together as these decisions will also help you
• General Rules• Everyone update yields• Update bases to maximize corn acres • If Power of Attorney is worded correctly,
producer can sign for decision

Producer Driven Decisions• Election between PLC, Arc county and Arc
Individual• This is how you handle the 10 %• Decision is determined by what you think
prices will do in the next five years• If you pick the wrong one – not the end of the
world - remember crop insurance is the main safety net

Handling the 10%
• Do it yourself – buy up 85% revenue coverage -expensive
• Let the USDA do it for you – 75% revenue + ARC or PLC – cheaper
• 75 to 85% revenue coverage, PLC plus add SCO insurance

Price Loss Coverage (PLC)
• Based on Marketing Year Average Price– Sept to August for corn,
soybeans– July to June for wheat
• Reference Price• RP- MYAP x payment
yield x 85% of base acres
• Reference Price– Corn $3.70– Sbean $8.40– Wheat $5.50– G Sorghum $3.95– Barley $4.95

SCO Insurance
• Supplemental Coverage Option• Have to pick PLC• Revenue insurance policy that covers from 75% to
86% (sounds good)• Based on County yield - not your yields (not so good)• You can have a loss – no county loss – no payment or
vice versa• Supposedly cheaper – seemed expensive for wheat
this year

Average Revenue Coverage County (ARC county)
• Similar to old ACRE Program• Based on county yields• Marketing Year Price• Sets up Rolling Average Revenue level– Olympic Average of Yield and Price– 86% of Benchmark Revenue– Payment limited to 10% of Benchmark– Paid on 85% of Base Acres
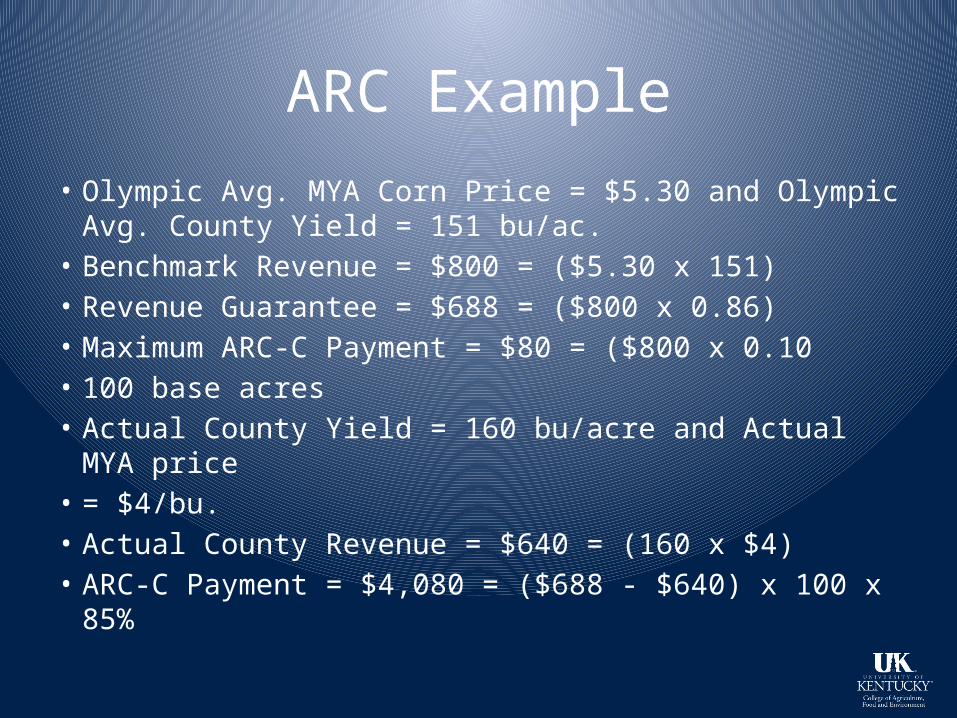
ARC Example
• Olympic Avg. MYA Corn Price = $5.30 and Olympic Avg. County Yield = 151 bu/ac.
• Benchmark Revenue = $800 = ($5.30 x 151)• Revenue Guarantee = $688 = ($800 x 0.86)• Maximum ARC-C Payment = $80 = ($800 x 0.10• 100 base acres• Actual County Yield = 160 bu/acre and Actual MYA price• = $4/bu.• Actual County Revenue = $640 = (160 x $4)• ARC-C Payment = $4,080 = ($688 - $640) x 100 x 85%
ARC Individual
• Extremely Complicated• Uses your own farm data (that sounds good)• Payments limited to 65% of base acres instead
of 85% (that’s the bad part)• Also it puts all crops on that farm together
(that is bad)• So if corn is bad but beans are good may not
get a payment

Arc Individual
• Might be good if farm has only 1 crop• Might be good if yields do not follow county
yields• Written for west of Mississippi where counties
are huge and see major variances in county yields

Which Should I Choose for My Farm
• Everything depends on where you think prices are going to be in the next five years
• For PLC to make any payment – prices have to be below reference price
• Maybe for corn and wheat – probably not for soybeans
• For Arc county to make payment – yield or price down – Starting with a good revenue average

Decision Aids
• 2 decision aids to help farmers make decision• Texas A&M and Illinois• Texas A&M very in depth – will show the
differences in re-allocating base acres – tends to steer to PLC – SCO
• Illinois tends to steer to ARC county• If you fill out information sheet – you can
enter in both relatively easy to compare

Decision Aids
• Texas A&M – https://usda.afpc.tamu.edu/
• Illinois - http://fsa.usapas.com/

Conclusions
• Only effects 10% - not the end of the world• Update yields – take the higher number• Update bases – take more corn acres except
for other reasons• If you think prices will be below reference
price next 5 years – PLC• If you think prices may be above reference
price – ARC county