2012 report -
TRANSCRIPT

agtrail.rivcoca.org
RIVERSIDE COUNTY AGRICULTURAL PRODUCTION REPORT
2012

On the Cover Featured on this year’s cover is a screen-shot of the recently launched Riverside County Ag Trail website. Though not the first in California, at over 400 miles, ours is unquestionably the longest Ag Trail in the state.
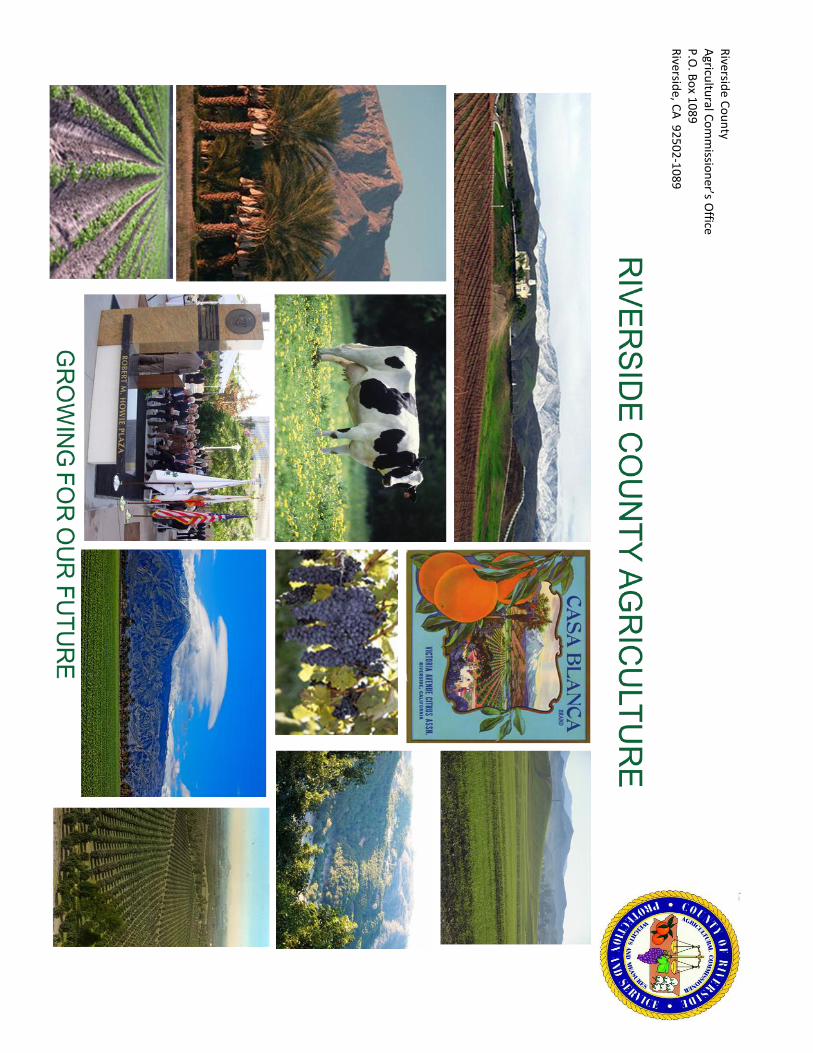
Riverside County represents a veritable agricultural cornucopia. Our unique geography and climate, as exemplified by the Palms to Pines Highway, allows Riverside County growers to practice virtually every form of agriculture known in the state of California.
Beginning in Blythe, one can observe large plantings of field crops, such as alfalfa, cotton and wheat. Traveling through the Coachella Valley can be very similar to visiting California’s Central Valley on Interstate 5 or Highway 99. Row upon row of every vegetable found in your salad bowl, including bell peppers, cauliflower, broccoli, carrots and artichokes. Fish farms, also known as aquaculture, dot the Coachella Valley and produce tilapia, catfish, bass, goldfish and koi. The Temecula wine area rivals Napa Valley in its beauty and its propensity to produce award winning wines. Hemet, Riverside and Corona still boast hundreds of acres of the Navel Oranges that originally brought fame and fortune to Southern California.
Interspersed within these more traditional agricultural sites one can explore various agritourism venues such as Christmas tree farms, pumpkin patches, Certified Farmers’ Markets and roadside fruit and vegetable stands.
Of particular note to out-of-town visitors are the ever popular National Date Festival, the Coachella Valley Date Museum and the California State Citrus Historic Park.
Whether as an educational field trip, a holiday treat or just to enjoy a date shake, the Riverside County Ag Trail is an opportunity to see the bounty and beauty of Riverside County agriculture. It also promises an opportunity to visit with the men and women that represent the many, diversified faces of agriculture that produce the food we enjoy each and every day.
agtrail.rivcoca.org
Karen Ross, Secretary California Department of Food and Agriculture
The Honorable Board of Supervisors of Riverside County
John Benoit, Chairman, District 4
Kevin Jeffries, District 1 John Tavaglione, District 2
Jeff Stone, District 3 Marion Ashley, District 5
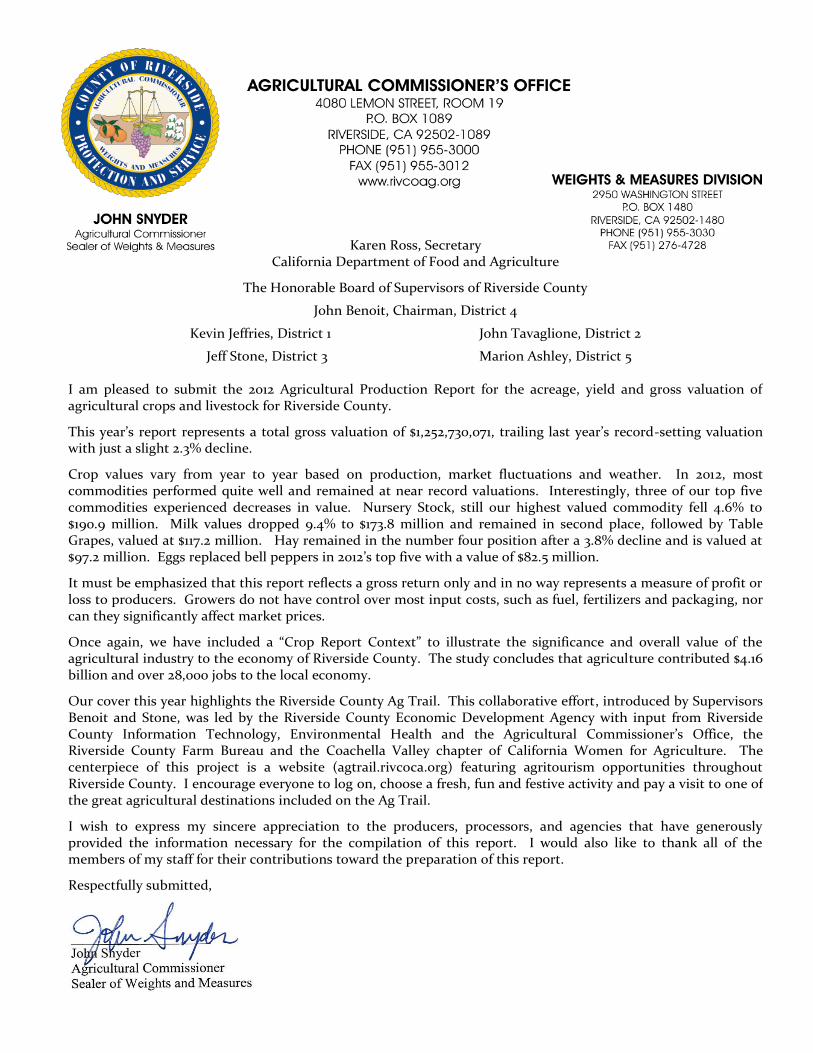
I am pleased to submit the 2012 Agricultural Production Report for the acreage, yield and gross valuation of agricultural crops and livestock for Riverside County.
This year’s report represents a total gross valuation of $1,252,730,071, trailing last year’s record-setting valuation with just a slight 2.3% decline.
Crop values vary from year to year based on production, market fluctuations and weather. In 2012, most commodities performed quite well and remained at near record valuations. Interestingly, three of our top five commodities experienced decreases in value. Nursery Stock, still our highest valued commodity fell 4.6% to $190.9 million. Milk values dropped 9.4% to $173.8 million and remained in second place, followed by Table Grapes, valued at $117.2 million. Hay remained in the number four position after a 3.8% decline and is valued at $97.2 million. Eggs replaced bell peppers in 2012’s top five with a value of $82.5 million.
It must be emphasized that this report reflects a gross return only and in no way represents a measure of profit or loss to producers. Growers do not have control over most input costs, such as fuel, fertilizers and packaging, nor can they significantly affect market prices.
Once again, we have included a “Crop Report Context” to illustrate the significance and overall value of the agricultural industry to the economy of Riverside County. The study concludes that agriculture contributed $4.16 billion and over 28,000 jobs to the local economy.
Our cover this year highlights the Riverside County Ag Trail. This collaborative effort, introduced by Supervisors Benoit and Stone, was led by the Riverside County Economic Development Agency with input from Riverside County Information Technology, Environmental Health and the Agricultural Commissioner’s Office, the Riverside County Farm Bureau and the Coachella Valley chapter of California Women for Agriculture. The centerpiece of this project is a website (agtrail.rivcoca.org) featuring agritourism opportunities throughout Riverside County. I encourage everyone to log on, choose a fresh, fun and festive activity and pay a visit to one of the great agricultural destinations included on the Ag Trail.
I wish to express my sincere appreciation to the producers, processors, and agencies that have generously provided the information necessary for the compilation of this report. I would also like to thank all of the members of my staff for their contributions toward the preparation of this report.
Respectfully submitted,

STAFF MEMBERS 1
CROP REPORT CONTEXT 2 - 3
CITRUS CROPS 4
TREE AND VINE CROPS 5
VEGETABLE, MELON AND MISCELLANEOUS CROPS 6 - 7
FIELD AND SEED CROPS 8 - 9
LIVESTOCK AND POULTRY 10
LIVESTOCK AND POULTRY PRODUCTS 10
AQUACULTURE 10
NURSERY STOCK PRODUCTION 11
APICULTURE 11
DISTRICT VALUATIONS 12
PRODUCTION VALUATION CHANGES 2011 - 2012 13
RIVERSIDE COUNTY LEADING AGRICULTURAL VALUATIONS 14
CALIFORNIA'S LEADING AGRICULTURAL COUNTIES 2010 - 2011 14
RIVERSIDE COUNTY AGRICULTUAL PRODUCTION VALUES 2003 - 2012 15
MILLION DOLLAR COMMODITIES 16
SUSTAINABLE AGRICULTURE REPORTS 17
PHYTOSANITARY EXPORT CERTIFICATION SUMMARY 18 - 19
RIVERSIDE COUNTY PEST INTERCEPTIONS 20 - 21
TABLE OF CONTENTS - 2012
2012 Agricultural Production Report Riverside County

Ron Bray Bill Oesterlein
Robert Mulherin Bill Tracy
Don Domenigoni Suzanne Nickau
Erin Freeman Keith Selnick
Dean Gottlieb
Rick Allert Kevin Doi Ting Hsiung Harry Loukatos
Abel Atanaw Eric Downs Yadira Jimenez Victor Miranda
Megan Barron Jacquelyne Drainville Delia Jimenez-Cioc Diana Nguyen
Lucy Candelario Tom Finan Charles Kregl Jose Quintero
Jennifer Chandler Julius Francisco Mike Lahti Hugo Soto
Ven Chien Gabriel Gowman Brian Larson Michele Tracy
Courtney Cooper Charles Hardesty Jeremy Larson Stephanie Van Stockum
Andrea Dillon Tom Hought Arturo Lomeli David Womack
Kelly Briggs Cynthia Ramos
Tara Buffington Veronica Sanchez
Elisa Montiel
Ian Ice Nicholas Janzen
G. Dustin Wiley
STAFF MEMBERS - 2012
Agricultural Commissioner / Sealer of Weights and Measures
John Snyder
Executive Assistant
Patrice Wyatt
Assistant Agricultural Commissioner / Sealer of Weights and Measures
Student Interns
Clerical Support Staff
Deputy Agricultural Commissioner / Sealer
Supervising Agricultural & Standards Investigaors
Agricultural & Standards Investigators
Weights and Measures Inspectors
Steve Bennett
Doug Simmons
2012 Agricultural Production Report 1 Riverside County

2012 Crop Report CONTEXT TM
How Important Is Agriculture to the Local Economy?
Overview
Agriculture clearly plays a key role in maintaining a vibrant Riverside County economy. What remains unclear,
however, is the true size of that role. Just how important is agriculture as a local economic driver? This section
answers that important question, using multiple data sources and advanced economic modeling techniques. It goes
beyond documenting the mere state of agriculture; it quantifies the significance of agriculture. The findings offer the
fullest picture yet of agriculture’s economic role in Riverside County, and should be of interest to policy makers, the
public, and anyone who values a vibrant local economy.
The Mandate
Section 2279 of the California Food and Agriculture Code requires every county agricultural commissioner/sealer to
compile reports of the "condition, acreage, production, and value of the agricultural products in his county." Like other
counties, Riverside has traditionally defined the word "value" as dollar value of production. For the second year now,
we used 21st century economic analysis tools to capture the fuller "value" of Riverside County agriculture. This
includes not just production, but also processing, multiplier effects, employment, and overall rank compared to other
industries. In short, we're using new tools for an old mandate.
Our Approach
When it comes to economic analysis, it's important to examine multiplier effects, which are "ripples" that agriculture
creates in the local economy. These ripples take two forms: indirect effects and induced effects. The first consists of
"business to business" supplier purchases, such as farm equipment, fertilizer, seed, insurance, banking services, and
other agricultural inputs. The second ripple type (induced effects) includes "consumption spending" by agriculture
business owners and their employees. They buy housing, healthcare, leisure activities, and other things for their
households. Quantifying these multiplier effects helps capture the fuller value of an economic sector such as
agriculture.
About the Data & Analysis
Data for the analysis came from the U.S. Bureau of Economic Analysis and other federal government sources, and a
widely used economic modeling program called IMPLAN (www.implan.com). Data are from 2011, the most recent
year available. Crop Report Context TM is a registered trademark of Agricultural Impact Associates LLC, which
performed the analysis for this section (www.ag-impact.com).
2012 Agricultural Production Report 2 Riverside County

2012 Crop Report CONTEXT TM
Including both the production and processing of food and fiber, what
was agriculture's total, direct economic contribution to the county
economy? $2.94 billion
What was the value of agriculture's multiplier effects from local
expenditures by agricultural companies and their employees? $1.22
billion
Considering both direct output and multiplier effects, what was
agriculture's total economic contribution to the county economy? $4.16
billion
How much did agricultural companies pay in indirect business taxes –
which include excise taxes, property taxes, fees, licenses, and sales
taxes but do not include taxes on profit or income? $21.3 million
How many jobs did Riverside County agriculture directly provide?
15,208 jobs
Just counting the direct employees, what percent of Riverside County's
jobs were in agriculture? 1.83%, or about 1 out of every 55 workers
How many extra jobs did agriculture indirectly provide through
expenditures by agricultural companies and their employees? 12,959
jobs
Added together, how many jobs did agriculture directly and indirectly
provide? 28,167 jobs
The Bottom Line. This section puts our annual Crop Report numbers into larger context,
providing the fullest picture yet of agriculture's overall economic role in Riverside County. It shows
agriculture to be a much larger economic engine than many people may have originally thought.
Economic Output
Employment
2012 Agricultural Production Report 3 Riverside County

Planted Harvested Per Per
Year Acreage Acreage Acre Total Unit Unit Total
Grapefruit-Red 2012 2,665 2,584 817 2,111,128 34 lbs 8.03 16,952,358
By-Products 2012 152 392,768 1.04 408,479
Grapefruit-Red 2011 2,938 2,855 798 2,278,290 34 lbs 7.17 16,335,339
By-Products 2011 153 436,815 0.99 432,447
Grapefruit-Ruby 2012 2,925 1,803 987 1,779,561 34 lbs 8.87 15,784,706
By-Products 2012 161 290,283 1.07 310,603
Grapefruit-Ruby 2011 1,893 1,893 936 1,771,848 34 lbs 6.64 11,765,071
By-Products 2011 153 289,629 0.98 283,836
Grapefruit-Other 2012 155 145 769 111,505 34 lbs 7.00 780,535
By-Products 2012 154 22,330 1.10 24,563
Grapefruit-Other 2011 229 229 855 195,795 34 lbs 9.57 1,873,758
By-Products 2011 133 30,457 1.18 35,939
Lemons 2012 6,180 5,408 724 3,915,392 38 lbs 16.95 66,365,894
By-Products 2012 131 708,448 1.77 1,253,953
Lemons 2011 5,735 5,637 740 4,171,380 38 lbs 15.59 65,031,814
By-Products 2011 120 676,440 1.60 1,082,304
Miscellaneous* 2012 41 41 3.86 158 tons 1,689.00 267,301
Miscellaneous* 2011 188 59 5.36 316 tons 976.00 308,650
Oranges-Navel 2012 1,360 1,290 479 617,910 37.5 lbs 8.97 5,542,653
By-Products 2012 230 296,700 1.59 471,753
Oranges-Navel 2011 1,233 1,233 526 648,558 37.5 lbs 6.22 4,034,031
By-Products 2011 213 262,629 0.94 246,871
Oranges-Valencia 2012 2,166 2,133 268 571,644 37.5 lbs 5.15 2,943,967
By-Products 2012 111 236,763 2.02 478,261
Oranges-Valencia 2011 2,121 2,121 433 918,393 37.5 lbs 3.78 3,471,526
By-Products 2011 106 224,826 2.38 535,086
Royal Mandarins 2012 130 130 392 50,960 37.5 lbs 17.65 899,444
By-Products 2012 107 13,910 1.95 27,125
Royal Mandarins 2011 120 120 400 48,000 37.5 lbs 18.00 864,000
By-Products 2011 100 12,000 2.00 24,000
Tangelos 2012 224 224 363 81,312 30 lbs 10.45 849,710
By-Products 2012 143 32,032 1.37 43,884
Tangelos 2011 490 379 386 146,294 30 lbs 10.23 1,496,588
By-Products 2011 165 62,535 1.80 112,563
Tangerines 2012 1,652 1,652 480 792,960 25 lbs 15.06 11,941,978
By-Products 2012 137 226,324 1.49 337,223
Tangerines 2011 1,861 1,748 424 741,152 25 lbs 15.79 11,702,790
By-Products 2011 140 244,720 1.25 305,900
TOTAL 2012 17,498 15,410 125,684,390
2011 16,808 16,274 119,942,513
* Includes: Kumquats, Limes, Blood Oranges.
ValueProduction
CITRUS CROPS
2012 Agricultural Productin Report 4 Riverside County

Planted Harvested Per Per
Year Acreage Acreage Acre Total Unit Unit Total
Apples 2012 23 23 97 2,231 40 lbs 16.14 36,008
2011 22 22 350 7,700 40 lbs 15.00 115,500
Apricots 2012 16 16 101 1,616 25 lbs 18.36 29,670
2011 13 13 200 2,600 25 lbs 20.00 52,000
Avocados 2012 6,337 6,310 280 1,766,800 26 lbs 22.03 38,922,604
2011 6,344 6,170 286 1,764,620 26 lbs 34.00 59,997,080
Cherries 2012 28 28 130 3,640 26 lbs 21.16 77,022
2011 28 28
Dates 2012 8,665 8,250 3.25 26,813 tons 1,567.00 42,015,188
Culls 2012 0.24 1,980 tons 75.65 149,787
Dates 2011 9,328 7,018 3.77 26,458 tons 1,554.00 41,115,514
Culls 2011 0.27 1,895 tons 90.00 170,537
Grapes - Table* 2012 8,013 7,535 117,182,732
(Total) 2011 8,619 7,725 118,524,718
Beauty Seedless 2012 63 63 409 25,767 18 lbs 23.42 603,463
2011 91 91 757 68,887 18 lbs 17.17 1,182,790
Exotic 2012 25 25 520 13,000 18 lbs 14.00 182,000
2011 26 26 520 13,520 18 lbs 14.00 189,280
Flame Seedless 2012 3,900 3,521 804 2,830,884 18 lbs 22.11 62,590,845
2011 4,268 3,582 797 2,854,854 18 lbs 19.61 55,983,687
Perlette 2012 81 81 400 32,400 18 lbs 20.00 648,000
2011 219 111 400 44,400 18 lbs 20.00 888,000
Thompson Seedless 2012 159 159 1,090 173,310 18 lbs 16.82 2,915,074
2011 349 249 794 197,706 18 lbs 22.00 4,349,532
Other Varieties 2012 3,785 3,686 738 2,720,268 18 lbs 18.47 50,243,350
2011 3,666 3,666 720 2,639,520 18 lbs 21.19 55,931,429
Grapes - Wine 2012 2,918 2,744 3.14 8,616 tons 1,240.87 10,691,534
2011 2,772 2,772 2.30 6,376 tons 1,051.00 6,700,756
Miscellaneous** 2012 496 383 6.02 2,306 tons 2,515.69 5,800,326
2011 1,160 387 4.93 1,908 tons 2,549.00 4,863,263
Peaches 2012 154 152 567 86,184 22 lbs 24.58 2,118,403
2011 105 99 505 49,995 22 lbs 21.12 1,055,894
Persimmons 2012 12 11 360 3,960 24 lbs 12.60 49,896
2011 10 10 450 4,500 24 lbs 12.00 54,000
TOTAL 2012 26,662 25,452 217,073,170
2011 28,401 24,244 232,649,262
* Harvested Acreage supplied by the California Desert Grape Administrative Committee.
** Includes: Cherimoya, Figs, Jujube, Mangoes, Nectarines, Olive, Pear, Plums, Pomegrantes, Walnut.
TREE AND VINE CROPS
Production Value
Listed by Variety below.
Frost Damage
2012 Agricultural Production Report 5 Riverside County

Value
Harvested Per Per
Year Acreage Acre Total Unit Unit Total
Artichokes 2012 543 761 413,223 23 lbs 15.14 6,256,196
2011 723 400 289,200 23 lbs 14.83 4,288,836
Beans-Green 2012 938 350 328,300 30 lbs 20.99 6,891,017
2011 916 363 332,508 30 lbs 16.80 5,586,134
Broccoli 2012 2,535 537 1,361,295 23 lbs 6.80 9,256,806
2011 2,717 535 1,453,595 23 lbs 10.47 15,219,140
Cabbage 2012 115 683 78,545 50 lbs 7.38 579,662
2011 93 590 54,870 50 lbs 8.77 481,210
Carrots 2012 2,587 42 108,654 tons 155.16 16,858,755
2011 1,995 45 89,775 tons 135.00 12,119,625
Cauliflower 2012 1,272 719 914,568 23 lbs 9.33 8,532,919
2011 1,399 557 779,243 23 lbs 11.20 8,727,522
Celery 2012 522 1,178 614,916 60 lbs 12.03 7,397,439
2011 478 771 368,538 60 lbs 14.40 5,306,947
Corn-Sweet 2012 2,759 361 995,999 45 lbs 10.12 10,079,510
2011 2,861 396 1,132,956 45 lbs 10.95 12,405,868
Eggplant 2012 349 1,164 406,236 20 lbs 10.40 4,224,854
2011 262 858 224,796 20 lbs 11.52 2,589,650
Lettuce
Head 2012 1,366 450 614,700 50 lbs 7.03 4,321,341
2011 1,348 389 524,372 50 lbs 12.42 6,512,700
Loose Leaf 2012 1,136 693 787,248 22 lbs 10.02 7,888,225
2011 1,066 852 908,232 22 lbs 10.88 9,881,564
Romaine 2012 2,336 722 1,686,592 35 lbs 8.50 14,336,032
2011 2,144 609 1,305,696 35 lbs 12.70 16,582,339
Melons
Cantaloupe 2012 875 712 623,000 40 lbs 6.44 4,012,120
2011 712 661 470,632 40 lbs 9.04 4,254,513
Crenshaw 2012 26 589 15,314 29 lbs 6.38 97,703
2011 53 584 30,952 29 lbs 6.49 200,878
Honeydew 2012 958 1,023 980,034 29 lbs 5.32 5,213,781
2011 889 928 824,992 29 lbs 6.10 5,032,451
Mixed* 2012 766 684 523,944 33 lbs 7.26 3,803,833
2011 558 773 431,334 33 lbs 7.95 3,429,105
VEGETABLE, MELON & MISCELLANEOUS CROPS
Production
* Includes: Casaba, Persian, Santa Claus, and Juan Canary.
2012 Agricultural Production Report 6 Riverside County

Value
Harvested Per Per
Year Acreage Acre Total Unit Unit Total
Melons
Watermelon 2012 1,339 23 30,797 tons 550.00 16,938,350
2011 642 38 24,396 tons 216.00 5,269,536
Miscellaneous** 2012 2,494 6.4 15,962 tons 748.82 11,952,365
2011 4,448 7.8 34,872 tons 550.00 19,179,776
Onions-Dry 2012 100 1,500 150,000 50 lbs 10.00 1,500,000
2011 38 800 30,400 50 lbs 6.25 190,000
Oriental Vegetables 2012 2,564 7.0 17,948 tons 700.00 12,563,600
2011 2,741 8.0 21,928 tons 773.00 16,950,344
Peppers
Bell 2012 5,021 1,086 5,452,806 30 lbs 13.57 73,994,577
2011 5,636 1,209 6,813,924 30 lbs 12.51 85,242,189
Potatoes
Fall 2012 1,380 246 339,480 100 lbs 12.08 4,100,918
2011 735 174 127,890 100 lbs 18.47 2,362,128
Spring 2012 5,844 156 911,664 100 lbs 16.36 14,914,823
2011 2,889 221 638,469 100 lbs 17.39 11,102,976
Radishes 2012
2011 120 1,050 126,000 35 lbs 5.10 642,600
Spices/Herbs 2012 761 1,448 1,101,928 various 3.93 4,330,577
2011 987 950 937,650 various 5.29 4,960,169
Spinach 2012 1,455 691 1,005,405 30 lbs 12.43 12,497,184
2011 188 1,056 198,528 30 lbs 10.06 1,997,192
Squash, All 2012 40 8.7 348 tons 656.00 228,288
2011 472 6.7 3,162 tons 539.00 1,704,534
Strawberries 2012 430 3,800.0 1,634,000 12 lbs 10.00 16,340,000
2011 372 3,728 1,386,816 various 10.06 13,951,369
Tomatoes 2012 297 2,082 618,354 20 lbs 11.42 7,061,603
2011 210 1,800 378,000 20 lbs 6.50 2,457,000
TOTAL 2012 40,808 286,172,478
2011 37,692 278,628,295
VEGETABLE, MELON & MISCELLANEOUS CROPS
Production
** Includes: Amaranth, Arugula, Beets, Blueberries, Chinese Broccoli, Chinese Cabbage, Chives, Cilantro, Fennel, Garlic, Leeks, Butter
Lettuce, Mint, Mushroom, Mustard, Okra, Parsley, Radishes, Snow Peas, Chili Peppers, Pumpkins, Strawberry.
Miscellaneous
2012 Agricultural Production Report 7 Riverside County
Value
Harvested Per Per
Year Acreage Acre Total Unit Unit Total
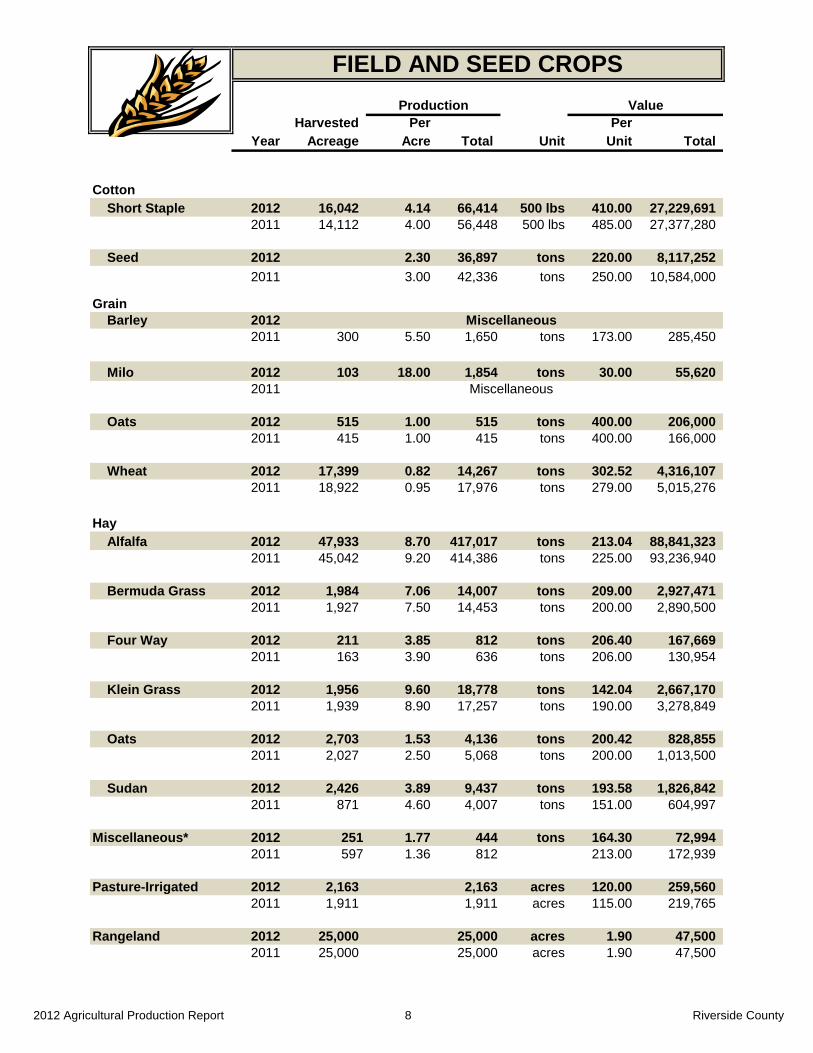
Cotton
Short Staple 2012 16,042 4.14 66,414 500 lbs 410.00 27,229,691
2011 14,112 4.00 56,448 500 lbs 485.00 27,377,280
Seed 2012 2.30 36,897 tons 220.00 8,117,252
2011 3.00 42,336 tons 250.00 10,584,000
Grain
Barley 2012
2011 300 5.50 1,650 tons 173.00 285,450
Milo 2012 103 18.00 1,854 tons 30.00 55,620
2011
Oats 2012 515 1.00 515 tons 400.00 206,000
2011 415 1.00 415 tons 400.00 166,000
Wheat 2012 17,399 0.82 14,267 tons 302.52 4,316,107
2011 18,922 0.95 17,976 tons 279.00 5,015,276
Hay
Alfalfa 2012 47,933 8.70 417,017 tons 213.04 88,841,323
2011 45,042 9.20 414,386 tons 225.00 93,236,940
Bermuda Grass 2012 1,984 7.06 14,007 tons 209.00 2,927,471
2011 1,927 7.50 14,453 tons 200.00 2,890,500
Four Way 2012 211 3.85 812 tons 206.40 167,669
2011 163 3.90 636 tons 206.00 130,954
Klein Grass 2012 1,956 9.60 18,778 tons 142.04 2,667,170
2011 1,939 8.90 17,257 tons 190.00 3,278,849
Oats 2012 2,703 1.53 4,136 tons 200.42 828,855
2011 2,027 2.50 5,068 tons 200.00 1,013,500
Sudan 2012 2,426 3.89 9,437 tons 193.58 1,826,842
2011 871 4.60 4,007 tons 151.00 604,997
Miscellaneous* 2012 251 1.77 444 tons 164.30 72,994
2011 597 1.36 812 213.00 172,939
Pasture-Irrigated 2012 2,163 2,163 acres 120.00 259,560
2011 1,911 1,911 acres 115.00 219,765
Rangeland 2012 25,000 25,000 acres 1.90 47,500
2011 25,000 25,000 acres 1.90 47,500
FIELD AND SEED CROPS
Production
Miscellaneous
Miscellaneous
2012 Agricultural Production Report 8 Riverside County

Value
Harvested Per Per
Year Acreage Acre Total Unit Unit Total
Silage and Green Chop
Alfalfa 2012 2,077 42.00 87,234 tons 57.00 4,972,338
2011 710 41.00 29,110 tons 40.00 1,164,400
Corn 2012 618 24.02 14,844 tons 54.10 803,080
2011 305 28.00 8,540 tons 50.00 427,000
Oats 2012 778 8.00 6,224 tons 60.00 373,440
2011 866 7.00 6,062 tons 36.00 218,232
Sorghum 2012 832 15.00 12,480 tons 45.00 561,600
2011 826 16.00 13,216 tons 45.00 594,720
Sudan 2012 415 14.00 5,810 tons 48.00 278,880
2011 300 18.00 5,400 tons 26.00 140,400
Triticale 2012 2,878 8.50 24,463 tons 49.50 1,210,919
2011 1,220 22.00 26,840 tons 40.00 1,073,600
Wheat 2012 4,876 5.50 26,818 tons 53.00 1,421,354
2011 2,250 6.50 14,625 tons 38.00 555,750
TOTAL 2012 131,160 147,185,665
2011 119,703 149,198,052
* Includes: Grain - Barley, Hay - Teff Grass, Safflower.
FIELD AND SEED CROPS
Production
2012 Agricultural Production Report 9 Riverside County

Value
Number Total Per
Year of Head Liveweight Unit Unit Total
Cattle and Calves 2012 24,405 142,949 cwt 115.00 16,439,135
2011 27,116 144,393 cwt 100.81 14,556,258
Sheep and Lambs 2012 9,292 12,079 cwt 120.97 1,461,197
2011 8,214 10,664 cwt 147.00 1,567,608
Other* 2012 various 1,247,400
2011 various 1,258,400
TOTAL 2012 19,147,732
2011 17,382,266
* Includes Baby Chicks, Chickens, Ducks, Pheasants.
Year Production Unit Unit Total
Eggs 2012 100,568,882 dozen 0.82 82,466,483
2011 100,871,496 dozen 0.81 81,705,912
Milk* 2012 10,277,545 cwt 16.91 173,793,286
2011 10,175,787 cwt 18.85 191,813,585
Other Products** 2012 1,140,617
2011 1,128,617
TOTAL 2012 $257,400,386
2011 $274,648,114
*Information Supplied by: California Agricultural Statistics Service. Includes Fresh Market and Manufactured.
**Includes Wool, Manure.
Year Production Unit Per Unit Total
Catfish 2012 200,000 lbs 2.25 450,000
2011 250,000 lbs 2.30 575,000
Miscellaneous* 2012 various 376,000
2011 various 492,250
Tilapia 2012 1,275,000 lbs 2.65 3,378,750
2011 1,450,000 lbs 2.58 3,741,000
Total 2012 $4,204,750
2011 $4,808,250
* Includes Goldfish, Koi, Tropical Fish, Bass.
LIVESTOCK AND POULTRY
LIVESTOCK AND POULTRY PRODUCTS
Value
AQUACULTURE
Value
2012 Agricultural Production Report 10 Riverside County

Year Acres Production Unit Valuation
Ornamental Nursery Stock 2012 4,717 54,668,972 various 169,065,400
2011 4,800 67,020,872 various 175,352,064
Cut Flowers* / Cut Greens 2012 214 3,874,067 cuttings 2,794,700
2011 206 2,722,400 cuttings 2,092,400
Christmas Trees (cut) 2012 49 2,615 each 200,000
2011 65 1,500 each 97,500
Turf 2012 1,601 69,329,740 square feet 14,911,000
2011 1,951 83,158,000 square feet 18,412,000
Farm Planting Stock 2012 80 157,900 various 3,907,000
2011 84 164,800 various 4,201,000
TOTAL 2012 6,661 190,878,100
2011 7,106 200,154,964
Value
Per
Year Production Unit Unit Total
Honey 2012 1,000,000 lbs 1.82 1,820,000
2011 1,100,000 lbs 1.44 1,584,000
Beeswax 2012 20,000 lbs 2.17 43,400
2011 22,160 lbs 2.17 48,100
Fees Collected for Pollination 2012 20,800 colonies 150.00 3,120,000
2011 23,110 colonies 139.00 3,212,300
Total Colonies 2012 33,750
2011 35,700
TOTAL 2012 4,983,400
2011 4,844,400
NURSERY STOCK PRODUCTION
APICULTURE
2012 Agricultural Production Report 11 Riverside County
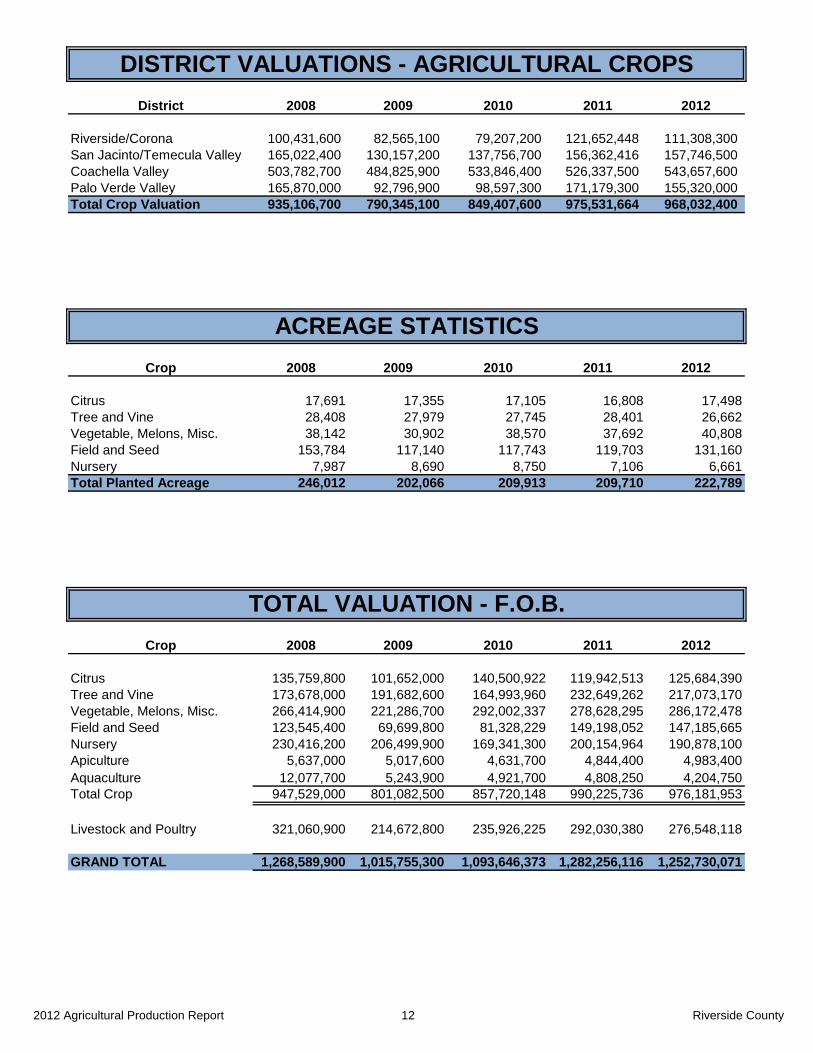
District 2008 2009 2010 2011 2012
Riverside/Corona 100,431,600 82,565,100 79,207,200 121,652,448 111,308,300
San Jacinto/Temecula Valley 165,022,400 130,157,200 137,756,700 156,362,416 157,746,500
Coachella Valley 503,782,700 484,825,900 533,846,400 526,337,500 543,657,600
Palo Verde Valley 165,870,000 92,796,900 98,597,300 171,179,300 155,320,000
Total Crop Valuation 935,106,700 790,345,100 849,407,600 975,531,664 968,032,400
Crop 2008 2009 2010 2011 2012
Citrus 17,691 17,355 17,105 16,808 17,498
Tree and Vine 28,408 27,979 27,745 28,401 26,662
Vegetable, Melons, Misc. 38,142 30,902 38,570 37,692 40,808
Field and Seed 153,784 117,140 117,743 119,703 131,160
Nursery 7,987 8,690 8,750 7,106 6,661
Total Planted Acreage 246,012 202,066 209,913 209,710 222,789
Crop 2008 2009 2010 2011 2012
Citrus 135,759,800 101,652,000 140,500,922 119,942,513 125,684,390
Tree and Vine 173,678,000 191,682,600 164,993,960 232,649,262 217,073,170
Vegetable, Melons, Misc. 266,414,900 221,286,700 292,002,337 278,628,295 286,172,478
Field and Seed 123,545,400 69,699,800 81,328,229 149,198,052 147,185,665
Nursery 230,416,200 206,499,900 169,341,300 200,154,964 190,878,100
Apiculture 5,637,000 5,017,600 4,631,700 4,844,400 4,983,400
Aquaculture 12,077,700 5,243,900 4,921,700 4,808,250 4,204,750
Total Crop 947,529,000 801,082,500 857,720,148 990,225,736 976,181,953
Livestock and Poultry 321,060,900 214,672,800 235,926,225 292,030,380 276,548,118
GRAND TOTAL 1,268,589,900 1,015,755,300 1,093,646,373 1,282,256,116 1,252,730,071
DISTRICT VALUATIONS - AGRICULTURAL CROPS
ACREAGE STATISTICS
TOTAL VALUATION - F.O.B.
2012 Agricultural Production Report 12 Riverside County

125,684,390 119,942,513
217,073,170 232,649,262
286,172,478 278,628,295
147,185,665 149,198,052
190,878,100 200,154,964
4,983,400 4,844,400
4,204,750 4,808,250
976,181,953 990,225,736
276,548,118 292,030,380
1,252,730,071 1,282,256,116
PRODUCTION VALUATION CHANGES 2011 TO 2012
2012 2011 Value Change ($) Percentage ChangeCrop
Citrus
Tree and Vine
Vegetables
Field and Seed
Apiculture
Aquaculture
All Agriculture
Livestock and Poultry
Grand Total
Nursery
5,741,877
(15,576,092)
7,544,183
(2,012,387)
(9,276,864)
139,000
4.8%
-6.7%
2.7%
-1.3%
-4.6%
2.9%
-12.6%
-1.4%
-5.3%
-2.3%
(603,500)
(14,043,783)
(15,482,262)
(29,526,045)
2012 Agricultural Production Report 13 Riverside County

1 Nursery Stock $200,154,964 1 Nursery Stock $190,878,100
2 Milk 191,813,585 2 Milk 173,793,286
3 Table Grapes 118,524,718 3 Table Grapes 117,182,732
4 Hay 101,155,740 4 Hay 97,259,330
5 Bell Peppers 85,242,189 5 Eggs 82,466,483
6 Eggs 81,705,912 6 Bell Peppers 73,994,577
7 Lemons 67,619,847 7 Lemons 67,619,847
8 Avocados 59,997,080 8 Dates 42,015,188
9 Dates 41,286,051 9 Avocados 38,922,604
10 Cotton 37,961,280 10 Cotton 35,346,943
11 Grapefruit 34,261,244 11 Grapefruit 34,261,244
12 Misc. Vegetables 19,179,776 12 Potatoes 19,015,741
13 Oriental Vegetables 16,950,344 13 Watermelon 16,938,350
14 Romaine Lettuce 16,582,339 14 Carrots 16,858,755
15 Broccoli 15,219,140 15 Cattle / Calves 16,439,135
16 Cattle / Calves 14,556,258 16 Strawberries 16,340,000
17 Tangerines / Mandarines 14,505,841 17 Romaine Lettuce 14,336,032
18 Strawberries 13,951,369 18 Mandarins 14,099,364
19 Potatoes 13,465,104 19 Oriental Vegetables 12,563,600
20 Sweet Corn 12,405,868 20 Spinach 12,497,184
2010 2011
County Value ($) County Value ($)
1 Fresno 5,944,148,000 1 Fresno 6,884,582,000
2 Tulare 4,863,706,000 2 Tulare 5,629,264,000
3 Kern 4,757,261,000 3 Kern 5,364,363,000
4 Monterey 4,006,240,000 4 Monterey 3,922,035,000
5 Merced 2,733,495,000 5 Merced 3,259,866,000
6 Stanislaus 2,572,433,000 6 Stanislaus 3,069,823,000
7 San Joaquin 1,960,721,000 7 San Joaquin 2,246,920,000
8 Ventura 1,856,698,000 8 Kings 2,219,529,000
9 Kings 1,717,970,000 9 Imperial 1,964,087,000
10 San Diego 1,648,572,000 10 Ventura 1,841,247,000
11 Imperial 1,598,534,000 11 San Diego 1,683,740,000
12 Madera 1,348,535,000 12 Madera 1,569,239,000
13 Santa Barbara 1,219,996,000 13 Riverside 1,282,256,000
14 Riverside 1,093,651,000 14 Santa Barbara 1,194,379,000
RankRank
2012
RIVERSIDE COUNTY LEADING AGRICULTURAL VALUATIONS
CALIFORNIA'S LEADING AGRICULTURAL COUNTIES BY TOTAL
VALUE OF PRODUCTION
2011
2012 Agricultural Production Report 14 Riverside County

YEAR VALUE STATE RANK
2003 $1,067,367,300 12
2004 $1,131,605,200 12
2005 $1,168,671,100 12
2006 $1,102,438,400 12
2007 $1,265,063,200 12
2008 $1,268,589,900 13
2009 $1,015,755,300 13
2010 $1,093,646,349 14
2011 $1,282,256,116 13
2012 $1,252,730,071
RIVERSIDE COUNTY AGRICULTURAL PRODUCTION
VALUES 2003 - 2012
agtrail.rivcoca.org
2012 Agricultural Production Report 15 Riverside County
Rank
1 Nursery Stock $190,878,100
2 Milk 173,793,286
3 Table Grapes 117,182,732
4 Hay 97,259,330
5 Eggs 82,466,483
6 Bell Peppers 73,994,577
7 Lemons 67,619,847
8 Dates 42,164,975
9 Avocados 38,922,604
10 Cotton 35,346,943
11 Grapefruit 34,261,244
12 Potatoes 19,015,741
13 Watermelon 16,938,350
14 Carrots 16,858,755
15 Cattle and Calves 16,439,135
16 Strawberries 16,340,000
17 Romaine Lettuce 14,336,032
18 Mandarins 14,099,364
19 Oriental Vegetables 12,563,600
20 Spinach 12,497,184
21 Misc. Vegetables 11,952,365
22 Wine Grapes 10,691,534
23 Sweet Corn 10,079,510
24 Broccoli 9,256,806
25 Cauliflower 8,532,919
26 Loose Leaf Lettuce 7,888,225
27 Celery 7,397,439
28 Tomatoes 7,061,603
29 Green Beans 6,891,017
30 Artichoke 6,256,196
31 Navel Oranges 6,014,406
32 Misc. Tree and Vine 5,800,326
33 Honeydew Melon 5,213,781
34 Apiculture 4,983,400
35 Alfalfa - Silage 4,972,338
36 Herbs and Spices 4,330,577
37 Head Lettuce 4,321,341
38 Wheat - Grain 4,316,107
39 Triticale - Silage 4,210,919
40 Cantaloupe 4,012,120
41 Mixed Melon 3,803,833
42 Valencia Orange 3,422,228
43 Talapia 3,378,750
44 Peaches 2,118,403
45 Dry Onions 1,500,000
46 Sheep and Lambs 1,461,197
47 Wheat - Silage 1,421,354
48 Other Livestock 1,247,400
49 Other Livestock Products 1,140,617
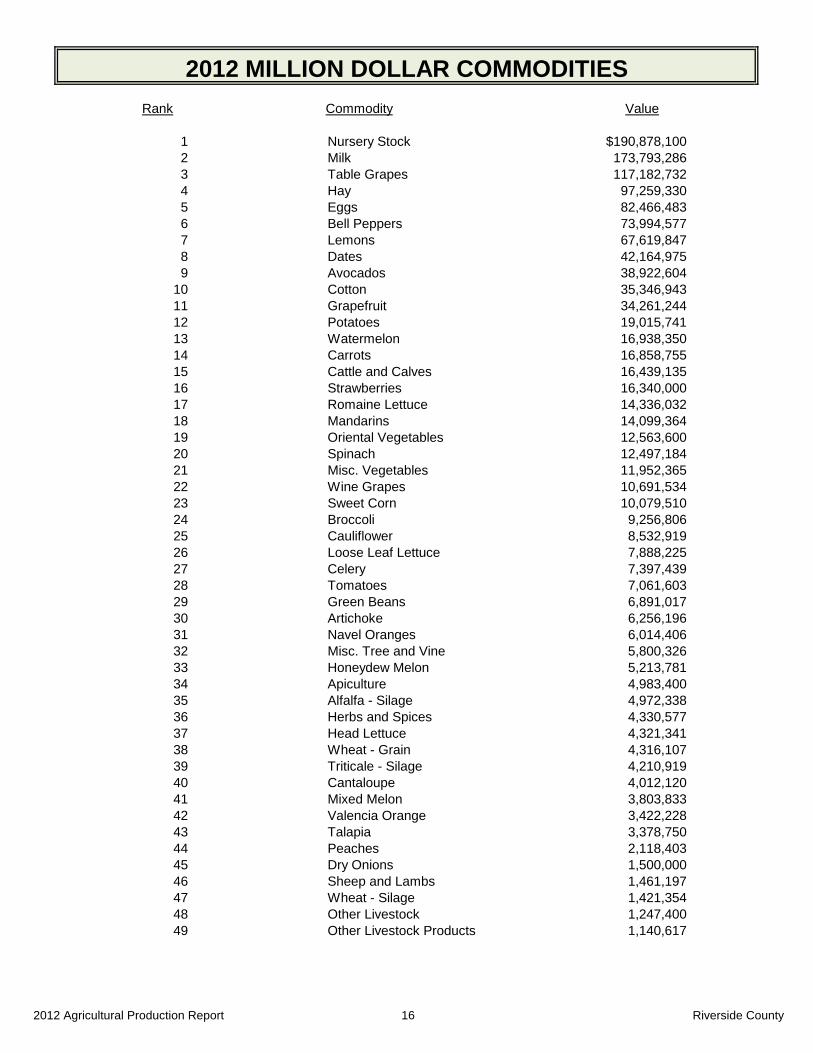
2012 MILLION DOLLAR COMMODITIES
ValueCommodity
2012 Agricultural Production Report 16 Riverside County

ORGANIC FARMING BIOLOGICAL CONTROL OF WEEDS145 Organic producers registered in Riverside County
Pest Control Agent
Yellow Starthistle Bangasternus orientalis (weevil)
PEST DETECTION (Commercial and Urban) Eustenopus Villosus (weevil)
Puncture Vine Microlarinus lareynii (weevil)
Activity Hours Microlarinus lypriformis (weevil)
Commercial Crops 1,842
Public Contact 80 BIOLOGICAL CONTROL OF INSECTS
Special Surveys: AND SNAILS
Red Imported Fire Ant 46 Pest Control Agent
Other 124 Ash Whitefly Eucarisa arthenopea (wasp)
Black Scale Metaphycus helvolus (wasp)
Citrus Tristeza Indexing (Coachella Valley) Numbers Brown Soft Scale Metaphycus luteolus (wasp)
Commercial California Red Aphytis melinus (wasp)
Scale
Properties tested 1 Citrus Mealybug Cryptolaemus montrouzieri (beetle)
Acres Sampled 25 Cottony Cushion Encarisia sp. (wasp)
Samples tested biochemically 193 Scale Cryptochaetum iceyae (fly)
"Positive" samples 0 Eucalyptus Aventianella longoi (wasp)
Long-horned Borer Jarra phoracantha (wasp)
Syngaster lepidus (wasp)
PEST DETECTION (Exotic Insects) Mosquitoes Bacillus thur. iraelensis (baterium)
Gamusia affinis (fish)
Pest Trap Servicings Olive Fruit Fly Psyttalia concolor (wasp)
Persea Mite Galendromus annectens (mite)
European Grape Vine Moth 9,818 Galenromus helveolus (mite)
Light Brown Apple Moth 636 Galendromus pilosus (mite)
Asian Citrus Psyllid 407 Red Gum Lerp Plyllaephagus bliteus (wasp)
European Corn Borer 65 Psyllid
Pink Hibiscus Mealybug 48 Red Imported Fire Beauveria bassiana (fungus)
Gypsy Moth 27 Ant Pseudacteon tricuspis (fly)
Khapra Beetle 3 Two Spotted Phytoseiulus persimilis (mite)
Spider Mite Galendromus occidentalis (mite)
Vine Mealybug Cryptolaemus montrouzieri (beetle)
Pest Exclusion (Incoming plant shipments) Western Grapeleaf Ametadoria harrisinae (parasitoid)
Skeletonizer Apanteles harrisinae (wasp)
Units Profiled Units inspected Rejections Wooly Whitefly Amitus spiniferus (parasitiod)
5,989 2,916 33 Cales noacki (parasitoid)
Brown Garden Rumina decollate (snail)
Snail
PEST ABATEMENT / HOLD NOTICES
Pest Properties OTHERCalifornia Red Scale 37 Enforcement of County Ordinances to control Lettuce
Asian Citrus Psyllid 21 Mosaic Virus, Agricultural Grading, Land Application
Sting Nematode 9 of Manure and Biosolids, Cotton Plowdown, Blowing
Citrus Tristeza Virus 0 Dust, and Beekeeping.
Glassy-Winged Sharpshooter 0
SUSTAINABLE AGRICULTURE - 2012
2012 Agricultural Production Report 17 Riverside County

Aruba Honduras Japan Singapore
Australia Hong Kong Republic of Korea Slovakia
Bahamas India Lebanon South Africa
Barbados Indonesia Malawi Spain
Bermuda Israel Malaysia Sri Lanka
Brazil Italy Mexico Switzerland
Brunei Darussalam Dominican Republic Morocco Taiwan
Canada Ecuador Nepal Thailand
Chile El Salvador Netherlands Trinidad and Tobago
China Fiji New Caledonia Turkey
Colombia French Polynesia New Zealand Uganda
Costa Rica Germany Nigeria United Arab Emirates
Curacao Greece Panama United Kingdom
Denmark Guadeloupe Peru Viet Nam
Guatemala Jamaica Philippines
Note: This list represents only countries that specifically require "pest cleanliness" certification services.
All Export Countries
PHYTOSANITARY EXPORT CERTIFICATION - 2012
Top Ten Export Countries
Japan 28%
Mexico 25%
China 15%
Republic of Korea 8%
Canada 8%
Australia 4%
Taiwan 1%
Thailand 1%
French Polynesia 0.9%
Other 9%
2012 Agricultural Production Report 18 Riverside County

Alfalfa Cotton Mango Raisin
Almond Date Palm Melon Romaine
Apple Dates Mint Rosemary
Artichoke Dill Nectarine Sage
Avocado Douglas Fir Nuts Savory
Basil Endive Oat Sour Orange
Bermuda Grass Fennel Olive Sudan Grass
Balackeyed Pea Flax Orange Sunflower
Blood Orange Grape Oregano Sweet Orange
Broccoli Grapefruit Ornamental Nursery Stock Tangelo
Brussels Sprouts Green Leaf Lettuce Pea Tangerine
Cantaloupe Klein Grass Peach Tangor
Cauliflower Kumquat Pepper Thyme
Celery Lemon Pomegranate Tomato
Chives Lettuce Potato Valencia Orange
Cilantro Macadamia Nut Prune Watermelon
Corn Mandarin Pummelo White Ash
Wood
Note: This list represents commodities exported only to countries that specifically require "pest cleanliness" certification services.
All Export Comodities
PHYTOSANITARY EXPORT CERTIFICATION - 2012
2012 Agricultural Production Report 19 Riverside County

Diaphorina citri Asian Citrus Psyllid A 10
Solenopsis invicta Red Imported Fire Ant A 9
Pseudaulacaspis cockerilli False Oleander Scale A 2
Aspidiotus destructor Coconut Scale A 1
Coccus viridis Green Scale A 1
Pseudaulacaspis pentagona White Peach Scale A 1
Aonideilla aurantii California Red Scale B 7
Cyperu esculentus Yellow Nut Sedge B 3
Cyperus rotundus Purple Nut Sedge B 1
Euphyllura olivina Olive Psyllid B 1
Ferrisia virgata Striped Mealygug B 1
Pulvinaria psidii Guava Scale B 1
Pulvinaria urbicola Urbicola Scale B 1
Paracoccus sp. A Mealybug Q 18
Dendrothrips howei Thrips Q 7
Miscanthicoccus miscanthi Grass Mealybug Q 6
Heterogaster urticae Nettle Ground Bug Q 4
Hypogeococcus pungens Cactus Mealybug Q 2
Scientific Name Common Name InterceptionsPest Rating
PEST INTERCEPTIONS - 2012
2012 Agricultural Production Report 20 Riverside County

Delottococcus confusus A Mealybug Q 1
Frankliniella schultzei Tomato Thrips Q 1
Kallitaxila granulata Grainy Plant Hopper Q 1
Planococcus sp. Passion Vine Mealybug Q 1
Pseudaulacaspis sp. A Scale Q 1
Ripersiella hibisci A Scale Q 1
Technomyrmex albipes White Footed Ant Q 1
Pest Rating Designations
"A" is an organism of known economic importance subject to state (or County Agricultural Commissioner)
enforcement action.
"B" is an organism of known economic importance subject to enforcement acion at the discretion of the
County Agricultural Commissioner.
"Q" is an organism suspected to be of economic importance but its status is uncertain because of
incomplete or inadequate information.
A B Q
2012 84 24 16 44
2011 92 36 12 44
2010 38 4 11 23
2009 72 13 21 38
2008 58 39 34
Interceptions
PEST INTERCEPTIONS - 2012
PEST INTERCEPTION SUMMARY 2008 - 2012
131
TotalYear
Scientific Name Common Name Pest Rating
2012 Agricultural Production Report 21 Riverside County

RIV
ERSI
DE
CO
UN
TY
AG
RIC
ULT
UR
AL
CO
MM
ISSI
ON
ER'S
OFF
ICE
DEC
EMB
ER 2
01
2

Notes
Riversid
e Co
un
ty A
gricultu
ral Co
mm
ission
er’s Office
P.O
. Bo
x 10
89
Riversid
e, CA
92
50
2-1
08
9