2012 sales compensation practices survey for the high-tech ... · 2012 sales compensation practices...
TRANSCRIPT

Copyright 2012 © WorldatWork and ZS Associates, Inc.
2012 Sales Compensation Practices Survey
for the High-Tech Industry
May 2012
This report is solely for the use of all direct recipients. No part of it may be circulated, quoted or reproduced
for distribution to any third party without prior written approval of ZS Associates and WorldatWork.

Copyright 2012 © WorldatWork and ZS Associates, Inc.
Introduction
Welcome to the 2012 edition of Sales Compensation Practices Survey for the High-Tech
Industry conducted by ZS Associates and WorldatWork.
The questionnaire used for this study was developed based on numerous interviews with
high-tech sales compensation leaders. The result was a study focused on the critical issues
facing sales compensation professionals today.
We hope you find the results of the survey beneficial and useful. If you have suggestions
for future surveys, please send an email to [email protected] or
Best Regards,
2
This report is published by the WorldatWork and ZS Associates, Inc. and contains information based on input from companies or individuals engaged in the development or
management of sales compensation plans

Copyright 2012 © WorldatWork and ZS Associates, Inc.
Invitations to participate in the study were sent out via email to selected high-tech
companies in February 2012.
Participants from 17 U.S.-based high-tech companies completed the online survey from
February through March 2012.
The survey was divided into the following categories of questions:
Incentive methods
Reporting and timing
Sales crediting
General sales force measurements
Incentive compensation issues
Respondents filled out the survey for different types of sales roles. These roles were
aggregated in four groupings:
Client relationship managers
Partner or channel account managers
Lead sales role
Technical specialists
Research Methodology
Please notes: n-sizes throughout the survey represent the number of responding companies, unless otherwise stated. Median values are not shown if fewer than five
responses were received; other values are not shown if fewer than three responses were received. Caution should be taken whenever values are based on small
response. 3

Copyright 2012 © WorldatWork and ZS Associates, Inc.
Participants*
Dell
Citrix Systems
Google, Inc.
IBM
EMC
GoDaddy.com, LLC
Motorola Mobility
CA Technologies
Microsoft
Wipro Ltd
CGI
AMD
Sonus Networks
Corning
BMC Software, Inc.
4
* Responses from two respondents that did not provide their company name are included in the analysis.

Copyright 2012 © WorldatWork and ZS Associates, Inc.
Section Page
Executive Summary 6
Incentive Methods 8
General Sales Force Measurements 17
Incentive Compensation Issues 21
Participant Profile 23
About ZS Associates, Inc. 26
About WorldatWork 27
5
Contents

Copyright 2012 © WorldatWork and ZS Associates, Inc.
Executive Summary
6

Copyright 2012 © WorldatWork and ZS Associates, Inc.
Executive Summary
7
Incentive Methods
• More than 3 out of 4 surveyed companies use some incentive method to encourage higher
price points for their products; specific methods vary widely
• Capping incentive earnings is not common for pure sales/hunter roles, but is more prevalent
for other sales roles
• The top performing sales representatives typically earn more than 2x the target incentive for
all roles
• The majority of respondents do not use any type of special incentives to encourage selling
early in the performance period
• Two-thirds of companies complement the sales incentive plan with a recognition program to
recognize and reward top performers; most utilize contests/SPIFFs to spur short-term
focused sales efforts
General Sales Force
Measurements
• Turnover rate (voluntary and involuntary combined) is less than 20% for most of the
companies surveyed, with a mean of 14%
• Most of the companies standardize compensation plans and roles across multiple countries
• Most companies do not spend more than 5% of revenues on sales compensation
Incentive Compensation
issues
• Accurate quota setting and overly complex plans are the biggest issues identified by surveyed
companies

Copyright 2012 © WorldatWork and ZS Associates, Inc.
Incentive Methods
8

Copyright 2012 © WorldatWork and ZS Associates, Inc.
In your last completed fiscal year, what methods did you use to incent
representatives to obtain the highest possible price levels? (check all that apply)
Vary the payout rate based on product/deal gross margin
Pay on gross profit dollars
Do not incorporate price into the plan
Pay on gross margin percent
Pay on net bookings
Pay on average selling price (ASP) achievement
Other
5
4
4
2
2
1
2
The majority of surveyed companies encourage higher prices with their sales
incentive plan, though the specific tactic varies widely.
Other responses include: •Price Floors •Based on revenue
9
number of respondents
n=17

Copyright 2012 © WorldatWork and ZS Associates, Inc.
For each of the following roles in your most recent fiscal year, did you use caps
to limit the amount of incentive pay earned?
Client Relationship Manager
(n=13)
Lead Sales Role (Hunter/Pure Sales)
(n=14)
Technical Specialist (Pre- and Post-Sales)
(n=17)
Partner or Channel Account Manager
(n=13)
Absolute cap on
incentive earnings
No cap and no
“decelerator”
“Decelerator” that slows
earning increases beyond a
specific performance level
“Per deal” cap applied to
each sale separately
Other
6
3
3
0
1
7
6
2
0
2
6
2
3
1
1
Capping incentive earnings is uncommon for the hunter / pure sales role, but is
slightly more common for the other sales roles.
4
5
3
1
1 Other responses include: •Cap and decelerator •Discretionary
10
number of
respondents number of
respondents
number of
respondents number of
respondents

Copyright 2012 © WorldatWork and ZS Associates, Inc.
For each of the following roles, how much incentive pay (as a multiple of the
target incentive) did your company plan as payout for its top performing sales
representatives (top 10%) in your most recently completed fiscal year ?
Client relationship manager
n=10
Lead sales role (hunter/pure sales)
n=11
Technical specialist (pre- and post-sales)
n=13
Partner or channel account manager
n=11
2.6
2.6
2.1
2.5
Top performing sales reps typically earn more than 2X the target incentive.
Mean Multiple of Target Incentive
11

Copyright 2012 © WorldatWork and ZS Associates, Inc.
What incentive methods do you use to encourage reps to sell earlier in the
performance period (not wait until the very end of the period)?
We do not incent our salespeople to sell
earlier in the year/period
MBOs
“Fast Start” bonus for sales early in the
period
SPIFFs early in the period
Pay some upside earlier in the period for
over performance up to that point
9
3
3
1
1
More than half of the respondents do not use any type of special incentives to
encourage selling early in the performance period.
number of respondents
n=17
12

Copyright 2012 © WorldatWork and ZS Associates, Inc.
How do you reward reps for selling multi-year service arrangements?
Multi-year deal results in a
kicker/accelerator on base earnings
Reward reps for the first X years in the
contract (e.g., 3)
Reward reps for all revenues in the
contract
MBOs
Other
6
4
3
2
2
Companies usually reward for multi-year service arrangements but the method
for rewarding varies.
Other responses include: •Use of a signings element when appropriate •We do not comp on multi-year deals
number of respondents
n=17
13
Copyright 2012 © WorldatWork and ZS Associates, Inc.
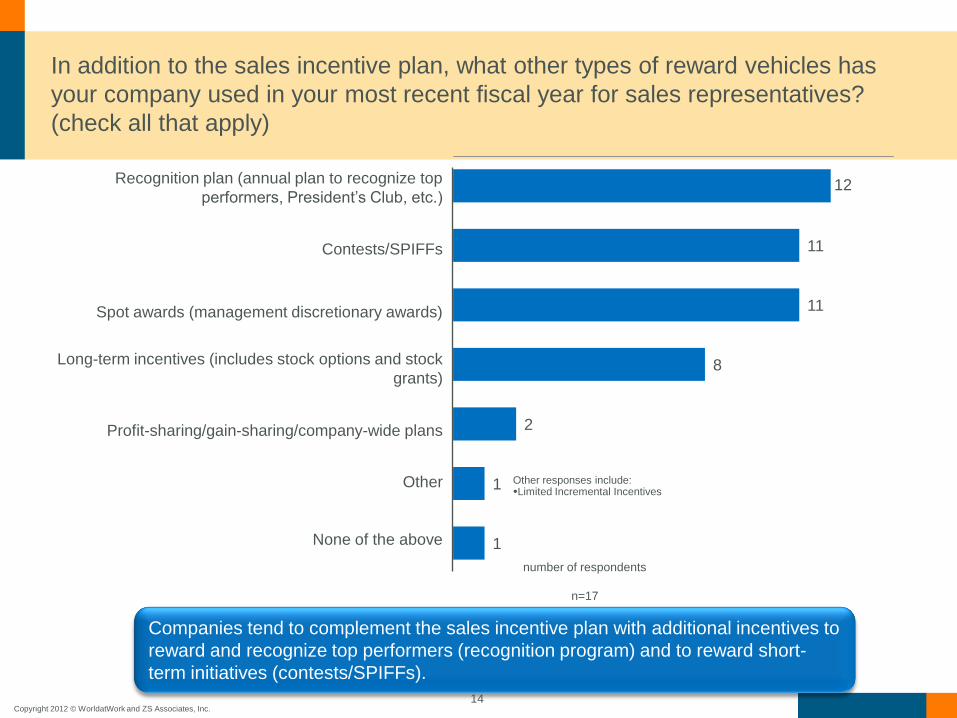
In addition to the sales incentive plan, what other types of reward vehicles has
your company used in your most recent fiscal year for sales representatives?
(check all that apply)
Recognition plan (annual plan to recognize top
performers, President’s Club, etc.)
Contests/SPIFFs
Spot awards (management discretionary awards)
Long-term incentives (includes stock options and stock
grants)
Profit-sharing/gain-sharing/company-wide plans
Other
None of the above
12
11
11
8
2
1
1
Companies tend to complement the sales incentive plan with additional incentives to
reward and recognize top performers (recognition program) and to reward short-
term initiatives (contests/SPIFFs).
Other responses include: •Limited Incremental Incentives
number of respondents
n=17
14

Copyright 2012 © WorldatWork and ZS Associates, Inc.
What percent of earnings are received at each of these points in the order
process? (responses must sum to 100%)
On average, earnings are split evenly across various stages in the order process.
n=15 Note: 2 respondents
excluded from analysis.
perc
ent of earn
ings (
mean) 21%
25%
23%
12%
19%
0%
5%
10%
15%
20%
25%
30%
When an order is booked
When an order in invoiced
When an order is shipped
When an order is paid
When revenue is recognized
15
Copyright 2012 © WorldatWork and ZS Associates, Inc.
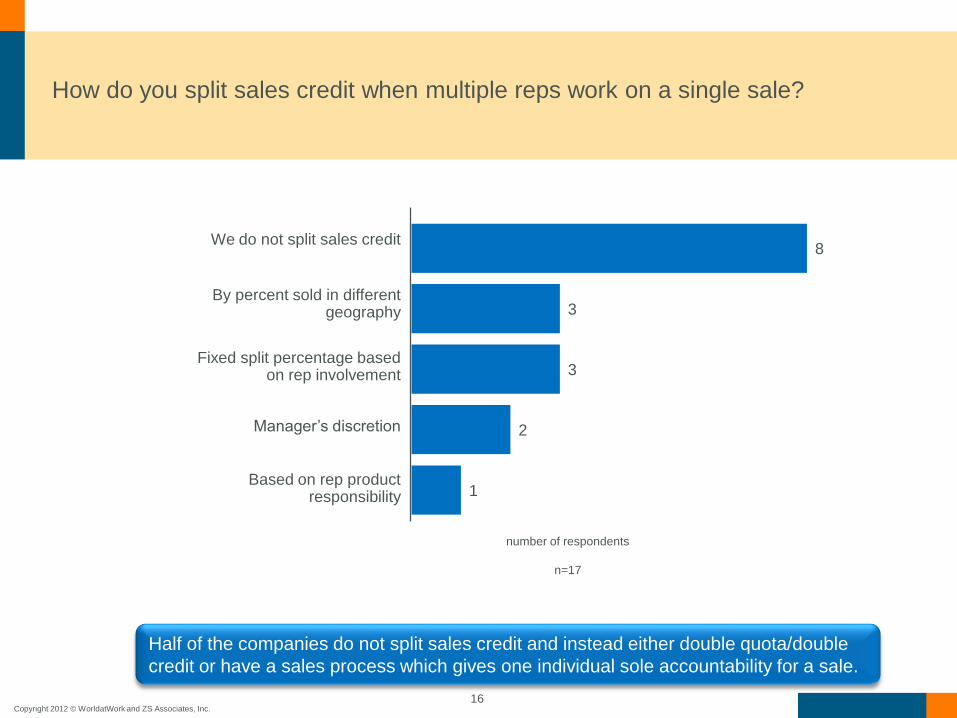
How do you split sales credit when multiple reps work on a single sale?
We do not split sales credit
By percent sold in different geography
Fixed split percentage based on rep involvement
Manager’s discretion
Based on rep product responsibility
8
3
3
2
1
Half of the companies do not split sales credit and instead either double quota/double
credit or have a sales process which gives one individual sole accountability for a sale.
number of respondents
n=17
16

Copyright 2012 © WorldatWork and ZS Associates, Inc.
General Sales Force Measurements
17

Copyright 2012 © WorldatWork and ZS Associates, Inc.
What was the total turnover rate (voluntary and involuntary combined) for sales
roles at your company during the most recently completed fiscal year?
Turnover rate (voluntary and involuntary combined) is less than 20% for most
participants, with a mean of 14%.
1 1
0
7
8
0
1
2
3
4
5
6
7
8
9
40+ 31-40% 21-30% 11-20% 0-10%
Turnover Rate Distribution
n=17
nu
mb
er
of re
sp
on
de
nts
Turnover rate (percent)
turnover rate percent
Mean 14%
75th percentile 18%
Median 12%
25th percentile 7%
18

Copyright 2012 © WorldatWork and ZS Associates, Inc.
Which of the following do you standardize across multiple countries?
(check all that apply)
Compensation plans
Roles
Pay mix
Leverage targets (the ratio of the top performers’
incentive pay to average incentive pay)
Inconsistent. Several countries have standard
features and some countries do not have shared
or standard features
We do not manage sales compensation across
multiple countries
14
12
8
8
3
1
Most of the companies standardize compensation plans and roles across
multiple countries.
number of respondents
n=17
19

Copyright 2012 © WorldatWork and ZS Associates, Inc.
What was the total sales compensation cost of sales (base salary + sales
incentives) as a percentage of revenue for your most recently-ended fiscal or
calendar year?
Total sales compensation cost of sales (base salary + sales incentives)
as a percentage of revenue for most recently-ended fiscal or calendar year
n=13
n=4
No
Yes
Companies tracking sales force compensation
cost of sales (CCOS)
Most companies do not spend more than 5% of associated revenue on sales
compensation.
n=11*
n=17 Note: two outliers were
removed from the analysis.
nu
mb
er
of co
mp
an
ies
0%
1%
2%
3%
4%
5% 75th Percentile
4.8%
25th Percentile
1.1%
Median
3.0%
Mean = 3.9%
20

Copyright 2012 © WorldatWork and ZS Associates, Inc.
Incentive Compensation Issues
21

Copyright 2012 © WorldatWork and ZS Associates, Inc.
Which of the following are the five most difficult sales compensation problems
for your company at the moment? (check all that apply)
Quota setting fairness
Sales forecast accuracy
Incentive plan complexity and/or field comprehension of the plan
Data availability to accurately assess performance
Effective communication of the incentive compensation plan
Incentive compensation payouts not aligned to corporate performance
Efficient incentive compensation administration
Adequate upside opportunity to motivate and retain top performers
Incentive plan not motivational enough, or motivating incorrectly
Competitiveness of total pay levels with the market
Compensation adjustments to reflect localized differences 2
2
3
4
5
5
6
8
8
10
13
Accurate quota setting and improving plan simplicity are the biggest issues identified.
number of respondents
n=17
22

Copyright 2012 © WorldatWork and ZS Associates, Inc.
Respondent Profile
23

Copyright 2012 © WorldatWork and ZS Associates, Inc.
At the end of your most recently completed fiscal year, how many sales people
(FTEs) were in each of the following roles?
Roles Total across all
companies surveyed
Number of
companies with
the role
Average number of
sales people
Client Relationship
Manager 20,005 13 1,539
Lead Sales Role
(Hunter/Pure Sales) 9,230 14 659
Technical Specialist
(Pre- and Post-Sales) 23,652 17 1,391
Partner or Channel
Account Manager 6,644 13 511
24
n=17

Copyright 2012 © WorldatWork and ZS Associates, Inc.
Service provider
Software – enterprise
Telecommunications manufacturer
Computer hardware manufacturer
Internet information provider
Semiconductor manufacturer
Which of the following best describes your company’s industry segment?
1
2
2
3
4
4
25
Note: information was not received from
one respondent
number of respondents
n=16

Copyright 2012 © WorldatWork and ZS Associates, Inc.
About ZS Associates
ZS Associates is a global management consulting firm specializing in sales and marketing strategy,
operations and execution.
Founded in 1983, ZS has grown into a firm of more than 2,000 professionals delivering expertise across
much of the sales and marketing spectrum. Our core practice areas include go-to-market and sales
organization strategy and extend to the deep tactical levels required to effectively implement those
strategies.
The breadth and depth of ZS offerings combine to enable a unique client partnership—both in the
development of effective strategies and in their execution. We have pioneered an approach to sales and
marketing consulting that is fact-based, analytically rigorous, and drawn from our many innovative
methodologies, processes and decision support tools.
Our client base is comprised of a diverse mix of companies, ranging from global market leaders to
entrepreneurial start-ups, across more than 65 countries. The customized solutions we deliver for our
clients extend from issue-specific at one end of the spectrum to large-scale, multinational business
transformations at the other. In all cases, we combine our strategy, operations and execution expertise to
ensure that the solutions we develop will work, and to help our clients successfully implement them at the
tactical level.
For more information on ZS Associates, please visit our website www.zsassociates.com.
26

Copyright 2012 © WorldatWork and ZS Associates, Inc. 27
About WorldatWork
WorldatWork (www.worldatwork.org) is a not-for-profit organization providing education, conferences and
research focused on global human resources issues including compensation, benefits, work-life and
integrated total rewards to attract, motivate and retain a talented workforce.
Founded in 1955, WorldatWork has nearly 30,000 members in more than 100 countries. Its affiliate
organization, WorldatWork Society of Certified Professionals®, is the certifying body for the prestigious
Certified Compensation Professional® (CCP®), Certified Benefits Professional® (CBP), Global Remuneration
Professional (GRP®), Work-Life Certified Professional™ (WLCP®), Certified Sales Compensation
Professional™ (CSCP™), and Certified Executive Compensation Professional™ (CECP™).
WorldatWork has offices in Scottsdale, Arizona, and Washington, D.C.