2012 san diego city storm water survey · 2012 san diego city storm water survey ... diego job...
TRANSCRIPT

Findings from Opinion Research
2012
SAN DIEGO CITY STORM WATER SURVEY
Conducted for
Think Blue San Diego
Goodwin Simon Strategic Research
April, 2012

TABLE OF CONTENTS Methodology............................................................................................................................................... 4
Executive Summary ................................................................................................................................... 7
Detailed Findings ..................................................................................................................................... 17
I. Familiarity with the Think Blue San Diego Slogan ................................................................... 17 Awareness of the Slogan............................................................................................................ 17 Where Did You Hear the Slogan............................................................................................... 22
II. Think Blue San Diego Communications ..................................................................................... 25 Awareness of Think Blue San Diego Communication Channels......................................... 25 Awareness of Think Blue San Diego’s Facebook Page .......................................................... 30 Awareness of the Telephone Hotline ....................................................................................... 33 Awareness of Specific Think Blue San Diego Communications .......................................... 35
III. Changes in Behavior to Reduce Pollution .................................................................................. 38 Changes That Were Made.......................................................................................................... 40
IV. Knowledge of Storm Drain System ............................................................................................. 44 V. Prevalence and Seriousness of Storm Drain Pollutants............................................................ 47
Prevalence of Pollutants............................................................................................................. 47 Seriousness Ratings for Storm Drain Pollutants..................................................................... 50
VI. Strongest Concern About Pollution............................................................................................. 56 VII. Job Being Done by the City to Reduce Pollution ............................................................... 58
Ratings of City Performance Regarding Reducing Pollution............................................... 58 Awareness of City Efforts to Prevent Pollution...................................................................... 62
VIII. Websites ................................................................................................................................... 63 Familiarity of Websites............................................................................................................... 63 Likelihood to Use Websites for Pollution Prevention Activities.......................................... 63
IX. Sample Demographics................................................................................................................... 66 Hispanics and Race..................................................................................................................... 66 Language ...................................................................................................................................... 67 Educational Attainment ............................................................................................................. 68 Age ................................................................................................................................................ 68 Type of Residence ....................................................................................................................... 69 Length of Residency in San Diego............................................................................................ 69 Language of Interview ............................................................................................................... 70 Gender .......................................................................................................................................... 70

TABLE OF FIGURES Figure 1: Heard the Slogan "Think Blue San Diego" Last Year in Surveys from 2001-2012.......... 17
Figure 2: Change in Awareness of Slogan over Time by Race: 2007 to 2012 Surveys ................. 20
Figure 3: Change in Awareness of Slogan over Time by Gender: 2007 to 2012 Surveys.............. 21
Figure 4: Change in Awareness of Slogan over Time by Age Range: 2007 to 2012 Surveys ....... 22
Figure 5: Proportion Who Have Seen or Heard a Think Blue Program Communication: 2012 Survey ............................................................................................................................................... 27
Figure 6: Proportion Seeing Think Blue Communications: 2010 to 2012 Surveys........................ 28
Figure 7: Likelihood to Join the Think Blue Facebook Page in 2012 Among Active Facebook Users (who are not familiar with it currently – n=368).............................................................. 32
Figure 8: Seen or Heard About Telephone Hotline in 2011/2012 Surveys..................................... 33
Figure 9: Seen or Heard Specific Communications from Think Blue in 2012 About Pollution from: .................................................................................................................................................. 36
Figure 10: Percentage Who Changed Behavior in Past Year From Hearing About Storm Water Pollution............................................................................................................................................ 39
Figure 11: Actions Being Taken to Reduce Pollution: 2009 to 2012 Surveys (n=229 in 2009, 257 in 2010, 256 in 2011, and 206 in 2012)............................................................................................. 42
Figure 12: Storm Water Treated or Untreated: 2007 to 2012 Surveys.............................................. 45
Figure 13: How Often Pollutants Seen on Their Block, 2012 Survey................................................ 49
Figure 14: Percentage Who Saw Each Pollutant on Their Block Often or Very Often: 2010, 2011, and 2012 Surveys ............................................................................................................................. 49
Figure 15: Strongest Concern Among Four Choices About Pollution of Beaches and Ocean, 2012 Survey ............................................................................................................................................... 57
Figure 16: % Who Report Seeing City Crews’ Storm Drain Protection Efforts: 2012 Survey ...... 62
Figure 17: % Likely to Use Think Blue/Storm Water Department Website, 2012.......................... 65
TABLE OF TABLES Table 1: Where Recalled Seeing or Hearing the “Think Blue San Diego” Slogan: 2008 to 2012
Surveys.............................................................................................................................................. 23
Table 2: Higher Proportions of Encounters with Think Blue Communications............................. 30
Table 3: Awareness of Think Blue Specific Communications 2012 Survey Compared to 2011 Survey ............................................................................................................................................... 36
Table 4: Percentage Who Knew Storm Water Is Not Treated, in Surveys From 2008 to 2012...... 46
Table 5: Ratings of Seriousness of Storm Water Pollutants, 2008-2012 ............................................ 53
Table 6: Ratings of San Diego Job Performance Regarding Pollution Prevention Efforts, 2012 Survey ............................................................................................................................................... 59
Table 7: Racial Categories (including Hispanic/Latino) .................................................................... 67

Table 8: Hispanic/Non-Hispanic and Non-Hispanic Racial Categories Referenced in the Report............................................................................................................................................................ 67
Table 9: Language Other Then English Spoken at Home on Daily Basis ........................................ 68
Table 10: Categories of Educational Attainment Referenced in the Report .................................... 68
Table 11: Categories of Resident Age Referenced in the Report ....................................................... 69
Table 12: Type of Residence as Referenced in the Report .................................................................. 69
Table 13: Length of Residency in San Diego ........................................................................................ 70

2012 City of San Diego Storm Water Survey Goodwin Simon Strategic Research Methodology Page 4
METHODOLOGY Think Blue San Diego, a program of the San Diego Storm Water Pollution Prevention Division, asked Goodwin Simon Strategic Research (GSSR) to conduct a telephone survey of adult residents living in San Diego. This is the sixth survey that GSSR has conducted for Think Blue since 2007. As in past years, the survey had the following objectives:
• To assess awareness of the Think Blue program and its outreach activities. • To assess the impact of Think Blue outreach efforts on interest in and
attitudes about pollution of water in storm drains. • To assess the impact of Think Blue outreach efforts on awareness of the
causes of storm water pollution and knowledge that the storm drain and sewage systems are separate.
• To assess the impact of Think Blue outreach efforts on reducing potential pollution-causing behaviors.
• To assess awareness of pollutants where residents live. • To assess the impact of various potential motivations for behavioral
change.
Additionally, for the first time this year (or for the first time in several years), the survey also sought to understand:
• Opinions about the job being done by the City of San Diego in reducing or
preventing pollution. This question was not asked in 2011 or 2010, but was asked in the years prior.
• Awareness of City efforts to clean storm drains and respond to street flooding.
• Usage of Facebook and interest in communications from Think Blue on Facebook.
• Interest in turning to the Think Blue program website or the Storm Water Department website for information related to preventing pollution of storm drains.
Population and Sample Frame The population surveyed was adults living in residential non-group housing in the city of San Diego. The sampling frame consisted of households that had either landline telephone service, or cellular telephone service, or both.

2012 City of San Diego Storm Water Survey Goodwin Simon Strategic Research Methodology Page 5
The sample, supplied by Scientific Telephone Samples, consisted of two separate random selections of landline and wireless telephone numbers, created in representative replicates.
• The landline sample was selected from among working banks of 100 contiguous numbers in exclusively landline exchanges which contained three or more residential listings in the city of San Diego. The sample was pre-screened to eliminate disconnects, businesses, and ported cell phone numbers.
• The wireless sample was selected randomly from among all wireless
exchanges associated with the county of San Diego (wireless sample can only be ordered on a county-wide basis).
Sampling
Eight hundred and nine adult residents of San Diego were interviewed by telephone between February 23 to March 1, 2012. Eligibility for participation was determined through the use of screening questions:
• Landline interviews were randomized among household adults through the use of the “last birthday” method.
• Wireless numbers were hand-dialed and participants screened for safety.
• All participants were screened for adult status, city of residence, and non-
business use of the phone number. Both samples were released in representative replicates to ensure an appropriate regional distribution, and multiple attempts were made to contact each number. Refusal conversions were attempted. Data collection was carried out by McGuire Research. The questionnaire was translated and interviews were conducted, upon participant request, in either English (n=775) or Spanish (n=34). The full questionnaire and marginal results are included as an appendix to this report. Landline and Wireless Phone Service Three hundred and ninety-six interviews were conducted on a wireless phone, and 413 on a landline phone. Among landline participants, 324 could also have been reached on a cell phone, while 89 have only a landline number.

2012 City of San Diego Storm Water Survey Goodwin Simon Strategic Research Methodology Page 6
As no precise figures are available at this time for how many households in the City of San Diego have only a landline phone, only a cell phone, or both, the samples were combined by using the best available estimate of landline and cell phone households, i.e. roughly 19% of the population has only a landline, and cannot be reached using a cell phone sample. The combination factor calculations utilized a 50/50 estimate for dual (cell phone and landline) household overlap. Once combined, the sample was adjusted to match the latest American Community Survey census estimates for gender, race and ethnicity, age, and educational attainment. Survey Error and Response Rates The best estimate of sampling error for citywide results for the combined sample of 809 is plus or minus 3.4 percentage points at a 95% confidence level. No precise estimate is available of the contribution to sampling error which may arise from combining landline and wireless samples. The margin of sampling error (MOSE) for some analyzed subgroups will be higher. While every precaution was taken to avoid error and increase accuracy, surveys such as this one may be subject to errors other than those attributable to sampling techniques, for which precise estimates cannot be calculated. These could include undetected differences between those who agreed to participate and those who did not, bias resulting from the wording or order of the questions, or influence from outside events that take place during the study period. Such errors are the result of the various practical difficulties associated with taking any survey of public opinion. Analysis and Comparisons with Previous Research
This is the sixth year that Goodwin Simon Strategic Research has conducted an annual survey of San Diego residents for Think Blue San Diego. It is important to note that since 2009, the sampling frame has included both landline and wireless telephone samples. In previous years, sampling was of landline exchanges only. Note also that this 2012 survey asks residents to report actions they took in 2011. Thus the 2012 survey generally refers to 2011 actions, while the 2011 survey refers to 2010 actions, and so forth. This report presents results broken out by subgroups of adult residents (e.g., by men versus women) only if the differences are both statistically significant using standard significance testing, and are relevant.

2012 City of San Diego Storm Water Survey Goodwin Simon Strategic Research Summary Page 7
EXECUTIVE SUMMARY
Think Blue San Diego, a program of the San Diego Storm Water Pollution Prevention Division, asked Goodwin Simon Strategic Research (GSSR) to conduct a telephone survey of adult residents living in the city of San Diego. This is the sixth survey that GSSR has conducted for Think Blue since 2007. This study was conducted between February 23 and March 1, 2012. Eight hundred and nine telephone interviews were conducted with adult residents randomly identified from across the city of San Diego using a random-digit-dial methodology, in which random lists of landline and cell phone telephone numbers served as the sample. Results were weighted to avoid double counting those who could have been reached on both a cell and a land line, and to match the latest American Community Survey census estimates for gender, race and ethnicity, age, and educational attainment. The margin of error for citywide results is plus or minus 3.4% at a 95% confidence level. That is, if this survey were to be repeated exactly as it was originally conducted, then 95 out of 100 times the responses from the sample (expressed as proportions) would be within 3.4 percentage points of the actual population proportions. Key Findings
Awareness of the Think Blue San Diego slogan is unchanged from the 2011 survey after a steady rise over the last three years—with the stagnant result most likely reflecting a reduced communications campaign as a result of budget cuts. In fact, budget cuts forced Think Blue San Diego to greatly reduce its media campaign, and the proportion who report having seen television advertising is down as a result. Related, a slightly lower proportion report making behavioral changes as a direct result of seeing information about storm water pollution. However, as seen in past years, those who have seen or heard the Think Blue San Diego communications are more likely to know that storm water is not treated and to change their behavior to prevent pollution—showing that exposure to Think Blue communications continues to succeed in bringing about the desired knowledge and behavioral change. As seen in past years, awareness and behavioral change are lower among Hispanic residents, non-white residents generally, seniors (in particular those

2012 City of San Diego Storm Water Survey Goodwin Simon Strategic Research Summary Page 8
over 70 years of age), newer residents, and the less educated. Outreach efforts should continue to be made to these populations. Key survey findings include the following:
Awareness of the Think Blue San Diego Program and its Communications
Half (51%) of respondents have seen or heard the “Think Blue San Diego”
slogan. This is down slightly from 53% in 2011, but remains higher than in any other year since 2004.
• Awareness is greatest among those 35 to 64—a key target age group. It is
higher by ten points or more with non-Hispanic white respondents than with Hispanic and non-white respondents generally, suggesting that greater outreach efforts among the Hispanic and non-white communities are needed. Awareness fell notably among Hispanic respondents from 2011—a further indicator that sustained outreach is needed among this community. This most likely reflects not only the lower media budget, but also reduced efforts to reach Hispanic residents, including cancellation of the Cesar Chavez event. Awareness is also lower with newer residents to San Diego as well as those with a high school education or less.
• Three-fourths to eight in ten of those who report having seen a Think Blue
radio or television ad, the website, a brochure, a booth or sign at an event, or a stencil on a sidewalk recall the slogan. This shows that the slogan is memorable to those who had exposure to program communications.
Television continues to be the most effective way of reaching residents.
The highest proportion of those familiar with the slogan volunteered that they heard or saw it on television—whether on the news, an advertisement, or some other television source. Thirty-eight percent of those who had heard or seen the Think Blue San Diego slogan said they had heard or seen it on television news or some other television coverage, and 18% said they heard or saw it on a television ad. The proportion volunteering a television ad is down dramatically from the 2011 study when 58% gave this response. Again, this most likely reflects that the budget for television advertising was significantly reduced in the past year. While the proportion citing a particular television source has varied from year to year, overall, about half or slightly over half of those familiar with the slogan have volunteered television as their source throughout the years this study has been conducted.
The proportion who had heard the slogan on the bus, at a bus stop, or on a bus-stop bench rose from 4% in the 2011 survey to 11% currently. Other

2012 City of San Diego Storm Water Survey Goodwin Simon Strategic Research Summary Page 9
sources for seeing or hearing the slogan varied little from previous years, including radio ads (12%), billboards (10%), storm drain stencils (7%), newspapers (3%), or posters (3%).
All respondents were asked directly if they had encountered a number of
Think Blue communication channels—whether they recalled the slogan or not. Television remains that most recalled source of information about the Think Blue program among all respondents, with 46% reporting they had seen a television commercial in the past year—including 15% who had not initially recalled the slogan. This proportion is down six points from 52% in the 2011 study and more closely reflects the 2010 results. As mentioned, this decline most likely reflects the reduced media campaign from Think Blue in 2011.
Asked for the first time this year, a high 42% had seen a stencil painted on
sidewalks in front of storm drain openings—a proportion near equal to the number who had seen a television ad. In fact, 21% of those who had initially not recalled the slogan remembered seeing a stencil when asked about it.
There is less awareness overall of radio commercials (27%, down from 35% in 2011, but similar to the 2010 survey results), brochures (15%), booths or signs at events (14%), the website (5%), or Think Blue emails (2%).
There is only modest awareness of the Think Blue Hotline where you can call to report people or businesses that are causing pollution in storm drains, with 23% having heard at least a “little” about it. In fact, just 5% have heard a “great deal” about the Hotline. The proportion unfamiliar with the Hotline is up slightly from 71% in 2011. Moreover, in the current study, just 2% said they had called the Hotline—down (insignificantly) from 4% the year prior.
There is strong interest in a Think Blue Facebook page—even if few are
currently familiar with it. There is very little current awareness of the Think Blue San Diego Facebook page, with just 4% of active Facebook users (meaning those with their own Facebook page that they look at regularly) familiar with it. However, among active Facebook users who were not familiar with the Think Blue San Diego Facebook page, nearly half (47%) would be “somewhat” (29%) or “very” (18%) likely to join the Think Blue Facebook page after hearing it provides information about pollution prevention and upcoming community events. Interest is greater among those 18 to 49 (49%) than those who are older (35%), in particular among those 18 to 29 (54%)—showing that promoting the Think Blue Facebook page will be most effective with a younger audience.

2012 City of San Diego Storm Water Survey Goodwin Simon Strategic Research Summary Page 10
There is also low awareness and utilization of the Think Blue website. However, solid proportions said they would be likely to go to the website after hearing the ways in which it can benefit them. Just 3% reported going to the Think Blue website or the Storm Water Department website in 2011 for any reason. However, between 46% and 59% said they would go to the website to report activities that might be polluting beaches and ocean (59%), to request the city repair or clean clogged storm drains and storm drain openings (58%), to get information about how to prevent pollution of beaches and oceans (53%), to learn about pollution prevention laws and regulations (54%), to find out about storm-related improvement projects in their neighborhood (48%), and to learn about events where you can get information about how to reduce pollution of beaches and the ocean (46%). This shows that greater promotion of information on the website will bolster its usage.
While upwards of half of respondents can recall some form of
communication from the Think Blue program, lower proportions can remember much of the content of those communications.
• The highest proportion recalled hearing at least “a little” about pollution
caused by litter, with 52% giving this response. However, just 37% had heard “a great deal” (15%) or “some” (22%) about it from the Think Blue program (this was not asked in the 2011 survey).
• In all, 48% have heard at least “a little” about pollution caused by vehicles
leaking oil, but only one-third had heard “a great deal” (15%) or “some” (18%) about it. This represents a sharp decline from 2011 when 63% had heard at least “a little” and nearly half (47%) had heard at least “some.” In the 2011 study, just 37% had heard nothing about this source of pollution from Think Blue, compared to 52% today.
• In the current study, 37% had heard at least “a little” about pollution caused
by dog waste, but 63% had heard nothing about it from the Think Blue program. Awareness about pollution caused by dog waste is down from the 2011 study, when 49% had at least “a little” awareness and 50% had heard nothing about it.
• Asked for the first time this year, just 21% had heard a “great deal” (7%)
or “some” (14%) about how to prepare for and prevent flooding during rainstorms from the Think Blue program, with a total of 35% having heard at least “a little.” Two-thirds (66%) had heard nothing from the Think Blue program in this area.

2012 City of San Diego Storm Water Survey Goodwin Simon Strategic Research Summary Page 11
Only one in ten respondents (10%) know that the City of San Diego has a rebate program to encourage residents to install rain barrels at their homes to capture rainfall (with respondents ages 70 or older the most familiar at 19%).
Behavioral Changes
Just over one in four (26%) respondents said they have changed their
behavior in the past year as a direct result of information they had received about what polluted water in storm drains does to local creeks, the beaches, and the ocean. However, this represents a decline from the 2011 and 2010 studies when 32% gave this response and from 29% in the 2009 survey.
As seen in past years, those who had received Think Blue communications
were more likely to have changed their behavior as a direct result of storm drain pollution information—suggesting that the program efforts continue to be effective in bringing about positive change among those who receive Think Blue communications.
• More than twice as many respondents who had heard the Think Blue San
Diego slogan had made a change in their behavior compared to those who had not heard the slogan, at 36% to 14%.
• While just 26% of the sample overall said they had changed their
behavior, 64% of those who had seen the Think Blue website, 47% who had seen a brochure, 43% of those who had heard a radio ad, 42% of those who had seen a booth or sign at an event, 39% of those who had seen a television commercial, and 34% of those who had seen a stencil reported having changed their behavior—more than two times the proportion giving this response who had not received communications via these channels.
• Approximately four in ten of those who had heard or seen Think Blue
communications about pollution caused by dog waste, litter, or leaking vehicle oil said they had made a change in their behavior, as did 48% of those who heard from Think Blue about how to prepare for and prevent flooding during rainstorms—again more than twice the proportion as those who had not received these specific communications.
• Furthermore, 50% of those who had heard of the Think Blue Hotline had
made a change (compared to 22% who had not). When asked what changes they had made to prevent pollution, slightly
higher proportions than in the 2011 study mentioned taking their car to a

2012 City of San Diego Storm Water Survey Goodwin Simon Strategic Research Summary Page 12
car wash; picking up trash or litter; using less fertilizer, pesticides, or chemicals; and properly dealing with used car oil—all “correct” answers as to how to reduce storm water pollution. Specifically, the highest proportion volunteered the following (in an open-ended question where no response options were given):
• Taking their car to a car wash rather than washing it at home (24%, up
from 19% in the 2011 survey but more closely reflecting the result in prior years). Twenty-eight percent of those who had heard the slogan gave this response, compared to 11% of those who had not.
• Picking up trash or litter (23%, up from 18% in the 2011 survey, 11% in
2010, and 18% in 2009).
• Using less (or no) fertilizer, pesticides, or chemicals (15%, up from 6% in 2011 and 2010 and 11% in 2009).
• Not pouring oil into the street, fixing oil leaks, or taking oil for proper
disposal (14%, up from 10% in 2012, 5% in 2010, and 7% in 2009).
• Being generally more cautious (12%).
• Recycling more (11%).
Just 8% said they are using less water, down from 28% in 2011, 51% in 2010, and 47% in 2009. This is likely a reflection of the adequate rainfall in recent years and thus the lack of general attention to water conservation and drought issues.
Awareness of and Concern about Storm Water Pollution Fifty-one percent of respondents know that water that goes into storm
drains is not treated before it is released into creeks or the ocean. However, 14% erroneously believe that it is treated and 34% are unsure—for a total for 50% who do not know that storm water is untreated. After a steady rise in awareness since the 2008 survey, these results are a departure, declining from 57% in the 2011 survey back to levels seen in the 2010 survey.
Those familiar with the Think Blue program are far more likely to know
that storm water is not treated. Sixty-five percent of those who had heard the Think Blue slogan know that storm water is not treated, compared to 37% of those who had not heard the slogan. Between 58% and 66% of those who had
2012 City of San Diego Storm Water Survey Goodwin Simon Strategic Research Summary Page 13
seen a Think Blue television or radio commercial, brochure, sign or booth at an event, website, or stencil know this water is not treated, compared to 40% to 51% of those who had not seen these communications. Furthermore, between 63% to 68% of those who had heard “a great deal” or “some” from Think Blue about pollution caused by dog waste, oil, or litter, or how to prepare for or prevent flooding know storm water is not treated. This is in contrast to 44% to 49% of those who recalled little or nothing of these communications.
Most respondents do not recognize common sources of storm water
pollution as often-seen problems in their own neighborhood—even if they had heard communications about the pollution caused by these sources. In fact, between 51% and 66% report that they “rarely” or “very rarely” see each of the sources named on the block on which they live, and no more than one in four report seeing any source “often.” This lack of awareness, which has changed little in most areas since previous years, most certainly undermines their level of concern or motivation to make change.
• Dog waste that is not picked up: 23% see it “often” to “very often,” 25%
“occasionally,” and 51% “rarely” or “very rarely.” Respondents who said they had seen Think Blue communications about pollution caused by dog waste were no more likely to say they notice dog waste that is not picked up on their block often.
• Litter: 18% see it “often” to “very often,” 28% “occasionally”, and 53%
“rarely” or “very rarely.” This is down from 30% seeing it “often” in 2011, but closer to results in 2010. Respondents who said they had seen Think Blue communications about litter were more likely to say they notice litter on their block than those who had not. However, those who had seen the communications about litter, were more likely to notice all the sources of pollution tested, suggesting that another factor related to these respondents could stand behind the response.
• Leaking motor oil onto the streets: 17% see it “often” to “very often,” 21%
“occasionally,” and 60% “rarely” or “very rarely.” This is similar to 2011, but higher than in 2010 when 12% saw this often and 14% “occasionally.” Those who had seen Think Blue communications about pollution caused by vehicles leaking oil were no more likely to say that they see this form of pollution on their block often.
• People washing their cars on the driveway or in the street: 16% see it “often” to
“very often,” 28% “occasionally”, and 54% “rarely” or “very rarely.” This was not asked in 2011, but the result is similar to 2010.

2012 City of San Diego Storm Water Survey Goodwin Simon Strategic Research Summary Page 14
• People washing or blowing yard waste or litter from their sidewalk or driveway
into the street: 15% see it “often” to “very often,” 30% “occasionally,” and 62% “rarely” or “very rarely.” Although worded somewhat differently when asked last in 2010, the result is similar.
• People using pesticides or weed killers on their lawns or gardens: 7% see it
“often” to “very often,” 17% “occasionally,” and 66% “rarely” or “very rarely.”
• Sinkholes and big potholes in the streets after rainstorms: 24% see it “often” to
“very often,” 20% “occasionally,” and 55% “rarely” or “very rarely.” • Flooding during rainstorms: 13% see it “often” to “very often,” 20%
“occasionally,” and 65% “rarely” or “very rarely.” Those who had received Think Blue communications about flooding were only slightly more likely to say they had seen flooding during rainstorms often than those who had not (20% to 11%).
There is a lack of intensity of concern about the sources of storm drain
pollution, although residents find each source of pollution to be at least somewhat serious overall. This may reflect the perception that sources of pollution are not often seen where they live and the modest level of familiarity with how the storm drain system works. When asked to rate how serious they feel a number of items are that may pollute water in storm drains in San Diego (on a 10-point scale where a “1” indicated it is not a serious concern and a “10” indicated it is a “very” serious concern, with 5.5 being the neutral midpoint), concern is greatest about pollution caused by motor oil (77% an “8” or greater on the 10-point scale). This is followed by pesticides and weed killers that people use on their lawns and gardens (66%), cigarette butts (58%), and litter (58%). No other source is considered serious (an “8” or higher) by more than 47% of respondents. In most areas, the level of concern has not increased.
It should be noted that those who were familiar with Think Blue communications were more likely to consider many if not all of these items to be serious sources of pollution of water in storm drains. Those who had changed their behavior as a result of information about storm drain pollution were also far more likely to give a rating of “8” or greater to each source of pollution than those who had not, with “8” or greater ratings of 10 to 20 points higher in each area.

2012 City of San Diego Storm Water Survey Goodwin Simon Strategic Research Summary Page 15
• The highest proportion recognize motor oil as a source of pollution in storm drains, with a mean score on a 10-point scale of 8.34 (where a “1” indicates it is not a serious source of pollution and a “10” indicates it is a very serious source), indicating a high overall level of concern. In fact, 58% rate this a “10” on the scale and it receives an “8” or higher from 77%. The mean rating is up from 8.0 in 2011 and ratings of “8” or higher are up from 69% as well. However, these ratings remain below those from 2008 to 2010.
• Asked for the first time this year, pesticides and weed killers that people use on
their lawns or gardens was the second most mentioned concern, with a mean rating of 7.86 and 66% giving a rating of “8” or higher.
• Just under six in ten (58%) gave a score of “8” or higher for litter, and it
received a mean rating of 7.46. These ratings are similar to 2011, but down from the years prior.
• Just under six in ten (58%) also gave an “8” or higher to cigarette butts as a
form of pollution, with a mean rating of 7.37. This level of seriousness is down slightly from 2010 and the years prior (the question was not asked in 2011).
• There is more modest concern about dog waste that is not picked up, with a
mean rating of 6.91 and 47% giving a rating of “8” or greater (ratings are similar to 2011).
• Concern is lower for food and drink that gets tossed in the streets (6.62 mean
rating, 44% “8” or higher), runoff waters from washing cars in the driveway or street (6.21, 36%), washing down sidewalks or driveways (5.77, 31%), and leaves and grass clippings (5.47, 29%). This finding clearly shows that more education is needed about the polluting potential of these behaviors.
For the first time this year, respondents were asked to name which of four outcomes concerned them most about pollution of local beaches and the ocean. Concern about the health and well-being of people and marine life far outweighs concern about economic impacts. The highest proportion, 31%, named that it causes harm to marine life in the ocean like seals, dolphins, and whales as what concerns them most. A close second was that is causes harm and illness to people who swim at our local beaches, with 24% giving this response. A far lower 19% named one of two economic reasons: that cleaning it up costs San Diego taxpayers a lot of money that could otherwise be used for services like police and fire protection (11%) and that when beaches get polluted, that drives away

2012 City of San Diego Storm Water Survey Goodwin Simon Strategic Research Summary Page 16
tourists and hurts San Diego’s economy, costing the city jobs we need during this recession (8%). One in four consider all four to be equal concerns.
City Performance in Preventing Pollution Respondents were asked to rate the City of San Diego’s performance in a
number of areas related to preventing pollution, using a 10-point scale where a “1” indicated they felt the City was doing a poor job and a “10” indicated they felt the City was doing an excellent job (components of this question were asked prior to 2010, but the question has not been asked in the last two years). A low proportion have a negative impression of the City in any area for their efforts to prevent pollution, with no greater than 15% giving a rating of “3” or lower. However, on average, the ratings suggest a modestly favorable impression –with mean scores ranging from 6.16 to 7.41.
• The City gets its strongest ratings for keeping the streets in your neighborhood
clean when they do street sweeping, with an average rating of 7.41 on the 10-point scale. However, just 39% give a “9” or “10” rating, indicating that this view is not strongly held.
• The City gets ratings only slightly above the mid-point of 5.5 for preventing
pollution of San Diego’s ocean, bays, and beaches (6.67), preventing flooding from rainstorms (6.53), enforcing laws against activities that pollute our storm rains and beaches (6.31), keeping polluted water out of storm drains (6.22), and helping people learn how to prevent pollution in their daily activities at home (6.16). Between 29% and 37% gave an “8” or greater rating in each area as well. The only slightly better than neutral ratings for the City in areas that relate to storm water pollution education and prevention suggest that the City’s role in the Think Blue San Diego campaign needs to be better communicated.
While the City gets modest ratings for preventing storm drain pollution, nearly half of respondents (47%) had seen City crews cleaning out storm drains or storm drain channels or responding to flooded streets or properties. Therefore, more respondents have witnessed these City efforts than give the City “8” or greater ratings for the pollution prevention efforts these actions represent.
The remainder of this report presents the results in more detail.
2012 City of San Diego Storm Water Survey Goodwin Simon Strategic Research Detailed Findings Page 17
DETAILED FINDINGS
I. Familiarity with the Think Blue San Diego Slogan
Awareness of the Slogan
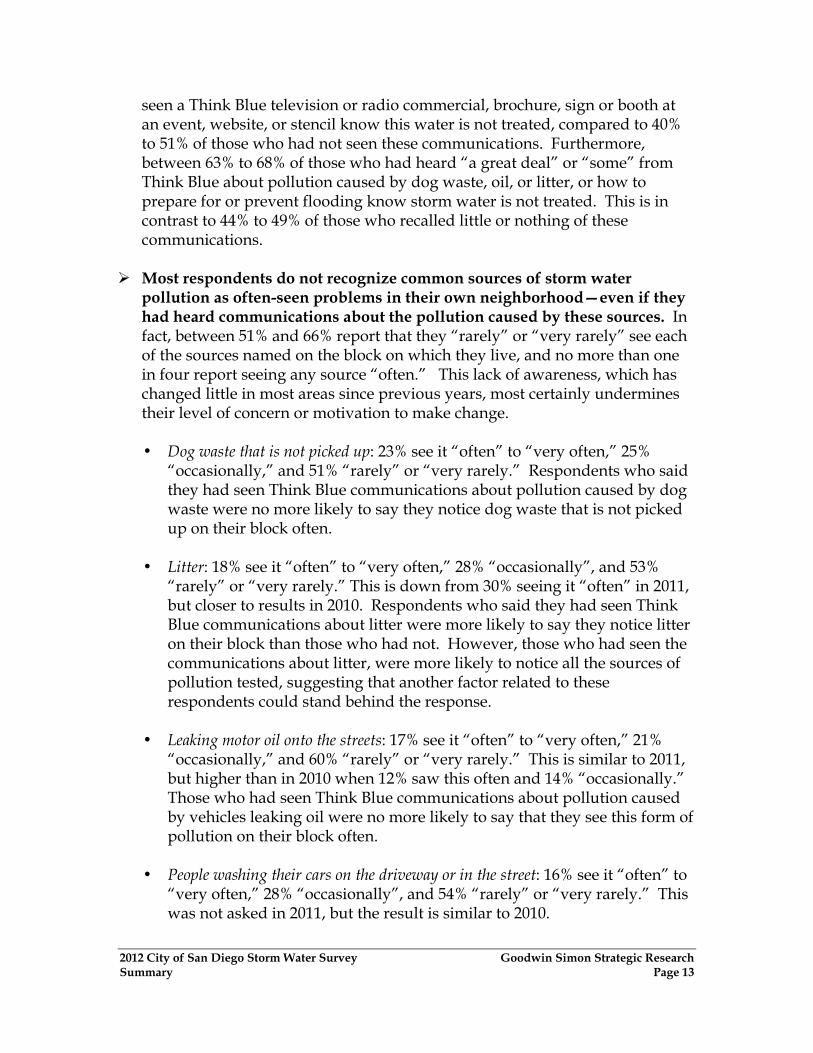
Awareness of the “Think Blue San Diego” slogan has held fairly steady over the last year, ending an upward trend dating back to 2009. Half (51%) of survey respondents said they had seen or heard the slogan in the past year, while 48% had not (one percent were unsure). This represents a very slight decline from the 53% who expressed familiarity one year ago, but remains higher than in any year since 2004. The finding that awareness remained fairly steady from 2011 is a positive indicator for the program given the smaller media and event budget in 2011, indicating how deeply ingrained it is in civic culture. Figure 1 illustrates the proportion of San Diego City residents who had heard the slogan based on Think Blue surveys going back to 2001. The findings from before 2007 are included for comparison purposes only; these results from earlier surveys should be viewed with some caution due to differences in question wording and survey methodology.
Figure 1: Heard the Slogan "Think Blue San Diego" Last Year in Surveys from 2001-2012.

2012 City of San Diego Storm Water Survey Goodwin Simon Strategic Research Detailed Findings Page 18
Results by Demographic and Behavioral Groups • Awareness of the slogan is highest among those ages 35 to 49 (at 57%) and 50
to 64 (52%) compared to those 18 to 34 (47%) or 65 years of age or older (45%). Those ages 35 to 64 were identified as a target group by Think Blue in past years, and the results suggest that efforts to reach them in particular have been successful.
• Awareness of Think Blue is much lower among African American, Asian
American, Hispanic, and other non-white residents compared to non-Hispanic white respondents. While 57% of non-Hispanic white respondents had heard the slogan, just 46% of Hispanics, 42% of African Americans, and 35% of Asian Americans had heard of the “Think Blue San Diego” slogan. In all, non-Hispanic non-whites are less likely to have heard the slogan than Hispanics (38% to 46%).
• Newer San Diego residents are less likely to be familiar with the slogan than
longer-term residents. While 33% of residents of five years or less are familiar with the “Think Blue San Diego” slogan, 55% of residents of six to 19 years and 53% of those residing in San Diego 20 years or more are familiar.
• Respondents with a high school education or less are less likely to have heard
of the slogan than those who are more educated, with 59% of post-graduates, 53% of college graduates, and 55% of those with some college familiar with it, compared to 42% of those with less education.
• As seen in past surveys, familiarity with the Think Blue slogan is higher
among those with exposure to the City’s anti-pollution efforts and with Think Blue program communications. This suggests that messaging efforts have been effective.
o Eight in ten or more residents who had seen a Think Blue television commercial (84%), heard an ad on the radio (81%), read a brochure (81%), seen or heard about the Think Blue website (79%), or seen a sign or booth at an event (83%) are familiar with the slogan. Three out of four (75%) of those who had seen a stencil painted on sidewalks in front of storm drain openings also gave this response.
o Also more familiar with the program were those who had heard about the Hotline where one can report people or businesses that cause pollution (80% familiar); those who had heard from Think Blue about how to prepare for and prevent flooding during a rainstorm (75%); or those who

2012 City of San Diego Storm Water Survey Goodwin Simon Strategic Research Detailed Findings Page 19
had heard from Think Blue about pollution caused by dog waste (78%), litter (76%), or vehicles leaking oil (74%).
o As also seen in previous surveys, those aware that water that goes into the
storm drains is untreated are far more familiar with the “Think Blue San Diego” slogan than those who are not aware or unsure—suggesting a correlation between receiving Think Blue San Diego communications and awareness of the storm drain system. While 65% of those who said storm water is not treated had heard of the slogan, a lower 49% of those who erroneously believe it is treated and 33% of those who are unsure whether storm drain water is treated or not were aware of the Think Blue slogan.
o Furthermore, 72% of those who said they had changed their behavior in the last year as a direct result of seeing information about the impact of polluted water in storm drains to local creeks, beaches, or the ocean said they had heard of the slogan. Meanwhile, just 43% of those who had not changed their behavior had heard “Think Blue San Diego.”
Comparison of results across years among key subgroups are as follows: • Race: Awareness among Hispanic residents has declined from that found in
the 2010 and 2011 surveys. In the current study, 46% of Hispanic respondents had heard of the slogan, compared to 58% in 2011 and 52% in 2010. However, awareness remains higher among Hispanic respondents than in the years prior to the 2010 survey. The decline may be an outgrowth of the lower media budget for Think Blue in 2011 and cancellation of the Cesar Chavez Day celebration.
Awareness among Asian American residents is statistically equal to levels found in the 2011 survey (36%), and remains higher than in the 2010 and 2009 surveys when it dipped down to 26% and 22%, respectively. (Note sample sizes for Asian-American and African-American respondents are relatively low at 105 and 48 cases respectively, meaning very large error margins.) Awareness is slightly lower with African American respondents, at 42%, down from 46% in 2011 and lower than in any year prior, although these differences fall within the margin of error for this sample size. There was little change among non-Hispanic white respondents from the 2011 survey (57% to 59% in 2011), with the proportion familiar remaining notably higher than from the 2010 survey and earlier studies. Figure 2 below illustrates the results.

2012 City of San Diego Storm Water Survey Goodwin Simon Strategic Research Detailed Findings Page 20
Figure 2: Change in Awareness of Slogan over Time by Race: 2007 to 2012 Surveys
• Gender: As shown in Figure 3, there is little change in familiarity with the slogan by gender from the 2011 survey.

2012 City of San Diego Storm Water Survey Goodwin Simon Strategic Research Detailed Findings Page 21
Figure 3: Change in Awareness of Slogan over Time by Gender: 2007 to 2012 Surveys
• Age: Awareness is up slightly among those ages 65 or older. In the current study, 45% of those in this age cohort are familiar with the slogan, compared to 38% in 2011 and 2010 and 39% in the 2009 survey. This familiarity was only matched in 2008 when 43% of those 65 or older were familiar with the slogan. Awareness, however, is slightly down from 2011 among those 50 to 64, with awareness returning to the same level as 2010 at 52%. Awareness remains elevated among those 35 to 49, with 57% having heard the slogan in the current study. Awareness is down among the youngest age cohort of those 18 to 34, with 47% having heard the slogan in the 2012 survey compared to 55% one year ago. The current proportion more closely matches that found in the 2010 survey. Figure 4 illustrates the results.

2012 City of San Diego Storm Water Survey Goodwin Simon Strategic Research Detailed Findings Page 22
Figure 4: Change in Awareness of Slogan over Time by Age Range: 2007 to
2012 Surveys
Where Did You Hear the Slogan
Those who had seen or heard the “Think Blue San Diego” slogan were most likely to have encountered it on television. Of the 51% of respondents who had seen or heard the “Think Blue San Diego” slogan (n=413), the highest proportion had heard or seen it on television news or other television coverage, with 38% giving this response. Another 18% said they heard or saw it on a television ad. While multiple responses were accepted, so those who had seen it on the news or through an ad could be one and the same, this result suggests that upwards of 50% encountered the slogan on television. As shown in Table 1, in the 2011 survey, 58% reported hearing the slogan on a television ad—notably higher than the 18% currently. This most certainly reflects the reduced media budget for Think Blue in 2011. However, in the 2011 survey, just 1% reported hearing the slogan on television news and there was no mention of other television sources—far lower than the 38% who gave this response in 2012. This could be due to variations in how the open-ended responses were coded. But overall, the proportion who reported hearing the slogan on some form of television is similar in 2011 and in the current study. In the 2010 survey, the proportion reporting hearing the slogan on a television ad was lower than both 2011 and 2012, with 11% giving this response. Four percent mentioned hearing it on television news and 37% on another non-specific

2012 City of San Diego Storm Water Survey Goodwin Simon Strategic Research Detailed Findings Page 23
television source. Again, despite different reports on the television source, the total television mentions were similar to those found in the 2011 and 2012 surveys. This fluctuation continued in years earlier, with 58% in 2009 having heard the slogan on a television ad, but no other mentions of television sources. In 2008, a similar 52% reported hearing the slogan on a television ad and just four percent on television news. Looking at the 2012 results, the proportion who had heard the slogan on the bus, at a bus stop, or on a bus-stop bench rose from four percent in the 2011 survey to 11% in 2012. This is also notably higher than in previous years. Other sources for hearing the slogan were mentioned much less frequently, and the proportions varied by only a few points or more from previous surveys. These volunteered mentions, and their proportions in 2012, were: • Billboard (10%) • Radio ad (12%) • Storm drain stencil (7%) • Newspaper (3%) • Poster (3%).
Table 1: Where Recalled Seeing or Hearing the “Think Blue San Diego”
Slogan: 2008 to 2012 Surveys (Open-ended question; no response options given; multiple responses allowed)
2008 (n=415) 2009 (n=315) 2010
(n=378) 2011
(n=427)
2012 (n=413)
TV news/other TV 4% 0% 41%1 1% 38%
TV ad 52% 58% 11% 58% 18%
Radio 13% 8% 11% 14% 12%
Buses/bus stop/bench -- 2% 5% 4%
11%
Billboard 7% 13% 10% 10% 10%
Storm drain stencil 7%2 5%3 8%4 5% 7%
1 4% mentioned TV news and 37% mentioned a non-specific television source. 2 Verbatim responses coded as “on the street (sewers/wall/storm drains/curb).”
3 Verbatim responses coded as “on the street/curb.”

2012 City of San Diego Storm Water Survey Goodwin Simon Strategic Research Detailed Findings Page 24
2008 (n=415) 2009 (n=315) 2010
(n=378) 2011
(n=427)
2012 (n=413)
Newspaper 8% 3% 3% 5% 3%
Poster -- -- -- 1% 3%
Utility bill 2% 0 3% -- 2%
Internet/website 0 2% 1% 1% 2%
At work -- 0 1% 05 2%
Movie theater -- -- -- 2% 2%
Brochure 1% 0 1% 1% 1%
Event/at a booth 1% 0 1% 1% 1%
Side of a truck 4% 0 0 1% 1%
Friends/family 2% 1% 1% 1% 1%
School -- 2% 3% 2% 1%
Everywhere -- 0 2% 2% 1%
Magazines -- -- 1% -- 1%
Other 3% 5% 7% 9% 3%
Not sure 9% 12% 9% 7% 9%
Results by Demographic and Behavioral Groups • Those under 50 years of age were more likely to have heard the slogan on a
television ad (22%) than those who are older (9%). They were also more likely to have seen the slogan on a bus or at a bus stop/bench (19% of those 18 to 34, 11% of those 35 to 49, 5% of those 50 to 64, and less than 1% of those older). Those ages 50 or older were more likely to have seen the slogan in a newspaper than those who are younger (8% to 1%).
• Those with a post-college degree were less likely to have seen or heard the
slogan on a television ad (10% to approximately two in ten of those less educated) or other television source (29% to approximately four in ten of those less educated). However, the differences are not statistically significant due to the lower sample size among post-graduates.
4 Verbatim responses were coded as “storm drains/gutters.” 5 “0” indicates less than .5%. “—“ indicates no mention.

2012 City of San Diego Storm Water Survey Goodwin Simon Strategic Research Detailed Findings Page 25
• Men under 50 years of age were more likely to have heard the slogan on a television ad than those older (24% to 6%). However, older men were more likely to have heard the slogan on television news or another television source (47% to 33%). Men 50 years of age or older were more likely to see the slogan on a storm drain stencil than those who are younger (15% to 3%). There was no difference among women by age.
• The proportion who saw the slogan on a bus or at a bus stop is higher among
African American (24%) and Asian American (23%) respondents than among non-Hispanic white respondents (8%). Hispanics are slightly more likely than non-Hispanic whites to have seen the slogan on a bus or at a bus stop (13%).
• Non-white men are more likely to have seen the slogan on a bus or bus stop
than non-white women (24% to 9%). However, there was no difference among Hispanic men and women.
• Those living in multi-family dwellings were more likely to have heard the
slogan on a television ad than those living in single-family dwellings (28% to 12%). Those in multi-family dwellings were also more likely to have seen the slogan on a bus or bus stop/bench (18% to 7%). This may reflect that the survey found that those in multi-family dwellings are more likely to be non-white.
II. Think Blue San Diego Communications
Awareness of Think Blue San Diego Communication Channels
Survey respondents were read a list of ways information about Think Blue San Diego has been communicated and were asked if they had heard or seen anything about the program from each of these communication sources. This differs from the previous question (about awareness of the Think Blue slogan) in two ways: (1) it was asked among all respondents, whether they recalled the San Diego Think Blue slogan or not and (2) it measures recognition—what they recall when a communication channel is mentioned—rather than recall, which indicates salience (or top-of-mind) of a communication. While half of the sample had previously said that they had not heard of the “Think Blue San Diego” slogan, all respondents were told that the Think Blue San Diego is “the City of San Diego’s program to reduce pollution of the water in the city’s storm drains, creeks, beaches, and the ocean.” While some respondents may not have remembered the slogan specifically, hearing the brief explanation of the program may have jogged their memory of the communications they had indeed received.

2012 City of San Diego Storm Water Survey Goodwin Simon Strategic Research Detailed Findings Page 26
• Just under half (46%) of respondents had seen a TV commercial about the
program when asked directly about it. This is down slightly from 52% in the 2011 survey, but equal to the 46% giving this response in 2010 (the first time the question was asked in the same manner).6 Again, the decline most likely reflects the reduced television advertising budget in the past year.
• For the first time this year, respondents were asked if they had seen a stencil
painted on sidewalks in front of storm drain openings and a high 42% reported they had—second only to television commercials.
• Just over one in four respondents (27%) had heard a radio commercial about
the program, down from 35% in the 2011 survey, but equal to the 26% who gave this response in the 2010 survey. The budget for radio advertising was also reduced in 2011, and the lower awareness of radio advertising reflects this.
• Fifteen percent had seen a brochure from Think Blue, statistically equal to
past years.
• Fourteen percent had seen a Think Blue booth or a sign at a local event, down only slightly from 18% in the 2011 and 2010 surveys (there were also fewer events in 2011 as a result of budget cuts).
• Five percent had seen the Think Blue website, a proportion that is statistically
unchanged from the 2011 and 2010 surveys.
• Just two percent had seen an email from Think Blue, similar to 3% in the 2011 survey (the item was not asked in 2010).
Figure 5 shows the 2012 findings and Figure 6 compares them to previous years.
6 We cannot make direct comparisons with studies prior to 2010 due to differences in question wording and in the base of respondents who were asked the question.

2012 City of San Diego Storm Water Survey Goodwin Simon Strategic Research Detailed Findings Page 27
Figure 5: Proportion Who Have Seen or Heard a Think Blue Program Communication: 2012 Survey

2012 City of San Diego Storm Water Survey Goodwin Simon Strategic Research Detailed Findings Page 28
Figure 6: Proportion Seeing Think Blue Communications: 2010 to 2012 Surveys
Results by Demographic and Behavioral Groups
• Those 70 years of age or older are less likely than younger residents to have seen most communications, including television commercials (31%), stencils (26%), radio commercials (17%), booths or signs at a local event (8%), or the website (2%). The differences are statistically significant between those 65 years or age or older and those younger for having seen a stencil (30% to 44% of those younger) and having heard a radio commercial (18% to 29%).
• Women under age 50 are more likely to have seen a stencil than those
older (46% to 33%). There were no other statistically significant differences by gender and age.
• Post-graduates are less likely to have seen a television commercial than
those less educated (35% to 47%). The proportion who had seen a stencil increased with education, from 38% of those with some college or less to 46% of those with a college degree and 52% of those with post-graduate

2012 City of San Diego Storm Water Survey Goodwin Simon Strategic Research Detailed Findings Page 29
degrees. Overall, those with a college degree are more likely to have seen a stencil than those without a college degree (48% to 39%).
• There were a number of notable differences by ethnic/racial groups:
o Non-Hispanic white respondents are far more likely to have seen a
stencil (48%) than non-Hispanic non-white respondents (23%), in particular African American (20%) and Asian American (22%) respondents. Hispanics are only slightly less likely to have seen a stencil (40%) than whites.
o Non-Hispanic white respondents are also more likely to have seen a
television commercial (48%) than African American (33%) or Asian American (27%) respondents. However, Hispanic respondents are the most likely to have seen a television commercial (56%). Non-whites without a college degree are more likely to have seen a television commercial than non-whites with a degree (45% to 27%).
o Thirty-five percent of Hispanic respondents had heard a radio
commercial. This is slightly (although not significantly) higher than among non-Hispanic white (27%) and African American (28%) respondents. Asian American respondents are least likely to have heard a radio ad (16%). Non-Hispanic whites under the age of 50 are more likely to have heard a radio ad than those older (30% to 20%).
o Asian Americans are also far less likely to have seen a booth or a sign
at a local event (3%) than other respondents (14% of the sample average).
o Hispanics are the most likely to say they had seen the slogan on the
Think Blue website (12% to 3% of non-Hispanics).
• Residents of more than five years in San Diego are more likely to recall a television ad than more recent arrivals (49% to 27%). They are also more likely to recall hearing a radio commercial (approximately 28%) than newer arrivals (19%).
• As seen in the 2010 and 2011 surveys, residents who have made a change
in response to hearing more about pollution are more likely to have recalled the various Think Blue communications. Also similar to last year, residents who had heard the slogan, saw a television commercial, heard a radio ad, read a brochure, visited the website, or saw a booth at an event are significantly more likely to have encountered the other Think Blue

2012 City of San Diego Storm Water Survey Goodwin Simon Strategic Research Detailed Findings Page 30
communications as well. And those who had heard about the Hotline, or had heard from Think Blue about pollution caused by dog waste, leaking oil, and litter, as well as how to prepare for and prevent flooding, are also more likely to have received Think Blue information through all the communication channels.
• Those who said they did not recall the Think Blue San Diego slogan
initially are more likely to recall the stencils on the sidewalk near the storm drains than any other source, with 21% giving this response. Another 15% remembered the television commercial and 11% a radio commercial. Among those able to recall the slogan, the highest proportion recalled a television commercial (75%), followed by the stencil (61%), and the radio commercial (43%).
Table 2 summarizes these results. As an example for how to read this table: among those who have made a change, 70% have seen a Think Blue television advertisement, 55% had seen stencil, 45% have heard a radio ad, etc.
Table 2: Higher Proportions of Encounters with Think Blue
Communications
Percentage of those who: …saw a TV ad
…saw a stencil on
the sidewalk …heard a radio ad
…saw the web site
…saw a bro-
chure
…saw a booth or sign at
an event
Made a change in behavior 70% 55% 45% 14% 28% 23%
Heard the Think Blue slogan 75% 61% 43% 8% 24% 23%
Seen a TV commercial 100% 60% 45% 9% 26% 19%
Awareness of Think Blue San Diego’s Facebook Page
For the first time this year, the survey measured the impact of the Think Blue San Diego Facebook page. The results show that there is little awareness of this page among its intended audience—those with active Facebook pages themselves.

2012 City of San Diego Storm Water Survey Goodwin Simon Strategic Research Detailed Findings Page 31
Profile of Facebook Users
Nearly half (46%) of survey respondents have a Facebook page that they look at regularly, while 54% do not. Younger, more educated respondents are more likely to be active Facebook users: • Just over six in ten (62%) of those under the age of 40 have a Facebook page
they look at regularly, compared to 44% of those 40 to 49 years of age, 36% of those 50 to 59, 24% of those 60 to 69, and 7% of those older than age 69.
• Just 31% of those with a high school education or less have a Facebook page
they look at regularly, compared to 56% of those with some college and 50% of those with a college degree.
• While there is no significant difference by gender or ethnicity/race overall,
non-Hispanic white women are more likely to have a Facebook page they look at regularly than non-Hispanic white men (55% to 42%). Meanwhile, non-white men are slightly more likely to have such a Facebook page than non-white women (48% to 36%). Hispanic men are also slightly more likely to have an active Facebook page than Hispanic women (44% to 34%), but the difference is not statistically significant.
• Those living in San Diego less than 20 years are more likely to have an active
Facebook page than longer-term San Diego residents (55% to 37%). This most likely reflects their younger age.
• Those who had heard of the Think Blue San Diego slogan are more likely to
have an active Facebook page than those who had not (52% to 40%). Those who know that storm water is not treated are also more likely to have an active Facebook page than those who think it is treated (50% to 36%).
Awareness of and Interest In the Think Blue Facebook Page Among Those with Active Pages
Of those with a Facebook page they look at regularly, only four percent know that the Think Blue program has a Facebook page. The proportion aware of this fact is low with all subgroups, but knowledge is highest among the small group (n=26) of African American respondents with an active Facebook page (18%). There is strong interest in the Think Blue Facebook page among active users of Facebook. Of those with a Facebook page that they look at regularly (but have
2012 City of San Diego Storm Water Survey Goodwin Simon Strategic Research Detailed Findings Page 32
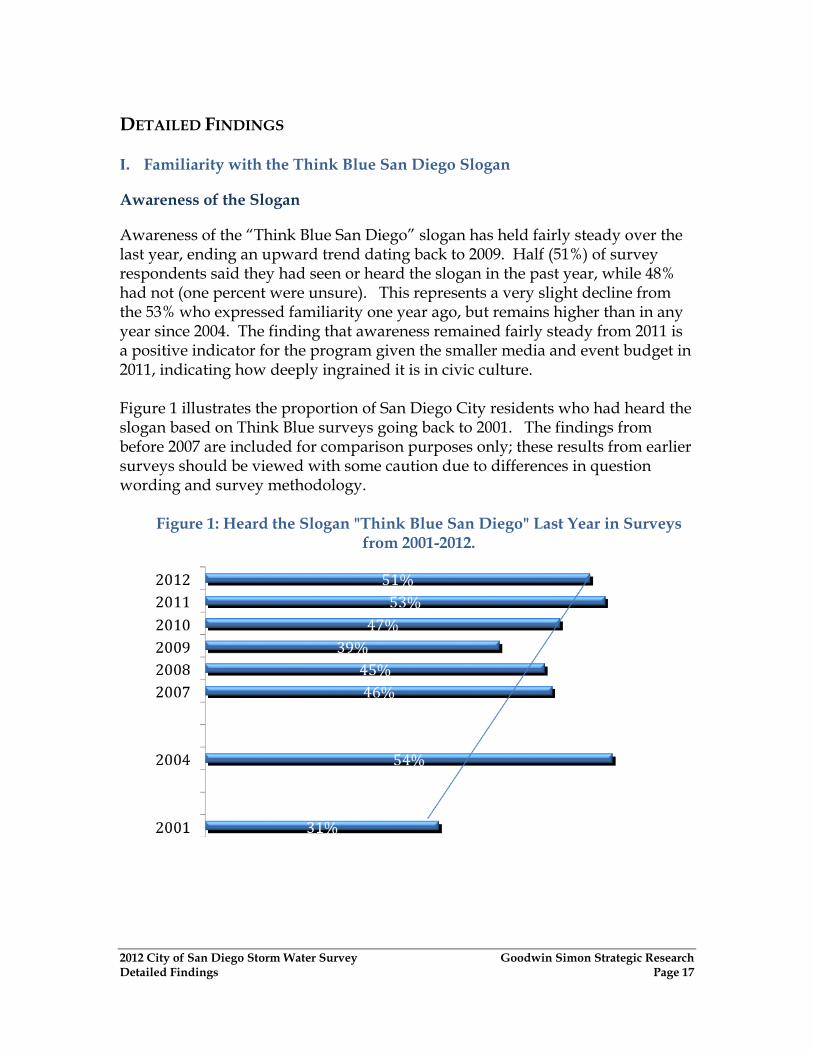
not seen any information on the Think Blue program Facebook page already), 47% said they would be “somewhat” (29%) or “very” (18%) likely to join the Think Blue Facebook page in 2012 after hearing that it provides information about pollution prevention and upcoming community events. Two in ten (20%) said they would not be too likely to do so and three in ten (31%) would not be likely to do so at all (3% said it “depends”). Figure 7 illustrates the results.
Figure 7: Likelihood to Join the Think Blue Facebook Page in 2012 Among Active Facebook Users (who are not familiar with it currently – n=368)
Results by Demographic and Behavioral Groups • Those 18 to 49 years of age are more likely to join the Think Blue Facebook
page than those older (49% to 35%), with those 18 to 29 years of age most likely to do so (54%).
• Those living in multi-family dwellings were also more likely than those living
in single-family dwellings to say they would join the Think Blue Facebook page (56% to 40%). This reflects their younger age on average.
• Those who have changed their behavior as a direct result of information
about pollution are also more likely to join the Facebook page (63% to 36% of other respondents).

2012 City of San Diego Storm Water Survey Goodwin Simon Strategic Research Detailed Findings Page 33
• Those who had received communications from Think Blue about the Hotline; impact of pollution from dog waste, leaking vehicle oil, and litter; and how to prepare for and prevent flooding during storms are more likely to say they would join the Facebook page than those who had not.
Awareness of the Telephone Hotline
Three out of four respondents (76%) had not heard of “a telephone Hotline which you can call to report people or businesses that are causing pollution in storm drains.” Just 5% had heard a “great deal” about it, while 9% had heard “some,” and 9% “a little.” The proportion unfamiliar with the Hotline is up slightly from the 2011 survey when 71% gave this response (see Figure 8). This question was offered with different wording and placement in the survey in 2010, and, at that time, a higher 81% of respondents were not familiar with the Hotline.7 Furthermore, no more than two in ten of any major demographic group is familiar with the Hotline.
Figure 8: Seen or Heard About Telephone Hotline in 2011/2012 Surveys
7 In 2010, the wording read: Have you heard of a telephone hotline which can be used to get information about preventing pollution or to report activities that may be polluting our local beaches and storm drains? The Hotline is part of the Think Blue program.

2012 City of San Diego Storm Water Survey Goodwin Simon Strategic Research Detailed Findings Page 34
Results by Demographic and Behavioral Groups • Hispanic respondents are slightly more likely than non-Hispanics to have
heard at least “some” about the Hotline, with 20% giving this response compared to 12% of other respondents. This repeats a trend seen in the 2011 survey. Asian American respondents are the least likely to be familiar with the Hotline (6%).
• Residents of 20 or more years are more likely to be familiar with the Hotline
(19%) than shorter-term residents (9%). • Those familiar with the “Think Blue San Diego” slogan are more likely to
have heard of the Hotline than those who are not, 22% to 6%. • Those who made a change in their behavior as a direct result of hearing about
pollution are more likely to be familiar with the Hotline (28%) than those who did not (10%).
• Awareness of the Hotline is also higher among those who have received other
Think Blue communications: o Seen the Think Blue website (36%) o Seen a Think Blue brochure (33%). o Seen a Think Blue sign or booth at an event (33%). o Heard a Think Blue radio ad (28%). o Seen a Think Blue television commercial (24%). o Seen a stencil (22%).
• Those who have heard about causes of pollution from Think Blue, such as dog waste (38% familiar with Hotline), leaking vehicle oil (33%), and litter (30%), and how to prepare for and prevent flooding during rainstorms (44%) are also more likely to be familiar with the Hotline than those who had not.
Respondents were later asked if they had ever called the Hotline, which was described as “a hotline that can be used to report activities that may be polluting our local beaches and storm drains, or to get information about how to prevent pollution.” Just 2% of respondents said they had, including 5% of those who said earlier that they had heard “a great deal” or “some” about it. In the 2011 survey, 4% had called the Hotline, including 9% of those who were initially familiar with it. In the 2010 survey, only about 1% of all respondents said they called the Hotline. However, the question was worded differently and comparisons should be viewed with some caution as a result.

2012 City of San Diego Storm Water Survey Goodwin Simon Strategic Research Detailed Findings Page 35
Awareness of Specific Think Blue San Diego Communications
There is modest awareness of specific sources of pollution communicated by the Think Blue program. • The highest proportion had heard a Think Blue communication about
pollution caused by litter. Fifteen percent had heard “a great deal,” while another 22% had heard “some” and 15% “a little,” for a total of 52% who had heard about this source of pollution from Think Blue. Just under half, 48%, had not heard or seen anything about pollution caused by litter. This question was not asked in the 2011 survey.
• One in three (33%) had heard “a great deal” (15%) or “some” (18%) about
pollution caused by vehicles leaking oil from the Think Blue program, while another 15% had heard “a little.” In all, 48% had heard at least “a little” about it. Meanwhile, 52% had heard nothing about this source of pollution from Think Blue. This represents a sharp decline from the 2011 survey when 63% had heard at least “a little” about this source of pollution from the Think Blue program and only 37% had heard nothing about it. This may reflect the reduced media exposure in 2011.
• Thirty-seven percent have heard “a great deal” (9%), “some” (15%), or “a
little” (13%) from the Think Blue program about pollution caused by dog waste. Nearly two in three (63%) had heard nothing about it. This also represents a decline from one year ago when 49% had heard at least “a little” about this source of pollution from Think Blue.
• For the first time this year respondents were asked if they had heard or seen
anything from the Think Blue program about how to prepare for and prevent flooding during rainstorms. Just two in ten (21%) had heard “a great deal” (7%) or “some” (14%) about it. Another 14% have only heard “a little”, while nearly two-thirds (66%) have heard nothing about how to prepare for and prevent flooding during rainstorms from the Think Blue program.
Figure 9 shows the findings from 2012 and Table 3 shows the comparison from the 2011 study on the communications tested both years.

2012 City of San Diego Storm Water Survey Goodwin Simon Strategic Research Detailed Findings Page 36
Figure 9: Seen or Heard Specific Communications from Think Blue in 2012 About Pollution from:
Table 3: Awareness of Think Blue Specific Communications 2012 Survey Compared to 2011 Survey
Communication Survey
Year Total Yes
Yes, Great Deal
Yes, Some
Yes, Little
No Change in Total Yes 2011-2012
2012 48% 15% 18% 15% 52% About pollution caused by vehicles leaking oil 2011 63% 19% 28% 16% 37%
-15%
2012 37% 9% 15% 13% 63% About pollution caused by dog waste 2011 49% 13% 20% 16% 51%
-12%

2012 City of San Diego Storm Water Survey Goodwin Simon Strategic Research Detailed Findings Page 37
Results by Demographic and Behavioral Groups • Hispanic respondents have more awareness of Think Blue communications
on preparing for and preventing flooding during rainstorms than other non-white respondents, with 28% having heard at least “some” about this compared to 10% of non-Hispanic non-whites. Non-Hispanic white respondents are slightly more familiar as well (21%). Non-Hispanic non-whites are also less familiar with Think Blue’s communications about dog waste (11%) than Hispanics (27%) and non-Hispanic whites (26%).
• Those living in multi-family dwellings are more likely to be familiar than
those living in single-family dwellings with Think Blue’s communications about pollution caused by litter (42% to 33% among single-family dwellings) and preparing for and preventing flooding during rainstorms (26% to 17%).
• Residents of San Diego for 20+ years are at least slightly more likely to have
heard “some” or “a great deal” about pollution caused by dog waste (29% compared to 18% of shorter-term residents) and how to prepare for and prevent flooding during rainstorms (24% to 16%).
• Those who had heard of the “Think Blue San Diego” slogan are more familiar
with each communication about sources of pollution from Think Blue than those who had not heard the slogan. While 54% of those familiar with the slogan had heard or seen at least “some” about pollution caused by litter, just 17% of those not familiar with the slogan had heard about this pollution. The same trend presents about pollution caused by vehicles leaking oil (48% to 18%), pollution caused by dog waste (36% to 10%), and how to prepare for and prevent flooding during rainstorms (30% to 10%).
• Interestingly, there was no notable difference in familiarity with each item
among those who know that storm water is not treated and those who think it is. Those who did not know if storm water is treated or not are significantly less likely to be familiar with each communication about sources of pollution or flooding.
• Those who had seen any communication channel used by Think Blue,
including a television commercial, website, radio commercial, brochure, booth or sign at an event, or stencil, are significantly more likely to have seen or heard at least “some” about each form of pollution or flooding tested in the survey.

2012 City of San Diego Storm Water Survey Goodwin Simon Strategic Research Detailed Findings Page 38
III. Changes in Behavior to Reduce Pollution
As in the 2011 survey, survey respondents were read the following statement: “Anything that goes into storm drains can end up in local creeks, rivers, or the ocean, without any filtering or treatment. Motor oil, leaves and grass, dirt, litter, and pesticides are all examples of pollution that goes into storm drains in San Diego. They end up untreated in our creeks, on our beaches, or in the ocean.” This is very similar (although not exactly) to the statement read to respondents in the 2007 to 2011 surveys.8 After hearing this statement, respondents were then asked if, in the past year, “you made any changes in your behavior that was the direct result of seeing any information about what polluted water in storm drains does to local creeks, the beaches, and the ocean.” This statement is the same as 2011 and very similar to what was asked in the 2010 and 2009 surveys. In the current study, 26% said they changed their behavior as a direct result of information they had received about what polluted water in storm drains does to local creeks, the beaches, and the ocean. Potentially reflecting the reduced media campaign for Think Blue in 2011, this represents a decline from the 2011 and 2010 studies when 32% said they had made such changes to their behavior and from the 29% who gave this response in the 2009 survey (see Figure 10).
8 Slightly different wording and different placement in the survey may impact the results, and the findings should be viewed with caution.

2012 City of San Diego Storm Water Survey Goodwin Simon Strategic Research Detailed Findings Page 39
Figure 10: Percentage Who Changed Behavior in Past Year From Hearing About Storm Water Pollution
Results by Demographic and Behavioral Groups • Although the differences are not statistically significant, the proportion who
made a change rose with declining age, from 18% of those 70 years of age or older to 30% of those under 30 years of age.
• Asian Americans were slightly less likely to have made a change (15%), while
Hispanic (31%) and non-Hispanic white respondents (27%) were the most likely to have done so (20% of African American respondents did so). Overall in the current study, non-Hispanic non-whites were less likely to have made a change (at 17%) than either non-Hispanic whites (27%) or Hispanics (31%).
• Those who recalled hearing the Think Blue slogan before (36%) were more
likely to have made a change than those who did not (14%). • Those who had received communications from the Think Blue program were
more likely to also say they had made changes in their behavior, including 64% who had seen the Think Blue website, 47% who had seen a brochure, 43% who had heard a radio ad, 42% who had seen a booth or a sign at an event, 39% who had seen a television commercial, and 34% who had seen a stencil on the sidewalk in front of a storm drain opening. Those who learned about pollution caused by dog waste (44% had made a change), litter (42%), and leaking vehicle oil (41%), as well as how to prepare for and prevent flooding during rainstorms (48%) from the Think Blue program were also

2012 City of San Diego Storm Water Survey Goodwin Simon Strategic Research Detailed Findings Page 40
more likely to have made a change. And those who had heard about the Hotline were more likely to have made a change (50%) as well.
Changes That Were Made
Residents who had made a change over the past year to prevent pollution (n=206) were asked, in an open-ended question where no response options were provided, to describe briefly what changes they had made. This question was also asked in the 2011, 2010, and 2009 surveys, and the results are compared in Figure 11 below. Approximately one in four each said they are taking their car to a carwash rather than washing it at home (24%) and picking up trash and litter (23%). Fifteen percent said they are using less fertilizer, pesticides, or chemicals; while 14% said they are not pouring oil in the streets, are taking it for proper disposal, or fixing vehicle leaks; 12% are being more cautious in general; and 11% are recycling more. Just 8% said they are conserving or using less water. It is important to note that this was an open-ended question, meaning respondents volunteered what they have done to prevent pollution in their own words. Therefore, some may have been stating what they have done in an effort to conserve or be efficient, such as recycle or conserve water, while others may only have been answering about what they specifically did to reduce pollution of storm water—which may not have included water conservation, even if they are conserving water for other reasons. The results show that there is an uptick in the proportion taking their car to a carwash; picking up trash or litter; and using less fertilizer, pesticides or chemicals from the 2011 study. Therefore, while there has been less communication from Think Blue, the results suggest that residents are growing at least slightly more aware of the actions they can take to prevent storm drain pollution. • The finding that just 8% volunteered that they are conserving or using less
water in an effort to prevent pollution is a departure from previous years where far higher proportions mentioned conserving water, with 28% giving this response in the 2011 survey, 51% in 2010, and 47% in 2009.
• The proportion taking their car to the carwash to prevent pollution is up
slightly from 19% in 2011 to 24% currently, but more closely reflects the 22% who gave this response in 2010 and 2009.

2012 City of San Diego Storm Water Survey Goodwin Simon Strategic Research Detailed Findings Page 41
• The proportion picking up trash and litter has increased to 23% from 18% in 2011, 11% in 2010, and 18% in 2009.
• The proportion who said they are recycling more to prevent pollution
remained similar to 2011 (13% to 11% currently). This was much lower than the 21% giving this response in 2010, but more closely reflects the 10% who gave this response in 2009.
• The proportion who are using less fertilizer, pesticides, and chemicals is up
from 6% in 2011 and 2010 to 15% currently and is higher than the 11% who gave this response in 2009.
• The proportion who said they are handling used oil properly and fixing
vehicle oil leaks is up from 7% in 2009, 5% in 2010, and 10% in 2011 to 14% currently.
• Just 2% reported keeping leaves and grass out of the gutter in the current
study, down from 7% in 2011 and more closely reflecting the 4% who gave this response in 2010 and 2009.

2012 City of San Diego Storm Water Survey Goodwin Simon Strategic Research Detailed Findings Page 42
Figure 11: Actions Being Taken to Reduce Pollution: 2009 to 2012 Surveys
(n=229 in 2009, 257 in 2010, 256 in 2011, and 206 in 2012)

2012 City of San Diego Storm Water Survey Goodwin Simon Strategic Research Detailed Findings Page 43
Results by Demographic and Behavioral Groups Notable differences among subgroups in the current study in response to the changes they made to prevent pollution include the following: • Non-Hispanic white respondents were more likely to say they took their car
to a carwash rather than washing it at home to prevent pollution (30%) than Hispanic (17%) and non-Hispanic non-white respondents (7%). Non-Hispanic white men were more likely to do so than non-Hispanic white women (39% to 20%).
• Those ages 18 to 34 (32%) were more likely than those older (approximately
16%) to say they had picked up trash and litter, as were those with a high school education or less (37%) or some college (23%) than those more educated (6%), and Hispanic (36%) and non-Hispanic non-whites (24%) than non-Hispanic whites (16%). Non-Hispanic white women were more likely to pick up trash and litter than non-Hispanic white men (25% to 9%).
• Those ages 18 to 34 (21%) were more likely than those older (5%) to say they
recycle more as a result of information about what polluted water in storm drains does to local creeks, beaches, and the ocean. Those living in multi-family dwellings were slightly more likely to give this response than those in single-family dwellings as well (17% to 6%).
• Those living in single-family dwellings were more likely to conserve water to
prevent pollution than those in multi-family dwellings (13% to 2%). • Those who saw a Think Blue brochure were more likely to say they are using
less fertilizer, pesticides or chemicals than those who did not see such a brochure (27% to 11%). Those who had seen a Think Blue brochure were also more likely to pick up trash and litter than those who had not (27% to 12%).
• Those who saw a stencil were more likely to use less fertilizer, pesticides, or
chemicals than those who had not (20% to 9%). They were also more likely to take their car to a carwash (29% to 17%).
• Those who had heard the “Think Blue San Diego” slogan were more likely to
have changed their behavior to not wash their car at home than those who had not (28% to 11%). There was no other notable difference based on awareness of the slogan.
2012 City of San Diego Storm Water Survey Goodwin Simon Strategic Research Detailed Findings Page 44
• Those who knew storm water is not treated were also more likely to say they now take their car to a carwash than those who thought storm water was treated (29% to 6%).
• Those who had heard a Think Blue radio ad (31%) or had seen a booth or sign
at an event (36%) were more likely to have changed their car washing behavior as well.
IV. Knowledge of Storm Drain System
Nearly half of respondents do not know that storm water is not treated. Respondents were told that “storm drains are the gutters, pipes, and concrete channels that collect water from streets.” They were then asked, “When water goes into the storm drains, does it go to a sewage treatment plant before it is released, or is it released into creeks or the ocean without treatment?” As Figure 12 shows, 51% of respondents know that this water is not treated. However, 14% erroneously believe that it is and 34% are unsure—for a total of 48% who do not know that storm water is untreated (one percent did not give an answer, suggesting they also do not know). After a steady trend upward since 2008, the proportion who knew storm water is not treated fell back down to 2010 survey levels, from 57% in 2011 to 51% currently—potentially reflecting the reduced communications campaign in the past year. The proportion who believe it is treated remained statistically unchanged from past years, while the proportion who are uncertain rose.

2012 City of San Diego Storm Water Survey Goodwin Simon Strategic Research Detailed Findings Page 45
Figure 12: Storm Water Treated or Untreated: 2007 to 2012 Surveys
Results by Demographic and Behavioral Groups Differences among demographic groups include the following: • Men are more likely than women to know that storm water is not treated
(56% to 46%), with women more uncertain (40% to 29%) rather than believing it is treated. This same trend was seen in the 2011 and 2010 surveys. However, the proportion who know this water is not treated has declined among both men and women.
• Those with a college degree are more likely to know that storm water is not
treated than those who are less educated (60% to 46%). Again, this repeats the trend from 2011. Those less educated are more uncertain rather than believing it is treated (38% uncertain to 28% of college graduates). However, there is no notable difference in response among non-Hispanic white respondents by those with a college degree and those without. The difference lies among non-white respondents generally, where 44% of those with a college degree know storm water is treated and only 28% of those without do so. The same trend is apparent among Hispanic respondents specifically, with 64% of those with a college degree aware that storm water is not treated compare to 35% of those less educated.
• Non-Hispanic white respondents are more likely to know that storm water is
untreated (62%) than Hispanics (39%), African Americans (34%), or Asian

2012 City of San Diego Storm Water Survey Goodwin Simon Strategic Research Detailed Findings Page 46
Americans (31%). Hispanics are the most likely to believe the water is treated (22% compared to 11% of non-Hispanics). Results among white respondents are unchanged from 2011. However, awareness fell among Hispanic, African American and Asian American respondents.
• There was no significant difference by age overall or years of residency in San
Diego. Non-white respondents under 50 years of age were more likely to say that storm water is not treated than those older (37% to 19%).
• Not surprisingly, those who have seen a television or radio ad, brochure,
booth, or stencil from Think Blue are more likely to know storm water is not treated, with between 58% and 66% of those who have seen these communications giving this response. And higher proportions who have received specific communications about the Hotline; pollution caused by litter, dog waster, or leaking oil; and how to prepare for and prevent flooding know that storm water is not treated than those who had not received these Think Blue communications (63% to 68%).
Table 4 shows the percentage who answered this question correctly over the last three years by key demographic groups.
Table 4: Percentage Who Knew Storm Water Is Not Treated, in Surveys From 2008 to 2012
% Storm Water Not Treated Change in Percentage
2007 2008 2009 2010 2011
2012 From 2007
From 2008
From 2009
From 2010
From 2011
Men 52 46 45 55 63 56 +4 +10 +11 +1 -7
Women 41 32 42 49 50 46 +5 +14 +4 -3 -4
Ages 18-49 46 35 37 50 56 51 +5 +16 +14 +1 -5
Ages 50+ 47 47 58 55 58 51 +4 +4 -7 -4 -7
No College degree 38 30 40 48 51 46 +8 +16 +6 -2 -5
College Grad 57 51 51 59 67 60 +3 +9 +9 +1 -7
Non-Hispanic white 51 53 49 60 61 62 +11 +9 +13 +2 +1
Hispanic 32 25 40 44 48 39 +7 +14 -1 -5 -9
Asian 51 14 26 38 60 31 -20 +17 +5 -7 -29
African American 29 42 26 29 44 34 +5 +8 +8 +5 -10
Single-Family Homes 49 45 46 57 58 54 +5 +9 +8 -3 -4
Multi-Family Homes 44 37 41 41 54 46 +2 +9 +5 +5 -8
The proportion aware that storm water is not treated fell with nearly every key subgroup from 2011 to the current study.
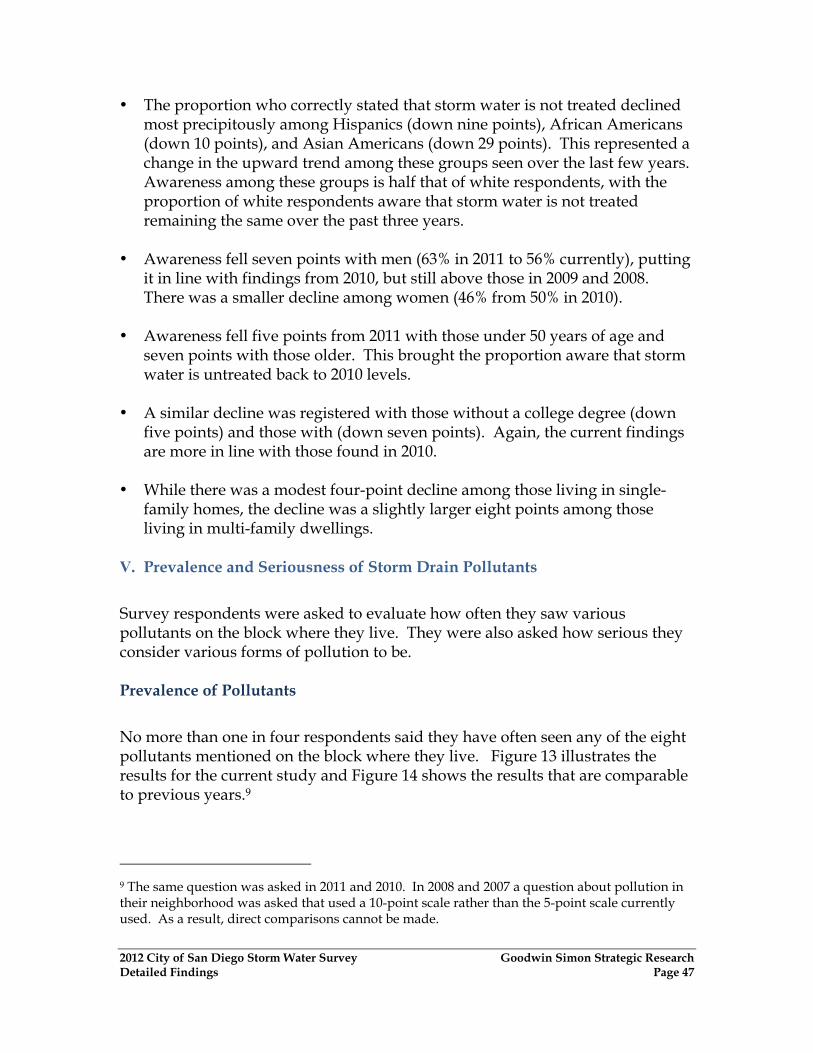
2012 City of San Diego Storm Water Survey Goodwin Simon Strategic Research Detailed Findings Page 47
• The proportion who correctly stated that storm water is not treated declined most precipitously among Hispanics (down nine points), African Americans (down 10 points), and Asian Americans (down 29 points). This represented a change in the upward trend among these groups seen over the last few years. Awareness among these groups is half that of white respondents, with the proportion of white respondents aware that storm water is not treated remaining the same over the past three years.
• Awareness fell seven points with men (63% in 2011 to 56% currently), putting
it in line with findings from 2010, but still above those in 2009 and 2008. There was a smaller decline among women (46% from 50% in 2010).
• Awareness fell five points from 2011 with those under 50 years of age and
seven points with those older. This brought the proportion aware that storm water is untreated back to 2010 levels.
• A similar decline was registered with those without a college degree (down
five points) and those with (down seven points). Again, the current findings are more in line with those found in 2010.
• While there was a modest four-point decline among those living in single-
family homes, the decline was a slightly larger eight points among those living in multi-family dwellings.
V. Prevalence and Seriousness of Storm Drain Pollutants
Survey respondents were asked to evaluate how often they saw various pollutants on the block where they live. They were also asked how serious they consider various forms of pollution to be. Prevalence of Pollutants
No more than one in four respondents said they have often seen any of the eight pollutants mentioned on the block where they live. Figure 13 illustrates the results for the current study and Figure 14 shows the results that are comparable to previous years.9
9 The same question was asked in 2011 and 2010. In 2008 and 2007 a question about pollution in their neighborhood was asked that used a 10-point scale rather than the 5-point scale currently used. As a result, direct comparisons cannot be made.

2012 City of San Diego Storm Water Survey Goodwin Simon Strategic Research Detailed Findings Page 48
• The highest proportion have seen sinkholes and big potholes in the streets after rain storms, with 24% saying they have seen this problem “very often” or “often.” Another two in ten (20%) have seen this “occasionally.” However, 55% have seen this “rarely” or “very rarely.” This item was not asked in previous years.
• A statistically equal 23% have seen dog waste that is not picked up “very often” or “often,” while 25% have seen this “occasionally.” Fifty-one percent have seen it “rarely” or “very rarely.” This finding is similar to that seen in 2011 (26% at least often) and 2010 (21% at least often).
• Just under two in ten (18%) said they see litter on the block where they live at least “often.” This is down from 30% in 2011 and more closely matches the 19% who gave this response in 2010. Another 28% report seeing litter occasionally in the current study, while 53% see it “rarely” or “very rarely.”
• Seventeen percent have seen motor oil that has leaked onto streets or driveways on their block “often,” while another 21% have seen this “occasionally.” Six in ten (60%) have “rarely” or “very rarely” seen this pollution on their block. This is similar to the result in 2011, but higher than in 2010 when 12% saw it often and 14% occasionally.
• A similar 16% have seen people washing their cars on the driveway or in the street on their block at least “often.” This question was not asked in 2011, but the result is equal to that seen in 2010. In the current study, nearly three in ten (28%) see people washing their cars on the driveway or in the street “occasionally,” and 54% see it “rarely” or “very rarely.”
• Fifteen percent often see people washing or blowing yard waste or litter from their sidewalk or driveway into the street. Two in ten (21%) see this on their block “occasionally,” but 62% “rarely” or “very rarely” see it. Although asked with somewhat different wording in 2010, the results are similar (the item was not asked in 2011).
• Fewer respondents said they often see flooding during rainstorms (13%) or people using pesticides or week killers on their lawns or gardens (7%). In fact, approximately two-thirds “rarely” or “very rarely” have seen these pollutants. Neither item was asked in 2011 or 2010.
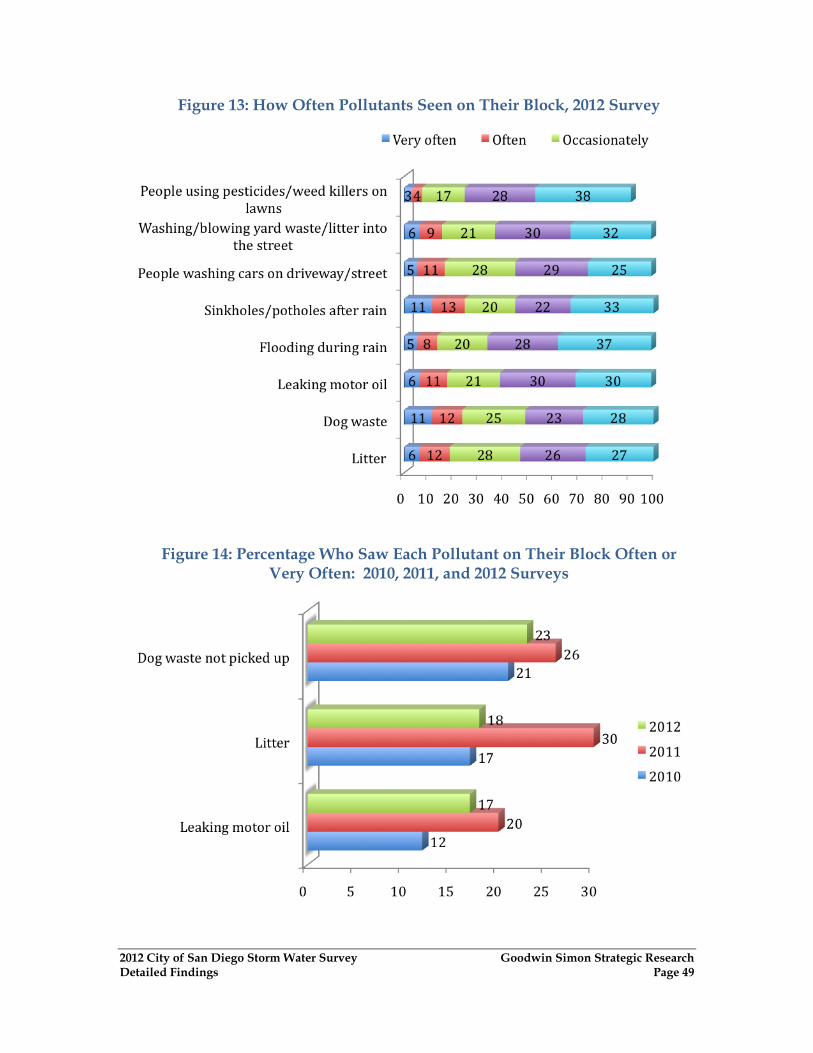
2012 City of San Diego Storm Water Survey Goodwin Simon Strategic Research Detailed Findings Page 49
Figure 13: How Often Pollutants Seen on Their Block, 2012 Survey
Figure 14: Percentage Who Saw Each Pollutant on Their Block Often or Very Often: 2010, 2011, and 2012 Surveys

2012 City of San Diego Storm Water Survey Goodwin Simon Strategic Research Detailed Findings Page 50
Results by Demographic and Behavioral Groups
Notable differences among subgroups include the following:
• Those without a college degree are more likely to often see dog waste that is not picked up (26% to 16% of those with a degree), litter (20% to 13%), leaked motor oil (20% to 9%), and people washing their cars on the street or driveway (18% to 12%) than those who are more educated.
• African American respondents were more likely to say they often see litter (30%) or leaked motor oil (47%) than white, Hispanic, or other non-white respondents.
• Those who speak Spanish at home are more likely to often see leaked motor oil (24%) than the sample average (16%).
• Those living in multi-family dwellings are more likely to often see dog waste that is not picked up (29% to 19% of those in single-family dwellings), litter (24% to 14%), leaked motor oil (24% to 11%), and flooding during rain storms (18% to 10%).
• Those 65 years of age or older are less likely to often see flooding during rainstorms (4%) than those younger (14%).
• Non-Hispanic white women are more likely than non-Hispanic white men to often see people washing or blowing yard waste into the street (22% to 13%) and flooding during rainstorms (19% to 10%).
• Non-Hispanic whites ages 50 or older are more likely to have seen sinkholes or potholes in the streets after storms than those younger (33% to 22%).
• Women 18 to 49 years of age are more likely to often see people washing their cars on the driveway or street than those older (22% to 13%) and more likely than men regardless of age (13%).
Seriousness Ratings for Storm Drain Pollutants Respondents were asked to rate how serious they considered a list of items that may pollute water in storm drains in San Diego, using a 10-point scale, where a “1” indicated that they feel the item is not a serious source of pollution and a “10” indicated they consider it very serious. For this analysis, ratings of eight or higher indicate an overall “serious” rating. Different items from this question were asked dating back to 2008. However, the question placement in the survey may impact the results, and comparisons should be viewed with this caution.

2012 City of San Diego Storm Water Survey Goodwin Simon Strategic Research Detailed Findings Page 51
• The highest proportion recognize motor oil as a source of pollution to storm drains, with a mean score of 8.34. In fact, 58% rate this as a “10” on the scale, and this item receives a score of “8” or higher from 77% of respondents. This mean rating is up slightly from 8.0 in 2011, and ratings of “8” or higher are up from 69% as well. These ratings, however, remains below that found in 2010 (81% rating of “8” or greater and a mean score of 8.68), 2009 (81%, 8.80), and 2008 (79%, 8.59).
• Pesticides and weed killers that people use on their lawns or gardens was the second
most mentioned concern, with a mean score of 7.86 and 66% giving it a score of “8” or higher. This item was not asked in previous years.
• Just under six in ten (58%) gave a score of “8” or more to litter as a source of
pollution. In all, it received a mean rating of 7.46, showing that it is considered at least a somewhat serious source of pollution on average. This rating is similar to 2011, when 53% considered litter a serious source of pollution, with an average rating of 7.3. However, ratings are lower than in 2010 (64% serious, 7.71 mean rating), 2009 (74%, 8.40), and 2008 (65%, 7.94).
• Nearly six in ten (58%) gave an “8” or higher rating to pollution from cigarette
butts, showing a strong level of concern. It receives a mean rating of 7.37 as well. The level of concern is down slightly from 2010, when it received a mean rating of 7.64 and 61% gave it a score of “8” or higher. And these ratings are down from 2009 (64% “8” or higher, mean of 7.90) and 2008 (68%, 7.98). This item was not asked in 2011.
• Forty-seven percent gave a rating of “8” or higher to dog waste that is not picked
up, and it received a mean rating is 6.91, suggesting a modest level of concern overall. This rating is similar to that received in 2011. The question was not asked in 2010, and in 2009 and 2008 the question asked about “dog droppings.” Concern was much stronger in 2009, with a mean score of 7.86, but more closely matched the current findings in 2008 (mean score of 6.94).
• Slightly lower numbers on average consider food and drink that gets tossed into
the street to be a serious source of pollution (mean rating of 6.62, 44% “8” rating or higher). Concern about food and drink that gets tossed in the street has not been assessed since 2009. At that time, the mean rating was a higher 7.53 and 61% gave an “8” rating or higher. However, in 2008 the rating more closely reflected that found today (6.81, 46% “8” or higher).
• Runoff water from washing cars in the driveway or street is considered a serious
source of pollution to 36% of respondents (generating a mean rating of 6.21).

2012 City of San Diego Storm Water Survey Goodwin Simon Strategic Research Detailed Findings Page 52
This is down slightly from 2010 (43%, 6.5), but closely reflects results in 2008 (35%, 6.35). The question was not asked in 2009 or 2011.
• Concern is even lower in regard to washing down sidewalks or driveways or
leaves and grass clippings. Just 31% gave the former and 29% the latter an “8” rating or higher (mean scores of 5.77 and 5.47, respectively). The results fluctuated from year to year about concern over washing down sidewalks or driveways. In 2010, 40% considered this a serious source of pollution (mean rating of 6.15). In 2009, 48% considered it serious (mean score of 6.81) and in 2008, it was serious to 33% (mean score of 6.00). Concern about leaves and grass clippings was only slightly lower in 2010 than the current study, with 24% considering it serious (mean score of 5.00). In 2009, a higher 40% felt this way (with a mean score of 6.30). The proportion expressing concern was 30% in 2008 (mean score of 5.63). This question was not asked in 2011.
Table 5 shows the average seriousness rating for items asked in the current study in comparison to the years each item was asked previously. As mentioned earlier, this chart should be viewed with caution due to differences in placement of the question in the questionnaire in various years, and different items included in the battery.

2012 City of San Diego Storm Water Survey Goodwin Simon Strategic Research Detailed Findings Page 53
Table 5: Ratings of Seriousness of Storm Water Pollutants, 2008-2012
Communication Survey
Year Mean score
Serious8-10
Not serious
1-3
2012 8.3 77% 10%
2011 8.0 69% 8%
2010 8.7 81% 8%
2009 8.8 81% 3%
Motor oil
2008 8.6 79% 6%
2012 7.9 66% 10%
2011 N/A N/A N/A
2010 N/A N/A N/A
2009 N/A N/A N/A
Pesticides and weed killers that people use
on their lawns or gardens
2008 N/A N/A N/A
2012 7.5 58% 9%
2011 7.3 53% 10%
2010 7.7 64% 8%
2009 8.4 74% 2%
Litter
2008 7.9 65% 7%
2012 7.4 58% 11%
2011 N/A N/A N/A
2010 7.6 61% 9%
2009 7.9 64% 8%
Cigarette butts
2008 8.0 68% 8%
2012 6.9 47% 14%
2011 6.7 46% 17%
2010 N/A N/A N/A
200910 7.9 63% 7%
Dog waste that is not picked up
2008 6.9 50% 14%
10 The question wording was different in 2009 and 2008, saying “dog droppings.”

2012 City of San Diego Storm Water Survey Goodwin Simon Strategic Research Detailed Findings Page 54
Table 5 Continued: Ratings of Seriousness of Storm Water Pollutants, 2008-2012
Communication Survey
Year Mean score
Serious8-10
Not serious
1-3
2012 6.6 44% 16%
2011 N/A N/A N/A
2010 N/A N/A N/A
2009 7.5 61% 11%
Food and drink that gets tossed into the
street
2008 6.8 46% 14%
2012 6.2 36% 18%
2011 N/A N/A N/A
2010 6.5 43% 17%
2009 N/A N/A N/A
Runoff water from washing cars in the driveway or street
2008 6.4 35% 15%
2012 5.8 31% 23%
2011 N/A N/A N/A
2010 6.2 40% 24%
2009 6.8 48% 14%
Washing down sidewalks or driveways
2008 6.0 33% 21%
2012 5.5 29% 30%
2011 N/A N/A N/A
2010 5.0 24% 35%
2009 6.3 40% 20%
Leaves or grass clippings
2008 5.6 30% 27%

2012 City of San Diego Storm Water Survey Goodwin Simon Strategic Research Detailed Findings Page 55
Results by Demographic and Behavioral Groups • As seen last year, women gave ratings of “8” or greater to each source of
pollution in higher numbers than men. However, the items were ranked similarly. Men ages 50 or older were the least likely to give an “8” or greater rating to pesticides and weed killers that people use on their lawns or gardens (53% serious), cigarette butts (44%), or litter (41%).
• Post-graduates were less likely to give an “8” or greater to litter (42% serious
compared to approximately 59% of those less educated), food or drink that gets tossed into the street (26% to approximately 45%), and to leaves or grass clippings (12% to approximately 31%). They were also less likely to consider dog waste that is not picked up to be a serious concern (36%) than those less educated (approximately 48%), although the result is not statistically significant. These findings suggest that various forms of “litter” are of less concern to post-graduates than those less educated.
• As seen last year and in years prior, Hispanic respondents are more likely to
consider each source of pollution to be serious (based on an “8” or greater rating) than non-Hispanic respondents. However, the items were ranked similarly. Those who speak Spanish at home are more likely to consider cigarette butts to be a serious source of pollution (71%) than the sample average (57%).
• Non-whites and Hispanics without a college degree are more likely to
consider dog waste that is not picked up, food and drink tossed into the street, runoff from washing cars in the driveway or street, washing down of sidewalks or driveways, leaves and grass clippings, and litter to be serious problems than non-whites and Hispanics with college degrees. This same trend was not apparent with non-Hispanic whites.
• Those living in multi-family dwellings are at least slightly more likely to
consider each item a serious source of pollution than those living in single-family dwellings. However, the items were ranked similarly.
• Residents of 20+ years were more likely to consider food and drink tossed into
the street, washing down sidewalks or driveways, and leaves or grass clippings to be serious sources of pollution than more recent residents.
• Familiarity with Think Blue outreach efforts is positively correlated with
higher awareness of serious pollutants. Specifically:

2012 City of San Diego Storm Water Survey Goodwin Simon Strategic Research Detailed Findings Page 56
• Those who saw a Think Blue television commercial were significantly more likely to rate these items as a serious pollutants compared to those who had not.
• Those who heard the radio ad were more likely to rate motor oil, cigarette butts, and washing down sidewalks or driveways as a serious pollutant, but not the other items.
• Those who saw a Think Blue brochure were more likely to rate motor oil as a serious pollutant than those who had not.
• Residents who saw a Think Blue booth or sign were more likely to rate nearly all of these items as serious compared to others. The only exceptions were regarding motor oil, pesticides and weed killers, and litter.
• Those who saw a stencil were more likely to consider motor oil, cigarette butts, dog waste, runoff from washing cars in the driveway or street, and washing down sidewalks or driveways at least slightly more serious than those who did not see a stencil.
• Those who heard the Think Blue slogan were more likely to consider all of these pollutants as serious other than pesticides and weed killers, food and drink tossed into the street, and leaves and grass clippings.
• Those who had heard from Think Blue about pollution caused by dog waste, vehicles leaking oil, and litter were more likely to consider nearly all these items to be serious. This is also true of those who had heard from Think Blue about how to prevent and prepare for flooding during a storm and those who had heard of the Hotline.
• Those who made a change last year in order to reduce pollution rated each one of the pollutants as more serious than those who didn’t make a change.
VI. Strongest Concern About Pollution For the first time this year, respondents were asked which of four options concerned them most about pollution of local beaches and ocean. The results show that health and marine life concerns top economic concerns, with 55% choosing a health and marine life concern and 19% an economic concern. The highest proportion, 31%, chose as their top concern that it causes harm to marine life in the ocean like seals, dolphins, and whales. An only slightly lower 24% chose that it causes harm and illness to people who swim at our local beaches. Eleven percent said they are most concerned that cleaning it up costs San Diego taxpayers a lot of money that could be used for services like police and fire protection and 8% chose that when our beaches get polluted, that drives away tourists and hurts sand Diego’s economy, costing the city jobs we need during this recession. One in four (25%) said all reasons were equal to them (see Figure 15).

2012 City of San Diego Storm Water Survey Goodwin Simon Strategic Research Detailed Findings Page 57
Figure 15: Strongest Concern Among Four Choices About Pollution of
Beaches and Ocean, 2012 Survey
Results by Demographic and Behavioral Groups • The proportion considering the harm to marine life the most concerning
reason of the four presented declines with rising age, from 38% of those under 30 to 24% of those 70 years of age or older. Those 50 years of age or older are more likely to say all four reasons concern them equally than those younger (33% to 20%).
• Those with a high school education or less were more likely to name the
tourism/economic statement (15%) than those more educated (6%). Post-graduates were the most likely to mention the marine life statement (43% to 23% of college graduates and 31% of those less educated).
• The tourism argument also resonated more with Hispanics (13%, in particular
women at 22%) and African Americans (23%) than non-Hispanic whites (6%). African Americans reacted in far lower proportions to the statement that it causes harm and illness to people who swim at local beaches (10%, compared to approximately one in four of other ethnic/racial subgroups).
• There is a pattern of those who had heard a Think Blue communication being
more likely to name harm to marine life as what concerns them most about

2012 City of San Diego Storm Water Survey Goodwin Simon Strategic Research Detailed Findings Page 58
pollution of local beaches and ocean than those who had not heard the communications, including seeing or hearing information from some communication channels or hearing specific information about sources of pollution.
VII. Job Being Done by the City to Reduce Pollution
Ratings of City Performance Regarding Reducing Pollution
Respondents were asked this year to assess the job the City of San Diego is doing in a number of ways to reduce or prevent pollution. Respondents were asked to rate the City’s job performance on a 10-point scale where a “1” indicated the City is doing a poor job and a “10” indicated it is doing an excellent job. This question was not asked in the 2010 or 2011 surveys, but some items from the battery were asked in prior years and comparisons are made where appropriate. The City gets modestly positive ratings on average in each area (see Table 6). However, the City gets negative ratings (“3” or lower) from no greater than 15%. A plurality of reviews in most areas fall in the middle range of “4” to “7.” • The City gets its strongest ratings for keeping the streets in your neighborhood
clean when they do street sweeping, with an average rating 7.41 on the 10-point scale. However, intensity is modest, with just 39% giving a “9” or “10” rating. In all, 56% gave the City a rating of “8” or greater, indicating a positive impression. This question was not asked in previous years.
• The next strongest rating for job performance is for preventing pollution of San
Diego’s ocean, bays, and beaches. However, the City receives a mean rating of 6.67—suggesting a modestly positive review overall. Just two in ten (21%) gave the City a “9” or “10” rating in this regard and 37% gave at least an “8” rating. However, this rating is up from 2009 (5.74), 2008 (5.36), and 2007 (5.24) with the proportion giving at least an “8” rating up from 22% in 2009, 16% in 2008, and 14% in 2007.
• The City receives an average rating of 6.53 for preventing flooding from
rainstorms. Just 22% gave the City a “9” or “10” rating, and 37% a rating of “8” or greater (this question was not asked in previous years).
• The mean rating for enforcing laws against activities that pollute our storm drains
and beaches is 6.31, with 18% giving a “9” or “10” rating and 30% at least an “8” rating in this area (this question was not asked in previous years).

2012 City of San Diego Storm Water Survey Goodwin Simon Strategic Research Detailed Findings Page 59
• Ratings are modest as well for the City’s job in keeping polluted water out of storm drains. The City receives a mean rating of 6.22 in this area, with 18% giving a “9” or “10” rating and 29% at least an “8” rating. However, this rating is up from 2009 (5.91 mean rating, 19% at least an “8” rating) and 2008 (5.28, 15%).11
• The weakest rating is for helping people learn how to prevent pollution in their
daily activities at home, with an average rating of 6.16 and a “9” or “10” rating from just 16% and at least an “8” rating from 32%. This question was not asked in previous years.
Table 6: Ratings of San Diego Job Performance Regarding Pollution Prevention Efforts, 2012 Survey
Item Mean score
Excellent 8-10
Poor 1-3
In keeping the streets in your neighborhood clean when they do street sweeping
7.4 56% 8%
Preventing pollution of San Diego’s ocean, bays, and beaches 6.7 37% 9%
In preventing flooding from rain storms 6.5 37% 12%
In enforcing laws against activities that pollute our storm drains and beaches
6.3 30% 14%
Keeping polluted water out of storm drains 6.2 29% 12%
In helping people learn how to prevent pollution in their daily activities at home
6.2 32% 15%
11 The question was worded differently in 2007: “preventing pollution in storm drains.” With this wording, the City received a mean rating of 5.16 and a rating of “8” or greater from 13% of respondents.

2012 City of San Diego Storm Water Survey Goodwin Simon Strategic Research Detailed Findings Page 60
Results by Demographic and Behavioral Groups • There is little variation in “8” to “10” ratings in each area by gender. Women
are slightly more likely than men to give the City this rating for helping people learn how to prevent pollution in their daily activities at home (37% to 28%). There is no statistically significant difference in mean ratings. Women ages 50 or older are more likely to give an “8” to “10” rating for keeping polluted water out of storm drains” than younger women (37% to 26%).
• Non-white women were more likely to give an “8” through “10” rating in all
areas other than keeping streets clean with street sweeping than non-white men. Hispanic women were more likely to give a positive rating than men for helping people learn how to prevent pollution in their daily activities at home (57% to 35%).
• There is also little difference in ratings by age. Those 18 to 29 gave an “8” to
“10” rating for keeping the streets in your neighborhood clean when they do street sweeping in higher proportions than those older (66% to 52%). Looking at age by ethnicity/race, non-Hispanic white respondents ages 18 to 49 were more likely to give a positive rating for keeping streets clean with street sweeping than those older (60% to 47%). Meanwhile, non-whites ages 50+ were more likely to give this response than those younger (72% to 57%). They were also more likely to give the City positive ratings for each item. Hispanics ages 50+ specifically were more likely than those younger to give the City a positive rating for keeping polluted water out of storm drains (61% to 38%). They were more likely to give stronger ratings on each item, but the results were not statistically significant because of the small sample size.
• Post-graduates were at least slightly less likely to give the City an “8” to “10”
rating in most areas, including in keeping streets clean with street sweeping (43% to approximately 58% of those less educated), preventing pollution of oceans, bays, and beaches (27% to approximately 38%), enforcing laws against activities that pollute storm drains and beaches (19% to approximately 31%), and keeping polluted water out of storm drains (14% to approximately 31%).
• Hispanic residents gave the City stronger reviews for preventing flooding from
rain storms (50% “8” to “10” rating to 32% for non-Hispanics), helping people learn how to prevent pollution in their daily activities at home (46% to 29%), enforcing laws against activities that pollute our storm drains and beaches (43% to 26%), and keeping polluted water out of storm drains (44% to 25%--in particular Hispanics ages 50+ at 61%).

2012 City of San Diego Storm Water Survey Goodwin Simon Strategic Research Detailed Findings Page 61
• African American respondents gave the City an “8” to “10” rating in the lowest proportions for enforcing laws against activities that pollute our storm drains and beaches, with just 10% giving this response compared to 27% of non-Hispanic white respondents, 30% of Asian American respondents, and 43% of Hispanic respondents.
• Those who had heard of the “Think Blue San Diego” slogan were more likely
to give an “8” to “10” rating for helping people learn to prevent pollution in their daily activities at home, with 37% giving this response compared to 28% who had not heard the slogan (with a mean rating of 6.4 to 5.9 as well).
• Respondents who had seen a Think Blue television commercial, radio
commercial, website, or booth at an event were more likely to give the City an “8” to “10” rating for helping people learn to prevent pollution in their daily activities at home and keeping polluted water out of storm drains. Those who saw a television ad were also more likely to give this positive rating to the City for preventing pollution of San Diego’s ocean, bays, and beaches—by approximately 10 to 20 percentage points. There was no difference among those who had seen stencils near storm drains or brochures.
• Respondents who had heard “a great deal” or “some” about pollution caused
by dog waste, leaking vehicle oil, and litter from the Think Blue program were also more likely to give the City an “8” to “10” rating for helping people learn to prevent pollution in their daily activities at home. While approximately four in ten gave this positive rating, a lower three in ten of those who had heard a little or nothing about these sources of pollution from the Think Blue program did so. This suggests that receiving this information bolstered the reviews of the City’s educational efforts.
• More to this point, those who had heard “a great deal” or “some” about the
Hotline were more likely to give a positive rating for helping people learn to prevent pollution in their daily activities at home (49% to 29% of those with little to no knowledge of the Hotline), keeping polluted water out of storm drains (44% to 27%), and enforcing laws against activities that pollute storm drains and beaches (44% to 28%). This again suggests that efforts like the Hotline leave a positive impression on residents of the City’s efforts. Those who have heard “a great deal” or “some” from the Think Blue program about how to prepare for and prevent flooding during rainstorms also gave positive scores in these three areas in higher numbers. Those who had heard about pollution caused by dog waste, leaking car oil, and litter were more likely to rate the City positively for helping people learn to prevent pollution in their daily activities at home. However, there was no other significant difference in ratings in other areas.

2012 City of San Diego Storm Water Survey Goodwin Simon Strategic Research Detailed Findings Page 62
Awareness of City Efforts to Prevent Pollution
Just under half of respondents have seen city crews cleaning out storm drains or storm drain channels (47%) or responding to flooded streets or properties (47%). Figure 16 illustrates the results.
Figure 16: % Who Report Seeing City Crews’ Storm Drain Protection Efforts: 2012 Survey
Results by Demographic and Behavioral Groups There are few differences in response to this question by subgroups. • Hispanics are more likely to have seen crews cleaning out storm drains or
channels than non-Hispanics (56% to 44%), with Asian Americans (35%) and African Americans (32%) the least likely to have seen these crews. Forty-seven percent of non-Hispanic whites have seen these crews.
• Those who have changed their behavior; have seen a Think Blue television or
radio commercial or booth at an event; or are aware of the Hotline, Think Blue program’s efforts to educate about pollution caused by dog waste, leaking vehicle oil, or litter, or how to prepare for or prevent flooding were slightly more likely to have seen the crews—suggesting that their awareness of pollution prevention efforts makes them more likely to notice efforts around them.

2012 City of San Diego Storm Water Survey Goodwin Simon Strategic Research Detailed Findings Page 63
• Post-graduates are less likely to have seen City crews responding to flooded
streets or properties (28%) than those less educated (48%). • Hispanics without a college degree are more likely to have seen City crews
responding to flooded streets or properties than Hispanics respondents with a college degree (56% to 28%). Non-Hispanic whites ages 18 to 49 were more likely to see these crews than those older (50% to 39%). Meanwhile non-whites ages 50+ were more likely to have seen these crews than those younger (61% to 46%). There was no difference by Hispanics by age.
• Residents of five years or less were less likely to have seen City crews
responding to flooded streets or properties than longer-term residents (32% to 48%).
• There was also slightly more awareness of City crews in this regard among
those who has changed their behavior; seen a television commercial, brochure, or booth about Think Blue; heard about the Think Blue Hotline; heard from Think Blue about pollution caused by dog waste, leaking vehicle oil, or litter; or heard from Think Blue about how to prepare for and prevent flooding during rainstorms. Again this suggests that more knowledge of Think Blue efforts makes residents more attune to City efforts around them.
VIII. Websites
Familiarity of Websites
As mentioned earlier (on page 26), just 5% recalled seeing or hearing about the Think Blue program website in 2011. When asked later in the survey, 3% said they had looked at the Think Blue Website. An equal number said they had looked at the City of San Diego’s Storm Water Department website as well.
Likelihood to Use Websites for Pollution Prevention Activities
For the first time this year, respondents were asked how likely they would be to use either of these websites for a number of reasons (see Figure 17). Overall, approximately half of respondents said they would be at least “somewhat” likely to use the website for each reason. However, the proportion who would be “very” likely to do so did not rise above 26%. • The highest proportion would turn to the website to report activities that might
be polluting our beaches and ocean (59% likely, 24% very likely).
2012 City of San Diego Storm Water Survey Goodwin Simon Strategic Research Detailed Findings Page 64
• A near equal 58% said they would use the website to request that the city repair
or clean clogged storm drains and storm drain openings (26% very likely). • Just over half (54%) would be likely to use the website to learn about pollution
prevention laws and regulations (17% very likely). • Fifty-three percent said they would be likely to go to the website to get
information about how to prevent pollution of our beaches and oceans (20% very likely).
• Just under half (48%) would turn to the website to find out about storm water-
related improvement projects in your neighborhood (17% very likely) • The lowest proportion, 46%, said they would go to the website to learn about
events where you can get information about how to reduce pollution of our beaches and ocean (15% very likely).

2012 City of San Diego Storm Water Survey Goodwin Simon Strategic Research Detailed Findings Page 65
Figure 17: % Likely to Use Think Blue/Storm Water Department Website, 2012
Results by Demographic and Behavioral Groups • Women were more likely than men to say they would be likely to go to the
websites for all reasons, although they were ranked similarly. Women under the age of 50 were even more likely to use the website than those older. There was little difference among Hispanics or other non-white respondents by gender, suggesting that the gender difference reflects the difference among non-Hispanic white men and women.
• Those under 50 years of age were more likely than those older to say they
would be likely to go to the websites for all reasons, although they were ranked similarly as well. Those 65 years of age or older are the least likely to turn to the website for each reason. These age differences may be the result of opinions among non-Hispanic whites. There is little difference among non-whites or Hispanics by those under 50 or older.

2012 City of San Diego Storm Water Survey Goodwin Simon Strategic Research Detailed Findings Page 66
• Those with a high school education or less are less likely to turn to the website for each reason than those more educated.
• Non-Hispanic whites were less likely to say they would turn to the website
for every reason other than to report activities that might be polluting our beaches and ocean than non-Hispanic non-whites.
• Residents of less than 20 years are more likely to turn to the website to learn
about pollution prevention laws and regulations than longer-term residents (67% of those living in San Diego five years or less, 58% of six to 19 year residents, and 48% of longer term residents).
• Those who had received communications from Think Blue, including seeing a
radio or television commercial, brochure, booth at an event, or stencil, were more likely to say they would turn to the websites for nearly every reason than those who had not. This trend was also apparent in every area other than to request the city repair or clean clogged storm drains and storm drain openings for those who had received communications from Think Blue about pollution from dog waste, leaking vehicle oil, or litter or heard about the Hotline or how to prevent and prepare for flooding in a storm.
IX. Sample Demographics
This survey was conducted on both landlines and cell phones, in Spanish and in English. Responses were weighted to account for overlap in households that have both landlines and cell phones, and to adjust for sample non-response. Unless otherwise indicated, all frequencies and percentages reflect the proportions after weights were applied. Hispanics and Race In Table 7 are the self-described racial categories of the respondents in this survey. These categories include those who identify as Latino or Hispanic, which is determined by a separate question.

2012 City of San Diego Storm Water Survey Goodwin Simon Strategic Research Detailed Findings Page 67
Table 7: Racial Categories (including Hispanic/Latino)
%
White or Caucasian 64
Asian or Asian-American 13
Black or African-American 6
Native American 0
Mixed Ethnicity 4
Other 12
Refused 2 Table 8 shows the proportion of San Diego residents who said they consider themselves Latino or Hispanic, and breaks down the non-Hispanic category into racial categories, corresponding to categories used in the analysis of this report.
Table 8: Hispanic/Non-Hispanic and Non-Hispanic Racial Categories Referenced in the Report
%
Hispanic 23
Non-Hispanic, which includes: 76
Non-Hispanic White 57
Non-Hispanic Other 19 In this survey, 30% of those who said they were Latino or Hispanic categorized themselves racially as white, 2% were black, 14% mixed ethnicity; 52% said they were some other race, and 3% of Hispanics refused to give a racial category. Language Thirty-three percent said they speak a language other than English at home on a daily basis. Of those, 58% (or 19% overall) said that they speak Spanish at their home—up from 45% in 2011 (13% overall), and 23% of them (8% overall) said they spoke an Asian language (Chinese, Vietnamese, Tagalog, or Korean) at home (little changed from 2011).

2012 City of San Diego Storm Water Survey Goodwin Simon Strategic Research Detailed Findings Page 68
Table 9: Language Other Then English Spoken at Home on Daily Basis
%
English Only 67
Other Language, which includes: 33
Spanish 19
Chinese 1
Tagalog 3
Vietnamese 3
Other 6
English/No 3 Three out of four Hispanics (75%) and Asian Americans (76%) said they speak a language other than English on a daily basis at home. This shows that the availability of materials in languages other than English is critical. Educational Attainment Table 10 shows the level of educational attainment of the respondents and the combined categories used for analysis in this report.
Table 10: Categories of Educational Attainment Referenced in the Report
%
No B.A. Degree (net) includes: 64
No High School Diploma 11
High School Graduate 21
Some College 20
Associate Degree 12
B.A. Degree + (net) includes: 36
Four Year Degree 24
Graduate Degree or more 12
Refused 1 Age Table 11 shows the breakdown by age of the survey respondents, aggregated into categories used in this analysis.

2012 City of San Diego Storm Water Survey Goodwin Simon Strategic Research Detailed Findings Page 69
Table 11: Categories of Resident Age Referenced in the Report
%
18 to 49 includes: 66
18 to 29 27
30 to 39 20
40 to 49 19
50 or older includes: 34
50 to 59 15
60 to 69 9
70 or older 10
Refused 1 Type of Residence In the analysis of this report we referred to residents living in “single family dwellings” (SFD) and “multi-family dwellings” (MFD). Six in ten (60%) survey respondents live in SFDs, and 39% live in an apartment, condo, duplex, triplex, or any other dwelling which is not a single family home, as shown in Table 12.
Table 12: Type of Residence as Referenced in the Report
%
Single Family Homes (SFD) 60
Multi-Family Homes (MFD) includes: 39
Condo or Apartment 29
Duplex, Triplex 3
Townhouse 5
Other 1
Don’t know/NA 1 Length of Residency in San Diego The mean length of residency in the city is 22 years, with a median of 20 years. Only 13% have lived in the city for 5 or fewer years, and 50% have lived in San Diego for 20 or more years.

2012 City of San Diego Storm Water Survey Goodwin Simon Strategic Research Detailed Findings Page 70
Table 13: Length of Residency in San Diego
%
0-5 Years 13
6-10 Years 16
11-19 Years 19
20 to 29 Years 22
30+ Years 28
Refused 2
Mean 22
Median 20 Language of Interview Thirty-four of the 809 interviews in this survey were conducted in Spanish, and the rest (775) were in English. Spanish language interviews account for 4% of the weighted sample. Gender Fifty-four percent of respondents were male and 46% female.

2012 San Diego Think Blue Telephone Survey Results N =809
February, 2012
Gender of Respondent
1 (Male) ------------------------------------ 54% 2 (Female) --------------------------------- 46
Hello, I’m ______________ from G-S-S Research, a public opinion research firm. We've been asked by the city of San Diego to conduct a brief survey of local residents, and your telephone number was selected at random. We are not trying to sell you anything, and we are only interested in your opinions.
CELL PHONE RESPONDENTS SKIP TO Q.A
LAND LINE SAMPLE ONLY READ
According to the research procedure, may I speak to the person in the house who is 18 or older who had the most recent birthday? [IF RESPONDENT SAYS NO OR NOT NOW, ASK TO MAKE AN APPOINTMENT FOR LATER].
[REPEAT INTRODUCTION IF RESPONDENT IS NOT PERSON WHO FIRST ANSWERED PHONE]
LAND LINE RESPONDENTS SKIP TO Q.E
CELL PHONE SAMPLE ONLY ASK Q.A:
A. This sounds like a cell phone. Are you in a place where you can safely talk on your cell phone?
Yes safe place (SKIP TO QC) --------------- 100% No not safe -------------------------TERMINATE No not cell phone (ASK Q.B) ------------------ 0 (DON'T READ) DK/NA-------TERMINATE
IF RESPONDENT SAYS NOT IN SAFE PLACE, TELL THEM YOU WILL CALL BACK AND TRY TO REACH THEM WHEN THEY CAN TALK SAFELY. THEN THANK AND HANG UP AND CALL BACK
LATER
ASK Q.B ONLY IF NOT CELL PHONE (PUNCH 2) ON Q.A
B. You said this was not a cell phone I reached you on. Did you forward your cell phone number to this phone, or was this not a cell phone number that I called you on?
Forwarded (ASK Q.C) ----------------------- 100% Not cell phone --------------------TERMINATE (DON'T READ) Other ---------TERMINATE (DON'T READ) DK/NA ------TERMINATE

C. According to the research procedure, I need to speak to someone who is age 18 or older. Are you age 18 or older?
Yes (ASK Q.D)---------------------------------- 100% No ------------------------------------TERMINATE (DON'T READ) DK/NA-------TERMINATE
D. When you are at home, do you get personal calls on a regular phone as well as this cell phone, do you get all your personal calls on this cell phone, or do you use this phone only for business calls?
Get calls on regular phone AND this cell phone (CONTINUE TO Q.E) --------------------------------67% Get calls on this cell phone only (CONTINUE TO Q.E) -----------------------------------------------------33 Get only business calls on this cell ------------------------------------------------------------------TERMINATE Get calls on regular phone only ---------------------------------------------------------------------TERMINATE (DON'T READ) REFUSED --------------------------------------------------------------------------TERMINATE
E. Now, do you live in the City of San Diego, or do you live in some other city outside of San Diego?
Yes San Diego (SKIP TO Q.1)----------------94% No, other city (ASK Q.F) ----------------------- 6 (DON'T READ) DK/NA ------TERMINATE ASK Q.F IF OTHER CITY ON Q.E F. What city do you live in?
(DON'T READ) San Diego------------------------------------------32% Carmel Mountain Ranch------------------------ 8 Carmel Valley ------------------------------------- 5 Del Cerro ------------------------------------------- 0 Del Mar Heights ---------------------------------- 0 Del Mar Mesa-------------------------------------- 3 Encanto---------------------------------------------- 8 Hillcrest --------------------------------------------- 0 Jamacha -------------------------------------------- 3 La Jolla [la HOY- ah]----------------------------13 Mira Mesa ------------------------------------------ 4 Mission Beach ------------------------------------ 0 Ocean Beach --------------------------------------- 5 Otay/Otay Mesa---------------------------------- 0 Pacific Beach -------------------------------------- 0 Point Loma----------------------------------------- 4 Rancho Bernardo --------------------------------- 5 Rancho Peñasquitos------------------------------ 0 Sabre Springs -------------------------------------- 0 San Carlos ------------------------------------------ 1 San Pasqual ---------------------------------------- 9 San Ysidro ------------------------------------------ 0 Scripps Ranch ------------------------------------- 0 Tierrasanta ----------------------------------------- 0 Tijuana River Valley ----------------------------- 0 Torrey Highlands/Hills/Pines --------------- 0

University City------------------------------------ 0 UTC -------------------------------------------------- 0 Any other response --------------TERMINATE Not Sure/Refused ---------------TERMINATE 1. Now, in the past year, have you seen or heard the slogan “Think Blue San Diego?”
YES NO DK/NA Think Blue -------------------------------------------------------------51%---------------------- 48% -------------- 1%
IF NO OR DK ON Q1, SKIP TO Q.3.
2. Where did you see or hear this? (RECORD VERBATIM, THEN SUPERVISOR CODE. ACCEPT MULTIPLE RESPONSES) (n=413 respondents; 530 total responses)
Note percentages sum to more than 100% as multiple responses are allowed (DON'T READ) TV ad -----------------------------------------------18% Radio -----------------------------------------------12 Billboard -------------------------------------------10 Brochure -------------------------------------------- 1 Community meeting----------------------------- 0 Event/at a booth at an event ------------------ 1 TV news/Other TV -----------------------------38 Newspaper----------------------------------------- 3 Internet/web site --------------------------------- 2 Side of truck --------------------------------------- 1 Friends/family/word of mouth -------------- 1 At work --------------------------------------------- 2 Storm drain stencil ------------------------------- 7 Movie theater-------------------------------------- 2 Buses/Bus stops/Bench -----------------------11 Poster ------------------------------------------------ 3 Beach ------------------------------------------------ 1 School ----------------------------------------------- 1 Everywhere ---------------------------------------- 1 Magazines ------------------------------------------ 1 Utility Bill/Mail----------------------------------- 2 Other------------------------------------------------- 3 Not Sure -------------------------------------------- 9 ASK EVERYONE 3. Next, I want to ask you some questions about storm drains. As you probably know, storm drains are the
gutters, pipes, and concrete channels that collect water from streets.
Now, when water goes into the storm drains in San Diego, does it go to a sewage treatment plant before it is released? Or is it released into creeks or the ocean without treatment? If you are not sure, just say so.
Is treated -------------------------------------------14% Is not treated--------------------------------------51 Not sure--------------------------------------------34 (DON'T READ) NA ----------------------------- 1

4. In fact, anything that goes into storm drains can end up in local creeks, rivers, or the ocean, without any filtering or treatment. Motor oil, leaves and grass, dirt, litter, and pesticides are all examples of pollution that goes into storm drains in San Diego. They end up untreated in our creeks, on our beaches, or in the ocean.
In the past year, did you make any changes in your behavior that were a direct result of seeing any
information about what polluted water in storm drains does to local creeks, the beaches, and the ocean? If you don't recall, just say so.
Yes (ASK Q.5) ------------------------------------26% No (SKIP TO Q.6) ------------------------------66 Don’t recall (SKIP TO Q.6) -------------------- 8 (DON’T READ) DK/NA (SKIP TO Q.6) 1 IF YES ON Q.4 ASK: 5. Can you very briefly describe that change you made in your behavior to prevent pollution? (ACCEPT
UP TO 2 RESPONSES – RECORD VERBATIM AND SUPERVISOR CODE) (n=206 respondents; 264 total responses)
Note percentages sum to more than 100% as multiple responses are allowed Conserve/use less water ----------------------------------------------------- 8% Take car to carwash/don't wash at home-------------------------------24 Pick up trash and litter ------------------------------------------------------23 More cautious (in general)--------------------------------------------------12 Recycling more ----------------------------------------------------------------11 Don't use or use less fertilizers/pesticides/chemicals---------------15 Wash car on the lawn or so water does not go in street -------------- 3 Clean gutters/streets/remove trash from street ----------------------- 2 Pick up after dog --------------------------------------------------------------- 2 Don’t pour oil into street/take used oil for proper disposal/
Fixed vehicle oil leak ---------------------------------------------------------14 Use less/don't use soap ------------------------------------------------------ 5 Keep leaves and grass from going in street or gutter ----------------- 2 Did not go in ocean/lake/creek-------------------------------------------- 0 Don't pour stuff in sink (grease, medications, etc)--------------------- 2 Maintain vehicle---------------------------------------------------------------- 1 Other ------------------------------------------------------------------------------ 6 Not sure -------------------------------------------------------------------------- 0 ASK EVERYONE 6. Earlier, I mentioned the slogan “Think Blue San Diego.” Think Blue is the City of San Diego’s program to
reduce pollution of the water in the city’s storm drains, creeks, beaches, and the ocean. Last year, that is in 2011, did you see or hear any of the following from the Think Blue program? (ROTATE)
YES NO DK/NA [ ] a. A TV commercial -------------------------------------------------------------------------------- 46% -----52%------- 2% [ ] b. The Think Blue website --------------------------------------------------------------------------5 --------95 --------- 0 [ ] c. A radio commercial ----------------------------------------------------------------------------- 27 --------71 --------- 2 [ ] d. A brochure from Think Blue------------------------------------------------------------------ 15 --------83 --------- 2

YES NO DK/NA [ ] e. A Think Blue booth or a sign at a local event -------------------------------------------- 14 --------84 --------- 2 [ ] f. An email from Think Blue-----------------------------------------------------------------------2 --------97 --------- 1 [ ] g. A stencil painted on sidewalks in front of storm drain openings ------------------- 42 --------58 --------- 1 7. Do you use Facebook? That is, do you have a Facebook page that you look at regularly? Yes (ASK Q.8) ------------------------------------46% No (SKIP TO Q.11) -----------------------------54 (DON’T READ) DK/NA (SKIP TO Q.11)0 IF YES ON Q.7 ASK: 8. Before this call, did you know that the Think Blue Program has a Facebook Page? (n=370) Yes---------------------------------------------------- 4% No --------------------------------------------------95 (DON’T READ) DK/NA ---------------------- 1 9. You said that you had a Facebook page in 2011. Let me ask you a couple of quick questions about that
and you can answer yes or no to each one. (n=370) YES NO DK/NA a. Did you see any information about the Think Blue program on Facebook in 2011? -4% -----96%------- 0% IF NO OR DK ON Q.9A SKIP TO Q.10, IF YES ON Q.9A CONTINUE TO Q.9B (n=13) b. Did you see anything about the Think Blue program on Facebook that was
shared by any of your friends in 2011?----------------------------------------------------- 50 --------50 --------- 0 IF NO OR DK ON Q.8 SKIP TO Q.10 (n=7) c. Did you visit the Think Blue page on Facebook in 2011? --------------------------------- 32 --------68 --------- 0 d. Did you join or like the Think Blue program in 2011? ------------------------------------- 41 --------59 --------- 0 IF YES ON Q.9D SKIP TO Q.11, ASK Q.10 IF NO OR DK ON Q.8 OR IF NO OR DK ON Q.9D
10. The Think Blue Facebook page provides information about pollution prevention and upcoming community events. How likely are you to join or like the Think Blue Facebook page in 2012 to see this information? (READ): (n=368)
Very likely-----------------------------------------18% Somewhat likely ---------------------------------29 Not too likely -------------------------------------20 Not likely at all -----------------------------------31 (DON’T READ) Already done so ----------- 0 (DON’T READ) Depends -------------------- 3 (DON’T READ) DK/NA --------------------- 0 ASK EVERYONE 11. OK, have you seen or heard any of the following from the Think Blue Program? (IF YES ASK): “Have
you seen or heard a great deal, some, or only a little?” (ROTATE)
YES GREAT YES YES DK/
DEAL SOME LITTLE NO NA [ ] a. About a hotline you can call to report people or businesses
that are causing pollution in storm drains --------------------- 5% ---------9% ---------9% -----76%------- 1% [ ] b. About pollution caused by dog waste -------------------------- 9 --------- 15---------- 13 --------63 --------- 1 [ ] c. About pollution caused by vehicles leaking oil--------------15 --------- 18---------- 15 --------52 --------- 1 [ ] d. About pollution caused by litter---------------------------------15 --------- 22---------- 15 --------48 --------- 0 [ ] e. About how to prepare for and prevent flooding during
rainstorms-------------------------------------------------------------- 7 --------- 14---------- 14 --------66 --------- 0

12. Now, how often do you see each of the following on the block where you live? Very often, often,
occasionally, rarely, or very rarely? (ROTATE) VERY VERY DK/
OFTEN OFTEN OCC. RARELY RARELY NA [ ] a. Litter------------------------------------------------- 6%------- 12% -----------28% ----------26% ------27%----- 1% [ ] b. Dog waste that is not picked up ------------- 11 --------- 12--------------25 ------------23 --------28 ------- 1 [ ] c. Motor oil that has leaked onto streets
or driveways--------------------------------------- 6 --------- 11--------------21 ------------30 --------30 ------- 4 [ ] d. Flooding during rain storms ------------------ 5 ----------- 8--------------20 ------------28 --------37 ------- 3 [ ] e. Sinkholes and big potholes in the streets
after rain storms --------------------------------- 11 --------- 13--------------20 ------------22 --------33 ------- 1 [ ] f. People washing their cars on the driveway
or in the street ------------------------------------- 5 --------- 11--------------28 ------------29 --------25 ------- 2 [ ] g. People washing or blowing yard waste
or litter from their sidewalk or driveway into the street -------------------------------------- 6 ----------- 9--------------21 ------------30 --------32 ------- 2
[ ] h. People using pesticides or weed killers on their lawns or gardens ---------------------- 3 ----------- 4--------------17 ------------28 --------38 ------10
13. On a scale of 1 to 10, how would you rate the job the city of San Diego is doing in each of the following?
(READ)? Use a 1 if you think it is doing a poor job, a 10 if you think it is doing an excellent job, or any number in between. (ROTATE)
POOR EXC DK MEAN [ ] a. Keeping polluted water out of storm
drains---------------------------------------5% -- 4% ----3% -- 6% --- 19% -- 8% - 11% 11% -- 4% -14%----15% 6.22 [ ] b. Preventing pollution of San Diego’s
ocean, bays, and beaches --------------3 ----- 2-------4 ----- 5------ 19----10 --- 14 -- 16 ----- 4----17 ------- 7 6.67 [ ] c. In keeping the streets in your
neighborhood clean when they do street sweeping --------------------------4 ----- 2-------2 ----- 4------ 11----- 5 --- 11 -- 17 --- 10----29 ------- 4 7.41
[ ] d. In preventing flooding from rain- storms --------------------------------------5 ----- 3-------4 ----- 5------ 17----- 8 --- 13 -- 15 ----- 4----18 ------- 9 6.53
[ ] e. In helping people learn how to prevent pollution in their daily activities at home------------------------4 ----- 5-------6 ----- 7------ 18----- 8 --- 11 -- 16 ----- 3----13 ------- 9 6.16
[ ] f. In enforcing laws against activities that pollute our storm drains and beaches -------------------------------4 ----- 4-------6 ----- 5------ 16----- 8 --- 10 -- 12 ----- 4----14 ------18 6.31
14. Next, please tell me if, in the past year, you saw any of the following in San Diego. You can answer yes or no to each one:
YES NO DK/NA [ ] a. City crews cleaning out storm drains or storm drain channels ---------------------- 47% -----51%------- 3% [ ] b. City crews responding to flooded streets or properties-------------------------------- 47 --------50 --------- 9 15. Did you know that the city of San Diego has a rebate program to encourage residents to install rain
barrels at their homes to capture rainfall? You can answer yes or no. YES NO DK/NA Rebate program ---------------------------------------------------------------------------------- 10% -----89%------- 1%

16. Now, I want to read you a brief list of items that may pollute water in storm drains in San Diego. Please rate each item on a scale of 1 to 10. Use a 1 if you think it is NOT a serious source of pollution, and a 10 if you think it is a VERY SERIOUS source of pollution of water in storm drains. Or you can use any number in between. (ROTATE)
NOT VERY SER DK MEAN [ ] a. Litter----------------------------------------5% -- 2% ----2% -- 4% --- 10% -- 8% - 11% 15% 11% -32%----- 1% 7.46 [ ] b. Motor oil-----------------------------------6 ----- 2-------2 ----- 2--------5----- 3 ---- 4 -- 10 ----- 9----58 ------- 1 8.34 [ ] c. Dog waste that is not picked up -----5 ----- 3-------6 ----- 6------ 14----- 9 --- 11 -- 12 ----- 6----29 ------- 1 6.91 [ ] d. Cigarette butts ---------------------------5 ----- 2-------4 ----- 3------ 12----- 8 ---- 8 -- 14 ----- 8----36 ------- 1 7.37 [ ] e. Leaves or grass clippings------------ 14 ----- 5----- 11 ----- 7------ 18----- 8 ---- 8 ----9 ----- 6----14 ------- 1 5.47 [ ] f. Washing down sidewalks or
driveways ------------------------------- 10 ----- 7-------6 ----- 7------ 18----11 ---- 8 -- 12 ----- 5----14 ------- 2 5.77 [ ] g. Runoff water from washing cars
in the driveway or street ------------ 10 ----- 4-------4 ----- 7------ 18----10 --- 10 -- 12 ----- 6----18 ------- 1 6.21 [ ] h. Pesticides and weed killers that people
use on their lawns or gardens -------5 ----- 2-------3 ----- 4--------8----- 5 ---- 5 -- 13 ----- 6----47 ------- 3 7.86 [ ] i. Food and drink that gets tossed
into the street -----------------------------6 ----- 4-------6 ----- 7------ 15----- 8 --- 10 -- 13 ----- 6----25 ------- 1 6.62 17. The City of San Diego’s Think Blue program has a hotline that can be used to report activities that may
be polluting our local beaches and storm drains, or to get information about how to prevent pollution. In 2011, did you call the Think Blue hotline?
Yes---------------------------------------------------- 2% No ---------------------------------------------------97 (DON'T READ) DK/NA----------------------- 1
18. The city’s Think Blue Program has a website. In 2011, did you look at the Think Blue website for any reason?
Yes---------------------------------------------------- 3% No ---------------------------------------------------96 (DON’T READ) ----------------------------------- 0
19. A separate city department, the Storm Water Department, also has a website. In 2011, did you look at the city of San Diego’s Storm Water Department website for any reason?
Yes---------------------------------------------------- 3% No ---------------------------------------------------97 (DON’T READ) ----------------------------------- 0

20. How likely would you be to use either of these websites for each of the following reasons? Very likely, somewhat likely, not too likely, or not likely at all? (ROTATE)
NOT NOT VERY S.W. TOO LIK DK
LIK LIK LIK AT ALL NA [ ] a. To get information about how to prevent pollution
of our beaches and oceans ------------------------------------20% ------- 33% ------- 19% -----27%------- 1% [ ] b. To report activities that might be polluting our beaches
and ocean----------------------------------------------------------24 --------- 35---------- 16 --------24 --------- 1 [ ] c. To learn about events where you can get information
about how to reduce pollution of our beaches and ocean----------------------------------------------------------15 --------- 31---------- 23 --------29 --------- 1
[ ] d. To find out about storm water-related improvement projects in your neighborhood-------------------------------17 --------- 31---------- 24 --------27 --------- 1
[ ] e. To request that the city repair or clean clogged storm drains and storm drain openings----------------------------26 --------- 32---------- 18 --------23 --------- 2
[ ] f. To learn about pollution prevention laws and regulations -------------------------------------------------------17 --------- 37---------- 19 --------27 --------- 1
21. Changing subjects, of the following, which one concerns you the most about pollution of our beaches
and ocean? (ROTATE)
[ ] A. That cleaning it up costs San Diego taxpayers a lot of money that could otherwise be used for services like police and fire protection--------------------------------------------------------------------------11%
OR [ ] B. That when our beaches get polluted, that drives away tourists and hurts San Diego’s economy,
costing the city jobs we need during this recession----------------------------------------------------------- 8 OR [ ] C. That it causes harm to marine life in the ocean like seals, dolphins, and whales --------------------31 OR [ ] D. That it causes harm and illness to people who swim at our local beaches-----------------------------24 (DON'T READ) None/other -------------------------------------------------------------------------------------------- 1 DON’T READ) All Equal------------------------------------------------------------------------------------------------25 (DON'T READ) DK/NA ------------------------------------------------------------------------------------------------- 1
• I HAVE JUST A FEW ADDITIONAL QUESTIONS FOR STATISTICAL PURPOSES ONLY
22. Are you of Hispanic or Latino origin or descent, or do you consider yourself Hispanic or Latino?
Yes---------------------------------------------------23% No ---------------------------------------------------76 Refused --------------------------------------------- 1

23. Would you describe your race as Black or African-American; Asian or Asian-American; White or Caucasian; Native American, mixed ethnicity, or something else? (IF RESPONSE IS “LATINO,” TRY AGAIN TO GET ONE OF THE RACE RESPONSES LISTED BELOW OR RECORD AS “OTHER”).
African-American -------------------------------- 6% Asian-American ---------------------------------13 Caucasian------------------------------------------64 Native American --------------------------------- 0 Mixed ethnicity ----------------------------------- 4 Other------------------------------------------------12 Refused --------------------------------------------- 2 24. Are any languages other than English spoken in your home on a daily basis?
Yes---------------------------------------------------33% No ---------------------------------------------------67 (DON’T READ) DK/NA---------------------- 1
IF YES ON Q.24 ASK: 25. What language is that? (ACCEPT MULTIPLE RESPONSES) (n=265 respondents; 280 total responses)
(DON’T READ) English ---------------------------------------------- 7% Spanish---------------------------------------------58 Chinese---------------------------------------------- 4 Korean----------------------------------------------- 2 Tagalog---------------------------------------------- 9 Vietnamese----------------------------------------- 8 Other (record) ------------------------------------16 No ---------------------------------------------------- 1 Refused --------------------------------------------- 1
ASK EVERYONE 26. Do you live in a single family home, a duplex or triplex, a townhouse, or an apartment or condominium?
Single family--------------------------------------60% Duplex/triplex ------------------------------------ 3 Townhouse)---------------------------------------- 5 Apartment/Condo) -----------------------------29 (DON'T READ) Other --------------------------- 1 (DON'T READ) DK/NA ----------------------- 1
27. How many years have you lived in the city of San Diego? 0-5 years -------------------------------------------13% 6-10 years ------------------------------------------16 11-19 years ----------------------------------------19 20-29 years ----------------------------------------22 30+ years-------------------------------------------28 Refused --------------------------------------------- 2 Mean------------------------------------------------22 years Median ---------------------------------------------20 years

28. What was the last level of school that you completed?
LESS THAN GRADE 12 -------------------------------------------------------11% HIGH SCHOOL GRADUATE -----------------------------------------------21 SOME COLLEGE, NO DEGREE---------------------------------------------20 ASSOCIATE DEGREE ---------------------------------------------------------12 BACHELOR DEGREE)-- BACHELOR’S DEGREE/COLLEGE GRAD 24 POST GRADUATE DEGREE/ PROFESSIONAL DEGREE ---------------------------------------------------12 REFUSED ---------------------------------------------------------------- 1
29. What is your age, please? 18-29 ------------------------------------------------27% 30-39 ------------------------------------------------20 40-49 ------------------------------------------------19 50-59 ------------------------------------------------15 60-64 ------------------------------------------------- 5 65-69 ------------------------------------------------- 4 70 or older -----------------------------------------10 (DON'T READ) REFUSED -------------------- 1
30. What is the zip code where you live?
31. Do you have one or more cell phones as well as this landline?
Yes (ASK Q.32) -----------------------------------78% No (TERMINATE) ------------------------------21 (DON’T READ) DK/NA (TERMINATE)-- 0
IF YES ON Q.31 ASK: (n=324) 32. Do you get personal phone calls on a cell phone when you are at home, or is your cell phone used only
for business calls?
• Yes, get personal calls on cell----------------------------------------------------------------------------------------88% • Cell used only for business ------------------------------------------------------------------------------------------- 8 • (DON’T READ) USE IT ONLY FOR EMERGENCIES-------------------------------------------------------- 3 • (DON’T READ) DON’T USE IT ----------------------------------------------------------------------------------- 1 • (DON’T READ) DK/NA --------------------------------------------------------------------------------------------- 1
IF PUNCH 3 OR 4 ON Q.32 ASK: (n=11) 33. If I had called you on that cell phone number, would you have answered it? Yes---------------------------------------------------31% No ---------------------------------------------------63 (DON’T READ) DK/NA----------------------- 7
•
My supervisor may be calling you to confirm that this interview took place. May I have your first name so she can call and ask for you?

• • •
• Name • • Telephone #
That's all the questions I have. Thank you very much for participating in the survey. CALCULATE AND RECORD INTERVIEW LENGTH. RECORD GENDER ON THE FIRST PAGE. I AFFIRM THAT THE ABOVE INFORMATION IS ACCURATELY RECORDED FROM THE RESPONDENT'S STATEMENTS.
• • •
• Interviewer's Signature • • Date
English ---------------------------------------------96% Spanish---------------------------------------------- 4
Wireless sample----------------------------------49% Land line sample --------------------------------51