2012/13 uefa financial report
TRANSCRIPT
Financial Report 2012/13
XXXVIII Ordinary UEFA Congress
Astana, 27 March 2014

I. FACts And FIgUREs 1 Foreword 2 Highlights of the 2012/13 financial year 3 A financial strategy to reflect UEFA’s
core values 4 Income statement 6 source of income 8 Use of income 10 governing expenses 11 solidarity 12 the flow of UEFA solidarity payments 14 Balance sheet 16 Own resources
17 the four-year cycle 18 Result by competition and activity 20 UEFA Champions League 24 UEFA Europa League
II. AnnEX • Financial statements as at 30 June 2013
• Reports of the statutory auditors
tABLE OF COntEnts
© Getty Images – Cover photo: © AFP/Getty Images/PA/PA-Empics/Presse Sports/UEFA

1
Financial Report 2012/13
UEFA’s footballing season witnessed some remarkable events and developments on and off the pitch and will not just go into the history books as a bridging season between the wonderfully successful UEFA EURO 2012 and the FIFA World Cup to be played in Brazil in 2014.
On the pitch, the ball started rolling in the new 2012–15 cycles of UEFA’s club competitions, during which many truly spectacular matches were played at venues all over Europe, culminating in two unforgettable finals in stadiums of great prestige: at the AmsterdamArenA where, after winning the UEFA Champions League the year before, Chelsea FC again lifted a cup – this time, the UEFA Europa League trophy, having narrowly beaten silver medallists SL Benfica in a dramatic final. The UEFA Champions League final, played at Wembley Stadium to provide a climax to The Football Association’s 150-year jubilee, featured another club which had also reached the final the previous season. On this occasion, FC Bayern München donned the European crown by beating their Bundesliga colleagues and rivals Borussia Dortmund in a very attractive match.
But there were other notable moments in a memorable season, with Spain and Italy providing a magnificent finale to the UEFA European Under-21 Championship final tournament staged in conjunction with the Israel Football Association and the Swedish hosts of the UEFA Women’s EURO 2013 organising a tournament which proved to be record-breaking in all respects – not only in the stadiums but also in terms of the public response to fan zones in the host cities and to the spectacular games which entertained massive television audiences.
This might seem a strange way to introduce a financial report – but UEFA’s uncompromising conviction is that the financial welfare of
European football is dependent on our ability to build stages on which the artists can express their talents to the full and offer entertainment and emotions to all those who love the game. I might be accused of being repetitive, but our stance is simply immovable and unequivocal. UEFA is fully committed to highlighting and promoting the social values of the game we love – and any financial benefits derived from elite competitions are distributed with this clear objective in mind.
I would like to congratulate everyone involved, not least the UEFA Finance Committee and its current chairman, Marios N. Lefkaritis, for the excellent work achieved. I would also ask readers of this report to discover not only the impressive results of the 2012/13 financial year but also to see how funds are being distributed on the basis of solidarity and a firm commitment to reinvesting in the future of the game and society as a whole, with an enormous variety of projects receiving support via our Respect campaigns. I would also like to stress that UEFA’s financial philosophy is not restricted to its own well-being. UEFA’s financial fair play initiative offers a clear indication of concern for the financial welfare of the entire European footballing family – and one of the notable statistics to emerge from the 2012/13 season was that club losses, which had been steadily rising, were cut by 36 %. UEFA’s recently published benchmarking report provides data which could be read in conjunction with this financial report with a view to painting a broader picture of the financial state of European football as a whole and the efforts which still need to be made if we are to build the future of our game on solid financial foundations.
Michel Platini UEFA President
FOREwORd

2
Key figures
€ m 2012/13 2011/12
Revenue 1 698.9 2 795.7
Distributed as solidarity payments - 159.8 - 642.3
Distribution to participating teams - 1 208.7 - 1 202.4
Distribution to UCL winner: FC Bayern München (12/13) / Chelsea FC (11/12) - 56.6 - 62.9
Distribution to UEL winner: Chelsea FC (12/13) / Club Atlético de Madrid (11/12) - 11.0 - 11.1
Operating result before solidarity payments 123.2 736.5
Net result for the period - 21.4 128.8
Number of matches played 1 823 1 868
Number of employees 411.0 516.3
– thereof employees with open-ended contracts 377.5 368.6
HIgHLIgHts OF tHE 2012/13 FInAnCIAL yEAR
Planet football turns in cycles and, as is usually the case in the season following a European Football Championship final round, the 2012/13 financial year presented a lower profile not only in sporting but also in purely financial terms. Having said that, it is nonetheless worthwhile to note that many EURO 2012-related financial transactions were concluded in the aftermath of the final match played in Kyiv – a fact which helps to explain the reasons why UEFA’s balance sheet total, and financial assets in particular, decreased over the reporting period.
2012/13 was the first season of UEFA’s 2012–15 club competition cycle, for which, once again, UEFA was able to achieve a very impressive increase in total income, in particular for the UEFA Champions League. This can be seen on the relevant pages within this report. This opened the door, for the first time, to the provision of a cross subsidy of €50 million in favour of the UEFA Europa League.
UEFA’s two competitions staged over two seasons came to an end in the final days of the financial year under review or in the first days of the following one: the final tournament of the UEFA European Under-21 Championship in Israel (5–18 June); and the UEFA Women’s EURO in Sweden (10–28 July). The financial impact of the second of the two obviously had to be allocated to the 2013/14 financial year.
Off the pitch, developments with an important financial impact included the following:
• The 2012/13 season was the first in which UEFA assumed full charge of activities at all club competition venues, a significant part of which had formerly been handled by UEFA’s agency TEAM Marketing AG. This new set-up created synergies which also generated benefits in financial terms. UEFA’s cost structure obviously changed as a consequence – with the
additional in-sourcing entailing a higher staff total and, evidently, higher personnel expenses on one side, but with lower event expenses on the other, given that UEFA’s agency costs decreased.
• Financial markets were more stable and predictable than in the previous year. Huge amounts of liquidity had been made available by central banks at nearly no cost to their commercial banks, meaning that the latter had no need to offer attractive rates to their customers. UEFA, like other investors, suffered considerably from this constellation and the interest rates moved constantly in one direction, registering one decrease after another. This continuous subtraction process led to a low financial result for the 2012/13 financial year.
Turning the focus to issues of a more internal nature and, more precisely, to the UEFA administration and the finance division, the advantages of UEFA’s enterprise resource planning (ERP) software, successfully introduced the previous year, were confirmed. 2012/13 was the first year over which all transactions were dealt with via this ERP system. This allowed more detailed figures and analyses to be at hand. During 2012/13, a treasury risk management (TRM) tool was introduced. This software fully meets UEFA’s requirements for daily cash and asset management accounting and represents a big step forward as far as risk monitoring, reporting and planning of cash inflows and outflows is concerned. UEFA’s forex transactions are now conducted via an electronic platform. Whenever a currency conversion is due, execution is automatically channelled through the bank offering the best rate. The business planning and consolidation (BPC) module was another tool to be successfully introduced. It enables an integrated process of budgeting and forecasting by automatically involving all budget holders and their superiors.
3
Financial Report 2012/13
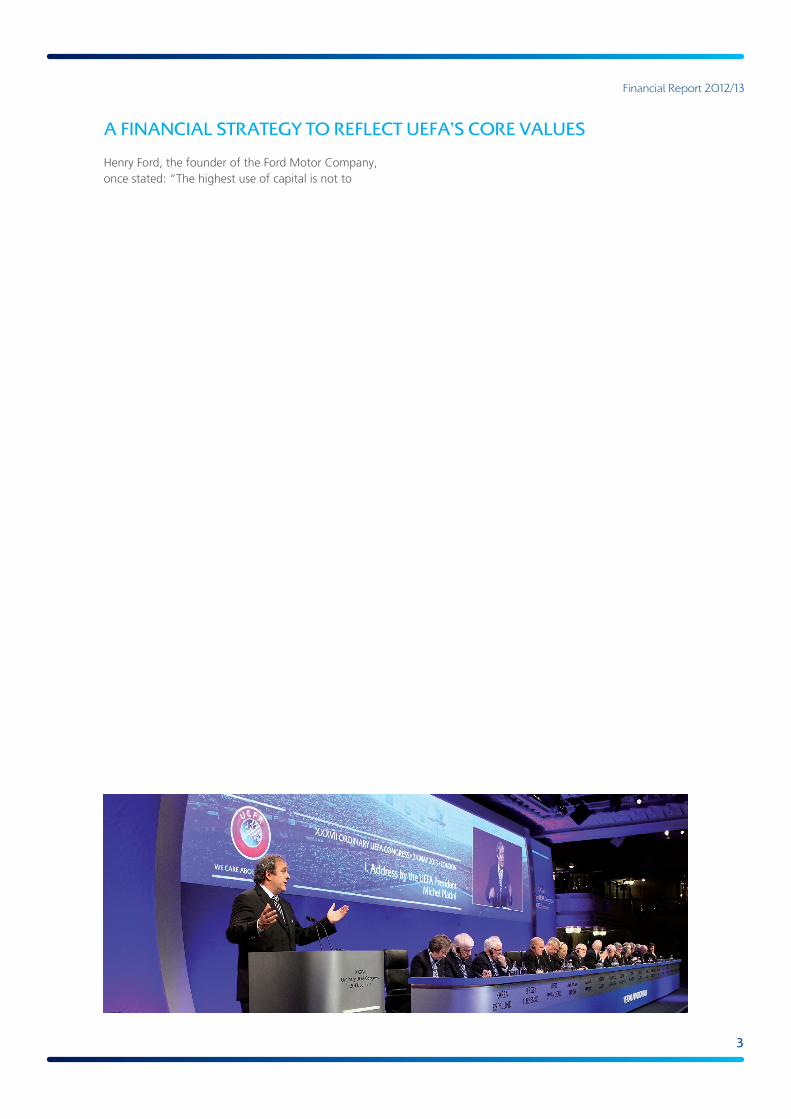
A FInAnCIAL stRAtEgy tO REFLECt UEFA’s CORE VALUEs
Henry Ford, the founder of the Ford Motor Company, once stated: “The highest use of capital is not to make more money, but to make money do more for the betterment of life.” The sentiment fits so nicely into UEFA’s operational philosophy that we might be forgiven for taking the liberty of expropriating a slightly adjusted version: “The highest use of capital is to make money do more for the betterment of football.”
In point of fact, Ford could have supplied several of the components that add up to UEFA’s philosophy. “A business that makes nothing but money,” he insisted, “is a poor business.” And, even more pertinently in terms of managing a football family, he maintained: “Coming together is a beginning; keeping together is progress; working together is success.” One of UEFA’s roles is to encourage its member associations to work together in the pursuit of a series of core values built on the premise of putting football first and, as a not-for-profit organisation, to use income in ways which, sticking to this philosophy, will do more for the betterment of football and, in consequence, the betterment of the social values attached to the game, right from the grassroots levels to the role-model pinnacles of the professional game. UEFA’s commitments therefore remain steadfastly unchanged.
UEFA is committed to strengthening solidarity, to protecting the future of the game and to maximising the benefits that football can offer society as a whole. UEFA’s finances therefore need to reflect and highlight the concept of solidarity.
UEFA is committed to good governance and to the promotion of good governance throughout its member associations. Leadership in this sphere implies responsibilities and duties. UEFA’s finances must therefore aim to demonstrate that good governance begins at home.
UEFA is committed to maintaining and enhancing the balance between national team and club football as complementary elements within the game. The distribution of financial resources therefore needs to achieve an equitable balance between the two.
UEFA is committed to safeguarding sporting integrity and preserving the true spirit of the game while running its competitions in an efficient way and to optimising revenues from commercial contracts to benefit and develop European football. The financial results offer an indication as to whether sporting and business criteria have been successfully married and whether these objectives have been achieved.
UEFA is committed to promoting fair play both on and off the pitch. Financial fair play is high on the agenda and, if UEFA is to lead European football in the right direction and provide top-class administrative support, UEFA’s economic status must be an illustration of financial fair play in terms of responsibility, fairness and transparency.
These principles need to be attached to all existing and future projects. During the year under review, for example, UEFA, acting on a clear mandate received from its member associations at the UEFA Congress of 2011, designed all the organisational and structural requirements to successfully deal with centralised sales of broadcasting and sponsorship rights for European national team qualifying matches. The project is, of course, being conducted along lines which Henry Ford would surely have endorsed: any financial benefits will be money to invest in doing even more for the betterment of football. This financial report on the 2012/13 season sets out to provide the reader with transparent indications about where income has come from and how it is being used for the betterment of the game.
© Getty Images

4
UEFA’s total revenue for 2012/13 reached the € 1.7 billion mark, which is obviously much lower than the € 2.8 billion grand total of the previous financial year but an impressive 21% higher than the € 1.4 billion total achieved in 2011/12 if UEFA EURO 2012 is excluded. Therefore, in order to make a meaningful comparison of the two financial years, a separate column (*2011/12) has been inserted, disclosing the 2011/12 financial statements after exclusion of all UEFA EURO 2012 transactions and all HatTrick-related accruals.
The 2012/13 financial year was the first of the 2012-15 three-year club competition contractual cycle. The higher rights revenue compared with the previous cycle is impressive, showing an increase of almost € 260 million, despite challenging market situations. This confirms the steadily growing worldwide success of UEFA’s club competitions, as shown in the chart above.
Tickets and hospitality have also contributed to this increase in club competition revenue, as a result of higher stadium seating capacities at the club competition finals and the gross revenue principle applied to ticket revenue as from this season, along with UEFA’s higher involvement in the organisation of these events.
It should be noted that the total revenue for 2012/13 includes € 1.73 million related to UEFA EURO 2012, which is a marginal amount considering the tight deadlines arising from the tournament being played right at the end of the 2011/12 financial year. Last but not least, the UEFA European Under-21 Championship final tournament played in June 2013 in Israel accounts for around € 7 million of the total revenue. More detailed information on the breakdown by nature and by competition is given under “Source of income” on pages 6 and 7.
A remarkable amount of just over € 1.2 billion was distributed this year to clubs and associations. This is a direct result of the 2012-15 three-year club competition contractual cycle, with higher rights revenue from broadcasters and commercial partners automatically meaning more of the income being distributed to participating clubs. A detailed breakdown by competition and club can be found
total revenue :
EURO
Club competitions and other revenue
2005/06 2006/07 2007/08 2008/09 2009/10 2010/11 2011/12 2012/13
647.7 895.5 886.1 1,309.8 1,384.1 1,404.8900.4 1,697.2
2,795.7
1,350.9
2,237.0
1,390.9
¤m
1,698.9
1.7
InCOmE stAtEmEnt
© Getty Images

5
Financial Report 2012/13
within the different competition sections of this report. Total event expenses, meanwhile, represent the cost of staging competitions, conferences and events. This total depends heavily on the extent of UEFA’s involvement in organising such competitions and events.
The higher net revenue after distribution and the lower event expenses have a direct positive impact on the operating result before solidarity payments. Solidarity payments have increased from € 144.7 million to € 159.8 million. This again reflects the principle that higher revenue not only means higher income for participating clubs, but also an increase in solidarity payments to other stakeholders in general.
The € 56.3 million higher operational result does not, unfortunately, improve the bottom line result to the same extent. This can be explained by the above-mentioned higher solidarity payments and by a significant downslide in financial income, with the situation on the financial markets continuing to be difficult and interest rates dropping to almost zero. At the same time, UEFA had lower financial assets at its disposal, following major cash outflows for HatTrick and payments related to UEFA EURO 2012 falling due in 2012/13.
In conclusion, thanks to higher overall revenue and despite the disappointing asset management performance, the audited 2012/13 negative net result of € 21.4 million is much better than the minus € 62.0 million in the budget approved by the 2012 UEFA Congress in Istanbul.
€ m 2012/13 *2011/12 2011/12
Total revenue 1 698.9 1 404.8 2 795.7
Distribution to participating teams - 1 208.7 - 1 006.4 - 1 202.4
Contributions to associations - 36.2 - 20.9 - 50.3
Event expenses - 117.3 - 146.2 - 453.7
Referees and match officers - 29.2 - 32.2 - 33.9
Information and communications technology - 47.8 - 42.7 - 114.2
Employee salaries and benefits - 59.8 - 55.3 - 117.7
Depreciation and amortisation - 7.9 - 1.3 - 1.4
Other expenses - 68.8 - 32.9 - 85.6
Total expenses - 1 575.7 - 1 337.9 - 2 059.2
Operating result before solidarity payments 123.2 66.9 736.5
Solidarity payments - 159.8 - 144.7 - 642.3
Financial items and taxes 15.2 34.6 34.6
Net result for the period - 21.4 - 43.2 128.8
Financial items &
taxes
net resultsolidarity payments
Operating result before
solidarity
ExpensesdistributionRevenue
¤m 1,698.9 1,208.7
123.2 15.2 21.4
367.0
159.8
* 2011/12: column without UEFA EURO 2012 and HatTrick transactions

6
sOURCE OF InCOmE
It is worthwhile analysing UEFA’s total source of income from two perspectives: by nature as well as by competition and other income. In addition to the standard items that make up total revenue in the consolidated income statement, the source of income analysed on this page also comprises the asset management result, bringing the total for 2012/13 to over € 1.7 billion.
Without the € 238.1 million in EURO 2012 ticket and hospitality revenue recognised last year, the split of income by nature compared with the total source of income is similar to previous years. Broadcasting rights still represent the lion’s share at 77% (68 % in 2011/12), while commercial rights account for 18% (21 % in 2011/12).
Lower average financial assets available for investments compared with the previous financial period, combined with the low interest rates offered on the financial markets, explain the low asset management result of € 16.5 million in 2012/13. It is interesting to note that the net impact of currency exchange differences has been negligible over the last two financial years, due mainly to very similar
Revenue and income by nature
€ m 2012/13 *2011/12 2011/12
Broadcasting rights 1 325.1 1 099.1 1 936.3
Commercial rights 313.2 279.5 593.4
Tickets and hospitality 39.1 13.0 251.1
Other revenue 21.5 13.2 14.9
Total revenue 1 698.9 1 404.8 2 795.7
Asset management 16.5 40.8 40.8
Source of income 1 715.4 1 445.6 2 836.5
Broadcasting rights
Commercial rights
tickets and hospitality
Other revenue
Asset management
2.3 %
77.2 %18.2%
1.3 %1.0 %
* 2011/12: column without UEFA EURO 2012 and HatTrick transactions
© Getty Images

7
Financial Report 2012/13
average exchange rates of the euro with the main foreign currencies UEFA deals in (Swiss francs, British pounds and US dollars).
The chart and table below illustrate UEFA’s source of income by competition and other income. In this first season of the 2012-15 club competition contractual cycle, the share of the UEFA Champions League increases to 83% of UEFA’s total source of
income, as a consequence of its revenue having increased more (+22%) than for the UEFA Europa League (+10%).
Other competitions and revenue increase from € 19.8 to € 31.1 million, due mainly to the UEFA European Under-21 Championship final tournament (played every second year) and to higher other football-related revenue such as fines.
Revenue by competition and other income
€ m 2012/13 *2011/12 2011/12
UEFA EURO 1.7 0.0 1 390.9
European Qualifiers 0.0 0.0 0.0
UEFA Champions League 1 424.1 1 165.4 1 165.4
UEFA Europa League 242.0 219.6 219.6
Total revenue 1 667.8 1 385.0 2 775.9
Other competitions and revenue 31.1 19.8 19.8
Asset management 16.5 40.8 40.8
Source of income 1 715.4 1 445.6 2 836.5
UEFA EURO
UEFA Champions League
UEFA Europa League
Other income
83.0 %14.1 %
2.8 % 0.1 %
* 2011/12: column without UEFA EURO 2012 and HatTrick transactions
© Getty Images

8
UsE OF InCOmE
It is UEFA’s responsibility and obligation to use income as efficiently and fairly as possible. By far the most important share (€ 1.2 billion or 70.5 % in relative figures) was distributed to the teams participating in UEFA’s competitions. Despite last year’s distribution to the UEFA EURO 2012 participating associations, the figure is almost identical this year thanks to the higher club competition rights revenue and, consequently, higher amounts distributed to the participating clubs. Full details can be found on the following pages, which disclose the competition results for the UEFA Champions League and the UEFA Europa League.
The € 225.0 million spent on organisational costs for UEFA’s main competitions is lower than last year, given that the total EURO 2012 tournament cost was recognised in the previous financial year. Event-related costs improved through, for example, lower commission payments, but the overall total is higher due to additional enhancement into the product such as LED boards.
UEFA is investing more than € 30 million annually in the organisation of Women’s and age-limit competitions or the biennial UEFA Region's Cup.
A major part of this includes contributions to the organisation of mini-tournaments in favour of member associations. The overall investment in other competitions will increase in the future not only due to the fact that the UEFA Youth League will join the ranks in 2013/14, but also thanks to increased financial support from UEFA.
The third highest position relates to solidarity payments. The total of € 159.8 million is significantly lower than last year, when € 428 million was set aside to finance around 75 % of the third cycle of the HatTrick programme (2012/13-2015/16) in favour of UEFA’s member associations. However, solidarity payments in favour of clubs increased in line with the higher revenue recorded for the first year of the new cycle.
Finally, UEFA’s governing expenses amounted to € 78.1 million. These refer to all expenses not attributed directly to a competition or to projects, and are grouped as administrative overheads and institutional expenses. Of course, both also contribute to the success of UEFA’s competitions and events.
© Sportsfile

9
Financial Report 2012/13
€ m 2012/13 in % *2011/12 2011/12
Distribution to participating teams - 1 208.7 70.4 % - 1 006.4 - 1 202.4
Solidarity payments - 159.8 9.3 % - 144.7 - 642.3
Organisation: main competitions - 225.0 13.1 % - 193.5 - 718.8
Organisation: other competitions - 34.3 2.0 % - 32.2 - 32.2
Football development and education - 26.0 1.5 % - 26.6 - 26.6
Events and conferences - 4.9 0.3 % - 3.9 - 3.9
Governing expenses - 78.1 4.6 % - 81.5 - 81.5
Net financing to (-) / from reserves (+) 21.4 - 1.2 % 43.2 - 128.8
Use of income - 1 715.4 100.0 % - 1 445.6 - 2 836.5
net financing
total distribution solidarity payments
Organisation development and
education
Events and conferences
governing expenses
¤m
* 2011/12: column without UEFA EURO 2012 and HatTrick transactions
© Sportsfile
1,715.4 1,208.7
159.8
259.3
26.04.9 78.1
21.4

10
gOVERnIng EXPEnsEs
Expenses related to the running of UEFA as a governing body are classified under two headings:
• Administrative overheads : these include personnel and other general administrative costs, such as travel and office running costs, which are not directly allocated to a competition or activity. Essentially, these costs comprise the operating expenses for the management of all divisions and for legal, finance and human resources. The weak euro continued to have an impact on overall expenses in 2012/13, given that most administrative overheads (salaries and social charges, travel and office running expenses, etc.) are paid in Swiss francs and posted in euros. The total decreased by 4%, due mainly to a lower number of employees and reduced ICT costs.
• Institutional : this heading shows the costs of the Executive Committee, the organisation of the UEFA Congress, disciplinary proceedings, club
licensing and financial fair play, and other institutional-related matters such as committees and expert panels. Overall expenditure remained similar to 2011/12, despite a higher number of committee meetings during the period under review.
UEFA is committed to keeping governing expenses as low as possible in order to allow maximum resources to be allocated to solidarity payments, football development and to the teams participating in its competitions. The percentage of governing expenses in relation to total average revenue is closely monitored and UEFA’s objective is to remain below the 5 % mark. Clearly, the increase in revenue is helping to achieve this goal but, in any case, UEFA plans to keep increases in its governing expenses as an absolute figure to a strict minimum.
The table below shows governing expenses for the last three seasons, with annual governing expenses and average total revenue over four years set against each other. This offers the best basis for comparison, bearing in mind that such comparisons would otherwise be distorted by a EURO every fourth year.
€ m 2012/13 2011/12 2010/11
Administrative overheads - 46.6 - 49.8 - 48.8
Institutional - 31.5 - 31.7 - 26.6
Governing expenses - 78.1 - 81.5 - 75.4
Total average revenue over four years 1 797.1 1 597.5 1 457.8
as % of total average revenue 4.3 % 5.1 % 5.2 %
© Sportsfile
11
Financial Report 2012/13
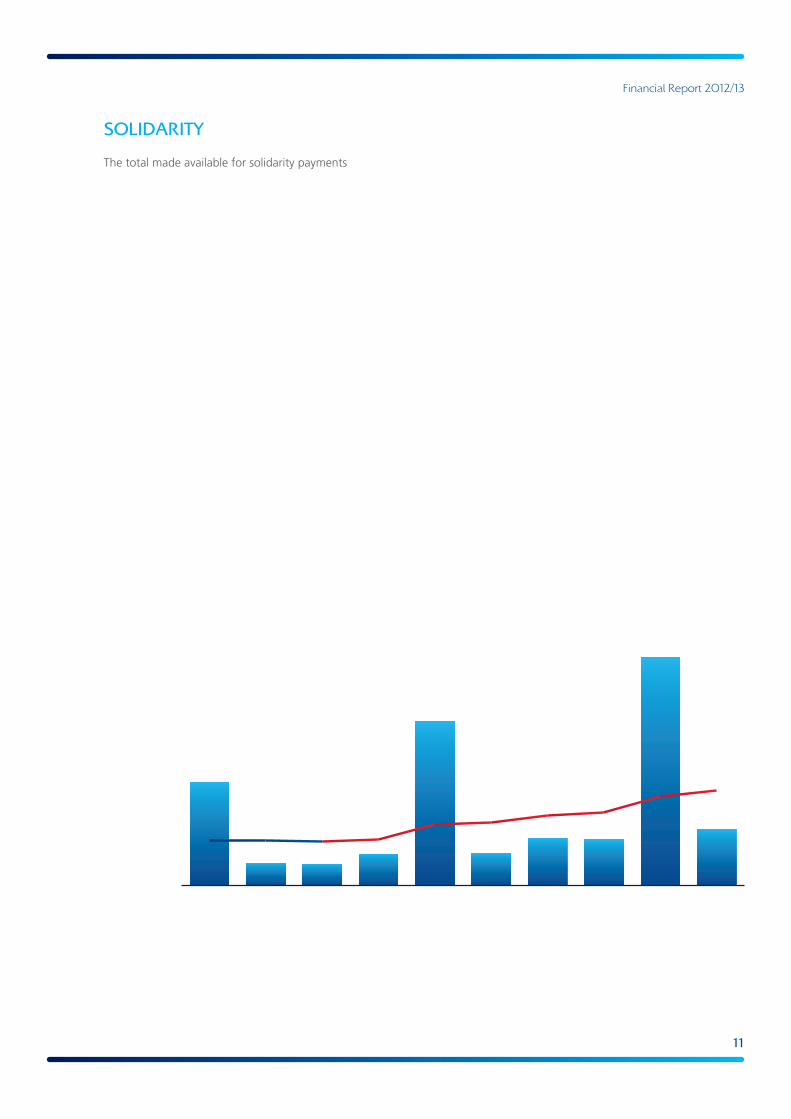
sOLIdARIty
The total made available for solidarity payments is the second largest position after the amount distributed to participating teams, as shown in the income statement on page 5. But, more importantly, solidarity payments are a cornerstone in UEFA’s philosophy. Thanks to the concept of central marketing and, of course, the ever increasing popularity of UEFA’s flagship competitions, it is possible for UEFA, as a governing body, to generate substantial revenue. It is UEFA’s main objective to plough back as much as possible of these resources into European football, not only via payments to participating teams and member associations, but also to those which may not have qualified to take part in UEFA’s revenue-generating competitions.
This has a two-fold objective, given that reducing financial gaps has the additional benefit of reducing sporting gaps and opening up the elite competitions to a maximum number of associations and teams. Meanwhile, sharing resources boosts the development of the European game at grassroots and youth levels, again in associations and clubs. Above all, the solidarity concept is an unwritten mutual contract aimed at developing the European football family as a whole and promoting the social values of the game.
Solidarity payments are made available to :
• member associations to develop their infrastructure;
• member associations to contribute to their current running costs;
• member associations as incentive payments for participating in non-top competitions and for other football-related initiatives;
• clubs eliminated in the preliminary stages of the UEFA Champions League and UEFA Europa League;
• other top-division clubs that do not qualify for UEFA's main competitions, with payments distributed by the leagues or associations for youth development;
• clubs participating in the success of national team football in general and the UEFA EURO in particular through the participation of some of their players.
The chart below shows the amounts made available to member associations and clubs and debited to UEFA’s accounts on an annual basis. The actual payments in favour of member associations and clubs are not necessarily made within the same financial year because authorisation to release these solidarity payments is linked to strict administrative processes. Payments under the HatTrick investment programme, for instance, need the approval of the HatTrick Committee. A detailed table showing all actual payments made to member associations during 2012/13 can be found on page 13.
trend (four-year average)
solidarity
¤m
€ m 2003/04 2004/05 2005/06 2006/07 2007/08 2008/09 2009/10 2010/11 2011/12 2012/13
Member associations 238.1 10.1 10.0 18.6 342.6 18.5 26.5 20.5 428.2 25.3
Clubs 49.0 48.1 48.1 68.2 113.4 69.2 102.2 104.7 207.2 129.8
Donations 4.9 6.0 3.3 3.4 5.4 4.4 5.9 4.9 6.9 4.7
Solidarity 292.0 64.2 61.4 90.2 461.4 92.1 134.6 130.1 642.3 159.8
292.0 64.2 61.4 90.2 461.4 92.1 134.6 130.1 642.3 159.8

12
tHE FLOw OF UEFA sOLIdARIty PAymEnts
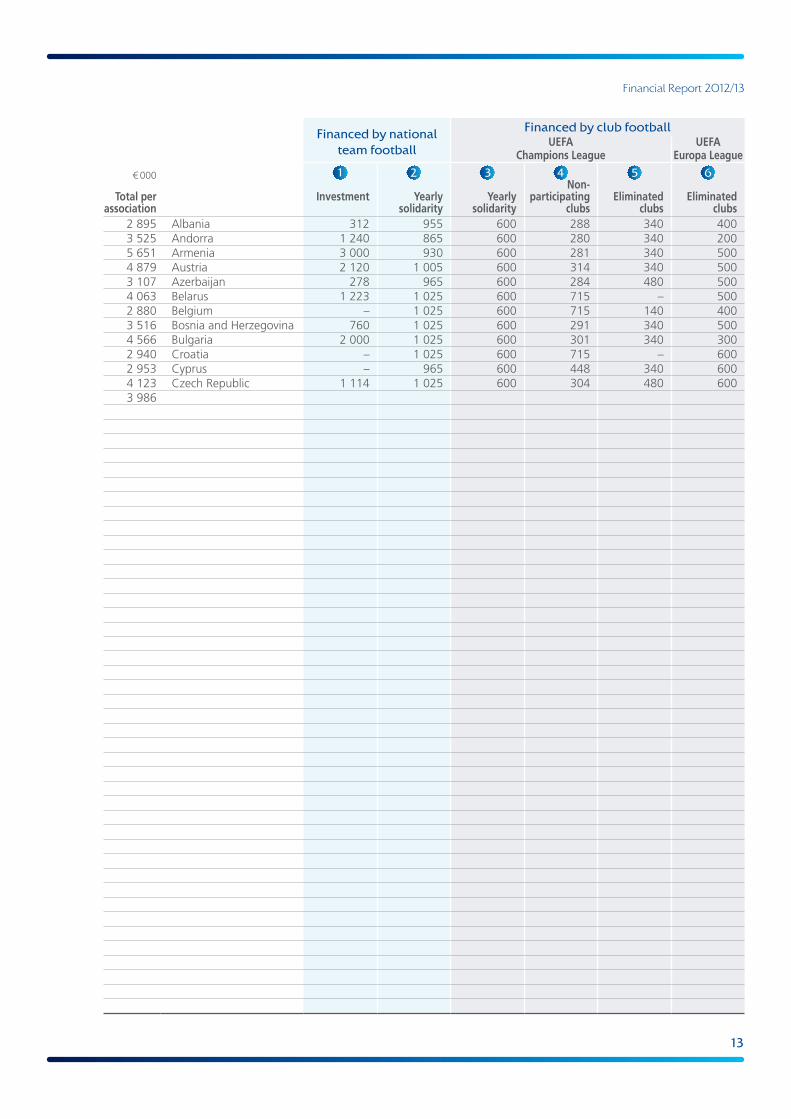
The previous pages of this report have focused on the sources of the revenue used for UEFA’s solidarity payments. However, it is also important to provide a transparent overview of all the payments. The various beneficiaries are disclosed in the table on the facing page.
When interpreting this information, account needs to be taken of the fact that a portion of solidarity payments stem from revenue generated by club competitions and that this part therefore mainly benefits club football. The other part, financed by national team football and derived from EUROs, is, to a large extent, made available to member associations within the framework of the HatTrick
programme. However, the football family is not divided into two separate parts but is an integrated, inter-related whole. As in any real family, solidarity within European football is based on mutual values – which means that earnings are channelled into club and national team football. Inter-relationships can be illustrated by the fact that when a EURO takes place every four years, a significant portion of the revenue goes to the clubs which participate in the success of the tournament and national team football in general. Likewise, as the table on the facing page shows, a proportion of the annual income generated by club football benefits member associations.
solidarity payments financed by national team football
1 The HatTrick programme for the 2012/13-2015/16 four-year cycle provides for a one-off € 3.0 million solidarity payment per member association to be used for investments in football infrastructure. The amounts distributed during the 2012/13 financial year are disclosed in this section. In some cases, these might include payments from previous HatTrick cycles and, therefore, the total amount paid in 2012/13 exceeds the € 3.0 million.
2 The HatTrick programme also provides for yearly solidarity payments in favour of member associations, consisting of the following elements :
• € 600,000 as a yearly solidarity payment to contribute to current running costs
• € 1,025,000 as a maximum annual incentive payment, divided up as follows :
– € 250,000 max. for participating in UEFA youth, women’s and futsal competitions
– € 250,000 max. for implementing and applying the UEFA club licensing system
– € 100,000 max. for implementing and applying the UEFA Coaching Convention
– € 100,000 max. for implementing and applying the UEFA Grassroots Charter
– € 100,000 max. for implementing and applying the UEFA Referee Convention
– € 100,000 max. for implementing the UEFA women’s football development programme
– € 100,000 max. for implementing the UEFA good governance programme
– € 25,000 max. for appointing an integrity officer
solidarity payments financed by club football
3 € 31.8 million was channelled from the UEFA Champions League to member associations to finance a share of the HatTrick yearly solidarity payments.
The total solidarity payment in 2012/13 in favour of a member association is therefore the sum of columns 2 and 3. The maximum amount available is € 1.625 million.
4 A substantial amount was made available to clubs not involved in either of the two main UEFA club competitions for youth development. As decided by the relevant leagues and/or member associations, clubs in the domestic top division and, in some cases, the next division down were included in this scheme.
5 A lump sum, depending on the number of matches played, was paid to clubs which were in the qualifiers but failed to reach the group stage of the UEFA Champions League, with an additional € 200,000 for a domestic champion. No payments were made to clubs involved in UEFA Champions League qualifying rounds which succeeded in reaching the group stage.
6 The formula described in point 5 above was also applied to the UEFA Europa League.
13
Financial Report 2012/13
Financed by national team football
Financed by club footballUEFA
Champions LeagueUEFA
Europa League
€ 000 1 2 3 4 5 6
Total per association
Investment Yearly solidarity
Yearly solidarity
Non- participating
clubsEliminated
clubsEliminated
clubs 2 895 Albania 312 955 600 288 340 400 3 525 Andorra 1 240 865 600 280 340 200 5 651 Armenia 3 000 930 600 281 340 500 4 879 Austria 2 120 1 005 600 314 340 500 3 107 Azerbaijan 278 965 600 284 480 500 4 063 Belarus 1 223 1 025 600 715 – 500 2 880 Belgium – 1 025 600 715 140 400 3 516 Bosnia and Herzegovina 760 1 025 600 291 340 500 4 566 Bulgaria 2 000 1 025 600 301 340 300 2 940 Croatia – 1 025 600 715 – 600 2 953 Cyprus – 965 600 448 340 600 4 123 Czech Republic 1 114 1 025 600 304 480 600 3 986 Denmark – 1 025 600 1 961 – 400
13 353 England – 985 600 11 668 – 100 5 445 Estonia 2 800 1 025 600 280 340 400 6 261 Faroe Islands 3 796 945 600 280 340 300 4 516 Finland 1 220 1 025 600 291 480 900
11 330 France – 1 025 600 9 605 – 100 4 182 FYROM 1 333 1 025 600 284 340 600 3 288 Georgia 500 965 600 283 340 600
10 250 Germany – 1 005 600 8 545 – 100 450 Gibraltar – 450 – – – –
7 340 Greece 3 199 1 025 600 2 016 – 500 4 369 Hungary 1 350 1 025 600 314 480 600 4 708 Iceland 2 000 985 600 283 340 500 3 912 Israel 1 200 1 025 600 447 340 300
15 154 Italy 260 1 025 600 13 169 – 100 2 848 Kazakhstan – 1 025 600 283 340 600 3 411 Latvia 765 1 025 600 281 340 400 1 810 Liechtenstein – 830 600 280 – 100 4 088 Lithuania 1 200 1 025 600 283 480 500 3 049 Luxembourg 159 890 600 280 620 500 3 624 Malta 1 000 955 600 289 480 300 4 660 Moldova 1 700 1 000 600 280 480 600 3 131 Montenegro 256 950 600 285 340 700 4 239 Netherlands – 1 025 600 1 574 140 900 4 295 Northern Ireland 1 550 985 600 280 480 400 3 506 Norway – 1 025 600 501 480 900 4 198 Poland 802 985 600 431 480 900 5 332 Portugal 2 368 990 600 1 274 – 100 2 662 Republic of Ireland – 1 005 600 317 340 400 3 246 Romania – 1 025 600 981 140 500 4 967 Russia 1 000 1 025 600 1 842 – 500 3 305 San Marino 1 000 885 600 280 340 200 3 586 Scotland – 1 005 600 1 441 140 400 3 018 Serbia – 1 025 600 313 480 600 4 814 Slovakia 2 068 1 025 600 281 340 500 4 124 Slovenia 1 025 1 025 600 434 340 700
13 955 Spain 1 075 1 005 600 11 175 – 100 3 277 Sweden – 1 025 600 512 340 800 5 917 Switzerland 3 000 1 025 600 452 340 500 3 118 Turkey – 1 025 600 993 – 500 2 640 Ukraine – 1 025 600 715 – 300 4 045 Wales 1 500 1 025 600 280 340 300
254 507 TOTAL 50 173 53 255 31 800 80 699 14 280 24 300

14
BALAnCE sHEEt
UEFA’s balance sheet total decreased by roughly 15 % compared with the previous year-end, to € 2.34 billion. This is normal after a EURO played right at the end of the previous financial year, given that a number of payments related to the final tournament fall due within the first six months of the following financial year. These include final distribution payments to participating associations and solidarity to clubs, as well as other outstanding EURO payables. This significant cash outflow did not change the percentage breakdown of UEFA’s total assets into current and non-current assets.
As at balance sheet date, UEFA’s cash and cash equivalents and other financial assets stood at € 1.48 billion, down from over € 2 billion at the end of last year. However, this position is still substantial, representing alone 63% of total assets (74% as at 30 June 2012). Security aspects, such as diversifying these assets among top-rated counterparts, continue to be given top priority, even though this has kept UEFA’s financial income at a lower level as a result.
The increase in other current assets is due to higher receivables from club competition partners of about € 180 million. For the 2013/14 season, fewer advance payments were received, which explains the higher number of open invoices at the financial year-end.
No significant capital expenditure in property and equipment or intangible assets was made, which is why the total of these assets – € 128.1 million after depreciation – is close to the € 131.8 million reported at the previous year-end.
On the liabilities and reserves side of the balance sheet, liabilities decreased for the same reason as current assets, i.e. because of the settlement in the 2012/13 financial year of significant payables and accrued expenses related to EURO 2012. Furthermore, the first payments were made in relation to the 2012-15 HatTrick cycle – investment payments in particular.
Under current liabilities, by far the biggest portion relates to deferred income, amounting to € 914.5 million as at 30 June 2013 (€ 835.4 million as at 30 June 2012). The equivalent will be recognised as revenue in the following seasons, when the competitions concerned will be played, in accordance with UEFA’s revenue recognition accounting principles.
Apart from UEFA’s strong cash base, further proof of UEFA’s sound financial position is the significant surplus of UEFA’s current assets over its current liabilities, with a current ratio of 141%. This confirms UEFA’s capability to meet all of its financial obligations with cash at hand or receivable in due time.
As a result of the significant decrease in UEFA’s liabilities, UEFA’s reserves as a percentage of the total balance sheet increased to 26% (23 % as at 30 June 2012), despite the negative result for the reporting period. More details on UEFA’s reserves can be found on page 16, under “Own resources”.
© Sportsfile
15
Financial Report 2012/13
€ m 30/06/2013 30/06/2012
Cash and cash equivalents 327.5 181.4
Other financial assets 983.2 1 620.3
Other current assets 733.3 582.4
Current assets 2 044.0 2 384.1
Property and equipment 116.5 120.4
Intangible assets 11.6 11.4
Other financial assets 166.7 215.6
Fixed assets 294.8 347.4
Total assets 2 338.8 2 731.5
Current liabilities 1 448.2 1 718.0
Non-current liabilities 289.5 391.0
Liabilities 1 737.7 2 109.0
Undesignated reserves 500.0 500.0
Retained earnings 122.5 - 6.3
Net result for the period - 21.4 128.8
Reserves 601.1 622.5
Total liabilities and reserves 2 338.8 2 731.5
Assets Liabilities Reserves
¤m
2,044.0
2,338.8
1,737.7Current
294.8 601.1Fixed

16
Own REsOURCEs
UEFA’s own resources are referred to as reserves and include the following positions:
• undesignated reserves
• designated reserves
• retained earnings
• net result for the period
The 2012 UEFA Congress in Istanbul agreed that undesignated reserves be fixed at € 500 million. Undesignated reserves correspond to the reserves UEFA needs to be covered against any business risk. Analyses over several years have shown that UEFA’s undesignated reserves reflect its actual risk exposure.
Designated reserves, which currently have a zero balance, would be funded by any surplus achieved at the end of a EURO cycle if not needed for UEFA’s day to day activities.
Meanwhile, retained earnings reflect part of the amount UEFA needs to cover its running expenses in years when there is no EURO. Retained earnings move close to zero before the end of a EURO cycle, reflecting the not-for-profit status of the organisation. As mentioned above, any surplus could be moved to designated reserves.
The net result for the period shows the financial outcome for the year under review.
Translation differences have disappeared from the balance sheet since last year, following the change of functional currency as of 1 July 2011 from Swiss francs to euros. A conversion from the functional to the reporting currency is no longer required and is history.
UEFA’s total reserves decreased as a consequence of the negative net result recorded in 2012/13 and now stand at € 601.1 million. The surplus in excess of € 500 million, i.e. € 101.1 million, will be used in the following two seasons to part-finance UEFA’s day to day activities.
€ m 30/06/2007 30/06/2008 30/06/2009 30/06/2010 30/06/2011 30/06/2012 30/06/2013
Undesignated reserves 168.2 168.2 168.2 168.2 168.2 500.0 500.0
Retained earnings 77.6 116.4 352.0 324.1 257.8 - 6.3 122.5
Translation differences - 28.4 - 11.8 25.9 107.9 153.6 – –
Net result for the period 38.8 235.6 - 27.9 - 66.3 - 85.9 128.8 - 21.4
Reserves 256.2 508.4 518.2 533.9 493.7 622.5 601.1
Undesignated reserves
Reserves
256.2 508.4 518.2 533.9 493.7 622.5 601.1

17
Financial Report 2012/13
tHE FOUR-yEAR CyCLE
UEFA is a not-for-profit organisation. However, this fundamental aspect is not visible if results for a single financial year are considered in isolation. An exercise during which a EURO takes place produces a positive net result, whereas years without yield a negative result. The overall revenue and expense streams therefore have to be combined over a four-year financial period in order for a clear picture to become visible.
Therefore, every four-year cycle starts from a year with a EURO and is followed by three successive years without. Thus, 2011/12 was the first year of a four-year cycle which ends in 2014/15. UEFA’s status as a not-for-profit organisation means that the aim is to end every four-year cycle on a balance of zero, so that UEFA’s reserves are not touched. The 2011/12 surplus of € 128.8 million is being used to part-finance the three following financial years. The table below shows the actual values for the 2011/12 and 2012/13 financial years as well as the estimated result for the following two years. Obviously, these are forward-looking statements for information purposes only and are based upon current expectations and assumptions regarding anticipated
developments. These forward-looking statements involve risks and uncertainties and factors may arise that could cause actual results to differ.
This forward-looking perspective, which takes into account the financial consequences of all the competitions and activities to be organised, helps ensure that UEFA does not spend more than it earns and that reserves are safeguarded in the long run. Whenever the balance at the end of a cycle shows a surplus, that amount remains within retained earnings to be reinvested into football, or, if not immediately reinvested, moved to designated reserves in favour of UEFA's member associations.
€ m A2011/12 A2012/13 F2013/14 B2014/15 Cumulative in %
UEFA EURO 1 390.9 1.7 0.0 0.0 1'392.6 16.8 %
European Qualifiers 0.0 0.0 0.0 253.3 253.3 3.1 %
UEFA Champions League 1 165.4 1 424.1 1 445.2 1'471.0 5'505.7 66.4 %
UEFA Europa League 219.6 242.0 246.3 256.3 964.2 11.6 %
Other competitions and revenue 19.8 31.1 24.0 26.5 101.4 1.2 %
Asset management 40.8 16.5 10.5 10.6 78.4 0.9 %
Source of income (gross) 2 836.5 1 715.4 1 726.0 2'017.7 8'295.6 100.0 %
Distribution to participating teams - 1 202.4 - 1 208.7 - 1 238.6 - 1'513.1 - 5'162.8 62.2 %
Solidarity payments - 642.3 - 159.8 - 165.7 - 167.0 - 1'134.8 13.7 %
Organisation: main competitions - 718.8 - 225.0 - 198.6 - 235.2 - 1'377.6 16.6 %
Organisation: other competitions - 32.2 - 34.3 - 44.9 - 44.5 - 155.9 1.9 %
Football development and education - 26.6 - 26.0 - 34.8 - 32.7 - 120.1 1.5 %
Events and conferences - 3.9 - 4.9 - 6.8 - 4.7 - 20.3 0.2 %
Governing expenses - 81.5 - 78.1 - 78.6 - 78.5 - 316.7 3.8 %
Net financing to (-) / from reserves (+) - 128.8 21.4 42.0 58.0 - 7.4 0.1 %
Use of income - 2 836.5 - 1 715.4 - 1 726.0 - 2'017.7 - 8'295.6 100.0 %

18
REsULt By COmPEtItIOn And ACtIVIty
UEFA’s reporting is set up in such a way that the result can be analysed on different levels and dimensions. The statutory accounts, audited by the external auditors, are structured by nature and form the consolidated income statement, as published in the annex to the UEFA financial report as well as on page 5. It is important for UEFA to disclose additional information on the source and use of net income. Therefore, in parallel and as complementary information, UEFA breaks down its result by competition and activity. In this way, it is possible to see where UEFA’s net income comes from and how it is spent.
The total source of net income discloses the result by competition, other revenue, as well as the result achieved by investing UEFA’s financial assets (asset management). It goes without saying that in years with a EURO (e.g. 2011/12), the total source of net income increases considerably. To ensure transparency regarding the source and use of net income, it should be noted that accruals for the HatTrick programme are disclosed on a separate line and have not been allocated to the UEFA EURO 2012 project accounts.
The use of net income is divided into four main sections:
• Other competitions : these are investments into women’s, youth and amateur, as well as futsal competitions, reflecting the costs of staging qualifying and final tournaments, e.g. contributions to organisers, event expenses, and costs related to referees and match officers.
• HatTrick programme and social responsibility: this is the sum of the accruals made for HatTrick solidarity payments and HatTrick administrative costs, as well as for social responsibility investments. The total amount for the HatTrick programme and social responsibility – € 33.3 million (2011/12 : € 456.8 million) – is significantly lower because roughly 75 % of the third HatTrick cycle was financed from EURO 2012 earnings and these investments were accrued in the 2011/12 financial year. The remaining 25 % comes from UEFA Champions League earnings and is presented on an annual basis within the same reporting line.
• Other football activities: “Football development and education” includes a range of initiatives that UEFA undertakes to further improve football in all areas, such as refereeing, coaching, the Study Group Scheme (know-how exchange between associations), football facilities (UEFA campus at the Colovray stadium in Nyon, Switzerland), grassroots, stadium and security matters, as well as doping and medical matters. “Events and conferences” reflects the cost of draws staged at UEFA headquarters, the season kick-off events in Monaco, and football-related forums and conferences, among others.
• Governing expenses: this groups administrative overheads and institutional costs, as explained in more detail on page 10.
© Sportsfile

19
Financial Report 2012/13
Result by competition and activity
2012/13 2012/13 € m 2012/13 2011/12Revenue Expenses Net result Net result
1.7 7.7 UEFA EURO 9.4 593.7
0.0 - 1.2 European Qualifiers - 1.2 - 2.8
1 424.1 - 1 294.4 UEFA Champions League 129.7 94.9
242.0 - 259.4 UEFA Europa League - 17.4 - 14.1
0.2 - 1.9 UEFA Super Cup - 1.7 - 0.1
1 668.0 - 1 549.2 Total main competitions 118.8 671.6
22.1 - 2.2 Other revenue 19.9 17.4
16.5 – Asset management 16.5 40.8
1 706.6 - 1 551.4 Source of net income 155.2 729.8
0.3 - 11.5 Women's competitions - 11.2 - 12.3
7.1 - 16.5 Under-21 competition - 9.4 - 7.1
0.2 - 11.9 Youth and amateur competitions - 11.7 - 8.6
0.0 - 2.0 Futsal competitions - 2.0 - 4.2
7.6 - 41.9 Total other competitions - 34.3 - 32.2
− - 33.3 HatTrick programme and social responsibility - 33.3 - 456.8
0.4 - 26.4 Football development and education - 26.0 - 26.6
– - 4.9 Events and conferences - 4.9 - 3.9
0.4 - 31.3 Total other football activities - 30.9 - 30.5
0.2 - 46.8 Administrative overheads - 46.6 - 49.8
0.6 - 32.1 Institutional - 31.5 - 31.7
0.8 - 78.9 Total governing expenses - 78.1 - 81.5
8.8 - 185.4 Use of net income - 176.6 - 601.0
1 715.4 Total revenue and asset management
- 1 736.8 Total expenses and solidarity
Net result for the period - 21.4 128.8
European Football Championship
Club competitions
Other revenue
Asset management
governing expenses
Other football
activities
Hattrick & social
responsibility
Other competitions
source of net income
net result4
8.2
110.6
16.5
34.3
33.3
155.2
78.1
30.9
21.4
19.9
¤m
20
UEFA CHAmPIOns LEAgUE
2012/13 was the first year of the 2012-15 three-year contractual cycle. Total rights revenue from broadcasters and commercial partners increased by 21% to reach € 1.39 billion (2011/12: € 1.15 billion). This impressive result reflects the steadily growing success of and public interest in this competition, as well as its appeal to broadcasters and sponsors all over the world. It also confirms that the current format of the competition – in place since the 2009/10 season – is very successful and is largely behind this growth in total rights revenue. This season again included 20 play-off matches to finalise the list of 32 group stage participants. These play-offs are included in the UEFA Champions League contracts, bringing the total number of UEFA Champions League matches played to 145. The UEFA Super Cup match is also part of the UEFA Champions League package. The dual UEFA Champions League access – the champions’ route and the league route – again enabled clubs from a greater number of national associations to participate in the group stage of the competition.
Distribution to clubs
The major share of rights revenue goes to the clubs which participate in the competition, including the 20 involved in the play-off round, from which the ten losing teams move into the group stage of the UEFA
Europa League. The two clubs involved in the UEFA Super Cup are also rewarded financially. The principles governing the distribution of revenue among the participating 32 UEFA Champions League group stage clubs remained the same as in the past, with a fixed amount, a performance bonus and an important part of the financial benefits distributed through the market pool concept. Market pool shares in favour of UEFA Champions League clubs are in proportion to the value of the broadcasting rights revenue within the territory of their respective national associations.
Being directly linked to the rights revenue, the amounts distributed to clubs followed the same upward trend in this first year of the new cycle. Each of the 20 clubs involved in the UEFA Champions League play-offs received € 2.1 million, while the 32 group stage clubs received a fixed participation bonus of € 8.6 million each (2011/12: € 7.2 million). For every group match win, clubs were rewarded with € 1.0 million, while a draw earned them € 0.5 million (2011/12: € 0.8 and € 0.4 million respectively). Additional payments were made to the clubs that progressed further in the competition, with € 3.5 million (2011/12: € 3.0 million) the reward for reaching the round of 16, € 3.9 million (2011/12: € 3.3 million) for reaching the quarter-finals and € 4.9 million (2011/12: € 4.2 million) for a semi-final place. The winners of the final played in London, FC Bayern München, collected a further € 10.5 million (2011/12: € 9.0 million for Chelsea FC), with € 6.5 million going to the runners-up, Borussia Dortmund (2011/12: € 5.6 million for FC Bayern München).
As already mentioned, participating clubs were also entitled to a share of the market pool based on the commercial value of their domestic television market, the number of UEFA Champions League matches played during the season in question and their final position in the previous season’s domestic league table. Obviously, this type of distribution system with variable parameters has a significant impact on the individual amounts received by the clubs, even among clubs that achieve similar results in the competition. Consequently, it is not necessarily the club which lifts the trophy that receives the biggest total amount.
© Getty Images

21
Financial Report 2012/13
Given that final total UEFA Champions League revenue was higher than had been anticipated when the amounts for distribution in 2012/13 were fixed, a surplus of € 25 million was available at the end of the season. This surplus was shared among the 32 clubs in proportion to the total of the fixed amounts and market pool shares already received by each club during the season, and € 10 million was used to increase the cross-subsidy in favour of the UEFA Europa League to a total of € 50 million. The surplus amounts per club are included in the market pool column on page 23.
It should also be noted that for all but one of the matches played, the home club kept all gate receipts – the exception being the final in London, where the two finalists received equal shares of the gate receipts.
Solidarity payments
Ever since its introduction, the UEFA Champions League concept has been based on one winner on the pitch and a large number of winners in terms of solidarity payments derived from UEFA’s flagship club competition. In 2012/13, each club that failed to reach the group stage of the UEFA Champions League received a solidarity payment of € 140,000 per qualifying round played (2011/12: € 130,000) and each domestic champion club received an additional
one-off € 200,000. In addition, the clubs, through the European Club Association (ECA), agreed that 6.5% of the total rights revenue earmarked for solidarity payments should be used for youth development. This € 70 million is transferred in favour of clubs not involved in UEFA competitions. As mentioned, for the first time this season, the clubs also agreed that € 50 million of the UEFA Champions League total rights revenue should be used as a cross-subsidy to develop the UEFA Europa League.
In all, € 129.8 million or 9.3 % of the total UEFA Champions League rights revenue was able to be reinvested directly in football, first and foremost in non-top competitions, to further develop the game at the base of the footballing pyramid and for the benefit of European football as a whole. This share of the total revenue is also used to finance football development and education activities, as well as to cover administrative and institutional costs of UEFA.
€ m 2003/04 2004/05 2005/06 2006/07 2007/08 2008/09 2009/10 2010/11 2011/12 2012/13
Broadcasting rights 450.5 469.5 481.8 625.1 625.7 623.2 847.9 885.3 892.3 1 097.2
Commercial rights 118.3 123.5 124.5 193.4 194.4 195.9 260.6 259.9 260.9 291.4
Total rights revenue 568.8 593.0 606.3 818.5 820.1 819.1 1 108.5 1 145.2 1 153.2 1 388.6
Rights revenue
¤m
568.8 593.0 606.3 818.5 820.1 819.1 1,108.5 1,145.2 1,153.2 1,388.6

22
¤m
Club share
UEFA share
Revenue
1,096.1
292.5
1,388.6
UEFA Champions League : project accounts
€ m 2012/13 in % 2011/12 in %
Broadcasting rights 1 097.2 79.0 % 892.3 77.4 %
Commercial rights 291.4 21.0 % 260.9 22.6 %
Total rights revenue 1 388.6 100.0 % 1 153.2 100.0 %
Distribution: group stage and play-offs - 317.2 - 272.4
Distribution: performance bonus - 219.8 - 182.6
Distribution: market pool - 434.6 - 379.0
Distribution: other - 2.8 - 2.9
Total distribution to clubs - 974.4 - 836.9
Contributions to UEL clubs - 50.0 0.0
Solidarity financed by clubs - 71.7 - 68.7
Club share - 1 096.1 78.9 % - 905.6 78.5 %
Other revenue (incl. tickets and hospitality) 35.5 12.2
Event costs - 142.1 - 127.6
Referees and match officers (incl. overheads) - 11.9 - 11.3
Internal allocation: website - 4.4 - 5.3
Internal allocation: UEFA Super Cup - 6.0 - 6.0
Solidarity financed by UEFA - 33.9 - 14.7
Contribution to European football - 129.7 - 94.9
UEFA share - 292.5 21.1 % - 247.6 21.5 %

23
Financial Report 2012/13
UEFA Champions League : distribution to clubs 2012/13
group stage market pool Knockout matches
€ 000 Fixed amount
Performance bonus
Round of 16
Quarter- finals
Semi- finals Final Total
group AFC Dynamo Kyiv 8 600 2 000 1 202 – – – – 11 802GNK Dinamo Zagreb 8 600 500 1 690 – – – – 10 790FC Porto 8 600 4 500 3 711 3 500 – – – 20 311Paris Saint-Germain FC 8 600 5 000 24 923 3 500 3 900 – – 45 923
group BFC Schalke 04 8 600 4 500 12 153 3 500 – – – 28 753Montpellier Hérault SC 8 600 1 000 23 642 – – – – 33 242Arsenal FC 8 600 3 500 16 690 3 500 – – – 32 290Olympiacos FC 8 600 3 000 12 288 – – – – 23 888
group CRSC Anderlecht 8 600 2 000 3 588 – – – – 14 188Málaga CF 8 600 4 500 12 494 3 500 3 900 – – 32 994FC Zenit St Petersburg 8 600 2 500 6 548 – – – – 17 648AC Milan 8 600 3 000 37 670 3 500 – – – 52 770
group dManchester City FC 8 600 1 500 19 469 – – – – 29 569Borussia Dortmund 8 600 5 000 23 257 3 500 3 900 4 900 6 500 55 657AFC Ajax 8 600 1 500 10 346 – – – – 20 446Real Madrid CF 8 600 4 000 24 878 3 500 3 900 4 900 – 49 778
group EJuventus 8 600 4 500 46 614 3 500 3 900 – – 67 114FC Shakhtar Donetsk 8 600 3 500 1 858 3 500 – – – 17 458FC Nordsjaelland 8 600 500 11 864 – – – – 20 964Chelsea FC 8 600 3 500 19 525 – – – – 31 625
group FValencia CF 8 600 4 500 14 233 3 500 – – – 30 833LOSC Lille Métropole 8 600 1 000 13 054 – – − – 22 654FC BATE Borisov 8 600 2 000 592 – – – – 11 192FC Bayern München 8 600 4 500 20 667 3 500 3 900 4 900 10 500 56 567
group gSL Benfica 8 600 3 000 2 669 – – – – 14 269FC Barcelona 8 600 4 500 21 364 3 500 3 900 4 900 – 46 764FC Spartak Moskva 8 600 1 000 4 879 – – – – 14 479Celtic FC 8 600 3 500 8 725 3 500 – – – 24 325
group HCFR 1907 Cluj 8 600 3 500 5 682 – – – – 17 782Manchester United FC 8 600 4 000 20 436 3 500 – – – 36 536Galatasaray AS 8 600 3 500 5 969 3 500 3 900 – – 25 469SC Braga 8 600 1 000 1 890 – – – – 11 490
Total 32 clubs 275 200 96 000 434 570 56 000 31 200 19 600 17 000 929 570
Contribution in favour of the 20 clubs involved in the UEFA Champions League play-offs (€ 2.1 million per club) 42 000
Allocated to the European Club Association in accordance with the memorandum of understanding with UEFA 2 845
Total 974 415

24
UEFA EUROPA LEAgUE
The 48 teams which qualify for the group stage of the UEFA Europa League are drawn into 12 groups, meaning that every team plays a minimum of three home matches. The winner and runner-up from each of the 12 groups are joined in the round of 32 by the eight teams which earn the right to continue their European campaign by finishing third in their UEFA Champions League group. In all, 205 UEFA Europa League matches – including the final in Amsterdam – were staged all over Europe in 2012/13, which was the first year of the 2012-15 three-year contractual cycle. Total rights revenue from broadcasters and commercial partners keeps growing and in 2012/13 reached € 235 million (2011/12: € 219 million), a 7% increase over the previous year.
Distribution to clubs
As during the previous cycle, 75 % of the total revenue generated by the 2012/13 UEFA Europa League was distributed to the participating clubs. The additional € 50 million cross-subsidy made available from the UEFA Champions League allowed € 226.3 million in total to be distributed to the participating teams, which is 38% more than the previous season. The 48 clubs involved received a fixed participation bonus of € 1,300,000 each (2011/12: € 1,000,000). For every group match win, clubs were rewarded with € 200,000, while a draw earned them € 100,000
(2011/12: € 140.000 and € 70,000 respectively). Bonuses were paid for the first time this season, rewarding the winner of each group with € 400,000 and the runners-up with € 200,000. Additional payments were made to the clubs that progressed in the competition, with a reward of €200,000 (same amount as in the previous season) for reaching the round of 32, € 350,000 (2011/12: € 300,000) for reaching the round of 16 and € 450,000 for reaching the quarter-finals (2011/12: € 400,000). The four semi-finalists received € 1,000,000 each (2011/12: € 700,000). The winners of the final played in Amsterdam, Chelsea FC, collected a further € 5 million (2011/12: € 3 million for Club Atlético de Madrid), with € 2.5 million going to the runners-up, SL Benfica (2011/12: € 2 million for Athletic Club-Bilbao).
The UEFA Champions League distribution model also applies to the UEFA Europa League, so that participating clubs are also entitled to a share of the market pool based on the commercial value of their domestic television markets.
Given that final total UEFA Europa League revenue was higher than had been anticipated when the amounts for distribution in 2012/13 were fixed, a surplus of € 17.3 million was available at the end of the season. This surplus was split among the clubs in proportion to the total of the fixed amount and
© Getty Images

25
Financial Report 2012/13
market pool shares already received by each club during the season. These surplus amounts are included in the market pool column on pages 26 and 27.
Ticketing revenue is treated the same as in the UEFA Champions League, with the home club retaining all gate receipts, except for the final, when the two finalists receive equal shares.
Solidarity
Solidarity, a cornerstone of European football, is also demonstrated in the UEFA Europa League. Each club involved in the 2012/13 UEFA Europa League qualifiers received € 100,000 per round. In addition, each club eliminated in the UEFA Europa League play-offs
received another € 100,000. The corresponding total amount of € 24.3 million was debited against the UEFA Europa League project accounts, entirely against the UEFA share.
Contribution from European football
In 2012/13, a contribution of € 17.4 million was financed from European football to achieve break-even in the UEFA Europa League project accounts. This contribution was necessary solely because the € 24.3 million in solidarity payments to the clubs eliminated in the UEFA Europa League qualifying matches and play-offs was debited against the project accounts.
Club share 176.3
UEFA share 58.7
Revenue 235.0
¤m
UEFA Europa League : project accounts
€ m 2012/13 in % 2011/12 in %
Broadcasting rights 217.9 92.7 % 206.1 94.1 %
Commercial rights 17.1 7.3 % 12.9 5.9 %
Total rights revenue 235.0 100.0 % 219.0 100.0 %
Distribution: group stage - 62.4 - 48.0
Distribution: performance bonus - 63.1 - 42.4
Distribution: market pool - 100.8 - 73.9
Total distribution to clubs - 226.3 - 164.3
Contributions from UCL clubs 50.0 0.0
Solidarity financed by clubs 0.0 0.0
Club share - 176.3 75.0 % - 164.3 75.0 %
Other revenue (incl. tickets and hospitality) 7.0 0.6
Event costs - 42.3 - 30.2
Referees and match officers (incl. overheads) - 12.7 - 11.1
Internal allocation: website - 3.8 - 4.4
Solidarity financed by UEFA - 24.3 - 23.7
Contribution from European football 17.4 14.1
UEFA share - 58.7 25.0 % - 54.7 25.0 %

26
UEFA Europa League : distribution to clubs 2012/13
group stage market pool Knockout matches
€ 000 Fixed amount
Performance bonus
Round of 32
Round of 16
Quarter- finals
Semi- finals Final Total
group AFC Anji Makhachkala 1 300 900 2 532 200 350 – – – 5 282
BSC Young Boys 1 300 700 448 – – – – – 2 448
Liverpool FC 1 300 1 100 2 213 200 – – – – 4 813
Udinese Calcio 1 300 300 2 824 – – – – – 4 424
group BA. Académica de Coimbra 1 300 400 790 – – – – – 2 490
Hapoel Tel-Aviv FC 1 300 300 301 – – – – – 1 901
Club Atlético de Madrid 1 300 1 000 3 374 200 – – – – 5 874
FC Viktoria Plzeň 1 300 1 300 404 200 350 – – – 3 554
group COlympique de Marseille 1 300 400 2 474 – – – – – 4 174
AEL Limassol FC 1 300 300 492 – – – – – 2 092
VfL Borussia Mönchengladbach 1 300 1 000 2 429 200 – – – – 4 929
Fenerbahçe SK 1 300 1 300 7 338 200 350 450 1 000 – 11 938
group dClub Brugge KV 1 300 300 683 – – – – – 2 283
CS Marítimo 1 300 500 564 – – – – – 2 364
Newcastle United FC 1 300 900 2 811 200 350 450 – – 6 011
FC Girondins de Bordeaux 1 300 1 300 4 277 200 350 – – – 7 427
group EMolde FK 1 300 400 1 032 – – – – – 2 732
VfB Stuttgart 1 300 800 3 507 200 350 – – – 6 157
FC Steaua Bucureşti 1 300 1 200 1 643 200 350 – – – 4 693
FC København 1 300 600 1 610 – – – – – 3 510
group FAIK Solna 1 300 300 495 – – – – – 2 095
FC Dnipro Dnipropetrovsk 1 300 1 400 694 200 – – – – 3 594
PSV Eindhoven 1 300 500 1 825 – – – – – 3 625
SSC Napoli 1 300 800 5 193 200 – – – – 7 493
group gFC Basel 1893 1 300 900 1 049 200 350 450 1 000 – 5 249
KRC Genk 1 300 1 300 828 200 – – – – 3 628
Videoton FC 1 300 400 403 – – – – – 2 103
Sporting Clube de Portugal 1 300 400 564 – – – – – 2 264

27
Financial Report 2012/13
group stage market pool Knockout matches
€ 000 Fixed amount
Performance bonus
Round of 32
Round of 16
Quarter- finals
Semi- finals Final Total
group HNeftçi PFK 1 300 300 316 – – – – – 1 916
FC Internationale Milano 1 300 1 000 4 313 200 350 – – – 7 163
FC Rubin Kazan 1 300 1 400 4 452 200 350 450 – – 8 152
FK Partizan 1 300 300 568 – – – – – 2 168
group IHapoel Kiryat Shmona FC 1 300 200 272 – – – – – 1 772
Olympique Lyonnais 1 300 1 500 4 587 200 – – – – 7 587
AC Sparta Praha 1 300 900 367 200 – – – – 2 767
Athletic Club 1 300 400 1 847 – – – – – 3 547
group JS.S. Lazio 1 300 1 300 6 667 200 350 450 – – 10 267
NK Maribor 1 300 300 308 – – – – – 1 908
Panathinaikos FC 1 300 400 2 473 – – – – – 4 173
Tottenham Hotspur FC 1 300 1 000 2 811 200 350 450 – – 6 111
group KFC Metalist Kharkiv 1 300 1 300 694 200 – – – – 3 494
SK Rapid Wien 1 300 200 630 – – – – – 2 130
Rosenborg BK 1 300 400 1 032 – – – – – 2 732
Bayer 04 Leverkusen 1 300 1 100 2 429 200 – – – – 5 029
group LHannover 96 1 300 1 300 2 429 200 – – – – 5 229
Levante UD 1 300 1 000 3 150 200 350 – – – 6 000
Helsingborgs IF 1 300 300 647 – – – – – 2 247
FC Twente 1 300 400 1 258 – – – – – 2 958
Clubs from UEFA Champions League
AFC Ajax – – 412 200 – – – – 612
FC BATE Borisov – – 6 200 – – – – 206
CFR 1907 Cluj – – 91 200 – – – – 291
SL Benfica – – 1 374 200 350 450 1 000 2 500 5 874
Olympiacos FC – – 351 200 – – – – 551
FC Zenit St Petersburg – – 466 200 350 – – – 1 016
FC Dynamo Kyiv – – 45 200 – – – – 245
Chelsea FC – – 4 008 200 350 450 1 000 5 000 11 008
Total 62 400 36 000 100 800 6 400 5 600 3 600 4 000 7 500 226 300

This financial report is published in English, French and German. The English version is authoritative in respect of financial reporting, in accordance with Article 4.3 of the UEFA Statutes.
© Getty Images

Setting and printing : Artgraphic Cavin SA, Grandson, Switzerland

UEFAROUtE dE gEnÈVE 46
CH-1260 nyOn 2swItZERLAnd
tELEPHOnE: +41 848 00 27 27tELEFAX: +41 848 0 1 27 27
UEFA.com
wE CARE ABOUt FOOtBALL