2012_tmi
TRANSCRIPT

1584 IEEE TRANSACTIONS ON MEDICAL IMAGING, VOL. 31, NO. 8, AUGUST 2012
Fast 3-D Tomographic Microwave Imagingfor Breast Cancer Detection
Tomasz M. Grzegorczyk*, Senior Member, IEEE, Paul M. Meaney, Member, IEEE, Peter A. Kaufman,Roberta M. diFlorio-Alexander, and Keith D. Paulsen, Member, IEEE
Abstract—Microwave breast imaging (using electromagneticwaves of frequencies around 1 GHz) has mostly remained at theresearch level for the past decade, gaining little clinical acceptance.The major hurdles limiting patient use are both at the hardwarelevel (challenges in collecting accurate and noncorrupted data)and software level (often plagued by unrealistic reconstructiontimes in the tens of hours). In this paper we report improvementsthat address both issues. First, the hardware is able to measuresignals down to levels compatible with sub-centimeter imageresolution while keeping an exam time under 2 min. Second, thesoftware overcomes the enormous time burden and produces sim-ilarly accurate images in less than 20 min. The combination of thenew hardware and software allows us to produce and report herethe first clinical 3-D microwave tomographic images of the breast.Two clinical examples are selected out of 400+ exams conductedat the Dartmouth Hitchcock Medical Center (Lebanon, NH). Thefirst example demonstrates the potential usefulness of our systemfor breast cancer screening while the second example focuses ontherapy monitoring.
Index Terms—Breast cancer, breast cancer diagnostic, discretedipole approximation, Gauss–Newton algorithm, therapy moni-toring, tomographic imaging, 3-D microwave imaging.
I. INTRODUCTION
B IOMEDICAL imaging is experiencing an increased in-terest among research institutions, pharmaceutical com-
panies, and hospitals due to unique properties such as nonin-vasiveness, wide applicability range, and potential high sensi-tivity and high specificity. Most clinical imaging modalities arecurrently based on the interaction of either electromagnetic oracoustic waves with body tissues and fluids [1]. In the realmof electromagnetic waves, a large portion of the spectrum hasalready been exploited, from very high frequencies (positronemission tomography, X-ray/computed tomography), to lowerand nonionizing frequencies such as infrared, near-infrared, ter-ahertz, and low megahertz regions where magnetic resonance(MR) operates. A portion of the spectrummuch less investigated
Manuscript received February 28, 2012; revised April 20, 2012; acceptedApril 22, 2012. Date of publication May 02, 2012; date of current version July27, 2012. This work was sponsored in part by the National Institutes of Health/National Cancer Institute (NIH/NCI) under Grant PO1-CA080139 and in partby Delpsi discretionary funds. Asterisk indicates corresponding author.*T. M. Grzegorczyk is with Delpsi, Newton, MA 02458 USA.P. M. Meaney and K. D. Paulsen are with the Thayer School of Engineering,
Dartmouth College, Hanover, NH 03755 USA.P. A. Kaufman and R. M. diFlorio-Alexander are with Dartmouth-Hitchcock
Medical Center, Lebanon, NH 03766 USA.Color versions of one or more of the figures in this paper are available online
at http://ieeexplore.ieee.org.Digital Object Identifier 10.1109/TMI.2012.2197218
is that of microwave frequencies, from a few hundreds of mega-hertz to several gigahertz. Electromagnetic waves, the means bywhich microwaves transport power and information, are wellunderstood and their propagation can be accurately simulated ina large variety of environments. The interaction of electromag-netic waves and matter depends on dielectric properties whichcan be directly related to various types of biological constituentsdue to their varying degree of water content: bone, fat, muscle,etc. This specificity can be exploited in different tissue types andeven offers the rationale for detecting tumors: ex vivo studieshave revealed varying degrees of contrast in the dielectric prop-erties between normal and malignant tissue [2]–[5]. The permit-tivity is normally high at lower frequencies due to the insulatingeffect of cell membranes, and decreases over higher frequenciesdue to dispersion and relaxation. Low water content tissues in-clude for example fat, bone, and lung, whereas high water con-tent tissues include muscles, brain, blood, internal organs, andtumors. For low water-content tissues such as the breast, studiesindicate that tumor versus normal tissues property contrast canrange from 10% to 400%, sufficiently large to be captured bymicrowave imaging.Among various possible applications, breast cancer imaging
remains a high research priority because of its vast incidence.Roughly 200 000 new cases of breast cancer are typicallydiagnosed in the U.S. every year, with an estimated 25%–30%of women dying from the disease making it the second largestcause of female cancer deaths in the U.S. [6]. There havebeen numerous reports demonstrating that early detection isthe single most significant predictor of long term survival [7],[8]; therefore, improvements in detection may help reduce thecurrent high mortality rates. Mammography is the front linescreening modality but its weaknesses in terms of sensitivityand specificity are well documented [7]. Largely because ofcost, magnetic resonance is limited primarily to screening forhigh risk patients and staging for treatment. Ultrasound pro-vides very good resolution but is especially operator dependentand time consuming, generally limiting its role to the diagnosticsetting. Notwithstanding, the morphology of breast tissue isideal for microwave imaging: fibroglandular tissue has beenshown to have higher dielectric properties than fat but withproperties that are still lower than tumors in most cases. Fur-thermore, studies have shown that the amount of fibroglandulartissue can vary widely from fattier breasts (very little) to denserbreasts (much larger proportions with highly heterogeneoustissue mixture) suggesting that the baseline electrical propertiesof the normal breast may be highly variable [9].
0278-0062/$31.00 © 2012 IEEE
GRZEGORCZYK et al.: FAST 3-D TOMOGRAPHIC MICROWAVE IMAGING FOR BREAST CANCER DETECTION 1585
The microwave imaging techniques presently being pursuedare generally either radar or tomography. With respect to radartechnology, the most advanced concepts appear to be confocalmicrowave imaging [10]–[13] and near field synthetic focusing[14]. Studies of microwave tomography also exist and includereports by Bolomey et al. [15], [16], Liewei et al. [17], Sou-vorov et al. [18], Bulyshev et al. [19], Meaney et al. [20], [21],Ciocan et al. [22], among others. Most of these efforts are occur-ring at the simulation and prototype stages where the goal is toidentify and optimize the design rather than report on electricalcharacteristics of breast tissues per se. In addition, most of themicrowave breast cancer detection algorithms currently used inconjunction with actual hardware are burdened with significantcomputational times which currently limit their clinical utility.For example, it is not uncommon to wait tens of hours or evendays for a single 3-D microwave tomographic image [23].In contrast to these limitations, we present our new mi-
crowave imaging system which achieves an exam time ofunder 2 min and produces 3-D tomographic images in min-utes. Our new ultra-fast system is based on a unique synergybetween hardware and software where both have been jointlyoptimized to yield near real-time imaging without sacrificingaccuracy. The hardware has been designed for state-of-the artperformance, incorporating features such as cross-plane dataacquisition and patient comfort, while the surrounding tankcan be customized for special applications such as integrationwithin an MR chamber for simultaneous MR and microwaveexams. The software takes advantage of the weak field dis-turbances introduced by the antennas, due to both their lowprofile and the lossy liquid within which they are immersed.The scattering effects, therefore, arise dominantly from thebiological tissues which can be efficiently modeled as lossy di-electric scatterers by the discrete dipole approximation (DDA).The system thus created is capable of taking patient data andproducing 3-D microwave tomographic images in minutes, andis already in use at the Dartmouth Hitchcock Medical Center(DHMC). Our validation campaign has included studies usingsimulated data and measured phantom configurations, as wellas measured clinical data on patients taking part in our preclin-ical studies. Initial results from a pilot diagnostic study showedthat our microwave technique could distinguish at a statisticallysignificant level between malignant and benign for lesions 1cm in diameter or greater [24]. In subsequent sections, weconcentrate exclusively on clinical cases and focus in particularon two examples, one relating to a cancer screening case alongwith a second to track tumor progression over the course ofneoadjuvant chemotherapy. These results represent the firstclinical 3-D microwave tomographic images of the breast.
II. MICROWAVE IMAGING: PRINCIPLE AND HARDWARE
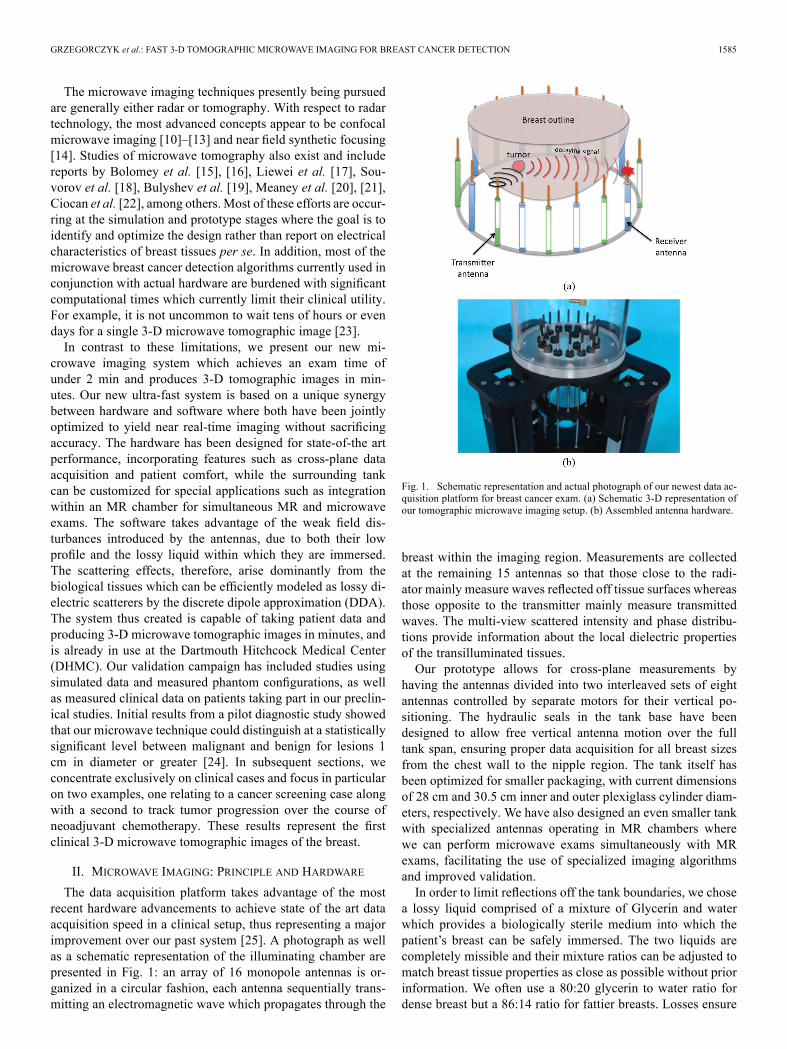
The data acquisition platform takes advantage of the mostrecent hardware advancements to achieve state of the art dataacquisition speed in a clinical setup, thus representing a majorimprovement over our past system [25]. A photograph as wellas a schematic representation of the illuminating chamber arepresented in Fig. 1: an array of 16 monopole antennas is or-ganized in a circular fashion, each antenna sequentially trans-mitting an electromagnetic wave which propagates through the
Fig. 1. Schematic representation and actual photograph of our newest data ac-quisition platform for breast cancer exam. (a) Schematic 3-D representation ofour tomographic microwave imaging setup. (b) Assembled antenna hardware.
breast within the imaging region. Measurements are collectedat the remaining 15 antennas so that those close to the radi-ator mainly measure waves reflected off tissue surfaces whereasthose opposite to the transmitter mainly measure transmittedwaves. The multi-view scattered intensity and phase distribu-tions provide information about the local dielectric propertiesof the transilluminated tissues.Our prototype allows for cross-plane measurements by
having the antennas divided into two interleaved sets of eightantennas controlled by separate motors for their vertical po-sitioning. The hydraulic seals in the tank base have beendesigned to allow free vertical antenna motion over the fulltank span, ensuring proper data acquisition for all breast sizesfrom the chest wall to the nipple region. The tank itself hasbeen optimized for smaller packaging, with current dimensionsof 28 cm and 30.5 cm inner and outer plexiglass cylinder diam-eters, respectively. We have also designed an even smaller tankwith specialized antennas operating in MR chambers wherewe can perform microwave exams simultaneously with MRexams, facilitating the use of specialized imaging algorithmsand improved validation.In order to limit reflections off the tank boundaries, we chose
a lossy liquid comprised of a mixture of Glycerin and waterwhich provides a biologically sterile medium into which thepatient’s breast can be safely immersed. The two liquids arecompletely missible and their mixture ratios can be adjusted tomatch breast tissue properties as close as possible without priorinformation. We often use a 80:20 glycerin to water ratio fordense breast but a 86:14 ratio for fattier breasts. Losses ensure

1586 IEEE TRANSACTIONS ON MEDICAL IMAGING, VOL. 31, NO. 8, AUGUST 2012
that signals collected by the receivers are dominated by wavespropagating through the imaging region, and that all other re-flections and various multi-path signals remain negligible. Asecondary effect of these losses is to significantly weaken thereceived signals, requiring reception channels to accurately cap-ture very low power signals. To this end, our newest hardwaresystem reliably measures down to 140 dBm, which effectivelytranslates into higher operating frequencies and, therefore, im-proved resolution. Such a low noise floor requires a channel-to-channel isolation of 150 dB. We have also implemented a tech-nique to suppress surface waves along the antenna feedlines andtank structures to minimize unwanted multi-path signal corrup-tion [26]. The antennas are simple monopoles which, when sub-merged in a lossy liquid, provide the necessary radiation char-acteristics: omni-directional pattern for full target coverage andgood, broadband, impedance matching. Although other types ofantennas have been investigated, most often motivated by theavailability of optimized designs for free-space operation, wehave found that the monopole antennas are one of the most ver-satile and efficient geometries with respect to our configuration.As will be discussed later, we can accurately use the DDA as aforward solver because the disruption of the field by the arrayof monopoles in the lossy glycerin bath is minimal.Our newest system collects 240 data points (16 transmitters
with 15 receivers) in roughly 1 s. Typically eleven frequen-cies are collected across seven coronal planes of the breast,amounting to a total exam time under 2 min per breast. In orderto achieve sub-centimeter resolution, we found that an operatingfrequency of 1.3 GHz is often optimal, although this dependssomewhat on breast composition (fat, dense, scattered, or het-erogeneous) which justifies our multi-frequency data collection.We should emphasize that although resolution improves withincreasing frequency, thus intuitively prompting for higher op-erating frequencies, signal losses and channel isolation can be-come limiting factors for certain breast types at higher frequen-cies. Improvements in this direction are currently being pursued.
III. MICROWAVE IMAGING ALGORITHM
A major limitation of current microwave imaging algo-rithms, in addition to being mostly applied to simulated data,is their heavy computational burden, typically reaching tens ofhours or even days for single 3-D images [23]. Conversely, ournewest implementation produces images from measurementdata in typically less than 10 min on a dual 2.8 GHz Intel Xeonprocessor, with further speed improvement expected. Thisultra-fast processing is possible because of our low profile an-tenna geometry and the lossy background within which they areembedded. This particular configuration has two consequences.First, scatterers such as tank boundaries and antenna supportsproduce negligible electric fields at the receivers and do notneed to be modeled. Second, the field radiated by the antennascan be assumed to propagate in a homogeneous medium withproperties equal to those of the liquid bath, hence lending itselfto an analytical solution, only to be perturbed by the scatteringfrom tissues which is accounted for by the DDA discretization(in practise the discretization includes portions of the back-ground medium since we do not have a precise knowledge onthe breast boundary). This forward solver is then combined
with the Gauss–Newton solution of the normal equation whichwe have previously documented [27]. Adopting a single anddouble bar notation for vectors and matrices, respectively, theminimization problem is written as
(1)
where denotes the increment in withbeing the complex wavenumber squared which gathers
the two unknowns (dielectric permittivity) and (electric con-
ductivity), where is the frequency in Hz, andare the Jacobian matrix and its transpose, respectively, is theidentity matrix, is a regularization parameter, and is thedifference between the measured and computed electric fields(we only measure the vertical component of the electric field inour case, aligned with the monopole antennas). The algorithm,therefore, iteratively updates the values of and across theimaging region in order to minimize . An important nov-elty of our algorithm is the analytical computation of the Jaco-bian matrix which improves accuracy over the more widelyused adjoint method [28]. In addition, a logarithmic version of(1) is used, whereby the amplitude and phase differences ofthe electric field are minimized rather than its real and imagi-nary parts [27]. The advantages of this method are to linearizethe problem and retain phase information, necessary for the re-covery of and . A comparison between the two algorithms re-veals important advantages of the logarithmic implementation:fast convergence, insensitivity to initial guess (a crucial prop-erty in medical imaging where prior information is rarely avail-able), robust even for increasing frequencies (thus lending itselfto improved resolution), all of which contribute to produce sig-nificantly more accurate images in cases of large and/or strongscatterers [29].The DDA is used as the forward solver, required at each itera-
tion and representing an important portion of the overall compu-tation burden of the algorithm. The discretization of scattererssuch as biological tissues into dipoles [30]–[32] is well suitedfor modeling heterogeneous structures and is ideal for our con-figuration since each dipole, with its polarizability, representsa pixel in our images. In addition, all the interaction matricesnecessary for the implementation of the DDA are computed of-fline, resulting in a considerable saving in computational timeand memory compared to a numerical approach such as the fi-nite-difference time-domain which we used in the past (typicalforward solutions are obtained in seconds instead of minutes).Within the DDA, the electric field is computed from the collec-tive sum of interacting dipoles whose elementary field at posi-tion due to a dipole at is governed by [33]
(2)
where is the polarization vector, with beingthe background permittivity, and isthe normalized vector between point and point separated bya distance . Equation (2) can be cast as a matrix

GRZEGORCZYK et al.: FAST 3-D TOMOGRAPHIC MICROWAVE IMAGING FOR BREAST CANCER DETECTION 1587
operation and the collective response of alldipoles in response to the incident field is written as
(3a)
where
(3b)
to which the incident field needs to be added in orderto obtain the total field. The self-term is given by
where the polarizability of dipole , whose effectivevolume is , is related to the unknowns by
(4)
It should be mentioned that other expressions of are pos-sible depending on which definition of the dipole polarizabilityis adopted [32]. The unknowns are solved from the DDAmaster equation
(5)
The computation of the Jacobian matrix remains analytical if werealize that the total field at receiver can be written in a similarway to (5). We denote the interaction matrix by and writethe total field at receiver
(6)
Hence, has the exact form as [obtained from (3b)] but iscomputed between all the dipole locations and all the receiverlocations, whereas is the interaction matrix between all thedipole locations themselves. In particular, these interaction ma-trices are only functions of frequency and dipole/receiver loca-tions, but independent of . Omitting the indices for simplicity,the Jacobian matrix with respect to where is com-puted as
(7a)
From (5)
(7b)
so that
(7c)
and
(7d)
Introducing back into (7a), the Jacobian is obtain as
(7e)
The computation therefore only requires the derivative of thepolarizability with respect to and , which is straightforwardin view of (4)
(8a)
(8b)
Again, these expressions could take different forms dependingon the definition of the polarizabilities [32].These equations can be cast in a series of matrix multiplica-
tions, where the matrices themselves can be precomputed andreused at each iteration of the Gauss–Newton iterative approach,yielding a considerable time saving. The basic system of equa-tion can be written as
(9)
where and denote the real and imaginary part opera-tors, respectively, and
(10)
Equation (9) can be directly transformed into the logarithmicversion of the algorithm following the procedure outlined in[34], with all the previously documented advantages [27], [29].Although not shown here, we have extensively validated the
forward solver by comparing the 240 electric field points (15 re-ceivers for each 16 transmitters) computed by our DDAmethodand the 2-D finite-difference time-domain (FDTD) method pro-posed in [35]. Due to the necessary 2-D nature of the problem,we limited ourselves to the scattering from a cylinder of radius4 cm and various permittivities and conductivities sampling ran-domly in the intervals and fora background of parameters whichcorresponds to a bath of 86% glycerin at 1.5 GHz. The 240field data points were used to compute the root mean squareerror (rms) of both the amplitude and phase, with the followingresults:• Amplitude: the maximum amplitude difference between2-D FDTD and 3-D DDAwas 0.3 dB for overall variationswithin 2 dB, with a cumulative average error of
dB per data point.
1588 IEEE TRANSACTIONS ON MEDICAL IMAGING, VOL. 31, NO. 8, AUGUST 2012
TABLE IMEAN AND STANDARD DEVIATION (STD) OF THE ERROR BETWEEN THESCATTERED FIELD COMPUTED BY DDA AND A 3-D FDTD REFERENCEMETHOD FOR A SPHERE (RADIUS 2 cm, COMPOSITION 50:50 MIXTURE OF
GLYCERIN AND WATER) WITHIN A 90:10 GLYCERIN AND WATER LIQUID BATH.THE FIELD VALUES WERE SAMPLED AT 240 POINTS PER PLANE, ACROSS 10
PLANES BETWEEN 4.5 cm, AND AT THE FREQUENCIES SHOWN
• Phase: the maximum difference between 2-D FDTD and3-D DDA was 1.9 for overall variations between 10and 30 , with an average cumulative error ofdegrees per point.
This study was extended to 3-D by comparing field valuesobtained with DDA and a 3-D FDTD method of reference.The configuration was that of a sphere of radius 2 cm (hence alarge scatterer prone to produce nontrivial scattered fields withpeak-to-peak variations of amplitude and phase amountingto about 25 dB and 700 at the frequencies of interest in thispaper) with electric parameters equivalent to those of a 50:50glycerin:water bath in a 90:10 glycerin:water background. The240 electric fields were samples at 10 planes every centimeterwithin 4.5 cm, and at frequencies of 1100, 1300, and 1500MHz. The mean and standard deviations errors were computedover the 2400 measurement points at each frequencies andresulted in the values summarized in Table I. These errors wereobtained with the DDA discretization subsequently used in thispaper to analyze clinical data, and are well within acceptableranges compared to our method of reference. The errors areseen to increase with frequency due to the smaller wavelengthswhich require finer discretization for both methods. We furtherconfirmed that these errors are indeed reduced with finer DDAand FDTD discretizations, as expected, yielding credibility toour DDA implementation. In the next section, we apply thisalgorithm to invert clinical data.
IV. CLINICAL RESULTS
We chose two representative clinical examples out of over400 cases collected at the DHMC under a Dartmouth College,IRB-approved protocol with associated patient informed con-sent. The first case demonstrates the potential usefulness of oursystem for breast cancer screening, showing good sensitivity toregions of higher water content, indicative of potentially malig-nant tissues. The second case focuses on the therapy monitoringsetting, whereby data gathered several weeks apart on a patientundergoing chemotherapy produced images clearly indicating aregressing tumor.The first example is that of an invasive ductal carcinoma de-
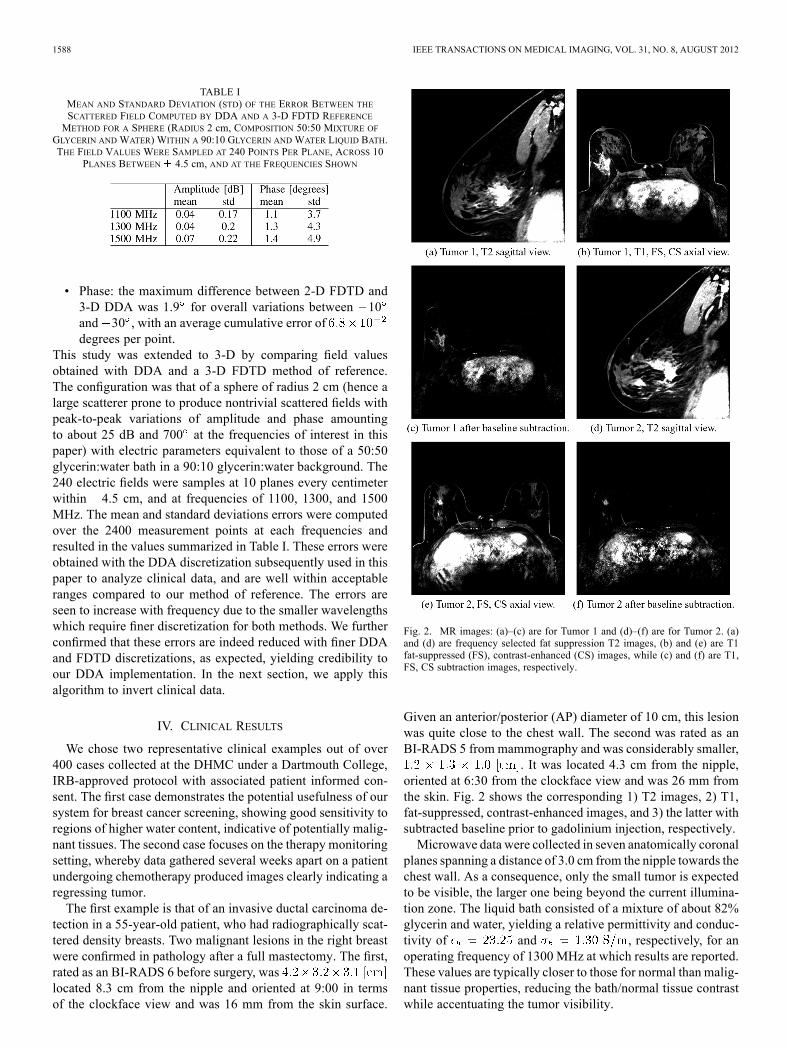
tection in a 55-year-old patient, who had radiographically scat-tered density breasts. Two malignant lesions in the right breastwere confirmed in pathology after a full mastectomy. The first,rated as an BI-RADS 6 before surgery, waslocated 8.3 cm from the nipple and oriented at 9:00 in termsof the clockface view and was 16 mm from the skin surface.
Fig. 2. MR images: (a)–(c) are for Tumor 1 and (d)–(f) are for Tumor 2. (a)and (d) are frequency selected fat suppression T2 images, (b) and (e) are T1fat-suppressed (FS), contrast-enhanced (CS) images, while (c) and (f) are T1,FS, CS subtraction images, respectively.
Given an anterior/posterior (AP) diameter of 10 cm, this lesionwas quite close to the chest wall. The second was rated as anBI-RADS 5 from mammography and was considerably smaller,
. It was located 4.3 cm from the nipple,oriented at 6:30 from the clockface view and was 26 mm fromthe skin. Fig. 2 shows the corresponding 1) T2 images, 2) T1,fat-suppressed, contrast-enhanced images, and 3) the latter withsubtracted baseline prior to gadolinium injection, respectively.Microwave data were collected in seven anatomically coronal
planes spanning a distance of 3.0 cm from the nipple towards thechest wall. As a consequence, only the small tumor is expectedto be visible, the larger one being beyond the current illumina-tion zone. The liquid bath consisted of a mixture of about 82%glycerin and water, yielding a relative permittivity and conduc-tivity of and , respectively, for anoperating frequency of 1300 MHz at which results are reported.These values are typically closer to those for normal than malig-nant tissue properties, reducing the bath/normal tissue contrastwhile accentuating the tumor visibility.

GRZEGORCZYK et al.: FAST 3-D TOMOGRAPHIC MICROWAVE IMAGING FOR BREAST CANCER DETECTION 1589
Fig. 3. 3-D microwave tomographic permittivity images at 1300 MHz. Highervalue iso-surfaces reveal the 3-D structure of a tumor in the right breast whilenone for the left breast. Results have been confirmed by magnetic resonanceimages. (a) Right breast. (b) Left breast.
The reconstruction algorithm operated with slightly under4500 dipoles organized in a cylindrical fashion: spanning 5 cmin height with a radius of 7.0 cm, i.e. located just within the radi-ating antennas. Note that a generic cylindrical domain was useddue to a lack of information on the breast location and volume.Applying more dipoles than necessary ensures that all dielec-tric and conductivity discontinuities are properly captured. Infuture versions of our system, a breast surface scanning will beincorporated, confining the reconstruction region to customizedsmaller volume, subsequently lowering the number of dipolesrequired and further reducing the computation time.Permittivity results are reported in Fig. 3 for both the right
and the left breast, with the outlines only approximately in-dicative of the boundaries since exact surface rendering wasnot available for this patient. The red iso-surface shown cor-responds to a relative permittivity of . Fig. 3(a) clearlyreveals the presence of a tumor in the right breast at roughly6:30 from an en face view, about 3 cm from the skin surfaceand close to the chest wall, in good agreement with the MR im-ages. From the microwave image, the tumor size is estimatedat . In contrast, the 3-D image for theleft breast in Fig. 3(b) shows a relatively homogeneous breastwith quite low properties situated within the higher propertysurrounding bath. Only slight perturbations in the breast dis-tribution are visible and are most likely related to the limitedamount of associated fibroglandular tissue. Fig. 4 shows a di-rectional averaging of the 3-D permittivity images for eachbreast compressed into a single coronal image (similar in con-cept to that observed in standard mammograms). Consistent
Fig. 4. Directionally averaged 2-D coronal permittivity images at 1300 MHz.The region of high permittivity in the right breast indicates the presence of atumor which is noticeably absent in the left breast (used as control). (a) Rightbreast. (b) Left breast.
with the previous images and discussions, the tumor is readilyvisible in the right breast image as an elevated permittivityzone, with no discerning features visible for the left breast.As a second example, we studied a 36-year-old woman also
with heterogeneously dense breasts. From the MR exams, aninvasive ductal carcinoma measured andwas located in the lower right quadrant (en face view) ofthe right breast and extended from just under the areola re-gion to nearly the chestwall. The patient received neoadjuvantchemotherapy, specifically a widely used regimen consistingof AC (doxorubicin [adriamycin] and cyclophosphamide) X 4cycles followed by paclitaxel (Taxol) and trastuzumab (Her-ceptin) X 4 cycles (each cycle was three weeks). She sub-sequently underwent a modified right mastectomy, and wasfound pathologically to have had a complete response, withno residual cancer in the breast. Contrast enhanced MR wasperformed at the start of the treatment (Doxorubicin and Cy-clophosphamide protocol) and at the end of the first set of fourcycles of therapy, reported in Fig. 5. For each date, we showthe frequency selected fat suppression T2 images, T1 fat-sup-pressed and contrast-enhanced images, and the latter with asubtracted baseline before contrast injection. For the first date,the images reveal a large, dispersed tumor extending fromjust under the nipple all the way to the chestwall. The imagealso shows an extensive skin thickening effect and associatedoedema around most of the breast—the skin thickening is notvisible in the subtraction image as expected. It was inconclu-sive as to whether there was any tumor involvement of the
1590 IEEE TRANSACTIONS ON MEDICAL IMAGING, VOL. 31, NO. 8, AUGUST 2012
Fig. 5. Sagittal MR images of the right breast of the test patient prior to therapy(top row) and after the first set of four cycles of treatment (bottom row). (a) and(d) show the T2 images, (b) and (e) show the T1, FS, CE images, and (c) and (f)are the same as (b) and (e) with a subtracted baseline before contrast injection.
skin at the time of the first MR exam. For the purposes ofthe microwave image, the more important feature of the skinwas the increased surface water content. The skin was testedin Pathology after the mastectomy and there was no evidenceof tumor there or anywhere else in the breast. In the secondset of images there is a marked decrease in the degree of seg-mental enhancement in the inferior right breast with a changein kinetics from washout/plateau to more benign progressiveenhancement. There was also a decrease in degree of skinthickening and axillary nodal involvement.Microwave data were collected at six time points during
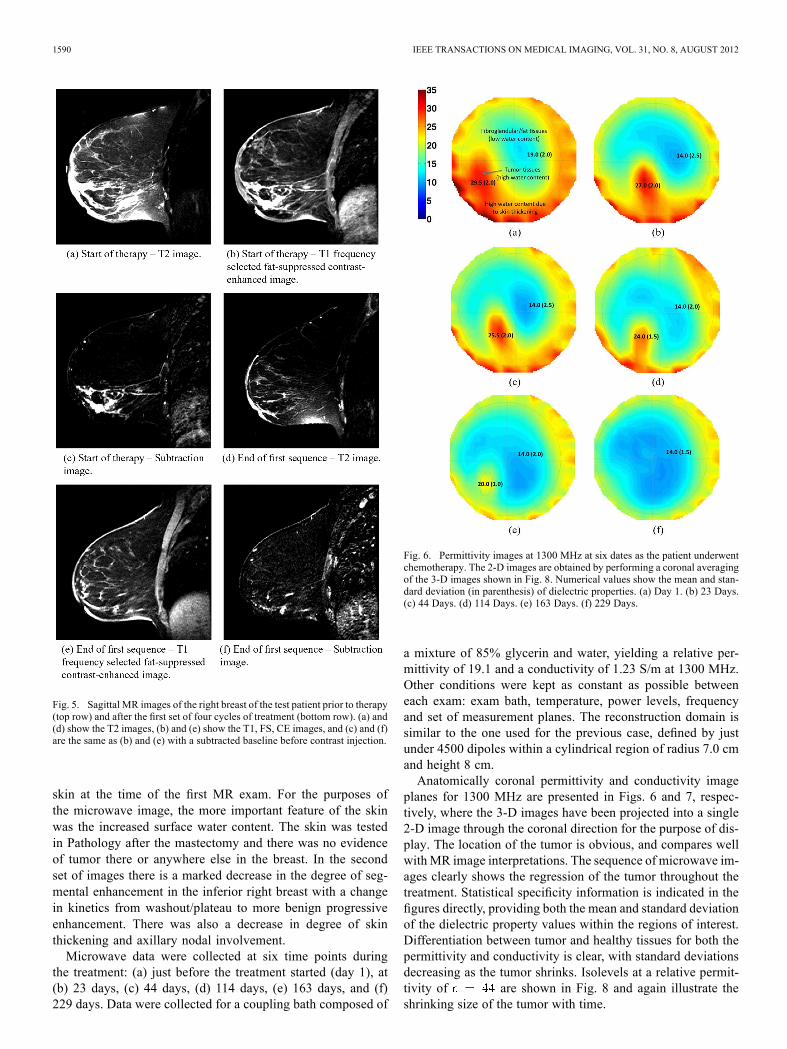
the treatment: (a) just before the treatment started (day 1), at(b) 23 days, (c) 44 days, (d) 114 days, (e) 163 days, and (f)229 days. Data were collected for a coupling bath composed of
Fig. 6. Permittivity images at 1300 MHz at six dates as the patient underwentchemotherapy. The 2-D images are obtained by performing a coronal averagingof the 3-D images shown in Fig. 8. Numerical values show the mean and stan-dard deviation (in parenthesis) of dielectric properties. (a) Day 1. (b) 23 Days.(c) 44 Days. (d) 114 Days. (e) 163 Days. (f) 229 Days.
a mixture of 85% glycerin and water, yielding a relative per-mittivity of 19.1 and a conductivity of 1.23 S/m at 1300 MHz.Other conditions were kept as constant as possible betweeneach exam: exam bath, temperature, power levels, frequencyand set of measurement planes. The reconstruction domain issimilar to the one used for the previous case, defined by justunder 4500 dipoles within a cylindrical region of radius 7.0 cmand height 8 cm.Anatomically coronal permittivity and conductivity image
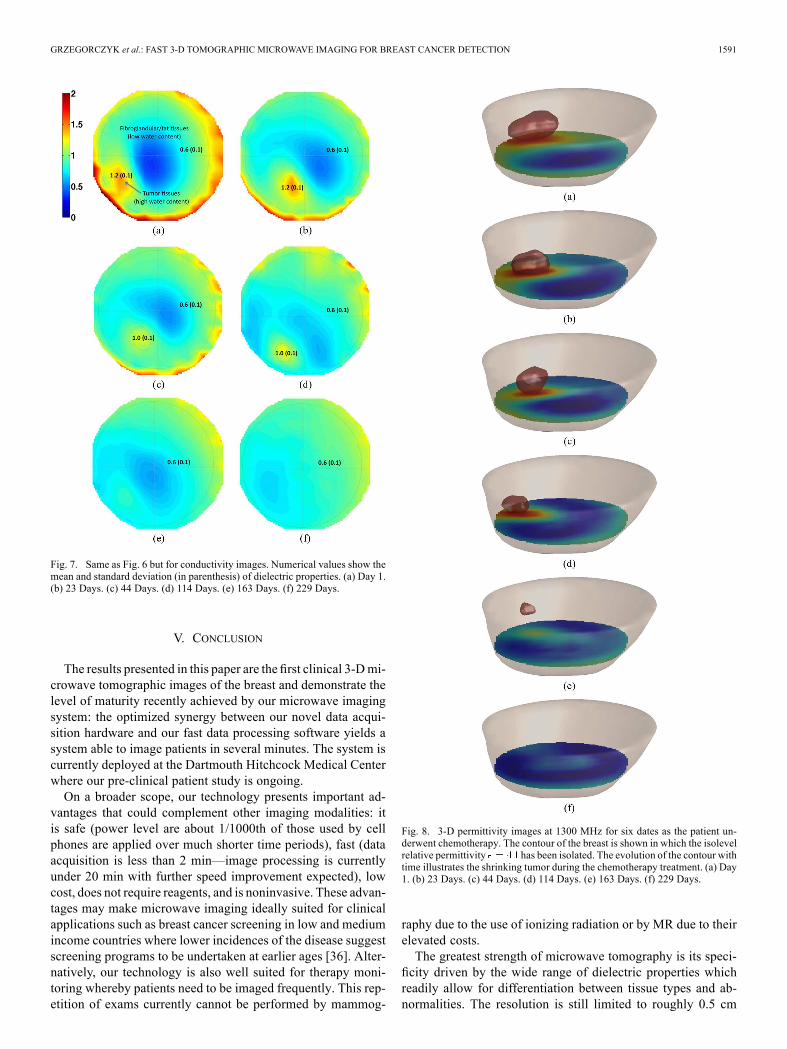
planes for 1300 MHz are presented in Figs. 6 and 7, respec-tively, where the 3-D images have been projected into a single2-D image through the coronal direction for the purpose of dis-play. The location of the tumor is obvious, and compares wellwith MR image interpretations. The sequence of microwave im-ages clearly shows the regression of the tumor throughout thetreatment. Statistical specificity information is indicated in thefigures directly, providing both the mean and standard deviationof the dielectric property values within the regions of interest.Differentiation between tumor and healthy tissues for both thepermittivity and conductivity is clear, with standard deviationsdecreasing as the tumor shrinks. Isolevels at a relative permit-tivity of are shown in Fig. 8 and again illustrate theshrinking size of the tumor with time.
GRZEGORCZYK et al.: FAST 3-D TOMOGRAPHIC MICROWAVE IMAGING FOR BREAST CANCER DETECTION 1591
Fig. 7. Same as Fig. 6 but for conductivity images. Numerical values show themean and standard deviation (in parenthesis) of dielectric properties. (a) Day 1.(b) 23 Days. (c) 44 Days. (d) 114 Days. (e) 163 Days. (f) 229 Days.
V. CONCLUSION
The results presented in this paper are thefirst clinical 3-Dmi-crowave tomographic images of the breast and demonstrate thelevel of maturity recently achieved by our microwave imagingsystem: the optimized synergy between our novel data acqui-sition hardware and our fast data processing software yields asystem able to image patients in several minutes. The system iscurrently deployed at the Dartmouth Hitchcock Medical Centerwhere our pre-clinical patient study is ongoing.On a broader scope, our technology presents important ad-
vantages that could complement other imaging modalities: itis safe (power level are about 1/1000th of those used by cellphones are applied over much shorter time periods), fast (dataacquisition is less than 2 min—image processing is currentlyunder 20 min with further speed improvement expected), lowcost, does not require reagents, and is noninvasive. These advan-tages may make microwave imaging ideally suited for clinicalapplications such as breast cancer screening in low and mediumincome countries where lower incidences of the disease suggestscreening programs to be undertaken at earlier ages [36]. Alter-natively, our technology is also well suited for therapy moni-toring whereby patients need to be imaged frequently. This rep-etition of exams currently cannot be performed by mammog-
Fig. 8. 3-D permittivity images at 1300 MHz for six dates as the patient un-derwent chemotherapy. The contour of the breast is shown in which the isolevelrelative permittivity has been isolated. The evolution of the contour withtime illustrates the shrinking tumor during the chemotherapy treatment. (a) Day1. (b) 23 Days. (c) 44 Days. (d) 114 Days. (e) 163 Days. (f) 229 Days.
raphy due to the use of ionizing radiation or by MR due to theirelevated costs.The greatest strength of microwave tomography is its speci-
ficity driven by the wide range of dielectric properties whichreadily allow for differentiation between tissue types and ab-normalities. The resolution is still limited to roughly 0.5 cm
1592 IEEE TRANSACTIONS ON MEDICAL IMAGING, VOL. 31, NO. 8, AUGUST 2012
and 1.0 cm in fatty and denser breasts, respectively. Althoughcomparable to other emerging modalities, in particular elastog-raphy, these figures can be improved by operating at higher fre-quencies and/or using a multi-frequency approach over an ultra-wide band. The hardware used in this work has the capability ofgathering data up to 3 GHz, where dielectric contrasts betweenbenign and malignant tissues are still sufficient to be captured.Algorithmic improvements under current investigation are ex-pected to allow us to report on higher resolution images in thenear future.
REFERENCES[1] L. Fass, “Imaging and cancer: A review,”Molecular Oncol., vol. 2, pp.
115–152, 2008.[2] M. Lazebnik, D. Popovic, L. McCartney, C. B. Watkins, M. J. Lind-
strom, J. Harter, S. Sewall, T. Ogilvie, A. Magliocco, T. M. Breslin,W. Temple, D. Mew, J. H. Booske, and M. Okoniewski, “A large-scalestudy of the ultrawideband microwave dielectric properties of normal,benign and malignant breast tissues obtained from cancer surgeries,”Phys. Med. Biol., vol. 52, no. 20, pp. 6093–6115, Oct. 2007.
[3] S. S. Chaudhary, R. K. Mishra, A. Swarup, and J. M. Thomas, “Di-electric-properties of normal and malignant human-breast tissues atradiowave and microwave-frequencies,” Indian J. Biochem. Biophys.,vol. 21, no. 1, pp. 76–79, 1984.
[4] W. T. Joines, Y. Zhang, C. X. Li, and R. L. Jirtle, “The measured elec-trical-properties of normal and malignant human tissues from 50 to 900MHz,” Med. Phys., vol. 21, no. 4, pp. 547–555, Apr. 1994.
[5] F. A. Duck, Physical Properties of Tissue: A Comprehensive ReferenceBook. London, U.K.: Academic, 1090.
[6] A. C. Society, Breast cancer facts and figures 2007–2008. Atlanta,GA, 2008.
[7] J. E. Joy, E. E. Penhoet, and D. B. Petitti, SavingWomen’s Lives: Strate-gies for Improving Breast Cancer Detection and Diagnosis. Wash-ington, DC: Nat. Acad. Press, 2005.
[8] L. Tabar, M. F. Yen, B. Vitak, H. H. T. Chen, R. A. Smith, and S.W. Duffy, “Mammography service screening and mortality in breastcancer patients,” Lancet Carcinoma Mortality, vol. 361, no. 9367, pp.1405–1410, Apr. 2003.
[9] J. Wei, H. P. Chan, M. A. Helvie, M. A. Roubidoux, B. Sahiner, L. M.Hadjiiski, C. A. Z. S. Paquerault, T. Chenevert, and M. M. Goodsitt,“Correlation between mammographic density and volumetric fibrog-landular tissue estimated on breast MR images,” Med. Phys. Screen.-Program, vol. 31, no. 4, pp. 933–942, Apr. 2004.
[10] X. Li, E. J. Bond, B. D. V. Veen, and S. C. Hagness, “An overviewof ultra-wideband microwave imaging via space-time beamformingfor early-stage breast-cancer detection,” IEEE Antennas Propag. Mag.,vol. 47, no. 1, pp. 19–34, Feb. 2005.
[11] S. K. Davis, H. Tandradinata, S. C. Hagness, and B. D. V. Veen, “Ul-trawideband microwave breast cancer detection: A detection-theoreticapproach using the generalized likelihood ratio test,” IEEE Trans.Biomed. Eng., vol. 52, no. 7, pp. 1237–1250, Jul. 2005.
[12] E. C. Fear, X. Li, S. C. Hagness, and M. A. Stuchly, “Confocal mi-crowave imaging for breast cancer detection: Localization of tumorsin three dimensions,” IEEE Trans. Biomed. Eng., vol. 49, no. 8, pp.812–822, Aug. 2002.
[13] X. Yun, E. C. Fear, and R. H. Johnston, “Compact antenna for radar-based breast cancer detection,” IEEE Trans. Antennas Propag., vol. 53,no. 8, pp. 2374–2380, Aug. 2005.
[14] R. Benjamin, I. J. Craddock, G. S. Hilton, S. Litobarski, E. Mc-Cutcheon, R. Nilavalan, and G. Crisp, “Microwave detection of buriedmines using non-contact, synthetic near-field focusing,” IEE-Proc.,Radar, Sonar Navigat., vol. 148, pp. 233–240, 2010.
[15] J. C. Bolomey, A. Izadnegahdar, L. Jofre, C. Pichot, G. Peronnet, andM. Solaimani, “Microwave diffraction tomography for biomedical ap-plications,” IEEE Trans. Microwave Theory Tech., vol. 30, no. 11, pp.1998–2000, Nov. 1982.
[16] J. C. Bolomey, L. Jofre, and G. Peronnet, “On the possible use of mi-crowave-active imaging for remote thermal sensing,” IEEE Trans. Mi-crowave Theory Tech., vol. 31, no. 9, pp. 777–781, Sep. 1983.
[17] L.W. Sha, L.W. Nolte, Z. Q. Zhang, and Q. H. Liu, “Performance anal-ysis for Bayesian microwave imaging in decision aided breast tumordiagnosis,” in Proc. 2002 IEEE Int. Symp. Biomed. Imag., 2002, pp.1039–1042.
[18] A. E. Souvorov, A. E. Bulyshev, S. Y. Semenov, R. H. Svenson, andG. P. Tatsis, “Two-dimensional computer analysis of a microwave flatantenna array for breast cancer tomography,” IEEE Trans. MicrowaveTheory Tech., vol. 48, no. 8, pp. 1413–1415, Aug. 2000.
[19] A. E. Bulyshev, S. Y. Semenov, A. E. Souvorov, R. H. Svenson, A.G. Nazarov, Y. E. Sizov, and G. P. Tatsis, “Computational modelingof three-dimensional microwave tomography of breast cancer,” IEEETrans. Biomed. Eng., vol. 48, no. 9, pp. 1053–1056, Sep. 2001.
[20] P. M. Meaney, M. W. Fanning, D. Li, S. P. Poplack, and K. D. Paulsen,“A clinical prototype for active microwave imaging of the breast,”IEEE Trans. Microwave Theory Tech., vol. 48, no. 11, pp. 1841–1853,Nov. 2000.
[21] P. M. Meaney, S. A. Pendergrass, M. W. Fanning, D. Li, and K. D.Paulsen, “Importance of using a reduced contrast coupling medium in2-D microwave breast imaging,” J. Electromagn. Waves Appl., vol. 17,no. 2, pp. 333–335, 2003.
[22] R. Ciocan andH. B. Jiang, “Model-basedmicrowave image reconstruc-tion: Simulations and experiments,” Med. Phys., vol. 31, Dec. 2004.
[23] S. Y. Semenov, A. E. Bulyshev, A. Abubakar, V. G. Posukh,Y. E. Sizov, A. E. Souvorov, P. M. van den Berg, and T. C.Williams, “Microwave-tomographic imaging of the high dielectric-contrast objects using different image-reconstruction approaches,”IEEE Trans. Microwave Theory Tech., vol. 53, no. 7, pp. 2284–2294,Jul. 2005.
[24] S. P. Poplack, K. D. Paulsen, A. Hartov, P. M. Meaney, B. Pogue, T.Tosteson, M. Grove, S. Soho, and W. Wells, “Electromagnetic breastimaging: Pilot results in women with abnormal mammography,” Radi-ology, vol. 243, pp. 350–359, 2007.
[25] K. D. Paulsen and P.M.Meaney, “Nonactive antenna compensation forfixed array microwave imaging: Part I—Model development,” IEEETrans. Med. Imag., vol. 18, no. 6, pp. 496–507, Jun. 1999.
[26] P. M. Meaney, F. Shubitidze, M. W. Fanning, M. Kmiec, N. R. Ep-stein, and K. D. Paulsen, “Surface wave multipath signals in near-fieldmicrowave imaging,” Int. J. Biomed. Imag., vol. 2012, 2012.
[27] P. M. Meaney, Q. Fang, T. Rubaek, E. Demidenko, and K. D. Paulsen,“Log transformation benefits parameter estimation in microwave to-mographic imaging,” Med. Phys., vol. 34, no. 6, pp. 2014–2023, Jun.2007.
[28] Q. Fang, P. M. Meaney, and K. D. Paulsen, “Microwave image re-construction of tissue property dispersion characteristics utilizing mul-tiple-frequency information,” IEEE Trans. Microwave Theory Tech.,vol. 52, no. 8, pp. 1866–1875, Aug. 2004.
[29] T. M. Grzegorczyk, P. M. Meaney, S. I. Jeon, and K. D. Paulsen, “Im-portance of phase unwrapping for the reconstruction of microwave to-mographic images,” Biomed. Opt. Exp., vol. 2, no. 2, pp. 315–330, Feb.1, 2011.
[30] B. T. Draine, “The discrete-dipole approximation and its application tointerstellar graphite grains,” Astrophys. J., vol. 333, pp. 848–872, Oct.15, 1988.
[31] J. J. Goodman, B. T. Draine, and P. J. Flatau, “Application of fast-Fourier-transform techniques to the discrete dipole approximation,”Opt. Lett., vol. 16, no. 15, pp. 1198–1200, Aug. 1, 1991.
[32] M. A. Yurkin and A. G. Hoekstra, “The discrete-dipole approximation:An overview and recent developments,” J. Quantitative SpectroscopyRadiative Transfer, vol. 106, pp. 558–589, 2007.
[33] J. A. Kong, Electromagnetic Wave Theory. Cambridge, MA: EMW,2000.
[34] P. M. Meaney, K. D. Paulsen, B. W. Pogue, and M. I. Miga, “Mi-crowave image reconstruction utilizing log-magnitude and unwrappedphase to improve high-contrast object recovery,” IEEE Trans. Med.Imag., vol. 20, no. 2, pp. 104–116, Feb. 2001.
[35] Q. Fang, P. M. Meaney, and K. D. Paulsen, “Viable three-di-mensional medical microwave tomography: Theory and numericalexperiments,” IEEE Trans. Antennas Propag. vol. 58, no. 2, pp.449–458, Feb. 2010.
[36] J. B. Harford, “Breast-cancer early detection in low-income andmiddle-income countries: Do what you can versus one size fits all,”Lancet Oncol., vol. 12, pp. 306–312, 2011.