2013-14 department of human services portfolio budget ... · portfolio budget statements 2013-14...
TRANSCRIPT

PORTFOLIO BUDGET STATEMENTS 2013-14 BUDGET RELATED PAPER NO. 1.10 HUMAN SERVICES PORTFOLIO
BUDGET INITIATIVES AND EXPLANATIONS OF APPROPRIATIONS SPECIFIED BY OUTCOMES AND PROGRAMS BY AGENCY
© Commonwealth of Australia 2013
ISBN 978-1-743-57769-1
This publication is available for your use under a Creative Commons BY Attribution 3.0 Australia licence, (http://creativecommons.org/licenses/by/3.0/au/deed.en), with the exception of the Commonwealth Coat of Arms, the Department of Human Services (Human Services) logo, photographs, images, signatures and where otherwise stated. The full licence terms are available from
http://creativecommons.org/licenses/by/3.0/au/legalcode.
Use of Human Services material under a Creative Commons BY Attribution 3.0 Australia licence requires you to attribute the work (but not in any way that suggests that Human Services endorses you or your use of the work).
Australian Government Department of Human Services material used 'as supplied'
Provided you have not modified or transformed Human Services material in any way including, for example, by changing the Human Services text; calculating percentage changes; graphing or charting data; or deriving new statistics from published Human Services statistics – then Human Services prefers the following attribution:
Source: The Australian Government Department of Human Services
Derivative material
If you have modified or transformed Human Services material, or derived new material from those of Human Services in any way, then Human Services prefers the following attribution:
Based on The Australian Government Department of Human Services data
Use of the Coat of Arms The terms under which the Coat of Arms can be used are set out on the It’s an Honour website (see www.itsanhonour.gov.au)
Other Uses Inquiries regarding this licence and any other use of this document are welcome at:
Chief Financial Officer, CFO Division, Department of Human Services, PO Box 3959, Manuka 2603, Australia.

iv
Abbreviations and conventions
The following notation may be used:
NEC/nec not elsewhere classified - nil .. not zero, but rounded to zero na not applicable (unless otherwise specified) nfp not for publication $m $ million $b $ billion
Figures in tables and in the text may be rounded. Figures in text are generally rounded to one decimal place, whereas figures in tables are generally rounded to the nearest thousand. Discrepancies in tables between totals and sums of components are due to rounding.
Enquiries
Should you have any enquiries regarding this publication please contact Mr Darren Box, Chief Financial Officer, Department of Human Services on (02) 6223 4433.
A copy of this document can be located on the Australian Government Budget website at: http://www.budget.gov.au.

v
USER GUIDE TO THE
PORTFOLIO BUDGET STATEMENTS

vi
USER GUIDE
The purpose of the 2013-14 Portfolio Budget Statements (PB Statements) is to inform Senators and Members of Parliament of the proposed allocation of resources to Government outcomes by agencies within the portfolio. Agencies receive resources from the annual appropriations acts, special appropriations (including standing appropriations and special accounts) and revenue from other sources.
A key role of the PB Statements is to facilitate the understanding of proposed annual appropriations in Appropriation Bills No. 1 and No. 2 2013-14 (or Appropriation Bill [Parliamentary Departments] No. 1 2013-14 for the parliamentary departments). In this sense the PB Statements are Budget related papers and are declared by the Appropriation Acts to be ‘relevant documents’ for the interpretation of the Acts under section 15AB of the Acts Interpretation Act 1901.
The PB Statements provide information, explanation and justification to enable Parliament to understand the purpose of each outcome proposed in the Bills.
As required under section 12 of the Charter of Budget Honesty Act 1998, non-general government sector entities are not consolidated into the Commonwealth general government sector fiscal estimates and accordingly, these entities are not reported in the PB Statements.

vii
CONTENTS
Portfolio Overview ........................................................................................................ 1 Human Services Portfolio Overview ................................................................................ 3
Agency Resources and Planned Performance .......................................................... 7 Department of Human Services ...................................................................................... 9
Portfolio Glossary ....................................................................................................... 57


PORTFOLIO OVERVIEW

3
HUMAN SERVICES PORTFOLIO OVERVIEW
Minister and Portfolio Responsibilities
On 1 July 2011 the Human Services Legislation Amendment Act 2011 integrated Medicare Australia and Centrelink into the Department of Human Services (the department).
The department provides policy advice on service delivery matters to government to ensure effective, innovative and efficient implementation of government service delivery. The department delivers a range of government and other payments and services to Australians, including through its three main programs:
• Centrelink delivers a range of government payments and services for retirees, the unemployed, families, carers, parents, people with disabilities, Indigenous Australians, and people from diverse cultural and linguistic backgrounds, and provides services at times of major change.
• Medicare looks after the health of Australians through efficient services and payments such as Medicare, the Pharmaceutical Benefits Scheme, the Australian Childhood Immunisation Register, and the Australian Organ Donor Register.
• Child Support provides support to separated parents to provide the financial and emotional support necessary for their children’s wellbeing.
The department also delivers other programs including CRS Australia, the Healthcare Identifiers Service, the Small Business Superannuation Clearing House and Early Release of Superannuation.
The Human Services portfolio includes Australian Hearing which is a non-General Government Sector entity. As such, Australian Hearing is not consolidated into the Commonwealth general government sector fiscal estimates. Accordingly, Australian Hearing is not reported in the Portfolio Budget Statements or Portfolio Additional Estimates Statements.
More comprehensive information on the department’s activities is available at the following website:
http://www.humanservices.gov.au

Portfolio Overview
4
Figure 1: Human Services Portfolio Structure and Outcomes
Portfolio Minister for Human Services Senator the Hon Jan McLucas
Department of Human Services Portfolio Secretary: Ms Kathryn Campbell, CSC
Outcome 1
Support individuals, families and communities to achieve greater self-sufficiency; through the delivery of policy advice and high quality accessible social, health and child support services and other payments; and support providers and businesses through convenient and efficient service delivery.
Portfolio Overview
5
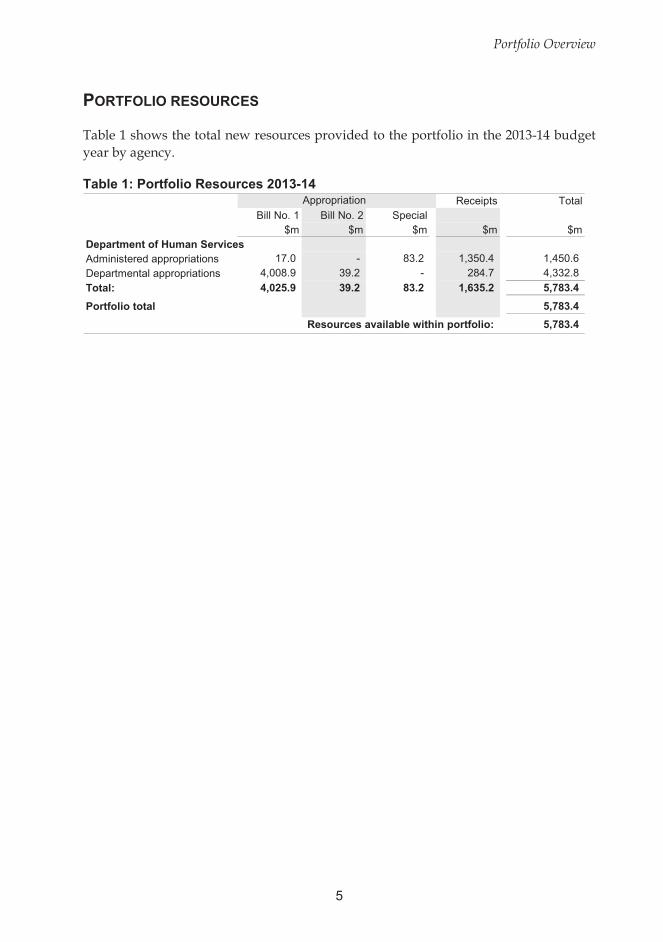
PORTFOLIO RESOURCES
Table 1 shows the total new resources provided to the portfolio in the 2013-14 budget year by agency.
Table 1: Portfolio Resources 2013-14 Receipts Total
Bill No. 1 Bill No. 2 Special$m $m $m $m $m
Department of Human ServicesAdministered appropriations 17.0 - 83.2 1,350.4 1,450.6
Departmental appropriations 4,008.9 39.2 - 284.7 4,332.8
Total: 4,025.9 39.2 83.2 1,635.2 5,783.4
Portfolio total 5,783.4
5,783.4
Appropriation
Resources available within portfolio:


7
AGENCY RESOURCES AND PLANNED PERFORMANCE
Department of Human Services ................................................................................... 9

9
Department of Human
Services
Agency Resources and Planned Performance

11
DEPARTMENT OF HUMAN SERVICES
Section 1: Agency Overview and Resources ........................................................... 13 1.1 Strategic Direction Statement ......................................................................... 13 1.2 Agency Resource Statement .......................................................................... 15 1.3 Budget Measures ............................................................................................ 19
Section 2: Outcomes and Planned Performance ..................................................... 26 2.1 Outcomes and Performance Information ........................................................ 26
Section 3: Explanatory Tables and Budgeted Financial Statements ..................... 36 3.1 Explanatory Tables ......................................................................................... 36 3.2 Budgeted Financial Statements ...................................................................... 40


13
DEPARTMENT OF HUMAN SERVICES
Section 1: Agency Overview and Resources
1.1 STRATEGIC DIRECTION STATEMENT
The Department of Human Services delivers social and health related services, through its Centrelink, Medicare, CRS Australia and Child Support programs. The department builds on its foundation of service excellence to improve the delivery of services to the Australian community. Through close collaboration with the community and partner agencies, the department plays an active role in developing new approaches to social and health related policy and service delivery.
The contribution of the department to the government’s agenda is reflected in its Outcome Statement which is to:
Support individuals, families and communities to achieve greater self-sufficiency; through the delivery of policy advice and high quality accessible social, health and child support services and other payments; and support providers and businesses through convenient and efficient service delivery.
The department works with other government agencies to provide access to government social and health related services that support self-sufficiency through:
the development of innovative and flexible service delivery policy that supports the implementation of government policy and programs;
the design and development of service delivery systems that are convenient and accessible; and meet the diverse needs of the community;
the provision of payments and services that match the circumstances of members of the community;
support for people to help them understand their rights and responsibilities and meet their obligations;
work with the public, private and non-government organisations, state and territory governments and other Australian Government departments and agencies to build partnerships for the delivery of services.
The department is the face of government to the majority of Australians and underpins the Commonwealth’s relationship with its people – as children and parents; as patients and carers; in study, in work and in retirement.

DHS Budget Statements
14
The department provides support to Australians facing financial hardship or structural adjustment and works with them through every stage of their lives.
The department’s payments and services support government outcomes in policy and program areas such as Aged Care, Personally Controlled Electronic Health Records, Clean Energy Future Household Assistance Package, Closing the Gap, Welfare Reform, the National Health Reforms, the National Health Funding Body, the Building Australia’s Future Workforce package and Emergency Management.
The department’s priorities include the following:
Improve our responsiveness to government and ensure that we understand and meet the priorities of the Minister and broader government.
Ensure we have controls and processes in place in order to meet our strategic objectives, manage risks and make effective use of our resources.
Make access to our services easier and more efficient. Where appropriate, move transactions from a personal service basis (face-to-face or phone) to self-managed mechanisms. Where possible, provide access to our services online, including from mobile devices.
Through direct involvement with the community and users of our services, build services that better meet the needs of individuals and more closely match the way that people wish to interact with government.
Seek input from relevant specialist sources, including service providers, practitioners and domain experts during the development of our services.
Work closely with our partner agencies to shape government policy on service delivery and to develop new and innovative services.
Continually evaluate the effectiveness of all our services using input from the community, users, service providers and our partner agencies.
Develop new, innovative and effective service approaches that support self-sufficiency and increase efficiency, while identifying and supporting those most in need.
Work with other government agencies at all levels (including state, territory and local) to develop service approaches that maximise the ease of access to government services for all Australians, regardless of the level of government.

DHS Budget Statements
15
1.2 AGENCY RESOURCE STATEMENT
Table 1.1 shows the total resources from all sources. The table summarises how resources will be applied by outcome and by administered and departmental classification.
Table 1.1: Department of Human Services Resource Statement — Budget Estimates for 2013-14 as at Budget May 2013
Estimate of Proposed Total Actual
Prior + at Budget = Estimate available
year amounts appropriation
available in
2013-14 2013-14 2013-14 2012-13$'000 $'000 $'000 $'000
Ordinary annual services1
Departmental appropriation
Prior year departmental appropriation 2 706,175 - 706,175 770,267 Departmental appropriation 3 4,008,936 4,008,936 4,039,132 s31 Relevant agency receipts 4 284,724 284,724 294,691Total 706,175 4,293,660 4,999,835 5,104,090
Administered expenses
Outcome 1 5- 16,958 16,958 14,874
Total - 16,958 16,958 14,874
Total ordinary annual services A 706,175 4,310,618 5,016,793 5,118,964
Other services6
Departmental non-operating Prior year departmental appropriation 2 - - - 7,515 Equity injections - 39,161 39,161 46,245
Total - 39,161 39,161 53,760
Total other services B - 39,161 39,161 53,760
Total available annual appropriations 706,175 4,349,779 5,055,954 5,172,724
Special appropriations
Special appropriations limited
by criteria/entitlementChild Support (Registration and Collection) Act 1988
Section 77 - unremitted deductions - 83,137 83,137 82,732
Section 78 - unexplained remittances - 50 50 50Total Special appropriations C - 83,187 83,187 82,782
Total appropriations excluding
Special accounts 706,175 4,432,966 5,139,141 5,255,506

DHS Budget Statements
16
Table 1.1: Department of Human Services Resource Statement — Budget Estimates for 2013-14 as at Budget May 2013 (continued)
Estimate of Proposed Total Actual
Prior + at Budget = Estimate available
year amounts appropriation
available in
2013-14 2013-14 2013-14 2012-13$'000 $'000 $'000 $'000
Special Accounts Opening balance 7
58,838 - 58,838 58,838 Appropriation receipts 8
- 85,327 85,327 84,912 Non-appropriation receipts to
Special Accounts 9- 1,350,444 1,350,444 1,343,869
Total Special Account D 58,838 1,435,771 1,494,609 1,487,619Total resourcingA+B+C+D 765,013 5,868,737 6,633,750 6,743,125Less appropriations drawn from annual or special appropriations above and credited to special accounts and/or CAC Act bodies through annual appropriations - 85,327 85,327 84,912
Total net resourcing for the Department of Human Services
765,013 5,783,410 6,548,423 6,658,213 Reader note: All figures are GST exclusive.
1. Appropriation Bill (No.1) 2013-14.
2. Estimated adjusted balance carried forward from previous year for annual appropriations.
3. Includes an amount of $115.2 million in 2013-14 for the Departmental Capital Budget (refer to Table 3.2.5 for further details). For accounting purposes this amount is designated as 'contributions by owners'.
4. Section 31 Relevant Agency receipts — estimate.
5. The Department of Human Services does not have any funding for an Administered Capital Budget for 2013-14.
6. Appropriation Bill (No.2) 2013-14.
7. Estimated opening balance for Special Accounts (excluding ‘Special Public Money’ held in accounts such as Services for Other Entities and Trust Moneys Special Accounts (SOETM)). For further details on special accounts see Table 3.1.2.
8. Includes Appropriation receipts of $2.140 million from the Department of Human Services annual Administered appropriation relating to Child Support payments and special appropriations of $83.187 million for 2013-14 included above.
9. Includes receipts from non-custodial parents for the Child Support Account.

DHS Budget Statements
17
Table 1.1: Department of Human Services Resource Statement — Budget Estimates for 2013-14 as at Budget May 2013 (continued)
Third party payments on behalf of and receipts from other agencies 2013-14 2012-13
$'000 $'000Payments made on behalf of other agencies
(disclosed in the respective Agency Resource Statement)
Special Appropriation - Social Security (Administration) Act 1999 62,542,601 58,073,946
21,362,101 20,600,438 Special Appropriation - Paid Parental Leave Act 2010 1,609,306 1,449,144 Annual Appropriation - Ex Gratia and Act of Grace Payments 3,775 8,821
Total FaHCSIA 85,517,783 80,132,349
21,818 10,000
Special Appropriation - Social Security (Administration) Act 1999 3,051,846 2,988,034
Total DIICCSRTE 3,073,664 2,998,034
8,000 212,258 1,000 10,784
Annual Appropriation - Disaster Income Recovery Subsidy 1,000 - Total AG 10,000 223,042
42,000 41,100 114,300 112,200
1,050 -
Total DIT 157,350 153,300
5,048,234 4,661,007 Special Appropriation - Social Security (Administration) Act 1999 15,463,900 14,788,807
Special Appropriation - Student Assistance Act 1973 294,025 288,816
198 198
82,941 110,900 Total DEEWR 20,889,298 19,849,728
7,608 11,949 Total DAFF 7,608 11,949
Department of Veterans' Affairs (DVA)
4,046,737 3,991,779
16,587 14,299
274 406 Total DVA 4,063,598 4,006,484
Annual Appropriation - Bass Strait Passenger Vehicle Equalisation Scheme
Department of Families, Housing, Community Servicesand Indigenous Affairs (FaHCSIA)
Special Appropriation - A New Tax System (Family Assistance) (Administration) Act 1999
Department of Industry, Innovation, Climate Change, Science, Research and Tertiary Education (DIICCSRTE)
Annual Appropriation - Liquefied Petroleum Gas Vehicle Scheme
Attorney-General's Department (AG)Special Appropriation - Social Security (Administration) Act 1999 - National Security and Criminal Justice
Department of Infrastructure and Transport (DIT)
Annual Appropriation - Ex Gratia assistance - New Zealand citizens
Annual Appropriation - Tasmanian Freight Equalisation Scheme
Annual Appropriation - Tasmanian Wheat Freight Scheme
Department of Education, Employment and Workplace Relations (DEEWR)
Special Appropriation - A New Tax System (Family Assistance) (Administration) Act 1999
Annual Appropriation - Compensation and Debt Relief Annual Appropriation - Child Care For Eligible Parents Undergoing Training
Department of Agriculture, Fisheries and Forestry (DAFF)Annual Appropriation - Transitional Farm Family Payment
Special Appropriation - Veterans’ Entitlements Act 1986 & Related ActsSpecial Appropriation - Military Rehabilitation and Compensation Act 2004Special Appropriation - Australian Participants in British Nuclear Tests (Treatment) Act 2006

DHS Budget Statements
18
Table 1.1: Department of Human Services Resource Statement — Budget Estimates for 2013-14 as at Budget May 2013 (continued)
Third party payments on behalf of and receipts from other agencies (continued)
2013-14 2012-13$'000 $'000
Payments made on behalf of other agencies (continued)
Department of Health and Ageing (DoHA)
18,838,215 18,459,874
244,034 83,087
9,882,989 9,471,178
300,095 279,772
4,916,721 5,135,350
98,602 96,589
1,391 334
9,853,374 9,309,702
9,388 6,457
76,864 63,326
Total DoHA 44,221,673 42,905,669
Australian Bureau of Statistics (ABS)5 63
Total ABS 5 63
Total Third party payments 157,940,979 150,280,618
(disclosed above within Departmental section 31)
Attorney-General's Department (AG) 1,183 1,943
Australian Electoral Commission (AEC) 4,058 272
Australian Taxation Office (ATO) 997 330
451 1,034
155,150 155,318
Department of Families, Housing, Community Services and Indigenous Affairs (FaHCSIA) 6,660 8,121
Department of Foreign Affairs and Trade (DFAT) 5,458 5,458
Department of Health and Ageing (DoHA) 15,876 14,982
Department of Immigration and Citizenship (DIAC) 291 689
25 633
Department of Veterans' Affairs (DVA) 35,339 27,883
225,488 216,663
Special Appropriation - National Health Act 1953 - Aids and Appliances
Special Appropriation - Health Insurance Act 1973 - Medical Benefits
Special Appropriation - Dental Benefits Act 2008
Special Appropriation - National Health Act 1953 - Pharmaceutical Benefits
Receipts received from other agencies for the provision of services
Total s31 Relevant agency receipts received for the provision of services
Special Appropriation - Private Health Insurance Act 2007
Special Appropriation - Medical Indemnity Agreement Act 2002
Special Appropriation - Midwife Professional Indemnity (Commonwealth Contribution) Scheme Act 2010
Special Appropriation - Aged Care Act 1997 (Total)
Special Account - Australian Childhood Immunisation Register
Special Appropriation - National Health Act 1953 - Continence Aids Payment
Department of Education, Employment and Workplace Relations (DEEWR)
Department of Broadband, Communications and the Digital Economy (DBCDE)
Department of Industry, Innovation, Climate Change, Science, Research and Tertiary Education (DIICCSRTE)
Annual Appropriation - Annual Health Survey
DHS Budget Statements
19
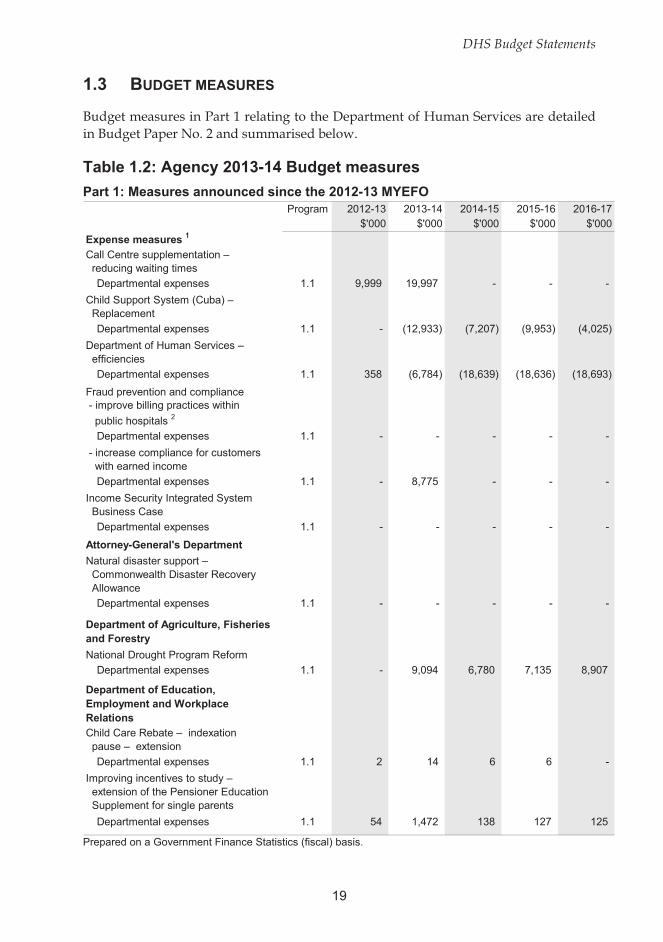
1.3 BUDGET MEASURES
Budget measures in Part 1 relating to the Department of Human Services are detailed in Budget Paper No. 2 and summarised below.
Table 1.2: Agency 2013-14 Budget measures Part 1: Measures announced since the 2012-13 MYEFO
Program 2012-13 2013-14 2014-15 2015-16 2016-17$'000 $'000 $'000 $'000 $'000
Expense measures 1
Call Centre supplementation – reducing waiting times
Departmental expenses 1.1 9,999 19,997 - - -
Child Support System (Cuba) – Replacement
Departmental expenses 1.1 - (12,933) (7,207) (9,953) (4,025)
Department of Human Services – efficiencies
Departmental expenses 1.1 358 (6,784) (18,639) (18,636) (18,693)
Fraud prevention and compliance - improve billing practices within
public hospitals 2
Departmental expenses 1.1 - - - - -
- increase compliance for customers with earned income
Departmental expenses 1.1 - 8,775 - - -
Income Security Integrated System Business Case
Departmental expenses 1.1 - - - - -
Attorney-General's Department
Natural disaster support – Commonwealth Disaster Recovery Allowance
Departmental expenses 1.1 - - - - -
Department of Agriculture, Fisheries and Forestry
National Drought Program Reform
Departmental expenses 1.1 - 9,094 6,780 7,135 8,907
Department of Education,Employment and WorkplaceRelationsChild Care Rebate – indexation pause – extension
Departmental expenses 1.1 2 14 6 6 -
Improving incentives to study – extension of the Pensioner Education Supplement for single parents
Departmental expenses 1.1 54 1,472 138 127 125
Prepared on a Government Finance Statistics (fiscal) basis.

DHS Budget Statements
20
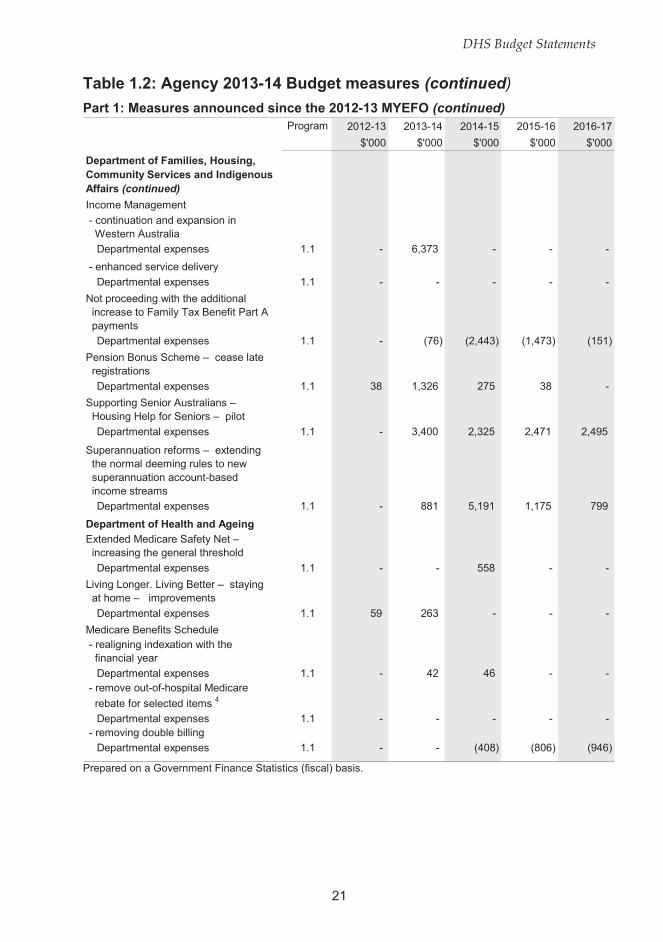
Table 1.2: Agency 2013-14 Budget measures (continued)
Part 1: Measures announced since the 2012-13 MYEFO (continued) Program 2012-13 2013-14 2014-15 2015-16 2016-17
$'000 $'000 $'000 $'000 $'000
Department of Education,Employment and WorkplaceRelations (continued)Improving incentives to work – extended Pensioner Concession Card entitlements for single parents
Departmental expenses 1.1 9 354 31 31 31
Jobs, Education and Training Child Care Fee Assistance – continuation
of bridging and foundation courses 3
Departmental expenses 1.1 289 394 - - -
Supporting jobseekers in the transition to work – increase and index the income free area for eligible income support recipients
Departmental expenses 1.1 - 1,215 54 48 44
Youth Attainment and Transitions – extension
Departmental expenses 1.1 - 173 26 - -
Department of Families, Housing, Community Services and Indigenous Affairs
Cape York Welfare Reform – Embedding and Building
Departmental expenses 1.1 - 3,061 2,616 1,253 -
Family and Parental Payments – change to rules for receiving payments overseas
Departmental expenses 1.1 - 2,701 1,728 569 642
Family payments reform
- continuing indexation pauses on upper income limits and supplements
Departmental expenses 1.1 - 267 (1,810) (2,407) (3,177)
- replacing the Baby Bonus
Departmental expenses 1.1 381 10,322 7,246 4,019 4,654
Family Tax Benefit and Child Care Assistance – realignment of time period for income reconciliation
Departmental expenses 1.1 1,435 6,003 2,199 749 (251)
Family Tax Benefit Part A – Changes to age of eligibility
Departmental expenses 1.1 - 3,458 1,037 392 267
Prepared on a Government Finance Statistics (fiscal) basis.
DHS Budget Statements
21
Table 1.2: Agency 2013-14 Budget measures (continued)
Part 1: Measures announced since the 2012-13 MYEFO (continued) Program 2012-13 2013-14 2014-15 2015-16 2016-17
$'000 $'000 $'000 $'000 $'000
Department of Families, Housing, Community Services and Indigenous Affairs (continued)
Income Management
- continuation and expansion in Western Australia
Departmental expenses 1.1 - 6,373 - - -
- enhanced service delivery
Departmental expenses 1.1 - - - - -
Not proceeding with the additional increase to Family Tax Benefit Part A payments
Departmental expenses 1.1 - (76) (2,443) (1,473) (151)
Pension Bonus Scheme – cease late registrations
Departmental expenses 1.1 38 1,326 275 38 -
Supporting Senior Australians – Housing Help for Seniors – pilot
Departmental expenses 1.1 - 3,400 2,325 2,471 2,495
Superannuation reforms – extending the normal deeming rules to new superannuation account-based income streams
Departmental expenses 1.1 - 881 5,191 1,175 799
Department of Health and Ageing
Extended Medicare Safety Net – increasing the general threshold
Departmental expenses 1.1 - - 558 - -
Living Longer. Living Better – staying at home – improvements
Departmental expenses 1.1 59 263 - - -
Medicare Benefits Schedule - realigning indexation with the financial year
Departmental expenses 1.1 - 42 46 - - - remove out-of-hospital Medicare
rebate for selected items 4
Departmental expenses 1.1 - - - - - - removing double billing
Departmental expenses 1.1 - - (408) (806) (946)
Prepared on a Government Finance Statistics (fiscal) basis.

DHS Budget Statements
22
Table 1.2: Agency 2013-14 Budget measures (continued)
Part 1: Measures announced since the 2012-13 MYEFO (continued) Program 2012-13 2013-14 2014-15 2015-16 2016-17
$'000 $'000 $'000 $'000 $'000Department of Health and Ageing (continued)
Mental Health Nurse Incentive Program
Departmental expenses 1.1 - 529 - - -
Pharmaceutical Benefits Scheme
- additional funding for further pricing
reform 5
Departmental expenses 1.1 - - - - -
- new and amended listings 6
Departmental expenses 1.1 27 12 13 12 11
- price changes
Departmental expenses 1.1 - - - - -
World Leading Cancer Care – National Bowel Cancer Screening Program – additional funding
Departmental expenses 1.1 - 2 2 2 2
Department of Immigration and Citizenship
Integrated Service Delivery Framework
Departmental expenses 1.1 - 10,942 14,158 12,246 12,177
Department of Industry, Innovation, Climate Change, Science, Research and Tertiary EducationStudent Start-up Scholarships – conversion to Income Contingent Loans
Departmental expenses 1.1 610 5,533 2,577 3,363 3,635
Department of Veterans' AffairsMental health services – expansion
Departmental expenses 1.1 - - (15) (20) (25)
Total expense measures
Administered - - - - -
Departmental 13,261 76,810 16,484 341 6,521
Total 13,261 76,810 16,484 341 6,521 Prepared on a Government Finance Statistics (fiscal) basis.

DHS Budget Statements
23
Table 1.2: Agency 2013-14 Budget measures (continued)
Part 1: Measures announced since the 2012-13 MYEFO (continued) Program 2012-13 2013-14 2014-15 2015-16 2016-17
$'000 $'000 $'000 $'000 $'000
Capital measures 1
Child Support System (Cuba) – Replacement
Departmental Capital 1.1 - 13,157 7,333 10,044 4,179
Department of Agriculture, Fisheries and Forestry
National Drought Program Reform
Departmental Capital 1.1 - 5,196 202 - -
Department of Families, Housing, Community Services and Indigenous Affairs
Family and Parental Payments – change to rules for receiving payments overseas
Departmental Capital 1.1 - 2,200 - - -
Family payments reform – replacing the Baby Bonus
Departmental Capital 1.1 94 3,814 4,946 1,530 987
Family Tax Benefit Part A – Changes to age of eligibility
Departmental Capital 1.1 - 1,828 207 125 -
Superannuation reforms – extending the normal deeming rules to new superannuation account-based income streams
Departmental Capital 1.1 - 256 323 - -
Supporting Senior Australians – Housing Help for Seniors – pilot
Departmental Capital 1.1 - 1,332 - - -
Department of Health and AgeingPharmaceutical Benefits Scheme – additional funding for further pricing
reform 5
Departmental Capital 1.1 - - - - -
Department of Immigration and Citizenship
Integrated Service Delivery Framework
Departmental Capital 1.1 - 1,776 - - -
Prepared on a Government Finance Statistics (fiscal) basis.
DHS Budget Statements
24
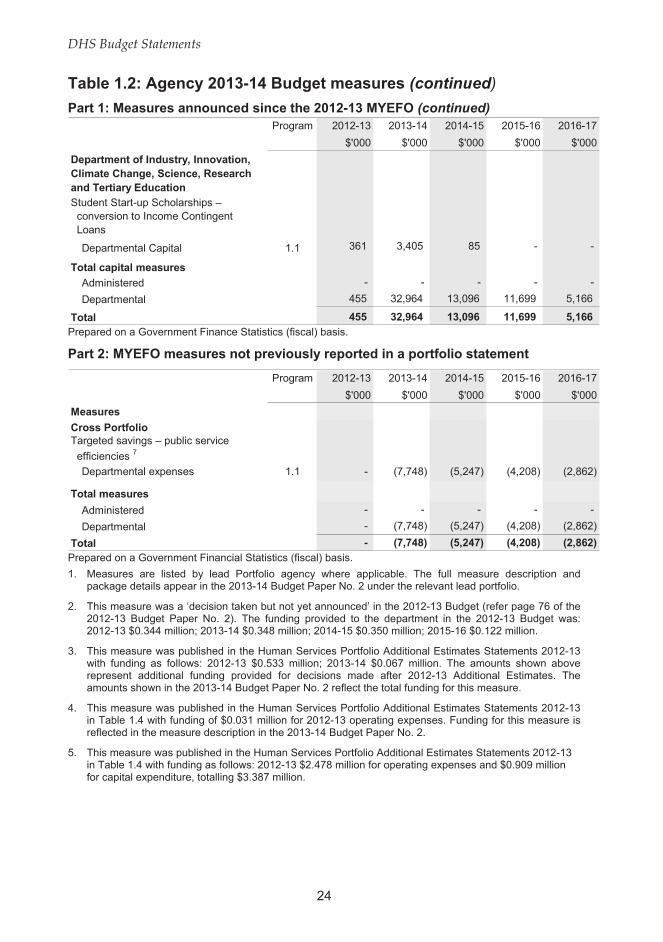
Table 1.2: Agency 2013-14 Budget measures (continued)
Part 1: Measures announced since the 2012-13 MYEFO (continued) Program 2012-13 2013-14 2014-15 2015-16 2016-17
$'000 $'000 $'000 $'000 $'000
Department of Industry, Innovation, Climate Change, Science, Research and Tertiary EducationStudent Start-up Scholarships – conversion to Income Contingent Loans
Departmental Capital 1.1 361 3,405 85 - -
Total capital measures
Administered - - - - -
Departmental 455 32,964 13,096 11,699 5,166
Total 455 32,964 13,096 11,699 5,166
Prepared on a Government Finance Statistics (fiscal) basis.
Part 2: MYEFO measures not previously reported in a portfolio statement
Program 2012-13 2013-14 2014-15 2015-16 2016-17
$'000 $'000 $'000 $'000 $'000
Measures
Cross PortfolioTargeted savings – public service
efficiencies 7
Departmental expenses 1.1 - (7,748) (5,247) (4,208) (2,862)
Total measures
Administered - - - - -
Departmental - (7,748) (5,247) (4,208) (2,862)
Total - (7,748) (5,247) (4,208) (2,862)
Prepared on a Government Financial Statistics (fiscal) basis.
1. Measures are listed by lead Portfolio agency where applicable. The full measure description and package details appear in the 2013-14 Budget Paper No. 2 under the relevant lead portfolio.
2. This measure was a ‘decision taken but not yet announced’ in the 2012-13 Budget (refer page 76 of the 2012-13 Budget Paper No. 2). The funding provided to the department in the 2012-13 Budget was: 2012-13 $0.344 million; 2013-14 $0.348 million; 2014-15 $0.350 million; 2015-16 $0.122 million.
3. This measure was published in the Human Services Portfolio Additional Estimates Statements 2012-13 with funding as follows: 2012-13 $0.533 million; 2013-14 $0.067 million. The amounts shown above represent additional funding provided for decisions made after 2012-13 Additional Estimates. The amounts shown in the 2013-14 Budget Paper No. 2 reflect the total funding for this measure.
4. This measure was published in the Human Services Portfolio Additional Estimates Statements 2012-13 in Table 1.4 with funding of $0.031 million for 2012-13 operating expenses. Funding for this measure is reflected in the measure description in the 2013-14 Budget Paper No. 2.
5. This measure was published in the Human Services Portfolio Additional Estimates Statements 2012-13 in Table 1.4 with funding as follows: 2012-13 $2.478 million for operating expenses and $0.909 million for capital expenditure, totalling $3.387 million.

DHS Budget Statements
25
Table 1.2: Agency 2013-14 Budget measures (continued) 6. This measure was published in the Human Services Portfolio Additional Estimates Statements 2012-13.
This included funding decided by the Government after MYEFO as follows: 2012-13 $0.185 million; 2013-14 $0.256 million; 2014-15 $0.273 million; 2015-16 $0.314 million; 2016-17 $0.350 million. The amounts shown in the table above represent additional funding provided for decisions made after 2012-13 Additional Estimates. The amounts shown in the 2013-14 Budget Paper No. 2 reflect the total funding for this measure since MYEFO.
7. The fiscal impact reported for the measure “Targeted savings – public service efficiencies” is in addition to the impact previously reported for this measure in the 2012-13 Human Services Portfolio Additional Estimates Statements.

DHS Budget Statements
26
Section 2: Outcomes and Planned Performance
2.1 OUTCOMES AND PERFORMANCE INFORMATION
Government outcomes are the intended results, impacts or consequences of actions by the government on the Australian community. Commonwealth programs are the primary vehicle by which government agencies achieve the intended results of their outcome statements. Agencies are required to identify the programs which contribute to government outcomes over the Budget and forward years.
Each outcome is described below together with its related programs, specifying the performance indicators and targets used to assess and monitor the performance of the Department of Human Services in achieving government outcomes.
Outcome 1: Support individuals, families and communities to achieve greater self-sufficiency; through the delivery of policy advice and high quality accessible social, health and child support services and other payments; and support providers and businesses through convenient and efficient service delivery.
Outcome Expense Statement
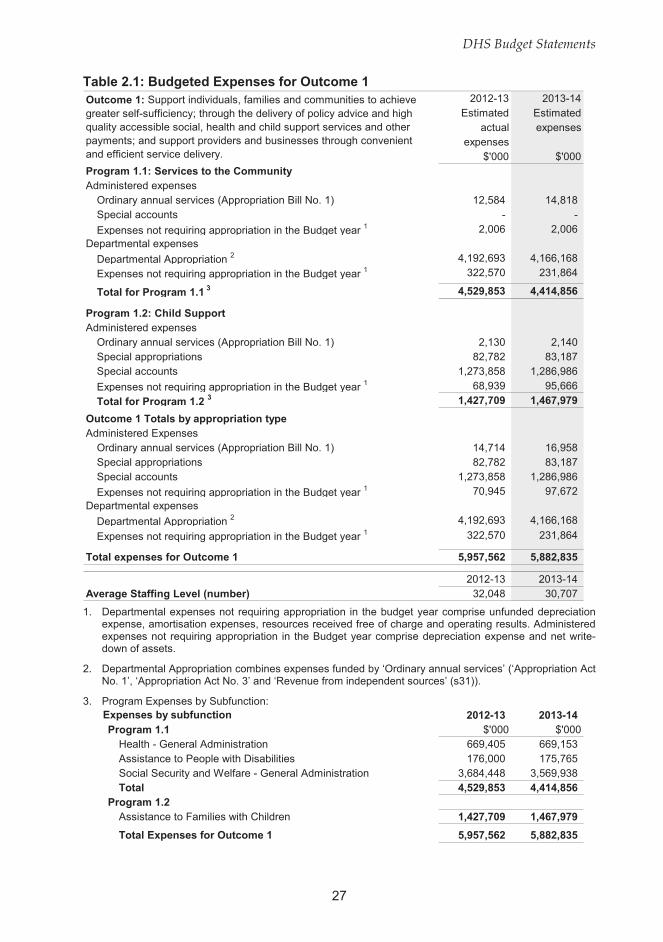
Table 2.1 provides an overview of the total expenses for Outcome 1 by program.
DHS Budget Statements
27
Table 2.1: Budgeted Expenses for Outcome 1 2012-13 2013-14
Estimated Estimatedactual expenses
expenses$'000 $'000
Program 1.1: Services to the CommunityAdministered expenses
Ordinary annual services (Appropriation Bill No. 1) 12,584 14,818 Special accounts - -
Expenses not requiring appropriation in the Budget year 1 2,006 2,006 Departmental expenses
Departmental Appropriation 2 4,192,693 4,166,168
Expenses not requiring appropriation in the Budget year 1 322,570 231,864
Total for Program 1.1 3 4,529,853 4,414,856
Program 1.2: Child SupportAdministered expenses
Ordinary annual services (Appropriation Bill No. 1) 2,130 2,140 Special appropriations 82,782 83,187 Special accounts 1,273,858 1,286,986
Expenses not requiring appropriation in the Budget year 1 68,939 95,666
Total for Program 1.2 3 1,427,709 1,467,979
Outcome 1 Totals by appropriation typeAdministered Expenses
Ordinary annual services (Appropriation Bill No. 1) 14,714 16,958 Special appropriations 82,782 83,187 Special accounts 1,273,858 1,286,986
Expenses not requiring appropriation in the Budget year 1 70,945 97,672 Departmental expenses
Departmental Appropriation 2 4,192,693 4,166,168
Expenses not requiring appropriation in the Budget year 1 322,570 231,864
Total expenses for Outcome 1 5,957,562 5,882,835
2012-13 2013-14Average Staffing Level (number) 32,048 30,707
Outcome 1: Support individuals, families and communities to achieve greater self-sufficiency; through the delivery of policy advice and high quality accessible social, health and child support services and other payments; and support providers and businesses through convenient and efficient service delivery.
1. Departmental expenses not requiring appropriation in the budget year comprise unfunded depreciation
expense, amortisation expenses, resources received free of charge and operating results. Administered expenses not requiring appropriation in the Budget year comprise depreciation expense and net write-down of assets.
2. Departmental Appropriation combines expenses funded by ‘Ordinary annual services’ (‘Appropriation Act No. 1’, ‘Appropriation Act No. 3’ and ‘Revenue from independent sources’ (s31)).
3. Program Expenses by Subfunction: Expenses by subfunction 2012-13 2013-14
Program 1.1 $'000 $'000Health - General Administration 669,405 669,153 Assistance to People with Disabilities 176,000 175,765 Social Security and Welfare - General Administration 3,684,448 3,569,938 Total 4,529,853 4,414,856
Program 1.2Assistance to Families with Children 1,427,709 1,467,979
Total Expenses for Outcome 1 5,957,562 5,882,835

DHS Budget Statements
28
Contributions to Outcome 1
Program 1.1: Services to the Community
Program 1.1 Objective
Individuals, families and communities are supported to achieve greater self-sufficiency.
• Policy development and decision-making is supported by the provision of information and service delivery policy advice.
• Efficient and responsive service delivery.
• People have access to high quality social, health and child support services and payments appropriate to their circumstances.
• Providers and businesses are supported by a service delivery system that facilitates payment transfers, referrals and other services.
Linked to:
Program 1.1 – Services to the Community is linked to the Outcomes and Programs of other agencies as shown below. A detailed list of the services delivered under various service agreements is published in the Department of Human Services annual report:
• Attorney-General’s Department: 1.2, 1.7
– AUSTRAC: 1.1
– CRIMTRAC: 1.1
– Family Court: 1.1
– Federal Circuit Court: 1.1
• Department of Agriculture, Fisheries and Forestry: 1.1, 1.11, 1.12
– Australian Fisheries Management Authority: 1.1
• Department of Broadband, Communications and the Digital Economy: 1.3
• Department of Defence:
– Department of Veterans’ Affairs: 1.1, 1.2, 1.3, 1.4, 1.5, 2.1, 2.2, 2.3, 2.4, 2.5, 2.6
• Department of Education, Employment and Workplace Relations: 1.1, 1.2, 2.2, 2.3, 2.8, 2.9, 3.1, 3.2, 3.5
• Department of Families, Housing, Community Services and Indigenous Affairs (including Family Assistance Office): 1.2, 1.3, 2.1, 3.1, 3.3, 3.4, 3.5, 4.1, 4.2, 5.2, 5.3

DHS Budget Statements
29
Program 1.1 Objective (continued)
Linked to (continued):
– Torres Strait Regional Authority: 1.1
• Department of Finance and Deregulation:
– Australian Electoral Commission: 1.1, 1.2, 1.3
• Department of Foreign Affairs and Trade: 2.1, 2.2
• Department of Health and Ageing: 1.1, 1.5, 2.1, 2.2, 2.4, 3.1, 3.2, 4.4, 4.5, 4.6, 5.2, 5.3, 7.1, 8.1, 9.1, 10.2, 11.1, 12.1, 13.1, 13.2
– Australian Organ and Tissue Donation and Transplantation Authority: 1.1
– Professional Services Review: 1.1
• Department of Immigration and Citizenship: 2.1, 4.1, 6.1
• Department of Infrastructure and Transport: 2.2
• Department of Industry, Innovation, Climate Change, Science, Research and Tertiary Education: 1.1, 3.3, 3.4, 3.5, 3.6
• Department of the Treasury:
– Australian Bureau of Statistics: 1.1
– Australian Taxation Office: 1.1, 1.16
– Australian Securities and Investments Commission: 1.1
The department also has links with various state and territory governments and countries with which Australia has an International Social Security Agreement.
DHS Budget Statements
30
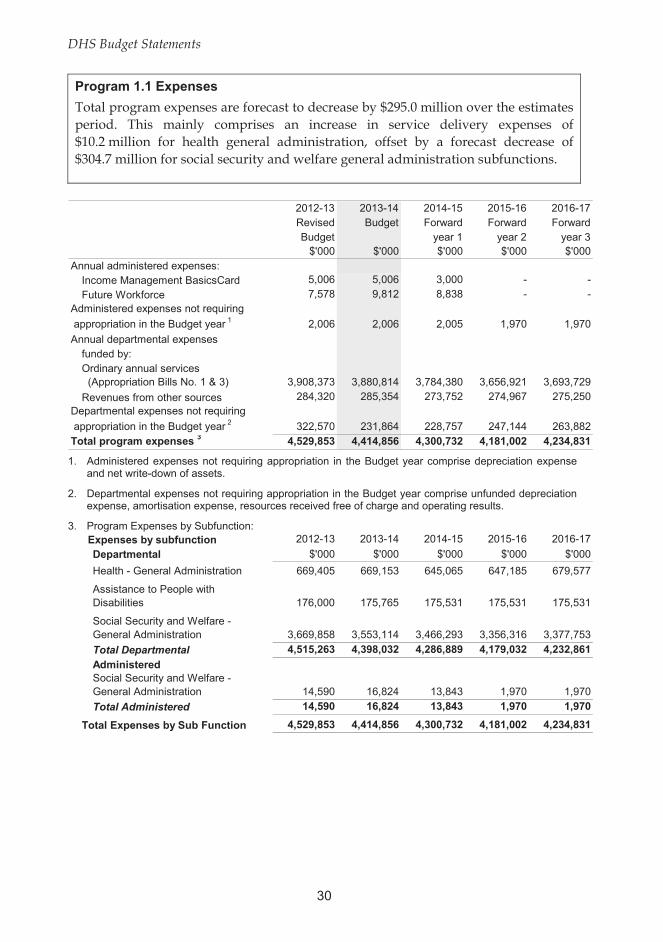
Program 1.1 Expenses
Total program expenses are forecast to decrease by $295.0 million over the estimates period. This mainly comprises an increase in service delivery expenses of $10.2 million for health general administration, offset by a forecast decrease of $304.7 million for social security and welfare general administration subfunctions.
2012-13 2013-14 2014-15 2015-16 2016-17Revised Budget Forward Forward ForwardBudget year 1 year 2 year 3
$'000 $'000 $'000 $'000 $'000Annual administered expenses:
Income Management BasicsCard 5,006 5,006 3,000 - -
Future Workforce 7,578 9,812 8,838 - - Administered expenses not requiring
appropriation in the Budget year 1 2,006 2,006 2,005 1,970 1,970
Annual departmental expensesfunded by:Ordinary annual services (Appropriation Bills No. 1 & 3) 3,908,373 3,880,814 3,784,380 3,656,921 3,693,729
Revenues from other sources 284,320 285,354 273,752 274,967 275,250 Departmental expenses not requiring
appropriation in the Budget year 2 322,570 231,864 228,757 247,144 263,882 Total program expenses 3 4,529,853 4,414,856 4,300,732 4,181,002 4,234,831
1. Administered expenses not requiring appropriation in the Budget year comprise depreciation expense and net write-down of assets.
2. Departmental expenses not requiring appropriation in the Budget year comprise unfunded depreciation expense, amortisation expense, resources received free of charge and operating results.
3. Program Expenses by Subfunction: Expenses by subfunction 2012-13 2013-14 2014-15 2015-16 2016-17
Departmental $'000 $'000 $'000 $'000 $'000
Health - General Administration 669,405 669,153 645,065 647,185 679,577
Assistance to People withDisabilities 176,000 175,765 175,531 175,531 175,531
Social Security and Welfare - General Administration 3,669,858 3,553,114 3,466,293 3,356,316 3,377,753
Total Departmental 4,515,263 4,398,032 4,286,889 4,179,032 4,232,861
AdministeredSocial Security and Welfare - General Administration 14,590 16,824 13,843 1,970 1,970
Total Administered 14,590 16,824 13,843 1,970 1,970
Total Expenses by Sub Function 4,529,853 4,414,856 4,300,732 4,181,002 4,234,831
DHS Budget Statements
31
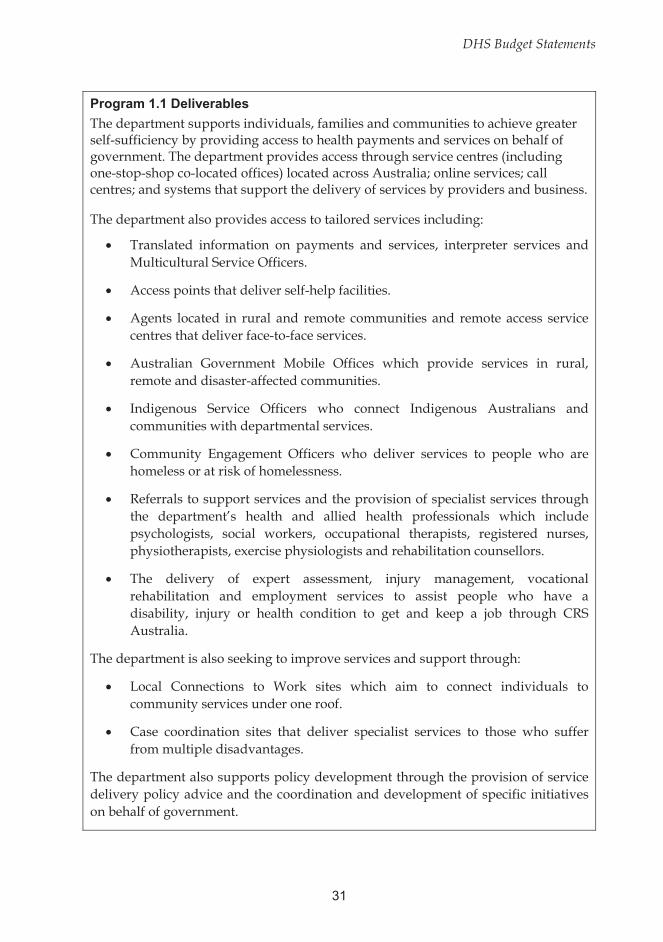
Program 1.1 Deliverables
The department supports individuals, families and communities to achieve greater self-sufficiency by providing access to health payments and services on behalf of government. The department provides access through service centres (including one-stop-shop co-located offices) located across Australia; online services; call centres; and systems that support the delivery of services by providers and business.
The department also provides access to tailored services including:
Translated information on payments and services, interpreter services and Multicultural Service Officers.
Access points that deliver self-help facilities.
Agents located in rural and remote communities and remote access service centres that deliver face-to-face services.
Australian Government Mobile Offices which provide services in rural, remote and disaster-affected communities.
Indigenous Service Officers who connect Indigenous Australians and communities with departmental services.
Community Engagement Officers who deliver services to people who are homeless or at risk of homelessness.
Referrals to support services and the provision of specialist services through the department’s health and allied health professionals which include psychologists, social workers, occupational therapists, registered nurses, physiotherapists, exercise physiologists and rehabilitation counsellors.
The delivery of expert assessment, injury management, vocational rehabilitation and employment services to assist people who have a disability, injury or health condition to get and keep a job through CRS Australia.
The department is also seeking to improve services and support through:
Local Connections to Work sites which aim to connect individuals to community services under one roof.
Case coordination sites that deliver specialist services to those who suffer from multiple disadvantages.
The department also supports policy development through the provision of service delivery policy advice and the coordination and development of specific initiatives on behalf of government.

DHS Budget Statements
32
Program 1.1 Key Performance Indicators (KPIs)
The department’s performance against its objectives will be demonstrated through the following KPIs:
2012-13 2013-14 2014-15 2015-16 2016-17Key Performance Revised Budget Forward Forward Forward
Indicators 1 budget Target year 1 year 2 year 3
Minister is satisfied with the quality, relevance and timeliness of ministerial briefing, correspondence and other departmental advice.
Satisfied Satisfied Satisfied Satisfied Satisfied
Achievement of customer satisfaction standards.
≥85% ≥85% ≥85% ≥85% ≥85%
Satisfaction with Medicare provider service delivery.
≥70% ≥70% ≥70% ≥70% ≥70%
Achievement of payment quality standards.
Centrelink: Delivery of correct payments. ≥95% ≥95% ≥95% ≥95% ≥95%
Medicare: Delivery of accurate medical and pharmaceutical benefits and services.
≥98% ≥98% ≥98% ≥98% ≥98%
Key initiatives delivered within timeframes
and on budget and outcomes are achieved 2
Service Delivery Reform. Achieved Achieved Achieved Achieved Achieved
Income Management Budget measures. 3 Achieved Achieved Achieved Achieved N/A
Fraud Prevention and Compliance Budget measures.
Achieved Achieved Achieved Achieved Achieved
Household Assistance Package. Achieved Achieved Achieved Achieved Achieved
Effective working arrangements with other government departments are in place which support the department's contribution to policy development through service delivery policy advice.
Strategies in place to ensure reporting against MOU and Bilateral Management arrangements are effective.
Effective Effective Effective Effective Effective
Government stakeholder assessment of the
portfolio's agility, flexibility and responsiveness.43.6 3.8 4.0 4.0 4.0

DHS Budget Statements
33
Program 1.1 Key Performance Indicators (continued) 2012-13 2013-14 2014-15 2015-16 2016-17
Key Performance Revised Budget Forward Forward ForwardIndicators budget Target year 1 year 2 year 3
Support economic and social participation of Indigenous Australians through the timely delivery of appropriate departmental payments and services.
Centrelink: Delivery of correct payments for Indigenous Australians.
≥95% ≥95% ≥95% ≥95% ≥95%
CRS Australia to maximise workforce participation rates for government at or above the market average for job seekers that remain in employment for 13 weeks.
≥70% ≥70% ≥70% ≥70% ≥70%
Increase in the proportion of self-managed transactions and electronic interactions.
1% increase
on 2011-12
1%increase
on 2012-13
1%increase
on 2013-14
1%increase
on 2014-15
1%increase
on 2015-16
Achievement of face-to-face, call and processing service level standards.Face-to-face: Average wait time. ≤15
minutes≤15
minutes≤15
minutes≤15
minutes≤15
minutes
Telephony: Average speed of answer:
- service users. ≤16 minutes
≤16 minutes
≤16 minutes
≤16 minutes
≤16 minutes
- providers. ≤30 seconds
≤30 seconds
≤30 seconds
≤30 seconds
≤30 seconds
Processing: Percentage of claims processed within standard - service users.
≥82% ≥82% ≥82% ≥82% ≥82%
Achievement of payment integrity standards.
Centrelink: Debt under recovery. ≥60% ≥60% ≥60% ≥60% ≥60%
Medicare: Completed audit and review cases. 2,500 2,500 2,500 2,500 2,500
1. Duplicated KPIs from 2012-13 have been removed for 2013-14.
2. The list of key initiatives is determined by government priorities each financial year.
3. Funding for Income Management Budget measures terminates in 2015-16.
4. Annual government stakeholder survey - out of 5 index points.

DHS Budget Statements
34
Program 1.2: Child Support
Program 1.2 Objective
The department’s Child Support Program is designed to ensure that both parents contribute to the cost of their children, according to their capacity. The scheme is expected to transfer $3.2 billion between parents for the benefit of approximately 1.2 million children in 2013-14.
Linked to :
Program 1.2 – Child Support is linked to Department of Families, Housing, Community Services and Indigenous Affairs Program 1.2. A detailed list of the services delivered under various service agreements is published in the Department of Human Services annual report.
Program 1.2 Expenses
Total Program Expenses are forecast to increase by $153.3 million over the estimates period, mainly due to increases in amounts of child support, being transferred between parents through the Child Support Special Account, which are forecast to increase by 2.5 per cent per annum.
2012-13 2013-14 2014-15 2015-16 2016-17Revised Budget Forward Forward ForwardBudget year 1 year 2 year 3
$'000 $'000 $'000 $'000 $'000Annual administered expenses:
Child Support dishonoured cheques and other shortfalls 2,130 2,140 2,194 2,249 2,305
Special Appropriations:Child Support Act 1
- s77 - unremitted deductions 82,732 83,137 85,271 87,404 89,591 - s78 - unexplained remittances 50 50 50 50 50
Special Account Expenses: Child Support Account 1,273,858 1,286,986 1,319,799 1,353,325 1,387,689
Administered expenses not requiring
appropriation in the Budget year 268,939 95,666 97,532 99,435 101,385
Total program expenses 3 1,427,709 1,467,979 1,504,846 1,542,463 1,581,020
1. Child Support (Registration and Collection) Act 1988.
2. Expenses not requiring appropriation in the budget year comprise net write-down of Child Support receivables.
3. Program 1.2 expenses are classified against the Assistance to Families with Children subfunction.

DHS Budget Statements
35
Program 1.2 Deliverables
Collect and disburse child support payments.
Program 1.2 Key Performance Indicators (KPIs)
2012-13 2013-14 2014-15 2015-16 2016-17
Key Performance Revised Budget Forward Forward ForwardIndicators Budget Target year 1 year 2 year 3
Total amount of child support transferred between parents.
$3.1 billion
$3.2 billion
$3.2 billion
$3.2 billion
$3.2 billion
Child support collection rate (Child Support collect only).
≥91.7% ≥91.7% ≥91.7% ≥91.7% ≥91.7%
Percentage of private collect cases to total active cases (Child Support collect and private collect cases).
≥52% ≥52% ≥52% ≥52% ≥52%
Percentage of domestic active paying parents without debt.
≥73.5% ≥73.5% ≥73.5% ≥73.5% ≥73.5%

DHS Budget Statements
36
Section 3: Explanatory Tables and Budgeted Financial Statements Section 3 presents explanatory tables and budgeted financial statements which provide a comprehensive snapshot of agency finances for the 2013-14 budget year. It explains how budget plans are incorporated into the financial statements and provides further details of the reconciliation between appropriations and program expenses, movements in administered funds, special accounts and government Indigenous expenditure.
3.1 EXPLANATORY TABLES
3.1.1 Movement of Administered Funds Between Years
Administered funds can be provided for a specified period, for example under annual Appropriation Acts. Funds not used in the specified period with the agreement of the Finance Minister may be moved to a future year. Table 3.1.1 shows the movement of administered funds approved between years.
Table 3.1.1: Movement of Administered Funds Between Years There are no movements of administered funds between years for the Department of Human Services.
3.1.2 Special Accounts
Special Accounts provide a means to set aside and record amounts used for specified purposes. Special Accounts can be created by a Finance Minister’s Determination under the FMA Act or under separate enabling legislation. Table 3.1.2 shows the expected additions (receipts) and reductions (payments) for each account used by the department.

DHS Budget Statements
37
Table 3.1.2: Estimates of Special Account Flows and Balances Opening Closingbalance Receipts Payments Adjustments balance2013-14 2013-14 2013-14 2013-14 2013-142012-13 2012-13 2012-13 2012-13 2012-13
Outcome $'000 $'000 $'000 $'000 $'000
Child Support Account 1 (A) 1 58,838 1,435,771 (1,435,771) - 58,838
58,838 1,428,781 (1,428,781) - 58,838
1 74,427 275,191 (275,803) - 73,815 75,029 270,591 (271,193) - 74,427
Superannuation Clearing 1 15,982 1,113,428 (1,105,530) - 23,880
House Special Account 3 (A) 8,948 745,159 (738,125) - 15,982
1 - - - - -
- - - - -
Total special accounts 2013-14 Budget Estimate 149,247 2,824,390 (2,817,104) - 156,533
Total special accounts2012-13 Estimated Actual 142,815 2,444,531 (2,438,099) - 149,247
Recovery of Compensationfor Health Care & Other
Services Special Account 2 (A)
Services for Other Entitiesand Trust Moneys –Department of Human
Services Special Account 4
(A) & (D)
(A) = Administered (D) = Departmental
1. Child Support Account - s73 Child Support (Registration and Collection) Act 1988. Purpose: For the receipt of maintenance payments and the making of regular and timely payments to custodial parents.
2. Recovery of Compensation for Health Care and Other Services Special Account - s20 FMA Act Determination 2005/24. Purpose: To credit monies for the purpose of recovery of compensation following a judgement or settlement under the Health and Other Services (Compensation) Act 1995 and;
(a) to pay the claimant, or the claimant’s authorised representative, amounts credited to the Special Account; and
(b) to reduce the balance of the Special Account (and, therefore, the available appropriation for the Special Account) without making a real or notional payment; and
(c) to repay amounts where an Act or other law requires or permits the repayment of an amount received.
3. Superannuation Clearing House Special Account - s20 FMA Act Determination 2010/05. Purpose: To receive amounts for the purpose of the Superannuation Clearing House and:
(a) make payments to superannuation funds on behalf of small business employers in performance of the functions of the Superannuation Clearing House;
(b) repay to the original payer, amounts credited to the Special Account, including the residual after any necessary payments are made for the purpose mentioned in paragraph (a);
(c) reduce the balance of the Special Account (and, therefore the available appropriation for the Special Account) without making a real or notional payment; and
(d) repay amounts where an Act or other law requires or permits the repayment of an amount received.
4. Services for Other Entities and Trust Moneys - Department of Human Services Special Account - s20(1) FMA Act Determination 2011/13. Purpose: To credit and debit monies for the purpose of:
(a) disbursing amounts held on trust or otherwise for the benefit of a person other than the Commonwealth;

DHS Budget Statements
38
Table 3.1.2: Estimates of Special Account Flows and Balances (continued)
(b) disbursing amounts in connection with services performed on behalf of other governments and bodies that are not FMA Act agencies;
(c) repaying amounts where an Act or other law requires or permits the repayment of an amount received; and
(d) reducing the balance of the Special Account (and, therefore, the available appropriation for the Account) without making a real or notional payment.

DHS Budget Statements
39
3.1.3 Australian Government Indigenous Expenditure
Table 3.1.3: Australian Government Indigenous Expenditure (AGIE)
Other Total ProgramBill Bill Special Total
No. 1 No. 2 approp approp
$'000 $'000 $'000 $'000 $'000 $'000
Department of Human ServicesOutcome 1
Administered 2013-14 4,341 - - 4,341 - 4,341 1.1
Administered 2012-13 4,341 - - 4,341 - 4,341 1.1
Departmental 2013-14 171,083 - - 171,083 - 171,083 1.1
Departmental 2012-13 178,266 - - 178,266 101 178,367 1.1
Total outcome 2013-14 175,424 - - 175,424 - 175,424
Total outcome 2012-13 182,607 - - 182,607 101 182,708
Total Department of Human Services
Total Administered 2013-14 4,341 - - 4,341 - 4,341
Total Administered 2012-13 4,341 - - 4,341 - 4,341
Total Departmental 2013-14 171,083 - - 171,083 - 171,083
Total Administered 2012-13 178,266 - - 178,266 101 178,367
Total AGIE 2013-14 175,424 - - 175,424 - 175,424
Total AGIE 2012-13 182,607 - - 182,607 101 182,708
Appropriations

DHS Budget Statements
40
3.2 BUDGETED FINANCIAL STATEMENTS
3.2.1 Differences in Agency Resourcing and Financial Statements
3.2.2 Analysis of Budgeted Financial Statements
Budgeted Departmental Comprehensive Income Statement (Table 3.2.1)
2012-13 Estimated Actual
The department is budgeting for an operating loss of $66.0 million for 2012-13, mainly due to:
• a delay in a program of voluntary redundancies in order to bring the staffing level down to affordable levels;
• additional costs incurred for service delivery in response to the recent natural disasters; and
• other additional expenses associated with continuing integration of the former Centrelink and Medicare Australia into the department.
Expenses for the year are estimated at $4,515.3 million, an increase of $77.7 million since 2012-13 Additional Estimates. The department is forecasting total own source income of $286.6 million in 2012-13, an increase of $3.3 million since Additional Estimates, mainly due to variations in contract services provided by the department. Revenue from Government has increased by $12.9 million, mainly as a result of new measures for the same period.
2013-14 Budget and Forward Years
The department is forecasting a break-even operating result for the budget and forward years. Expenses for 2013-14 are estimated at $4,398.0 million, an increase of $107.9 million since 2012-13 Additional Estimates. This change is mainly driven by new expense measures as per table 1.2. Expenses are forecast to decrease by $165.2 million (3.8 per cent) over the Budget and forward estimates period, mainly comprising reductions of $113.3 million in employee benefits and $81.7 million in supplier expenses.
Total own source income in 2013-14 is estimated at $287.6 million, an increase of $5.0 million since Additional Estimates. This change is mainly due to variations in contract services provided by the department. Revenue from Government is forecast to decrease by $187.1 million (4.8 per cent) over the Budget and forward estimates period.

DHS Budget Statements
41
Departmental Balance Sheet (Table 3.2.2)
2012-13 Estimated Actual
Total Assets are estimated to be $1,751.0 million, a decrease of $91.5 million since Additional Estimates, mainly due to reductions in receivables. Total Liabilities are estimated to be $1,275.1 million, a decrease of $30.5 million since Additional Estimates. This is mainly due to a reduction in supplier payables.
2013-14 Budget and Forward Years
Total Assets for 2013-14 are estimated to be $1,636.5 million, a decrease of $75.9 million since 2012-13 Additional Estimates, mainly due to reductions in receivables. Over the Budget and forward estimates period, total assets are forecast to decrease by $208.4 million, mainly because depreciation expense and asset impairments exceed asset additions funded under the net cash appropriation arrangements.
Total Liabilities are estimated to be $1,236.2 million, a decrease of $29.0 million since Additional Estimates. This is mainly due to a reduction in supplier payables.
Departmental Statement of Changes in Equity (Table 3.2.3)
Total Equity for 2013-14 is estimated to be $400.2 million (at 30 June 2014), a decrease of $75.7 million from the end of 2012-13. This is mainly due to the difference between unfunded depreciation expense, as reflected in the operating result and capital funding for new and replacement assets for 2013-14.
Departmental Cash Flows (Table 3.2.4)
2012-13 Estimated Actual
Since the 2012-13 Additional Estimates, cash flows have been affected by new measures, changes in own source revenue and associated expenses, and movements of assets and liabilities. This has resulted in increased cash receipts from operating activities in 2012-13 of $98.4 million and increased payments of $117.0 million for operating activities. Cash used for purchase of property, plant and equipment and intangibles has decreased by $15.2 million since Additional Estimates, due to a similar increase in capital payable at year end.
2013-14 Budget and Forward Years
Since the 2012-13 Additional Estimates, both 2013-14 cash receipts and cash payments have increased by $76.9 million mainly resulting from new measures.
Over the Budget and forward estimates period, the movements in cash received and cash used for operations reflect the movements in total revenue and total expenses noted above. Movements in net cash flows from investing and financing activities over the forward estimates reflect government funding levels for replacement of assets and equity injections for capital expenditure as detailed in the Departmental Capital Budget (Table 3.2.5).

DHS Budget Statements
42
Departmental Capital Budget Statement (Table 3.2.5)
New capital appropriations for 2013-14 have increased by $34.4 million since Additional Estimates. This is mainly due to capital funding for new measures as reflected in Table 1.2. Funding for 2013-14 is now estimated at $154.4 million, a reduction of $23.7 million compared to 2012-13 estimated actuals. Capital funding is forecast to increase to $206.4 million in 2014-15 and remain stable over the forward years.
Statement of Asset Movements (Table 3.2.6)
The estimated net book values for 2013-14 have increased by $15.7 million since Additional Estimates. The closing net book value for 2013-14 represents a decrease of $77.8 million for the year because depreciation expense and asset impairments exceed total additions funded under the net cash appropriation arrangements.

DHS Budget Statements
43
Administered Income and Expenses (Table 3.2.7)
2012-13 Estimated Actual
Since 2012-13 Additional Estimates, Administered revenue in 2012-13 has decreased by $25.8 million while expenses have also decreased by $27.0 million. These movements are mainly due to an estimated reduction in the transfers of Child Support payments between parents.
2013-14 Budget and Forward Years
Administered expenses in 2013-14 have decreased by $27.8 million since Additional Estimates mainly due to a forecast reduction in the transfers of Child Support payments between parents.
Child Support revenue and expenses are forecast to increase by approximately 2.5 per cent each year. Grants for the measure, ‘Building Australia Future Workforce – community innovation through collaboration’ and supplier expenses for ‘Income Management BasicsCard’ will cease in 2015-16 due to termination of the measures.
Administered Assets and Liabilities (Table 3.2.8)
Over the Budget and Forward estimates period, total Administered Assets and Liabilities are forecast to increase by approximately 3.1 per cent per annum, consistent with the trend in income and expenses for the Child Support Program.
Administered Cash Flows (Table 3.2.9)
2012-13 Estimated Actual
Since the 2012-13 Additional Estimates, Administered receipts have decreased by $25.0 million while payments have decreased by $25.4 million. This is mainly due to an estimated reduction in the transfers of Child Support payments between parents.
2013-14 Budget and Forward Years
Administered cash receipts and payments, and payments to or from the official public account (OPA), are forecast to increase by an average of 2.3 per cent each year over the Budget and forward years, consistent with the trend in income and expenses for the Child Support program.

DHS Budget Statements
44
3.2.3 Budgeted Financial Statements Tables
Table 3.2.1 Comprehensive Income Statement (Showing Net Cost of Services) (for the period ended 30 June)
Estimated Budget Forward Forward Forwardactual estimate estimate estimate estimate
2012-13 2013-14 2014-15 2015-16 2016-17
$'000 $'000 $'000 $'000 $'000
EXPENSES
Employee benefits 2,847,374 2,808,915 2,757,879 2,671,270 2,695,636
Supplier expenses 1,390,640 1,337,685 1,281,182 1,242,251 1,255,964
Depreciation and amortisation 262,355 237,595 233,912 251,509 267,167
Write-down and impairment of assets 7,514 7,514 7,514 7,514 7,514 Losses from asset sales 1,063 - - - - Finance costs 929 862 862 862 862 Other expenses 5,388 5,461 5,540 5,626 5,718
Total expenses 4,515,263 4,398,032 4,286,889 4,179,032 4,232,861
LESS:
OWN-SOURCE INCOME
Own-source revenue
Sale of goods and rendering of services 282,351 283,385 271,783 272,998 273,281
Rental income 969 969 969 969 969 Other 1,000 1,000 1,000 1,000 1,000Total own-source revenue 284,320 285,354 273,752 274,967 275,250
Gains
Other 2,240 2,240 2,239 2,239 2,239
Total gains 2,240 2,240 2,239 2,239 2,239Total own-source income 286,560 287,594 275,991 277,206 277,489
Net cost of (contribution by)
services 4,228,703 4,110,438 4,010,898 3,901,826 3,955,372
Revenue from Government 3,908,373 3,880,814 3,784,380 3,656,921 3,693,729
Surplus (Deficit) (320,330) (229,624) (226,518) (244,905) (261,643)
Surplus (Deficit) attributable to the Australian Government (320,330) (229,624) (226,518) (244,905) (261,643)
Total comprehensive income (loss) (320,330) (229,624) (226,518) (244,905) (261,643)
Total comprehensive income (loss)attributable to the Australian
Government (320,330) (229,624) (226,518) (244,905) (261,643)
DHS Budget Statements
45
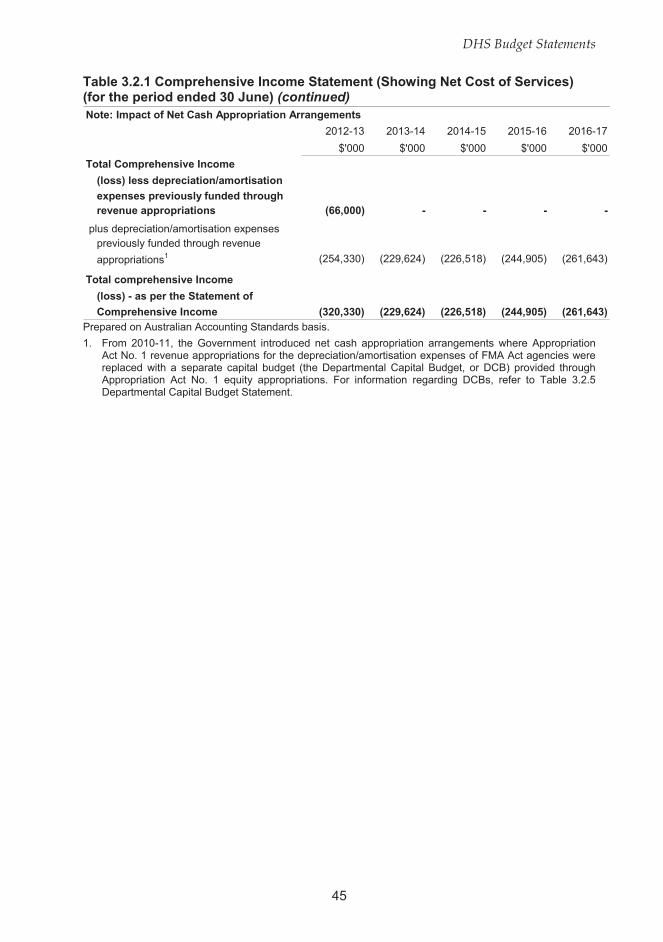
Table 3.2.1 Comprehensive Income Statement (Showing Net Cost of Services) (for the period ended 30 June) (continued) Note: Impact of Net Cash Appropriation Arrangements
2012-13 2013-14 2014-15 2015-16 2016-17
$'000 $'000 $'000 $'000 $'000
Total Comprehensive Income
(loss) less depreciation/amortisation
expenses previously funded throughrevenue appropriations (66,000) - - - -
plus depreciation/amortisation expensespreviously funded through revenue
appropriations1 (254,330) (229,624) (226,518) (244,905) (261,643)
Total comprehensive Income
(loss) - as per the Statement of
Comprehensive Income (320,330) (229,624) (226,518) (244,905) (261,643)
Prepared on Australian Accounting Standards basis.
1. From 2010-11, the Government introduced net cash appropriation arrangements where Appropriation Act No. 1 revenue appropriations for the depreciation/amortisation expenses of FMA Act agencies were replaced with a separate capital budget (the Departmental Capital Budget, or DCB) provided through Appropriation Act No. 1 equity appropriations. For information regarding DCBs, refer to Table 3.2.5 Departmental Capital Budget Statement.

DHS Budget Statements
46
Table 3.2.2: Budgeted Departmental Balance Sheet (as at 30 June)
Estimated Budget Forward Forward Forwardactual estimate estimate estimate estimate
2012-13 2013-14 2014-15 2015-16 2016-17$'000 $'000 $'000 $'000 $'000
ASSETSFinancial assets
Cash and cash equivalents 24,343 24,665 24,909 24,924 24,924Trade and other receivables 759,613 721,300 699,137 633,365 652,237Other financial assets 95 95 95 95 95
Total financial assets 784,051 746,060 724,141 658,384 677,256
Non-financial assetsLand and buildings 331,952 292,035 280,732 259,662 241,177Property, plant and equipment 194,435 162,796 161,848 161,387 153,338Intangibles 382,669 376,443 359,975 333,292 292,842Other non-financial assets 57,907 59,119 60,496 61,900 63,405
Total non-financial assets 966,963 890,393 863,051 816,241 750,762Total assets 1,751,014 1,636,453 1,587,192 1,474,625 1,428,018
LIABILITIES
PayablesSuppliers 260,059 257,918 250,890 249,164 249,570Other payables 99,198 104,097 110,542 46,711 54,984
Total payables 359,257 362,015 361,432 295,875 304,554
ProvisionsEmployee provisions 855,598 813,992 785,437 778,835 783,807Other 60,211 60,211 60,211 60,211 60,211
Total provisions 915,809 874,203 845,648 839,046 844,018
Total liabilities 1,275,066 1,236,218 1,207,080 1,134,921 1,148,572
Net assets 475,948 400,235 380,112 339,704 279,446EQUITY*Parent entity interest
Contributed equity 1,080,367 1,234,278 1,440,673 1,645,170 1,846,555Reserves 34,291 34,291 34,291 34,291 34,291Retained surplus (accumulated deficit) (638,710) (868,334) (1,094,852) (1,339,757) (1,601,400)
Total parent entity interest 475,948 400,235 380,112 339,704 279,446
Total equity 475,948 400,235 380,112 339,704 279,446Prepared on Australian Accounting Standards basis.
* 'Equity' is the residual interest in assets after deduction of liabilities.

DHS Budget Statements
47
Table 3.2.3: Departmental Statement of Changes in Equity — Summary of Movement (Budget Year 2013-14)
Retained Asset Contributed Totalearnings revaluation equity/ equity
reserve capital$'000 $'000 $'000 $'000
Opening balance as at 1 July 2013
Balance carried forward fromprevious period (638,710) 34,291 1,080,367 475,948
Comprehensive incomeSurplus (deficit) for the period (229,624) (229,624)
Total comprehensive income (229,624) - - (229,624)
of which:Attributable to the Australian Government (229,624) - - (229,624)
Transactions with ownersContribution by owners
Equity Injection - Appropriation - - 38,706 38,706Departmental Capital Budget (DCB) - - 115,205 115,205
Sub-total transactions with owners - - 153,911 153,911
Estimated closing balanceas at 30 June 2014 (868,334) 34,291 1,234,278 400,235Closing balance attributable to the
Australian Government (868,334) 34,291 1,234,278 400,235 Prepared on Australian Accounting Standards basis.

DHS Budget Statements
48
Table 3.2.4: Budgeted Departmental Statement of Cash Flows (for the period ended 30 June)
Estimated Budget Forward Forward Forwardactual estimate estimate estimate estimate
2012-13 2013-14 2014-15 2015-16 2016-17$'000 $'000 $'000 $'000 $'000
OPERATING ACTIVITIESCash received
Goods and services 313,845 305,247 294,461 294,842 295,389Appropriations 3,975,501 3,919,250 3,806,143 3,722,875 3,674,871Section 31 receipts redrawn from OPA 317,803 306,248 295,461 295,842 296,389Net GST received 138,835 108,848 108,268 104,351 105,629Other 1,018 1,000 1,000 1,000 1,000
Total cash received 4,747,002 4,640,593 4,505,333 4,418,910 4,373,278
Cash usedEmployees 2,838,227 2,845,695 2,780,068 2,741,789 2,682,482Suppliers 1,539,428 1,470,031 1,417,793 1,369,418 1,382,475
Section 31 receipts transferred to OPA 317,804 306,247 295,461 295,842 296,389Other 5,440 5,388 5,461 5,540 5,626
Total cash used 4,700,899 4,627,361 4,498,783 4,412,589 4,366,972Net cash from (used by)
operating activities 46,103 13,232 6,550 6,321 6,306
INVESTING ACTIVITIESCash received
Proceeds from sales of property,plant, equipment and intangibles 2,941 - - - -
Total cash received 2,941 - - - -
Cash usedPurchase of property, plant,
equipment and intangibles 230,290 167,321 212,701 210,803 207,691
Total cash used 230,290 167,321 212,701 210,803 207,691Net cash from (used by)
investing activities (227,349) (167,321) (212,701) (210,803) (207,691)
FINANCING ACTIVITIESCash received
Contributed equity 181,762 154,411 206,395 204,497 201,385
Total cash received 181,762 154,411 206,395 204,497 201,385
Cash usedFinance leases 238 - - - -
Total cash used 238 - - - -Net cash from (used by)
financing activities 181,524 154,411 206,395 204,497 201,385
Net increase or (decrease)in cash held 278 322 244 15 -
Cash and cash equivalents at thebeginning of the reporting period 24,065 24,343 24,665 24,909 24,924
Cash and cash equivalents at the end of the reporting period 24,343 24,665 24,909 24,924 24,924
Prepared on Australian Accounting Standards basis.

DHS Budget Statements
49
Table 3.2.5: Departmental Capital Budget Statement (for the period ended 30 June)
Estimated Budget Forward Forward Forward
actual estimate estimate estimate estimate2012-13 2013-14 2014-15 2015-16 2016-17
$'000 $'000 $'000 $'000 $'000NEW CAPITAL APPROPRIATIONS
Capital budget - Bill No. 1 (DCB) 131,826 115,205 199,402 202,795 200,350 Equity injections - Bill No. 2 46,245 39,161 6,993 1,702 1,035
Total new capital appropriations 178,071 154,366 206,395 204,497 201,385
Provided for:Purchase of non-financial assets 175,573 153,911 206,395 204,497 201,385 Other Items 2,498 455 - - -
Total Items 178,071 154,366 206,395 204,497 201,385
PURCHASE OF NON-FINANCIALASSETS
Funded by capital appropriations 144,936 38,706 6,993 1,702 1,035
Funded by capital appropriation - DCB 2 136,826 115,705 199,402 202,795 200,350
Funded internally from
departmental resources 3 10,595 12,910 6,306 6,306 6,306
TOTAL 192,357 167,321 212,701 210,803 207,691
RECONCILIATION OF CASHUSED TO ACQUIRE ASSETSTO ASSET MOVEMENT TABLE
Total purchases 192,357 167,321 212,701 210,803 207,691 plus payables 37,933 - - - -
Total cash used to
acquire assets 230,290 167,321 212,701 210,803 207,691
Prepared on Australian Accounting Standards basis.
1. Includes both current and prior year Act 2 and Act 4 appropriations.
2. Excludes annual finance lease costs. Includes purchases from current and previous years' Departmental Capital Budgets (DCBs).
3. Includes funding from s31 relevant agency receipts.

50
DHS Budget Statements
50
Tab
le 3
.2.6
: S
tate
men
t o
f A
sset
Mo
vem
ents
(20
13-1
4)
Land
Bui
ldin
gsO
ther
pro
pert
y,In
tang
ible
sT
otal
plan
t an
deq
uipm
ent
$'00
0$'
000
$'00
0$'
000
$'00
0
As
at 1
Ju
ly 2
013
Gro
ss b
ook
valu
e
4,
938
467
,248
3
02,5
43
61
5,14
0
1,38
9,86
9 A
ccum
ulat
ed d
epre
ciat
ion/
amor
tisat
ion
and
impa
irmen
t
-
(
140,
234)
(
108,
108)
(232
,471
)
(48
0,81
3)O
pen
ing
net
bo
ok
bal
ance
4,93
8
3
27,0
14
194
,435
382,
669
909
,056
CA
PIT
AL
AS
SE
T A
DD
ITIO
NS
Est
imat
ed e
xpen
dit
ure
on
new
or
rep
lace
men
t as
sets
By
purc
hase
- a
ppro
pria
tion
equi
ty 1
-
57
4
,087
34,
562
3
8,70
6 B
y pu
rcha
se -
app
ropr
iatio
n or
dina
ry
annu
al s
ervi
ces
2
-
46,
468
2
2,15
2
47,
085
11
5,70
5 B
y pu
rcha
se -
oth
er
-
3,47
5
1,
773
7,6
62
12
,910
To
tal
add
itio
ns
-
5
0,00
0
28,
012
8
9,30
9
167,
321
Oth
er m
ove
men
tsD
epre
ciat
ion/
amor
tisat
ion
expe
nse
-
(
89,2
17)
(58
,555
)
(89,
823)
(2
37,5
95)
Oth
er
-
(7
00)
(
1,09
6)
(5
,712
)
(7,
508)
As
at 3
0 Ju
ne
2014
Gro
ss b
ook
valu
e
4,
938
515
,848
3
29,3
92
69
8,23
7
1,54
8,41
5 A
ccum
ulat
ed d
epre
ciat
ion/
amor
tisat
ion
and
impa
irmen
t
-
(
228,
751)
(
166,
596)
(321
,794
)
(71
7,14
1)C
losi
ng
net
bo
ok
bal
ance
4,93
8
2
87,0
97
162
,796
376,
443
831
,274
P
repa
red
on
Aus
tral
ian
Acc
ount
ing
Sta
ndar
ds b
asis
.
1.
"App
ropr
iatio
n eq
uity
" re
fers
to e
quity
inje
ctio
ns o
r A
dmin
iste
red
Ass
ets
and
Liab
ilitie
s ap
prop
riatio
ns p
rovi
ded
thro
ugh
App
ropr
iatio
n B
ill (
No.
2) 2
013-
14.
2.
"App
ropr
iatio
n or
dina
ry a
nnua
l ser
vice
s" r
efer
s to
fund
ing
prov
ided
thr
ough
App
rop
riatio
n B
ill (
No.
1) 2
013-
14 fo
r de
prec
iatio
n/am
ortis
atio
n ex
pens
es, D
CB
s or
oth
er
oper
atio
nal e
xpe
nses
.
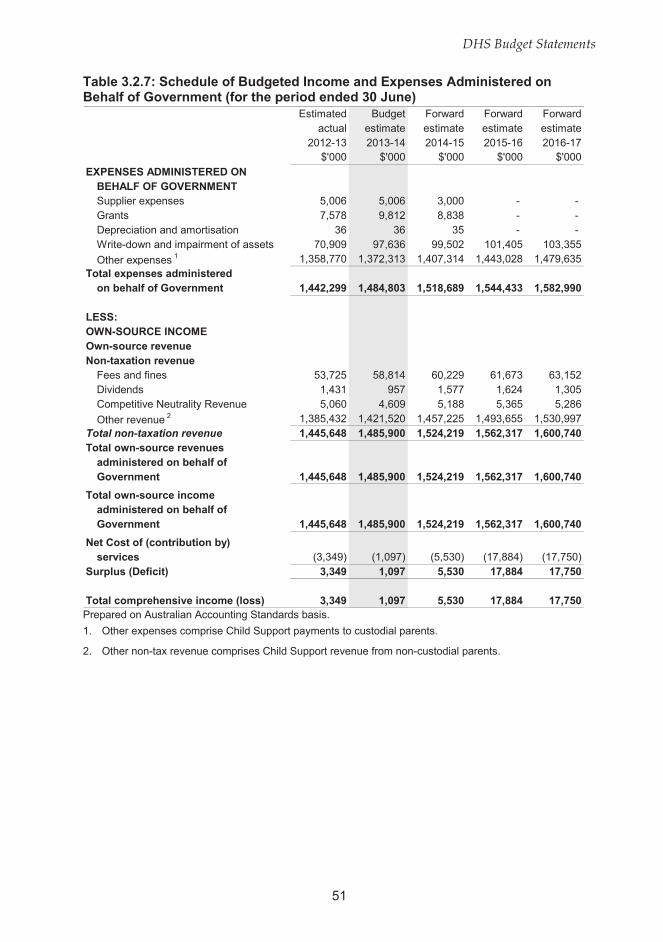
DHS Budget Statements
51
Table 3.2.7: Schedule of Budgeted Income and Expenses Administered on Behalf of Government (for the period ended 30 June)
Estimated Budget Forward Forward Forwardactual estimate estimate estimate estimate
2012-13 2013-14 2014-15 2015-16 2016-17$'000 $'000 $'000 $'000 $'000
EXPENSES ADMINISTERED ONBEHALF OF GOVERNMENTSupplier expenses 5,006 5,006 3,000 - - Grants 7,578 9,812 8,838 - - Depreciation and amortisation 36 36 35 - - Write-down and impairment of assets 70,909 97,636 99,502 101,405 103,355
Other expenses 1 1,358,770 1,372,313 1,407,314 1,443,028 1,479,635Total expenses administered
on behalf of Government 1,442,299 1,484,803 1,518,689 1,544,433 1,582,990
LESS:OWN-SOURCE INCOMEOwn-source revenueNon-taxation revenue
Fees and fines 53,725 58,814 60,229 61,673 63,152Dividends 1,431 957 1,577 1,624 1,305Competitive Neutrality Revenue 5,060 4,609 5,188 5,365 5,286
Other revenue 2 1,385,432 1,421,520 1,457,225 1,493,655 1,530,997Total non-taxation revenue 1,445,648 1,485,900 1,524,219 1,562,317 1,600,740Total own-source revenues
administered on behalf ofGovernment 1,445,648 1,485,900 1,524,219 1,562,317 1,600,740
Total own-source incomeadministered on behalf ofGovernment 1,445,648 1,485,900 1,524,219 1,562,317 1,600,740
Net Cost of (contribution by)services (3,349) (1,097) (5,530) (17,884) (17,750)
Surplus (Deficit) 3,349 1,097 5,530 17,884 17,750
Total comprehensive income (loss) 3,349 1,097 5,530 17,884 17,750Prepared on Australian Accounting Standards basis.
1. Other expenses comprise Child Support payments to custodial parents.
2. Other non-tax revenue comprises Child Support revenue from non-custodial parents.

DHS Budget Statements
52
Table 3.2.8: Schedule of Budgeted Assets and Liabilities Administered on Behalf of Government (as at 30 June)
Estimated Budget Forward Forward Forwardactual estimate estimate estimate estimate
2012-13 2013-14 2014-15 2015-16 2016-17$'000 $'000 $'000 $'000 $'000
ASSETSFinancial assets
Cash and cash equivalents 15 15 15 15 15Receivables 721,517 743,325 767,154 791,814 817,434Investments accounted for
using the equity method 37,342 37,342 37,342 37,342 37,342Total financial assets 758,874 780,682 804,511 829,171 854,791
Non-financial assetsProperty, plant and equipment 71 35 - - -
Total non-financial assets 71 35 - - -Total assets administered
on behalf of Government 758,945 780,717 804,511 829,171 854,791
LIABILITIESPayables
Suppliers 1 32,734 32,734 32,734 32,082 32,082Other payables 17,389 17,389 17,389 17,389 17,389
Total payables 50,123 50,123 50,123 49,471 49,471
ProvisionsOther provisions 706,247 728,116 751,067 775,123 800,311
Total provisions 706,247 728,116 751,067 775,123 800,311Total liabilities administered
on behalf of Government 756,370 778,239 801,190 824,594 849,782
Net assets/(liabilities) 2,575 2,478 3,321 4,577 5,009 Prepared on Australian Accounting Standards basis.
1. Includes Child Support and Income Management BasicsCard payables.
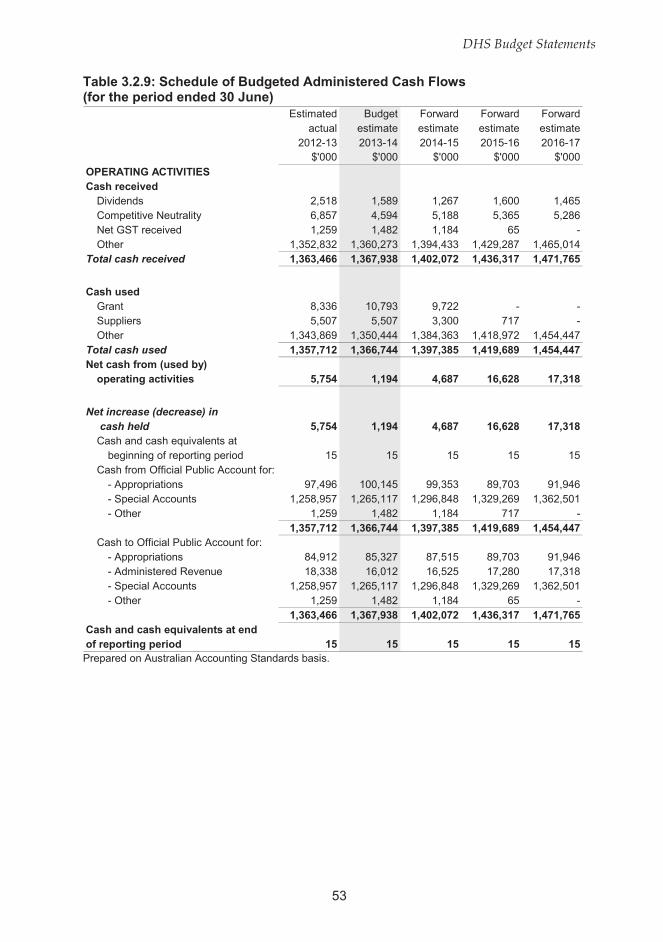
DHS Budget Statements
53
Table 3.2.9: Schedule of Budgeted Administered Cash Flows (for the period ended 30 June)
Estimated Budget Forward Forward Forwardactual estimate estimate estimate estimate
2012-13 2013-14 2014-15 2015-16 2016-17$'000 $'000 $'000 $'000 $'000
OPERATING ACTIVITIESCash received
Dividends 2,518 1,589 1,267 1,600 1,465Competitive Neutrality 6,857 4,594 5,188 5,365 5,286Net GST received 1,259 1,482 1,184 65 -Other 1,352,832 1,360,273 1,394,433 1,429,287 1,465,014
Total cash received 1,363,466 1,367,938 1,402,072 1,436,317 1,471,765
Cash usedGrant 8,336 10,793 9,722 - -Suppliers 5,507 5,507 3,300 717 -Other 1,343,869 1,350,444 1,384,363 1,418,972 1,454,447
Total cash used 1,357,712 1,366,744 1,397,385 1,419,689 1,454,447Net cash from (used by)
operating activities 5,754 1,194 4,687 16,628 17,318
Net increase (decrease) in cash held 5,754 1,194 4,687 16,628 17,318Cash and cash equivalents at
beginning of reporting period 15 15 15 15 15Cash from Official Public Account for:
- Appropriations 97,496 100,145 99,353 89,703 91,946- Special Accounts 1,258,957 1,265,117 1,296,848 1,329,269 1,362,501- Other 1,259 1,482 1,184 717 -
1,357,712 1,366,744 1,397,385 1,419,689 1,454,447Cash to Official Public Account for:
- Appropriations 84,912 85,327 87,515 89,703 91,946- Administered Revenue 18,338 16,012 16,525 17,280 17,318- Special Accounts 1,258,957 1,265,117 1,296,848 1,329,269 1,362,501- Other 1,259 1,482 1,184 65 -
1,363,466 1,367,938 1,402,072 1,436,317 1,471,765Cash and cash equivalents at endof reporting period 15 15 15 15 15Prepared on Australian Accounting Standards basis.

DHS Budget Statements
54
Table 3.2.10: Schedule of Administered Capital Budget Statement The Department of Human Services does not have an Administered Capital Budget for 2013-14.
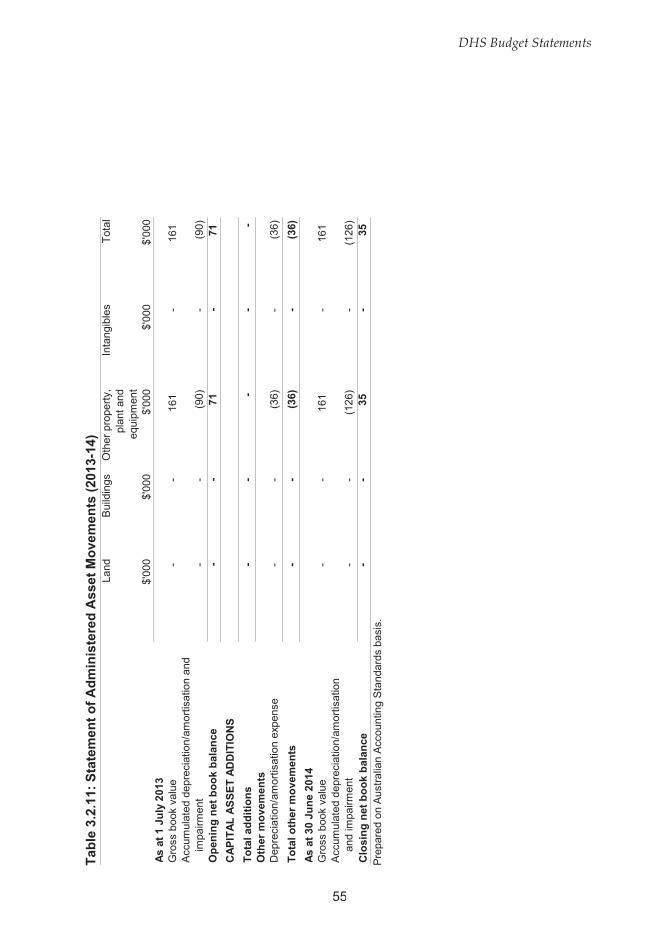
55
DHS Budget Statements
Tab
le 3
.2.1
1: S
tate
men
t o
f A
dm
inis
tere
d A
sset
Mo
vem
ents
(20
13-1
4)
Land
Bui
ldin
gsO
ther
pro
pert
y,In
tang
ible
sT
otal
plan
t an
deq
uipm
ent
$'00
0$'
000
$'00
0$'
000
$'00
0A
s at
1 J
uly
201
3G
ross
boo
k va
lue
-
-
16
1
-
161
A
ccum
ulat
ed d
epre
ciat
ion/
amor
tisat
ion
and
impa
irmen
t
-
-
(90
)
-
(9
0)O
pen
ing
net
bo
ok
bal
ance
-
-
71
-
71
CA
PIT
AL
AS
SE
T A
DD
ITIO
NS
To
tal
add
itio
ns
-
-
-
-
-
O
ther
mo
vem
ents
Dep
reci
atio
n/am
ortis
atio
n ex
pens
e
-
-
(36
)
-
(
36)
To
tal
oth
er m
ove
men
ts
-
-
(3
6)
-
(
36)
As
at 3
0 Ju
ne
2014
Gro
ss b
ook
valu
e
-
-
161
-
1
61
Acc
umul
ated
dep
reci
atio
n/am
ortis
atio
nan
d im
pairm
ent
-
-
(12
6)
-
(126
)C
losi
ng
net
bo
ok
bal
ance
-
-
35
-
35
Pre
pare
d o
n A
ustr
alia
n A
ccou
ntin
g S
tand
ards
bas
is.

DHS Budget Statements
56
3.2.4 Notes to the Financial Statements
The Budgeted Financial Statements have been prepared in accordance with:
• Finance Minister’s Orders (FMOs); and
• Australian Accounting Standards and Interpretations issued by the Australian Accounting Standards Board (AASB) which apply for the reporting period.
The department’s Budgeted Financial Statements have been prepared on an accrual basis and are in accordance with historical cost convention, except for certain assets and liabilities at fair value.
Unless alternative treatment is specifically required by an Accounting Standard or the FMOs, assets and liabilities are recognised in the Balance Sheet when and only when it is probable that future economic benefits will flow to and from the department and the amounts of the assets or liabilities can be reliably measured. However, assets and liabilities arising under executor contracts are not recognised unless required by an Accounting Standard.
Unless alternative treatment is specifically required by an Accounting Standard, revenues and expenses are recognised in the Comprehensive Income Statement when and only when, the flow, consumption or loss of economic benefits has occurred and can be reliably measured.
The presentation of the Comprehensive Income Statement includes the “Impact of Net Cash Appropriation Arrangements” note, whereby the department’s net operating result is adjusted by unfunded depreciation and amortisation expense. This treatment is the result of the net cash arrangement that has been implemented as part of the Operation Sunlight reform agenda.
Departmental Departmental assets, liabilities, revenues and expenses are those items controlled by the Department that are used in producing outputs, and include:
• non-financial assets used in providing goods and services;
• liabilities for employee entitlements;
• revenue from appropriations or independent sources in payment for outputs; and
• employee, supplier and depreciation expenses incurred in providing departmental outputs.
Administered Administered items are those items controlled by the government and managed, or overseen, by the department on behalf of the government.
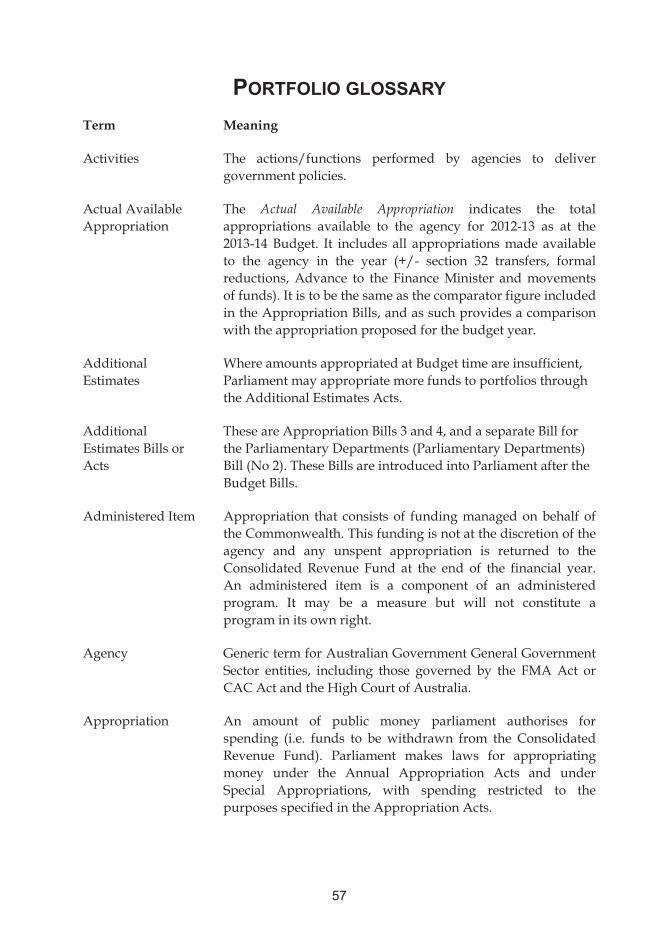
57
PORTFOLIO GLOSSARY
Term Meaning
Activities The actions/functions performed by agencies to deliver government policies.
Actual Available Appropriation
The Actual Available Appropriation indicates the total appropriations available to the agency for 2012-13 as at the 2013-14 Budget. It includes all appropriations made available to the agency in the year (+/- section 32 transfers, formal reductions, Advance to the Finance Minister and movements of funds). It is to be the same as the comparator figure included in the Appropriation Bills, and as such provides a comparison with the appropriation proposed for the budget year.
Additional Estimates
Where amounts appropriated at Budget time are insufficient, Parliament may appropriate more funds to portfolios through the Additional Estimates Acts.
Additional Estimates Bills or Acts
These are Appropriation Bills 3 and 4, and a separate Bill for the Parliamentary Departments (Parliamentary Departments) Bill (No 2). These Bills are introduced into Parliament after the Budget Bills.
Administered Item Appropriation that consists of funding managed on behalf of the Commonwealth. This funding is not at the discretion of the agency and any unspent appropriation is returned to the Consolidated Revenue Fund at the end of the financial year. An administered item is a component of an administered program. It may be a measure but will not constitute a program in its own right.
Agency Generic term for Australian Government General Government Sector entities, including those governed by the FMA Act or CAC Act and the High Court of Australia.
Appropriation An amount of public money parliament authorises for spending (i.e. funds to be withdrawn from the Consolidated Revenue Fund). Parliament makes laws for appropriating money under the Annual Appropriation Acts and under Special Appropriations, with spending restricted to the purposes specified in the Appropriation Acts.

Glossary
58
Term Meaning
Appropriations and Cash Management Module (ACM)
A module of the Central Budget Management System from which agencies draw down funds from the Consolidated Revenue Fund.
BasicsCard The BasicsCard is a PIN-protected card that allows customers to access their income-managed money through existing EFTPOS facilities at approved stores and businesses. The BasicsCard provides customers on Income Management with a greater choice and flexibility to purchase essential goods and services from a broad range of stores and businesses.
Budget Paper 1 (BP1) Budget Strategy and Outlook. Provides information and analysis on whole of government expenditure and revenue.
Budget Paper 2 (BP2) Budget Measures. Provides a description of each budget measure by portfolio.
Budget Paper 3 (BP3) Australia’s Federal Relations. Provides information and analysis on Federal funding provided to the States and Territories.
Budget Paper 4 (BP4) Agency Resourcing. Details total resourcing available to agencies.
Commonwealth Authorities and Companies Act 1997 (CAC Act)
The CAC Act sets out the financial management, accountability and audit obligations on Commonwealth statutory authorities and companies in which the Commonwealth has at least a direct controlling interest.
Central Budget Management System (CBMS)
CBMS is the Australian Government’s central budget and financial management information system administered by the Department of Finance and Deregulation. It contains the Commonwealth program list and produces the Annual Appropriation Bills.

Glossary
59
Term Meaning
Clear Read Principle Under the Outcomes arrangements there is an essential clear link between the Appropriation Bills, the Portfolio Budget Statements (PBS), the Portfolio Additional Estimates Statements (PAES), and annual reports of agencies. Information should be consistent across these and other budget documents, and where possible, duplication of reporting within the PBS should be avoided. This is called the “clear read” between the different documents. Under this Principle the actual performance in the annual reports is to be provided on the same basis as the planned performance in PBS for the same period, to permit a clear read across planning and actual performance reporting documents. Agencies should take this into account in designing their performance reporting arrangements.
Consolidated Revenue Fund (CRF)
The principal operating fund from which money is drawn to pay for the activities of the Government. Section 81 of the Australian Constitution provides that all revenue raised or monies received by the Executive Government forms one consolidated revenue fund from which appropriations are made for the purposes of the Australian Government.
Departmental Capital Budget (DCB)
Funds provided in Appropriation Bill 1/3/5 for the ongoing replacement of minor assets.
Departmental Item Resources (assets, liabilities, revenues and expenses) that agency Chief Executives control directly. This includes outsourced activities funded and controlled by the agency. Examples of departmental items include agency running costs, accrued employee entitlements and net appropriations. A departmental item is a component of a departmental program.
Depreciation Apportionment of an asset’s capital value as an expense over its estimated useful life to take account of normal usage, obsolescence, or the passage of time.
Expense Total value of all of the resources consumed in producing goods and services or the loss of future economic benefits in the form of reductions in assets or increases in liabilities of an entity.
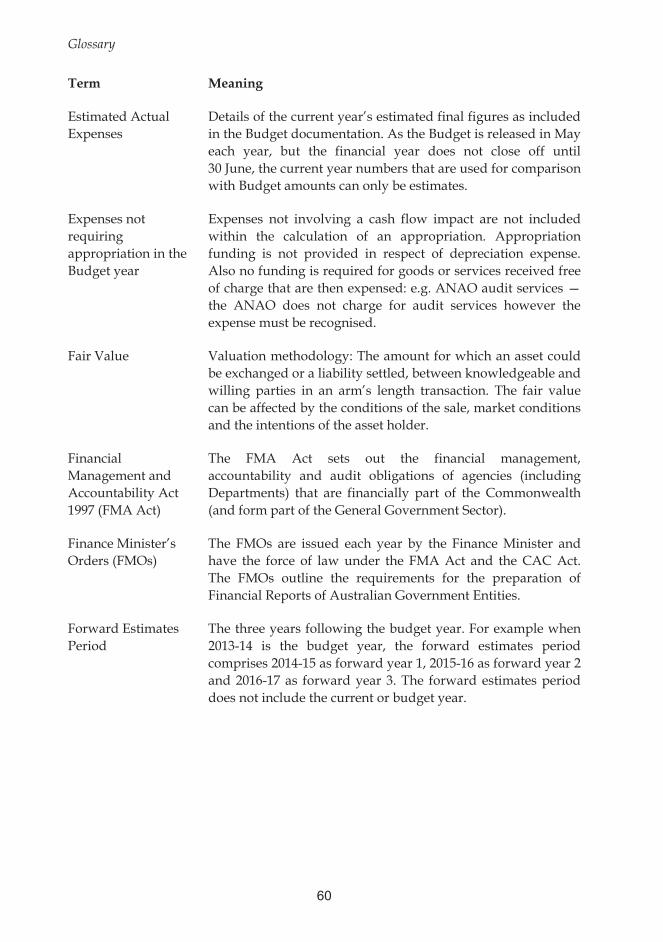
Glossary
60
Term Meaning
Estimated Actual Expenses
Details of the current year’s estimated final figures as included in the Budget documentation. As the Budget is released in May each year, but the financial year does not close off until 30 June, the current year numbers that are used for comparison with Budget amounts can only be estimates.
Expenses not requiring appropriation in the Budget year
Expenses not involving a cash flow impact are not included within the calculation of an appropriation. Appropriation funding is not provided in respect of depreciation expense. Also no funding is required for goods or services received free of charge that are then expensed: e.g. ANAO audit services — the ANAO does not charge for audit services however the expense must be recognised.
Fair Value Valuation methodology: The amount for which an asset could be exchanged or a liability settled, between knowledgeable and willing parties in an arm’s length transaction. The fair value can be affected by the conditions of the sale, market conditions and the intentions of the asset holder.
Financial Management and Accountability Act 1997 (FMA Act)
The FMA Act sets out the financial management, accountability and audit obligations of agencies (including Departments) that are financially part of the Commonwealth (and form part of the General Government Sector).
Finance Minister’s Orders (FMOs)
The FMOs are issued each year by the Finance Minister and have the force of law under the FMA Act and the CAC Act. The FMOs outline the requirements for the preparation of Financial Reports of Australian Government Entities.
Forward Estimates Period
The three years following the budget year. For example when 2013-14 is the budget year, the forward estimates period comprises 2014-15 as forward year 1, 2015-16 as forward year 2 and 2016-17 as forward year 3. The forward estimates period does not include the current or budget year.

Glossary
61
Term Meaning
General Government Sector (GGS)
A Government Finance Statistics’ classification of all entities that are controlled and largely funded by the Commonwealth Government. The GGS provides public services that are mainly non-market in nature and for the collective consumption of the community, or involve the transfer or redistribution of income. These services are largely financed through taxes and other compulsory levies, user charging and external funding. This sector comprises all government departments, offices and some other bodies.
Intended Result Intended result is a key part of an outcome statement and describes the goal or objective of an agency. The intended result is typically distilled from the Government’s economic, social, health or environmental policy goals.
Measure A new policy or savings decision of the government with financial impacts on the government’s: underlying cash balance; fiscal balance; operating balance; headline cash balance; net debt or net worth. Such proposals are normally made in the context of the annual Budget, and are typically published in Budget Paper No. 2, in the Mid-Year Economic and Fiscal Outlook (MYEFO) and in the Pre-election Economic and Fiscal Outlook (PEFO).
Mid-Year Economic and Fiscal Outlook (MYEFO)
The MYEFO provides an update of the government's budget estimates by examining expenses and revenues in the year to date, as well as provisions for new decisions that have been taken since the Budget. The report provides updated information to allow the assessment of the government’s fiscal performance against the fiscal strategy set out in its current fiscal strategy statement.
Official Public Account (OPA)
The OPA is the government’s central bank account held within the Reserve Bank of Australia. The OPA reflects the operations of the Consolidated Revenue Fund.
Outcome An outcome is the intended result, consequence or impact of Government actions on the Australian community.
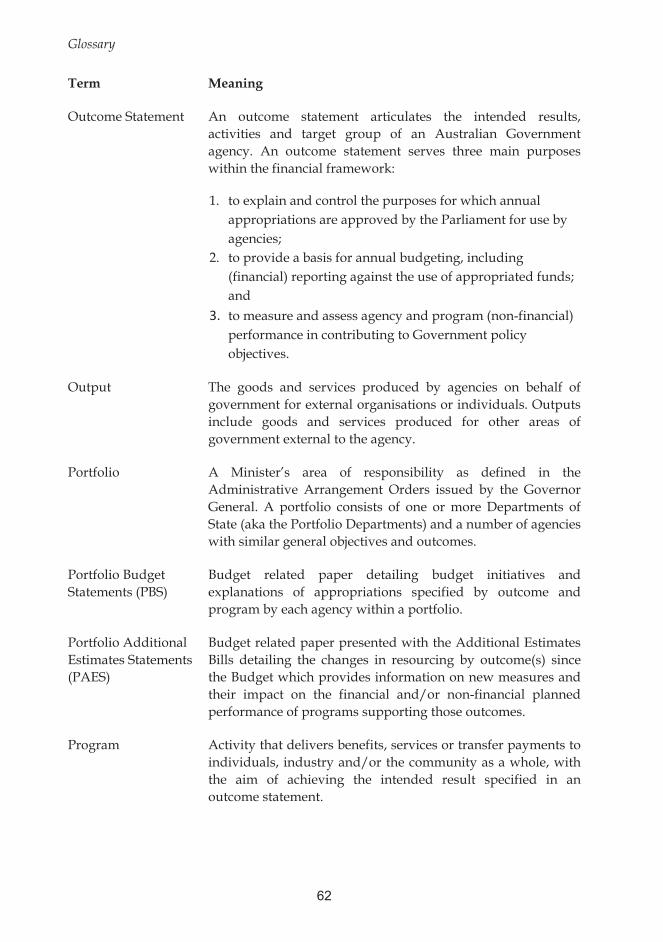
Glossary
62
Term Meaning
Outcome Statement An outcome statement articulates the intended results, activities and target group of an Australian Government agency. An outcome statement serves three main purposes within the financial framework:
1. to explain and control the purposes for which annual appropriations are approved by the Parliament for use by agencies;
2. to provide a basis for annual budgeting, including (financial) reporting against the use of appropriated funds; and
3. to measure and assess agency and program (non-financial) performance in contributing to Government policy objectives.
Output The goods and services produced by agencies on behalf of government for external organisations or individuals. Outputs include goods and services produced for other areas of government external to the agency.
Portfolio A Minister’s area of responsibility as defined in the Administrative Arrangement Orders issued by the Governor General. A portfolio consists of one or more Departments of State (aka the Portfolio Departments) and a number of agencies with similar general objectives and outcomes.
Portfolio Budget Statements (PBS)
Budget related paper detailing budget initiatives and explanations of appropriations specified by outcome and program by each agency within a portfolio.
Portfolio Additional Estimates Statements (PAES)
Budget related paper presented with the Additional Estimates Bills detailing the changes in resourcing by outcome(s) since the Budget which provides information on new measures and their impact on the financial and/or non-financial planned performance of programs supporting those outcomes.
Program Activity that delivers benefits, services or transfer payments to individuals, industry and/or the community as a whole, with the aim of achieving the intended result specified in an outcome statement.

Glossary
63
Term Meaning
Program Support The agency running costs allocated to a program. This is funded as part of the agency’s departmental appropriations.
Revenue Total value of resources earned or received to cover the production of goods and services or increases in future economic benefits in the form of increases in assets or reductions in liabilities of an entity.
Section 31 (s31) Section 31 of the FMA Act.
Special Accounts Balances existing within the CRF that are supported by standing appropriations (FMA Act sections 20 and 21). Special Accounts allow money in the CRF to be acknowledged as set aside (hypothecated) for a particular purpose. Amounts credited to a Special Account may be spent only for the purposes of the Special Account. Special Accounts can only be established by a written determination of the Finance Minister (section 20 FMA Act) or through an Act of Parliament (referred to in section 21 of the FMA Act).
Special Appropriations (including Standing Appropriations)
An amount of money appropriated by a particular Act of Parliament for a specific purpose and number of years. For special appropriations the authority to withdraw funds from Consolidated Revenue Fund does not generally cease at the end of the financial year.
Standing appropriations are a sub-category consisting of ongoing special appropriations – the amount appropriated will depend on circumstances specified in the legislation.
Target Group A specific group being targeted for assistance by government policy.
Transfer Cash paid to recipients of the applicable program. This includes welfare payments and tax rebates.
