2013-2014 jobs, skills, training and labour annual...
TRANSCRIPT
Jobs, Skills, Training and Labour
Annual Report2013-2014
2013-2014 Alberta Jobs, Skills, Training and Labour Annual Report
For more information, contact:
Jobs, Skills, Training and Labour Corporate Services Branch9th Floor, Labour Building10808 99 AvenueEdmonton, AB T5K 0G5
Tel. (780) 427-5585Fax. (780) 427-5988Email address: [email protected]
Electronic versions of this document are available at:http://work.alberta.ca/department/478.html
Copyright © 2014, the Crown in Right of the Province of Alberta, as represented by the Minister of Jobs, Skills, Training and Labour.
Permission is hereby given by the copyright owner for any person to reproduce this document for educational purposes and on a non-profit basis.
Summer 2014
ISBN 978-0-7785-9872-5 (Print)ISBN 978-0-7785-9873-2 (Online)ISSN 2292-9606 (Print)ISSN 2292-9614 (Online)
2013-2014 Alberta Jobs, Skills, Training and Labour Annual Report1
Jobs, Skills, Training and Labour
Annual Report
2013-2014
Preface............................................................................................................ 2
Minister’s Accountability Statement ........................................................... 3
Message from the Minister ........................................................................... 4
Management’s Responsibility for Reporting .............................................. 6
Results Analysis ........................................................................................... 8Ministry Overview ..................................................................................................................... 92013-2014 Ministry Goals, Priority Initiatives and Performance Measures ............................... 13Review Engagement Report (Auditor General’s Report) ........................................................... 15Performance Measures Summary Table ................................................................................... 16
Discussion and Analysis of Results ........................................................................................... 17 Goal 1: Alberta has fair, safe, healthy and inclusive workplaces and a skilled labour force that contributes to economic prosperity ............................................................................................ 18
Goal 2: Alberta’s workforce is skilled and productive ................................................................. 23
Financial Information ....................................................................................28Independent Auditor’s Report .................................................................................................... 29Financial Statements ................................................................................................................. 30Financial Statements - Workers’ Compensation Board ............................................................. 57
Other Information: Performance Measures, Sources and Methodologies .........................................................................96
Other Statutory Reports ................................................................................98
2013-2014 Alberta Jobs, Skills, Training and Labour Annual Report2
PrefaceThe Public Accounts of Alberta are prepared in accordance with the Financial Administration Act and the Fiscal Management Act. The Public Accounts consist of the annual report of the Government of Alberta and the annual reports of each of the 19 ministries.
The annual report of the Government of Alberta contains ministers’ accountability statements, the financial statements of the province and Measuring Up report, which compares actual performance results to desired results set out in the government’s strategic plan.
On December 6, 2013, the government announced new ministry structures. The 2013-2014 ministry annual reports and financial statements have been prepared based on the new ministry structures. The Ministry of Jobs, Skills, Training and Labour is comprised of programs formerly in the Ministries of Enterprise and Advanced Education and Human Services. Specifically, the following components were transferred to the ministry:
• Workforce Strategies division;
• Safe, Fair and Healthy Workplaces division;
• Immigrant Settlement and Language Programming branch;
• Aboriginal Economic Development branch;
• Online Initiatives and Information Supports branch;
• Staff to provide leadership on setting direction and policy for labour market agreements;
• Select Business and Industry Liaison staff;
• Primary Corporate Services staff to support the new ministry;
• Alberta Labour Relations Board;
• Appeals Commission for Alberta Workers’ Compensation;
• Workers’ Compensation Medical Panels;
• Occupational Health and Safety Council; and
• Workers’ Compensation Board.
This annual report of the Ministry of Jobs, Skills, Training and Labour contains the minister’s accountability statement, the audited financial statements of the ministry and a comparison of actual performance results to desired results set out in the ministry business plan. This ministry annual report also includes:
• the financial statement of entities making up the ministry including the Department of Jobs, Skills, Training and Labour, the Alberta Labour Relations Board, the Appeals Commission for Alberta Workers’ Compensation, Workers’ Compensation Medical Panels and the Occupational Health and Safety Council; and
• other financial information as required by the Financial Administration Act and Fiscal Management Act, either as separate reports or as a part of the financial statements, to the extent that the ministry has anything to report; and financial information relating to trust funds.
2013-2014 Alberta Jobs, Skills, Training and Labour Annual Report3
Minister’s Accountability StatementThe ministry’s annual report for the year ended March 31, 2014, was prepared under my direction in accordance with the Fiscal Management Act and the government’s accounting policies. All of the government’s policy decisions as at June 6, 2014 with material economic or fiscal implications of which I am aware have been considered in the preparation of this report.
[Original signed by]
Kyle FawcettMinister of Jobs, Skills, Training and Labour
2013-2014 Alberta Jobs, Skills, Training and Labour Annual Report4
Message from the MinisterWith abundant natural resources and an active investment climate, Alberta’s economy shows no signs of slowing down. Recognizing this, the Government of Alberta created Jobs, Skills, Training and Labour – a ministry to do the important work of building a skilled workforce, maintaining workplaces where workers are protected and treated fairly and ensuring Alberta remains this country’s economic driver for years to come.
Jobs, Skills, Training and Labour brings together the Workforce Strategies division from the former Ministry of Enterprise and Advanced Education as well as the business areas of occupational health and safety, employment standards, labour relations, Aboriginal development, settlement and language programs, and others from the Ministry of Human Services. Together, we are united in our work to fulfil our mandate and accomplish our goals.
The ministry plays a key role in securing Alberta’s economic future by investing in our most important resource – our people – and I am pleased to share with you the many accomplishments we have achieved so far.
Since the ministry was created in December, much of our work has focused on addressing the fundamental challenge of people without jobs and jobs without people and the development of our future workforce.
In December 2013, there were approximately 200,000 job vacancies in Canada, with about 22 per cent of these vacancies in Alberta. To help address this, the Alberta government and the Government of Canada signed an agreement to help connect Albertans with available jobs. The Canada Job Grant is an innovative, employer-driven approach designed to meet the economic needs of our province.
Equally important are the needs of our workers. Early this year, Compassionate Care came into effect allowing Albertans to take up to eight weeks of unpaid, job-protected leave from work to care for a gravely ill family member.
Alberta has changed and so has the need to look at our rules around work to ensure they reflect that change. We asked Albertans to “Talk about Work” and provide their input into Alberta’s employment standards.
Alberta is changing in other ways. In the last year alone, we welcomed almost 100,000 new Albertans, and we expect a million more over the next 10 years. With the Federal, Provincial and Territorial (FPT) Forum of Immigration Ministers, Jobs, Skills, Training and Labour has made economic immigration a top priority by working with the federal government on building Canada’s new ‘Express Entry’ – a system that will be more responsive to labour market needs.
We introduced options through the Alberta Immigrant Nominee Program (AINP) so that immigrants in our province can work to their full potential. Further, we continue to make changes to the way foreign qualifications are assessed and recognized so we can attract the best and the brightest.
In our efforts to ensure that Albertans with foreign educational credentials can use their skills and fully contribute to the economy, we have completed over 8,300 assessments through the International Qualifications Assessment Services (IQAS) – a 15 per cent increase in production from the previous year; and received over 10,000 applications – an 18 per cent increase in service demand from the previous year.
2013-2014 Alberta Jobs, Skills, Training and Labour Annual Report5
Work continues to focus on workplace health, safety and fairness, including improving education, increasing enforcement and expanding information sharing. Occupational Health and Safety Officers focused on 28 ski hill operators in an inspection campaign that saw a significant drop in the number of infractions after a total of 40 inspections were carried out. In March, the first 10 Occupational Health and Safety Officers completed the newly designed peace officer training. This designation gives officers the ability to write tickets to employers and workers who cut corners and put people at risk.
Of note, invaluable contributions were made during the 2013 Southern Alberta floods. Our own Occupational Health and Safety Officers were deep in the mud ensuring that volunteers and workers alike were responding to this disaster without neglecting their own health and safety.
In addition, our Temporary Foreign Worker Advisory Office (TFWAO) staff worked at evacuation centers in Nanton, Blackie, Vulcan, Lethbridge and the University of Calgary and contacted 224 temporary foreign workers to ensure they received the help they needed to continue their employment and to recover important documents.
Alberta’s economy leads the country, and Jobs, Skills, Training and Labour is playing a key role in driving Alberta’s prosperity. In the coming year, the ministry will continue working with our stakeholders, training and labour partners to position Alberta for economic and social success, now and for the future.
[Original signed by]
Kyle FawcettMinister of Jobs, Skills, Training and Labour
2013-2014 Alberta Jobs, Skills, Training and Labour Annual Report6
Management’s Responsibility for ReportingThe Ministry of Jobs, Skills, Training and Labour includes:
• The Department of Jobs, Skills, Training and Labour;
• Alberta Labour Relations Board;
• Appeals Commission for Alberta Workers’ Compensation;
• Occupational Health and Safety Council;
• Workers’ Compensation Medical Panels; and
• Workers’ Compensation Board.
The executives of the individual entities within the ministry have the primary responsibility and accountability for the respective entities. Collectively, the executives ensure the ministry complies with all relevant legislation, regulations and policies.
Ministry business plans, annual reports, performance results and the supporting management information are integral to the government’s fiscal and strategic plan, annual report, quarterly reports and other financial and performance reporting.
Responsibility for the integrity and objectivity of the financial statements and performance results for the ministry rests with the Minister of Jobs, Skills, Training and Labour. Under the direction of the Minister, I oversee the preparation of the ministry’s annual report, including financial statements and performance results. The financial statements and the performance results, of necessity, include amounts that are based on estimates and judgments. The financial statements are prepared in accordance with Canadian public sector accounting standards. The performance measures are prepared in accordance with the following criteria:
• Reliability – information agrees with underlying data and the sources used to prepare it;
• Understandability and Comparability – current results are presented clearly in accordance with the stated methodology and are comparable with previous results; and
• Completeness – performance measures and targets match those included in Budget 2013.
As Deputy Minister, in addition to program responsibilities, I am responsible for the ministry’s financial administration and reporting functions. The ministry maintains systems of financial management and internal control which give consideration to costs, benefits, and risks that are designed to:
• provide reasonable assurance that transactions are properly authorized, executed in accordance with prescribed legislation and regulations, and properly recorded so as to maintain accountability of public money;
• provide information to manage and report on performance;
• safeguard the assets and properties of the Province under ministry administration;
• provide Executive Council, the President of Treasury Board, the Minister of Finance and the Minister of Jobs, Skills, Training and Labour information needed to fulfill their responsibilities; and
• facilitate preparation of ministry business plans and annual reports required under the Fiscal Management Act.

2013-2014 Alberta Jobs, Skills, Training and Labour Annual Report7
In fulfilling my responsibilities for the ministry, I have relied, as necessary, on the executive of the individual entities within the ministry.
[Original signed by]
Lana LougheedDeputy Minister of Jobs, Skills, Training and Labour
June 6, 2014
2013-2014 Alberta Jobs, Skills, Training and Labour Annual Report8
Results AnalysisMinistry Overview
2013-2014 Ministry Goals, Priority Initiatives and Performance Measures
Review Engagement Report (Auditor General’s Report)
Performance Measures Summary Table
Discussion and Analysis of Results
Goal 1: Alberta has fair, safe, healthy and inclusive workplaces and a skilled labour force that contributes to economic prosperity
Goal 2: Alberta’s workforce is skilled and productive
2013-2014 Alberta Jobs, Skills, Training and Labour Annual Report9
Ministry Overview
The Ministry
The Ministry of Jobs, Skills, Training and Labour provides supports to meet the needs of both employees and employers. This work focuses on building a skilled workforce for the jobs of today as well as tomorrow, and maintaining safe, fair and healthy workplaces.
The Department
The Department of Jobs, Skills, Training and Labour consists of the areas described below:
Deputy Minister’s Office
The Deputy Minister’s office leads the department and provides advice and support to the Minister. The Deputy Minister’s office is the link to the Minister’s office to ensure the work of the department meets the goals and objectives outlined in the Business Plan and the priorities provided to the Minister by the Premier. The Deputy Minister supports the Deputy Minister of Executive Council by contributing to policy development, planning and implementation of cross-ministry initiatives, and advocating for new approaches and long-term views toward achieving government-wide goals.
Safe, Fair and Healthy Workplaces
The Safe, Fair and Healthy Workplaces division delivers programs and develops legislation, policy, and programs to ensure Alberta’s workplaces contribute to a productive economy. Working with employers, labour associations, unions and workers directly, this area works to instil a culture of awareness and compliance with several pieces of workplace-related legislation.
Key responsibilities include:
• developing legislation, standards and policies related to occupational health and safety, employment standards and labour relations;
• developing educational materials and raising awareness of industry best practices to ensure that Alberta’s workplaces are safe and healthy and that workers are treated fairly;
• enforcing the Employment Standards Code, which sets the minimum standards of employment (pay, vacation, termination, etc.), by responding to complaints, conducting investigations and administering appeals of orders and decisions;
• enforcing the Occupational Health and Safety Act, which sets the standards for the protection of workers by educating employers and workers about their health and safety rights and responsibilities, by proactively inspecting worksites, as well as by responding to and investigating occupational health and safety complaints, serious incidents and fatalities;
• providing a framework for preventing and reducing diseases related to occupational hazards;
• providing mediation services to trade unions and employers in the collective bargaining process, appointing grievance arbitrators, and providing objective collective bargaining information;
• working with formal Partners and Certifying Partners to assist employers in developing a
2013-2014 Alberta Jobs, Skills, Training and Labour Annual Report10
comprehensive health and safety management system necessary for the issuance of a Certificate of Recognition; and
• providing advice, guidance and issues resolution through the Temporary Foreign Worker (TFW) Advisory Office to TFWs related to their employment in Alberta.
Workforce Strategies
The Workforce Strategies division works across government and with industry to identify labour force needs and issues, and develops and implements policies, strategies and programs to address Alberta’s labour force requirements now and in the future.
Key responsibilities include:
• developing and implementing Alberta’s long-term workforce, including increasing workforce participation of all Albertans;
• leading the development of labour market information and resources for decision-makers, industry, employers and job seekers;
• working with industry and employers to support them in meeting their labour force requirements;
• facilitating credential recognition for those trained or educated outside of Alberta;
• leading the attraction, selection and retention of immigrants to meet Alberta’s labour force requirements;
• working closely with self-regulating professional associations to ensure that they are governed in the public interest; and
• administering the Land Agents Licensing Act.
Corporate Services
The Corporate Services branch is responsible for the ministry’s financial planning and policies, Freedom of Information and Protection of Privacy services, legislative services, and corporate planning and reporting.
Key responsibilities include:
• leading the efficient and sustainable development and analysis of ministry financial planning, and the preparation of budgets (estimates) and monitoring;
• overseeing the preparation and implementation of ministry financial reporting, compliance and accountability, financial processes and policies;
• providing corporate services for facilities and accommodations, information and records management, and business continuity;
• balancing transparency and privacy, and delivering services related to the Freedom of Information and Protection of Privacy Act; and
• leading the development of ministry strategic planning, business planning and annual reporting processes.
2013-2014 Alberta Jobs, Skills, Training and Labour Annual Report11
Communications
Communications provides planning, advice and support to the Minister and the department, and clear and timely information to the public about the ministry’s key initiatives, programs and services. Communications is also responsible for providing advice on issues management, media relations, specialized writing, social media, website content and product design.
Human Resources
Human Resources leads strategic human resource initiatives and oversees the planning, development and delivery of human resource services for the ministry. Human Resources develops innovative and collaborative strategies to recruit, engage and develop staff.
Information Management and Information Technology (IMIT)
IMIT leads strategic information and information technology initiatives and oversees the planning, development and delivery of IMIT services to the ministry.
Agencies, Boards and Commissions
The Ministry of Jobs, Skills, Training and Labour also includes the following agencies, boards and commissions:
Alberta Labour Relations Board
The Alberta Labour Relations Board (ALRB) is an independent and impartial tribunal responsible for the day-to-day application and interpretation of Alberta’s labour laws. It processes applications and conducts hearings on matters arising from both private and public sectors. Some, but not all, of the issues that come before the ALRB include certifications, revocations, various votes, bargaining unit determinations, and unfair labour practices, which fall under the Labour Relations Code, Public Service Employee Relations Act, and Police Officers Collective Bargaining Act.
The Labour Relations Code encourages parties to settle their disputes through honest and open communication. The ALRB offers informal settlement options to the parties, but it also has inquiry and hearing powers to make binding rulings whenever necessary.
Appeals Commission for Alberta Workers’ Compensation
The Appeals Commission for Alberta Workers’ Compensation, an independent and impartial tribunal, hears worker and employer appeals arising from Workers’ Compensation Board (WCB) review bodies. The mission of the Appeals Commission is to provide a timely, fair and independent appeals process consistent with legislation, policy and the principles of natural justice.
Occupational Health and Safety Council
The Occupational Health and Safety Council advises the Minister on matters concerning the Occupational Health and Safety Act, Code and Regulation. In addition, the Council is empowered to hear appeals related to orders issued by Occupational Health and Safety officers, cancellations/suspensions of a licence or permit, and rulings from a disciplinary action complaint investigation.
2013-2014 Alberta Jobs, Skills, Training and Labour Annual Report12
With the coming into effect of the Protections and Compliance Statutes Amendment Act on December 10, 2012, the duties of the OHS Council were expanded to include hearing appeals to administrative penalties for violations.
Workers’ Compensation Board – Alberta
The Workers’ Compensation Board – Alberta (WCB) is an employer funded, not-for-profit organization legislated to administer the workers’ compensation system for the province’s employers. The WCB is independently funded and operated as an insurance enterprise. In Canada, workers’ compensation is a no-fault disability insurance system that protects both employers and workers against the economic impact of work-related injuries and occupational disease.
Workers’ Compensation Medical Panels
Medical panels provide the WCB and Appeals Commission with an impartial, independent decision-making process to resolve medical issues that affect a claimant’s right to compensation. Each panel is made up of three contracted physicians with specialized knowledge of the medical area in dispute.
2013-2014 Alberta Jobs, Skills, Training and Labour Annual Report13
2013-2014 Ministry Goals, Priority Initiatives and Performance Measures
Jobs, Skills, Training and Labour is responsible for reporting on the following goals, priority initiatives and performance measures:
Alberta has fair, safe, healthy and inclusive workplaces and a skilled labour force that contributes to economic prosperity
Priority Initiatives:
• Streamline and institute compliance models that align workplace enforcement activities while advancing awareness through partnerships, educational programs, and best practices.
• Enhance labour legislation and policies to ensure workplaces are productive, fair, and safe.
• Implement targeted workforce strategies and initiatives to increase labour force participation of under-represented groups.*
• Provide timely, effective and efficient services to the labour relations stakeholders through the Alberta Labour Relations Board.
• Provide timely and fair appeal services through the Appeals Commission for Alberta Workers’ Compensation.
• In collaboration with other ministries, strengthen partnerships with Alberta’s industry associations and employers to assist them in meeting their workforce requirements.*
* Indicates priority initiatives are shared with Human Services for 2013-2014.
Performance Measures:
• Inter-provincial rank of Alberta’s First Nations, Métis and off-reserve labour force participation rate.
• Lost-time Claim Rate: Number of lost-time claims per 100 person-years worked.
Alberta’s workforce is skilled and productive
Priority Initiatives:
• Develop a new Alberta immigration approach, including a highly targeted domestic and international labour marketing strategy to help meet Alberta’s labour challenges.
• Develop strategies to increase participation of groups under-represented in the workforce, including youth.
• Develop an Aboriginal workforce strategy, building on Connecting the Dots: Aboriginal Workforce and Economic Development in Alberta.
From Human Services 2013-16 Business Plan
From former Enterprise and Advanced Education 2013-16 Business Plan
2013-2014 Alberta Jobs, Skills, Training and Labour Annual Report14
• Renew Alberta’s labour strategy, including enhancing and developing tools for improved labour market information and forecasting to anticipate and meet labour needs.
Performance Measures:
• Alberta’s labour force participation rate and interprovincial ranking.
• Alberta’s immigrant labour force participation rate.
2013-2014 Alberta Jobs, Skills, Training and Labour Annual Report15
[Original signed by Merwan N. Saher, FCA]

2013-2014 Alberta Jobs, Skills, Training and Labour Annual Report16
Performance Measures Summary Table
Goals/Performance Measure(s) Prior Year’s Results Target Current Actual
1. Alberta has fair, safe, healthy and inclusive workplaces and a skilled labour force that contributes to economic prosperity
1.a Inter-provincial rank of Alberta’s First Nations, Métis and Inuit off-reserve labour force participation rate
#3
(69.9%)
#1
(70.6%)
#1
(67.7%)
#2
(69.9%)
#1 #1
(71.7%)
2009 2010 2011 2012 2013
1.b Lost-time claim rate: number of lost-time claims per 100 person-years worked
1.59 r 1.47 r 1.50 r 1.40 r 1.35 1.34
2009 2010 2011 2012 2013
2. Alberta’s workforce is skilled and productive
2.a Alberta’s labour force participation rate and interprovincial ranking*
#1
(74.3%)
#1
(72.9%)
#1
(73.7%)
#1
(73.4%)
#1
(73.7%)
#1
(73.1%)
2009 2010 2011 2012 2013
2.b Alberta’s immigrant labour force participation rate 69.0% 68.9% 70.2% 69.9% 70.9% 68.2%
2009 2010 2011 2012 2013
r The previous four years of results were re-calculated with the updated data provided by the WCB. By re-calculating historical results, this provides the reader most accurate and up-to-date injury information. There is no change in how the result is calculated.
* Indicates performance measure that has been reviewed by the Office of the Auditor General
The performance measure indicated with an asterisk was selected for review by ministry management based on the following criteria established by government:
• Enduring measures that best represent the goal;
• Measures for which new data is available; and
• Measures that have well-established methodology.
2013-2014 Alberta Jobs, Skills, Training and Labour Annual Report17
Discussion and Analysis of Results
Each day in Alberta, more than two million people go to work. They are the front lines of economic growth, international competitiveness, responsible development and building Alberta. Jobs, Skills, Training and Labour was created to contribute to thriving workplaces that are safe, fair and healthy and to help current and future workers be equipped to do their jobs. With an unemployment rate of 4.6 per cent in 2013 and skill shortages increasing across many sectors, it was the time to create this ministry and bring a sharper focus on making Alberta’s workplaces the safest, fairest and most productive in Canada. The ministry works with key stakeholders and builds strong relationships to jointly create the positive change needed to support Alberta’s dynamic economy as well as workplaces that meet the needs of both employers and workers.
The ministry’s 2013-2014 revenues were $63.4 million, approximately $11.5 million more than the previous year. The increase is primarily due to an increase of $8.5 million in revenue received from the Workers’ Compensation Board. The increase was partially offset by a decrease in federal government transfers allocated to ministry programs. The ministry’s overall spending in 2013-2014 was $135.8 million, which was a decrease of $6.2 million from the prior year. A decrease of $14.9 million in the Workforce Strategies program was partially offset by an increase of $6.3 million in the Safe, Fair and Healthy Workplaces program and other smaller increases in ministry programs.
Within this context, the following sections outline the accomplishments of Jobs, Skills, Training and Labour during 2013-2014.
2013-2014 Alberta Jobs, Skills, Training and Labour Annual Report18
Goal 1: Alberta has fair, safe, healthy and inclusive workplaces and a skilled labour force that contributes to economic prosperity
Safe, fair and healthy workplaces contribute to productivity, increase the quality of life for Alberta workers and support keeping Alberta prosperous and competitive in the global economy. The ministry informs, promotes, monitors, and regulates employers and workers in Alberta about workplace rights and responsibilities, including labour relations, occupational health and safety, and employment standards.
In addition, the ministry works to support the development of Alberta’s labour force. Through collaborative efforts with Alberta’s industry associations, employers, other provincial government ministries and the federal government, the ministry works to support Albertans in their ongoing attachment to and resilience in the labour force through the availability of learning and training opportunities.
Key results and highlights during 2013-2014 which support this goal include:
Employment Standards• On September 1, 2013, the minimum wage was adjusted to reflect increases to the Consumer
Price Index and Average Weekly Earnings in Alberta. The general minimum wage was raised from $9.75 per hour to $9.95 per hour. The liquor server minimum wage rate remained unchanged at $9.05 per hour. The recommendation to increase the general minimum wage was based on the indexing policy adopted by the government in 2011, which ties increases in the minimum wage to changes in the Consumer Price Index and average weekly earnings.
• On February 1, 2014, the Employment Standards Code (Code) was amended by a private member’s bill to add compassionate care leave. The leave is accessible to eligible employees requiring time off from work to care for gravely ill family members. The leave protects an employee’s job during their absence when they are acting as a primary caregiver and employees may be eligible for corresponding federal employment insurance benefits during that time.
• The ministry significantly enhanced the resources available for Albertans wishing to submit an employment standards complaint. These new resources provide potential claimants with multiple self-help tools and are expected to improve the accuracy of estimates regarding unpaid earnings while bringing considerably quicker resolution to claims. The resources are available online at http://work.alberta.ca/employment-standards.html by clicking on the Submit a Complaint link.
• Over 6,200 employment standards complaints were received in 2013-2014 and 6,975 investigations were completed. These investigations resulted in over $4.5 million in unpaid earnings being returned to Albertans.
• The ministry’s Temporary Foreign Worker Advisory Office (TFWAO) through coordination, cooperation, and collaboration with all levels of governments and non-government partners provided support and services to Temporary Foreign Workers (TFW) across the province to help resolve situations involving unfair, unsafe, or unhealthy working and living conditions.
○ In 2013-2014, the TFWAO provided 51 presentations across Alberta to TFW and other stakeholders to raise awareness of their rights and responsibilities; TFWAO staff also served over 2,200 TFW on a one-on-one basis to address their concerns.
○ The TFWAO made over 4,300 enforcement and non-enforcement referrals to provincial, federal and non-government partners regarding concerns from TFW.
2013-2014 Alberta Jobs, Skills, Training and Labour Annual Report19
Occupational Health and Safety• Jobs, Skills, Training and Labour established an administrative penalty system and a ticketing
system for occupational health and safety (OHS) violations to provide additional compliance tools to encourage workers and their employers to consistently abide by OHS law.
○ In March 2014, the first ten Occupational Health and Safety Officers completed newly designed peace officer training. The new designation gives officers the ability to write tickets to employers and workers who cut corners and put people at risk.
• Through a well-publicized, province-wide campaign, the ministry continued to focus on improving industry health and safety measures. For example, proactive work focusing on the ski hill industry resulted in considerable improvements in the second year of the project. Specifically, 66 per cent fewer orders were issued to employers.
• Over 8,500 inspections and re-inspections were conducted in 2013-2014 resulting in the issuance of over 7,500 OHS orders to employers to meet and comply with safety and/or health standards as set out in the OHS Act, Regulation and Code. In addition, ten prosecutions for the most serious OHS infractions were undertaken with fine amounts ranging from $75 thousand to $1.25 million.
Labour Relations• In 2013, 97.8 per cent of collective bargaining agreements were achieved without a work
stoppage. Of the 85 mediations that were concluded in the year where a ministry-appointed mediator was engaged to assist the parties in their negotiations, over 80 were settled without a work stoppage.
Development of Alberta’s Workforce• The Alberta Learning Information Service (ALIS) website attracted 4.75 million visitors in 2013-
2014 and continued to provide career, learning, employment, workplace and labour market information resources in print and online to help Albertans make informed plans and decisions.
• The Integrated Service Program (ISP), which is co-managed by the ministry and Citizenship and Immigration Canada (CIC), provides funding to non-profit agencies to support the successful settlement and integration of newcomers to Alberta. ISP services and activities increase the ability of newcomers to access opportunities, services and resources, as well as to enhance their labour market participation and economic independence. Approximately 29,000 clients were served through the program in 2013-2014.
• The ministry’s Language Assessment Services program assesses English language skills for newcomers, and provides information and counselling for language and skills training options to help newcomers secure jobs and stay employed. Approximately 26,000 Albertans received these services in 2013-2014.
• English as a Second Language (ESL) drop-in supports provide learning opportunities to immigrants who cannot access mainstream programming. Approximately 1,500 learners received services at ESL drop-in centres in 2013-2014. The Language Training Program (LTP) Innovation Fund continued to support the Alberta language learning community by funding innovative projects to help skilled immigrants integrate into the labour market. An example of a successful LTP project is with Alberta Workforce Essential Skills Society (AWES) called Focus on Investment. This project developed and delivered an e-learning course called English Through the Workplace Safety (EWS) Program. In addition, they created an e-learning version of the Construction Safety Training
2013-2014 Alberta Jobs, Skills, Training and Labour Annual Report20
System Study Guide to help newcomers take the construction safety course.
• Temporary Foreign Worker (TFW) Support Services provided funding to immigrant settlement agencies to help support TFWs’ transition into living and working in Alberta. Services are provided through five agencies in seven communities throughout Alberta. An estimated 4,250 clients accessed TFW Support Services in 2013-2014.
Alberta Labour Relations Board• In 2013-2014, the Alberta Labour Relations Board (ALRB) addressed a number of high profile
labour disputes in the public sector. The ALRB continues to see success in resolving matters without formal adjudication with 73 per cent of applications being resolved without going to hearing.
Appeals Commission for Alberta Workers’ Compensation• In 2013-2014, the Appeals Commission worked to recruit and develop new commissioners;
developed a comprehensive quality management system; redeveloped its website to improve ease of use, implemented electronic document management which will enable appeals to be submitted electronically; broadened the use of video-conferencing; and improved its records management system, including improving privacy compliance protocols.

2013-2014 Alberta Jobs, Skills, Training and Labour Annual Report21
Performance Measures
Inter-provincial rank of Alberta’s First Nations, Métis and Inuit off-reserve labour force participation rate Target: #1 Result: #1
67.0%
72.0%
2009 2010 2011 2012 2013
75.0%
74.0%
73.0%
71.0%
70.0%
69.0%
68.0%
69.9% 69.9%
70.6%
67.7%
71.7%
Labour Force Participation Rate of Off-Reserve Alberta First Nations, Metis and Inuit
The First Nations, Métis and Inuit off-reserve labour force participation rate in Alberta was the highest in Canada at 71.7 per cent, with Saskatchewan having the second highest participation rate at 66.3 per cent.
The ministry continued to invest in Community Plans and Labour Force Surveys for Aboriginal communities to help increase labour force participation, supported Aboriginal entrepreneurs interested in starting up or expanding a business, and supported Aboriginal youth through entrepreneurial and career exposure camps.
Through partnerships with other ministries, governments, industry, employers and Aboriginal groups and communities, working to increase the participation rate of under-represented groups, including Aboriginal Albertans, remains a priority for Jobs, Skills, Training and Labour.
In 2014-2015, this performance measure will be reported as a performance indicator in Jobs, Skills, Training and Labour’s annual report, along with Alberta immigrants and youth as there are many factors outside the ministry’s sphere of influence that impact the results.
2013-2014 Alberta Jobs, Skills, Training and Labour Annual Report22
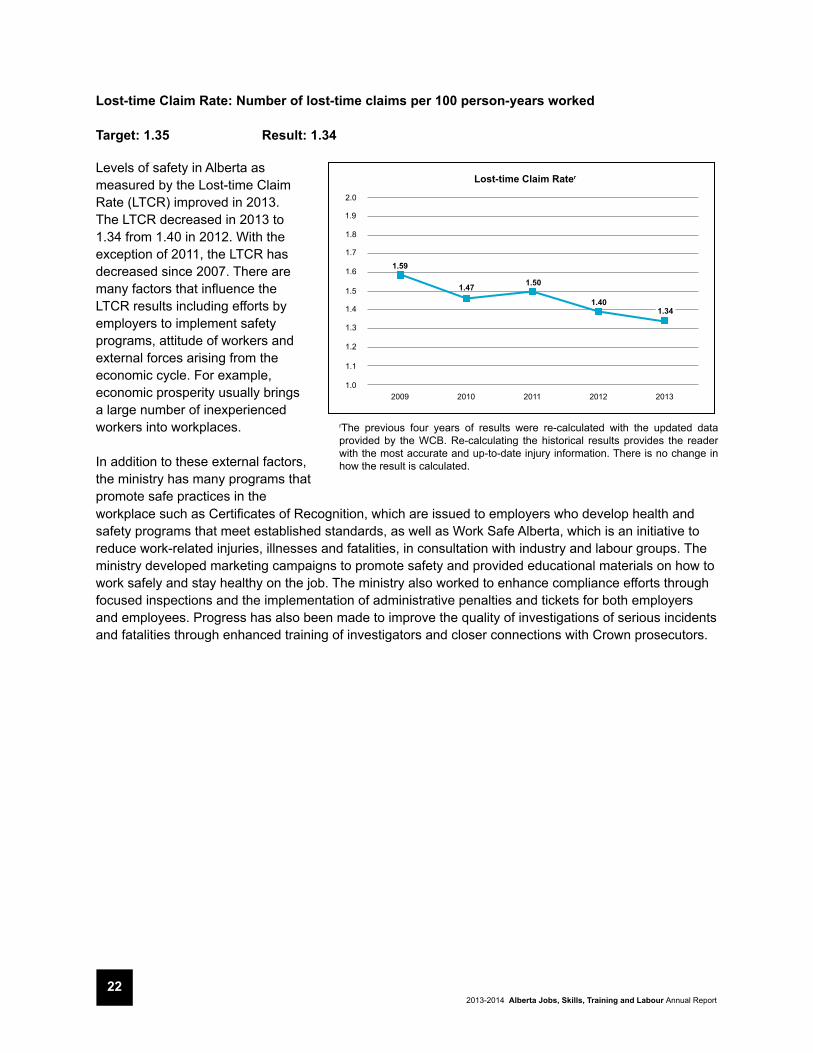
Lost-time Claim Rate: Number of lost-time claims per 100 person-years worked
Target: 1.35 Result: 1.34
1.0
1.5
2009 2010 2011 2012 2013
1.8
1.7
1.6
1.4
1.3
1.2
1.1
1.59
1.40
1.47 1.50
1.34
Lost-time Claim Rater
1.9
2.0
rThe previous four years of results were re-calculated with the updated data provided by the WCB. Re-calculating the historical results provides the reader with the most accurate and up-to-date injury information. There is no change in how the result is calculated.
Levels of safety in Alberta as measured by the Lost-time Claim Rate (LTCR) improved in 2013. The LTCR decreased in 2013 to 1.34 from 1.40 in 2012. With the exception of 2011, the LTCR has decreased since 2007. There are many factors that influence the LTCR results including efforts by employers to implement safety programs, attitude of workers and external forces arising from the economic cycle. For example, economic prosperity usually brings a large number of inexperienced workers into workplaces.
In addition to these external factors, the ministry has many programs that promote safe practices in theworkplace such as Certificates of Recognition, which are issued to employers who develop health and safety programs that meet established standards, as well as Work Safe Alberta, which is an initiative to reduce work-related injuries, illnesses and fatalities, in consultation with industry and labour groups. The ministry developed marketing campaigns to promote safety and provided educational materials on how to work safely and stay healthy on the job. The ministry also worked to enhance compliance efforts through focused inspections and the implementation of administrative penalties and tickets for both employers and employees. Progress has also been made to improve the quality of investigations of serious incidents and fatalities through enhanced training of investigators and closer connections with Crown prosecutors.
2013-2014 Alberta Jobs, Skills, Training and Labour Annual Report23
Goal 2: Alberta’s workforce is skilled and productive
Alberta’s economic success depends on the strength and skill of our labour force. Jobs, Skills, Training and Labour works to support and develop Alberta’s labour force through programs and initiatives that are responsive to Alberta’s labour needs. Some activities include developing timely and relevant labour market information, supporting under-represented groups; attraction and retention efforts, and recognizing other Canadian and foreign qualifications.
Key results and highlights during 2013-2014 which support this goal include:
New Immigration Approach
• The ministry leverages the Alberta Immigrant Nominee Program (AINP) to attract work-ready migrants to the province. Individuals nominated by the Government of Alberta can apply to the federal government for a permanent resident visa as a Provincial Nominee. In 2013, just over 9,894 applications were processed, resulting in the issuance of 5,541 nomination certificates. This impacted approximately 11,962 individuals (principal applicants and family members).
• The ministry piloted an initiative to allow foreign workers with Alberta work experience to apply directly to the AINP. The AINP also made program criteria changes to simplify the application process. These changes were made to help those working in Alberta stay permanently and will help to build Alberta’s permanent workforce.
• The ministry continued to raise awareness of the AINP with Alberta employers and immigrants through a coordinated marketing campaign including webinars that reached over 2,600 attendees.
• The ministry’s Foreign Qualification Recognition Innovation Fund continued to assist stakeholders with streamlining the foreign qualification assessment process, improving access to relevant and current information about qualification recognition processes, and enhancing the recognition of internationally trained applicants. Many Professional Regulatory Organizations (PROs) have used the fund to establish projects that help to eliminate barriers faced by internationally educated professionals. Examples of projects include:
○ In 2013-2014, the College of Physical Therapists of Alberta completed a review of international physiotherapy education accreditation systems in Australia, United States, United Kingdom and Ireland. The review found these accreditation systems to be broadly comparable to systems in place in Canada, and as a result the College will now work towards exploring the recognition of physical therapy certification from those countries and to developing mutual recognition agreements with the above countries.
○ In 2013-2014, Global Leadership Associates created nine workplace cultural competency online training modules for employers and immigrants. These modules increase the capacity of employers to understand and better use the skills of their international employees, and allow internationally trained workers to learn about Canadian workplace cultural norms and how to advance within Canadian employment systems.
• Recognition of international educational credentials was facilitated by the ministry’s International Qualifications Assessment Services (IQAS), which issued over 8,300 assessment certificates in 2013-2014. This represents an increase of more than 900 assessment certificates issued from the previous year. These certificates help immigrants access the Alberta job market, educational institutions, and professional regulatory organizations.
2013-2014 Alberta Jobs, Skills, Training and Labour Annual Report24
• Alberta also held the Secretariat for the Federal/Provincial/Territorial (FPT) Ministers responsible for Immigration and worked with our FPT partners to build a stronger and more successful immigration system. The Secretariat helped to advance the design and development of the new federal immigration system Expression of Interest (EOI) to help meet the workforce needs of Alberta and across Canada.
• In 2013-2014, Alberta held Expression of Interest Dialogue Sessions with employers and stakeholders in Edmonton and Calgary that generated feedback that was important in advancing Alberta’s perspective on the federal EOI system.
Domestic and International Labour Marketing Strategy
• In 2013-2014, the ministry made significant progress in supporting Alberta employers with highly targeted domestic and international recruitment strategies and connected job seekers with opportunities in Alberta.
○ In May 2013, the ministry hosted a two-day virtual job expo, providing a platform for Alberta employers and partners to connect virtually with jobseekers. More than 1,400 attendees from Alberta, Canada and various international markets had the opportunity to chat live with employers, apply for jobs, join online presentations and download information about working in Alberta. The ministry also supported Calgary Economic Development and Alberta employers that attended Working Abroad Job Fairs in Ireland and the United Kingdom, by providing on-site immigration expertise.
○ Web applications hosted on the AlbertaCanada.com immigration site were updated to provide greater functionality on mobile devices. These applications include an interactive Alberta map, a frequently asked questions tool, and Alberta Newcomer Information Subscription Services forms. Traffic to the immigration portal increased 44 per cent from 2012-2013, to more than two million visits, and subscriptions to the Alberta Newcomer Information Subscription Service grew by 14 per cent from 2012-2013 to more than 32,000 users.
○ Many prospective immigrants to Alberta require decision support, procedural information about the immigration process, and pre-arrival and settlement advice. The ministry’s Immigration Help Centre (IHC), available on AlbertaCanada.com, was implemented in 2013-2014 and provides comprehensive immigration information through an online, interactive self-service tool. The IHC is built around a searchable frequently asked questions (FAQs) tool which generates custom immigration information based on a database of more than 500 questions. The IHC also features pre- and post-arrival checklists for newcomers, video FAQs, video testimonials from new Albertans, and a link to the Alberta Newcomer Information Subscription Service. Since its launch in May of 2013, the IHC has received more than 140,000 visits.
Participation of Under-Represented Groups in the Workforce
• Jobs, Skills, Training and Labour partnered with industry associations to support a number of projects aimed at increasing labour force participation amongst under-represented groups and developing timely, relevant labour market information.
○ In 2013-2014, the ministry supported projects that help Alberta’s efforts to ease worker shortages by encouraging participation of women in industries where they are under-represented. This included supporting Electricity Human Resources Canada who
2013-2014 Alberta Jobs, Skills, Training and Labour Annual Report25
conducted two Alberta-specific pilot projects for the electricity sector and development of videos targeted towards women. The series of videos feature women in the Alberta electricity sector and provide an introduction to the wide variety of positions available.
○ Progress Highlights on the Connecting the Dots: Aboriginal Workforce and Economic Development in Alberta strategy was released in October 2013 to demonstrate progress related to Aboriginal workforce and economic development in Alberta. The cross-ministry partners for this strategy include Jobs, Skills, Training and Labour; Human Services; Aboriginal Relations; Innovation and Advanced Education; Education; Service Alberta; Culture; Justice and Attorney General; and Corporate Human Resources.
○ In 2013-2014, the ministry engaged a broad range of stakeholders to define the needs, gaps and approaches related to youth employment issues and supported several projects. This included partnering with Calgary Region of Human Services, Calgary Logistics Council and the Calgary Regional Partnership on the Attracting Youth to a Sustainable Supply Chain Workforce Pilot Project. Over 70 per cent of the youth participants completed the classroom and paid internship components, leading to over 60 per cent of them obtaining a job and the remainder either entering education or identified for further employment readiness opportunities. The engagement has also guided the development of career awareness and a career services model in the Calgary Region.
Workforce Strategies• Working with other ministries, the ministry continued to develop and distribute labour market
information, analysis and forecasts.
○ In 2013-2014, Jobs, Skills, Training and Labour released an updated Occupational Demand and Supply Outlook for 2013-2023. The Occupational Demand and Supply Outlook, which is available at http://work.alberta.ca/demand-supply-outlook, contains information on forecasted labour shortages and surpluses for occupations in Alberta for the next 10 years. The most recent Outlook forecasts a cumulative labour shortage in Alberta of 96,000 workers by the year 2023. The Occupational Demand and Supply Outlook, along with other labour market information, provides the foundation of evidence on which the ministry is able to develop a workforce to meet future demands by building essential skills and promoting ongoing learning.
○ The ministry continued its partnership with the Construction Owners Association of Alberta and the oil sands industry to project workforce supply and demand for Alberta’s oil sands industry through the Oil Sands Information Labour Market Analysis Projection (OILMAP) tool. OILMAP information was released on December 19, 2013 on the Construction Owners Association of Alberta’s website at http://www.coaa.ab.ca and clicking on Workforce Demand Forecast. In 2013-2014, over 225 energy-related projects were tracked through the tool, involving more than 400 companies. The OILMAP workforce model enables industry, government and other stakeholders to have a better understanding of the labour force requirements for heavy industrial construction projects for workforce planning and policy development.
○ The Alberta Workforce Information (AWI) tool was launched by the ministry in November 2013. AWI is an online subscription tool that employers can sign-up for to receive timely and relevant workforce related information. As of March 31, 2014, there were 616 employers registered.
2013-2014 Alberta Jobs, Skills, Training and Labour Annual Report26
Performance Measures
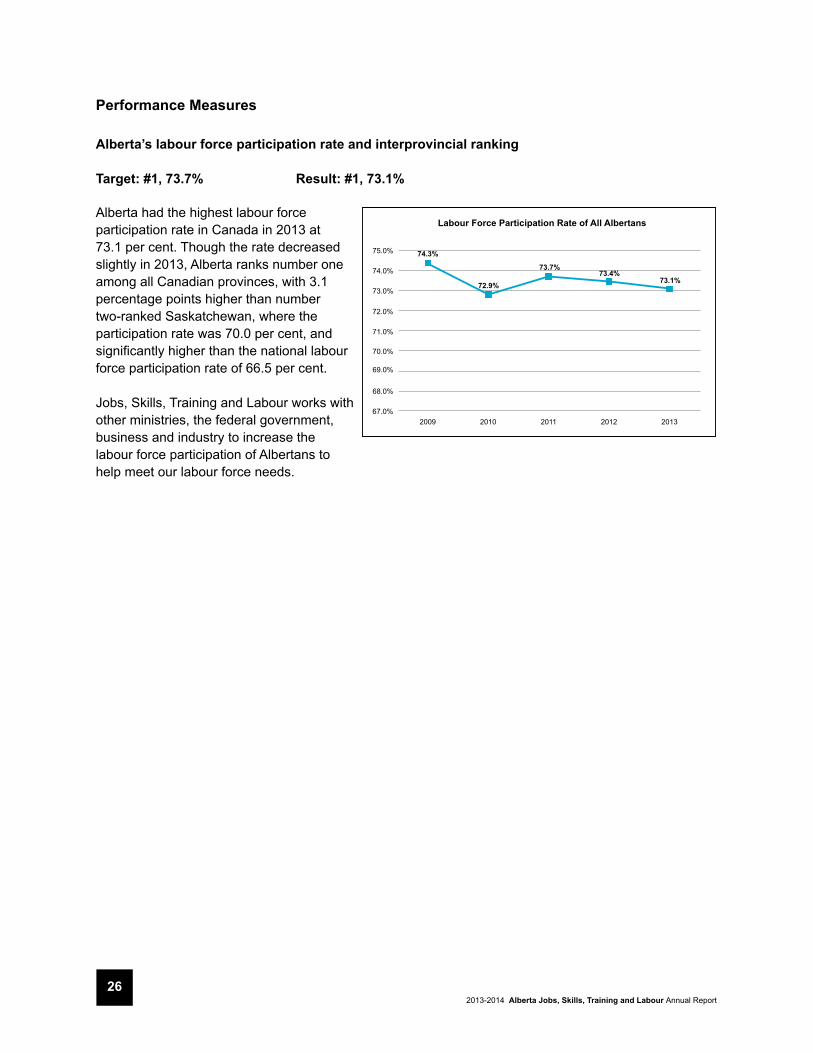
Alberta’s labour force participation rate and interprovincial ranking
Target: #1, 73.7% Result: #1, 73.1%
Alberta had the highest labour force participation rate in Canada in 2013 at 73.1 per cent. Though the rate decreased slightly in 2013, Alberta ranks number one among all Canadian provinces, with 3.1 percentage points higher than number two-ranked Saskatchewan, where the participation rate was 70.0 per cent, and significantly higher than the national labour force participation rate of 66.5 per cent.
Jobs, Skills, Training and Labour works with other ministries, the federal government, business and industry to increase the labour force participation of Albertans to help meet our labour force needs.
67.0%
72.0%
2009 2010 2011 2012 2013
75.0%
74.0%
73.0%
71.0%
70.0%
69.0%
68.0%
74.3%
73.4%72.9%
73.7%
73.1%
Labour Force Participation Rate of All Albertans

2013-2014 Alberta Jobs, Skills, Training and Labour Annual Report27
Alberta’s immigrant labour force participation rate
Target: 70.9% Result: 68.2%
Even though the immigrant participation rate declined, Alberta was one of the three provinces (along with Saskatchewan and Manitoba) with the highest immigrant labour force participation rates over the last three years. Alberta will continue to work to ensure that economic immigration selection criteria at the national level are responsive to Alberta’s labour market needs. This is essential given that the majority of economic immigrants landing in Alberta come under the federal streams. Alberta will continue to promote pathways for retaining skilled workers, and increase the labour force participation rates of immigrants.
Note: In 2014-2015, this performance measure will be reported as a performance indicator in Jobs, Skills, Training and Labour’s annual report, along with the participation rates of Aboriginal Albertans living off-reserve and youth as there are many factors outside the ministry’s sphere of influence that impact the results.
The labour force participation rate of immigrant Albertans has been decreasing over the last few years. The decline in labour force participation rate between 2012 and 2013 is more pronounced among very recent immigrants.
Alberta has been very successful in attracting new immigrants in recent years and the number of new immigrants has been increasing annually. Because new immigrants initially have lower labour force participation rates, this contributed to the lower overall immigrant participation rate.
67.0%
72.0%
2009 2010 2011 2012 2013
75.0%
74.0%
73.0%
71.0%
70.0%
69.0%
68.0%
69.0%
69.9%
68.9%
70.2%
68.2%
Labour Force Participation Rate of Alberta Immigrants
2013-2014 Alberta Jobs, Skills, Training and Labour Annual Report28
Financial Information
Independent Auditor’s Report
Financial Statements
Financial Statements: Workers’ Compensation Board

2013-2014 Alberta Jobs, Skills, Training and Labour Annual Report29
[Original signed by Merwan N. Saher, FCA]
2013-2014 Alberta Jobs, Skills, Training and Labour Annual Report30
Financial StatementsYear ended March 31, 2014
Statement of OperationsStatement of Financial PositionStatement of Cash FlowsNotes to the Financial StatementsSchedule 1 – RevenuesSchedule 2 – Credit or RecoverySchedule 3 – Expenses – Directly Incurred Detailed by ObjectSchedule 4 – Lapse/Encumbrance Schedule 5 – Lottery Fund EstimatesSchedule 6 – Salary and Benefits DisclosuresSchedule 7 – Related Party TransactionsSchedule 8 – Allocated Costs
2013-2014 Alberta Jobs, Skills, Training and Labour Annual Report31
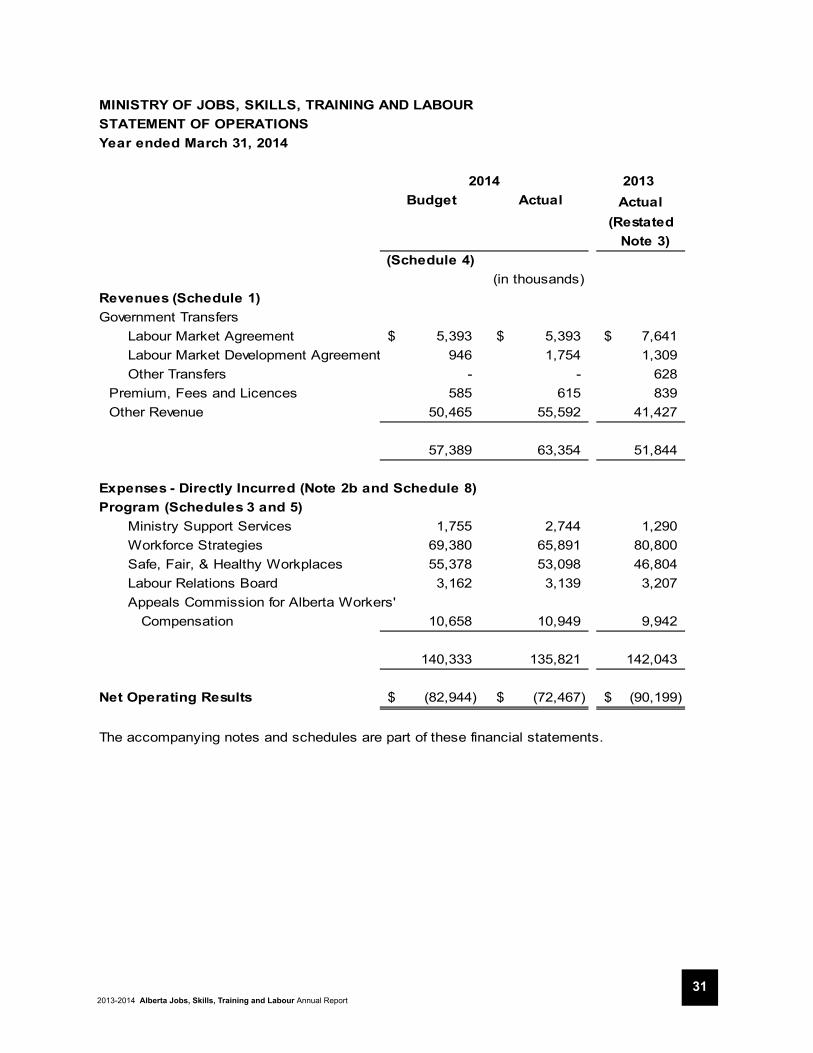
MINISTRY OF JOBS, SKILLS, TRAINING AND LABOURSTATEMENT OF OPERATIONSYear ended March 31, 2014
2013Actual
(Restated Note 3)
(Schedule 4)(in thousands)
Revenues (Schedule 1)Government Transfers
Labour Market Agreement 5,393$ 5,393$ 7,641$ Labour Market Development Agreement 946 1,754 1,309 Other Transfers - - 628
Premium, Fees and Licences 585 615 839 Other Revenue 50,465 55,592 41,427
57,389 63,354 51,844
Expenses - Directly Incurred (Note 2b and Schedule 8)Program (Schedules 3 and 5)
Ministry Support Services 1,755 2,744 1,290 Workforce Strategies 69,380 65,891 80,800 Safe, Fair, & Healthy Workplaces 55,378 53,098 46,804 Labour Relations Board 3,162 3,139 3,207 Appeals Commission for Alberta Workers' Compensation 10,658 10,949 9,942
140,333 135,821 142,043
Net Operating Results (82,944)$ (72,467)$ (90,199)$
The accompanying notes and schedules are part of these financial statements.
2014 Actual Budget
2013-2014 Alberta Jobs, Skills, Training and Labour Annual Report32
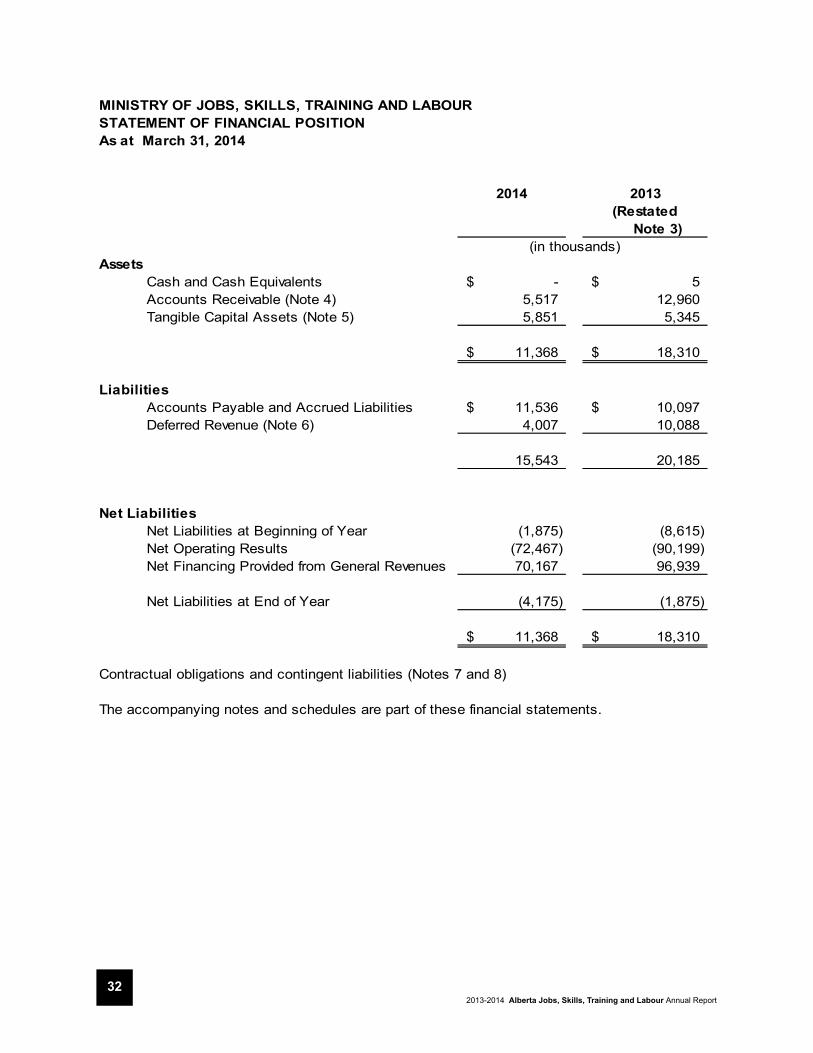
MINISTRY OF JOBS, SKILLS, TRAINING AND LABOURSTATEMENT OF FINANCIAL POSITION
2014 2013(Restated
Note 3)(in thousands)
AssetsCash and Cash Equivalents -$ 5$ Accounts Receivable (Note 4) 5,517 12,960 Tangible Capital Assets (Note 5) 5,851 5,345
11,368$ 18,310$
Liabilities Accounts Payable and Accrued Liabilities 11,536$ 10,097$ Deferred Revenue (Note 6) 4,007 10,088
15,543 20,185
Net LiabilitiesNet Liabilities at Beginning of Year (1,875) (8,615) Net Operating Results (72,467) (90,199) Net Financing Provided from General Revenues 70,167 96,939
Net Liabilities at End of Year (4,175) (1,875)
11,368$ 18,310$
Contractual obligations and contingent liabilities (Notes 7 and 8)
The accompanying notes and schedules are part of these financial statements.
As at March 31, 2014

2013-2014 Alberta Jobs, Skills, Training and Labour Annual Report33
MINISTRY OF JOBS, SKILLS, TRAINING AND LABOURSTATEMENT OF CASH FLOWS
2014 2013(Restated
Note 3)(in thousands)
Operating TransactionsNet Operating Results (72,467)$ (90,199)$ Non-Cash Items included in Net Operating Results
Amortization 1,579 935 Unearned Revenue recognized as Revenue (39,419) (32,935)
(110,307) (122,199)
Decrease (Increase) in Accounts Receivable 7,443 (7,838) Increase in Accounts Payable
and Accrued Liabilities 1,439 582 Unearned Revenue received/receivable 33,338 33,864
Cash Applied to Operating Transactions (68,087) (95,591)
Capital Transactions Acquisition of Tangible Capital Assets (2,085) (1,343)
Cash Applied to Capital Transactions (2,085) (1,343)
Financing TransactionsNet Financing Provided from General Revenues 70,167 96,939
(Decrease) Increase in Cash (5) 5
Cash at Beginning of Year 5 -
Cash at End of Year - 5$
The accompanying notes and schedules are part of these financial statements.
Year ended March 31, 2014
2013-2014 Alberta Jobs, Skills, Training and Labour Annual Report34
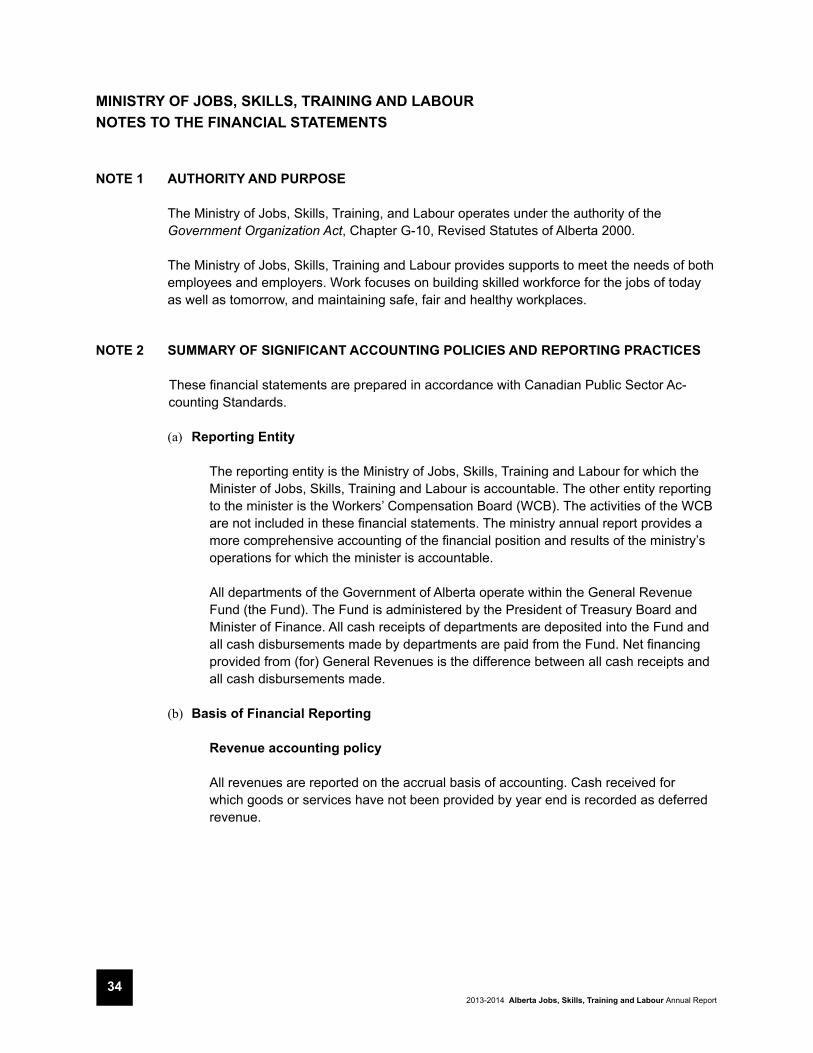
MINISTRY OF JOBS, SKILLS, TRAINING AND LABOURNOTES TO THE FINANCIAL STATEMENTS
NOTE 1 AUTHORITY AND PURPOSE
The Ministry of Jobs, Skills, Training, and Labour operates under the authority of the Government Organization Act, Chapter G-10, Revised Statutes of Alberta 2000.
The Ministry of Jobs, Skills, Training and Labour provides supports to meet the needs of both employees and employers. Work focuses on building skilled workforce for the jobs of today as well as tomorrow, and maintaining safe, fair and healthy workplaces.
NOTE 2 SUMMARY OF SIGNIFICANT ACCOUNTING POLICIES AND REPORTING PRACTICES
These financial statements are prepared in accordance with Canadian Public Sector Ac-counting Standards.
(a) Reporting Entity
The reporting entity is the Ministry of Jobs, Skills, Training and Labour for which the Minister of Jobs, Skills, Training and Labour is accountable. The other entity reporting to the minister is the Workers’ Compensation Board (WCB). The activities of the WCB are not included in these financial statements. The ministry annual report provides a more comprehensive accounting of the financial position and results of the ministry’s operations for which the minister is accountable.
All departments of the Government of Alberta operate within the General Revenue Fund (the Fund). The Fund is administered by the President of Treasury Board and Minister of Finance. All cash receipts of departments are deposited into the Fund and all cash disbursements made by departments are paid from the Fund. Net financing provided from (for) General Revenues is the difference between all cash receipts and all cash disbursements made.
(b) Basis of Financial Reporting
Revenue accounting policy
All revenues are reported on the accrual basis of accounting. Cash received for which goods or services have not been provided by year end is recorded as deferred revenue.
2013-2014 Alberta Jobs, Skills, Training and Labour Annual Report35
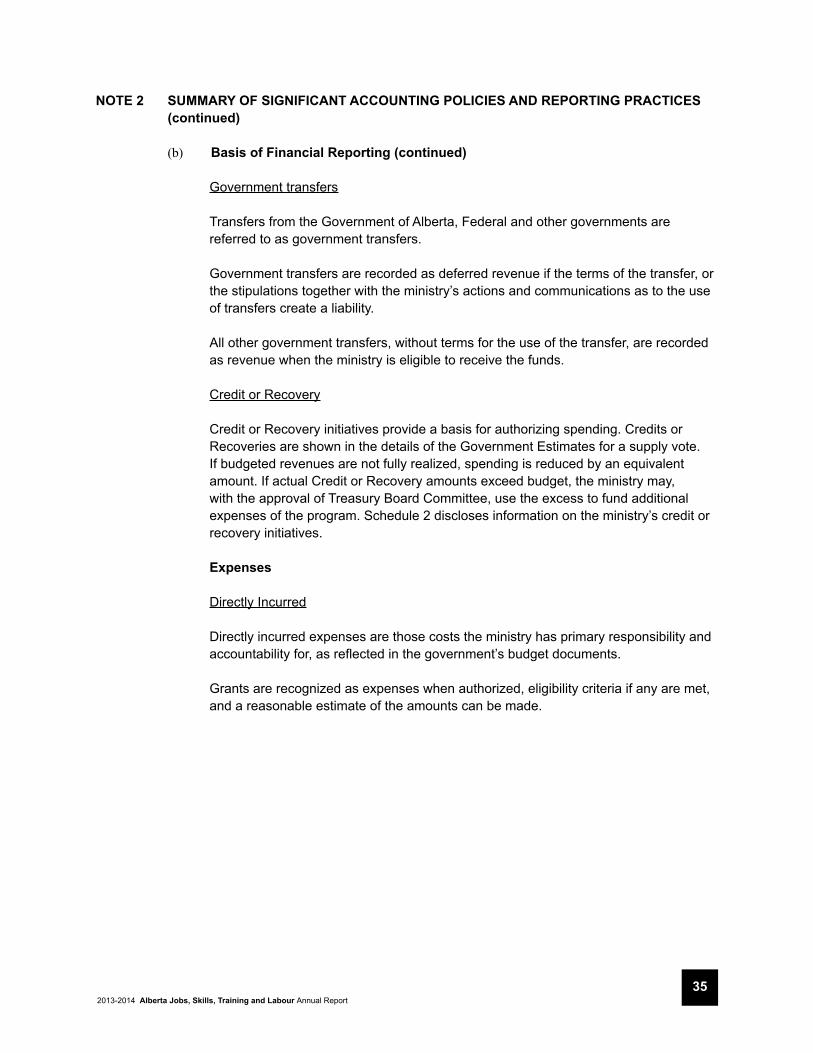
NOTE 2 SUMMARY OF SIGNIFICANT ACCOUNTING POLICIES AND REPORTING PRACTICES (continued)
(b) Basis of Financial Reporting (continued)
Government transfers
Transfers from the Government of Alberta, Federal and other governments are referred to as government transfers.
Government transfers are recorded as deferred revenue if the terms of the transfer, or the stipulations together with the ministry’s actions and communications as to the use of transfers create a liability.
All other government transfers, without terms for the use of the transfer, are recorded as revenue when the ministry is eligible to receive the funds.
Credit or Recovery
Credit or Recovery initiatives provide a basis for authorizing spending. Credits or Recoveries are shown in the details of the Government Estimates for a supply vote. If budgeted revenues are not fully realized, spending is reduced by an equivalent amount. If actual Credit or Recovery amounts exceed budget, the ministry may, with the approval of Treasury Board Committee, use the excess to fund additional expenses of the program. Schedule 2 discloses information on the ministry’s credit or recovery initiatives.
Expenses
Directly Incurred
Directly incurred expenses are those costs the ministry has primary responsibility and accountability for, as reflected in the government’s budget documents.
Grants are recognized as expenses when authorized, eligibility criteria if any are met, and a reasonable estimate of the amounts can be made.
2013-2014 Alberta Jobs, Skills, Training and Labour Annual Report36
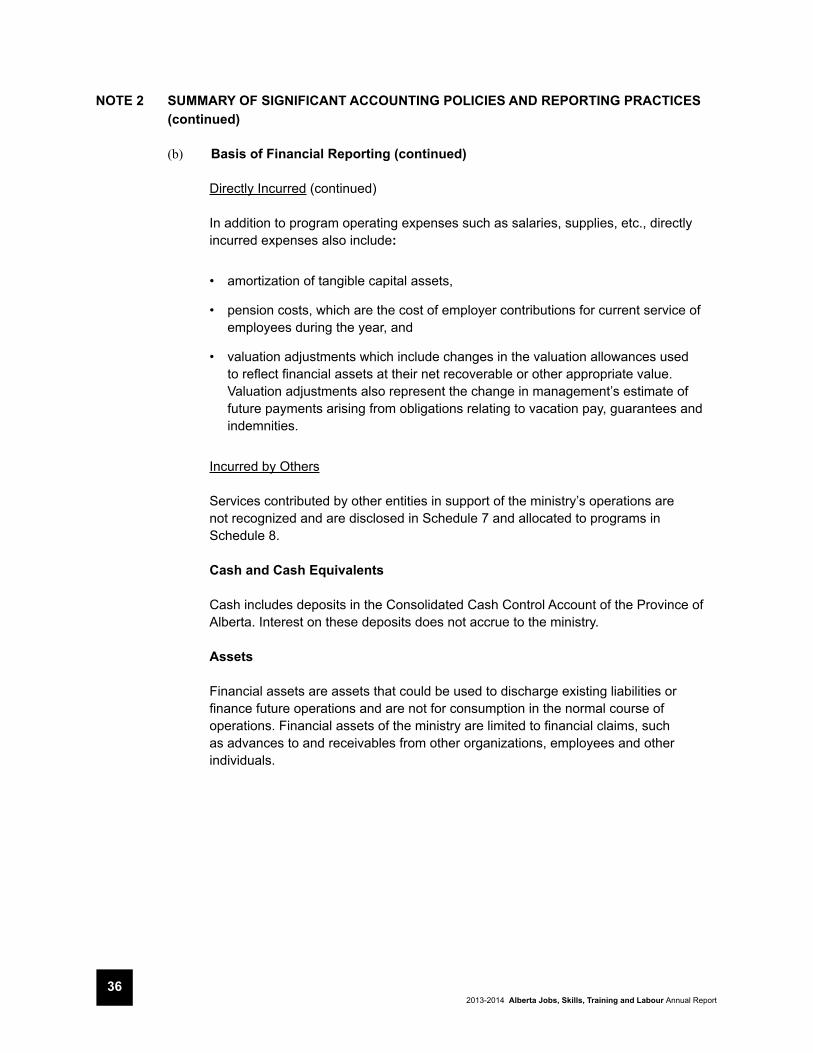
NOTE 2 SUMMARY OF SIGNIFICANT ACCOUNTING POLICIES AND REPORTING PRACTICES (continued)
(b) Basis of Financial Reporting (continued)
Directly Incurred (continued)
In addition to program operating expenses such as salaries, supplies, etc., directly incurred expenses also include:
• amortization of tangible capital assets,
• pension costs, which are the cost of employer contributions for current service of employees during the year, and
• valuation adjustments which include changes in the valuation allowances used to reflect financial assets at their net recoverable or other appropriate value. Valuation adjustments also represent the change in management’s estimate of future payments arising from obligations relating to vacation pay, guarantees and indemnities.
Incurred by Others
Services contributed by other entities in support of the ministry’s operations are not recognized and are disclosed in Schedule 7 and allocated to programs in Schedule 8.
Cash and Cash Equivalents
Cash includes deposits in the Consolidated Cash Control Account of the Province of Alberta. Interest on these deposits does not accrue to the ministry.
Assets
Financial assets are assets that could be used to discharge existing liabilities or finance future operations and are not for consumption in the normal course of operations. Financial assets of the ministry are limited to financial claims, such as advances to and receivables from other organizations, employees and other individuals.
2013-2014 Alberta Jobs, Skills, Training and Labour Annual Report37
NOTE 2 SUMMARY OF SIGNIFICANT ACCOUNTING POLICIES AND REPORTING PRACTICES (continued)
(b) Basis of Financial Reporting (continued)
Assets acquired by right are not included. Tangible capital assets of the ministry are recorded at historical cost and amortized on a straight-line basis over the estimated useful lives of the assets.
The threshold for capitalizing new systems development is $250,000 and the threshold for major systems enhancements is $100,000. The threshold for all other tangible capital assets is $5,000. All land is capitalized.
Contributed tangible capital assets are recorded at their fair value at the time of contribution.
Amortization is only charged if the tangible capital asset is in use.
When physical assets are gifted or sold for a nominal sum, the net book value of these physical capital assets less any nominal proceeds are recorded as grants in kind.
Liabilities
Liabilities are recorded to the extent that they represent present obligations as a result of events and transactions occurring prior to the end of the fiscal year. The settlement of liabilities will result in sacrifice of economic benefits in the future.
Valuation of Financial Assets and Liabilities
Fair value is the amount of consideration agreed upon in an arm’s-length transaction between knowledgeable, willing parties who are under no compulsion to act.
The fair values of Cash and Cash Equivalents, Accounts Receivable, and Accounts Payable and Accrued Liabilities are estimated to approximate their carrying values because of the short-term nature of these instruments.

2013-2014 Alberta Jobs, Skills, Training and Labour Annual Report38
NOTE 2 SUMMARY OF SIGNIFICANT ACCOUNTING POLICIES AND REPORTING PRACTICES (continued)
(b) Basis of Financial Reporting (continued)
Net Liabilities Net Liabilities represent the difference between the carrying value of assets held by the ministry and its liabilities.
Canadian Public Sector Accounting Standards require a “net debt” presentation for the statement of financial position in the summary financial statements of governments. Net debt presentation reports the difference between financial assets and liabilities as “net debt” or “net financial assets” as an indicator of the future revenues required to pay for past transactions and events. The ministry operates within the government reporting entity, and does not finance all its expenditures by independently raising revenues. Accordingly, these financial statements do not report a net debt indicator.
NOTE 3 GOVERNMENT REORGANIZATION(in thousands)
The Ministry of Jobs, Skills, Training and Labour was established as a result of restructuring of government ministries announced on December 6, 2013. Comparatives for 2013 have been restated as if the ministry had always been assigned with its current responsibilities. Net liabilities on March 31, 2012 are made up as follows:
Net Assets (Liabilities) as previously reported $ - Net Liabilities transferred from Ministry of Human Services (7,647)Net Liabilities transferred from Ministry of Innovation and Advanced Education (968)
Net Liabilities at March 31, 2012 $ (8,615)
2013-2014 Alberta Jobs, Skills, Training and Labour Annual Report39
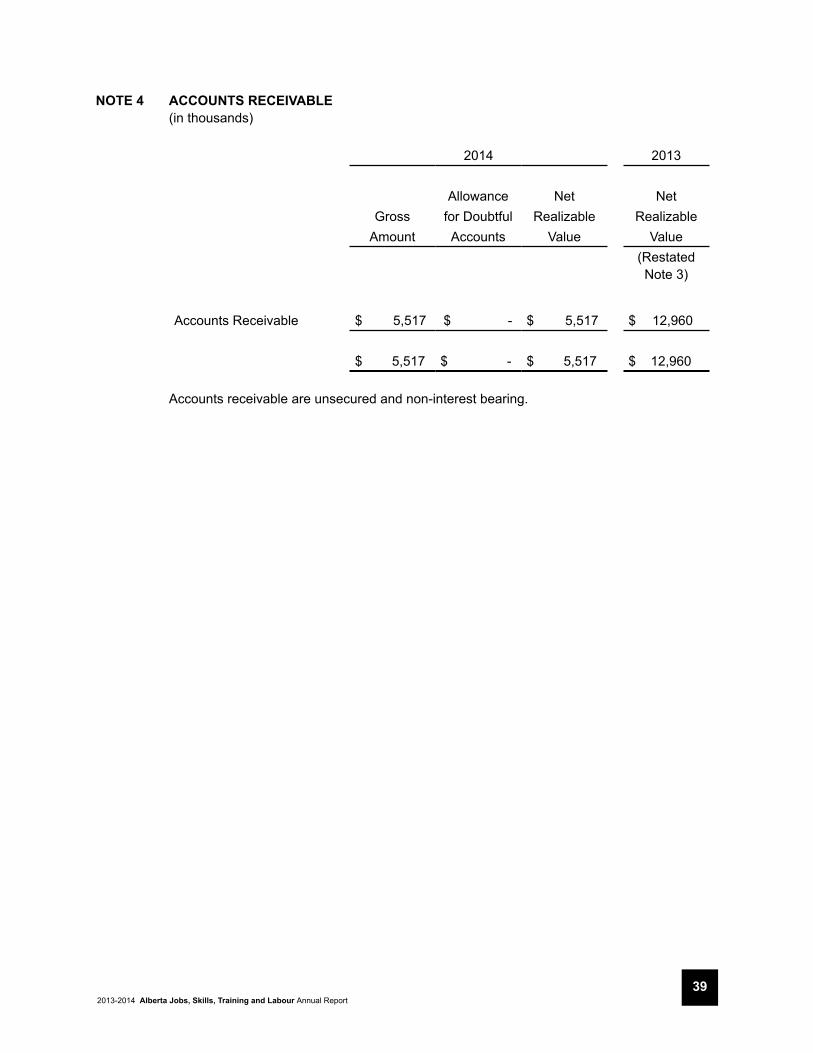
NOTE 4 ACCOUNTS RECEIVABLE(in thousands)
2014 2013
Allowance Net NetGross for Doubtful Realizable Realizable
Amount Accounts Value Value(Restated Note 3)
Accounts Receivable $ 5,517 $ - $ 5,517 $ 12,960
$ 5,517 $ - $ 5,517 $ 12,960
Accounts receivable are unsecured and non-interest bearing.
2013-2014 Alberta Jobs, Skills, Training and Labour Annual Report40
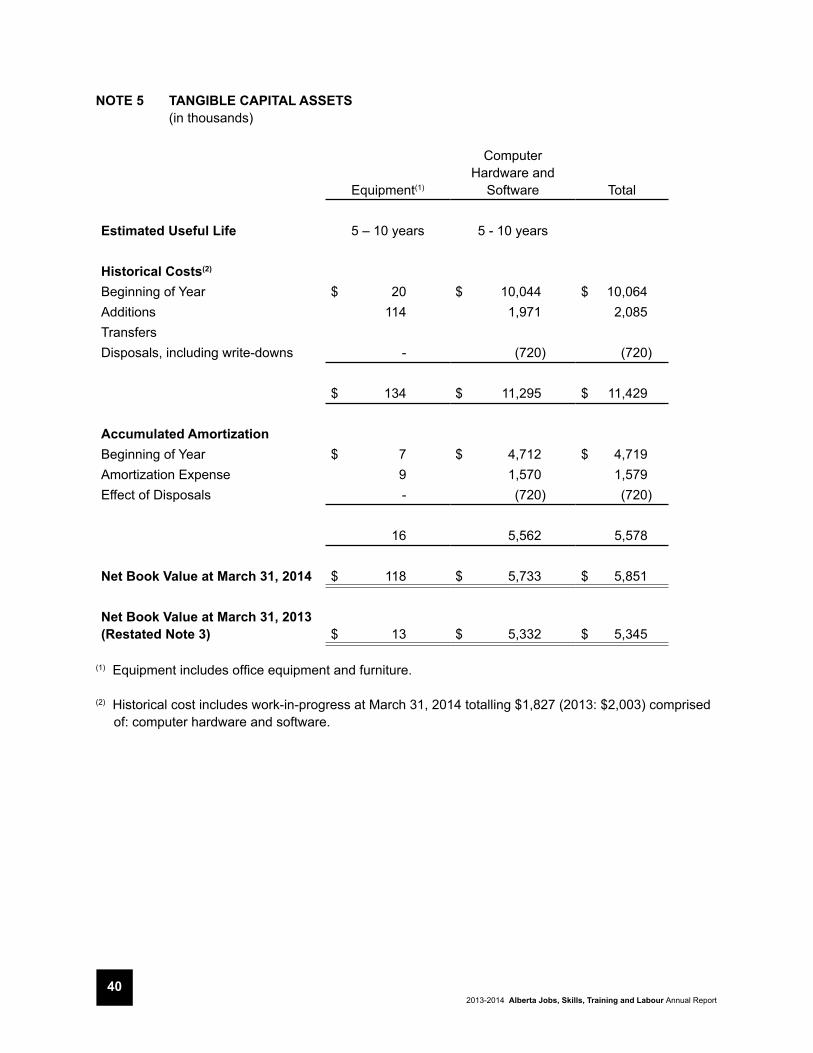
NOTE 5 TANGIBLE CAPITAL ASSETS(in thousands)
Equipment(1)
Computer Hardware and
Software Total
Estimated Useful Life 5 – 10 years 5 - 10 years
Historical Costs(2)
Beginning of Year $ 20 $ 10,044 $ 10,064Additions 114 1,971 2,085Transfers Disposals, including write-downs - (720) (720)
$ 134 $ 11,295 $ 11,429
Accumulated AmortizationBeginning of Year $ 7 $ 4,712 $ 4,719Amortization Expense 9 1,570 1,579Effect of Disposals - (720) (720)
16 5,562 5,578
Net Book Value at March 31, 2014 $ 118 $ 5,733 $ 5,851
Net Book Value at March 31, 2013(Restated Note 3) $ 13 $ 5,332 $ 5,345
(1) Equipment includes office equipment and furniture.
(2) Historical cost includes work-in-progress at March 31, 2014 totalling $1,827 (2013: $2,003) comprised of: computer hardware and software.
2013-2014 Alberta Jobs, Skills, Training and Labour Annual Report41
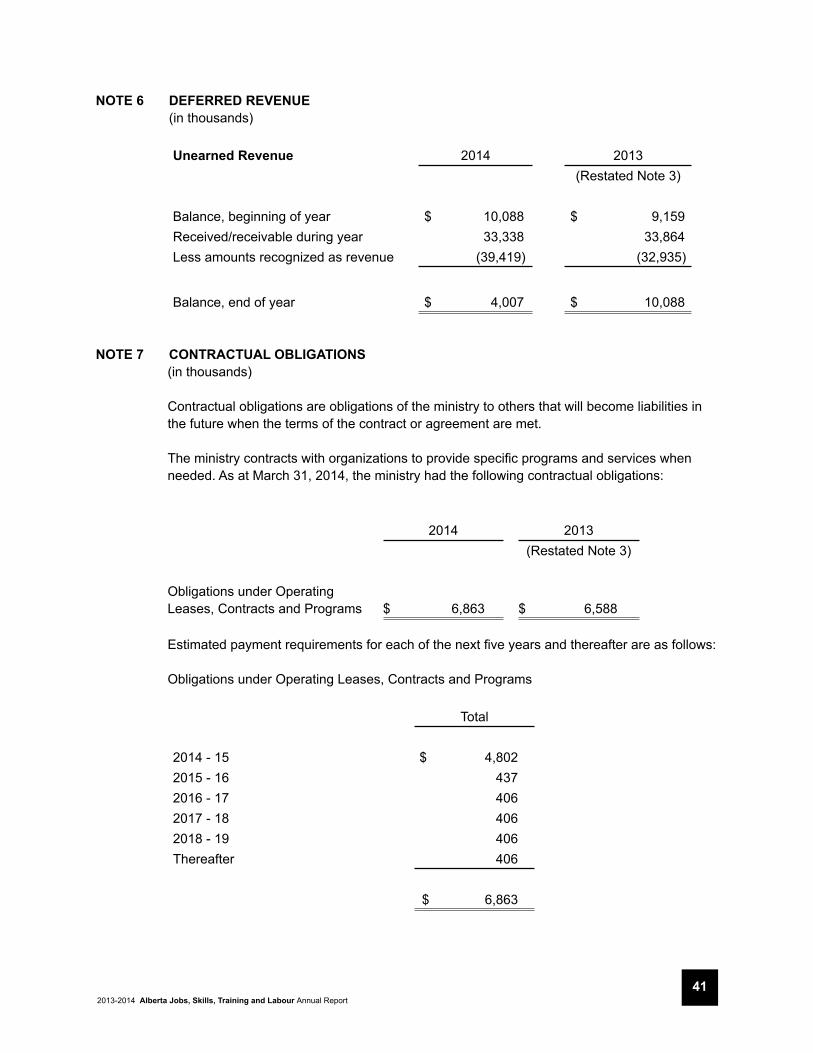
NOTE 6 DEFERRED REVENUE(in thousands)
Unearned Revenue 2014 2013
(Restated Note 3)
Balance, beginning of year $ 10,088 $ 9,159Received/receivable during year 33,338 33,864Less amounts recognized as revenue (39,419) (32,935)
Balance, end of year $ 4,007 $ 10,088
NOTE 7 CONTRACTUAL OBLIGATIONS(in thousands)
Contractual obligations are obligations of the ministry to others that will become liabilities in the future when the terms of the contract or agreement are met.
The ministry contracts with organizations to provide specific programs and services when needed. As at March 31, 2014, the ministry had the following contractual obligations:
2014 2013(Restated Note 3)
Obligations under Operating Leases, Contracts and Programs $ 6,863 $ 6,588
Estimated payment requirements for each of the next five years and thereafter are as follows:
Obligations under Operating Leases, Contracts and Programs
Total
2014 - 15 $ 4,8022015 - 16 4372016 - 17 4062017 - 18 4062018 - 19 406Thereafter 406
$ 6,863
2013-2014 Alberta Jobs, Skills, Training and Labour Annual Report42
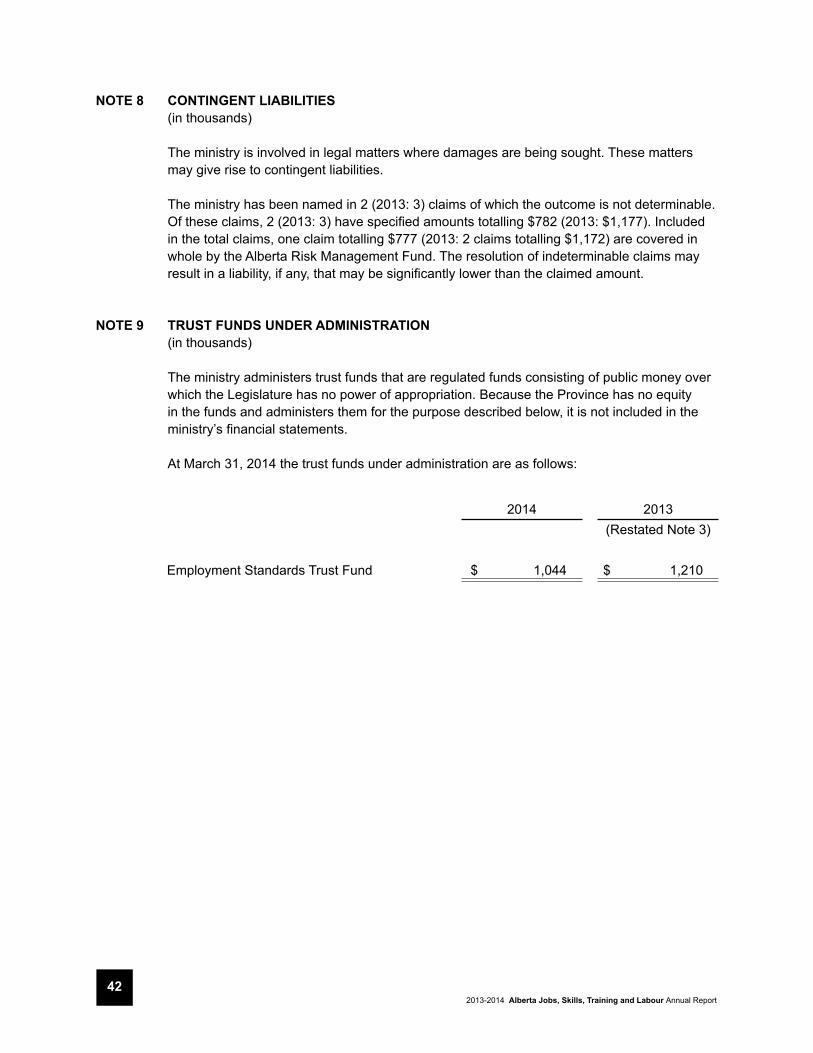
NOTE 8 CONTINGENT LIABILITIES(in thousands)
The ministry is involved in legal matters where damages are being sought. These matters may give rise to contingent liabilities.
The ministry has been named in 2 (2013: 3) claims of which the outcome is not determinable. Of these claims, 2 (2013: 3) have specified amounts totalling $782 (2013: $1,177). Included in the total claims, one claim totalling $777 (2013: 2 claims totalling $1,172) are covered in whole by the Alberta Risk Management Fund. The resolution of indeterminable claims may result in a liability, if any, that may be significantly lower than the claimed amount.
NOTE 9 TRUST FUNDS UNDER ADMINISTRATION(in thousands)
The ministry administers trust funds that are regulated funds consisting of public money over which the Legislature has no power of appropriation. Because the Province has no equity in the funds and administers them for the purpose described below, it is not included in the ministry’s financial statements.
At March 31, 2014 the trust funds under administration are as follows:
2014 2013(Restated Note 3)
Employment Standards Trust Fund $ 1,044 $ 1,210
2013-2014 Alberta Jobs, Skills, Training and Labour Annual Report43
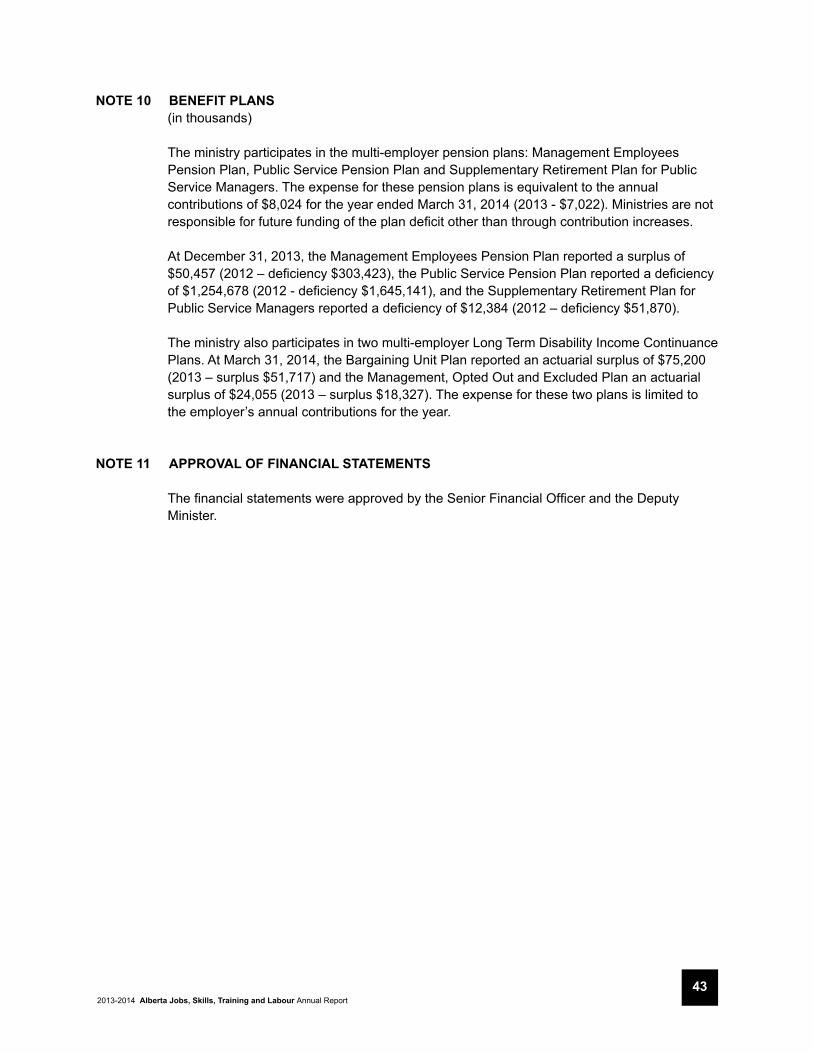
NOTE 10 BENEFIT PLANS(in thousands)
The ministry participates in the multi-employer pension plans: Management Employees Pension Plan, Public Service Pension Plan and Supplementary Retirement Plan for Public Service Managers. The expense for these pension plans is equivalent to the annual contributions of $8,024 for the year ended March 31, 2014 (2013 - $7,022). Ministries are not responsible for future funding of the plan deficit other than through contribution increases.
At December 31, 2013, the Management Employees Pension Plan reported a surplus of $50,457 (2012 – deficiency $303,423), the Public Service Pension Plan reported a deficiency of $1,254,678 (2012 - deficiency $1,645,141), and the Supplementary Retirement Plan for Public Service Managers reported a deficiency of $12,384 (2012 – deficiency $51,870).
The ministry also participates in two multi-employer Long Term Disability Income Continuance Plans. At March 31, 2014, the Bargaining Unit Plan reported an actuarial surplus of $75,200 (2013 – surplus $51,717) and the Management, Opted Out and Excluded Plan an actuarial surplus of $24,055 (2013 – surplus $18,327). The expense for these two plans is limited to the employer’s annual contributions for the year.
NOTE 11 APPROVAL OF FINANCIAL STATEMENTS
The financial statements were approved by the Senior Financial Officer and the Deputy Minister.
2013-2014 Alberta Jobs, Skills, Training and Labour Annual Report44
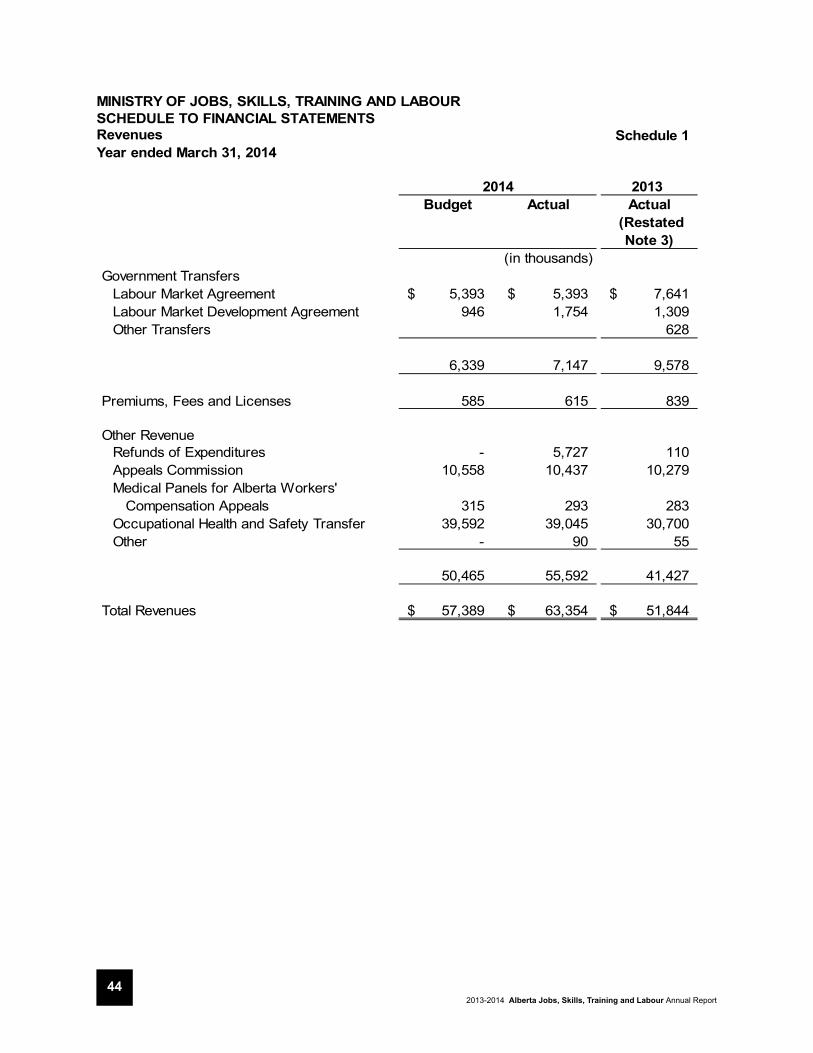
MINISTRY OF JOBS, SKILLS, TRAINING AND LABOURSCHEDULE TO FINANCIAL STATEMENTS
Schedule 1Year ended March 31, 2014
2013 Budget Actual Actual
(Restated Note 3)
Government TransfersLabour Market Agreement 5,393$ 5,393$ 7,641$ Labour Market Development Agreement 946 1,754 1,309 Other Transfers 628
6,339 7,147 9,578
Premiums, Fees and Licenses 585 615 839
Other RevenueRefunds of Expenditures - 5,727 110 Appeals Commission 10,558 10,437 10,279 Medical Panels for Alberta Workers' Compensation Appeals 315 293 283 Occupational Health and Safety Transfer 39,592 39,045 30,700 Other - 90 55
50,465 55,592 41,427
Total Revenues 57,389$ 63,354$ 51,844$
Revenues
2014
(in thousands)
2013-2014 Alberta Jobs, Skills, Training and Labour Annual Report45
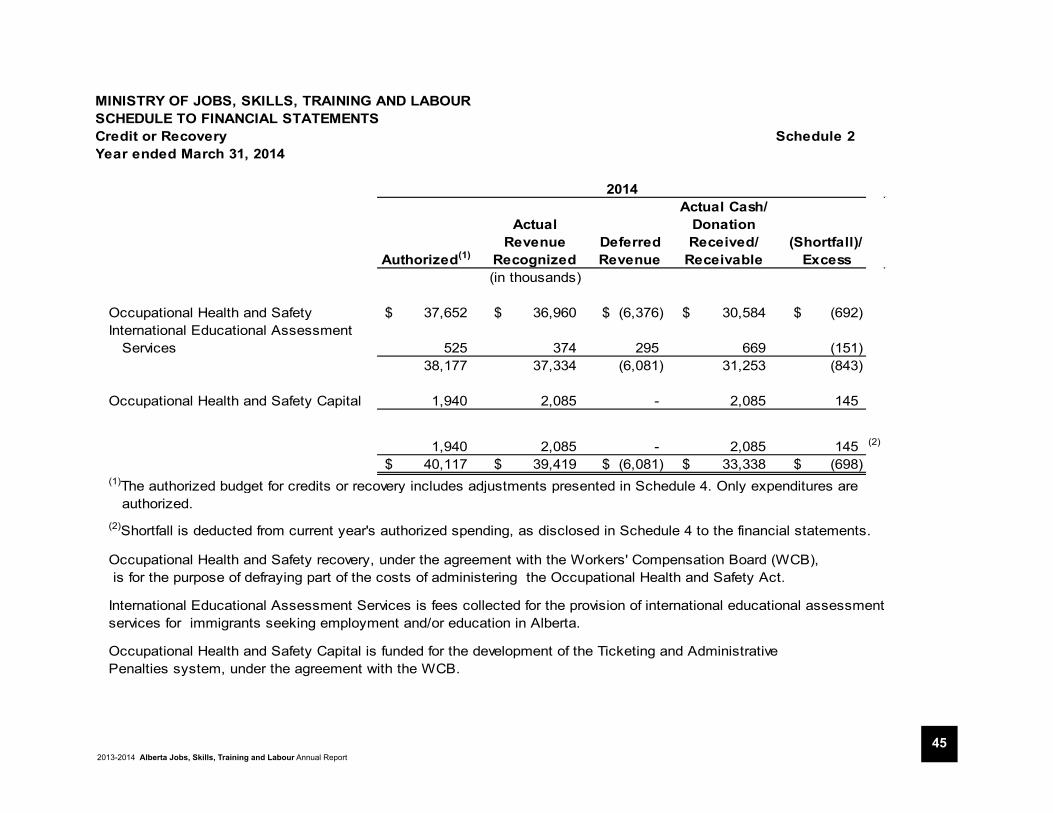
MINISTRY OF JOBS, SKILLS, TRAINING AND LABOURSCHEDULE TO FINANCIAL STATEMENTSCredit or Recovery Schedule 2Year ended March 31, 2014
Authorized(1)
Actual Revenue
RecognizedDeferred Revenue
Actual Cash/ Donation Received/
Receivable(Shortfall)/
Excess(in thousands)
Occupational Health and Safety 37,652$ 36,960$ (6,376)$ 30,584$ (692)$ International Educational Assessment Services 525 374 295 669 (151)
38,177 37,334 (6,081) 31,253 (843)
Occupational Health and Safety Capital 1,940 2,085 - 2,085 145
1,940 2,085 - 2,085 145 (2)
40,117$ 39,419$ (6,081)$ 33,338$ (698)$ (1)The authorized budget for credits or recovery includes adjustments presented in Schedule 4. Only expenditures are authorized.
(2)Shortfall is deducted from current year's authorized spending, as disclosed in Schedule 4 to the financial statements.
Occupational Health and Safety recovery, under the agreement with the Workers' Compensation Board (WCB), is for the purpose of defraying part of the costs of administering the Occupational Health and Safety Act.
International Educational Assessment Services is fees collected for the provision of international educational assessment services for immigrants seeking employment and/or education in Alberta.
Occupational Health and Safety Capital is funded for the development of the Ticketing and Administrative Penalties system, under the agreement with the WCB.
2014
2013-2014 Alberta Jobs, Skills, Training and Labour Annual Report46
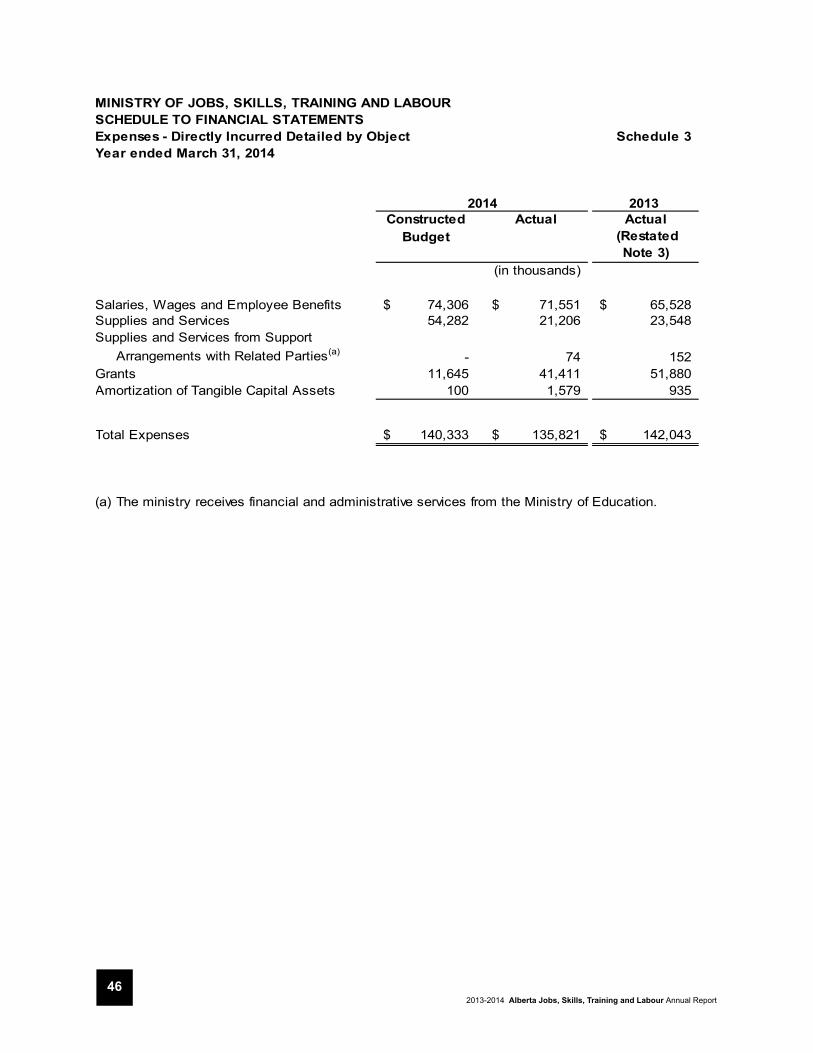
MINISTRY OF JOBS, SKILLS, TRAINING AND LABOURSCHEDULE TO FINANCIAL STATEMENTS
Schedule 3Year ended March 31, 2014
2013Constructed Actual Actual
Budget (Restated Note 3)
Salaries, Wages and Employee Benefits 74,306$ 71,551$ 65,528$ Supplies and Services 54,282 21,206 23,548 Supplies and Services from Support
Arrangements with Related Parties(a) - 74 152 Grants 11,645 41,411 51,880 Amortization of Tangible Capital Assets 100 1,579 935
Total Expenses 140,333$ 135,821$ 142,043$
(a) The ministry receives financial and administrative services from the Ministry of Education.
Expenses - Directly Incurred Detailed by Object
2014
(in thousands)
2013-2014 Alberta Jobs, Skills, Training and Labour Annual Report47
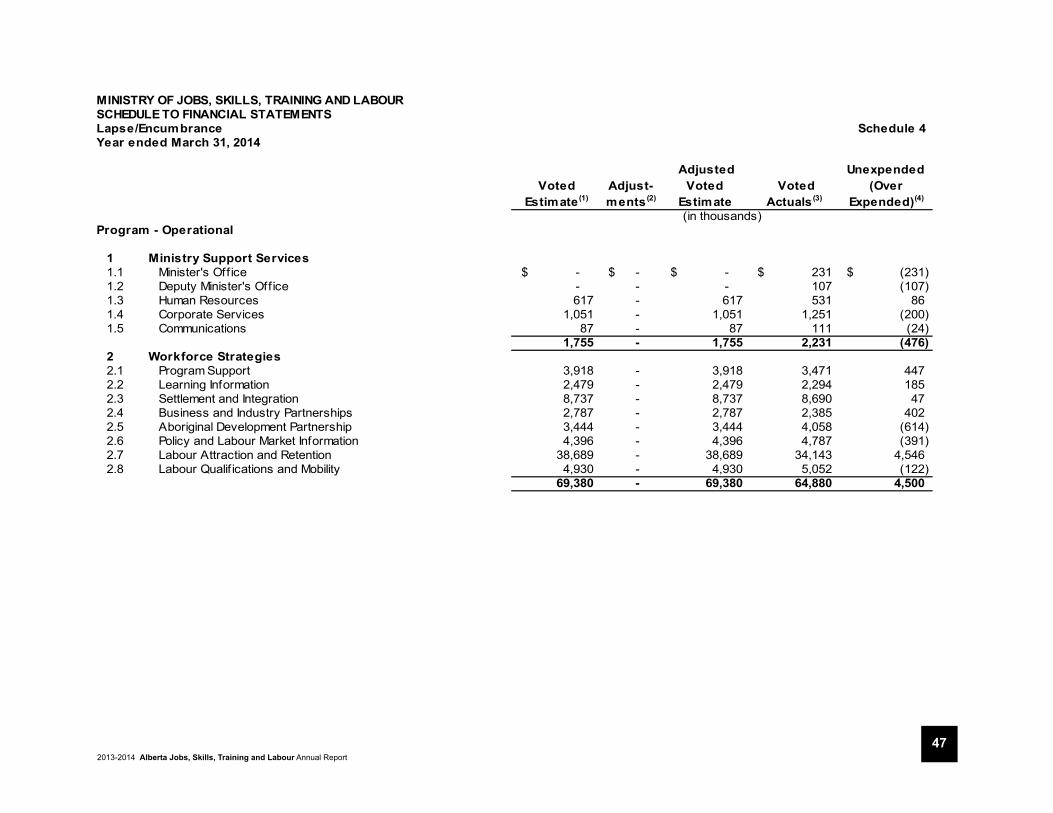
MINISTRY OF JOBS, SKILLS, TRAINING AND LABOURSCHEDULE TO FINANCIAL STATEMENTSLapse/Encumbrance Schedule 4 Year ended March 31, 2014
Voted Estimate(1)
Adjust-ments(2)
Adjusted Voted
Estimate Voted
Actuals(3)
Unexpended (Over
Expended)(4)
Program - Operational
1 Ministry Support Services1.1 Minister's Off ice -$ -$ -$ 231$ (231)$ 1.2 Deputy Minister's Off ice - - - 107 (107) 1.3 Human Resources 617 - 617 531 86 1.4 Corporate Services 1,051 - 1,051 1,251 (200) 1.5 Communications 87 - 87 111 (24)
1,755 - 1,755 2,231 (476) 2 Workforce Strategies2.1 Program Support 3,918 - 3,918 3,471 447 2.2 Learning Information 2,479 - 2,479 2,294 185 2.3 Settlement and Integration 8,737 - 8,737 8,690 47 2.4 Business and Industry Partnerships 2,787 - 2,787 2,385 402 2.5 Aboriginal Development Partnership 3,444 - 3,444 4,058 (614) 2.6 Policy and Labour Market Information 4,396 - 4,396 4,787 (391) 2.7 Labour Attraction and Retention 38,689 - 38,689 34,143 4,546 2.8 Labour Qualif ications and Mobility 4,930 - 4,930 5,052 (122)
69,380 - 69,380 64,880 4,500
(in thousands)
2013-2014 Alberta Jobs, Skills, Training and Labour Annual Report48
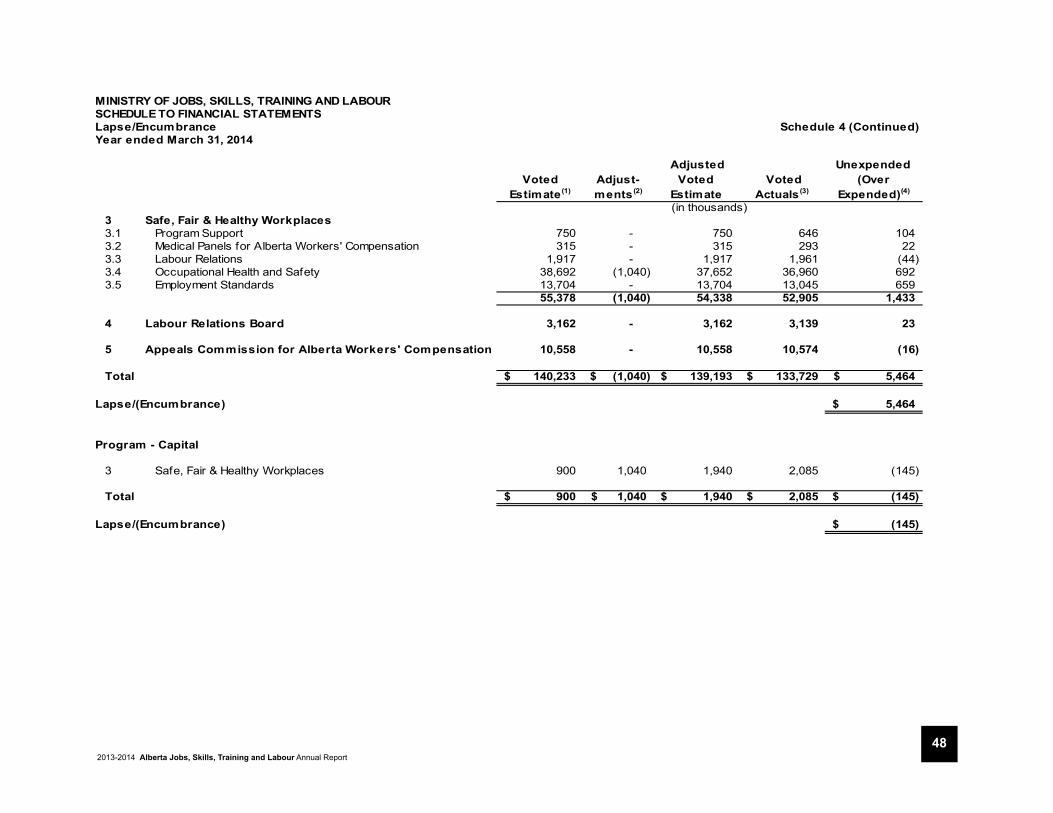
MINISTRY OF JOBS, SKILLS, TRAINING AND LABOURSCHEDULE TO FINANCIAL STATEMENTSLapse/Encumbrance Schedule 4 (Continued)Year ended March 31, 2014
Voted Estimate(1)
Adjust-ments(2)
Adjusted Voted
Estimate Voted
Actuals(3)
Unexpended (Over
Expended)(4)
3 Safe, Fair & Healthy Workplaces3.1 Program Support 750 - 750 646 104 3.2 Medical Panels for Alberta Workers' Compensation 315 - 315 293 22 3.3 Labour Relations 1,917 - 1,917 1,961 (44) 3.4 Occupational Health and Safety 38,692 (1,040) 37,652 36,960 692 3.5 Employment Standards 13,704 - 13,704 13,045 659
55,378 (1,040) 54,338 52,905 1,433
4 Labour Relations Board 3,162 - 3,162 3,139 23
5 Appeals Commission for Alberta Workers' Compensation 10,558 - 10,558 10,574 (16)
Total 140,233$ (1,040)$ 139,193$ 133,729$ 5,464$
Lapse/(Encumbrance) 5,464$
Program - Capital
3 Safe, Fair & Healthy Workplaces 900 1,040 1,940 2,085 (145)
Total 900$ 1,040$ 1,940$ 2,085$ (145)$
Lapse/(Encumbrance) (145)$
(in thousands)

2013-2014 Alberta Jobs, Skills, Training and Labour Annual Report49
MINISTRY OF JOBS, SKILLS, TRAINING AND LABOURSCHEDULE TO FINANCIAL STATEMENTSLapse/Encumbrance Schedule 4 (Continued)Year ended March 31, 2014
(1) The 2013-14 Voted Estimate w as revised as a result of government re-organization (Orders in Council 409/2013, 11/2014, 35/2014).(2) Adjustments include encumbrances, capital carry forw ard amounts and credit or recovery increases approved by Treasury Board and credit or recovery shortfalls. An encumbrance is incurred w hen, on a vote by vote basis, the total of actual disbursements in the prior year exceed the total adjusted estimate. All calculated encumbrances from the prior year are reflected as an adjustment to reduce the corresponding Voted Estimate in the current year.(3) Actuals exclude non-voted amounts such as amortization and valuation adjustments, in the amount of $2,092(4) Unexpended amount includes dedicated revenue lapsed funds of $843 for Occupational Health and Safety and International Educational Assessment Services programs.
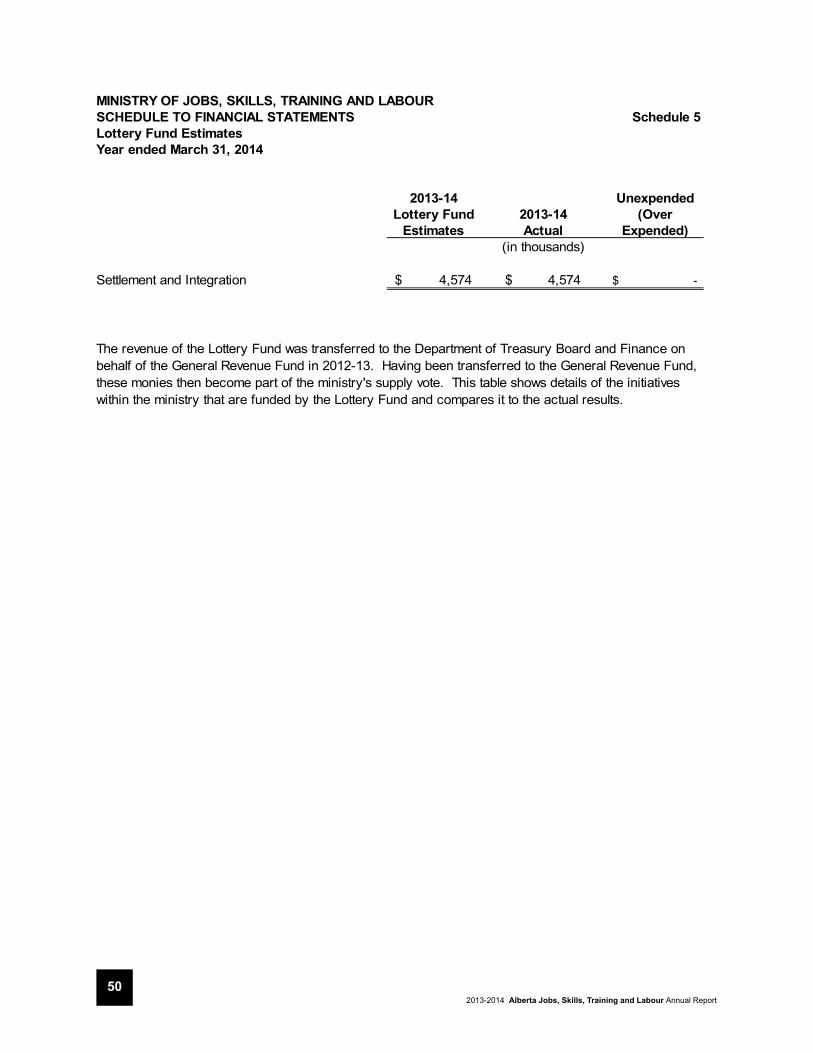
2013-2014 Alberta Jobs, Skills, Training and Labour Annual Report50
MINISTRY OF JOBS, SKILLS, TRAINING AND LABOURSCHEDULE TO FINANCIAL STATEMENTS Schedule 5Lottery Fund EstimatesYear ended March 31, 2014
2013-14 UnexpendedLottery Fund 2013-14 (Over
Estimates Actual Expended)(in thousands)
Settlement and Integration 4,574$ 4,574$ -$
The revenue of the Lottery Fund was transferred to the Department of Treasury Board and Finance on behalf of the General Revenue Fund in 2012-13. Having been transferred to the General Revenue Fund, these monies then become part of the ministry's supply vote. This table shows details of the initiatives within the ministry that are funded by the Lottery Fund and compares it to the actual results.
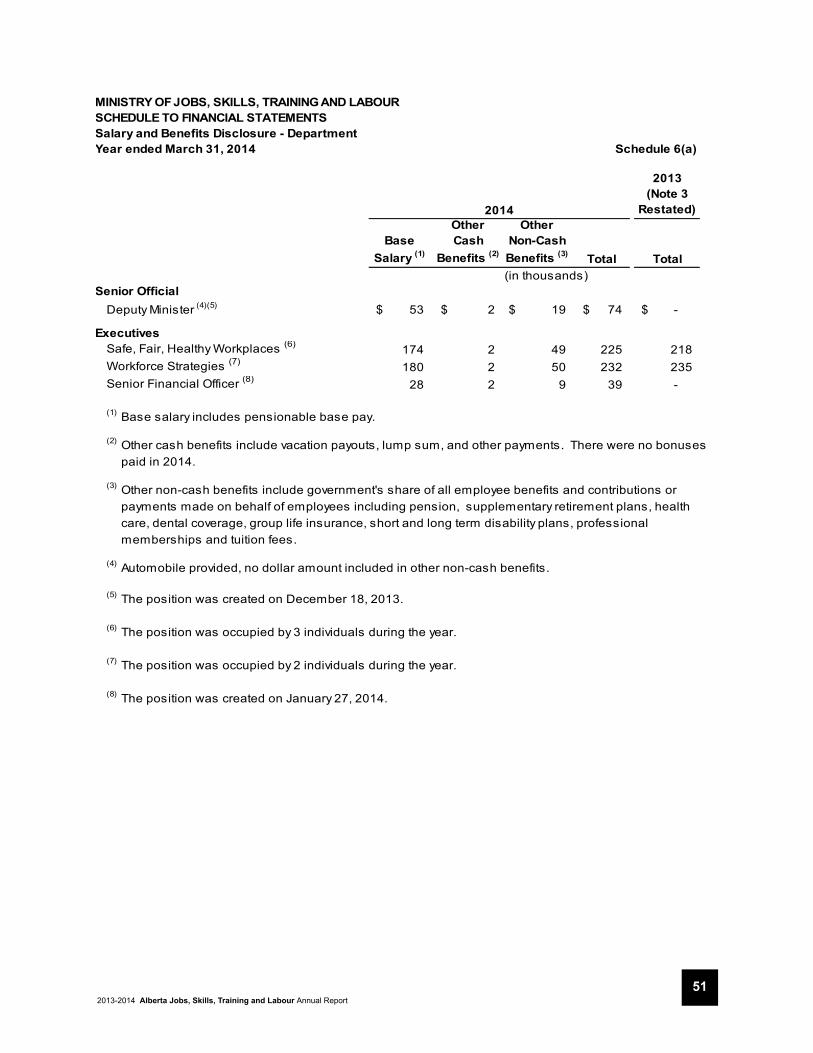
2013-2014 Alberta Jobs, Skills, Training and Labour Annual Report51
MINISTRY OF JOBS, SKILLS, TRAINING AND LABOURSCHEDULE TO FINANCIAL STATEMENTSSalary and Benefits Disclosure - DepartmentYear ended March 31, 2014 Schedule 6(a)
2013 (Note 3
Restated)
Base Salary (1)
Other Cash
Benefits (2)
Other Non-Cash Benefits (3) Total Total(in thousands)
Senior OfficialDeputy Minister (4)(5) 53$ 2$ 19$ 74$ -$
ExecutivesSafe, Fair, Healthy Workplaces (6) 174 2 49 225 218 Workforce Strategies (7) 180 2 50 232 235 Senior Financial Officer (8) 28 2 9 39 -
(1) Base salary includes pensionable base pay.
(2) Other cash benefits include vacation payouts, lump sum, and other payments. There were no bonuses paid in 2014.
(3) Other non-cash benefits include government's share of all employee benefits and contributions or payments made on behalf of employees including pension, supplementary retirement plans, health care, dental coverage, group life insurance, short and long term disability plans, professional memberships and tuition fees.
(4) Automobile provided, no dollar amount included in other non-cash benefits.
(5) The position was created on December 18, 2013.
(6) The position was occupied by 3 individuals during the year.
(7) The position was occupied by 2 individuals during the year.
(8) The position was created on January 27, 2014.
2014

2013-2014 Alberta Jobs, Skills, Training and Labour Annual Report52
MINISTRY OF JOBS, SKILLS, TRAINING AND LABOURSCHEDULE TO FINANCIAL STATEMENTSSalary and Benefits Disclosure - Labour Relations BoardYear ended March 31, 2014 Schedule 6(b)
2013
Base Salary (1)
Other Cash
Benefits (2)
Other Non-Cash Benefits (3) Total Total (in thousands)
Senior OfficialChair (4)(5) 263$ 2$ 11$ 276$ 272$
ExecutivesVice Chair(5) 162 31 4 197 201 Vice Chair 163 2 45 210 206 Vice Chair(7) 51 2 15 68 - Vice Chair(5)(6) 32 1 2 35 114 Executive Director 139 2 38 179 194
(1) Base salary includes pensionable base pay.
(2) Other cash benefits include vacation payouts and lump sum payments. There were no bonuses paid in 2014.
(3) Other non-cash benefits include government's share of all employee benefits and contributions or payments made on behalf of employees including pension, supplementary retirement plans, health care, dental coverage, group life insurance, short and long term disability plans, professional memberships and tuition fees.
(4) Automobile provided, no dollar amount included in other non-cash benefits.
(5) Salary includes pay in lieu of benefits
(6) This position was occupied part time and the term ended on July 31, 2013
(7) This position was created on December 9, 2013
2014
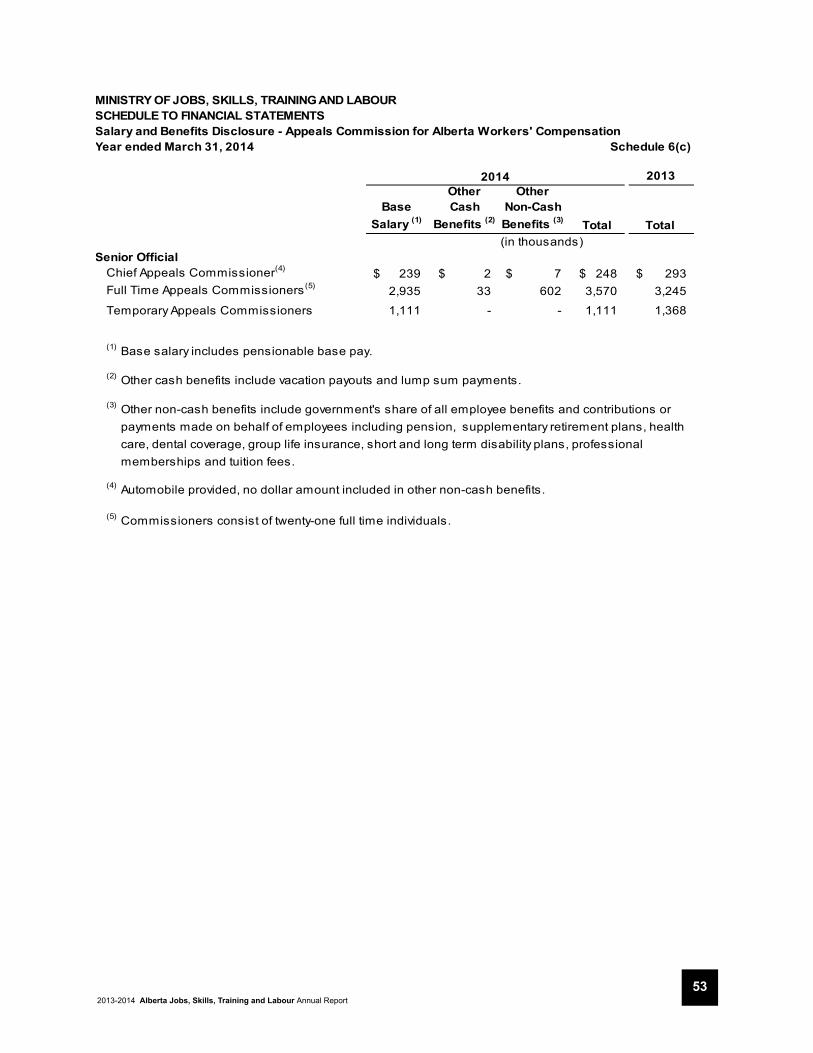
2013-2014 Alberta Jobs, Skills, Training and Labour Annual Report53
MINISTRY OF JOBS, SKILLS, TRAINING AND LABOURSCHEDULE TO FINANCIAL STATEMENTSSalary and Benefits Disclosure - Appeals Commission for Alberta Workers' Compensation Year ended March 31, 2014 Schedule 6(c)
2013
Base Salary (1)
Other Cash
Benefits (2)
Other Non-Cash Benefits (3) Total Total (in thousands)
Senior OfficialChief Appeals Commissioner(4) 239$ 2$ 7$ 248$ 293$ Full Time Appeals Commissioners(5) 2,935 33 602 3,570 3,245
Temporary Appeals Commissioners 1,111 - - 1,111 1,368
(1) Base salary includes pensionable base pay.
(2) Other cash benefits include vacation payouts and lump sum payments.
(3) Other non-cash benefits include government's share of all employee benefits and contributions or payments made on behalf of employees including pension, supplementary retirement plans, health care, dental coverage, group life insurance, short and long term disability plans, professional memberships and tuition fees.
(4) Automobile provided, no dollar amount included in other non-cash benefits.
(5) Commissioners consist of twenty-one full time individuals.
2014
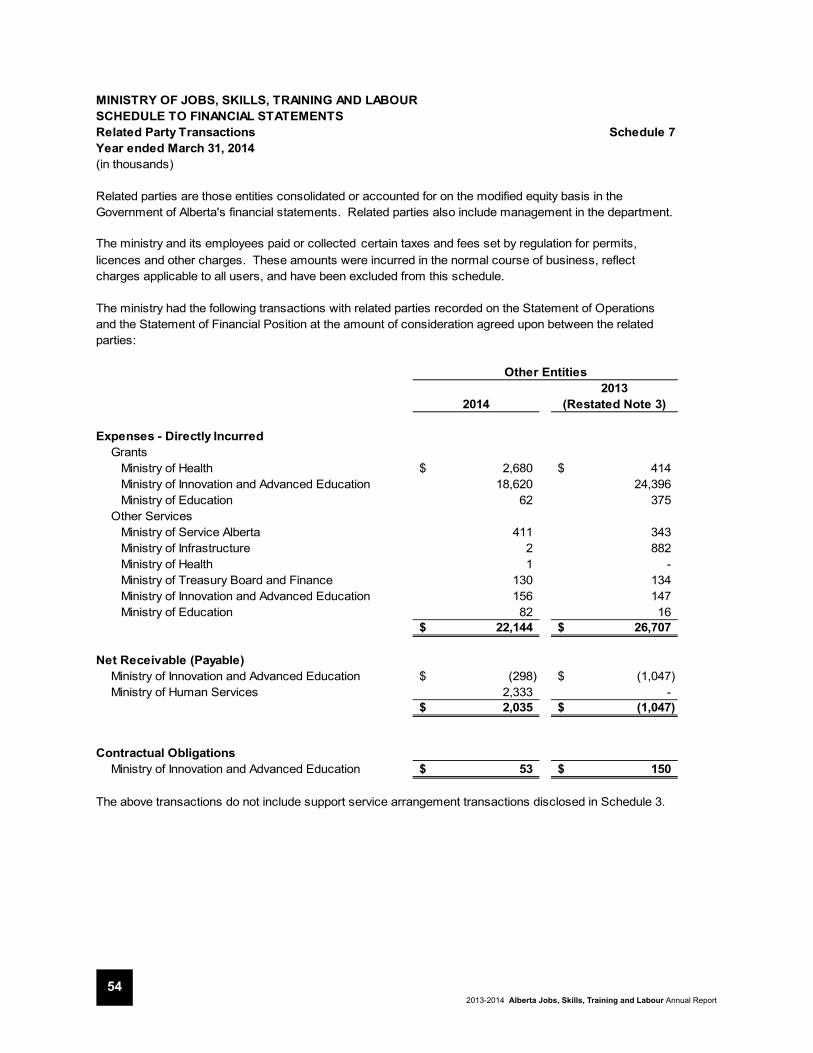
2013-2014 Alberta Jobs, Skills, Training and Labour Annual Report54
MINISTRY OF JOBS, SKILLS, TRAINING AND LABOURSCHEDULE TO FINANCIAL STATEMENTSRelated Party Transactions Schedule 7Year ended March 31, 2014(in thousands)
Related parties are those entities consolidated or accounted for on the modified equity basis in the Government of Alberta's financial statements. Related parties also include management in the department.
The ministry and its employees paid or collected certain taxes and fees set by regulation for permits, licences and other charges. These amounts were incurred in the normal course of business, reflect charges applicable to all users, and have been excluded from this schedule.
The ministry had the following transactions with related parties recorded on the Statement of Operations and the Statement of Financial Position at the amount of consideration agreed upon between the related parties:
20142013
(Restated Note 3)
Expenses - Directly IncurredGrants Ministry of Health 2,680$ 414$ Ministry of Innovation and Advanced Education 18,620 24,396 Ministry of Education 62 375 Other Services Ministry of Service Alberta 411 343 Ministry of Infrastructure 2 882 Ministry of Health 1 - Ministry of Treasury Board and Finance 130 134 Ministry of Innovation and Advanced Education 156 147 Ministry of Education 82 16
22,144$ 26,707$
Net Receivable (Payable)Ministry of Innovation and Advanced Education (298)$ (1,047)$ Ministry of Human Services 2,333 -
2,035$ (1,047)$
Contractual ObligationsMinistry of Innovation and Advanced Education 53$ 150$
The above transactions do not include support service arrangement transactions disclosed in Schedule 3.
Other Entities

2013-2014 Alberta Jobs, Skills, Training and Labour Annual Report55
MINISTRY OF JOBS, SKILLS, TRAINING AND LABOURSCHEDULE TO FINANCIAL STATEMENTSRelated Party Transactions Schedule 7 (Continued)Year ended March 31, 2014(in thousands)
The ministry also had the following transactions with related parties for which no consideration was exchanged. The amounts for these related party transactions are estimated based on the costs incurred by the service provider to provide the service. These amounts are not recorded in the financial statements but are disclosed in Schedule 8
20142013
(Restated Note 3)Expenses - Incurred by Others
Accommodation 1,333$ 6,859$ Legal Services 895 512 Other Services 671 1,069
2,899$ 8,440$
Other Entities

2013-2014 Alberta Jobs, Skills, Training and Labour Annual Report56
MINISTRY OF JOBS, SKILLS, TRAINING AND LABOURSCHEDULE TOFINANCIAL STATEMENTSAllocated Costs Schedule 8Year ended March 31, 2014(in thousands)
2013 ( Restated
Note 3)
Program Expenses(1)Accommodation
Costs(2)Legal
Services(3)Other
Services(4)Total
Expenses Total Expenses
Ministry Support Services 2,744$ 31$ 252$ 16$ 3,043$ 1,552$ Workforce Strategies 65,891 423 - 213 66,527 82,946 Safe, Fair & Healthy Workplaces 53,098 709 643 356 54,806 51,855 Labour Relations Board 3,139 46 - 23 3,208 3,498 Appeals Commission for Alberta Workers' - Compensation 10,949 124 - 63 11,136 10,632
135,821$ 1,333$ 895$ 671$ 138,720$ 150,483$
(1) Expenses - Directly Incurred as per the Statement of Operations.(2) Accommodation costs (includes grants in lieu of taxes), which were paid by the Ministry of Infrastructure represent the Ministry's building costs allocated by the number of employees per program.(3) Costs for Legal Services, which were paid by the Ministry of Justice and Solicitor General, are based on specific amounts for each program.(4) Other Services represents services provided by Ministry of Treasury Board and Finance, Service Alberta, Executive Council for which no consideration was exchanged. Costs were allocated by the number of ministry employees per program.
2014Expenses - Incurred by Others
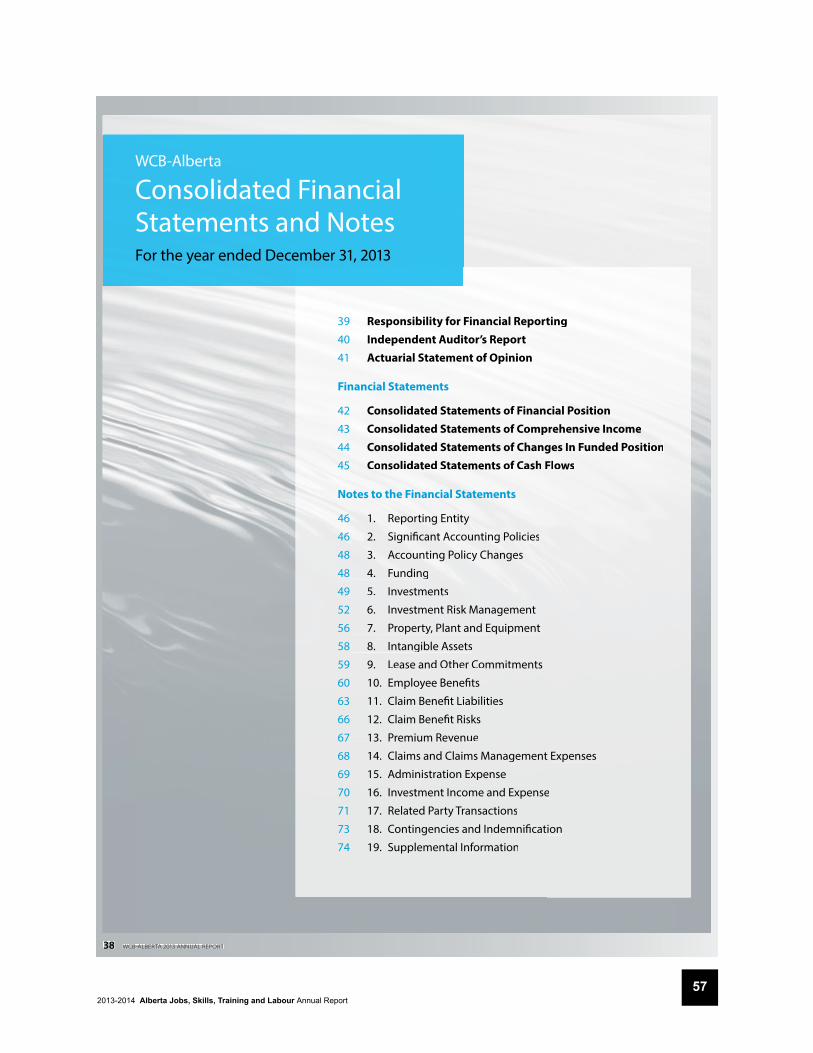
2013-2014 Alberta Jobs, Skills, Training and Labour Annual Report57
38 WCBALBERTA 2013 ANNUAL REPORT
WCB-Alberta
Consolidated Financial Statements and NotesFor the year ended December 31, 2013
39 Responsibility for Financial Reporting40 Independent Auditor’s Report41 Actuarial Statement of Opinion
Financial Statements
42 Consolidated Statements of Financial Position43 Consolidated Statements of Comprehensive Income44 Consolidated Statements of Changes In Funded Position45 Consolidated Statements of Cash Flows
Notes to the Financial Statements
46 1. Reporting Entity
46 2. Signifi cant Accounting Policies
48 3. Accounting Policy Changes
48 4. Funding
49 5. Investments
52 6. Investment Risk Management
56 7. Property, Plant and Equipment
58 8. Intangible Assets
59 9. Lease and Other Commitments
60 10. Employee Benefi ts
63 11. Claim Benefi t Liabilities
66 12. Claim Benefi t Risks
67 13. Premium Revenue
68 14. Claims and Claims Management Expenses
69 15. Administration Expense
70 16. Investment Income and Expense
71 17. Related Party Transactions
73 18. Contingencies and Indemnifi cation
74 19. Supplemental Information

2013-2014 Alberta Jobs, Skills, Training and Labour Annual Report58
2013 CONSOLIDATED FINANCIAL STATEMENTS AND NOTES 39
Responsibility for Financial Reporting
TThe consolidated fi nancial statements of the Workers' Compensation Board - Alberta were prepared by management, which is responsible for the integrity and fairness of the data presented, including signifi cantaccounting judgements and estimates. This responsibility includes selecting appropriate accounting principlesconsistent with International Financial Reporting Standards.
In discharging its responsibility for the integrity and fairness of the consolidated fi nancial statements, management maintains the necessary internal controls designed to provide reasonable assurance that relevant and reliable fi nancial information is produced and that assets are properly safeguarded. The eff ectiveness of controls over fi nancial reporting was assessed and found to provide reasonable assurance that internal controls atDecember 31, 2013 operated eff ectively with no material weaknesses in the design or operation of the controls.
TThe Board of Directors is responsible for overseeing management in the performance of fi nancial reporting responsibilities and has approved the consolidated fi nancial statements included in the annual report.
TThe Board of Directors is assisted in its responsibilities by its Audit Committee. This committee reviews andrecommends approval of the consolidated fi nancial statements and meets periodically with management, internal and external auditors, and actuaries concerning internal controls and all other matters relating to fi nancial reporting.
Eckler Ltd. has been appointed as the independent consulting actuary to the WCB. Their role is to complete an independent actuarial valuation of the claim benefi t liabilities included in the consolidated fi nancial statements of the WCB and to report thereon in accordance with generally accepted actuarial practice.
TThe Offi ce of the Auditor General, the independent auditor of the WCB, has performed an independent audit of the consolidated fi nancial statements of the WCB in accordance with Canadian generally accepted auditing standards. The Independent Auditor’s Report outlines the scope of this independent audit and the opinion expressed.
Bob NormandChair, Board of DirectorsWorkers’ Compensation Board – Alberta
Guy R. KerrPresident & Chief Executive Offi cerWorkers’ Compensation Board – Alberta
Ron J. HelmholdChief Financial Offi cerWorkers’ Compensation Board – Alberta
[Original signed by] [Original signed by] [Original signed by]
2013-2014 Alberta Jobs, Skills, Training and Labour Annual Report59
40 WCBALBERTA 2013 ANNUAL REPORT
Independent Auditor’s Report
TTo the Board of Directors of the Workers' Compensation Board – Alberta
Report on the Consolidated Financial StatementsI have audited the accompanying consolidated fi nancial statements of the Workers’ Compensation Board–Alberta, which comprise the consolidated statement of fi nancial position as at December 31, 2013, and the consolidated statements of comprehensive income, changes in funded position and cash fl ows for the year then ended, and a summary of signifi cant accounting policies and other explanatory information.
Management’s Responsibility for the Consolidated Financial StatementsManagement is responsible for the preparation and fair presentation of these consolidated fi nancial statements in accordance with International Financial Reporting Standards, and for such internal control as managementdetermines is necessary to enable the preparation of consolidated fi nancial statements that are free from material misstatement, whether due to fraud or error.
Auditor’s ResponsibilityMy responsibility is to express an opinion on these consolidated fi nancial statements based on my audit. I conducted my audit in accordance with Canadian generally accepted auditing standards. Those standards require that I comply with ethical requirements and plan and perform the audit to obtain reasonable assurance about whether the consolidated fi nancial statements are free from material misstatement.
An audit involves performing procedures to obtain audit evidence about the amounts and disclosures in theconsolidated fi nancial statements. The procedures selected depend on the auditor’s judgment, including the assessment of the risks of material misstatement of the consolidated fi nancial statements, whether due to fraud or error. In making those risk assessments, the auditor considers internal control relevant to the entity’s preparation and fair presentation of the consolidated fi nancial statements in order to design audit procedures that are appropriate in the circumstances, but not for the purpose of expressing an opinion on the eff ectiveness of the entity’s internal control. An audit also includes evaluating the appropriateness of accounting policies used and the reasonableness of accounting estimates made by management, as well as evaluating the overall presentation of the consolidated fi nancial statements.
I believe that the audit evidence I have obtained is suffi cient and appropriate to provide a basis for my audit opinion.
OpinionIn my opinion, the consolidated fi nancial statements present fairly, in all material respects, the fi nancial position of the Workers’ Compensation Board–Alberta as at December 31, 2013, and its fi nancial performance and its cash fl ows for the year then ended in accordance with International Financial Reporting Standards.
Auditor GeneralApril 29, 2014Edmonton, Alberta
[Original signed by Merwan N. Saher, FCA]
2013-2014 Alberta Jobs, Skills, Training and Labour Annual Report60
2013 CONSOLIDATED FINANCIAL STATEMENTS AND NOTES 41
Actuarial Statement of Opinion on the Valuation of the Benefi ts Liabilities of the Workers’ Compensation Board – Alberta as at December 31, 2013
I have completed the actuarial valuation of the benefi t liabilities of the Workers’ Compensation Board – Alberta (WCB) for the consolidated fi nancial statements of the WCB as at December 31, 2013 (the “valuation date”).
In my opinion, the actuarial liabilities of $6,320.7 million make reasonable provision for future payments for short term disability, vocational rehabilitation, long term disability, survivor and health care benefi ts with respect to claims which occurred on or before the valuation date, and for all occupational disease claims expected to arise after the valuation date as a result of exposures incurred in the workplace on or before the valuation date inrespect of occupational diseases with a long latency period that are recognized by the WCB. This amount providesfor future claim administration costs, but does not include a provision for benefi ts and payments that are on a self-insured basis.
TThe valuation was based on the provisions of the Workers’ Compensation Act of Alberta and on the WCB’s policies tand administrative practices in eff ect at the time of the valuation.
TThe data on which the valuation is based were provided by the WCB; I applied such checks of reasonableness of the data as I considered appropriate, and have concluded that the data are suffi ciently reliable to permit a realistic valuation of the liabilities and that the data are consistent with WCB’s consolidated fi nancial statements. In my opinion, the data on which the valuation is based are suffi cient and reliable for the purpose of the valuation.
TThe economic assumptions adopted for purposes of computing the liabilities are consistent with the WCB’sfunding and investment policies. For this valuation, an annual real rate of return of 2.00% for 2014 to 2016 and 3%thereafter was used to discount expected payments subject to infl ation. Other economic assumptions underlyingthe calculations include annual changes in the Consumer Price Index (CPI) of 2.50%, increase for benefi ts subject to cost of living adjustments at CPI minus 0.50%, as well as health care costs and vocational rehabilitation benefi ts assumed to grow at annual rates of 5.00% and 3.50% respectively. In my opinion, the assumptions are appropriate for the purpose of the valuation.
TThe methods and assumptions employed in the valuation were consistent with those used in the previous valuation, after taking account of changes in claim patterns. Projections of future claim payments and awards have been made using factors developed from the WCB’s claims experience, mortality and other assumptions. Inmy opinion, the methods employed in the valuation are appropriate for the purpose of the valuation.
Changes to the actuarial basis (i.e. actuarial methods and assumptions) caused liabilities to decrease by $81.1 million. Changes to assumptions for valuing economic loss payments represented a decrease of $18.7 million, cost factor curve changes for third party recoveries represented a decrease of $14.5 million and calculation refi nements decreased liabilities by $47.9 million. Details of the data, actuarial assumptions, valuation methods and analysis of results are set out in my actuarial report as at the valuation date, of which this statement of opinion forms part.
In my opinion, the amount of the benefi t liabilities makes appropriate provision for all personal injury compensation obligations and the consolidated fi nancial statements fairly represent the results of the valuation.TThis report has been prepared, and my opinions given, in accordance with accepted actuarial practice in Canada.
Richard Larouche, FSA, FCIA
ActuaryEckler Ltd.April 28, 2014
[Original signed by]
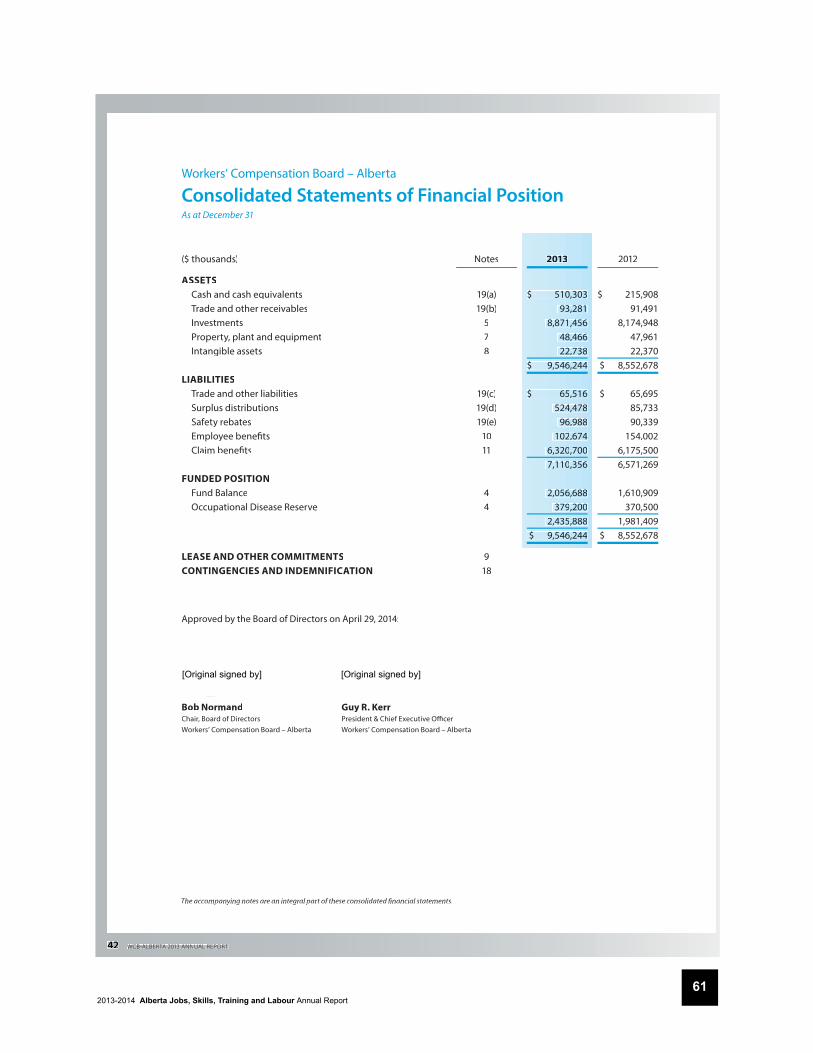
2013-2014 Alberta Jobs, Skills, Training and Labour Annual Report61
42 WCBALBERTA 2013 ANNUAL REPORT
Workers’ Compensation Board – Alberta
Consolidated Statements of Financial PositionAs at December 31
($ thousands)
ASSETS Cash and cash equivalents Trade and other receivables Investments Property, plant and equipment Intangible assets
LIABILITIES Trade and other liabilities Surplus distributions Safety rebates Employee benefi ts Claim benefi ts
FUNDED POSITION Fund Balance Occupational Disease Reserve
Notes
19(a)19(b)
578
19(c)19(d)19(e)
1011
44
20133
$ 5100,303 933,281
8,8711,456 488,466 222,738
$ 9,5466,244
$ 655,516 5244,478
966,988 1022,674
6,3200,700 7,1100,356
2,0566,688 3799,200
2,4355,888 $ 9,5466,244
2012
$ 215,908 91,491
8,174,948 47,961 22,370
$ 8,552,678
$ 65,695 85,733 90,339
154,002 6,175,500 6,571,269
1,610,909 370,500
1,981,409 $ 8,552,678
LEASE AND OTHER COMMITMENTSCONTINGENCIES AND INDEMNIFICATION
918
Approved by the Board of Directors on April 29, 2014:
Bob NormandChair, Board of DirectorsWorkers’ Compensation Board – Alberta
Guy R. KerrPresident & Chief Executive Offi cerWorkers’ Compensation Board – Alberta
The accompanying notes are an integral part of these consolidated fi nancial statements.The accompanying notes are an integral part of these consolidated fi nancial statements.
[Original signed by] [Original signed by]
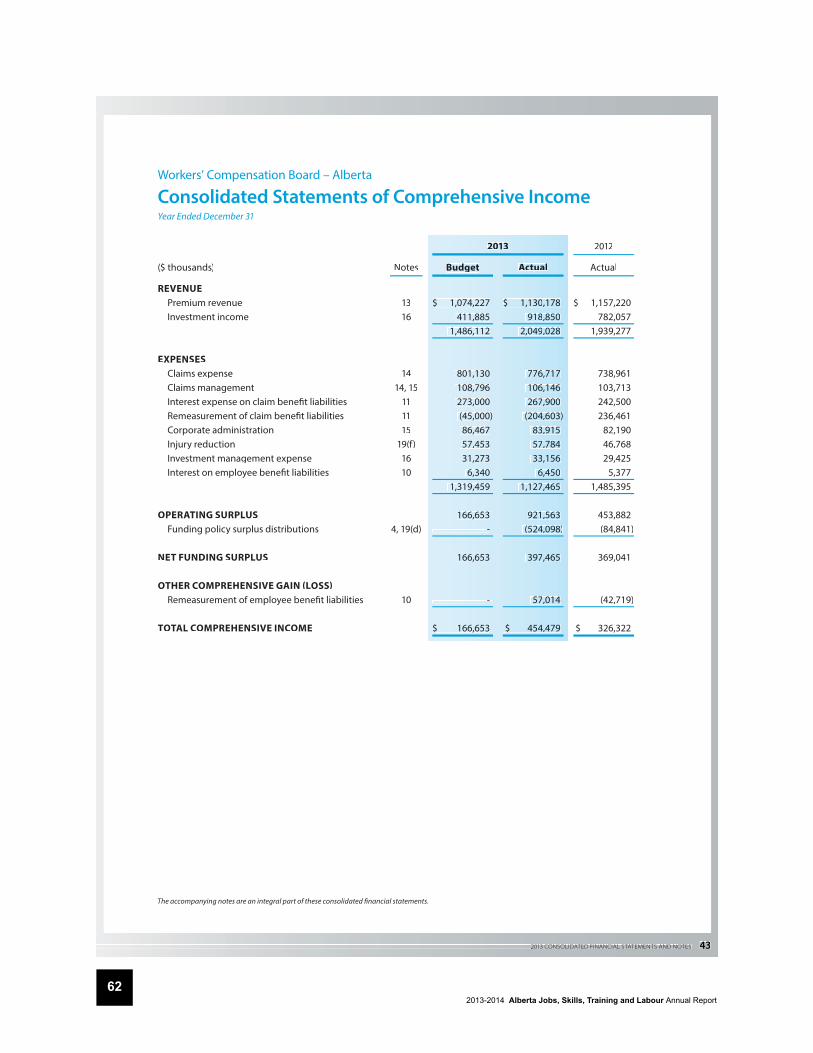
2013-2014 Alberta Jobs, Skills, Training and Labour Annual Report62
2013 CONSOLIDATED FINANCIAL STATEMENTS AND NOTES 43
Workers’ Compensation Board – Alberta
Consolidated Statements of Comprehensive IncomeYear Ended December 31
20013 2012
($ thousands) Notes Budget Actuaal Actual
REVENUE Premium revenue Investment income
EXPENSES Claims expense Claims management Interest expense on claim benefi t liabilities Remeasurement of claim benefi t liabilitiesCorporate administration Injury reductionInvestment management expenseInterest on employee benefi t liabilities
OPERATING SURPLUS Funding policy surplus distributions
NET FUNDING SURPLUS
OTHER COMPREHENSIVE GAIN (LOSS) Remeasurement of employee benefi t liabilities
TOTAL COMPREHENSIVE INCOME
1316
1414, 15
111115
19(f)1610
4, 19(d)
10
$ 1,074,227 411,885
1,486,112
801,130 108,796 273,000 (45,000) 86,467 57,453 31,273
6,340 1,319,459
166,653 -
166,653
-
$ 166,653
$ 1,130,178 918,850
2,049,028
7766,717 1066,146 267,900
(2044,603) 83,915 57,784 33,156
66,450 1,127,465
921,563
(5244,098)
397,465
57,014
$ 4544,479
$ 1,157,220 782,057
1,939,277
738,961 103,713 242,500 236,461
82,190 46,768 29,425
5,377 1,485,395
453,882(84,841)
369,041
(42,719)
$ 326,322
The accompanying notes are an integral part of these consolidated fi nancial statements.
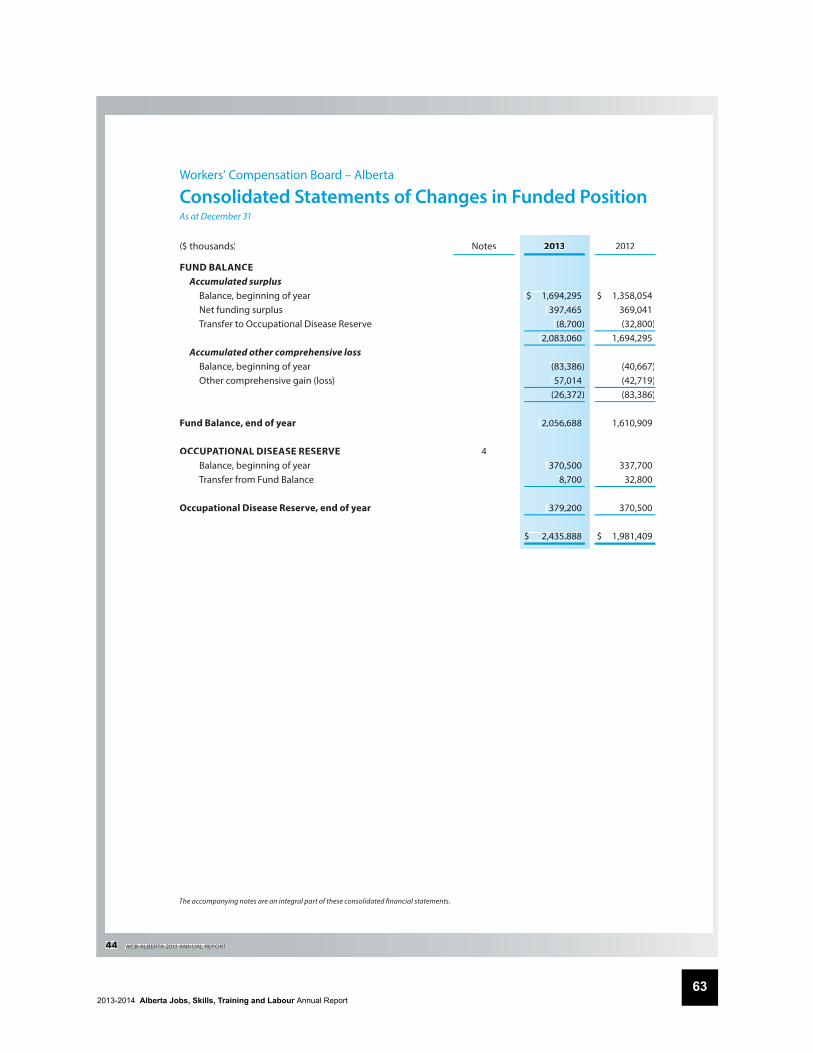
2013-2014 Alberta Jobs, Skills, Training and Labour Annual Report63
44 WCBALBERTA 2013 ANNUAL REPORT
Workers’ Compensation Board – Alberta
Consolidated Statements of Changes in Funded PositionAs at December 31
($ thousands) Notes 20133 2012
FUND BALANCE Accumulated surplus Balance, beginning of year Net funding surplus Transfer to Occupational Disease Reserve Accumulated other comprehensive loss Balance, beginning of year Other comprehensive gain (loss) Fund Balance, end of year OCCUPATIONAL DISEASE RESERVE Balance, beginning of year Transfer from Fund Balance Occupational Disease Reserve, end of year
4
$ 1,694,,295 397,,465
(8,,700) 2,083,,060
(83,,386) 57,,014
(26,,372)
2,056,,688
370,,500 8,,700
379,,200
$ 2,435,,888
$ 1,358,054 369,041 (32,800)
1,694,295
(40,667) (42,719) (83,386)
1,610,909
337,700 32,800
370,500
$ 1,981,409
The accompanying notes are an integral part of these consolidated fi nancial statements.
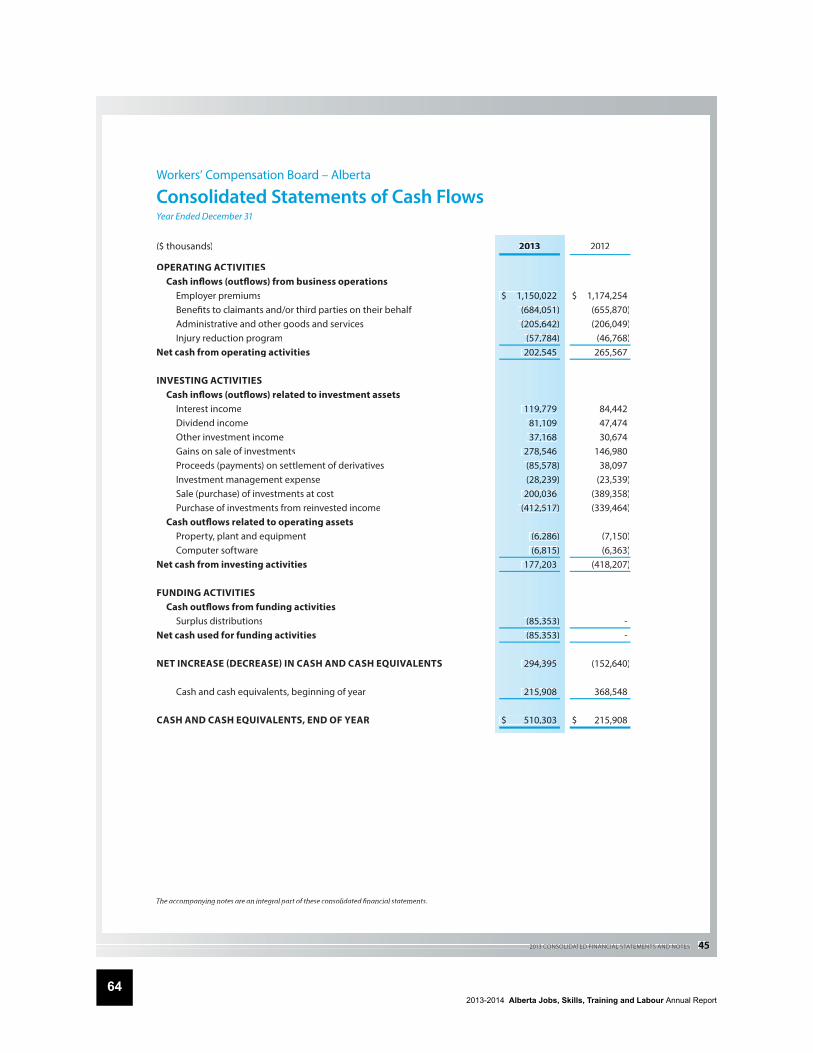
2013-2014 Alberta Jobs, Skills, Training and Labour Annual Report64
2013 CONSOLIDATED FINANCIAL STATEMENTS AND NOTES 45
Workers’ Compensation Board – Alberta
Consolidated Statements of Cash FlowsYear Ended December 31
($ thousands) 20133 2012
OPERATING ACTIVITIES Cash infl ows (outfl ows) from business operations Employer premiums Benefi ts to claimants and/or third parties on their behalf Administrative and other goods and services Injury reduction programNet cash from operating activities
INVESTING ACTIVITIES Cash infl ows (outfl ows) related to investment assets Interest income Dividend income Other investment income Gains on sale of investments Proceeds (payments) on settlement of derivatives Investment management expense Sale (purchase) of investments at cost Purchase of investments from reinvested income Cash outfl ows related to operating assets Property, plant and equipment Computer softwareNet cash from investing activities
FUNDING ACTIVITIES Cash outfl ows from funding activities Surplus distributionsNet cash used for funding activities
NET INCREASE (DECREASE) IN CASH AND CASH EQUIVALENTS
Cash and cash equivalents, beginning of year
CASH AND CASH EQUIVALENTS, END OF YEAR
$ 1,150,,022 (684,,051) (205,,642)
(57,,784) 202,,545
119,,779 81,,109 37,,168
278,,546 (85,,578) (28,,239)
200,,036 (412,,517)
(6,,286) (6,,815)
177,,203
(85,,353) (85,,353)
294,,395
215,,908
$ 510,,303
$ 1,174,254 (655,870) (206,049)
(46,768) 265,567
84,442 47,474 30,674
146,980 38,097
(23,539) (389,358) (339,464)
(7,150) (6,363)
(418,207)
- -
(152,640)
368,548
$ 215,908
The accompanying notes are an integral part of these consolidated fi nancial statements.The accompanying notes are an integral part of these consolidated fi nancial statements.

2013-2014 Alberta Jobs, Skills, Training and Labour Annual Report65
46 WCBALBERTA 2013 ANNUAL REPORT
Notes to the Consolidated Financial StatementsFor the year ended December 31, 2013 with comparatives for the year ended December 31, 2012 (thousands of dollars unless stated otherwise)
1. REPORTING ENTITY
The Workers’ Compensation Board – Alberta (WCB) is a provincial board created by legislation in 1918. As a statutory corporation, WCB administers the workers’ compensation system for the province of Alberta under the authority of the Workers’ Compensation Act (the Act). WCB’s corporate head offi ce is located in Edmonton,Alberta, with operations exclusively within the province of Alberta. WCB’s legislated mandate is to provide disability benefi ts to workers who sustain injuries in the course of employment.
2. SIGNIFICANT ACCOUNTING POLICIES
The following accounting policies have been applied in the preparation of the consolidated fi nancialstatements for all years presented, unless otherwise indicated.
GENERAL ACCOUNTING POLICIES
Basis of preparationThese consolidated fi nancial statements have been prepared in accordance with International FinancialReporting Standards (IFRS). They comply, in all material respects, with IFRS as issued by the International Accounting Standards Board (IASB) in eff ect as at December 31, 2013.
These consolidated fi nancial statements have been prepared on an historic cost basis except for investments reported at fair value. The principal accounting policies applied in the preparation of the consolidated fi nancial statements on an IFRS basis are set out below.
Basis of consolidationThe consolidated fi nancial statements include the assets, liabilities, and results of operations of WCB and all of its subsidiaries, after the elimination of intercompany transactions and balances. Subsidiaries are defi ned as entities controlled by WCB in which WCB is the benefi cial owner.
WCB holds 100 per cent of the voting interest in the following subsidiaries, both Alberta registeredcorporations:
• WCB Real Assets Ltd. – holds portfolio investments in infrastructure, and timberlands• WCB Global Real Assets Ltd. – holds portfolio investments in commercial real estate
In the context of structured entities, WCB has concluded that it does not control its structured entities, and the substance of WCB’s interests is that they are only passive portfolio investments. For further details, see the table describing interests in unconsolidated structured entities at the end of Note 5 Investments.
Foreign currency translationWCB’s consolidated fi nancial statements are presented in Canadian dollars, which is also the functionalcurrency. All fi nancial information presented has been rounded to the nearest thousand, unless otherwise stated.
Monetary assets and liabilities denominated in foreign currency are translated into Canadian dollars at the exchange rate in eff ect at the date of the consolidated statement of fi nancial position. Exchange diff erences arising from settlement of monetary items are included in income in the period in which they arise. Non-monetary assets and liabilities denominated in foreign currency are translated at the exchange rate in eff ect when those transactions occurred.
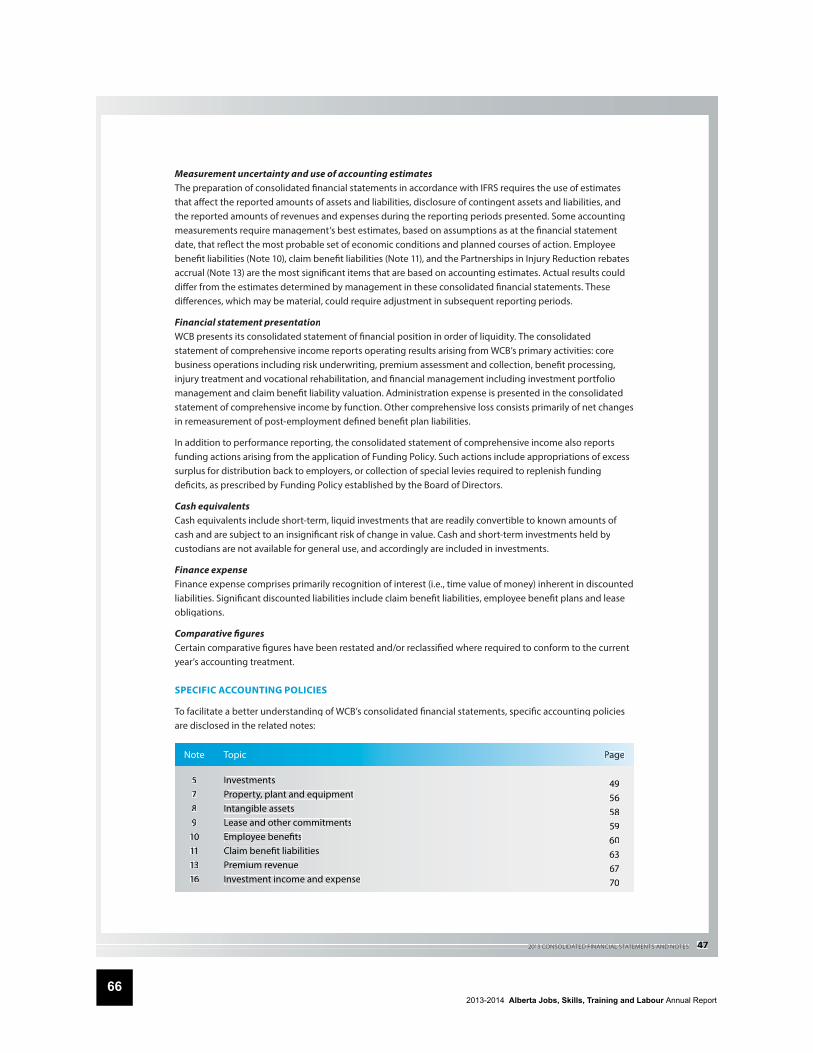
2013-2014 Alberta Jobs, Skills, Training and Labour Annual Report66
2013 CONSOLIDATED FINANCIAL STATEMENTS AND NOTES 47
Measurement uncertainty and use of accounting estimatesThe preparation of consolidated fi nancial statements in accordance with IFRS requires the use of estimatesthat aff ect the reported amounts of assets and liabilities, disclosure of contingent assets and liabilities, and the reported amounts of revenues and expenses during the reporting periods presented. Some accounting measurements require management’s best estimates, based on assumptions as at the fi nancial statement date, that refl ect the most probable set of economic conditions and planned courses of action. Employee benefi t liabilities (Note 10), claim benefi t liabilities (Note 11), and the Partnerships in Injury Reduction rebates accrual (Note 13) are the most signifi cant items that are based on accounting estimates. Actual results could diff er from the estimates determined by management in these consolidated fi nancial statements. These diff erences, which may be material, could require adjustment in subsequent reporting periods.
Financial statement presentationWCB presents its consolidated statement of fi nancial position in order of liquidity. The consolidatedstatement of comprehensive income reports operating results arising from WCB’s primary activities: core business operations including risk underwriting, premium assessment and collection, benefi t processing, injury treatment and vocational rehabilitation, and fi nancial management including investment portfolio management and claim benefi t liability valuation. Administration expense is presented in the consolidated statement of comprehensive income by function. Other comprehensive loss consists primarily of net changes in remeasurement of post-employment defi ned benefi t plan liabilities.
In addition to performance reporting, the consolidated statement of comprehensive income also reports funding actions arising from the application of Funding Policy. Such actions include appropriations of excess surplus for distribution back to employers, or collection of special levies required to replenish funding defi cits, as prescribed by Funding Policy established by the Board of Directors.
Cash equivalentsCash equivalents include short-term, liquid investments that are readily convertible to known amounts of cash and are subject to an insignifi cant risk of change in value. Cash and short-term investments held bycustodians are not available for general use, and accordingly are included in investments.
Finance expenseFinance expense comprises primarily recognition of interest (i.e., time value of money) inherent in discountedliabilities. Signifi cant discounted liabilities include claim benefi t liabilities, employee benefi t plans and leaseobligations.
Comparative fi guresCertain comparative fi gures have been restated and/or reclassifi ed where required to conform to the current year’s accounting treatment.
SPECIFIC ACCOUNTING POLICIES
To facilitate a better understanding of WCB’s consolidated fi nancial statements, specifi c accounting policies are disclosed in the related notes:
Note Topic Paage
5789
10111316
InvestmentsProperty, plant and equipmentIntangible assetsLease and other commitmentsEmployee benefi tsClaim benefi t liabilitiesPremium revenueInvestment income and expense
4956585960636770

2013-2014 Alberta Jobs, Skills, Training and Labour Annual Report67
48 WCBALBERTA 2013 ANNUAL REPORT
3. ACCOUNTING POLICY CHANGES
STANDARDS EFFECTIVE IN THE CURRENT YEAR
IFRS 10 Consolidated Financial StatementsIFRS 11 Joint ArrangementsIFRS 12 Disclosure of Interests in Other Entities
Eff ective January 1, 2013, WCB adopted IFRS 10, IFRS 11 and IFRS 12 concurrently as prescribed.
IFRS 10 establishes a single defi nition of control as the basis of consolidation, based on a reporting entity having power, rights, or exposure to variable returns, and the ability to use such power to aff ect its returns from the investee. This new standard applies to WCB’s wholly owned investment subsidiaries, and structured portfolio investments.
IFRS 11 applies to joint arrangements which include joint operations and joint ventures. WCB is not currentlyinvolved in joint arrangements.
IFRS 12 prescribes new and expanded disclosures, both quantitative and narrative, relating to WCB’s involvement with other entities, in order to facilitate better understanding of the economic relationships with other entities.
IFRS 13 Fair Value Measurement
Eff ective January 1, 2013, WCB adopted IFRS 13 Fair Value Measurement that prescribes additional disclosures ton the use of valuation techniques and unobservable inputs used in fair value measurements.
Amendments to IFRS 7 Financial Instruments – Disclosures: Off setting Financial Assets and Financial Liabilities
Eff ective January 1, 2013, WCB adopted amended IFRS 7 that requires additional disclosure of recognized fi nancial instruments that are off set. The amendments prescribe separate disclosure for fi nancial assets andfi nancial liabilities, that are (i) off set in the statement of fi nancial position or (ii) subject to master nettingor similar arrangements irrespective of whether they are off set. WCB discloses fi nancial assets and fi nancial liabilities that have been off set in Note 6 Investment Risk Management in the subsection “Derivatives risk.”These disclosures do not aff ect WCB’s fi nancial position or results of operations.
STANDARDS ISSUED BUT NOT YET EFFECTIVE
Amendments to IAS 32 Financial Instruments – Presentation: Off setting Financial Assets and Financial Liabilities
In December 2011, the IASB amended IAS 32 guidance to clarify when fi nancial assets and fi nancial liabilities may be off set. Since WCB does not hold material fi nancial liabilities, the guidance will primarily aff ect WCB’s derivative contracts and only when they result in material loss positions. These requirements, which areeff ective for reporting periods beginning on or after January 1, 2014, with earlier application permitted, arenot expected to have a material impact on WCB’s fi nancial reporting.
4. FUNDING
ACCIDENT FUND
The Act stipulates the creation of an Accident Fund (the Fund) holding suffi cient funds for the payment of present and future compensation. The Fund is fully funded when the total assets equal or exceed total liabilities. This Funded Position (or net assets) represents the current funding status of the Fund.
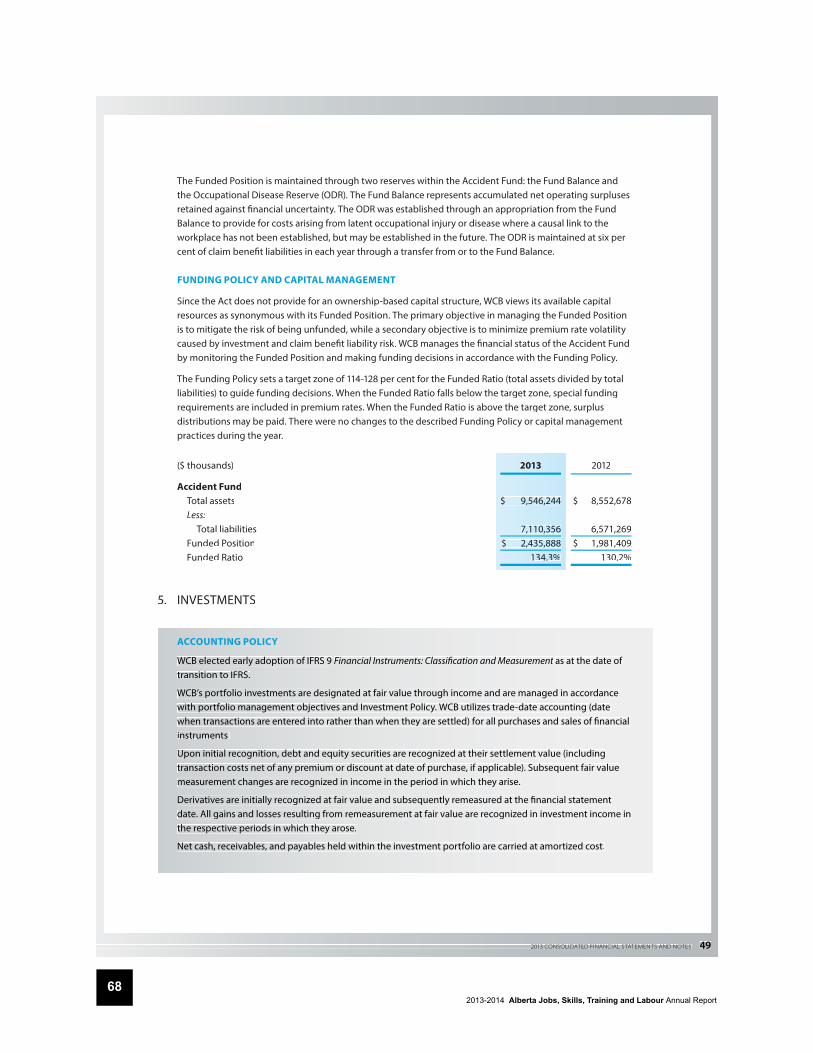
2013-2014 Alberta Jobs, Skills, Training and Labour Annual Report68
2013 CONSOLIDATED FINANCIAL STATEMENTS AND NOTES 49
The Funded Position is maintained through two reserves within the Accident Fund: the Fund Balance andthe Occupational Disease Reserve (ODR). The Fund Balance represents accumulated net operating surpluses retained against fi nancial uncertainty. The ODR was established through an appropriation from the Fund Balance to provide for costs arising from latent occupational injury or disease where a causal link to theworkplace has not been established, but may be established in the future. The ODR is maintained at six per cent of claim benefi t liabilities in each year through a transfer from or to the Fund Balance.
FUNDING POLICY AND CAPITAL MANAGEMENT
Since the Act does not provide for an ownership-based capital structure, WCB views its available capitalresources as synonymous with its Funded Position. The primary objective in managing the Funded Position is to mitigate the risk of being unfunded, while a secondary objective is to minimize premium rate volatility caused by investment and claim benefi t liability risk. WCB manages the fi nancial status of the Accident Fund by monitoring the Funded Position and making funding decisions in accordance with the Funding Policy.
The Funding Policy sets a target zone of 114-128 per cent for the Funded Ratio (total assets divided by total liabilities) to guide funding decisions. When the Funded Ratio falls below the target zone, special fundingrequirements are included in premium rates. When the Funded Ratio is above the target zone, surplus distributions may be paid. There were no changes to the described Funding Policy or capital management practices during the year.
($ thousands) 2013 2012
Accident Fund Total assets
Less: Total liabilities Funded Position Funded Ratio
$ 9,546,244
7,110,356$ 2,435,888
134.3%
$ 8,552,678
6,571,269 $ 1,981,409
130.2%
5. INVESTMENTS
ACCOUNTING POLICY
WCB elected early adoption of IFRS 9 Financial Instruments: Classifi cation and Measurement as at the date of transition to IFRS.
WCB’s portfolio investments are designated at fair value through income and are managed in accordancewith portfolio management objectives and Investment Policy. WCB utilizes trade-date accounting (date when transactions are entered into rather than when they are settled) for all purchases and sales of fi nancial instruments.
Upon initial recognition, debt and equity securities are recognized at their settlement value (including transaction costs net of any premium or discount at date of purchase, if applicable). Subsequent fair valuemeasurement changes are recognized in income in the period in which they arise.
Derivatives are initially recognized at fair value and subsequently remeasured at the fi nancial statement date. All gains and losses resulting from remeasurement at fair value are recognized in investment income in the respective periods in which they arose.
Net cash, receivables, and payables held within the investment portfolio are carried at amortized cost.
2013-2014 Alberta Jobs, Skills, Training and Labour Annual Report69
50 WCBALBERTA 2013 ANNUAL REPORT
Valuation of fi nancial instrumentsThe fair value of fi nancial instruments as at the reporting date is determined as follows:
Debt and equity securities• Publicly traded securities are based on their closing bid prices or the average of the latest bid/ask
prices quoted by independent securities valuation companies.• Non-publicly traded pooled funds are valued at the net asset values of the funds, which refl ect the
fair values of fund assets less fund liabilities.• The fair value of infrastructure and real estate funds are based on independent annual
appraisals, net of any liabilities against the fund assets.
• The fair value of commercial mortgage funds is based on the market interest rate spread over Bank of Canada bonds with a similar term to maturity.
Derivative contracts• Written forward foreign-exchange contracts are valued based on the change in the underlying
exchange rate relative to the Canadian dollar.
• Tradable equity index futures, whose prices change according to the underlying market index, are valued based on exchange-listed prices.
• Bond futures, whose prices change according to the underlying bond price, are valued based on exchange-listed prices.
INVESTMENT PORTFOLIO HOLDINGS
WCB’s portfolio investments are all classifi ed at fair value through income. The table in this section presents the fair value of WCB’s investments as at December 31, together with their classifi cations under the fair value measurement hierarchy. Note 16 Investment Income and Expense provides a breakdown of investment income by type.
Fair value classifi cation hierarchyThe fair value of WCB’s investments recorded on the consolidated statement of fi nancial position was determined using one of the following valuation techniques:
Level 1 The fair value is based on quoted prices in active markets for identical assets or liabilities. This level includes equity securities and derivative contracts that are traded in an active exchange market.
Level 2 The fair value is based on inputs, other than Level 1 prices, such as quoted prices for similar assets or liabilities; quoted prices in markets that are not active; or other inputs based on observablemarket data. Includes pooled funds invested in traded securities, as well as derivative contracts whose value is determined using a pricing model with inputs that are observable in the market or can be derived principally from or corroborated by observable market data.
Level 3 The fair value is based on unobservable inputs that are signifi cant to the fair value of the assets or liabilities and have little or no market activity. This level includes fi nancial instruments whose value is determined using pricing models, discounted cash fl ow methodologies or similar techniques, as well as instruments for which the determination of fair value requires signifi cant management judgment or estimation. The most signifi cant inputs aff ecting the fair value calculations include the projected operating and capital-related cash fl ows and the associated discount rate. The discountrate is responsive to changes in macroeconomic factors aff ecting the risk profi le of invested assets such as demand, market conditions, fi nancial risks, future infl ation, and so on. This level includes pooled funds invested in debt securities, private equity, real estate and infrastructure.
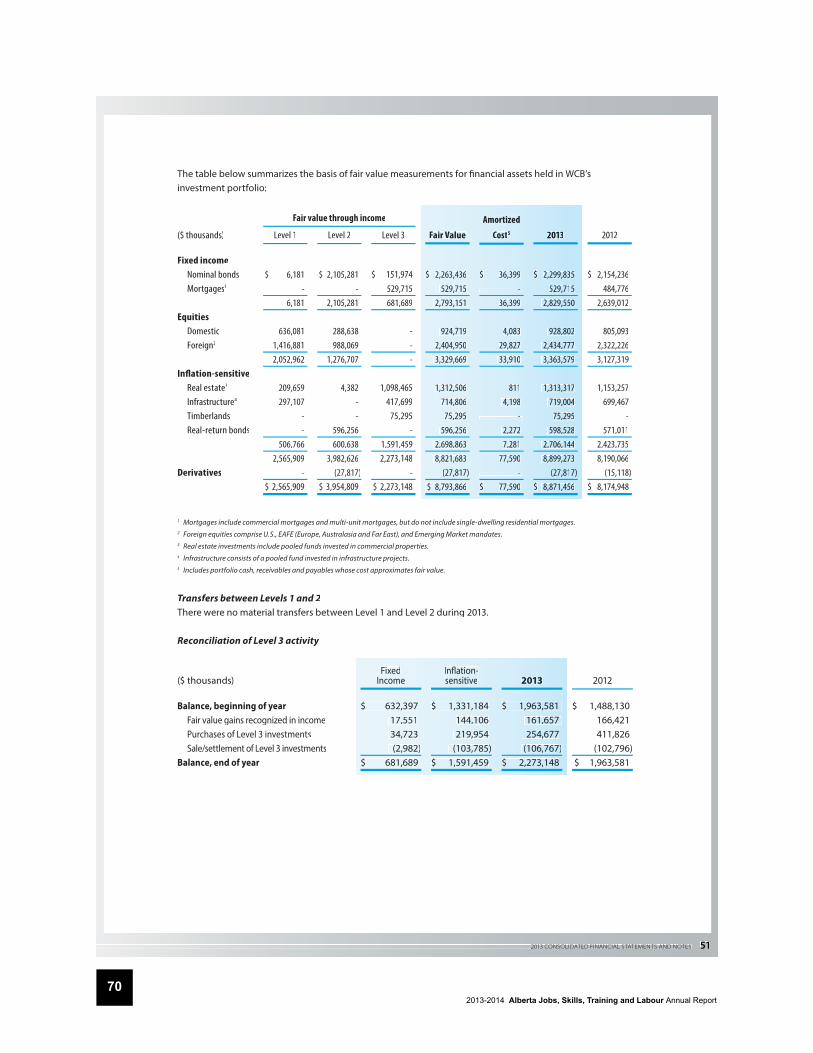
2013-2014 Alberta Jobs, Skills, Training and Labour Annual Report70
2013 CONSOLIDATED FINANCIAL STATEMENTS AND NOTES 51
The table below summarizes the basis of fair value measurements for fi nancial assets held in WCB’s investment portfolio:
Fair value through income Amortizedd
($ thousands)
Fixed income Nominal bonds Mortgages1 Equities Domestic Foreign2
Infl ation-sensitive Real estate3
Infrastructure4
Timberlands Real-return bonds
Derivatives
Level 1
$ 6,181 -
6,181
636,081 1,416,881 2,052,962
209,659 297,107
- -
506,766 2,565,909
- $ 2,565,909
Level 2
$ 2,105,281 -
2,105,281
288,638 988,069
1,276,707
4,382 - - 596,256
600,638 3,982,626
(27,817) $ 3,954,809
Level 3
$ 151,974 529,715 681,689
- - -
1,098,465 417,699
75,295 -
1,591,459 2,273,148
- $ 2,273,148
Fair VValue
$ 2,2663,436 5229,715
2,7993,151
9224,7192,4004,950 3,3229,669
1,312,506714,806
75,295 5996,256
2,6998,863 8,8221,683
(227,817) $ 8,7993,866
Cost5
$ 36,3999--
36,3999
4,083329,8277
33,9100
8111 4,1988
-- 2,27227,2811
77,5900 -- $ 77,5900
2013
$ 2,299,8335529,715
2,829,5550
928,8002 2,434,777 3,363,579
1,313,317 719,0004
75,2995 598,528
2,706,1444 8,899,273
(27,817)$ 8,871,4556
2012
$ 2,154,236484,776
2,639,012
805,0932,322,2263,127,319
1,153,257699,467
-571,011
2,423,7358,190,066
(15,118)$ 8,174,948
1 Mortgages include commercial mortgages and multi-unit mortgages, but do not include single-dwelling residential mortgages.2 Foreign equities comprise U.S., EAFE (Europe, Australasia and Far East), and Emerging Market mandates.3 Real estate investments include pooled funds invested in commercial properties.4 Infrastructure consists of a pooled fund invested in infrastructure projects.5 Includes portfolio cash, receivables and payables whose cost approximates fair value.
Transfers between Levels 1 and 2There were no material transfers between Level 1 and Level 2 during 2013.
Reconciliation of Level 3 activity
Fixed Innfl ation-($ thousands)
Balance, beginning of year Fair value gains recognized in income Purchases of Level 3 investments Sale/settlement of Level 3 investmentsBalance, end of year
Income
$ 632,397 17,551 34,723
(2,982)$ 681,689
sensitive
$ 1,331,184144,106 219,954 (103,785)
$ 1,591,459
2013
$ 1,963,581 161,657 254,677(106,767)
$ 22,273,148
2012
$ 1,488,130 166,421
411,826 (102,796)
$ 1,963,581
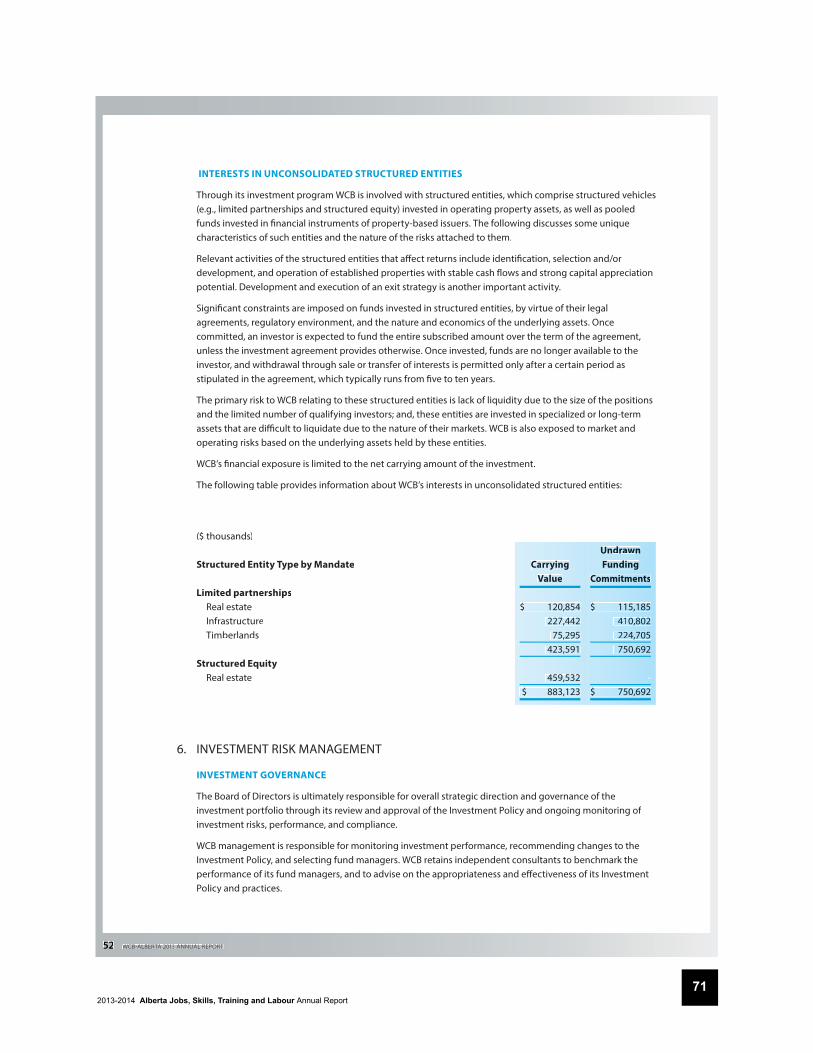
2013-2014 Alberta Jobs, Skills, Training and Labour Annual Report71
52 WCBALBERTA 2013 ANNUAL REPORT
INTERESTS IN UNCONSOLIDATED STRUCTURED ENTITIES
Through its investment program WCB is involved with structured entities, which comprise structured vehicles(e.g., limited partnerships and structured equity) invested in operating property assets, as well as pooled funds invested in fi nancial instruments of property-based issuers. The following discusses some unique characteristics of such entities and the nature of the risks attached to them.
Relevant activities of the structured entities that aff ect returns include identifi cation, selection and/ordevelopment, and operation of established properties with stable cash fl ows and strong capital appreciationpotential. Development and execution of an exit strategy is another important activity.
Signifi cant constraints are imposed on funds invested in structured entities, by virtue of their legal agreements, regulatory environment, and the nature and economics of the underlying assets. Once committed, an investor is expected to fund the entire subscribed amount over the term of the agreement, unless the investment agreement provides otherwise. Once invested, funds are no longer available to the investor, and withdrawal through sale or transfer of interests is permitted only after a certain period as stipulated in the agreement, which typically runs from fi ve to ten years.
The primary risk to WCB relating to these structured entities is lack of liquidity due to the size of the positions and the limited number of qualifying investors; and, these entities are invested in specialized or long-term assets that are diffi cult to liquidate due to the nature of their markets. WCB is also exposed to market and operating risks based on the underlying assets held by these entities.
WCB’s fi nancial exposure is limited to the net carrying amount of the investment.
The following table provides information about WCB’s interests in unconsolidated structured entities:
($ thousands)
Structured Entity Type by Mandate Caarrying Value
UndraawnFundding
CommittmentsLimited partnerships Real estate Infrastructure Timberlands
Structured Equity Real estate
$ 120,854 227,442
75,295 423,591
459,532 $ 883,123
$ 115,185410,802224,705750,692
-$ 750,692
6. INVESTMENT RISK MANAGEMENT
INVESTMENT GOVERNANCE
The Board of Directors is ultimately responsible for overall strategic direction and governance of theinvestment portfolio through its review and approval of the Investment Policy and ongoing monitoring of investment risks, performance, and compliance.
WCB management is responsible for monitoring investment performance, recommending changes to the Investment Policy, and selecting fund managers. WCB retains independent consultants to benchmark the performance of its fund managers, and to advise on the appropriateness and eff ectiveness of its Investment Policy and practices.
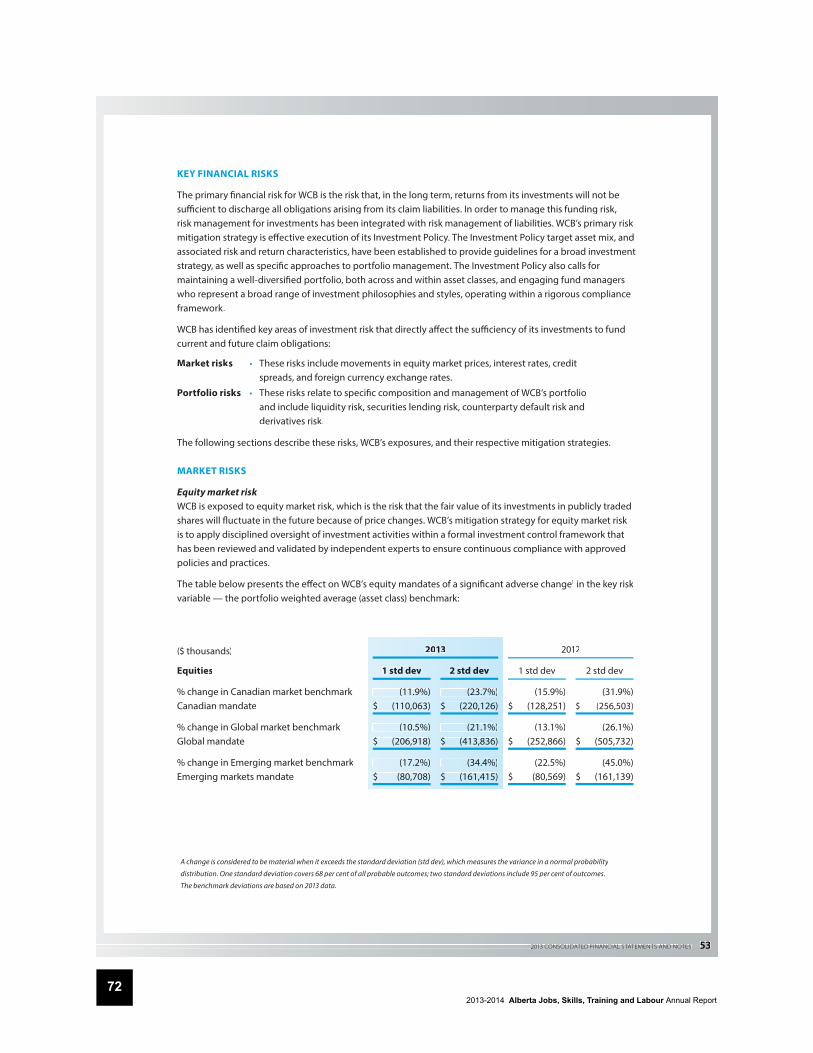
2013-2014 Alberta Jobs, Skills, Training and Labour Annual Report72
2013 CONSOLIDATED FINANCIAL STATEMENTS AND NOTES 53
KEY FINANCIAL RISKS
The primary fi nancial risk for WCB is the risk that, in the long term, returns from its investments will not be suffi cient to discharge all obligations arising from its claim liabilities. In order to manage this funding risk, risk management for investments has been integrated with risk management of liabilities. WCB’s primary risk mitigation strategy is eff ective execution of its Investment Policy. The Investment Policy target asset mix, and associated risk and return characteristics, have been established to provide guidelines for a broad investmentstrategy, as well as specifi c approaches to portfolio management. The Investment Policy also calls formaintaining a well-diversifi ed portfolio, both across and within asset classes, and engaging fund managers who represent a broad range of investment philosophies and styles, operating within a rigorous complianceframework.
WCB has identifi ed key areas of investment risk that directly aff ect the suffi ciency of its investments to fundcurrent and future claim obligations:
Market risks • These risks include movements in equity market prices, interest rates, credit spreads, and foreign currency exchange rates.
Portfolio risks • These risks relate to specifi c composition and management of WCB’s portfolioand include liquidity risk, securities lending risk, counterparty default risk and derivatives risk.
The following sections describe these risks, WCB’s exposures, and their respective mitigation strategies.
MARKET RISKS
Equity market riskWCB is exposed to equity market risk, which is the risk that the fair value of its investments in publicly traded shares will fl uctuate in the future because of price changes. WCB’s mitigation strategy for equity market risk is to apply disciplined oversight of investment activities within a formal investment control framework that has been reviewed and validated by independent experts to ensure continuous compliance with approved policies and practices.
The table below presents the eff ect on WCB’s equity mandates of a signifi cant adverse change1 in the key risk variable — the portfolio weighted average (asset class) benchmark:
($ thousands) 20013 2012
Equities
% change in Canadian market benchmarkCanadian mandate
% change in Global market benchmarkGlobal mandate
% change in Emerging market benchmarkEmerging markets mandate
1 std dev
(11.9%)$ (110,063)
(10.5%)$ (206,918)
(17.2%)$ (80,708)
2 std dev
(23.7%)$ (220,126)
(21.1%)$ (413,836)
(34.4%)$ (161,415)
1 std dev
(15.9%)$ (128,251)
(13.1%)$ (252,866)
(22.5%)$ (80,569)
2 std dev
(31.9%)$ (256,503)
(26.1%)$ (505,732)
(45.0%)$ (161,139)
1 A change is considered to be material when it exceeds the standard deviation (std dev), which measures the variance in a normal probability
distribution. One standard deviation covers 68 per cent of all probable outcomes; two standard deviations include 95 per cent of outcomes.
The benchmark deviations are based on 2013 data.
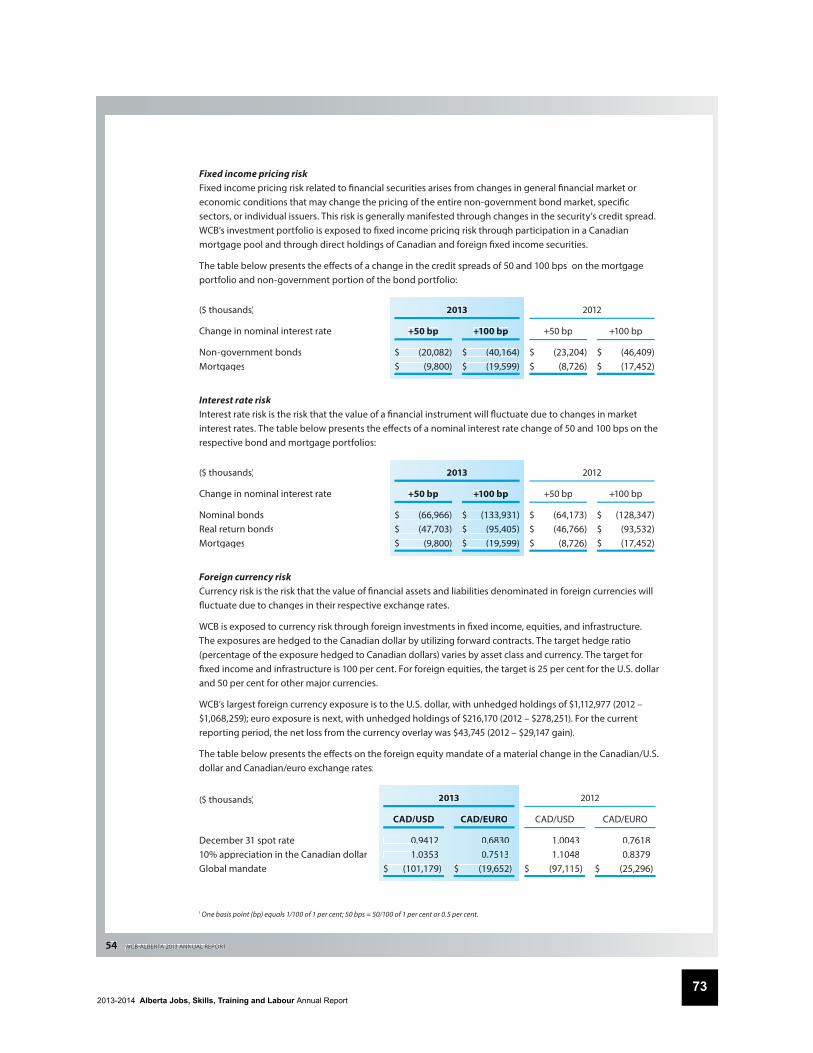
2013-2014 Alberta Jobs, Skills, Training and Labour Annual Report73
54 WCBALBERTA 2013 ANNUAL REPORT
Fixed income pricing riskFixed income pricing risk related to fi nancial securities arises from changes in general fi nancial market or economic conditions that may change the pricing of the entire non-government bond market, specifi c sectors, or individual issuers. This risk is generally manifested through changes in the security’s credit spread.WCB’s investment portfolio is exposed to fi xed income pricing risk through participation in a Canadianmortgage pool and through direct holdings of Canadian and foreign fi xed income securities.
The table below presents the eff ects of a change in the credit spreads of 50 and 100 bps1 on the mortgage portfolio and non-government portion of the bond portfolio:
($ thousands) 2013 2012
Change in nominal interest rate
Non-government bondsMortgages
+50 bp
$ (20,0882)$ (9,8000)
+100 bp
$ (40,164)$ (19,599)
+50 bp
$ (23,204)$ (8,726)
+100 bp
$ (46,409)$ (17,452)
Interest rate riskInterest rate risk is the risk that the value of a fi nancial instrument will fl uctuate due to changes in market interest rates. The table below presents the eff ects of a nominal interest rate change of 50 and 100 bps on the respective bond and mortgage portfolios:
($ thousands) 2013 2012
Change in nominal interest rate
Nominal bondsReal return bondsMortgages
+50 bp
$ (66,9666)$ (47,7003)$ (9,8000)
+100 bp
$ (133,931)$ (95,405)$ (19,599)
+50 bp
$ (64,173)$ (46,766)$ (8,726)
+100 bp
$ (128,347)$ (93,532)$ (17,452)
Foreign currency riskCurrency risk is the risk that the value of fi nancial assets and liabilities denominated in foreign currencies will fl uctuate due to changes in their respective exchange rates.
WCB is exposed to currency risk through foreign investments in fi xed income, equities, and infrastructure.The exposures are hedged to the Canadian dollar by utilizing forward contracts. The target hedge ratio (percentage of the exposure hedged to Canadian dollars) varies by asset class and currency. The target forfi xed income and infrastructure is 100 per cent. For foreign equities, the target is 25 per cent for the U.S. dollar and 50 per cent for other major currencies.
WCB’s largest foreign currency exposure is to the U.S. dollar, with unhedged holdings of $1,112,977 (2012 – $1,068,259); euro exposure is next, with unhedged holdings of $216,170 (2012 – $278,251). For the current reporting period, the net loss from the currency overlay was $43,745 (2012 – $29,147 gain).
The table below presents the eff ects on the foreign equity mandate of a material change in the Canadian/U.S. dollar and Canadian/euro exchange rates:
($ thousands) 2013 2012
December 31 spot rate10% appreciation in the Canadian dollarGlobal mandate
CAD/USD
0.9412 1.0353$ (101,179)
CAD/EUURO
0.668300.7513
$ (199,652)
CAD/USD
1.00431.1048
$ (97,115)
CAD/EURO
0.76180.8379
$ (25,296)
1 One basis point (bp) equals 1/100 of 1 per cent; 50 bps = 50/100 of 1 per cent or 0.5 per cent.
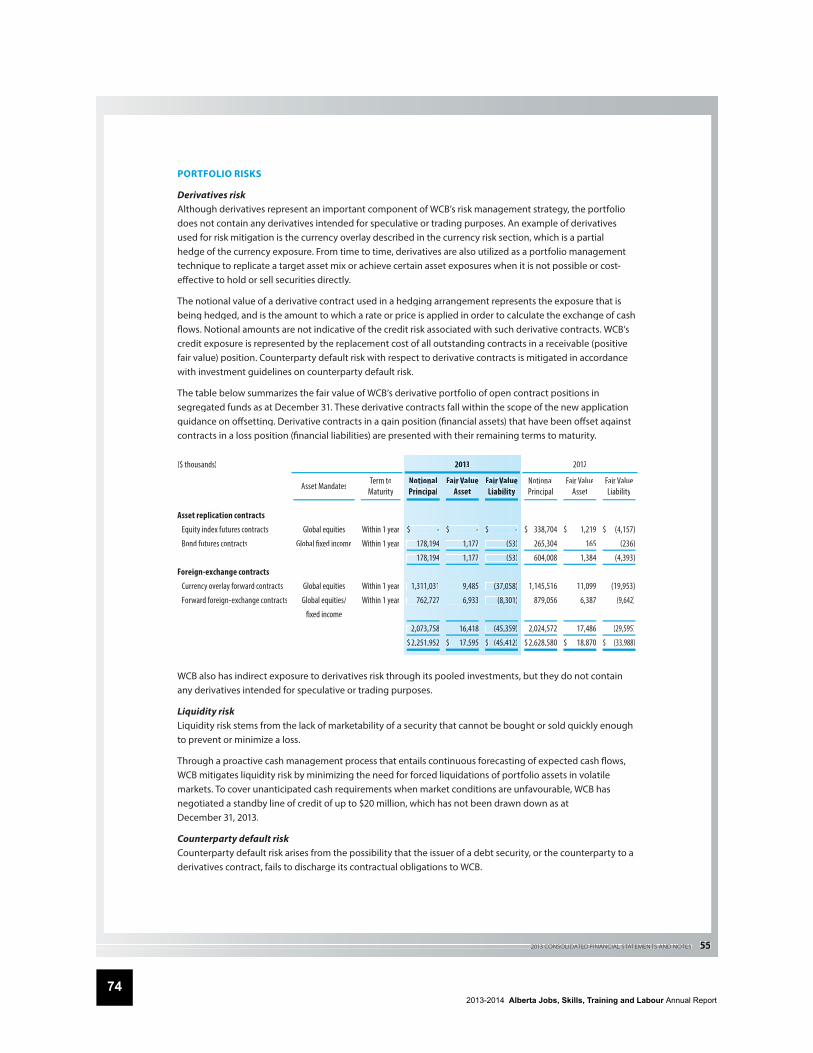
2013-2014 Alberta Jobs, Skills, Training and Labour Annual Report74
2013 CONSOLIDATED FINANCIAL STATEMENTS AND NOTES 55
PORTFOLIO RISKS
Derivatives riskAlthough derivatives represent an important component of WCB’s risk management strategy, the portfoliodoes not contain any derivatives intended for speculative or trading purposes. An example of derivatives used for risk mitigation is the currency overlay described in the currency risk section, which is a partialhedge of the currency exposure. From time to time, derivatives are also utilized as a portfolio management technique to replicate a target asset mix or achieve certain asset exposures when it is not possible or cost-eff ective to hold or sell securities directly.
The notional value of a derivative contract used in a hedging arrangement represents the exposure that isbeing hedged, and is the amount to which a rate or price is applied in order to calculate the exchange of cash fl ows. Notional amounts are not indicative of the credit risk associated with such derivative contracts. WCB’scredit exposure is represented by the replacement cost of all outstanding contracts in a receivable (positive fair value) position. Counterparty default risk with respect to derivative contracts is mitigated in accordance with investment guidelines on counterparty default risk.
The table below summarizes the fair value of WCB’s derivative portfolio of open contract positions in segregated funds as at December 31. These derivative contracts fall within the scope of the new application guidance on off setting. Derivative contracts in a gain position (fi nancial assets) that have been off set against contracts in a loss position (fi nancial liabilities) are presented with their remaining terms to maturity.
($ thousands) . 2013 2012
Asset Mandates Term toMaturity
NotionaalPrincipaal
Fair Value Asset
Fair VaalueLiability
NotionalPrincipal
Fair ValueAsset
Fair ValueLiability
Asset replication contracts
Equity index futures contracts
Bond futures contracts
Foreign-exchange contracts
Currency overlay forward contracts
Forward foreign-exchange contracts
Global equities
Global fi xed income
Global equities
Global equities/
fi xed income
Within 1 year
Within 1 year
Within 1 year
Within 1 year
$ -
178,1994
178,1994
1,311,0331
762,7227
2,073,7558
$ 2,251,9552
$ -
1,177
1,177
9,485
6,933
16,418
$ 17,595
$ -
(53)
(53)
(37,0058)
(8,3301)
(45,3359)
$ (45,4412)
$ 338,704
265,304
604,008
1,145,516
879,056
2,024,572
$ 2,628,580
$ 1,219
165
1,384
11,099
6,387
17,486
$ 18,870
$ (4,157)
(236)
(4,393)
(19,953)
(9,642)
(29,595)
$ (33,988)
WCB also has indirect exposure to derivatives risk through its pooled investments, but they do not containany derivatives intended for speculative or trading purposes.
Liquidity riskLiquidity risk stems from the lack of marketability of a security that cannot be bought or sold quickly enough to prevent or minimize a loss.
Through a proactive cash management process that entails continuous forecasting of expected cash fl ows, WCB mitigates liquidity risk by minimizing the need for forced liquidations of portfolio assets in volatilemarkets. To cover unanticipated cash requirements when market conditions are unfavourable, WCB has negotiated a standby line of credit of up to $20 million, which has not been drawn down as at December 31, 2013.
Counterparty default riskCounterparty default risk arises from the possibility that the issuer of a debt security, or the counterparty to a derivatives contract, fails to discharge its contractual obligations to WCB.
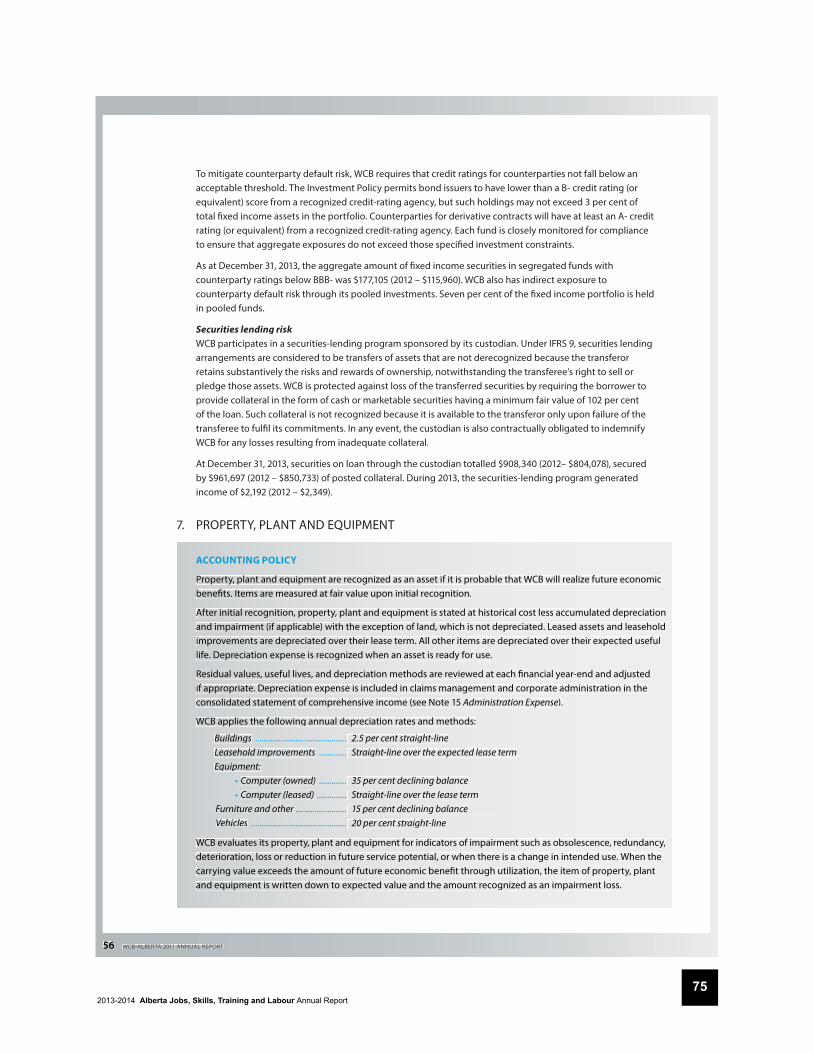
2013-2014 Alberta Jobs, Skills, Training and Labour Annual Report75
56 WCBALBERTA 2013 ANNUAL REPORT
To mitigate counterparty default risk, WCB requires that credit ratings for counterparties not fall below an acceptable threshold. The Investment Policy permits bond issuers to have lower than a B- credit rating (or equivalent) score from a recognized credit-rating agency, but such holdings may not exceed 3 per cent of total fi xed income assets in the portfolio. Counterparties for derivative contracts will have at least an A- creditrating (or equivalent) from a recognized credit-rating agency. Each fund is closely monitored for compliance to ensure that aggregate exposures do not exceed those specifi ed investment constraints.
As at December 31, 2013, the aggregate amount of fi xed income securities in segregated funds with counterparty ratings below BBB- was $177,105 (2012 – $115,960). WCB also has indirect exposure to counterparty default risk through its pooled investments. Seven per cent of the fi xed income portfolio is held in pooled funds.
Securities lending riskWCB participates in a securities-lending program sponsored by its custodian. Under IFRS 9, securities lending arrangements are considered to be transfers of assets that are not derecognized because the transferor retains substantively the risks and rewards of ownership, notwithstanding the transferee’s right to sell orpledge those assets. WCB is protected against loss of the transferred securities by requiring the borrower to provide collateral in the form of cash or marketable securities having a minimum fair value of 102 per centof the loan. Such collateral is not recognized because it is available to the transferor only upon failure of the transferee to fulfi l its commitments. In any event, the custodian is also contractually obligated to indemnify WCB for any losses resulting from inadequate collateral.
At December 31, 2013, securities on loan through the custodian totalled $908,340 (2012– $804,078), secured by $961,697 (2012 – $850,733) of posted collateral. During 2013, the securities-lending program generated income of $2,192 (2012 – $2,349).
7. PROPERTY, PLANT AND EQUIPMENT
ACCOUNTING POLICY
Property, plant and equipment are recognized as an asset if it is probable that WCB will realize future economic benefi ts. Items are measured at fair value upon initial recognition.
After initial recognition, property, plant and equipment is stated at historical cost less accumulated depreciationand impairment (if applicable) with the exception of land, which is not depreciated. Leased assets and leasehold improvements are depreciated over their lease term. All other items are depreciated over their expected useful life. Depreciation expense is recognized when an asset is ready for use.
Residual values, useful lives, and depreciation methods are reviewed at each fi nancial year-end and adjusted if appropriate. Depreciation expense is included in claims management and corporate administration in the consolidated statement of comprehensive income (see Note 15 Administration Expense).
WCB applies the following annual depreciation rates and methods:
Buildings ........................................... 2.5 per cent straight-lineLeasehold improvements ............. Straight-line over the expected lease termEquipment:
• Computer (owned) ............. 35 per cent declining balance • Computer (leased) .............. Straight-line over the lease term
Furniture and other ........................ 15 per cent declining balance Vehicles ............................................. 20 per cent straight-line
WCB evaluates its property, plant and equipment for indicators of impairment such as obsolescence, redundancy, deterioration, loss or reduction in future service potential, or when there is a change in intended use. When thecarrying value exceeds the amount of future economic benefi t through utilization, the item of property, plantand equipment is written down to expected value and the amount recognized as an impairment loss.
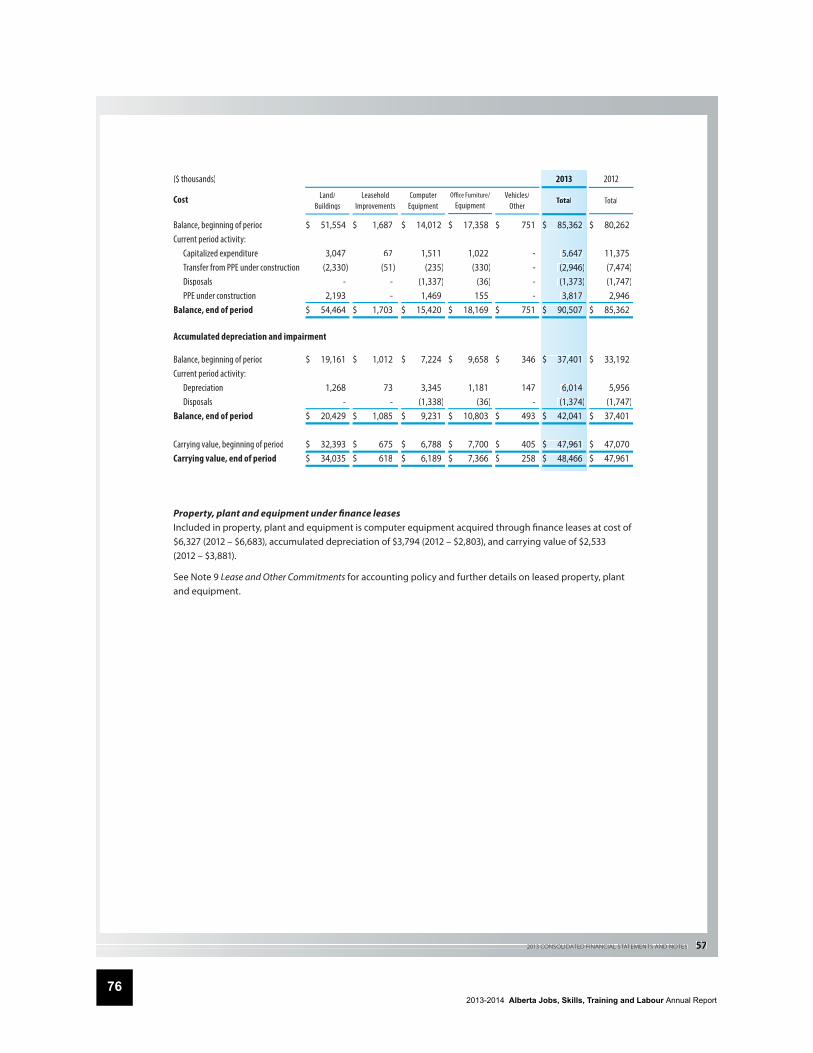
2013-2014 Alberta Jobs, Skills, Training and Labour Annual Report76
2013 CONSOLIDATED FINANCIAL STATEMENTS AND NOTES 57
($ thousands) . 20113 2012
Cost Land/Buildings
LeaseholdImprovements
ComputerEquipment
Offi ce Furniture/Equipment
Vehicles/Other
Tottal Total
Balance, beginning of periodCurrent period activity: Capitalized expenditure Transfer from PPE under construction Disposals PPE under constructionBalance, end of period
Accumulated depreciation and impairment
Balance, beginning of periodCurrent period activity: Depreciation DisposalsBalance, end of period
Carrying value, beginning of periodCarrying value, end of period
$ 51,554
3,047 (2,330)
- 2,193
$ 54,464
$ 19,161
1,268 -$ 20,429
$ 32,393 $ 34,035
$ 1,687
67 (51) - -$ 1,703
$ 1,012
73 -$ 1,085
$ 675 $ 618
$ 14,012
1,511 (235)
(1,337) 1,469
$ 15,420
$ 7,224
3,345 (1,338)
$ 9,231
$ 6,788 $ 6,189
$ 17,358
1,022 (330)
(36) 155
$ 18,169
$ 9,658
1,181 (36)
$ 10,803
$ 7,700$ 7,366
$ 751
- - - -$ 751
$ 346
147 -$ 493
$ 405 $ 258
$ 855,362
55,647 (22,946) (1,373)
33,817$ 900,507
$ 377,401
66,014 (1,374)
$ 422,041
$ 477,961 $ 488,466
$ 80,262
11,375 (7,474) (1,747) 2,946
$ 85,362
$ 33,192
5,956 (1,747)
$ 37,401
$ 47,070 $ 47,961
Property, plant and equipment under fi nance leases Included in property, plant and equipment is computer equipment acquired through fi nance leases at cost of $6,327 (2012 – $6,683), accumulated depreciation of $3,794 (2012 – $2,803), and carrying value of $2,533 (2012 – $3,881).
See Note 9 Lease and Other Commitments for accounting policy and further details on leased property, plant and equipment.
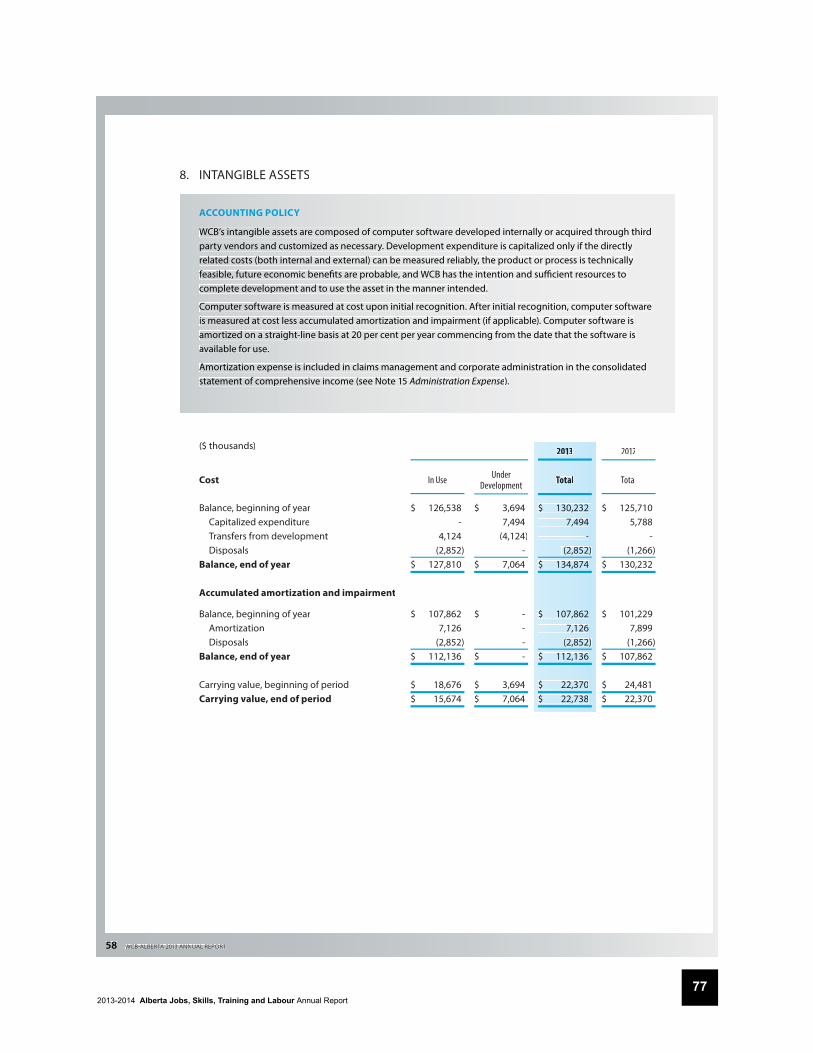
2013-2014 Alberta Jobs, Skills, Training and Labour Annual Report77
58 WCBALBERTA 2013 ANNUAL REPORT
8. INTANGIBLE ASSETS
ACCOUNTING POLICY
WCB’s intangible assets are composed of computer software developed internally or acquired through third party vendors and customized as necessary. Development expenditure is capitalized only if the directly related costs (both internal and external) can be measured reliably, the product or process is technically feasible, future economic benefi ts are probable, and WCB has the intention and suffi cient resources to complete development and to use the asset in the manner intended.
Computer software is measured at cost upon initial recognition. After initial recognition, computer software is measured at cost less accumulated amortization and impairment (if applicable). Computer software is amortized on a straight-line basis at 20 per cent per year commencing from the date that the software is available for use.
Amortization expense is included in claims management and corporate administration in the consolidated statement of comprehensive income (see Note 15 Administration Expense).
($ thousands) 2013 2012
Cost In Use Under Development Total Total
Balance, beginning of year Capitalized expenditure Transfers from development DisposalsBalance, end of year
Accumulated amortization and impairment
Balance, beginning of year Amortization DisposalsBalance, end of year
Carrying value, beginning of periodCarrying value, end of period
$ 126,538 -
4,124(2,852)
$ 127,810
$ 107,862 7,126(2,852)
$ 112,136
$ 18,676$ 15,674
$ 3,694 7,494
(4,124) -
$ 7,064
$ - - -
$ -
$ 3,694 $ 7,064
$$ 130,232 7,494
- (2,852))
$$ 134,874
$$ 107,862 7,126
(2,852)) $$ 112,136
$$ 22,370$$ 22,738
$ 125,710 5,788 -
(1,266)$ 130,232
$ 101,229 7,899
(1,266)$ 107,862
$ 24,481 $ 22,370
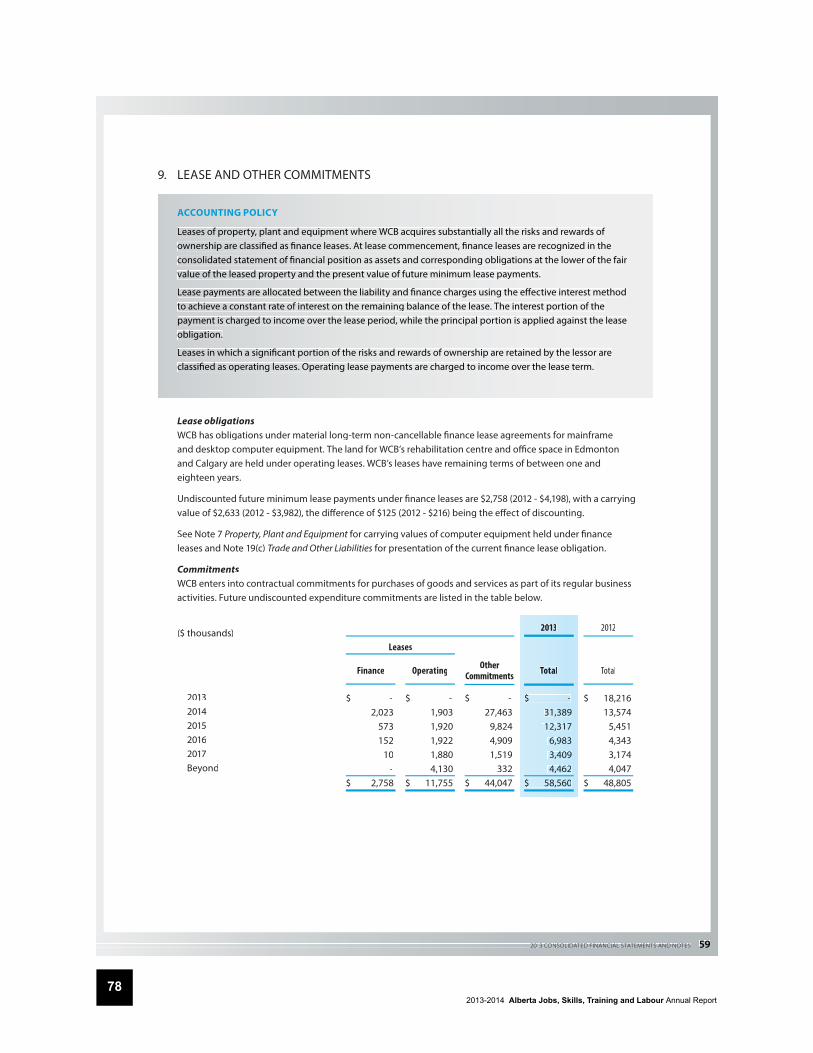
2013-2014 Alberta Jobs, Skills, Training and Labour Annual Report78
2013 CONSOLIDATED FINANCIAL STATEMENTS AND NOTES 59
9. LEASE AND OTHER COMMITMENTS
ACCOUNTING POLICY
Leases of property, plant and equipment where WCB acquires substantially all the risks and rewards of ownership are classifi ed as fi nance leases. At lease commencement, fi nance leases are recognized in theconsolidated statement of fi nancial position as assets and corresponding obligations at the lower of the fair value of the leased property and the present value of future minimum lease payments.
Lease payments are allocated between the liability and fi nance charges using the eff ective interest method to achieve a constant rate of interest on the remaining balance of the lease. The interest portion of the payment is charged to income over the lease period, while the principal portion is applied against the lease obligation.
Leases in which a signifi cant portion of the risks and rewards of ownership are retained by the lessor are classifi ed as operating leases. Operating lease payments are charged to income over the lease term.
Lease obligationsWCB has obligations under material long-term non-cancellable fi nance lease agreements for mainframeand desktop computer equipment. The land for WCB’s rehabilitation centre and offi ce space in Edmonton and Calgary are held under operating leases. WCB’s leases have remaining terms of between one andeighteen years.
Undiscounted future minimum lease payments under fi nance leases are $2,758 (2012 - $4,198), with a carryingvalue of $2,633 (2012 - $3,982), the diff erence of $125 (2012 - $216) being the eff ect of discounting.
See Note 7 Property, Plant and Equipment for carrying values of computer equipment held under fi nancetleases and Note 19(c) Trade and Other Liabilities for presentation of the current fi nance lease obligation.
CommitmentsWCB enters into contractual commitments for purchases of goods and services as part of its regular business activities. Future undiscounted expenditure commitments are listed in the table below.
($ thousands) 2013 2012
Leases
Finance Operating OtherCommitments Total Total
2013 2014 2015 2016 2017 Beyond
$ -2,023
573152 10
-$ 2,758
$ -1,903 1,920 1,922 1,880 4,130
$ 11,755
$ -27,463 9,824 4,909 1,519
332$ 44,047
$ --31,3899 12,3177
6,9833 3,4099 4,4622
$ 58,5600
$ 18,216 13,574
5,4514,3433,1744,047
$ 48,805
2013-2014 Alberta Jobs, Skills, Training and Labour Annual Report79
60 WCBALBERTA 2013 ANNUAL REPORT
10. EMPLOYEE BENEFITS
ACCOUNTING POLICY
WCB provides active service and defi ned post-employment benefi ts to its employees. WCB also participates in certain multi-employer pension plans sponsored by the province of Alberta. An expense and a liability for benefi ts earned are recognized in the period that employee service has been rendered.
For defi ned post-employment benefi t plans, current benefi t cost represents the actuarial present value of the benefi ts earned in the current period. Such cost is actuarially determined using the accrued benefi t method prorated on service, a market interest rate, management’s best estimate of projected costs, and the expected years of service until retirement. The liability as at the reporting date is the present value of the defi ned benefi t obligation, which is determined by discounting the estimated future cash outfl ows using a discount rate based on market yields of high-quality corporate bonds having terms to maturity that approximate the duration of the related benefi t liability. Interest expense represents the amount required in each year to build up the liability over the projected benefi t period to its future value.
Remeasurement changes in benefi t liabilities, composed of actuarial changes in assumptions and experiencegains and losses, are recognized in other comprehensive gain (loss).
ACTIVE SERVICE BENEFITS
WCB’s short-term benefi ts for active employees include salary, compensated absence (sick leave, statutory holidays, and annual vacation), group life insurance, dental and medical coverage, employee family assistance program, education support, and health and wellness benefi ts.
Termination benefi ts are provided for through employment contracts, statutory requirements, orconstructive obligations. As at December 31, 2013, there were no material provisions relating to termination benefi ts.
POST-EMPLOYMENT BENEFITS
Pension plansEmployee post-retirement benefi ts are provided through contributory multi-employer defi ned benefi t pension plans sponsored by the province of Alberta, namely the Public Service Pension Plan (PSPP) and the Management Employees Pension Plan (MEPP). Under defi ned benefi t plan accounting, WCB must recognize its proportionate share, determined on an actuarial basis, of plan assets, obligations, remeasurementamounts, and service cost prorated on total contributory payroll.
Both plans have funding defi ciencies that have statutory funding requirements by employers and employeesto eliminate any plan defi ciencies over a specifi c time horizon. The information in this note refl ects an annual actuarial valuation of WCB’s share of the plans’ assets, benefi t obligations, remeasurement amounts, and service cost.
Supplemental executive retirement plan
WCB sponsors a non-contributory supplemental executive retirement plan (SERP), with the WCB AccidentFund covering the obligations of the plan. Earnings of senior management generally exceed the thresholdearnings for the maximum pension benefi t permitted under the federal Income Tax Act. Under the terms of the SERP, senior management is entitled to receive supplemental retirement payments that bring their total pension benefi ts to a level consistent with their total earnings. Future pension benefi ts are based on the participants’ years of service and earnings.
See Note 17 Related Party Transactions for a breakdown of SERP costs by executive position.
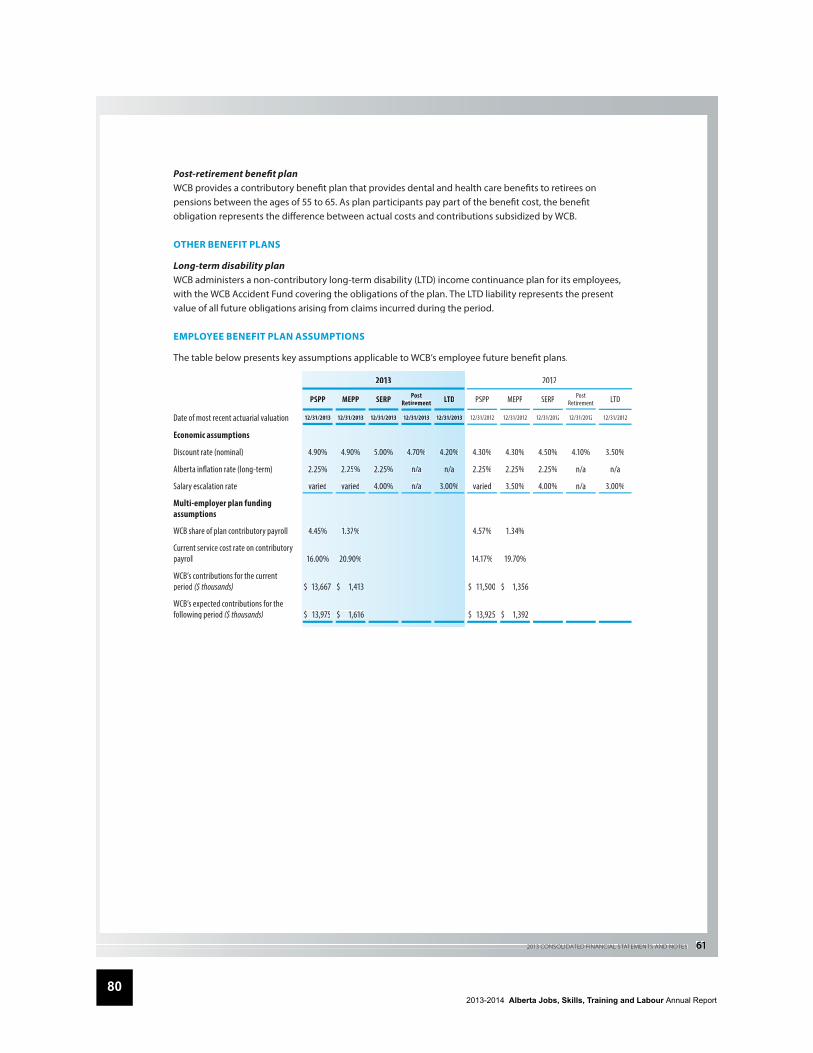
2013-2014 Alberta Jobs, Skills, Training and Labour Annual Report80
2013 CONSOLIDATED FINANCIAL STATEMENTS AND NOTES 61
Post-retirement benefi t planWCB provides a contributory benefi t plan that provides dental and health care benefi ts to retirees onpensions between the ages of 55 to 65. As plan participants pay part of the benefi t cost, the benefi t obligation represents the diff erence between actual costs and contributions subsidized by WCB.
OTHER BENEFIT PLANS
Long-term disability planWCB administers a non-contributory long-term disability (LTD) income continuance plan for its employees, with the WCB Accident Fund covering the obligations of the plan. The LTD liability represents the presentvalue of all future obligations arising from claims incurred during the period.
EMPLOYEE BENEFIT PLAN ASSUMPTIONS
The table below presents key assumptions applicable to WCB’s employee future benefi t plans.
2013 2012
PSPP MEPPP SERP PoostRetireement LTD PSPP MEPP SERP Post
Retirement LTD
Date of most recent actuarial valuation 12/31/2013 12/31/22013 12/31/2013 12/31//2013 12/31/2013 12/31/2012 12/31/2012 12/31/2012 12/31/2012 12/31/2012
Economic assumptions
Discount rate (nominal) 4.90% 4.900% 5.00% 4.700% 4.20% 4.30% 4.30% 4.50% 4.10% 3.50%
Alberta infl ation rate (long-term) 2.25% 2.25% 2.25% n//a n/a 2.25% 2.25% 2.25% n/a n/a
Salary escalation rate varied varieed 4.00% n//a 3.00% varied 3.50% 4.00% n/a 3.00%
Multi-employer plan funding assumptions
WCB share of plan contributory payroll 4.45% 1.37% 4.57% 1.34%
Current service cost rate on contributorypayroll 16.00% 20.900% 14.17% 19.70%
WCB’s contributions for the current period ($ thousands) $ 13,667 $ 1,4413 $ 11,500 $ 1,356
WCB’s expected contributions for thefollowing period ($ thousands) $ 13,975 $ 1,6616 $ 13,925 $ 1,392
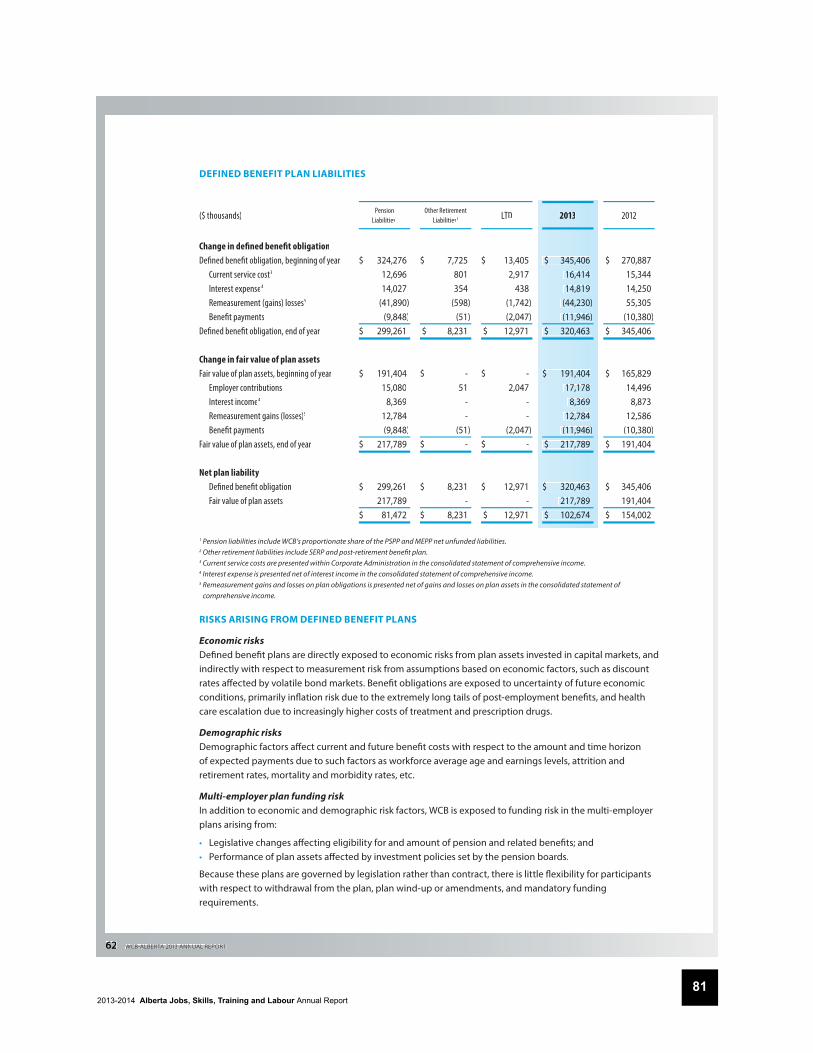
2013-2014 Alberta Jobs, Skills, Training and Labour Annual Report81
62 WCBALBERTA 2013 ANNUAL REPORT
DEFINED BENEFIT PLAN LIABILITIES
($ thousands) PensionLiabilities1
Other RetirementLiabilities2 LTD 2013 2012
Change in defi ned benefi t obligationDefi ned benefi t obligation, beginning of year Current service cost3
Interest expense4
Remeasurement (gains) losses5
Benefi t paymentsDefi ned benefi t obligation, end of year
Change in fair value of plan assets Fair value of plan assets, beginning of year Employer contributions Interest income4
Remeasurement gains (losses)5
Benefi t paymentsFair value of plan assets, end of year
Net plan liability Defi ned benefi t obligation Fair value of plan assets
$ 324,276 12,696 14,027
(41,890) (9,848)
$ 299,261
$ 191,404 15,080
8,369 12,784 (9,848)
$ 217,789
$ 299,261 217,789
$ 81,472
$ 7,725 801 354
(598) (51)
$ 8,231
$ - 51
- -
(51)$ -
$ 8,231 - $ 8,231
$ 13,405 2,917
438 (1,742) (2,047)
$ 12,971
$ - 2,047
- -
(2,047)$ -
$ 12,971 - $ 12,971
$ 345,406 16,414 14,819
(44,230) (11,946)
$ 320,463
$ 191,404 17,178
8,369 12,784
(11,946) $ 217,789
$ 320,463 217,789
$ 102,674
$ 270,887 15,344 14,250 55,305
(10,380) $ 345,406
$ 165,829 14,496
8,873 12,586
(10,380) $ 191,404
$ 345,406 191,404
$ 154,002
1 Pension liabilities include WCB’s proportionate share of the PSPP and MEPP net unfunded liabilities.2 Other retirement liabilities include SERP and post-retirement benefi t plan.3 Current service costs are presented within Corporate Administration in the consolidated statement of comprehensive income.4 Interest expense is presented net of interest income in the consolidated statement of comprehensive income.5 Remeasurement gains and losses on plan obligations is presented net of gains and losses on plan assets in the consolidated statement of
comprehensive income.
RISKS ARISING FROM DEFINED BENEFIT PLANS
Economic risksDefi ned benefi t plans are directly exposed to economic risks from plan assets invested in capital markets, and indirectly with respect to measurement risk from assumptions based on economic factors, such as discount rates aff ected by volatile bond markets. Benefi t obligations are exposed to uncertainty of future economic conditions, primarily infl ation risk due to the extremely long tails of post-employment benefi ts, and healthcare escalation due to increasingly higher costs of treatment and prescription drugs.
Demographic risksDemographic factors aff ect current and future benefi t costs with respect to the amount and time horizon of expected payments due to such factors as workforce average age and earnings levels, attrition andretirement rates, mortality and morbidity rates, etc.
Multi-employer plan funding riskIn addition to economic and demographic risk factors, WCB is exposed to funding risk in the multi-employer plans arising from:
• Legislative changes aff ecting eligibility for and amount of pension and related benefi ts; and• Performance of plan assets aff ected by investment policies set by the pension boards.
Because these plans are governed by legislation rather than contract, there is little fl exibility for participants with respect to withdrawal from the plan, plan wind-up or amendments, and mandatory funding requirements.
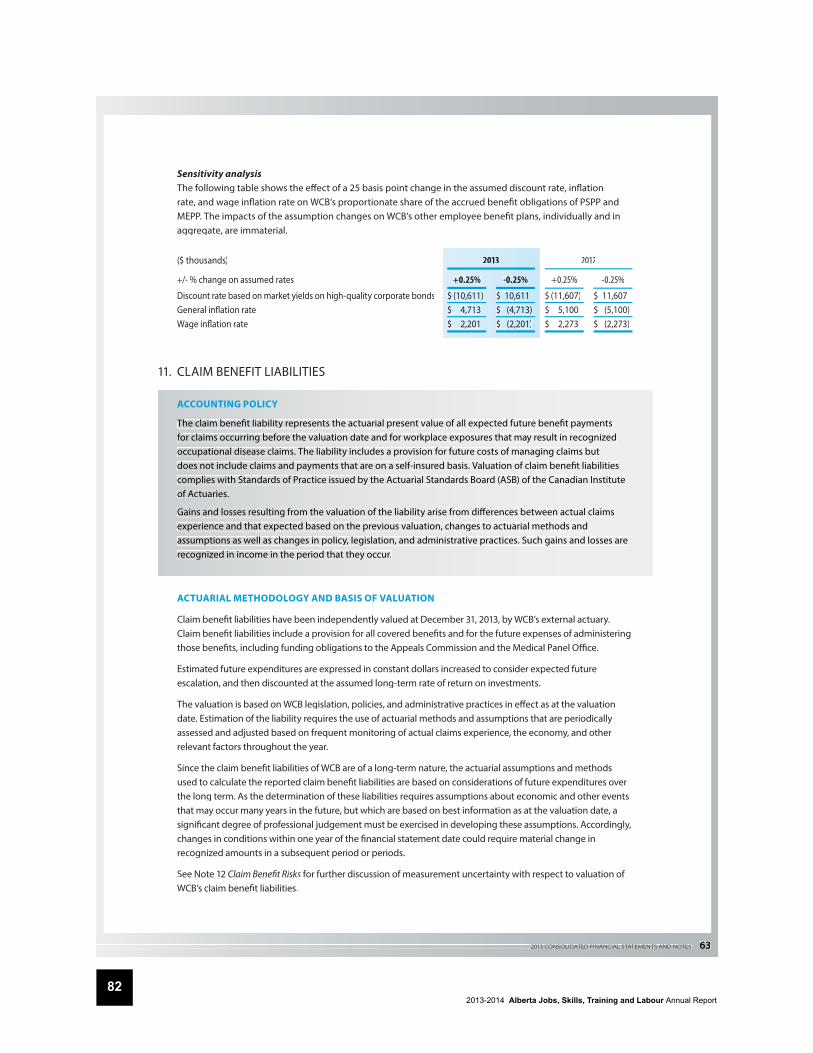
2013-2014 Alberta Jobs, Skills, Training and Labour Annual Report82
2013 CONSOLIDATED FINANCIAL STATEMENTS AND NOTES 63
Sensitivity analysisThe following table shows the eff ect of a 25 basis point change in the assumed discount rate, infl ation rate, and wage infl ation rate on WCB’s proportionate share of the accrued benefi t obligations of PSPP and MEPP. The impacts of the assumption changes on WCB’s other employee benefi t plans, individually and in aggregate, are immaterial.
($ thousands) 2013 2012
+/- % change on assumed rates +0.25% -0.25% +0.25% -0.25%
Discount rate based on market yields on high-quality corporate bondsGeneral infl ation rateWage infl ation rate
$ (10,611)$ 4,713 $ 2,201
$ 10,611$ (4,713)$ (2,201)
$ (11,607)$ 5,100 $ 2,273
$ 11,607$ (5,100)$ (2,273)
11. CLAIM BENEFIT LIABILITIES
ACCOUNTING POLICY
The claim benefi t liability represents the actuarial present value of all expected future benefi t payments for claims occurring before the valuation date and for workplace exposures that may result in recognized occupational disease claims. The liability includes a provision for future costs of managing claims but does not include claims and payments that are on a self-insured basis. Valuation of claim benefi t liabilities complies with Standards of Practice issued by the Actuarial Standards Board (ASB) of the Canadian Institute of Actuaries.
Gains and losses resulting from the valuation of the liability arise from diff erences between actual claims experience and that expected based on the previous valuation, changes to actuarial methods andassumptions as well as changes in policy, legislation, and administrative practices. Such gains and losses are recognized in income in the period that they occur.
ACTUARIAL METHODOLOGY AND BASIS OF VALUATION
Claim benefi t liabilities have been independently valued at December 31, 2013, by WCB’s external actuary. Claim benefi t liabilities include a provision for all covered benefi ts and for the future expenses of administering those benefi ts, including funding obligations to the Appeals Commission and the Medical Panel Offi ce.
Estimated future expenditures are expressed in constant dollars increased to consider expected futureescalation, and then discounted at the assumed long-term rate of return on investments.
The valuation is based on WCB legislation, policies, and administrative practices in eff ect as at the valuation date. Estimation of the liability requires the use of actuarial methods and assumptions that are periodically assessed and adjusted based on frequent monitoring of actual claims experience, the economy, and otherrelevant factors throughout the year.
Since the claim benefi t liabilities of WCB are of a long-term nature, the actuarial assumptions and methods used to calculate the reported claim benefi t liabilities are based on considerations of future expenditures overthe long term. As the determination of these liabilities requires assumptions about economic and other events that may occur many years in the future, but which are based on best information as at the valuation date, a signifi cant degree of professional judgement must be exercised in developing these assumptions. Accordingly, changes in conditions within one year of the fi nancial statement date could require material change inrecognized amounts in a subsequent period or periods.
See Note 12 Claim Benefi t Risks for further discussion of measurement uncertainty with respect to valuation of WCB’s claim benefi t liabilities.
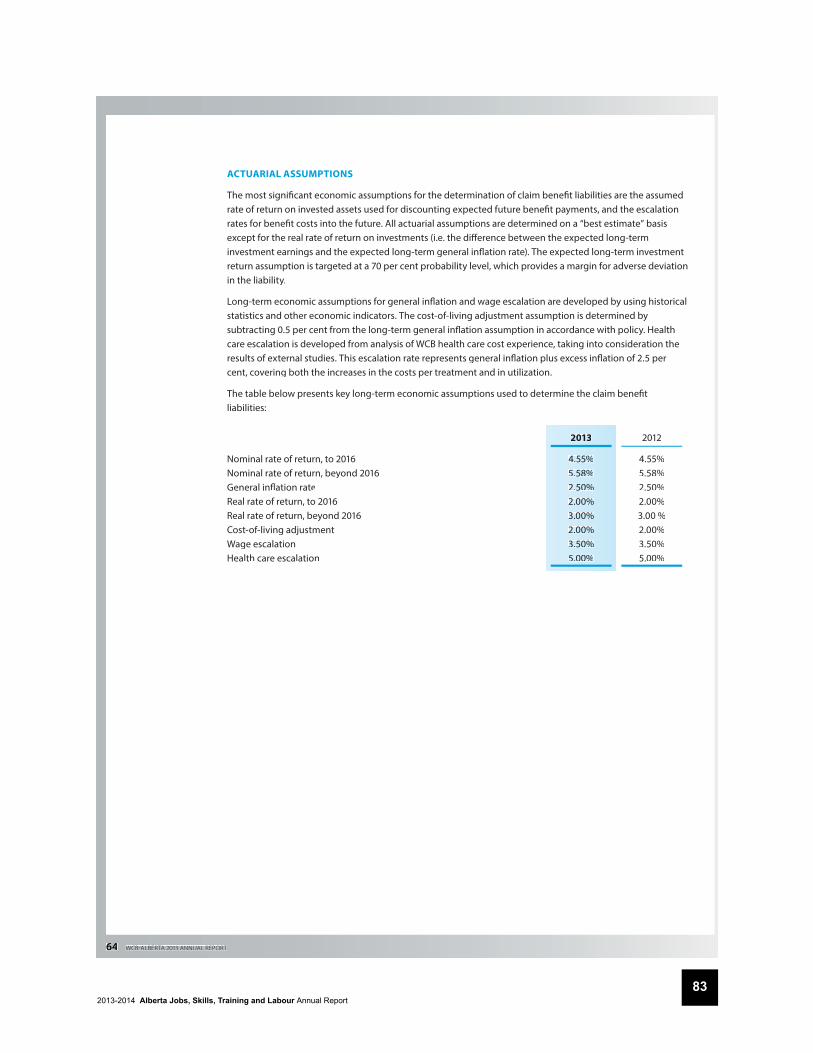
2013-2014 Alberta Jobs, Skills, Training and Labour Annual Report83
64 WCBALBERTA 2013 ANNUAL REPORT
ACTUARIAL ASSUMPTIONS
The most signifi cant economic assumptions for the determination of claim benefi t liabilities are the assumedrate of return on invested assets used for discounting expected future benefi t payments, and the escalationrates for benefi t costs into the future. All actuarial assumptions are determined on a “best estimate” basisexcept for the real rate of return on investments (i.e. the diff erence between the expected long-term investment earnings and the expected long-term general infl ation rate). The expected long-term investment return assumption is targeted at a 70 per cent probability level, which provides a margin for adverse deviation in the liability.
Long-term economic assumptions for general infl ation and wage escalation are developed by using historicalstatistics and other economic indicators. The cost-of-living adjustment assumption is determined by subtracting 0.5 per cent from the long-term general infl ation assumption in accordance with policy. Health care escalation is developed from analysis of WCB health care cost experience, taking into consideration the results of external studies. This escalation rate represents general infl ation plus excess infl ation of 2.5 percent, covering both the increases in the costs per treatment and in utilization.
The table below presents key long-term economic assumptions used to determine the claim benefi t liabilities:
2013 2012
Nominal rate of return, to 2016Nominal rate of return, beyond 2016General infl ation rateReal rate of return, to 2016Real rate of return, beyond 2016Cost-of-living adjustmentWage escalationHealth care escalation
44.55%5.58%22.50%22.00%33.00%22.00%33.50%5.00%
4.55%5.58%2.50%2.00%3.00 %2.00%3.50%5.00%
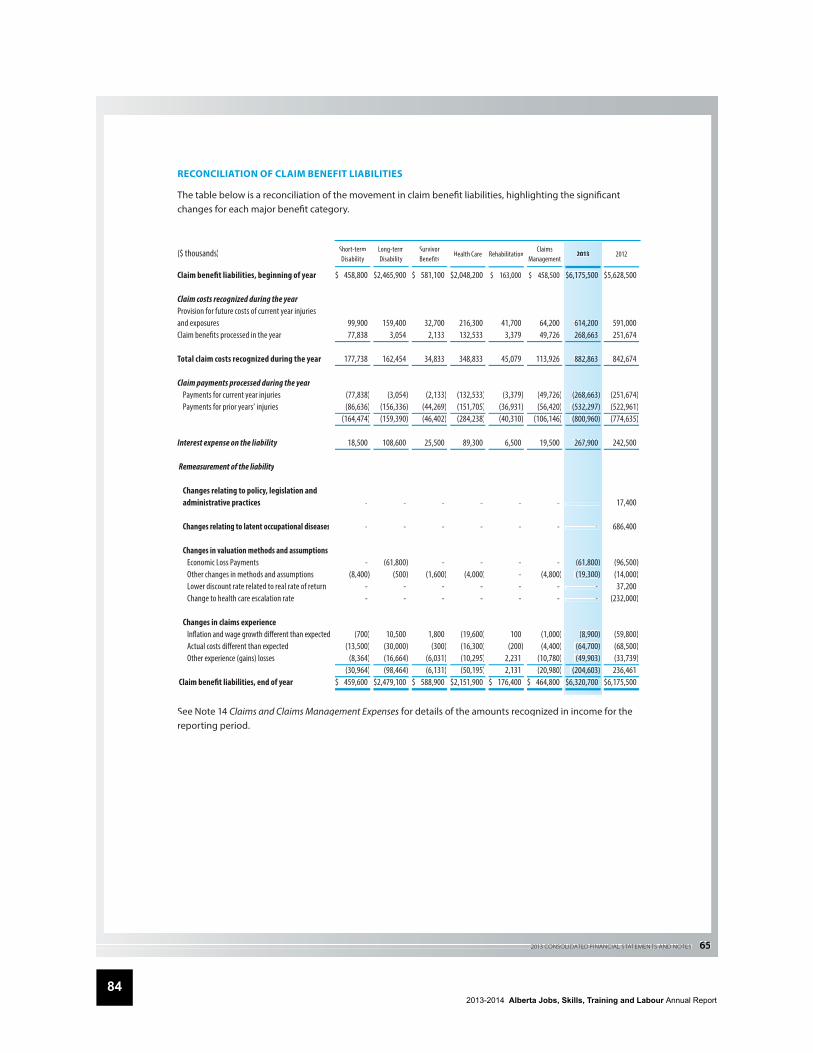
2013-2014 Alberta Jobs, Skills, Training and Labour Annual Report84
2013 CONSOLIDATED FINANCIAL STATEMENTS AND NOTES 65
RECONCILIATION OF CLAIM BENEFIT LIABILITIES
The table below is a reconciliation of the movement in claim benefi t liabilities, highlighting the signifi cant changes for each major benefi t category.
($ thousands) Short-termDisability
Long-termDisability
SurvivorBenefi ts
Health Care RehabilitationClaims
Management2013 2012
Claim benefi t liabilities, beginning of year
Claim costs recognized during the yearProvision for future costs of current year injuries and exposures Claim benefi ts processed in the year
Total claim costs recognized during the year
Claim payments processed during the year Payments for current year injuries Payments for prior years’ injuries
Interest expense on the liability
Remeasurement of the liability
Changes relating to policy, legislation and administrative practices
Changes relating to latent occupational diseases
Changes in valuation methods and assumptions Economic Loss Payments Other changes in methods and assumptions Lower discount rate related to real rate of return Change to health care escalation rate
Changes in claims experience Infl ation and wage growth diff erent than expected Actual costs diff erent than expected Other experience (gains) losses
Claim benefi t liabilities, end of year
$ 458,800
99,900 77,838
177,738
(77,838) (86,636)
(164,474)
18,500
-
-
- (8,400) - -
(700) (13,500)
(8,364) (30,964)
$ 459,600
$ 2,465,900
159,400 3,054
162,454
(3,054) (156,336) (159,390)
108,600
-
-
(61,800) (500)
- -
10,500 (30,000) (16,664) (98,464)
$ 2,479,100
$ 581,100
32,700 2,133
34,833
(2,133) (44,269) (46,402)
25,500
-
-
- (1,600)
- -
1,800 (300)
(6,031) (6,131)
$ 588,900
$ 2,048,200
216,300 132,533
348,833
(132,533) (151,705) (284,238)
89,300
-
-
- (4,000)
- -
(19,600) (16,300) (10,295) (50,195)
$ 2,151,900
$ 163,000
41,700 3,379
45,079
(3,379) (36,931) (40,310)
6,500
-
-
- - - -
100 (200)
2,231 2,131
$ 176,400
$ 458,500
64,200 49,726
113,926
(49,726) (56,420)
(106,146)
19,500
-
-
- (4,800)
- -
(1,000) (4,400)
(10,780) (20,980)
$ 464,800
$ 66,175,5000
614,2000 268,6633
882,8633
(268,6633) (532,2977) (800,9600)
267,9000
-
-
(61,8000) (19,3000)
- -
(8,9000) (64,7000) (49,9033)
(204,6033)$ 66,320,7000
$ 5,628,500
591,000 251,674
842,674
(251,674) (522,961) (774,635)
242,500
17,400
686,400
(96,500) (14,000) 37,200
(232,000)
(59,800) (68,500) (33,739) 236,461
$ 6,175,500
See Note 14 Claims and Claims Management Expenses for details of the amounts recognized in income for the reporting period.
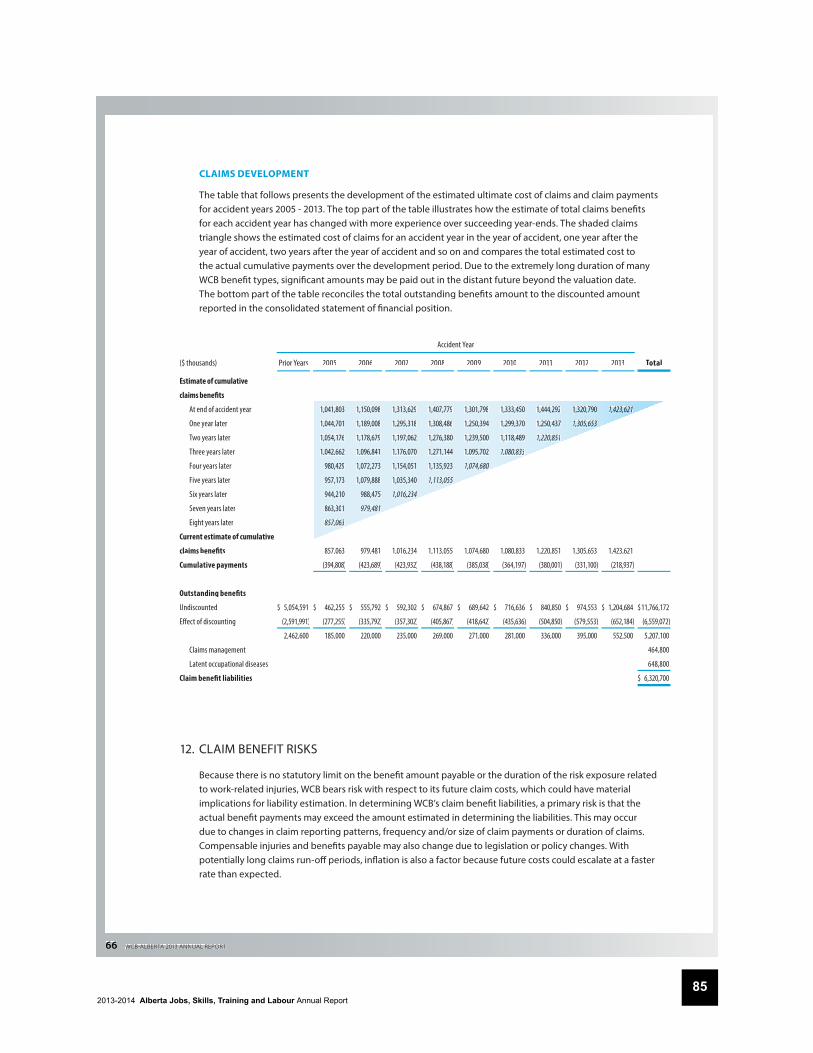
2013-2014 Alberta Jobs, Skills, Training and Labour Annual Report85
66 WCBALBERTA 2013 ANNUAL REPORT
CLAIMS DEVELOPMENT
The table that follows presents the development of the estimated ultimate cost of claims and claim payments for accident years 2005 - 2013. The top part of the table illustrates how the estimate of total claims benefi tsfor each accident year has changed with more experience over succeeding year-ends. The shaded claims triangle shows the estimated cost of claims for an accident year in the year of accident, one year after theyear of accident, two years after the year of accident and so on and compares the total estimated cost tothe actual cumulative payments over the development period. Due to the extremely long duration of many WCB benefi t types, signifi cant amounts may be paid out in the distant future beyond the valuation date. The bottom part of the table reconciles the total outstanding benefi ts amount to the discounted amountreported in the consolidated statement of fi nancial position.
Accident Year
($ thousands) Prior Years 2005 2006 2007 2008 2009 2010 2011 2012 2013 Total
Estimate of cumulative
claims benefi ts
At end of accident year
One year later
Two years later
Three years later
Four years later
Five years later
Six years later
Seven years later
Eight years later
Current estimate of cumulative
claims benefi ts
Cumulative payments
Outstanding benefi ts
Undiscounted
Eff ect of discounting
Claims management
Latent occupational diseases
Claim benefi t liabilities
$ 5,054,591
(2,591,991)
2,462,600
1,041,803
1,044,701
1,054,176
1,042,662
980,429
957,173
944,210
863,301
857,063
857,063
(394,808)
$ 462,255
(277,255)
185,000
1,150,098
1,189,008
1,178,679
1,096,841
1,072,273
1,079,888
988,475
979,481
979,481
(423,689)
$ 555,792
(335,792)
220,000
1,313,629
1,295,318
1,197,062
1,176,070
1,154,051
1,035,340
1,016,234
1,016,234
(423,932)
$ 592,302
(357,302)
235,000
1,407,779
1,308,486
1,276,380
1,271,144
1,135,923
1,113,055
1,113,055
(438,188)
$ 674,867
(405,867)
269,000
1,301,798
1,250,394
1,239,500
1,095,702
1,074,680
1,074,680
(385,038)
$ 689,642
(418,642)
271,000
1,333,450
1,299,370
1,118,489
1,080,833
1,080,833
(364,197)
$ 716,636
(435,636)
281,000
1,444,292
1,250,437
1,220,851
1,220,851
(380,001)
$ 840,850
(504,850)
336,000
1,320,7900
1,305,6533
1,305,653
(331,100)
$ 974,553
(579,553)
395,000
1,4223,621
1,423,621
(218,937)
$ 1,204,684
(652,184)
552,500
$ 11,766,172
(6,559,072)
5,207,100
464,800
648,800
$ 6,320,700
12. CLAIM BENEFIT RISKS
Because there is no statutory limit on the benefi t amount payable or the duration of the risk exposure related to work-related injuries, WCB bears risk with respect to its future claim costs, which could have material implications for liability estimation. In determining WCB’s claim benefi t liabilities, a primary risk is that the actual benefi t payments may exceed the amount estimated in determining the liabilities. This may occur due to changes in claim reporting patterns, frequency and/or size of claim payments or duration of claims. Compensable injuries and benefi ts payable may also change due to legislation or policy changes. Withpotentially long claims run-off periods, infl ation is also a factor because future costs could escalate at a fasterrate than expected.
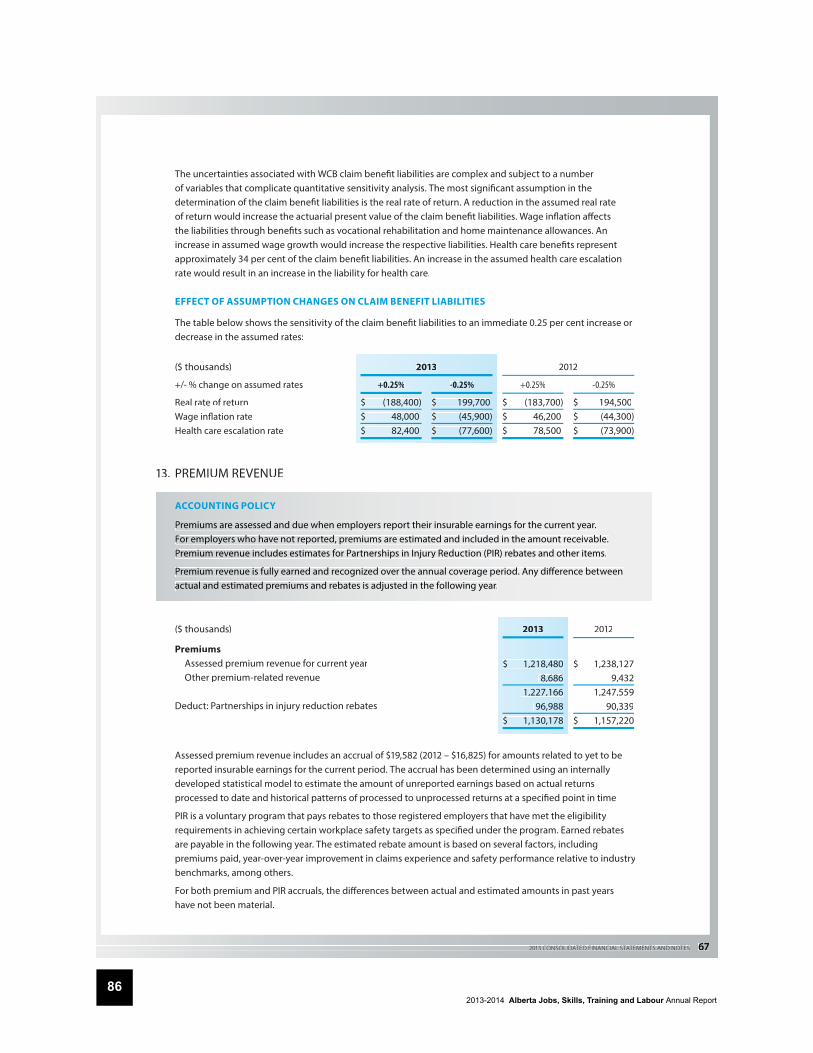
2013-2014 Alberta Jobs, Skills, Training and Labour Annual Report86
2013 CONSOLIDATED FINANCIAL STATEMENTS AND NOTES 67
The uncertainties associated with WCB claim benefi t liabilities are complex and subject to a number of variables that complicate quantitative sensitivity analysis. The most signifi cant assumption in the determination of the claim benefi t liabilities is the real rate of return. A reduction in the assumed real rate of return would increase the actuarial present value of the claim benefi t liabilities. Wage infl ation aff ectsthe liabilities through benefi ts such as vocational rehabilitation and home maintenance allowances. An increase in assumed wage growth would increase the respective liabilities. Health care benefi ts represent approximately 34 per cent of the claim benefi t liabilities. An increase in the assumed health care escalation rate would result in an increase in the liability for health care.
EFFECT OF ASSUMPTION CHANGES ON CLAIM BENEFIT LIABILITIES
The table below shows the sensitivity of the claim benefi t liabilities to an immediate 0.25 per cent increase or decrease in the assumed rates:
($ thousands) 20133 2012
+/- % change on assumed rates +0.25% -0.25% +0.25% -0.25%
Real rate of returnWage infl ation rateHealth care escalation rate
$ (188,400)$ 48,000$ 82,400
$$ 199,700$$ (45,900)$$ (77,600)
$ (183,700)$ 46,200$ 78,500
$ 194,500$ (44,300)$ (73,900)
13. PREMIUM REVENUE
ACCOUNTING POLICY
Premiums are assessed and due when employers report their insurable earnings for the current year. For employers who have not reported, premiums are estimated and included in the amount receivable. Premium revenue includes estimates for Partnerships in Injury Reduction (PIR) rebates and other items.
Premium revenue is fully earned and recognized over the annual coverage period. Any diff erence between actual and estimated premiums and rebates is adjusted in the following year.
($ thousands) 2013 2012
Premiums Assessed premium revenue for current year Other premium-related revenue
Deduct: Partnerships in injury reduction rebates
$ 1,218,480 8,686
1,227,166 96,988
$ 1,130,178
$ 1,238,127 9,432
1,247,559 90,339
$ 1,157,220
Assessed premium revenue includes an accrual of $19,582 (2012 – $16,825) for amounts related to yet to be reported insurable earnings for the current period. The accrual has been determined using an internally developed statistical model to estimate the amount of unreported earnings based on actual returns processed to date and historical patterns of processed to unprocessed returns at a specifi ed point in time
PIR is a voluntary program that pays rebates to those registered employers that have met the eligibility requirements in achieving certain workplace safety targets as specifi ed under the program. Earned rebates are payable in the following year. The estimated rebate amount is based on several factors, including premiums paid, year-over-year improvement in claims experience and safety performance relative to industry benchmarks, among others.
For both premium and PIR accruals, the diff erences between actual and estimated amounts in past years have not been material.
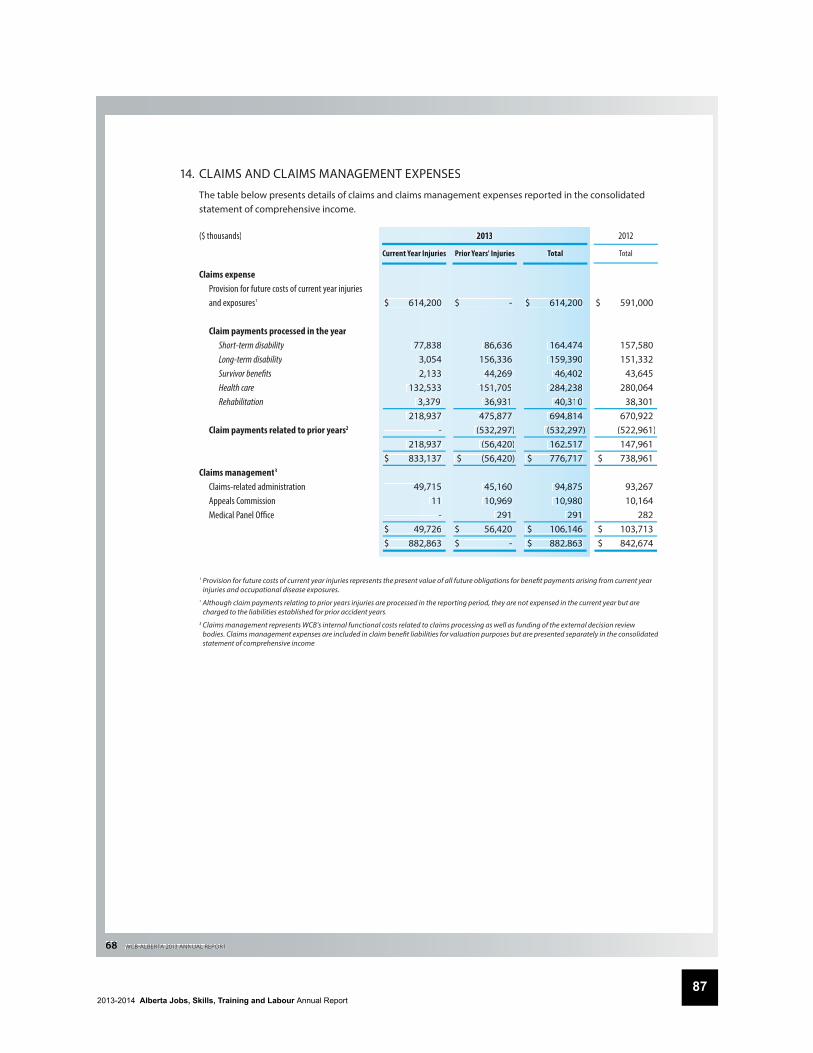
2013-2014 Alberta Jobs, Skills, Training and Labour Annual Report87
68 WCBALBERTA 2013 ANNUAL REPORT
14. CLAIMS AND CLAIMS MANAGEMENT EXPENSES
The table below presents details of claims and claims management expenses reported in the consolidated statement of comprehensive income.
($ thousands) 2013 2012
Current Year Injuries Prior Years' Injuries Total Total
Claims expense Provision for future costs of current year injuries and exposures1
Claim payments processed in the yearShort-term disability
Long-term disability Survivor benefi ts Health care Rehabilitation
Claim payments related to prior years2
Claims management3
Claims-related administration Appeals Commission Medical Panel Offi ce
$ 614,200
77,838 3,054 2,133
132,533 3,379
218,937 -
218,937 $ 833,137
49,715 11
- $ 49,726$ 882,863
$ -
86,636 156,336
44,269 151,705
36,931 475,877
(532,297) (56,420)
$ (56,420)
45,160 10,969
291 $ 56,420 $ -
$ 614,2200
164,4474 159,3390
46,4402 284,2238
40,3310 694,8814
(532,2297) 162,5517
$ 776,7717
94,8875 10,9980
2291 $ 106,1146 $ 882,8863
$ 591,000
157,580 151,332
43,645 280,064
38,301 670,922
(522,961) 147,961
$ 738,961
93,267 10,164
282 $ 103,713 $ 842,674
1 Provision for future costs of current year injuries represents the present value of all future obligations for benefi t payments arising from current year injuries and occupational disease exposures.
2 Although claim payments relating to prior years injuries are processed in the reporting period, they are not expensed in the current year but arecharged to the liabilities established for prior accident years.
3 Claims management represents WCB’s internal functional costs related to claims processing as well as funding of the external decision review bodies. Claims management expenses are included in claim benefi t liabilities for valuation purposes but are presented separately in the consolidated statement of comprehensive income.
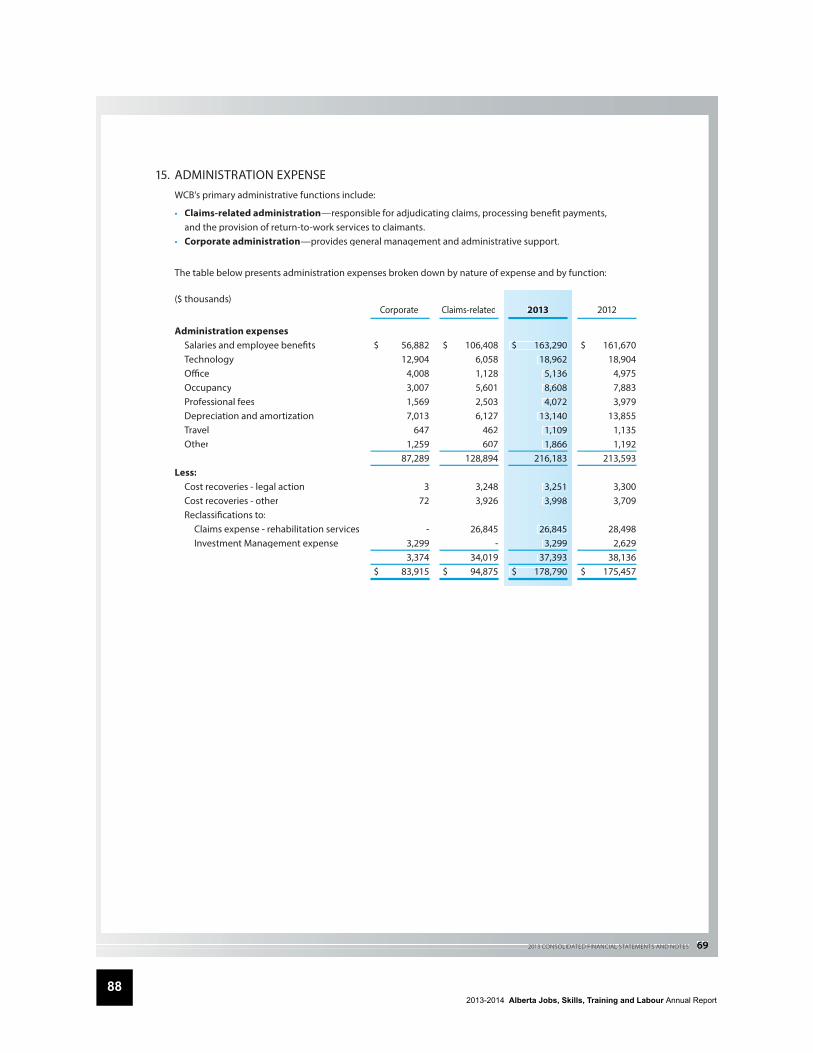
2013-2014 Alberta Jobs, Skills, Training and Labour Annual Report88
2013 CONSOLIDATED FINANCIAL STATEMENTS AND NOTES 69
15. ADMINISTRATION EXPENSEWCB’s primary administrative functions include:
• Claims-related administration—responsible for adjudicating claims, processing benefi t payments, and the provision of return-to-work services to claimants.
• Corporate administration—provides general management and administrative support.
The table below presents administration expenses broken down by nature of expense and by function:
($ thousands)Corporate Claims-related 2013 2012
Administration expenses Salaries and employee benefi ts Technology Offi ce Occupancy Professional fees Depreciation and amortization Travel Other
Less: Cost recoveries - legal action Cost recoveries - other Reclassifi cations to: Claims expense - rehabilitation services Investment Management expense
$ 56,882 12,904
4,008 3,007 1,569 7,013
647 1,259
87,289
3 72
- 3,299 3,374
$ 83,915
$ 106,408 6,058 1,128 5,601 2,503 6,127
462 607
128,894
3,248 3,926
26,845 -
34,019 $ 94,875
$ 163,290 18,962
5,136 8,608 4,072
13,140 1,109 1,866
216,183
3,251 3,998
26,845 3,299
37,393 $ 178,790
0 $ 161,6704 18,9045 4,9753 7,8839 3,9795 13,8555 1,1352 1,1923 213,593
0 3,3009 3,709
8 28,4989 2,6296 38,1367 $ 175,457

2013-2014 Alberta Jobs, Skills, Training and Labour Annual Report89
70 WCBALBERTA 2013 ANNUAL REPORT
16. INVESTMENT INCOME AND EXPENSE
ACCOUNTING POLICY
The primary components of investment income include:
(a) Gains and losses from investments classifi ed at fair value through income (including gains and losses from remeasurement and from disposition of assets) recognized in income in the period in which they arise;
(b) Interest revenue accrued using the eff ective interest method, net of amortization of any premium or discount recognized at date of purchase;
(c) Dividend income when a right to payment has been established based on the ex-dividend date for quoted securities; and
(d) Property income (operating income such as rentals and other business revenue) when a right todistributable income has been established.
Investment expense is composed primarily of investment management expenses, for both external andinternal portfolio managers. Fund management expenses of pooled investments, excluding investment management fees, are netted against the revenues of those respective funds.
INVESTMENT INCOME
($ thousands) . 2013 2012
Interest Dividends Gains (Losses) Property Derivatives Totall Total
Fixed income Bonds1
Mortgages Short-term investments
Equities Domestic equities Foreign equities
Infl ation-sensitive Real estate Infrastructure
$ 91,242 24,244
4,293 119,779
- - -
- - - $ 119,779
$ - - - -
34,762 46,347 81,109
- - - $ 81,109
$ (119,888) (9,663)
-(129,551)
88,947 618,836 707,783
86,358 118,108 204,466
$ 782,698
$ - - - -
- - -
26,359 22,299 48,658
$ 48,658
$ (26,320) - -
(26,320)
- (67,504) (67,504)
- (19,570) (19,570)
$ (113,394)
$$ (54,9966) 14,5581
4,2293 (36,0092)
123,7709 597,6679 721,3388
112,7717 120,8837 233,5554
$ 918,8850
$ 156,448 15,253
3,061 174,762
76,310 276,087 352,397
154,499 100,399 254,898
$ 782,057
1 Includes both nominal and real return bonds.
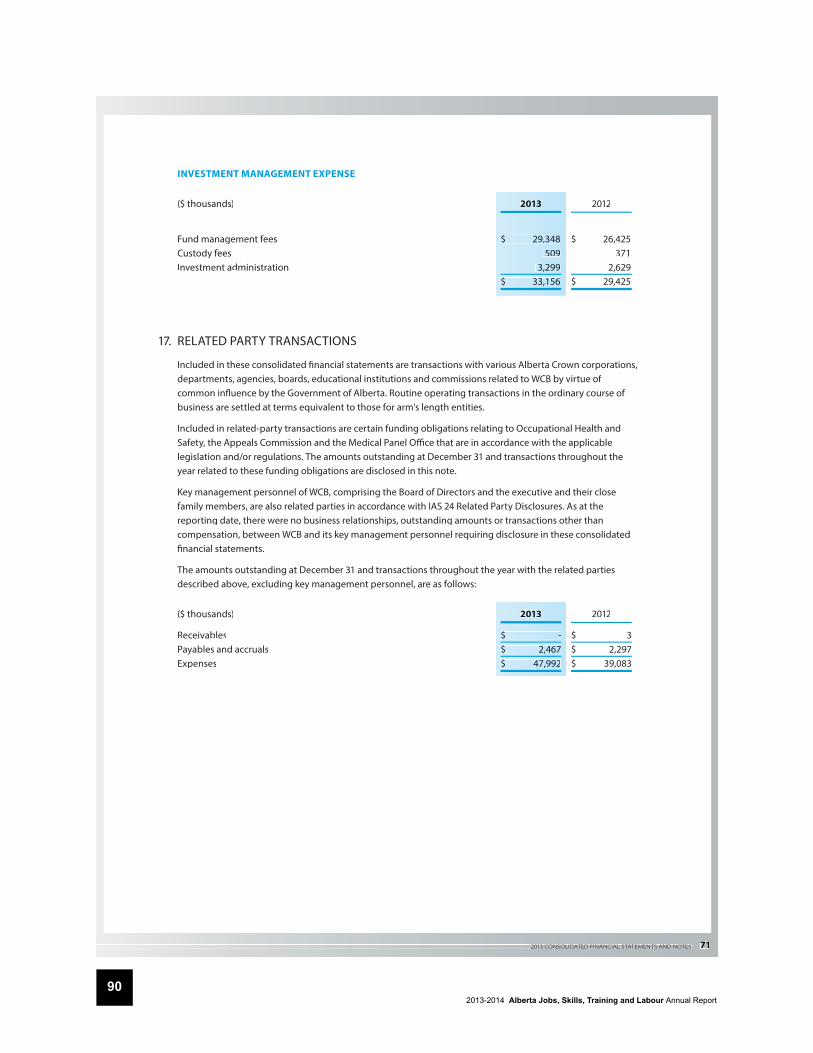
2013-2014 Alberta Jobs, Skills, Training and Labour Annual Report90
2013 CONSOLIDATED FINANCIAL STATEMENTS AND NOTES 71
INVESTMENT MANAGEMENT EXPENSE
($ thousands) 2013 2012
Fund management feesCustody feesInvestment administration
$ 29,348509
3,299 $ 33,156
$ 26,425 371
2,629$ 29,425
17. RELATED PARTY TRANSACTIONS
Included in these consolidated fi nancial statements are transactions with various Alberta Crown corporations, departments, agencies, boards, educational institutions and commissions related to WCB by virtue of common infl uence by the Government of Alberta. Routine operating transactions in the ordinary course of business are settled at terms equivalent to those for arm’s length entities.
Included in related-party transactions are certain funding obligations relating to Occupational Health andSafety, the Appeals Commission and the Medical Panel Offi ce that are in accordance with the applicable legislation and/or regulations. The amounts outstanding at December 31 and transactions throughout theyear related to these funding obligations are disclosed in this note.
Key management personnel of WCB, comprising the Board of Directors and the executive and their close family members, are also related parties in accordance with IAS 24 Related Party Disclosures. As at the reporting date, there were no business relationships, outstanding amounts or transactions other thancompensation, between WCB and its key management personnel requiring disclosure in these consolidatedfi nancial statements.
The amounts outstanding at December 31 and transactions throughout the year with the related partiesdescribed above, excluding key management personnel, are as follows:
($ thousands) 2013 2012
ReceivablesPayables and accrualsExpenses
$ -$ 2,,467$ 47,,992
$ 3$ 2,297$ 39,083
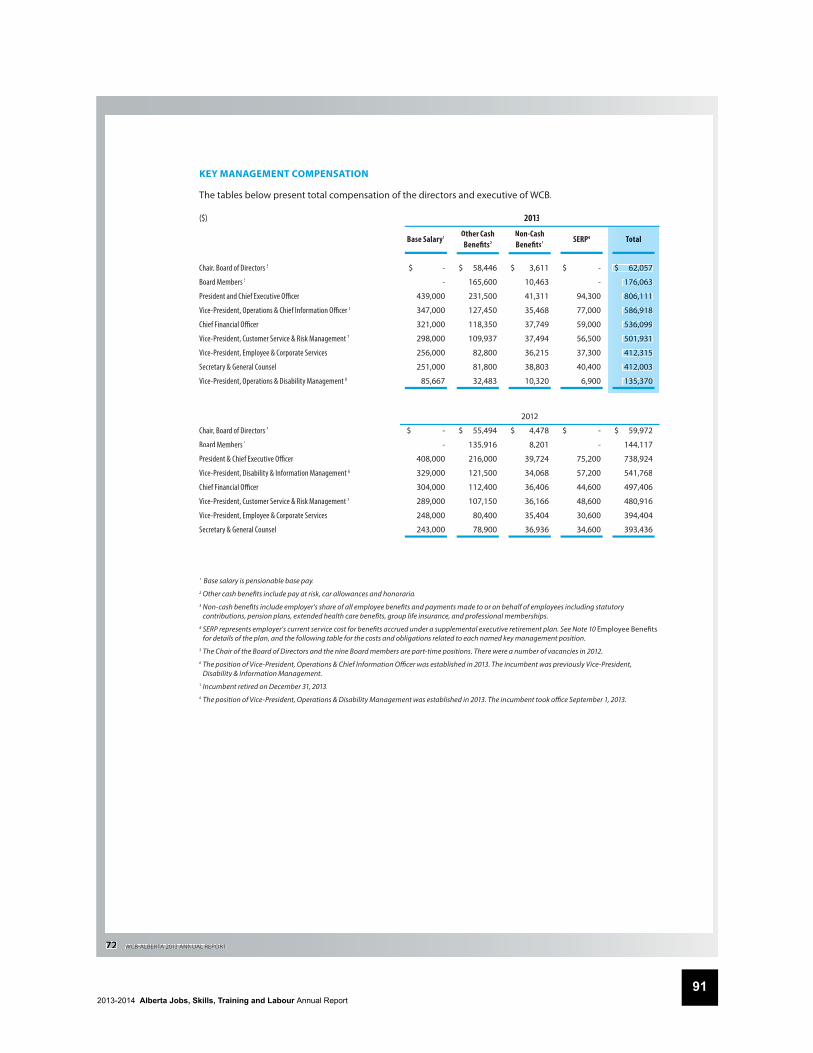
2013-2014 Alberta Jobs, Skills, Training and Labour Annual Report91
72 WCBALBERTA 2013 ANNUAL REPORT
KEY MANAGEMENT COMPENSATION
The tables below present total compensation of the directors and executive of WCB.
($) 2013
Base Salary1 Other Cash Benefi ts2
Non-Cash Benefi ts3 SERP4 Total
Chair, Board of Directors 5
Board Members 5
President and Chief Executive Offi cer
Vice-President, Operations & Chief Information Offi cer 6
Chief Financial Offi cer
Vice-President, Customer Service & Risk Management 7
Vice-President, Employee & Corporate Services
Secretary & General Counsel
Vice-President, Operations & Disability Management 8
$ -
-
439,000
347,000
321,000
298,000
256,000
251,000
85,667
$ 58,446
165,600
231,500
127,450
118,350
109,937
82,800
81,800
32,483
$ 3,611
10,463
41,311
35,468
37,749
37,494
36,215
38,803
10,320
$ -
-
94,300
77,000
59,000
56,500
37,300
40,400
6,900
$ 62,057
176,063
806,111
586,918
536,099
501,931
412,315
412,003
135,370
2012
Chair, Board of Directors 5
Board Members 5
President & Chief Executive Offi cer
Vice-President, Disability & Information Management 6
Chief Financial Offi cer
Vice-President, Customer Service & Risk Management 7
Vice-President, Employee & Corporate Services
Secretary & General Counsel
$ -
-
408,000
329,000
304,000
289,000
248,000
243,000
$ 55,494
135,916
216,000
121,500
112,400
107,150
80,400
78,900
$ 4,478
8,201
39,724
34,068
36,406
36,166
35,404
36,936
$ -
-
75,200
57,200
44,600
48,600
30,600
34,600
$ 59,972
144,117
738,924
541,768
497,406
480,916
394,404
393,436
1 Base salary is pensionable base pay.2 Other cash benefi ts include pay at risk, car allowances and honoraria.3 Non-cash benefi ts include employer's share of all employee benefi ts and payments made to or on behalf of employees including statutory
contributions, pension plans, extended health care benefi ts, group life insurance, and professional memberships.4 SERP represents employer's current service cost for benefi ts accrued under a supplemental executive retirement plan. See Note 10 Employee Benefi ts
for details of the plan, and the following table for the costs and obligations related to each named key management position.5 The Chair of the Board of Directors and the nine Board members are part-time positions. There were a number of vacancies in 2012.6 The position of Vice-President, Operations & Chief Information Offi cer was established in 2013. The incumbent was previously Vice-President,
Disability & Information Management.7 Incumbent retired on December 31, 2013.7
8 The position of Vice-President, Operations & Disability Management was established in 2013. The incumbent took offi ce September 1, 2013.
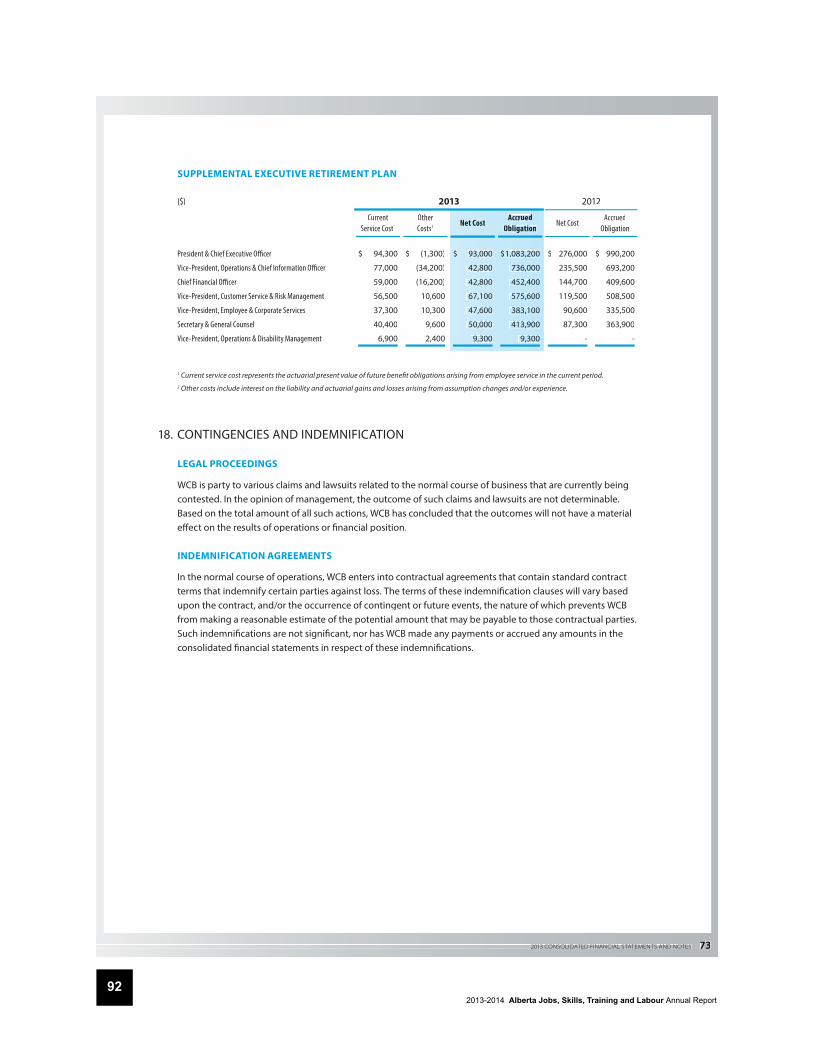
2013-2014 Alberta Jobs, Skills, Training and Labour Annual Report92
2013 CONSOLIDATED FINANCIAL STATEMENTS AND NOTES 73
SUPPLEMENTAL EXECUTIVE RETIREMENT PLAN
($) 2013 2012
CurrentService Cost1
Other Costs2 Net Cost
AccruedOObligation
Net CostAccrued
Obligation
President & Chief Executive Offi cer
Vice-President, Operations & Chief Information Offi cer
Chief Financial Offi cer
Vice-President, Customer Service & Risk Management
Vice-President, Employee & Corporate Services
Secretary & General Counsel
Vice-President, Operations & Disability Management
$ 94,300
77,000
59,000
56,500
37,300
40,400
6,900
$ (1,300)
(34,200)
(16,200)
10,600
10,300
9,600
2,400
$ 93,000
42,800
42,800
67,100
47,600
50,000
9,300
$11,083,200
736,000
452,400
575,600
383,100
413,900
9,300
$ 276,000
235,500
144,700
119,500
90,600
87,300
-
$ 990,200
693,200
409,600
508,500
335,500
363,900
-
1 Current service cost represents the actuarial present value of future benefi t obligations arising from employee service in the current period.2 Other costs include interest on the liability and actuarial gains and losses arising from assumption changes and/or experience.
18. CONTINGENCIES AND INDEMNIFICATION
LEGAL PROCEEDINGS
WCB is party to various claims and lawsuits related to the normal course of business that are currently being contested. In the opinion of management, the outcome of such claims and lawsuits are not determinable. Based on the total amount of all such actions, WCB has concluded that the outcomes will not have a materialeff ect on the results of operations or fi nancial position.
INDEMNIFICATION AGREEMENTS
In the normal course of operations, WCB enters into contractual agreements that contain standard contractterms that indemnify certain parties against loss. The terms of these indemnifi cation clauses will vary basedupon the contract, and/or the occurrence of contingent or future events, the nature of which prevents WCB from making a reasonable estimate of the potential amount that may be payable to those contractual parties. Such indemnifi cations are not signifi cant, nor has WCB made any payments or accrued any amounts in theconsolidated fi nancial statements in respect of these indemnifi cations.
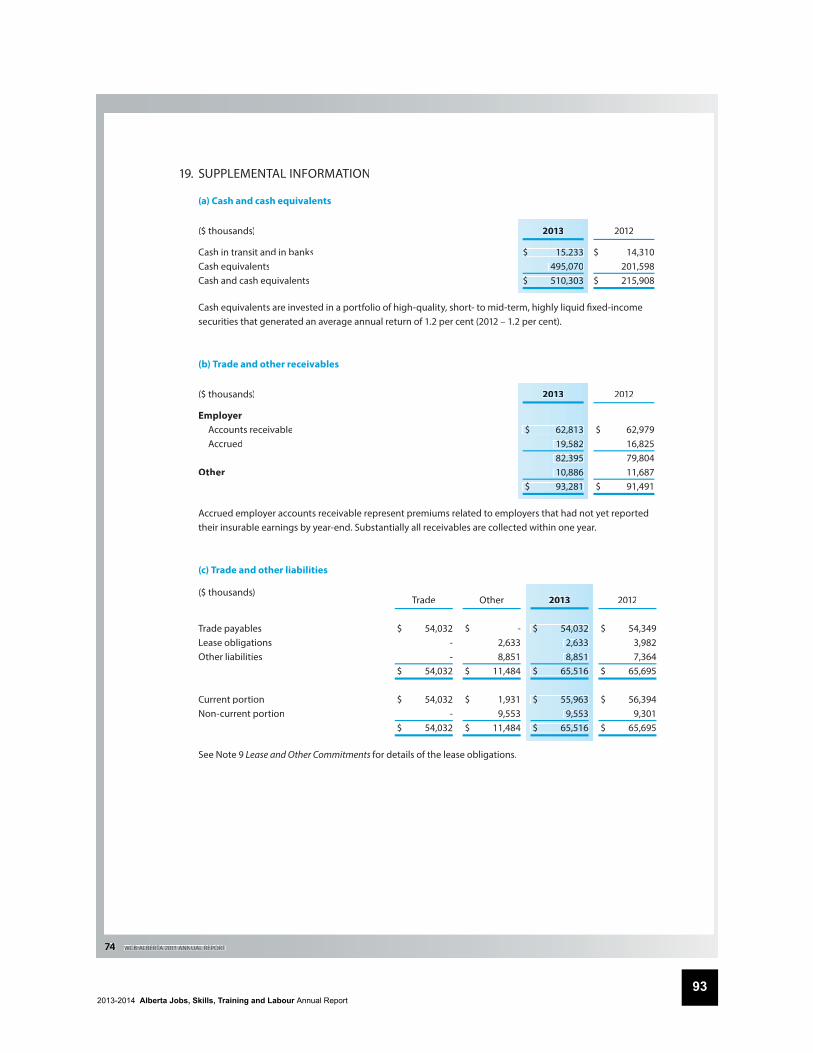
2013-2014 Alberta Jobs, Skills, Training and Labour Annual Report93
74 WCBALBERTA 2013 ANNUAL REPORT
19. SUPPLEMENTAL INFORMATION
(a) Cash and cash equivalents
($ thousands) 2013 2012
Cash in transit and in banksCash equivalentsCash and cash equivalents
$ 15,,233 495,,070
$ 510,,303
$ 14,310 201,598
$ 215,908
Cash equivalents are invested in a portfolio of high-quality, short- to mid-term, highly liquid fi xed-income securities that generated an average annual return of 1.2 per cent (2012 – 1.2 per cent).
(b) Trade and other receivables
($ thousands) 2013 2012
Employer Accounts receivable Accrued
Other
$ 62,,813 19,,582 82,,395 10,,886
$ 93,,281
$ 62,979 16,825 79,804 11,687
$ 91,491
Accrued employer accounts receivable represent premiums related to employers that had not yet reported their insurable earnings by year-end. Substantially all receivables are collected within one year.
(c) Trade and other liabilities
($ thousands)Trade Other 20133 2012
Trade payablesLease obligationsOther liabilities
Current portionNon-current portion
$ 54,032 - -
$ 54,032
$ 54,032 -
$ 54,032
$ - 2,633 8,851
$ 11,484
$ 1,931 9,553
$ 11,484
$ 544,03222,633 88,851
$ 655,516
$ 555,96399,553
$ 655,516
$ 54,3493,9827,364
$ 65,695
$ 56,3949,301
$ 65,695
See Note 9 Lease and Other Commitments for details of the lease obligations.
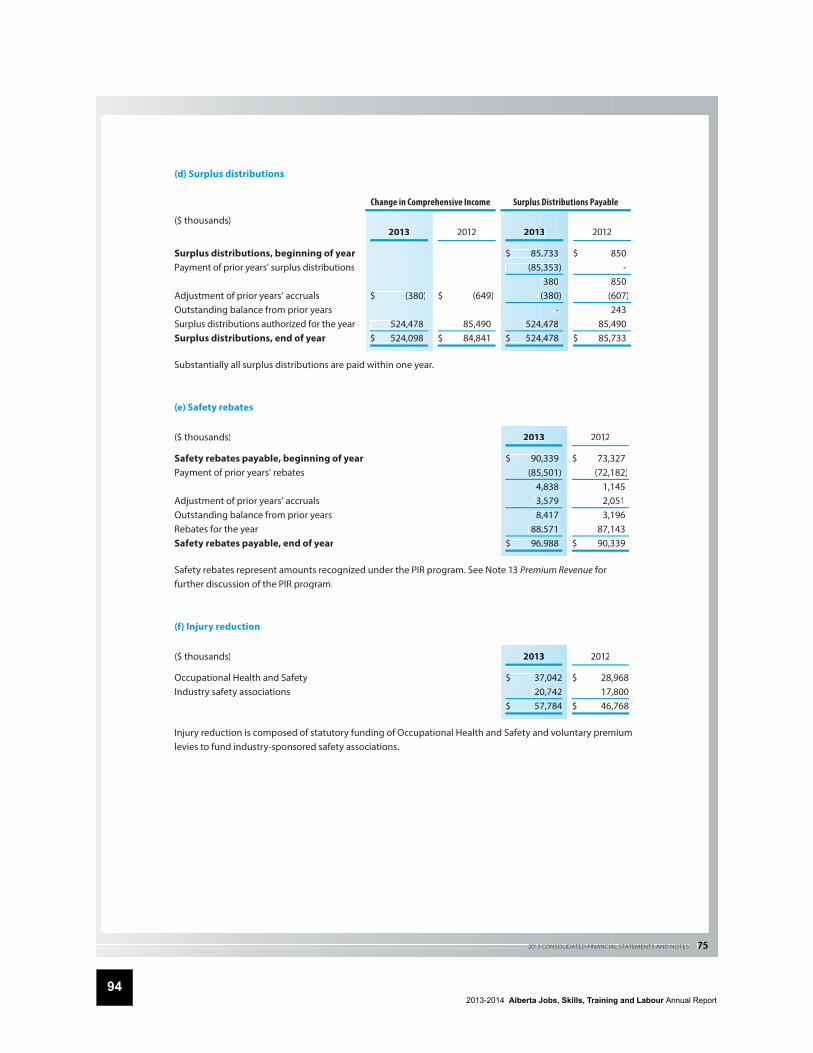
2013-2014 Alberta Jobs, Skills, Training and Labour Annual Report94
2013 CONSOLIDATED FINANCIAL STATEMENTS AND NOTES 75
(d) Surplus distributions
Change in Comprehensive Income Surplus Distributions Payable
($ thousands)2013 2012 20133 2012
Surplus distributions, beginning of yearPayment of prior years’ surplus distributions
Adjustment of prior years’ accrualsOutstanding balance from prior yearsSurplus distributions authorized for the yearSurplus distributions, end of year
$ (380)
524,478$ 524,098
$ (649)
85,490$ 84,841
$ 85,733 (85,3353)
3380 (3380)
- 524,4478
$ 524,4478
$ 850 -
850 (607) 243
85,490$ 85,733
Substantially all surplus distributions are paid within one year.
(e) Safety rebates
($ thousands) 20133 2012
Safety rebates payable, beginning of yearPayment of prior years’ rebates
Adjustment of prior years’ accrualsOutstanding balance from prior yearsRebates for the yearSafety rebates payable, end of year
$ 90,,339 (85,,501)
4,,838 3,,579 8,,417
88,,571$ 96,,988
$ 73,327 (72,182)
1,145 2,051 3,196
87,143$ 90,339
Safety rebates represent amounts recognized under the PIR program. See Note 13 Premium Revenue for further discussion of the PIR program.
(f) Injury reduction
($ thousands) 20133 2012
Occupational Health and SafetyIndustry safety associations
$ 377,042 200,742
$ 577,784
$ 28,968 17,800
$ 46,768
Injury reduction is composed of statutory funding of Occupational Health and Safety and voluntary premium levies to fund industry-sponsored safety associations.
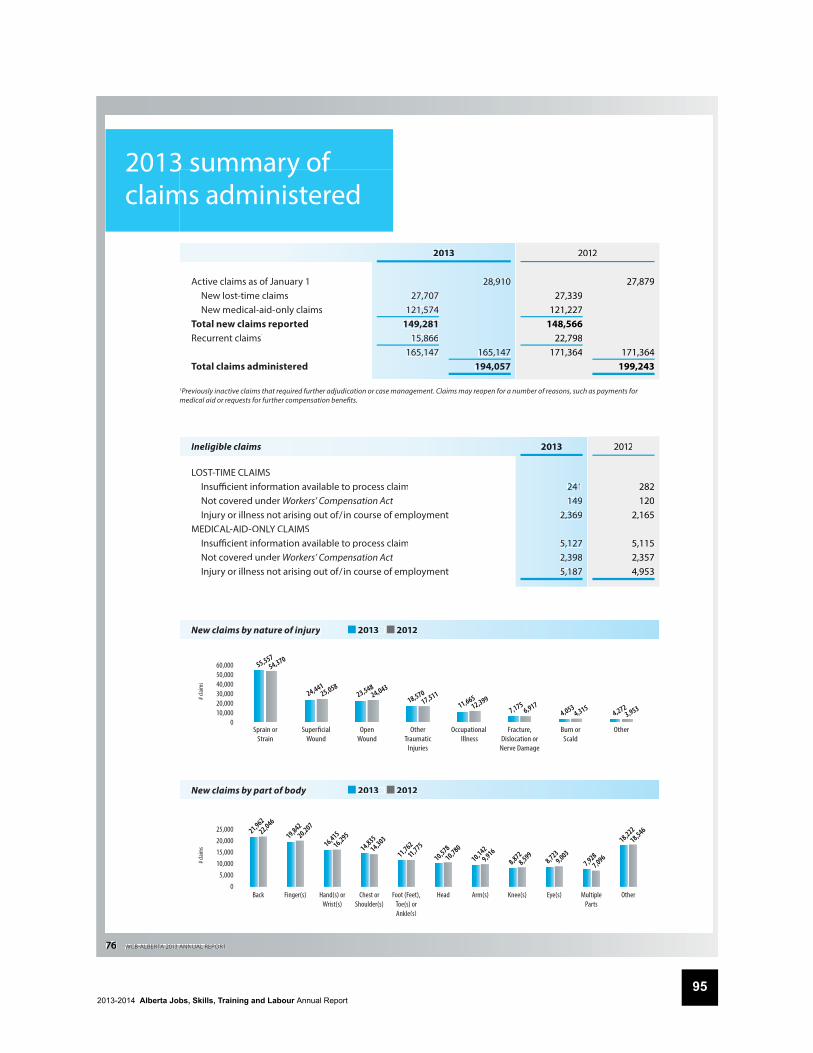
2013-2014 Alberta Jobs, Skills, Training and Labour Annual Report95
76 WCBALBERTA 2013 ANNUAL REPORT
20113 2012
Active claims as of January 1 New lost-time claims New medical-aid-only claimsTotal new claims reportedRecurrent claims1
Total claims administered
27,707121,574
149,28115,866
165,147
28,910
165,147194,057
27,339121,227
148,56622,798
171,364
27,879
171,364199,243
1Previously inactive claims that required further adjudication or case management. Claims may reopen for a number of reasons, such as payments for medical aid or requests for further compensation benefi ts.
Ineligible claims 2013 2012
LOST-TIME CLAIMS Insuffi cient information available to process claim Not covered under Workers’ Compensation Act Injury or illness not arising out of/ in course of employmentMEDICAL-AID-ONLY CLAIMS Insuffi cient information available to process claim Not covered under Workers’ Compensation Act Injury or illness not arising out of/ in course of employment
241149
2,369
5,1272,3985,187
282120
2,165
5,1152,3574,953
New claims by nature of injury 20013 2012
# clai
ms
010,00020,00030,00040,00050,00060,000
OtherBurn orScald
Fracture,Dislocation or
Nerve Damage
Occupational Illness
OtherTraumatic
Injuries
OpenWound
SuperficialWound
Sprain orStrain
55,55754,370
24,44125,058
23,54824,043
11,66512,39918,570
17,511
4,0534,315 7,175
6,9174,272
3,953
New claims by part of body 20013 2012
# clai
ms
0
5,000
10,000
15,000
20,000
25,000
OtherMultipleParts
Eye(s)Knee(s)Arm(s)HeadFoot (Feet),Toe(s) orAnkle(s)
Chest orShoulder(s)
Hand(s) orWrist(s)
Finger(s)Back
21,962
22,046
19,84220,207
18,222
18,546
16,415
16,295
14,835
14,303
7,928 9,003
10,57811,775
10,1429,91611,762
10,780
8,872
8,5998,723
7,096
2013 summary of claims administered
2013-2014 Alberta Jobs, Skills, Training and Labour Annual Report96
Other Information: Performance Measures, Sources and MethodologiesInter-provincial rank of Alberta’s First Nations, Métis and Inuit off-reserve labour force participation rate
Statistics Canada’s Labour Force Survey (LFS) is the primary source of statistics on employment and unemployment in Canada and the provinces. The LFS is conducted by Statistics Canada across the country. The Canadian sample size for the monthly Labour Force Survey was 56,027 households over the reporting period. Alberta’s sample size corresponds to its share of the national population. An average of 5,540 Alberta households were surveyed each month. The coefficient of variation (the standard error as a percentage of the reported result) is approximately 2.5 per cent for the 92,900 Albertans in the First Nations, Métis and Inuit labour force (off-reserve).
The LFS provides information on the work activities of the respondents during the week containing the 15th day of the month known as the reference week. The LFS includes a question that asks respondents if they identify themselves with at least one Aboriginal group, for example, North American Indian, Métis or Inuit. The First Nations, Métis and Inuit labour force (off-reserve) represents the number of people in the working age population that are either employed or actively seeking employment (unemployed). This is calculated as a 12-month average for the calendar year.
With this performance measure, the rate for Alberta is compared to the nine other Canadian provinces. The inter-provincial ranking is reported to assess how Alberta ranks when compared to the other provinces across Canada.
The target population covered by the survey corresponds to all persons aged 15 years and over residing in Canada, with the exception of the following: persons living on reserves and other Aboriginal settlements; full-time members of the Canadian Forces and the institutionalized population.
For more information on the methodology of the Labour Force Survey, please see Guide to the Labour Force Survey (2013), Statistics Canada: http://www.statcan.gc.ca/pub/71-543-g/71-543-g2013001-eng.htm
Lost-time Claim Rate: Number of lost-time claims per 100 person-years worked
The Lost-time Claim Rate represents the probability, or risk, of injury or disease to a worker during a period of one year’s work. The measure indicates the number of lost-time claims per 100 person-years worked to indicate increases or decreases in this risk. One person-year is equivalent to one full-time worker working for one year, or 2,000 hours worked.
The Workers’ Compensation Board – Alberta (WCB) records a lost-time claim when a worker, his/her physician, or his/her employer submits an injury report form. The WCB collects this information, calculates estimated person-years worked, and provides the data files to Jobs, Skills, Training and Labour for analysis. Prior to 2010-2011, the estimated person-years worked was calculated by Human Services rather than the WCB. Since 2010-2011, estimated person-years worked has been calculated by WCB and used in Jobs, Skills, Training and Labour’s calculations for current and historical results. The lost-time claim rate is reported by calendar year and is calculated by dividing the number of lost-time claims by the number of estimated person-years worked.
The previous four years of results were re-calculated with the updated data provided by the WCB. WCB sends Jobs, Skills, Training and Labour a new data file each year, which includes all of the most recent injury data. Re-calculating the historical results provides the reader with the most accurate and up-to-date injury information. There is no change in how the result is calculated.
2013-2014 Alberta Jobs, Skills, Training and Labour Annual Report97
Alberta’s labour force participation rate and interprovincial rank
Statistics Canada’s Labour Force Survey (LFS) is the primary source of statistics on employment and unemployment in Canada and the provinces. The LFS is conducted by Statistics Canada across the country. The Canadian sample size for the monthly Labour Force Survey was 56,027 households over the reporting period. Alberta’s sample size corresponds to its share of the national population. An average of 5,540 Alberta households were surveyed each month. The coefficient of variation (the standard error as a percentage of the reported result) for the estimated 2,318,200 Albertans in the labour force is 1.0 per cent.
The LFS provides information on the work activities of survey respondents during the week containing the 15th day of the month known as the reference week. The target population covered by the survey corresponds to all persons aged 15 years and over residing in Canada, with the exception of the following: persons living on reserves and other Aboriginal settlements, full-time members of the Canadian Forces, and the institutionalized population. The labour force is the sum of the number of persons employed and the number of persons actively seeking employment (unemployed). This is calculated as a 12-month average for the calendar year.
The participation rate represents the percentage of the working age population that is either employed or actively seeking employment (unemployed). With this performance measure, the rate for Alberta is compared to the nine other Canadian provinces. The inter-provincial ranking is reported to assess how Alberta ranks when compared to the other provinces across Canada.
For more information on the methodology of the Labour Force Survey, please see Guide to the Labour Force Survey (2013), Statistics Canada: http://www.statcan.gc.ca/pub/71-543-g/71-543-g2013001-eng.htm
Alberta’s immigrant labour force participation rate
Statistics Canada’s Labour Force Survey (LFS) is the primary source of statistics on employment and unemployment in Canada and the provinces. The LFS is conducted by Statistics Canada across the country. The Canadian sample size for the monthly Labour Force Survey was 56,027 households over the reporting period. Alberta’s sample size corresponds to its share of the national population. An average of 5,540 Alberta households were surveyed each month. The coefficient of variation (the standard error as a percentage of the reported result) for the estimated 2,318,200 Albertans in the labour force is 1.0 per cent.
The LFS provides information on the work activities of survey respondents during the week containing the 15th day of the month known as the reference week. The target population covered by the survey corresponds to all persons aged 15 years and over residing in Canada, with the exception of the following: persons living on reserves and other Aboriginal settlements, full-time members of the Canadian Forces, and the institutionalized population. The labour force is the sum of the number of persons employed and the number of persons actively seeking employment (unemployed). This is calculated as a 12-month average for the calendar year.
The participation rate represents the percentage of the working age population that is either employed or actively seeking employment (unemployed). This performance measure looks particularly at those who identify themselves as a landed immigrant. A landed immigrant is a person who has been granted the right to live in Canada permanently by immigration authorities. Canadian citizens by birth and non-permanent residents (persons from another country who live in Canada and have a work or study permit, or are claiming refugee status, as well as family members living here with them) are not landed immigrants.
For more information on the methodology of the Labour Force Survey, please see Guide to the Labour Force Survey (2013), Statistics Canada: http://www.statcan.gc.ca/pub/71-543-g/71-543-g2013001-eng.htm
2013-2014 Alberta Jobs, Skills, Training and Labour Annual Report98
Other Statutory Reports Statutes of Alberta Chapter P-39.5 – Public Interest Disclosure (Whistleblower Protection) Act
s. 32 of the Public Interest Disclosure (Whistleblower Protection) Act requires the chief officer of a department to report annually on all disclosures made to the designated officer of the department, public entity or office of the Legislature for which the chief officer is responsible.
This constitutes the annual report of the chief officer of the department covering the period of April 1, 2013 to March 31, 2014.
There have been no disclosures received by, acted on or not acted on by the designated officer.
Therefore there have been no investigations commenced by the designated officer as the result of disclosures and there is no data to report in relation to the reporting requirements under s. 32 of the Public Interest Disclosure (Whistleblower Protection) Act.