2013 - 2014 media guide - espn: the worldwide … - 2014 media guide the coaches’ trophy each year...
TRANSCRIPT

2013 - 2014MEDIA GUIDE
www.bcsfootball.org

The Coaches’ Trophy
Each year the winner of the BCS National Champi-onship Game is presented with The Coaches’ Trophy in an on-field ceremony after the game. The current presenting sponsor of the trophy is Dr Pepper.
The Coaches’ Trophy is a trademark and copyright image owned by the American Football Coaches As-sociation. It has been awarded to the top team in the Coaches’ Poll since 1986. The USA Today Coaches’ Poll is one of the elements in the BCS Standings.
The Trophy — valued at $30,000 — features a foot-ball made of Waterford® Crystal and an ebony base. The winning institution retains The Trophy for perma-nent display on campus.
Any portrayal of The Coaches’ Trophy must be li-censed through the AFCA and must clearly indicate the AFCA’s ownership of The Coaches’ Trophy.
Specific licensing information and criteria and a his-tory of The Coaches’ Trophy are available at www.championlicensing.com.

1
TABLE OF CONTENTSAFCA Football Coaches’ Trophy ............................................IFCTable of Contents .........................................................................1BCS Media Contacts/Governance Groups ...............................2-3Important Dates ...........................................................................4The 2013-14 Bowl Championship Series ...............................5-11The BCS Standings ....................................................................12College Football Playoff .......................................................13-14Media Policies for BCS Games ............................................15-23FBS Conference Directory ...................................................24-27Tostitos Fiesta Bowl .............................................................28-29Allstate Sugar Bowl ..............................................................30-31Discover Orange Bowl .........................................................32-33Rose Bowl Game Presented by VIZIO .................................34-352014 VIZIO BCS National Championship Game` ...............36-37College Football Bowl Schedule ..........................................38-41History of the BCS ...............................................................42-43All-Time BCS National Championship Game Results .............44BCS Game Results/All-Time Records in BCS Games .........45-48Weekly BCS Standings Leaders/All-Time Appearances ......49-652012 BCS Standings .............................................................66-672011 BCS Standings .............................................................68-692010 BCS Standings .............................................................70-712009 BCS Standings .............................................................72-732008 BCS Standings .............................................................74-752007 BCS Standings .............................................................76-772006 BCS Standings .............................................................78-792005 BCS Standings .............................................................80-812004 BCS Standings .............................................................82-832003 BCS Standings .............................................................84-852002 BCS Standings .............................................................86-872001 BCS Standings .............................................................88-892000 BCS Standings .............................................................90-911999 BCS Standings .............................................................92-931998 BCS Standings .............................................................94-952013 BCS Championship Game Summary ..........................96-972012 BCS Championship Game Summary ..........................98-992011 BCS Championship Game Summary ......................100-1012010 BCS Championship Game Summary ......................102-1032009 BCS Championship Game Summary ......................104-1052008 BCS Championship Game Summary .....................106-1072007 BCS Championship Game Summary ......................108-1092006 BCS Championship Game Summary ......................110-1112005 BCS Championship Game Summary .....................112-1132004 BCS Championship Game Summary .....................114-1152003 BCS Championship Game Summary ......................116-1172002 BCS Championship Game Summary ......................118-1192001 BCS Championship Game Summary ......................120-1212000 BCS Championship Game Summary .....................122-1231999 BCS Championship Game Summary ......................124-125BCS Selection History ......................................................126-140BCS Records.....................................................................141-173BCS Tom Mickle Internship ................................................... IBC

2
MEDIA CONTACTSThe 2013-14 Bowl Championship Series Media Guide is designed to provide an overview of the BCS. Should you need further information, please feel free to contact any of the following people:
Bill Hancock, Executive Director ([email protected])Michael Kelly, Chief Operating Officer ([email protected])Reid Sigmon, Chief Financial Officer ([email protected])Gina Chappin Lehe, Senior Director of Communications and Brand Management ([email protected])Nikki Epley, Director of Stadium and Game OperationsLaila Brock, Director of Team Operations and LogisticsAllison Doughty, Director of Events and Hospitality ServicesWes Gentry, Director of Administration
Mailing Address:College Football Playoff545 East John Carpenter FreewaySuite 1025Irving, TX, 75062469-262-5200
For information about ESPN, Harris Interactive, the National Football Foundation or the American Football Coaches Association, please contact the appropriate representative:
ESPNJosh Krulewitz, Vice President, Communications Phone: (860) 766-2319 E-mail: [email protected]
Keri Potts, Senior Director, Communications Phone: (860) 766-4483 E-mail: [email protected]
Mike Humes, Manager, Communications Phone: (860) 766-2233 E-mail: [email protected]
Gracie Blackburn, Associate Manager Phone: (860) 766-5069 E-mail: [email protected]
Rachel Margolis Siegal, Senior Publicist Phone: (860) 766-2798 E-mail: [email protected]
National Football FoundationMatthew Sign, BCS Standings Coordinator Phone: (972) 556-1000 ext. 203 E-mail: [email protected]
Harris Interactive Phone: (212) 539-9600 E-mail: [email protected]
American Football Coaches AssociationVince Thompson, Director of Media Relations Phone: (254) 754-9900 ext. 130 E-mail: [email protected]

3
BCS/COLLEGE FOOTBALL PLAYOFF GOVERNANCE GROUPS
BOARD OF MANAGERSAnthony Frank, President (Colorado State, Mountain West)Judy Genshaft, President (USF, American Athletic)Jack Hawkins, President (Troy, Sun Belt)Rev. John Jenkins, President (Notre Dame)Bernie Machen, President (Florida, Southeastern)Rod McDavis, President (Ohio, Mid-American)Max Nikias, President (Southern California, Pac-12)Harvey Perlman (chair), Chancellor (Nebraska, Big Ten)Bill Powers, President (Texas, Big 12)Charles W. Steger, President (Virginia Tech, Atlantic Coast)Conference USA, TBD
MANAGEMENT COMMITTEEMike Aresco (American Athletic Conference)Britton Banowsky (Conference USA)Karl Benson (Sun Belt Conference)Bob Bowlsby (Big 12 Conference)Jim Delany (Big Ten Conference)Larry Scott (Pac-12 Conference)Mike Slive (Southeastern Conference) Jon Steinbrecher (Mid-American Conference)Jack Swarbrick, Director of Athletics (Notre Dame) John Swofford (Atlantic Coast Conference) Craig Thompson (Mountain West Conference)
ATHLETICS DIRECTORS ADVISORY GROUPBarry Alvarez (Wisconsin - Big Ten)Thomas Boeh (Fresno State - Mountain West)Tom Bowen (Memphis - American Athletic)Joe Castiglione (Oklahoma - Big 12)Jeremy Foley (Florida - Southeastern)Pat Haden (Southern California – Pac-12)Terry Mohajir (Arkansas State - Sun Belt)Mike O’ Brien (Toledo - Mid-American)Dan Radakovich (Clemson, Atlantic Coast)Conference USA, TBD

4
Important Dates For Media Covering the BCS in 2013-14
October 13 – First Harris pollOctober 20 – First BCS Standings announcedNovember 26 – First selection teleconferenceDecember 3 – Second selection teleconferenceDecember 8 – Final BCS Standings announced; teams selected for gamesDecember 20 – Deadline for applying for media credentials for the five BCS Bowl games
2013-14 BCS SCHEDULE
Following 2013 Regular SeasonAll games televised by ESPN. (Approximate Starting Times, All Times Eastern)
Wedenesday, Jan. 1, 2014 – Rose Bowl Game presented by VIZIO 5 p.m. Wednesday, Jan. 1, 2014 –Tostitos Fiesta Bowl, 8:30 p.m. Thursday, Jan. 2, 2014 – Allstate Sugar Bowl, 8:30 p.m. Friday, Jan. 3, 2014 – Discover Orange Bowl, 8:30 p.m. Monday, Jan. 6, 2014 – VIZIO BCS National Championship Game (Pasadena), 8:30 p.m.
Team Selection Order
For 2013-14 – Orange, Sugar, Fiesta
2014-15 College Football Playoff Dates
SemifinalsThursday, Jan. 1, 2015Rose BowlSugar Bowl
Championship GameMonday, Jan. 12, 2015Cowboys Stadium, Arlington, Texas

5
The BCS At A Glance • The BCS is popular. The BCS National Championship Game
annually trails only the Super Bowl in terms of television ratings for sporting events in the United States.
• The BCS delivers the most meaningful regular season in sports. The BCS plays an important role in preserving and enhancing college football’s unique regular season where every game counts.
• The BCS maintains the bowl tradition. The BCS delivers the championship game while continuing the excitement and pageantry of the bowl games for student-athletes and fans.
The BCS In Depth The 2013-14 season will be the 16th year for the BCS, which is a five-game arrangement that is designed to match the two top-rated teams in a national championship game and to create exciting and competitive match-ups among eight other highly regarded teams in four other bowl games. It enhances the importance of the regular season and maintains the bowl system for the benefit of the game. It has been undeniably successful in achieving those goals; college football has never been more popular, and the BCS is a significant reason for that. Additionally, it has provided more access to the major bowls, more television exposure, and more post-season revenue than ever before.
The five bowl games are the Tostitos Fiesta Bowl, the Discover Orange Bowl, the Rose Bowl Game Presented by VIZIO, the Allstate Sugar Bowl, and the 2014 VIZIO BCS National Championship Game, which will be played at the Rose Bowl in Pasadena.
The BCS is an event managed by the 10 NCAA Football Bowl Subdivision conferences, all of them “BCS Conferences,” and the indepedent institutions through a series of contracts among bowls and television networks. The conferences are the American Athletic, Atlantic Coast, Big Ten, Big 12, Conference USA, Mid-American, Mountain West, Sun Belt, Pacific-12, and Southeastern. The conference commissioners, representing their constituents, and the Notre Dame athletics director, representing independent institutions, make decisions regarding all BCS matters, in consultation with an athletics directors advisory group and subject to the approval of a board of managers whose members represent all Football Bowl Subdivision programs.
The BCS games are operated by community-based organizations in each of the host cities. All bowl games provide meaningful season-ending opportunities for student-athletes.

6
This robust system of many post-season bowl games offers rewards for teams and places a great premium on the regular season. Football weekends are an important ingredient in the overall college experience—going well beyond simply what occurs in the athletics department. For many institutions, a significant amount of the revenue that supports all athletics programs is generated by regular-season football. Regular-season football weekends also permit universities, alumni, and other supporters of higher education to build and maintain close and lasting relationships. A thriving bowl structure helps ensure that the regular season remains strong and vibrant.
ESPN will televise all five BCS bowl games.
REVENUE SHARING
Revenues are shared fairly, under the simple principle that the conferences represented in the BCS bowls receive the largest portion of the revenues. Conferences then divide revenues as they see fit. All 11 conferences – plus independent institutions and Football Championship Subdivision (FCS) conferences – receive a share of the revenue regardless of whether their team participates in one of the games.
For the 2013-14 season:• If a team from one of four non-AQ conferences (i.e., a
conference without annual automatic qualification) qualifies, those conferences will share approximately $28.5 million – 18 percent of the net revenue. (Those conferences have elected to divide the revenue among themselves according to a formula they have devised.)
• If no team from the non-AQ conferences participates, those conferences would receive approximately $14.25 million – nine percent of the net BCS revenue.
• The net share for each AQ conference will be approximately $23.9 million.
• The share for each team selected at-large by one of the bowls will be $6.3 million.
• Notre Dame will receive $6.3 million if it participates in a BCS game; its share will be approximately $1.97 million if it does not – 1/66th of the net BCS revenue.
• Each FCS conference will receive $250,000.
• If Army, Navy or BYU becomes an automatic qualifier or is selected at-large, it will receive $6.3 million; if not selected, each will receive $100,000.

7
THE BCS IS FAIREvery team has a chance to play in a BCS bowl game, including the National Championship Game. Eight teams from conferences without annual automatic qualification have played in BCS bowls in the last nine years. This marks a drastic change from the 54 years before the BCS was created,when teams that are currently members of non-AQ conferences played in the top-tier bowl games only five times. Moreover, each conference competed for AQ status based on its teams’ performance on the field over a period of years. The current six AQ conferences have earned that status.
The BCS meets the goals that the conference commissioners established for it. Before the formation of the BCS and its predecessors, the Bowl Coalition and the Bowl Alliance, the Associated Press’s No. 1 and 2 teams met in bowl games only eight times in 56 years. The top two teams have played each other 15 times in the last 15 years by BCS measurements and 12 times in the last 15 years according to the Associated Press poll – including the last nine years in a row.
‘BCS CONFERENCE’ DESIGNATION
All 10 FBS conferences are “BCS Conferences” because the arrangement is managed by all 10 of them. There are no “non-BCS conferences” in the bowl subdivision.
COMMUNITY BENEFITS
The bowl system provides significant charitable, civic and economic-impact benefits for its local communities.
The total economic impact in the host cities from the five BCS games is expected to be more than $1.2 billion.
BCS EXECUTIVE DIRECTOR
Bill Hancock is executive director of the BCS and will serve in the same role for the College Football Playoff. Hancock joined the BCS in 2005, becoming executive director in 2009. He previously worked 16 years with the NCAA, including 13 as director of the Men’s Final Four. A member of the College Sports Information Directors Hall of Fame, Hancock was assistant SID at the University of Oklahoma, then was a newspaper editor for four years before an 11-year stint with the Big Eight Conference. He joined the NCAA staff in 1989. Hancock enjoys classical music, history, exercising, and spending time with his three grandchildren. A 15-time marathoner, he has ridden his bicycle across the U.S. twice. His book, “Riding With the Blue Moth”, the story of his first cross-country bicycle ride, was a top-selling sports memoir in 2005 and 2006. His second book, “This One Day in Hobart” is a history of his hometown in Oklahoma.

8
AUTOMATIC QUALIFICATION,AT-LARGE ELIGIBILITY AND
SELECTION PROCEDURES
1. The top two teams in the final BCS Standings will play in the National Championship Game.
2. The champions of the American Athletic, Atlantic Coast, Big Ten, Big 12, Pac-12, and Southeastern Conferences will have automatic berths in one of the participating bowls each year through the 2013 regular season.
3. The champion of Conference USA, the Mid-American Conference, the Mountain West Conference or the Sun Belt Conference will earn an automatic berth in a BCS bowl game if either:
A. Such team is ranked in the top 12 of the final BCS Standings, or
B. Such team is ranked in the top 16 of the final BCS Standings and its ranking in the final BCS Standings is higher than that of a champion of a conference that has an annual automatic berth in one of the BCS bowls. No more than one such team from Conference USA, the Mid-American Conference, the Mountain West Conference, and the Sun Belt Conference shall earn an automatic berth in any year. (Note: A second team could be eligible for at-large selection.)
If two or more teams from those conferences satisfy the provisions for an automatic berth, then the team with the highest finish in the final BCS Standings will receive the automatic berth, and the remaining team or teams will be in the pool of teams eligible for selection by the bowls as at-large teams.
4. Notre Dame will have an automatic berth if it is in the top eight of the final BCS Standings.
5. If any of the 10 slots remain open after application of provisions 1 through 4, and an at-large team from a conference with an annual automatic berth for its champion is ranked No. 3 in the final BCS Standings, that team will become an automatic qualifier, provided that no at-large team from the same conference qualifies for the National Championship Game.
6. If any of the 10 slots remain open after application of provisions 1 through 5, and if no team qualifies under paragraph No. 5 and an at-large team from a conference with an annual automatic berth for its champion is ranked No. 4 in the final BCS Standings, that team will become an automatic qualifier, provided that no at-large team from the same conference qualifies for the NCG.

9
AT-LARGE ELIGIBILITY
If there are fewer than 10 automatic qualifiers, then the bowls will select at-large participants to fill the remaining berths. An at-large team is any Football Bowl Subdivision team that is bowl-eligible and meets the following requirements:
A. Has won at least nine regular-season games, and B. Is among the top 14 teams in the final BCS Standings.
No more than two teams from a conference may be selected, regardless of whether they are automatic qualifiers or at-large selections, unless two non-champions from the same conference are ranked No. 1 and No. 2 in the final BCS Standings.
If fewer than 10 teams are eligible for selection, then the bowls can select as an at-large team any Football Bowl Subdivision team that is bowl-eligible, has won at least nine regular season games and is among the top 18 teams in the final BCS Standings, subject to the two-team limit noted above and also subject to the following: (1) If any conference has two or more teams in the top 14, then two of those teams must be selected; and (2) from the teams ranked 15-18, a bowl can select only a team from a conference that has fewer than two teams in the top 14.
If expansion of the pool to 18 teams does not result in 10 teams eligible for selection, then the pool shall be expanded by blocks of four (4) teams until 10 eligible teams are available, subject to the two-teams-per-conference limit noted above and also subject to the following: (1) If any conference has two or more teams in the top 14, then two of those teams must be selected; and (2) from the teams ranked 15 or lower, a bowl can select only a team from a conference that has fewer than two teams in the top 14.
Relative to the two preceding paragraphs, all teams ranked in the top 14, other than those from conferences that already have had two teams selected, must be included in the bowl selection.
Note: In order to participate in a BCS Bowl game, a team (1) must be eligible for post-season play under the rules of the NCAA and, if it is not an independent, under the rules of its conference; and (2) must not have imposed sanctions upon itself prohibiting participation in a post-season game for infractions of the rules of the NCAA or the rules of its conference.

10
TEAM-SELECTION PROCEDURES
The bowls will select their participants from two pools: (1) automatic qualifiers, all of which must be selected; and (2) at-large teams, if fewer than 10 teams qualify automatically. The following sequence will be used when establishing pairings:
1. The top two teams in the final BCS Standings will be placed in the National Championship Game (NCG).
2. Unless they qualify to play in the NCG, the champions of selected conferences are contractually committed to host selected games:
Atlantic Coast Conference—Orange Bowl Big Ten Conference—Rose Bowl Game Big 12 Conference—Fiesta Bowl Pac-12 Conference—Rose Bowl Game Southeastern Conference—Sugar Bowl
3. If a bowl loses a host team to the NCG, then such bowl shall select a replacement team from among the automatic-qualifying teams and the at-large teams before any other selections are made. If two bowls lose host teams to the NCG, each bowl will get a replacement pick before any other selections are made. In such case, the bowl losing the No. 1 team gets the first replacement pick, and the bowl losing the No. 2 team gets the second replacement pick. If the Rose Bowl game loses both the Big Ten and Pac-12 champions to the NCG, it will receive two replacement picks.
For the games of January 2011 through 2014, the first year the Rose Bowl loses a team to the NCG and a team from the non-automatic qualifying group is an automatic qualifier, that non-automatic qualifying team will play in the Rose Bowl.
A bowl choosing a replacement team may not select: (TCU fulfilled this in 2012.)
A. A team in the NCG, or
B. The host team for another BCS Bowl.
Further, when two bowls lose host teams, then the bowl losing the No. 1 team may not select a replacement team from the same conference as the No. 2 team, unless the bowl losing the No. 2 team consents.
4. For the January 2014 games, after steps 1, 2, and 3 have been completed, any bowl with an unfilled slot shall select a team from the automatic qualifiers and/or at-large teams in the following order: Orange, Sugar, then Fiesta.
All teams earning automatic berths must be selected.
5. After completion of the selection process as described in Paragraph Nos. 1-4, the conferences and Notre Dame may, but are not required to, adjust the pairings, taking into consideration the following:

11
A. Whether the same team will be playing in the same bowl game for two consecutive years; and/or
B. Whether two teams that played against one another in the regular season will be paired against one another in a bowl game; and/or C. Whether the same two teams will play against each other in a bowl game for two consecutive years; and/or
D. Whether alternative pairings may have greater or lesser appeal to college football fans as measured by expected ticket sales for the bowls and by expected television interest, and the consequent financial impact on rights-holding television networks and the bowls.
The pairings may not be altered by removing the Big Ten champion or the Pac-12 champion from the Rose Bowl.
TIE-BREAKING PROCEDURES
The following steps may be used to resolve any ties in the Standings after computation is carried out to full decimal points.
1. Look to head-to-head result;
2. If the tie is not resolved by No. 1, then evaluate results against the highest ranked common opponent in the BCS Standings;
3. If the tie is not resolved by No. 1 or No.2, then calculate tied teams place in BCS Standings using all six computer providers (i.e., do not throw out the high and low computer rankings) and the Harris and Coaches polls;
4. If the tie is not resolved by No. 1, No. 2, or No. 3, then draw.

12
THE BCS STANDINGSThe Harris Interactive College Football Poll, USA Today Coaches Poll and computer rankings each constitute one-third of the BCS Standings. To derive the three percentages, each team is assigned an inverse point total (25 for No. 1, 24 for No. 2, etc.).
The two poll percentages are calculated by dividing each team’s point total by the maximum possible points which is the number of panelists times 25. The computer rankings percentage is calculated by dropping the highest and lowest ranking for each team, and then dividing the remaining total by 100 (the maximum possible points).
The BCS average is calculated by averaging the percentage totals of the Harris Interactive Poll, USA Today Poll, and the computer rankings. The teams’ BCS averages are ranked to produce the BCS Standings.
The six computer ranking providers are Anderson & Hester, Richard Billingsley, The Colley Matrix, Kenneth Massey, Jeff Sagarin, and Peter Wolfe. Each computer ranking provider accounts for schedule strength, won-loss record and home-and-away records within its formula.
The BCS Standings are used to: * Determine the two teams that qualify to play in the BCS National Championship Game;
* Determine any other automatic qualifiers; and,
* Establish the pool of teams eligible for at-large selection by the bowls.
The BCS Standings are released for eight consecutive weeks each season, including the final standings on selection Sunday. The National Football Foundation compiles and releases the Standings each week.
HARRIS INTERACTIVE COLLEGE FOOTBALL POLL
The Harris Poll was first used during the 2005 regular season. The panel includes 105 former coaches, student-athletes, administrators and media members who are nominated by each conference and the independent institutions.
To provide the initial pool of potential panelists in 2005, each conference submitted the names of 30 qualified individuals; Harris Interactive randomly selected 10 panelists from among the names submitted by each conference. Notre Dame submitted a list of six qualified individuals, from which Harris randomly selected three. Army and Navy together submitted a list of three qualified individuals, from which Harris selected one.
When a person leaves the panel, the conference that originally nominated the individual nominates three others to take the spot. Harris Interactive then randomly selects the replacement.
The Harris Poll is released for nine consecutive weeks each season, including the final poll on selection Sunday.

13
COLLEGE FOOTBALL PLAYOFFBeginning with the 2014-15 season, college football will enter a new four-team playoff era. The format is simple: the best four teams, two semifinals played in bowl games and a championship game played in a different city each year. It’s the best of all worlds and the biggest innovation in the sport in decades.
Every Game CountsThe new playoff preserves the excitement and significance of college football’s unique regular season where every game counts.
The Best Four TeamsA selection committee will choose the four teams for the playoff based on body of work, strength of schedule, head-to-head results, comparison of results against common opponents, championships won and other factors.
Best of All WorldsThe new postseason structure creates an exciting four-team playoff that preserves the best regular season in sports and protects America’s rich bowl tradition. It goes just the right distance and respects the academic calendar while limiting the number of games played by student-athletes.
A New Year’s SpectacleFans will enjoy back-to-back triple-headers. Two semifinals and four other premier bowl games will be played on New Year’s Eve and New Year’s Day. Those holidays will belong to college football. Semifinal games will rotate among six different bowls, extending the experience to more fans.
Championship MondayThe championship game will be on Monday night every year.
Site SelectionThe commissioners will select cities to host the Championship Game. A city can host a bowl game and the championship game in the same year. A city cannot, however, host a semifinal and championship game in the same year.
Universal AccessEvery FBS team will have equal access to the playoff based on the team’s performance. No conference will qualify automatically.
More RevenueThe popularity of the new format will increase revenue for all conferences and independent institutions.
Conferences Manage the EventThe FBS conferences will manage the College Football Playoff. All 10 conferences are members of the new entity—CFP Administration, LLC. University presidents and chancellors from all 10 conferences and Notre Dame form the Board of Managers and will govern the administrative operations, with commissioners and athletics directors (the Management Committee) managing the event. A small staff in the playoff’s office in Irving, Texas, will carry out the detailed responsibilities.
More Decisions Coming Important matters such as the selection committee’s protocol and composition and the locations for future championship games are yet to be determined.

14
Selection Committee Responsibilities Select the best four teams, rank them and assign them to semifinals sites. Rank the next group of teams to play in other New Year’s bowls if berths are available. Select the highest-ranked champion from the five conferences without New Year’s bowl contracts. Assign teams to New Year’s bowls. Create competitive matchups. Attempt to avoid rematches of regular-season games and repeat appearances. Consider geography
Participants in the Orange, Rose and Sugar Bowls*Both participants in those three bowls are contracted outside the playoff arrangement (Big 10 and Pac-12 to Rose Bowl; SEC and Big 12 to Sugar Bowl; ACC to Orange Bowl against a contracted opponent.) If a conference champion qualifies for the playoff, then the bowl will choose a replacement. When those bowls host the semifinals and their contracted conference champions do not qualify, then the displaced champion(s) will play in the other New Year’s bowls.
Participants in the New Year’s Bowls (Fiesta, Cotton, Atlanta) Displaced conference champions and the top-ranked champion from a non-contract conference Highest-ranked available teams will fill any other berths Competitive matchups Attempt to avoid rematches and repeat appearances Geography will be a consideration

15
MEDIA CREDENTIALING POLICIESTo ensure that all qualified media agencies have the appropriate access, these policies have been developed by the 11 Football Bowl Subdivision commissioners, the Notre Dame athletics director and the BCS bowl games. The policies will be strictly enforced at the BCS National Championship Game. At the other BCS bowl games, the bowl media director may authorize additional credentials for all areas except the sidelines, if space allows.
Requests for all working media credentials for all Bowl Championship Series games shall be directed to the host media director. The deadline for applying is the second Friday after selection Sunday.
A “press agency” for purposes of these criteria shall mean a daily or weekly publication, cable system, radio or television station or network requiring immediate news coverage. “Immediate news coverage” for purposes of these criteria shall mean that the editorial, audio and/or visual deadline for the bowl game action being documented occurs no later than six days after the competition at the site has been completed.
A press agency or television or radio station in the bowl’s immediate geographic area that has staffed Division I college football games on a regular basis throughout the season and does not otherwise meet the criteria may be designated as a “minority media enterprise.” A “minority media enterprise” shall mean a business enterprise involved in the dissemination of college football news on a weekly basis or more frequently to audiences from ethnically, socially or culturally diverse backgrounds. Such audiences include, but are not limited to, African Americans, non-English speaking Americans and Native-American Indians. Such minority media enterprises may receive one media credential if space is available.
Each application will stand on its merits for each particular bowl game. Membership in a writers or broadcasters association does not automatically qualify an agency or individual for credentials. Having been credentialed for other bowl games does not automatically qualify an agency or individual for credentials.
An individual holding a credential is subject to removal from the stadium for violating BCS credential policies.
Except for television camera operators, a credential may be issued only to an authorized full-time, salaried representative of, or a representative who regularly and customarily performs services for, the agency submitting the request. Credentials are not transferable.
Credential requests will be considered only if they are submitted by the sports editor, by the sports director/producer or by the photo editor.
Subject to limitations of space and at the host media director’s discretion, credentials at all sites shall be assigned in accordance with the following policies:

16
PRINTSeparate publications sharing common ownership may not be combined for purposes of meeting circulation or other criteria.
1. A daily agency with circulation greater than 50,000, a weekly with circulation greater than 500,000 or a monthly with circulation greater than 750,000 will be identified as “national media” and will qualify for credentials. Press agencies may receive credentials according to the following circulation requirements:
Daily Circulation Credentials 50,000-99,999 one seat 100,000-199,999 two seats 200,000-299,999 three seats 300,000-499,000 four seats 500,000-699,999 five seats 700,000 and above six seats
Weekly Circulation Credentials 500,000-3 million two seats 3 million and above three seats
Monthly Circulation Credentials 750,000-3 million two seats 3 million and above three seats
An agency that has covered all of a participating institution’s regular-season games will be entitled to additional seats if space is available.
2. An agency that does not meet Criterion No. 1 qualifies for credentials if a full-time staff member has covered all of the participating institution’s regular-season games. Such an agency can receive one more than the number of credentials it used for a majority of the institution’s regular-season games, plus additional seats if space is available.
A publication whose primary purpose is the coverage of college football and does not meet the criteria listed above may be eligible for one credential at the discretion of the host bowl’s media director.
3. The Associated Press and the primary newspaper(s) that provide daily coverage at the site of the bowl game may receive a maximum of eight seats.
4. At the media director’s discretion, a maximum of two credentials may be issued to reporters representing the non-sports side of the major newspaper that covers all regular-season games of the participating institution.
5. At the media director’s discretion, a maximum of two credentials may be issued to reporters representing the non-sports side of the major newspaper in the host city.

17
6. Credentials may be issued to a maximum of three individuals certified by the director of athletics or designated representative of each participating institution, who will be the sole representatives of all media organizations affiliated with such institution and all media organizations whose coverage primarily is directed at such institution and its activities.
STILL PHOTOGRAPHY Sports editors or photo editors shall request all credentials. Most media agencies will be limited to a maximum of two credentials.
Subject to limitations of space, credentials for photo staff members shall be assigned to agencies requiring immediate news coverage in accordance with the following priorities:
Photographers1. A maximum of four photographers certified by the director
of athletics or designated representative of each participating institution, who will be the sole representatives of all media organizations affiliated with any such institution (e.g., student newspaper, yearbook, alumni magazine) and all media organizations whose coverage primarily is directed at such institution and its activities.
2. Each institution’s athletics department may be represented by a maximum of three photographers.
3. The primary press agencies at the host site of a Bowl Championship Series game that cover college football on a regular basis may receive a maximum of four credentials.
4. The Associated Press may receive a maximum of 12 credentials for photographers. Sports Illustrated and USA Today each may receive a maximum of six credentials. Reuters, Getty and US Presswire may receive a maximum of four credentials at the discretion of the host media director. The Sporting News and ESPN The Magazine may receive a maximum of three credentials.
5. A press agency with a minimum daily circulation of 350,000, a weekly circulation of 500,000, or a monthly circulation of one million may receive one credential.
6 A participating institution may receive a total of four credentials for media/photo agencies that do not meet the minimum daily or weekly circulation requirements. These agencies shall be certified by the director of athletics or designated representative of the participating institution to have staffed at least 80 percent of its games throughout the season.
7. A publication whose primary purpose is the coverage of college football and does not meet the criteria listed above may be eligible for one credential at the discretion of the host media director.
8. For access to the sidelines, photographers must wear vests provided by the bowl.

18
Photo Couriers, Editors and TechniciansA media entity requiring credentials for immediate news coverage may be granted credentials for couriers, editors and/or technicians subject to the media coordindator’s discretion.
TELEVISION(See below for the definition of a crew.)
1. A television station or regional cable network from the locale of a Bowl Championship Series game may be represented by a maximum of two crews.
2. A television station from the locale of the participating institution, which has staffed all of its regular-season games, may be represented by a maximum of two crews.
3. A regional cable network from the locale of the participating institution, which has staffed all of its regular-season games, or a conference’s television network (e.g., Big Ten Network) may be entitled to be represented by a maximum of two crews, plus a third crew may be issued limited-access credentials at the discretion of the host media director.
4. A regional cable network that airs a nightly sports show and covers all of a team’s games during the regular season may be represented by one crew.
5. Each division (i.e., the sports, news, entertainment and affiliate divisions) from a national television network or cable system that originates a daily sports news program (e.g., Fox, ABC, CBS, NBC, ESPN, CNN) may be represented by one crew. The NFL Network may be represented by one crew.
6. A television station in a market area estimated to have a minimum of one million U.S. television households the previous year by the A.C. Nielsen Company may be represented by one crew.
7. At the discretion of the host media director, no more than two credentials may be authorized to other news services that have news and sports programming.
8. Each participating institution may be represented by a maximum of one crew for a “coach’s show.”
A crew is defined as no more than four individuals, including one camera operator.
RADIO1. A maximum of two credentials (one media and one limited
access) may be assigned to a radio station in a market area representing at least one million radio homes that regularly covers college football games and has a daily “sports talk” program.
2. Two credentials may be assigned to a radio station in the geographic area of the bowl city that regularly covers college football games (i.e., full-time staff members attend games and

19
file reports) and airs six or more sports reports each day.
3. Two credentials may be assigned to a radio station in the geographic area of a participating team that covers college football games (i.e., full-time staff members attend games and file reports) at least 90 percent of a participating institution’s home games and airs six or more sports reports each day.
4. Media credentials may be assigned to each of the following radio entities: American Forces Radio, ABC, AP, CBS, CNN Radio, Echlin Sports Service, ESPN Radio, Fox Sports Radio, NBC, National Public Radio, Sirius/XM Radio, Sports Byline USA, USA Radio Network, Voice of America, Westwood One and Yahoo! Sports Radio.
5. A radio network that will originate a live play-by-play broadcast is entitled to the number of individuals it used to originate games during the most recently completed regular season. Entities that produce national radio broadcasts under rights assigned through the national television rightsholder shall be limited to a maximum of eight credentials.
ONLINE MEDIA1. A maximum of two credentials may be issued to the BCS web
site and to the web sites of the television network that holds rights to broadcast the game.
2. Credential(s) may be issued to an online agency that (1) registers at least one million unique users per month in each of the 12 months before the game and (2) covers college football daily.
3. The official web site of a competing institution, as designated by the school’s sports information director, may receive a maximum of two credentials in addition to the institution’s credentials noted elsewhere in this policy.
4. The official web site of a competing conference, as designated by the conference’s sports information director, may receive a maximum of two credentials in addition to the conference’s credentials noted elsewhere in this policy.
5. A print, radio or television agency will not receive more credentials than the number provided for elsewhere in this document. An agency may allot one (or more) of its credentials to its online entity.
6. If space is available, an online entity that does not meet the other criteria herein may qualify for credentials if a full-time staff member has covered all of the participating institution’s regular-season games. Such credential may be issued only to a full-time staff member.
7. An online entity may receive a credential only if its own full-time staff members write an overwhelming percentage of that site’s material.

20
8. Online entities will not receive during-game field access.
9. An online service that is recognized as an outlet intended primarily for the purpose of delivering news related to the recruitment of student-athletes does not qualify for credentials.
INTERNATIONAL MEDIAWhen space is available, credentials will be issued to a full-time, salaried employee or a representative who regularly and customarily performs services for:
1. A newspaper that has a minimum circulation of five percent of the total population of the country;
2. A specialty publication that has a minimum circulation of one percent of the total population of the country;
3. The official publication of the country’s organization for governance of “American football”;
4. A television station that has a signal reaching 25 percent of the homes in the country;
5. Each of the two largest sports networks in the country.
Each of the media agencies above may also be assigned a photography position at the discretion of the host media director.
AGENCIES NOT ELIGIBLE Credentials shall not be issued to the following:
1. Persons solely for the purpose of writing or gathering material for books;
2. Representatives of syndicated television or cable programmers who are not producing programs for immediate news coverage (i.e., to air within 24 hours);
3. Telephone reporting services;
4. Entities normally identified as “tout sheets,” and other publications devoted solely to gambling;
5. Scouts from professional teams; (Instead, the bowls will offer to sell tickets to the professional league office if requested and if tickets are available, with the understanding that the professional league will distribute the tickets to the teams as it wishes.)
6. Agencies that normally provide specific services for a media agency (e.g., scores) if many of its clients have been accredited to staff the event.
7. Online entities not specifically referenced herein.

21
BCS INTERVIEW POLICIESNews conferences will be conducted during the week of each game (see the schedule of events) and also immediately after each game. The host media coordinator will have the authority to designate and require any student-athlete to attend any news conference.
The media coordinator designated by the BCS Group will work with the host bowl to assign a designee to facilitate the postgame news conferences.
GAME DAY
Locker Rooms. The locker rooms will be open to the media for a minimum of 30 minutes after the post-game cooling-off period ends, provided media representatives are present the entire time. Student-athletes who do not play in the game may depart earlier.
The head coach has the option to allow representatives of the national television rights holder into the locker room before the game and during the cooling-off period after the game. Cooling-Off Period. A “cooling-off period” has been set aside for the coach to be with the student-athletes in the locker room after each game. The period for the losing team begins when the coach enters the locker room immediately after the game. The period for the winning team begins after the conclusion of the trophy presentation. The period will be 20 minutes for the winning team and 10 minutes for the losing team. A coach may shorten the cooling-off period but may not extend it. The coach and student-athletes must report to the interview room after the cooling-off period ends.
“Selected Media” Policy. Except for the national television rights holder as noted in the “locker rooms” section above, no interviews may take place during the cooling-off period. If a coach permits one media representative to enter the locker room before the cooling-off period has ended, the locker room will be open to all other media representatives desiring access.
PRACTICES
Each institution has the option of having its practices in the locale of the bowl open or closed to the media.
For those institutions choosing the closed option, a 15-minute period during a minimum of two practices at the designated practice site must be open to the media. The 15-minute period will begin at the end of pre-practice stretching and warm-up drills. The team may not designate its first practice nor its final walk-through. No interviews will be conducted during the open portion of the practices; media will stand on the sidelines and may photograph the first 15 minutes of the practice.
The head coach and selected student-athletes will be available to the media after the practice two days before the game (i.e., January 2 for a January 4 game). If the bowl does not conduct a media day, then six to eight different student-athletes shall also be made available after practice on an additional day.
Each institution has the option to make coaches and student-athletes available in conjunction with other practices and shall notify the media of any such availability in advance.

22
NEWS CONFERENCES DURING GAME WEEK
Each bowl will conduct news conferences during the week of the game. The bowl shall propose a schedule of news conferences to the institutions; the bowl and the institution shall agree upon the schedule not later than December 15. Once the bowl and institution have agreed to the schedule, it shall not be adjusted. The suggested game-week schedule is as follows:
Day 1: Coach and a minimum of two student-athletes upon arrival: news conference at airport, team hotel or other location identified by the bowl.
Day 2: Visiting team offensive coordinator and selected starting offensive players, Home team defensive coordinator and selected starting defensive players at media hotel. (Suggested times are 8:30 a.m. for visiting team and at 9:30 a.m. for home team).
Day 3: Visiting team defensive coordinator and selected starting defensive players and home team offensive coordinator and selected starting offensive players at media hotel. (Suggested times are 8:30 a.m. for visiting team and 9:30 a.m. for home team). Note: The student-athletes who accompany the coaches to the news conferences on Day 2 and Day 3 must include the starting quarterback, leading rusher, leading tackler, all major national award winners and first- team all-Americans.
Day 4: *Media day at stadium or other location chosen by the bowl: all coaches and student-athletes, (Student-athletes shall wear game jerseys. Suggested times are home team from 9:30 to 10:30 a.m. and visiting team from 11 a.m. to noon.) The head coach and four student-athletes will sit on risers on the field. Other student-athletes will sit in the stands. Teams have the option to take a team photo on the field before or after the interviews.
Day 5: Six to eight selected student-athletes available after practice. (Final student-athlete availability.)
Day 6: Head coaches at media hotel. (Suggested times are visiting team at 8:30 a.m., home team at 9 a.m.)
Day 7: Game Day.
Day 8: *Head coach of winning team and offensive and defensive players-of-the-game (if from the same team) at media hotel. The following trophies will be presented: AFCA, Football Writers, Associated Press and National Football Foundation. (Suggested time is 10-11 a.m.)
* Indicates required at national championship game, optional at other bowls. If the bowl opts not to conduct media day, then it is suggested that the activities on Day 2 and Day 3 take place on Days 3 and 4.

23
NEWS CONFERENCES, POST-GAME
Representatives of each team shall participate in a news conference after the game.
Pre-Game Designation. Before the game, the coach shall designate a minimum of two starters to report to the interview room immediately after the cooling-off period ends. The media coordinator will distribute the names of these individuals to the media before the end of the game. The media coordinator may also require that non-designated student-athletes join or replace a representative in the designated group should the athletes’ performances merit it.
Obligation of the Coach. Regardless of any personal regular-season radio or television contracts, the coach is first obligated to all media staffing the game and must report to the interview room immediately after the cooling-off period ends. After fulfilling this commitment to the media staffing the game, the coach and student-athletes may participate in other interviews.
The coach may not delay a post-game interview with the covering media to conduct a program for a single newspaper, radio, online or television reporter or Internet site, unless requested to grant a short interview by the national television rightsholder or the radio network as noted herein.
Order of Appearance. The losing coach and players shall be scheduled in the interview room before the winning coach and players.
Timing. The scoreboard operator shall start the clock at 20 minutes when the postgame trophy presentation ends. After 20 minutes, the winning team’s representatives will be escorted to the locker room and interview room.
Television and Radio Rightsholders, Post-Game. If requested, the winning coach, losing coach and winning student-athletes shall grant post-game interviews, not to exceed four minutes, to the rightsholding television and/or the rightsholding radio networks, provided the networks are still providing live coverage from the facility. The media coordinator, not the television or radio network, will be responsible for terminating the four-minute interview period.
The rightsholding television network will have the first choice of individuals to interview, then the rightsholding radio networks.
The networks cannot inordinately delay the coaches’ and student-athletes’ return to the locker room. If the networks are not prepared to conduct live interviews immediately, it will be necessary for the interviews to be taped. Any interview with the losing coach should be conducted off the field, near the locker room.

24
FOOTBALL BOWL SUBDIVISION CONFERENCE DIRECTORY
American Athletic Conference15 Park Row WestProvidence, RI 02903Phone: (401) 453-0660Fax: (401) 751-8540Internet Address: www.TheAmerican.org
Commissioner ............................................................. Mike Aresco Football Contact .......Chuck Sullivan ([email protected])Teleconference .....................Mondays, 11 a.m.-12:50 p.m. Eastern
2013-14 American Bowl Relationships (Listed in alphabetical order)
Champion: BCSAutoZone Liberty, BBVA Compass; Beef ‘O’Brady’s St. Petersburg, Belk, New Era Pinstripe, Russell Athletic
Atlantic Coast Conference4512 Weybridge LaneGreensboro, NC 27407Phone: (336) 854-8787Fax: (336) 854-8797Internet Address: www.theacc.com
Commissioner .......................................................... John SwoffordFootball Contact .............................Mike Finn ([email protected])Teleconference ...........Wednesdays, 10:30 a.m.-12:50 p.m. Eastern
2013-14 ACC Bowl Relationships (Listed in alphabetical order)
Champion: BCSAdvoCare V100, Belk, Chick-fil-A, Franklin American Mortgage Music City, Hyundai Sun, Military Bowl presented by Northrop Grumman, Russell Athletic
Big Ten Conference5440 Park PlaceRosemont, IL 6001bc8Phone: (847) 696-1010Fax: (847) 696-1150Internet Address: www.bigten.org
Commissioner ....................................................... James E. DelanyFootball Contact ................ Scott Chipman ([email protected])Teleconference ............................Tuesdays, 11 a.m.-1 p.m. Central
2013-14 Big Ten Bowl Relationships (Listed in alphabetical order)
Champion: BCSBuffalo Wild Wings, Capital One, Heart of Dallas, Little Caesars Pizza, Outback, TaxSlayer.com Gator, Texas

25
FOOTBALL BOWL SUBDIVISION CONFERENCE DIRECTORY
Big 12 Conference400 East John Carpenter FreewayIrving, TX 75062Phone: (469) 524-1000Fax: (469) 524-1045Internet Address: www.big12sports.com
Commissioner ............................................................ Bob BowlsbyFootball Contact ......................Bob Burda ([email protected])Teleconference .................. Mondays, 9:50 a.m.-11:30 a.m. Central
2013-14 Big 12 Bowl Relationships (Listed in alphabetical order)
Champion: BCSAT&T Cotton, Bridgepoint Holiday, Buffalo Wild Wings, New Era Pinstripe, Texas, Valero Alamo
Conference USA5201 N. O’Connor Blvd., Suite 300Irving, TX 75039Phone: (214) 774-1300Fax: (214) 496-0055Internet Address: www.ConferenceUSA.com
Commissioner .....................................................Britton BanowskyFootball Contact ...............Russ Anderson ([email protected])Teleconference ......................Select Mondays, 1-2:30 p.m. Central
2013-14 Conference USA Bowl Relationships (Listed in alphabetical order)
AutoZone Liberty, Beef ‘O’ Brady’s St. Petersburg, Heart of Dallas, Military, R+L Carriers New Orleans, Sheraton Hawai’i
Mid-American Conference24 Public Square, 15th FloorCleveland, OH 44113Phone: (216) 566-4622Fax: (216) 858-9622Internet Address: www.mac-sports.com
Commissioner ....................................................... Jon SteinbrecherFootball Contact ..............Ken Mather ([email protected])Teleconference ..........................Mondays, 9:30-11:30 a.m. Eastern
2013-14 MAC Bowl Relationships (Listed in alphabetical order)
Little Caesar’s Pizza, GoDaddy, Famous Idaho Potato

26
FOOTBALL BOWL SUBDIVISION CONFERENCE DIRECTORY
Mountain West Conference10807 New Allegiance Drive, Suite 250Colorado Springs, CO 80921Phone: (719) 488-4040Fax: (719) 487-7240Internet Address: www.themwc.com
Commissioner .......................................................Craig ThompsonFootball Contact ............. Javan Hedlund ([email protected])Teleconference ......................... Tuesdays, 10-11:43 a.m. Mountain
2013-14 Mountain West Bowl Relationships (Listed in alphabetical order)
Bell Helicopter Armed Forces, Famous Idaho Potato, Gildan New Mexico, Las Vegas, San Diego County Credit Union Poinsettia, Sheraton Hawai’i
Pac-12 Conference1350 Treat Blvd., Suite 500Walnut Creek, CA 94597-8853Phone: (925) 932-4411Fax: (925) 932-4601Internet Address: www.pac-12.org
Commissioner ................................................................Larry ScottFootball Contact .......................Dave Hirsch ([email protected])Teleconference .....................................Tuesdays, 10 -Noon Pacific
2013-14 Pac-12 Bowl Relationships (Listed in alphabetical order)
Champion: BCSBridgepoint Holiday, Hyundai Sun, Kraft Fight Hunger, MAACO Las Vegas, Gildan New Mexico, Valero Alamo

27
FOOTBALL BOWL SUBDIVISION CONFERENCE DIRECTORY
Southeastern Conference2201 Richard Arrington Blvd. N.Birmingham, AL 35203Phone: (205) 458-3000Fax: (205) 458-3030Internet Address: www.secsports.com
Commissioner ................................................................ Mike SliveFootball Contact ....................................................................... TBATeleconference ........................ Wednesdays, 10-Noon a.m. Central
2013-14 SEC Bowl Relationships (Listed in alphabetical order)
Champion: BCSAdvocare V100, AT&T Cotton, AutoZone Liberty, BBVA Compass, Capital One, Chick-fil-A, Franklin American Mortgage Music City, Outback, TaxSlayer.com Gator
Sun Belt ConferenceMercedes Benz Superdome1500 Sugar Bowl DriveNew Orleans, LA 70112Phone: (504) 299-9066Fax: (504) 299-9068Internet Address: www.sunbeltsports.org
Commissioner ..............................................................Karl BensonFootball Contact ... John McElwain ([email protected])Teleconference ................Mondays, 10:30 a.m.-12:00 p.m. Central
2013-14 Sun Belt Bowl Relationships (Listed in alphabetical order)
R&L Carriers New Orleans; GoDaddy.com

28
TOSTITOS FIESTA BOWLJanuary 1 • 8:30 p.m. ET • ESPNBCS (Big 12) vs. BCS
Tostitos Fiesta Bowl7135 E. Camelback Road, Suite 190Scottsdale, AZ 85251(480) 350-0900; Fax: (480) 350-0930
Executive Director ................................................Robert N. SheltonChairman ...........................................................................Brian HallDirector of Media Relations .....................................Kristen PflipsenE-mail ....................................................... [email protected]
QUICK FACTSField (Capacity) ................ University of Phoenix Stadium (73,000)2012 Results ..........................................Oregon 35, Kansas State 17 2012 Attendance ......................................................................70,2422012 Nielsen Rating ....................................................................8.56Internet Address ................................................ www.fiestabowl.orgMedia Headquarters ..............................JW Marriott Camelback InnPhone Number ..........................................................(480) 948-1700
TENTATIVE GAME WEEK SCHEDULEDec. 26 - Head Coaches Press Conference Upon ArrivalDec. 27 - Selected Player Interviews at Practice SitesDec. 28 - Coordinators/Student-Athlete Interviews at JW Marriott
Camelback InnDec. 29 - Coordinators/Student-Athlete Interviews at JW Marriott
Camelback InnDec. 30 - Media Day at JW Marriott Camelback InnDec. 31 - Head Coaches Press Conference at JW Marriott Camelback
InnJan. 1 - Kickoff (8:30 p.m. ET, 6:30 MT)
DIRECTIONS FROM AIRPORT TO MEDIA HOTELTake 44th St. N., approximately 9 miles. 44th Street curves into Mc-Donald. Turn left on Tatum. Right on Lincoln. Hotel is on the left. From I-10, Exit 24th Street, head north until dead end at Lincoln Drive. Turn right on Lincoln; cross over Tatum Blvd. and resort is 1/4 mile on left. From I-17 exit Glendale Avenue and head east. Glendale turns into Lincoln Drive. Cross over Tatum Blvd. and resort is 1/4 mile on left.
DIRECTIONS FROM AIRPORT TO UNIVERSITY OF PHOENIX STADIUMExit Sky Harbor Airport and continue on East Sky Harbor Blvd. Head West towards Los Angeles on I-10. Take the AZ loop 101 Freeway North. Exit at Bethany Home and make a right off the exit. Make a left on 95th and the stadium will be on the right.

29
ALL-TIME FIESTA BOWL RESULTS
1971 .......Arizona State 45, Florida State 381972 .......Arizona State 49, Missouri 351973 .......Arizona State 28, Pittsburgh 71974 .......Oklahoma State 16, BYU 61975 .......Arizona State 17, Nebraska 141976 .......Oklahoma 41, Wyoming 71977 .......Penn State 42, Arizona State 301978 .......Arkansas 10, UCLA 101979 .......Pittsburgh 16, Arizona 101980 .......Penn State 31, Ohio State 191982 .......Penn State 26, USC 101983 .......Arizona State 32, Oklahoma 211984 .......Ohio State 28, Pittsburgh 231985 .......UCLA 39, Miami 371986 .......Michigan 27, Nebraska 231987 .......Penn State 14, Miami 101988 .......Florida State 31, Nebraska 281989 .......Notre Dame 34, West Virginia 211990 .......Florida State 41, Nebraska 171991 .......Louisville 34, Alabama 71992 .......Penn State 42, Tennessee 171993 .......Syracuse 26, Colorado 221994 .......Arizona 29, Miami 01995 .......Colorado 41, Notre Dame 241996 .......Nebraska 62, Florida 241997 .......Penn State 38, Texas 151998 .......Kansas State 35, Syracuse 181999 .......Tennessee 23, Florida State 162000 .......Nebraska 31, Tennessee 212001 .......Oregon State 41, Notre Dame 92002 .......Oregon 38, Colorado 162003 .......Ohio State 31, Miami 24 (2ot)2004 .......Ohio State 35, Kansas State 282005 .......Utah 35, Pittsburgh 72006 .......Ohio State 34, Notre Dame 202007 .......Boise State 43, Oklahoma 42 (OT)2008 .......West Virginia 48, Oklahoma 282009 .......Texas 24, Ohio State 212010 .......Boise State 17, TCU 102011 ........Oklahoma 48, Connecticut 202012........Oklahoma State 41, Stanford 38 (ot)2013........Oregon 35, Kansas State 17

30
ALLSTATE SUGAR BOWLJanuary 2 • 8:30 p.m. ET • ESPNBCS (SEC) vs. BCS
Allstate Sugar BowlMercedes-Benz Superdome1500 Sugar Bowl DriveNew Orleans, LA 70112(504) 828-2440; Fax: (504) 828-2441
Chief Executive Officer .......................................... Paul HoolahanPresident .............................................................................Jay BattDirector of Communications ................................... John Sudsbury E-mail ...........................................................johns@sugarbowl.org
QUICK FACTSField (Capacity) ............................ Louisiana Superdome (74,000)2012 Results ............................................ Louisville 33, Florida 232012 Attendance ...................................................................54,1782012 Nielsen Rating ...................................................................6.2Internet Address .................................. www.allstatesugarbowl.orgMedia Headquarters ...............Marriott Hotel (Convention Center)Phone Number .......................................................(504) 613-2888
TENTATIVE GAME WEEK SCHEDULEDec. 27 - Arrival Press Conferences (Airport or Marriott)Dec. 28 - Team PracticesDec. 29 - Coordinators/Student-Athlete Interviews at Marriott
(Convention Center)Dec. 30 - Coordinators/Student-Athlete Interviews at Marriott
(Convention Center)Dec. 31 - Selected Student-Athletes available after team practicesJan. 1 - Head Coaches Press Conference at Marriott (Convention
Center)Jan. 2 - Kickoff (8:30 p.m. ET)
DIRECTIONS FROM AIRPORT TO MEDIA HOTELTake I-10 East toward New Orleans. When approaching city, follow I-10 sign and bear right toward Slidell at fork in Interstate. Take Poydras Street/Superdome exit 2/3 mile after road fork (exit left from Interstate to exit). Go straight for 1 mile. Turn right on Convention Center Boulevard. Marriott Hotel on right.
DIRECTIONS FROM AIRPORT TO MERCEDES-BENZ SUPERDOMETake I-10 East toward New Orleans. When approaching city, follow I-10 sign and bear right toward Slidell at fork in Interstate. Take Poydras Street/Superdome exit 2/3 mile after road fork (exit left from Interstate to exit). Stadium is on right.

31
1935........................Tulane 20, Temple 141936................................... TCU 3, LSU 21937.....................Santa Clara 21, LSU 141938.........................Santa Clara 6, LSU 01939..............TCU 15, Carnegie Mellon 71940................ Texas A&M 14, Tulane 131941......Boston College 19, Tennessee 131942......................Fordham 2, Missouri 01943........................Tennessee 14, Tulsa 71944................ Georgia Tech 20, Tulsa 181945........................Duke 29, Alabama 261946.... Oklahoma State 33, St. Mary’s 131947..........Georgia 20, North Carolina 101948......................... Texas 27, Alabama 71949........Oklahoma 14, North Carolina 61950........................ Oklahoma 35, LSU 01951................ Kentucky 13, Oklahoma 71952...............Maryland 28, Tennessee 131953.........Georgia Tech 24, Mississippi 71954... Georgia Tech 42, West Virginia 191955......................Navy 21, Mississippi 01956.............Georgia Tech 7, Pittsburgh 01957..................... Baylor 13, Tennessee 71958..................... Mississippi 39, Texas 71959.............................LSU 7, Clemson 01960.......................Mississippi 21, LSU 01961....................... Mississippi 14, Rice 61962....................Alabama 10, Arkansas 31963..............Mississippi 17, Arkansas 131964................Alabama 12, Mississippi 71965.........................LSU 13, Syracuse 101966.....................Missouri 20, Florida 181967................... Alabama 34, Nebraska 71968....................... LSU 20, Wyoming 131969.....................Arkansas 16, Georgia 21970..............Mississippi 27, Arkansas 221971...............Tennessee 34, Air Force 131972..................Oklahoma 40, Auburn 221972...............Oklahoma 14, Penn State 01973.............Notre Dame 24, Alabama 231974....................Nebraska 13, Florida 101975................. Alabama 13, Penn State 61977................... Pittsburgh 27, Georgia 31978................. Alabama 35, Ohio State 61979................. Alabama 14, Penn State 71980....................Alabama 24, Arkansas 91981.............. Georgia 17, Notre Dame 101982................. Pittsburgh 24, Georgia 201983.................Penn State 27, Georgia 231984....................... Auburn 9, Michigan 71985........................Nebraska 28, LSU 101986......................Tennessee 35, Miami 71987........................Nebraska 30, LSU 151988....................Auburn 16, Syracuse 161989................ Florida State 13, Auburn 71990......................Miami 33, Alabama 251991................. Tennessee 23, Virginia 221992............... Notre Dame 39, Florida 281993......................Alabama 34, Miami 131994............... Florida 41, West Virginia 71995...............Florida State 23, Florida 17
1995.................Virginia Tech 28 Texas 101997...............Florida 52, Florida State 201998......... Florida State 31, Ohio State 141999.......... Ohio State 24, Texas A&M 142000.... Florida State 46, Virginia Tech 292001........................ Miami 37, Florida 202002............................LSU 47, Illinois 342003............. Georgia 26, Florida State 132004...................... LSU 21, Oklahoma 142005.............Auburn 16, Virginia Tech 132006.......... West Virginia 38, Georgia 35^2007................... LSU 41, Notre Dame 142008...................... Georgia 41, Hawaii 102009.........................Utah 31, Alabama 172010.................. Florida 51, Cincinnati 242011 .............*Ohio State 31, Arkansas 262012...Michigan 23, Virginia Tech 20 (ot)2013...................Louisville 33, Florida 23
*Ohio State’s participation later vacated.^ Georgia Dome (Atlanta)
ALL-TIME SUGAR BOWL RESULTS

32
DISCOVER ORANGE BOWLJanuary 3 • 8:30 p.m. ET • ESPNBCS (ACC) vs. BCS
Discover Orange Bowl14360 NW 77th CourtMiami Lakes, FL 33016(305) 341-4700; Fax: (305) 341-4750
CEO...........................................................................Eric L. PomsPresident .............................................................. Andrew F. HertzVice President for Communications ........................... Larry WahlE-mail ....................................................... [email protected]
QUICK FACTSField (Capacity) .................................. Sun Life Stadium (71,540)2012 Results ........................Florida State 31, Northern Illinois 102012 Attendance .................................................................72,0732012 Nielsen Rating ..................................................................6.1Internet Address .......................................... www.orangebowl.orgMedia Headquarters ....................................Embassy Suites Hotel (Ft. Lauderdale, FL)Phone Number ...................................................... (954) 527-2700
TENTATIVE GAME WEEK SCHEDULEDec. 28- Head Coaches’ Press Conference upon team arrival (Ft. Lauderdale/Hollywood International Airport & Miami International Airport)Dec. 29 - Selected Student-Athletes available after team practicesDec. 30 - Coordinators/Student-Athletes interviews at Marriott Harbor Beach Resort & SpaDec. 31 - Coordinators/Student-Athletes interviews at Marriott Harbor Beach Resort & SpaJan. 1 - Selected Student-Athletes available after team practicesJan. 2 - Head Coaches’ Press Conference at Marriott Harbor Beach Resort & SpaJan. 3 - Kickoff (8:30 p.m. ET)
DIRECTIONS FROM AIRPORTS TO MEDIA HOTELFrom Ft. Lauderdale/Hollywood International Airport (FLL):Take the Airport exit to US-1 North. Go north on US-1/Federal Highway approximately 2.5 miles. Make a right on A1A/SE 17th Street and head east approximately .3 mile. Turn right into hotel. Entrance is just past SE 10th Ave. From Miami International Airport (MIA)Follow exit toward SR 112/Airport Expressway. Follow SR 112 East approximately 4.5 miles to I-95 North. Take I-95 North for approximately 20 miles to Exit 24, I-595 East. Take I-595 approximately 2.5 miles to Exit 12B US-1/Federal Highway North. Go north on US-1/Federal Highway to AIA/SE 17th Street. Make a right on A1A/SE 17th St. and head east approximately .3 mile. Turn right into hotel. Entrance is just past SE 10th Ave.
DIRECTIONS FROM AIRPORTS TO SUN LIFE STADIUMFrom Ft. Lauderdale/Hollywood International Airport (FLL):Take the Airport exit to I-595. Follow I-595 West approximately 5 miles to Florida’s Turnpike. Go south on Florida’s Turnpike (toward Miami) to Exit 2X, Stadium/NW 199th St./Dan Marino Blvd./Honey Hill Dr.
From Miami International Airport (MIA)Follow exit toward SR 112/Airport Expwy. Follow SR 112 East approximately 4.5 miles to I-95 North. Take I-95 North for approximately 7.5 miles to Florida’s Turnpike (exit is on the left). Go through the toll booth to Exit 2X, Stadium/NW 199th St./Dan Marino Blvd./Honey Hill Dr.

33
ALL-TIME ORANGE BOWL RESULTS1935 ..............Bucknell 26, Miami 01936 ..... Catholic 20, Mississippi 191937 ... Duquesne 13, Miss. State 121938 .....Auburn 6, Michigan State 01939 ......Tennessee 17, Oklahoma 01940 ... Georgia Tech 21, Missouri 71941 ..Miss. State 14, Georgetown 71942 ................ Georgia 40, TCU 261943 .. Alabama 37, Boston College 211944 ..........LSU 19, Texas A&M 141945 .......Tulsa 26, Georgia Tech 121946 .......... Miami 13, Holy Cross 61947 ................. Rice 8, Tennessee 01948 ....Georgia Tech 20, Kansas 141949 ...............Texas 41, Georgia 281950 ...Santa Clara 21, Kentucky 131951 ............ Clemson 15, Miami 141952 .....Georgia Tech 17, Baylor 141953 .......... Alabama 61, Syracuse 61954 .........Oklahoma 7, Maryland 01955 ............... Duke 34, Nebraska 71956 .......Oklahoma 20, Maryland 61957 ........Colorado 27, Clemson 211958 ............Oklahoma 48, Duke 211959 ........Oklahoma 21, Syracuse 61960 ............Georgia 14, Missouri 01961 .............. Missouri 21, Navy 141962 .................LSU 25, Colorado 71963 ........Alabama 17, Oklahoma 01964 ............Nebraska 13, Auburn 71965 ..............Texas 21, Alabama 171966 ........Alabama 39, Nebraska 281967 .... Florida 27, Georgia Tech 121968 .... Oklahoma 26, Tennessee 241969 ........ Penn State 15, Kansas 141970 ........Penn State 10, Missouri 31971 .............. Nebraska 17, LSU 121972 ..........Nebraska 38, Alabama 61973 .... Nebraska 40, Notre Dame 61974 .............. Penn State 16, LSU 91975 ... Notre Dame 13, Alabama 111976 ....... Oklahoma 14, Michigan 61977 ..... Ohio State 27, Colorado 101978 ........Arkansas 31, Oklahoma 61979 ..... Oklahoma 31, Nebraska 241980 ..Oklahoma 24, Florida State 71981 ..Oklahoma 18, Florida State 171982 ........Clemson 22, Nebraska 151983 .............. Nebraska 21, LSU 201984 ........... Miami 31, Nebraska 301985 . Washington 28, Oklahoma 171986 ... Oklahoma 25, Penn State 101987 ........Oklahoma 42, Arkansas 81988 ..........Miami 20, Oklahoma 141989 ............. Miami 23, Nebraska 31990 .....Notre Dame 21, Colorado 61991 .....Colorado 10, Notre Dame 91992 ............. Miami 22, Nebraska 01993 . Florida State 27, Nebraska 141994 . Florida State 18, Nebraska 161995 ........... Nebraska 24, Miami 17
1996 .. Florida State 31, Notre Dame 261997 .. Nebraska 41, Virginia Tech 211998 ......Nebraska 42, Tennessee 171999 ........... Florida 31, Syracuse 102000 ...Michigan 35, Alabama 34 (ot)2001 ..Oklahoma 13, Florida State 22002 ..........Florida 56, Maryland 232003 ..................... USC 38, Iowa 172004 ......Miami 16, Florida State 142005 ...........*USC 55, Oklahoma 192006 . Penn State 26, Florida State 23 (3ot)2007 ... Louisville 24, Wake Forest 132008 ....Kansas 24, Virginia Tech 212009 .... Virginia Tech 20, Cincinnati 72010 ............Iowa 24, Georgia Tech 142011 .......Stanford 40, Virginia Tech 122012 ......West Virginia 70, Clemson 332013 ....Florida State 31, No. Illinois 10
* USC’s participation later vacated

34
ROSE BOWL GAME January 1 • 5:10 p.m. ET • ESPNBCS (Big Ten) vs. BCS (Pac-12)
Rose Bowl Game presented by VIZIO391 South Orange Grove BoulevardPasadena, CA 91184(626) 449-4100; Fax: (626) 449-9066
Executive Director ....................................................William FlinnCAO ............................................................................... Kevin AshMedia Director ................................................................Gina LeheE-mail ..............................................................glehe@rosemail.org
QUICK FACTSField (Capacity) .................................Rose Bowl Stadium (89,105)2012 Result ...........................................Stanford 20, Wisconsin 142012 Attendance .................................................................. 93,3592012 Nielsen Rating ................................................................... 9.4Internet Address ...............................www.tournamentofroses.comMedia Headquarters .........................................The LA Downtown 333 South Figueroa Street, Los Angeles, CA 90071Phone Number ..................................................... (213) 617-1133
TENTATIVE GAME WEEK SCHEDULEDec. 26 - Disneyland Welcome Press ConferenceDec. 27 - Coordinators/Student-Athlete InterviewsDec. 28 - Coordinators/Student-Athlete InterviewsDec. 29 - Media Day Dec. 30 - Head Coaches Press ConferenceJan. 1 - Kickoff (5:10 p.m. ET)
DIRECTIONS FROM AIRPORT TO MEDIA HOTELFROM LOS ANGELES INTERNATIONAL AIRPORT (LAX): Exit airport and turn right (south) at South Sepulveda Boulevard. Head through the tunnel and take ramp on the right to I-105 East. Take the exit onto 110 North toward Los Angeles. Continue on 110 North. Follow signs for 3rd Street. Make a right at Flower Street. Turn right at 5th Street. Make a right at Figueroa Street. Hotel will be on the left.
FROM BOB HOPE AIRPORT (BURBANK): Exit airport on Thornton Avenue going toward North Hollywood Way. Turn left on North Lincoln Street. Turn right on North San Fernando Boulevard. Take ramp on left to I-5 South toward Los Angeles. Take the exit to 110 South/Pasadena Freeway toward Los Angeles. Merge all the way to the right for a quick exit on 4th/6th Street toward Downtown/3rd Street/Wilshire Boulevard. Keep right at the fork and follow signs to 3rd Street. Turn left at South Beaudry Avenue followed by a slight left at West 4th Street. Make a left at South Figueroa (hotel will be on your left).
DIRECTIONS FROM AIRPORT TO ROSE BOWL STADIUMFROM LOS ANGELES INTERNATIONAL AIRPORT (LAX): Exit airport and turn right (south) at South Sepulveda Boulevard. Head through the tunnel and take ramp on the right to the I-105 East. Take the exit onto 110 North toward Los Angeles. Continue on 110 North. Take the Marmion Way/Avenue 64 exit. Make a left to continue on Avenue 64. At fork, veer right on to Melrose Avenue. Make a right on Colorado. Stay to the right to veer onto Linda Vista. Make a slight right onto Seco Street. Veer right to continue on Seco Street. Make a left at Arroyo Blvd. Stadium will be straight ahead.
FROM BOB HOPE AIRPORT (BURBANK): Exit airport on Thornton Avenue going toward North Hollywood Way. Turn left on North Lincoln Street. Turn right on North San Fernando Boulevard. Take ramp on left to I-5 South toward Los Angeles. Merge onto the 134 East. Exit at San Rafael Avenue. Make a left onto Colorado. Make a slight right onto Seco Street. Veer right to continue on Seco Street. Make a left at Arroyo Blvd. Stadium will be straight ahead.

35
ALL-TIME ROSE BOWL GAME RESULTS1902 ................Michigan 49, Stanford 0 1916 ......Washington State 14, Brown 01917 .........................Oregon 14, Penn 01918 ..... Mare Island 19, Camp Lewis 71919 ...... Great Lakes 17, Mare Island 01920 ......................Harvard 7, Oregon 61921 ............California 28, Ohio State 01922 . California 0, Wash. & Jefferson 01923 .................... USC 14, Penn State 31924 ............... Navy 14, Washington 141925 ......... Notre Dame 27, Stanford 101926 ......... Alabama 20, Washington 191927 ...................Alabama 7, Stanford 71928 .................Stanford 7, Pittsburgh 61929 ......... Georgia Tech 8, California 71930 ...................USC 47, Pittsburgh 141931 .. Alabama 24, Washington State 01932 ........................ USC 21, Tulane 121933 .....................USC 35, Pittsburgh 01934 ................. Columbia 7, Stanford 01935 ...............Alabama 29, Stanford 131936 ........................ Stanford 7, SMU 01937 ..........Pittsburgh 21, Washington 01938 .............. California 13, Alabama 01939 .............................. USC 7, Duke 31940 .....................USC 14, Tennessee 01941 ..............Stanford 21, Nebraska 131942 ............. Oregon State 20, Duke 161943 ....................... Georgia 9, UCLA 01944 .................. USC 29, Washington 01945 .....................USC 25, Tennessee 01946 .....................Alabama 34, USC 141947 .....................Illinois 45, UCLA 141948 ......................Michigan 49, USC 01949 .....Northwestern 20, California 141950 ..........Ohio State 17, California 141951 ............. Michigan 14, California 61952 ....................Illinois 40, Stanford 71953 ...................... USC 7, Wisconsin 01954 ........Michigan State 28, UCLA 201955 .................... Ohio State 20, USC 71956 ........Michigan State 17, UCLA 141957 ..............Iowa 35, Oregon State 191958 ................Ohio State 10, Oregon 71959 ...................Iowa 38, California 121960 ......... Washington 44, Wisconsin 81961 .........Washington 17, Minnesota 71962 ................. Minnesota 21, UCLA 31963 .................. USC 42, Wisconsin 371964 ...............Illinois 17, Washington 71965 .........Michigan 34, Oregon State 71966 ........UCLA 14, Michigan State 121967 ........................Purdue 14, USC 131968 ......................... USC 14, Indiana 31969 .................. Ohio State 27, USC 161970 ......................USC 10, Michigan 31971 ............ Stanford 27, Ohio State 171972 ..............Stanford 13, Michigan 121973 .................. USC 42, Ohio State 171974 .................. Ohio State 42, USC 211975 .................. USC 18, Ohio State 17
1976 ............... UCLA 23, Ohio State 101977 ......................USC 14, Michigan 61978 .........Washington 27, Michigan 201979 ....................USC 17, Michigan 101980 .................. USC 17, Ohio State 161981 ...........Michigan 23, Washington 61982 ..................Washington 28, Iowa 01983 .................UCLA 24, Michigan 141984 .......................UCLA 45, Illinois 91985 .................. USC 20, Ohio State 171986 ........................ UCLA 45, Iowa 281987 ......Arizona State 22, Michigan 151988 ...........Michigan State 20, USC 171989 ....................Michigan 22, USC 141990 ....................USC 17, Michigan 101991 ................Washington 46, Iowa 341992 .........Washington 34, Michigan 141993 .........Michigan 34, Washington 311994 ............... Wisconsin 21, UCLA 161995 ..............Penn State 38, Oregon 201996 ............. USC 41, Northwestern 321997 .... Ohio State 20, Arizona State 171998 ..... Mich. 21, Washington State 161999 ............... Wisconsin 38, UCLA 312000 .............. Wisconsin 17, Stanford 92001 ............ Washington 34, Purdue 242002 ................. Miami 37, Nebraska 142003 ...... Okla. 34, Washington State 142004 ....................USC 28, Michigan 142005 .................. Texas 38, Michigan 372006 ........................Texas 41, *USC 382007 ....................USC 32, Michigan 182008 ........................USC 49, Illinois 172009 .................. USC 38, Penn State 242010 ..............Ohio State 26, Oregon 162011 ................... TCU 21, Wisconsin 192012............... Oregon 45, Wisconsin 382013............. Stanford 20, Wisconsin 14
*USC’s participation later vacated.

36
VIZIO BCS NATIONAL CHAMPIONSHIP
January 6 • 8:20 p.m. ET • ESPNBCS (#1) vs. BCS (#2)
VIZIO BCS National Championship391 South Orange Grove BoulevardPasadena, CA 91184(626) 449-4100; Fax: (626) 449-9066
Executive Director .......................................................William FlinnCAO ..................................................................................Kevin AshMedia Director .................................................................. Gina LeheE-mail .................................................................glehe@rosemail.org
QUICK FACTSField (Capacity) ..................................Rose Bowl Stadium (89,105)2013 Result .....Alabama 42, Notre Dame 14 (Miami Gardens, Fla.)2013 Attendance ......................................................................80,1202013 Nielsen Rating ....................................................................15.1Internet Address ............................................... www.bcsfootball.orgMedia Headquarters ............Newport Beach Marriott Hotel & Spa 900 Newport Beach Center Drive, Newport Beach, CA 92660 Phone Number ..................................................... (949) 640-4000
BCS NCG RESULTS2007...............................Florida 41, Ohio State 14 (Glendale, Ariz.)2008............................... LSU 38, Ohio State 24 (New Orleans, La.)2009.......................Florida 24, Oklahoma 14 (Miami Gardens, Fla.)2010.................................. Alabama 37, Texas 21 (Pasadena, Calif.)2011 ................................... Auburn 22, Oregon 19 (Glendale, Ariz.)2012....................................Alabama 21, LSU 0 (New Orleans, La.)2013.................Alabama 42, Notre Dame 14 (Miami Gardens, Fla.)
TENTATIVE GAME WEEK SCHEDULEDec. 31 - Welcome Press Conference at ESPN Zone Jan. 2 - Coordinators/Student-Athlete Press Conference Jan. 3 - Coordinators/Student-Athlete Press ConferenceJan. 4 - Media Day Jan. 5 - Head Coaches Press Conference Jan. 6 - KickoffJan. 7 - Winning Head Coach Press Conference and Trophy Presentation
*All game-week press conferences with the exception of the wel-come press conference will take place at the Newport Beach Marriott Hotel

37
VIZIO BCS NATIONAL CHAMPIONSHIP
DIRECTIONS FROM AIRPORTS TO MEDIA HOTELFrom John Wayne Airport (SNA): Exit airport northwest on Airport Way toward MacArthur Blvd. Turn right onto MacArthur Blvd. Turn slight right onto Jamboree Road. Turn left onto San Joaquin Hills Road. Turn right onto Santa Cruz Drive. Turn right onto Newport Center Drive. End at 900 Newport Center Drive, Newport Beach, CA.
From Los Angeles International Airport (LAX): Exit airport on World Way/Center Way. Merge onto South Sepulveda Boulevard/CA-1 S toward I-105. Take the Imperial Highway West/I-105 E ramp toward Imperial Terminal. Merge onto I-105 E toward Norwalk. Merge onto I-405 S toward Long Beach. Merge onto CA-73 S toward San Diego. Take Exit 15 toward Jamboree Road. Stay straight to go onto SE Bristol Street. Turn right onto Jamboree Road. Turn left onto San Joaquin Hills Road. Turn right onto Santa Cruz Drive. Turn right onto Newport Center Drive. End at 900 Newport Center Drive.
DIRECTIONS FROM AIRPORTS TO ROSE BOWL STADIUMFrom John Wayne Airport (SNA): Exit airport northeast on Airport Way toward MacArthur Blvd. Turn left onto MacArthur Blvd. Merge onto CA-55 N toward Riverside. Merge onto I-5 N via Exit 10B toward Santa Ana. Merge onto I-605 N. Take the Interstate I-210 W/Foothill Freeway exit on the left toward Pasadena. Take the Mountain Street exit, Exit 24, toward Seco Street. Turn left onto West Mountain Street. West Mountain Street becomes Seco Street. Turn right onto North Arroyo Boulevard. End at 1001 Rose Bowl Drive.
From Los Angeles International Airport (LAX): Exit airport going east on World Way/Center Way. Merge onto South Sepulveda Blvd/CA-1 S toward I-105. Take the Imperial Highway West/I-105 E ramp toward Imperial Terminal. Merge onto I-105 E toward Norwalk. Merge onto I-110 N toward Los Angeles. I-110 N becomes CA-110 N. Take the I-5 FWY N/Golden State Freeway exit, Exit 26A, on the left toward Sacramento. Merge onto I-5 N. Merge onto CA-2 N toward Glendale. Merge onto CA-134 E toward Pasadena. Take the San Rafael exit, Exit 12, toward Linda Vista Avenue. Turn right onto North San Rafael Avenue. Turn left onto West Colorado Blvd. Turn slight right onto Linda Vista Avenue/CA-159 N. Turn slight right onto Seco Street. Turn slight right to stay on Seco Street. Turn left onto North Arroyo Boulevard. End at 1001 Rose Bowl Drive.

38
2013-14 FOOTBALL BOWL SCHEDULE(All times Eastern and subject to change)
Dec. 21 Gildan New Mexico Bowl............................... 2:00 pm ................ ESPN Albuquerque, NM • University Stadium (37,457) Phone: (505) 925-5999 Executive Director: Jeff Siembieda, [email protected] Internet Address: www.newmexicobowl.com Mountain West vs. Pac-12
Dec. 21 Famous Idaho Potato Bowl ............................ 5:30 pm ................ ESPN Boise, ID • Bronco Stadium (32,000) Phone: (208) 424-1011 Executive Director: Kevin McDonald, [email protected] Internet Address: www.idahopotatobowl.com MAC vs. MWC
Dec. 21 R+L Carriers New Orleans Bowl ................... 9 p.m. ................. ESPN New Orleans, LA • Mercedes-Benz Superdome (75,000) Phone: (504) 525-5678 Executive Director: Billy Ferrante, [email protected] Internet Address: www.neworleansbowl.org Sun Belt vs. Conference USA
Dec. 21 Las Vegas Bowl ...............................................3:30 pm. ................. ABC Las Vegas, NV • Sam Boyd Stadium (40,000) Phone: (702) 732-3912 Executive Director: Dan Henneke [email protected] Internet Address: www.lvbowl.com Mountain West vs. Pac-12
Dec. 23 Beef ‘O’Brady’s Bowl St. Petersburg .............. 2 pm ................. ESPN St. Petersburg, FL • Tropicana Field (36,048) Phone: 727-290-9865 Executive Director: Brett Dulaney, [email protected] Internet Address: www.stpetersburgbowl.com American vs. Conference USA
Dec. 24 Sheraton Hawai’i Bowl ..................................... 8 pm .................. ESPN Honolulu, HI • Aloha Stadium (50,000) Phone: (808) 523-3688 Executive Director: David A. K. Matlin, [email protected] Internet Address: www.sheratonhawaiibowl.com Conference USA vs. Mountain West
Dec. 26 Little Caesars Pizza Bowl ................................ 6 p.m. ................. ESPN Detroit, MI • Ford Field (65,000) Phone: (313) 262-2010 Executive Director: Ken Hoffman, [email protected] Internet Address: www.littlecaesarspizzabowl.com Big Ten vs. MAC
Dec. 26 San Diego County Credit Union Poinsettia Bowl ........................................................ 9:30 pm ................ ESPN San Diego, CA • Qualcomm Stadium (66,000) Phone: (619) 285-5061 Executive Director: Bruce Binkowski, [email protected] Internet Address: www.poinsettiabowl.net Mountain West vs. Army
Dec. 27 Military Bowl pres. by Northrop Grumman 2:30 pm ................ ESPN Annapolis, MD • Navy-Marine Corps Memorial Stadium (xx,000) Phone: (202) 785-2695 Executive Director: Stephen J. Beck, [email protected] Internet Address: www.militarybowl.org ACC vs. Conference USA

39
2013-14 FOOTBALL BOWL SCHEDULE(All times Eastern and subject to change)
Dec. 27 Texas Bowl .......................................................... 6 pm .................. ESPN Houston, TX • Reliant Stadium (70,000) Phone: (832) 667-2109 Director: Heather Houston, [email protected] Internet Address: www.texasbowl.com Big 12 vs. Big Ten
Dec. 27 Kraft Fight Hunger Bowl .............................. 9:30 pm ............... ESPN San Francisco, CA • AT&T Park (40,184) Phone: (415) 972-1812 Executive Director: Gary Cavalli, [email protected] Internet: www.kraftbowl.org BYU vs. Pac-12
Dec. 28 New Era Pinstripe Bowl ....................................Noon .................. ESPN Bronx, NY • Yankee Stadium (50,086) Phone: (646) 977-8043 Executive Director: Mark Holtzman, [email protected] Internet Address: www.newerapinstripebowl.com Big 12 vs. American
Dec. 28 Belk Bowl ........................................................ 3:20 pm ................ ESPN Charlotte, NC • Bank of America Stadium (73,504) Phone: (704) 644-4048 Executive Director: Will Webb, [email protected] Internet Address: www.belkbowl.com ACC vs. American
Dec. 28 Russell Athletic Bowl ..................................... 6:45 pm ................ ESPN Orlando, FL • Florida Citrus Bowl Stadium (65,438) Phone: (407) 423-2476 CEO: Steve Hogan, [email protected] Internet Address: www.fcsports.com ACC vs. American
Dec. 28 Buffalo Wild Wings Bowl .............................. 10:15 pm ............... ESPN Tempe, AZ • Sun Devil Stadium (56,000) Phone: (480) 350-0900 President/CEO: Dr. Robert N. Shelton, [email protected] Internet Address: www.fiestabowl.org Big Ten vs. Big 12
Dec. 30 Bell Helicopter Armed Forces Bowl .............11:45 a.m. .............. ESPN Dallas, TX • Gerald J. Ford Stadium (32,000) Phone: (817) 810-0012 Executive Director: Brant Ringler, [email protected] Internet Address: www.armedforcesbowl.com Mountain West vs. Navy
Dec. 30 Franklin American Mortgage Music City Bowl .............. 3:15 pm .........................ESPN Nashville, TN • LP Field (67,000) Phone: (615) 743-3122 President/CEO: Scott Ramsey, [email protected] Internet Address: www.musiccitybowl.com ACC vs. SEC
Dec. 30 Valero Alamo Bowl ........................................6:45 pm. ............... ESPN San Antonio, TX • Alamodome (65,000) Phone: (210) 226-2695 President/CEO: Derrick Fox, [email protected] Internet Address: www.valeroalamobowl.com Pac-12 vs. Big 12
Dec. 30 Bridgepoint Education Holiday Bowl ........... 9:45 pm ................ ESPN San Diego, CA • Qualcomm Stadium (66,000) Phone: (619) 283-5808 Executive Director: Bruce Binkowski, [email protected] Internet Address: www.holidaybowl.com Big 12 vs. Pac-12

40
2013-14 FOOTBALL BOWL SCHEDULE(All times Eastern and subject to change)
Dec. 31 AdvoCare V100 ............................................................. 12:30 ...........................ESPN Shreveport, LA • Independence Stadium (49,565) Phone: (318) 221-0712 Executive Director: Missy Setters, [email protected] Internet Address: www.advocare100bowl.com ACC vs. SEC
Dec. 31 Hyundai Sun Bowl .............................................2 pm. .....................CBS El Paso, TX • Sun Bowl Stadium (50,426) Phone: (915) 533-4416 Executive Director: Bernie Olivas, [email protected] Internet Address: www.sunbowl.org ACC vs. Pac-12
Dec. 31 AutoZone Liberty Bowl ...................................4 pm. .................. ESPN Memphis, TN • Liberty Bowl Memorial (62,506) Phone: (901) 795-7700 Executive Director: Steve Ehrhart, [email protected] Internet Address: www.libertybowl.org Conference USA vs. SEC
Dec. 31 Chick-fil-A Bowl ................................................ 8 pm .................. ESPN Atlanta, GA • Georgia Dome (71,147) Phone: (404) 586-8500 CEO: Gary Stokan, [email protected] Internet Address: www.cfabowl.com ACC vs. SEC
Jan. 1 Heart of Dallas Bowl .........................................Noon ................ESPNU Dallas, TX • Cotton Bowl (92,158) Phone: (817) 750-0369 Executive Director: Tom Starr Internet Address: www.heartofdallas.com Big Ten vs. Conference USA
Jan. 1 TaxSlayer.com Gator Bowl .............................. Noon. ................ ESPN2 Jacksonville, FL • EverBank Field (77,000) Phone: (904) 798-1700 President: Rick Catlett, [email protected] Internet Address: www.gatorbowl.com Big Ten vs. SEC
Jan. 1 Outback Bowl ....................................................1 pm. .................. ESPN Tampa, FL • Raymond James Stadium (65,657) Phone: (813) 874-2695 President: Jim McVay, [email protected] Internet Address: www.outbackbowl.com Big Ten vs. SEC
Jan. 1 Capital One Bowl...............................................1 pm. ................... ABC Orlando, FL • Florida Citrus Bowl Stadium (65,438) Phone: (407) 423-2476 CEO: Steve Hogan, [email protected] Internet Address: www.fcsports.com Big Ten vs. SEC
Jan. 1 Rose Bowl Game presented by VIZIO ............ 5 pm .................. ESPN Pasadena, CA • Rose Bowl (91,000) Phone: (626) 449-4100 CAO: Kevin Ash, [email protected] Internet Address: www.tournamentofroses.com **BCS vs. BCS

41
2013-14 FOOTBALL BOWL SCHEDULE(All times Eastern and subject to change)
Jan. 1 Tostitos Fiesta Bowl ........................................ 8:30 pm ................ ESPN Glendale, AZ • University of Phoenix Stadium (73,000) Phone: (480) 350-0900 President: Robert N. Shelton, [email protected] Internet Address: www.fiestabowl.org **BCS vs. BCS
Jan. 2 Allstate Sugar Bowl ........................................ 8:30 pm ................ ESPN New Orleans, LA • Mercedes-Benz Superdome (75,000) Phone: (504) 828-2440 CEO: Paul J. Hoolahan, [email protected] Internet Address: www.Allstatesugarbowl.org **BCS vs. BCS
Jan. 3 AT&T Cotton Bowl Classic .............................. 8 pm .................... FOX Arlington, TX • Cowboys Stadium (71,167) Phone: (817) 892-4800 President: Rick Baker, [email protected] Internet Address: www.attcottonbowl.com Big 12 vs. SEC
Jan. 3 Discover Orange Bowl .................................... 8:30 pm ................ ESPN Miami Gardens, FL • Sun Life Stadium (72,230) Phone: (305) 341-4700 CEO: Eric Poms, [email protected] Internet Address: www.orangebowl.org **BCS vs. BCS
Jan. 4 BBVA Compass Bowl ........................................ 1 pm .................. ESPN Birmingham, AL • Legion Field (71,594) Phone: (205) 733-3776 Executive Director: Mark Meadows, [email protected] Internet Address: www.BBVACompassbowl.com American vs. SEC
Jan. 5 GoDaddy Bowl .................................................. 9 pm .................. ESPN Mobile, AL • Ladd Peebles Stadium (40,646) Phone: (251) 635-0011 Executive Director: Frank Modarelli, [email protected] Internet Address: www.godaddybowl.com Sun Belt vs. MAC Jan. 6 VIZIO BCS National Championship Game .........8:30 pm ................ ESPN Pasadena, CA • Rose Bowl (91,000) Phone: (626) 449-4100 CAO: Kevin Ash, [email protected] Internet Address: www.tournamentofroses.com **BCS vs. BCS
*All times Eastern and subject to change
** - BOWL CHAMPIONSHIP SERIES: Unless a host team qualifies to play in the NCG, the BCS bowls will be hosted by the following conference champions: Rose - Big Ten and Pac-12; Allstate Sugar - SEC; Discover Orange - ACC; Tostitos Fiesta - Big 12.

42
HISTORY OF THE BCSThe Bowl Championship Series, now in its 16th year, was designed to preserve and nurture the rich traditions and many benefits of the bowl system, while providing a means for the nation’s two highest-ranked teams to play annually in a bowl game.
To understand how the BCS developed, it is necessary to understand something of the history of the bowl system. Although the bowl system has existed since 1902 (even predating the creation of the NCAA), the bowls blossomed after World War II. As the bowl games grew over the years, a number of conferences individually developed close relationships with certain bowl committees and began to send their champions to a particular bowl game annually. The most noted of these relationships was the arrangement between the Big Ten and Pacific-10 Conferences and the Pasadena Tournament of Roses Association for the Rose Bowl game. Also, for example, the Southeastern, Big Eight, and Southwest Conferences developed similar relationships with the Sugar, Orange, and Cotton Bowls, respectively.
These relationships proved valuable to both the individual bowls and the conferences. A berth in a particular bowl became the reward for a conference championship. The close ties between institutions in a conference and a particular bowl encouraged fans to travel to the host city and helped the bowls develop solid economic bases, from which they have supported an abundance of educational, charitable, and community initiatives. By the early 1990s, conference-bowl affiliation arrangements had become a vital part of college football. They have proved to be so valuable and useful that they extend well beyond the five BCS bowls and encompass teams other than conference champions. Virtually all of the existing bowl games have individually negotiated affiliation agreements with particular conferences.
Before the BCS, however, the prevalence of affiliation arrangements between conference and bowls usually precluded matchups between the No. 1 and No. 2 teams because the champion of one conference might be committed to participate in one bowl game and the champion of another conference might be committed to play in another game. Only eight times from 1946 until 1991 were the bowls able to pair the two highest-ranked teams.
That limitation of the bowl system became more pronounced in the early 1990s because there was substantial conference expansion. Before then, a number of highly regarded programs played as independents and could participate in any bowl game that invited them. In the early 1990s, however, all of those teams except Notre Dame became members of conferences. And so the ability of any single bowl committee to pair the top two teams declined.
To increase the chances of a matchup between the top two teams in a bowl game, in 1992 several conferences and Notre Dame, along with four bowl committees, developed the Bowl Coalition arrangement. The Coalition did not alter any of the then-existing conference-bowl affiliation arrangements. Instead, the Coalition’s major innovation was the creation of a selection procedure among four bowl games – the Cotton, Fiesta, Orange, and Sugar Bowls – to enhance the chances that the two highest-ranked teams would meet. The Gator and John Hancock (Sun) Bowls later joined the Coalition arrangement.
Given its narrow parameters and aims, the Coalition arrangement was quite successful, pairing the top two teams in the nation in a bowl game in two of the three years it existed. But it had limitations. It could not, for example, pair the champions of the Big Eight and SEC in any bowl game. Likewise, because neither the Big Ten nor the Pac-10 champions participated in the Coalition, the arrangement could not pair either of those teams with an opponent from another conference. It was clear, therefore, that the Coalition arrangement, while helpful, could never guarantee a matchup between No. 1 and No. 2.

43
The Coalition agreement ended after the bowl games of January 1995 at the same time that a number of the existing conference and bowl affiliation agreements expired. The end of the affiliation arrangements presented another opportunity to increase the likelihood of a season-ending bowl pairing of the top two teams. The result was the Bowl Alliance.
The Alliance arrangement involved the champions of the ACC, Big East, Big 12, and SEC, and three bowl games – the Fiesta, Orange, and Sugar Bowls. The Alliance existed for three years covering the bowl games of January 1996, 1997, and 1998. Like the Coalition arrangement, the Alliance created a selection structure for the participating bowls. Each year one of the three Alliance bowls had the right to select the first two teams from a pool of eligible teams consisting of Notre Dame; the champions of the ACC, Big East, Big 12, and SEC; other conference champions if those conferences chose to participate in the arrangement, and highly ranked non-champions from any conference. None of the participating conference champions were committed to play in any bowl game as they had been in the past under the conference-bowl affiliation arrangements. This selection procedure permitted the Alliance bowls to match conference champions in games that would not have been played under the previous conference-bowl affiliation arrangements. For example, after the 1995 regular season, the Alliance arrangement created a national championship game between the only two unbeaten teams in the nation: Nebraska, champion of the Big Eight, and Florida, champion of the SEC.
Like the Coalition, however, the Alliance had limitations. Neither the Big Ten nor the Pac-10 champion was committed to play in one of the Alliance bowls because of their conferences’ relationship with the Rose Bowl game. As the Alliance arrangement neared its end, it became clear that any attempt to further increase the likelihood of creating an annual national championship game would have to include the Big Ten and Pac-10 champions.
In 1996, several conferences began discussions about the possibility of integrating the Big Ten and Pac-10 champions into a bowl arrangement that would allow for an annual pairing of the top two teams in the nation. To make that arrangement possible, the Big Ten, Pac-10, and Rose Bowl game agreed that under certain circumstances, the Big Ten and/or Pac-10 champions would not play their traditional game in Pasadena on New Year’s Day. Similarly, the Rose Bowl game agreed to host a national championship game in rotation with the other bowls. The three bowls that had participated in the Alliance arrangement enthusiastically supported the new approach, and thus was born the BCS. Beginning in 1999, the bowl system could, for the first time in its nearly 100-year history, promise the fans of college football an annual pairing between the top two teams.
A fifth BCS game was added to the yearly rotation beginning with the bowl games of January 2007. Each bowl game, during a four-year period, plays host to its own game as well as to the BCS National Championship Game, with roughly a week between games.
In the fall of 2009, the Presidential Oversight Committee changed the administrative structure of the BCS, doing away with the role of BCS Coordinator – which had previously been held by conference commissioners on a two-year rotating basis – and replacing the position with an executive director. Bill Hancock, former director of the NCAA Men’s Final Four, serves as executive director.
The BCS arrangement has provided numerous benefits to college football and its fans. It has paired teams in national championship games that would not have been possible under the bowl arrangements existing before its creation. It has enhanced the regular season. It has contributed to the growth of the bowl system in general, to the benefit of every Football Bowl Subdivision school. And it has enhanced opportunities for teams from all Bowl Subdivision conferences to participate in the Fiesta, Orange, Rose, and Sugar Bowls.

44
1999 Tostitos Fiesta Bowl (80,470) 1 Tennessee (SEC) .......................................................................23 2 Florida State (ACC)..................................................................16
2000 Allstate Sugar Bowl (79,280) 1 Florida State (ACC)..................................................................46 2 Virginia Tech (Big East) ...........................................................29
2001 FedEx Orange Bowl (76,835) 1 Oklahoma (Big 12) ...................................................................13 2 Florida State (ACC)....................................................................2
2002 Rose Bowl Game (93,781) 1 Miami (Big East) ......................................................................37 2 Nebraska (Big 12) ....................................................................14
2003 Tostitos Fiesta Bowl (77,502) 2 Ohio State (Big Ten) ........................................................ (2ot) 31 1 Miami (Big East) ......................................................................24
2004 Allstate Sugar Bowl (79,342) 2 LSU (SEC) ...............................................................................21 1 Oklahoma (Big 12) ...................................................................14
2005 FedEx Orange Bowl (77,912) 1 *USC (Pac-10) .........................................................................55 2 Oklahoma (Big 12) ...................................................................19
2006 Rose Bowl Game (93,986) 2 Texas (Big 12) ..........................................................................41 1 *USC (Pac-10) .........................................................................38
2007 Tostitos BCS National Championship Game (Glendale) (74,628) 2 Florida (SEC) ...........................................................................41 1 Ohio State (Big Ten) .................................................................14
2008 Allstate BCS National Championship Game (New Orleans) (79,651) 2 LSU (SEC) ...............................................................................38 1 Ohio State (Big Ten) .................................................................24
2009 FedEx BCS National Championship Game (Miami) (78,468) 2 Florida (SEC) ...........................................................................24 1 Oklahoma (Big 12) ...................................................................14
2010 BCS National Championship Game presented by Citi (Pasadena) (94,906) 1 Alabama (SEC).........................................................................38 2 Texas (Big 12) ..........................................................................21
2011 Tostitos BCS National Championship Game (Glendale) (78,603) 1 Auburn (SEC) ...........................................................................22 2 Oregon (Pac-10) .......................................................................192012 Allstate BCS National Championship Game(New Orleans) (78,237) 1. LSU (SEC) .................................................................................0 2. Alabama (SEC).........................................................................212013 Discover BCS National Championship Game(Miami) (80,120) 1. Notre Dame (Independent) .......................................................14 2. Alabama (SEC).........................................................................42
ALL-TIME NCG RESULTS

45
BCS GAME RESULTS1999 Attendance Teams TV RtgSugar ............... 76,503 ...................#4 Ohio State 24, #6 Texas A&M 14 ................11.5Fiesta .............. 80,470 ..................#1 Tennessee 23, #2 Florida State 16 ...............17.2Orange ............. 67,919 ....................... #8 Florida 31, #15 Syracuse 10 ......................8.4Rose................. 93,872 ........................#9 Wisconsin 38, #5 UCLA 31 ....................13.3
2000 Attendance Teams TV RtgSugar ............... 79,280 ................ #1 Florida State 46, #2 Virginia Tech 29 .............17.5Fiesta ............... 71,526 ......................#3 Nebraska 31, #5 Tennessee 21 ....................9.6Orange ............. 70,461 ...................... #8 Michigan 35, #4 Alabama 34 ...................11.4Rose................. 93,731 ..........................#7 Wisconsin 17, Stanford 9 ......................14.1
2001 Attendance Teams TV RtgSugar ............... 64,407 .......................... #3 Miami 37, #7 Florida 20 .......................13.0Fiesta ............... 75,428 ................. #6 Oregon State 41, #11 Notre Dame 9 ..............10.7Orange ............. 76,835 ....................#1 Oklahoma 13, #2 Florida State 2 ................17.8Rose................. 94,392 .........................#4 Washington 34, Purdue 24 .....................14.0
2002 Attendance Teams TV RtgSugar ............... 77,688 ...........................#13 LSU 47, #8 Illinois 34 .........................8.6Fiesta ................74,118 ........................#4 Oregon 38, #3 Colorado 16 ....................11.3Orange ............. 73,640 .......................#5 Florida 56, #10 Maryland 23 .....................9.5Rose................. 93,781 ........................ #1 Miami 37, #2 Nebraska 14 .....................13.9
2003 Attendance Teams TV RtgSugar ............... 74,269 ....................#3 Georgia 26, #14 Florida State 13 ..................9.2Fiesta ............... 77,502 ................. #2 Ohio State 31, #1 Miami 24 (2 OT) ..............17.2Orange ............. 75,971 ............................. #4 USC 38, #5 Iowa 17 ............................9.7Rose................. 86,848 ...............#7 Oklahoma 34, #6 Washington State 14............11.3
2004 Attendance Teams TV RtgSugar ............... 79,342 ......................... #2 LSU 21, #1 Oklahoma 14 ......................14.8Fiesta ............... 73,425 ................. #5 Ohio State 35, #10 Kansas State 28 ................8.5Orange ............. 76,739 ......................#9 Miami 16, #7 Florida State 14 ....................9.1Rose................. 93,849 ..........................#3 USC 28, #4 Michigan 14 ......................14.3
2005 Attendance Teams TV RtgSugar ............... 77,349 .................... #3 Auburn 16, #8 Virginia Tech 13 ...................9.5Fiesta ............... 73,519 ......................... #6 Utah 35, #21 Pittsburgh 7 ........................7.4Orange ............. 77,912 ........................ *#1 USC 55, #2 Oklahoma 19 .....................13.7Rose................. 93,468 ........................#4 Texas 38, #13 Michigan 37 .....................12.4
2006 Attendance Teams TV RtgSugar ............... 74,458 ................... #11 West Virginia 38, #7 Georgia 35 ..................9.0Fiesta ............... 76,196 ...................#4 Ohio State 34, #6 Notre Dame 20................12.9Orange ............. 77,912 ........... #3 Penn State 26, #22 Florida State 23 (3 OT) ........12.2Rose................. 93,986 ............................#2 Texas 41, *#1 USC 38 ........................21.7
2007 Attendance Teams TV RtgSugar ............... 77,781 .......................#4 LSU 41, #11 Notre Dame 14 .....................9.3Fiesta ............... 73,719 .............. #8 Boise State 43, #10 Oklahoma 42 (OT) .............8.4Orange ............. 74,470 .................. #6 Louisville 24, #14 Wake Forest 13 .................7.0Rose................. 93,852 ..........................#5 USC 32, #3 Michigan 18 ......................11.4NCG ................ 74,628 .......................#2 Florida 41, #1 Ohio State 14 ....................17.4
2008 Attendance Teams TVRtgSugar ............... 74,383 ........................ #5 Georgia 41, #10 Hawaii 10 ...................... 7.0Fiesta ............... 70,016 .................. #9 West Virginia 48, #4 Oklahoma 28 .................7.7Orange ..............74,111 .....................#8 Kansas 24, #3 Virginia Tech 21 ...................7.4Rose................. 93,923 ...........................#7 USC 49, #13 Illinois 17 ..................... 11.11NCG ................ 79,651 .........................#2 LSU 38, #1 Ohio State 24 .....................14.4
2009 Attendance Teams TV RtgSugar ............... 71,872 .......................... #6 Utah 31, #4 Alabama 17 .......................7.81Fiesta ............... 72,047 ....................... #3 Texas 24, #10 Ohio State 21 ..................10.37 Orange ............. 73,602 ................. #19 Virginia Tech 20, #12 Cincinnati 7 ..............5.41Rose ................ 93,293 .........................#5 USC 38, #8 Penn State 24 ...................11.73NCG ................ 78,468 ....................... #2 Florida 24, #1 Oklahoma 14 ..................15.82
2010 Attendance Teams TV RtgSugar ............... 65,207 ....................... #5 Florida 51, #3 Cincinnati 24 ......................8.5Fiesta ............... 73,227 ........................ #6 Boise State 17, #4 TCU 10 .......................8.2 Orange ............. 66,131 ......................#10 Iowa 24, #9 Georgia Tech 14 ....................6.8Rose ................ 93,963 .......................#8 Ohio State 26, #7 Oregon 16 ...................13.2NCG ................ 94,906 ..........................#1 Alabama 37, #2 Texas 21 ....................17.17* USC’s participation later vacated.

46
2011 Attendance Teams TV RtgSugar ............... 73,879 .................... *#6 Ohio State 31, #8 Arkansas 26 ...................8.2Fiesta ............... 67,232 .................. #7 Oklahoma 48, NR Connecticut 20 .................6.2 Orange ............. 65,453 ...................#4 Stanford 40, #13 Virginia Tech 14 .................6.8Rose .................94,118 .........................#3 TCU 21, #5 Wisconsin 19......................11.3NCG ................ 78,603 ......................... #1 Auburn 22, #2 Oregon 19 ......................15.3*Ohio State’s participation later vacated.
2012 Attendance Teams TV RtgSugar ............... 64,512 ............. #13 Michigan 23, #11 Virginia Tech 20 (ot) ............6.1Fiesta ............... 69,927 .............. #3 Oklahoma State 41, #4 Stanford 38 (ot) .............9.7 Orange ............. 67,563 ................. #23 West Virginia 70, #15 Clemson 33 ..............4.56Rose ................ 91,245 ......................#5 Oregon 45, #10 Wisconsin 38...................10.2NCG ................ 78,237 ........................... #2 Alabama 21, #1 LSU 0 ......................14.01
2013............. Attendance ......................................Teams ................................. TV RtgSugar ............... 54,178 ...................... #21 Louisville 33, #3 Florida 23 .....................6.2Fiesta ............... 70,242 .....................#4 Oregon 35, #5 Kansas State 17 ..................8.56Orange ............. 72,073 ............#12 Florida State 31, #15 Northern Illinois 10 ..........6.1Rose................. 93,359 ........................#6 Stanford 20, NR Wisconsin 9.4NCG ................80, 120 .....................#Alabama 42, #1 Notre Dame 14
BCS rankings indicated on matchups.

47
BCS BOWL GAME ALL-TIME RECORDS BCS Record NCG Record West Virginia ......................................3-0Auburn ...............................................2-0 ............................... 1-0Boise State .........................................2-0Utah .................................................2-0Kansas ................................................1-0Louisville ...........................................2-0Oklahoma State ..................................1-0Oregon State .......................................1-0Washington.........................................1-0USC ................................................*6-1 ............................. *1-1Florida ................................................5-2 ............................... 2-0LSU .................................................4-1 ............................... 2-1Miami .................................................3-1 ............................... 1-1Texas .................................................3-1 ............................... 1-1Georgia ...............................................2-1Ohio State ..........................................*6-3 .............................. 1-2Wisconsin ...........................................2-3Nebraska ............................................1-1 ............................... 0-1Iowa .................................................1-1Penn State ...........................................1-1Tennessee ...........................................1-1 ............................... 1-0TCU .................................................1-1Alabama .............................................3-2 ............................... 2-0Oregon ................................................2-2 ............................... 0-1Michigan ............................................2-3Oklahoma ...........................................3-5 ............................... 1-3Stanford ..............................................2-2Virginia Tech ......................................1-5 ............................... 0-1Florida State .......................................2-5 ............................... 1-2Arkansas .............................................0-1Clemson .............................................0-1Colorado .............................................0-1Connecticut ........................................0-1Georgia Tech ......................................0-1Hawaii ................................................0-1Kansas State .......................................0-2Maryland ............................................0-1Northern Illinois .................................0-1Pittsburgh ...........................................0-1Purdue ................................................0-1Syracuse .............................................0-1Texas A&M ........................................0-1UCLA .................................................0-1Wake Forest........................................0-1Washington State................................0-1Cincinnati ...........................................0-2Illinois ................................................0-2Notre Dame ........................................0-4 ............................... 0-1*USC’s official record is 5-0 in all BCS games because two appearances were vacated.*Ohio State’s official record is 5-3 because one appearance was vacated.
Most BCS GamesOhio State ........................................... *9Oklahoma ............................................ 8USC ................................................. *7Florida ................................................. 7Florida State ........................................ 7Virginia Tech ....................................... 6LSU .................................................. 5Michigan ............................................. 5Alabama .............................................. 5Oregon ................................................. 5Miami .................................................. 4Wisconsin ............................................ 5Notre Dame ......................................... 4Stanford .............................................. 4Texas .................................................. 4*USC’s official appearance total is five because two appearances were vacated.*Ohio State’s official appearance total is eight because one appearance was vacated.
Highest Winning Percentage by ConferenceMountain West .....................................3-1 ............................... .750Southeastern .......................................17-8 .............................. .680Western Athletic ...................................2-1 .............................. .667Pacific-12 ........................................* 13-7 ............................. . .650Big Ten ...........................................*12-14 .............................. .462Big East ................................................8-7 .............................. .533Big 12 .................................................9-11 .............................. .450Atlantic Coast .....................................3-13 ............................. . .187Mid-American ......................................0-1 ............................... .000Independents ........................................0-4 .............................. .000* The Pac-12’s official record is 10-6 because two USC appearances were vacated. The Big Ten’s official record is 11-13 because one Ohio State appearance was vacated.

48
RESULTS OF BOWL COALITION AND BOWL ALLIANCE GAMES
Bold Italics indicate games involving the No. 1 or No. 2-ranked team in the Associated Press poll that were not part of the Coalition or Alliance arrangements.
BOWL COALITION PAIRINGS
1992-93 Attendance TeamsOrange ..............57,324 ............. #3 Florida State 27, #11 Nebraska 14Fiesta ................70,224 ................ #6 Syracuse 26, #10 Colorado 22Cotton ...............71,615 ............. #5 Notre Dame 28, #4 Texas A&M 3Sugar ...........76,789 ....................#2 Alabama 34, #1 Miami 13Gator ............71,233 ................#14 Florida 27, #12 N.C. State 10Hancock ...........41,622.......................Baylor 20, #22 Arizona 15
1993-94 Attendance TeamsOrange ...........81,536 .............. #1 Florida State 18, #2 Nebraska 16Fiesta .............72,260 ................... #16 Arizona 29, #10 Miami 0Cotton ............69,855 ............ #4 Notre Dame 24, #8 Texas A&M 21Sugar ............75,437 ................ #8 Florida 41, #3 West Virginia 7Gator ............67,205 ...........#18 Alabama 24, #12 North Carolina 10Hancock ...........43,848................. #19 Oklahoma 41, Texas Tech 10
1994-95 Attendance. TeamsOrange ..........81,753 ................... #1 Nebraska 24, #3 Miami 17Fiesta .............73,968 ................. #5 Colorado 41, Notre Dame 24Cotton ............70,218......................#21 USC 55, Texas Tech 14Sugar ............76,224 ................#7 Florida State 23, #5 Florida 17Gator* ..........62,200 ........... #24 Tennessee 45, #15 Virginia Tech 23Hancock ..........50,612..................Texas 35, #14 North Carolina 31Rose.................102,247................#2 Penn State 38, #12 Oregon 20
*- Played at Florida Field, Gainesville, Fla.
BOWL ALLIANCE PAIRINGS
1995-96 Attendance TeamsFiesta .............79,864....................#1 Nebraska 62, #2 Florida 24Orange ...........72,198 ............#8 Florida State 31, #6 Notre Dame 26Sugar ............70,283 ................#13 Virginia Tech 28, #9 Texas 10
1996-97 Attendance TeamsSugar ............78,344 ................#3 Florida 52, #1 Florida State 20Fiesta .............65,106 ..................#7 Penn State 38, #20 Texas 15Orange ...........63,297 .............#6 Nebraska 41, #10 Virginia Tech 21Rose.................100,635............ #4 Ohio State 20, #2 Arizona State 17
1997-98 Attendance TeamsOrange .............74,002................. #2 Nebraska 42, #3 Tennessee 17Sugar ................67,289.............. #4 Florida State 31, #9 Ohio State 14Fiesta ................69,367...............#8 Kansas State 35, #14 Syracuse 18Rose.................101,219..........#1 Michigan 21, #8 Washington State 16

49
1998 Team RatingOct. 26 UCLA 3.04Nov. 2 Ohio State 3.71Nov. 9 Tennessee 3.92Nov. 16 Tennessee 3.77Nov. 23 Tennessee 4.39Nov. 30 Tennessee 4.99Dec. 6 Tennessee 3.47
1999 Team RatingOct. 25 Florida State 3.55Nov. 1 Florida State 3.11Nov. 8 Florida State 2.64Nov. 15 Florida State 2.64Nov. 22 Florida State 2.32Nov. 29 Florida State 2.24Dec. 5 Florida State 2.24
2000 Team RatingOct. 23 Nebraska 3.61Oct. 30 Oklahoma 2.48Nov. 6 Oklahoma 2.76Nov. 13 Oklahoma 2.52Nov. 20 Oklahoma 2.95Nov. 27 Oklahoma 3.96Dec. 3 Oklahoma 3.30
2001 Team RatingOct. 22 Oklahoma 3.06Oct. 29 Nebraska 2.02Nov. 5 Nebraska 2.62Nov. 12 Nebraska 2.20Nov. 19 Nebraska 2.87Nov. 26 Miami 2.92Dec. 3 Miami 2.50Dec. 9 Miami 2.62
2002 Team RatingOct. 21 Oklahoma 3.92Oct. 28 Oklahoma 3.33Nov. 4 Oklahoma 2.04Nov. 11 Ohio State 3.41Nov. 18 Miami 3.69Nov. 25 Miami 2.89Dec. 2 Miami 3.53Dec. 8 Miami 2.93
2003 Team RatingOct. 20 Oklahoma 2.77Oct. 27 Oklahoma 2.45Nov. 3 Oklahoma 2.24Nov. 10 Oklahoma 1.68Nov. 17 Oklahoma 1.80Nov. 24 Oklahoma 1.90Dec. 1 Oklahoma 2.06Dec. 7 Oklahoma 5.11
2004 Team RatingOct. 18 USC 0.9912Oct. 25 USC 0.9843Nov. 1 USC 0.9895Nov. 8 USC 0.9847Nov. 15 USC 0.9808Nov. 22 USC 0.9789Nov. 29 USC 0.9834Dec. 5 USC 0.9770
2005 Team RatingOct. 17 USC 0.9923Oct. 24 Texas 0.9763Oct. 31 USC 0.9767Nov. 7 USC 0.9802Nov. 14 USC 0.9863Nov. 21 USC 0.9807Nov. 28 USC 0.9861Dec. 4 USC 0.9868
2006 Team RatingOct. 15 Ohio State 0.9731Oct. 22 Ohio State 0.9764Oct. 29 Ohio State 0.9864Nov. 5 Ohio State 0.9865Nov. 12 Ohio State 0.9764Nov. 19 Ohio State 1.0000Nov. 26 Ohio State 1.0000Dec. 3 Ohio State 0.9999
2007 Team RatingOct. 14 Ohio State 0.9416Oct. 21 Ohio State 0.9759Oct. 28 Ohio State 0.9756Nov. 4 Ohio State 0.9949Nov. 11 LSU 0.9802Nov. 18 LSU 0.9904Nov. 25 Missouri 0.9781Dec. 2 Ohio State 0.9588
2008 Team RatingOct. 19 Texas 0.9979Oct. 26 Texas 0.9981Nov. 2 Alabama 0.9747Nov. 9 Alabama 0.9814Nov. 16 Alabama 0.9787Nov. 23 Alabama 0.9872Nov. 30 Alabama 0.9713Dec. 7 Oklahoma 0.9757
2009 Team RatingOct. 18 Florida 0.9886Oct. 25 Florida 0.9726Oct. 31 Florida 0.9918Nov. 7 Florida 0.9842Nov. 14 Florida 0.9833Nov. 21 Florida 0.9664Nov. 28 Florida 0.9868Dec. 6 Alabama 0.9978
2010 Team RatingOct. 17 Oklahoma 0.9215Oct. 24 Auburn 0.9371Oct. 31 Oregon 0.9777Nov. 7 Oregon 0.9895Nov. 14 Oregon 0.9753Nov. 21 Oregon 0.9764Nov. 28 Auburn 0.9779Dec. 5 Auburn 0.9866
2011 Team RatingOct. 16 LSU 0.9522Oct. 23 LSU 0.9702Oct. 30 LSU 0.9734Nov. 6 LSU 0.9931Nov. 13 LSU 0.9933Nov. 20 LSU 1.0000Nov. 27 LSU 1.0000Dec. 4 LSU 1.0000
WEEKLY BCS STANDINGS LEADERS

50
2012 Team RatingOct. 14 Alabama 0.9761Oct. 21 Alabama 0.9625Oct. 28 Alabama 0.9759Nov. 4 Alabama 0.9957Nov. 11 Kansas State 0.9674Nov. 18 Notre Dame 0.9973Nov. 25 Notre Dame 0.9979Dec. 2 Notre Dame 0.9978
Most Weeks Ranked #11. Oklahoma 202. Ohio State 15 USC 154. LSU 10 Alabama 106. Florida State 7 Miami 7 Florida 79. Nebraska 5 Tennessee 511. Oregon 412. Auburn 3 Texas 3 Notre Dame 315. Missouri 1 UCLA 1 Kansas State 1
Most Consecutive Weeks Ranked #11. Ohio State 12(all 8 weeks of 2006 and first four weeks of 2007)2. USC 9(all 8 weeks of 2004 and first week of 2005)
WEEKLY BCS STANDINGS LEADERS

51
(Editor’s Note: Many thanks to Bo Carter of the National Football Foundation for compiling this list.)
Noting BCS All-Time Appearances:Texas has appeared in at least one BCS Standings every year since 1998.
Top 15 Schools By Appearance 1. Texas ..........................102 2. Florida ..........................92 Oklahoma .....................92 4. LSU ..............................81 Virginia Tech ................81 6. Oregon ..........................77 7. Ohio State .....................76 8. Michigan ......................75 9. Florida State .................72 10. USC ..............................70 11. Georgia .........................69 12. Wisconsin .....................65 13 Boise State ...................64 14. Nebraska ......................62 15. Miami (Fla.) .................60
Total BCS Standings Appearances by Conferences 1. Southeastern ...............503 2. Big 12 .........................473 3. Big Ten .......................407 4. Atlantic Coast .............350 5. Pacific-12 ...................347 6. Big East ......................170 7. Mountain West ...........129 8. Western Athletic ...........79 9. Independents ................48 10. Conference USA ..........47 11. Mid American ..............36
Total Schools Represented by Conferences: 1. Big 12 ............................14 2. Southeastern ..................12 3. Atlantic Coast ................11 4. Big Ten ..........................10 Pacific-12 ......................10 6. Big East ...........................8 Conference USA .............8 8. Mid American .................7 Western Athletic ..............7 10. Mountain West ...............5 11. Independent .....................1
All-Time BCS Standings Appearances(89 teams have made an appearance in the 117 BCS
Standings; Best All-Time Standing in Bold Underline)

52
Air Force (2)1998 Nov. 16 ...........18 Nov. 23 ...........16
Alabama (58)10 appearances at No. 11999 Oct. 25 ............13 Nov. 1 ...............9 Nov. 8 ...............9 Nov. 15 .............6 Nov. 22 .............8 Nov. 29 ...........11 Dec. 5................42005 Dec. 17..............5 Dec. 24..............5 Oct. 31 ..............4 Nov. 7 ...............3 Nov. 14 .............8 Nov. 21 ...........14 Nov. 28 ...........15 Dec. 4..............132007 Oct. 21 ............24 Oct. 28 ............17 Nov. 4 .............222008 Oct. 19 ..............2 Oct. 26 ..............2 Nov. 2 ...............1 Nov. 9 ...............1 Nov. 16 .............1 Nov. 23 .............1 Nov. 30 ............1 Dec. 7................42009 Oct. 18 ..............2 Oct. 25 ..............2 Nov. 1 ...............3 Nov. 8 ...............2 Nov. 15 .............2 Nov. 22 .............2 Nov. 29 .............2 Dec. 6................12010 Oct. 17 ..............8 Oct. 24 ..............7 Oct. 31 ..............6 Nov. 7 .............11 Nov. 14 ...........11 Nov. 21 ...........11 Nov. 28 ...........16 Dec. 5..............162011 Oct. 16 ..............2 Oct. 23 ..............2 Oct. 30 ..............2 Nov. 6 ...............3 Nov. 13 .............3 Nov. 20 .............2 Nov. 27 .............2 Dec. 4................22012 Oct. 14 ..............1 Oct. 21 ..............1 Oct. 28 ..............1 Nov. 4 ...............1 Nov. 11..............4 Nov. 18 .............2 Nov. 25 .............2 Dec. 2................2
Arizona (21)1998 Oct. 26 ............14 Nov. 2 .............10 Nov. 9 .............10 Nov. 16 .............8 Nov. 23 .............7 Nov. 30 .............6 Dec. 6................72009 Oct. 18 ............22 Oct. 25 ............20 Nov. 1 .............18 Nov. 8 .............17 Dec. 6..............202010 Oct. 17 ............18 Oct. 24 ............15 Oct. 31 ............10 Nov. 7 .............18 Nov. 14 ...........22 Nov. 21 ...........21 Nov. 28 ...........232012 Oct. 28 ............22 Nov. 18 ...........24 Arizona State (18)2004 Oct. 18 ............18 Oct. 25 ............15 Nov. 1 .............18 Nov. 8 .............16 Nov. 15 ...........14 Nov. 22 ...........16 Nov. 29 ...........19 Dec. 5..............192007 Oct. 14 ..............8 Oct. 21 ..............4 Oct. 28 ..............4 Nov. 4 ...............9 Nov. 11..............8 Nov. 18 .............6 Nov. 25 ...........13 Dec. 2..............112011 Oct. 23 ............21 Oct. 30 ............19
Arkansas (31)1998 Oct. 26 ............12 Nov. 2 .............11 Nov. 9 ...............7 Nov. 16 .............9 Nov. 23 ...........13 Nov. 30 ...........13 Dec. 6..............132003 Nov. 24 ...........242006 Oct. 15 ............13 Oct. 22 ............13 Oct. 29 ............13 Nov. 5 .............11 Nov. 12 .............7 Nov. 19 .............6 Nov. 26 .............9 Dec. 3..............122010 Oct. 17 ............23 Oct. 24 ............19 Oct. 31 ............18 Nov. 7 .............15 Nov. 14 ...........13 Nov. 21 ...........12 Nov. 28 .............7 Dec. 5................82011 Oct. 16 ..............9 Oct. 23 ............10 Oct. 30 ..............7 Nov. 6 ...............8 Nov. 13 .............6 Nov. 20 .............3 Nov. 27 .............8 Dec. 4................6
Auburn (45)3 appearances at No. 12004 Oct. 18 ..............4 Oct. 25 ..............4 Nov. 1 ...............3 Nov. 9 ..............3 Nov. 16 .............3 Nov. 23 .............3 Nov. 30 .............3 Dec. 5................32005 Oct. 17 ............18 Oct. 24 ............22 Oct. 31 ............20 Nov. 7 .............20 Nov. 14 ...........13 Nov. 21 ...........10 Nov. 28 ...........10 Dec. 4................92006 Oct. 15 ..............4 Oct. 22 ..............5 Oct. 29 ..............6 Nov. 5 ...............6 Nov. 12 ...........14 Nov. 19 ...........12 Nov. 26 ...........11 Dec. 3................92007 Oct. 14 ............17 Oct. 21 ............22 Oct. 28 ............16 Nov. 4 .............18 Nov. 25 ...........24 Dec. 2..............232010 Oct. 17 ..............4
All-Time BCS Standings Appearances 89 teams have made an appearance in the 117 BCS Standings;
Best All-Time Rank in Bold

53
Oct. 24 ..............1 Oct. 31 ..............2 Nov. 7 ...............2 Nov. 14 .............2 Nov. 21 .............2 Nov. 28 .............1 Dec. 5................12011 Oct. 16 ............20 Oct. 23 ............23 Oct. 30 ............22 Nov. 6 .............20 Nov. 13 ...........24 Nov. 20 ...........24 Dec. 4..............25
Ball State (8)2008 Oct. 19 ............20 Oct. 26 ............16 Nov. 2 .............17 Nov. 9 ............14 Nov. 16 ...........17 Nov. 23 ...........15 Nov. 30 ...........12 Dec. 7..............22
Baylor (7)2010 Oct. 24 ............25 Oct. 31 ............212011 Nov. 6 .............25 Nov. 13 ...........22 Nov. 20 ...........18 Nov. 27 ...........17 Dec. 4..............12
Boise State (64)2003 Nov. 17 ...........23 Nov. 24 ...........19 Dec. 1..............19 Dec. 7..............172004 Oct. 18 ............14 Oct. 25 ............13 Nov. 1 .............12 Nov. 8 .............10 Nov. 15 .............9 Nov. 22 .............7 Nov. 29 .............8 Dec. 5................92006 Oct. 15 ............15 Oct. 22 ............15 Oct. 29 ............14 Nov. 5 ............14 Nov. 12 ...........12 Nov. 19 ...........11 Nov. 26 .............8 Dec. 3................82007 Oct. 28 ............22 Nov. 4 .............20 Nov. 11............18 Nov. 18 ...........19 Nov. 25 ...........25 Dec. 2..............24
2008 Oct. 19 ............12 Oct. 26 ............11 Nov. 2 .............10 Nov. 9 ...............9 Nov. 16 .............9 Nov. 23 .............9 Nov. 30 .............9 Dec. 7................92009 Oct. 18 ..............4 Oct. 25 ..............7 Nov. 1 ...............7 Nov. 8 ...............6 Nov. 15 .............6 Nov. 22 .............6 Nov. 29 .............6 Dec. 6................62010 Oct. 17 ..............3 Oct. 24 ..............3 Oct. 31 ..............4 Nov. 7 ...............4 Nov. 14 .............4 Nov. 21 .............4 Nov. 28 ...........11 Dec. 5..............112011 Oct. 16 ..............5 Oct. 23 ..............4 Oct. 30 ..............5 Nov. 6 ...............5 Nov. 13 ...........10 Nov. 20 .............7 Nov. 27 .............7 Dec. 4................72012 Oct. 14 ............22 Oct. 21 ............21 Oct. 28 ............19 Nov. 18 ...........22 Nov. 25 ...........20 Dec. 2..............19
Boston College (29)2004 Nov. 1 .............25 Nov. 8 .............23 Nov. 15 ...........21 Nov. 22 ...........212005 Oct. 17 ............12 Oct. 24 ............14 Oct. 31 ............19 Nov. 14 ...........24 Nov. 21 ...........18 Nov. 28 ...........20 Dec. 4..............212006 Oct.15 .............20 Oct. 22 ............17 Oct. 29 ............15 Nov. 5 .............22 Nov. 12 ...........20 Nov. 19 ...........18 Dec. 3..............242007 Oct. 14 ..............3 Oct. 21 ..............2 Oct. 28 ..............2 Nov. 4 ...............8 Nov. 11............17 Nov. 18 ...........14 Nov. 25 ...........11 Dec. 2..............142008 Nov. 23 ...........21 Nov. 30 ...........17 Dec. 7..............24
Bowling Green (9)2003 Oct. 27 ............17 Nov. 3 .............16 Nov. 10 ...........23 Nov. 17 ...........20 Nov. 24 ...........20 Dec. 1..............18 Dec. 7..............242004 Nov. 15 ...........25 Nov. 22 ...........25 Brigham Young (29)1999 Nov. 1 .............15 Nov. 8 .............142001 Oct. 29 ............13 Nov. 5 .............13 Nov. 12 ...........13 Nov. 19 ...........13 Nov. 26 ...........12 Dec. 3..............122006 Nov. 12 ...........25 Nov. 19 ...........23 Nov. 26 ...........21 Dec. 3..............202007 Nov. 18 ...........25 Nov. 25 ...........19 Dec. 2..............172008 Oct. 19 ............21 Oct. 26 ............20 Nov. 2 .............15 Nov. 9 .............17 Nov. 16 ...........14 Nov. 23 ...........18 Nov. 30 ...........18 Dec. 7..............162009 Oct. 18 ............16 Nov. 8 .............22 Nov. 15 ...........22 Nov. 22 ...........19 Nov. 29 ...........14 Dec. 6..............14
California (27)2004 Oct. 18 ..............8 Oct. 25 ..............8 Nov. 1 ...............4 Nov. 8 ...............4 Nov. 15 .............4 Nov. 22 .............4 Nov. 29 .............4 Dec. 5................52005 Oct. 17 ............25 Oct. 24 ............23 Oct. 31 ............242006 Oct. 15 ............10 Oct. 22 ............10 Oct. 29 ............10 Nov. 5 ...............8 Nov. 12 ...........15 Nov. 19 ...........19 Nov. 26 ...........18 Dec. 3..............182007 Oct. 14 ............12 Oct. 21 ............212008 Nov. 2 .............212009 Oct. 18 ..............5 Nov. 1 .............20 Nov. 15 ...........25 Nov. 22 ...........22 Nov. 29 ...........19
All-Time BCS Standings Appearances

54
Cincinnati (20)2007 Oct. 14 ............23 Nov. 11............22 Nov. 18 ...........24 Nov. 25 ...........23 Dec. 2..............222008 Nov. 9 .............22 Nov. 16 ...........19 Nov. 23 ...........16 Nov. 30 ...........13 Dec. 7..............122009 Oct. 18 ..............5 Oct. 25 ..............8 Nov. 1 ...............5 Nov. 8 ...............5 Nov. 15 .............5 Nov. 22 .............5 Nov. 29 .............5 Dec. 6................32011 Nov. 6 .............232012 Oct. 14 ............21
Clemson (33)2000 Oct. 23 ..............7 Oct. 30 ............13 Nov. 20 ...........13 Nov. 27 ...........15 Dec. 3..............152006 Oct. 15 ............12 Oct. 22 ............12 Oct. 29 ............19 Nov. 19 ...........242007 Oct. 28 ............25 Nov. 4 .............21 Nov. 11............15 Nov. 18 ...........22 Nov. 25 ...........16 Dec. 2..............152009 Nov. 15 ...........23 Nov. 22 ...........182011 Oct. 16 ..............7 Oct. 23 ..............5 Oct. 30 ............11 Nov. 6 ...............9 Nov. 13 .............7 Nov. 20 ...........17 Nov. 27 ...........20 Dec. 4..............152012 Oct. 14 ............19 Oct. 21 ............18 Oct. 28 ............13 Nov. 4 .............13 Nov. 11............11 Nov. 18 ...........11 Nov. 25 ...........14 Dec. 2..............14
Colorado (13)2001 Nov. 12 ...........14 Nov. 19 ...........15 Nov. 26 .............7 Dec. 3................4 Dec. 9................32002 Oct. 28 ............12 Nov. 18 ...........13 Nov. 25 ...........12 Dec. 2..............12 Dec. 8..............132005 Oct. 24 ............24 Oct. 31 ............22 Nov. 7 .............18
Colorado State (1)2002 Oct. 25 ............15
Connecticut (7)2007 Oct. 21 ............23 Oct. 28 ............13 Nov. 4 .............13 Nov. 11............24 Nov. 18 ...........20 Dec. 2..............252008 Oct. 26 ............25
Florida (92)7 appearances at No. 11998 Oct. 26 ..............7 Nov. 2 ...............5 Nov. 9 ...............5 Nov. 16 .............5 Nov. 23 .............8 Nov. 30 .............7 Dec. 6................81999 Oct. 25 ..............6 Nov. 1 ...............4 Nov. 8 ...............4 Nov. 15 .............4 Nov. 22 .............5 Nov. 29 .............4 Dec. 5..............102000 Oct. 23 ..............6 Oct. 30 ..............6 Nov. 6 ...............5 Nov. 13 .............4 Nov. 20 .............7 Nov. 27 .............7 Dec. 3................72001 Oct. 22 ............11 Oct. 29 ..............8 Nov. 5 ...............7 Nov. 12 .............5 Nov. 19 .............4 Nov. 26 .............2 Dec. 3................6 Dec. 9................52002 Nov. 4 .............14 Nov. 11............14 Nov. 18 ...........14 Nov. 25 ...........132003 Oct. 27 ............21 Nov. 3 .............17 Nov. 10 ...........14 Nov. 17 ...........13 Nov. 24 ...........11 Dec. 1..............14 Dec. 7..............15
2004 Oct. 18 ............22 Nov. 29 ...........22 Dec. 5..............232005 Oct. 17 ............20 Oct. 24 ............19 Oct. 31 ............16 Nov. 7 .............13 Nov. 14 ...........22 Nov. 21 ...........23 Nov. 28 ...........17 Dec. 4..............172006 Oct. 15 ..............6 Oct. 22 ..............6 Oct. 29 ..............4 Nov. 5 ...............4 Nov. 12 .............4 Nov. 19 .............4 Nov. 26 .............4 Dec. 3................22007 Oct. 14 ............15 Oct. 21 ............11 Oct. 28 ............20 Nov. 4 .............15 Nov. 11............12 Nov. 18 ...........12 Nov. 25 ..........10 Dec. 2..............122008 Oct. 19 ............10 Oct. 26 ..............8 Nov. 2 ...............5 Nov. 9 ...............4 Nov. 16 .............4 Nov. 23 .............4 Nov. 30 .............4 Dec. 7................22009 Oct. 18 ..............1 Oct. 25 ..............1 Nov. 1 ...............1 Nov. 8 ...............1 Nov. 15 .............1 Nov. 22 .............1 Nov. 29 .............1 Dec. 6................52010 Nov. 7 .............222012 Oct. 14 ..............2 Oct. 21 ..............2 Oct. 28 ..............7 Nov. 4 ...............6 Nov. 11..............6 Nov. 18 .............4 Nov. 25 .............4 Dec. 2................3
Florida State (72)7 appearances at No. 11998 Oct. 26 ..............5 Nov. 2 ...............6 Nov. 9 ...............4 Nov. 16 ............4 Nov. 23 .............4 Nov. 30 .............4 Dec. 6................21999 Oct. 25 ..............1 Nov. 1 ...............1 Nov. 8 ...............1 Nov. 15 .............1 Nov. 22 .............1 Nov. 29 .............1 Dec. 5 ...............1
All-Time BCS Standings Appearances

55
2000 Oct. 23 ..............5 Oct. 30 ..............3 Nov. 6 ...............2 Nov. 13 ............3 Nov. 20 .............2 Nov. 27 .............2 Dec. 3................22001 Nov. 5 .............142002 Oct. 21 ............12 Nov. 4 .............13 Nov. 11............11 Nov. 18 ...........12 Dec. 2..............14 Dec. 8..............142003 Oct. 20 ..............5 Oct. 27 ..............3 Nov. 3 ...............3 Nov. 10 ...........13 Nov. 17 ...........11 Nov. 24 .............9 Dec. 1................8 Dec. 7................72004 Oct. 18 ..............5 Oct. 25 ..............5 Nov. 1 .............13 Nov. 8 .............12 Nov. 15 .............8 Nov. 22 ...........18 Nov. 29 ...........16 Dec. 5..............162005 Oct. 17 ............11 Oct. 24 ............10 Oct. 31 ..............9 Nov. 7 .............19 Nov. 21 ...........24 Dec. 4..............222008 Oct. 19 ............25 Oct. 26 ............15 Nov. 2 .............22 Nov. 9 .............19 Nov. 23 ...........20 Nov. 30 ...........242010 Oct. 17 ............17 Oct. 24 ............16 Oct. 31 ............24 Nov. 14 ...........25 Nov. 21 ...........22 Nov. 28 ...........22 Dec. 5..............232011 Nov. 13 ...........252012 Oct. 14 ............14 Oct. 21 ............12 Oct. 28 ..............9 Nov. 4 .............10 Nov. 11............10 Nov. 18 ...........10 Nov. 25 ...........13 Dec. 2..............12
Fresno State (5)2005 Oct. 31 ............24 Nov. 7 .............22 Nov. 14 ...........17 Nov. 21 ...........19 Nov. 28 ...........25
Georgia (69)1998 Oct. 26 ..............3 Nov. 16 ...........15 Nov. 23 ...........142000 Oct. 23 ............122001 Nov. 26 ...........152002 Oct. 21 ..............5 Oct. 28 ..............4 Nov. 4 ...............6 Nov. 11..............6 Nov. 18 .............5 Nov. 25 .............4 Dec. 2................3 Dec. 8................32003 Oct. 20 ..............4 Oct. 27 ..............5 Nov. 3 .............10 Nov. 10 .............9 Nov. 17 .............6 Nov. 24 .............7 Dec. 1................7 Dec. 7..............122004 Oct. 18 ............10 Oct. 25 ..............9 Nov. 1 ...............9 Nov. 8 ...............8 Nov. 15 ...........11 Nov. 22 .............8 Nov. 29 .............7 Dec. 5................72005 Oct. 17 ..............4 Oct. 24 ..............4 Oct. 31 ............11 Nov. 7 ...............9 Nov. 14 ...........16 Nov. 21 ...........15 Nov. 28 ...........13 Dec. 4................72007 Oct. 14 ............20 Oct. 21 ............18 Oct. 28 ............10 Nov. 4 .............10 Nov. 11..............9 Nov. 18 .............7 Nov. 25 .............4 Dec. 2................52008 Oct. 19 ..............7 Oct. 26 ..............6 Nov. 2 .............13 Nov. 9 .............10 Nov. 16 ...........11 Nov. 23 ...........11 Nov. 30 ...........16 Dec. 7..............152011 Oct. 23 ............22 Oct. 30 ............18 Nov. 6 .............15 Nov. 13 ...........14 Nov. 20 ...........13 Nov. 27 ...........14 Dec. 4..............162012 Oct. 14 ............11 Oct. 21 ............10 Oct. 28 ..............6 Nov. 4 ...............5 Nov. 11..............5 Nov. 18 .............3 Nov. 25 .............3 Dec. 2................7
Georgia Tech (38)1998 Nov. 16 ...........22 Nov. 23 ...........19 Nov. 30 ...........12 Dec. 6..............141999 Oct. 25 ..............8 Nov. 1 ...............7 Nov. 8 .............15 Nov. 15 ...........132000 Nov. 27 ...........13 Dec. 3..............132005 Nov. 7 .............23 Nov. 21 ...........21 Nov. 28 ...........24 Dec. 4..............242006 Oct. 15 ............19 Oct. 22 ............24 Oct. 29 ............20 Nov. 5 .............18 Nov. 12 ...........18 Nov. 19 ...........16 Nov. 26 ...........222008 Oct. 19 ............18 Nov. 2 .............20 Nov. 23 ...........22 Nov. 30 ...........15 Dec. 7..............142009 Oct. 18 ............12 Oct. 25 ............11 Nov. 1 .............10 Nov. 8 ...............7 Nov. 15 .............7 Nov. 22 .............7 Nov. 29 ...........10 Dec. 6................92011 Oct. 16 ............22 Oct. 30 ............23 Nov. 6 .............21 Nov. 20 ...........23
Hawaii (10)2006 Nov. 26 ...........252007 Oct. 14 ............18 Oct. 21 ............17 Oct. 28 ............14 Nov. 4 .............16 Nov. 11............16 Nov. 18 ...........15 Nov. 25 ...........12 Dec. 2..............102010 Dec. 5..............24
Houston (15)2009 Oct. 18 ............17 Oct. 25 ............18 Nov. 1 .............15 Nov. 8 .............15 Nov. 15 ...........24 Nov. 22 ...........23 Nov. 29 ...........212011 Oct. 16 ............19 Oct. 23 ............17 Oct. 30 ............13 Nov. 6 .............11 Nov. 13 ...........11 Nov. 20 .............8 Nov. 27 .............6 Dec. 4..............19
All-Time BCS Standings Appearances

56
Illinois (11)2001 Nov. 5 .............12 Nov. 12 ...........10 Nov. 19 .............8 Nov. 26 .............8 Dec. 3................8 Dec. 9................82007 Nov. 11............19 Nov. 18 ...........17 Nov. 25 ...........15 Dec. 2..............132011 Oct. 16 ............23
Iowa (37)2002 Oct. 21 ............13 Oct. 28 ............10 Nov. 4 ...............8 Nov. 11..............8 Nov. 18 .............7 Nov. 25 .............5 Dec. 2................5 Dec. 8................52003 Oct. 20 ............15 Oct. 27 ............11 Nov. 3 .............11 Nov. 10 ...........20 Nov. 17 ...........18 Nov. 24 ...........12 Dec. 1..............12 Dec. 7..............132004 Oct. 25 ............23 Nov. 1 .............21 Nov. 8 .............20 Nov. 15 ...........18 Nov. 22 ...........11 Nov. 29 ...........13 Dec. 5..............122006 Oct. 15 ............232009 Oct. 18 ..............6 Oct. 25 ..............4 Nov. 1 ...............4 Nov. 8 .............10 Nov. 15 ...........13 Nov. 22 ...........11 Nov. 29 .............9 Dec. 6..............102010 Oct. 17 ...........15 Oct. 24 ............18 Oct. 31 ............16 Nov. 7 .............13 Nov. 14 ...........20 Nov. 21 ...........24
Iowa State (1)2012 Oct. 24 ............24
Kansas (10)2007 Oct. 14 ............13 Oct. 21 ..............9 Oct. 28 ..............8 Nov. 4 ...............4 Nov. 11..............3 Nov. 18 .............2 Nov. 25 .............5 Dec. 2................82008 Oct. 19 ............232009 Oct. 18 ............25
Kansas State (49)1 appearance at No. 11998 Oct. 26 ..............4 Nov. 2 ...............4 Nov. 9 ...............3 Nov. 16 .............3 Nov. 23 .............3 Nov. 30 .............3 Dec. 6................31999 Oct. 25 ..............5 Nov. 1 ...............6 Nov. 8 ...............5 Nov. 15 .............8 Nov. 22 .............6 Nov. 29 ............6 Dec. 6................52000 Oct. 23 ............10 Nov. 6 .............11 Nov. 13 ...........10 Nov. 20 .............9 Nov. 27 .............9 Dec. 3................92002 Oct. 28 ............15 Nov. 4 .............15 Nov. 11............12 Nov. 18 ...........11 Nov. 25 ...........10 Dec. 2................8 Dec. 8................82003 Nov. 17 ...........19 Nov. 24 ...........16 Dec. 1..............15 Dec. 7..............102010 Oct. 17 ............22 Nov. 7 .............242011 Oct. 16 ............11 Oct. 23 ..............8 Oct. 30 ............14 Nov. 6 .............14 Nov. 13 ...........13 Nov. 20 ...........11 Nov. 27 ...........11 Dec. 4................82012 Oct. 14 ..............4 Oct. 21 ..............3 Oct. 28 ..............2 Nov. 4 ...............2 Nov. 11..............1 Nov. 18 .............6 Nov. 25 .............6 Dec. 2................5
Kentucky (4)2007 Oct. 14 ..............7 Oct. 21 ............14 Nov. 4 .............25 Nov. 11 ...........23
Kent State (3)2012 Nov. 18 ...........23 Nov. 25 ...........17 Dec. 2..............25
Louisiana Tech (3) Oct. 28 ............25 Nov. 4 .............20 Nov. 11............20
Louisville (28)2004 Oct. 18 ............17 Oct. 25 ............17 Nov. 1 .............15 Nov. 8 .............14 Nov. 15 ...........10 Nov. 22 ...........10 Nov. 29 .............9 Dec. 5..............102005 Nov. 7 .............25 Nov. 14 ...........18 Nov. 21 ...........20 Nov. 28 ...........21 Dec. 4..............192006 Oct. 15 ..............7 Oct. 22 ..............8 Oct. 29 ..............5 Nov. 5 ...............3 Nov. 12 ...........10 Nov. 19 .............9 Nov. 26 .............6 Dec. 3................62012 Oct. 14 ............16 Oct. 21 ............16 Oct. 28 ............10 Nov. 4 ...............9 Nov. 11............19 Nov. 18 ...........20 Dec. 2..............21
LSU (81)10 appearances at No. 12001 Dec. 9..............132002 Oct. 21 ............10 Oct. 28 ............14 Nov. 11............112003 Oct. 20 ............12 Oct. 27 ..............7 Nov. 3 ...............7 Nov. 17 .............4 Nov. 24 .............3 Dec. 1................3 Dec. 7................22004 Oct. 18 ............19 Oct. 25 ............20 Nov. 1 .............17 Nov. 8 ............19 Nov. 15 ...........16 Nov. 22 ...........13 Nov. 29 ...........11 Dec. 5..............112005 Oct. 17 ..............6 Oct. 24 ..............8 Oct. 31 ..............8 Nov. 7 ...............7 Nov. 14 .............5 Nov. 21 .............4 Nov. 28 .............4 Dec. 4..............122006 Oct. 15 ............18 Oct. 22 ............16 Oct. 29 ............17 Nov. 5 .............12 Nov. 12 ...........11 Nov. 19 ...........10 Nov. 26 .............5 Dec. 3................42007 Oct. 14 ..............4 Oct. 21 ..............3 Oct. 28 ..............3
All-Time BCS Standings Appearances

57
Nov. 4 ...............2 Nov. 11..............1 Nov. 18 .............1 Nov. 25 .............7 Dec. 2..............122008 Oct. 19 ............13 Oct. 26 ............19 Nov. 2 .............16 Nov. 9 .............20 Nov. 16 ...........182009 Oct. 18 ..............9 Oct. 25 ..............9 Nov. 1 ...............9 Nov. 8 ...............8 Nov. 15 .............8 Nov. 22 ...........15 Nov. 29 ...........13 Dec. 6..............122010 Oct. 17 ..............6 Oct. 24 ............12 Oct. 31 ............10 Nov. 7 ...............5 Nov. 14 .............5 Nov. 21 .............5 Nov. 28 ...........10 Dec. 5..............102011 Oct. 16 ..............1 Oct. 23 ..............1 Oct. 30 ..............1 Nov. 6 ...............1 Nov. 13 .............1 Nov. 20 .............1 Nov. 27 .............1 Dec. 4................12012 Oct. 14 ..............6 Oct. 21 ..............6 Oct. 28 ..............5 Nov. 4 ...............7 Nov. 11..............7 Nov. 18 .............7 Nov. 25 .............7 Dec. 2................8
Marshall (6)1999 Oct. 25 ............14 Nov. 1 .............14 Nov. 15 ...........14 Nov. 22 ...........13 Nov. 29 ...........12 Dec. 5..............12
Maryland (13)2001 Oct. 22 ..............8 Nov. 5 .............15 Nov. 19 ...........12 Nov. 26 ...........11 Dec. 3..............10 Dec. 9..............102003 Dec. 1..............24 Dec. 7..............232006 Nov. 5 .............23 Nov. 12 ...........192008 Nov. 2 .............23 Nov. 16 ...........25
Miami (60)7 appearances at No. 11998 Nov. 23 ...........11 Nov. 30 ...........202000 Oct. 23 ..............4 Oct. 30 ..............5 Nov. 6 ...............3 Nov. 13 .............2 Nov. 20 .............3 Nov. 27 .............3 Dec. 3................32001 Oct. 22 ..............4 Oct. 29 ..............3 Nov. 5 ...............2 Nov. 12 .............2 Nov. 19 .............2 Nov. 26 .............1 Dec. 3................1 Dec. 9................12001 Oct. 21 ..............2 Oct. 28 ..............2 Nov. 4 ...............3 Nov. 11..............2 Nov. 18 .............1 Nov. 25 .............1 Dec. 2................1 Dec. 8................12003 Oct. 20 ..............2 Oct. 27 ..............2 Nov. 3 ...............4 Nov. 10 ...........12 Nov. 17 ...........12 Nov. 24 ...........10 Dec. 1..............10 Dec. 7................92004 Oct. 18 ..............2 Oct. 25 ..............3 Nov. 1 .............10 Nov. 8 .............17 Nov. 15 ...........12 Nov. 22 .............9 Nov. 29 ...........10 Dec. 5..............142005 Oct. 17 ..............8 Oct. 24 ..............7 Oct. 31 ..............6 Nov. 7 ...............4 Nov. 14 .............3 Nov. 21 .............9 Nov. 28 .............9 Dec. 4................82008 Nov. 16 ...........232009 Oct. 18 ............10 Oct. 25 ............19 Nov. 1 .............17 Nov. 8 .............14 Nov. 15 ...........20 Nov. 22 ...........17 Nov. 29 ...........17 Dec. 6..............152010 Oct. 24 ............22 Nov. 14 ...........24
Miami (Ohio) (7)2003 Oct. 27 ............19 Nov. 3 .............21 Nov. 10 ...........16 Nov. 17 ...........14 Nov. 24 ...........13 Dec. 1..............11 Dec. 7..............11
Michigan (75)1998 Nov. 9 .............19 Nov. 16 ...........12 Nov. 23 ...........141999 Oct. 25 ............12 Nov. 1 .............13 Nov. 8 .............12 Nov. 15 ...........10 Nov. 22 ...........10 Nov. 29 .............9 Dec. 5................82000 Oct. 30 ............12 Nov. 20 ...........15 Nov. 27 ...........16 Dec. 3..............162001 Oct. 22 ..............7 Oct. 29 ..............4 Nov. 5 .............10 Nov. 12 ...........11 Nov. 19 ...........102002 Oct. 21 ..............8 Oct. 28 ............13 Nov. 4 .............11 Nov. 11............10 Nov. 18 .............9 Nov. 25 ...........11 Dec. 2..............11 Dec. 8..............112003 Oct. 27 ............13 Nov. 3 ...............8 Nov. 10 .............8 Nov. 17 .............9 Nov. 24 .............4 Dec. 1................4 Dec. 7................42004 Oct. 18 ............13 Oct. 25 ............12 Nov. 1 .............11 Nov. 8 ...............9 Nov. 15 .............7 Nov. 22 ...........12 Nov. 29 ...........14 Dec. 5..............132005 Oct. 24 ............25 Oct. 31 ............21 Nov. 7 .............21 Nov. 14 ...........15 Nov. 21 ..........22 Nov. 28 ...........19 Dec. 4..............202006 Oct. 15 ..............3 Oct. 22 ..............2 Oct. 29 ..............2 Nov. 5 ...............2 Nov. 12 .............2 Nov. 19 .............2 Nov. 26 .............3 Dec. 3................32007 Oct. 14 ............25 Oct. 21 ............20
All-Time BCS Standings Appearances

58
Oct. 28 ............12 Nov. 4 .............12 Nov. 11............212011 Oct. 16 ............18 Oct. 23 ............18 Oct. 30 ............15 Nov. 6 .............24 Nov. 13 ...........18 Nov. 20 ...........15 Nov. 27 ...........16 Dec. 4..............132012 Oct. 21 ............22 Nov. 11............21 Nov. 18 ...........19 Nov. 25 ...........19 Dec. 2..............18
Michigan State (34)1999 Oct. 25 ............15 Nov. 8 .............13 Nov. 15 ...........12 Nov. 22 ...........11 Nov. 29 ...........10 Dec. 5................92003 Oct. 20 ............13 Oct. 27 ............10 Nov. 3 .............20 Nov. 10 ...........242005 Oct. 17 ............242008 Oct. 26 ............21 Nov. 2 .............18 Nov. 9 .............15 Nov. 16 ...........15 Nov. 23 ...........19 Nov. 30 ...........21 Dec. 7..............182010 Oct. 17 ..............7 Oct. 24 ..............5 Oct. 31 ............14 Nov. 7 .............11 Nov. 14 ...........12 Nov. 21 ...........10 Nov. 28 .............8 Dec. 5................92011 Oct. 16 ............16 Oct. 23 ............11 Oct. 30 ............17 Nov. 6 .............17 Nov. 13 ...........15 Nov. 20 ...........14 Nov. 27 ...........13 Dec. 4..............17
Minnesota (14)1999 Nov. 22 ...........14 Nov. 29 ...........14 Dec. 5..............132003 Oct. 27 ............24 Nov. 20 ...........22 Dec. 1..............25 Dec. 7..............252004 Oct. 25 ............252005 Oct. 17 ............22 Oct. 24 ............20 Nov. 7 .............24 Nov. 14 ...........212008 Oct. 19 ............24 Oct. 26 ............17
Mississippi (9)2003 Nov. 3 .............23 Nov. 10 ...........18 Nov. 17 ...........15 Nov. 24 ...........18 Dec. 1..............20 Dec. 7..............192008 Dec. 7..............252009 Oct. 25 ............25 Nov. 22 ...........25
Mississippi State (19)1999 Oct. 25 ............11 Nov. 1 .............12 Nov. 8 .............10 Nov. 15 ...........152000 Oct. 30 ............15 Nov. 6 .............14 Nov. 13 ...........122010 Oct. 17 ............24 Oct. 24 ............21 Oct. 31 ............20 Nov. 7 .............19 Nov. 14 ...........21 Nov. 21 ...........25 Nov. 28 ...........22 Dec. 5..............212012 Oct. 14 ............12 Oct. 21 ............11 Oct. 28 ............15 Nov. 4 .............21
Missouri (32)1 appearance at No. 11998 Oct. 26 ............18 Nov. 9 .............13 Nov. 16 ...........192003 Oct. 27 ...........20 Nov. 3 .............242006 Oct. 15 ............24 Oct. 22 ............202007 Oct. 14 ............16 Oct. 21 ............13 Oct. 28 ..............9 Nov. 4 .............11 Nov. 18 .............4 Nov. 25 .............1 Dec. 2................62008 Oct. 19 ............15 Oct. 26 ............14 Nov. 2 .............14 Nov. 9 .............12 Nov. 16 ...........13 Nov. 23 ...........13 Nov. 30 ...........20 Dec. 7..............212010 Oct. 17 ............11 Oct. 24 ..............6 Oct. 31 ............12 Nov. 7 .............17 Nov. 14 ...........15 Nov. 21 ...........14 Nov. 28 ...........12 Dec. 5..............122011 Nov. 27 ...........25
NC State (5)2002 Oct. 21 ............11 Oct. 28 ..............9 Nov. 4 .............122010 Oct. 31 ............25 Nov. 21 ...........23
Nebraska (68)5 appearances at No. 11998 Oct. 26 ..............6 Nov. 2 .............12 Nov. 9 .............11 Nov. 16 ...........14 Nov. 23 ...........12 Nov. 30 ...........11 Dec. 6..............111999 Oct. 25 ..............7 Nov. 1 ...............8 Nov. 8 ..............6 Nov. 15 .............3 Nov. 22 .............3 Nov. 29 .............3 Dec. 5................32000 Oct. 23 ..............1 Oct. 30 ..............4 Nov. 6 ...............4 Nov. 13 .............8 Nov. 20 .............8 Nov. 27 .............8 Dec. 3................82001 Oct. 22 ..............2 Oct. 29 ..............1 Nov. 5 ...............1 Nov. 12 .............1 Nov. 19 .............1 Nov. 26 .............4 Dec. 3................3 Dec. 9................22003 Oct. 20 ............11 Oct. 27 ..............9 Nov. 3 .............18 Nov. 10 ...........17 Nov. 17 ...........22 Nov. 24 ...........23 Dec. 1..............21 Dec. 7..............202005 Oct. 17 ............232006 Oct. 15 ............17 Oct. 22 ............22 Nov. 12 ...........23 Nov. 19 ...........22 Nov. 26 ...........20 Dec. 3..............232009 Nov. 19 ...........22 Dec. 6..............222010 Oct. 17 ............16 Oct. 24 ............14 Oct. 31 ..............7 Nov. 7 ...............8 Nov. 14 .............8 Nov. 21 ...........15 Nov. 28 ...........13 Dec. 5..............182011 Oct. 16 ............13 Oct. 23 ............14 Oct. 30 ............10 Nov. 6 .............19 Nov. 13 ...........16 Nov. 20 ...........21 Nov. 27 ...........19
All-Time BCS Standings Appearances

59
Dec. 4..............202012 Oct. 28 ............20 Nov. 4 .............16 Nov. 11............14 Nov. 18 ...........14 Nov. 25 ...........12 Dec. 2..............16
Nevada (7)2010 Oct. 24 ............24 Oct. 31 ............23 Nov. 7 .............21 Nov. 14 ...........18 Nov. 21 ...........19 Nov. 28 ...........17 Dec. 5..............15
North Carolina (5)2008 Oct. 26 ............22 Nov. 2 .............19 Nov. 9 .............16 Nov. 16 ...........222009 Nov. 22 ...........24
Northern Illinois (7)2003 Oct. 20 ............10 Oct. 27 ............23 Nov. 3 .............22 Nov. 10 ...........212010 Nov. 28 ...........252012 Nov. 25 ...........21 Dec. 2..............15
Northwestern (13)2000 Nov. 6 .............152005 Oct. 24 ............21 Nov. 21 ...........25 Nov. 28 ...........22 Dec. 4..............252008 Oct. 19 ............22 Nov. 2 .............24 Nov. 23 ...........24 Nov. 30 ...........22 Dec. 7..............232012 Nov. 4 .............24 Nov. 25 ...........22 Dec. 2..............20
Notre Dame (48)3 appearances at No. 11998 Oct. 26 ............16 Nov. 2 .............13 Nov. 9 .............12 Nov. 16 ...........10 Nov. 23 .............92000 Oct. 30 ............14 Nov. 6 .............12 Nov. 13 ...........11 Nov. 20 ...........11 Nov. 27 ...........11 Dec. 3..............112002 Oct. 21 ..............3 Oct. 28 ..............3 Nov. 4 ...............7 Nov. 11..............7 Nov. 18 .............6 Nov. 25 .............7 Dec. 2..............10 Dec. 8................9
2004 Oct. 18 ............23 Nov. 8 .............252005 Oct. 17 ............16 Oct. 24 ............15 Oct. 31 ............14 Nov. 7 .............11 Nov. 14 .............9 Nov. 21 .............8 Nov. 28 .............8 Dec. 4................62006 Oct. 15 ..............8 Oct. 22 ..............9 Oct. 29 ..............9 Nov. 5 ...............9 Nov. 12 .............5 Nov. 19 .............5 Nov. 26 ...........10 Dec. 3..............112009 Oct. 25 ............23 Nov. 1 .............222011 Nov. 20 ...........222012 Oct. 14 ..............5 Oct. 21 ..............5 Oct. 28 ..............3 Nov. 4 ...............4 Nov. 11..............3 Nov. 18 .............1 Nov. 25 .............1 Dec. 2................1
Ohio State (76) 15 appearances at No. 11998 Oct. 26 ..............2 Nov. 2 ...............1 Nov. 9 ...............8 Nov. 16 .............7 Nov. 23 .............6 Nov. 30 .............5 Dec. 6................42000 Oct. 23 ............11 Nov. 6 .............13 Nov. 13 ...........132002 Oct. 21 ..............6 Oct. 28 ..............5 Nov. 4 ...............2 Nov. 11..............1 Nov. 18 .............2 Nov. 25 .............2 Dec. 2................2 Dec. 8................22003 Oct. 20 ..............6 Oct. 27 ..............6 Nov. 3 ...............5 Nov. 10 .............3 Nov. 17 .............2 Nov. 24 .............5 Dec. 1................5 Dec. 7................52004 Nov. 29 ...........25 Dec. 5..............242005 Oct. 17 ............15 Oct. 24 ............13 Oct. 31 ............10 Nov. 7 ...............8 Nov. 14 .............7 Nov. 21 .............6 Nov. 28 .............6 Dec. 4................42006 Oct. 15 ..............1
Oct. 22 ..............1 Oct. 29 ..............1 Nov. 5 ...............1 Nov. 12 .............1 Nov. 19 .............1 Nov. 26 .............1 Dec. 3................12007 Oct. 14 ..............1 Oct. 21 ..............1 Oct. 28 ..............1 Nov. 4 ...............1 Nov. 11..............7 Nov. 18 .............5 Nov. 25 .............3 Dec. 2................12008 Oct. 19 ..............9 Oct. 26 ............12 Nov. 2 .............11 Nov. 9 .............11 Nov. 16 ...........10 Nov. 23 ...........10 Nov. 30 ...........10 Dec. 7..............102009 Oct. 18 ............19 Oct. 25 ............17 Nov. 1 .............16 Nov. 8 .............11 Nov. 15 ...........10 Nov. 22 ...........10 Nov. 29 .............8 Dec. 6................82010 Oct. 17 ............10 Oct. 24 ............11 Oct. 31 ............11 Nov. 7 ...............9 Nov. 14 .............9 Nov. 21 .............8 Nov. 28 .............6 Dec. 5................6
Ohio (1)2012 Oct. 21 ............24
Oklahoma (92)20 appearances at No. 12000 Oct. 23 ..............2 Oct. 30 ..............1 Nov. 6 ...............1 Nov. 13 .............1 Nov. 20 .............1 Nov. 27 .............1 Dec. 3................12001 Oct. 22 ..............1 Oct. 29 ..............2 Nov. 5 ...............3 Nov. 12 .............3 Nov. 19 .............3 Nov. 26 .............9 Dec. 3..............11 Dec. 9..............112002 Oct. 21 ..............1 Oct. 28 ..............1 Nov. 4 ...............1 Nov. 1 ...............4 Nov. 18 .............4 Nov. 25 .............3 Dec. 2................7 Dec. 8................72003 Oct. 20 ..............1
All-Time BCS Standings Appearances

60
Oct. 27 ..............1 Nov. 3 ...............1 Nov. 10 .............1 Nov. 17 .............1 Nov 24 ..............1 Dec. 1................1 Dec. 7................12004 Oct. 18 ..............3 Oct. 25 ..............2 Nov. 1 ...............2 Nov. 8 ...............2 Nov. 15 .............2 Nov. 22 .............2 Nov. 29 .............2 Dec. 5................22005 Oct. 31 ............25 Nov. 14 ...........25 Nov. 28 ...........23 Dec. 4..............232006 Oct. 15 ............22 Oct. 22 ............19 Oct. 29 ............18 Nov. 5 .............17 Nov. 12 ...........17 Nov. 19 ...........15 Nov. 26 ...........12 Dec. 3..............102007 Oct. 14 ..............5 Oct. 21 ..............6 Oct. 28 ..............6 Nov. 4 ...............5 Nov. 11..............4 Nov. 18 ...........10 Nov. 25 .............9 Dec. 2................42008 Oct. 19 ..............4 Oct. 26 ..............4 Nov. 2 ...............6 Nov. 9 ...............5 Nov. 16 .............5 Nov. 23 .............3 Nov. 30 .............2 Dec. 7................12009 Nov. 1 .............242010 Oct. 17 ..............1 Oct. 24 ..............9 Oct. 31 ..............8 Nov. 7 .............16 Nov. 14 ...........14 Nov. 21 ...........13 Nov. 28 .............9 Dec. 5................72011 Oct. 16 ..............3 Oct. 23 ..............9 Oct. 30 ..............6 Nov. 6 ...............6 Nov. 13 .............5 Nov. 20 .............9 Nov. 27 ...........10 Dec. 4..............142012 Oct. 14 ..............9 Oct. 21 ..............8 Oct. 28 ............12 Nov. 4 .............12 Nov. 11............12 Nov. 18 ...........13 Nov. 25 ...........11 Dec. 2..............11
Oklahoma State (51)2003 Oct. 27 ............14 Nov. 3 .............19 Nov. 10 ...........25 Nov. 17 ...........21 Nov. 24 ...........21 Dec. 1..............22 Dec. 7..............212004 Oct. 18 ............21 Oct. 25 ............19 Nov. 1 .............19 Nov. 8 .............22 Nov. 15 ...........22 Nov. 22 ...........22 Nov. 29 ...........24 Dec. 5..............242008 Oct. 19 ..............6 Oct. 26 ..............9 Nov. 2 ...............9 Nov. 9 .............13 Nov. 16 ...........12 Nov. 23 ...........12 Nov. 30 ...........14 Dec. 7..............132009 Oct. 25 ............14 Nov. 1 .............19 Nov. 8 .............19 Nov. 15 ...........12 Nov. 22 ...........12 Nov. 29 ...........20 Dec. 6..............192010 Oct. 17 ............14 Oct. 24 ............17 Oct. 31 ............17 Nov. 7 .............10 Nov. 14 ...........10 Nov. 21 .............9 Nov. 28 ...........14 Dec. 5..............142011 Oct. 16 ..............4 Oct. 23 ..............3 Oct. 30 ..............3 Nov. 6 ...............2 Nov. 13 .............2 Nov. 20 .............4 Nov. 27 .............3 Dec. 4................32012 Oct. 28 ............24 Nov. 11............24 Nov. 18 ...........21 Nov. 25 ...........23
Oregon (77)4 appearances at No. 11998 Oct. 26 ............11 Nov. 9 .............14 Nov. 16 ...........11 Nov. 23 ...........182000 Oct. 23 ..............8 Oct. 30 ..............7 Nov. 6 ...............7 Nov. 13 .............7 Nov. 20 ...........10 Nov. 27 ...........10 Dec. 3..............102001 Oct. 22 ............13 Oct. 29 ............10 Nov. 5 ...............6 Nov. 12 .............4 Nov. 19 .............5
Nov. 26 .............5 Dec. 3................5 Dec. 9................42002 Oct. 21 ............152005 Oct. 17 ............13 Oct. 24 ............11 Oct. 31 ............13 Nov. 7 .............10 Nov. 14 ...........10 Nov. 21 .............7 Nov. 28 .............7 Dec. 4................52006 Oct. 15 ............14 Oct. 22 ............23 Oct. 29 ............22 Nov. 5 .............20 Nov. 12 ...........242007 Oct. 14 ............10 Oct. 21 ..............5 Oct. 28 ..............5 Nov. 4 ...............3 Nov. 11..............2 Nov. 18 .............9 Nov. 25 ...........172008 Oct. 26 ............24 Nov. 16 ...........24 Nov. 23 ...........23 Nov. 30 ...........19 Dec. 7..............172009 Oct. 18 ............11 Oct. 25 ............10 Nov. 1 ...............8 Nov. 8 .............13 Nov. 15 ...........11 Nov. 22 .............8 Nov. 29 .............7 Dec. 6................72010 Oct. 17 ..............2 Oct. 24 ..............2 Oct. 31 ..............1 Nov. 7 ...............1 Nov. 14 .............1 Nov. 21 .............1 Nov. 28 .............2 Dec. 5................22011 Oct. 16 ............10 Oct. 23 ..............7 Oct. 30 ..............8 Nov. 6 ...............7 Nov. 13 .............4 Nov. 20 ...........10 Nov. 27 .............9 Dec. 4................52012 Oct. 14 ..............3 Oct. 21 ..............4 Oct. 28 ..............4 Nov. 4 ...............3 Nov. 11..............2 Nov. 18 .............5 Nov. 25 .............5 Dec. 2................4
All-Time BCS Standings Appearances

61
Oregon State (25)2000 Oct. 30 ............11 Nov. 6 ...............9 Nov. 13 .............9 Nov. 20 .............5 Nov. 27 .............6 Dec. 3................62006 Nov. 5 .............24 Nov. 26 ...........24 Dec. 3..............222008 Nov. 16 ...........21 Nov. 23 ...........172009 Oct. 18 ............15 Nov. 8 .............23 Nov. 15 ...........19 Nov. 22 ...........16 Nov. 29 ...........16 Dec. 6..............182012 Oct. 14 ..............8 Oct. 21 ..............7 Oct. 28 ............11 Nov. 4 .............11 Nov. 11............16 Nov. 18 ...........15 Nov. 25 ...........15 Dec. 2..............13
Penn State (51)1998 Oct. 26 ............10 Nov. 2 ...............9 Nov. 9 .............18 Nov. 16 ...........171999 Oct. 25 ..............2 Nov. 1 ...............2 Nov. 8 ...............7 Nov. 15 ...........11 Nov. 22 ...........12 Nov. 29 ...........13 Dec. 5..............112002 Nov. 11............15 Nov. 18 ...........15 Nov. 25 ...........14 Dec. 2..............13 Dec. 8..............122005 Oct. 17 ............10 Oct. 24 ..............9 Oct. 31 ..............7 Nov. 7 ...............5 Nov. 14 .............4 Nov. 21 .............3 Nov. 28 .............3 Dec. 4................32006 Nov. 19 ..........252007 Oct. 21 ............25 Nov. 4 .............232008 Oct. 19 ..............3 Oct. 26 ..............3 Nov. 2 ...............3 Nov. 9 ..............8 Nov. 16 ............8 Nov. 23 .............8 Nov. 30 .............8 Dec. 7............... 82009 Oct. 18 ............13 Oct. 25 ............12 Nov. 1 .............11 Nov. 8 .............18 Nov. 15 ...........14 Nov. 22 ...........13 Nov. 29 ...........11
Dec. 6..............132011 Oct. 16 ............21 Oct. 23 ............19 Oct. 30 ............16 Nov. 6 .............12 Nov. 13 ...........21 Nov. 20 ...........19 Nov. 27 ...........21 Dec. 4..............22
Pittsburgh (20)2003 Nov. 3 .............25 Nov. 10 ...........19 Nov. 17 ...........25 Nov. 24 ...........252004 Nov. 29 ...........23 Dec. 5..............212008 Dec. 19............17 Nov. 9 .............21 Nov. 16 ...........20 Nov. 23 ...........25 Nov. 30 ...........23 Dec. 7..............202009 Oct. 18 ............20 Oct. 25 ............15 Nov. 1 .............13 Nov. 8 .............12 Nov. 15 .............9 Nov. 22 .............9 Nov. 29 ...........15 Dec. 6..............17
Purdue (14)2000 Oct. 23 ............15 Oct. 30 ............10 Nov. 6 .............102001 Oct. 29 ............142003 Oct. 20 ..............8 Oct. 27 ............18 Nov. 3 .............14 Nov. 10 ...........11 Nov. 17 ...........16 Nov. 24 ...........14 Dec. 1..............13 Dec. 7..............142004 Oct. 18 ............12 Oct. 25 ............21
Rutgers (13)2006 Oct. 15 ............16 Oct. 22 ............12 Oct. 29 ............12 Nov. 5 .............13 Nov. 12 .............6 Nov. 19 ...........14 Nov. 26 ...........13 Dec. 3..............162012 Oct. 14 ............15 Oct. 21 ............15 Nov. 4 .............23 Nov. 11............22 Nov. 18 ...........18
San Jose State (2)2012 Nov. 25 ...........25 Dec. 2..............24
South Carolina (33)2001 Oct. 22 ............15 Dec. 3..............15 Dec. 9..............142005 Nov. 14 ...........232007 Oct. 14 ..............6 Oct. 21 ............162008 Nov. 9 .............252009 Oct. 18 ............24 Oct. 25 ............222010 Oct. 17 ............21 Oct. 24 ............20 Oct. 31 ............19 Nov. 7 .............23 Nov. 14 ...........17 Nov. 21 ...........18 Nov. 28 ...........19 Dec. 5..............202011 Oct. 16 ............14 Oct. 23 ............13 Oct. 30 ..............9 Nov. 6 .............13 Nov. 13 ...........12 Nov. 20 ...........12 Nov. 27 ...........12 Dec. 4................92012 Oct. 14 ..............7 Oct. 21 ............13 Oct. 28 ..............8 Nov. 4 ...............8 Nov. 11..............9 Nov. 18 ...........12 Nov. 25 ...........10 Dec. 2..............10
USC (70)15 appearances at No. 11998 Nov. 16 ...........202002 Oct. 21 ............14 Oct. 28 ............11 Nov. 4 ...............9 Nov. 11..............9 Nov. 18 .............8 Nov. 25 .............6 Dec. 2................4 Dec. 8................52003 Oct. 20 ..............7 Oct. 27 ..............4 Nov. 3 ...............2 Nov. 10 .............2 Nov. 17 .............3 Nov. 24 .............2 Dec. 1................2 Dec. 7................32004 Oct. 18 ..............1 Oct. 25 ..............1 Nov. 1 ...............1 Nov. 8 ...............1 Nov. 15 .............1 Nov. 22 .............1 Nov. 29 .............1 Dec. 5................12005 Oct. 17 ..............1 Oct. 24 ..............2 Oct. 31 ..............1 Nov. 7 ...............1 Nov. 14 .............1 Nov. 21 .............1 Nov. 28 .............1 Dec. 4................1
All-Time BCS Standings Appearances

62
2006 Oct. 15 ..............2 Oct. 22 ..............3 Oct. 29 ..............8 Nov. 5 ...............7 Nov. 12 .............3 Nov. 19 .............3 Nov. 26 .............2 Dec. 3................52007 Oct. 14 ............14 Oct. 21 ............12 Oct. 28 ............19 Nov. 4 .............17 Nov. 11............11 Nov. 18 ...........11 Nov. 25 .............8 Dec. 2................72008 Oct. 19 ..............5 Oct. 26 ..............5 Nov. 2 ...............7 Nov. 9 ...............6 Nov. 16 .............6 Nov. 23 .............5 Nov. 30 .............5 Dec. 7................52009 Oct. 18 ..............7 Oct. 25 ..............5 Nov. 1 .............12 Nov. 8 ...............9 Nov. 15 ...........18 Nov. 22 ...........20 Nov. 29 ...........18 Dec. 6..............242012 Oct. 14 ............10 Oct. 21 ..............9 Oct. 28 ............17 Nov. 4 .............19 Nov. 11............18
Southern Miss (8)1999 Nov. 22 ...........152000 Oct. 23 ............142004 Nov. 1 .............232011 Oct. 30 ............25 Nov. 6 .............22 Nov. 13 ...........20 Nov. 27 ...........24 Dec. 4..............21
Stanford (35)2001 Oct. 22 ............14 Oct. 29 ..............6 Nov. 5 .............11 Nov. 12 .............9 Nov. 19 .............9 Nov. 26 ...........10 Dec. 3................9 Dec. 9................92009 Nov. 15 ...........17 Nov. 29 ...........24 Dec. 6..............212010 Oct. 17 ............12 Oct. 24 ............13 Oct. 31 ............13 Nov. 7 ...............6 Nov. 14 .............6 Nov. 21 .............6 Nov. 28 .............4 Dec. 5................42011 Oct. 16 ..............8 Oct. 23 ..............6
Oct. 30 ..............4 Nov. 6 ...............4 Nov. 13 .............9 Nov. 20 .............6 Nov. 27 .............4 Dec. 4................42012 Oct. 14 ............20 Oct. 21 ............17 Oct. 28 ............14 Nov. 4 .............14 Nov. 11............13 Nov. 18 .............8 Nov. 25 .............8 Dec. 2................6
Syracuse (5)1998 Oct. 26 ............20 Nov. 2 .............17 Nov. 30 ...........15 Dec. 6..............152001 Nov. 12 ...........15
TCU (50)2000 Oct. 23 ............13 Oct. 30 ..............9 Nov. 20 ...........14 Nov. 27 ...........14 Dec. 3..............142003 Oct. 20 ............14 Oct. 27 ............12 Nov. 3 ...............9 Nov. 10 .............6 Nov. 17 .............8 Nov. 24 ...........17 Dec. 1..............17 Dec. 7..............182005 Oct. 17 ............21 Oct. 24 ............18 Oct. 31 ............18 Nov. 7 .............17 Nov. 14 ...........14 Nov. 21 ...........13 Nov. 28 ...........14 Dec. 4..............142008 Oct. 19 ............14 Oct. 26 ............13 Nov. 2 .............12 Nov. 9 .............18 Nov. 16 ...........16 Nov. 23 ...........14 Nov. 30 ...........11 Dec. 7..............112009 Oct. 18 ..............8 Oct. 25 ..............6 Nov. 1 ...............6 Nov. 8 ...............4 Nov. 15 .............4 Nov. 22 .............4 Nov. 29 .............4 Dec. 6................42010 Oct. 17 ..............5 Oct. 24 ..............4 Oct. 31 ..............3 Nov. 7 ...............3 Nov. 14 .............3 Nov. 21 .............3 Nov. 28 .............3 Dec. 5................32011 Nov. 13 ...........19 Nov. 20 ...........20
Nov. 27 ...........18 Dec. 4..............18 Nov. 25 .............8 Dec. 2................62012 Oct. 14 ............23 Tennessee (52)Five appearances at No. 11998 Oct. 26 ..............3 Nov. 2 ...............2 Nov. 9 ...............1 Nov. 16 .............1 Nov. 23 .............1 Nov. 30 .............1 Dec. 6................11999 Oct. 25 ..............4 Nov. 1 ...............5 Nov. 8 ...............2 Nov. 15 .............5 Nov. 22 .............4 Nov. 29 .............5 Dec. 5................52001 Oct. 22 ..............9 Oct. 29 ..............7 Nov. 5 ...............4 Nov. 12 .............7 Nov. 19 .............7 Nov. 26 .............6 Dec. 3................2 Dec. 9................62003 Oct. 27 ............15 Nov. 3 .............13 Nov. 10 .............7 Nov. 17 .............7 Nov. 24 .............8 Dec. 1................9 Dec. 7................82004 Oct. 18 ..............9 Oct. 25 ............11 Nov. 1 ...............8 Nov. 8 .............15 Nov. 15 ...........17 Nov. 22 ...........15 Nov. 29 ...........15 Dec. 5..............152005 Oct. 17 ............192006 Oct. 15 ............11 Oct. 22 ............11 Oct. 29 ............11 Nov. 5 .............16 Nov. 12 ...........22 Nov. 19 ...........20 Nov. 26 ...........16 Dec. 3..............172007 Oct. 14 ............21 Nov. 4 .............24 Nov. 11............20 Nov. 18 ...........18 Nov. 25 ...........14 Dec. 2..............16
All-Time BCS Standings Appearances

63
Texas (102)Three appearances at No. 11998 Nov. 2 .............14 Nov. 9 .............15 Nov. 16 ...........231999 Oct. 25 ............10 Nov. 1 .............11 Nov. 8 .............11 Nov. 15 .............9 Nov. 22 .............9 Nov. 29 ...........11 Dec. 5..............152000 Nov. 13 ...........14 Nov. 20 ...........12 Nov. 27 ...........12 Dec. 3..............122001 Oct. 22 ..............6 Oct. 29 ..............5 Nov. 5 .............11 Nov. 12 .............6 Nov. 19 .............6 Nov. 26 .............3 Dec. 3................7 Dec. 9................72002 Oct. 21 ............10 Oct. 28 ..............7 Nov. 4 ...............4 Nov. 11..............5 Nov. 18 ...........10 Nov. 25 .............9 Dec. 2................9 Dec. 8..............102003 Oct. 27 ............22 Nov. 3 .............12 Nov. 10 .............5 Nov. 17 .............5 Nov. 24 .............6 Dec. 1................6 Dec. 7................62004 Oct. 18 ............11 Oct. 25 ............10 Nov. 1 ...............7 Nov. 8 ...............6 Nov. 15 .............5 Nov. 22 .............5 Nov. 29 .............5 Dec. 5................42005 Oct. 17 ..............2 Oct. 24 ..............1 Oct. 31 ..............2 Nov. 7 ...............2 Nov. 14 .............2 Nov. 21 .............2 Nov. 28 .............2 Dec. 4................22006 Oct. 15 ..............9 Oct. 22 ..............7 Oct. 29 ..............7 Nov. 5 ...............5 Nov. 12 ...........13 Nov. 19 ...........13 Nov. 26 ...........13 Dec. 3..............19
2007 Oct. 14 ............22 Oct. 21 ............19 Oct. 28 ............15 Nov. 4 .............14 Nov. 11............13 Nov. 18 ...........13 Nov. 25 ...........20 Dec. 2..............192008 Oct. 19 ..............1 Oct. 26 ..............1 Nov. 2 ...............4 Nov. 9 ...............3 Nov. 16 .............3 Nov. 23 .............2 Nov. 30 .............3 Dec. 7................32009 Oct. 18 ..............3 Oct. 25 ..............3 Nov. 1 ...............2 Nov. 8 ...............3 Nov. 15 .............3 Nov. 22 .............3 Nov. 29 .............3 Dec. 6................22010 Oct. 17 ............192011 Oct. 16 ............24 Oct. 23 ............24 Oct. 30 ............21 Nov. 6 .............16 Nov. 13 ...........23 Nov. 20 ...........25 Nov. 27 ...........22 Dec. 4..............242012 Oct. 14 ............25 Oct. 21 ............23 Oct. 28 ............23 Nov. 4 .............17 Nov. 11............15 Nov. 18 ...........16 Nov. 25 ...........18 Dec. 2..............23
Texas A&M (38)1998 Oct. 26 ..............8 Nov. 2 ...............7 Nov. 9 ...............6 Nov. 16 .............6 Nov. 23 .............5 Nov. 30 .............8 Dec. 6................61999 Nov. 29 ...........15 Dec. 5..............142000 Nov. 13 ...........152004 Oct. 18 ............16 Oct. 25 ............14 Nov. 1 .............22 Nov. 8 .............21 Nov. 15 ...........20 Nov. 22 ...........19 Nov. 29 ...........20 Dec. 5..............202006 Oct. 22 ............21 Oct. 29 ............21 Nov. 5 .............25 Nov. 26 ...........23 Dec. 3..............212010 Nov. 7 .............25 Nov. 14 ...........19 Nov. 21 ...........17 Nov 28 ............18
Dec. 5..............172011 Oct. 16 ............17 Oct. 23 ............162012 Oct. 14 ............18 Oct. 21 ............20 Oct. 28 ............16 Nov. 4 .............15 Nov. 11..............8 Nov. 18 .............9 Nov. 25 .............9 Dec. 2................9
Texas Tech (25)2004 Nov. 29 ...........21 Dec. 5..............222005 Oct. 17 ..............7 Oct. 24 ............16 Oct. 31 ............15 Nov. 7 .............12 Nov. 14 ...........19 Nov. 21 ...........16 Nov. 28 ...........16 Dec. 4..............152007 Oct. 14 ............242008 Oct. 19 ..............8 Oct. 26 ..............7 Nov. 2 ...............2 Nov. 9 ...............2 Nov. 16 .............2 Nov. 23 .............7 Nov. 30 .............7 Dec. 7................72011 Oct. 23 ............202012 Oct. 14 ............17 Oct. 21 ............14 Oct. 28 ............18 Nov. 4 .............22 Nov. 11............23
Toledo (1)2012 Nov. 4 .............25
Tulane (7)1998 Oct. 26 ............19 Nov. 2 .............16 Nov. 9 .............16 Nov. 16 ...........16 Nov. 23 ...........11 Nov. 30 ...........10 Dec. 6..............10
Tulsa (4)2006 Oct. 15 ............252008 Oct. 19 ............19 Oct. 26 ............18 Nov. 9 .............23
UAB (1)2004 Oct. 18 ............24
UCF (1)2010 Dec. 5..............25
All-Time BCS Standings Appearances

64
UCLA (24)One appearance at No. 11998 Oct. 26 ..............1 Nov. 2 ...............3 Nov. 9 ...............2 Nov. 16 .............2 Nov. 23 .............2 Nov. 30 .............2 Dec. 6................52001 Oct. 22 ..............3 Oct. 29 ..............92003 Oct. 27 ............252005 Oct. 17 ..............9 Oct. 24 ..............6 Oct. 31 ..............5 Nov. 7 .............15 Nov. 14 ...........11 Nov. 21 ...........12 Nov. 28 ...........12 Dec. 4..............162006 Dec. 3..............252012 Nov. 4 .............18 Nov. 11............17 Nov. 18 ...........17 Nov. 25 ...........16 Dec. 2..............17
USF (10)2007 Oct. 14 ..............2 Oct. 21 ............10 Oct. 28 ............18 Nov. 18 ...........23 Nov. 25 ...........21 Dec. 2..............212008 Oct. 19 ............16 Oct. 26 ............232009 Nov. 1 .............25 Nov. 8 .............24
Utah (36)2003 Nov. 17 ...........24 Nov. 24 ...........22 Dec. 1..............23 Dec. 7..............222004 Oct. 18 ..............7 Oct. 25 ..............6 Nov. 1 ...............6 Nov. 8 ...............7 Nov. 15 .............6 Nov. 22 .............6 Nov. 29 .............6 Dec. 5................62008 Oct. 19 ............11 Oct. 26 ............10 Nov. 2 ...............8 Nov. 9 ...............7 Nov. 16 .............7 Nov. 23 .............6 Nov. 30 .............6 Dec. 7................62009 Oct. 18 ............18 Oct. 25 ............16 Nov. 1 .............14 Nov. 8 .............16 Nov. 15 ...........21 Nov. 22 ...........21 Nov. 29 ...........25 Dec. 6..............232010 Oct. 17 ..............9 Oct. 24 ..............8
Oct. 31 ..............5 Nov. 7 .............14 Nov. 14 ..........23 Nov. 21 ...........20 Nov. 28 ...........10 Dec. 5..............19
Utah State (2)2012 Nov. 25 ...........24 Dec. 2..............22
UTEP (5)2004 Oct. 25 ............24 Nov. 1 .............24 Nov. 8 .............24 Nov. 15 ...........24 Nov. 24 ...........22
Virginia (22)1998 Oct. 26 ............15 Nov. 2 .............15 Nov. 16 ...........21 Nov. 23 ...........17 Nov. 30 ...........14 Dec. 6..............122004 Oct. 18 ............15 Oct. 25 ............16 Nov. 1 .............14 Nov. 8 .............11 Nov. 15 ...........19 Nov. 22 ...........17 Nov. 29 ...........18 Dec. 5..............182007 Oct. 14 ............19 Oct. 21 ............15 Oct. 28 ............23 Nov. 4 .............19 Nov. 11............14 Nov. 18 ...........16 Nov. 25 ...........22 Dec. 2..............20
Virginia Tech (81)1998 Nov. 9 .............201999 Oct. 25 ..............3 Nov. 1 ...............3 Nov. 8 ...............3 Nov 15 ..............2 Nov. 22 .............2 Nov. 29 .............2 Dec. 5................22000 Oct. 23 ..............3 Oct. 30 ..............2 Nov. 6 ...............8 Nov. 13 .............6 Nov. 20 .............6 Nov. 27 .............5 Dec. 3................52001 Oct. 22 ..............5 Oct. 29 ............152002 Oct. 21 ..............4 Oct. 28 ..............6 Nov. 4 .............102003 Oct. 20 ..............3 Oct. 27 ............16 Nov. 3 ...............6 Nov. 10 ...........15 Nov. 17 ...........172004 Oct. 18 ............25
Oct. 25 ............22 Nov. 1 .............20 Nov. 8 .............18 Nov. 15 ...........15 Nov. 22 ...........14 Nov. 29 ...........12 Dec. 5................82005 Oct. 17 ..............3 Oct. 24 ..............3 Oct. 31 ..............3 Nov. 7 ...............6 Nov. 14 .............6 Nov. 21 .............5 Nov. 28 .............5 Dec. 4..............102006 Oct. 29 ............25 Nov. 5 .............21 Nov. 12 ...........21 Nov. 19 ...........17 Nov. 26 ...........14 Dec. 3..............152007 Oct. 14 ............11 Oct. 21 ..............8 Oct. 28 ............11 Nov. 4 .............11 Nov. 11............10 Nov. 18 .............8 Nov. 25 .............6 Dec. 2................32008 Nov. 30 ...........25 Dec. 7..............192009 Oct. 18 ............14 Oct. 25 ............13 Nov. 1 .............23 Nov. 8 .............21 Nov. 15 ...........15 Nov. 22 ...........14 Nov. 29 ...........12 Dec. 6..............112010 Oct. 17 ............25 Oct. 24 ............23 Oct. 31 ............22 Nov. 7 .............20 Nov. 14 ...........16 Nov. 21 ...........16 Nov. 28 ...........15 Dec. 5..............132011 Oct. 16 ............12 Oct. 23 ............12 Oct. 30 ............12 Nov. 6 .............10 Nov. 13 .............8 Nov. 20 .............5 Nov. 27 .............5 Dec. 4..............11
Wake Forest (8)2006 Oct. 29 ............24 Nov. 5 .............19 Nov. 12 ...........16 Nov. 19 ...........21 Nov. 26 ...........17 Dec. 3..............142007 Oct. 28 ............242008 Nov. 9 .............24
All-Time BCS Standings Appearances

65
Washington (17)2000 Oct. 23 ..............9 Oct. 30 ..............8 Nov. 6 ...............6 Nov. 13 .............5 Nov. 20 .............4 Nov. 27 .............4 Dec. 3................42001 Oct. 22 ............12 Oct. 29 ............11 Nov. 5 ...............8 Nov. 19 ...........11 Nov. 26 ...........14 Dec. 3..............14 Dec. 9..............152011 Oct. 16 ............252012 Nov. 11............25 Nov. 18 ...........25
Washington State (26)2001 Oct. 22 ............10 Oct. 29 ............12 Nov. 5 ...............9 Nov. 12 .............8 Nov. 19 ...........14 Nov. 26 ...........13 Dec. 3..............13 Dec. 9..............122002 Oct. 21 ..............7 Oct. 28 ..............8 Nov. 4 ...............5 Nov. 11..............3 Nov. 18 .............3 Nov. 25 .............8 Dec. 2................6 Dec. 8................62003 Oct. 20 ..............9 Oct. 27 ..............8 Nov. 3 .............15 Nov. 10 ...........10 Nov. 17 ...........10 Nov. 24 ...........15 Dec. 1..............16 Dec. 7..............162006 Oct. 22 ............25 Oct. 29 ............23
West Virginia (46)2002 Dec. 2..............25 Dec. 8..............152004 Oct. 18 ............20 Oct. 25 ............18 Nov. 1 .............16 Nov. 8 .............13 Nov. 15 ...........23 Nov. 22 ...........232005 Oct. 17 ............17 Oct. 24 ............17 Oct. 31 ............17 Nov. 7 .............14 Nov. 14 ...........12 Nov. 21 ...........11 Nov. 28 ...........11 Dec. 4..............112006 Oct. 15 ..............5 Oct. 22 ..............4 Oct. 29 ..............3 Nov. 5 .............10 Nov. 12 .............8 Nov. 19 .............7
Nov. 26 ...........15 Dec. 3..............132007 Oct. 14 ..............9 Oct. 21 ..............7 Oct. 28 ..............7 Nov. 4 ...............7 Nov. 11..............6 Nov. 18 .............3 Nov. 25 .............2 Dec. 2................92008 Nov. 2 .............252009 Oct. 18 ............23 Oct. 25 ............21 Nov. 8 .............25 Nov. 29 ...........23 Dec. 6..............162010 Oct. 17 ............20 Nov. 28 ...........24 Dec. 5..............222011 Oct. 16 ............15 Oct. 23 ............25 Oct. 30 ............24 Nov. 27 ...........23 Dec. 4..............232012 Oct. 14 ............13 Oct. 21 ............19 Oct. 28 ............21
Wisconsin (65)1998 Oct. 26 ..............9 Nov. 2 ...............8 Nov. 9 ...............9 Nov. 16 ...........13 Nov. 23 ...........10 Nov. 30 .............9 Dec. 6................91999 Oct. 25 ..............9 Nov. 1 .............10 Nov. 8 ...............8 Nov. 15 .............7 Nov. 22 .............7 Nov. 29 .............7 Dec. 5................72004 Oct. 18 ..............6 Oct. 25 ..............7 Nov. 1 ...............5 Nov. 8 ...............5 Nov. 15 ...........13 Nov. 22 ...........20 Nov. 29 ...........17 Dec. 5..............172005 Oct. 17 ............14 Oct. 24 ............12 Oct. 31 ............12 Nov. 7 .............16 Nov. 14 ...........20 Nov. 21 ...........17 Nov. 28 ...........18 Dec. 4..............182006 Oct. 25 ............21 Oct. 22 ............18 Oct. 29 ............16 Nov. 5 .............15 Nov. 12 .............9 Nov. 19 .............8 Nov. 26 .............7 Dec. 3................72007 Oct. 28 ............21 Nov. 11............25 Nov. 18 ...........21
Nov. 25 ...........18 Dec. 2..............182009 Oct. 18 ............21 Nov. 1 .............21 Nov. 8 .............20 Nov. 15 ...........16 Dec. 6..............252010 Oct. 17 ............13 Oct. 24 ............10 Oct. 31 ..............9 Nov. 7 ...............7 Nov. 14 .............7 Nov. 21 .............7 Nov. 28 .............5 Dec. 5................52011 Oct. 16 ..............6 Oct. 23 ............15 Oct. 30 ............20 Nov. 6 .............18 Nov. 13 ...........17 Nov. 20 ...........16 Nov. 27 ...........15 Dec. 4..............102012 Oct. 21 ............25
All-Time BCS Standings Appearances

66
FIN
AL
2012
BO
WL
CH
AM
PIO
NSH
IP S
ERIE
S ST
AN
DIN
GS
Har
ris I
nter
activ
e U
SA T
oday
And
erso
n
C
olle
y
C
ompu
ter
BCS
Prev
ious
Team
Ran
k Po
ints
%
R
ank
Poin
ts
%
& H
este
r
Billi
ngsle
y
Mat
rix
Mas
sey
Saga
rin
Wol
fe
%
Ran
k A
vg.
Ran
k(To
t)1.
N
otre
Dam
e (12
-0)
1 28
66
.996
9 1
1470
.9
966
1 1
1 1
1 1
1.00
00
1 .9
978
1 (.9
979)
2.
Ala
bam
a (1
2-1)
2
2765
.9
617
2 14
17
.960
7 4
2 4
3 3
3 .9
100
3 .9
441
2 (.9
236)
3.
Flor
ida
(11-
1)
4 24
80
.862
6 4
1287
.8
725
2 6
2 2
2 2
.960
0 2
.898
4 4
(.888
2)4.
O
rego
n (1
1-1)
3
2548
.8
863
3 13
13
.890
2 6
4 6
6 5
6 .8
100
6 .8
621
5 (.8
626)
5.
Kan
sas S
tate
(11-
1)
6 23
32
.811
1 6
1190
.8
068
3 3
5 8
4 7
.850
0 4
.822
6 6
(.773
5)6.
St
anfo
rd (1
1-2)
7
2142
.7
450
8 10
47
.709
8 5
5 3
5 6
4 .8
500
4 .7
683
8 (.7
299)
7.
Geo
rgia
(11-
2)
5 23
88
.830
6 5
1216
.8
244
10
10
11
11
9 11
.6
200
11
.758
3 3
(.891
1)8.
LS
U (1
0-2)
8
2128
.7
402
7 11
11
.753
2 8
8 9
4 7
5 .7
600
7 .7
511
7 (.7
357)
9.
Texa
s A&
M (1
0-2)
9
1991
.6
925
9 10
39
.704
4 11
11
10
9
11
9 .6
300
10
.675
6 9
(.686
1)10
. So
uth
Car
olin
a (1
0-2)
10
1838
.6
393
10
947
.642
0 9
9 8
10
8 8
.700
0 9
.660
4 10
(.66
89)
11.
Okl
ahom
a (1
0-2)
11
14
45
.607
0 11
90
5 .6
136
7 7
7 7
10
10
.730
0 8
.650
2 11
(.61
29)
12.
Flor
ida
Stat
e (11
-2)
12
1655
.5
757
12
853
.578
3 17
14
15
24
21
15
.3
600
16
.504
7 13
(.46
45)
13.
Ore
gon
Stat
e (9-
3)
14
1280
.4
452
14
663
.449
5 13
15
13
13
12
13
.5
200
12
.471
6 15
(.37
90)
14.
Cle
mso
n (1
0-2)
13
14
85
.516
5 13
76
9 .5
214
15
13
14
20
18
.3
700
15
.469
3 14
(.45
70)
15.
No.
Illin
ois (
12-1
) 16
99
8 .3
471
16
495
.335
6 21
12
16
25
12
.300
0 19
.3
276
21 (.
1936
)16
. N
ebra
ska
(10-
3)
18
710
.247
0 21
32
8 .2
224
12
20
12
12
15
14
.510
0 13
.3
264
12 (.
5393
)17
. U
CLA
(9-4
) 17
79
1 .2
751
19
408
.276
6 18
24
18
15
16
21
.3
100
17
.287
2 16
(.33
04)
18.
Mic
higa
n (8
-4)
22
525
.182
6 22
27
8 .1
885
16
22
19
14
14
16
.390
0 14
.2
537
19 (.
2094
)19
. Bo
ise S
tate
(10-
2)
15
1058
.3
680
15
569
.385
8
19
.000
0 31
.2
513
20 (.
2030
)20
. N
orth
wes
tern
(9-3
) 20
68
2 .2
372
17
444
.301
0 19
25
21
22
20
.160
0 21
.2
327
22 (.
1865
)21
. Lo
uisv
ille (
10-2
) 19
70
5 .2
452
18
409
.277
3 24
23
.0
200
29
.180
8 N
R22
. U
tah
Stat
e (10
-2)
21
660
.229
6 20
33
4 .2
264
17
25
19
.0
800
23
.178
7 24
(.11
71)
23.
Texa
s (8-
4)
24
230
.080
0 25
97
.0
658
14
21
22
16
13
24
.310
0 17
.1
519
18 (.
2492
)24
. Sa
n Jo
se S
tate
(10-
2) 2
6 19
9 .0
692
24
110
.074
6 20
18
17
23
17
.260
0 20
.1
346
25 (.
0974
)25
. K
ent S
tate
(11-
2)
23
330
.1148
26
84
.0
569
16
20
.060
0 25
.0
772
17 (.
2512
)
EXPL
AN
ATIO
N:
Poll
Aver
age -
Tea
m p
erce
ntag
es a
re d
eriv
ed b
y di
vidi
ng a
team
’s ac
tual
rank
ing
poin
ts b
y a
max
imum
282
7 po
ssib
le p
oint
s in
the H
arri
s Int
erac
tive P
oll a
nd 1
475
poss
ible
poi
nts i
n th
e USA
Tod
ay/E
SPN
Coa
ches
Pol
l.C
ompu
ter A
vera
ge -
Six
com
pute
r ran
king
s cal
cula
ted
in in
vers
e poi
nts o
rder
(25
for #
1, 2
4 fo
r #2,
etc.)
are
use
d to
det
erm
ine t
he o
vera
ll co
mpu
ter c
ompo
nent
.Th
e bes
t and
wor
st ra
nkin
g fo
r eac
h te
am is
dro
pped
, and
the r
emai
ning
four
are
add
ed a
nd d
ivid
ed b
y 10
0 (th
e max
imum
pos
sible
poi
nts)
to p
rodu
ce a
Com
pute
r Ran
king
s Per
cent
age.
The s
ix co
mpu
ter r
anki
ng
prov
ider
s are
And
erso
n &
Hes
ter,
Ric
hard
Bill
ings
ley,
Col
ley
Mat
rix,
Ken
neth
Mas
sey,
Jeff
Saga
rin,
and
Pet
er W
olfe
. Eac
h co
mpu
ter r
anki
ng a
ccou
nts f
or sc
hedu
le st
reng
th in
its f
orm
ula.

67
Team .......................O14 O21 O28 N4 N11 N18 N25 D2 Notre Dame ...............5 5 3 4 3 1 1 1 Alabama ..................1 1 1 1 4 2 2 2 Florida .......................2 2 7 6 6 4 4 3 Oregon ......................3 4 4 3 2 5 5 4 Kansas State ..............4 3 2 2 1 6 6 5 Stanford ....................20 17 14 14 13 8 8 6 Georgia.....................11 10 6 5 5 3 3 7 LSU ...........................6 6 5 7 7 7 7 8 Texas A&M ..............18 20 16 15 8 9 9 9 South Carolina ..........7 13 8 8 9 12 10 10 Oklahoma ..................9 8 12 12 12 13 11 11 Florida State .............14 12 9 10 10 10 13 12 Oregon State .............8 7 11 11 16 15 15 13 Clemson ...................19 18 13 13 11 11 14 14 Northern Illinois ....... -- -- -- -- -- -- 21 15 Nebraska .................. -- -- 20 16 14 14 12 16 UCLA ....................... -- -- -- 18 17 17 16 17 Michigan .................. -- 22 -- -- 21 19 19 18 Boise State ...............22 21 19 -- -- 22 20 19 Northwestern ............ -- -- -- 24 20 -- 22 20 Louisville .................16 16 10 9 19 20 -- 21 Utah State ................. -- -- -- -- -- -- 24 22 Texas ........................25 23 23 17 15 16 18 23 San Jose State .......... -- -- -- -- -- -- 25 24 Kent State ................. -- -- -- -- -- 23 17 25 USC ..........................10 9 17 19 18 -- -- -- Mississippi State ......12 11 15 21 -- -- -- -- West Virginia ...........13 19 21 -- -- -- -- -- Rutgers .....................15 15 -- 23 22 18 -- -- Texas Tech ...............17 14 18 22 23 -- -- -- Cincinnati ................21 -- -- -- -- -- -- -- TCU .........................23 -- -- -- -- -- -- -- Iowa State ...............24 -- -- -- -- -- -- -- Ohio ........................... 24 -- -- -- -- -- -- Wisconsin ................... 25 -- -- -- -- -- -- Arizona .................... -- -- 22 -- -- 24 -- -- Oklahoma State ........ -- -- 24 -- 24 21 23 -- Louisiana Tech ......... -- -- 25 20 -- -- -- -- Toledo ...................... -- -- -- 25 -- -- -- -- Washington .............. -- -- -- -- 25 25 -- --
2012 BCS Standings Week-by-Week

68
FIN
AL
2011
BO
WL
CH
AM
PIO
NSH
IP S
ERIE
S ST
AN
DIN
GS
Har
ris I
nter
activ
e U
SA T
oday
And
erso
n
C
olle
y
C
ompu
ter
BCS
Prev
ious
Team
Ran
k Po
ints
%
R
ank
Poin
ts
%
& H
este
r
Billi
ngsle
y
Mat
rix
Mas
sey
Saga
rin
Wol
fe
%
Ran
k A
vg.
Ran
k(To
t)1.
LS
U (1
3-0)
1
2875
1.
0000
1
1475
1.
0000
1
1 1
1 1
1 1.
0000
1
1.00
00
1 (1
.000
0)2.
A
laba
ma
(11-
1)
2 27
23
.947
1 2
1399
.9
485
3 3
3 3
2 2
.930
0 3
.941
9 2
(.955
1)3.
O
klah
oma
Stat
e (11
-1) 3
26
54
.923
1 3
1367
.9
268
2 2
2 2
3 3
.950
0 2
.933
3 3
(.871
2)4.
St
anfo
rd (1
1-1)
4
2504
.8
710
4 12
86
.871
9 4
4 5
8 10
7
.800
0 5
.847
6 4
(.855
9)5.
O
rego
n (1
1-2)
5
2372
.8
250
5 12
32
.835
3 12
5
8 10
9
6 .7
100
8 .7
901
9 (.6
862)
6.
Ark
ansa
s (10
-2)
7 21
63
.752
3 7
1112
.7
539
7 8
12
5 4
4 .8
000
5 .7
687
8 (.7
003)
7.
Boise
Sta
te (1
1-1)
6
2236
.7
777
6 11
28
.764
7 9
6 7
12
12
8 .6
800
9 .7
408
7 (.7
027)
8.
Kan
sas S
tate
(10-
2)
10
1733
.6
028
10
878
.595
3 5
7 4
4 5
5 .8
500
4 .6
827
11 (.
5702
)9.
So
uth
Car
olin
a (1
0-2)
9
1833
.6
376
9 97
1 .6
583
8 12
11
9
8 9
.670
0 10
.6
553
12 (.
5684
)10
. W
iscon
sin (1
1-2)
8
2060
.7
165
8 10
85
.735
6 15
10
15
16
19
12
.4
600
14
.637
4 15
(.45
76)
11.
Virg
inia
Tec
h (1
1-2)
11
14
98
.521
0 11
83
5 .5
661
13
11
13
14
21
17
.470
0 13
.5
190
5 (.7
811)
12.
Bayl
or (9
-3)
16
1228
.4
271
16
599
.406
1 10
17
10
6
7 11
.6
600
11
.497
7 17
(.39
10)
13.
Mic
higa
n (1
0-2)
12
14
47
.503
3 12
78
9 .5
349
11
16
9 19
22
18
.4
000
15
.479
4 16
(.43
10)
14.
Okl
ahom
a (9
-3)
19
933
.324
5 19
43
7 .2
963
6 9
6 7
6 10
.7
600
7 .4
603
10 (.
6710
)15
. C
lem
son
(10-
3)
14
1351
.4
699
14
657
.445
4 19
15
18
20
17
13
.3
500
16
.421
8 20
(.19
79)
16.
Geo
rgia
(10-
3)
18
1095
.3
809
18
538
.364
7 14
20
16
11
11
14
.4
900
12
.411
9 14
(.53
48)
17.
Mic
higa
n St
ate (
10-3
) 13
1428
.4
967
13
735
.498
3 20
13
21
24
24
22
.1
700
21
.388
3 13
(.53
69)
18.
TCU
(10-
2)
15
1245
.4
330
15
631
.427
8 22
14
19
23
18
15
.3
000
17
.386
9 18
(.33
10)
19.
Hou
ston
(12-
1)
17
1132
.3
937
17
542
.367
5 16
19
14
21
25
19
.2
900
18
.350
4 6
(.739
9)20
. N
ebra
ska
(9-3
) 20
71
7 .2
494
20
402
.272
5 17
18
17
25
23
20
.2
600
19
.260
6 19
(.25
78)
21.
Sout
hern
Miss
(11-
2) 2
1 71
1 .2
473
21
366
.248
1
22
22
16
.080
0 25
.1
918
24 (.
0724
)22
. Pe
nn S
tate
(9-3
) 23
38
3 .1
332
23
189
.128
1 21
21
20
23
.1
300
24
.130
5 21
(.13
82)
23.
Wes
t Vir
gini
a (9
-3)
22
522
.181
6 22
27
8 .1
885
24
.0
000
29
.123
3 23
(.12
41)
24.
Texa
s (7-
5)
34
6 .0
021
34
1 .0
007
18
23
13
13
24
.2
600
19
.087
6 22
(.13
34)
25.
Aub
urn
(7-5
) 31
15
.0
052
36
.0
000
25
24
17
14
21
.1
700
21
.058
4 N
R
EXPL
AN
ATIO
N:
Poll
Aver
age -
Tea
m p
erce
ntag
es a
re d
eriv
ed b
y di
vidi
ng a
team
’s ac
tual
rank
ing
poin
ts b
y a
max
imum
282
5 po
ssib
le p
oint
s in
the H
arri
s Int
erac
tive P
oll a
nd 1
525
poss
ible
poi
nts i
n th
e USA
Tod
ay/E
SPN
Coa
ches
Pol
l.C
ompu
ter A
vera
ge -
Six
com
pute
r ran
king
s cal
cula
ted
in in
vers
e poi
nts o
rder
(25
for #
1, 2
4 fo
r #2,
etc.)
are
use
d to
det
erm
ine t
he o
vera
ll co
mpu
ter c
ompo
nent
.Th
e bes
t and
wor
st ra
nkin
g fo
r eac
h te
am is
dro
pped
, and
the r
emai
ning
four
are
add
ed a
nd d
ivid
ed b
y 10
0 (th
e max
imum
pos
sible
poi
nts)
to p
rodu
ce a
Com
pute
r Ran
king
s Per
cent
age.
The s
ix co
mpu
ter r
anki
ng
prov
ider
s are
And
erso
n &
Hes
ter,
Ric
hard
Bill
ings
ley,
Col
ley
Mat
rix,
Ken
neth
Mas
sey,
Jeff
Saga
rin,
and
Pet
er W
olfe
. Eac
h co
mpu
ter r
anki
ng a
ccou
nts f
or sc
hedu
le st
reng
th in
its f
orm
ula.

69
Team .......................O16 O23 O30 N6 N13 N20 N27 D4 LSU ...........................1 1 1 1 1 1 1 1 Alabama ..................2 2 2 3 3 2 2 2 Oklahoma State .........4 3 3 2 2 4 3 3 Stanford .....................8 6 4 4 9 6 4 4 Oregon .....................10 7 8 7 4 10 9 5 Arkansas ...................9 10 7 8 6 3 8 6 Boise State ................5 4 5 5 10 7 7 7 Kansas State .............11 8 14 14 13 11 11 8 South Carolina .........14 13 9 13 12 12 12 9 Wisconsin ..................6 15 20 18 17 16 15 10 Virginia Tech ............12 12 12 10 8 5 5 11 Baylor ...................... -- -- -- 25 22 18 17 12 Michigan ..................18 18 15 24 18 15 16 13 Oklahoma ..................3 9 6 6 5 9 10 14 Clemson ....................7 5 11 9 7 17 20 15 Georgia..................... -- 22 18 15 14 13 14 16 Michigan State .........16 11 17 17 15 14 13 17 TCU ......................... -- -- -- -- 19 20 18 18 Houston ....................19 17 13 11 11 8 6 19 Nebraska ..................13 14 10 19 16 21 19 20 Southern Miss .......... -- -- 25 22 20 -- 24 21 Penn State ................21 19 16 12 21 19 21 22 West Virginia ...........15 25 24 -- -- -- 23 23 Texas ........................24 24 21 16 23 25 22 24 Auburn ....................20 23 22 20 24 24 -- 25 Texas A&M ..............17 16 -- -- -- -- -- -- Georgia Tech ............22 -- 23 21 -- 23 -- -- Illinois ......................23 -- -- -- -- -- -- -- Washington ..............25 -- -- -- -- -- -- -- Texas Tech ............... -- 20 -- -- -- -- -- -- Arizona State ........... -- 21 19 -- -- -- -- -- Cincinnati ................. -- -- -- 23 -- -- -- -- Florida State ............. -- -- -- -- 25 -- -- -- Notre Dame .............. -- -- -- -- -- 22 -- -- Missouri ................... -- -- -- -- -- -- 25 --
2011 BCS Standings Week-by-Week

70
FIN
AL
2010
BO
WL
CH
AM
PIO
NSH
IP S
ERIE
S ST
AN
DIN
GS
Har
ris I
nter
activ
e U
SA T
oday
And
erso
n
C
olle
y
C
ompu
ter
BCS
Prev
ious
Team
Ran
k Po
ints
%
R
ank
Poin
ts
%
& H
este
r B
illin
gsle
y
Mat
rix
Mas
sey
Saga
rin
Wol
fe
%
Ran
k A
vg.
Ran
k(To
t)1.
Aub
urn
(13-
0)
1 28
09
.985
6 2
1437
.9
742
1 1
1 1
1 1
1.00
00
1 .9
866
1 (.9
779)
2. O
rego
n (1
2-0)
2
2773
.9
730
1 14
50
.983
1 2
2 2
2 2
2 .9
600
2 .9
720
2 (.9
777)
3. T
CU
(12-
0)
3 26
13
.916
8 3
1348
.9
139
3 3
4 4
7 3
.900
0 3
.910
2 3
(.916
7)4.
Sta
nfor
d (1
1-1)
5
2421
.8
495
5 12
39
.840
0 8
7 5
5 4
5 .8
200
5 .8
365
4 (.8
413)
5. W
iscon
sin (1
1-1)
4
2443
.8
572
4 12
76
.865
1 5
4 12
10
12
8
.690
0 8
.804
1 5
(.818
5)6.
Ohi
o St
ate (
11-1
) 6
2293
.8
046
6 12
00
.813
6 6
6 7
13
16
10
.680
0 9
.766
0 6
(.763
2)7.
Okl
ahom
a (1
1-2)
9
1926
.6
758
8 10
08
.683
4 4
11
3 6
5 6
.830
0 4
.729
7 9
(.678
0)8.
Ark
ansa
s (10
-2)
8 19
92
.698
9 8
1008
.6
834
9 8
11
3 3
4 .8
000
6 .7
274
7 (.7
189)
9. M
ichi
gan
Stat
e (11
-1)
7 21
04
.738
2 7
1104
.7
485
7 12
8
15
14
11
.590
0 11
.6
922
8 (.6
980)
10. B
oise
Sta
te (1
1-1)
10
18
00
.631
6 10
91
4 .6
197
13
5 9
14
15
9 .5
900
11
.613
7 11
(.58
05)
11. L
SU (1
0-2)
11
16
25
.570
2 12
82
6 .5
600
11
9 10
7
6 7
.710
0 7
.613
4 10
(.60
67)
12. M
issou
ri (1
0-2)
13
13
68
.480
0 14
71
2 .4
827
10
18
6 11
9
12
.620
0 10
.5
276
12 (.
5148
)13
. Vir
gini
a Te
ch (1
1-2)
12
16
23
.569
5 11
90
0 .6
102
18
16
16
21
20
17
.330
0 18
.5
032
15 (.
4396
)14
. Okl
ahom
a St
ate (
10-2
) 15
12
32
.432
3 13
71
8 .4
868
12
13
13
9 11
15
.5
500
13
.489
7 14
(.46
30)
15. N
evad
a (1
2-1)
14
13
02
.456
8 15
64
0 .4
339
17
14
15
17
18
14
.410
0 16
.4
336
17 (.
4043
)16
. Ala
bam
a (9
-3)
16
1155
.4
053
18
521
.353
2 15
10
17
12
8
13
.540
0 14
.4
328
16 (.
4201
)17
. Tex
as A
&M
(9-3
) 18
10
77
.377
9 17
54
2 .3
675
14
19
14
8 10
16
.5
000
15
.415
1 18
(.39
10)
18. N
ebra
ska
(10-
3)
17
1136
.3
986
16
607
.411
5 16
17
18
16
13
18
.3
700
17
.393
4 13
(.50
71)
19. U
tah
(10-
2)
19
685
.240
4 19
37
5 .2
542
20
15
19
19
21
19
.270
0 19
.2
549
20 (.
2254
)20
. Sou
th C
arol
ina
(9-4
) 20
63
1 .2
214
20
345
.233
9 19
20
20
18
17
20
.2
700
19
.241
8 19
(.38
17)
21. M
ississ
ippi
Sta
te (8
-4)
22
500
.175
4 22
25
5 .1
729
22
21
25
20
19
21
.200
0 21
.1
828
22 (.
1630
)22
. Wes
t Vir
gini
a (9
-3)
21
519
.182
1 21
26
1 .1
769
24
23
24
.0
400
24
.133
0 24
(.05
42)
23. F
lori
da S
tate
(9-4
) 23
27
4 .0
961
23
156
.105
8 21
22
21
24
24
23
.1
400
22
.1140
21
(.21
25)
24. H
awai
i (10
-3)
24
191
.067
0 25
98
.0
664
23
24
22
25
22
.1
000
23
.077
8 N
R25
. Cen
tral
Flo
rida
(10-
3)
25
190
.066
7 24
14
3 .0
969
.000
0 28
.0
545
NR
EXPL
AN
ATIO
N:
Poll
Aver
age -
Tea
m p
erce
ntag
es a
re d
eriv
ed b
y di
vidi
ng a
team
’s ac
tual
rank
ing
poin
ts b
y a
max
imum
282
5 po
ssib
le p
oint
s in
the H
arri
s Int
erac
tive P
oll a
nd 1
525
poss
ible
poi
nts i
n th
e USA
Tod
ay/E
SPN
Coa
ches
Pol
l.C
ompu
ter A
vera
ge -
Six
com
pute
r ran
king
s cal
cula
ted
in in
vers
e poi
nts o
rder
(25
for #
1, 2
4 fo
r #2,
etc.)
are
use
d to
det
erm
ine t
he o
vera
ll co
mpu
ter c
ompo
nent
.Th
e bes
t and
wor
st ra
nkin
g fo
r eac
h te
am is
dro
pped
, and
the r
emai
ning
four
are
add
ed a
nd d
ivid
ed b
y 10
0 (th
e max
imum
pos
sible
poi
nts)
to p
rodu
ce a
Com
pute
r Ran
king
s Per
cent
age.
The s
ix co
mpu
ter r
anki
ng
prov
ider
s are
And
erso
n &
Hes
ter,
Ric
hard
Bill
ings
ley,
Col
ley
Mat
rix,
Ken
neth
Mas
sey,
Jeff
Saga
rin,
and
Pet
er W
olfe
. Eac
h co
mpu
ter r
anki
ng a
ccou
nts f
or sc
hedu
le st
reng
th in
its f
orm
ula.

71
Team .......................O17 O24 O31 N7 N14 N21 N28 D5 Auburn ......................4 1 2 2 2 2 1 1 Oregon ....................2 2 1 1 1 1 2 2 TCU ..........................5 4 3 3 3 3 3 3 Stanford ....................12 13 13 6 6 6 4 4 Wisconsin .................13 10 9 7 7 7 5 5 Ohio State ................10 11 11 9 9 8 6 6 Oklahoma ..................1 9 8 16 14 13 9 7 Arkansas ..................23 19 18 15 13 12 7 8 Michigan State ..........7 5 14 11 12 10 8 9 Boise State ................3 3 4 4 4 4 11 10 LSU ...........................6 12 10 5 5 5 10 11 Missouri ...................11 6 12 17 15 14 12 12 Virginia Tech ............25 23 22 20 16 16 15 13 Oklahoma State ........14 17 17 10 10 9 14 14 Nevada ......................– 24 23 21 18 19 17 15 Alabama ....................8 7 6 12 11 11 16 16 Nebraska ..................16 14 7 8 8 15 13 17 Utah ...........................9 8 5 14 23 20 20 18 South Carolina .........21 20 19 23 17 18 19 19 Mississippi State ......24 21 20 19 21 25 22 20 West Virginia ...........20 – – – – – 24 21 Flordia State .............17 16 24 – 25 22 21 22 Hawaii .......................– – – – – – – 23 Central Florida ..........– – – – – – – 24 Iowa .........................15 18 16 13 20 24 – 25 Arizona ....................18 15 15 18 22 21 23 – Texas ........................19 – – – – – – – Kansas State .............22 – – 24 – – – – Miami (Fla.) ..............– 22 – – 24 – – – Baylor .......................– 25 21 – – – – – NC State ....................– – 25 – – 23 – – Florida .......................– – – 22 – – – – Texas A&M ...............– – – 25 19 17 18 – Northern Illinois ........– – – – – – 25 –
2010 BCS Standings Week-by-Week

72
FIN
AL
2009
BO
WL
CH
AM
PIO
NSH
IP S
ERIE
S ST
AN
DIN
GS
Harr
is In
tera
ctiv
e U
SA T
oday
And
erso
n
C
olle
y
C
ompu
ter
BCS
Prev
ious
Team
Ran
k Po
ints
%
R
ank
Poin
ts
%
& H
este
r B
illin
gsle
y
Mat
rix
Mas
sey
Saga
rin
Wol
fe
%
Ran
k A
vg.
Ran
k(To
t)1.
Ala
bam
a (1
3-0)
1
2841
.9
968
1 14
70
.996
6 25
25
25
25
25
25
1.
0000
1
.997
8 2
(.951
3)2.
Tex
as (
13-0
) 2
2721
.9
547
2 14
09
.955
3 23
24
24
22
21
23
.9
200
3 .9
433
3 (.9
282)
3. C
inci
nnat
i (12
-0)
4 24
67
.865
6 4
1280
.8
678
24
22
23
23
23
24
.930
0 2
.887
8 5
(.854
7)4.
Tex
as C
hrist
ian
(12-
0)
3 25
79
.904
9 3
1336
.9
058
21
21
21
21
22
21
.840
0 5
.883
6 4
(.868
9)5.
Flo
rida
(12-
1)
5 23
95
.840
4 5
1240
.8
407
22
23
22
24
24
22
.910
0 4
.863
7 1
(.986
8)6.
Boi
se S
tate
(13-
0)
6 23
58
.827
4 6
1216
.8
244
20
20
19
19
19
20
.780
0 6
.810
6 6
(.809
6)7.
Ore
gon
(10-
2)
7 21
30
.747
4 7
1096
.7
431
19
19
20
20
20
19
.780
0 6
.756
8 7
(.734
3)8.
Ohi
o St
ate (
10-2
) 8
2081
.7
302
8 10
77
.730
2 16
18
16
9
2 10
.5
100
12
.656
8 8
(.688
2)9.
Geo
rgia
Tec
h (1
1-2)
10
17
87
.627
0 10
92
1 .6
244
17
16
18
17
17
18
.690
0 8
.647
1 10
(.58
03)
10. I
owa
(10-
2)
11
1772
.6
218
11
918
.622
4 18
17
17
11
11
16
.6
100
10
.618
0 9
(.602
8)11
. Vir
gini
a Te
ch (9
-3)
12
1569
.5
505
12
829
.562
0 13
6
15
16
16
15
.590
0 11
.5
675
12 (.
5376
)12
. Lou
isian
a St
ate (
9-3)
13
13
84
.485
6 13
71
8 .4
868
15
13
14
18
18
17
.640
0 9
.537
5 13
(.51
39)
13. P
enn
Stat
e (10
-2)
9 18
00
.631
6 9
950
.644
1 14
15
13
0
0 5
.320
0 18
.5
319
11 (.
5499
)14
. Bri
gham
You
ng (1
0-2)
14
13
49
.473
3 14
70
2 .4
759
11
14
11
7 1
12
.410
0 15
.4
531
14 (.
4394
)15
. Mia
mi (
Fla.
) (9-
3)
15
1173
.4
116
15
611
.414
2 10
8
12
14
15
14
.500
0 13
.4
419
17 (.
3843
)16
. Wes
t Vir
gini
a (9
-3)
18
730
.256
1 17
42
9 .2
908
12
11
10
13
12
11
.460
0 14
.3
357
23 (.
1400
)17
. Pitt
sbur
gh (9
-3)
16
995
.349
1 16
50
6 .3
431
8 5
8 4
6 6
.250
0 20
.3
141
15 (.
4101
)18
. Ore
gon
Stat
e (8-
4)
19
722
.253
3 20
36
8 .2
495
4 10
4
15
13
9 .3
600
17
.287
6 16
(.40
70)
19. O
klah
oma
Stat
e (9-
3)
17
839
.294
4 18
40
4 .2
739
9 9
9 0
0 4
.220
0 21
.2
628
20 (.
2251
)20
. Ari
zona
(8-4
) 24
38
1 .1
337
23
237
.160
7 6
1 7
12
14
13
.380
0 16
.2
248
NR
21. S
tanf
ord
(8-4
) 21
62
5 .2
193
21
253
.171
5 3
7 2
5 5
1 .1
500
22
.180
3 24
(.11
98)
22. N
ebra
ska
(9-4
) 20
63
1 .2
214
19
391
.265
1 0
2 1
0 0
0 .0
100
30
.165
5 22
(.14
91)
23. U
tah
(9-3
) 22
51
1 .1
793
24
183
.124
1 1
12
3 0
0 3
.070
0 24
.1
245
25 (.
0707
)24
. USC
(8-4
) 26
12
4 .0
435
27
42
.028
5 7
0 5
10
10
7 .2
900
19
.120
7 N
R25
. Wisc
onsin
(9-3
) 23
40
9 .1
435
22
247
.167
5 5
0 6
0 0
0 .0
500
26
.120
3 N
R
EXPL
AN
ATIO
N:
Poll
Aver
age -
Tea
m p
erce
ntag
es a
re d
eriv
ed b
y di
vidi
ng a
team
’s ac
tual
rank
ing
poin
ts b
y a
max
imum
282
5 po
ssib
le p
oint
s in
the H
arri
s Int
erac
tive P
oll a
nd 1
525
poss
ible
poi
nts i
n th
e USA
Tod
ay/E
SPN
Coa
ches
Pol
l.C
ompu
ter A
vera
ge -
Six
com
pute
r ran
king
s cal
cula
ted
in in
vers
e poi
nts o
rder
(25
for #
1, 2
4 fo
r #2,
etc.)
are
use
d to
det
erm
ine t
he o
vera
ll co
mpu
ter c
ompo
nent
.Th
e bes
t and
wor
st ra
nkin
g fo
r eac
h te
am is
dro
pped
, and
the r
emai
ning
four
are
add
ed a
nd d
ivid
ed b
y 10
0 (th
e max
imum
pos
sible
poi
nts)
to p
rodu
ce a
Com
pute
r Ran
king
s Per
cent
age.
The s
ix co
mpu
ter r
anki
ng
prov
ider
s are
And
erso
n &
Hes
ter,
Ric
hard
Bill
ings
ley,
Col
ley
Mat
rix,
Ken
neth
Mas
sey,
Jeff
Saga
rin,
and
Pet
er W
olfe
. Eac
h co
mpu
ter r
anki
ng a
ccou
nts f
or sc
hedu
le st
reng
th in
its f
orm
ula.

73
Team .......................O18 O25 N1 N8 N15 N22 N29 D6 Alabama ....................2 2 3 2 2 2 2 1 Texas .......................3 3 2 3 3 3 3 2 Cincinnati ..................5 8 5 5 5 5 5 3 Texas Christian .........8 6 6 4 4 4 4 4 Florida .......................1 1 1 1 1 1 1 5 Boise State ................4 7 7 6 6 6 6 6 Oregon .....................11 10 8 13 11 8 7 7 Ohio State ................19 17 16 11 10 10 8 8 Georgia Tech ............12 11 10 7 7 7 10 9 Iowa ..........................6 4 4 10 13 11 9 10 Virginia Tech ............14 13 23 21 15 14 12 11 Louisiana State ..........9 9 9 8 8 15 13 12 Penn State ................13 12 11 18 14 13 11 13 Brigham Young ........16 — — 22 22 19 14 14 Miami (Fla.) .............10 19 17 14 20 17 17 15 West Virginia ...........23 21 — 25 — — 23 16 Pittsburgh .................20 15 13 12 9 9 15 17 Oregon State ............15 — — 23 19 16 16 18 Oklahoma State ........— 14 19 19 12 12 20 19 Arizona ....................22 20 18 17 — — — 20 Stanford ....................— — — — 17 — 24 21 Nebraska ..................— — — — — — 22 22 Utah ..........................18 16 14 16 21 21 25 23 USC ...........................7 5 12 9 18 20 18 24 Wisconsin .................21 — 21 20 16 — — 25 California .................— 24 20 — 25 22 19 — Houston ....................17 18 15 15 24 23 21 — Clemson ...................— — — — 23 18 — — North Carolina .........— — — — — 24 — — Mississippi ...............— 25 — — — 25 — — South Florida ...........— — 25 24 — — — — Notre Dame ..............— 23 22 — — — — — Oklahoma .................— — 24 — — — — — South Carolina .........24 22 — — — — — — Kansas ......................25 — — — — — — —
2009 BCS Standings Week-by-Week

74
FIN
AL
2008
BO
WL
CH
AM
PIO
NSH
IP S
ERIE
S ST
AN
DIN
GS
Harr
is In
tera
ctiv
e U
SA T
oday
And
erso
n
C
olle
y
C
ompu
ter
BCS
Prev
ious
Team
Ran
k Po
ints
%
R
ank
Poin
ts
%
& H
este
r B
illin
gsle
y
Mat
rix
Mas
sey
Saga
rin
Wol
fe
%
Ran
k A
vg.
Ran
k(To
t) 1
. Okl
ahom
a (1
2-1)
2
2699
0.
9554
1
1482
0.
9718
25
25
25
25
25
25
1.
000
1 0.
9757
2
(.935
1) 2
. Flo
rida
(12-
1)
1 27
76
0.98
27
2 14
81
0.97
11
22
24
23
21
22
22
0.89
0 3
0.94
79
4 (.
8851
) 3
. Tex
as (1
1-1)
3
2616
0.
9260
3
1408
0.
9233
23
22
24
23
24
24
0.
940
2 0.
9298
3
(.92
23)
4. A
laba
ma
(12-
1)
4 24
42
0.86
44
4-T
1309
0.
8584
20
21
21
20
20
19
0.
810
6 0.
8443
1
(.971
3) 5
. USC
(11-
1)
5 24
13
0.85
42
4-T
1309
0.
8584
17
23
19
19
19
18
0.
750
7 0.
8208
5
(.807
6) 6
. Uta
h (1
2-0)
7
2119
0.
7501
7
1134
0.
7436
24
19
22
22
21
21
0.
860
5 0.
7846
6
(.784
4) 7
. Tex
as T
ech
(11-
1)
8 20
90
0.73
98
8 11
32
0.74
23
21
20
20
24
23
23
0.87
0 4
0.78
40
7 (.7
805)
8. P
enn
Stat
e (11
-1)
6 21
86
0.77
38
6 11
93
0.78
23
18
16
17
16
16
17
0.66
0 9
0.73
87
8 (.7
373)
9. B
oise
Sta
te (1
2-0)
9
1938
0.
6860
9
1034
0.
6780
19
18
18
18
18
20
0.
730
8 0.
6980
9
(.703
4)10
. Ohi
o St
ate (
10-2
) 10
18
58
0.65
77
10
1004
0.
6584
16
17
16
12
11
15
0.
590
11
0.63
54
10 (
.634
0)11
. Tex
as C
hrist
ian
(10-
2)
11
1580
0.
5593
11
87
7 0.
5751
15
14
12
17
17
16
0.
620
10
0.58
48
11 (.
5633
)12
. Cin
cinn
ati (
11-2
) 12
15
28
0.54
09
12
830
0.54
43
14
10
15
13
12
14
0.53
0 12
0.
5384
13
(.48
31)
13. O
klah
oma
Stat
e (9-
3)
13
1402
0.
4963
14
72
2 0.
4734
9
13
8 14
15
13
0.
490
13
0.48
66
14 (.
4276
)14
. Geo
rgia
Tec
h (9
-3)
14
1221
0.
4322
15
69
0 0.
4525
10
12
10
15
14
11
0.
470
14
0.45
16
15 (.
4046
)15
. Geo
rgia
(9-3
) 17
10
18
0.36
04
17
537
0.35
21
13
11
13
8 9
9 0.
420
15
0.37
75
16 (.
3311
)16
. Bri
gham
You
ng (1
0-2)
16
10
71
0.37
91
16
541
0.35
48
8 15
6
7
7
12
0.34
0 16
0.
3580
18
(.31
42)
17. O
rego
n (9
-3)
15
1211
0.
4287
13
74
7 0.
4898
0
9 4
0 0
6 0.
100
23-T
0.
3395
19
(.30
41)
18. M
ichi
gan
Stat
e (9-
3)
18
831
0.29
42
18
466
0.30
56
11
6 11
2
1 7
0.26
0 21
0.
2866
21
(.25
50)
19. V
irgi
nia
Tech
(9-4
) 22
51
1 0.
1809
19
33
7 0.
2210
6
1 7
10
13
10
0.33
0 17
0.
2440
25
(.05
73)
20. P
ittsb
urgh
(9-3
) 19
63
8 0.
2258
21
31
6 0.
2072
12
3
14
3 5
8 0.
280
18
0.23
77
23 (.
1012
)21
. Miss
ouri
(9-4
) 24
38
2 0.
1352
23
21
8 0.
1430
7
7 3
5 4
5 0.
210
20-T
0.
1627
20
(.28
18)
22. B
all S
tate
(12-
1)
20
609
0.21
56
22
219
0.14
36
1 4
9 0
0 3
0.08
0 25
0.
1464
12
(.53
06)
23. N
orth
wes
tern
(9-3
) 22
54
8 0.
1940
20
33
4 0.
2190
0
0 0
0 0
0 0.
000
NR
0.
1377
22
(.1
216)
24. B
osto
n C
olle
ge (9
-4)
26
172
0.06
09
26
96
0.06
30
22
4 0
5 8
2 0.
190
17
0.10
46
17 (
.320
2)25
. Miss
issip
pi (8
-4)
23
413
0.14
62
24
160
0.04
9 N
R
0 5
0 0
0 0.
000
NR
0.
0745
N
R
EXPL
AN
ATIO
N:
Poll
Aver
age -
Tea
m p
erce
ntag
es a
re d
eriv
ed b
y di
vidi
ng a
team
’s ac
tual
rank
ing
poin
ts b
y a
max
imum
282
5 po
ssib
le p
oint
s in
the H
arri
s Int
erac
tive P
oll a
nd 1
525
poss
ible
poi
nts i
n th
e USA
Tod
ay/E
SPN
Coa
ches
Pol
l.C
ompu
ter A
vera
ge -
Six
com
pute
r ran
king
s cal
cula
ted
in in
vers
e poi
nts o
rder
(25
for #
1, 2
4 fo
r #2,
etc.)
are
use
d to
det
erm
ine t
he o
vera
ll co
mpu
ter c
ompo
nent
.Th
e bes
t and
wor
st ra
nkin
g fo
r eac
h te
am is
dro
pped
, and
the r
emai
ning
four
are
add
ed a
nd d
ivid
ed b
y 10
0 (th
e max
imum
pos
sible
poi
nts)
to p
rodu
ce a
Com
pute
r Ran
king
s Per
cent
age.
The s
ix co
mpu
ter r
anki
ng
prov
ider
s are
And
erso
n &
Hes
ter,
Ric
hard
Bill
ings
ley,
Col
ley
Mat
rix,
Ken
neth
Mas
sey,
Jeff
Saga
rin,
and
Pet
er W
olfe
. Eac
h co
mpu
ter r
anki
ng a
ccou
nts f
or sc
hedu
le st
reng
th in
its f
orm
ula.

75
Team .......................O19 O26 N2 N9 N16 N23 N30 D7 Oklahoma .................4 4 6 5 5 3 2 1 Florida .....................10 8 5 4 4 4 4 2 Texas ........................1 1 4 3 3 2 3 3 Alabama ...................2 2 1 1 1 1 1 4 USC ..........................5 5 7 6 6 5 5 5 Utah .........................11 10 8 7 7 6 6 6 Texas Tech ...............8 7 2 2 2 7 7 7 Penn State ................3 3 3 8 8 8 8 8 Boise State ..............12 11 10 9 9 9 9 9 Ohio State ................9 12 11 11 10 10 10 10 TCU ........................14 13 12 18 16 14 11 11 Cincinnati .................– – – 22 19 16 13 12 Oklahoma State ........6 9 9 13 12 12 14 13 Georgia Tech ...........18 – 20 – – 22 15 14 Georgia .....................7 6 13 10 11 11 16 15 Brigham Young .......21 20 15 17 14 18 18 16 Oregon .....................– 24 – – 24 23 19 17 Michigan State .........– 21 18 15 15 19 21 18 Virginia Tech ............– – – – – – 25 19 Pittsburgh ................17 – – 21 20 25 23 20 Missouri ..................15 14 14 12 13 13 20 21 Ball State .................20 16 17 14 17 15 12 22 Northwestern ...........22 – 24 – – 24 22 23 Boston College .........– – – – – 21 17 24 Mississippi ............... – – – – – – – 25 Florida State ............25 15 22 19 – 20 24 – Oregon State ............– – – – 21 17 – – LSU .........................13 19 16 20 18 – – – North Carolina .........– 22 19 16 22 – – – Miami .......................– – – – 23 – – – Maryland ..................– – 23 – 25 – – – Tulsa ........................19 18 – 23 – – – – Wake Forest ............. – – – 24 – – – – South Carolina .........– – – 25 – – – – California .................– – 21 – – – – – West Virginia ...........– – 25 – – – – – Minnesota ...............24 17 – – – – – – South Florida ..........16 23 – – – – – – Connecticut ..............– 25 – – – – – – Kansas .....................23 – – – – – – –
2008 BCS Standings Week-by-Week

76
FIN
AL
2007
BO
WL
CH
AM
PIO
NSH
IP S
ERIE
S ST
AN
DIN
GS
Harr
is In
tera
ctiv
e U
SA T
oday
And
erso
n
C
olle
y
C
ompu
ter
BCS
Prev
ious
Team
Ran
k Po
ints
%
R
ank
Poin
ts
%
& H
este
r B
illin
gsle
y
Mat
rix
Mas
sey
Saga
rin
Wol
fe
%
Ran
k A
vg.
Ran
k(To
t) 1
. Ohi
o St
ate (
11-1
) 1
2813
0.
9870
1
1469
0.
9793
25
25
21
23
22
21
0.
910
3 0.
9588
3
(.919
2) 2
. LSU
(11-
2)
2 26
30
0.92
28
2 14
18
0.94
53
21
24
25
24
24
23
0.95
0 2
0.93
94
7 (.
7744
) 3
. Vir
gini
a Te
ch (1
1-2)
6
2345
0.
8228
5
1242
0.
8280
22
22
24
25
25
25
0.
960
1 0.
8703
6
(.78
11)
4. O
klah
oma
(11-
2)
3 25
20
0.88
42
3 13
31
0.83
73
18
21
18
18
23
24
0.80
0 T-
6 0.
8572
9
(,682
9) 5
. Geo
rgia
(10-
2)
4 24
69
0.86
63
4 12
77
0.85
13
20
17
23
22
19
19
0.80
0 T-
6 0.
8392
4
(.827
4) 6
. Miss
ouri
(11-
2)
7 21
17
0.74
28
7 11
04
0.73
60
24
16
22
21
20
22
0.85
0 4
0.77
63
1 (.9
781)
7. U
SC (1
0-2)
5
2346
0.
8232
6
1227
0.
8180
17
23
14
14
17
17
0.
650
9 0.
7637
8
(.692
6) 8
. Kan
sas (
11-1
) 8
2092
0.
7340
8
1099
0.
7327
23
20
16
20
21
20
0.
810
5 0.
7589
5
(.791
8) 9
. Wes
t Vir
gini
a (1
0-2)
9
1924
0.
6751
9
1010
0.
6733
16
15
20
13
15
18
0.
640
10
0.66
28
2 (.9
713)
10. H
awai
i (12
-0)
10
1903
0.
6677
10
99
4 0.
6627
14
18
12
18
18
13
0.
610
12
0.64
68
12 (
.583
5)11
. Ari
zona
Sta
te (1
0-2)
12
16
28
0.57
12
11
900
0.60
00
19
19
17
17
13
16
0.69
0 8
0.62
04
13 (.
5571
)12
. Flo
rida
(9-3
) 11
17
86
0.62
67
12
890
0.59
33
15
14
19
19
14
14
0.62
0 11
0.
6133
10
(.61
84)
13. I
llino
is (9
-3)
13
1400
0.
4912
13
74
7 0.
4980
13
13
7
9 8
9 0.
390
16
0.45
97
15 (.
4198
)14
. Bos
ton
Col
lege
(10-
3)
14
1124
0.
3944
14
61
7 0.
4113
12
12
15
15
16
15
0.
570
13
0.45
86
11 (.
6169
)15
. Cle
mso
n (9
-3)
16
1041
0.
3653
16
56
7 0.
3780
7
3 11
12
12
11
0.
410
15
0.38
44
16 (.
3358
)16
. Ten
ness
ee (9
-4)
19
870
0.30
53
18
480
0.32
00
11
6 9
11
9
5
0.
350
17
0.32
51
14 (.
4614
)17
. Bri
gham
You
ng (1
0-2)
18
91
2 0.
3200
19
46
2 0.
3080
8
7 10
2
3 10
0.
280
19
0.30
27
19 (.
2252
)18
. Wisc
onsin
(9-3
) 15
10
79
0.37
86
15
594
0.39
60
3 11
0
5 0
2 0.
100
24
0.29
15
18 (.
2628
)19
. Tex
as (9
-3)
17
983
0.34
49
17
498
0.33
20
5 0
4 0
0 4
0.08
0 25
0.
2523
20
(.22
16)
20. V
irgi
nia
(9-3
) 21
55
1 0.
1933
20
33
2 0.
2213
6
2 8
7 10
8
0.29
0 18
0.
2349
22
(.17
95)
21. S
outh
Flo
rida
(9-3
) 24
36
2 0.
1270
25
11
5 0.
0767
10
0
13
10
11
12
0.43
0 14
0.
2112
21
(.18
80)
22. C
inci
nnat
i (9-
3)
20
580
0.20
35
23
215
0.14
33
1 5
6 4
4 6
0.19
0 T-
20
0.17
89
23 (.
1490
)23
. Aub
urn
(9-3
) 23
44
8 0.
1572
21
28
9 0.
1927
2
0 2
8 7
1 0.
120
23
0.15
66
24 (
.147
2)24
. Boi
se S
tate
(10-
2)
22
541
0.18
98
22
246
0.16
40
0 10
0
0 0
0 0.
000
NR
0.
1179
25
(.11
25)
25. C
onne
ctic
ut (9
-3)
29
52
0.01
82
T-28
23
0.
0153
0
8 3
3 6
7 0.
190
T-20
0.
0745
N
R
EXPL
AN
ATIO
N:
Poll
Aver
age -
Tea
m p
erce
ntag
es a
re d
eriv
ed b
y di
vidi
ng a
team
’s ac
tual
rank
ing
poin
ts b
y a
max
imum
282
5 po
ssib
le p
oint
s in
the H
arri
s Int
erac
tive P
oll a
nd 1
525
poss
ible
poi
nts i
n th
e USA
Tod
ay/E
SPN
Coa
ches
Pol
l.C
ompu
ter A
vera
ge -
Six
com
pute
r ran
king
s cal
cula
ted
in in
vers
e poi
nts o
rder
(25
for #
1, 2
4 fo
r #2,
etc.)
are
use
d to
det
erm
ine t
he o
vera
ll co
mpu
ter c
ompo
nent
.Th
e bes
t and
wor
st ra
nkin
g fo
r eac
h te
am is
dro
pped
, and
the r
emai
ning
four
are
add
ed a
nd d
ivid
ed b
y 10
0 (th
e max
imum
pos
sible
poi
nts)
to p
rodu
ce a
Com
pute
r Ran
king
s Per
cent
age.
The s
ix co
mpu
ter r
anki
ng p
rovi
ders
are
A
nder
son
& H
este
r, R
icha
rd B
illin
gsle
y, C
olle
y M
atri
x, K
enne
th M
asse
y, Je
ff Sa
gari
n, a
nd P
eter
Wol
fe. E
ach
com
pute
r ran
king
acc
ount
s for
sche
dule
stre
ngth
in it
s for
mul
a.BC
S Av
erag
e - T
he B
CS
Aver
age i
s cal
cula
ted
by a
vera
ging
the p
erce
nt to
tals
of th
e Har
ris I
nter
activ
e, U
SA T
oday
Coa
ches
and
Com
pute
r pol
ls.

77
Team .........................O14 O21 O28 N4 N11 N18 N25 D2Ohio State ....................1 1 1 1 7 5 3 1LSU .............................4 3 3 2 1 1 7 2Virginia Tech .............. 11 8 11 11 10 8 6 3Oklahoma ....................5 6 6 5 4 10 9 4Georgia ......................20 18 10 10 9 7 4 5Missouri .....................16 13 9 6 5 4 1 6USC ............................14 12 19 17 11 11 8 7Kansas ........................13 9 8 4 3 2 5 8West Virginia ...............9 7 7 7 6 3 2 9Hawaii ........................18 17 14 16 16 15 12 10Arizona State ...............8 4 4 9 8 6 13 11Florida ........................15 11 20 15 12 12 10 12Illinois .........................– – – – 19 17 15 13Boston College ............3 2 2 8 17 14 11 14Clemson ......................– – 25 21 15 22 16 15Tennessee ...................21 – – 24 20 18 14 16BYU ............................– – – – – 25 19 17Wisconsin ....................– – 21 – 25 21 18 18Texas ..........................22 19 15 14 13 13 20 19Virginia.......................19 15 23 19 14 16 22 20South Florida ...............2 10 18 – – 23 21 21Cincinnati ...................23 – – – 22 24 23 22Auburn .......................17 22 16 18 – – 24 23Boise State ..................– – 22 20 18 19 25 24Connecticut .................– 23 13 13 24 20 – 25Oregon ........................10 5 5 3 2 9 17 –Michigan ....................25 20 12 12 21 – – –Kentucky .....................7 14 – 25 23 – – –Alabama ......................– 24 17 22 – – – –Penn State ....................– 25 – 23 – – – –Wake Forest.................– – 24 – – – – –South Carolina ............6 16 – – – – – –California ...................12 21 – – – – – –Texas Tech ..................24 – – – – – – –
2007 BCS Standings Week-by-Week

78
FIN
AL
2006
BO
WL
CH
AM
PIO
NSH
IP S
ERIE
S ST
AN
DIN
GS
Harr
is In
tera
ctiv
e
USA
Tod
ay
A
nder
son
Col
ley
Com
pute
r
BC
S Pr
evio
usTe
am
R
ank
Poin
ts
%
Ran
k Po
ints
%
&
Hes
ter
Bi
lling
sley
M
atri
x M
asse
y Sa
gari
n W
olfe
%
R
ank
Avg
. R
k (A
vg.)
1. O
hio
Stat
e 1
2824
0.
9996
1
1550
1.
000
25
25
24
25
25
25
1.00
0 1
0.99
99
1 (1
.000
) 2
. Flo
rida
2
2670
0.
9451
2
1470
0.
9484
24
23
25
24
23
23
0.
940
T-2
0.94
45
4 (.
8897
) 3
. Mic
higa
n 3
2632
0.
9317
3
1444
0.
9316
23
24
23
23
24
24
0.
940
T-2
0.93
44
3 (.
9216
) 4
. LSU
4
2372
0.
8396
4
1299
0.
8381
22
17
19
21
21
21
0.
820
5 0.
8326
5
(.81
06)
5. U
SC
7 21
73
0.76
92
7 11
73
0.75
68
20
18
22
22
22
22
0.86
0 4
0.79
53
2 (.
9460
) 6
. Lou
isvill
e 5
2272
0.
8042
6
1223
0.
7890
21
22
21
17
13
20
0.
790
6 0.
7944
6
(.76
18)
7. W
iscon
sin
6 22
29
0.78
90
5 12
63
0.81
48
11
21
16
13
18
17
0.64
0 10
0.
7480
7
(.70
96)
8. B
oise
Sta
te
9 19
50
0.69
03
9 10
53
0.67
94
19
16
20
19
20
18
0.76
0 7
0.70
99
8 (.
6744
) 9
. Aub
urn
T-10
17
25
0.61
06
10
1000
0.
6452
17
12
17
20
19
16
0.
690
8 0.
6486
11
(.6
183)
10. O
klah
oma
8 19
77
0.69
98
8 11
15
0.71
94
15
19
13
8 7
11
0.47
0 16
0.
6297
5 12
(.5
509)
11. N
otre
Dam
e T1
0 17
25
0.61
06
11
923
0.59
55
18
15
18
15
17
19
0.68
0 9
0.62
87
10 (
.626
2)12
. Ark
ansa
s 13
14
83
0.52
50
13
798
0.51
48
10
9 10
18
16
15
0.
510
12
0.51
66
9 (
.661
6)13
. Wes
t Vir
gini
a 12
14
85
0.52
57
12
800
.516
1 14
13
15
11
8
10
0.48
0 T-
14
0.50
73
15 (
.401
4)14
. Wak
e For
est
14
1366
0.
4835
15
74
5 0.
4806
9
14
8
7 5
9 0.
330
18
0.43
14
17 (
.347
1)15
. Vir
gini
a Te
ch
15
1358
0.
4807
14
78
1 0.
5039
8
20
9
6 4
7 0.
300
19
0.42
82
14 (
.442
6)16
. Rut
gers
16
10
83
0.38
34
17
567
0.36
58
16
11
12
10
11
14
0.48
0 T-
14
0.40
97
13 (
.550
0)17
. Ten
ness
ee
18
940
0.33
27
18
500
0.32
26
13
10
11
14
14
12
0.50
0 13
0.
3851
16
(.3
705)
18. C
alifo
rnia
20
73
6 0.
2605
19
43
6 0.
2813
12
7
14
16
15
13
0.54
0 11
0.
3606
18
(.3
192)
19. T
exas
17
95
2 0.
3370
16
58
2 0.
3755
6
4
6 0
0 5
0.15
0 T-
21
0.28
75
19 (
.296
7)20
. Bri
gham
You
ng
19
838
0.29
66
20
369
0.23
81
4
1 5
0 0
4 0.
090
23
0.20
82
21 (.
1917
)21
. Tex
as A
&M
21
55
1 0.
1950
21
30
3 0.
1955
3
8
2 0
0 0
0.05
0 T-
24
0.14
68
23 (.
0969
)22
. Ore
gon
Stat
e 26
12
7 0.
0450
T-
25
72
0.04
65
7
0 7
12
12
8 0.
340
17
0.14
38
24 (.
0950
)23
. Neb
rask
a 22
35
2 0.
1246
22
24
2 0.
1561
0
0
0 0
0 0
0.00
0 N
R
0.09
36
20 (.
2268
)24
. Bos
ton
Col
lege
23
31
8 0.
1126
23
17
5 0.
1129
1
0
4 0
0 3
0.04
0 N
R
0.08
85
NR
25. U
CLA
33
10
0.
0035
N
R
0
0.00
00
5
2 3
9 10
2
0.19
0 20
0.
0645
N
R
EXPL
AN
ATIO
N:
Poll
Aver
age -
Tea
m p
erce
ntag
es a
re d
eriv
ed b
y di
vidi
ng a
team
’s ac
tual
rank
ing
poin
ts b
y a
max
imum
282
5 po
ssib
le p
oint
s in
the H
arri
s Int
erac
tive P
oll a
nd 1
525
poss
ible
poi
nts i
n th
e USA
Tod
ay/E
SPN
Coa
ches
Pol
l.C
ompu
ter A
vera
ge -
Six
com
pute
r ran
king
s cal
cula
ted
in in
vers
e poi
nts o
rder
(25
for #
1, 2
4 fo
r #2,
etc.)
are
use
d to
det
erm
ine t
he o
vera
ll co
mpu
ter c
ompo
nent
.Th
e bes
t and
wor
st ra
nkin
g fo
r eac
h te
am is
dro
pped
, and
the r
emai
ning
four
are
add
ed a
nd d
ivid
ed b
y 10
0 (th
e max
imum
pos
sible
poi
nts)
to p
rodu
ce a
Com
pute
r Ran
king
s Per
cent
age.
The s
ix co
mpu
ter r
anki
ng p
rovi
ders
are
A
nder
son
& H
este
r, R
icha
rd B
illin
gsle
y, C
olle
y M
atri
x, K
enne
th M
asse
y, Je
ff Sa
gari
n, a
nd P
eter
Wol
fe. E
ach
com
pute
r ran
king
acc
ount
s for
sche
dule
stre
ngth
in it
s for
mul
a.BC
S Av
erag
e - T
he B
CS
Aver
age i
s cal
cula
ted
by a
vera
ging
the p
erce
nt to
tals
of th
e Har
ris I
nter
activ
e, U
SA T
oday
Coa
ches
and
Com
pute
r pol
ls.

79
Team ........................ O15 O22 O29 N5 N12 N19 N26 D3Ohio State ....................1 1 1 1 1 1 1 1Florida .........................6 6 4 4 4 4 4 2Michigan .....................3 2 2 2 2 2 3 3LSU ............................18 16 17 12 11 10 5 4USC .............................2 3 8 7 3 3 2 5Louisville ....................7 8 5 3 10 9 6 6Wisconsin ...................21 18 16 15 9 8 7 7Boise State .................15 15 14 14 12 11 8 8Auburn ........................4 5 6 6 14 12 11 9Oklahoma ...................22 19 18 17 17 15 12 10Notre Dame .................8 9 9 9 5 5 10 11Arkansas .....................13 13 13 11 7 6 9 12West Virginia ...............5 4 3 10 8 7 15 13Wake Forest.................– – 24 19 16 21 17 14Virginia Tech ...............– – 25 21 21 17 14 15Rutgers .......................16 14 12 13 6 14 13 16Tennessee ...................11 11 11 16 22 20 16 17California ...................10 10 10 8 15 19 18 18Texas ...........................9 7 7 5 13 13 19 19BYU ............................– – – – 25 23 21 20Texas A&M .................– 21 21 25 – – 23 21Oregon State ................– – – 24 – – 24 22Nebraska ....................17 22 – – 23 22 20 23Boston College ...........20 17 15 22 20 18 – 24UCLA ..........................– – – – – – – 25Georgia Tech ..............19 24 20 18 18 16 22 –Hawaii .........................– – – – – – 25 –Clemson .....................12 12 19 – – 24 – –Penn State ....................– – – – – 25 – –Maryland .....................– – – 23 19 – – –Oregon ........................14 23 22 20 24 – – –Washington State.........– 25 23 – – – – –Missouri .....................24 20 – – – – – –Iowa ............................23 – – – – – – –Tulsa ...........................25 – – – – – – –
2006 BCS Standings Week-by-Week

80
FIN
AL
2005
BO
WL
CH
AM
PIO
NSH
IP S
ERIE
S ST
AN
DIN
GS
Harr
is In
tera
ctiv
e
USA
Tod
ay
A
nder
son
Col
ley
Com
pute
r
BC
S Pr
evio
usTe
am
Ran
k Po
ints
%
R
ank
Poin
ts
%
& H
este
r
Billi
ngsle
y
Mat
rix
Mas
sey
Saga
rin
Wol
fe
% R
ank
Avg
. R
ank
(Avg
.)1.
USC
1
28
11
.995
0 1
1543
.9
955
25
25
24
24
24
24
.970
2
.986
8 1
(.98
61)
2. T
exas
2
2726
.9
650
2 14
95
.964
5 24
24
25
25
25
25
.9
90
1 .9
732
2
(.97
37)
3. P
enn
Stat
e 3
2592
.9
175
3 14
24
.918
7 23
23
23
23
23
23
.9
20
3 .9
187
3
(.89
90)
4. O
hio
Stat
e 4
2398
.8
488
4 13
00
.838
7 22
17
22
22
22
22
.8
80
4 .8
559
6 (.
7971
)5.
Ore
gon
6 22
05
.780
5 5
1234
.7
961
21
15
21
19
21
21
.820
5
.798
9 7
(.74
53)
6. N
otre
Dam
e 5
2295
.8
124
6 12
19
.786
5 17
12
16
12
18
15
.6
00
T10
.732
9 8
(.69
44)
7. G
eorg
ia
8 20
53
.726
7 8
1097
.7
077
20
22
18
16
14
18
.720
8
.718
2 13
(.5
301)
8. M
iam
i (Fl
a.)
9 19
42
.687
4 9
1075
.6
935
18
19
17
20
19
17
.730
7
.703
7 9
(.66
09)
9. A
ubur
n 7
2085
.7
381
7 11
41
.736
1 12
21
14
15
11
14
.5
50
12
.674
7 10
(.6
305)
10. V
irgi
nia
Tech
11
17
19
.608
5 12
95
5 .6
161
19
16
20
21
20
20
.790
6
.671
5 5
(.83
37)
11. W
est V
irgi
nia
12
1673
.5
922
11
959
.618
7 14
18
19
18
16
19
.7
10
9 .6
403
11 (
.581
4)12
. LSU
10
18
12
.641
4 10
10
02
.646
5 16
20
15
11
13
16
.6
00
T10
.629
3 4
(.84
87)
13. A
laba
ma
13
1451
.5
136
13
787
.507
7 8
13
10
7
6 9
.340
18
.4
538
15 (
.448
5)14
. TC
U
14
1328
.4
701
14
734
.473
5 13
14
13
0
1 12
.3
90
17
.444
5 14
(.4
595)
15. T
exas
Tec
h 15
11
47
.406
0 15
63
6 .4
103
10
9 12
14
12
13
.4
70
13
.428
8 16
(.4
102)
16. U
CLA
T1
7 10
04
.355
4 17
53
1 .3
426
15
11
11
2 8
11
.410
T1
4 .3
693
12 (
.563
3)17
. Flo
rida
T1
7 10
04
.355
4 18
53
0 .3
419
6
6 7
3 2
7 .2
20
21
.305
8 17
(.2
853)
18. W
iscon
sin
20
675
.238
9 20
39
9 .2
574
9
3 9
13
15
10
.410
T1
4 .3
021
18 (
.284
8)19
. Lou
isvill
e 16
10
16
.359
6 16
58
5 .3
774
1
10
3 0
0 1
.050
N
R
.262
4 21
(.2
338)
20. M
ichi
gan
21
556
.196
8 21
27
4 .1
768
7
4 8
17
17
8 .4
00
16
.257
9 19
(.2
486)
21. B
osto
n C
olle
ge
19
763
.270
1 19
42
7 .2
755
4
8 6
5 4
3 .1
90
22
.245
2 20
(.2
477)
22. F
lori
da S
tate
22
47
4 .1
678
22
256
.165
2 0
0
0 1
0 0
.000
N
R
.1110
N
R23
. Okl
ahom
a 26
87
.0
308
26
45
.029
0 11
0
5 8
5 6
.240
T1
9 .0
999
23 (
.091
9)24
. Geo
rgia
Tec
h 24
28
2 .0
998
24
114
.073
5 2
5
1 4
3 2
.110
25
.094
5 24
(.0
773)
25. N
orth
wes
tern
T2
9 30
.0
106
28
24
.015
5 5
1
4 10
10
5
.240
T1
9 .0
887
22 (
.099
2)
EXPL
AN
ATIO
N:
Poll
Aver
age -
Tea
m p
erce
ntag
es a
re d
eriv
ed b
y di
vidi
ng a
team
’s ac
tual
rank
ing
poin
ts b
y a
max
imum
282
5 po
ssib
le p
oint
s in
the H
arri
s Int
erac
tive P
oll a
nd 1
525
poss
ible
poi
nts i
n th
e USA
Tod
ay/E
SPN
Coa
ches
Pol
l.C
ompu
ter A
vera
ge -
Six
com
pute
r ran
king
s cal
cula
ted
in in
vers
e poi
nts o
rder
(25
for #
1, 2
4 fo
r #2,
etc.)
are
use
d to
det
erm
ine t
he o
vera
ll co
mpu
ter c
ompo
nent
.Th
e bes
t and
wor
st ra
nkin
g fo
r eac
h te
am is
dro
pped
, and
the r
emai
ning
four
are
add
ed a
nd d
ivid
ed b
y 10
0 (th
e max
imum
pos
sible
poi
nts)
to p
rodu
ce a
Com
pute
r Ran
king
s Per
cent
age.
The s
ix co
mpu
ter r
anki
ng p
rovi
ders
are
A
nder
son
& H
este
r, R
icha
rd B
illin
gsle
y, C
olle
y M
atri
x, K
enne
th M
asse
y, Je
ff Sa
gari
n, a
nd P
eter
Wol
fe. E
ach
com
pute
r ran
king
acc
ount
s for
sche
dule
stre
ngth
in it
s for
mul
a.BC
S Av
erag
e - T
he B
CS
Aver
age i
s cal
cula
ted
by a
vera
ging
the p
erce
nt to
tals
of th
e Har
ris I
nter
activ
e, U
SA T
oday
Coa
ches
and
Com
pute
r pol
ls.

81
Team ........................ O17 O24 O31 N7 N14 N21 N28 D4USC .............................1 2 1 1 1 1 1 1Texas ...........................2 1 2 2 2 2 2 2Penn State ...................10 9 7 5 4 3 3 3Ohio State ...................15 13 10 8 7 6 6 4Oregon ........................13 11 13 10 10 7 7 5Notre Dame ................16 15 14 11 9 8 8 6Georgia .......................4 4 11 9 16 15 13 7 Miami (Fla.) ................8 7 6 4 3 9 9 8Auburn .......................18 22 20 20 13 10 10 9Virginia Tech ...............3 3 3 6 6 5 5 10West Virginia ..............17 17 17 14 12 11 11 11 LSU .............................6 8 8 7 5 4 4 12Alabama ......................5 5 4 3 8 14 15 13TCU............................21 18 18 17 14 13 14 14Texas Tech ...................7 16 15 12 19 16 16 15 UCLA ..........................9 6 5 15 11 12 12 16 Florida ........................20 19 16 13 22 23 17 17 Wisconsin ...................14 12 12 16 20 17 18 18 Louisville ....................– – – 25 18 20 21 19 Michigan .....................– 25 21 21 15 22 19 20 Boston College ...........12 14 19 – 24 18 20 21 Florida State ...............11 10 9 19 – 24 – 22 Oklahoma ....................– – 25 – 25 – 23 23 Georgia Tech ...............– – – 23 – 21 24 24 Northwestern ...............– 21 – – – 25 22 25 Fresno State .................– – 24 22 17 19 25 – Minnesota ...................22 20 – 24 21 – – – South Carolina ............– – – – 23 – – – Colorado ......................– 24 22 18 – – – – California ...................25 23 23 – – – – – Tennessee ...................19 – – – – – – – Nebraska ....................23 – – – – – – – Michigan State ...........24 – – – – – – –
2005 BCS Standings Week-by-Week

82
FIN
AL
2004
BO
WL
CH
AM
PIO
NSH
IP S
ER
IES
STA
ND
ING
S
A
ssoc
iate
d Pr
ess
USA
Tod
ay/E
SPN
And
erso
n
C
olle
y
C
ompu
ter
B
CS
Prev
ious
Team
Ran
k Po
ints
%
R
ank
Poin
ts
%
& H
este
r
Bill
ings
ley
M
atri
x M
asse
y Sa
gari
n W
olfe
%
R
ank
Avg.
Ran
k (A
vg.)
1. U
SC
1
1599
.9
840
1
14
90
.977
0
24
24
25
2
5 24
24
.9
70
2
.977
0
1 (.9
834
2. O
klah
oma
2
15
56
.957
5
2
1459
.9
567
25
25
24
24
25
25
.990
1
.9
681
2 (.
9611
)3.
Aub
urn
3
15
25
.938
5
3
1435
.9
410
23
23
23
23
23
23
.920
3
.9
331
3 (.
9342
)4.
Tex
as
6
1337
.8
228
5
12
81
.840
0
21
22
22
22
22
22
.8
80
4
.847
6 5
(.84
18)
5. C
alifo
rnia
4
13
99
.860
9
4
1286
.8
433
20
18
20
20
21
20
.800
6
.8
347
4 (.
8431
)6.
Uta
h
5
1345
.8
277
6
12
15
.796
7
22
20
21
21
20
21
.8
30
5
.818
1 6
(.82
24)
7. G
eorg
ia
8
1117
.6
874
7
11
17
.732
5
17
19
18
17
15
15
.6
70
8
.696
6 7
(.69
48)
8. V
irgi
nia
Tech
9
11
11
.683
7
9
1037
.6
800
13
15
14
18
18
18
.650
T-
9
.671
2 1
2 (.5
710)
9. B
oise
Sta
te
10
960
.5
908
10
94
3
.618
4
19
21
19
19
19
19
.7
60
7
.656
4 8
(.65
10)
10. L
ouis
ville
7
11
83
.728
0
8
1066
.6
990
9
12
13
11
17
16
.520
13
.6
490
9 9
.637
9)11
. LSU
12
92
9
.571
7
11
932
.6
111
16
17
15
16
16
17
.650
T-
9
.610
9 1
1 (.6
871)
12. I
owa
11
94
8
.583
4
13
812
.5
325
18
14
17
10
9
14
.550
12
.5
553
13
(.538
9)13
. Mic
higa
n
13
917
.5
643
12
87
4
.573
1
14
16
12
3
2
9
.3
80
17
.505
8 1
4 (.4
859)
14. M
iam
i (Fl
a.)
14
776
.4
775
14
73
8
.483
9
11
13
10
12
12
10
.4
50
T-14
.4
705
10
(.634
2)15
. Ten
ness
ee
15
651
.4
006
17
55
9
.366
6
12
11
11
14
11
11
.4
50
T-14
.4
057
15 (.
4822
)16
. Flo
rida
Sta
te
17
647
.398
2 15
64
3 .4
216
8
4 8
5 5
4 .2
20
21
.346
6 16
(.34
13)
17. W
isco
nsin
16
64
8 .3
988
16
599
.392
8 7
10
6
1 3
8 .2
40
20
.343
9 17
(.33
64)
18. V
irgi
nia
18
482
.296
6 18
45
5 .2
984
6
9 7
9 8
6 .3
00
18
.298
3 18
(.28
60)
19. A
rizo
na S
tate
21
22
2 .1
366
24
173
.113
4 15
0 16
15
13
13
.5
60
11
.270
0 19
(.25
39)
20. T
exas
A&
M
22
213
.131
1 25
14
7 .0
964
10
0
9 13
14
12
.4
40
16
.222
5 20
(.21
74)
21. P
ittsb
urgh
19
41
5 .2
554
20
318
.208
5 0
6
0 0
0 0
.000
N
R
.154
6 23
(.10
45)
22. T
exas
Tec
h 23
16
8 .1
034
21
234
.153
4 4
0
4 6
7 5
.190
22
.1
489
21 (.
1431
)23
. Flo
rida
20
32
5 .2
000
19
324
.212
5 0
5
0 0
0 0
.000
N
R
.137
5 22
(.11
44)
24. O
klah
oma
Stat
e 32
16
.0
098
28
35
.023
0 5
0
5 8
10
7 .2
50
19
.094
3 24
(.10
09)
25. O
hio
Stat
e 24
15
5 .0
954
22
181
.118
7 3
8
1 0
0 0
.040
N
R
.084
7 25
(.83
6)
EX
PLA
NAT
ION
:Po
ll Av
erag
e - T
eam
per
cent
ages
are
der
ived
by
divi
ding
a te
am’s
act
ual r
anki
ng p
oint
s by
a m
axim
um 1
625
poss
ible
poi
nts i
n th
e AP
Poll
and
1525
pos
sibl
e po
ints
in th
e U
SA T
oday
/ESP
N C
oach
es P
oll.
Com
pute
r Ave
rage
- Si
x co
mpu
ter
rank
ings
cal
cula
ted
in in
vers
e po
ints
ord
er (2
5 fo
r #1
, 24
for
#2, e
tc.)
are
used
to d
eter
min
e th
e ov
eral
l com
pute
r co
mpo
nent
.T
he b
est a
nd w
orst
ran
king
for
each
team
is d
ropp
ed, a
nd th
e re
mai
ning
four
are
add
ed a
nd d
ivid
ed b
y 10
0 (t
he m
axim
um p
ossi
ble
poin
ts) t
o pr
oduc
e a
Com
pute
r R
anki
ngs P
erce
ntag
e. T
he si
x co
mpu
ter
rank
ing
prov
ider
s are
A
nder
son
& H
este
r, R
icha
rd B
illin
gsle
y, C
olle
y M
atri
x, K
enne
th M
asse
y, J
eff S
agar
in, a
nd P
eter
Wol
fe. E
ach
com
pute
r ra
nkin
g ac
coun
ts fo
r sc
hedu
le st
reng
th in
its f
orm
ula.
BC
S Av
erag
e - T
he B
CS
Aver
age
is c
alcu
late
d by
ave
ragi
ng th
e pe
rcen
t tot
als o
f the
Ass
ocia
ted
Pres
s, U
SA T
oday
/ESP
N C
oach
es a
nd C
ompu
ter
polls
.

83
Team ...................... O18 O25 N1 N8 N15 N22 N29 D5USC ...........................1 1 1 1 1 1 1 1Oklahoma ..................3 2 2 2 2 2 2 2Auburn ......................4 4 3 3 3 3 3 3Texas ........................11 10 7 6 5 5 5 4California ..................8 8 4 4 4 4 4 5Utah ...........................7 6 6 7 6 6 6 6Georgia ....................10 9 9 8 11 8 7 7Virginia Tech ............25 22 20 18 15 14 12 8Boise State ...............14 13 12 10 9 7 8 9Louisville .................17 17 15 14 10 10 9 10LSU ..........................19 20 17 19 16 13 11 11Iowa ...........................– 23 21 20 18 11 13 12Michigan ..................13 12 11 9 7 12 14 13Miami (Fla.) ..............2 3 10 17 12 9 10 14Tennessee ..................9 11 8 15 17 15 15 15Florida State ..............5 5 13 12 8 18 16 16Wisconsin ..................6 7 5 5 13 20 17 17Virginia.....................15 16 14 11 19 17 18 18Arizona State ............18 15 18 16 14 16 19 19Texas A&M ..............16 14 22 21 20 19 20 20Pittsburgh ..................– – – – – – 23 21Texas Tech .................– – – – – – 21 22Florida ......................22 – – – – – 22 23Oklahoma State ........21 19 19 22 22 22 24 24Ohio State ..................– – – – – – 25 25Minnesota ..................– 25 – – – – – –Boston College ..........– – 25 23 21 21 – –West Virginia ............20 18 16 13 23 23 – –UTEP .........................– 24 24 24 24 24 – – Bowling Green ..........– – – – 25 25 – –Notre Dame ..............23 – – 25 – – – –Southern Miss ...........– – 23 – – – – –Purdue ......................12 21 – – – – – –UAB .........................24 – – – – – – –
2004 BCS Standings Week-by-Week

84
FIN
AL
200
3 B
OW
L C
HA
MPI
ON
SHIP
SE
RIE
S ST
AN
DIN
GS
USA
/ Po
ll A
nder
son
Ric
hard
C
olle
y K
en
NY
Je
ff
Pet
er
Com
p. S
ched
ule
Sc
hedu
le Q
ualit
y
Pr
evio
usR
k T
eam
A
P E
SPN
A
vg.
& H
este
r B
illin
gsle
y M
atri
x M
asse
y T
imes
Sa
gari
n W
olfe
A
vg.
Stre
ngth
R
ank
Los
s W
in
Tot
al
Ran
k (.T
ot)
1.
Okl
ahom
a 3
3 3
1 1
1 2
5 1
1 1.
17
11
0.44
1
-0.5
5.
11
1 (
2.06
) 2
. L
SU
2 2
2 2
2 2
1 2
2 2
1.83
29
1.
16
1 0.
0 5.
99
3 (
8.43
) 3
. U
SC
1 1
1 3
3 3
3 1
4 3
2.67
37
1.
48
1 0.
0 6.
15
2 (
6.90
) 4
. M
ichi
gan
4 4
4 7
4 6
5 3
5 5
4.67
14
0.
56
2 -0
.6
10.6
3 4
(10
.22)
5.
Ohi
o St
ate
7 6
6.5
6 6
4 4
8 6
7 5.
50
7 0.
28
2 0.
0 14
.28
5 (
14.8
3) 6
. T
exas
5
5 5
5 9
8 7
4 8
10
6.83
20
0.
80
2 -0
.1
14.5
3 6
(15
.18)
7.
Flor
ida
Stat
e 9
8 8.
5 8
8 5
8 7
7 6
6.83
15
0.
60
2 0.
0 17
.93
8 (
18.4
4) 8
. T
enne
ssee
6
7 6.
5 10
7
10
11
9 10
11
9.
50
46
1.84
2
-0.2
19
.64
9 (
20.3
7) 9
. M
iam
i (Fl
a.)
10
9 9.
5 9
5 7
9 10
11
9
8.17
13
0.
52
3 -0
.4
19.7
9 10
(20
.89)
10.
Kan
sas S
tate
8
10
9 16
12
12
12
6
13
13
11.3
3 10
0.
40
1 -1
.0
22.7
3 15
(35
.66)
11.
Mia
mi (
OH
) 14
15
14
.5
4 10
9
6 9
3 4
6.00
68
2.
72
3 0.
0 24
.22
11 (
27.4
0)12
. G
eorg
ia
11
11
11
12
11
11
10
22
9 8
10.1
7 18
0.
72
1 -0
.3
24.5
9 7
(1
5.33
)13
. Io
wa
13
12
12.5
14
16
15
13
12
12
12
13
.50
16
0.64
3
-0.7
28
.94
12 (
27.9
0)14
. Pu
rdue
12
13
12
.5
15
17
17
14
15
15
17
15.8
3 40
1.
60
3 0.
0 32
.93
13 (
30.5
3)15
. Fl
orid
a 17
17
17
24
14
23
15
18
16
18
16
.50
5 0.
20
4 -0
.9
36.8
0 14
(34
.71)
16. W
ashi
ngto
n St
ate
15
14
14.5
18
19
19
22
21
21
21
19
.83
44
1.76
3
0.0
39.0
9 16
(36
.77)
17.
Boi
se S
tate
18
16
17
21
13
16
21
34
17
16
17
.33
105
4.20
1
0.0
39.5
3 19
(42
.48)
18.
TC
U
19
19
19
11
15
13
24
39
22
15
16.6
7 95
3.
80
1 0.
0 40
.47
17 (
39.3
9)19
. M
issi
ssip
pi
16
18
17
23
20
24
20
17
24
24
21.3
3 70
2.
80
3 0.
0 44
.13
20 (
45.2
6)20
. N
ebra
ska
22
21
21.5
17
29
18
18
19
.5
18
20
18.4
2 32
1.
28
3 0.
0 44
.20
21 (
45.2
7)21
. O
klah
oma
Stat
e 21
22
21
.5
19
25
21
16
16
20
22
19.0
0 58
2.
32
3 -0
.1
45.7
2 22
(46
.37)
22.
Uta
h 25
25
25
13
21
14
17
33
19
19
17
.17
59
2.36
2
0.0
46.5
3 23
(47
.11)
23.
Mar
ylan
d 23
24
23
.5
25
31
20
23
11
23
23
20.8
3 56
2.
24
3 0.
0 49
.57
24 (
50.6
2)24
. B
owlin
g G
reen
26
30
28
29
26
22
19
36
14
14
20
.67
36
1.44
3
0.0
53.1
1 18
(41
.73)
25.
Min
neso
ta
24
20
22
27
24
28
28
28
32
28
27.1
7 83
3.
32
3 0.
0 55
.49
25 (
56.4
5)E
XPL
AN
AT
ION
:Po
ll A
vera
ge -
Ave
rage
of t
he A
P M
edia
Pol
l and
USA
Tod
ay/E
SPN
Coa
ches
Pol
l. O
ther
s rec
eivi
ng v
otes
cal
cula
ted
in o
rder
rec
eive
d.
Com
pute
r A
vera
ge -
Ave
rage
of A
nder
son
& H
este
r, R
icha
rd B
illin
gsle
y, C
olle
y M
atri
x, K
enne
th M
asse
y, N
ew Y
ork
Tim
es, J
eff S
agar
in’s
USA
Tod
ay a
nd th
e Pe
ter
Wol
fe r
anki
ngs.
The
com
pute
r co
mpo
nent
will
be
dete
rmin
ed b
y av
erag
ing
six
of th
e se
ven
rank
ings
. T
he lo
wes
t (w
orst
) com
pute
r ra
nkin
g w
ill b
e di
sreg
arde
d.
Sche
dule
Ran
k - R
ank
of sc
hedu
le st
reng
th c
ompa
red
to o
ther
Div
isio
n I-
A te
ams o
f act
ual g
ames
pla
yed
divi
ded
by 2
5. T
his c
ompo
nent
is c
alcu
late
d by
det
erm
inin
g th
e cu
mul
ativ
e w
on/lo
ss r
ecor
ds o
f the
team
’s o
ppon
ent (
66 2
/3 p
erce
nt) a
nd th
e cu
mul
ativ
e w
on/lo
ss
reco
rds o
f the
team
’s o
ppon
ents
’ opp
onen
ts (3
3 1/
3 pe
rcen
t).
Los
ses -
One
poi
nt fo
r ea
ch lo
ss d
urin
g th
e se
ason
. Q
ualit
y W
in C
ompo
nent
- T
he q
ualit
y w
in c
ompo
nent
will
rew
ard
to v
aryi
ng d
egre
es te
ams t
hat d
efea
t opp
onen
ts r
anke
d am
ong
the
top
10 in
the
wee
kly
stan
ding
s. T
he b
onus
poi
nt sc
ale
will
ran
ge fr
om a
hig
h of
1.0
poi
nts f
or a
win
ove
r th
e to
p ra
nked
team
to a
low
of
0.1
for
a vi
ctor
y ov
er th
e 10
th-r
anke
d B
CS
team
. The
BC
S St
andi
ngs a
t the
end
of t
he se
ason
will
det
erm
ine
final
qua
lity
win
poi
nts.
If a
team
reg
iste
rs a
vic
tory
ove
r a
team
mor
e th
an o
nce
duri
ng th
e re
gula
r se
ason
, qua
lity
poin
ts w
ill b
e aw
arde
d ju
st o
nce.
Qua
lity
win
poi
nts a
re b
ased
on
the
stan
ding
s det
erm
ined
by
the
subt
otal
. The
fina
l sta
ndin
gs a
re r
econ
figur
ed to
refl
ect t
he q
ualit
y w
in p
oint
ded
uctio
n.

85
Team ................. *O20 O27 N3 N10 N17 N24 D1 D7Oklahoma ..............1 1 1 1 1 1 1 1LSU ......................12 7 7 4 4 3 3 2USC .......................7 4 2 2 3 2 2 3Michigan ...............– 13 8 8 9 4 4 4Ohio State ..............6 6 5 3 2 5 5 5Texas .....................– 22 12 5 5 6 6 6Florida State ..........5 3 3 13 11 9 8 7Tennessee ..............– 15 13 7 7 8 9 8Miami (Fla.) ..........2 2 4 12 12 10 10 9Kansas State ..........– – – – 19 16 15 10Miami (Ohio) ........– 19 21 16 14 13 11 11Georgia .................4 5 10 9 6 7 7 12Iowa ......................15 11 11 20 18 12 12 13Purdue ...................8 18 14 11 16 14 13 14Florida ...................– 21 17 14 13 11 14 15Washington State...9 8 15 10 10 15 16 16Boise State ............– – – – 23 19 19 17TCU......................14 12 9 6 8 17 17 18Mississippi ............– – 23 18 15 18 20 19Nebraska ..............11 9 18 17 22 23 21 20Oklahoma State .....– 14 19 25 21 21 22 21Utah .......................– – – – 24 22 23 22Maryland ...............– – – – – – 24 23Bowling Green ......– 17 16 23 20 20 18 24Minnesota ..............– 24 – 22 – – 25 25Arkansas ................– – – – – 24 – –Pittsburgh ..............– – 25 19 25 25 – –Northern Illinois ...10 23 22 21 – – – –Michigan State .....13 10 20 24 – – – –Missouri ................– 20 24 – – – – –UCLA ....................– 25 – – – – – –Virginia Tech .........3 16 6 15 17 – – – *Only 15 teams released on poll
2003 BCS Standings Week-by-Week

86
FIN
AL
2002
BO
WL
CH
AM
PIO
NSH
IP S
ER
IES
STA
ND
ING
S
USA
T/ P
oll A
nder
son
Ric
hard
C
olle
y K
en
NY
Je
ff
Pete
r C
omp.
Sc
hedu
le S
ched
ule
Q
ualit
y
Prev
ious
Rk
Team
A
P E
SPN
Avg.
& H
este
r B
illin
gsle
y M
atri
x Mas
sey
Tim
es S
agar
in W
olfe
A
vg.
Stre
ngth
R
ank
Los
s W
in
Tota
l
Ran
k (T
otal
)
1.
Mia
mi (
Fla.
) 1
1 1
2
1 1
1
1 1
2 1.
17
19
0.76
0
0.0
2.93
1 (3
.53)
2
. O
hio
Stat
e 2
2 2
1
2 2
2
3 2
1 1.
67
20
0.80
0
-0.5
3.
97
2
(4.0
1)
3.
Geo
rgia
4
4 4
3
3 3
4
4 3
3 3.
17
5 0.
20
1 0
.0
8.37
3 (9
.03)
4
. U
SC
5 5
5
5
6 4
3
2 4
4 3.
67
1 0
.04
2 -0
.2
10.5
1
4 (9
.84)
5
. Io
wa
3 3
3 4
5
5
8 5
5 5
4.83
49
1.
96
1 0.
0 10
.79
5
(10.
55)
6
. W
ashi
ngto
n St
ate
7 7
7 8
9
8
5 10
6
6 7.
00
21
0.84
2
-0.7
16
.14
6
(17.
67)
7
. O
klah
oma
8 8
8 7
4
7
7 6
8 7
6.33
14
0.
56
2 -0
.1
16.7
9
7 (1
8.87
)
8.
Kan
sas S
tate
6
6 6
15
11
13
10
8 12
10
10
.67
54
2.16
2
-0.7
20
.13
8
(20.
05)
9
. N
otre
Dam
e 11
12
11
.5
6
8 6
6
14.5
7
8
6.83
15
0.
60
2 0.
0 20
.93
10
(20.
73)
10.
Tex
as
9 9
9 10
7
9
11
12
9
11
9.50
22
0.
88
2 -0
.3
21.0
8
9 (2
0.28
) 1
1.
Mic
higa
n 12
11
11
.5
9
16
10
9
9 10
9
9.33
2
0.08
3
0.0
23.9
1
11 (2
4.08
) 1
2. P
enn
Stat
e 10
10
10
12
14
14
15
11
16
14
13
.33
16
0.64
3
0.0
26.9
7
13 (2
7.69
) 1
3. C
olor
ado
14
14
14
14
23
16
14
17
14
16
15.1
7 10
0.
40
4 -0
.3
33.2
7
12 (2
5.97
) 1
4. F
lori
da S
tate
16
16
16
13
24
12
13
19
13
13
13
.83
3 0.
12
4 0.
0 33
.95
14
(36.
12)
15.
Wes
t Vir
gini
a 15
13
14
19
15
17
19
16
19
18
17
.33
41
1.64
3
0.0
35.9
7
15 (3
8.43
)
EX
PLA
NAT
ION
:Po
ll Av
erag
e - A
vera
ge o
f the
AP
Med
ia P
oll a
nd U
SA T
oday
/ESP
N C
oach
es P
oll.
Oth
ers r
ecei
ving
vot
es c
alcu
late
d in
ord
er r
ecei
ved.
C
ompu
ter A
vera
ge -
Aver
age
of A
nder
son
& H
este
r, R
icha
rd B
illin
gsle
y, C
olle
y M
atri
x, K
enne
th M
asse
y, N
ew Y
ork
Tim
es, J
eff S
agar
in’s
USA
Tod
ay a
nd th
e Pe
ter
Wol
fe r
anki
ngs.
The
com
pute
r co
mpo
nent
will
be
dete
rmin
ed b
y av
erag
ing
six
of th
e se
ven
rank
ings
. The
low
est (
wor
st) c
ompu
ter
rank
ing
will
be
disr
egar
ded.
Sc
hedu
le R
ank
- Ran
k of
sche
dule
stre
ngth
com
pare
d to
oth
er D
ivis
ion
I-A
team
s of a
ctua
l gam
es p
laye
d di
vide
d by
25.
Thi
s com
pone
nt is
cal
cula
ted
by d
eter
min
ing
the
cum
ulat
ive
won
/loss
rec
ords
of t
he te
am’s
opp
onen
t (66
2/3
pe
rcen
t) a
nd th
e cu
mul
ativ
e w
on/lo
ss r
ecor
ds o
f the
team
’s o
ppon
ents
’ opp
onen
ts (3
3 1/
3 pe
rcen
t).
Los
ses -
One
poi
nt fo
r ea
ch lo
ss d
urin
g th
e se
ason
. Q
ualit
y W
in C
ompo
nent
- T
he q
ualit
y w
in c
ompo
nent
will
rew
ard
to v
aryi
ng d
egre
es te
ams t
hat d
efea
t opp
onen
ts r
anke
d am
ong
the
top
10 in
the
wee
kly
stan
ding
s. T
he b
onus
poi
nt sc
ale
will
ran
ge fr
om a
hig
h of
1.0
poi
nts f
or a
win
ov
er th
e to
p ra
nked
team
to a
low
of 0
.1 fo
r a v
icto
ry o
ver t
he 1
0th-
rank
ed B
CS
team
. The
BC
S St
andi
ngs a
t the
end
of t
he se
ason
will
det
erm
ine
final
qua
lity
win
poi
nts.
If a
team
regi
ster
s a v
icto
ry o
ver a
team
mor
e th
an o
nce
duri
ng
the
regu
lar
seas
on, q
ualit
y po
ints
will
be
awar
ded
just
onc
e. Q
ualit
y w
in p
oint
s are
bas
ed o
n th
e st
andi
ngs d
eter
min
ed b
y th
e su
btot
al. T
he fi
nal s
tand
ings
are
rec
onfig
ured
to r
eflec
t the
qua
lity
win
poi
nt d
educ
tion.

87
Team ...................... O21 O28 N4 N11 N18 N25 D2 D8
Miami (Fla.) ..............2 2 3 2 1 1 1 1Ohio State ..................6 5 2 1 2 2 2 2Georgia .....................5 4 6 6 5 4 3 3USC ..........................14 11 9 9 8 6 4 4Iowa ..........................13 10 8 8 7 5 5 5Washington State.......7 8 5 3 3 8 6 6Oklahoma ..................1 1 1 4 4 3 7 7Kansas State ..............– 15 15 12 11 10 8 8Notre Dame ...............3 3 7 7 6 7 10 9Texas ........................10 7 4 5 10 9 9 10Michigan ...................8 13 11 10 9 11 11 11Penn State ..................– – – 15 15 14 13 12Colorado ....................– 12 – – 13 12 12 13Florida State .............12 – 13 11 12 – 14 14West Virginia .............– – – – – – 15 15Florida .......................– – 14 14 14 13 – –Colorado State ...........– – – – – 15 – –LSU ...........................9 14 – 13 – – – –Virginia Tech .............4 6 10 – – – – –NC State ...................11 9 12 – – – – –Oregon ......................15 – – – – – – –
2002 BCS Standings Week-by-Week

88
FIN
AL
2001
BO
WL
CH
AM
PIO
NSH
IP S
ER
IES
STA
ND
ING
S
U
SAT
/ P
oll
And
erso
n
AJC
Ric
hard
Ken
D
avid
J
eff
Scr
ipps
- Pe
ter
Com
p.
––S
ched
ule–
-
Q
ualit
y
Prev
ious
Ran
k Te
am
AP
ESP
N
Avg.
&
Hes
ter
Col
ley
Bill
ings
ley
Mas
sey
Rot
hman
Sag
arin
How
ard
W
olfe
Avg
. St
reng
th
Ran
k L
oss
Win
T
otal
R
k(To
tal)
1.
M
iam
i (Fl
a.)
1 1
1 1
1 1
1 1
1
1 1
1.00
18
0.
72
0 -0
.1
2.62
1(
2.50
)
2.
Neb
rask
a 4
4 4
2 2
2 3
2
3 2
2 2.
17
14
0.56
1
-0.5
7.
23
3 (8
.39)
3
. C
olor
ado
3 3
3 4
5 4
4 5
5
5 3
4.50
2
0.08
2
-2.3
7.
28
4 (9
.880
4
. O
rego
n 2
2 2
3 3
3 2
8
7 6
7 4.
83
31
1.24
1
-0.4
8.
67
5 (1
0.44
)
5.
Flor
ida
5 5
5 9
8 7
8 4
2
3 5
5.83
19
0.
76
2 -0
.5
13.0
9 6
(14.
65)
6
. Te
nnes
see
8 8
8 5
4 8
6 7
8
7 4
6.17
3
0.12
2
-1.6
14
.69
2 (4
.79)
7
. Te
xas
9 9
9 8
9 10
9
3
4 4
6 6.
67
33
1.32
2
-1.2
17
.79
7 (1
9.22
)
8.
Illin
ois
7 7
7 7
6 6
12
13
12
10
12
9.
83
37
1.48
1
0.0
19.3
1 8
(20.
69)
9
. St
anfo
rd
11
11
11
6 7
11
5 9
9
8 8
7.83
22
0.
88
2 -1
.3
20.4
1 9
(21.
64)
1
0. M
aryl
and
6 6
6 14
10
5
10
11
11
14
11
11
.17
78
3.12
1
0.0
21.2
9 10
(22.
25)
1
1. O
klah
oma
10
10
10
10
11
9 13
6
6
9 9
9.0
0 36
1.
44
2 -0
.9
21.5
4 11
(22.
79)
1
2. W
ash.
St.
13
13
13
12
12
12
7 10
10
11
10
10.8
3 4
2 1.
68
2 -0
.6
26.9
1 13
(27.
04)
1
3. L
SU
12
12
12
11
13
14
14
12
18
13
14
13
.33
10
0.43
3
-1.0
27
.73
NR
1
4. S
o. C
arol
ina
14
14
14
20
19
19
17
17
23
23
17
19
.17
40
1.63
3
0.0
37.7
7 15
(37.
15)
1
5. W
ashi
ngto
n 21
20
20
.5
13
15
15
11
16
25
17
13
14
.83
21
0.84
3
-1.0
38
.17
14 (3
6.73
)
EX
PLA
NAT
ION
:Po
ll Av
erag
e - A
vera
ge o
f the
AP
Med
ia P
oll a
nd U
SA T
oday
/ESP
N C
oach
es P
oll.
Oth
ers r
ecei
ving
vot
es c
alcu
late
d in
ord
er r
ecei
ved.
C
ompu
ter A
vera
ge -
Aver
age
of A
nder
son
& H
este
r, A
tlant
a Jo
urna
l-Con
stitu
tion
Col
ley
Mat
rix,
Ric
hard
Bill
ings
ley,
Ken
neth
Mas
sey,
Dav
id R
othm
an, J
eff S
agar
in’s
USA
Tod
ay, M
atth
ews/
Scri
pps-
How
ard,
and
the
Pete
r W
olfe
ra
nkin
gs. T
he c
ompu
ter
com
pone
nt w
ill b
e de
term
ined
by
aver
agin
g si
x ra
nkin
gs. T
he h
ighe
st a
nd th
e lo
wes
t will
be
disr
egar
ded.
Sc
hedu
le R
ank
- Ran
k of
sche
dule
stre
ngth
com
pare
d to
oth
er D
ivis
ion
I-A
team
s of a
ctua
l gam
es p
laye
d di
vide
d by
25.
Thi
s com
pone
nt is
cal
cula
ted
by d
eter
min
ing
the
cum
ulat
ive
won
/loss
rec
ords
of t
he te
am’s
opp
onen
t (66
2/3
pe
rcen
t) a
nd th
e cu
mul
ativ
e w
on/lo
ss r
ecor
ds o
f the
team
’s o
ppon
ents
’ opp
onen
ts (3
3 1/
3 pe
rcen
t).
Los
ses -
One
poi
nt fo
r ea
ch lo
ss d
urin
g th
e se
ason
. Q
ualit
y W
in C
ompo
nent
- T
he q
ualit
y w
in c
ompo
nent
will
rew
ard
to v
aryi
ng d
egre
es te
ams t
hat d
efea
t opp
onen
ts r
anke
d am
ong
the
top
15 in
the
wee
kly
stan
ding
s. T
he b
onus
poi
nt sc
ale
will
ran
ge fr
om a
hig
h of
1.5
poi
nts f
or a
win
ov
er th
e to
p ra
nked
team
to a
low
of 0
.1 fo
r a v
icto
ry o
ver t
he 1
5th-
rank
ed B
CS
team
. The
BC
S St
andi
ngs a
t the
end
of t
he se
ason
will
det
erm
ine
final
qua
lity
win
poi
nts.
If a
team
regi
ster
s a v
icto
ry o
ver a
team
mor
e th
an o
nce
duri
ng
the
regu
lar
seas
on, q
ualit
y po
ints
will
be
awar
ded
just
onc
e. Q
ualit
y w
in p
oint
s are
bas
ed o
n th
e st
andi
ngs d
eter
min
ed b
y th
e su
btot
al. T
he fi
nal s
tand
ings
are
rec
onfig
ured
to r
eflec
t the
qua
lity
win
poi
nt d
educ
tion.

89
Team .......................... O22 O29 N5 N12 N19 N26 D3 D9
Miami (Fla.) ..............4 3 2 2 2 1 1 1Nebraska ...................2 1 1 1 1 4 3 2Colorado ....................– – – 14 15 7 4 3Oregon ......................13 10 6 4 5 5 5 4Florida ...................... 11 8 7 5 4 2 6 5Tennessee ..................9 7 4 7 7 6 2 6Texas .........................6 5 5 6 6 3 7 7Illinois .......................– – 12 10 8 8 8 8Stanford ....................14 6 11 9 9 10 9 9Maryland ...................8 – 15 12 12 11 10 10Oklahoma ..................1 2 3 3 3 9 11 11Washington State......10 12 9 8 14 13 13 12LSU ...........................– – – – – – – 13South Carolina .........15 – – – – – 15 14Washington...............12 11 8 – 11 14 14 15BYU ..........................– 13 13 13 13 12 12 –Georgia .....................– – – – – 15 – –Michigan ...................7 4 10 11 10 – – –Syracuse ....................– – – 15 – – – –Florida State ..............– – 14 – – – – –UCLA ........................3 9 – – – – – –Purdue .......................– 14 – – – – – –Virginia Tech .............5 15 – – – – – –
2001 BCS Standings Week-by-Week

90
FIN
AL
2000
BO
WL
CH
AM
PIO
NSH
IP S
ER
IES
STA
ND
ING
S
USA
T/
Poll
Ric
hard
D
unke
l K
enne
th
NY
D
avid
Je
ff
Scri
pps-
Se
attle
C
omp.
Sc
hedu
le
Sche
dule
Pr
evio
us R
k Te
am
AP
ESP
N
Avg.
Bill
ings
ley
Inde
x M
asse
y Ti
mes
R
othm
an
Saga
rin
How
ard
Tim
es
Avg.
St
reng
th
Ran
k L
osse
s To
tal
Rk
(Tot
al)
1.
O
klah
oma
1 1
1.0
1 3
2 3
1 3
2 1
1.86
11
0.
44
0 3.
30
1 (3
.96)
2
. Fl
orid
a St
ate
3 3
3.0
2 1
1 1
2 1
1 3
1.29
2
0.08
1
5.37
2
(5.1
8)
3.
Mia
mi (
Fla.
) 2
2 2.
0 3
2 3
2 3
2 3
4 2.
57
3 0.
12
1 5.
69
3 (5
.79)
4
. W
ashi
ngto
n 4
4 4.
0 10
11
5
5 4
8 4
2 5.
43
6 0.
24
1 10
.67
4 (1
0.18
)
5.
Vir
gini
a Te
ch
6 5
5.5
5 5
4 4
7 5
7 6
5.14
14
0.
56
1 12
.20
5 (1
2.31
)
6.
Ore
gon
Stat
e 5
6 5.
5 7
9 8
8.5
5 7
5 5
6.50
42
1.
68
1 14
.68
6 (1
4.28
)
7.
Flor
ida
7 7
7.0
4 4
7 6
9 6
6 7
5.71
1
0.04
2
14.7
5 7
(16.
48)
8
. N
ebra
ska
9 8
8.5
6 13
6
10
6 4
8 9
7.00
18
0.
72
2 18
.22
8 (1
8.79
)
9.
Kan
sas S
tate
11
9
10.0
8
12
11
12
8 9
11
12
10.1
4 29
1.
16
3 24
.30
9 (2
0.65
)
10.
Ore
gon
8 11
9.
5 12
17
14
15
11
14
9
8 11
.86
24
0.96
2
24/3
2 10
(24.
35)
1
1. N
otre
Dam
e 10
10
10
.0
14
15
15
8.5
12
16
10
10
12.0
7 25
1.
00
2 25
.07
11 (2
5.97
)
12.
Tex
as
12
12
12.0
11
6
9 11
10
10
12
15
9.
86
84
3.36
2
27.2
2 12
(27.
22)
1
3. G
eorg
ia T
ech
15
17
16.0
9
8 10
7
14
11
13
11
9.86
44
1.
76
2 29
.62
13 (3
1.73
)
14.
TC
U
13
16
14.5
16
7
12
20
15
12
14
20
13.7
1 95
3.
80
1 33
.01
14 (3
2.41
)
15.
Cle
mso
n 16
13
14
.5
13
21
13
19
13
15
15
13
14.4
3 56
2.
24
2 33
.17
15 (3
3.28
)
16.
Mic
higa
n 17
15
16
.0
15
10
16
17
17
13
17
17
15.0
0 35
1.
40
3 35
.40
16 (3
5.26
EX
PLA
NAT
ION
:Po
ll Av
erag
e - A
vera
ge o
f USA
Tod
ay/E
SPN
Coa
ches
and
AP
Med
ia P
olls
. Oth
ers r
ecei
ving
vot
es c
alcu
late
d in
ord
er r
ecei
ved.
Com
pute
r Ave
rage
- Av
erag
e of
Ric
hard
Bill
ings
ley,
Dun
kel I
ndex
, Ken
neth
Mas
sey,
New
Yor
k Ti
mes
, Dav
id R
othm
an, J
eff S
agar
in’s
USA
Tod
ay, M
atth
ews/
Scri
pps-
How
ard,
and
the A
nder
son
& H
este
r/Se
attle
Tim
es r
anki
ngs.
The
com
pute
r co
mpo
nent
is d
eter
min
ed b
y av
erag
ing
the
seve
n hi
ghes
t com
pute
r ra
nkin
gs. T
he lo
wes
t (w
orst
) com
pute
r ra
nkin
g is
be
disr
egar
ded.
Sche
dule
Ran
k - R
ank
of sc
hedu
le st
reng
th c
ompa
red
to o
ther
Div
isio
n I-
A te
ams o
f act
ual g
ames
pla
yed
divi
ded
by 2
5. T
his c
ompo
nent
is c
alcu
late
d by
det
erm
inin
g th
e cu
mul
ativ
e w
on/lo
ss r
ecor
ds o
f the
team
’s o
ppon
ent (
66
2/3
perc
ent)
and
the
cum
ulat
ive
won
/loss
rec
ords
of t
he te
am’s
opp
onen
ts’ o
ppon
ents
(33
1/3
perc
ent)
.L
osse
s - O
ne P
oint
for
each
loss
dur
ing
the
seas
on.

91
Team ...........................O23 O30 N6 N13 N20 N27 D3
Oklahoma ......................2 1 1 1 1 1 1Florida State ..................5 3 2 3 2 2 2Miami (Fla.) ..................4 5 3 2 3 3 3Washington....................9 8 6 5 4 4 4Virginia Tech .................3 2 8 6 6 5 5Oregon State ..................– 11 9 9 5 6 6Florida ...........................6 6 5 4 7 7 7Nebraska .......................1 4 4 8 8 8 8Kansas State .................10 – 11 10 9 9 9Oregon ...........................8 7 7 7 10 10 10Notre Dame ...................– 14 12 11 11 11 11Texas .............................– – – 14 12 12 12Georgia Tech .................– – – – – 13 13TCU..............................13 9 – – 14 14 14Clemson ........................7 13 – – 13 15 15Michigan .......................– 12 – – 15 – –Mississippi State ...........– 15 14 12 – – –Ohio State ..................... 11 – 13 13 – – –Texas A&M ...................– – – 15 – – –Purdue ..........................15 10 10 – – – –Northwestern .................– – 15 – – – –Georgia ........................12 – – – – – –Southern Miss ..............14 – – – – – –
2000 BCS Standings Week-by-Week

92
FIN
AL
1999
BO
WL
CH
AM
PIO
NSH
IP S
ER
IES
STA
ND
ING
S
U
SAT
/ Po
ll R
icha
rd
Dun
kel
Ken
neth
N
Y
Dav
id
Jeff
Sc
ripp
s-
Seat
tle
Com
pute
r Sch
edul
e Sc
hedu
le
Prev
ious
Ran
k, T
eam
A
P E
SPN
Avg
. B
illin
gsle
y In
dex
Mas
sey
Tim
es
Rot
hman
Saga
rin H
owar
d Ti
mes
Av
g.
Stre
ngth
R
ank
Los
ses
Tota
l R
nk.(T
otal
)
1.
Flor
ida
Stat
e 1
1 1.
0 1
1 1
1 1
1 1
1 1.
00
6 0.
24
0 2.
24
1 (2
.24)
2.
Vir
gini
a Te
ch
2 2
2.0
2 2
2 2
2 2
2 3
2.00
53
2.
12
0 6.
12
2 (6
.16)
3
. N
ebra
ska
3 3
3.0
3 3
3 4
3 3
3 2
2.86
14
0.
56
1 7.
42
3 (7
.70)
4
. A
laba
ma
5 6
5.5
5 7
6 3
4 6
4 4
4.57
1
0.04
2
12.1
1 7
(16.
64)
5
. Te
nnes
see
6 5
5.5
7 6
5 5
6 5
5 8
5.57
16
0.
64
2 13
.71
5 (1
4.13
)
6.
Kan
sas S
tate
7
7 7.
0 4
5 4
6 5
4 6
5 4.
71
63
2.52
1
15.2
3 6
(15.
59)
7
. W
isco
nsin
4
4 4.
0 8
4 7
8 9
7 11
12
7.
71
75
3.00
2
16.7
1 8
(16.
67)
8
. M
ichi
gan
8 8
8.0
10
9 8
7 10
9
7 6
8.00
2
0.08
2
18.0
8 9
(19.
69)
9
. M
ichi
gan
Stat
e 9
9 9.
0 6
8 9
10
8 8
8 7
7.71
10
0.
40
2 19
.11
10 (2
0.26
) 1
0. F
lori
da
10
10
10.0
9
12
12
16
7 11
9
9 9.
86
5 0.
20
3 23
.06
4 (1
3.38
) 1
1. P
enn
Stat
e 13
17
15
.0
11
10
10
20
11
10
10
11
10.4
3 8
0.32
3
28.7
5 13
(30.
00)
12.
Mar
shal
l 11
11
11
.0
33
31
11
11
12
13
22
15
16.4
3 93
3.
72
0 31
.15
12 (2
9.63
) 1
3. M
inne
sota
12
12
12
.0
14
19
17
21.5
15
15
15
21
16
.57
51
2.04
3
33.6
1 14
(34.
79)
14.
Tex
as A
&M
18
13
15
.5
13
16
15
15
16
17
18
14
15.1
4 28
1.
12
3 34
.76
15 (3
5.55
) 1
5. T
exas
14
18
16
.0
17
13
16
21.5
13
14
14
13
14
.29
13
0.52
4
34.8
1 11
(28.
96)
EX
PLA
NAT
ION
:Po
ll Av
erag
e - A
vera
ge o
f USA
Tod
ay/E
SPN
Coa
ches
and
AP
Med
ia P
olls
. Oth
ers r
ecei
ving
vot
es c
alcu
late
d in
ord
er r
ecei
ved.
Com
pute
r Ave
rage
- Ave
rage
of R
icha
rd B
illin
gsle
y, D
unke
l Ind
ex, K
enne
th M
asse
y, N
ew Y
ork
Tim
es, D
avid
Rot
hman
, Jef
f Sag
arin
’s U
SA T
oday
, Mat
thew
s/Sc
ripp
s-H
owar
d, a
nd th
e And
erso
n &
Hes
ter/
Seat
tle T
imes
rank
ings
. T
he c
ompu
ter
com
pone
nt is
det
erm
ined
by
aver
agin
g th
e se
ven
high
est c
ompu
ter
rank
ings
. The
low
est (
wor
st) c
ompu
ter
rank
ing
is d
isre
gard
ed.
Sche
dule
Ran
k - R
ank
of sc
hedu
le st
reng
th c
ompa
red
to o
ther
Div
isio
n I-
A te
ams o
f act
ual g
ames
pla
yed
divi
ded
by 2
5. T
his c
ompo
nent
is c
alcu
late
d by
det
erm
inin
g th
e cu
mul
ativ
e w
on/lo
ss r
ecor
ds o
f the
team
’s o
ppon
ent
(66
2/3
perc
ent)
and
the
cum
ulat
ive
won
/loss
rec
ords
of t
he te
am’s
opp
onen
ts’ o
ppon
ents
(33
1/3
perc
ent)
.L
osse
s - O
ne P
oint
for
each
loss
dur
ing
the
seas
on.

93
Team .......................... O25 N1 N8 N15 N22 N29 D5
Florida State ..................1 1 1 1 1 1 1Virginia Tech .................3 3 3 2 2 2 2Nebraska .......................7 8 6 3 3 3 3Alabama .......................13 9 9 6 8 7 4Tennessee ......................4 5 2 5 4 5 5Kansas State ..................5 6 5 8 6 6 6Wisconsin ......................9 10 8 7 7 8 7Michigan ......................12 13 12 10 10 9 8Michigan State .............15 – 13 12 11 10 9Florida ...........................6 4 4 4 5 4 10Penn State ......................2 2 7 11 12 13 11 Marshall .......................14 14 – 14 13 12 12Minnesota ......................– – – – 14 14 13Texas A&M ...................– – – – – 15 14Texas ............................10 11 11 9 9 11 15Southern Miss ...............– – – – 15 – –Georgia Tech .................8 7 15 13 – – –Mississippi State ..........11 12 10 15 – – –BYU ..............................– 15 14 – – – –
1999 BCS Standings Week-by-Week

94
FIN
AL
1998
BO
WL
CH
AM
PIO
NSH
IP S
ER
IES
STA
ND
ING
S
U
SA T
oday
/ Po
ll Se
attle
New
Yor
k C
ompu
ter
Sche
dule
Q
uart
ile
Prev
ious
Ran
k Te
am
AP
ESP
N
Avg.
Ti
mes
Sa
gari
n Ti
mes
Av
g.
Stre
ngth
R
ank
Los
ses
Tota
l R
k(To
tal)
1
. Te
nnes
see
1 1
1.0
1 2
2 1.
67
20
0.80
0
3.47
1
(4.9
9)
2.
Flor
ida
Stat
e 2
2 2.
0 2
2.25
(3)
1 1.
75
4 0.
16
1 4.
91
4 (8
.20)
3
. K
ansa
s Sta
te
4 4
4.0
4 1
4.00
(5)
3.00
49
1.
96
1 9.
96
3 (6
.31)
4
. O
hio
Stat
e 3
3 3.
0 6.
75 (7
) 6
3 5.
25
28
1.12
1
10.3
7 5
(12.
33)
5
. U
CL
A
6 5
5.5
3 4
5.25
(6)
4.08
8
0.32
1
10.9
0 2
(5.0
3)
6.
Texa
s A&
M
8 9
8.5
6 5
4 5.
00
5 0.
20
2 15
.70
8 (2
0.19
)
7.
Ari
zona
5
6 5.
5 5
9 9
7.67
58
2.
32
1 16
.49
6 (1
5.16
)
8.
Flor
ida
7 7
7.0
10
8 11
9.
67
32
1.28
2
19.9
5 7
(19.
79)
9
. W
isco
nsin
9
8 8.
5 9
10
10
9.67
61
2.
44
1 21
.61
9 (2
0.85
)
10.
Tu
lane
10
10
10
.0
8 14
16
.5 (2
3)
12.8
3 96
3.
84
0 26
.67
10 (2
6.88
)
11.
N
ebra
ska
14
16
15.0
11
7
13.5
(15)
10
.50
14
0.56
3
29.0
6 11
(29.
06)
1
2.
Vir
gini
a 13
12
12
.5
13
18
17
16.0
0 43
1.
72
2 32
.22
14 (3
3.39
)
13.
A
rkan
sas
11
11
11.0
17
12
21
.75
(22)
16
.92
59
2.36
2
32.2
8 13
(33.
36)
1
4.
Geo
rgia
Tec
h 12
14
13
.0
16
20
12
16.0
0 44
1.
76
2 32
.76
12 (3
2.43
1
5.
Syra
cuse
18
17
17
.5
17.2
5 (2
4)
16
7 13
.42
22
0.88
3
34.8
0 15
(35.
66)
EX
PLA
NAT
ION
:Po
ll Av
erag
e - A
vera
ge o
f USA
Tod
ay/E
SPN
Coa
ches
and
AP
Med
ia P
olls
. C
ompu
ter A
vera
ge - A
vera
ge o
f The
And
erso
n &
Hes
ter/
Seat
tle T
imes
, Jef
f Sag
arin
’s U
SA T
oday
and
New
Yor
k Ti
mes
rank
ings
. In
orde
r to
prev
ent u
nusu
al d
iffer
ence
s in
indi
vidu
al fo
rmul
as, a
max
imum
adj
uste
d de
viat
ion
of
no g
reat
er th
an 5
0 pe
rcen
t of t
he a
vera
ge o
f the
two
low
est c
ompu
ter r
anki
ngs i
s util
ized
. In
case
s of a
djus
ted
devi
atio
n, th
e hig
h sc
ore w
ill b
ecom
e no
low
er th
an th
e mid
dle s
core
. Raw
scor
es in
par
enth
esis
nex
t to
adju
sted
scor
es.
Qua
rtile
Ran
k - R
ank
of sc
hedu
le st
reng
th c
ompa
red
to o
ther
Div
isio
n I-
A te
ams o
f act
ual g
ames
pla
yed
divi
ded
by 2
5. T
his c
ompo
nent
is c
alcu
late
d by
det
erm
inin
g th
e cu
mul
ativ
e w
on/lo
ss r
ecor
ds o
f the
team
’s o
ppon
ent
(66.
6 pe
rcen
t) a
nd th
e cu
mul
ativ
e w
on/lo
ss r
ecor
ds o
f the
team
s’ op
pone
nts’
oppo
nent
s (33
.3 p
erce
nt).
Los
ses:
One
poi
nt fo
r ea
ch lo
ss d
urin
g th
e se
ason
.

95
Team .................. O26 N2 N9 N16 N23 N30 D6Tennessee ..............3 2 1 1 1 1 1Florida State ..........5 6 4 4 4 4 2Kansas State ..........4 4 3 3 3 3 3Ohio State ..............2 1 8 7 6 5 4UCLA ....................1 3 2 2 2 2 5Texas A&M ...........8 7 6 6 5 8 6Arizona .................14 10 10 8 7 6 7Florida ...................7 5 5 5 8 7 8Wisconsin ..............9 8 9 13 10 9 9Tulane ....................– – – – 11 10 10 Nebraska ...............6 12 11 14 12 11 11Virginia.................15 15 – – – 14 12Arkansas ...............12 11 7 9 13 13 13Georgia Tech .........– – – – – 12 14Syracuse ................– – – – – 15 15Notre Dame ...........– 13 12 10 9 – –Michigan ...............– – – 12 14 – –Georgia ................13 – – 15 15 – –Oregon .................. 11 – 14 11 – – –Missouri ................– – 13 – – – –Texas .....................– 14 15 – – – –Penn State .............10 9 – – – – –
1998 BCS Standings Week-by-Week

96
2013 Discover BCS National Championship
Sun Life StadiumMiami Gardens, Fla.
Jan. 7, 2013Teams .............................................1 2 3 4 ........Score#2 Alabama (13-1) ........................14 14 7 7 ............. 42#1 Notre Dame (13-1) .....................0 0 7 7 ............. 14Att–80,120Kickoff Time: 8:30; End of Game: 11:40; Total Elapsed Time: 3:10Weather: 73 degrees, wind NE 5
Scoring SummaryALA - Eddie Lacy, 20 run (Jeremy Shelley kick), 5-82 (2:57), 12:03, 1stALA - M. Williams, 3 pass from AJ McCarron (Jeremy Shelley kick), 10-61 (4:49), 6:14, 1stALA - T.J. Yeldon, 1 run (Jeremy Shelley kick), 8-80 (4:26), 14:56, 2ndALA - Eddie Lacy, 11 pass from AJ McCarron (Jeremy Shelley kick), 9-71 (3:12), 0:31, 2ndALA - Amari Cooper, 34 pass from AJ McCarron (Jeremy Shelley kick), 10-97 (5:37), 7:34, 3rdND - Everett Golson, 2 run (Kyle Brindza kick), 9-85 (3:26), 4:08, 3rdALA - Amari Cooper 19 pass from AJ McCarron (Jeremy Shelley kick), 14-86 (7:41), 11:27, 4thND - Theo Riddick, 6 pass from Everett Golson (Kyle Brindza kick), 10-75 (3:36), 7:51, 4th
Final Statistics ........................................ ALA ND1st Downs ......................................................28 16 Rushing ................................................13 3 Passing .................................................14 12 Penalty ...................................................1 1Rushes-Yards.......................................... 45-265 19-32Passing Yards ...............................................264 270Passes Comp-Att-Int .............................20-28-0 21-36-1Total Offense (Plays-Yards) ................... 73-529 55-302Punt Returns-Yards ...................................... 1-1 3-2Kickoff Returns-Yards ............................... 2-31 3-47Punts (Number-Avg) ......................4-197 (49.2) 5-214 (42.8)Fumbles-Lost ............................................... 0-0 1-0Sacks By: (Number-Yards) ........................ 2-16 0-0Penalties-Yards ........................................... 4-40 3-353rd Down Conversions .............................. 8-13 2-84th Down Conversions ................................. 1-1 0-1
Individual StatisticsRushing: ALA — Eddie Lacy 20-140; T.J. Yeldon 21-108; AJ McCarron 1-9; Kenyan Drake 3-8. ND — Theo Riddick 10-37; Cierre Wood 4-2; Everett Golson 5-(-7).
Passing: ALA–AJ McCarron 20-28-0-264. ND–Everett Golson 21-36-1-270.
Receiving: ALA—Amari Cooper 6-105; Kevin Norwood 3-66; M Williams 3-17; Chris-tion Jones 2-40; Eddie Lacy 2-17; Marvin Shinn 2-14; Kelly Johnson 1-5; T.J. Yeldon 1-0. ND — T.J. Jones 7-90; DeVaris Daniels 6-115; Tyler Eifert 6-61; Theo Riddick 1-6; Cierre Wood 1-(-2).
Punting: ALA – Cody Mandell 4-197, 49.2. ND – Ben Turk 5-214, 42.8.
Returns: ALA–Punt: Christion Jones 1-1; Kickoff: Christion Jones 2-31; Int.: H. Clinton-Dix 1-0. ND–Punt: Davonte Neal 3-2; Kickoff: G. Atkinson 3-47.
Field Goals: None Tackles (Solo-Assist-Total; QBS-Yds; TFL-Yds;)ALA — C.J. Mosley (5-3-8; TFL-1.0-6); H. Clinton-Dix (4-3-7, TFL-0.5-1); Robert Lester (3-3-6); Deion Belue (4-0-4; TFL-1.0-2); Landon Collins (3-0-3); Dee Milliner (1-2-3); Trey DePriest (1-2-3); Vinnie Sunseri (1-1-2); Adrian Hubbard (1-1-2, QBS-1.0-5, TFL-1.0-5); Tyler Hayes (2-0-2); Jeoffrey Pagan (1-0-1); Quinton Dial (0-1-1, TFL-0.5-1); Christion Jones (0-1-1); Geno Smith (1-0-1); Nick Perry (1-0-1); Denzel Devall (0-1-1); Nico Johnson (0-1-1); Ed Stinson (1-0-1); Jesse Williams (0-1-1); D.J. Pettway (1-0-1, QBS-1.0-11, TFL-1.0-11).
ND—Zeke Motta (7-9-16); Manti Te’o (3-7-10; KeiVarae Russell (3-5-8); Mathias Farley (4-2-6); Dan Fox (4-2-6); Stephon Tuitt (2-3-5); Louis Nix (5-0-5, TFL-2.0-0.5); Bennett Jackson (1-3-4); Carlo Calabrese (2-1-3, TFL-1.0-2); Prince Shembo (1-2-3); Sheldon Day (1-2-3); Cavalaris (1-1-2); Ishaq Williams (0-1-1); Danny Spond (0-1-1); Elijah Shumate (1-0-1); Chris Salvi (0-1-1); Ben Councell (1-0-1); Kapron Lewis-Moore (1-0-1).

97
RecapAlabama rolled past Notre Dame 42-14 in front of a Sun Life Stadium re-cord crowd of 80,120. The win was Alabama’s third BCS title in four years and the Crimson Tide became the first team in the BCS era to win back-to-back national championships. The win also secured Alabama its ninth AP title, the most by any school.
Crimson Tide running back Eddie Lacy earned offensive MOP honors. Lacy finished the game with 140 yards on 20 carries and a pair of touch-downs (one rushing, one receiving).
Quarterback AJ McCarron threw four touchdown passes while completing 20 of 28 pass attempts. The Crimson Tide led 28-0 at halftime.
Linebacker C.J. Mosley earned MOP defensive honors by leading a stout Alabama defense with eight tackles. The Fighting Irish were held to 32 yards rushing.
For the Irish, it was a disappointing end to a storybook season. After com-piling a 12-0 regular-season record with some emotional and dramatic vic-tories, the Irish were beaten for the first time.
Starting Lineups
Alabama Crimson TidePos. No. OffenseLT 71 Cyrus KouandjioLG 65 Chance WarmackC 75 Barrett JonesRG 61 Anthony SteenRT 76 D.J. FlukerTE 84 Brian VoglerTE 89 M. WilliamsQB 10 AJ McCarronRB 42 Eddie LacyWR 9 Amari CooperWR 83 Kevin Norwood
Pos. No. DefenseDE 49 Ed StinsonNG 54 Jesse WilliamsDE 92 Damion SquareSLB 4B Adrian HubbardMLB 33 Trey DePriestWLB 32 C.J. MosleyJACK 47 Xzavier DicksonCB 3 Vinnie SunseriCB 13 Deion BelueSS 6A H. Clinton-DixFS 37 Robert Lester
Reserves1A-John Fulton, 2F-Cody Mandell, 2D-N.McAlister, 2A-Tana Patrick, 4-T.J. Yeldon, 5C-Carson Tinker, 5-Jeremy Shelley, 6-Blake Sims, 8A-Jeoffrey Pagan, 9A-Quinton Dial, 16-Bradley Sylve, 17-Kenyan Drake, 18-Reggie Ragland, 21-Brent Calloway, 22-Christion Jones, 23-J.Washington, 24-Geno Smith, 26-Landon Collins, 27-Nick Perry, 28-Dee Milliner, 30-Denzel Devall, 31-Kelly Johnson, 35-Nico Johnson, 36-Tyler Hayes, 43-Cade Foster, 57-D.JU. Pettway, 62-Brandon Ivory, 63-Kellen Williams, 70-Ryan Kelly, 77-Arie Kouandjio, 78-Chad Lindsay, 79-Austin Shepherd, 80-Marvin Shinn, 85-Malcolm Faclane, 95-Darren Lake.
Notre DameFighting IrishPos. No. OffenseLT 70 Zack Martin LG 66 Chris Watt C 52 Braxston Cave RG 57 Mike Golic Jr.RT 74 Christian Lombard QB 5A Everett Golson RB 6 Theo Riddick TE 80 Tyler Eifert WR 7 T.J. Jones WR 18 Ben Koyack WR 85 Troy Niklas
Pos. No. DefenseDE 89 Lewis-Moore NG 9A Louis Nix DE 7A Stephon Tuitt OLB 13 Danny Spond ILB 5 Manti Te’o ILB 48 Dan Fox OLB 55 Prince Shembo CB 2 Bennett Jackson CB 6A KeiVarae Russell SS 17 Zeke Motta FS 41 Mathias Farley
Reserves1A-Ishaq Williams, 4-George Atkinson, 8-Ken-dall Moore, 9-Robby Toma, 10-DaVaris Daniels, 11-Tommy Rees, 14-Luke Massa, 15-Dan McCarthy, 19-Davonte Neal, 20-Cierre Wood, 22-Elijah Shumate, 24-Chris Salvi, 27-Kyle Brindza, 29-Nicky Baratti, 30-Ben Councell, 33-Cam McDaniel, 35-Ben Turk, 38-Joe Schmidt, 42-Ernie Soto, 43-Josh Atkinson, 44-Carlo Cal-abrese, 45-Romeo Okwara, 47-Connor Cavalaris, 59-Jarrett Grace, 60-Jordan Cowart, 65-Conor Hanratty, 69-Tony Springman, 72-Nick Martin, 81-John Goodman, 87-Daniel Smith, 91-Sheldon Day, 96-Kona Schwenke.
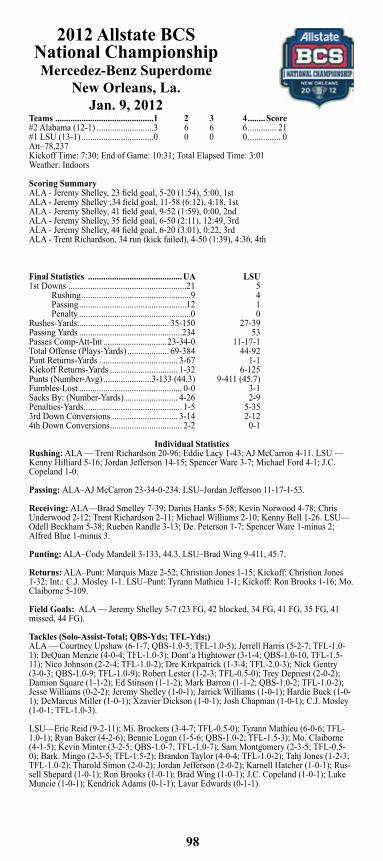
98
2012 Allstate BCS National ChampionshipMercedez-Benz Superdome
New Orleans, La.Jan. 9, 2012
Teams .............................................1 2 3 4 ........Score#2 Alabama (12-1) ..........................3 6 6 6 ............. 21#1 LSU (13-1) .................................0 0 0 0 ............... 0Att–78,237Kickoff Time: 7:30; End of Game: 10:31; Total Elapsed Time: 3:01Weather: Indoors
Scoring SummaryALA - Jeremy Shelley, 23 field goal, 5-20 (1:54), 5:00, 1stALA - Jeremy Shelley ,34 field goal, 11-58 (6:12), 4:18, 1stALA - Jeremy Shelley, 41 field goal, 9-52 (1:59), 0:00, 2ndALA - Jeremy Shelley, 35 field goal, 6-50 (2:11), 12:49, 3rdALA - Jeremy Shelley, 44 field goal, 6-20 (3:01), 0:22, 3rdALA - Trent Richardson, 34 run (kick failed), 4-50 (1:39), 4:36, 4th
Final Statistics ...........................................UA LSU1st Downs ......................................................21 5 Rushing ..................................................9 4 Passing .................................................12 1 Penalty ...................................................0 0Rushes-Yards.......................................... 35-150 27-39Passing Yards ...............................................234 53Passes Comp-Att-Int .............................23-34-0 11-17-1Total Offense (Plays-Yards) ................... 69-384 44-92Punt Returns-Yards .................................... 3-67 1-1Kickoff Returns-Yards ............................... 1-32 6-125Punts (Number-Avg) ......................3-133 (44.3) 9-411 (45.7)Fumbles-Lost ............................................... 0-0 3-1Sacks By: (Number-Yards) ........................ 4-26 2-9Penalties-Yards ............................................. 1-5 5-353rd Down Conversions .............................. 3-14 2-124th Down Conversions ................................. 2-2 0-1
Individual StatisticsRushing: ALA — Trent Richardson 20-96; Eddie Lacy 1-43; AJ McCarron 4-11. LSU — Kenny Hilliard 5-16; Jordan Jefferson 14-15; Spencer Ware 3-7; Michael Ford 4-1; J.C. Copeland 1-0.
Passing: ALA–AJ McCarron 23-34-0-234. LSU–Jordan Jefferson 11-17-1-53.
Receiving: ALA—Brad Smelley 7-39; Darius Hanks 5-58; Kevin Norwood 4-78; Chris Underwood 2-12; Trent Richardson 2-11; Michael Williams 2-10; Kenny Bell 1-26. LSU—Odell Beckham 5-38; Rueben Randle 3-13; De. Peterson 1-7; Spencer Ware 1-minus 2; Alfred Blue 1-minus 3.
Punting: ALA–Cody Mandell 3-133, 44.3. LSU–Brad Wing 9-411, 45.7.
Returns: ALA–Punt: Marquis Maze 2-52; Christion Jones 1-15; Kickoff: Christion Jones 1-32; Int.: C.J. Mosley 1-1. LSU–Punt: Tyrann Mathieu 1-1; Kickoff: Ron Brooks 1-16; Mo. Claiborne 5-109.
Field Goals: ALA — Jeremy Shelley 5-7 (23 FG, 42 blocked, 34 FG, 41 FG, 35 FG, 41 missed, 44 FG). Tackles (Solo-Assist-Total; QBS-Yds; TFL-Yds;)ALA — Courtney Upshaw (6-1-7; QBS-1.0-5; TFL-1.0-5); Jerrell Harris (5-2-7; TFL-1.0-1); DeQuan Menzie (4-0-4; TFL-1.0-3); Dont’a Hightower (3-1-4; QBS-1.0-10, TFL-1.5-11); Nico Johnson (2-2-4; TFL-1.0-2); Dre Kirkpatrick (1-3-4; TFL-2.0-3); Nick Gentry (3-0-3; QBS-1.0-9; TFL-1.0-9); Robert Lester (1-2-3; TFL-0.5-0); Trey Depriest (2-0-2); Damion Square (1-1-2); Ed Stinson (1-1-2); Mark Barron (1-1-2; QBS-1.0-2; TFL-1.0-2); Jesse Williams (0-2-2); Jeremy Shelley (1-0-1); Jarrick Williams (1-0-1); Hardie Buck (1-0-1); DeMarcus Miller (1-0-1); Xzavier Dickson (1-0-1); Josh Chapman (1-0-1); C.J. Mosley (1-0-1; TFL-1.0-3).
LSU—Eric Reid (9-2-11); Mi. Brockers (3-4-7; TFL-0.5-0); Tyrann Mathieu (6-0-6; TFL-1.0-1); Ryan Baker (4-2-6); Bennie Logan (1-5-6; QBS-1.0-2; TFL-1.5-3); Mo. Claiborne (4-1-5); Kevin Minter (3-2-5; QBS-1.0-7; TFL-1.0-7); Sam Montgomery (2-3-5; TFL-0.5-0); Bark. Mingo (2-3-5; TFL-1.5-2); Brandon Taylor (4-0-4; TFL-1.0-2); Tahj Jones (1-2-3; TFL-1.0-2); Tharold Simon (2-0-2); Jordan Jefferson (2-0-2); Karnell Hatcher (1-0-1); Rus-sell Shepard (1-0-1); Ron Brooks (1-0-1); Brad Wing (1-0-1); J.C. Copeland (1-0-1); Luke Muncie (1-0-1); Kendrick Adams (0-1-1); Lavar Edwards (0-1-1).

99
RecapAlabama’s defense held LSU to just 92 total yards as the Crimson Tide claimed the national championship with a 21-0 victory.
Alabama won its second BCS title in the last three years and avenged a 9-6 regular-season overtime loss to the Tigers in the process.
Alabama quarterback A.J. McCarron earned Offensive Most Valuable Play-er honors after throwing for 234 yards on 23-of-34 passing. Kicker Jeremey Shelley tied an all-bowls record with five made field goals which gave Ala-bama a 15-0 lead after three quarters. Tide running back Trent Richardson sealed the win with a 34-yard touchdown run with 4:36 left in the game.
Alabama’s Courtney Upshaw earned Defensive Most Valuable Player hon-ors after leading the Tide with seven tackles, including six individual stops and a sack.
The Crimson Tide posted 384 yards of total offense while holding the Ti-gers to the second-lowest yardage total in a BCS game. The Tide also had 21 first downs to just five for LSU. The Tigers didn’t cross midfield until midway through the fourth quarter.
Starting Lineups
Alabama Crimson TidePos. No. OffenseLT 75 Barrett JonesLG 65 Chance WarmackC 73 William VlachosRG 52 A. McCulloughRT 76 D.J. FlukerTE 89 M. WilliamsTE 17 Brad SmelleyQB 10 AJ McCarronRB 3 Trent RichardsonWR 4 Marquis MazeWR 11 Brandon Gibson
Pos. No. DefenseDE 54 Jesse WilliamsNG 99 Josh ChapmanDE 92 Damion SquareSLB 5 Jerrell HarrisMLB 30 Dont’a HightowerWLB 35 Nico JohnsonJACK 41 Courtney UpshawCB 24 DeQuan MenzieCB 21 Dre KirkpatrickSS 37 Robert LesterFS 4 Marquis Maze
Reserves2A-DeAndrew White, 2F-Cody Mandell, 3A-Vinnie Sunseri, 4A-Mark Barron, 4B-Adrian Hubbard, 5C-Carson Tinker, 6A-H. Clinton-Dix, 7-Kenny Bell, 9A-Quinton Dial, 15-Darius Hanks, 20-J. Williams, 22-Christion Jones, 26-J. Washington, 28-D. Milliner, 32-C.J. Mosley, 33-Trey Depriest, 36-Chris Jordan, 42-Eddie Lacy, 43-Cade Foster, 45-Jalston Fowler, 47-Xza-vier Dickson, 49-Ed Stinson, 51-Wilson Love, 58-Nick Gentry, 61-Anthony Steen, 81-Hardie Buck, 83-Kevin Norwood, 86-U. Billingsley, 87-Chris Underwood, 90-Jeremy Shelley, 91-Alex Watkins..
LSU TigersPos. No. OffenseLT 76 Chris Faulk LG 60 Will Blackwell C 64 P.J. Lonergan RG 74 Josh Williford RT 72 Alex Hurst QB 9 Jo. Jefferson RB 42 Michael Ford TE 82 James Wright WR 2 Rueben Randle WR 33 Odell Beckham WR 19 De. Peterson
Pos. No. DefenseDE 94 Kendrick Adams LT 90 Mi. Brockers RT 93 Bennie Logan DE 49 Bark. Mingo SLB 23 S. Francois MLB 46 Kevin Minter WLB 22 Ryan Baker CB 17 Mo. Claiborne CB 7 Tyrann Mathieu SS 18 Brandon Taylor FS 1 Eric Reid
Reserves3H-James Hairston, 4-Alfred Blue, 6-Craig Loston, 9F-Ego Ferguson, 10-Russell Shepard, 11-Spencer Ware, 13-Ron Brooks, 24-Tharold Simon, 27-Kenny Hilliard, 35-James Stampley, 37-Karnell Hatcher, 38-Brad Wing, 39-Josh Johns, 40-R. Duplessis, 44-J.C. Copeland, 50-Joey Crappell, 52-Luke Muncie, 56-Anthony Johnson, 57-Lamin Barrow, 58-Tahj Jones, 77-Josh Downs, 80-Jarvis Landry, 83-Mitch Joseph, 85-Alex Russian, 86-Kadron Boone, 88-Chase Clement, 89-Lavar Edwards, 99-Sam Montgomery.

100
2011 BCS National ChampionshipUniversity of Phoenix Stadium
Glendale, Ariz.Jan. 10, 2011
Teams .............................................1 2 3 4 ........Score#2 Oregon (12-1)......... ....................0 11 0 8 ............. 19#1 Auburn (14-0)..... ........................0 16 3 3 ............. 22Att–78,603Kickoff Time: 6:38; End of Game: 10:12; Total Elapsed Time: 3:34Weather: Indoors
Scoring SummaryORE–Rob Beard, 26 yd field goal, 10-62 (3:01), 14:13, 2ndAUB–Kodi Burns, 35 yd pass from Cam Newton (Wes Byrum kick), 8-82 (2:08), 12:00, 2ndORE–LaMichael James, 8 yd pass from Darron Thomas (Rob Beard rush), 4-93 (0:57), 10:58, 2ndAUB–Safety, 3:26, 2ndAUB–Emory Blake, 30 yd pass from Cam Newton (Wes Bynum kick), 6-66 (1:34), 1:47, 2ndAUB–Wes Byrum, 28 yd field goal, 9-60 (3:24), 11:30, 3rdORE–LaMichael James, 2 yd pass from Darron Thomas (Jeff Maehl pass from Darron Thomas), 8-55 (2:17), 2:33, 4thAUB–Wes Byrum, 19 yd field goal, 7-73 (2:27), 0:00, 4th
Final Statistics ........................................ORE AUB1st Downs ......................................................23 28 Rushing ..................................................5 14 Passing .................................................16 13 Penalty ...................................................2 1Rushes-Yards............................................ 32-75 50-254Passing Yards ...............................................374 265Passes Comp-Att-Int .............................28-41-2 20-35-1Total Offense (Plays-Yards) ................... 73-449 85-519Punt Returns-Yards ...................................... 3-6 0-0Kickoff Returns-Yards ............................... 4-65 5-92Punts (Number-Avg) ......................5-184 (36.8) 5-202 (40.4) Fumbles-Lost ............................................... 1-0 2-1Sacks By: (Number-Yards) ........................ 2-13 2-9Penalties-Yards ........................................... 6-37 5-473rd Down Conversions .............................. 5-15 9-174th Down Conversions ................................. 2-3 0-1
Individual StatisticsRushing: ORE–LaMichael James 13-49; Kenjon Barner 11-32; Darron Thomas 8-minus 6. AUB–Michael Dyer 22-143; Cam Newton 22-64; Onterio McCalebb 6-47.
Passing: ORE–Darron Thomas 27-40-2-363 2 TDs; Jackson Rice 1-1-0-11. AUB–Cam Newton 20-34-1-265 2 TDs; Team 0-1-0-0.
Receiving: ORE–Jeff Maehl 9-133; D.J. Davis 6-60; LaMichael James 4-39; Lavasier Tuinei 3-75; David Paulson 3-48; Kenjon Barner 2-8; Marvin Johnson 1-11. AUB–Terrell Zachery 6-48; Darvin Adams 4-54; Emory Blake 4-54; Phillip Lutzenkirchen 2-48; Onterio McCalebb 2-10; Kodi Burns 1-35; Mario Fannin 1-16.
Punting: ORE–Jackson Rice 5-184, 36.8. AUB–Ryan Shoemaker 5-202, 40.4.
Returns: ORE–Punt: Cliff Harris 1-1; Kickoff: Kenjon Barner 2-30; Josh Huff 2-35; Int.: Cliff Harris 1-22. AUB–Kickoff: Demond Washington 5-92; Int.: Zac Etheridge 1-0; Demond Washington 1-1.
Field Goals: ORE–Rob Beard, 1-1 (26 FG); AUB–Wes Byrum 2-2 (28 FG, 19 FG). Tackles (Solo-Assist-Total; QBS-Yds; TFL-Yds;)ORE–John Boyett (10-1-11); Kenny Rowe (8-1-9; QBS-1.0-8; TFL-4-12); Spencer Pay-singer (7-1-8); Casey Matthews (4-2-6; TFL-0.5-1); Terrell Turner (2-3-5); Michael Clay (4-0-4); Dion Jordan (4-0-4; TFL-1.0-2); Zac Clark (3-1-4; QBS-1.0-5; TFL-1.0-5); Cliff Harris (3-0-3); Javes Lewis (3-0-3); Talmadge Jackson (3-0-3); Eddie Pleasant (2-0-2); Marvin Johnson (1-1-2); Brandon Bair (0-2-2; TFL-0.5-1); Boseko Lokombo (1-0-1); Josh Kaddu (1-0-1); Wade Keliikipi (1-0-1); Chad Peppars (1-0-1); Dewitt Stuckey (1-0-1); Avery Patterson (1-0-1); Bryson Littlejohn (1-0-1).
AUB–Mike McNeil (12-2-14); Demond Washington (7-0-7; TFL-1.0-2); T’Sharvan Bell (5-0-5; TFL-1.0-1); Nick Fairley (5-0-5; QBS-1.0-7; TFL-3.0-14); Craig Stevens (5-0-5); Nosa Eguae (4-0-4; TFL-1.0-2); Zach Clayton (3-0-3; QBS-1.0-2; TFL-1.0-2); Mike Blanc (2-1-3; TFL-1.0-1); Corey Lemonier (2-1-3; TFL-1.0-3); Zac Etheridge (2-1-3); Antoine Carter (2-0-2; TFL-1.0-4); Josh Bynes (2-0-2); Neiko Thorpe (1-1-2); Michael Goggans (1-1-2); Emory Blake (1-0-1); Daren Bates (1-0-1); Ryan White (1-0-1); Demetruce McNeal (1-0-1); Eltoro Freeman (1-0-1); Jamar Travis (1-0-1); Ikeem Means (0-1-1).

101
Starting LineupsOregon DucksPos. No. OffenseWR 10 D.J. DavisLT 74 Darrion WeemsLG 69 Bo ThranC 54 Jordan HolmesRG 68 C.E. KaiserRT 79 Mark AsperTE 42 David PaulsonWR 23 Jeff MaehlQB 1 Darron ThomasRB 21 LaMichael JamesRB 24 Kenjon Barner
Pos. No. DefenseDE 45 Terrell TurnerDT 88 Brandon BairDT 99 Zac ClarkDE 58 Kenny RoweMLB 55 Casey MatthewsWLB 35 Spencer PaysingerSLB 56 Josh KadduLCB 13 Cliff HarrisFS 20 John BoyettROV 11 Eddie PleasantRCB 37 Talmadge Jackson
Reserves0A-Marvin Johnson, 0G-Chad Peppars, 4-Josh Huff, 7-Nate Costa, 14-Javes Lewis, 25-Boseko Lokombo, 31-Avery Patterson, 43-Bryson Little-john, 46-Michael Clay, 49-Jackson Rice, 53-De-witt Stuckey, 75-Jamaal Burrell, 80-Lavasier Tuinei, 85-Anthony Anderson, 92-Wade Keliikipi, 93-Rob Beard, 96-Dion Jordan.
Auburn TigersPos. No. OffenseQB 2 Cam NewtonRB 23 Onterio McCalebbHB 43 Phillip LutzenkirchenHB 32 Eric SmithWR 18 Kodi BurnsWR 81 Terrell ZacheryLT 73 Lee ZiembaLG 66 Mike BerryC 50 Ryan PughRG 57 Byron IsomRT 75 Brandon Mosley
Pos. No. DefenseLE 45 Antoine CarterDT 98 Zach ClaytonDT 90 Nick FairleyRE 94 Nosa EguaeLLB 46 Craig StevensMLB 17 Josh BynesLCB 14 Demond WashingtonLCB 22 T’Sharvan BellS 4 Zac EtheridgeS 26 Mike McNeilRCB 15 Neiko Thorpe
Reserves1D-Ryan Shoemaker, 1A-Wes Byrum, 3-DeAn-gelo Benton, 5A-Jake Holland, 5-Michael Dyer, 6-Antonio Goodman, 8-Anthony Morgan, 9-Quindarius Carr, 9A-Ryan White, 11-Chris Davis, 12-Demetruce McNeal, 13-Craig Sanders, 16-Ikeem Means, 19-Neil Caudle, 21-Eltoro Freeman, 24-Ryan Smith, 25-Daren Bates, 27-Mario Fanin, 28-W. Christopher, 35-Jonathan Evans, 49-Michael Goggans, 53-Bart Eddins, 54-Jeffrey Whitaker, 55-Corey Lemonier, 61-Josh Harris, 63-Blake Burgess, 71-John Sullen, 74-Jamar Travis, 76-Jorrel Bostrom, 79-Jared Cooper, 80-Emory Blake, 87-Derek Winter, 89-Darvin Adams, 93-Mike Blanc, 95-Dee Ford.
RecapAuburn’s Wes Byrum connected on a 19-yard field goal as time expired to beat Oregon 22-19 and give Auburn its first BCS crown as well as a fifthstraight title to the SEC.
On the game’s final possession, Auburn drove 73 yards to the Oregon 1-yard line before Byrum made the winning kick. The drive included a 37-yard run by freshman running back Michael Dyer. A 28-yard field goal by Byrum with 11:30 left in the third quarter gave Auburn a 19-11 lead. The Ducks, undefeated champions of the Pac-10 Conference, scored a touchdown with 2:33 left on a 2-yard pass from Darron Thomas to running back LaMichael James. Oregon added a two-point conversion to tie the score 19-19.
Auburn led 16-11 at halftime on the strength of a 35-yard touchdown passfrom Cam Newton to wideout Kodi Burns, a safety and a 30-yard scoring toss from Newton to receiver Emory Blake. Oregon opened the scoring when Rob Beard made a 26-yard field goal early in the second quarter. The Ducks gained an 11-7 edge in the second quarter on an 8-yard touchdown pass from Thomas to James and a two-point conversion.
The Tigers outgained the Ducks in total yards thanks to a huge edge in rushing yards. Newton, the Heisman Trophy winner, completed 20-of-34 passes for 265 yards and rushed for 64 more yards.
Dyer, who was named the outstanding offensive player of the game, gained 143 yards on 22 carries with one touchdown.Auburn defensive tackle Nick Fairley was named the outstanding defensive player after tallying five solo tackles, including three tackles for loss and one sack.

102
2010 BCS National Championship
The Rose BowlPasadena, Calif.
Jan. 7, 2010Teams .............................................1 2 3 4 .......Score#2 Texas (13-1).......... ....................6 0 7 8 ............ 21#1 Alabama .(14-0)..... ....................0 24 0 13 ............ 37Att–94,906Kickoff Time: 5:39; End of Game: 9:07; Total Elapsed Time: 3:28Temperature: 63; Wind: WNW 3mph; Weather: Clear
Scoring SummaryUT–Hunter Lawrence, 18 yd field goal, 10-36 (3:50), 9:11, 1st,UT–Hunter Lawrence 42 yd field goal, 4-5 (1:07), 8:04, 1stUA–Mark Ingram 2 yd run (Leigh Tiffin kick), 7-57 (3:27), 14:18, 2ndUA–T. Richardson 49 yd run (Leigh Tiffin kick), 2-49 (0:45), 7:59, 2nd UA–Leigh Tiffin 26 yd field goal, 6-20 (1:51), 0:29, 2ndUA–Marcell Dareus 28 yd interception return (Leigh Tiffin kick), 0:03, 2ndUT–Jordan Shipley, 44 yd pass from Garrett Gilbert (Hunter Lawrence kick), 5-59 (1:47), 1:31, 3rdUT–Jordan Shipley 28 yd pass from Garrett Gilbert (Dan Buckner pass from Garrett Gilbert), 9-65 (4:58), 6:15, 4thUA–Mark Ingram 1 yd run (Leigh Tiffin kick), 3-3 (1:01), 2:01, 4thUA–T. Richardson 2 yd run (Leigh Tiffin kick failed), 3-27 (1:01), 0:47, 4th
Final Statistics ........................................... UT UA1st Downs ......................................................15 16 Rushing ..................................................4 10 Passing ...................................................9 3 Penalty ...................................................2 3Rushes-Yards............................................ 28-81 51-205Passing Yards ...............................................195 58Passes Comp-Att-Int .............................17-42-4 6-12-1Total Offense (Plays-Yards) ................... 70-276 63-263Punt Returns-Yards ...................................... 0-0 3-19Kickoff Returns-Yards ............................. 6-106 3-19Punts (Number-Avg) ......................8-343 (42.9) 7-261 (37.3) Fumbles-Lost ............................................... 1-1 1-1Sacks By: (Number-Yards) ........................ 5-33 1-14Penalties-Yards ........................................... 8-77 5-383rd Down Conversions .............................. 6-17 2-124th Down Conversions ................................. 0-0 0-1
Individual StatisticsRushing: UT–Tre’ Newton 14-39; D.J. Monroe 3-33; John Chiles 1-8; F. Whittaker 1-5; Cody Johnson; Colt McCoy 1-0; Garrett Gilbert 5-minus 6. UA–Mark Ingram 22-116; T. Richardson 19-109; Roy Upchurch 2-9; Team 1-minus 2; Greg McElroy 7-minus 27.
Passing: UT–Garrett Gilbert 15-40-4-186, 2 TD; Colt McCoy 2-2-0-9; UA–Greg McElroy 6-11-0-58; P.J. Fitzgerald 0-1-1-0.
Receiving: UT–Jordan Shipley 10-122, 2 TD; Marquise Goodwin 3-70; Tre’ Newton 2-2; Malcolm Williams 1-4; Dan Buckner 1-minus 3; UA–T. Richardson 2-19; Mark Ingram 2-12; Julio Jones 1-23; Marquis Maze 1-4.
Punting: UT–Justin Tucker 4-155, 38.8; John Gold, 4-188, 47.0; UA–P.J. Fitzgerald 7-261, 37.3.
Returns: UT–Kickoff: Marquise Goodwin 3-62; D.J. Monroe 2-36; Antwan Cobb 1-8; Int.: Blake Gideon, 1-0. UA–Punt: Javier Arenas 3-19; Kickoff: M. Williams 2-17; Team 1-2; Int.: Javier Arenas 2-3; Marcell Dareus 1-28; Tyrone King 1-0.
Field Goals: UT–Hunter Lawrence, 1-1 (18 FG, 42 FG); UA–Leigh Tiffin 1-2 (26 FG, 52 missed). Tackles (Solo-Assist-Total; QBS-Yds; TFL-Yds;)UT–Lamarr Houston (8-2-10; QBS-1.0-8, TFL-2-10); Sergio Kindle (6-2-8; QBS-2.5-19; TFL-4-23); Keenan Robinson (3-4-7; QBS-0.5-3; TFL-1-3); Roddrick Muckelroy (6-0-6); Earl Thomas (5-1-6); Sam Acho (4-2-6; QBS-1.0-3; TFL-1-3); Blake Gideon (2-4-6); Chykie Brown (2-1-3); Aaron Williams (2-1-3); Eddie Jones (2-0-2); Kheeston Randall (1-1-2); Ben Alexander (0-2-2); Curtis Brown (1-0-1); William Harvey (1-0-1); Nolan Brewster (1-0-1); Dustin Earnest (1-0-1); Alex Okafor (0-1-1); Emmanuel Acho (0-1-1).
UA–Eryk Anders (6-1-7; QBS-1.0-14; TFL-2-16); Mark Brown (5-1-6; TFL-1-1); Robby Green (4-2-6); Javier Arenas (4-1-5); Rolando McClain (2-2-4; TFL-2-5); Josh Chapman (3-0-3); Kareem Jackson (2-1-3); Cory Reamer (2-1-3); Terrence Cody (1-2-3); Justin Woodall (2-0-2; TFL-1-3); L. Washington (2-0-2; TFL-1-5); Rod Woodson (2-0-2); Marquis Johnson (1-0-1); Nico Johnson (1-0-1); B. Deaderick (1-0-1); Courtney Upshaw (0-1-1); Roy Up-church (0-1-1); Marcell Dareus (0-1-1); Dre Kirkpatrick (0-1-1); Chris Rogers (0-1-1).

103
Starting LineupsTexas LonghornsPos. No. OffenseFL 8 Jordan Shipley WR 1C Jam Kirkendoll RT 64 Kyle Hix RG 63 Michael Huey C 71 Chris Hall LG 52 Charlie Tanner LT 74 Adam Ulatoski SE 9 Malco Williams TB 23 Tre’ Newton WR 4 Dan Buckner QB 12 Colt McCoy
Pos. No. DefenseBUCK 2A Sergio KindleNT 91 Kheest Randall DT 33 Lamarr Houston DE 81 Sam Acho, Sam LCB 3A Curtis Brown MLB 38 Ridd Muckelroy WLB 1A Keena Robinson RCB 8A Chykie Brown RS 21 Blake GideonLS 1D Earl Thomas NICK 4A Aaron Williams
Reserves1V-Kenny Vaccaro, 2M-Jorge Martinez, 3-Garrett Gilbert 5A-Ben Wells, 6A-Christian Scott, 7A-Deon Beasley, 7-John Chiles, 8B-Gregory Timmons, 13-Ahmard Howard, 14-Eryon Barnett, 15-Hunter Lawrence, 18-Emmanuel Acho, 19-Justin Tucker, 24-Antwan Cobb, 25-Jeremy Hills, 26-D.J. Monroe, 27-Nolan Brewster, 28-Foswhitt Whittaker, 30-Ryan Roberson, 31-Cody Johnson, 32-Eddie Jones, 42-Dustin Earnest, 46-Aaron Smith, 47-John Gold, 56-Tray Allen, 58-William Harvey, 72-Britt Mitchell, 77-Luke Poehlmann, 78-David Snow, 79-Thomas Ashcraft, 80-Alex Okafor, 83-Greg Smith, 84-Marquise Goodwin, 86-Cade McCrary, 88-Mac McWhorter, 89-Barre Matthews, 92-Ben Alexander, 96-Calvin Howell.
Alabama Crimson TidePos. No. OffenseLT 77 James Carpenter LG 78 Mike Johnson C 73 William Vlachos RG 75 Barrett Jones RT 79 Drew Davis TE 84 Colin Peek WR 15 Darius Hanks QB 12 Greg McElroy RB 22 Mark Ingram WR 8 Julio Jones WR 4 Marquis Maze
Pos. No. DefenseDE 97 L. Washington NG 62 Terrence Cody DE 95 B. Deaderick CB 23 Robby Green MLB 25 Rolando McClain CB 24 Marquis Johnson JACK 32 Eryk Anders LC 28 Javier Arenas RC 3 Kareem Jackson SS 4A Mark Barron FS 27 Justin Woodall
Reserves1-Chris Rogers, 1H-Josh Chapman, 3A-T. Rich-ardson, 5-Roy Upchurch, 6-Demetrius Goode, 7-P J. Fitzgerald, 10-Jerrell Harris, 13-Cory Reamer, 17-Brad Smelley, 18-Rod Woodson, 20-Tyrone King, 21-Dre Kirkpatrick, 26-Ali Sharrief, 35-Nico Johnson, 36-Chris Jordan, 37-Robert Lester, 40-Baron Huber, 41-Courtney Upshaw, 50-Brian Selman, 57-Marcell Dareus, 64-Kerry Murphy, 66-Brian Motley, 67-J. Boswell, 80-Mike McCoy, 85-Preston Dial, 87-Chris Underwood, 89-M. Williams, 96-Luther Davis, 99-Leigh Tiffin.
RecapThe 2010 national title game featured key turnovers, key plays and, more than anything, a key injury, as Alabama defeated Texas, 37-21.
On its first drive, Alabama botched a fake punt that Texas’ Blake Gideon in-tercepted at the Tide’s 37-yard line. From there, Colt McCoy led his Long-horns to the Alabama 11, but then came the key injury. On the next play, Texas’ star quarterback was sacked, and to the horror of the Longhorn faith-ful, left the game for good with a shoulder injury. In came inexperienced freshman Garret Gilbert, and Texas conservatively plodded to a 3-0 lead.
Another Alabama turnover on the ensuing kickoff allowed the Longhorns to cash in for three more points and a 6-0 lead. However, the momentum changed in the second quarter. Heisman Trophy-winner Mark Ingram punched in the first of his two touchdowns less than a minute into the pe-riod.
Trent Richardson added a touchdown with a 49-yard scamper and a Leigh Tiffin field goal made it 17-6. Then, to bookend a disastrous second quarter for the Longhorns, Alabama lineman Marcel Dareus picked off a shovel pass and ran it back 28 yards for a score in what would be an insurmount-able 24-6 halftime lead.
Coach Mack Brown and the Longhorns didn’t just roll over, though. Gilbert completed touchdown passes of 44 and 28 yards to Jordan Shipley, and a successful two-point conversion brought the score to 24-21. That glimmer of hope was extinguished, though, with a fumble and two interceptions as Alabama ran up 13 more points to cement its 13th national title.

104
2009 FedEx BCS National Championship
Dolphin StadiumMiami Gardens, Fla.
Jan. 8, 2009Teams .................................. 1 2 3 4 .... Score#2 Florida (13-1).......... ....... 0 7 7 10 ..........24#1 Oklahoma .(12-2)..... ....... 0 7 0 7 ..........14Att–78,468Kickoff Time: 8:20; End of Game: 11:46; Total Elapsed Time: 3:26Temperature: 68; Wind: NW 2mph; Weather: Clear, 58 degrees
Scoring SummaryUF–Louis Murphy 20 Pass from Tim Tebow (Jonathan Phillips Kick), 12-86 (5:50), 14:02, 2ndOU–Jermaine Gresham 6 Pass from Sam Bradford (Jimmy Stevens Kick), 6-65 (2:13), 11:49, 2ndUF–Percy Harvin 2 Run (Jonathan Phillips Kick), 13-75 (5:22), 4:21, 3rdOU–Jermaine Gresham 11 Pass from Sam Bradford (Jimmy Stevens Kick), 8-77 (2:36), 12:13, 4th UF–Jonathan Phillips 27 FG, 6-68 (1:28), 10:45, 4thUF–David Nelson 4 Pass from Tim Tebow (Jonathan Phillips Kick), 11-76 (6:52), 3:07, 4th
Final Statistics ..............................UF OU1st Downs ........................................ 24 25 Rushing .................................... 11 8 Passing ..................................... 12 15 Penalty ....................................... 1 2 Rushes-Yards.............................44-249 29-107Passing Yards ................................. 231 256Passes Comp-Att-Int ............... 18-30-2 26-41-2Total Offense (Plays-Yards) ......74-480 70-363Punt Returns-Yards .........................1-1 1-15Kickoff Returns-Yards ..................3-51 5-118Punts (Number-Avg) ....... 3-51.7 (40.0) 3-38.7 (31.7) Fumbles-Lost ..................................0-0 0-0Sacks By: (Number-Yards) ...........2-18 0-0Penalties-Yards ..............................8-81 4-313rd Down Conversions ...............12-17 6-134th Down Conversions ....................0-0 0-2
Individual StatisticsRushing: UF–Percy Harvin 9-122, TD; Tim Tebow 22-109; Jeffrey Demps, 9-23; Emmanuel. Moody, 1-0; Chris Rainey 1- (-3); Team, 1- (-2). OU– Chris Brown, 22-110; Mossis Madu, 4-12; Ryan Broyles, 1-3; Sam Bradford, 2- (-18).
Passing: UF–Tim Tebow 18-30-231, 2 TD; OU–Sam Bradford, 26-41-2, 256, 2 TD.
Receiving: UF–Aaron Hernandez, 5-57; Percy Harvin, 5-49; Louis Murphy, 2-44, 1 TD; David Nelson, 2-33, 1 TD; Riley Cooper, 2-28; Chris Rainey, 1-11; Brandon James, 1-9. OU–Jermaine Greshman 8-62, 2 TD; Juaquin Iglesias 5-58; Manuel Johnson 4-29; Ryan Broyles 4-26; Quentin Chaney 2-37; Chris Brown, 2-37; Mossis Madu 1-7.
Punting: UF–Chas Henry, 3-155, 51.7; OU–Mike Knall, 3-116, 38.7.
Returns: UF–Punt: Brandon James, 1-1; Kickoff: Brandon James 3-51; Int.: Major Wright, 1-0; Ahmad Black, 1-0. OU–Punt: Ryan Broyles 1-15; Kickoff: Juaquin Iglesias, 5-118; Int.: Nic Harris, 1-8; Gerald McCoy, 1-12.
Field Goals: UF–Jonathan Phillips, 1-1 (27 FG); OU–Jimmy Stevens, 0-1, (49 blocked). Tackles (Solo-Assist-Total; QBS-Yds; TFL-Yds;)UF–Joe Haden (7-3-10), Ryan Stamper (4-6-10; TFL-1.0-4), Major Wright (5-4-9), Brandon Spikes (4-2-6), Janouris Jenkins (3-2-5), Ahmad Black (3-2-5), Carlos Dunlap (2-2-4; QBS-0.5-2; TFL–1.5-4), Will Hill (2-1-3), Lawrence Marsh (1-2-3), Brandon Hicks (2-0-2; QBS–1.0-14, TFL-1.0-14), Torrey Davis (2-0-2; TFL-1.0-2), Justin Williams (1-1-2), Dustin Doe (1-1-2; QBS-0.5-2; TFL-0.5-2), A.J. Jones (0-2-2), Tim Tebow (1-0-1), Jermaine Cunningham (1-0-1), Jeff Demps (1-0-1), Cade Holliday (1-0-1), Lorenzo Edwards (1-0-1), Duke Lemmens (0-1-1), Wondy Pierre-Louis (0-1-1).
OU–Nic Harris (6-5-11), Lendy Holmes (6-4-10), Jeremy Beal (5-2-7, TFL-1.5-2), Travis Lewis (1-6-7), Keenan Clayton (5-1-6), Mike Balogun (2-4-6; TFL-1.0-3), Adrian Taylor (2-4-6), Fran Alexander (3-2-5; TFL-1.0-1), Brian Jackson (2-3-5), Gerald McCoy (3-1-4; TFL-1.0-4), Dominique Franks (2-1-3), Quinton Carter (0-3-3, TFL 0.5-1), Brett Bowers (1-1-2), Auston English (1-1-2), Sam Proctor (1-0-1), Alan Davis (1-0-1).

105
Starting LineupsFlorida GatorsPos. No. OffenseWR 2 Jeff DempsWR 9 Louis MurphyWR 11 Riley CooperLT 75 Phil TrautweinLG 57 Carl JohnsonC 56 Maurkice PounceyRG 55 Mike PounceyRT 77 Jason WatkinsTE 81 Aaron HernandezQB 15 Tim TebowWR 83 David Nelson
Pos. No. DefenseDE 94 Justin TrattouNT 90 Lawrence MarshDT 92 Terron SandersDE 49 Jermaine CunninghamSLB 40 Brandon HicksMLB 51 Brandon SpikesWLB 41 Ryan StamperCB 29 Janoris JenkinsCB 5 Joe HadenSS 35 Ahmad BlackFS 2 Major Wright
Reserves1-Percy Harvin; 3-Chris Rainey, 4-Wondy Pierre-Louis; 6-Deonte Thompson; 7-Justin Williams, 8-Caros Dunlap, 10-Will Hill, 14-Markihe Anderson, 16-A.J. Jones, 17-Chas. Henry, 19-Caleb Sturgis, 21-Emmanuel Moody, 22-Cade Hol-liday, 25-Brandon James, 26-Lorenzo Edwards, 32-Dustin Doe, 33-Kes-tahn Moore, 34-Lerentee McCray, 36-Moses Jenkins, 37-Butch Rowley, 38-Jonathan Phillips, 39-Joey Sor-rentino, 43-James Smith, 44-Duke Lemmens, 53-Jamaal Deveaux, 54-Roderick Blackett, 59-John Fairbanks, 64-Kyle Newell, 84-Tate Casey, 93-Javier Estopinan, 95-Tor-rey Davis, 96–William Green
Oklahoma SoonersPos. No. OffenseLT 79 Phil LoadholtLG 72 George Robinson C 50 Jon CooperRG 73 Brandon WalkerRT 71 Trent WilliamsTE 18 Jermaine GreshamWR 83 Brody EldridgeWR 9 Juaquin IglesiasQB 14 Sam BradfordSL 1 Manuel JohnsonRB 29 Chris Brown
Pos. No. DefenseDE 88 Fran AlexanderNG 86 Adrian TaylorDT 93 Gerald McCoyDE 44 Jeremy BealSLB 22 Keenan ClaytonMLB 10 Mike BalogunWLB 28 Travis LewisCB 15 Dominique FranksSS 5 Nic HarrisFS 11 Lendy HolmesCB 2 Brian Jackson
Reserves1-Jimmy Stevens, 8-Brandon Caleb, 13-Mike Knall, 17-Mossis Madu, 20-Quinton Carter, 21-J.R. Bryant, 25–Justn Johnson, 26-Brett Bowers, 27-Sam Proctor, 30-Lamon Robin-son, 32-Jamell Fleming, 33-Auston English, 34-Matt Clapp, 37-Matt Moreland, 52-Derek Shaw, 74-Brian Simmons, 76-Brandon Braxton, 80-Adron Tennell, 81-Carter Whit-son, 82-James Hanna, 84-Quentin Chaney, 85-Ryan Broyles, 89-Cord-ero Moore, 95-Alan Davis, 97-Cory Bennettt, 99-Jonte Bumpus.
RecapTim Tebow and Percy Harvin supplied the key offensive plays to lead Flor-ida to its second championship in three years, in a 24-14 win overOklahoma.
Despite a career-high two interceptions, Tebow rebounded late in the game, clinching the victory with his patented jump-pass -- he took two hard steps toward the line, jumped and zipped a 4-yard touchdown pass to David Nel-son with 3:07 to make it 24-14. Harvin returned from an ankle injury and dashed for 122 yards on only nine carries. His 52-yard gallop set up Jona-than Phillips’ 27-yard field goal early in the fourth quarter for a 17-14 lead. These teams entered the night averaging a combined 99 points per game, but wound up with a scoreless first quarter. In the second quarter, Florida’s defense made a pair of goal line stands that left it 7-7 at halftime.
Tebow struggled throughout the first half with the only highlight a 20-yardtouchdown pass to Louis Murphy for a 7-0 lead early in the second quarter. OU’s Sam Bradford came right back with a swift 65-yard drive, capped by his 6-yard TD toss to Jermaine Gresham.
The Florida defense was exceptional throughout, including a pair of goal-line stands in the first half. Oklahoma owned a first-and-goal at the 9 and Chris Brown carried four straight times, but the Gators stood up the 1,100-yard rusher, twice stuffing him from the 1. With 10 seconds left in the half from the 6, Bradford tried to hit Manuel Johnson at the goal line, but the pass deflected off him and three Gator defenders before Major Wright had the interception.
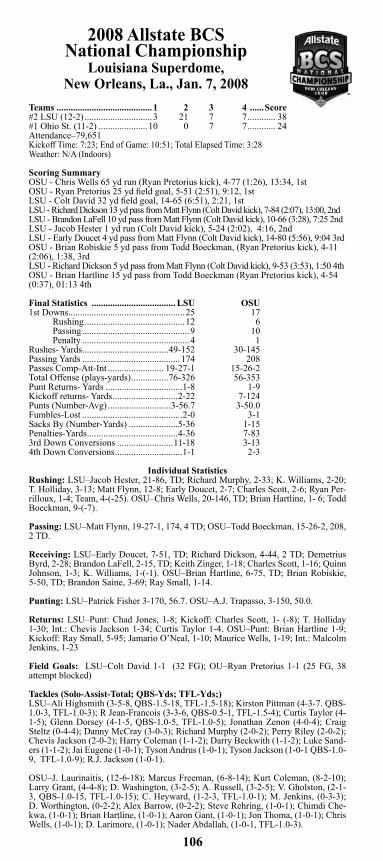
106
2008 Allstate BCS National Championship
Louisiana Superdome, New Orleans, La., Jan. 7, 2008
Teams .........................................1 2 3 4 ......Score#2 LSU (12-2) .............................3 21 7 7 ............ 38#1 Ohio St. (11-2) .....................10 0 7 7 ............ 24Attendance–79,651Kickoff Time: 7:23; End of Game: 10:51; Total Elapsed Time: 3:28Weather: N/A (Indoors)
Scoring SummaryOSU - Chris Wells 65 yd run (Ryan Pretorius kick), 4-77 (1:26), 13:34, 1stOSU - Ryan Pretorius 25 yd field goal, 5-51 (2:51), 9:12, 1stLSU - Colt David 32 yd field goal, 14-65 (6:51), 2:21, 1stLSU - Richard Dickson 13 yd pass from Matt Flynn (Colt David kick), 7-84 (2:07), 13:00, 2ndLSU - Brandon LaFell 10 yd pass from Matt Flynn (Colt David kick), 10-66 (3:28), 7:25 2ndLSU - Jacob Hester 1 yd run (Colt David kick), 5-24 (2:02), 4:16, 2nd LSU - Early Doucet 4 yd pass from Matt Flynn (Colt David kick), 14-80 (5:56), 9:04 3rdOSU - Brian Robiskie 5 yd pass from Todd Boeckman, (Ryan Pretorius kick), 4-11 (2:06), 1:38, 3rdLSU - Richard Dickson 5 yd pass from Matt Flynn (Colt David kick), 9-53 (3:53), 1:50 4thOSU - Brian Hartline 15 yd pass from Todd Boeckman (Ryan Pretorius kick), 4-54 (0:37), 01:13 4th
Final Statistics .................................... LSU OSU1st Downs..................................................25 17 Rushing ...........................................12 6 Passing ..............................................9 10 Penalty ..............................................4 1Rushes- Yards .....................................49-152 30-145Passing Yards ..........................................174 208Passes Comp-Att-Int ........................ 19-27-1 15-26-2Total Offense (plays-yards) ................76-326 56-353Punt Returns- Yards .................................1-8 1-9Kickoff returns- Yards ............................2-22 7-124Punts (Number-Avg) ...........................3-56.7 3-50.0Fumbles-Lost ...........................................2-0 3-1Sacks By (Number-Yards) .....................5-36 1-15Penalties-Yards .......................................4-36 7-833rd Down Conversions ........................11-18 3-134th Down Conversions .............................1-1 2-3
Individual StatisticsRushing: LSU–Jacob Hester, 21-86, TD; Richard Murphy, 2-33; K. Williams, 2-20; T. Holliday, 3-13; Matt Flynn, 12-8; Early Doucet, 2-7; Charles Scott, 2-6; Ryan Per-rilloux, 1-4; Team, 4-(-25). OSU–Chris Wells, 20-146, TD; Brian Hartline, 1- 6; Todd Boeckman, 9-(-7).
Passing: LSU–Matt Flynn, 19-27-1, 174, 4 TD; OSU–Todd Boeckman, 15-26-2, 208, 2 TD.
Receiving: LSU–Early Doucet, 7-51, TD; Richard Dickson, 4-44, 2 TD; Demetrius Byrd, 2-28; Brandon LaFell, 2-15, TD; Keith Zinger, 1-18; Charles Scott, 1-16; Quinn Johnson, 1-3; K. Williams, 1-(-1). OSU–Brian Hartline, 6-75, TD; Brian Robiskie, 5-50, TD; Brandon Saine, 3-69; Ray Small, 1-14.
Punting: LSU–Patrick Fisher 3-170, 56.7. OSU–A.J. Trapasso, 3-150, 50.0.
Returns: LSU–Punt: Chad Jones, 1-8; Kickoff: Charles Scott, 1- (-8); T. Holliday 1-30; Int.: Chevis Jackson 1-34; Curtis Taylor 1-4. OSU–Punt: Brian Hartline 1-9; Kickoff: Ray Small, 5-95; Jamario O’Neal, 1-10; Maurice Wells, 1-19; Int.: Malcolm Jenkins, 1-23
Field Goals: LSU–Colt David 1-1 (32 FG); OU–Ryan Pretorius 1-1 (25 FG, 38 attempt blocked) Tackles (Solo-Assist-Total; QBS-Yds; TFL-Yds;)LSU–Ali Highsmith (3-5-8, QBS-1.5-18, TFL-1.5-18); Kirston Pittman (4-3-7. QBS-1.0-3, TFL-1.0-3); R Jean-Francois (3-3-6, QBS-0.5-1, TFL-1.5-4); Curtis Taylor (4-1-5); Glenn Dorsey (4-1-5, QBS-1.0-5, TFL-1.0-5); Jonathan Zenon (4-0-4); Craig Steltz (0-4-4); Danny McCray (3-0-3); Richard Murphy (2-0-2); Perry Riley (2-0-2); Chevis Jackson (2-0-2); Harry Coleman (1-1-2); Darry Beckwith (1-1-2); Luke Sand-ers (1-1-2); Jai Eugene (1-0-1); Tyson Andrus (1-0-1); Tyson Jackson (1-0-1 QBS-1.0-9, TFL-1.0-9); R.J. Jackson (1-0-1).
OSU–J. Laurinaitis, (12-6-18); Marcus Freeman, (6-8-14); Kurt Coleman, (8-2-10); Larry Grant, (4-4-8); D. Washington, (3-2-5); A. Russell, (3-2-5); V. Gholston, (2-1-3, QBS-1.0-15, TFL-1.0-15); C. Heyward, (1-2-3, TFL-1.0-1); M. Jenkins, (0-3-3); D. Worthington, (0-2-2); Alex Barrow, (0-2-2); Steve Rehring, (1-0-1); Chimdi Che-kwa, (1-0-1); Brian Hartline, (1-0-1); Aaron Gant, (1-0-1); Jon Thoma, (1-0-1); Chris Wells, (1-0-1); D. Larimore, (1-0-1); Nader Abdallah, (1-0-1, TFL-1.0-3).

107
Starting LineupsLSU TigersPos. No. OffenseQB 15 Matt FlynnRB 18 Jacob HesterWR 2 Demetrius ByrdWR 1 Brandon LaFellTE 89 Keith ZingerWR 9 Early DoucetLT 70 Ciron BlackLG 79 Herman JohnsonC 74 Brett HelmsRG 65 Lyle HittRT 71 Carnell Stewart
Pos. No. DefenseDE 93 Tyson JacksonDT 72 Glenn DorseyDT 90 R Jean-FrancoisDE 49 Kirston PittmanWLB 35 Luke SandersMLB 48 Darry BeckwithSLB 7 Ali HighsmithCB 19 Jonathan ZenonCB 21 Chevis JacksonSS 16 Craig SteltzFS 27 Curtis Taylor
Reserves3-Chad Jones, 4-Jai Eugene, 5-Keiland Williams, 6-Colt David, 8-Trindon Holliday, 11-Ryan Perril-loux, 11-Kelvin Sheppard, 23-Josh McManus, 24-Harry Coleman, 26-Richard Murphy, 28-R.J. Jack-son, 29-Chris Hawkins, 32-Charles Scott, 33-Tyson Andrus, 36-Patrick Fisher, 40-Shawn Jordan, 44-Danny McCray, 45-Quinn Johnson, 47-T. Johnson, 51-Jacob O’Hair, 54-Jacob Cutrera, 56-Perry Riley, 63-Ryan Miller, 69-Sean Gaudet, 73-Will Arnold, 78-Joseph Barksdale, 80-Terrance Toliver, 81-Mit Cole, 82-Richard Dickson, 84-Rahim Alem, 86-Chris Mitchell, 87-Jared Mitchell, 92-Drake Nevis, 95-La-zarius Levingston, 97-Al Woods, 99-Marlon Favorite.
Ohio State BuckeyesPos. No. OffenseQB 17 Todd BoeckmanTB 28 Chris WellsRB 5 Albert DukesWR 80 Brian RobiskieWR 9 Brian HartlineTE 88 Rory NicolLT 75 Alex BooneLG 71 Steve RehringC 64 Jim CordleRG 63 Ben PersonRT 74 Kirk Barton
Pos. No. DefenseDE 97 Cameron HeywardDT 84 Doug WorthingtonDT 93 Nader AbdallahDE 50 Vernon GholstonWLB 1 Marcus FreemanMLB 33 James LaurinaitisSLB 6 Larry GrantCB 2 Malcolm JenkinsCB 20 Donald WashingtonSS 4 Kurt ColemanFS 21 Aaron Russell
Reserves3-Jamario O’Neal, 3-Brandon Saine, 4-Ray Small, 5-Chimdi Chekwa, 7-Jermale Hines, 8-Aaron Gant, 11-James Scott, 12-D. San-zenbacher, 13-Andre Amos, 15-A. J. Trapasso, 16-Trever Robinson, 20-Aaron Pettrey, 23-Nick Patter-son, 24-Grant Schwartz, 24-Mar-cus Williams, 26-Tyler Moeller, 29-Shaun Lane, 34-Maurice Wells, 36-Brian Rolle, 38-Austin Spitler, 42-Tyler Whaley, 48-Jon Thoma, 49-Dionte Johnson, 56-Dimitrios Makridis, 61-Jackson Haas, 70-Bry-ant Browning, 72-Dexter Larimore, 77-Connor Smith, 78-Alex Barrow, 78-Daniel Dye, 85-Ryan Pretorius, 86-Jake Ballard, 87-Brandon Smith, 91-Brett Daly, 92-Todd Denlinger.
RecapLSU danced, dodged and darted its way to its second national title in four years behind quarterback Matt Flynn’s four touchdown strikes. The Tigers, the first two-loss team to even play for the national title, rallied from an early 10-0 deficit, taking a 24-10 halftime lead that held up.
Jacob Hester bulled for a short touchdown, Early Doucet wiggled loose for a touchdown and Glenn Dorsey led a unit that outplayed the top-ranked defense in the nation.
Better on offense and defense, the Tigers also got two big plays on special teams -- Ricky Jean-Francois blocked a field goal, and LSU took advantage of a roughing-the-kicker penalty.
Flynn hit Doucet with a 4-yard toss with 9:04 left for a 31-10 lead and the Tiger fans were ready celebrate. The Buckeyes made the score more respectable on Todd Boeckman’s 5-yard TD pass on fourth down to Brian Robiskie, only to have Flynn come back and throw his second TD pass to Richard Dickson.
Tied at 10, the Buckeyes counted on Wells. He delivered one of the season’sbest stiff-arms on a 29-yard romp, and Ohio State seemed poised to retake the lead. Instead, Jean-Francois crashed through the middle, swung his big right arm and blocked Pretorius’ 38-yard field goal try.

108
2007 Tostitos BCS National ChampionshipUniversity of Phoenix Stadium,
Glendale, Ariz., Jan. 8, 2007
Teams ..................................... 1 2 3 4 .....Score#2 Florida (13-1)......... .......... 14 20 0 7 .......... 41#1 Ohio State (12-1)..... ........... 7 7 0 0 .......... 14Attendance–74,628Kickoff Time: 6:33; End of Game: 9:57; Total Elapsed Time: 3:24Temperature: 71; Wind: None; Weather: Roof closed
Scoring SummaryOSU - Ted Ginn Jr., 93 yd kickoff return (Aaron Pettrey kick), 14:44, 1stUF - Dallas Baker 14 yd pass from Chris Leak (Chris Hetland kick), 7-46 (4:13), 10:31, 1stUF - Percy Harvin 4 yd run (Chris Hetland kick), 5-34 (2:37), 5:51, 1stUF - DeShawn Wynn 2 yd run (Chris Hetland kick), 10-71 (2:53), 14:56, 2ndOSU - Antonio Pittman 18 yd run (Aaron Pettrey kick), 4-64 (1:24), 13:32, 2ndUF - Chris Hetland 42 yd field goal, 9-32 (3:04), 6:00, 2ndUF - Chris Hetland 40 yd field goal, 4-6 (1:44), 1:53, 2ndUF - Andre Caldwell 1 yd pass from Tim Tebow, (Chris Hetland kick), 3-5 (1:05), 0:23, 2nd UF - Tim Tebow 1 yd run (Chris Hetland kick), 8-39 (3:42), 10:20, 4th
Final Statistics ..................................UF OSU1st Downs ............................................ 21 8 Rushing ......................................... 6 5 Passing ........................................ 14 1 Penalty .......................................... 1 2 Rushes-Yards.................................43-156 23-47Passing Yards ..................................... 214 35Passes Comp-Att-Int ....................26-37-0 4-14-1Total Offense (Plays-Yards) ..........80-370 37-82Punt Returns-Yards ...........................4-28 1-13Kickoff Returns-Yards ......................1-33 6-193Punts (Number-Avg) ......................4-44.2 6-37.8 Fumbles-Lost ......................................0-0 1-1Sacks By: (Number-Yards) ...............5-51 1-7Penalties-Yards ..................................6-50 5-503rd Down Conversions ...................10-19 1-94th Down Conversions ........................2-3 0-1
Individual StatisticsRushing: UF–DeShawn Wynn 19-69, TD; Tim Tebow 10-39, TD; Percy Harvin 5-22, TD; Andre Caldwell 3-13; Kestahn Moore 2-7; Chris Leak 3-7; Team, 1-(-1). OSU– Antonio Pittman 10-62, TD; Chris Wells 2-9; Brian Hartline 1-5; Troy Smith 10-(-29).
Passing: UF–Chris Leak 25-36-0, 213, TD; Tim Tebow 1-1-0, 1, TD. OSU–Troy Smith 4-14-1, 35.
Receiving: UF–Percy Harvin 9-60; Jemalle Cornelius 5-50; Cornelius In-gram,4-58; Dallas Baker 4-23, TD; Billy Latsko 2-17; Andre Caldwell, 2-6, TD. OSU– Anthony Gonzalez 2-11; Brian Hartline 1-13; Antonio Pittman, 1-11.
Punting: UF–Eric Wilbur 4-177, 44.2. OSU–A.J. Trapasso 6-227, 37.8.
Returns: UF–Punt: Brandon James 4-28; Kickoff: Brandon James 1-33; Int.: Reggie Lewis, 1-0; OSU–Punt: Anthony Gonzalez, 1-13; Kickoff: Anthony Gon-zalez, 2-43; Maurice Wells 1-22; Ted Ginn Jr. 1-93; Roy Hall 2-35.
Field Goals: UF–Chris Hetland, 2-2 (42 FG, 40 FG); OSU–None Tackles (Solo-Assist-Total; QBS-Yds; TFL-Yds;)UF–Earl Everett (5-2-7), Derrick Harvey (4-0-4,QBS-3.0-31, TFL-3.0-31), Bran-don Siler, (4-0-4, TFL-1.0-4), Ray McDonald (0-3-3), Ryan Smith (2-0-2), Tre-maine McCollum (2-0-2), Jarvis Moss (2-0-2, QBS-2.0-20, TFL-2.0-20), Dorian Munroe (2-0-2), Brian Crum (1-0-1), Louis Murphy (1-0-1), Riley Cooper (1-0-1), Tony Joiner (0-1-1); Nick Brooks (0-1-1), Reggie Nelson (0-1-1), Steven Harris (0-1-1), James Smith (0-1-1).
OSU–James Laurinaitis (10-5-15), Marcus Freeman (9-6-15), Brandon Mitchell (6-3-9, TFL-1.0-1), Donald Washington (6-1-7), Jamario O’Neal (3-3-6), Anto-nio Smith (2-3-5), Vernon Gholston (2-3-5, QBS-1.0-7, TFL-1.0-7), Malcolm Jenkins (3-1-4, TFL-2.0-3), David Patterson (3-1-4), Joel Penton (2-1-3), Quinn Pitcock (1-2-3, TFL-1.0-2), Drew Norman (1-0-1), Aaron Pettrey (1-0-1), Jay Richardson (0-1-1), Alex Barrow (0-1-1), Brandon Smith (0-1-1).

109
Starting LineupsFlorida GatorsPos. No. OffenseWR 81 Dallas BakerWR 5 Andre CaldwellWR 8 Percy Harvin WR 6 Jemalle Cornelius LT 75 Phil TrautweinLG 63 Jim TarttC 79 Steve RisslerRG 67 Drew MillerRT 73 Carlton Medder.TE 7 Cornelius Ingram QB 12 Chris Leak
Pos. No. DefenseDE 91 Derrick HarveyDT 95 Ray McDonaldDT 93 Steven HarrisDE 94 Jarvis Moss SLB 30 Earl Everett MLB 40 Brandon SilerLCB 22 Reggie LewisRCB 28 Ryan Smith RCB 18 Tremaine McCollum SS 19 Tony JoinerFS 1 Reggie Nelson
Reserves2-Markus Manson, 2-Cade Holliday, 3-Kyle Jackson, 4-Wondy Pierre-Louis, 9-Kenneth Tookes, 10-Eric Wilbur, 11-Jarred Fayson, 13-Brian Crum, 15-Tim Tebow, 16-Buth Rowley, 16-A. J. Jones, 20-Joe Cohen, 21-DeShawn Wynn, 23-Jacques Rickerson, 24-John Curtis, 25-Brandon James, 29-Eric Rutledge, 32-Dustin Doe, 33-Kestahn Moore, 34-Dorian Munroe, 36-Nick Brooks, 37-Markihe Anderson, 39-Chris Hetland, 42-Billy Latsko, 43-James Smith, 51-Brandon Spikes, 56-Darryon Robin-son, 64-Kyle Newell, 70-Ronnie Wilson, 78-Simon Codrington, 82-Louis Murphy, 83-David Nelson, 84-Tate Casey, 85-An-drew Fritze, 86-Riley Cooper., 89-Jason Watkins, 98-Clint McMillan, 98-Joey Ijjas, 99-Lutrell Alford.
Ohio State BuckeyesPos. No. OffenseSE 80 Brian RobiskieLT 75 Alex BooneLG 71 Steve RehringC 50 Vernon GholstonRG 72 T.J. DowningRT 74 Kirk BartonTE 88 Rory NicolFL 7 Ted Ginn, Jr.QB 10 Troy SmithTB 25 Antonio PittmanWR 11 Anthony Gonzalez
Pos. No. DefenseDE 99 Jay RichardsonDT 97 David PattersonDT 90 Quinn PitcockDE 50 Vernon GholstonSLB 1 Marcus FreemanMLB 33 James LaurinaitisFC 2 Malcolm JenkinsBC 14 Antonio SmithFS 3 Jamario O’NealSS 32 Brandon MitchellNB 2C Donald Washington
Reserves8-Aaron Gant, 4-Kurt Coleman, 4-Ray Small, 5-Albert Dukes, 6-Larry Grant, 8-Roy Hall, 9-Brian Hartline, 13-Andre Amos, 15-A.J. Trapasso, 16-Trever Robinson, 19-Derek Harden, 20-Aaron Pettrey, 23-Nick Patterson, 28-Chris Wells, 29-Shaun Lane, 34-Maurice Wells, 39-Michael Dougherty, 49-Dionte Johnson, 49-Ryan Lukens, 50-Doug Datish, 51-Ross Homan, 55-Curtis Terry, 58-Drew Norman, 67-Kyle Mitchum, 78-Alex Barrow, 79-Jon Skinner, 86-Jake Ballard, 87-Brandon Smith, 87-Lawrence Wilson, 89-Stan White, Jr., 98-Joel Penton.
RecapFlorida dominated undefeated Ohio State and streaked to the BCS national championship, behind coach Urban Meyer’s two-quarterback system.
Ohio State started strong as Ted Ginn, Jr., returned the opening kickoff 93 yards for a touchdown, but then it quickly fell apart for the Buckeyes. Ginn hurt his foot in the touchdown celebration and didn’t return to the field until the second half - on crutches - and Florida led 34-14.
Gator starting quarterback Chris Leak, maligned for never winning the big one, completed 25 of 36 passes for 213 yards and a touchdown. Supersub Tim Tebow threw for one TD and powered into the end zone for another.
Defensive ends Derrick Harvey and Jarvis Moss made it a miserable night for Buckeye quarterback Troy Smith, the Heisman Trophy winner. The Gators sacked him five times and held him to minus-29 yards on 10 runs.
The Buckeyes had beat a pair of No. 2 teams, defending champion Texas and Michigan, earlier in the season, and they held a 19-game winning streak. However, they were no match for Florida’s speed and style.
The Buckeyes looked flummoxed by Florida’s frenetic offense. Trying to match up with the Gators’ shifting formations, they often jumped around at the line and still were out of position. Leak gladly took advantage of the confusion, picking wide-open receivers at will and hitting his first nine passes.
By the end, the numbers were numbing. Florida outgained the Buckeyes 370 yards to 82, led in first downs 21-8 and time of possession 40:48 to 19:12.

110
2006 Rose Bowl GameThe Rose Bowl
Pasadena, Calif., Jan. 4, 2006(USC’s participation was later vacated.)Teams ........................................... 1 2 3 4 ......Score#2 Texas (13-0) ............................. 0 16 7 18 ............ 41#1 USC (12-1) ............................... 7 3 14 14 ........... 38Att–93,986Kickoff Time: 5:26; End of Game: 9:25; Total Elapsed Time: 3:59Temperature: 68; Wind: nil; Weather: Hazy, 53% Humidity.
Scoring SummaryUSC - LenDale White 4 yd run (Mario Danelo kick), 5-46 (1:12), 12:27 1stUT - David Pino 46 yd field goal, 9-52 (4:02), 10:38 2ndUT - Selvin Young 12 yd run (David Pino kick failed), 7-80 (1:53), 4:57 2ndUT - Ramonce Taylor 30 run (David Pino kick), 4-51 (1:12), 2:34 2ndUSC - Mario Danelo 43 yd field goal, 11-54 (2:32), 0:02 2ndUSC - LenDale White 3 yd run (Mario Danelo kick) 7-62 (3:27), 10:36 3rdUT - Vince Young 14 yd run (David Pino kick), 7-80 (2:02), 08:34 3rdUSC - LenDale White 12 yd run (Mario Danelo kick), 9-74 (4:27), 4:07 3rd USC - Reggie Bush 26 yd run (Mario Danelo kick), 9-80 (3:36), 11:19 4thUT - David Pino 34 yd field goal, 9-52 (2:33), 8:46 4thUSC - Dwayne Jarrett 22 yd pass from Matt Leinart (Mario Danelo kick), 5-80 (2:04), 6:42 4thUT - Vince Young 17 yd run (David Pino kick), 8-69 (2:39), 4:03 4thUT - Vince Young 8 yd run (Vince Young rush), 10-56 (1:50), 0:19 4th
Final Statistics .......................................UT USC1st Downs .................................................30 30 Rushing............................................15 12 Passing .............................................14 15 Penalty ...............................................1 3Rushes-Yards......................................36-289 41-209Passing Yards ..........................................267 365Passes Comp-Att-Int ........................ 30-40-0 29-41-1Total Offense (plays-yards) ................76-556 82-574Punt Returns-Yards ................................2-19 0-0Kickoff Returns-Yards ...........................1-29 7-130Punts (Number-Avg) ...........................2-34.0 2-41.5Fumbles-Lost ...........................................4-1 1-1Sacks By: (Number-Yards) ....................3-15 0-0Penalties-Yards .......................................4-34 5-303rd Down Conversions ..........................3-11 8-144th Down Conversions .............................1-2 1-3
Individual StatisticsRushing: UT–Vince Young, 19-200, 3 TD; Selvin Young, 7-45, TD; Jamaal Charles, 5-34; Ramonce Taylor, 4-12, TD; TEAM, 1-(-2). USC–LenDale White 20-124, 3 TD; Reggie Bush 13-82, TD; Dwayne Jarrett 1-5; Matt Leinart 6-2, 2 TD; Chris McFoy 1-(-4)
Passing: UT–Vince Young 30-40-0, 267; USC–Matt Leinart, 29-40-1, 365, TD; Dwayne Jarrett 0-1-0, 0.
Receiving: UT–David Thomas 10-88; Limas Sweed, 8-65; Billy Pittman, 4-53; Brian Carter, 3-52; Quan Cosby, 2-16; Ramonce Taylor 2-(-3); Selvin Young 1-(-4). USC–Dwayne Jarrett 10-121, TD; Reggie Bush 6-95; Dominique Byrd, 4-32; David Kirtman, 3-61; Steve Smith, 3-29; Fred Davis, 2-19; Brandon Hancock 1-8.
Punting: UT–Richmond McGee 2-68, 34.0. USC–Tom Malone 2-83, 41.5.
Returns: UT–Punt: Aaron Ross 2-19; Kickoff: Ramonce Taylor 1-29; Int.: Michael Griffin, 1-0. USC–Kickoff: Reggie Bush 5-102; Darnell Bing 1-21; Rey Maualuga, 1-7.
Field Goals: UT–David Pino, 2-3 (46 Good, 31 Missed, 34 Good); USC–Mario Danelo, Mario, 1-1 (43 Good). Tackles (Solo-Assist-Total; QBS-Yds; TFL-Yds;)UT–Michael Huff (7-5-12, TFL-1-4); Tarell Brown (5-5-10, TFL-1-2); Michael Grif-fin, (7-1-8); Aaron Ross (6-2-8, TFL-1-1); Cedric Griffin (6-2-8); Robe Killebrew (4-2-6); Drew Kelson (4-1-5); Tim Crowder (4-0-4); Aaron Harris (2-1-3); Brandon Foster (2-0-2); TEAM (2-0-2, QBS-2-8, TFL-2.0-8); Greg Johnson (2-0-2); Frank Okam, (2-0-2, QBS-1-7, TFL-1-7); Brian Robison (1-0-1); Brian Orakpo (1-0-1); Roy Miller (1-0-1); Derek Lokey (1-0-1); Matt Melton (0-1-1); Karim Meijer (0-1-1); Brian Carter, (0-1-1).
USC–Darnell Bing (5-4-9); Josh Pinkard (6-1-7); Oscar Lua (3-3-6); Collin Ash-ton (4-1-5); Keith Rivers (4-1-5); Frostee Rucker (3-2-5, TFL-2-5); LaJuan Ramsey (3-2-5, TFL-2-4); Scott Ware (3-2-5, TFL-1-1); Sedrick Ellis (2-1-3); Justin Wyatt (1-1-2); Ryan Ting (1-1-2); Rey Maualuga (1-0-1); TEAM (1-0-1, TFL-1-2); Kaluka Maiava (1-0-1); John Walker (1-0-1); Brian Cushing (0-1-1).

111
Starting LineupsTexas LonghornsPos. No. OffenseSE 4 Limas Sweed LT 73 Jonathan Scott LG 64 Kasey Studdard C 62 Lyle Sendlein RG 72 Will Allen RT 63 Justin Blalock TE 16 David Thomas QB 10 Vince Young SL 5 Billy Pittman TB 22 Selvin Young FL 6 Quan Cosby
Pos. No. DefenseDE 80 Tim Crowder DT 97 Frank Okam DT 90 Rodrique Wright DE 39 Brian Robison SLB 40 Robe Killebrew MLB 2A Aaron Harris WLB 44 Rashad Bobino RCB 8 Cedric Griffin FS 27 Michael Griffin SS 7 Michael Huff LCB 5 Tarell Brown
Reserves1-Tyrel Gatewood, 2-Brian Carter, 3-Karim Meijer, 4-Drew Kelson, Drew, 7-Matt Nordgren, 9-Nate Jones, 11-Ramonce Taylor, 13-Err-ick Jackson, 15-David Pino, 18-Matt Melton, 21-Eric Foreman, 25-Jamaal Charles, 26-Marcus Griffin, 29-Ryan Palmer, 30-Braden Johnson, 31-Aar-on Ross, 35-Richmond McGee, 37-Henry Melton, 46-Ahmard Hall, 51-Mike Garcia, 53-Nick Schroeder, 75-Roy Miller, 87-Neale Tweedie, 91-Tully Janszen, 92-Larry Dibbles, 96-Derek Lokey, 97-Greg Johnson, 98-Brian Orakpo.
USC TrojansPos. No. OffenseSE 8 Dwayne JarrettLT 79 Sam BakerLG 71 Taitusi LutuiC 67 Ryan KalilRG 51 Fred MatuaRT 74 Winston JusticeTE 86 Dominique ByrdFL 2 Steve SmithQB 11 Matt LeinartFL 82 Chris McFoyTB 5 Reggie Bush
Pos. No. DefenseDE 96 Lawrence JacksonNT 49 Sedrick EllisDT 98 LaJuan RamseyDE 90 Frostee RuckerSLB 10 Brian CushingMLB 45 Oscar LuaWLB 55 Keith RiversCB 24 Justin WyattFS 29 Scott WareSS 20 Darnell BingCB 36 Josh Pinkard
Reserves1-Patrick Turner, 14-Tom Malone, 17-Troy Van Blarcom, 18-John Walker, 19-Mario Danelo, 21-Len-Dale White, 30-Mike Brittingham, 37-David Kirtman, 38-Brandon Ting, 39-Ryan Ting, 40-Brandon Hancock, 43-Kaluka Maiava, 50-Will Collins, 54-Jeff Schweiger, 56-Ryan Pow-drell, 58-Rey Maualuga, 59-Colin Ashton, 66-Chilo Rachal, 69-Matt Spanos, 75-Fili Moala, 83-Fred Da-vis, 84-Kyle Moore, 87-Nick Vander-boom, 88-Jimmy Miller, 95-Travis Tofi.
RecapVince Young single-handedly outperformed two-time defending national champion and No. 1 USC’s two Heisman trophy winners – Matt Leinart and Reggie Bush. Young ran and threw for a Rose Bowl Game-record 467 yards of total offense – passing for 267 yards and rushing for 200 yards and three TDs, two of those coming near the end of the fourth quarter to author a comeback that will forever live as one of the greatest in Rose Bowl Game history.
After USC took a 7-0 lead in the first quarter, Texas came alive in the second, scoring 16 points to USC’s three to take a 16-10 halftime lead. The Trojans responded with four touchdowns sandwiched around one Texas TD and a field goal to take a 38-26 lead with 6:42 remaining.
It was then that Young went to work. On the ensuing drive, he calmly took his offense 69 yards in just 2:39 and capped it with a 17-yard touchdown run.
After the Longhorns stopped the Torjans on fourth down on the next drive, Young took the ball with 2:09 remaining. As the USC faithful who traveled across town feared, Young did what Young does when it matters: He drove his team into scoring territory and, well, scored. He took a quarterback draw on 4th and 5 into the end zone from 8 yards out with 19 seconds left.
The victory ended a 34-game USC winning streak and earned Texas its first national championship since 1970.

112
2005 FedEx Orange BowlPro Player Stadium
Miami, Fla. January 4, 2005
(USC’s participation was later vacated.)Teams ............................................. 1 2 3 4 ....... Score#2 Oklahoma (12-1) ........................ 7 3 0 9 .............19#1 USC (13-0) ............................... 14 24 10 7 ............55Att–77,912Kickoff Time: 8:24; End of Game: 12:16; Total Elapsed Time: 3:52Temperature: 69; Wind: E 7mph; Weather: Clear 81% rh
Scoring SummaryOU - Travis Wilson 5 yd pass from Jason White (Garret Hartley kick), 12-92 (5:56), 7:44, 1stUSC - Dominique Byrd 33 yd pass from Matt Leinart (Ryan Killeen kick), 6-75 (3:17), 04:27, 1st USC - LenDale White 6 yd run (Ryan Killeen kick), 1-6 (0:06), 0:17 1st USC - Dwayne Jarrett 54 yd pass from Matt Leinart (Ryan Killeen kick), 6-89 (1:41), 11:46, 2ndUSC - Steve Smith 5 yd pass from Matt Leinart (Ryan Killeen kick), 3-10 (0:49), 09:17, 2ndOU - Garret Hartley 29 yd field goal, 13-68 (6:07), 03:10, 2ndUSC - Steve Smith 33 yd pass from Matt Leinart (Ryan Killeen kick), 4-79 (1:14), 01:56, 2ndUSC - Ryan Killeen 44 yd field goal, 7-8 (0:50), 00:03, 2nd USC - Steve Smith 4 yd pass from Matt Leinart (Ryan Killeen kick), 8-85 (3:07), 10:42, 3rdUSC - Ryan Killeen 42 yd field goal, 9-45 (2:34), 04:01, 3rd USC - LenDale White 8 yd run (Ryan Killeen kick), 5-56 (3:00), 09:46, 4thOU - TEAM safety, 06:34, 4thOU - Travis Wilson 9 yd pass from Jason White (Garret Hartley kick), 6-49 (2:35), 03:59, 4th
Final Statistics ........................................... OU USC1st Downs ...................................................... 19 19 Rushing .................................................. 9 8 Passing ................................................... 9 11 Penalty ................................................... 1 0 Rushes-Yards........................................... 40-128 28-193Passing Yards ............................................... 244 332Passes Comp-Att-Int ..............................24-36-3 18-35-0Total Offense (Plays-Yards) .................... 76-372 63-525Punt Returns-Yards ....................................... 1-3 1-7Kickoff Returns-Yards .............................. 7-139 2-36Punts (Number-Avg) ................................ 4-44.5 4-43.5 Fumbles-Lost ................................................ 3-2 1-0Sacks By: (Number-Yards) ........................... 1-9 2-20Penalties-Yards ............................................ 3-30 9-753rd Down Conversions ............................... 8-17 6-144th Down Conversions .................................. 0-1 2-2
Individual StatisticsRushing: OU-Adrian Peterson, 25-82; D. J. Wolfe, 7-40; Kejuan Jones, 4-9; Travis Wilson, 1-5; Jason White, 3-(-8). USC-LenDale White, 15-118, 2 TD; Reggie Bush, 6-75; Lee Webb 1-4; David Kirtman, 1-4; Desmond Reed, 2-2; Dominique Byrd, 1-1; Matt Leinart, 2-(-11).
Passing: OU-Jason White, 24-36-3, 244, 2TD. USC-Matt Leinart, 18-35-0, 332, 5TD.
Receiving: OU-Travis Wilson, 7-59, 2TD; Mark Clayton, 4-21; Mark Bradley, 2-66; Kejuan Jones, 2-30; Brandon Jones, 2-13; Adrian Peterson, 2-6; Jejuan Rankins, 2-0; Joe Jon Finley, 1-23; Will Peoples, 1-18; James Moses, 1-8. USC-Steve Smith, 7-113, 3 TD; Dwayne Jarrett, 5-115, TD; Dominique Byrd, 3-58, TD; Reggie Bush, 2-31; David Kirtman, 1-15.
Punting: OU–Blake Ferguson, 4-178, 44.5; USC–Tom Malone, 4-174, 43.5.
Returns: UF–Punt: Mark Bradley, 1-3; Kickoff: Travis Wilson, 3-51; Mark Bradley, 3-70; Brandon Jones, 1-18; USC–Punt: Reggie Bush, 1-7; Kickoff: Reggie Bush, 2-36; Int.: Eric Wright, 1-22; Jason Leach, 1-0; Matt Grootegoed, 1-9.
Field Goals: OU–Garret Hartley, 1-1 (29 FG); USC–Ryan Killeen, 2-2 (44 FG, 42 FG).
Tackles (Solo-Assist-Total; QBS-Yds; TFL-Yds;)OU–Brodney Pool (6-1-7, TFL-1.0-2); Donte Nicholson (3-3-6); Lance Mitchell, (1-5-6); Rufus Alexander (2-3-5); Marcus Walker (2-3-5); Antoni Perkins (2-2-4); Dan Cody, (2-1-3, QBS-1.0-9, TFL-2.0-13); Clint Ingram (2-1-3); Lynn McGruder (2-0-2); Travis Wilson, (2-0-2); Jason Carter (1-0-1); Gayron Allen (1-0-1); Zach Latimer (1-0-1); Lawrence Dampeer, (1-0-1); Mark Clayton (1-0-1); Larry Birdine (1-0-1); Jowahn Poteat (0-1-1); Remi Ayodele, (0-1-1); Brandon Jones (0-1-1).
USC–Trojans-Lofa Tatupu (7-5-12, QBS-0.5-3, TFL-0.5-3); Darnell Bing (5-5-10, TFL-1.5-5); Jason Leach (5-2-7); Matt Grootegoed (4-3-7); Shaun Cody (2-3-5, QBS-1.0-14, TFL-1.0-14); Eric Wright (3-1-4); Keith Rivers (3-1-4, QBS-0.5-3, TFL-0.5-3); Manuel Wright (2-1-3, TFL-2.5-2); Dallas Sartz (2-1-3); Justin Tolliver (1-2-3); Mike Patterson (0-3-3); Ryan Ting (0-3-3); Lawrence Jackson (2-0-2); Frostee Rucker (2-0-2); Terrell Thomas, (2-0-2); Greg Farr (1-1-2); Josh Pinkard (1-1-2); Thomas Williams (0-2-2); Lee Webb (0-2-2); Jeff Schweiger (0-2-2); Travis Tofi (1-0-1); Collin Ashton (1-0-1); Ronald Nunn (1-0-1); Justin Wyatt, (1-0-1, TFL-1.0-2); David Kirtman (0-1-1); Oscar Lua (0-1-1).

113
Starting Lineups
Oklahoma SoonersPos. No. OffenseWR 4 Travis Wilson LT 60 Wes Sims RG 70 Kelvin Chaisson C 50 Vince Carter LG 77 Davin Joseph RT 55 Jammal Brown WR 29 Will Peoples FB 38 J.D. Runnels QB 18 Jason White TB 28 Adrian Peterson WR 9 Mark Clayton
Pos. No. DefenseDE 49 Jonathan Jackson DT 68 Carl Pendleton DT 96 Lynn McGruder DE 80 Dan Cody WLB 42 Rufus Alexander MLB 10 Lance Mitchell SLB 44 Clint Ingram CB 24 Marcus Walker CB 28 Antoni Perkins FS 23 Brodney Pool SS 8 Donte Nicholson
Reserves1-Mark Bradley, 3-Jejuan Rankins, 15-Tommy Grady, 5-Brandon Shelby, 6-Jason Carter, 20-Kejuan Jones, 21-Jowahn Poteat, 22-Chi-jioke Onyenegecha, 25-D.J. Wolfe, 32-Garret Hartley, 35-Donta Hickson, 36-Russe Denni-son, 39-Dan Townsend, 41-Darien Williams, 46-Zach Latimer, 48-Gayron Allen, 51-Demar Pleasant, 52-Chris Bush, 64-Chris Chester, 68-Jacob Rice, 69-Aki Millington, 73-John Flynn, 74-Lawrence Dampeer, 79-Chris Messner, 81-Brandon Jones, 83-Trey DiCarlo, 85-Joe Jon Finley, 87-Blake Ferguson, 88-Wil-lie Roberts, 89-James Moses, 90-Steven Cole-man, 92-Larry Birdine, 93-Remi Ayodele.
USC TrojansPos. No. OffenseSE 8 Dwayne JarrettLT 79 Sam BakerLG 73 John DrakeC 67 Ryan KalilRG 51 Fred MatuaRT 71 Taitusi LutuiTE 81 Alex HolmesFB 35 Lee WebbQB 11 Matt LeinartTB 5 Reggie BushFL 2 Steve Smith
Pos. No. DefenseDE 90 Frostee RuckerNT 99 Mike PattersonDT 84 Shaun CodyDE 96 Lawrence JacksonSLB 42 Dallas SartzMLB 58 Lofa TatapuWLB 6 Matt GrootegoedCB 24 Justin WyattSS 20 Darnell BingFS 27 Jason LeachCB 25 Eric Wright
Reserves10-Matt Cassel, 14-Tom Malone, 15-Jason Mitchell, 16-Ryan Killeen, 18-John Walker, 19-Greig Carlson, 21-Justin Tolliver, 21-LenDale White, 22-Desmond Reed, 23-Ronald Nunn, 26-Greg Farr, 28-Terrell Thomas, 29-Scott Ware, 30-Kevin Arbet, 31-William Buchanon, 36-Josh Pinkard, 37-David Kirtman, 38-Brandon Ting, 39-Ryan Ting, 41-Thomas Williams, 41-Jody Adewale, 45-Oscar Lua, 49-Sedrick Ellis, 49-Mike Brittingham, 50-Will Collins, 52-LaJua Ramsey, 53-Jeff Byers, 54-Jeff Schweiger, 55-Keith Rivers, 59-Colin Ashton, 60-Drew Radovich, 63-Travis Wat-kins, 69-Matt Spanos, 75-Kyle Williams, 82-Chris McFoy, 86-Dominique Byrd, 87-Nick Vanderboom, 89-Dale Thompson, 92-Manuel Wright, 95-Travis Tofi, 97-Alex Morrow.
RecapHeisman Trophy winner Matt Leinart threw a record five touchdown passes and Southern California overwhelmed Oklahoma 55-19, ending the season just as they started: No. 1.
With the aid of four Oklahoma turnovers, the Trojans ambushed the Sooners with 38 points in the final 20 minutes of the first half. Leinart became the first Heisman winner to win a national title since Michigan’s Charles Woodson in 1997. Leinart tossed four scores in the first half as the Trojans turned an early 7-0 deficit into a 38-10 halftime lead.
The Trojans reached a season high for points and turned the game into a USC highlight reel, with Leinart making pinpoint passes and his receivers making spectacular catches. Steve Smith caught an Orange Bowl record three touchdowns, LenDale White ran for 118 yards and two scores and USC’s defense smothered Oklahoma’s freshman sensation Adrian Peterson.
Trailing 7-0, USC knotted the game on a 33-yard TD pass, then took the lead as White reached the ball over the goal line after a misplayed punt. USC made it 21 straight points with the help of Oklahoma’s second turnover. Under pressure, Jason White heaved a deep ball into quadruple-coverage and Jason Leach came up with USC’s 20th interception of the season.

114
2004 Nokia Sugar BowlLouisiana Superdome
New Orleans, La. January 4, 2004
Teams .........................................1 2 3 4 ......Score#2 LSU (13-1).......... ...................7 7 7 0 ........... 21#1 Oklahoma .(12-2)..... ..............0 7 0 7 ........... 14Attendance–79,342Kickoff Time: 7:25; End of Game: 11:08; Total Elapsed Time: 3:43Temperature: 70; Wind: None; Weather: Indoors
Scoring SummaryLSU - Skyler Green 24 yd run (Ryan Gaudet kick), 3-32 (1:09), 11:38, 1stOU - Kejuan Jones 1 yd run (Trey DiCarlo kick), 3-2 (1:04), 07:31, 2ndLSU - Justin Vincent 18 yd run (Ryan Gaudet kick), 9-80 (3:10), 04:21, 2nd LSU- Marcus Spears 20 yd interception return (Ryan Gaudet kick), 14:13, 3rdOU - Kejuan Jones 1 yd run (Trey DiCarlo kick), 9-31 (3:45), 11:01, 4th
Final Statistics .................................... LSU OU1st Downs .................................................13 12 Rushing..............................................6 5 Passing ...............................................6 5 Penalty ...............................................1 2 Rushes-Yards......................................40-159 33-52Passing Yards ..........................................153 102Passes Comp-Att-Int ........................ 14-24-2 13-37-2Total Offense (Plays-Yards) ...............64-312 70-154Punt Returns-Yards ................................3-26 5-36Kickoff Returns-Yards .............................0-0 2-24Punts (Number-Avg) ...........................8-34.0 8-45.9 Fumbles-Lost ...........................................1-1 2-0Sacks By: (Number-Yards) ....................5-46 5-12Penalties-Yards .......................................8-65 11-703rd Down Conversions ..........................6-17 4-154th Down Conversions .............................0-1 1-3
Individual StatisticsRushing: LSU–Justin Vincent 16-117, TD; Matt Mauck 14-27; Skyler Green3-22; Alley Broussard 2-6; Joseph Addai 2-(-1); TEAM 3-(-12). OU–Kejuan Jones 20-59, 2 TD; Mark Clayton 4-38; Renaldo Works 1-2; TEAM1-(-1); Jason White 7-(-46).
Passing: LSU–Matt Mauck 13-22-2, 124; Blain Bech 1-1-0, 29; MichaelClayton 0-1-0, 0. OU–Jason White 13-37-2, 102.
Receiving: LSU–Michael Clayton 4-38; David Jones 3-54; D. Henderson2-24; Skyler Green 2-23; Joseph Addai 2-12; Eric Edwards 1-2. OU–Mark Clayton 4-32; Travis Wilson 3-31; J.D. Runnels 2-19; Kejuan Jones 2-6; Mark Bradley 1-9; Brandon Jones 1-5.
Punting: LSU–Donnie Jones 7-272 (38.9); TEAM 1-0 (0.0). OU–Blake Ferguson 8-367 (45.9).
Returns: LSU–Punt: Skyler Green 3-26; Int.: Corey Webster 1-18; Marcus Spears 1-20. OU–Punt: Antoni Perkins 3-10; Russe Dennison 0-2; Brandon Shelby 1-17; TEAM 1-7; Kickoff: Mark Clayton 2-24; Int.: Brodney Pool 1-49; Antoni Perkins 1-13.
Field Goals: None.
Tackles (Solo-Assist-Total; QBS-Yds; TFL-Yds;)LSU–Lionel Turner (8-1-8.5; QBS-2.0-26; TFL-2.0-26), Eric Alexander (5-3-6.5, TFL-1.0-1), Jack Hunt (4-2-5.0), Chad Lavalais (4-0-4.0), Melvin Oliver (4-0-4.0, QBS-1.0-9, TFL-2.0-13), Marquise Hill (3-1-3.5, QBS-1.0-8, TFL-1.0-8), Travis Dan-iels (2-2-3.0 TFL-1.0-2), Kyle Williams (2-1-2.5), Marcus Spears (2-0-2.0, QBS-1.0-3, TFL-1.0-3), LaRon Landry (1-3-2.5), Gant Petty (1-0-1.0), Chad White (1-0-1.0), David Jones (1-0-1.0), Bennie Brazell (1-0-1.0), Cameron Vaughn (1-1-1.5), Michael Clayton (1-0-1.0), Jesse Daniels (1-0-1.0, TFL-1.0-2), Brian West (0-1-0.5), Randall Gay (0-1-0.5).
OU–Derrick Strait (8-3-9.5), Brodney Pool (8-2-9.0, QBS-1.0-3, TFL-1.0-3), Dont Nicholson (6-1-6.5, QBS-1.0-1, TFL-1.0-1), Teddy Lehman (5-3-6.5, QBS-1.0-2, TFL-1.5-3), Jonath Jackson (3-1-3.5, TFL-2.0-8), Antoni Perkins (3-0-3.0), 48 Gayron Allen (3-1-3.5, TFL-1.0-4), Tommie Harris (2-1-2.5, QBS-1.0-3, TFL-1.0-3), Dusty Dvoracek (1-0-1.0, TFL-1.0-1), Dan Cody (1-1-1.5, QBS-1.0-3, TFL-1.0-3), Brandon Shelby (1-0-1.0, TFL-1.0-2), Will Peoples (1-0-1.0), J.D. Runnels (1-0-1.0), Brando Everage (1-0-1.0), Pasha Jackson (0-1-0.5, TFL-0.5-0).

115
Starting LineupsLSU TigersPos. No. OffenseSE 9 D. HendersonLT 76 A. WhitworthLG 71 Nate LivingsC 55 Ben WilkersonRG 72 S. PetermanRT 60 Rodney ReedTE 47 Eric EdwardsQB 18 Matt MauckRB 25 Justin VincentHB 82 David JonesFL 14 Michael Clayton
Pos. No. DefenseLE 84 Marcus SpearsLT 95 Kyle WilliamsRT 93 Chad LavalaisRE 94 Marquise HillSLB 27 Eric AlexanderMLB 58 Lionel TurnerWLB 46 Cameron VaughnLC 13 Corey WebsterRC 29 Travis DanielsSS 8 Jack HuntLB 57 Dave Peterson
Reserves5-Skyler Green, 7-Adrian Mayes, 10-Joseph Addai, 17-Bennie Brazell, 21-Randall Gay, 22-Alley Broussard, 24-Keron Gordon, 30-LaRon Landry, 31-Jesse Daniels, 32-B. Edwards, 37-Daniel Francis, 38-G. Giam-belluca, 39-Ryan Gaudet, 41-Chris Jackson, 43-Chad White, 44-Kevin Steltz, 48-Kirston Pittman, 54-Brian West, 62-Harold Bicknell, 68-Terrell McGill, 70-Gant Petty, 80-Don-nie Jones, 81-Dwayne Bowe, 87-Blain Bech, 89-Keith Zinger, 90-Melvin Oliver, 92-Bryce Wyatt, 97-B. Washington, 98-Tor-ran Williams, 99-Jason LeDoux.
Oklahoma SoonersPos. No. OffenseWR 9 Mark ClaytonLT 60 Wes Sims LG 70 Kelvin ChaissonC 50 Vince CarterRG 77 Davin JosephRT 55 Jammal BrownTE 86 Lance DonleyQB 18 Jason WhiteRB 20 Kejuan JonesHB 38 J. D. Runnels WR 29 Will Peoples
Pos. No. DefenseDE 49 Jonah JacksonDT 97 Tommie HarrisDT 94 Dusty DvoracekDE 80 Dan CodyMLB 48 Gayron AllenWLB 11 Teddy LehmanCB 28 Antoni PerkinsCB 2 Derrick StraitSS 8 Don NicholsonFS 7 Brandon EverageCB 23 Brodney Pool
Reserves1-Mark Bradley, 4-Travis Wilson, 5-Brandon Shelby, 6-Jason Carter, 13-Eric Bassey, 16-Lewis Baker, 34-Matt McCoy, 35-Donta Hickson, 36-Russe Dennison, 44-Clint Ingram, 46-Zach Latimer, 47-Renaldo Works, 53-Pasha Jackson, 58-Cal Thibodeaux, 68-Jacob Rice, 81-Brandon Jones, 83-Trey DiCarlo, 84-Chris Chester, 87-Blake Ferguson, 89-James Mo-ses, 92-Larry Birdine, 93-Kory Klein, 96-Lynn McGruder.
RecapRiding its defense, LSU claimed its second national title with a 21-14 win over Oklahoma in the BCS National Championship Game. The title was the first for the Tigers since 1958 - a championship also clinched in the Sugar Bowl.
LSU opened the game up with a 64-yard rush from Justin Vincent on the first play from scrimmage but failed to score on that possession. The Tigers did score on their next possession after a Corey Webster interception that put LSU on the Oklahoma 32-yard line. Three plays later, Skyler Green scored on a 24-yard end-around to put the Tigers up 7-0.
The teams traded scores in the second quarter as Sooner running back Kejuan Jones tied up the game at 7-7 with a 1-yard touchdown run, and later in the quarter, Vincent dashed into the end zone on an 18-yard TD run to put LSU up again 14-7 at the half. The Tigers opened the second-half much like they did in the beginning of the game by scoring fast. Marcus Spears intercepted a Jason White pass less than a minute into the third quarter for a 20-yard score.
Oklahoma pulled within seven early in the fourth quarter on another 1-yard run by Jones. The Sooners then made a late-game push to the LSU 12, but four failed pass attempts gave up the ball back to LSU, which let the clock run down for the win.

116
2003 Tostitos Fiesta BowlSun Devil Stadium
Tempe, Arizona Jan. 3, 2003
Teams .........................................1 2 3 4 OT .......... Score#2 Ohio State (14-0).......... .........0 14 3 0 14 ................31#1 Miami .(12-1)..... ....................7 0 7 3 7 .................24Att–77,502Kickoff Time: 6:21; End of Game: 10:17; Total Elapsed Time: 3:56Temperature: 70; Wind: W 9mph; Weather: Beautiful
Scoring SummaryMIAMI–Parrish, Roscoe 25 yd pass from Dorsey, Ken (Sievers, Todd kick), 5-52 (2:12), 04:09, 1stOSU–Krenzel, Craig 1 yd run (Nugent, Mike kick), 7-17 (3:08), 02:28, 2ndOSU–Clarett, Maurice 7 yd run (Nugent, Mike kick), 2-14 (1:05), 01:10, 2nd OSU–Nugent, Mike 44 yd field goal, 4-1 2:00, (08:33), 3rdMIAMI–McGahee, Willis 9 yd run (Sievers, Todd kick), 7-55 (2:54), 02:11, 3rd MIAMI–Sievers, Todd 40 yd field goal, 32-3 (2:02), 00:00, 4thMIAMI–Winslow, Kellen 7 yd pass from Dorsey, Ken (Sievers, Todd kick), OT, 5-25OSU–Krenzel, Craig 1 yd run (Nugent, Mike kick), OT, 11-25OSU–Clarett, Maurice 5 yd run (Nugent, Mike kick), OT, 5-25
Final Statistics ....................................OSU UM1st Downs .................................................14 19 Rushing..............................................7 3 Passing ...............................................6 14 Penalty ...............................................1 2 Rushes-Yards......................................52-145 33-65Passing Yards ..........................................122 304Passes Comp-Att-Int .......................... 7-21-2 29-44-2Total Offense (Plays-Yards) ...............73-267 77-369Punt Returns-Yards ..................................1-1 2-56Kickoff Returns-Yards ...........................1-15 1-39Punts (Number-Avg) ...........................6-47.7 4-43.2Fumbles-Lost ...........................................0-0 3-3Sacks By: (Number-Yards) ....................4-18 1-4Penalties-Yards .......................................9-49 6-303rd Down Conversions ..........................6-18 6-184th Down Conversions .............................2-3 1-2
Individual StatisticsRushing: OSU–Craig Krenzel 19-81, 2 TD; Maurice Clarett 23-47, 2 TD; Lydell Ross, 9-17; Andy Groom 1-0. UM–Willis McGahee 20-67, TD; Jarrett Payton 8-17; Quadrine Hill 1-0; Ken Dorsey 4-(-19).
Passing: OSU–Craig Krenzel, 7-21-2, 122; UM–Ken Dorsey 28-43-2, 296, 2TD; Der-rick Crudup 1-1-0, 8.
Receiving: OSU–Michael Jenkins 4-45; Chris Gamble 2-69; Chris Vance 1-8. UM–Kellen Winslow 11-122, TD; Roscoe Parrish, 5-70, TD; Andre Johnson 4-54; Ethenic Sands 3-34; Willis McGahee 3-5; Quadrine Hill 1-8; Jarrett Payton, 1-7; Jason Geath-ers 1-4.
Punting: OSU–Andy Groom 6-286, 47.7; UM–Freddie Capshaw 3-130, 43.3; Derrick Crudup, 1-43, 43.0.
Returns: OSU–Punt: Chris Gamble 1-1; Kickoff; Maurice Hall 1-15; Int: Mike Doss 1-35, Dustin Fox 1-12. UM–Punt: Roscoe Parrish 2-56; Kickoff: Andre Johnson 1-39 Int: Sean Taylor 2-28.
Field Goals: OSU–Mike Nugent 1-2, (44 FG, 42 missed). UM–Todd Sievers 1-2, (40 FG, 54 missed). Tackles (Solo-Assist-Total; QBS-Yds; TFL-Yds;)OSU–Matt Wilhelm (6-4-10, TFL-3-5); Mike Doss (3-6-9, TFL 0.5-1); Will Smith (6-2-8, QBS-1-3, TFL-2-4); Dustin Fox (5-2-7); Cie Grant (4-3-7); Kenny Peterson (4-1-5, QBS-2-10, TFL-3-12); Chris Gamble (3-2-5); Donnie Nickey (3-2-5); Will Al-len (3-2-5, TFL 0.5-1); Robert Reynolds (3-1-4); Tim Anderson (1-3-4, TFL 0.5-1); David Thompson (0-3-3, TFL-1-1); Darrion Scott (1-0-1); Steven Moore (1-0-1); Si-mon Fraser (1-0-1; QBS-1-5, TFL-1-5); Maurice Clarett (1-0-1); Tyler Everett (1-0-1); Andy Groom (0-1-1); Mike Kudla (0-1-1); TEAM (0-1-1).
UM–Jonathan Vilma (5-9-14); Maurice Sikes (2-10-12); Sean Taylor (2-9-11); D.J. Williams (3-5-8, TFL-1-2); Roger McIntosh (2-6-8, TFL 1.5-3); Matt Walters (4-3-7); Antrel Rolle (2-2-4); Orien Harris (1-3-4); Jamaal Green (2-1-3, QBS-1-4, TFL-1-4); William Joseph (2-1-3); Sherko Haji-Rasouli (2-0-2); Andrew Williams (1-1-2); Glenn Sharpe (1-1-2); Jerome McDougle (1-1-2, TFL 0.5-1); James Scott (1-0-1); Vince Wilfork (1-0-1, TFL-1-7); Willis McGahee (1-0-1); Al Marshall (1-0-1).

117
Starting LineupsOhio State BuckeyesPos. No. OffenseSE 12 Michael JenkinsLT 77 Rob SimsLG 63 Adrien ClarkeC 76 Alex StepanovichRG 78 Bryce BishopRT 71 Shane OliveaTE 88 Ben HartsockFL 7 Chris GambleQB 16 Craig KrenzelTB 13 Maurice ClarettFB 38 Joe Brandon
Pos. No. DefenseRE 93 Will SmithDT 54 Tim AndersonDT 97 Kenny PetersonLE 56 Darrion ScottWLB 6 Cie GrantMLB 35 Matt WilhelmSLB 44 Robert ReynoldsCB 37 Dustin FoxCB 7 Chris GambleFS 25 Donnie NickeySS 2 Mike Doss
Reserves2-Mike Doss 3D-Steven Moore, 3-Bam Childress, 4-Chris Vance, 5-Mike D’Andrea, 6-Cie Grant, 7-Chris Gamble, 8-Drew Carter, 12-Michael Jenkins, 13-Maurice Clarett, 16-Craig Krenzel, 18-Andy Groom, 20-Chris Conwell, 21-Nate Salley, 25-Don-nie Nickey, 26-Will Allen, 28-Maurice Hall, 30-Lydell Ross, 35-Matt Wilhelm, 36-Pat O’Neill, 37-Dustin Fox, 38-Bran-den Joe, 42-Bobby Carpenter, 43-Brandon Schnittker, 44-Robert Reynolds, 47-A.J. Hawk, 48-Jack Tucker, 49-E. J. Underwood, 52-Mike Kne, 53-Ivan Douglas, 54-Tim Anderson, 55-Nick Mangold, 56-Darrion Scott, 57-Mike Kudla, 60-Kyle Andrews, 63-Adrien Clarke, 71-Shane Olivea, 75-Si-mon Fraser, 76-Alex Stepanovich, 77-Rob Sims, 78-Bryce Bishop, 80-Ryan Hamby, 83-Redgie Arden, 85-Mike Nugent, 87-Json Caldwell, 88-Ben Hartsock, 91-Jason Bond, 93-Wil Smith, 94-Marcus Green, 95-Da-vid Thompson, 97-Kenny Peterson, 99-Jay Richardson.
Miami HurricanesPos. No. OffenseSE 5 Andre JohnsonLT 76 Carlos JosephLG 74 Sherko Haji-Rasouli C 66 Brett RombergRG 77 Chris MyersRT 60 Vernon CareyTE 81 Kellen WinslowFL 1 Roscoe ParrishQB 11 Ken DorseyRB 2 Willis McGaheeFB 23 Quadtrine Hill
Pos. No. DefenseRE 55 Jamaal GreenRT 91 Matt WaltersLT 94 William JosephLE 95 Jerome McDougleWLB 17 D.J. WilliamsMLB 51 Jonathan VilmaSLB 50 Roger McIntoshRCB 25 Al MarshallLCB 6 Antrel RolleFS 26 Sean TaylorSS 36 Maurice Sikes
Reserves1-Roscoe Parrish, 2-Willis McGahee, 3-Jason Geathers, 5-Andre Johnson, 6-Antrel Rolle, 7-Ethenic Sands 11-Ken Dorsey, 13-Freddie Capshaw, 16-Todd Sievers, 17-D.J. Williams, 18-Derrick Crudup, 22-Kelly Jennings, 23-Quadtrine Hill, 24-Marcus Maxey, 25-Al Marshall, 26-Sean Taylor, 28-Greg Threat, 29-James Scott, 31-Glenn Sharpe, 34-Jarrett Payton, 36-Maurice Sikes, 39-Jon Peattie, 41-Talib Humphrey, 44-Leon Williams, 45-Howard Clark, 49-Darrell McClover, 50-Roger McIntosh, 51-Jonathan Vilma, 55-Jamaal Green, 58-Jarrell Weaver, 59-Brad Kunz, 60-Vernon Carey, 62-Chris Harvey, 66-Brett Romberg, 70-Joel Rodriguez, 74-Sherko Haji-Rasouli, 75-Vince Wilfork, 76-Carlos Joseph, 77-Chris Myers, 80-JOLLA, Ak-ieem Jolla, 81-Kellen Winslow, 82-David Williams, 87-Eric Winston, 91-Matt Wal-ters, 92-Orien Harris, 94-JOSEPH, William Joseph, 95-Jerome McDougle, 99-Andrew Williams.
RecapFor three quarters, the Tostitos Fiesta Bowl was a perfectly good, if not memorable, college football championship game. By the end of the fourth quarter, with Ohio State and Miami tied at 17, it was a classic.
After two overtimes, and the Buckeyes’ 31-24 victory, it was one of the greatest ever.
The game was won by a five-yard touchdownrun from Maurice Clarett, followed by Ohio State’s defense turning back one final bid by No. 1 Miami.With that, the Buckeyes completed an unlikely, unbeaten run to their first national title in 34 years. But it would have never happened if not for a late pass interference call at the end of the first overtime. Instead, the fourth-down call gave Ohio State the chance it needed to tie the game and send it into the second overtime.
Miami’s Todd Sievers sent the game into overtime with his 40-yard field goal on the final play of the fourth quarter. The Buckeyes’ punishing defense had rattled and pounded Miami quarterback Ken Dorsey all night. And on the last play of the game, on fourth-and-goal at the 1, Cie Grant blitzed and forced Dorsey to heave a desperation pass that linebacker Matt Wilhelm batted to the ground.
A few plays earlier, Wilhelm knocked Dorsey to the sideline for one play. He came back in, but the Buckeyes would not be denied against a team trying to secure its place in history as one of college football’s great dynasties.

118
2002 Rose BowlRose Bowl Stadium
Pasadena, California January 3, 2002
Teams .........................................1 2 3 4 ......Score#2 Miami (12-0) ..........................7 27 0 3 ........... 37#1 Nebraska (11-2)..... .................0 0 7 7 ........... 14Attendance–93,781Kickoff Time: 5:24; End of Game: 8:34; Total Elapsed Time: 3:10Temperature: 58; Wind: Swirling; Weather: 34% Humidity, High Clouds
Scoring SummaryUM–Johnson, Andre, 49 yd pass from Dorsey, Ken (Sievers, Todd kick), 1-49, (0:07), 06:51, 1st.UM–Portis, Clinton 39 yd run (Sievers, Todd kick), 5- 86 (1:32), 14:33, 2nd.UM–Lewis, James 47 yd interception return (Sievers, Todd kick), 12:52, 2nd.UM–Shockey, Jeremy 21 yd pass from Dorsey, Ken (Sievers, Todd kick failed), 2- 66 (0:33), 10:40, 2nd.UM–Johnson, Andre 8 yd pass from Dorsey, Ken (Sievers, Todd kick), 7- 55 (3:04), 3:35, 2nd.NEB.–Davies, Judd 16 yd run (Brown, Josh kick), 11-68 (5:42), 02:39, 3rd.NEB.–Groce, DeJuan 71 yd punt return (Brown, Josh kick), 14:28 ,4th.UM–Sievers, Todd 37 yd field goal, 11-59 (4:24), 10:04, 4th.
Final Statistics ..................................... UM NEB1st Downs .................................................18 16 Rushing..............................................6 14 Passing .............................................12 2 Penalty ...............................................0 0 Rushes-Yards......................................26-110 49-197Passing Yards ..........................................362 62Passes Comp-Att-Int ........................ 22-35-1 5-15-1Total Offense (Plays-Yards) ...............61-472 64-259Punt Returns-Yards ................................4-37 3-85Kickoff Returns-Yards ...........................2-27 5-119Punts (Number-Avg) ...........................4-38.5 5-40.6Fumbles-Lost ...........................................2-0 4-2Sacks By: (Number-Yards) ....................3-26 0-0Penalties-Yards .....................................12-85 4-263rd Down Conversions ..........................6-13 5-154th Down Conversions .............................0-0 1-4
Individual StatisticsRushing: UM–Clinton Portis 20-104, TD; Willis McGahee 2-7; Frank Gore 2-3; TEAM 2-(-4). NEB–Eric Crouch 22-114; Dahrran Diedrick 15-47; Judd Davies 5-20, TD; Ben Zajicek 1-10; Thunder Collins 6-10.
Passing: UM–Ken Dorsey 22-35-1, 362, 3TD. NEB–Eric Crouch 5-15-1, 62; Dahrran Diedrick, D. 0-0-0, 0.
Receiving: UM–Andre Johnson 7-199, 2TD; Jeremy SHOCKEY, 5-85, TD; Kevin Beard 4-41; Clinton Portis 4-26; Daryl Jones 1-7; Robert Williams 1-4. NEB–Wilson Thomas 3-36; Tracey Wistrom 2-26.
Punting: UM–Freddie Capshaw 4-143, 35.8. NEB–Kyle Larson 5-203, 40.6.
Returns: UM–Punt: Phillip Buchanon 4-37; Kickoff: Andre Johnson 2-27; Int.: James Lewis 1-47. NEB–Punt: DeJuan Groce 3-85; Kickoff: Josh Davis 5-119; Int.: Keyuo Craver 1-0.
Field Goals: UM–Todd Sievers 1-2 (49 Missed, 37 Good). NEB–None. Tackles (Solo-Assist-Total; QBS-Yds; TFL-Yds;)UM–Jonathan Vilma (6-2-8, QBS-1.0-9; TFL-3-13), Edward Reed (6-3-9), William Joseph (4-2-6, TFL-3-9), D. J. Williams (3-1-4, QBS-1-10, TFL-1-10), James Lewis (4-1-5), Andrew Williams (3-1.4, TFL-1-1), Howard Clark (3-1-4), Jamaal Green (3-0-3), Phillip Buchanon (3-0-3, QBS-1.0-7, TFL-2-8), Mark Fitzgerald (2-1-3), Jerome McDougle (2-0-2, TFL-1-2), Kellen Winslow (2-0-2), Mike Rumph (1-1-2), Antrell Rolle (1-0-1), Jarrell Weaver (1-0-1), Al Marshall (1-0-1), Matt Walters (1-0-1, TFL-1-3), TEAM (1-0-1, TFL-1-1).
NEB–Willie Amos (6-1-7, TFL-1-1); Keyuo Craver (4-2-6); DeJuan Groce (4-0-4); Scott Shanle (3-0-3); Chris Kelsay (3-1-4, TFL-1-1); Dion Booker (2-0-2); Demoine Adams (3-0-3); TEAM (3-0-3, TFL-3-7), Jamie Burrow (2-1-3); Mark Vedral (1-2-3); J. P. Wichmann (1-1-2, TFL-1-3); Jerrell Pippens (2-0-2); Ryon Bingham (1-0-1); Philip Bland (1-0-1); Justin Smith (1-0-1); Aaron Terpening (1-0-1); Jon Clanton (1-0-1); Pat Ricketts (1-0-1); Judd Davies (1-0-1); Erwin Swiney (1-0-1); T.J. Hollowell (0-1-1); TEAM: (3-0-3; TFL-3-7).

119
Starting Lineups
Miami HurricanesPos. No. OffenseQB 11 Ken Dorsey RB 28 Clinton Portis RB 2 Willis McGaheeSE 5 Andre Johnson FL 1 Daryl Jones TE 88 Jeremy Shockey LT 78 Bryant McKinnie LG 72 Ed Wilkins C 66 Brett Romberg RG 65 Martin Bibla RT 73 Joaquin Gonzalez
Pos. No. DefenseLE 95 Jerome McDougle LT 94 William Joseph RE 99 Andrew Williams RT 91 Matt Walters WLB 17 D. J. Williams MLB 51 Jonathan Vilma SLB 45 Howard Clark FS 20 Edward Reed SS 23 James Lewis RC 8 Mike Rumph LC 31 Phillip Buchanon
Reserves3-Jason Geathers, 6-Antrel Rolle, 9-Kev-in Beard, 13-Freddie Capshaw, 16-Todd Sievers, 25-Al Marshall, 26-Sean Taylor, 27-Mark Fitzgerald 32-Frank Gore, 34-Jarrett Payton, 36-Maurice Sikes, 38-Carl Walker, 39-LaVaar Scott, 40-Kyle Cobia, 41-Franklin Bayless, 47-Ken Dangerfield, 53-James Sikora, 55-Jamaal Green, 56-Santonio Thomas, 58-Jar-rell Weaver, 59-Brad Kunz, 60-Vernon Carey, 68-Joe Fantigrassi, 70-Joel Ro-driguez, 75-Vince Wilfork, 80-Robert Williams, 81-Kellen Winslow, 82-David Williams, 83-Aaron Greeno.
Nebraska CornhuskersPos. No. OffenseQB 7 Eric CrouchFB 4 Judd DaviesSE 9A Wilson ThomasIB 30 Dahrran DiedrickWB 8 John GibsonTE 99 Aaron GollidayLT 58 Dave VolkLG 77 Toniu FonotiC 52 John GarrisonRG 66 Jon RutherfordRT 68 Dan Waldrop
Pos. No. DefenseLRE 57 Chris KelsayNT 55 Jon ClantonDT 56 Jeremy SlechtaRRE 98 Demoine AdamsSLB 43 Scott ShanleMLB 48 Jamie BurrowWLB 9 Mark VedralLCB 3 Keyuo CraverFS 14 Dion BookerROV 27 Willie AmosRCB 5 DeJuan Groce
Reserves1-Thunder Collins, 2-Aaron Terpen-ing, 16-Erwin Swiney, 17-T.J. Hollow-ell, 19-Kyle Larson, 21-Philip Bland, 25-Josh Davis, 26-Josh Brown, 28-Pat Ricketts, 31-Jerrell Pippens, 38-Bar-rett Ruud, 45-Steve Kriewald, 59-Ryon Bingham, 59-Wes Cody, 81-Ben Cor-nelsen, 84-Jon Bowling, 85-Ben Zajicek, 85-Casey Nelson, 86-Kyle Ringenberg, 87-Tracey Wistrom, 89-Troy Has-sebroek, 91-Manaia Brown, 92-Justin Smith, 95-J. P. Wichmann.
RecapFor the first time since 1947, the Rose Bowl Game didn’t host a Big Ten-Pac 10 matchup; instead it hosted the national championship in the BowlChampionship Series. And fans were treated to a truly dominating performance by Miami, which could likely have been crowned the champ at halftime.
The Hurricanes raced out to a 34-0 lead at intermission – the highest point total in any half in Rose Bowl Game history – and finished it off in the second half for a 37-14 win, the national championship, their 22nd straight Division I win and a perfect season. Quarterback Ken Dorsey connected with receiver Andre Johnson for 199 yards and two touchdowns to lead the Hurricane assault. Dorsey, a Northern California native, threw for 362 yards – the fourth-best total in Rose Bowl Game history – and three touchdowns.
The story of the game was an 11-minute stretch in the second quarter when the Hurricanes scored 27 points. That stretch included a 39-yard touchdown run from Clinton Portis, a James Lewis 47-yard interception return for a touchdown, a 21-yard strike from Dorsey to Jeremy Shockey and an 8-yard throw to Johnson before the half.
Nebraska’s biggest bright spot was the 197 yards rushing they amassed inthe game – helped largely by Heisman Trophy winner Eric Crouch’s 114.
The Miami pass defense, however, held him to just five completions for 62 yards.

120
2001 FedEx Orange BowlPro Player Stadium
Miami, Fla.January 3, 2001
Teams ..................................... 1 2 3 4 .....Score#2 Florida State (11-2) ............ 0 0 0 2 ............. 2#1 Oklahoma (13-0) ................ 3 0 3 7 ........... 13Att–76,835Kickoff Time: 8:24; End of Game: 12:01; Total Elapsed Time: 3:37Temperature: 63; Wind: NNW 5mph; Weather: Mostly Cloudy
Scoring SummaryOU–Tim Duncan 27 yd field goal, 7-44 (2:03), 7:16 1stOU–Tim Duncan 42 yd field goal, 7-40 (2:09), 4:24 3rdOU–Quentin Griffin 10 yd run (Tim Duncan kick), 2-15 (0:44), 7:46 4thFSU–Team Safety, 0:55 4th
Final Statistics ................................FSU OU1st Downs ............................................ 14 12 Rushing ......................................... 1 2 Passing ........................................ 12 10 Penalty .......................................... 1 0 Rushes-Yards...................................17-27 36-56Passing Yards ..................................... 274 214Passes Comp-Att-Int ....................25-52-2 25-39-1Total Offense (Plays-Yards) ..........69-301 75-270Punt Returns-Yards .............................4-2 5-35Kickoff Returns-Yards ........................1-2 1-36Punts (Number-Yards) ..................10-447 8-329Fumbles-Lost ......................................3-2 2-1Sacks By: (Number-Yards) ...............2-13 1-2Penalties-Yards ..................................6-38 7-453rd Down Conversions .................1 of 15 7 of 194th Down Conversions ....................0 of 2 0 of 1
Individual StatisticsRushing: FSU–T. Minor 13-20, C. Weinke 4-7. OU–Griffin 11-40, TD. Heupel 13-23, Works 6-16, Littrell 2-8, Mackey 2-5, Team 2-(-36).
Passing: FSU–C. Weinke 25-51-2, 274, Team 0-1-0-0. OU–Heupel 25-39-1 214.
Receiving: FSU–Bell 7-137, T. Minor 5-9, A. Boldin 3-31, Morgan 3-21, Go-lightly 3-15, J Walker 1-25, Gardner 1-16, Sprague 1-14, Franklin 1-6. OU–Griffin 6-23, Mackey 4-23, Works 4-3, Norman 3-49, Woolfolk 3-41, Savage 2-23, T Smith 2-13, Fagan 1-39.
Punting: FSU–K. Cottrell 10-447. OU–J. Ferguson 8-329.
Returns: FSU: Punt-N. Maddox 1-(-3), C. Thomas 3-5. Kick-S. Douglas 1-2, Int-T. Cody 1-19. OU: Punt-J.T. Thatcher 5-33. Kick-A. Savage 1-36. Int-O. Jones 1-0, T. Marshall 1-13.
Field Goals: FSU–B. Cimorelli 0-1 (30 missed). OU–T. Duncan 2-3 (27 FG, 37 missed, 42 FG).
Tackles (Solo-Assist-Total; QBS-Yds; TFL-Yds;)FSU–Brian Allen, (5-7-12; TFL-1-1), Tommy Polley (4-7-11; TFL-1-4), Clevan Thomas (4-4-8; TFL-1-1), Chris Hope (5-2-7), Bradley Jennings (3-3-6; TFL-2-3), Derrick Gibson (3-3-6; TFL-1-3), Jamal Reynolds (2-3-5; QBS-1-7; TFL-1-7), David Warren (3-1-4; QBS-1-7; TFL-1-7), Jeff Womble (2-2-4), Stanford Samuels (1-3-4; TFL-1-35), Malcolm Tatum (3-0-3), Tay Cody (2-0-2), Rufus Brown (2-0-2), Michael Boulware (1-0-1), Matt Munyon (1-0-1), Alonzo Jack-son (1-0-1), Tony Benford (1-0-1), Charron Dorsey (1-0-1), Kevin Emanuel (0-1-1), Darnell Dockett (0-1-1, QBS-1-7, TFL-1-7), Gennaro Jackson (0-1-1).
OU–Michael Thompson (5-2-7), J.T. Thatcher (6-0-6, TFL-1-3), Torrance Mar-shall (5-1-6, TFL-1-5), Ontei Jones (4-1-5), Roy Williams (4-1-5, TFL-1-1), Derrick Strait (3-0-3), Rocky Calmus (3-0-3), Andrew Woolfolk (2-0-2), Jimmy Wilkerson (2-0-2), Bary Holleyman (0-2-2), Ramon Richardson (0-2-2), Kory Klein (1-0-1, QBS-1-2, TFL-1-2), Cory Heinecke (1-0-1), Dan Cody (1-0-1), Seth Littrell (1-0-1), Brandon Everage (0-1-1), Ryan Fisher (0-1-1), Corey Cal-lens (0-1-1).

121
Starting LineupsFlorida State SeminolesPos. No. OffenseSE 87 Robert MorganST 72 Brett WilliamsSG 64 Justin AmmanC 54 Jarad MoonTG 61 Montrae HollandTT 75 Charron DorseyTE 85 Ryan SpragueQB 16 Chris WeinkeTB 23 Travis MinorSLOT 26 Atrews BellFB 43 Randy Golightly
Pos. No. DefenseFS 28 Chris HopeWLB 29 Tommy PolleyMLB 44 B. JenningsSLB 55 Brian AllenRV 6 Derrick GibsonCB 6 Tay CodyRE 58 Jamal ReynoldsDT 45 Darnell DockettNG 91 Jeff WombleLE 99 David WarrenCB 8 Clevan Thomas
Reserves3-Malcolm Tatum, 4-Anquan Boldin, 5-C. Collier, 7-Rufus Brown, 9-Kendyll Pope, 10-S. Samuels, 12-Abdual Howard, 18-Y. Buchanan, 19-Greg Moore, 20-Nick Mad-dox, 21-Talman Gardner, 24-Slade Douglas, 30-Patrick Newton, 31-Bryant McFadden, 32-Jean Jeune, 33-Lemar Parrish, 38-Greg Jones, 39-Chad Maeder, 40-Allen Augus-tin, 42-Jarel Hudson, 46-Gennaro Jack-son, 47-Keith Cottrell, 48-Alonzo Jackson, 49-Brett Cimorelli, 51-Ronald Boldin, 53-D. Darling, 57-Michael Boulware, 59-Charles Howard, 60-Tarlos Thomas, 74-Otis Du-hart, 78-Donald Heaven, 79-Todd Williams, 80-Javon Walker, 81-Nick Franklin, 83-De-vard Darling, 86-Matt Munyon, 89-Brian Sawyer, 90-Kevin Emanuel, 94-O.J. Jackson, 97-Tony Benford.
Oklahoma SoonersPos. No. OffenseSE 22 Quentin GriffinLT 63 Frank RomeroLG 68 Howard DuncanC 59 Bubba BurchamRG 75 Mike SkinnerRT 72 Scott KempenichTE 88 Trent SmithWR 6 Antwone SavageFL 17 Andre WoolfolkRB 47 Renaldo WorksQB 14 Josh Heupel
Pos. No. DefenseRE 92 Corey CallensRT 93 Kory KleinLT 94 Ryan FisherLE 89 Cory HeineckeCB 19 M. ThompsonCB 2 Derrick StraitFS 15 J.T. ThatcherDB 11 Ontei JonesMLB 10 T. MarshallSLB 20 Rocky CalmusSS 38 Roy Williams
Reserves3-Josh Norman, 7- Brandon Everage, 9-Roger Steffan, 12-Curtis Fagan, 13-Da-mian Mackey, 16-Patrick Fletcher, 26-Erin Helvey, 30-Matt Meyhew, 34-Seth Littrell, 36-Danny Cork, 40-Tim Duncan, 45-Jim-my Wilkerson, 54-Teddy Lehman, 57-Der-rick Hurst, 65-Will Mathis, 67-Ben Panter, 80-Dan Cody, 81-Chris Hammons, 83-Jeff Ferguson, 85-Jeremy Hess, 86-Lance Don-ley, 90-Matt Anderson, 91-Ramon Rich-ardson, 96-Jeremy Wilson-Guest, 99-Bary Holleyman.
RecapOklahoma used a smothering defense to shut down the third-ranked Seminoles and Josh Heupel generated enough offense to lead the Sooners to a perfect season and their first national championship in 15 years.
The Seminoles were hoping to become the first team to repeat as national champion since Nebraska in 1994-95. Heupel more than made up for his runner-up finish to Florida State’s Chris Weinke in the Heisman Trophy race by outplaying him in the biggest game of his life.
The left-hander from Aberdeen, S.D., completed 25 of 39 passes for 214 yards and kept the Seminoles off balance all night. Tim Duncan kicked two field goals and Quentin Griffin scored the clinching touchdown on a 10-yard run up the middle with 8:30 to play.
Florida State avoided its first shutout in 12 seasons when Stanford Samuels tackled Oklahoma punter Jeff Ferguson in the end zone for a safety with 55 seconds remaining.
Florida State got the ball back on the ensuing free kick, but Weinke’s 29-yard pass into the end zone was intercepted by Dontei Jones with 16 seconds left and the celebration began. After Heupel took a knee and the clock ran down,
Oklahoma clinched its seventh national title as many in the crowd of 76,835 at Pro Player Stadium cheered. Orange Bowl MVP Torrance Marshall finished with six tackles, one interception and one batted ball.

122
2000 Nokia Sugar BowlLouisiana Superdome
New Orleans, La.January 4, 2000
Teams .........................................1 2 3 4 ......Score#2 Virginia Tech (11-1) ...............7 7 15 0 ............ 29#1 Florida State (12-0) ..............14 14 0 18 ............ 46Att–79,280Kickoff Time: 7:20; End of Game: 11:15; Total Elapsed Time: 3:55Temperature: Indoors; Wind: None; Weather: Indoors
Scoring SummaryFSU-P. Warrick 64 yd pass from C. Weinke (S. Janikowski kick), 4-80 (0:32), 3:22 1st.FSU-J. Chaney 6 yd blocked punt return (S.Janikowski kick), 2:14 1st.VT-And. Davis 49 yd pass from M.Vick (S.Graham kick), 3-80 (1:44), 0:30 1st.FSU-R. Dugans 63 yd pass from C. Weinke (S. Janikowski kick) 5-80 (1:45), 13:45, 2nd.FSU-P. Warrick 59 yd punt return (S. Janikowski kick) 11:40 2nd.VT-M. Vick 3 yd run (S. Graham kick) 7-80 (3:16), 0:37 2nd.VT-S. Graham 23 yd field goal, 5-34 (1:44), 7:54 3rd.VT-A. Kendrick 29 yd run (M. Vick pass failed), 3-36 (0:55), 5:57 3rd.VT-A. Kendrick 6 yd run (M. Vick pass failed), 7-59 (3:14), 2:13 3rd.FSU-R. Dugans 14 yd pass from C. Weinke (P. Warrick pass), 11-85 (4:14), 12:59 4th.FSU-S. Janikowski 32 yd field goal 5-19 (1:32), 10:26 4th.FSU-P. Warrick 43 yd pass from C. Weinke (S. Janikowski kick), 1-43 (0:10), 7:42 4th.
Final Statistics .......................................VT FSU1st Downs .................................................24 15 Rushing............................................ 11 4 Passing .............................................10 10 Penalty ...............................................3 1 Rushes-Yards......................................52-278 23-30Passing Yards ..........................................225 329Passes Comp-Att-Int ........................ 15-29-0 20-34-1Total Offense (Plays-Yards) ...............81-503 57-359Punt Returns-Yards ................................4-88 4-80Kickoff Returns-Yards .........................4-134 4-75Punts (Number-Yards) .........................6-176 7-310 Fumbles-Lost ...........................................3-3 2-0Sacks By: (Number-Yards) ....................4-31 7-37Penalties-Yards .......................................6-65 7-593rd Down Conversions ......................3 of 14 5 of 144th Down Conversions .........................0 of 4 1 of 1
Individual StatisticsRushing: VT–M. Vick 23-97, 1 TD; A. Kendrick 12-69, 2TD; S. Stith 11-68; And. Davis 1-16; E. Johnson 1-12; M. Sorensen 1-7; J. Ferguson 1-5; D. Hawkins 1-4; E. Graham 1-0. FSU–J. Chaney 4-43; T. Minor 9-35; Team 3-(-7); C. Weinke 23-30.
Passing: VT–M. Vick 15-29-0, 225, TD. FSU–C. Weinke 20-34-1, 329, 4TD.
Receiving: VT–And. Davis 7-108, TD; C. Hawkins 2-49; A. Kendrick 2-27; E. John-son 1-23; B. Wynn 1-7; J. Ferguson 1-6; D. Carter 1-5. FSU–P. Warrick 6-163, 2TD; R. Dugans 5-99, 2TD; M. Minnis 2-25; T. Minor 2-23; R. Morgan 2-10; J. Chaney 2-5; A. Boldin 1-4.
Punting: VT–J. Kibble 5-176 (35.2); Team 1-0. FSU–K. Cottrell 7-310 (44.3).
Returns: VT–PUNT-I. Charlton 4-88; KICK-A. Kendrick 2-75; S. Stith, 2-59; INT-A. Midget 1-0. FSU–PUNT-P. Warrick 2-57; J. Chaney 0-6; T. Polley 1-4; R. Durden 1-13; KICK-N. Maddox 1-22; T. Gardner 2-36; G. Stringer 1-17.
Field Goals: VT–Graham, 1-1, 23 FG; FSU–S. Jankiowski 1-1, 32 FG. Tackles (Solo-Assist-Total; QBS-Yds; TFL-Yds;)VT–B. Taylor (7-0-1), N. Sorensen (4-3-7; TFL-2-8), J. Smith (4-0-4; QBS-1-11 TFL-1-11), C. Bradley (3-1-4; QBS-1-7, TFL-2-12), N. Williams (2-2-4; TFL-1-5), M. Hawkes (2-2-4; TFL-1-3), C. Bird (2-1-3; TFL-1-1), J. Engelberger (2-0-2; QBS-1-5, TFL-2-6), R. Whitaker (2-0-2), I Charlton (2-0-2), E. Johnson (1-0-1), D. Pugh (1-0-1, QBS-1-8, TFL-1-8), C. Moore (1-0-1), D. Piniella (1-0-1), L. Suggs (1-0-1), B. Wolfe (1-0-1), L. Austin (1-0-1), D. Carter (1-0-1), W. Ward (1-0-1), A. Midget (1-0-1).
FSU–B. Jennings (6-2-8; QBS-2-11, TFL-2-11), D. Gibson (5-1-6; TFL-1-1); J. Reyn-olds (5-1-6; QBS-3-19, TFL-3-19); T. Rackley (5-1-6), C. Simon (4-1-5, QBS-1-3, TFL-2-5), J. Johnson (4-1-5, TFL-2-3), C. Thomas (3-2-5; TFL-1-6); C. Hope(4-0-4), B. Allen (3-1-4, TFL-1-1), R. Durden (3-0-3), S. Key (3-0-3), T. Cody (3-0-3), R. Seymour (2-1-3; QBS-1-4; TFL-1-4), T. Polley (2-1-3; TFL-1-2), B. Rhodes (1-2-3), A. Howard (2-0-2), M. Tatum (2-0-2), J. Chaney (1-1-2), G. Jackson (1-0-1), T. Frier (1-0-1), J. Jeune (1-0-1), D. Warren (0-1-1; TF-1-1), C. Woods (0-1-1; QBS-1-5; TFL-1-5), K. Cottrell (0-1-1).

123
Lineups and Player Participation Unavailable
RecapPeter Warrick provided the fireworks and Florida State put the exclamation point on its wire-to-wire National Championship season with a convincing 46-29 victory over Virginia Tech.
Warrick set a Sugar Bowl record with 20 points scored as Bobby Bowden posted his first unbeaten season while the Seminoles cemented their claim as the team of the 1990s with their second national title of the decade.
Warrick scored on a 59-yard punt return, a 64-yard touchdown reception, a 43-yard touchdown reception and a two-point conversion. After FSU pulled ahead 28-7 early in the second quarter, the Hokies scored 22 unanswered points behind quarterback Michael Vick’s heroics. But FSU put 18 points on the board in the final quarter to end the Hokies’ Cinderella season.
Vick finished with 97 yards rushing and passed for 225 yards. But the Seminoles sacked him seven times and didn’t give him time to throw, especially in the fourth quarter.

124
1999 Tostitos Fiesta BowlSun Devil Stadium,
Tempe, Ariz. January 4, 1999
Teams .........................................1 2 3 4 ......Score#2 Florida State (11-1) ................0 9 0 7 ............ 16#1 Tennessee (13-0) ....................0 14 0 9 ............ 23Att–80,470Kickoff Time: 6:20; End of Game: 10:06; Total Elapsed Time: 3:46Temperature: 61; Wind: W 3mph; Weather: Humidity 26%
Scoring SummaryUT–Shawn Bryson 4 yd pass from Tee Martin (Jeff Hall kick), 6-88 (2:02), 14:05, 2nd.UT–Dwyane Goodrich 54 yd interception return (Jeff Hall kick), 13:40 2nd.FSU–William McCray 1 yd run (kick failed), 3-3 (1:18), 8:59 2nd.FSU–Sebastian Janikowski 34 yd Field Goal, 10-10 (4:33), 1:17 2nd.UT–Peerless Price 79 yd pass from Tee Martin (kick blocked), 3-80 (1:24), 9:17 4th.UT–Jeff Hall 23 yd Field Goal, 6-22 (2:55), 6:01 4th.FSU–Marcus Outzen 7 yd run (Sebastian Janikowski kick), 5-49 (2:19), 3:42 4th.
Final Statistics .................................... FSU UT1st Downs .................................................13 16 Rushing..............................................9 4 Passing ...............................................4 8 Penalty ...............................................0 4 Rushes-Yards......................................41-108 45-114Passing Yards ..........................................145 278Passes Comp-Att-Int .......................... 9-22-2 11-19-2Total Offense (Plays-Yards) ...............63-253 64-392Punt Returns-Yards ................................2-51 4-34Kickoff Returns-Yards ...........................4-52 3-43Punts (Number-Avg) ...........................9-39.8 5-38.0 Fumbles-Lost ...........................................4-1 3-2Sacks By: (Number-Yards) ......................1-3 4-31Penalties-Yards ...................................12-110 9-553rd Down Conversions ......................4 of 15 1 of 124th Down Conversions .............................1-1 1-1
Individual StatisticsRushing: FSU–Travis Minor 15-83; Peter Warrick 1-11; Marcus Outzen 18-(-1), TD; Laveranues Coles 2-4; William McCray 4-9, TD; Lamarr Glenn 1-2. UT–Travis Henry 19-28; Tee Martin 10-19; Shawn Bryson 3-7; Travis Stephens 13-60.
Passing: FSU–Marcus Outzen 9-22-2, 145. UT–Tee Martin 11-18-2, 278, 2TD.
Receiving: FSU–Travis Minor 1-(-8); Ron Dugans 6-135; Peter Warrick 1-7; William McCray 1-11. UT–Peerless Price 4-199, TD; Travis Henry 1-9; Shawn Bryson 3-34, TD; John Finlayson 1-14; Cedrick Wilson 1-7; Jeremaine Copeland 1-15.
Punting: FSU–Keith Cottrell 9-385 (39.8). UT–David Leaverton 5-190 (38.0).
Returns: FSU–Punt: Peter Warrick 1-51; Reggie Durden 1-0. Kick: Reggie Durden 3-44; William McCray 1-8. Int: Derrick Gibson 1-43; Dexter Jackson 1-26. UT–Punt: Eric Parker 4-34. Kick: Peerless Price 2-43; Int: Dwayne. Goodrich 1-54 TD, Steve Johnson 1-20.
Field Goals: FSU–Sebastian Janikowski, 1-1 (34 FG); UT–Jeff Hall 1-2 (33 missed)(23 FG). Tackles (Solo-Assist-Total; QBS-Yds; TFL-Yds;)FSU–David Warren (1-2-3; TFL-1.5-4), Theon Rackley (0-2-2, TFL-1-1), Brian Allen (2-5-7, QBS-1-3; TFL-1-3); Jerry Johnson (2-3-5, TFL-1-1), Troy Saunders (0-1-1), Derrick Gibson (0-2-2), Clevan Thomas (1-0-1), Dexter Jackson (6-4-10), Mario Ed-wards (1-0-1), Sean Key (1-3-4), Deon Humphrey (1-3-4), Tay Cody (5-1-6), Tommy Polley (1-2-3), Tony Bryant (0-3-3), B. Rhodes (0-3-3), Bradley Jennings (0-1-1), La-mont Green (2-2-4), B. Rhodes (0-2-2), Demetro Stephens (0-2-2), Corey Simon (0-8-8), Roland Seymour (0-3-3), Jeff Chaney (0-1-1), Lamarr Glenn (0-1-1), Jean Jeune (1-1-2), Jamal Reynolds (0-1-1), Robert Morgan (2-0-2), Peter Warrick (1-0-1).
UT–Shaun Ellis (3-3-6; TFL-1-16), Eric Westmoreland (2-2-4; QBS-1-6; TFL-3-17), Jeff Coleman (0-1-1; TFL-0.5-4), Raynoch Thompson (4-2-6; QBS-1-6; TFL-2-9) Dar-win Walker (1-2-3; QBS-1-10; TFL-2-12), Billy Ratliff (3-2-5; QBS-1-9; TFL-1.5-10), Corey Terry (4-1-5; TFL-1-2), Fred White (2-1-3; TFL-1-6), Deon Grant (2-0-2), Tad Golden (2-0-2), Gerald Griffin (1-1-2), Dwayne Goodrich (2-0-2), Al Wilson (4-5-9), Derrick Edmonds (3-0-3), Steve Johnson (2-0-2), Ron Green (1-0-1), Judd Granzow (1-1-2), Matt Goodin (1-0-1), Will Overstreet (1-1-2), Chris Ramseur (1-0-1), David Leaverton (1-0-1), Spencer Riley (1-0-1).

125
Starting LineupsFlorida State SeminolesPos. No. OffenseSE 80 Ron DugansST 76 Ross BrannonSG 68 Jason WhitakerC 57 Eric ThomasTG 78 Donald HeavenTT 60 Tarlos ThomasTE 84 Myron JacksonQB 14 Marcus OutzenTB 23 Travis MinorFB 31 Lamarr GlennFL 9 Peter Warrick
Pos. No. DefenseRE 40 Tony BryantDT 92 Jerry JohnsonNG 53 Corey SimonLE 56 Roland SeymourWLB 45 Lamont GreenMLB 52 Demetro StephensSLB 29 Tommy PolleyLCB 15 Mario EdwardsRCB 27 Tay CodyFS 11 Dexter JacksonRV 6 Derrick Gibson
Reserves1-Reggie Durden, 4-Troy Saunders, 5-The-on Rackley, 7-Laveranues Coles, 8-Cleven Thomas, 11-Jared Jones, 13-Marvin Minn-is, 18-Sean Key, 19-P Henderson, 21-Deon Humphrey, 24-Jeff Chaney, 28-Chris Hope, 32-Jean Jeune, 35-Todd Frier, 36-William McCray, 38-Sebastian Jan-ikowski, 39-Ryan Sprague, 43-Billy Rho-des, 44-Bradley Jennings, 47-Keith Cot-trell, 48-Bryne Malone, 49-Bobby Rhodes, 54-Ben Waldrop, 55-Brian Allen, 58-Jamal Reynolds, 64-Justin Amman, 71-Jerry Car-michael, 73-Clay Ingram, 77-Jeremy Brett, 81-Nick Franklin, 82-Patrick Hughes, 86-Germaine Stringer, 87-Robert Mor-gan, 91-Randy Wilkins, 93-Chris Walker, 99-David Warren.
Tennessee VolunteersPos. No. OffenseWR 37 Peerless PriceLT 67 Chad CliftonLG 75 Mercedes HamiltonC 68 Spencer RileyRG 52 Cosey ColemanRT 72 Jarvis ReadoTE 82 Eric DioguQB 17 Tee MartinTB 20 Travis HenryFB 24 Shawn BrysonWR 14 Cedrick Wilson
Pos. No. DefenseLE 93 Shaun EllisLT 40 Billy RatliffRT 58 Darwin WalkerRE 22 Corey TerryLLB 42 Eric WestmorelandMLB 27 Al WilsonRLB 46 Raynoch ThompsonLCB 34 Steve JohnsonRCB 23 Dwayne GoodrichSS 18 Gerald GriffinFS 7 Deon Grant
Reserves2-Fred White, 3-Willie Miles, 4-Jeff Hall, 6-Jeremaine Copeland, 10-Benson Scott, 11-Bobby Graham, 12-Teddy Gaines, 13-Tad Golden, 15-Tim Sewell, 21-Phillip Crosby, 25-Travis Stephens, 28-Dominique Stevenson, 29-Mikki Allen, 30-Andre Lott, 33-Derrick Ed-monds, 36-Maurice Fitzgerald, 38-Roger Alexander, 41- Chris Ramseur, 43-David Leaverton, 45-Will Bartho-lomew, 47-Matt Blankenship, 51-Kevin Gregory, 53-Toby Champion, 54-Diron Robinson, 55-Ron Green, 56-Bernard Jackson, 59-Judd Granzow, 60-Matt Goodin, 69-Ethan Massa, 77-Josh Tucker, 80-Eric Parker, 83-Tyrone Gra-ham, 84-Neil Johnson, 86-Kevin Taylor, 87-David Martin, 90-Will Overstreet, 92-Jeff Coleman, 96-John Finlayson, 99-DeAngelo Lloyd.
RecapPeerless Price handed Tennessee its first national championship since 1951, setting up one score with a 76-yard catch and breaking open the game with a 79-yard touchdown reception in a 23-16 victory overFlorida State in the Fiesta Bowl.
Overshadowed by the attention given Florida State standout Peter Warrick, Price truly was peerless. He made four catches for 199 yards. Warrick caught just one pass for seven yards, making his only impact with a long punt return in the first half.
The game was a defensive war until early in the final period when Price hauled in Tee Martin’s rainbow, cruising the final 40 yards to give the Vols a 20-9 lead with 9:17 remaining. A sack and forced fumble by Shaun Ellis on the next play from scrimmage set up a 23-yard field goal that extended the lead to 23-9.
The Volunteers were able to stifle the attack of Florida State despite injuries to safety Deon Grant, defensive tackle Ron Green and cornerback Dwayne Goodrich,who had a 54-yard interception return for a touchdown in the second quarter.
Despite a rash of penalties, the Seminoles responded with a five-play, 49-yard drive capped by Outzen’s seven-yard scoring run with 3:42 left. A fourth-down screen pass from Martin to fullback Shawn Bryson produced a first down at the 10 and appeared to seal the win for the Volunteers. But a Tennessee fumble gave FSU hope. With 89 seconds and three timeouts left, Outzen threw a long pass intended for Laveranues Coles, but Steve Johnson intercepted and Tennessee ran out the clock, giving coach Phillip Fulmer his first title.

126
BCS Selections History
1998-99 GamesTeams qualifying automatically by winning conference championships: ACC – Florida State Big East – Syracuse Big Ten – Wisconsin Big 12 – Texas A&M Pac-10 – UCLA Southeastern – Tennessee
Other teams qualifying automatically None
Other teams eligible for at-large selection 3. Kansas State 4. Ohio State 7. Arizona 8. Florida 10. Tulane 11. Nebraska 12. Virginia
Step-by-Step Process 1. The Fiesta Bowl was the championship game — No. 1 Tennessee
and No. 2 Florida State. 2. The Sugar Bowl chose Ohio State to replace Tennessee. 3. The Orange Bowl chose Florida to replace Florida State. 4. The Sugar Bowl chose Texas A&M. 5. The Orange Bowl chose Syracuse.
PairingsFiesta Bowl (championship game) – Tennessee vs. Florida StateSugar Bowl – Ohio State vs. Texas A&MOrange Bowl – Florida vs. SyracuseRose Bowl –UCLA vs. Wisconsin
(Note: Before selection Sunday, the Orange Bowl had the option to choose either the ACC or Big East champion to be its host team; it selected the ACC.)

127
1999-2000 GamesTeams qualifying automatically by winning conference championships: ACC – Florida State Big East – Virginia Tech Big Ten – Wisconsin Big 12 – Nebraska (defeated Texas in championship game) Pac-10 – Stanford Southeastern – Alabama (defeated Florida in championship game)
Other teams qualifying automatically None
Other teams eligible for at-large selection 5. Tennessee 6. Kansas State 8. Michigan 9. Michigan State 10. Florida 11. Penn State 12. Marshall
Step-by-Step Process 1. Sugar Bowl was the championship game—No. 1 Florida State and
No. 2 Virginia Tech 2. Fiesta Bowl had Big 12 champion Nebraska 3. Rose Bowl had Big Ten champion Wisconsin and Pac-10 cham-
pion Stanford 4. Orange Bowl selected Alabama as a replacement team (Either
Florida State or Virginia Tech would have hosted the Orange Bowl, so it made no difference which team was the technical host. The Orange Bowl was entitled to only one replacement pick under the policy at the time)
5. Fiesta Bowl selected Tennessee 6. Orange Bowl selected Michigan.
PairingsSugar Bowl (championship game) – Florida State vs. Virginia TechFiesta Bowl – Nebraska vs. TennesseeOrange Bowl – Michigan vs. AlabamaRose Bowl – Wisconsin vs. Stanford
(Note: Before selection Sunday, the Orange Bowl had the option to choose either the ACC or Big East champion to be its host team; it selected the ACC.)

128
2000-01 gamesTeams qualifying automatically by winning conference championships: ACC – Florida State Big East – Miami Big Ten – Purdue Big 12 – Oklahoma (defeated Kansas State in championship game) Pac-10 – Washington Southeastern – Florida (defeated Auburn in championship game)
Other teams qualifying automatically None
Other teams eligible for at-large selection 5. Virginia Tech 6. Oregon State 8. Nebraska 9. Kansas State 10. Oregon 11. Notre Dame 12. Texas
Step-by-Step Process 1. Orange Bowl was championship game, No. 1 Oklahoma and No. 2
Florida State. 2. Rose Bowl had Pac-10 champion Washington and Big Ten cham-
pion Purdue 3. Sugar Bowl had SEC champion Florida 4. Fiesta Bowl selected Notre Dame to replace Oklahoma 5. Sugar Bowl selected Miami 6. Fiesta Bowl selected Oregon State
PairingsOrange Bowl (championship game) – Oklahoma vs. Florida StateSugar Bowl – Miami vs. FloridaFiesta Bowl – Oregon State vs. Notre DameRose Bowl – Washington vs. Purdue

129
2001-02 GamesTeams qualifying automatically by winning conference championships: ACC – Maryland Big East – Miami Big Ten – Illinois Big 12 - Colorado * Pac-10 – Oregon Southeastern – LSU (defeated Tennessee in championship game)
Other teams qualifying automatically No. 2 Nebraska * (qualified for championship game) No. 3 Colorado * (3-4 rule)
* Although Colorado was the Big 12 champion, Nebraska technically earned the Big 12’s automatic berth because it qualified for the national championship game.
Other teams eligible for at-large selection 5. Florida 6. Tennessee 9. Stanford 12. Washington State
Step-by-Step Process 1. Rose Bowl was championship game – Miami vs. Nebraska 2. Sugar Bowl had SEC champion LSU 3. Orange Bowl selected Florida to replace Big East champion Mi-
ami (Big East was slated to host the Orange Bowl) 4. Fiesta Bowl selected Colorado 5. Fiesta Bowl selected Oregon (All three bowls had previously
exercised a selection priority. Therefore, the Fiesta Bowl got first priority and selected Oregon.)
6. (The Orange Bowl and Sugar Bowl listed the preferences; the Orange Bowl preferred Maryland and the Sugar Bowl preferred Illinois.)
PairingsRose Bowl (championship game) – Miami vs. NebraskaFiesta Bowl – Oregon vs. ColoradoOrange Bowl – Florida vs. MarylandSugar Bowl – LSU vs. Illinois
(Note: Before selection Sunday, the Orange Bowl had the option to choose either the ACC or Big East champion to be its host team; it selected the Big East.)

130
2002-03 GamesTeams qualifying automatically by winning conference championships: ACC – Florida State Big East – Miami Big Ten – Ohio State Big 12 – Oklahoma (defeated Colorado in championship game) Pac-10 – Washington State Southeastern – Georgia (defeated Arkansas in championship game)
Other team qualifying automatically No. 4 Southern Cal (3-4 rule)
Other teams eligible for at-large selection 5. Iowa 7. Oklahoma 8. Kansas State 9. Notre Dame 10. Texas 11. Michigan 12. Penn State
Step-by-Step Process 1. Fiesta was the championship game, No. 1 Miami and No. 2 Ohio
State 2. Rose Bowl had Pac-10 champion Washington State 3. Sugar Bowl had SEC champion Georgia 4. Orange Bowl selected Iowa to replace Miami 5. Rose Bowl selected Oklahoma to replace Ohio State 6. Orange Bowl exercised its right of priority and selected USC 7. Sugar Bowl selected Florida State
PairingsFiesta Bowl (championship game) – Miami vs. Ohio StateOrange Bowl – USC vs. IowaSugar Bowl – Georgia vs. Florida StateRose Bowl – Oklahoma vs. Washington State

131
2003-04 gamesTeams qualifying automatically by winning conference championships: ACC – Florida State Big East – Miami Big Ten – Michigan Big 12 – Kansas State (defeated Oklahoma in championship game) Pac-10 – USC Southeastern – LSU (defeated Georgia in championship game)
Other teams qualifying automatically No. 1 Oklahoma
Other teams eligible for at-large selection 5. Ohio State 8. Tennessee 11. Miami Ohio 12. Georgia
Step-by-Step Process 1. Sugar Bowl had Oklahoma and LSU 2. Rose Bowl had USC and Michigan 3. Fiesta Bowl had Kansas State 4. Orange Bowl selected the Big East as its host conference; thus it
had Miami. 5. Fiesta Bowl and Orange Bowl then listed the top three teams they
wished to select:
Fiesta Bowl listed 1. Ohio State, 2. Florida State, 3. Tennessee; Orange Bowl listed 1. Ohio State; 2. Florida State, 3. Georgia
Because the Orange Bowl had exercised its right to priority the previous year, the Fiesta Bowl had priority and was entitled to its selection of Ohio State
6. Orange Bowl was entitled to its selection of Florida State
(It was noted that the Sugar Bowl would have selection priority next year if such a situation arose. If the Sugar Bowl used its right to selection priority next year, the Orange Bowl would have the first selection right again, if necessary, the following year.)
PairingsSugar Bowl (championship game) – Oklahoma vs. LSUFiesta Bowl – Ohio State vs. Kansas StateOrange Bowl – Miami vs. Florida StateRose Bowl – USC vs. Michigan
(Note: Before selection Sunday, the Orange Bowl had the option to choose either the ACC or Big East champion to be its host team; it selected the Big East.)

132
2004-05 GamesTeams qualifying automatically by winning conference championships: ACC – Virginia Tech Big East – Pittsburgh Big Ten – Michigan Big 12 – Oklahoma (defeated Colorado in championship game) Pac-10 – USC Southeastern – Auburn (defeated Tennessee in championship game)
Other teams qualifying automatically No. 4 Texas No. 6 Utah
Other teams eligible for at-large selection by the bowls None
Step-by-Step Process 1. Orange Bowl was championship game – No. 1 USC and No. 2
Oklahoma. 2. Rose Bowl had Big Ten champion Michigan 3. Sugar Bowl had SEC champion Auburn 4. Rose Bowl took Texas to replace USC after the Fiesta Bowl con-
sented to release Texas 5. Fiesta Bowl selected Utah to replace Oklahoma 6. Sugar Bowl selected Virginia Tech 7. Fiesta Bowl selected Pittsburgh
PairingsOrange Bowl (championship game) – USC vs. OklahomaFiesta Bowl – Utah vs. PittsburghSugar Bowl – Auburn vs. Virginia TechRose Bowl – Texas vs. Michigan

133
2005-06 GamesTeams qualifying automatically by winning conference championships: ACC—Florida State (defeated Virginia Tech in championship game) Big East—West Virginia Big Ten—Penn State (tied with Ohio State but won head-to-head) Big 12—Texas (defeated Colorado in championship gamed) Pacific-10—USC Southeastern—Georgia (defeated LSU in championship game)
Others qualifying automatically: No. 4 Ohio State (3-4 rule) No. 6 Notre Dame
Other teams eligible for at-large selection by the bowlsNone; all slots were filled by the six conference champions with annual automatic qualification and the two other teams qualifying automatically for this season.
Step-by-Step Process 1. Rose was the championship game – USC vs. Texas 2. Sugar had SEC champion Georgia 3. Orange had ACC champion Florida State 4. Fiesta selected Notre Dame to replace Texas as its host team 5. Orange selected Penn State 6. Fiesta selected Ohio State 7. Sugar selected West Virginia
PairingsRose (championship game) – USC vs TexasSugar – West Virginia vs. GeorgiaOrange – Penn State vs. Florida StateFiesta – Ohio State vs. Notre Dame
(Note: Before selection Sunday, the Orange Bowl had the option to choose either the ACC or Big East champion to be its host team; it selected the ACC.)

134
2006-07 GamesTeams qualifying automatically by winning conference championships: ACC – Wake Forest (defeated Georgia Tech in championship game) Big East – Louisville Big Ten – Ohio State Big 12 – Oklahoma (defeated Nebraska in championship game) Pac-10 – USC Southeastern – Florida (defeated Arkansas in championship game)
Other teams qualifying automatically: No. 3 Michigan (3-4 rule) No. 8 Boise State
Eligible for at-large selection: 4. LSU 9. Auburn 11. Notre Dame 12. Arkansas 13. West Virginia
Step-by-Step Process 1. BCS National Championship Game in Glendale – No. 1 Ohio
State vs. No. 2 Florida 2. Rose selected Michigan to replace Ohio State and play Pac-10
champ USC 3. Sugar selected at-large team LSU to replace Florida 4. Sugar (first in rotation) selected at large team Notre Dame 5. Orange (second in rotation) selected Louisville 6. Fiesta (third in rotation) selected Boise State
PairingsFiesta Bowl – Boise State vs. OklahomaRose Bowl – Michigan vs. Southern CalOrange Bowl – Louisville vs. Wake ForestSugar Bowl – Notre Dame vs. LSUNational Championship Game – Florida vs. Ohio State

135
2007-08 GamesTeams qualifying automatically by winning conference championships: ACC – Virginia Tech (defeated Boston College in championship game) Big East – West Virginia Big Ten – Ohio State Big 12 – Oklahoma (defeated Missouri in championship game) Pac-10 – USC Southeastern – LSU (defeated Tennessee in championship game)
Other teams qualifying automatically: No. 10 Hawaii
Eligible for at-large selection: 5. Georgia 6. Missouri 8. Kansas 11. Arizona State 12. Florida 13. Illinois 14. Boston College
Step-by-Step Process 1. BCS National Championship Game in New Orleans: No. 1 Ohio
State vs. No. 2 LSU 2. Rose selected Illinois to replace Ohio State and play Pac-10 champ
USC 3. Sugar selected at-large team Georgia to replace LSU 4. Orange (first in rotation) selected at large team Kansas 5. Fiesta (second in rotation) selected West Virginia 6. Sugar (third in rotation) selected Hawaii
PairingsFiesta Bowl – West Virginia vs. OklahomaRose Bowl – Illinois vs. USCOrange Bowl – Kansas vs. Virginia TechSugar Bowl – Hawaii vs. GeorgiaNational Championship Game – LSU vs. Ohio State

136
2008-09 GamesTeams qualifying automatically by winning conference championships: ACC – Virginia Tech (defeated Boston College in championship game) Big East – Cincinnati Big Ten – Penn State Big 12 – Oklahoma (defeated Missouri in championship game) Pac-10 – USC Southeastern – Florida (defeated Alabama in championship game)
Other teams qualifying automatically: No. 3 Texas (3-4 rule) No. 6 Utah
Eligible for at-large selection: 4. Alabama 9. Boise State 10. Ohio State 11. Texas Christian 14. Georgia Tech Step-by-step process 1. BCS National Championship Game in Miami, No. 1 Oklahoma vs.
No. 2 Florida 2. Fiesta selected Texas to replace No. 1 Oklahoma 3. Sugar selected Alabama to replace No. 2 Florida 4. Fiesta (first in rotation) selected at-large team Ohio State 5. Sugar (second in rotation) selected AQ Utah 6. Orange (third in rotation) selected AQ Cincinnati
PairingsFiesta Bowl – Ohio State vs. TexasRose Bowl – Penn State vs. Southern CalOrange Bowl – Cincinnati vs. Virginia TechSugar Bowl – Utah vs. AlabamaNational Championship Game – Florida vs. Oklahoma

137
2009-10 GamesTeams qualifying automatically by winning conference championships: ACC – Georgia Tech (defeated Clemson in championship game) Big East – Cincinnati Big Ten – Ohio State Big 12 – Texas (defeated Nebraska in championship game) Pac-10 – Oregon Southeastern – Alabama (defeated Florida in championship game)
Other teams qualifying automatically: No. 4 TCU
Eligible for at-large selection: 5. Florida 6. Boise State 10. Iowa 11. Virginia Tech 13. Penn State 14. BYU Step-by-step process 1. BCS National Championship Game in Pasadena, No. 1 Alabama
vs. No. 2 Texas 2. Sugar selected Florida to replace No. 1 Alabama 3. Fiesta selected TCU to replace No. 2 Texas 4. Orange (first in rotation) selected at-large Iowa 5. Fiesta (second in rotation) selected at-large Boise State 6. Sugar (third in rotation) selected AQ Cincinnati
PairingsFiesta Bowl – Boise State vs. TCURose Bowl – Ohio State vs. OregonOrange Bowl – Iowa vs. Georgia TechSugar Bowl – Cincinnati vs. FloridaNational Championship Game – Texas vs. Alabama

138
2010-11 GamesTeams qualifying automatically by winning conference championships: ACC – Virginia Tech (defeated Florida State in championship game) Big East – Connecticut Big Ten – Wisconsin Big 12 – Oklahoma (defeated Nebraska in championship game) Pac-10 – Oregon Southeastern – Auburn (defeated South Carolina in championship game)
Other teams qualifying automatically: No. 3 TCU No. 4 Stanford
Eligible for at-large selection: 6. Ohio State 8. Arkansas 9. Michigan State 10. Boise State 11. LSU 12. Missouri 14. Oklahoma State Step-by-step process 1. BCS National Championship Game in Glendale, No. 1 Auburn vs.
No. 2 Oregon 2. Sugar selected Arkansas to replace No. 1 Auburn 3. Rose selected TCU to replace No. 2 Oregon 4. Sugar (first in rotation) selected Ohio State 5. Orange (second in rotation) selected Stanford 6. Fiesta (third in rotation) selected Connecticut
PairingsFiesta Bowl – Connecticut vs. OklahomaRose Bowl – TCU vs. WisconsinOrange Bowl – Virginia Tech vs. StanfordSugar Bowl – Arkansas vs. Ohio StateNational Championship Game – Auburn vs. Oregon

139
2011-12 GamesTeams qualifying automatically by winning conference championships: ACC – Clemson (defeated Virginia Tech in championship game) Big East – West Virginia Big Ten – Wisconsin (defeated Michigan State in championship game) Big 12 – Oklahoma State Pac-10 – Oregon (defeated UCLA in championship game) Southeastern – LSU (defeated Georgia in championship game)
Other teams qualifying automatically: No. 4 Stanford
Eligible for at-large selection: 2. Alabama 7. Boise State 8. Kansas State 11. Virginia Tech 12. Baylor 13. Michigan 14. Oklahoma Step-by-step process 1. BCS National Championship Game in New Orleans, No. 1 LSU
vs. No. 2 Alabama 2. Sugar selected Michigan to replace No. 1 LSU 3. Fiesta (first in rotation) selected Stanford 4. Sugar (second in rotation) selected Virginia Tech 5. Orange (third in rotation) selected West Virginia
PairingsFiesta Bowl – Oklahoma State vs. StanfordRose Bowl – Oregon vs. WisconsinOrange Bowl – Clemson vs. West VirginiaSugar Bowl – Michigan vs. Virginia TechNational Championship Game – Alabama vs. LSU

140
2012-13 GamesTeams qualifying automatically by winning conference champion-ships: ACC – 12, Florida State (defeated Georgia Tech in championship game) Big East – 21. Louisville Big Ten – NR Wisconsin (defeated Nebraska in championship game) Big 12 – 5, Kansas State Pac-12 – 6, Stanford (defeated UCLA in championship game) Southeastern – 2. Alabama (defeated Georgia in championship game)
Other teams qualifying automatically: No. 1 Notre Dame (in championship game) No. 3 Florida (3-4 rule) No. 15 Northern Illinois (ranked higher than the champions of two AQ conferences)
Eligible for at-large selection: 4. Oregon 11. Oklahoma13. Oregon State14. Clemson Step-by-step process 1. BCS National Championship Game in Miami (No. 1 Notre Dame vs. No. 2 Alabama) 2. Sugar selected No. 3 AQ Florida to replace Alabama 3. Fiesta (first in rotation) selected No. 4 at-large Oregon 4. Sugar (second in rotation) selected No. 21 AQ Louisville 5. Orange (third in rotation) selected No. 15 AQ Northern Illinois
PairingsFiesta Bowl – Oregon vs. Kansas State Rose Bowl – Wisconsin vs. Stanford Orange Bowl – Northern Illinois vs. Florida State Sugar Bowl – Louisville vs. Florida National Championship Game – Alabama vs. Notre Dame

141
BCS INDIVIDUAL RECORDS(Through the 2013 Games)
TOTAL OFFENSEMost Total Yards533–Tim Tebow, Florida vs. Cincinnati, Sugar, Jan. 1, 2010 (482 pass, 51 rush)467–Vince Young, Texas vs. USC, Rose, Jan. 4, 2006 (267 pass, 200 rush)429–Mark Sanchez, USC vs. Penn State, Rose, Jan. 1, 2009 (413 pass, 16 rush).427–Rohan Davey, LSU vs. Illinois, Sugar, Jan. 2, 2002 (444 pass, minus 17 rush)426–Landry Jones, Oklahoma vs. Connecticut, Fiesta, Jan. 1, 2011 (429 pass, minus 3 rush)
Most Total Yards, Championship Game467–Vince Young, Texas vs. USC, Rose, Jan. 4, 2006 (267 pass, 200 rush)362–Ken Dorsey, Miami (Fla.) vs. Nebraska, Rose, Jan. 3, 2002 (362 pass)357–Darron Thomas, Oregon vs. Auburn (Glendale), Jan. 10, 2011 (363 pass, minus 6 rush)340–Tim Tebow, Florida vs. Oklahoma (Miami), Jan. 8, 2009 (231 pass, 109 rush)329–Cam Newton, Auburn vs. Oregon, (Glendale), Jan. 10, 2011 (265 pass, 64 rush)
Most Total Yards, All Bowl Games594–Ty Detmer, Brigham Young vs. Penn State, Holiday, 1989 (576 pass, 18 rush)
Most Touchdowns Responsible For (TDs scored and passed for)7–Geno Smith, West Virginia vs. Clemson, Orange, Jan. 4, 2012 (1 rush, 6 pass)5–Mark Sanchez, USC vs. Penn State, Rose, Jan. 1, 2009 (1 rush, 4 pass)5–Vince Young, Texas vs. Michigan, Rose, Jan. 1, 2005 (4 rush, 1 pass)5–*Matt Leinart, USC vs. Oklahoma, Orange, Jan. 1, 2005 (5 pass)
Most Touchdowns Responsible For, Championship Game5–*Matt Leinart, USC vs. Oklahoma, Orange, Jan. 1, 2005 (5 pass)
Most Touchdowns Responsible For, All Bowl Games7--Geno Smith, West Virginia vs. Clemson, Orange, Jan. 4, 2012 (1 rush, 6 pass)

142
RUSHINGMost Rushing Attempts35–Stefan Taylor, Stanford vs. Oklahoma State (ot), Fiesta, Jan. 2, 2012 (177 yards)34–Ron Dayne, Wisconsin vs. Stanford, Rose, Jan. 1, 2000 (200 yards)32–Montee Ball, Wisconsin vs. Oregon, Rose, Jan. 2, 2012 (177 yards)30--Kenjon Barner, Oregon vs. Kansas State, Fiesta, Jan. 3, 2013 (152 yards)30–Quentin Griffin, Oklahoma vs. Washington State, Rose, Jan. 1, 2003 (144 yards)
Most Rushing Attempts, Championship Game25–Adrian Peterson, Oklahoma vs. USC, Orange, Jan. 4, 2005 (82 yards)23–Maurice Clarett, Ohio State vs. Miami (Fla.) (2ot), Fiesta, Jan. 3, 2003 (47 yards)22–Michael Dyer, Auburn vs. Oregon (Glendale), Jan. 10, 2011 (143 yards)22–Cam Newton, Auburn vs. Oregon (Glendale), Jan. 10, 2011 (64 yards)22–Mark Ingram, Alabama vs. Texas (Pasadena), Jan. 7, 2010 (116 yards)22–Tim Tebow, Florida vs. Oklahoma (Miami), Jan. 8, 2009 (109 yards)22–Chris Brown, Oklahoma vs. Florida (Miami), Jan. 8, 2009 (110 yards)22–Eric Crouch, Nebraska vs. Miami (Fla.), Rose, Jan. 3, 2002 (114 yards)
Most Rushing Attempts, All Bowl Games46–Ron Jackson, Tulsa vs. San Diego State, Freedom, 1991 (211 yards)
Most Rushing Yards246–Ron Dayne, Wisconsin vs. UCLA, Rose, Jan. 1, 1999 (27 attempts)204–Steve Slaton, West Virginia vs. Georgia, Sugar, Jan. 2, 2006 (26 attempts)200–Ron Dayne, Wisconsin vs. Stanford, Rose, Jan. 1, 2000 (34 attempts)200–Vince Young, Texas vs. USC, Rose, Jan. 4, 2006 (19 attempts)192–Vince Young, Texas vs. Michigan, Rose, Jan. 1, 2005 (21 attempts)
Most Rushing Yards, Championship Game200–Vince Young, Texas vs. USC, Rose, Jan. 4, 2006 (19 attempts)146–Chris Wells, Ohio State vs. LSU (New Orleans), Jan. 7, 2008 (20 attempts)143–Michael Dyer, Auburn vs. Oregon (Glendale), Jan. 10, 2011 (22 attempts)140--Eddie Lacy, Alabama vs. Notre Dame (Miami), Jan. 7, 2013 (20 attempts)124–*LenDale White, USC vs. Texas, Rose, Jan. 4, 2006 (20 attempts)
Most Rushing Yards, All Bowl Games307–P.J. Daniels, Georgia Tech vs. Tulsa, Humanitarian, 2004 (31 attempts)
Most Rushing Yards By A Quarterback200–Vince Young, Texas vs. USC, Rose, Jan. 4, 2006 (19 attempts)192–Vince Young, Texas vs. Michigan, Rose, Jan. 1, 2005 (21 attempts)150–Patrick White, West Virginia vs. Oklahoma, Fiesta, Jan. 2, 2008 (20 attempts)115–Terelle Pryor, Ohio State vs. Arkansas, Sugar, Jan. 4, 2011 (15 attempts)114–Eric Crouch, Nebraska vs. Miami (Fla.), Rose, Jan. 3, 2002 (22 attempts)

143
Most Rushing Yards By A Quarterback, Championship Game200–Vince Young, Texas vs. USC, Rose, Jan. 4, 2006 (19 attempts)114–Eric Crouch, Nebraska vs. Miami (Fla.), Rose, Jan. 3, 2002 (22 attempts)109–Tim Tebow, Florida vs. Oklahoma (Miami), Jan. 8, 2009 (22 attempts)97–Michael Vick, Virginia Tech vs. Florida State, Sugar, Jan. 4, 2000 (23 attempts)81–Craig Krenzel, Ohio State vs. Miami (Fla.) (2ot), Fiesta, Jan. 3, 2003 (19 attempts)
Most Rushing Yards By A Quarterback, All Bowl Games200–Vince Young, Texas vs. USC, Rose, Jan. 4, 2006 (19 attempts)
Most Rushing Yards Per Attempt (min. 15 attempts)10.53–Vince Young, Texas vs. USC, Jan. 4, 2006 (19 for 200)9.31–Ernest Graham, Florida vs. Maryland, Orange, Jan. 2, 2002 (16 for 149)9.14–Vince Young, Texas vs. Michigan, Rose, Jan. 1, 2005 (21 for 192)9.11–Ron Dayne, Wisconsin vs. UCLA, Rose, Jan. 1, 1999 (27 for 246)9.07–Ernest Graham, Florida vs. Miami (Fla.), Sugar, Jan. 2, 2001 (15 for 136)
Most Rushing Yards Per Attempt, Championship Game (min. 15 attempts)10.53–Vince Young, Texas vs. USC, Rose, Jan. 4, 2006 (19 for 200)7.87–*LenDale White, USC vs. Oklahoma, Orange, Jan. 4, 2005 (15 for 118)7.31–Justin Vincent, LSU vs. Oklahoma, Rose, Jan. 4, 2004 (16 for 117)7.30–Chris Wells, Ohio State vs. LSU (New Orleans), Jan. 7, 2008 (20 for 146)7.00--Eddie Lacy, Alabama vs. Notre Dame (Miami), Jan. 7, 2013 (20 for 140)
Most Rushing Yards Per Attempts, All Bowl Games15.67–Tyrone Wheatley, Michigan vs. Washington, Rose, 1993
Most Rushing Touchdowns4–Vince Young, Texas vs. Michigan, Rose, Jan. 1, 2005 4–Domanick Davis, LSU vs. Illinois, Sugar, Jan. 2, 2002 4–Ron Dayne, Wisconsin vs. UCLA, Rose, Jan. 1, 19993–*LenDale White, USC vs. Texas, Rose, Jan. 4, 20063–Vince Young, Texas vs. USC, Rose, Jan. 4, 20063–Darius Walker, Notre Dame vs. Ohio State, Fiesta, Jan. 2, 20063–Steve Slaton, West Virginia vs. Georgia, Sugar, Jan. 2, 20063–Shaun Alexander, Alabama vs. Michigan (ot), Orange, Jan. 1, 2000
Most Rushing Touchdowns, Championship Game3–Vince Young, Texas vs. USC, Rose, Jan. 4, 20063–*LenDale White, USC vs. Texas, Rose, Jan. 4, 20062–Mark Ingram, Alabama vs. Texas (Pasadena), Jan. 7, 20102–Trent Richardson, Alabama vs. Texas (Pasadena), Jan. 7, 20102–*LenDale White, USC vs. Oklahoma, Orange, Jan. 4, 2005 2–Kejuan Jones, Oklahoma vs. LSU, Sugar, Jan. 4, 20042–Maurice Clarett, Ohio State vs. Miami (Fla.) (2 ot), Fiesta, Jan. 3, 20032–Craig Krenzel, Ohio State vs. Miami (Fla.) (2 ot), Fiesta, Jan. 3, 20032–Andre Kendrick, Virginia Tech vs. Florida State, Sugar, Jan. 4, 2000
Most Rushing Touchdowns, All Bowl Games5–Barry Sanders, Oklahoma State vs. Wyoming, Holiday, 19885–Neil Snow, Michigan vs. Stanford, Rose, 1902

144
PASSINGMost Pass Attempts58–Colt McCoy, Texas vs. Ohio State, Fiesta, Jan. 5, 2009 (41 completions)53–Rohan Davey, LSU vs. Illinois, Sugar, Jan. 2, 2002 (31 completions)52–Ell Roberson, Kansas State vs. Ohio State, Fiesta, Jan. 2, 2004 (20 completions) 51–Chris Weinke, Florida State vs. Oklahoma, Orange, Jan. 3, 2001 (25 completions)49–Landry Jones, Oklahoma vs. Connecticut, Fiesta, Jan. 1, 2011 (34 completions)
Most Pass Attempts, Championship Game51–Chris Weinke, Florida St. vs. Oklahoma, Orange, Jan. 3, 2001 (25 completions)43–Ken Dorsey, Miami (Fla.) vs. Ohio State (2 ot), Fiesta, Jan. 3, 2003 (28 completions)41–Sam Bradford, Oklahoma vs. Florida (Miami), Jan. 8, 2009 (26 completions)40–Darron Thomas, Oregon vs. Auburn (Glendale), Jan. 10, 2011 (27 completions)40–Garrett Gilbert, Texas vs. Alabama (Pasadena), Jan. 7, 2010 (15 completions)40–*Matt Leinart, USC vs. Texas, Rose, Jan. 4, 2006 (29 completions) 40–Vince Young, Texas vs. USC, Rose, Jan. 4, 2006 (30 completions)
Most Pass Attempts, All Bowl Games74–Kyle Orton, Purdue vs. Washington State, Sun, 2001 (38 completions)
Most Pass Completions41–Colt McCoy, Texas vs. Ohio State, Fiesta, Jan. 5, 2009 (58 attempts)34–Landry Jones, Oklahoma vs. Connecticut, Fiesta, Jan. 1, 2011 (49 attempts)34–Tom Brady, Michigan vs. Alabama (ot), Orange, Jan. 1, 2000 (46 attempts)31–Geno Smith, West Virginia vs. Clemson, Orange, Jan. 4, 2012 (42 attempts)31–Tim Tebow, Florida vs. Cincinnati, Sugar, Jan. 1, 2010 (35 attempts)31–Rohan Davey, LSU vs. Illinois, Sugar, Jan.2, 2002 (53 attempts)
Most Pass Completions, Championship Game30–Vince Young, Texas vs. USC, Rose, Jan. 4, 2006 (40 attempts)29–*Matt Leinart, USC vs. Texas, Rose, Jan. 4, 2006 (40 attempts)28–Ken Dorsey, Miami (Fla.) vs. Ohio State (2 ot), Fiesta, Jan., 3, 2003 (43 attempts)27–Darron Thomas, Oregon vs. Auburn (Glendale), Jan. 10, 2011 (40 attempts)26–Sam Bradford, Oklahoma vs. Florida (Miami), Jan. 8, 2009 (41 attempts)
Most Pass Completions, All Bowl Games44–Graham Harrell, Texas Tech vs. Virginia, Gator, 2008 (69 attempts)
Most Passing Yards482–Tim Tebow, Florida vs. Cincinnati, Sugar, Jan. 1, 2010 (35 attempts)444–Rohan Davey, LSU vs. Illinois, Sugar, Jan. 2, 2002 (31 of 53)429–Landry Jones, Oklahoma vs. Connecticut, Fiesta, Jan. 1, 2011 (34 of 49)414–Colt McCoy, Texas vs. Ohio State, Fiesta, Jan. 5, 2009 (41 of 58)413–Mark Sanchez, USC vs. Penn State, Rose, Jan. 1, 2009 (28 of 35)
Most Passing Yards, Championship Game365–*Matt Leinart, USC vs. Texas, Rose, Jan. 4, 2006 (29 of 40)363–Darron Thomas, Oregon vs. Auburn (Glendale), Jan. 10, 2011 (27 of 40)362–Ken Dorsey, Miami (Fla.) vs. Nebraska, Rose, Jan. 3, 2002 (22 of 35)

145
332–*Matt Leinart, USC vs. Oklahoma, Orange, Jan. 4, 2005 (18 of 35)329–Chris Weinke, Florida State vs. Virginia Tech, Sugar, Jan. 4, 2000 (20 of 34)
Most Passing Yards, All Bowl Games576–Byron Leftwich, Marshall vs. East Carolina (2 ot), GMAC,2001 (41 of 70)576–Ty Detmer, Brigham Young vs. Penn State, Holiday, 1989 (42 of 59)
Most Passes Without An Interception53–Rohan Davey, LSU vs. Illinois, Sugar, Jan. 2, 2002
Most Passes Without An Interception, Championship Game40–Vince Young, Texas vs. USC, Rose, Jan. 4, 2006
Most Touchdown Passes6–Geno Smith, West Virginia vs. Clemson, Orange, Jan. 4, 20125–*Matt Leinart, USC vs. Oklahoma, Orange, Jan. 4, 20054--AJ McCarron, Alabama vs. Notre Dame, NCG (Miami), Jan. 7, 20134–Andrew Luck, Stanford vs. Virginia Tech, Orange, Jan. 3, 20114–Mark Sanchez, USC vs. Penn State, Rose, Jan. 1, 20094–Matt Flynn, LSU vs. Ohio State, NCG (New Orleans), Jan. 7, 20084–J.D. Booty, USC vs. Michigan, Rose, Jan. 12, 20074–Alex Smith, Utah vs. Pittsburgh, Fiesta, Jan. 1, 20054–Chad Henne, Michigan vs. Texas, Rose, Jan. 1, 2005 4–Craig Krenzel, Ohio State vs. Kansas State, Fiesta, Jan. 2, 20044–Rex Grossman, Florida vs. Maryland, Orange, Jan. 2, 20024–Kurt Kittner, Illinois vs. LSU, Sugar, Jan. 2, 20024–Chris Weinke, Florida State vs. Virginia Tech, Sugar, Jan. 4, 20004–Tom Brady, Michigan vs. Alabama, Orange, Jan. 1, 2000
Most Touchdown Passes, Championship Game5–*Matt Leinart, USC vs. Oklahoma, Orange, Jan. 4, 20054--AJ McCarron, Alabama vs. Notre Dame, Orange, Jan. 7, 20134–Matt Flynn, LSU vs. Ohio State (New Orleans), Jan. 7, 20084–Chris Weinke, Florida State vs. Virginia Tech, Sugar, Jan. 4, 20003–Ken Dorsey, Miami (Fla.) vs. Nebraska, Rose, Jan. 3, 2002
Most Touchdown Passes, All Bowls6–Chuck Long, Iowa vs. Texas, Freedom, 19846--Geno Smith, West Virginia vs. Clemson, Orange, Jan. 4, 2012
Highest Completion Percentage (min. 20 attempts).886–Tim Tebow, Florida vs. Cincinnati, Sugar, Jan. 1, 2010 (31 of 35).871–Andrew Luck, Stanford vs. Oklahoma State (ot), Fiesta, Jan. 2, 2012 (27 of 31).800–Mark Sanchez, USC vs. Penn State, Rose, Jan. 1, 2009 (28 of 35).784–Alex Smith, Utah vs. Pittsburgh, Fiesta, Jan. 1, 2005 (29 of 37).782–Andrew Luck, Stanford vs. Virginia Rech, Orange, Jan. 3, 2011 (18 of 23)
Highest Completion Percentage, Championship Game (min. 20 attempts).750–Vince Young, Texas vs. USC, Rose, Jan. 4, 2006 (30 of 40).725–*Matt Leinart, USC vs. Texas, Rose, Jan. 4, 2006 (29 of 40).714--AJ McCarron, Alabama vs Notre Dame, (Miami), Jan. 7, 2013 (20 of 28).704–Matt Flynn, LSU vs. Ohio State (New Orleans), Jan. 7, 2008 (19 of 27).694–Chris Leak, Florida vs. Ohio State (Glendale), Jan. 8, 2007 (25 of 36) Highest Completion Percentage, All Bowl Games (Min. 20 attempts).929–Mike Bobo, Georgia vs. Wisconsin, Outback, 1998

146
RECEIVINGMost Receptions15–Paris Warren, Utah vs. Pittsburgh, Fiesta, Jan. 1, 2005 (198 yards)14–Quan Cosby, Texas vs. Ohio State, Fiesta, Jan. 5, 2009 (171 yards)14–Josh Reed, LSU vs. Illinois, Sugar, Jan. 2, 2002 (239 yards)13–Ryan Broyles, Oklahoma vs. Connecticut, Fiesta, Jan. 1, 2011 (170 yards)12--Tavon Austin, West Virginia vs. Clemson, Orange, Jan. 4, 2012 (123 yards)12–Freddie Brown, Utah vs. Alabama, Sugar, Jan. 2, 2009 (125 yards)
Most Receptions, Championship Game11–Kellen Winslow, Jr., Miami (Fla.) vs. Ohio St., Fiesta, Jan. 3, 2003 (122 yards)10–Jordan Shipley, Texas vs. Alabama, Jan. 7, 2010 (122 yards)10–David Thomas, Texas vs. USC, Rose, Jan. 4, 2006 (88 yards)10–*Dwayne Jarrett, USC vs. Texas, Rose, Jan. 4, 2006 (121 yards)9–Jeff Maehl, Oregon vs. Auburn (Glendale), Jan. 10, 2011 (133 yards)9–Percy Harvin, Florida vs. Ohio State (Glendale), Jan. 8, 2007 (60 yards)
Most Receptions, All Bowl Games20–Norman Jordan, Vanderbilt vs. Air Force, Hall of Fame, 1982 (173 yards)20–Walker Gillette, Richmond vs. Ohio, Tangerine, 1968, (242 yards)
Most Receiving Yards239–Josh Reed, LSU vs. Illinois, Sugar, Jan. 2, 2002 (14 receptions)205–Dwayne Jarrett, USC vs. Michigan, Rose, Jan. 1, 2007 (11 receptions)199–Andre Johnson, Miami (Fla.) vs. Nebraska, Rose, Jan. 3, 2002 (7 receptions)199–Peerless Price, Tennessee vs. Florida State, Fiesta, Jan. 4, 1999 (4 receptions)198–Paris Warren, Utah vs. Pittsburgh, Fiesta, Jan. 1, 2005 (15 receptions)
Most Receiving Yards, Championship Game199–Andre Johnson, Miami (Fla.) vs. Nebraska, Rose, Jan. 3, 2002 (7 receptions)199–Peerless Price, Tennessee vs. Florida State, Fiesta, Jan. 4, 1999 (4 receptions)163–Peter Warrick, Florida State vs. Virginia Tech, Sugar, Jan. 4, 2000 (6 receptions)137–Atrews Bell, Florida State vs. Oklahoma, Orange, Jan. 3, 2001 (7 receptions)135–Ron Dugans, Florida State vs. Tennessee, Fiesta, Jan. 4, 1999 (6 receptions)
Most Receiving Yards, All Bowl Games308–Jason Rivers, Hawaii vs. Arizona State, Hawaii Bowl, 2006 (14 receptions)
Most Touchdowns Receiving4–Tavon Austin, West Virginia vs. Clemson, Orange, Jan. 4, 20123--Justin Blackmon, Oklahoma State vs. Stanford, Fiesta, Jan. 2, 20123–Coby Fleener, Stanford vs. Virginia Tech, Orange, Jan. 3, 20113–Braylon Edwards, Michigan vs. Texas, Rose, Jan. 1, 20053–*Steve Smith, USC vs. Oklahoma, Orange, Jan. 4, 20053–David Terrell, Michigan vs. Alabama, Orange, Jan. 1, 2000
Most Touchdowns Receiving, Championship Game3–*Steve Smith, USC vs. Oklahoma, Orange, Jan. 4, 20052–Six times
Most Touchdowns Receiving, All Bowl Games4--Tavon Austin, West Virginia vs. Clemson, Orange, Jan. 4, 20124–Travis LaTendresse, Utah vs. Georgia Tech, Emerald, 20054–Fred Biletnikoff, Florida State vs. Oklahoma, Gator, 19654–Bob McChesney, Hardin-Simmons vs. Wichita State, Camellia, 1948

147
Highest Average Per Reception (min. 3 receptions)49.8–Peerless Price, Tennessee vs. Florida State, Fiesta, Jan. 4, 1999 (4 for 199)42.0–Josh Morgan, Virginia Tech vs. Auburn, Sugar, Jan. 3, 2005 (3 for 126)34.0–Durell Price, UCLA vs. Wisconsin, Rose, Jan. 1, 1999 (3 for 102)32.3–Quentin Chaney, Oklahoma vs. West Virginia, Fiesta, Jan. 2, 2008 (4 for 129)
Highest Average Per Reception, Championship Game (min. 3 receptions)49.8–Peerless Price, Tennessee vs. Florida State, Fiesta, Jan. 4, 1999 (4 for 199)
Highest Average Per Reception, All Bowl Games (minimum 3 receptions)52.3–Phil Harris, Texas vs. Navy, Cotton, 1964 (3 for 157)52.3–Jason Anderson, Wake Forest vs. Oregon, Seattle, 2002 (3 for 157)
ALL-PURPOSE YARDSMost All-Purpose Yards346–Jar Abbrederis, Wisconsin vs. Oregon, Rose, Jan. 2, 2012 (119 receiving, 201 kickoff return, 26 punt return)315–Steve Breaston, Michigan vs. Texas, Rose, Jan. 1, 2005 (221 kickoff return, 77 receiving, 15 rush, 2 punt return)314--DeAnthony Thomas, Oregon vs. Wisconsin, Rose, Jan. 2, 2012 (155 rushing, 34 receiving, 125 kickoff return)280--Tavon Austin, West Virginia vs. Clemson, Orange, Jan. 4, 2012 (46 rushing, 117 receiving, 117 kickoff return)279–*Reggie Bush, USC vs. Texas, Rose, Jan. 4, 2006 (102 kickoff returns, 95 receiving, 82 rushing)
Most All-Purpose Yards, Championship Game279–*Reggie Bush, USC vs. Texas, Rose, Jan. 4, 2006 (102 kickoff return, 95 receiving, 82 rushing)242–Peerless Price, Tennessee vs. Florida State, Fiesta, Jan. 4, 1999 (199 receiving, 43 punt return)226–Andre Johnson, Miami (Fla.) vs. Nebraska, Rose, Jan. 3, 2002 (199 receiving, 27 kickoff return)220–Peter Warrick, Florida State vs. Virginia Tech, Sugar, Jan. 4, 2000 (163 receiving, 57 punt returns)176–Juaquin Iglesias, Oklahoma vs. Florida, Jan. 8, 2009 (58 receiving, 118 kickoff returns)
Most All-Purpose Yards, All Bowl Games408–Chris Johnson, East Carolina vs. Boise State, Hawaii Bowl, 2007 (223 rush, 153 kickoff returns, 32 receiving)

148
SCORINGMost Points Scored24–Tavon Austin, West Virginia vs. Clemson, Orange, Jan. 4, 2012 (4 TDs)24–Vince Young, Texas vs. Michigan, Rose, Jan. 1, 2005 (4 TDs)24–Domanick Davis, LSU vs. Illinois, Sugar Jan. 2, 2002 (4 TDs)24–Ron Dayne, Wisconsin vs. UCLA, Rose, Jan. 1, 1999 (4 TDs)20–Peter Warrick, Florida State vs. Virginia Tech, Sugar, Jan. 4, 2000 (3 TDs, 1 2-pt conversion)20–Vince Young, Texas vs. USC, Rose, Jan. 4, 2006 (3 TDs, 1 2-pt. conversion)
Most Points Scored, Championship Game20–Vince Young, Texas vs. USC, Rose, Jan. 4, 2006 (3 TDs, 1 2-pt. conversion)20–Peter Warrick, Florida St. vs. Virginia Tech, Sugar, Jan. 4, 2000 (3 TDs, 1 2-pt. conversion)18–*LenDale White, USC vs. Texas, Rose, Jan. 4, 2006 (3 TDs)18–*Steve Smith, USC vs. Oklahoma, Orange, Jan. 4, 2005 (3 TDs)16–Jeremy Shelley, Alabama vs. LSU (New Orleans), Jan. 9, 2012 (5 FGs, 1 PAT)
Most Points Scored, All Bowl Games30--Reggie Campbell, Navy vs. Colorado State, Poinsettia, 2005 (5 TDs)30–Sheldon Canley, San Jose State vs. Central Michigan, California, 1990 (5 TDs)30–Steven Jackson, Oregon State vs. New Mexico, Las Vegas, 2003 (5 TDs)30–Barry Sanders, Oklahoma State vs. Wyoming, Holiday, 1988 (5 TDs)
Most Points Scored By A Kicker16–Jeremy Shelley, Alabama vs. LSU, NCG (New Orleans), Jan. 9, 2012 (5 FGs, 1 PAT)
Most Points Scored By A Kicker, Championship Game16–Jeremy Shelley, Alabama vs. LSU, (New Orleans), Jan. 9, 2012 (5 FGs, 1 PATs)
Most Points Scored By A Kicker, All Bowl Games19–Kevin Miller, East Carolina vs. Marshall, GMAC, 2001 (4 FGs, 7 PATs)
FIELD GOALS/EXTRA POINTSMost Field Goals5–Jeremy Shelley, Alabama vs. LSU, NCG (New Orleans), Jan. 9, 20124--Justin Myer, Virginia Tech vs. Michigan (ot), Sugar, Jan. 3, 20124–Billy Bennett, Georgia vs. Florida State, Sugar, Jan. 1, 20033–eight times
Most Field Goals, Championship Game5–Jeremy Shelley, Alabama vs. LSU (New Orleans), Jan. 9, 20122–Wes Byrum, Auburn vs. Oregon (Glendale), Jan. 10, 20112–Hunter Lawrence, Texas vs. Alabama (Pasadena), Jan. 7, 20102–Chris Hetland, Florida vs. Ohio State (Glendale), Jan. 8, 20072–David Pino, Texas vs. USC, Rose, Jan. 4, 20062–*Ryan Killeen, USC vs. Oklahoma, Orange, Jan. 4, 20052–Tim Duncan, Oklahoma vs. Florida State, Orange, Jan. 3, 2001
Most Field Goals, All Bowl Games5–Six times
Most Field Goal Attempts7–Jeremy Shelley, Alabama vs. LSU, NCG (New Orleans), Jan. 9, 2012 (5 made)5–Billy Bennett, Georgia vs. Florida State, Sugar, Jan. 1, 2003 (4 made)

149
Most Field Goal Attempts, Championship Game7–Jeremy Shelley, Alabama vs. LSU (New Orleans), Jan. 9, 2012 (5 made)3–David Pino, Texas vs. USC, Rose, Jan. 4, 2006 (2 made)3–Tim Duncan, Oklahoma vs. Florida State, Orange, Jan. 3, 2001 (2 made)
Most Field Goal Attempts, All Bowl Games7--Jeremy Shelley, Alabama vs. LSU (New Orleans), Jan. 9, 2012 (5 made)
Longest Field Goal52–Leah Tiffin, Alabama vs. Utah, Sugar, Jan. 2, 200952–Brandon Coutu, Georgia vs. Hawaii, Sugar, Jan. 1, 200851–Jeff Chandler, Florida vs. Miami (Fla.), Sugar, Jan. 2, 200151–Jon Peattie, Miami (Fla.) vs. Florida State, Orange, Jan. 3, 2001
Longest Field Goal, Championship Game46–David Pino, Texas vs. USC, Rose, Jan. 4, 2006
Longest Field Goal, All Bowl Games62–Tony Franklin, Texas A&M vs. Florida, Sun, Jan. 2, 1977
Most Extra Point Kick Attempts10–Tyler Bitancourt, West Virginia vs. Clemson, Orange, Jan. 4, 2012
Most Extra Point Kick Attempts, Championship Game7–*Ryan Killeen, USC vs. Oklahoma, Orange, Jan. 4, 2005 (7 made)
Most Extra Point Kick Attempts, All Bowls10–Tyler Bitancourt, West Virginia vs. Clemson, Orange, Jan. 4, 2012 (10 made)
Most Extra Point Kicks Made10–Tyler Bitancourt, West Virginia vs. Clemson, Orange, Jan. 4, 2012
Most Extra Point Kicks Made, Championship Game7–*Ryan Killeen, USC vs. Oklahoma, Orange, Jan. 4, 2005 (7 attempts)
Most Extra Point Kicks Made, All Bowl Games10–Tyler Bitancourt, West Virginia vs. Clemson, Orange, Jan. 4, 2012
PUNTINGMost Punts11–Jeremy Kapinos, Penn State vs. Florida State (3 ot), Orange Jan. 3, 2006
Most Punts, Championship Game10–Keith Cottrell, Florida State vs. Oklahoma, Orange, Jan. 3, 2001
Most Punts, All Bowl Games21–Everett Sweeney, Michigan vs. Stanford, Rose, 1902
Longest Punt66–Pat McAfee, West Virginia vs. Oklahoma, Fiesta, Jan. 2, 200865–Anson Kelton, TCU vs. Boise State, Fiesta, Jan. 4, 201063–A.J. Trapasso, Ohio State vs. LSU, NCG (New Orleans), Jan. 7, 200862–Kyle Tucker, Kansas vs. Virginia Tech, Orange, Jan. 3, 200862–Patrick Fisher, LSU vs. Ohio State, NCG (New Orleans), Jan. 7, 2008 (Fisher had two 62-yard punts in the game)
Longest Punt, Championship Game63–A.J. Trapasso, Ohio State vs. LSU (New Orleans), Jan. 7, 200862–Patrick Fisher, LSU vs. Ohio State (New Orleans), Jan. 7, 2008 (Fisher had two 62-yard punts in the game)59–Blake Ferguson, Oklahoma vs. LSU, Sugar, Jan. 4, 200459–Eric Wilbur, Florida vs. Ohio State (Glendale), Jan. 8, 2007
Longest Punt, All Bowl Games84–Kyle Rote, SMU vs. Oregon, Cotton, 1949

150
Highest Punting Average (min. 3 punts)58.5–Pat McAfee, West Virginia vs. Oklahoma, Fiesta, Jan. 2, 2008 (4 for 234)
Highest Punting Average, Championship Game (min. 3 punts)56.7–Patrick Fisher, LSU vs. Ohio State (New Orleans), Jan. 7, 2008 (3 for 170)
Highest Punting Average, All Bowl Games (NCAA min. 5 punts)55.0–Justin Brantly, Texas A&M vs. Penn State, Alamo, 2007 (6 for 330)
PUNT RETURNSMost Punt Returns7–Willie Reid, Florida State vs. Penn State (3 ot), Orange, Jan. 3, 2006 (180 yards)5–Ryan Broyles, Oklahoma vs. Connecticut, Fiesta, Jan. 1, 2011 (92 yards)5--Jeremy Kerley, TCU vs. Boise State, Fiesta, Jan. 4, 2010 (76 yards)
Most Punt Returns, Championship Game4–Brandon James, Florida vs. Ohio State, (Glendale), Jan. 8, 2007 (28 yards)4–Phillip Buchanon, Miami (Fla.) vs. Nebraska, Rose, Jan. 3, 2002 (37 yards)4–Ike Charlton, Virginia Tech vs. Florida State, Sugar, Jan. 4, 2000 (88 yards)
Most Punt Returns, All Bowl Games9–Buzzy Rosenberg, Georgia vs. North Carolina, Gator, 1971 (54 yards)9–Paddy Driscoll, Great Lakes vs. Mare Island, Rose, 1919 (115 yards)
Most Punt Return Yards180–Willie Reid, Florida State vs. Penn State (3ot), Orange, Jan. 3, 2006 (7 returns)107–Freddie Milons, Alabama vs. Michigan (ot), Orange, Jan. 1, 2000 (4 returns)92–Ryan Broyles, Oklahoma vs. Connecticut, Fiesta, Jan. 1, 2011 (5 returns)90–Antonio Perkins, Oklahoma vs. Washington State, Rose, Jan. 1, 2003 (4 returns)88–Ike Charlton, Virginia Tech vs. Florida State, Sugar, Jan. 4, 2000 (4 returns)
Most Punt Return Yards, Championship Game88–Ike Charlton, Virginia Tech vs. Florida State, Sugar, Jan. 4, 2000 (4 returns)85–DeJuan Groce, Nebraska vs. Miami (Fla.), Rose, Jan. 3, 2002 (3 returns)57–Peter Warrick, Florida State vs. Virginia Tech, Sugar, Jan. 4, 2000 (2 returns)43–Peerless Price, Tennessee vs. Florida State, Fiesta, Jan. 4, 1999 (3 returns)37–Phillip Buchanon, Miami (Fla.) vs. Nebraska, Rose, Jan. 3, 2002 (4 returns)
Most Punt Return Yards, All Bowl Games180–Willie Reid, Florida State vs. Penn State (3 ot), Orange, Jan. 3, 2006 (7 returns)
Highest Punt Return Average (min. 3 returns)28.33–DeJuan Groce, Nebraska vs. Miami (Fla.), Rose, Jan. 3, 2002 (3 for 85)
Highest Punt Return Average, Championship Game(minimum 3 returns)

151
28.33–DeJuan Groce, Nebraska vs. Miami (Fla.), Rose, Jan. 3, 2002 (3 for 85)
Highest Punt Return Average, All Bowl Games (min. 3 returns)40.67–George Fleming, Washington vs. Wisconsin, Rose, 1960 (3 for 122)
Punt Returns For Touchdowns87–Willie Reid, Florida State vs. Penn State (3ot), Orange, Jan. 3, 2006 (2nd quarter)84–Justin Harper, Virginia Tech vs. Kansas, Orange, Jan. 3, 2008 (3rd quarter)73–Javier Arenas, Alabama vs. Utah, Sugar, Jan. 2, 2009 (2nd quarter)71–DeJuan Groce, Nebraska vs. Miami (Fla.), Rose, Jan. 3, 2002 (4th quarter)62–Freddie Milons, Alabama vs. Michigan (ot), Orange, Jan. 1, 2000 (3rd quarter)60–Bobby Newcombe, Nebraska vs. Tennessee, Fiesta, Jan. 2, 2000 (1st quarter)59–Peter Warrick, Florida State vs. Virginia Tech, Sugar, Jan. 4, 2000 (2nd quarter)51–Antonio Perkins, Oklahoma vs. Washington State, Rose, Jan. 1, 2003 (2nd quarter)45–Terrell Roberts, Oregon State vs. Notre Dame, Fiesta, Jan. 1, 2001 (3rd quarter)#16–Kevin Grifith, Ohio State vs. Texas A&M, Sugar, Jan. 1, 1999 (1st quarter)#7–John Hollins, Ohio State vs. Kansas State, Fiesta, Jan. 2, 2004, 1st quarter#6–Jeff Chaney, Florida State vs. Virginia Tech, Sugar, Jan. 4, 2000 (1st quarter)
Punt Returns for Touchdowns, Championship Game71–DeJuan Groce, Nebraska vs. Miami (Fla.), Rose, Jan. 3, 2002 (4th quarter)59–Peter Warrick, Florida State vs. Virginia Tech, Sugar, Jan. 4, 2000 (2nd quarter)#6–Jeff Chaney, Florida State vs. Virginia Tech, Sugar, Jan. 4, 2000 (1st quarter) #–Return of blocked punt.
KICK RETURNSMost Kickoff Returns8–Jar Abbrederis, Wisconsin vs. Oregon, Rose, Jan. 2, 2012 (201 yards)8–Mardy Gilyard, Cincinnati vs. Florida, Sugar, Jan. 1, 2010 (207 yards)7--Sammy Watkins, Clemson vs. West Virginia, Orange, Jan. 4, 2012 (143 yards)7–Juaquin Iglesias, Oklahoma vs. West Virginia, Fiesta, Jan. 2, 2008 (195 yards) 7–Ramonce Taylor, Texas vs. Michigan, Rose, Jan. 1, 2005 (201 yards)
Most Kickoff Returns, Championship Game5–Morris Claiborne, LSU vs. Alabama, (New Orleans), Jan. 9, 2012 (109 yards)5–Demond Washington, Auburn vs. Oregon (Glendale), Jan. 10, 2011 (92 yards)5–Juaquin Iglesias, Oklahoma vs. Florida (Miami), Jan. 8, 2009 (118 yards)5–Ray Small, Ohio State vs. LSU (New Orleans), Jan. 7, 2008 (95 yards)5–*Reggie Bush, USC vs. Texas, Rose, Jan. 4, 2006 (102 yards)5–Josh Davis, Nebraska vs. Miami (Fla.), Rose, Jan. 3, 2002 (119 yards)
Most Kickoff Returns, All Bowl Games8–Three times

152
Most Kickoff Return Yards221–Steve Breaston, Michigan vs. Texas, Rose, Jan. 1, 2005 (6 ret.)207–Mardy Gilyard, Cincinnati vs. Florida, Sugar, Jan. 1, 2010 (8 ret.)201--Jar Abbrederis, Wisconsin vs. Oregon, Rose, Jan. 2, 2012 (8 returns)201–Ramonce Taylor, Texas vs. Michigan, Rose, Jan. 1, 2005 (7 ret.)195–Juaquin Iglesias, Oklahoma vs. West Virginia, Fiesta, Jan. 2, 2008 (7 returns)
Most Kickoff Return Yards, Championship Game119–Josh Davis, Nebraska vs. Miami (Fla.), Rose, Jan. 3, 2002 (5 ret.)118–Juaquin Iglesias, Oklahoma vs. Florida (Miami), Jan. 8, 2009 (5 ret.)102–*Reggie Bush, USC vs. Texas, Rose, Jan. 4, 2006 (5 ret.)95–Ray Small, Ohio State vs. LSU, (New Orleans) Jan. 7, 2008 (5 ret.)93–Ted Ginn, Jr., Ohio State vs. Florida (Glendale), Jan. 8, 2007 (1 ret.)
Most Kickoff Return Yards, All Bowl Games221–Steve Breaston, Michigan vs. Texas, Rose, Jan. 1, 2005 (6 ret.)
Highest Kickoff Return Average (min. 3 returns)42.25–C.J. Jones, Iowa vs. USC, Orange, Jan. 3, 2003 (4 for 169)
Highest Kickoff Return Average, Championship Game (min. 3 returns)23.8–Josh Davis, Nebraska vs. Miami (Fla.), Rose, Jan. 3, 2002 (5 for 119)
Highest Kickoff Return Average, All Bowl Games (min. 3 ret.)46.67–Cal Beck, Utah vs. Arizona, Freedom, 1994 (3 for 140)
Kickoffs Returned for Touchdowns100–C.J. Jones, Iowa vs. USC, Orange, Jan. 2, 2003 (opening kickoff)95–Robbie Frey, Connecticut vs, Oklahoma, Fiesta, Jan. 1, 2011 (3rd quarter)93–Ted Ginn, Jr., Ohio State vs. Florida, NCG (Glendale), Jan. 8, 2007 (opening kickoff)89–Sammy Moore, Washington State vs. Oklahoma, Rose, Jan. 1, 2003 (4th quarter)
Kickoffs Returned for Touchdowns, Championship Game93–Ted Ginn, Jr., Ohio State vs. Florida, (Glendale), Jan. 8, 2007 (opening kickoff)
LONGEST PLAYSLongest Runs From Scrimmage91–DeAnthony Thomas, Oregon vs. Wisconsin, Rose, Jan. 2, 2012 (TD)79–Rashard Mendenhall, Illinois vs. USC, Rose, Jan. 1, 2008 (TD)68--Andre Ellington, Clemson vs. West Virginia, Orange, Jan. 4, 2012 (TD)68–Ted Ginn, Jr., Ohio St. vs. Notre Dame, Fiesta, Jan. 2, 2006 (TD)65–Chris Wells, Ohio State vs. LSU, NCG (New Orleans), Jan. 7, 2008 (TD) 65–Noel Devine, West Virginia vs. Oklahoma, Fiesta, Jan. 2, 2008 (TD)65–Joe McKnight, USC vs. Illinois, Rose, Jan. 1, 2008 (did not score)
Longest Runs From Scrimmage, Championship Game65–Chris Wells, Ohio State vs. LSU (New Orleans), Jan. 7, 2008 (touchdown) 64–Justin Vincent, LSU vs. Oklahoma, Sugar, Jan. 4, 2004 (did not score)52–Percy Harvin, Florida vs. Oklahoma (Miami), Jan. 8, 200949–Trent Richardson, Alabama vs. Texas (Pasadena), Jan. 7, 201045–Vince Young, Texas vs. USC, Jan. 4, 2006 (did not score)45–*Reggie Bush, USC vs. Oklahoma, Orange, Jan. 4, 2005 (did not score)
Longest Run From Scrimmage, All Bowl Games99–Terry Baker, Oregon State vs. Villanova, Liberty, 1962 (touchdown)

153
Longest Pass Plays From Scrimmage85–Troy Smith to Santonio Holmes, Ohio St. vs. Notre Dame, Fiesta, Jan. 2, 2006 (TD)81–Darron Thomas to Jeff Maehl, Oregon vs. Auburn, NCG (Glendale), Jan. 10, 2011 (did not score)80–Tim Tebow to Riley Cooper, Florida vs. Cincinnati, Sugar, Jan. 1, 2010 (TD)80–Bryan Randall to Josh Morgan, Virginia Tech vs. Auburn, Sugar, Jan. 3, 2005 (TD)79–Patrick White to Tito Gonzales, West Virginia vs. Oklahoma, Fiesta, Jan. 2, 2008 (TD)79–Joey Harrington to Samie Parker, Oregon vs. Colorado, Fiesta, Jan. 1, 2002 (TD)79–Tee Martin to Peerless Price, Tennessee vs. Florida State, Fiesta, Jan. 4, 1999 (TD)
Longest Pass Plays From Scrimmage, Championship Game81–Darron Thomas to Jeff Maehl, Oregon vs. Auburn (Glendale), Jan. 10, 2011 (did not score)79–Tee Martin to Peerless Price, Tennessee vs. Florida State, Fiesta, Jan. 4, 1999 (TD)64–Chris Weinke to Peter Warrick, Florida State vs. Virginia Tech, Sugar, Jan. 4, 2000 (TD)63–Chris Weinke to Ron Dugans, Florida State vs. Virginia Tech, Sugar, Jan. 4, 2000 (TD)54–*Matt Leinart to Dwayne Jarrett, USC vs. Oklahoma, Orange, Jan. 4, 2005 (TD)
Longest Pass Plays From Scrimmage, All Bowl Games95–Ronnie Fletcher to Ben Hart, Oklahoma vs. Florida State, Gator, 1965 (TD)
Longest Kickoff Returns100–C.J. Jones, Iowa vs. USC, Orange, Jan. 2, 2003 (opening kickoff, TD)95–Robbie Frey, Connecticut vs. Oklahoma, Jan. 1, 2011 (3rd quarter, TD)93–Ted Ginn, Jr., Ohio State vs. Florida, NCG (Glendale), Jan. 8, 2007 (opening kickoff, TD)89–Sammy Moore, Washington State vs. Oklahoma, Rose, Jan. 1, 2003 (4th quarter, TD)73–Allen Patrick, Oklahoma vs. West Virginia, Fiesta, Jan.2, 2008 (2nd quarter, did not score)
Longest Kickoff Returns, Championship Game93–Ted Ginn, Jr., Ohio State vs. Florida (Glendale), Jan. 8, 2007 (opening kickoff, TD)35–Ray Small, Ohio State vs. LSU (New Orleans), Jan. 7, 2008, 4th quarter (did not score)33–Brandon James, Florida vs. Ohio State (Glendale), Jan. 8, 2007, 1st quarter (did not score)
Longest Punt Returns87–Willie Reid, Florida State vs. Penn State, Orange, Jan. 3, 2006 (2nd quarter)84–Justin Harper, Virginia Tech vs. Kansas, Orange, Jan.3, 2008 (3rd quarter)73–Javier Arenas, Alabama vs. Utah, Sugar, Jan. 2, 2009 (2nd quarter)71–DeJuan Groce, Nebraska vs. Miami (Fla.), Rose, Jan. 3, 2002 (4th quarter)62–Freddie Milons, Alabama vs. Michigan (ot), Orange, Jan. 1, 2000 (3rd quarter)Longest Punt Returns, Championship Game71–DeJuan Groce, Nebraska vs. Miami (Fla.), Rose, Jan. 3, 2002 (4th quarter) (TD)59–Peter Warrick, Florida State vs. Virginia Tech, Sugar, Jan. 4, 2000 (2nd quarter) (TD)

154
Longest Interception Returns71–Bruce Thornton, Georgia vs. Florida State, Sugar, Jan. 1, 2003 (TD)60–Aqib Talib, Kansas vs. Virginia Tech, Orange, Jan. 3, 2008 (TD)55–Jamell Fleming, Oklahoma vs. Connecticut, Fiesta, Jan. 1, 2011 (TD)54–Dwayne Goodrich, Tennessee vs. Florida State, Fiesta, Jan. 4, 1999 (TD)51–Brandyn Thompson, Boise St., vs. TCU, Fiesta, Jan. 4, 2010 (TD)
Longest Interception Returns, Championship Game54–Dwayne Goodrich, Tennessee vs. Florida State, Fiesta, Jan. 4, 1999 (TD)47–James Lewis, Miami (Fla.) vs. Nebraska, Rose, Jan. 3, 2002 (TD)34–Chevis Jackson, LSU vs. Ohio State (New Orleans), Jan. 7, 2008 (did not score)28–Marcell Dareus, Alabama vs. Texas (Pasadena), Jan. 7, 2010 (did not score)23–Malcolm Jenkins, Ohio State vs. LSU (New Orleans), Jan. 7, 2008 (did not score)
DEFENSEMost Total Tackles18–James Laurinaitis, Ohio State vs. LSU, NCG (New Orleans), Jan. 7, 2008 (12 solo, 6 assists)17–John Boyett, Oregon vs. Wisconsin, Rose, Jan. 2, 2012 (13 solos, 4 assists)17–Rufus Alexander, Oklahoma vs. Boise State (ot), Fiesta, Jan. 1, 2007 (14 solos, 3 assists)15–Jonathan Abbate, Wake Forest vs. Louisville, Orange, Jan. 2, 2007 (4 solos), 11 assists)15–James Laurinaitis, Ohio State vs. Florida, NCG (Glendale), Jan. 8, 2007 (10 solos, 5 assists)15–Marcus Freeman, Ohio State vs. Florida, NCG (Glendale), Jan. 8, 2007 (9 solos, 6 assists)15–Curtis Lofton, Oklahoma vs. West Virginia, Fiesta, Jan. 2, 2008 (12 solos, 3 assists)
Most Solo Tackles14–Rufus Alexander, Oklahoma vs. Boise State, Fiesta, Jan. 1, 200713–John Boyett, Oregon vs. Wisconsin, Rose, Jan. 2, 201213–Dat Nguyen, Texas A&M vs. Ohio State, Sugar, Jan. 1, 1999 13–Vontae Davis, Illinois vs. USC, Rose, Jan. 1, 2008
Most Tackles For Loss5–Navorro Bowman, Penn State vs. USC, Rose, Jan. 1, 20094–Jake Ryan, Michigan vs. Virginia Tech (ot), Sugar, Jan. 3, 20124–Kenny Rowe, Oregon vs. Auburn, NCG (Glendale), Jan. 10, 20114–Shayne Skov, Stanford vs. Virginia Tech, Orange, Jan. 3, 20114–Kenny Rowe, Oregon vs. Ohio State, Rose, Jan. 1, 20104–Terrill Byrd, Cincinnati vs. Virginia Tech, Orange, Jan. 1, 20094–Brian Cushing, USC vs. Michigan, Rose, Jan. 1, 20074–La Marr Woodley, Michigan vs. Texas, Rose, Jan. 1, 2005
Most Quarterbacks Sacks3–Shayne Skov, Stanford vs. Virginia Tech, Orange, Jan. 3, 20113–Kenny Rowe, Oregon vs. Ohio State, Rose, Jan. 1, 20103–Steve Sylvester, Utah vs. Alabama, Sugar, Jan. 2, 20093–Marcus Howard, Georgia vs. Hawaii, Sugar, Jan. 1, 20083–Rey Maualuga, USC vs. Illinois, Rose, Jan. 1, 20083–Derrick Harvey, Florida vs. Ohio State, NCG (Glendale), Jan. 8, 2007 3–Brian Cushing, USC vs. Michigan, Rose, Jan. 2, 20073–Mike Kudla, Ohio State vs. Notre Dame, Fiesta, Jan. 2, 20063–Tommy Hackenbruck, Utah vs. Pittsburgh, Fiesta, Jan. 1, 2005

155
Most Passes Broken Up3–William Gay, Louisville vs. Wake Forest, Orange, Jan. 2, 20073--Donle Whitner, Ohio State vs. Notre Dame, Fiesta, Jan. 2, 20063--Anwar Phillips, Penn State vs. Florida State, Orange, Jan. 3, 20063--Randall Gay, LSU vs. Illinois, Sugar, Jan. 1, 20023--Sedrick Curry, Texas A&M vs. Ohio State, Fiesta, Jan. 1, 19993--Ahmed Plummer, Ohio State vs. Texas A&M, Fiesta, Jan. 1, 1999
Most Interceptions2–Javier Arenas, Alabama vs. Texas, NCG, (Pasadena), Jan. 7, 20102–Brandyn Thompson, Boise State vs. TCU, Fiesta, Jan. 4, 20102–Sean Taylor, Miami (Fla.) vs. Ohio State, Fiesta, Jan. 3, 2003
Interceptions Returned For Touchdowns71–Bruce Thornton, Georgia vs. Florida State, Sugar, Jan. 1, 200360–Aqib Talib, Kansas vs. Virginia Tech, Orange, Jan. 3, 200855–Jamell Fleming, Oklahoma vs. Connecticut, Fiesta, Jan. 1, 201154–Dwayne Goodrich, Tennessee vs. Florida State, Fiesta, Jan. 4, 199951–Brand Thompson, Boise State vs. TCU, Fiesta, Jan. 4, 201047–James Lewis, Miami (Fla.) vs. Nebraska, Rose, Jan. 3, 200246–Dwayne Gratz, Connecticut vs. Oklahoma, Fiesta, Jan. 1, 201146–Jamar Fletcher, Wisconsin vs. UCLA, Rose, Jan. 1, 199940–Jerrad Tarrant, Georgia Tech vs. Iowa, Orange, Jan. 5, 201033–Marcus Walker, Oklahoma vs. Boise State, Fiesta, Jan. 1, 200728–Marcell Dareus, Alabama vs. Texas, NCG (Pasadena), Jan. 7, 201027–Marty Tadman, Boise St. vs. Oklahoma (ot), Fiesta, Jan. 1, 201122–Tony Jefferson, Oklahoma vs. Connecticut, Fiesta, Jan. 1, 201120–Marcus Spears, LSU vs. Oklahoma, Sugar, Jan. 1, 2004
Fumbles Returned For Touchdowns1–Darwin Cook, West Virginia vs. Clemson, Orange, Jan. 4, 2012 (99 yards)1–Louis Nzegwu, Wisconsin vs. Oregon, Rose, Jan. 2, 2012 (33 yards)1–Marcus Howard, Georgia vs. Hawaii, Sugar, Jan. 1, 2008 (0 yards, recovered fumble in end zone)
* Later vacated.
Youngest Coaches to Win BCS Championship40.35 years old – Bob Stoops, Oklahoma, Jan. 3, 2001(born September 9, 1960)42.53 years old – Urban Meyer, Florida, Jan. 8, 2007 (born July 10, 1964)

156
BCS TEAM RECORDSTOTAL OFFENSE
Most Total Plays97–LSU vs. Illinois, Sugar, Jan. 2, 200289–West Virginia vs. Clemson, Orange, Jan. 4, 201289–Ohio State vs. Oregon, Rose, Jan. 1, 201087–Texas vs. Ohio State, Fiesta, Jan. 5, 200987–Penn State vs. Florida State (ot), Orange, Jan. 3, 2006
Most Total Plays, Championship Game85–Auburn vs. Oregon, (Glendale), Jan. 10, 201182–*Texas vs. USC, Rose, Jan. 4, 200681–Virginia Tech vs. Florida State, Sugar, Jan. 4, 200080–Florida vs. Ohio State, (Phoenix), Jan. 8, 200777–Miami (Fla.) vs. Ohio State (2 ot), Fiesta, Jan. 3, 2003
Most Total Plays, All Bowl Games107–Purdue vs. Washington State, Sun, 2001
Most Total Plays Combined163–West Virginia (89) and Clemson (74), Orange, Jan. 4, 2012160–Oklahoma (80) and Connecticut (80), Fiesta, Jan. 1, 2011158–Auburn (85) and Oregon (73), NCG (Glendale), Jan. 10, 2011158–*Texas (82) and USC (76), Rose, Jan. 4, 2006156–Penn State (87) and Florida State (60) (3ot), Orange, Jan. 3, 2006
Most Total Plays Combined, Championship Game158–Auburn (85) and Oregon (73) (Glendale), Jan. 10, 2011158–*Texas (82) and USC (76), Rose, Jan. 4, 2006150–Miami (Fla.) (77) vs. Ohio State (73) (2ot), Fiesta, Jan. 3, 2003144–Florida (74) and Oklahoma (70) (Miami), Jan. 8, 2009144–Oklahoma (75) vs. Florida State (69), Orange, Jan. 3, 2001
Most Total Plays Combined, All Bowl Games180–Hawaii (91) and Houston (89), Hawaii, 2003180–Marshall (104) and East Carolina (76), GMAC, 2003
Most Total Yards659–Florida vs. Cincinnati, Sugar, Jan. 1, 2010 (482 pass, 177 rush)659–Florida vs. Maryland, Orange, Jan. 2, 2002 (456 pass, 203 rush)633–USC vs. Illinois, Rose, Jan.1, 2008 (289 pass, 344 rush)628–LSU vs. Illinois, Sugar, Jan. 2, 2002 (444 pass, 184 rush)617–Ohio State vs. Notre Dame, Fiesta, Jan. 2, 2006 (342 pass, 275 rush)
Most Total Yards, Championship Game574–*USC vs. Texas, Rose, Jan. 4, 2006 (365 pass, 209 rush)556–*Texas vs. USC, Rose, Jan. 4, 2006 (289 rush, 267 rush)529--Alabama vs. Notre Dame, (Miami), Jan. 7, 2013 (264 pass, 265 rush) 525–*USC vs. Oklahoma, Orange, Jan. 4, 2005 (332 pass, 193 rush)519–Auburn vs. Oregon, (Glendale), Jan. 10, 2011 (265 pass, 254 rush)
Most Total Yards, All Bowl Games718–Arizona State vs. Missouri, Fiesta, 1972 (452 rush, 266 pass)

157
Most Total Yards Combined1,130–*Texas (556) and USC (574), Rose, Jan. 4, 20061,129--Oregon (621) and Wisconsin (508), Rose, Jan. 2, 20121,078–USC (633) and Illinois (445), Rose, Jan. 1, 20081,054–Stanford (590) and Oklahoma State (464), Fiesta, Jan. 2, 20121,035–Wisconsin (497) and UCLA (538), Rose, Jan. 1, 1999
Most Total Yards Combined, Championship Game1,130–*Texas (556) and USC (574), Rose, Jan. 4, 2006968–Auburn (519) and Oregon (449), (Glendale), Jan. 10, 2011897– *USC (525) and Oklahoma (372), Orange, Jan. 4, 2005862–Virginia Tech (503) and Florida State (359), Sugar, Jan. 4, 2000843–Florida (480) and Oklahoma (363), (Miami), Jan. 8, 2009
Most Total Yards Combined, All Bowl Games1,211–Arizona State (679) and Rutgers (532), Insight, 2005
Most Yards Gained Per Play9.89–Stanford vs. Virginia Tech, Orange, Jan. 3, 2011 (54 for 534)9.78–Stanford vs. Oklahoma State (ot), Fiesta, Jan. 2, 2012 (64 for 621)9.64–Ohio State vs. Notre Dame, Fiesta, Jan. 2, 2006 (64 for 617)9.40–Florida vs. Cincinnati, Sugar, Jan. 1, 2010 (70 for 659)9.05–West Virginia vs. Oklahoma, Fiesta, Jan. 2, 2008 (58 for 525)
Most Yards Gained Per Play, Championship Game8.33–*USC vs. Oklahoma, Orange, Jan. 4, 2005 (63 for 525)7.74–Miami (Fla.) vs. Nebraska, Rose, Jan. 3, 2002 (61 for 472)7.32–Texas vs. USC, Rose, Jan. 4, 2006 (76 for 556)7.25--Alabama vs. Notre Dame, (Miami), Jan. 7, 2013 (73 for 529)7.00–*USC vs. Texas, Rose, Jan. 4, 2006 (82 for 574)
Most Yards Gained Per Play, All Bowl Games9.89–Stanford vs. Virginia Tech, Orange, Jan. 3, 2011 (54 for 534)
Fewest Total Yards82–Ohio State vs. Florida, NCG (Glendale), Jan. 8, 2007 (47 rush, 35 pass)92–LSU vs. Alabama, NCG (New Orleans), Jan. 9, 2012 (39 rush, 53 pass)154–Oklahoma vs. LSU, Sugar, Jan. 4, 2004 (52 rush, 102 pass)155–Georgia Tech vs. Iowa, Orange, Jan. 5, 2010 (143 rush, 12 pass)155–Notre Dame vs. Oregon State, Fiesta, Jan. 1, 2001 (17 rush, 138 pass)
Fewest Total Yards, Championship Game82–Ohio State vs. Florida, (Glendale), Jan. 8, 2007 (47 rush, 35 pass)92–LSU vs. Alabama, (New Orleans), Jan. 9, 2012 (39 rush, 53 pass)154–Oklahoma vs. LSU, Sugar, Jan. 4, 2004 (52 rush, 102 pass)253–Florida State vs. Tennessee, Fiesta, Jan. 4, 1999 (108 rush, 145 pass)259–Nebraska vs. Miami (Fla.), Rose, Jan. 3, 2002 (62 pass, 197 rush)
Fewest Total Yards, All Bowl Games-21–U of Mexico vs. Southwestern (Tex.), Sun, 1945 (29 rush, -50 pass)
Fewest Total Yards Combined452–Florida (370) and Ohio State (82), NCG (Glendale), Jan. 8, 2007476–Alabama (384) and LSU (92), NCG (New Orleans), Jan. 9, 2012466–LSU (312) and Oklahoma (154), Sugar, Jan. 4, 2004538–Georgia (276) and Florida State (262), Sugar, Jan. 1, 2003539–Texas (276) and Alabama (263), NCG (Pasadena), Jan. 10, 2010
Fewest Total Yards Combined, Championship Game452–Florida (370) and Ohio State (82), (Glendale), Jan. 8, 2007466–LSU (312) and Oklahoma (154), Sugar, Jan. 4, 2004476–Alabama (384) and LSU (92), (New Orleans), Jan. 9, 2012
Fewest Total Yards Combined, All Bowl Games260–Randolph Field (150) and Texas (110), Cotton, 1944

158
RUSHINGMost Rushing Attempts63–West Virginia vs. Georgia, Sugar, Jan. 2, 2006 (382 yards)55–Virginia Tech vs. Cincinnati, Orange, Jan. 1, 2009 (258 yards)55–Nebraska vs. Tennessee, Fiesta, Jan. 2, 2000 (323 yards)53–Wisconsin vs. Stanford, Rose, Jan. 1, 2000 (226 yards)52–Virginia Tech vs. Florida State, Sugar, Jan. 4, 2000 (278 yards)52–Washington vs. Purdue, Rose, Jan. 1, 2001 (268 yards)52–Ohio State vs. Miami (Fla.) (2ot), Fiesta, Jan. 3, 2003 (145 yards)
Most Rushing Attempts, Championship Game52–Virginia Tech vs. Florida State, Sugar, Jan. 4, 2000 (278 yards)52–Ohio State vs. Miami (Fla.) (2 ot), Fiesta, Jan. 3, 2003 (145 yards)51–Alabama vs. Texas, (Pasadena), Jan. 7, 2010 (205 yards)50–Auburn vs. Oregon, (Glendale), Jan. 10, 2011 (254 yards)49–Nebraska vs. Miami (Fla.), Rose, Jan. 3, 2002 (197 yards)49–LSU vs. Ohio State, (New Orleans), Jan. 7, 2008 (195 yards)
Most Rushing Attempts, All Bowl Games87–Oklahoma vs. Auburn, Sugar, 1972
Most Rushing Attempts Combined91–West Virginia (63) and Georgia (28), Sugar, Jan. 2, 200686–Wisconsin (48) and UCLA (38), Rose, Jan. 1, 199986–Wisconsin (46) and Oregon (40), Rose, Jan. 2, 201286–Tennessee (45) and Florida State (41), Fiesta, Jan. 4, 199985–Ohio State (52) and Miami (Fla.) (2ot) (33), Fiesta, Jan. 3, 2003
Most Rushing Attempts Combined, Championship Game86–Tennessee (45) and Florida State (41), Fiesta, Jan. 4, 199985–Ohio State (52) and Miami (Fla.) (2 ot) (33), Fiesta, Jan. 3, 200382–Auburn (50) and Oregon (32), (Glendale), Jan. 10, 201179–Alabama (51) and Texas (28), (Pasadena), Jan. 7, 201079–LSU (49) and Ohio State (30), (New Orleans), Jan. 7, 2008
Most Rushing Attempts Combined, All Bowl Games122–USC (50) and Texas A&M (72) Bluebonnet, 1972122–Mississippi State (68) and North Carolina (54), Sun, 1974
Most Rushing Yards382–West Virginia vs. Georgia, Sugar, Jan. 2, 2006 (63 attempts)349–West Virginia vs. Oklahoma, Fiesta, Jan. 2, 2008 (39 attempts)345–Oregon vs. Wisconsin, Rose, Jan. 2, 2012 (40 attempts)344–USC vs. Illinois, Rose, Jan. 1, 2008 (43 attempts)343–Wisconsin vs. UCLA, Rose, Jan. 1, 1999 (48 attempts)
Most Rushing Yards, Championship Game289–Texas vs. USC, Rose, Jan. 4, 2006 (36 attempts)278–Virginia Tech vs. Florida State, Sugar, Jan. 4, 2000 (52 attempts)265--Alabama vs. Notre Dame, (Miami), Jan. 7, 2013 (45 attempts)254–Auburn vs. Oregon, (Glendale), Jan. 10, 2011 (50 attempts)249–Florida vs. Oklahoma, (Miami), Jan. 8, 2009 (44 attempts)
Most Rushing Yards, All Bowl Games524–Nebraska vs. Florida, Fiesta, 1996 (68 attempts)
Most Rushing Yards Combined606–West Virginia (382) and Georgia (224), Sugar, Jan. 2, 2006557–Oregon (345) and Wisconsin (212), Rose, Jan. 2, 2012526–West Virginia (349) and Oklahoma (177), Fiesta, Jan. 2, 2008498–*Texas (289) and USC (209), Rose, Jan. 4, 2006488–USC (344) and Illinois (144), Rose, Jan. 1, 2008

159
Most Rushing Yards, Combined, Championship Game498–*Texas (289) and USC (209), Rose, Jan. 4, 2006384–LSU (195) vs. Ohio State (189), (New Orleans), Jan. 7, 2008356–Florida (249) and Oklahoma (107), (Miami), Jan. 8, 2009329–Auburn (254) and Oregon (75), (Glendale), Jan. 10, 2011321–*USC (193) and Oklahoma (128), Orange, Jan. 4, 2005
Most Rushing Yards, Combined, All Bowl Games864–USC (378) and Texas A&M (486), Bluebonnet, 1977
Most Rushing Yards Per Attempt8.95–West Virginia vs. Oklahoma, Fiesta, Jan. 2, 2008 (39 for 349)8.63–Oregon vs. Wisconsin, Rose, Jan. 2, 2012 (40 for 345)8.12–Florida vs. Maryland, Orange, Jan. 2, 2002 (25 for 203)8.03–Texas vs. USC, Rose, Jan. 4, 2006 (36 for 289)8.00–Stanford vs. Virginia Tech, Orange, Jan. 3, 2011 (31 for 247)8.00–Georgia vs. West Virginia, Sugar, Jan. 2, 2006 (28 for 224)8.00–USC vs. Illinois, Rose, Jan. 1, 2008 (43 for 344)
Most Rushing Yards Per Attempt, Championship Game8.03–Texas vs. USC, Rose, Jan. 4, 2006 (36 for 289)6.89–*USC vs. Oklahoma, Orange, Jan. 4, 2005 (28 for 193)5.90--Alabama vs. Notre Dame, (Miami), Jan. 7, 20135.66–Florida vs. Oklahoma, (Miami), Jan. 8, 2009 (44 for 249)5.35–Virginia Tech vs. Florida State, Sugar, Jan. 4, 2000 (52 for 278)
Most Rushing Yards Per Attempt, All Bowl Games9.26–Texas Tech vs. Air Force, Copper, 1995 (39 for 361)
Fewest Rushing Attempts15–Oklahoma State vs. Stanford (ot), Fiesta, Jan. 2, 2012 (65 yards)17–Florida State vs. Oklahoma, Orange, Jan. 3, 2001 (27 yards)18–Hawaii vs. Georgia, Sugar, Jan. 1, 2008 (-5 yards)20–TCU vs. Boise State, Fiesta, Jan. 4, 2010 (36 yards)20–Florida vs. Miami (Fla.), Sugar, Jan. 2, 2001 (140 yards)
Fewest Rushing Attempts, Championship Game17–Florida State vs. Oklahoma, Orange, Jan. 3, 2001 (27 yards)19--Notre Dame vs. Alabama, (Miami), Jan. 7, 2013 (32 yards)23–Florida State vs. Virginia Tech, Sugar, Jan. 4, 2000 (30 yards) 23–Ohio State vs. Florida, (Glendale), Jan. 8, 2007 (47 yards)26–Miami (Fla.) vs. Nebraska, Rose, Jan. 3, 2002 (110 yards)
Fewest Rushing Attempts, All Bowl Games12–Vanderbilt vs. Air Force, Hall of Fame, 1982 (35 yards)
Fewest Rushing Attempts Combined50–USC (23) and Michigan (27), Rose, Jan. 1, 200752–TCU (20) and Boise State (32), Fiesta, Jan. 4, 201053–Oklahoma (36) and Florida State (17), Orange, Jan. 3, 200157–Florida (34) and Cincinnati (23), Sugar, Jan. 1, 201057–Utah (24) and Alabama (33), Sugar, Jan. 2, 2009
Fewest Rushing Attempts Combined, Championship Game53–Oklahoma (36) vs. Florida State (17), Orange, Jan. 3, 2001
Fewest Rushing Attempts Combined, All Bowl Games50–USC (23) vs. Michigan (27), Rose, Jan.1, 2007
Fewest Rushing Yards -5–Stanford vs. Wisconsin, Rose, Jan. 1, 2000 (27 attempts) -5–Hawaii vs. Georgia, Sugar, Jan. 1, 2008 (18 attempts) 4–Washington State vs. Oklahoma, Rose, Jan. 1, 2003 (21 attempts)12–Michigan vs. USC, Rose, Jan. 1, 2007 (27 attempts)13–Utah vs. Alabama, Sugar, Jan. 2, 2009 (24 attempts)

160
Fewest Rushing Yards, Championship Game27–Florida State vs. Oklahoma, Orange, Jan. 3, 2001 (17 attempts)30–Florida State vs. Virginia Tech, Sugar, Jan. 4, 2000 (23 attempts)32--Notre Dame vs. Alabama, (Miami), Jan. 7, 2013 (19 attempts)39–LSU vs. Alabama, (New Orleans), Jan. 9, 2012 (27 attempts)47–Ohio State vs. Florida, (Glendale), Jan. 8, 2007 (23 attempts)
Fewest Rushing Yards, All Bowl Games-61–Kansas State vs. Boston College, Aloha, 1994 (23 attempts)
Fewest Rushing Yards Combined44–Utah (13) and Alabama (31), Sugar, Jan. 2, 200960–Michigan (12) and USC (48), Rose, Jan. 1, 200783–Oklahoma (56) and Florida State (27), Orange, Jan. 3, 2001113–TCU (36) and Boise State (77), Fiesta, Jan. 4, 2010117–USC (68) and Michigan (49), Rose, Jan. 1, 2004
Fewest Rushing Yards Combined, Championship Game83–Oklahoma (56) and Florida State (27), Orange, Jan. 3, 2001
Fewest Rushing Yards Combined, All Bowl Games51–Utah (6) and Arizona (45), Freedom, 1994
PASSINGMost Pass Attempts58–Texas vs. Ohio State, Fiesta, Jan. 5, 2009 (41 completions)57–Hawaii vs. Georgia, Sugar, Jan. 1, 2008 (35 completions)53–LSU vs. Illinois, Sugar, Jan. 2, 2002 (31 completions)52–Florida State vs. Oklahoma, Orange, Jan. 3, 2001 (25 completions)52–Kansas State vs. Ohio State, Fiesta, Jan. 2, 2004 (20 completions)
Most Pass Attempts, Championship Game52–Florida State vs. Oklahoma, Orange, Jan. 3, 2001 (25 completions)44–Miami (Fla.) vs. Ohio State (2 ot), Fiesta, Jan. 3, 2003 (29 completions)42–Texas vs. Alabama (Pasadena), Jan. 7, 2010 (17 completions)41–Oregon vs. Auburn (Glendale), Jan. 10, 2011 (28 completions)41–Oklahoma vs. Florida, (Miami), Jan. 8, 2009 (26 completions)41–*USC vs. Texas, Rose, Jan. 4, 2006 (29 completions)
Most Pass Attempts, All Bowl Games75–Purdue vs. Washington State, Sun, 2001 (38 completions)
Most Pass Attempts Combined91–Miami (Fla.) (40) and Florida (51), Sugar, Jan. 2, 200191–Oklahoma (39) and Florida State (52), Orange, Jan. 3, 200189–Oklahoma (50) and Connecticut (39), Fiesta, Jan. 1, 201189–Oregon (42) and Colorado (47), Fiesta, Jan. 1, 200289–LSU (53) and Illinois (36), Sugar, Jan. 2, 2002
Most Pass Attempts, Combined, Championship Game91–Oklahoma (39) and Florida State (52), Orange, Jan. 3, 200181–*Texas (40) and USC (41), Rose, Jan. 4, 200676–Auburn (35) and Oregon (41), (Glendale), Jan. 10, 201171–Florida (30) and Oklahoma (41), (Miami), Jan. 8, 200971–*USC (35) and Oklahoma (36), Orange, Jan. 4, 2005
Most Pass Attempts Combined, All Bowl Games116–Purdue (75) and Washington State (41), Sun, 2001
Most Pass Completions41–Texas vs. Ohio State, Fiesta, Jan. 5, 2009 (58 attempts)35–Michigan vs. Alabama (ot), Orange, Jan. 1, 2000 (47 attempts)35–Hawaii vs. Georgia, Sugar, Jan. 1, 2008 (57 attempts)34–Oklahoma vs. Connecticut, Fiesta, Jan. 1, 2011 (50 attempts)33–Florida vs. Maryland, Orange, Jan. 2, 2002 (49 attempts)

161
Most Pass Completions, Championship Game30–Texas vs. USC, Rose, Jan. 4, 2006 (40 attempts)29–Miami (Fla.) vs. Ohio State (2 ot), Fiesta, Jan. 3, 2003 (44 attempts)29–*USC vs. Texas, Rose, Jan. 4, 2006 (41 attempts)28–Oregon vs. Auburn, (Glendale), Jan. 10, 2011 (41 attempts)26–Oklahoma vs. Florida, (Miami), Jan. 8, 2009 (41 attempts)26–Florida vs. Ohio State, (Glendale), Jan. 8, 2007 (37 attempts)
Most Pass Completions, All Bowl Games44–Texas Tech vs. Virginia, Gator, 2008 (69 attempts)
Most Pass Completions, Combined59–*Texas (30) and USC (29), Rose, Jan. 4, 200658–Florida (31) and Cincinnati (27), Sugar, Jan. 1, 201056--Oklahoma State (29) and Stanford (27) (ot), Fiesta, Jan. 2, 201256–Florida (33) and Maryland (23), Orange, Jan. 2, 200255–West Virginia (31) and Clemson (24), Orange, Jan. 4, 2012
Most Pass Completions Combined, Championship Game59–*Texas (30) and USC (29), Rose, Jan. 4, 200650–Oklahoma (25) and Florida State (25), Orange, Jan. 3, 200148–Auburn (20) and Oregon (28), (Glendale), Jan. 10, 201144–Florida (18) and Oklahoma (26), (Miami), Jan. 8, 200942–*USC (18) and Oklahoma (24), Orange, Jan. 4, 2005
Most Completions Combined, All Bowl Games64–Texas Tech (39) and Clemson (25), Tangerine, 200264–Texas (37) and Washington (27), Holiday, 2001
Most Passing Yards482–Florida vs. Cincinnati, Sugar, Jan. 1, 2010 (31 completions)456–Florida vs. Maryland, Orange, Jan. 2, 2002 (33 completions)444–LSU vs. Illinois, Sugar, Jan. 2, 2002 (31 completions)429–Oklahoma vs. Connecticut, Fiesta, Jan. 1, 2011 (34 completions)418–UCLA vs. Wisconsin, Rose, Jan. 1, 1999 (21 completions)
Most Passing Yards, Championship Game374–Oregon vs. Auburn, (Glendale), Jan. 10, 2011 (28 completions)365–*USC vs. Texas, Rose, Jan. 4, 2006 (29 completions)362–Miami (Fla.) vs. Nebraska, Rose, Jan. 3, 2002 (22 completions)332–*USC vs. Oklahoma, Orange, Jan. 4, 2005 (18 completions)329–Florida State vs. Virginia Tech, Sugar, Jan. 4, 2000 (20 completions)
Most Passing Yards, All Bowl Games576–Marshall vs. East Carolina, GMAC, 2001 (41 completions)576–Brigham Young vs. Penn State, Holiday, 1989 (42 completions)
Most Passing Yards, Combined746–Oklahoma State (399) and Stanford (347), Fiesta, Jan. 2, 2012746–LSU (444) and Illinois (302), Sugar, Jan. 2, 2002713–Florida (456) and Maryland (257), Orange, Jan. 2, 2002700–USC (391) and Michigan (309), Rose, Jan. 1, 2007686–USC (413) and Penn State (273), Rose, Jan. 1, 2009
Most Passing Yards Combined, Championship Game639–Auburn (265) and Oregon (374), (Glendale), Jan. 10, 2011632–*Texas (267) and USC (365), Rose, Jan. 4, 2006576–*USC (332) and Oklahoma (244), Orange, Jan. 4, 2005554–Florida State (329) and Virginia Tech (225), Sugar, Jan. 4, 2000534--Alabama (264) and Notre Dame (270), (Miami), Jan. 7, 2013
Most Passing Yards Combined, All Bowl Games907–Michigan State (376) and Fresno State (531), Silicon Valley, 2001

162
Fewest Pass Attempts9–Georgia Tech vs. Iowa, Orange, Jan. 5, 2010 (2 completions)12–Alabama vs. Texas, NCG, (Pasadena), Jan. 7, 2010 (6 completions)14–Ohio State vs. Florida, NCG (Phoenix), Jan. 8, 2007 (4 completions)14–West Virginia vs. Georgia, Sugar, Jan. 2, 2006 (11 completions)14–Wisconsin vs. Stanford, Rose, Jan. 1, 2000 (7 completions)
Fewest Pass Attempts, Championship Game12–Alabama vs. Texas, (Pasadena), Jan. 7, 2010 (6 completions)14–Ohio State vs. Florida, (Glendale), Jan. 8, 2007 (4 completions)15–Nebraska vs. Miami (Fla.), Rose, Jan. 3, 2002 (5 completions)17–LSU vs. Alabama, (New Orleans), Jan. 9, 2012 (11 completions)19–Tennessee vs. Florida State, Fiesta, Jan. 4, 1999 (11 completions)
Fewest Pass Attempts, All Bowl Games2–Air Force vs. Mississippi State, Liberty, 1991 (1 completion)2–Army vs. Michigan State, Cherry, 1984 (1 completion) 2–West Virginia vs. South Carolina, Peach, 1969 (1 completion)
Fewest Pass Attempts, Combined37--Stanford (20) and Wisconsin (17), Rose, Jan. 1, 201338–Georgia Tech (9) and Iowa (29), Orange, Jan. 5, 201041–Georgia (15) and Florida State (26), Sugar, Jan. 1, 2003 41–Tennessee (19) and Florida State (22), Fiesta, Jan. 4, 199947–West Virginia (14) and Georgia (33), Sugar, Jan. 2, 2006
Fewest Pass Attempts Combined, Championship Game41–Tennessee (19) and Florida State (22), Fiesta, Jan. 4, 1999
Fewest Pass Attempts Combined, All Bowl Games9–Fordham (4) and Missouri (5), Sugar, 1942
Fewest Pass Completions 2–Georgia Tech vs. Iowa, Orange, Jan. 5, 2010 (9 attempts) 4–Ohio State vs. Florida, NCG (Glendale), Jan. 8, 2007 (14 attempts) 5–Nebraska vs. Miami (Fla.), Rose, Jan. 3, 2002 (15 attempts) 6–Alabama vs. Texas, NCG (Pasadena), Jan. 7, 2010 (12 attempts) 6–Florida State vs. Miami (Fla.), Orange, Jan. 1, 2004 (19 attempts) Fewest Pass Completions, Championship Game 4–Ohio State vs. Florida, (Glendale), Jan. 8, 2007 (14 attempts) 5–Nebraska vs. Miami (Fla.), Rose, Jan. 3, 2002 (15 attempts) 6–Alabama vs. Texas (Pasadena), Jan. 7, 2010 (12 attempts) 7–Ohio State vs. Miami (Fla.), Fiesta, Jan. 3, 2003 (21 attempts) 9–Florida State vs. Tennessee, Fiesta, Jan. 4, 1999 (22 attempts)
Fewest Pass Completions, All Bowl Games0–13 times
Fewest Pass Completions Combined19–Georgia Tech (2) and Iowa (17), Orange, Jan. 5, 201020–Miami (Fla.) (14) and Florida State (6), Orange, Jan. 1, 200420–Tennessee (11) and Florida State (9), Fiesta, Jan. 4, 199923--Stanford (13) and Wisconsin (10), Rose, Jan. 1, 201323–Texas (17) and Alabama (6), NCG (Pasadena), Jan. 7, 201023–Georgia (10) and Florida State (13), Sugar, Jan. 1, 2003
Fewest Pass Completions Combined, Championship Game20–Tennessee (11) and Florida State (9), Fiesta, Jan. 4, 199923--Alabama (6) and Texas (17), Pasadena, Jan. 7, 201027--Oklahoma (13) and LSU (14), Sugar, Jan. 4, 200427–Nebraska (5) vs. Miami (Fla.) (22), Rose, Jan. 3, 2002

163
Fewest Completions Combined, All Bowl Games 3–Arizona State (0) and Catholic (3), Sun, 1940
Fewest Passing Yards12–Georgia Tech vs. Iowa, Orange, Jan. 5, 2010 (2 completions)35–Ohio State vs. Florida, NCG (Glendale), Jan. 8, 2007 (4 completions)53–LSU vs. Alabama, NCG (New Orleans), Jan. 9, 2012 (11 completions)58–Alabama vs. Texas, NCG (Pasadena), Jan. 7, 2010 (6 completions)62–Nebraska vs. Miami (Fla.), NCG, Rose, Jan. 3, 2002 (5 completions)
Fewest Passing Yards, Championship Game35–Ohio State vs. Florida, (Glendale), Jan. 8, 2007 (4 completions)53–LSU vs. Alabama, NCG (New Orleans), Jan. 9, 2012 (11 completions)58–Alabama vs. Texas (Pasadena), Jan. 7, 2010 (6 completions)62–Nebraska vs. Miami (Fla.), Rose, Jan. 3, 2002 (5 completions)102–Oklahoma vs. LSU, Sugar, Jan. 4, 2004 (13 completions)
Fewest Passing Yards, All Bowl Games-50–U of Mexico vs. Southwestern (Tex.), Sun, 1945 (2 completions)
Fewest Passing Yards Combined240--Stanford (157) vs. Wisconsin (83), Rose, Jan. 1, 2013243–Georgia Tech (12) and Iowa (231), Orange, Jan. 5, 2010249–Ohio State (35) and Florida (214), NCG (Glendale), Jan. 8, 2007253–Alabama (58) and Texas (195), NCG, (Pasadena), Jan. 7, 2010253–Florida State (96) and Miami (Fla.) (157), Orange, Jan. 1, 2004
Fewest Passing Yards, Combined, Championship Game249–Ohio State (35) and Florida (214), (Glendale), Jan. 8, 2007253–Alabama (58) and Texas (195), (Pasadena), Jan. 7, 2010255–Oklahoma (102) and LSU (153), Sugar, Jan. 4, 2004
Fewest Passing Yards Combined, All Bowl Games16–Arkansas (0) vs. LSU (16), Cotton, 194716–Arizona State (0) and Catholic (16), Sun, 1940
Most Interceptions By4–Alabama vs. Texas, NCG (Pasadena), Jan. 7, 20104–Cincinnati vs. Virginia Tech, Orange, Jan. 1, 20094–Hawaii vs. Georgia, Sugar, Jan. 1, 20083–Five times
Most Interceptions By, Championship Game4–Alabama vs. Texas, (Pasadena), Jan. 7, 20103–Oklahoma vs. USC, Orange, Jan. 4, 2005
Most Interceptions By, All Bowl Games8–Arizona vs. Auburn, Sun, 1968
Most Interceptions By, Combined5–Texas (4) and Alabama (1), NCG (Pasadena), Jan. 7, 20105–Cincinnati (4) and Virginia Tech (1), Orange, Jan. 1, 20095–Florida (3) vs. Miami (Fla.) (2), Sugar, Jan. 2, 20015–Hawaii (4) vs. Georgia (1), Sugar, Jan. 1, 2008
Most Interceptions By, Combined, Championship Game5–Texas (4) and Alabama (1), (Pasadena), Jan. 7, 20104–LSU (2) vs. Oklahoma (2), Sugar, Jan. 4, 20044–Florida State (2) vs. Tennessee (2), Fiesta, Jan. 4, 19994–Miami (Fla.) (2) vs. Ohio State (2), Fiesta, Jan. 3, 2003
Most Interceptions By, Combined, All Bowl Games12–Arizona (8) vs. Auburn (4), Sun, 1968
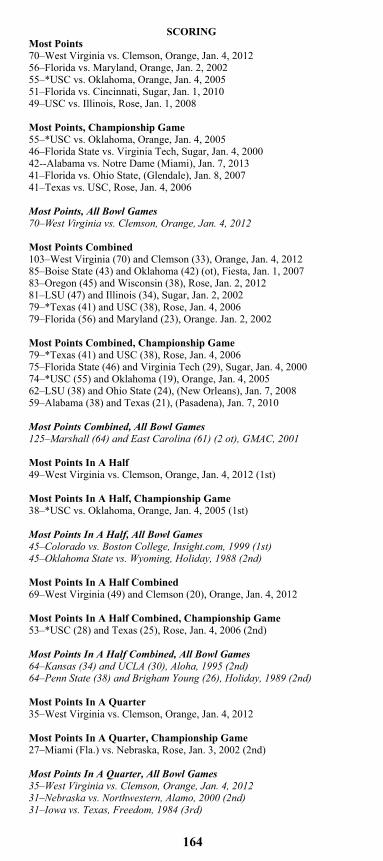
164
SCORINGMost Points70–West Virginia vs. Clemson, Orange, Jan. 4, 201256–Florida vs. Maryland, Orange, Jan. 2, 200255–*USC vs. Oklahoma, Orange, Jan. 4, 200551–Florida vs. Cincinnati, Sugar, Jan. 1, 201049–USC vs. Illinois, Rose, Jan. 1, 2008
Most Points, Championship Game55–*USC vs. Oklahoma, Orange, Jan. 4, 200546–Florida State vs. Virginia Tech, Sugar, Jan. 4, 200042--Alabama vs. Notre Dame (Miami), Jan. 7, 201341–Florida vs. Ohio State, (Glendale), Jan. 8, 2007 41–Texas vs. USC, Rose, Jan. 4, 2006
Most Points, All Bowl Games70–West Virginia vs. Clemson, Orange, Jan. 4, 2012
Most Points Combined103–West Virginia (70) and Clemson (33), Orange, Jan. 4, 201285–Boise State (43) and Oklahoma (42) (ot), Fiesta, Jan. 1, 200783–Oregon (45) and Wisconsin (38), Rose, Jan. 2, 201281–LSU (47) and Illinois (34), Sugar, Jan. 2, 200279–*Texas (41) and USC (38), Rose, Jan. 4, 200679–Florida (56) and Maryland (23), Orange. Jan. 2, 2002
Most Points Combined, Championship Game79–*Texas (41) and USC (38), Rose, Jan. 4, 200675–Florida State (46) and Virginia Tech (29), Sugar, Jan. 4, 200074–*USC (55) and Oklahoma (19), Orange, Jan. 4, 200562–LSU (38) and Ohio State (24), (New Orleans), Jan. 7, 200859–Alabama (38) and Texas (21), (Pasadena), Jan. 7, 2010
Most Points Combined, All Bowl Games125–Marshall (64) and East Carolina (61) (2 ot), GMAC, 2001
Most Points In A Half49–West Virginia vs. Clemson, Orange, Jan. 4, 2012 (1st)
Most Points In A Half, Championship Game38–*USC vs. Oklahoma, Orange, Jan. 4, 2005 (1st)
Most Points In A Half, All Bowl Games45–Colorado vs. Boston College, Insight.com, 1999 (1st)45–Oklahoma State vs. Wyoming, Holiday, 1988 (2nd)
Most Points In A Half Combined69–West Virginia (49) and Clemson (20), Orange, Jan. 4, 2012
Most Points In A Half Combined, Championship Game53–*USC (28) and Texas (25), Rose, Jan. 4, 2006 (2nd)
Most Points In A Half Combined, All Bowl Games64–Kansas (34) and UCLA (30), Aloha, 1995 (2nd)64–Penn State (38) and Brigham Young (26), Holiday, 1989 (2nd)
Most Points In A Quarter35–West Virginia vs. Clemson, Orange, Jan. 4, 2012
Most Points In A Quarter, Championship Game27–Miami (Fla.) vs. Nebraska, Rose, Jan. 3, 2002 (2nd)
Most Points In A Quarter, All Bowl Games35–West Virginia vs. Clemson, Orange, Jan. 4, 201231–Nebraska vs. Northwestern, Alamo, 2000 (2nd)31–Iowa vs. Texas, Freedom, 1984 (3rd)

165
Most Points In A Quarter Combined38–West Virginia (35) and Clemson (3), Jan. 4, 2012
Most Points In A Quarter Combined, Championship Game32–*Texas (18) and USC (14), Rose, Jan. 4, 2006 (4th)
Most Points In A Quarter Combined, All Bowl Games45–Nebraska (31) vs. Northwestern (14), Alamo, 2000 (2nd)
Most Points By A Losing Team42–Oklahoma vs. Boise State (43) (ot), Fiesta, Jan. 1, 200738–Wisconsin vs. Oregon (45), Rose, Jan. 2, 201238–*USC vs. Texas (41), Rose, Jan. 4, 2006
Most Points By A Losing Team, Championship Game38–*USC vs. Texas (41), Rose, Jan. 4, 2006
Most Points By A Losing Team, All Bowl Games61–East Carolina vs. Marshall (64) (2 ot), GMAC, 2001
Most Touchdowns Scored10–West Virginia vs. Clemson, Orange, Jan. 4, 2012 (6 pass, 3 run, 1 return)
Most Touchdowns Scored, Championship Game7–*USC vs. Oklahoma, Orange, Jan. 4, 2005 (5 pass, 2 rush)
Most Touchdowns Scored, All Bowl Games10--West Virginia vs. Clemson, Orange, Jan. 4, 2012 (6 pass, 3 run, 1 return)
Most Touchdowns Scored Combined14–West Virginia (10) and Clemson (4), Orange, Jan. 4, 2012
Most Touchdowns Scored Combined, Championship Game10–*Texas (5) and USC (5), Rose, Jan. 4, 200610–Florida State (6) and Virginia Tech (4), Sugar, Jan. 4, 2000
Most Touchdowns Scored Combined, All Bowl Games16–Marshall (9) and East Carolina (7) (2ot), GMAC, 2001
Most Rushing Touchdowns5–Texas vs. USC, NCG, Rose, Jan. 4, 20064–Wisconsin vs. UCLA, Rose, Jan. 1, 19994–LSU vs. Illinois, Sugar, Jan. 2, 20024–USC vs. Iowa, Orange, Jan. 2, 20034–Ohio State vs. Miami (Fla.) (2 ot), Fiesta, Jan. 3, 20034–Kansas State vs. Ohio State, Fiesta, Jan. 2, 20044–Texas vs. Michigan, Rose, Jan. 1, 20054–West Virginia vs. Georgia, Sugar, Jan. 2, 20064–*USC vs. Texas, Rose, Jan. 4, 20064–West Virginia vs. Oklahoma, Fiesta, Jan. 2, 2008
Most Rushing Touchdowns, Championship Game5–Texas vs. USC, Rose, Jan. 4, 20064–Alabama vs. Texas (Pasadena), Jan. 7, 20104–Ohio State vs. Miami (Fla.) (2 ot), Fiesta, Jan. 3, 20034–*USC vs. Texas, Rose, Jan. 4, 20063–Virginia Tech vs. Florida State, Sugar, Jan. 4, 20003–Florida vs. Ohio State, (Glendale), Jan. 8, 2007
Most Rushing Touchdowns, All Bowl Games8–Centre vs. TCU, Fort Worth Classic, 1921

166
Most Rushing Touchdowns Combined9–*Texas (5) and USC (4), Rose, Jan. 4, 20066–West Virginia (4) and Georgia (2), Sugar, Jan. 2, 20065–Wisconsin (4) and UCLA (1), Rose, Jan. 1, 19995–Florida (3) and Maryland (2), Orange, Jan. 2, 20025–Ohio State (4) and Miami (Fla.) (1), Fiesta, Jan. 3, 20035–Notre Dame (3) and Ohio State (2), Fiesta, Jan. 2, 20065–West Virginia (3) and Clemson (2), Orange, Jan. 4, 20125–West Virginia (4) and Oklahoma (1), Fiesta, Jan. 2, 2008
Most Rushing Touchdowns Combined, Championship Game9–*Texas (5) and USC (4), Rose, Jan. 4, 20065–Ohio State (4) and Miami (Fla.) (1) (2 ot), Fiesta, Jan. 3, 20034–Alabama (4) and Texas (0) (Pasadena), Jan. 7, 20104–LSU (2) and Oklahoma (2), Sugar, Jan. 4, 20044–Florida (3) and Ohio State (1), (Glendale), Jan. 8, 2007
Most Rushing Touchdowns Combined, All Bowl Games12–Texas Tech (6) and Air Force (6), Copper, 1995
Most Touchdown Passes6–West Virginia vs. Clemson, Orange, Jan. 4, 20125–*USC vs. Oklahoma, Orange, Jan. 4, 20055–Illinois vs. LSU, Sugar, Jan. 2, 20025–Florida vs. Maryland, Orange, Jan. 2, 20024–11 Times
Most Touchdown Passes, Championship Game5–*USC vs. Oklahoma, Orange, Jan. 4, 20054--Alabama vs. Notre Dame (Miami), Jan. 7, 20134–LSU vs. Ohio State, (Sugar), Jan. 7, 2008 4–Florida State vs. Virginia Tech, Sugar, Jan. 4, 20003–Miami (Fla.) vs. Nebraska, Rose, Jan. 3, 2002
Most Touchdown Passes, All Bowl Games6–West Virginia vs. Clemson, Orange, Jan. 4, 20126–Tulsa vs. Bowling Green, GMAC, 20086–Iowa vs. Texas, Freedom, 1984
Most Touchdown Passes Combined8–West Virginia (6) and Clemson (2), Orange, Jan. 4, 20128–Illinois (5) and LSU (3), Sugar, Jan. 2, 20027–*USC (5) and Oklahoma (2), Orange, Jan. 4, 20056–Florida (3) and Cincinnati (3), Sugar, Jan. 1, 20106–USC (4) and Penn State (2), Rose, Jan. 1, 20096–LSU (4) vs. Ohio State (2), NCG (New Orleans), Jan. 7, 20086–Boise State (4) vs. Oklahoma (2) (ot), Fiesta, Jan. 1, 2007 6–Florida (5) vs. Maryland (1), Orange, Jan. 2, 2002
Most Touchdown Passes Combined, Championship Game7–*USC (5) vs. Oklahoma (2), Orange, Jan. 4, 20056–LSU (4) vs. Ohio State (2), (New Orleans), Jan. 7, 20085–Florida State (4) vs. Virginia Tech (1), Sugar, Jan. 4, 20005--Alabama (4) vs. Notre Dame (1), (Miami), Jan. 7, 20134–Auburn (2) vs. Oregon (2), (Glendale), Jan. 10, 2011
Most Touchdown Passes Combined, All Bowl Games9–Bowling Green (5) vs. Memphis (4), GMAC, 2004
Fewest Points0–LSU vs. Alabama (21), NCG (New Orleans), Jan. 9, 20122–Florida State vs. Oklahoma (13), Orange, Jan. 3, 20017–Pittsburgh vs. Utah (35), Fiesta, Jan. 1, 20057–Cincinnati vs. Virginia Tech (20), Orange, Jan. 1, 20099–Notre Dame vs. Oregon State (41), Fiesta, Jan. 1, 20019–Stanford vs. Wisconsin (17), Rose, Jan. 1, 2000

167
Fewest Points, Championship Game0–LSU vs. Alabama (21), (New Orleans), Jan. 9, 20122–Florida State vs. Oklahoma (13), Orange, Jan. 3, 200113–Oklahoma vs. Florida State (2), Orange, Jan. 3, 200114--Notre Dame vs. Alabama (42), (Miami), Jan. 7, 201314–Oklahoma vs. Florida (24), (Miami), Jan. 8, 200914–Ohio State vs. Florida (41), (Glendale), Jan. 8, 200714–Oklahoma vs. LSU (21), Sugar, Jan. 4, 200414–Nebraska vs. Miami (Fla.) (37), Rose, Jan. 3, 2002
Fewest Points, All Bowl Games0–By Many Teams, Last by LSU vs. Alabama (21), NCG (New Orleans) Jan. 9, 2012
Fewest Points Combined15–Oklahoma (13) and Florida State (2), Orange, Jan., 3, 200121–Alabama (21) and LSU (0), NCG (New Orleans), Jan. 9, 201226–Wisconsin (17) and Stanford (9), Rose, Jan. 1, 200027–TCU (10) and Boise State (17), Fiesta, Jan. 4, 201027–Virginia Tech (20) and Cincinnati (7), Orange, Jan. 1, 2009
Fewest Points Combined, Championship Game15–Oklahoma (13) and Florida State (2), Orange, Jan. 3, 2001
Fewest Points Combined, All Bowl Games0–4 times, last by TCU and Air Force, Cotton, 1959
SafetiesAuburn vs. Oregon, NCG (Glendale), Jan. 10, 2011Arkansas vs. *Ohio State, Sugar, Jan. 4, 2011Virginia Tech vs. Stanford, Orange, Jan. 3, 2011Penn State vs. Florida State (3 ot), Orange, Jan. 3, 2006Oklahoma vs. USC, (NCG) Orange, Jan. 4, 2005Florida St. vs. Oklahoma, Orange, Jan. 3, 2001
FIRST DOWNSMost First Downs33–Texas vs. Ohio State, Fiesta, Jan. 5, 200932–LSU vs. Illinois, Sugar, Jan. 2, 200231--West Virginia vs. Clemson, Orange, Jan. 4, 201231--LSU vs. Notre Dame, Sugar, Jan. 3, 2007, 30--five times
Most First Downs, Championship Game30–Texas vs. USC, Rose, Jan. 4, 200630–*USC vs. Texas, Rose, Jan. 4, 200628--Auburn vs. Oregon, (Glendale), Jan. 10, 201125--Oklahoma vs. Florida (Miami), Jan. 8, 200925--LSU vs. Ohio State (New Orleans), Jan. 7, 2008
Most First Downs, All Bowl Games36–Marshall vs. East Carolina, GMAC, 2001 36–Oklahoma vs. Virginia, Gator, 1991
Most First Downs Combined60–*Texas (30) and USC (30), Rose, Jan. 4, 200651--Auburn (28) and Oregon (23), (Glendale), Jan. 10, 2011
Most First Downs Combined, Championship Game60–*Texas (30) and USC (30), Rose, Jan. 4, 2006
Most First Downs Combined, All Bowl Games62–NC State (34) and Kansas (28), Tangerine, 2003
Most First Downs Rushing22–Nebraska vs. Tennessee, Fiesta, Jan. 2, 2000

168
Most First Downs Rushing, Championship Game15–Texas vs. USC, Rose, Jan. 4, 2006
Most First Downs Rushing, All Bowl Games26–Navy vs. Colorado State, Poinsettia, 200526–Oklahoma vs. Auburn, Sugar, 1972
Most First Downs Passing23–Texas vs. Ohio State, Fiesta, Jan. 5, 200923–LSU vs. Illinois, Sugar, Jan. 2, 200223–Florida vs. Maryland, Orange, Jan. 2, 2002
Most First Downs Passing, Championship Game16–Oregon vs. Auburn, (Glendale), Jan. 10, 201115–Oklahoma vs. Florida, (Miami), Jan. 8, 200915–*USC vs. Texas, Rose, Jan. 4, 2006
Most First Downs Passing, All Bowl Games27–Brigham Young vs. Penn State, Holiday, 1989
Most First Downs By Penalty7–Oklahoma vs. West Virginia, Fiesta, Jan. 2, 2008
Most First Downs By Penalty, Championship Game4–LSU vs. Ohio State, (New Orleans), Jan. 7, 20084–Tennessee vs. Florida State, Fiesta, Jan. 4, 1999
Most First Downs By Penalty, All Bowl Games8–West Virginia vs. Florida State, Gator, 2005
SCORING DRIVESLongest Scoring Drive By Yards99–Nebraska vs. Tennessee, Fiesta, Jan. 2, 2000 (10 plays, TD)
Longest Scoring Drive by Yards, Championship Game97--Alabama vs. Notre Dame, (Miami), Jan. 7, 2013 (10 plays, TD)92--Oklahoma vs. USC, Orange, Jan. 4, 2005 (12 plays, TD)
Longest Scoring Drive By Plays19–Ohio State vs. Oregon, Rose, Jan. 1, 2010 (67 yards, FG)
Longest Scoring Drive By Plays, Championship Game14--Alabama vs. Notre Dame (Miami), Jan. 7, 2013 (86 yards, TD)14–LSU vs. Ohio State, (New Orleans), Jan. 7, 2008 (65 yards, TD)14–LSU vs. Ohio State, (New Orleans), Jan. 7, 2008 (80 yards, TD)
Longest Scoring Drive By Time8:10–Purdue vs. Washington, Rose, Jan. 1, 2001 (90 yards in 16 plays, TD)
Longest Scoring Drive By Time, Championship Game7:41--Alabama vs. Notre Dame, (Miami) Jan. 7, 2013 (86 yds. in 14 plays)6:52–Florida vs. Oklahoma, (Miami), Jan. 8, 2009 (76 yds in 11 plays, TD)6:51–LSU vs. Ohio State, (New Orleans), Jan. 7, 2008 (65 yds in 14 plays, FG)
TIME OF POSSESSIONMost Time of Possession41:47–Stanford vs. Oklahoma State (ot), Fiesta, Jan. 2, 201241:37–Ohio State vs. Oregon, Rose, Jan. 1, 201040:48–Florida vs. Ohio State, (Glendale), Jan. 8, 200739:39–Virginia Tech vs. Cincinnati, Orange, Jan. 1, 200939:16–LSU vs. Illinois, Sugar, Jan. 2, 2002

169
Most Time of Possession, Championship Game40:48–Florida vs. Ohio State, (Glendale), Jan. 8, 200738:13--Alabama vs. Notre Dame, (Miami), Jan. 7, 201336:33--Oklahoma vs. Florida State, Orange, Jan. 3, 2001
TURNOVERSMost Turnovers6–Hawaii vs. Georgia, Sugar, Jan. 1, 2008
Most Turnovers, Championship Game5–Oklahoma vs. USC, Orange, Jan. 4, 20055–Miami (Fla.) vs. Ohio State (2 ot), Fiesta, Jan. 3, 2003
Most Turnovers Combined7–Hawaii (6) and Georgia (1), Sugar, Jan., 2, 20087–Oklahoma (4) and Boise State (3), Fiesta, Jan. 1, 20077–Miami (Fla.) (5) and Ohio State (2) (2 ot), Fiesta, Jan. 3, 20037–Florida State (4) and Tennessee (3), Fiesta, Jan. 4, 1999
Most Turnovers Combined, Championship Game7–Miami (Fla.) (5) and Ohio State (2) (2 ot), Fiesta, Jan. 3, 20037–Florida State (4) and Tennessee (3), Fiesta, Jan. 4, 1999
Most Fumbles6–Illinois vs. USC, Rose, Jan. 1, 2008 (2 lost)
Most Fumbles, Championship Game4–Texas vs. USC, Rose, Jan. 4, 2006 (1 lost)4–Nebraska vs. Miami (Fla.), Rose, Jan. 3, 2002 (2 lost)4–Florida State vs. Tennessee, Fiesta, Jan. 4, 1999 (1 lost)
Most Fumbles, All Bowl Games11–Mississippi vs. Alabama, Sugar, 1964 (6 lost)
Most Fumbles, Combined7–Florida State (4) and Tennessee (3), Fiesta, Jan. 4, 1999
Most Fumbles Combined, Championship Game7–Florida State (4) and Tennessee (3), Fiesta, Jan. 4, 1999
Most Fumbles Combined, All Bowl Games17–Mississippi (11) and Alabama (6), Sugar, 1964 (9 lost)
Most Fumbles Lost3–Georgia vs. West Virginia, Sugar, Jan. 2, 20063–Miami (Fla.) vs. Ohio State (2 ot), Fiesta, Jan. 3, 20033–Virginia Tech vs. Florida State, Sugar, Jan. 4, 20003–Syracuse vs. Florida, Orange, Jan. 2, 1999
Most Fumbles Lost, Championship Game3–Miami (Fla.) vs. Ohio State (2 ot), Fiesta, Jan. 3, 20033–Virginia Tech vs. Florida State, Sugar, Jan. 4, 2000
Most Fumbles Lost Combined4–Louisville (2) and Wake Forest (2), Orange, Jan. 2, 2007 3–six times
Most Fumbles Lost Combined, Championship Game3–Miami (Fla.) (3) and Ohio State (0) (2 ot), Fiesta, Jan. 3, 2003 3–Virginia Tech (3) and Florida State (0), Sugar, Jan. 4, 20003–Tennessee (2) and Florida State (1), Fiesta, Jan. 4, 1999
Most Fumbles Lost Combined, All Bowl Games9–Mississippi (6) and Alabama (3), Sugar, 1964

170
Most Passes Had Intercepted4–Texas vs. Alabama, NCG (Pasadena), Jan. 7, 20104–Cincinnati vs. Virginia Tech, Orange, Jan. 1, 20094–Hawaii vs. Georgia, Sugar, Jan. 1, 20083–6 Times
Most Passes Had Intercepted, Championship Game4–Texas vs. Alabama, (Pasadena), Jan. 7, 20103–Oklahoma vs. USC, Orange, Jan. 4, 2005
Most Passes Had Intercepted, All Bowl Games8–Arizona vs. Auburn, Sun, 1968
Most Passes Had Intercepted, Combined5–Texas (4) and Alabama (1), NCG (Pasadena), Jan. 7, 20105–Cincinnati (4) and Virginia Tech (1), Orange, Jan. 1, 20095–Hawaii (4) and Georgia (1), Sugar, Jan. 1, 20085–Florida (3) and Miami (Fla.) (2), Sugar, Jan. 2, 2001
Most Passes Had Intercepted, Combined, Championship Game5–Texas (4) and Alabama (1), (Pasadena), Jan. 7, 20104--Florida (2) and Oklahoma (2) (Miami), Jan. 8, 20094–LSU (2) and Oklahoma (2), Sugar, Jan. 4, 20044–Ohio State (2) and Miami (Fla.) (2) (2 ot), Fiesta, Jan. 3, 20034–Florida State (2) and Tennessee (2), Fiesta, Jan. 4, 1999
Most Passes Had Intercepted, Combined, All Bowl Games 12–Arizona (8) and Auburn (4), Sun, 1968
PUNTSMost Punts11–Penn State vs. Florida State (3 ot), Orange, Jan. 3, 2006
Most Punts, Championship Game10–Florida State vs. Oklahoma, Orange, Jan. 3, 2001
Most Punts, All Bowl Games17–Duke vs. USC, Rose, 1939
Most Punts, Combined20–Penn State (11) and Florida State (9) (3ot), Orange, Jan. 3, 2006
Most Punts Combined, Championship Game18–Florida State (10) and Oklahoma (8), Orange, Jan. 3, 2001
Most Punts Combined, All Bowl Games28–Tennessee (15) vs. Rice (13), Orange, 1947 28–Santa Clara (14) vs. LSU (14), Sugar, 1938
Fewest Punts1--Louisville vs. Florida, Sugar, Jan. 2, 20131–Virginia Tech vs. Michigan (ot), Sugar, Jan. 3, 20121–Florida vs. Cincinnati, Sugar, Jan. 1, 20101–Ohio State vs. Notre Dame, Fiesta, Jan. 2, 2006 1–Utah vs. Pittsburgh, Fiesta, Jan. 1, 2005
Fewest Punts, Championship Game2–*Texas vs. USC, Rose, Jan. 4, 20062–*USC vs. Texas, Rose, Jan. 4, 20063–Five times
Fewest Punts, All Bowl Games0–Six times

171
Fewest Punts Combined4–*Texas (2) and USC (2), Rose, Jan. 4, 2006
Fewest Punts Combined, Championship Game4–*Texas (2) and USC (2), Rose, Jan. 4, 2006
KICK RETURNSMost Punt Return Yards180–Florida State vs. Penn State (3 ot), Orange, Jan. 3, 2006 (7 returns)
Most Punt Return Yards, Championship Game88–Tennessee vs. Florida State, Fiesta, Jan. 4, 1999 (4 returns)
Most Punt Return Yards, All Bowl Games180–Florida State vs. Penn State (3 ot), Orange, Jan. 3, 2006 (7 returns)
Most Kickoff Return Yards284–Oklahoma vs. West Virginia, Fiesta, Jan. 2, 2008 (9 returns)
Most Kickoff Return Yards, Championship Game193–Ohio State vs. Florida, (Glendale), Jan. 8, 2007 (6 returns)139–Oklahoma vs. USC, Orange, Jan. 4, 2005 (7 returns)
Most Kickoff Return Yards, All Bowl Games284–Oklahoma vs. West Virginia, Fiesta, Jan. 2, 2008 (9 returns)
PENALTIESMost Penalties18–Oregon State vs. Notre Dame, Fiesta, Jan. 1, 2001 18–Alabama vs. Michigan (ot), Orange, Jan. 1, 2000
Most Penalties, Championship Game12–Miami (Fla.) vs. Nebraska, Rose, Jan. 3, 2002 12–Florida State vs. Tennessee, Fiesta, Jan. 4, 1999
Most Penalties, All Bowl Games21–Mississippi State vs. Clemson, Peach, 1999
Most Penalties Combined28–Alabama (18) and Michigan (10), Orange, Jan. 1, 2000
Most Penalties Combined, Championship Game21–Florida State (12) and Tennessee (9), Fiesta, Jan. 4, 1999
Most Penalties Combined, All Bowl Games29–Mississippi State (21) and Clemson (8), Peach, 1999 29–Florida (15) and Florida State (14), Sugar, 1997 29–Tulsa (16) and McNeese State (13), Independence, 1976
Most Penalty Yards174–Oregon State vs. Notre Dame, Fiesta, Jan. 1, 2001 (18 penalties)
Most Penalty Yards, Championship Game110–Florida State vs. Tennessee, Fiesta, Jan. 4, 1999 (12 penalties)
Most Penalty Yards, All Bowl Games202–Miami (Fla.) vs. Texas, Cotton, 1991 (16 penalties)
Most Penalty Yards Combined247–Alabama (132) and Michigan (115) (ot), Orange, Jan. 1, 2000
Most Penalty Yards Combined, Championship Game165–Florida State (110) and Tennessee (55), Fiesta, Jan. 4, 1999
Most Penalty Yards Combined, All Bowl Games295–Florida State (174) and West Virginia (121), Gator, 2005

172
DEFENSEMost Sacks By8–Stanford vs. Virginia Tech, Orange, Jan. 3, 20118–Utah vs. Alabama, Sugar, Jan., 2, 20098–Georgia vs. Hawaii, Sugar, Jan. 1, 2008
*Later vacated.
The Last TimeKickoff return for touchdown – Robbie Frey, Connecticut vs. Oklahoma, 2011 Fiesta Bowl (95 yards)
Punt return for touchdown – Javier Arenas, Alabama vs. Utah, 2009 Sugar Bowl (73 yards)
Blocked punt for touchdown – John Hollins, Ohio State vs. Kansas State, 2004 Fiesta Bowl (7 yards)
Blocked field goal for touchdown – None
Pass interception for touchdown – Tony Jefferson, Oklahoma vs. Connecticut, 2011 Fiesta Bowl (22 yards)
Fumble returned for touchdown – Darwin Cook, West Virginia vs. Clemson, 2012 Orange Bowl (99 yards) Louis Nzegwu, Wisconsin vs. Oregon, 2012 Orange Bowl (33 yards)
Safety – Auburn vs. Oregon, 2011 NCG (Glendale)
Defensive two-point conversion– None
Shutout – Alabama 21, LSU 0, NCG (New Orleans), Jan. 9, 2012
BCS AttendanceHighest Championship Game Attendance (beginning in 2007)94,906–Alabama vs. Texas, (Pasadena),
Highest Rose Bowl Attendance (BCS games only)94,118–TCU vs. Wisconsin, Jan. 1, 2011
Highest Orange Bowl Attendance (BCS games only)80, 120--Alabama vs. Notre Dame, Jan. 7, 2013
Highest Sugar Bowl Attendance (BCS games only)79,342—LSU vs. Oklahoma, Jan. 4, 2004
Highest Fiesta Bowl Attendance (BCS games only)80,470—Tennessee vs. Florida St., Jan. 4, 1999

173
National Championship Game Most Outstanding Players
2013 RB Eddie Lacy, Alabama vs. Notre Dame LB C.J. Mosley, Alabama vs. Notre Dame
2012 – QB A.J. McCarron, Alabama vs. LSU LB Courtney Upshaw, Alabama vs. LSU
2011 – RB Michael Dyer, Auburn vs. Oregon DE Nick Fairley, Auburn vs. Oregon
2010 – RB Mark Ingram, Alabama vs. Texas DT Marcell Dareus, Alabama vs. Texas
2009 – QB Tim Tebow, Florida vs. Oklahoma DE Carlos Dunlap, Florida vs. Oklahoma
2008 – QB Matt Flynn, LSU vs. Ohio State DT Ricky Jean-Francois, LSU vs. Ohio State
2007 – QB Chris Leak, Florida vs. Ohio State DE Derrick Harvey, Florida vs. Ohio State
2006 – QB Vince Young, Texas vs. USC (Rose Bowl) S/CB Michael Huff, Texas vs. USC (Rose Bowl)
2005 – *QB Matt Leinart, USC vs. Oklahoma (Orange Bowl)
2004 – RB Justin Vincent, LSU vs. Oklahoma (Sugar Bowl)
2003 – QB Craig Krenzel, Ohio State vs. Miami, Fla. (Fiesta Bowl) S Michael Doss, Ohio State vs. Miami, Fla. (Fiesta Bowl)
2002 – QB Ken Dorsey and WR Andre Johnson, Miami, Fla. vs. Nebraska (Rose Bowl)
2001 – LB Torrance Marshall, Oklahoma vs. Florida State (Orange Bowl)
2000 – WR Peter Warrick, Florida State vs. Virginia Tech (Sugar Bowl)
1999 – WR Peerless Price, Tennessee vs. Florida State (Fiesta Bowl) CB Dwayne Goodrich, Tennessee vs. Florida State (Fiesta Bowl)
*Later vacated.

174
NOTES

TOM MICKLE INTERNSHIP PROGRAM
The Football Bowl Subdivision con-ferences and institutions sponsor the Tom Mickle BCS Internship in the of-fice of the bowl that will host the na-tional championship game each year. The program, currently in its eighth year, is intended as an opportunity for a young person to become involved in administering the event. It honors the memory of Mr. Mickle, who made many contributions to college football in general and to the development of the BCS in particular. At the time of his passing, Mick-le was the executive director of Florida Citrus Sports, host of the Capital One Bowl and the Champs Sports Bowl. Prior to his appointment at Florida Citrus Sports in 2002, he was an associ-ate commissioner at the Atlantic Coast Conference and also had been an assistant athletics director at Duke University.
The Bowl Championship Series Tom Mickle Interns
2006-07 ...Fiesta Bowl ....... Kelly Bishop, Auburn B.A .in Mass Communications2007-08 ...Sugar Bowl ....... Perry Thomas, Mississippi State B.A. in Communications, M.S. in Physical Education2008-09 ...Orange Bowl ..... Thomas Norton, Wake Forest B.A. in Communications2009-10 ...Rose Bowl......... Andrew Tanker, NC State B.A. in Media Communications2010-11....Fiesta Bowl ....... Lauren Sujkowski, Penn State B.A. Public Relations2011-12 ...Sugar Bowl ....... Allison Horowitz, Tulane B.A. Economics and Social Policy2012-13....Orange Bowl...... Jennifer Sun, LSU B.S. Sports Administration
Tom Mickle

The Bowl Championship Series
January 6, 2014
January 3, 2014
January 1, 2014
January 2, 2014
January 1, 2014