2013-2014 programme report - ireland’s national …€¦ · programme report an clÁr...
TRANSCRIPT

ProgrammeReport
AN CLÁR NÁISIÚNTA SCAGTHÁSTÁLA CEIRBHEACSTHE NATIONAL CERVICAL SCREENING PROGRAMME
Cuid d’Fheidhmeannacht na Seirbhíse Sláinte. Part of the Health Service Executive.
2013-2014
CS/PR/PM-19 Rev 1ISBN 978-1-907487-20-0

Key achievements 2013-2014 3
Introduction to the statistics 2013/2014 4
Programme coverage 5
Laboratory turnaround time 8
CervicalCheck Women’s Charter 8
Cytology 9
Referral to colposcopy 10
Cytology correlation measures 10
Diagnosis and treatment 11
Reasons for referral 13
Waiting times 15
Biopsy rate 17
Treatment at colposcopy 18
Histology 21
References 24
Contents

CervicalCheck Programme Report 2012/20132

CervicalCheck Programme Report 2013/2014
• Coverage in the 5-year period to the end of August 2014 increased to 77% of the target population (it was 74.7% at the end of August 2013). The objective of the programme for coverage (5-year) remains at 80%.
• There was a significant improvement in the number of women who received a letter advising that the results of their smear test was available within four weeks of the smear test date (88.6%).
• There was a reduction in the number of follow-up visits in colposcopy services compared to the previous year. This reduction is a result of the successful introduction of HPV testing in combination with cytology to identify women at low risk of high grade CIN who are suitable for discharge.
• The waiting time targets for appointments in colposcopy were exceeded for all categories of referrals – clinical indication urgent, clinical indication non-urgent, high grade and low grade.
• The biopsy rate for women attending colposcopy increased relative to the previous year, both for first appointments and for all appointments in colposcopy services.
• Treatments were performed in colposcopy services as an outpatient procedure under local anaesthetic in 94.3% of cases, well ahead of the target of 80%.
• Treatment at the first visit for women who presented with low grade abnormalities was carried out in 2.9% of cases, well below the 10% target.
• 92.5% of women treated at the first visit to colposcopy had CIN detected (the standard is 90%). In addition, 91.5% of women who had an excisional treatment at any visit had CIN detected (the standard is 80%).
• During the reporting year the positive predictive value of a colposcopic impression of high grade disease was 73%, appreciably in excess of the programme’s standard of >65%.
• 7,034 cases of high grade CIN (CIN2, CIN3 or AIS) were histology-detected, the highest annual number to date for the programme. There were 5,407 cases of low grade CIN and 5,422 cases with no CIN. These numbers are significantly higher than the previous year.
• For cytology-histology correlation, the positive predictive value (PPV) – measured as the percentage of women referred with high grade cytological abnormality who have a histological diagnosis of CIN2 or higher – was 79.8%.
Key achievements 2013-2014
3

CervicalCheck – The National Cervical Screening Programme has been in operation since 1 September 2008. The figures reported in this section relate to the sixth year of the programme. During the reporting period a combination of ’invitation/re-call’ and ’direct entry’ was in operation. Women whose details were on the Cervical Screening Register (and their doctor or nurse) could check their next smear test due date using an online facility on the CervicalCheck website.
Quality assurance underpins every aspect of the CervicalCheck programme and programme performance is measured against key performance indicators (KPIs) as outlined in Guidelines for Quality Assurance in Cervical Screening Second Edition, 20131.
The response to the programme was very positive with 300,546 women attending for screening. Table 1 shows the number of women screened by age group. Women between the ages of 25 and 60 are invited for screening, but a small number of women under the age of 25 may attend under specific circumstances. Those women aged 61 or over include women presenting for the first time at this age as well as those who first attended for a smear test before the age of 61 and who did not have a second successive normal result before the age of 61 to exit the programme.
Introduction to the statistics 2013/2014
Table 1: Number of women screened by age group
* Based on evidence to date, there is no additional public health benefit in starting population screening below the age of 25. Screening in women under the age of 25 may lead to many women receiving unnecessary treatment for lesions that would never have developed into invasive cancer. Certain exemptions apply where some women over the age of 60 and under the age of 25 are considered eligible. Such exemptions may include women of any age who are post-colposcopy, women over the age of 60 who have never had a smear test and women aged 20 and over who are on renal dialysis, have HIV infection, are post organ transplant or who have had a previous abnormal smear test result and are within the recommended follow-up period.
Age group Number of women screened %
<25* 969 0.3
25 - 29 47,090 15.7
30 - 34 53,345 17.7
35 - 39 49,914 16.6
40 - 44 44,562 14.8
45 - 49 35,312 11.7
50 - 54 29,147 9.7
55 - 59 23,379 7.8
60 3,851 1.3
≥61 12,977 4.3
Total 300,546 100
CervicalCheck Programme Report 2013/20144

5
Figure 1: Five-year coverage (%) based on county of residence* for period ending 31 August 2014
* Population based on CSO 20112 figures projected to 2012, not adjusted for hysterectomy (hysterectomy data not available by geographical location).
100%
90%
80%
70%
60%
50%
40%
30%
20%
10%
0%
Carlo
w
Kild
are
Mea
th
Don
egal
Lim
eric
k
Slig
o
Clar
e
Laoi
s
Offa
ly
Gal
way
Lout
h
Wat
erfo
rd
Wex
ford
Cava
n
Kilk
enny
Mon
agha
n
Dub
lin
Long
ford
Tipp
erar
y
Cork
Leitr
im
Rosc
omm
on
Kerr
y
May
o
Wes
tmea
th
Wic
klow
Programme coverage
Coverage is a measure of the effectiveness of the screening programme in reaching the target population and indicates the proportion of the eligible population screened within a period. The five-year coverage at the end of the reporting period (31 August 2014) was 77 per cent. This figure is adjusted for women who have had a hysterectomy and therefore do not require cervical screening. This rate represents continued improvement over the first six years as CervicalCheck approaches the target five-year coverage of 80 per cent overall.
The geographical spread of screening coverage based on the eligible population of each county is shown in Figures 1 and 2. Five counties achieved the standard of 80 per cent coverage and 18 counties achieved higher than 70 per cent during this year. Only three counties had coverage below 70 per cent. Continued efforts have been made to improve coverage in counties where there is low coverage.
CervicalCheck Programme Report 2013/2014

> = 80%
70% - 80%
<70%
Coverage
Figure 2: Map showing five-year coverage (%) based on county of residence* for period ending 31 August 2014
Data analysed using Health Atlas Ireland.
* Population based on CSO 20112 figures projected to 2012, not adjusted for hysterectomy (hysterectomy data not available by geographical location).
6 CervicalCheck Programme Report 2013/2014
7
100%
90%
80%
70%
60%
50%
40%
30%
20%
10%
0%25-29 30-34 35-39
Age group
% c
over
age
40-44 45-49 50-54 55-59 60
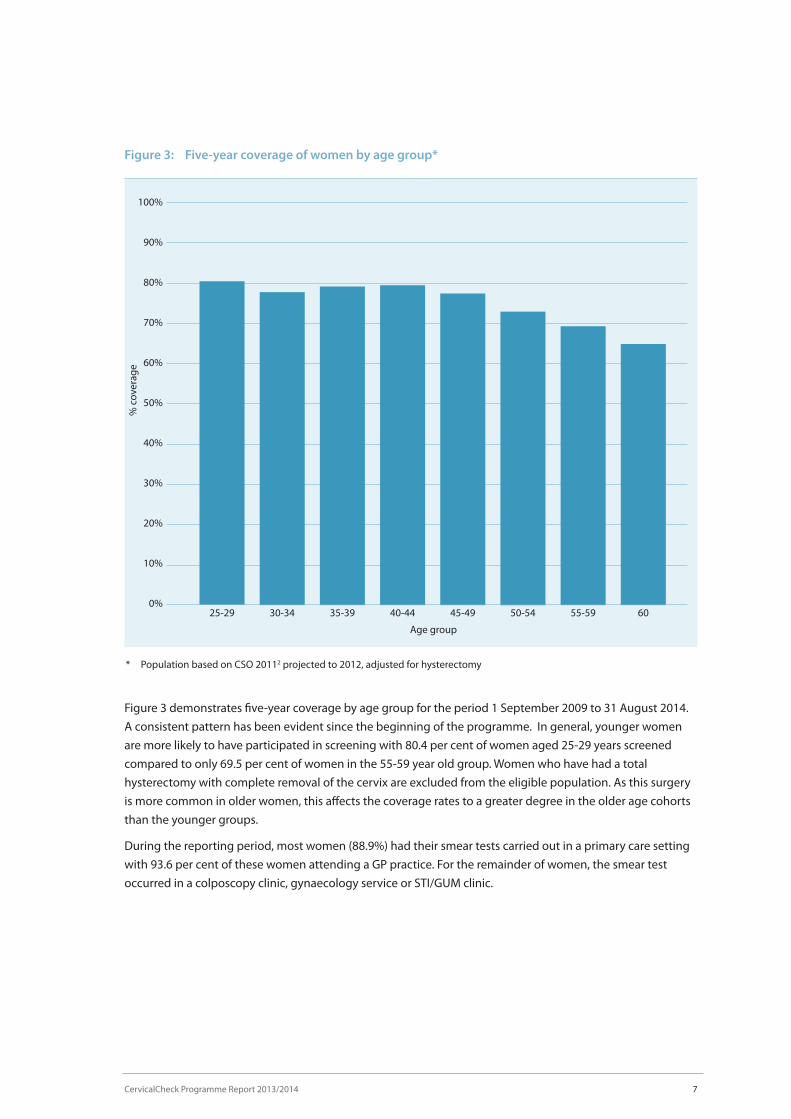
Figure 3: Five-year coverage of women by age group*
Figure 3 demonstrates five-year coverage by age group for the period 1 September 2009 to 31 August 2014. A consistent pattern has been evident since the beginning of the programme. In general, younger women are more likely to have participated in screening with 80.4 per cent of women aged 25-29 years screened compared to only 69.5 per cent of women in the 55-59 year old group. Women who have had a total hysterectomy with complete removal of the cervix are excluded from the eligible population. As this surgery is more common in older women, this affects the coverage rates to a greater degree in the older age cohorts than the younger groups.
During the reporting period, most women (88.9%) had their smear tests carried out in a primary care setting with 93.6 per cent of these women attending a GP practice. For the remainder of women, the smear test occurred in a colposcopy clinic, gynaecology service or STI/GUM clinic.
* Population based on CSO 20112 projected to 2012, adjusted for hysterectomy
CervicalCheck Programme Report 2013/2014

Table 3: Percentage of letters advising results available sent within four and five weeks of smear test date
Time from smear test to letter printed date 2013/2014 Target
Within 4 weeks 88.6% >90%
Within 5 weeks 97%
Table 2: Laboratory turnaround time – time from receipt of sample at laboratory to results returned to the programme
Performance parameter 2013/2014 Target
% results returned within two weeks of 97.8% >90% receipt of sample at laboratory.
Laboratory turnaround time
In the CervicalCheck programme it is important that cytology services process smear tests within 10 days to facilitate the timely provision of results to women following their smear test.
A laboratory turnaround time of less than two weeks in over 90 per cent of cases is a programme standard. In this reporting year 97.8 per cent of results were received by the programme within two weeks of the receipt of the sample being notified by the laboratory, which surpassed this target (Table 2).
CervicalCheck Women’s Charter
The CervicalCheck Women’s Charter includes the commitment that ‘your result and any treatment recommendation will be provided to you and your smeartaker by the programme within four weeks’. Table 3 illustrates the performance of the programme against this target with a notable improvement from 40 per cent in the first year to 88.6 per cent in the sixth year of the programme, with the letter to the woman being issued within five weeks in 97 per cent of cases (Table 3 & Figure 4). Ongoing monitoring and actions including liaison with smeartakers on sample submission as well as ensuring turnaround times at laboratories continue to make improvements in these response times.
8 CervicalCheck Programme Report 2013/2014

9
Up to 4 weeks
4-5 weeks
5-6 weeks
Over 6 weeks
Figure 4: Time in weeks for letter to be sent to women (%)
Table 4: Cytology findings for smear test results
Cytology findings
Total number of smear Unsatisfactory/ Satisfactory/ tests processed inadequate smear test adequate smear test
N N % N %
321,581 6,010 1.9 315,571 98.1
Cytology
Cytology findings reported in Tables 4 and 5 are based on smear test results received by the programme in the period 1 September 2013 to 31 August 2014, rather than the date on which the smear test was taken. Of the 321,581 smear tests examined, a small number (6,010/1.9%), were unsatisfactory (Table 4). The outcomes of the remaining 315,571 satisfactory smear tests are reported in Table 5. Over 90 per cent of satisfactory smear test results were found to be negative or normal. Of the remainder, eight per cent showed low grade abnormalities and 1.7 per cent showed high grade abnormalities (HSIL [moderate or severe], query invasive squamous carcinoma or query glandular neoplasia). In previous years there was a higher than anticipated rate of ASCUS results. In this year the ASCUS rate was four per cent compared to a peak of 10.2 per cent during the third year of the programme.
8.4%
0.8%2.2%
88.6%
CervicalCheck Programme Report 2013/2014
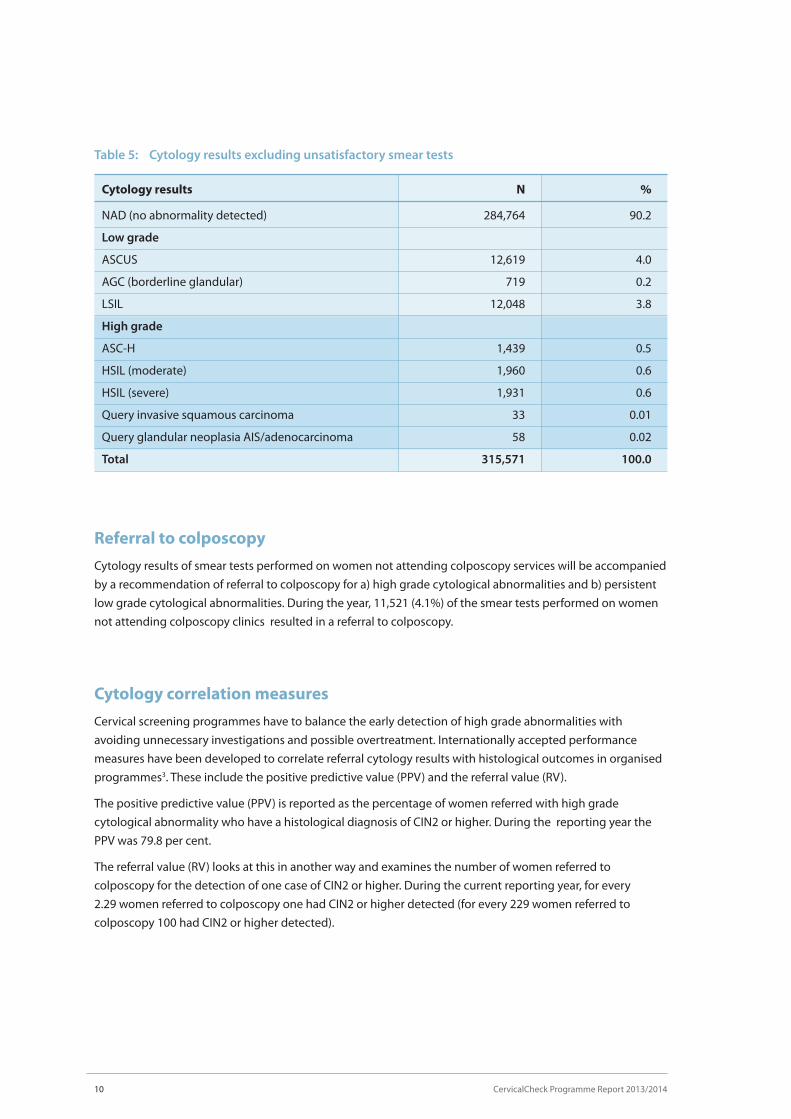
Cytology results N %
NAD (no abnormality detected) 284,764 90.2
Low grade
ASCUS 12,619 4.0
AGC (borderline glandular) 719 0.2
LSIL 12,048 3.8
High grade
ASC-H 1,439 0.5
HSIL (moderate) 1,960 0.6
HSIL (severe) 1,931 0.6
Query invasive squamous carcinoma 33 0.01
Query glandular neoplasia AIS/adenocarcinoma 58 0.02
Total 315,571 100.0
Table 5: Cytology results excluding unsatisfactory smear tests
10 CervicalCheck Programme Report 2013/2014
Referral to colposcopy
Cytology results of smear tests performed on women not attending colposcopy services will be accompanied by a recommendation of referral to colposcopy for a) high grade cytological abnormalities and b) persistent low grade cytological abnormalities. During the year, 11,521 (4.1%) of the smear tests performed on women not attending colposcopy clinics resulted in a referral to colposcopy.
Cytology correlation measures
Cervical screening programmes have to balance the early detection of high grade abnormalities with avoiding unnecessary investigations and possible overtreatment. Internationally accepted performance measures have been developed to correlate referral cytology results with histological outcomes in organised programmes3. These include the positive predictive value (PPV) and the referral value (RV).
The positive predictive value (PPV) is reported as the percentage of women referred with high grade cytological abnormality who have a histological diagnosis of CIN2 or higher. During the reporting year the PPV was 79.8 per cent.
The referral value (RV) looks at this in another way and examines the number of women referred to colposcopy for the detection of one case of CIN2 or higher. During the current reporting year, for every 2.29 women referred to colposcopy one had CIN2 or higher detected (for every 229 women referred to colposcopy 100 had CIN2 or higher detected).

11
Table 6: Outcome of appointments at colposcopy clinics
First visits Follow-ups Total
N % N % N %
Attended 15,786 72.7 40,869 53.5 56,655 57.8
Cancelled 4,445 20.5 24,987 32.7 29,432 30.0
DNA 1,445 6.7 10,468 13.7 11,913 12.2
Not recorded 25 0.1 0 0.0 25 0.0
Total 21,701 100 76,324 100 98,025 100
Diagnosis and treatment
Quality assured colposcopy services with timely diagnosis and treatment are an important requirement for successful cervical screening programmes. Fifteen colposcopy services nationwide continue to work with the programme. Each colposcopy service is delivered by dedicated multidisciplinary teams. Information is collected electronically and a central data extraction performed. This data forms the basis for this section of the report.
CervicalCheck Programme Report 2013/2014
Measures of the performance of cytology
PPV 79.8%
RV 2.29
It is important to note the number of women referred and the number of new referrals attended will not be the same in any given time period. This is because of the lead time between the colposcopy referral and the date of the first colposcopy visit as well as additional referrals for clinical reasons.
During the reporting period, 15,786 women attended colposcopy for the first time representing an increase when compared to the previous year (Table 6, Figure 5). By contrast there was a reduction in the number of follow-up visits compared to the previous year. This is a result of the introduction of HPV testing in combination with cytology to identify women at low risk of high grade CIN who are suitable for discharge. This has reduced unnecessary follow-up visits.
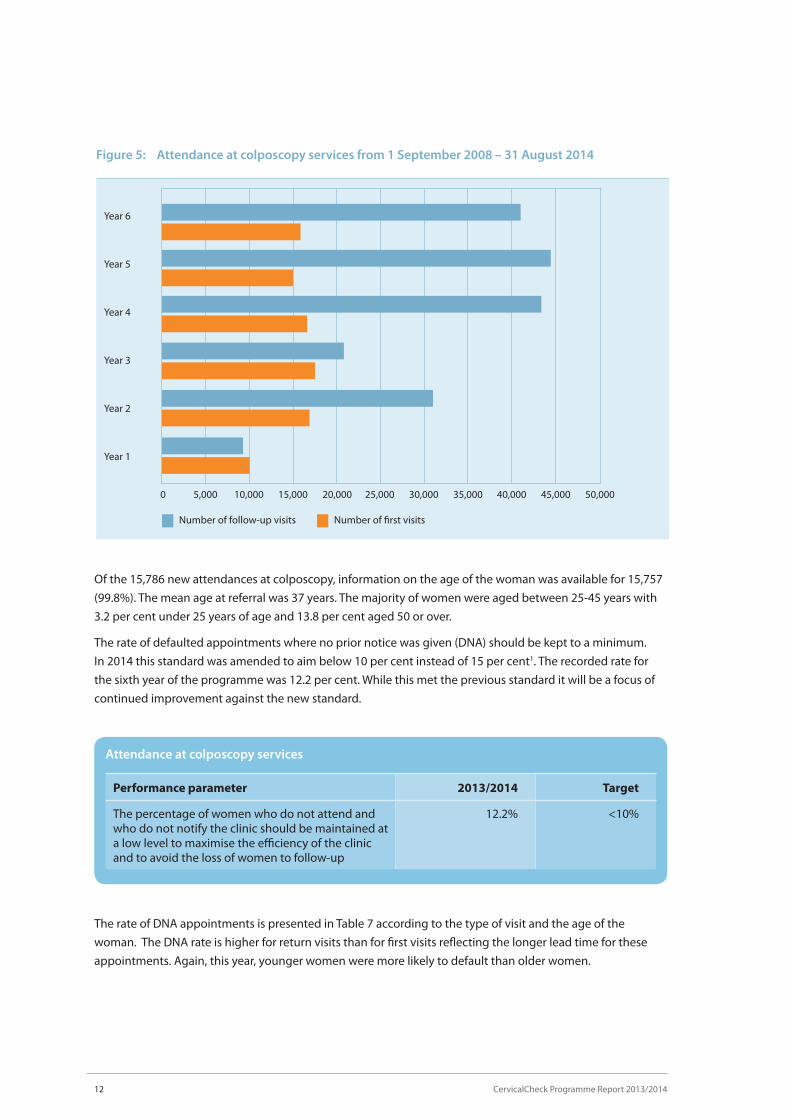
Attendance at colposcopy services
Performance parameter 2013/2014 Target
The percentage of women who do not attend and 12.2% <10% who do not notify the clinic should be maintained at a low level to maximise the efficiency of the clinic and to avoid the loss of women to follow-up
The rate of DNA appointments is presented in Table 7 according to the type of visit and the age of the woman. The DNA rate is higher for return visits than for first visits reflecting the longer lead time for these appointments. Again, this year, younger women were more likely to default than older women.
Of the 15,786 new attendances at colposcopy, information on the age of the woman was available for 15,757 (99.8%). The mean age at referral was 37 years. The majority of women were aged between 25-45 years with 3.2 per cent under 25 years of age and 13.8 per cent aged 50 or over.
The rate of defaulted appointments where no prior notice was given (DNA) should be kept to a minimum. In 2014 this standard was amended to aim below 10 per cent instead of 15 per cent1. The recorded rate for the sixth year of the programme was 12.2 per cent. While this met the previous standard it will be a focus of continued improvement against the new standard.
12 CervicalCheck Programme Report 2013/2014
50,00035,00020,000 45,00030,00015,0005,000 40,00025,00010,0000
Number of first visitsNumber of follow-up visits
Year 6
Year 5
Year 4
Year 3
Year 2
Year 1
Figure 5: Attendance at colposcopy services from 1 September 2008 – 31 August 2014

Table 7: DNA rates for appointments offered to women by age group
Age in years at Number of First Number of Follow-up first offered first visit DNA follow-up visit DNA appointments appointments rate (%) appointments rate (%)
<25 722 9.0 3,681 18.1
25 – 29 5,373 7.4 23,676 15.1
30 – 34 4,859 8.2 17,923 14.3
35 – 39 3,382 6.7 10,976 14.2
40 – 44 2,543 5.2 7,942 11.9
45 – 49 2,022 5.1 5,628 10.6
50 – 54 1,269 4.6 3,331 9.1
55 – 59 811 3.7 1,906 9.1
60 103 4.9 245 8.2
61+ 616 4.9 1,016 6.8
Table 8: Reason for referral to colposcopy
New referrals
Reason for referral to colposcopy N %
Abnormal smear 10,589 67.2
Clinical indication – non-urgent 3,036 19.3
Clinical indication – urgent 2,107 13.4
Total* 15,732 100
* The reason for referral was missing in 21 cases
Reasons for referral
Women were referred to colposcopy on the basis of an abnormal smear test result or for clinical reasons such as abnormal vaginal bleeding or suspicion of an anatomical abnormality of the cervix (Table 8). This table excludes 33 women (0.2%) for whom no consent information was recorded.
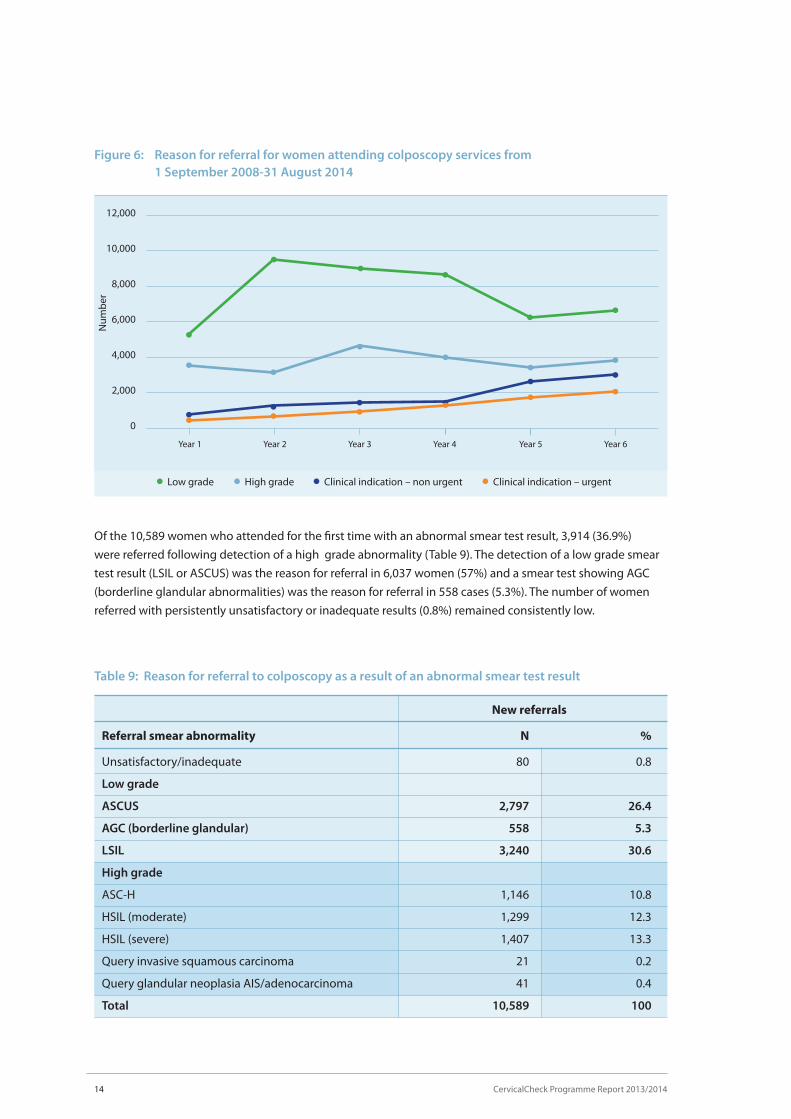
The reasons for referral to colposcopy for 15,753 new referrals are presented in Table 8 . Over two thirds of women were referred on the basis of an abnormal smear test result and 32 per cent were referred for clinical reasons. This relative increase in clinical referrals (women with anatomical abnormalities of the cervix or those with inter-menstrual or post-coital bleeding) represents the utilisation of capacity in colposcopy services which facilitated the inclusion of some women who previously would have been seen in outpatient gynaecology services (Figure 6).
13CervicalCheck Programme Report 2013/2014
14
Figure 6: Reason for referral for women attending colposcopy services from 1 September 2008-31 August 2014
12,000
10,000
8,000
6,000
4,000
2,000
0
Low grade High grade Clinical indication – non urgent Clinical indication – urgent
Num
ber
Year 1 Year 2 Year 3 Year 4 Year 5 Year 6
Of the 10,589 women who attended for the first time with an abnormal smear test result, 3,914 (36.9%) were referred following detection of a high grade abnormality (Table 9). The detection of a low grade smear test result (LSIL or ASCUS) was the reason for referral in 6,037 women (57%) and a smear test showing AGC (borderline glandular abnormalities) was the reason for referral in 558 cases (5.3%). The number of women referred with persistently unsatisfactory or inadequate results (0.8%) remained consistently low.
Table 9: Reason for referral to colposcopy as a result of an abnormal smear test result
New referrals
Referral smear abnormality N %
Unsatisfactory/inadequate 80 0.8
Low grade
ASCUS 2,797 26.4
AGC (borderline glandular) 558 5.3
LSIL 3,240 30.6
High grade
ASC-H 1,146 10.8
HSIL (moderate) 1,299 12.3
HSIL (severe) 1,407 13.3
Query invasive squamous carcinoma 21 0.2
Query glandular neoplasia AIS/adenocarcinoma 41 0.4
Total 10,589 100
CervicalCheck Programme Report 2013/2014

15CervicalCheck Programme Report 2013/2014
Waiting times
One of the key challenges faced by the CervicalCheck programme has been the provision of access to colposcopy services in a timely fashion for women. Since the programme began, services have been actively engaged in a process to reduce waiting times resulting in sustained improvements year-on-year.
Programme standards state that 90 per cent of women with high grade cytological abnormalities should be offered an appointment for colposcopy within four weeks and 90 per cent of all women with low grade cytological abnormalities should be offered an appointment within eight weeks.
For the period 1 September 2013 to 31 August 2014 information on waiting times was available for 15,732 of the 15,753 new attendances (Figure 7 and Table 10). For women referred to colposcopy with a smear test suggestive of CIN2/CIN3, 91 per cent were seen within four weeks. Overall only 3.5 per cent of women experienced waiting times of longer than eight weeks and in only 0.5 per cent of cases the wait was longer than 12 weeks.
Figure 7: Waiting times for colposcopy services 2008 to 2014
100%
80%
60%
40%
20%
0%
Year 1 Year 2 Year 3 Year 4 Year 5 Year 6
All women referred to colposcopy should be offered an appointment within eight weeks of the date the letter was received at the clinic
All women referred to colposcopy with a suspicion of invasive cancer on a smear should be offered an appointment within two weeks of the date the letter was received at the clinic
All women referred to colposcopy with a smear suggestive of CIN 2 or CIN 3 should be offered an appointment within four weeks of the date the letter was received at the clinic
All women referred to colposcopy with a smear suggestive of glandular neoplasia should be offered an appointment within four weeks of the date the letter was received at the clinic

Waiting times for colposcopy
Performance parameter 2013/2014 Target
All women referred to colposcopy should be offered 96% > 90% an appointment within 8 weeks of the date the letter was received at the clinic
All women referred to colposcopy with a smear test 91% > 90% result suggestive of CIN 2 or CIN 3 should be offered an appointment within 4 weeks of the date the letter was received at the clinic
All women referred to colposcopy with a suspicion 95% > 90% of invasive cancer on a smear test result should be offered an appointment within 2 weeks of the date the letter was received at the clinic
All women referred to colposcopy with a smear test 98% > 90% result suggestive of glandular neoplasia should be offered an appointment within 4 weeks of the date the letter was received at the clinic
Table 10: Waiting times for women referred to colposcopy grouped by grade of referral smear test
High grade* Low grade Total
N % N % N %
2 weeks or less 1,689 43.2 1,118 16.8 2,807 26.5
Between 2 and 4 weeks 1,811 46.2 1,840 27.6 3,651 34.5
Between 4 and 8 weeks 380 9.7 3,332 49.9 3,712 35.1
Between 8 and 12 weeks 20 0.5 335 5.0 355 3.4
Greater than 12 weeks 10 0.3 40 0.6 50 0.5
Total 3,910 100 6,665 100.0 10,575 100.0
* Includes ASCH, adenoma in situ and query invasive carcinoma
16 CervicalCheck Programme Report 2013/2014

17CervicalCheck Programme Report 2013/2014
Figure 8: Number of women undergoing biopsy at colposcopy services
25,000
20,000
15,000
10,000
5,000
0
Num
ber
Year 1 Year 2 Year 3 Year 4 Year 5 Year 6
All appointmentsFirst appointments
Table 11: Biopsy rates measured against colposcopy standards
Performance parameter 2013/2014 Target
A biopsy should be performed in the presence of an 92.4% >90% atypical Transformation Zone and a smear test which suggest underlying CIN
If there is a suspicion of invasive disease a biopsy 100.0% >90% must be performed immediately
Biopsy rate
The role of colposcopy is to facilitate diagnosis and treatment of women with abnormal smear test results. Where an abnormality is suspected at colposcopy it is good practice to perform a biopsy to confirm the diagnosis. There are two main types of biopsy performed – a diagnostic biopsy, which involves sampling a portion of the abnormal area only, and an excisional biopsy which removes the abnormal area in its entirety.
During the reporting period, 13,536 diagnostic biopsies and 6,440 excisional biopsies were performed. The initial colposcopy visit determines the presence or absence of an atypical Transformation Zone (TZ) for women referred with an abnormal smear test result. A biopsy was performed in over 92 per cent of cases where the TZ was documented as atypical or abnormal. A biopsy was performed in all cases where an invasive cancer was suspected (Table 11 and Figure 8).

18
Table 12: Biopsies performed during the first visit to colposcopy according to referral smear test result grade
Type of biopsy performed
Excisional Diagnostic No biopsy Total biopsy biopsy taken
Grade of cytology result of referral smear test N % N % N % N %
AGC (borderline glandular) 47 8.4 359 64.3 152 27.2 558 100
High grade 961 24.6 2,527 64.6 426 10.9 3,914 100
Low grade 182 3.0 3,919 64.9 1,936 32.1 6,037 100
Unsatisfactory/inadequate 1 1.3 26 32.5 53 66.3 80 100
Total 1,191 11.2 6,831 64.5 2,567 24.2 10,589 100
The outcome of use of local anaesthetic
Performance parameter 2013/2014 Target
The majority of women should have treatment 94.3% >80% performed as an outpatient under local anaesthetic
Treatment at colposcopy
Effective treatment of high grade CIN and adenocarcinoma in situ (AIS) with subsequent reduction of the risk of invasive cancer is vital to the success of any cervical screening programme. Treatments should be effective, safe and acceptable and should aim to eradicate all CIN from the cervix.
CervicalCheck programme standards state that treatments are performed as outpatient procedures under local anaesthetic more than 80 per cent of the time. During the sixth year of the programme outpatient treatments occurred using local anaesthetic over 94 per cent of the time, surpassing this target.
The biopsy rates at the first visit, according to the grade of the referral smear test and reasons for referral are presented in Table 12. Eighty nine per cent of women presenting with a high grade cytological abnormality had a biopsy performed at the first visit compared with 68 per cent of women presenting with a low grade cytological abnormality. Seventy three per cent of women presenting with AGC (borderline glandular cells) had a biopsy at the first visit which included an excisional biopsy in 8.4 per cent of cases.
CervicalCheck Programme Report 2013/2014

19CervicalCheck Programme Report 2013/2014
During the reporting period, 6,725 treatments were recorded at colposcopy. Large Loop Excision of the Transformation Zone (LLETZ) was performed in 5,674 (84.4%) cases and ablative treatment was used in 927 (13.8%) cases (Figure 9). Thirty six cone biopsies (0.5%), 80 hysterectomies (1.2%) and eight trachalectomies (0.12%) were performed.
The number of treatments performed has grown markedly since the start of the CervicalCheck programme due to increased capacity at colposcopy (Figure 10).
Ablation
Cone biopsy
LLETZ
Hysterectomy
Trachalectomy
Figure 9: Treatments at colposcopy services
84.4%
13.8%
0.5%
0.12%1.2%
Figure 10: Number of women undergoing treatment at colposcopy services
8,000
7,000
6,000
5,000
4,000
3,000
2,000
1,000
0
Num
ber
Year 1 Year 2 Year 3 Year 4 Year 5 Year 6
All appointmentsFirst appointments

20
Table 13: Treatment at first visit to colposcopy
Reason for referral No treatment Treatment on Total number of to colposcopy on first visit first visit women attended
N % N % N %
Clinical indication 2,965 97.7 71 2.3 3,036 100 – non-urgent
Clinical indication 2,067 98.1 40 1.9 2,107 100 – urgent
AGC 511 91.6 47 8.4 558 100 (borderline glandular)
High grade 2,953 75.4 961 24.6 3,914 100
Low grade 5,864 97.1 173 2.9 6,037 100
Unsatisfactory 79 98.7 1 1.2 80 100 /inadequate
Total 14,439 91.8 1,293 8.2 15,732 100
One of the principles of screening is the avoidance of overtreatment. This is of particular relevance to cervical screening because of the potential adverse effect of some treatments on future fertility. In this regard, treatment at the first visit for women who present with low grade abnormalities should be avoided and kept below 10 per cent. During the reporting period, this figure was within the target at 2.9 per cent (Table 13).
The performance of colposcopy treatment parameters
Performance parameter 2013/2014 Target
Treatment at the first visit to colposcopy should not 2.9% <10% be performed on women who present with low grade cytological change (even if there is a colposcopic suspicion of high grade disease) except in special circumstances
Women treated by excisional treatments at first 92.5% >90% visit should have CIN on histology
Women treated by excisional treatments at any 91.5% >80% visit should have CIN on histology
Most women who undergo excisional procedures should have histologically-proven CIN detected on the excised specimen. This is particularly true if the procedure is performed at the first visit to colposcopy. During the sixth year of the programme 92.5 per cent of women treated at the first visit had CIN detected which met this standard. In addition, 91.5 per cent of women who had an excisional treatment at any visit had CIN histology meeting the standard of greater than 80 per cent.
CervicalCheck Programme Report 2013/2014

21CervicalCheck Programme Report 2013/2014
The positive predictive value of colposcopy
Performance parameter 2013/2014 Target
Compliance between colposcopic impression of 73% >65% high grade disease and histologically proven high grade CIN
Colposcopy plays an important role in the evaluation of women with suspected cervical abnormalities. It allows the identification of the site of the abnormality as well as an estimation of the grade of abnormality including the presence or absence of features suggestive of invasive cancer. The correlation between the colposcopic impression and histological diagnosis is a useful marker of the quality of colposcopy. During the reporting period the positive predictive value (PPV) of a colposcopic impression of high grade disease was 73 per cent which is in excess of the programme standard of >65 per cent.
Histology
The objective of a cervical screening programme is the detection and treatment of high grade CIN and the yield of these abnormalities is one of the hallmarks of success. The histology is presented by year in Figure 11. The yield of high grade abnormalities remained consistently high.
Overall, for all women who attended colposcopy in the sixth year of the programme (regardless of their reason for referral), there were 175 cancers detected, 7,034 high grade CIN (CIN2, CIN3 or AIS), 5,407 low grade CIN and 5,422 women with no CIN (Table 14). The specimen was suitable for histological analysis in 98.6 per cent of women biopsied (target >95%).
Since CervicalCheck became available in 2008, there have been 23,013 low grade CIN, 33,768 high grade CIN and 860 cancers detected.

8,000
7,000
6,000
5,000
4,000
3,000
2,000
1,000
0
Num
ber
Figure 11: Detection of CIN and cancer
No CIN Low grade CIN High grade CIN Cancer
Year 1 Year 2 Year 3 Year 4 Year 5 Year 6
Performance parameter 2013/2014 Target
Biopsy specimens should be suitable for 99% >95% histological diagnosis
22 CervicalCheck Programme Report 2013/2014

23CervicalCheck Programme Report 2013/2014
Tab
le 1
4: H
isto
log
y re
sult
s fo
r w
om
en w
ho
had
a s
atis
fact
ory
bio
psy
at fi
rst v
isit
to c
olp
osc
op
y fr
om
1 S
epte
mb
er 2
013
to 3
1 A
ug
ust
201
4
N
o C
IN/N
o H
PV
H
PV
/Cer
viti
s C
IN 1
C
IN 2
C
IN 3
A
den
oca
rcin
om
a C
ance
r To
tal
(no
rmal
) o
nly
in
sit
u/C
GIN
(i
ncl
ud
ing
m
icro
inva
sive
)
Gra
de
of c
yto
log
y
resu
lt o
f ref
erra
l sm
ear
N
%
N
%
N
%
N
%
N
%
N
%
N
%
N
%
ASC
US
472
27.4
19
0 11
.0
744
43.3
22
1 12
.8
93
5.4
0 0.
0 0
0.0
1,72
0 10
0
AGC
(b
orde
rline
gla
ndul
ar)
137
37.1
34
9.
2 99
26
.8
27
7.3
34
9.2
30
8.1
8 2.
2 36
9 10
0
LSIL
47
4 21
.3
233
10.5
1,
014
45.6
35
1 15
.8
153
6.9
1 0.
0 0
0.0
2,22
6 10
0
ASC
-H
135
14.3
74
7.
8 25
7 27
.2
193
20.4
27
7 29
.3
7 0.
7 1
0.1
944
100
HSI
L
(mod
erat
e or
sev
ere)
13
1 5.
4 10
4 4.
3 25
9 10
.6
513
21.1
1,
365
56.1
19
0.
8 44
1.
8 2,
435
100
Que
ry in
vasi
ve
squa
mou
s ca
rcin
oma
0 0.
0 1
5.3
1 5.
3 0
0.0
9 47
.4
3 15
.8
5 26
.3
19
100
Que
ry g
land
ular
ne
opla
sia
AIS
/
aden
ocar
cino
ma
6 19
.4
1 3.
2 0
0.0
0 0.
0 4
12.9
19
61
.3
1 3.
2 31
10
0
Uns
atis
fact
ory/
inad
equa
te
13
56.5
4
17.4
6
26.1
0
0.0
0 0.
0 0
0.0
0 0.
0 23
10
0
Tota
l 1,
368
17.6
64
1 8.
3 2,
380
30.6
1,
305
16.8
1,
935
24.9
79
1.
0 59
0.
8 7,
767
100

1. National Cancer Screening Service. Guidelines for Quality Assurance in Cervical Screening Second Edition 2013. NCSS/PUB/Q-1 Rev 2, ISBN 978-1-907487-13-2. Dublin; National Cancer Screening Service: 2013.
2. Central Statistics Office. Census 2011 Profile 2 - Older and Younger [Internet] [cited 2015 Oct 5]. Available from http://www.cso.ie/en/census/census2011reports/census2011profile2-olderandyounger/
3. NHS Cervical Screening Programme. Achievable standards, Benchmarks for reporting, and Criteria for evaluating cervical cytopathology (3rd Edition) ISBN 978 1 84463 081 3. UK; NHS Cervical Screening Programme; 2013.
24 CervicalCheck Programme Report 2013/2014
References


ProgrammeReport
AN CLÁR NÁISIÚNTA SCAGTHÁSTÁLA CEIRBHEACSTHE NATIONAL CERVICAL SCREENING PROGRAMME
Cuid d’Fheidhmeannacht na Seirbhíse Sláinte. Part of the Health Service Executive.
2013-2014
CS/PR/PM-19 Rev 1ISBN 978-1-907487-20-0