2013 aha/acc guideline on lifestyle management to reduce ... tool files/2013 acc... · 2013 aha/acc...
TRANSCRIPT

Journal of the American College of Cardiology� 2014 The Expert Work Group MembersPublished by Elsevier Inc.
Vol. 63, No. 25, 2014ISSN 0735-1097/$36.00
http://dx.doi.org/10.1016/j.jacc.2013.11.003
2013 AHA/ACC Guideline on LifestyleManagement to Reduce Cardiovascular RiskqA Report of the American College of Cardiology/American Heart Association
Task Force on Practice Guidelines
Endorsed by the American Association of Cardiovascular and Pulmonary Rehabilitation,
American Pharmacists Association, American Society for Nutrition, American Society for
Preventive Cardiology, American Society of Hypertension, Association of Black Cardiologists,
National Lipid Association, Preventive Cardiovascular Nurses Association, and
WomenHeart: The National Coalition for Women With Heart Disease
qC
W
on
Th
At
tio
pro
are
Tr
Co
val
Expert WorkGroup Members
irculation is published on
olters Kluwer. The Journa
behalf of the American
is is an open access ar
tribution Non-Commerci
n, and reproduction in
perly cited, the use is no
made.
This document was approv
ustees and the American H
mmittee in November 201
ue of this guideline.
Robert H. Eckel, MD, FAHA, Co-Chair
John M. Jakicic, PHD, Co-Chair
Jamy D. Ard, MD
Janet M. de Jesus, MS, RD*
Nancy Houston Miller, RN, BSN, FAHA
Van S. Hubbard, MD, PHD*
I-Min Lee, MD, SCD
Alice H. Lichtenstein, DSC, FAHA
behalf of the American Heart Association, Inc., by
l of the American College of Cardiology is published
College of Cardiology Foundation by Elsevier Inc.
ticle under the terms of the Creative Commons
al-NoDervis License, which permits use, distribu-
any medium, provided that the Contribution is
n-commercial, and no modifications or adaptations
ed by the American College of Cardiology Board of
eart Association Science Advisory and Coordinating
3. The Academy of Nutrition and Dietetics affirms the
The A
follows: E
VS, Lee
Smith SC
on lifesty
College o
Guideline
This ar
Copies:
College o
(http://my
Inc. Repri
Catherine M. Loria, PHD, FAHA*
Barbara E. Millen, DRPH, RD, FADA
Cathy A. Nonas, MS, RD
Frank M. Sacks, MD, FAHA
Sidney C. Smith, JR, MD, FACC, FAHA
Laura P. Svetkey, MD, MHS
Thomas A. Wadden, PHD
Susan Z. Yanovski, MD*
*Ex-Officio Members.
Methodology
Members
Karima A. Kendall, PHD
Laura C. Morgan, MA
Michael G. Trisolini, PHD, MBA
George Velasco
Janusz Wnek, PHD
ACC/AHA TaskForce Members
Jeffrey L. Anderson, MD, FACC, FAHA, Chair
Jonathan L. Halperin, MD, FACC, FAHA,
Chair-Elect
Nancy M. Albert, PHD, CCNS, CCRN, FAHA
Biykem Bozkurt, MD, PHD, FACC, FAHA
Ralph G. Brindis, MD, MPH, MACC
Lesley H. Curtis, PHD, FAHA
David DeMets, PHD
Judith S. Hochman, MD, FACC, FAHA
Richard J. Kovacs, MD, FACC, FAHA
E. Magnus Ohman, MD, FACC
Susan J. Pressler, PHD, RN, FAAN, FAHA
Frank W. Sellke, MD, FACC, FAHA
Win-Kuang Shen, MD, FACC, FAHA
Subcommittee
on Prevention
Guidelines
Sidney C. Smith, JR, MD, FACC, FAHA, Chair
Gordon F. Tomaselli, MD, FACC, FAHA, Co-Chairmerican College of Cardiology requests that this document be cited as
ckel RH, Jakicic JM, Ard JD, de Jesus JM, Houston Miller N, Hubbard
I-M, Lichtenstein AH, Loria CM, Millen BE, Nonas CA, Sacks FM,
Jr, Svetkey LP, Wadden TA, Yanovski SZ. 2013 AHA/ACC guideline
le management to reduce cardiovascular risk: a report of the American
f Cardiology/American Heart Association Task Force on Practice
s. J Am Coll Cardiol 2014;63:2960–84.
ticle is copublished in Circulation.
This document is available on the World Wide Web sites of the American
f Cardiology (www.cardiosource.org) and the American Heart Association
.americanheart.org). For copies of this document, please contact the Elsevier
nt Department: fax (212) 462-1935, or e-mail [email protected].

JACC Vol. 63, No. 25, 2014 Eckel et al.July 1, 2014:2960–84 2013 AHA/ACC Lifestyle Management Guideline
2961
TABLE OF CONTENTS
Preamble and Transition to ACC/AHA Guidelines toReduce Cardiovascular Risk . . . . . . . . . . . . . . . . . . . . . . 2961
1.1. Scope of Guideline . . . . . . . . . . . . . . . . . . . . . . . 2962
1.2. Methodology and Evidence Review . . . . . . . . 2962
1.2.1. Scope of the Evidence Review . . . . . . . . . 29621.2.2. CQ-Based Approach . . . . . . . . . . . . . . . . . 2965
1.3. Organization of Work Group . . . . . . . . . . . . . . . 2967
1.4. Document Reviews and Approval . . . . . . . . . . 2967
2. Lifestyle Management Recommendations . . . . 2967
3. CQ1dDietary Patterns and Macronutrients:BP and Lipids . . . . . . . . . . . . . . . . . . . . . . . . . . . . . . . . . 2967
3.1. Introduction/Rationale . . . . . . . . . . . . . . . . . . . 2967
3.2. Selection of Inclusion/Exclusion Criteria . 2967
3.3. Literature Search Yield . . . . . . . . . . . . . . . . . . . 2967
3.3.1. Dietary Pattern/MacronutrientComposition Evidence . . . . . . . . . . . . . . . . 2967
3.4. CQ1 Evidence Statements . . . . . . . . . . . . . . . . 2967
3.4.1. Dietary Patterns . . . . . . . . . . . . . . . . . . . . . 2967
3.4.1.1. MED PATTERN . . . . . . . . . . . . . . . . . . . . 29673.4.1.2. DASH DIETARY PATTERN . . . . . . . . . . . . . 29683.4.1.3. DASH VARIATIONS . . . . . . . . . . . . . . . . . 29683.4.2. Dietary Fat and Cholesterol . . . . . . . . . . . 2968
3.5. Diet Recommendations for LDL-CLowering . . . . . . . . . . . . . . . . . . . . . . . . . . . . . . . . . 2968
4. CQ2dSodium and Potassium:BP and CVD Outcomes . . . . . . . . . . . . . . . . . . . . . . . 2971
4.1. Introduction and Rationale . . . . . . . . . . . . . . . 2971
4.2. Selection of Inclusion/Exclusion Criteria . 29714.3. Literature Search Yield . . . . . . . . . . . . . . . . . . . 2971
4.4. CQ2 Evidence Statements . . . . . . . . . . . . . . . . 2972
4.4.1. Sodium and BP . . . . . . . . . . . . . . . . . . . . . . 2972
4.5. Diet Recommendations for BP Lowering . . 29725. CQ3dPhysical Activity: Lipids and BP . . . . . . . . 2974
5.1. Introduction/Rationale . . . . . . . . . . . . . . . . . . . 2974
5.2. Selection of Inclusion/Exclusion Criteria . 2974
5.3. Literature Search Yield . . . . . . . . . . . . . . . . . . . 2974
5.4. CQ3 Evidence Statements . . . . . . . . . . . . . . . . 2975
5.4.1. Physical Activity and Lipids . . . . . . . . . . . 29755.4.2. Physical Activity and BP . . . . . . . . . . . . . . 2975
5.4.2.1. AEROBIC EXERCISE TRAINING AND BP . . . . 29755.4.2.2. RESISTANCE EXERCISE TRAINING AND BP . . 29755.4.2.3. COMBINATION OF AEROBIC AND RESISTANCE
EXERCISE TRAINING AND BP . . . . . . . . . . 2975
5.5. Physical Activity Recommendations . . . . . . 29765.6. Heart-Healthy Nutrition andPhysical Activity Behaviors . . . . . . . . . . . . . . . 2976
6. Gaps in Evidence and Future ResearchNeeds . . . . . . . . . . . . . . . . . . . . . . . . . . . . . . . . . . . . . . . . 2976
6.1. Diet . . . . . . . . . . . . . . . . . . . . . . . . . . . . . . . . . . . . . 2976
6.2. Physical Activity . . . . . . . . . . . . . . . . . . . . . . . . . 2977
References . . . . . . . . . . . . . . . . . . . . . . . . . . . . . . . . . . . . . . . . 2978
Appendix 1. Author Relationships With Industry andOther Entities (Relevant) . . . . . . . . . . . . . . . . . . . . . . . . . 2981
Appendix 2. Expert Reviewer Relationships WithIndustry and Other Entities . . . . . . . . . . . . . . . . . . . . . . . 2984
Appendix 3. Abbreviations . . . . . . . . . . . . . . . . . . . . . . . . 2984
Preamble and Transition to ACC/AHAGuidelines to Reduce Cardiovascular Risk
The goals of the American College of Cardiology (ACC)and the American Heart Association (AHA) are to preventcardiovascular diseases (CVDs); improve the managementof people who have these diseases through professionaleducation and research; and develop guidelines, standards,and policies that promote optimal patient care and car-diovascular health. Toward these objectives, the ACC andAHA have collaborated with the National Heart, Lung,and Blood Institute (NHLBI) and stakeholder and pro-fessional organizations to develop clinical practice guide-lines for assessment of cardiovascular risk, lifestylemodifications to reduce cardiovascular risk, management ofblood cholesterol in adults, and management of overweightand obesity in adults.
In 2008, the NHLBI initiated these guidelines bysponsoring rigorous systematic evidence reviews for eachtopic by expert panels convened to develop critical ques-tions (CQs), interpret the evidence, and craft recommen-dations. In response to the 2011 report from the Instituteof Medicine on the development of trustworthy clinicalguidelines (1), the NHLBI Advisory Council recom-mended that the NHLBI focus specifically on reviewingthe highest-quality evidence and partner with other orga-nizations to develop recommendations (2,3). Accordingly,in June 2013 the NHLBI initiated collaboration withthe ACC and AHA to work with other organizations tocomplete and publish the 4 guidelines noted above andmake them available to the widest possible constituency.Recognizing that the Expert Panels/Work Groups did notconsider evidence beyond 2011 (except as specified in themethodology), the ACC, AHA, and collaborating societiesplan to begin updating these guidelines starting in 2014.
The joint ACC/AHA Task Force on Practice Guide-lines (Task Force) appointed a subcommittee to shepherdthis transition, communicate the rationale and expectationsto the writing panels and partnering organizations, andexpeditiously publish the documents. The ACC/AHA andpartner organizations recruited a limited number of expertreviewers for fiduciary examination of content, recognizingthat each document had undergone extensive peer reviewby representatives of the NHLBI Advisory Council, key

Eckel et al. JACC Vol. 63, No. 25, 20142013 AHA/ACC Lifestyle Management Guideline July 1, 2014:2960–84
2962
federal agencies, and scientific experts. Each writing panelresponded to comments from these reviewers. Clarifica-tions were incorporated where appropriate, but there wereno substantive changes because the bulk of the content wasundisputed.Although the Task Force led the final development of
these prevention guidelines, they differ from other ACC/AHA guidelines. First, as opposed to an extensive com-pendium of clinical information, these documents aresignificantly more limited in scope and focus on selectedCQs on each topic, based on the highest-quality evidenceavailable. Recommendations were derived from random-ized trials, meta-analyses, and observational studies evalu-ated for quality and were not formulated when sufficientevidence was not available. Second, the text accompanyingeach recommendation is succinct, summarizing the evi-dence for each question. The Full Panel/Work GroupReports include more detailed information about the evi-dence statements (ESs) that serve as the basis for recom-mendations. Third, the format of the recommendationsdiffers from other ACC/AHA guidelines. Each recom-mendation has been mapped from the NHLBI gradingformat to the ACC/AHA Classification of Recommen-dation/Level of Evidence (COR/LOE) construct (Table 1)and is expressed in both formats. Because of the inherentdifferences in grading systems and the clinical questionsdriving the recommendations, alignment between theNHLBI and ACC/AHA formats is in some casesimperfect. Explanations of these variations are noted in therecommendation tables, where applicable.In consultation with NHLBI, the policies adopted by
the writing panels to manage relationships of authors withindustry and other entities (RWI) are outlined in themethods section of each panel report. These policies werein effect when this effort began in 2008 and throughoutthe writing process and voting on recommendations, untilthe process was transferred to ACC/AHA in 2013. In theinterest of transparency, the ACC/AHA requested thatpanel authors resubmit RWI disclosures as of July 2013.Relationships relevant to this guideline are disclosed inAppendix 1. None of the ACC/AHA expert reviewers hadrelevant RWI (Appendix 2). See Appendix 3 for a list ofabbreviations used in the guideline.Systematic evidence reports and accompanying summary
tables were developed by the expert panels and NHLBI.The guideline was reviewed by the ACC/AHA Task Forceand approved by the ACC Board of Trustees and theAHA Science Advisory and Coordinating Committee. Inaddition, ACC/AHA sought endorsement from otherstakeholders, including professional organizations. It is thehope of the writing panels, stakeholders, professional or-ganizations, NHLBI, and Task Force that the guidelineswill garner the widest possible readership for the benefit ofpatients, providers, and the public health.These guidelines are meant to define practices that
meet the needs of patients in most circumstances and
are not a replacement for clinical judgment. The ulti-mate decision about care of a particular patient must bemade by the healthcare provider and patient in light ofthe circumstances presented by that patient. As a result,situations might arise in which deviations from theseguidelines may be appropriate. These considerationsnotwithstanding, in caring for most patients, clinicianscan employ the recommendations confidently to reducethe risks of atherosclerotic CVD events.
See Tables 2 and 3 for an explanation of the NHLBIrecommendation grading methodology.
1.1. Scope of Guideline
See Table 4 for the Lifestyle Expert Work Group’s CQs.A healthy lifestyle is important in the prevention of
CVD, the leading cause of morbidity and mortalityworldwide. The intent of the Lifestyle Work Group(Work Group) was to evaluate evidence that particulardietary patterns, nutrient intake, and levels and types ofphysical activity can play a major role in CVD preventionand treatment through effects on modifiable CVD riskfactors (i.e., blood pressure [BP] and lipids). These ESsand recommendations may be used as appropriate in themanagement of hypercholesterolemia and hypertension.The target audience of the report is primary care providers.
This guideline is based on the Full Work Group Report,which is provided as an online-only data supplement to theguideline. The Full Work Group Report supplementcontains background and additional material related tocontent, methodology, evidence synthesis, rationale, andreferences and is supported by the NHLBI SystematicEvidence Review, which can be found at http://www.nhlbi.nih.gov/guidelines/cvd_adult/lifestyle/.
Diet and physical activity interventions of interest to theWork Group that were not included in this report becauseof time and resource limitations were the following: cal-cium, magnesium, alcohol, cardiorespiratory fitness, singlebehavioral intervention or multicomponent lifestyle in-terventions, the addition of lifestyle intervention to phar-macotherapy, and smoking. Outcomes of interest notcovered in this evidence review were the following riskfactors: diabetes mellitus (diabetes)- and obesity-relatedmeasurements, incident diabetes metabolic syndrome,high-sensitivity C-reactive protein, and other inflamma-tory markers. The Work Group was interested in review-ing the evidence for CVD outcomes in all of the CQs;however, the evidence for mortality and CVD outcomeswas reviewed only in CQ2.
1.2. Methodology and Evidence Review
1.2.1. Scope of the Evidence Review
To formulate the nutrition recommendations, the WorkGroup used randomized controlled trials (RCTs), obser-vational studies, meta-analyses, and systematic reviews ofstudies carried out in adults (�18 years of age) with or

Table 1. Applying Classification of Recommendation and Level of Evidence
A recommendation with Level of Evidence B or C does not imply that the recommendation is weak. Many important clinical questions addressed in the guidelines do not lend themselves to clinical trials.
Even when randomized trials are unavailable, there may be a very clear clinical consensus that a particular test or therapy is useful or effective.
*Data available from clinical trials or registries about the usefulness/efficacy in different subpopulations, such as sex, age, history of diabetes, history of prior myocardial infarction, history of heart
failure, and prior aspirin use.
yFor comparative-effectiveness recommendations (Class I and IIa; Level of Evidence A and B only), studies that support the use of comparator verbs should involve direct comparisons of the treatments
or strategies being evaluated.
JACC Vol. 63, No. 25, 2014 Eckel et al.July 1, 2014:2960–84 2013 AHA/ACC Lifestyle Management Guideline
2963
without established coronary heart disease/CVD and withor without risk factors for coronary heart disease/CVD,who were of normal weight, overweight, or obese. Theevidence review date range was 1998 to 2009. To capturehistorical data or more recent evidence, date ranges werechanged for subquestions in some instances. The evidencedate ranges are described clearly in each CQ section. TheWork Group assessed the impact of both dietary patternsand macronutrient composition on plasma low-density li-poprotein cholesterol (LDL-C), high-density lipoproteincholesterol (HDL-C), and triglycerides and on systolic BPand diastolic BP over a minimum RCT interventionperiod of 1 month in studies performed in any geographiclocation and research setting.
Overall, the Work Group emphasized dietary patternsrather than individual dietary components. Patterns werecharacterized by habitual or prescribed combinations ofdaily food intake. Dietary patterns offer the opportunity tocharacterize the overall composition and quality of theeating behaviors of a population (e.g., Mediterranean-styledietary [MED] pattern). Eating patterns consist of variouscombinations of foods that may differ in macronutrient,vitamin, and mineral compositions. The macronutrientssaturated, trans, monounsaturated, and polyunsaturatedfatty acids are particularly relevant for their effects on plasmalipids and lipoproteins. Dietary sodium and potassium areparticularly relevant for their effects on BP. Epidemiologicalresearch has examined the dietary patterns of populations

Table 2. NHLBI Grading of the Strength ofRecommendations
Grade Strength of Recommendation*
A Strong recommendation
There is high certainty based on evidence that the net benefityis substantial.
B Moderate recommendation
There is moderate certainty based on evidence that the net benefit ismoderate to substantial, or there is high certainty that the netbenefit is moderate.
C Weak recommendation
There is at least moderate certainty based on evidence that there is asmall net benefit.
D Recommendation against
There is at least moderate certainty based on evidence that there isno net benefit or that risks/harms outweigh benefits.
E Expert opinion (“There is insufficient evidence or evidence is
unclear or conflicting, but this is what the Work Group
recommends.”)Net benefit is unclear. Balance of benefits and harms cannot be
determined because of no evidence, insufficient evidence,unclear evidence, or conflicting evidence, but the Work Groupthought it was important to provide clinical guidance andmake a recommendation. Further research is recommendedin this area.
N No recommendation for or against (“There is insufficient evidence or
evidence is unclear or conflicting.”)
Net benefit is unclear. Balance of benefits and harms cannot bedetermined because of no evidence, insufficient evidence, unclearevidence, or conflicting evidence, and the Work Group thoughtno recommendation should be made. Further research isrecommended in this area.
*In most cases, the strength of the recommendation should be closely aligned with the quality
of the evidence; however, under some circumstances, there may be valid reasons for making
recommendations that are not closely aligned with the quality of the evidence (e.g., strong
recommendation when the evidence quality is moderate, such as smoking cessation to reduce
cardiovascular disease risk or ordering an ECG as part of the initial diagnostic work-up for a
patient presenting with possible MI). Those situations should be limited and the rationale
explained clearly by the Work Group.
yNet benefit is defined as benefits minus risks/harms of the service/intervention.
ECG indicates electrocardiogram; MI, myocardial infarction; and NHLBI, National Heart, Lung,
and Blood Institute.
Table 3. NHLBI Quality Rating of the Strength of Evidence
Type of Evidence Quality Rating*
Well-designed, well-executedy RCT that adequatelyrepresent populations to which the results are appliedand directly assess effects on health outcomes.
Meta-analyses of such studies.Highly certain about the estimate of effect. Further
research is unlikely to change our confidence in theestimate of effect.
High
RCT with minor limitationsz affecting confidence in,or applicability of, the results.
Well-designed, well-executed nonrandomized controlledstudiesx and well-designed, well-executed observationalstudiesk.
Meta-analyses of such studies.Moderately certain about the estimate of effect. Further
research may have an impact on our confidence in theestimate of effect and may change the estimate.
Moderate
RCT with major limitations.Nonrandomized controlled studies and observational
studies with major limitations affecting confidence in,or applicability of, the results.
Uncontrolled clinical observations without an appropriatecomparison group (e.g., case series, case reports).
Physiological studies in humans.Meta-analyses of such studies.Low certainty about the estimate of effect. Further
research is likely to have an impact on our confidencein the estimate of effect and is likely to change theestimate.
Low
*In some cases, other evidence, such as large all-or-none case series (e.g., jumping from air-
planes or tall structures), can represent high- or moderate-quality evidence. In such cases, the
rationale for the evidence rating exception should be explained by the Work Group and clearly
justified.
y“Well-designed, well-executed” refers to studies that directly address the question; use
adequate randomization, blinding, and allocation concealment; are adequately powered; use
intention-to-treat analyses; and have high follow-up rates.
zLimitations include concerns with the design and execution of a study that result in decreased
confidence in the true estimate of the effect. Examples of such limitations include but are not
limited to: inadequate randomization, lack of blinding of study participants or outcome asses-
sors, inadequate power, outcomes of interest that are not prespecified for the primary out-
comes, low follow-up rates, and findings based on subgroup analyses. Whether the limitations
are considered minor or major is based on the number and severity of flaws in design or
execution. Rules for determining whether the limitations are considered minor or major and how
they will affect rating of the individual studies will be developed collaboratively with the meth-
odology team.
xNonrandomized controlled studies refer to intervention studies where assignment to inter-
vention and comparison groups is not random (e.g., quasi-experimental study design).
kObservational studies include prospective and retrospective cohort, case-control, and cross-
sectional studies.
NHLBI indicates National Heart, Lung, and Blood Institute; and RCT, randomized controlled
trials.
Eckel et al. JACC Vol. 63, No. 25, 20142013 AHA/ACC Lifestyle Management Guideline July 1, 2014:2960–84
2964
and identified associations between various patterns andCVD risk factors and outcomes. Intervention studies havetested a priori hypotheses involving prescribed dietary pat-terns specifically formulated on the basis of these data (e.g.,Dietary Approaches to Stop Hypertension [DASH] orMED patterns). Population-based prospective cohortstudies and RCTs suggest that there are healthier overalldietary patterns (foods and/or their constituent macronu-trient, vitamin, and mineral combinations) that are associ-ated with lower risk of chronic diseases, including CVD andrisk factors such as type 2 diabetes and hypertension. Wereviewed data exclusively on dietary intake rather thannutritional supplements provided in pharmaceutical prep-arations (e.g., potassium pills), because nutritional sup-plements may not have similar effects and are notconsidered “lifestyle” interventions.The Work Group focused on CVD risk factors to
provide a free-standing Lifestyle document and to informthe Blood Cholesterol guideline (4) and the hypertensionpanel. It also recognized that RCTs examining the effects
on hard outcomes (myocardial infarction, stroke, heartfailure, and CVD-related death) are difficult if notimpossible to conduct for several reasons (e.g., long-termadherence to dietary changes). However, the WorkGroup also supplemented this evidence on risk factors withobservational data on hard outcomes for sodium. TheWork Group prioritized topics for the evidence review andwas unable to review the evidence on hard outcomes fordietary patterns or physical activity.
For physical activity, substantial epidemiological evi-dence links higher levels of aerobic physical activity tolower rates of CVD and other chronic diseases, such astype 2 diabetes. Evidence indicates a dose-dependent in-verse relationship between levels of physical activity andrates of CVD. The proposed mechanisms mediating the
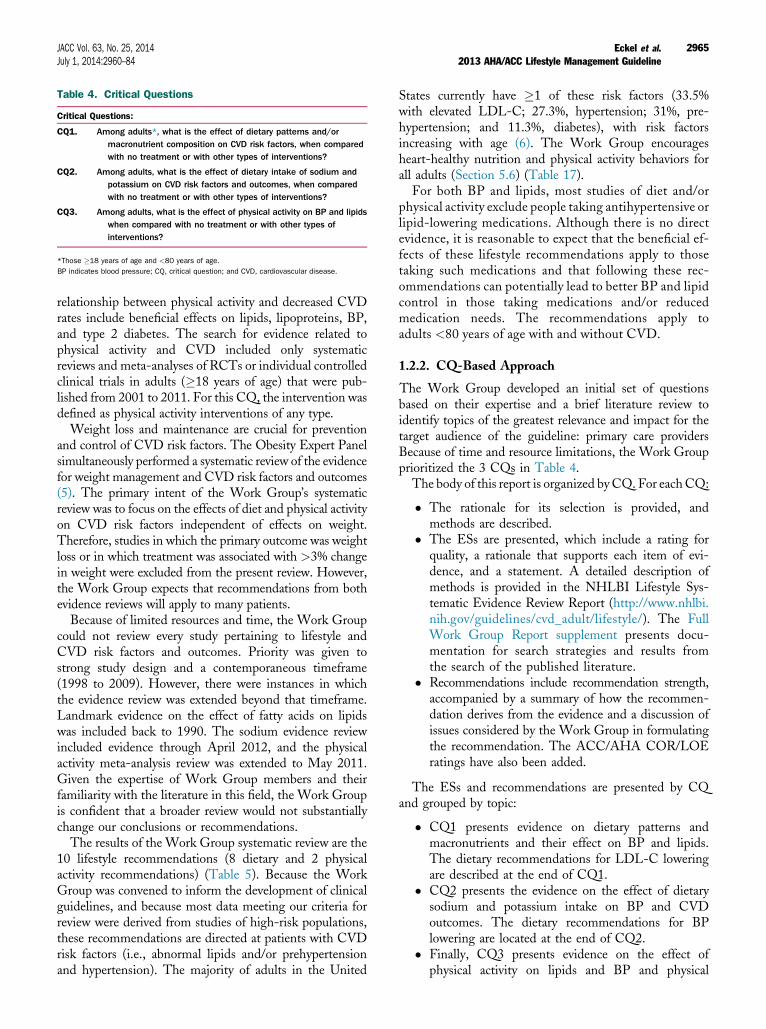
Table 4. Critical Questions
Critical Questions:
CQ1. Among adults*, what is the effect of dietary patterns and/ormacronutrient composition on CVD risk factors, when comparedwith no treatment or with other types of interventions?
CQ2. Among adults, what is the effect of dietary intake of sodium andpotassium on CVD risk factors and outcomes, when comparedwith no treatment or with other types of interventions?
CQ3. Among adults, what is the effect of physical activity on BP and lipidswhen compared with no treatment or with other types ofinterventions?
*Those �18 years of age and <80 years of age.
BP indicates blood pressure; CQ, critical question; and CVD, cardiovascular disease.
JACC Vol. 63, No. 25, 2014 Eckel et al.July 1, 2014:2960–84 2013 AHA/ACC Lifestyle Management Guideline
2965
relationship between physical activity and decreased CVDrates include beneficial effects on lipids, lipoproteins, BP,and type 2 diabetes. The search for evidence related tophysical activity and CVD included only systematicreviews and meta-analyses of RCTs or individual controlledclinical trials in adults (�18 years of age) that were pub-lished from 2001 to 2011. For this CQ, the intervention wasdefined as physical activity interventions of any type.Weight loss and maintenance are crucial for prevention
and control of CVD risk factors. The Obesity Expert Panelsimultaneously performed a systematic review of the evidencefor weight management and CVD risk factors and outcomes(5). The primary intent of the Work Group’s systematicreview was to focus on the effects of diet and physical activityon CVD risk factors independent of effects on weight.Therefore, studies in which the primary outcome was weightloss or in which treatment was associated with >3% changein weight were excluded from the present review. However,the Work Group expects that recommendations from bothevidence reviews will apply to many patients.Because of limited resources and time, the Work Group
could not review every study pertaining to lifestyle andCVD risk factors and outcomes. Priority was given tostrong study design and a contemporaneous timeframe(1998 to 2009). However, there were instances in whichthe evidence review was extended beyond that timeframe.Landmark evidence on the effect of fatty acids on lipidswas included back to 1990. The sodium evidence reviewincluded evidence through April 2012, and the physicalactivity meta-analysis review was extended to May 2011.Given the expertise of Work Group members and theirfamiliarity with the literature in this field, the Work Groupis confident that a broader review would not substantiallychange our conclusions or recommendations.The results of the Work Group systematic review are the
10 lifestyle recommendations (8 dietary and 2 physicalactivity recommendations) (Table 5). Because the WorkGroup was convened to inform the development of clinicalguidelines, and because most data meeting our criteria forreview were derived from studies of high-risk populations,these recommendations are directed at patients with CVDrisk factors (i.e., abnormal lipids and/or prehypertensionand hypertension). The majority of adults in the United
States currently have �1 of these risk factors (33.5%with elevated LDL-C; 27.3%, hypertension; 31%, pre-hypertension; and 11.3%, diabetes), with risk factorsincreasing with age (6). The Work Group encouragesheart-healthy nutrition and physical activity behaviors forall adults (Section 5.6) (Table 17).
For both BP and lipids, most studies of diet and/orphysical activity exclude people taking antihypertensive orlipid-lowering medications. Although there is no directevidence, it is reasonable to expect that the beneficial ef-fects of these lifestyle recommendations apply to thosetaking such medications and that following these rec-ommendations can potentially lead to better BP and lipidcontrol in those taking medications and/or reducedmedication needs. The recommendations apply toadults <80 years of age with and without CVD.
1.2.2. CQ-Based Approach
The Work Group developed an initial set of questionsbased on their expertise and a brief literature review toidentify topics of the greatest relevance and impact for thetarget audience of the guideline: primary care providersBecause of time and resource limitations, the Work Groupprioritized the 3 CQs in Table 4.
The body of this report is organized byCQ. For eachCQ:
� The rationale for its selection is provided, andmethods are described.
� The ESs are presented, which include a rating forquality, a rationale that supports each item of evi-dence, and a statement. A detailed description ofmethods is provided in the NHLBI Lifestyle Sys-tematic Evidence Review Report (http://www.nhlbi.nih.gov/guidelines/cvd_adult/lifestyle/). The FullWork Group Report supplement presents docu-mentation for search strategies and results fromthe search of the published literature.
� Recommendations include recommendation strength,accompanied by a summary of how the recommen-dation derives from the evidence and a discussion ofissues considered by the Work Group in formulatingthe recommendation. The ACC/AHA COR/LOEratings have also been added.
The ESs and recommendations are presented by CQand grouped by topic:
� CQ1 presents evidence on dietary patterns andmacronutrients and their effect on BP and lipids.The dietary recommendations for LDL-C loweringare described at the end of CQ1.
� CQ2 presents the evidence on the effect of dietarysodium and potassium intake on BP and CVDoutcomes. The dietary recommendations for BPlowering are located at the end of CQ2.
� Finally, CQ3 presents evidence on the effect ofphysical activity on lipids and BP and physical

Table 5. Summary of Recommendations for Lifestyle Management
Recommendations NHLBI GradeNHLBI EvidenceStatements ACC/AHA COR ACC/AHA LOE
DIET
LDL-C: Advise adults who would benefit from LDL-C lowering* to:
1. Consume a dietary pattern that emphasizes intake ofvegetables, fruits, and whole grains; includes low-fatdairy products, poultry, fish, legumes, nontropicalvegetable oils, and nuts; and limits intake of sweets,sugar-sweetened beverages, and red meats.a. Adapt this dietary pattern to appropriate calorie
requirements, personal and cultural food preferences,and nutrition therapy for other medical conditions(including diabetes).
b. Achieve this pattern by following plans such as the DASHdietary pattern, the USDA Food Pattern, or the AHA Diet.
A (Strong) CQ1: ES4 (high), ES6 (low),ES8 (moderate),ES9 (moderate)
I A
2. Aim for a dietary pattern that achieves 5%–6% of caloriesfrom saturated fat.
A (Strong) CQ1: ES11 (high) I A
3. Reduce percent of calories from saturated fat. A (Strong) CQ1: ES11 (high),ES12 (moderate),ES13 (moderate)
I A
4. Reduce percent of calories from trans fat. A (Strong) CQ1: ES14 (moderate),ES15 (moderate)
I A
BP: Advise adults who would benefit from BP lowering to:
1. Consume a dietary pattern that emphasizes intake ofvegetables, fruits, and whole grains; includes low-fatdairy products, poultry, fish, legumes, nontropicalvegetable oils, and nuts; and limits intake of sweets,sugar-sweetened beverages, and red meats.a. Adapt this dietary pattern to appropriate calorie
requirements, personal and cultural food preferences,and nutrition therapy for other medical conditions(including diabetes).
b. Achieve this pattern by following plans such as the DASHdietary pattern, the USDA Food Pattern, or the AHA Diet.
A (Strong) CQ1: ES1 (low) ES3 (high),ES5 (high), ES6 (low),ES7 (low),ES8 (moderate)
I A
2. Lower sodium intake. A (Strong) CQ2: ES1 (high),ES2 (moderate),ES3 (high), ES4 (high),ES5 (high), ES8 (low),ES9 (low)
I A
3. a. Consume no more than 2,400 mg of sodium/d;b. Further reduction of sodium intake to 1,500 mg/d
can result in even greater reduction in BP; andc. Even without achieving these goals, reducing
sodium intake by at least 1,000 mg/d lowers BP.
B (Moderate) CQ2: ES2 (moderate),ES3 (high)
IIa B
4. Combine the DASH dietary pattern with lower sodium intake. A (Strong) CQ1: ES3 (high), ES5 (high),ES8 (moderate)
CQ2: ES1 (high),ES2 (moderate),ES3 (high), ES4 (high),ES5 (high), ES6 (moderate)
I A
PHYSICAL ACTIVITY
Lipids
1. In general, advise adults to engage in aerobic physicalactivity to reduce LDL-C and non–HDL-C: 3–4 sessions per wk,lasting on average 40 min per session, and involvingmoderate- to vigorous-intensity physical activity.
B (Moderate) CQ3: ES1 (moderate),ES2 (moderate),ES5 (low)
IIa A
BP
1. In general, advise adults to engage in aerobic physicalactivity to lower BP: 3–4 sessions per wk, lasting on average40 min per session, and involving moderate- tovigorous-intensity physical activity.
B (Moderate) CQ3: ES1 (high) IIa A
*Refer to 2013 Blood Cholesterol Guideline for guidance on who would benefit from LDL-C lowering (4).
ACC indicates American College of Cardiology; AHA, American Heart Association; BP, blood pressure; COR, Class of Recommendation; CQ, critical question; DASH, Dietary Approaches to Stop
Hypertension; ES, evidence statement; HDL-C, high-density lipoprotein cholesterol; LDL-C, low-density lipoprotein cholesterol; LOE, Level of Evidence; NHLBI, National Heart, Lung, and Blood Institute;
and USDA, U.S. Department of Agriculture.
Eckel et al. JACC Vol. 63, No. 25, 20142013 AHA/ACC Lifestyle Management Guideline July 1, 2014:2960–84
2966

JACC Vol. 63, No. 25, 2014 Eckel et al.July 1, 2014:2960–84 2013 AHA/ACC Lifestyle Management Guideline
2967
activity recommendations for BP and lipid lowering.The physical activity recommendations for BP andlipid lowering are located at the end of CQ3.
It should be recognized that formulating recommen-dations derived from evidence reviews in response toCQs has some advantages as well as limitations. Becauseof its desire to adhere to the highest quality of evidence,the Work Group was restricted to using evidence thatmet inclusion/exclusion and quality criteria establishedby the Work Group in partnership with the methodol-ogists. When the phrase “there is insufficient evidence” isused, the reader must distinguish between “insufficient”evidence where no studies meeting inclusion/exclusionand quality criteria were found to answer a CQ and“insufficient” evidence where RCTs or observationalstudies were conducted but the available data do notprovide sufficient information to formulate a recommen-dation. This perspective is important because clinicianscould see fewer recommendations derived from expertopinion. Given this perspective, the clinical and researchcommunity can identify research questions that need to beanswered in the future to refine recommendations whenupdates to the guideline are written (Section 6).
1.3. Organization of Work Group
The Work Group was composed of 12 members and 4 ex-officio members, including physicians and experts in BP,blood cholesterol, obesity, and lifestyle management. Theauthors came from the primary care, nursing, pharma-cology, nutrition, exercise, behavioral science, and epide-miology disciplines and also included senior scientific stafffrom NHLBI and the National Institutes of Health.
1.4. Document Reviews and Approval
A formal peer review process initially was completed underthe auspices of the NHLBI and included 6 expert reviewersand representatives of federal agencies. This document wasalso reviewed by 4 expert reviewers nominated by the ACCand the AHA when the management of the guidelinetransitioned to the ACC/AHA. The ACC and AHAreviewers’ RWI information is published in this document(Appendix 2).This document was approved for publication by the gov-
erning bodies of the ACC and AHA and endorsed by theAmerican Association of Cardiovascular and PulmonaryRehabilitation, American Pharmacists Association, Amer-ican Society for Nutrition, American Society for PreventiveCardiology, American Society of Hypertension, Associationof Black Cardiologists, National Lipid Association, Preven-tive Cardiovascular Nurses Association, and WomenHeart:The National Coalition for Women With Heart Disease.
2. Lifestyle Management Recommendations
See Table 5 for the Summary of Lifestyle Recommendations.
3. CQ1dDietary Patterns andMacronutrients: BP and Lipids
See Table 6 for the CQ for BP and lipids with dietarypatterns and macronutrients.
3.1. Introduction/Rationale
The importance of nutrition in modifying the risk of CVDhas been repeatedly emphasized (7–11). Historically, therole of dietary components has been the predominant focus;however, foods are typically consumed in combinationsrather than individually. Over the past few years, increasingattention has been given to dietary patterns and their rela-tionship to health outcomes such as CVD (12–20).
In intervention studies, specific dietary patterns ofdefined macronutrient composition are identified on thebasis of expert evidence and a priori hypothesis (e.g., theDASH or MED patterns) and then are evaluated in RCTs.In observational studies, associations between intake andrisk factors are assessed. Because of resource limitations,CVD morbidity and mortality outcomes were not includedin the evidence review for this question. The charge of theWork Group was to inform the treatment of lipids and BP;therefore, those risk factors were the outcomes of focus.
3.2. Selection of Inclusion/Exclusion Criteria
Work Group members developed eligibility criteria basedon a Population, Intervention, Comparator, Outcomes,Timing, and Setting (PICOTS) approach for screeningpotential studies for inclusion in this evidence review. Thedetails of the PICOTS approach for CQ1 and LiteratureSearch Yield, including summary tables, are available in theFull Work Group Report supplement.
3.3. Literature Search Yield
3.3.1. Dietary Pattern/MacronutrientComposition Evidence
In all, 17 studies (28 articles) satisfied the final inclusioncriteria and were rated to be of good or fair quality (21–48).
The Dietary Pattern Summary Tables (Tables B–1through B–8) are available in the Full Work Group Reportsupplement. The tables present summary data on theincluded studies organized by dietary pattern/macronu-trient composition or subpopulations of interest, defined byage, sex, race, or comorbid condition. Some studies appearin more than 1 summary table because they address morethan 1 corresponding macronutrient composition or di-etary pattern comparison.
3.4. CQ1 Evidence Statements
3.4.1. Dietary Patterns
3.4.1.1. MED PATTERN
MED pattern description (Table 7): There was no uni-form definition of the MED diet in the RCTs and cohort
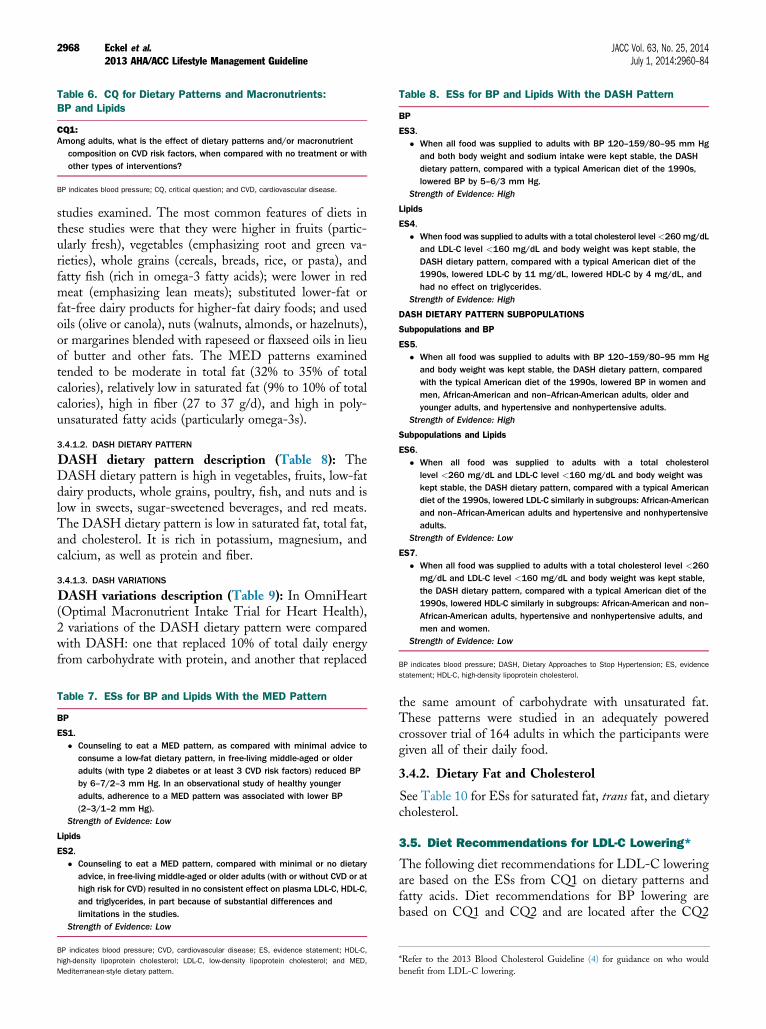
Table 6. CQ for Dietary Patterns and Macronutrients:BP and Lipids
CQ1:Among adults, what is the effect of dietary patterns and/or macronutrient
composition on CVD risk factors, when compared with no treatment or withother types of interventions?
BP indicates blood pressure; CQ, critical question; and CVD, cardiovascular disease.
Table 8. ESs for BP and Lipids With the DASH Pattern
BP
ES3.� When all food was supplied to adults with BP 120–159/80–95 mm Hg
and both body weight and sodium intake were kept stable, the DASHdietary pattern, compared with a typical American diet of the 1990s,lowered BP by 5–6/3 mm Hg.
Strength of Evidence: High
Lipids
ES4.� When food was supplied to adults with a total cholesterol level<260mg/dL
and LDL-C level <160 mg/dL and body weight was kept stable, theDASH dietary pattern, compared with a typical American diet of the1990s, lowered LDL-C by 11 mg/dL, lowered HDL-C by 4 mg/dL, andhad no effect on triglycerides.
Strength of Evidence: High
DASH DIETARY PATTERN SUBPOPULATIONS
Subpopulations and BP
ES5.� When all food was supplied to adults with BP 120–159/80–95 mm Hg
and body weight was kept stable, the DASH dietary pattern, comparedwith the typical American diet of the 1990s, lowered BP in women andmen, African-American and non–African-American adults, older andyounger adults, and hypertensive and nonhypertensive adults.
Strength of Evidence: High
Subpopulations and Lipids
ES6.� When all food was supplied to adults with a total cholesterol
level <260 mg/dL and LDL-C level <160 mg/dL and body weight waskept stable, the DASH dietary pattern, compared with a typical Americandiet of the 1990s, lowered LDL-C similarly in subgroups: African-Americanand non–African-American adults and hypertensive and nonhypertensiveadults.
Strength of Evidence: Low
ES7.� When all food was supplied to adults with a total cholesterol level <260
mg/dL and LDL-C level <160 mg/dL and body weight was kept stable,the DASH dietary pattern, compared with a typical American diet of the1990s, lowered HDL-C similarly in subgroups: African-American and non–African-American adults, hypertensive and nonhypertensive adults, andmen and women.
Strength of Evidence: Low
BP indicates blood pressure; DASH, Dietary Approaches to Stop Hypertension; ES, evidence
Eckel et al. JACC Vol. 63, No. 25, 20142013 AHA/ACC Lifestyle Management Guideline July 1, 2014:2960–84
2968
studies examined. The most common features of diets inthese studies were that they were higher in fruits (partic-ularly fresh), vegetables (emphasizing root and green va-rieties), whole grains (cereals, breads, rice, or pasta), andfatty fish (rich in omega-3 fatty acids); were lower in redmeat (emphasizing lean meats); substituted lower-fat orfat-free dairy products for higher-fat dairy foods; and usedoils (olive or canola), nuts (walnuts, almonds, or hazelnuts),or margarines blended with rapeseed or flaxseed oils in lieuof butter and other fats. The MED patterns examinedtended to be moderate in total fat (32% to 35% of totalcalories), relatively low in saturated fat (9% to 10% of totalcalories), high in fiber (27 to 37 g/d), and high in poly-unsaturated fatty acids (particularly omega-3s).
3.4.1.2. DASH DIETARY PATTERN
DASH dietary pattern description (Table 8): TheDASH dietary pattern is high in vegetables, fruits, low-fatdairy products, whole grains, poultry, fish, and nuts and islow in sweets, sugar-sweetened beverages, and red meats.The DASH dietary pattern is low in saturated fat, total fat,and cholesterol. It is rich in potassium, magnesium, andcalcium, as well as protein and fiber.
3.4.1.3. DASH VARIATIONS
DASH variations description (Table 9): In OmniHeart(Optimal Macronutrient Intake Trial for Heart Health),2 variations of the DASH dietary pattern were comparedwith DASH: one that replaced 10% of total daily energyfrom carbohydrate with protein, and another that replaced
Table 7. ESs for BP and Lipids With the MED Pattern
BP
ES1.� Counseling to eat a MED pattern, as compared with minimal advice to
consume a low-fat dietary pattern, in free-living middle-aged or olderadults (with type 2 diabetes or at least 3 CVD risk factors) reduced BPby 6–7/2–3 mm Hg. In an observational study of healthy youngeradults, adherence to a MED pattern was associated with lower BP(2–3/1–2 mm Hg).
Strength of Evidence: Low
Lipids
ES2.� Counseling to eat a MED pattern, compared with minimal or no dietary
advice, in free-living middle-aged or older adults (with or without CVD or athigh risk for CVD) resulted in no consistent effect on plasma LDL-C, HDL-C,and triglycerides, in part because of substantial differences andlimitations in the studies.
Strength of Evidence: Low
BP indicates blood pressure; CVD, cardiovascular disease; ES, evidence statement; HDL-C,
high-density lipoprotein cholesterol; LDL-C, low-density lipoprotein cholesterol; and MED,
Mediterranean-style dietary pattern.
statement; HDL-C, high-density lipoprotein cholesterol.
the same amount of carbohydrate with unsaturated fat.These patterns were studied in an adequately poweredcrossover trial of 164 adults in which the participants weregiven all of their daily food.
3.4.2. Dietary Fat and Cholesterol
See Table 10 for ESs for saturated fat, trans fat, and dietarycholesterol.
3.5. Diet Recommendations for LDL-C Lowering*
The following diet recommendations for LDL-C loweringare based on the ESs from CQ1 on dietary patterns andfatty acids. Diet recommendations for BP lowering arebased on CQ1 and CQ2 and are located after the CQ2
*Refer to the 2013 Blood Cholesterol Guideline (4) for guidance on who would
benefit from LDL-C lowering.

Table 9. ESs for DASH Variations/Glycemic Index/LoadDietary Approaches
BP
ES8.� In adults with BP of 120–159/80–95 mm Hg, modifying the DASH dietary
pattern by replacing 10% of calories from carbohydrates with the sameamount of either protein or unsaturated fat (8% monounsaturated and 2%polyunsaturated) lowered systolic BP by 1 mm Hg compared with theDASH dietary pattern. Among adults with BP 140–159/90–95 mm Hg,these replacements lowered systolic BP by 3 mm Hg relative to DASH.
Strength of Evidence: Moderate
Lipids
ES9.� In adults with average baseline LDL-C level of 130 mg/dL, HDL-C level of
50 mg/dL, and triglyceride level of 100 mg/dL, modifying the DASHdietary pattern by replacing 10% of calories from carbohydrates with 10%of calories from protein lowered LDL-C by 3 mg/dL, HDL-C by 1 mg/dL,and triglycerides by 16 mg/dL compared with the DASH dietary pattern.Replacing 10% of calories from carbohydrates with 10% of calories fromunsaturated fat (8% monounsaturated and 2% polyunsaturated) loweredLDL-C similarly, increased HDL-C by 1 mg/dL, and lowered triglycerides by10 mg/dL as compared with the DASH dietary pattern.
Strength of Evidence: Moderate
ES10.� There is insufficient evidence to determine whether low-glycemic diets
versus high-glycemic diets affect lipids or BP for adults withoutdiabetes. The evidence for this relationship in adults with diabetes wasnot reviewed.
Strength of Evidence: Insufficient
BP indicates blood pressure; DASH, Dietary Approaches to Stop Hypertension; ES, evidence
statement; HDL-C, high-density lipoprotein cholesterol; and LDL-C, low-density lipoprotein
cholesterol.
JACC Vol. 63, No. 25, 2014 Eckel et al.July 1, 2014:2960–84 2013 AHA/ACC Lifestyle Management Guideline
2969
ESs. The physical activity and lipids ESs and recom-mendations are located in CQ3.
1. Advise adults who would benefit from LDL-Clowering to:
� Consume a dietary pattern that emphasizesintake of vegetables, fruits, and whole grains;includes low-fat dairy products, poultry, fish,legumes, nontropical vegetable oils, and nuts;and limits intake of sweets, sugar-sweetenedbeverages, and red meats.B Adapt this dietary pattern to appropriate cal-orie requirements, personal and cultural foodpreferences, and nutrition therapy for othermedical conditions (including diabetes).
B Achieve this pattern by following plans suchas the DASH dietary pattern, the U.S.Department of Agriculture (USDA) FoodPattern, or the AHA Diet.
NHLBI Grade: A (Strong); ACC/AHA COR: I, LOE: A
Rationale: This recommendation is based largely onstudies of the DASH dietary pattern (DASH and DASH-Sodium), which provided the highest-quality evidence for adietary pattern causing improvements in BP and lipidprofiles (Tables 8 and 9). The LDL-C–lowering effect hasbeen demonstrated in men and women, African Americansand non–African Americans, and in adults of all ages(Table 8, ES6). The evidence suggests that the effects of
the recommended dietary pattern persist as long as thepattern is consumed.
The caloric (energy) intake should be appropriate for theindividual (e.g., restricted for those attempting weightloss). Patients should also be encouraged to adapt therecommended dietary pattern to their personal and culturalpreferences. Materials are available to assist patients inachieving the recommended dietary pattern at differentcalorie levels (Table 9). The 2010 U.S. Department ofHealth and Human Services Dietary Guidelines forAmericans recommend the USDA Food Pattern and theDASH dietary pattern (49). Overall, the recommendeddietary pattern is consistent with the AHA Diet (50) andthe USDA Food Pattern (49). The USDA Food Patternoffers lacto-ovo vegetarian and vegan adaptations. There-fore, this recommendation is consistent with other nationalguidelines. Clinicians should be familiar with the recom-mendations, advise their patients to adopt them, andprovide easy access to information (Table 11). Dietaryplanning and nutritional counseling are often facilitated byreferral to a nutrition professional.
2. Advise adults who would benefit from LDL-Clowering to:
� Aim for a dietary pattern that achieves 5% to6% of calories from saturated fat.
NHLBI Grade: A (strong); ACC/AHA COR: I, LOE: A
Rationale: As described in Table 10, ES11 there is strongevidence that reductions in LDL-C were achieved whendietary patterns were followed in which saturated fat intakewas reduced from 14% to 15% of calories to 5% to 6%. Aspreviously noted, these studies did not isolate the effect ofsaturated fat on LDL-C lowering. Intake of saturated fathas decreased in the United States over the past few de-cades and is currently estimated at 11% of energy in theU.S. population �2 years of age (51). However, this levelof saturated fat intake is higher than that tested in theDASH and DELTA (Dietary Effects on Lipoproteins andThrombogenic Activity) trials (5% to 6%) and is notconsistent with consuming a diet rich in vegetables, fruits,low-fat dairy products, whole grains, poultry, fish, legumesand nuts, and vegetable oils and limited in sweets, sugar-sweetened beverages, and red meat. Given the currentaverage intake of saturated fat at 11% of calories, it wouldbe beneficial for those who would benefit from LDL-Clowering to decrease saturated fat intake to 5% to 6% ofcalories.
3. Advise adults who would benefit from LDL-Clowering to:
� Reduce percentage of calories from saturatedfat.
NHLBI Grade: A (strong); ACC/AHA COR: I, LOE: A
Rationale: Reducing saturated fat intake lowers bothLDL-C and HDL-C. Because the absolute effect tends to
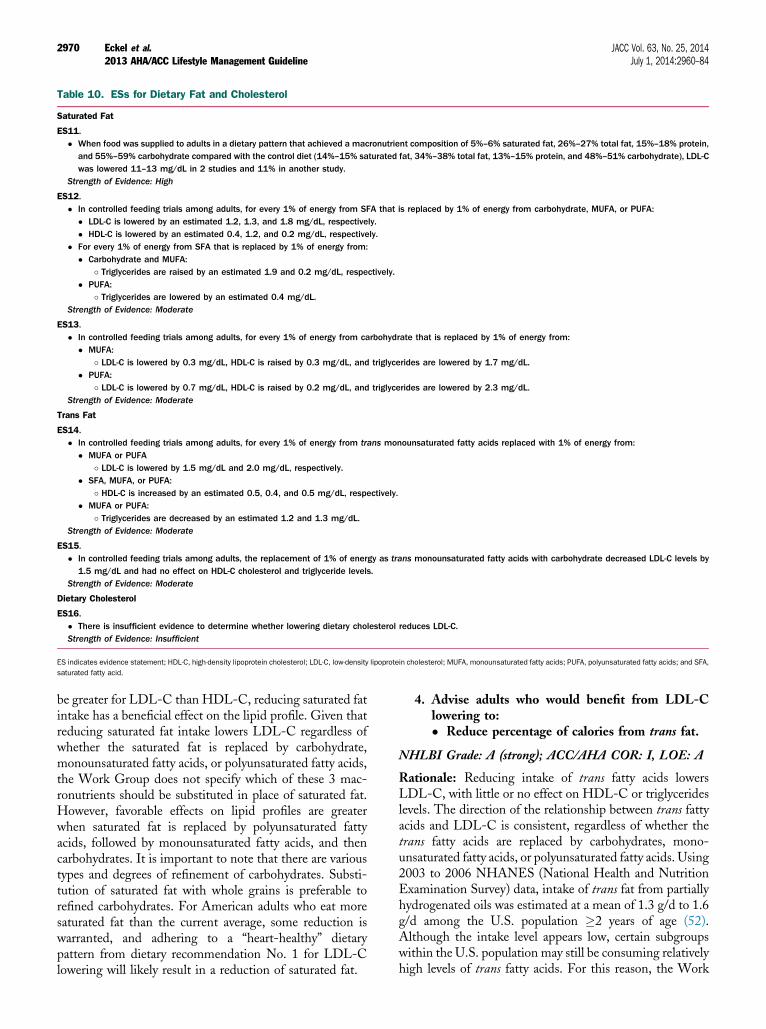
Table 10. ESs for Dietary Fat and Cholesterol
Saturated Fat
ES11.� When food was supplied to adults in a dietary pattern that achieved a macronutrient composition of 5%–6% saturated fat, 26%–27% total fat, 15%–18% protein,
and 55%–59% carbohydrate compared with the control diet (14%–15% saturated fat, 34%–38% total fat, 13%–15% protein, and 48%–51% carbohydrate), LDL-Cwas lowered 11–13 mg/dL in 2 studies and 11% in another study.
Strength of Evidence: High
ES12.� In controlled feeding trials among adults, for every 1% of energy from SFA that is replaced by 1% of energy from carbohydrate, MUFA, or PUFA:
� LDL-C is lowered by an estimated 1.2, 1.3, and 1.8 mg/dL, respectively.� HDL-C is lowered by an estimated 0.4, 1.2, and 0.2 mg/dL, respectively.
� For every 1% of energy from SFA that is replaced by 1% of energy from:� Carbohydrate and MUFA:
� Triglycerides are raised by an estimated 1.9 and 0.2 mg/dL, respectively.� PUFA:
� Triglycerides are lowered by an estimated 0.4 mg/dL.Strength of Evidence: Moderate
ES13.� In controlled feeding trials among adults, for every 1% of energy from carbohydrate that is replaced by 1% of energy from:
� MUFA:� LDL-C is lowered by 0.3 mg/dL, HDL-C is raised by 0.3 mg/dL, and triglycerides are lowered by 1.7 mg/dL.
� PUFA:� LDL-C is lowered by 0.7 mg/dL, HDL-C is raised by 0.2 mg/dL, and triglycerides are lowered by 2.3 mg/dL.
Strength of Evidence: Moderate
Trans Fat
ES14.� In controlled feeding trials among adults, for every 1% of energy from trans monounsaturated fatty acids replaced with 1% of energy from:
� MUFA or PUFA� LDL-C is lowered by 1.5 mg/dL and 2.0 mg/dL, respectively.
� SFA, MUFA, or PUFA:� HDL-C is increased by an estimated 0.5, 0.4, and 0.5 mg/dL, respectively.
� MUFA or PUFA:� Triglycerides are decreased by an estimated 1.2 and 1.3 mg/dL.
Strength of Evidence: Moderate
ES15.� In controlled feeding trials among adults, the replacement of 1% of energy as trans monounsaturated fatty acids with carbohydrate decreased LDL-C levels by
1.5 mg/dL and had no effect on HDL-C cholesterol and triglyceride levels.Strength of Evidence: Moderate
Dietary Cholesterol
ES16.� There is insufficient evidence to determine whether lowering dietary cholesterol reduces LDL-C.Strength of Evidence: Insufficient
ES indicates evidence statement; HDL-C, high-density lipoprotein cholesterol; LDL-C, low-density lipoprotein cholesterol; MUFA, monounsaturated fatty acids; PUFA, polyunsaturated fatty acids; and SFA,
saturated fatty acid.
Eckel et al. JACC Vol. 63, No. 25, 20142013 AHA/ACC Lifestyle Management Guideline July 1, 2014:2960–84
2970
be greater for LDL-C than HDL-C, reducing saturated fatintake has a beneficial effect on the lipid profile. Given thatreducing saturated fat intake lowers LDL-C regardless ofwhether the saturated fat is replaced by carbohydrate,monounsaturated fatty acids, or polyunsaturated fatty acids,the Work Group does not specify which of these 3 mac-ronutrients should be substituted in place of saturated fat.However, favorable effects on lipid profiles are greaterwhen saturated fat is replaced by polyunsaturated fattyacids, followed by monounsaturated fatty acids, and thencarbohydrates. It is important to note that there are varioustypes and degrees of refinement of carbohydrates. Substi-tution of saturated fat with whole grains is preferable torefined carbohydrates. For American adults who eat moresaturated fat than the current average, some reduction iswarranted, and adhering to a “heart-healthy” dietarypattern from dietary recommendation No. 1 for LDL-Clowering will likely result in a reduction of saturated fat.
4. Advise adults who would benefit from LDL-Clowering to:� Reduce percentage of calories from trans fat.
NHLBI Grade: A (strong); ACC/AHA COR: I, LOE: A
Rationale: Reducing intake of trans fatty acids lowersLDL-C, with little or no effect on HDL-C or triglycerideslevels. The direction of the relationship between trans fattyacids and LDL-C is consistent, regardless of whether thetrans fatty acids are replaced by carbohydrates, mono-unsaturated fatty acids, or polyunsaturated fatty acids. Using2003 to 2006 NHANES (National Health and NutritionExamination Survey) data, intake of trans fat from partiallyhydrogenated oils was estimated at a mean of 1.3 g/d to 1.6g/d among the U.S. population �2 years of age (52).Although the intake level appears low, certain subgroupswithin the U.S. population may still be consuming relativelyhigh levels of trans fatty acids. For this reason, the Work
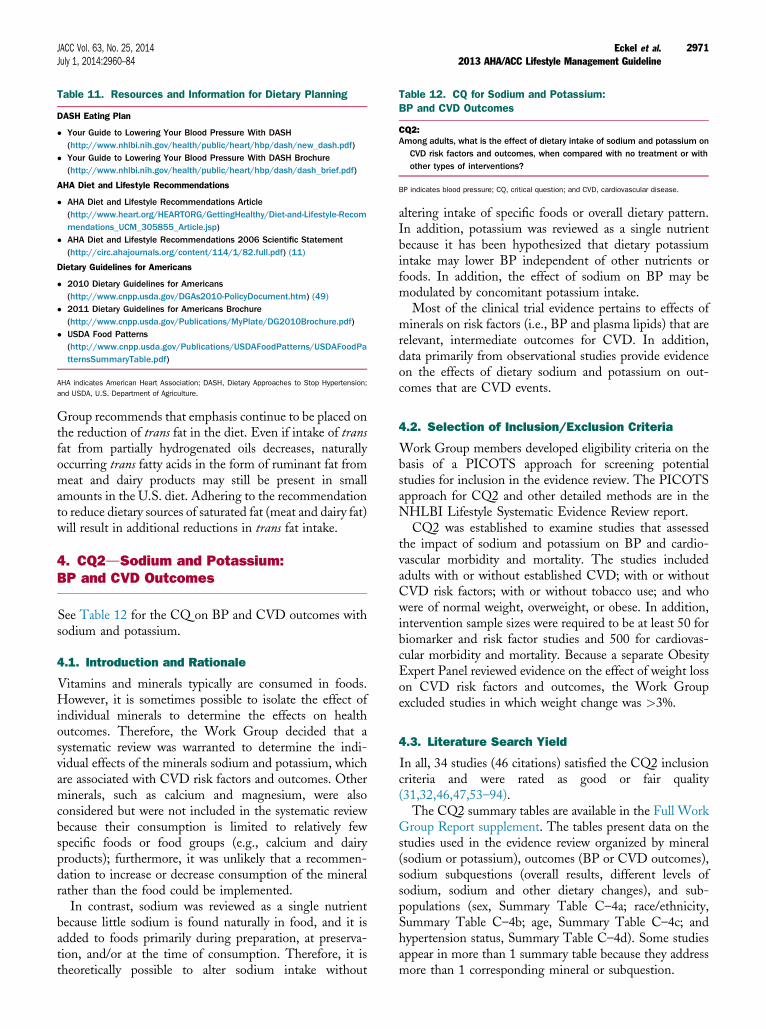
Table 11. Resources and Information for Dietary Planning
DASH Eating Plan
� Your Guide to Lowering Your Blood Pressure With DASH(http://www.nhlbi.nih.gov/health/public/heart/hbp/dash/new_dash.pdf)
� Your Guide to Lowering Your Blood Pressure With DASH Brochure(http://www.nhlbi.nih.gov/health/public/heart/hbp/dash/dash_brief.pdf)
AHA Diet and Lifestyle Recommendations
� AHA Diet and Lifestyle Recommendations Article(http://www.heart.org/HEARTORG/GettingHealthy/Diet-and-Lifestyle-Recommendations_UCM_305855_Article.jsp)
� AHA Diet and Lifestyle Recommendations 2006 Scientific Statement(http://circ.ahajournals.org/content/114/1/82.full.pdf) (11)
Dietary Guidelines for Americans
� 2010 Dietary Guidelines for Americans(http://www.cnpp.usda.gov/DGAs2010-PolicyDocument.htm) (49)
� 2011 Dietary Guidelines for Americans Brochure(http://www.cnpp.usda.gov/Publications/MyPlate/DG2010Brochure.pdf)
� USDA Food Patterns(http://www.cnpp.usda.gov/Publications/USDAFoodPatterns/USDAFoodPatternsSummaryTable.pdf)
AHA indicates American Heart Association; DASH, Dietary Approaches to Stop Hypertension;
and USDA, U.S. Department of Agriculture.
Table 12. CQ for Sodium and Potassium:BP and CVD Outcomes
CQ2:Among adults, what is the effect of dietary intake of sodium and potassium on
CVD risk factors and outcomes, when compared with no treatment or withother types of interventions?
BP indicates blood pressure; CQ, critical question; and CVD, cardiovascular disease.
JACC Vol. 63, No. 25, 2014 Eckel et al.July 1, 2014:2960–84 2013 AHA/ACC Lifestyle Management Guideline
2971
Group recommends that emphasis continue to be placed onthe reduction of trans fat in the diet. Even if intake of transfat from partially hydrogenated oils decreases, naturallyoccurring trans fatty acids in the form of ruminant fat frommeat and dairy products may still be present in smallamounts in the U.S. diet. Adhering to the recommendationto reduce dietary sources of saturated fat (meat and dairy fat)will result in additional reductions in trans fat intake.
4. CQ2dSodium and Potassium:BP and CVD Outcomes
See Table 12 for the CQ on BP and CVD outcomes withsodium and potassium.
4.1. Introduction and Rationale
Vitamins and minerals typically are consumed in foods.However, it is sometimes possible to isolate the effect ofindividual minerals to determine the effects on healthoutcomes. Therefore, the Work Group decided that asystematic review was warranted to determine the indi-vidual effects of the minerals sodium and potassium, whichare associated with CVD risk factors and outcomes. Otherminerals, such as calcium and magnesium, were alsoconsidered but were not included in the systematic reviewbecause their consumption is limited to relatively fewspecific foods or food groups (e.g., calcium and dairyproducts); furthermore, it was unlikely that a recommen-dation to increase or decrease consumption of the mineralrather than the food could be implemented.In contrast, sodium was reviewed as a single nutrient
because little sodium is found naturally in food, and it isadded to foods primarily during preparation, at preserva-tion, and/or at the time of consumption. Therefore, it istheoretically possible to alter sodium intake without
altering intake of specific foods or overall dietary pattern.In addition, potassium was reviewed as a single nutrientbecause it has been hypothesized that dietary potassiumintake may lower BP independent of other nutrients orfoods. In addition, the effect of sodium on BP may bemodulated by concomitant potassium intake.
Most of the clinical trial evidence pertains to effects ofminerals on risk factors (i.e., BP and plasma lipids) that arerelevant, intermediate outcomes for CVD. In addition,data primarily from observational studies provide evidenceon the effects of dietary sodium and potassium on out-comes that are CVD events.
4.2. Selection of Inclusion/Exclusion Criteria
Work Group members developed eligibility criteria on thebasis of a PICOTS approach for screening potentialstudies for inclusion in the evidence review. The PICOTSapproach for CQ2 and other detailed methods are in theNHLBI Lifestyle Systematic Evidence Review report.
CQ2 was established to examine studies that assessedthe impact of sodium and potassium on BP and cardio-vascular morbidity and mortality. The studies includedadults with or without established CVD; with or withoutCVD risk factors; with or without tobacco use; and whowere of normal weight, overweight, or obese. In addition,intervention sample sizes were required to be at least 50 forbiomarker and risk factor studies and 500 for cardiovas-cular morbidity and mortality. Because a separate ObesityExpert Panel reviewed evidence on the effect of weight losson CVD risk factors and outcomes, the Work Groupexcluded studies in which weight change was >3%.
4.3. Literature Search Yield
In all, 34 studies (46 citations) satisfied the CQ2 inclusioncriteria and were rated as good or fair quality(31,32,46,47,53–94).
The CQ2 summary tables are available in the Full WorkGroup Report supplement. The tables present data on thestudies used in the evidence review organized by mineral(sodium or potassium), outcomes (BP or CVD outcomes),sodium subquestions (overall results, different levels ofsodium, sodium and other dietary changes), and sub-populations (sex, Summary Table C–4a; race/ethnicity,Summary Table C–4b; age, Summary Table C–4c; andhypertension status, Summary Table C–4d). Some studiesappear in more than 1 summary table because they addressmore than 1 corresponding mineral or subquestion.

Eckel et al. JACC Vol. 63, No. 25, 20142013 AHA/ACC Lifestyle Management Guideline July 1, 2014:2960–84
2972
4.4. CQ2 Evidence Statements
See Table 13 for the CQ2 ESs for sodium and BP.
4.4.1. Sodium and BP
A note about the unit of measure presented for dietaryand urinary sodium: sodium is presented in studies inmillimoles (mmol), grams (g), and milligrams (mg). TheWork Group chose to convert the sodium results to mil-ligrams for the ESs, recommendations, and rationales sothat data from different studies would be displayed in aconsistent unit. Also, U.S. dietary recommendations andthe Nutrition Facts labels on food products display sodiumin milligrams, and this unit (mg) will be easier forhealthcare providers to communicate with patients. Uri-nary and dietary sodium are portrayed in the original unitsfrom each published study in the CQ2 summary tables(C–1 to C–8).
4.5. Diet Recommendations for BP Lowering
1. Advise adults who would benefit fromBP lowering to:a. Consume a dietary pattern that emphasizes intake
of vegetables, fruits, and whole grains; includeslow-fat dairy products, poultry, fish, legumes,nontropical vegetable oils, and nuts; and limitsintake of sweets, sugar-sweetened beverages, andred meats.
i. Adapt this dietary pattern to appropriate calorierequirements, personal and cultural food pref-erences, and nutrition therapy for other medi-cal conditions (including diabetes).ii. Achieve this pattern by following plans such asthe DASH dietary pattern, the USDA FoodPattern, or the AHA Diet.
NHLBI Grade: A (strong); ACC/AHA COR: I, LOE: A
Rationale: This recommendation is based largely onstudies of the DASH dietary pattern (DASH and DASH-Sodium), which provided the highest-quality evidence thatthis food-based dietary pattern improves lipid profiles andBP (Tables 8 and 9, CQ1 ES3–ES9). This evidence wassupplemented by studies of low quality in which variousadaptations of the MED pattern were tested and alsofound to reduce BP (Table 7, CQ1 ES1). The evidencesuggests that the effects of the recommended dietarypattern persist as long as the pattern is consumed. The BP-lowering effect has been demonstrated in adults with hy-pertension and prehypertension and is evident in men andwomen, African-American and non–African-Americanadults, and older and younger adults (Table 8, ES5). Thedietary pattern’s effect on BP is independent of changes inweight and sodium intake. The magnitude of effect issufficient to prevent progression from prehypertension tohypertension, promote nonpharmacological BP control inthose with hypertension, and supplement pharmacologicalBP lowering.
The caloric (energy) intake should be appropriate for theindividual (e.g., restricted for those attempting weightloss). Patients should also be encouraged to adapt therecommended dietary pattern to their personal and culturalpreferences. Materials are available to assist patients inachieving the recommended dietary pattern at differentcalorie levels (Table 9). The 2010 U.S. Department ofHealth and Human Services Dietary Guidelines forAmericans recommend the USDA Food Pattern and theDASH dietary pattern (49). Overall, the recommendeddietary pattern is consistent with the AHA Diet (50) andthe USDA Food Pattern (49). The USDA Food Patternoffers lacto-ovo vegetarian and vegan adaptations. There-fore, this recommendation is consistent with other nationalguidelines. Clinicians should be familiar with the recom-mendations, advise their patients to adopt them, andprovide easy access to information (Table 11). Dietaryplanning and nutritional counseling are often facilitated byreferral to a nutrition professional.
2. Advise adults who would benefit from BPlowering to:
a. Lower sodium intakeNHLBI Grade: A (strong); ACC/AHA COR: I, LOE: A
Rationale: There is strong and consistent clinical trialevidence that reducing sodium intake lowers BP. This BP-lowering effect has been demonstrated in adults with hy-pertension and prehypertension, in men and women, inAfrican-American and non–African-American adults, andin older and younger adults. Trials contributing to thisevidence include well-controlled feeding studies as well asstudies in which participants were counseled to lower so-dium intake. The effect of reducing sodium intake on BP isindependent of changes in weight. The magnitude of effectis sufficient both to prevent progression from pre-hypertension to hypertension and to promote non-pharmacological BP control in those with hypertension.Observational data also suggest that lower sodium intake isassociated with lower risk of cardiovascular events in peoplewith and without hypertension, which is hypothesized tooccur through reductions in BP.
3. Advise adults who would benefit from BPlowering to:
a. Consume no more than 2,400 mg of sodium/d;b. Further reductionof sodium intake to 1,500mg/dcan result in even greater reduction in BP;c. Even without achieving these goals, reducing
sodium intake by at least 1,000 mg/d lowers BP.
NHLBI Grade: B (moderate); ACC/AHA COR: IIa, LOE: B
Rationale: One well-conducted trial demonstrated clini-cally meaningful lowering of BP when sodium was reducedto 2,400 mg/d, with lower BPs achieved when sodium intakewas reduced to 1,500 mg/d. Reductions of 1,000 mg/d wereshown to be beneficial in trials, and observational studies

Table 13. CQ2 ESs for Sodium and BP
Overall Results of Sodium and the Effect on BP:
What Is the Overall Effect of Dietary Intake of Sodium on BP?
ES1.� In adults 25 to 80 years of age with BP 120–159/80–95 mm Hg, reducing sodium intake lowers BP.Strength of Evidence: High
Comparison of Different Levels of Sodium Intake:
What Is the Effect of Different Levels of Dietary Sodium Intake on BP?ES2.
� In adults 25 to 75 years of age with BP 120–159/80–95 mm Hg, a reduction in sodium intake that achieves a mean 24-h urinary sodium excretion ofapproximately 2,400 mg/d, relative to approximately 3,300 mg/d, lowers BP by 2/1 mm Hg. A reduction in sodium intake that achieves a mean 24-hurinary sodium excretion of approximately 1,500 mg/d lowers BP by 7/3 mm Hg.
Strength of Evidence: Moderate
ES3.� In adults 30–80 years of age with or without hypertension, counseling to reduce sodium intake by an average of 1,150 mg/d reduces BP by 3–4/1–2 mm Hg.Strength of Evidence: High
Sodium in Subpopulations:
What Is the Effect of Sodium on BP in Subgroups Defined by Sex, Race/Ethnicity, Age, and Hypertension Status?
ES4.� In adults with prehypertension or hypertension, reducing sodium intake lowers BP in women and men, African-American and non–African-American adults, and
older and younger adults.Strength of Evidence: High
ES5.� Reducing sodium intake lowers BP in adults with either prehypertension or hypertension who are eating either the typical American diet or the DASH dietary
pattern. The effect is greater in those with hypertension.Strength of Evidence: High
Sodium and Dietary Pattern Changes:
What Is the Effect of Sodium on BP in the Context of Dietary Pattern Changes?
ES6.� In adults 22–80 years of age with BP 120–159/80–95 mm Hg, the combination of reduced sodium intake plus eating the DASH dietary pattern lowers BP more
than reduced sodium intake alone.Strength of Evidence: Moderate
Sodium in the Context of Other Minerals and BP:
What Is the Effect of Sodium on BP in the Context of Other Single Minerals?
ES7.� There is insufficient evidence from RCTs to determine whether reducing sodium intake plus changing dietary intake of any other single mineral (e.g., increasing
potassium, calcium, or magnesium) lowers BP more than reducing sodium intake alone.Strength of Evidence: Insufficient
Sodium and Congestive Heart Disease/CVD Outcomes:
What Is the Effect of Dietary Intake of Sodium on CVD Outcomes?
ES8.� A reduction in sodium intake of approximately 1,000 mg/d reduces CVD events by about 30%.Strength of Evidence: Low
ES9.� Higher dietary sodium intake is associated with a greater risk of fatal and nonfatal stroke and CVD.Strength of Evidence: Low
ES10.� There is insufficient evidence to determine the association between sodium intake and the development of HF.Strength of Evidence: Insufficient
ES11.� There is insufficient evidence to assess the effect of reducing dietary sodium intake on cardiovascular outcomes in patients with existing HF.Strength of Evidence: Insufficient
Potassium and BP and Congestive Heart Disease/CVD Outcomes:
What Is the Effect of Dietary Intake of Potassium on BP and CVD Outcomes?
ES12.� There is insufficient evidence to determine whether increasing dietary potassium intake lowers BP.Strength of Evidence: Insufficient
ES13.� In observational studies with appropriate adjustments (e.g., BP, sodium intake), higher dietary potassium intake is associated with lower stroke risk.Strength of Evidence: Low
ES14.� There is insufficient evidence to determine whether there is an association between dietary potassium intake and congestive heart disease, HF, or cardiovascular
mortality rate.Strength of Evidence: Insufficient
BP indicates blood pressure; CVD, cardiovascular disease; DASH, Dietary Approaches to Stop Hypertension; ES, evidence statement; HF, heart failure; and RCT, randomized controlled trial.
JACC Vol. 63, No. 25, 2014 Eckel et al.July 1, 2014:2960–84 2013 AHA/ACC Lifestyle Management Guideline
2973

Table 14. CQ for Physical Activity: Lipids and BP
CQ3:Among adults, what is the effect of physical activity on BP and lipids when
compared with no treatment or with other types of interventions?
BP indicates blood pressure and CQ, critical question.
Eckel et al. JACC Vol. 63, No. 25, 20142013 AHA/ACC Lifestyle Management Guideline July 1, 2014:2960–84
2974
estimated significant reductions in relative risk associatedwith changes in sodium intake of about 1,000 mg/d. Thisrecommendation is directed at the two thirds of the U.S.adults who have prehypertension or hypertension, forwhom reducing sodium intake can prevent or improvecontrol of hypertension and potentially reduce cardiovas-cular events.The Work Group acknowledges that the recommenda-
tion to reduce sodium intake to�2,400mg/d differs slightlyfrom other current dietary recommendationsdspecifically,the 2010 Dietary Guidelines for Americans and theInstitute of Medicine Dietary Reference Intakes; bothof these publications recommend 2,300 mg/d as theupper limit of intake for adults. Although the impacton behavior of a difference between intakes of 2,400mg of sodium/d versus 2,300 mg of sodium/d would beminimal, these recommendations are based on thestrongest clinical trial evidence available: the achievedlevel of 2,400 mg/d from the DASH-Sodium trial(estimated from average urinary sodium excretion)(Table 11, CQ2 ES2).The strength of this recommendation is graded “mod-
erate” because fewer clinical trials were used to devise the2,400-mg and 1,500-mg goals than the large number oftrials used to inform the overall recommendation on so-dium (dietary recommendation No. 2 for BP lowering),which is graded “strong.”Reducing sodium intake can be challenging for an in-
dividual because of the ubiquitous nature of sodium in theAmerican food supply. Educational materials with strate-gies to help patients lower sodium intake are provided byseveral federal and private sources (49,95–98). Ultimately,however, significant changes in sodium intake among U.S.adults may require changes both in individual behavior andin food manufacturing and processing.
4. Advise adults who would benefit from BPlowering to:
a. Combine the DASH dietary pattern with lowersodium intake.
NHLBI Grade: A (strong); ACC/AHA COR: I, LOE: A
Rationale: Both a healthy dietary pattern, as exemplifiedby DASH, and reduced sodium intake independentlyreduce BP. However, the BP-lowering effect is evengreater when these dietary changes are combined. In the60% of U.S. adults with prehypertension or hypertension,simultaneously implementing dietary recommendationsNo. 1 and No. 2 for BP lowering can prevent and controlhypertension more than either intervention alone.
5. CQ3dPhysical Activity: Lipids and BP
See Table 14 for the CQ for physical activity and lipidsand BP.
5.1. Introduction/Rationale
Large bodies of observational data show an associationbetween higher levels of physical activity and lower rates ofmany chronic diseases, including CVD, and enhancedlongevity (99–101). Furthermore, an inverse dose-responserelation exists, with increasing higher levels of activityassociated with commensurately lower rates of CVD in acurvilinear fashion (102,103). In a recent analysis, it wasestimated that by eliminating physical inactivity, 6% ofcoronary heart disease worldwide may be eliminated, andlife expectancy of the world population may be increased by0.68 years (104,105).
Among the mechanisms proposed to mediate the rela-tionship between physical activity and decreased CVDrates are beneficial effects of exercise on lipid profile andBP (106). In one study, it was estimated that the beneficialeffects of physical activity on BP and development of hy-pertension explained some 27% of the activity-relatedreduction in observed CVD rates, while 19% and 16% ofthe reduction in CVD rates could be explained by thebeneficial effects of physical activity on traditional lipidsand novel lipids, respectively.
In the remainder of Section 5, the Work Group elab-orates on findings from meta-analyses of the effects ofphysical activity on changes in lipid profile and BP.
5.2. Selection of Inclusion/Exclusion Criteria
Because of resource limitations, the Work Group includedonly systematic reviews and meta-analyses of RCTs orcontrolled clinical trials published from 2001 through2011. Detailed inclusion/exclusion criteria are available inthe Full Work Group Report supplement.
5.3. Literature Search Yield
A total of 26 systematic reviews and meta-analyses wereidentified that met inclusion/exclusion criteria and wererated as good or fair quality (105,107–130).
The CQ3 subcommittee members next identified theincluded systematic reviews and meta-analyses that con-tained detailed data on BP outcomes. They identified 11studies with data on BP outcomes. Ten meta-analyses and1 systematic review examined the effects of aerobic exer-cise. One systematic review looked at the effects of resis-tance training. The CQ3 subcommittee members nextidentified the included systematic reviews and meta-analyses that contained detailed data on lipid outcomes.They identified 14 studies with data on lipid outcomes,including 10 meta-analyses and 4 systematic reviews.
The next step in the evidence review process for sys-tematic reviews and meta-analyses was to develop ESs and
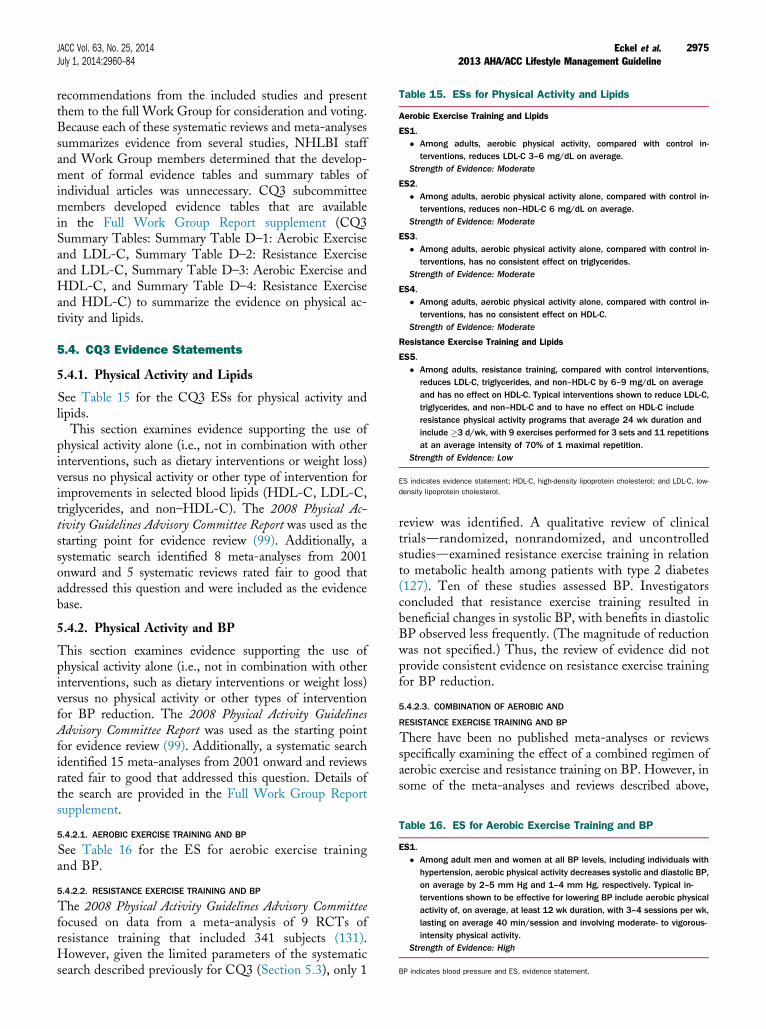
Table 16. ES for Aerobic Exercise Training and BP
ES1.� Among adult men and women at all BP levels, including individuals with
hypertension, aerobic physical activity decreases systolic and diastolic BP,on average by 2–5 mm Hg and 1–4 mm Hg, respectively. Typical in-terventions shown to be effective for lowering BP include aerobic physicalactivity of, on average, at least 12 wk duration, with 3–4 sessions per wk,lasting on average 40 min/session and involving moderate- to vigorous-intensity physical activity.
Strength of Evidence: High
BP indicates blood pressure and ES, evidence statement.
Table 15. ESs for Physical Activity and Lipids
Aerobic Exercise Training and Lipids
ES1.� Among adults, aerobic physical activity, compared with control in-
terventions, reduces LDL-C 3–6 mg/dL on average.Strength of Evidence: Moderate
ES2.� Among adults, aerobic physical activity alone, compared with control in-
terventions, reduces non–HDL-C 6 mg/dL on average.Strength of Evidence: Moderate
ES3.� Among adults, aerobic physical activity alone, compared with control in-
terventions, has no consistent effect on triglycerides.Strength of Evidence: Moderate
ES4.� Among adults, aerobic physical activity alone, compared with control in-
terventions, has no consistent effect on HDL-C.Strength of Evidence: Moderate
Resistance Exercise Training and Lipids
ES5.� Among adults, resistance training, compared with control interventions,
reduces LDL-C, triglycerides, and non–HDL-C by 6–9 mg/dL on averageand has no effect on HDL-C. Typical interventions shown to reduce LDL-C,triglycerides, and non–HDL-C and to have no effect on HDL-C includeresistance physical activity programs that average 24 wk duration andinclude �3 d/wk, with 9 exercises performed for 3 sets and 11 repetitionsat an average intensity of 70% of 1 maximal repetition.
Strength of Evidence: Low
ES indicates evidence statement; HDL-C, high-density lipoprotein cholesterol; and LDL-C, low-
density lipoprotein cholesterol.
JACC Vol. 63, No. 25, 2014 Eckel et al.July 1, 2014:2960–84 2013 AHA/ACC Lifestyle Management Guideline
2975
recommendations from the included studies and presentthem to the full Work Group for consideration and voting.Because each of these systematic reviews and meta-analysessummarizes evidence from several studies, NHLBI staffand Work Group members determined that the develop-ment of formal evidence tables and summary tables ofindividual articles was unnecessary. CQ3 subcommitteemembers developed evidence tables that are availablein the Full Work Group Report supplement (CQ3Summary Tables: Summary Table D–1: Aerobic Exerciseand LDL-C, Summary Table D–2: Resistance Exerciseand LDL-C, Summary Table D–3: Aerobic Exercise andHDL-C, and Summary Table D–4: Resistance Exerciseand HDL-C) to summarize the evidence on physical ac-tivity and lipids.
5.4. CQ3 Evidence Statements
5.4.1. Physical Activity and Lipids
See Table 15 for the CQ3 ESs for physical activity andlipids.This section examines evidence supporting the use of
physical activity alone (i.e., not in combination with otherinterventions, such as dietary interventions or weight loss)versus no physical activity or other type of intervention forimprovements in selected blood lipids (HDL-C, LDL-C,triglycerides, and non–HDL-C). The 2008 Physical Ac-tivity Guidelines Advisory Committee Report was used as thestarting point for evidence review (99). Additionally, asystematic search identified 8 meta-analyses from 2001onward and 5 systematic reviews rated fair to good thataddressed this question and were included as the evidencebase.
5.4.2. Physical Activity and BP
This section examines evidence supporting the use ofphysical activity alone (i.e., not in combination with otherinterventions, such as dietary interventions or weight loss)versus no physical activity or other types of interventionfor BP reduction. The 2008 Physical Activity GuidelinesAdvisory Committee Report was used as the starting pointfor evidence review (99). Additionally, a systematic searchidentified 15 meta-analyses from 2001 onward and reviewsrated fair to good that addressed this question. Details ofthe search are provided in the Full Work Group Reportsupplement.
5.4.2.1. AEROBIC EXERCISE TRAINING AND BP
See Table 16 for the ES for aerobic exercise trainingand BP.
5.4.2.2. RESISTANCE EXERCISE TRAINING AND BP
The 2008 Physical Activity Guidelines Advisory Committeefocused on data from a meta-analysis of 9 RCTs ofresistance training that included 341 subjects (131).However, given the limited parameters of the systematicsearch described previously for CQ3 (Section 5.3), only 1
review was identified. A qualitative review of clinicaltrialsdrandomized, nonrandomized, and uncontrolledstudiesdexamined resistance exercise training in relationto metabolic health among patients with type 2 diabetes(127). Ten of these studies assessed BP. Investigatorsconcluded that resistance exercise training resulted inbeneficial changes in systolic BP, with benefits in diastolicBP observed less frequently. (The magnitude of reductionwas not specified.) Thus, the review of evidence did notprovide consistent evidence on resistance exercise trainingfor BP reduction.
5.4.2.3. COMBINATION OF AEROBIC AND
RESISTANCE EXERCISE TRAINING AND BP
There have been no published meta-analyses or reviewsspecifically examining the effect of a combined regimen ofaerobic exercise and resistance training on BP. However, insome of the meta-analyses and reviews described above,

Table 17. Heart-Healthy Nutrition and Physical ActivityBehaviors
Heart-Healthy Nutrition and Physical Activity Behaviors
The adult population should be encouraged to practice heart-healthy lifestylebehaviors, including:
� Consume a dietary pattern that emphasizes intake of vegetables, fruits, andwhole grains; includes low-fat dairy products, poultry, fish, legumes,nontropical vegetable oils, and nuts; and limits intake of sodium, sweets,sugar-sweetened beverages, and red meats.- Adapt this dietary pattern to appropriate calorie requirements, personal
and cultural food preferences, and nutrition therapy for other medicalconditions (including diabetes).
- Achieve this pattern by following plans such as the DASH dietary pattern,the USDA Food Pattern, or the AHA Diet.
� Engage in 2 h and 30 min per wk of moderate-intensity physical activity, or1 h and 15 min (75 min) per wk of vigorous-intensity aerobic physicalactivity, or an equivalent combination of moderate- and vigorous-intensityaerobic physical activity. Aerobic activity should be performed in episodes ofat least 10 min, preferably spread throughout the wk (132).
� Achieve and maintain a healthy weight. Refer to the 2013 Obesity ExpertPanel Report for recommendations on weight loss and maintenance (5).
AHA indicates American Heart Association; DASH, Dietary Approaches to Stop Hypertension;
and USDA, U.S. Department of Agriculture.
Eckel et al. JACC Vol. 63, No. 25, 20142013 AHA/ACC Lifestyle Management Guideline July 1, 2014:2960–84
2976
studies with aerobic and resistance components wereincluded in pooled data related to aerobic exercise training(113,114).
5.5. Physical Activity Recommendations
1. In general, advise adults to engage in aerobic phys-ical activity to reduce LDL-C and non–HDL-C: 3 to4 sessions per week, lasting on average 40 minutesper session, and involving moderate- to vigorous-intensity physical activity.
NHLBI Grade: B (moderate); ACC/AHA COR: IIa, LOE: A
Rationale: This recommendation was based on evidencefrom meta-analyses and reviews published from 2001 on-ward and rated fair to good. This is also consistent with thefindings of the literature review conducted for the 2008Physical Activity Guidelines Advisory Committee Report, inwhich it was found that it may require 12 metabolicequivalent task-hours per week of exercise to favorablyinfluence LDL-C. The amount of physical activity rec-ommended above for reducing LDL-C and non–HDL-Cis congruent with the amount of physical activity recom-mended in 2008 by the federal government for overallhealth: “Most health benefits occur with at least 150minutes (2 hours and 30 minutes) a week of moderate-intensity physical activity, such as brisk walking. Addi-tional benefits occur with more physical activity” (99).
2. In general, advise adults to engage in aerobicphysical activity to lower BP: 3 to 4 sessions perweek, lasting on average 40 minutes per session,and involving moderate- to vigorous-intensityphysical activity.
NHLBI Grade: B (moderate); ACC/AHA COR: IIa, LOE: A
Rationale: This recommendation was based on evidencefrom meta-analyses and reviews rated fair to good that werepublished from 2001 onward, as well as the 2008 PhysicalActivity Guidelines Advisory Committee Report. The amountof physical activity recommended above for lowering BPis congruent with the amount of physical activity recom-mended in 2008 by the federal government for overallhealth: “Most health benefits occur with at least 150minutes (2 hours and 30 minutes) a week of moderate-intensity physical activity, such as brisk walking. Addi-tional benefits occur with more physical activity” (99). It isworth noting that the present recommendation is congruentwith (i.e., expends approximately the same amount of en-ergy) but not identical to the 2008 federal guidelines. This isbecause the present recommendation is based on a review ofmeta-analyses of exercise in relation to BP only (hence, thespecific regimens as used in the clinical trials), whereas the2008 federal guidelines targeted overall health (i.e., not justBP). Additionally, the 2008 federal guidelines for overallhealth make it clear that any amount of physical activity ishealthful (“Some physical activity is better than none”), and
that there is a dose-response relationship (“For most healthoutcomes, additional benefits occur as the amount ofphysical activity increases through higher intensity, greaterfrequency, and/or longer duration”).
5.6. Heart-Healthy Nutrition andPhysical Activity Behaviors
See Table 17 for information on heart-healthy nutritionand physical activity behaviors.
Overall, the Work Group encourages heart-healthynutrition and physical activity behaviors for the entireU.S. adult population as stated in the 2010 DietaryGuidelines for Americans and the 2008 Physical ActivityGuidelines for Americans. The recommendations inTable 17 are a consensus of the Work Group, not aguideline, and are generally consistent with the 2010 Di-etary Guidelines for Americans and the 2008 Physical ActivityGuidelines for Americans.
6. Gaps in Evidence andFuture Research Needs
6.1. Diet
The extensive work of the Work Group served an addi-tional purpose, and that was to identify important gaps inthe knowledge of how lifestyle impacts CVD risk reduc-tion. Additional research is needed on the following topicsrelated to diet:
� Interaction between dietary modification and statintreatment.
� Relative effects of saturated fats, monounsaturatedfatty acids, polyunsaturated fatty acids, trans fattyacids, omega-3 fatty acids, and types of carbohydrates

JACC Vol. 63, No. 25, 2014 Eckel et al.July 1, 2014:2960–84 2013 AHA/ACC Lifestyle Management Guideline
2977
on lipids, inflammation, microbiome, and othernewer potential CVD risk factors.
� Relative effects of naturally occurring fiber (cereal[whole grains] and vegetable/fruit) and supplementalfiber on lipids, inflammation, microbiome, and othernewer potential CVD risk factors.
� Effects of dietary cholesterol on LDL-C and HDL-C over the current ranges of cholesterol and saturatedfat intakes (5th and 95th percentiles).
� Effects of minerals in combination (other than so-dium) on BP.
� High-density lipoprotein function in studies thatmodify HDL-C by changes in diet.
� Is the minimal effect of dietary carbohydrate onplasma triglycerides harmful?
� The effect of sodium reduction in patients withdiabetes, heart failure, and chronic kidney disease.
� Effect of dietary pattern and sodium intake in adultstaking BP-lowering or lipid-lowering medications(e.g., effects on BP/lipids, achieving BP/lipid goals,medication needs/costs, outcomes).
� Effect of dietary pattern and sodium intake in adultswith CVD (e.g., after myocardial infarction; afterstroke; with coronary artery disease, heart failure, orchronic kidney disease).
� Strategies for effectively (and cost-effectively)implementing these evidence-based recommenda-tions. (How can primary care providers, health sys-tems, public health agencies, local and federalgovernment, community organizations, and otherstakeholders help patients adopt these diet and so-dium intake recommendations?)
� Increased understanding of racial/ethnic/socioeco-nomic factors that may influence (a) effect of dietarypattern and sodium on BP and lipids, (b) adoption ofdiet/sodium recommendations, and (c) method ofdiet assessment.
6.2. Physical Activity
Additional research is needed on the following topicsrelated to physical activity:
� Improved understanding of whether exercise per-formed at a lower intensity or dose, or differentmodes of exercise, can impact these outcomes.
� Further understanding the characteristics of in-dividuals for whom exercise of a certain dose or in-tensity can reduce LDL-C and non–HDL-C.
� Understand the source of the inconsistent findings tobetter understand under what conditions exercise canincrease HDL-C or decrease triglycerides.
� Define the optimal dose of exercise that will result inthe desired changes in lipids and lipoproteins andwhether exercise performed at a lower intensity ordose, or different modes of exercise, can impact theseoutcomes.
� Further understand the characteristics of individualsfor whom exercise of a certain dose, intensity, ormode can increase HDL-C or reduce triglycerides.
� Clarify the shape of the dose-response curve betweenphysical activity and BP.
� Expand the limited data on whether resistance ex-ercise training lowers BP and whether a combinationof aerobic and resistance exercise training offers anyadded BP lowering, compared with aerobic exerciseonly.
� Determine how diet and physical activity behavesynergistically with regard to lipids and BP.
� Determine the effect of physical activity in adultstaking BP-lowering and/or lipid-lowering medica-tions (e.g., effects on BP/lipids, achieving BP/lipidgoals, medication needs/costs, outcomes).
� Determine the effect of physical activity in adultswith CVD (e.g., after myocardial infarction; afterstroke; with coronary artery disease, heart failure, orchronic kidney disease).
� Determine strategies for effectively (and cost-effectively) implementing these evidence-based rec-ommendations. (How can primary care providers,health systems, public health agencies, local andfederal government, community organizations, andother stakeholders help patients adopt these physicalactivity recommendations?)
� Increase understanding of racial/ethnic/socioeco-nomic factors that may influence (a) effect of physicalactivity on BP and lipids and (b) adoption of physicalactivity recommendations.
Presidents and Staff
American College of CardiologyJohn Gordon Harold, MD, MACC, PresidentShalom Jacobovitz, Chief Executive OfficerWilliam J. Oetgen, MD, MBA, FACC, Executive Vice
President, Science, Education, and QualityCharlene L. May, Senior Director, Science and Clinical
Policy
American College of Cardiology/AmericanHeart AssociationLisa Bradfield, CAE, Director, Science and Clinical PolicyEmily Cottrell, MA, Specialist, Science and Clinical Policy
American Heart AssociationMariell Jessup, MD, FACC, FAHA, PresidentNancy Brown, Chief Executive OfficerRose Marie Robertson, MD, FAHA, Chief Science
OfficerGayle R. Whitman, PhD, RN, FAHA, FAAN, Senior
Vice President, Office of Science OperationsMarco Di Buono, PhD, Vice President of Science and
Research

Eckel et al. JACC Vol. 63, No. 25, 20142013 AHA/ACC Lifestyle Management Guideline July 1, 2014:2960–84
2978
Jody Hundley, Production Manager, Scientific Publications,Office of Science Operations
National Heart, Lung, and Blood InstituteKathryn Y. McMurry, MSGlen Bennett, MPHDenise G. Simons-Morton, MD, PhD
REFERENCES
1. Institute of Medicine (U.S.) Committee on Developing TrustworthyGuidelines. Clinical Practice Guidelines We Can Trust. Washing-ton, DC: The National Academies Press; 2011.
2. Gibbons GH, Harold JG, Jessup M, et al. The next steps indeveloping clinical practice guidelines for prevention. J Am CollCardiol 2013;62:1399–400.
3. Gibbons GH, Shurin SB, Mensah GA, et al. Refocusing theagenda on cardiovascular guidelines: an announcement from theNational Heart, Lung, and Blood Institute. J Am Coll Cardiol2013;62:1396–8.
4. Stone NJ, Robinson JG, Lichtenstein AH, et al. 2013 ACC/AHAguideline on the treatment of blood cholesterol to reduce athero-sclerotic cardiovascular risk in adults: a report of the AmericanCollege of Cardiology/American Heart Association Task Force onPractice Guidelines. J Am Coll Cardiol 2014;63:2889–934.
5. Jensen MD, Ryan DH, C.M. A, et al. 2013 ACC/AHA/TOSguideline for the management of overweight and obesity in adults: areport of the American College of Cardiology/American HeartAssociation Task Force on Practice Guidelines and The ObesitySociety. J Am Coll Cardiol 2014;63:2985–3023.
6. Centers for Disease Control and Prevention (CDC). NationalCenter for Health Statistics (NCHS). National Health and Nutri-tion Examination Survey Data. Hyattsville, MD: U.S. Departmentof Health and Human Services, Centers for Disease Control andPrevention; 2005–2008.
7. Micha R, Kalantarian S, Wirojratana P, et al. Estimating the globaland regional burden of suboptimal nutrition on chronic disease:methods and inputs to the analysis. Eur J Clin Nutr 2012;66:119–29.
8. Mehio Sibai A, Nasreddine L, Mokdad AH, et al. Nutrition tran-sition and cardiovascular disease risk factors in Middle East andNorth Africa countries: reviewing the evidence. Ann Nutr Metab2010;57:193–203.
9. Srinath Reddy K, Katan MB. Diet, nutrition and the prevention ofhypertension and cardiovascular diseases. Public Health Nutr 2004;7:167–86.
10. Diet, nutrition, and the prevention of chronic diseases. Report of aWHO Study Group. World Health Organ Tech Rep Ser 1990;797:1–204.
11. American Heart Association Nutrition Committee,Lichtenstein AH, Appel LJ, et al. Diet and lifestyle recommenda-tions revision 2006: a scientific statement from the American HeartAssociation Nutrition Committee. Circulation 2006;114:82–96.
12. Eilat-Adar S, Mete M, Fretts A, et al. Dietary patterns and theirassociation with cardiovascular risk factors in a population under-going lifestyle changes: The Strong Heart Study. Nutr MetabCardiovasc Dis 2013;23:528–35.
13. Flock MR, Kris-Etherton PM. Dietary Guidelines for Americans2010: implications for cardiovascular disease. Curr Atheroscler Rep2011;13:499–507.
14. Mozaffarian D, Appel LJ, Van Horn L. Components of a car-dioprotective diet: new insights. Circulation 2011;123:2870–91.
15. Hercberg S, Castetbon K, Czernichow S, et al. The Nutrinet-SantéStudy: a web-based prospective study on the relationship betweennutrition and health and determinants of dietary patterns andnutritional status. BMC Public Health 2010;10:242.
16. Kant AK. Dietary patterns: biomarkers and chronic disease risk.Appl Physiol Nutr Metab 2010;35:199–206.
17. Iqbal R, Anand S, Ounpuu S, et al. Dietary patterns and the risk ofacute myocardial infarction in 52 countries: results of the INTER-HEART study. Circulation 2008;118:1929–37.
18. Nettleton JA, Schulze MB, Jiang R, et al. A priori-defined dietarypatterns and markers of cardiovascular disease risk in the Multi-Ethnic Study of Atherosclerosis (MESA). Am J Clin Nutr 2008;88:185–94.
19. Mikkilä V, Räsänen L, Raitakari OT, et al. Major dietary patternsand cardiovascular risk factors from childhood to adulthood. TheCardiovascular Risk in Young Finns Study. Br J Nutr 2007;98:218–25.
20. Panagiotakos DB, Pitsavos C, Stefanadis C. Dietary patterns: aMediterranean diet score and its relation to clinical and biologicalmarkers of cardiovascular disease risk. Nutr Metab Cardiovasc Dis2006;16:559–68.
21. Mensink RP, Katan MB. Effect of dietary fatty acids on serum lipidsand lipoproteins. A meta-analysis of 27 trials. Arterioscler ThrombVasc Biol 1992;12:911–9.
22. Mensink RP, Zock PL, Kester ADM, et al. Effects of dietary fattyacids and carbohydrates on the ratio of serum total to HDLcholesterol and on serum lipids and apolipoproteins: a meta-analysisof 60 controlled trials. Am J Clin Nutr 2003;77:1146–55.
23. Mozaffarian D, Clarke R. Quantitative effects on cardiovascular riskfactors and coronary heart disease risk of replacing partially hydro-genated vegetable oils with other fats and oils. Eur J Clin Nutr 2009;63 Suppl 2:S22–33.
24. Tang JL, Armitage JM, Lancaster T, et al. Systematic review ofdietary intervention trials to lower blood total cholesterol in free-living subjects. BMJ 1998;316:1213–20.
25. Jula A, Marniemi J, Huupponen R, et al. Effects of diet and sim-vastatin on serum lipids, insulin, and antioxidants in hypercholes-terolemic men: a randomized controlled trial. JAMA 2002;287:598–605.
26. Michalsen A, Lehmann N, Pithan C, et al. Mediterranean diet hasno effect on markers of inflammation and metabolic risk factors inpatients with coronary artery disease. Eur J Clin Nutr 2006;60:478–85.
27. Wolever TMS, Gibbs AL, Mehling C, et al. The Canadian Trial ofCarbohydrates in Diabetes (CCD), a 1-y controlled trial of low-glycemic-index dietary carbohydrate in type 2 diabetes: no effecton glycated hemoglobin but reduction in C-reactive protein. Am JClin Nutr 2008;87:114–25.
28. Appel LJ, Moore TJ, Obarzanek E, et al. A clinical trial of the ef-fects of dietary patterns on blood pressure. DASH CollaborativeResearch Group. N Engl J Med 1997;336:1117–24.
29. Sacks FM, Appel LJ, Moore TJ, et al. A dietary approach to preventhypertension: a review of the Dietary Approaches to Stop Hyper-tension (DASH) Study. Clin Cardiol 1999;22:III6–10.
30. Obarzanek E, Sacks FM, Vollmer WM, et al. Effects on bloodlipids of a blood pressure-lowering diet: the Dietary Approaches toStop Hypertension (DASH) Trial. Am J Clin Nutr 2001;74:80–9.
31. Sacks FM, Svetkey LP, Vollmer WM, et al. Effects on bloodpressure of reduced dietary sodium and the Dietary Approaches toStop Hypertension (DASH) diet. DASH-Sodium CollaborativeResearch Group. N Engl J Med 2001;344:3–10.
32. Harsha DW, Sacks FM, Obarzanek E, et al. Effect of dietary so-dium intake on blood lipids: results from the DASH-sodium trial.Hypertension 2004;43:393–8.
33. Erlinger TP, Miller ER 3rd, Charleston J, et al. Inflammationmodifies the effects of a reduced-fat low-cholesterol diet on lipids:results from the DASH-sodium trial. Circulation 2003;108:150–4.
34. Ginsberg HN, Kris-Etherton P, Dennis B, et al. Effects of reducingdietary saturated fatty acids on plasma lipids and lipoproteins inhealthy subjects: the DELTA Study, protocol 1. ArteriosclerThromb Vasc Biol 1998;18:441–9.
35. Gardner CD, Coulston A, Chatterjee L, et al. The effect of a plant-based diet on plasma lipids in hypercholesterolemic adults: a ran-domized trial. Ann Intern Med 2005;142:725–33.
36. Jenkins DJA, Kendall CWC, McKeown-Eyssen G, et al. Effect of alow-glycemic index or a high-cereal fiber diet on type 2 diabetes: arandomized trial. JAMA 2008;300:2742–53.
37. Estruch R, Martínez-González MA, Corella D, et al. Effects of aMediterranean-style diet on cardiovascular risk factors: a random-ized trial. Ann Intern Med 2006;145:1–11.
38. Appel LJ, Sacks FM, Carey VJ, et al. Effects of protein,monounsaturated fat, and carbohydrate intake on blood pressure andserum lipids: results of the OmniHeart randomized trial. JAMA2005;294:2455–64.

JACC Vol. 63, No. 25, 2014 Eckel et al.July 1, 2014:2960–84 2013 AHA/ACC Lifestyle Management Guideline
2979
39. Núñez-Córdoba JM, Valencia-Serrano F, Toledo E, et al. TheMediterranean diet and incidence of hypertension: the SeguimientoUniversidad de Navarra (SUN) Study. Am J Epidemiol 2009;169:339–46.
40. Howard BV, Van Horn L, Hsia J, et al. Low-fat dietary pattern andrisk of cardiovascular disease: the Women’s Health Initiative Ran-domized Controlled Dietary Modification Trial. JAMA 2006;295:655–66.
41. Tinker LF, Bonds DE, Margolis KL, et al. Low-fat dietary patternand risk of treated diabetes mellitus in postmenopausal women: theWomen’s Health Initiative randomized controlled dietary modifi-cation trial. Arch Intern Med 2008;168:1500–11.
42. Yusof BNM, Talib RA, Kamaruddin NA, et al. A low-GI diet isassociated with a short-term improvement of glycaemic control in Asianpatients with type 2 diabetes. Diabetes Obes Metab 2009;11:387–96.
43. Svetkey LP, Simons-Morton D, Vollmer WM, et al. Effects ofdietary patterns on blood pressure: subgroup analysis of the DietaryApproaches to Stop Hypertension (DASH) randomized clinicaltrial. Arch Intern Med 1999;159:285–93.
44. Moore TJ, Vollmer WM, Appel LJ, et al. Effect of dietary patternson ambulatory blood pressure: results from the Dietary Approachesto Stop Hypertension (DASH) Trial. DASH CollaborativeResearch Group. Hypertension 1999;34:472–7.
45. Conlin PR, Chow D, Miller ER 3rd, et al. The effect of dietarypatterns on blood pressure control in hypertensive patients: resultsfrom the Dietary Approaches to Stop Hypertension (DASH) trial.Am J Hypertens 2000;13:949–55.
46. Bray GA, Vollmer WM, Sacks FM, et al. A further subgroupanalysis of the effects of the DASH diet and three dietary sodiumlevels on blood pressure: results of the DASH-Sodium Trial. Am JCardiol 2004;94:222–7.
47. Vollmer WM, Sacks FM, Ard J, et al. Effects of diet and sodiumintake on blood pressure: subgroup analysis of the DASH-sodiumtrial. Ann Intern Med 2001;135:1019–28.
48. Tonstad S, Sundfør T, Seljeflot I. Effect of lifestyle changes onatherogenic lipids and endothelial cell adhesion molecules in youngadults with familial premature coronary heart disease. Am J Cardiol2005;95:1187–91.
49. U.S. Department of Agriculture and U.S. Department of Healthand Human Services. Dietary Guidelines for Americans, 2010. 7thEdition. Washington, DC: U.S. Government Printing Office;December 2010.
50. Lichtenstein AH, Appel LJ, Brands M, et al. Summary of AmericanHeart Association Diet and Lifestyle Recommendations revision2006. Arterioscler Thromb Vasc Biol 2006;26:2186–91.
51. Wright JD, Wang C-Y. Trends in intake of energy and macronu-trients in adults from 1999-2000 through 2007-2008. NCHS DataBrief 2010:1–8.
52. Doell D, Folmer D, Lee H, et al. Updated estimate of trans fatintake by the US population. Food Addit Contam Part A ChemAnal Control Expo Risk Assess 2012;29:861–74.
53. Whelton PK, Appel LJ, Espeland MA, et al. Sodium reduction andweight loss in the treatment of hypertension in older persons: arandomized controlled trial of nonpharmacologic interventions inthe elderly (TONE). TONE Collaborative Research Group. JAMA1998;279:839–46.
54. Effects of weight loss and sodium reduction intervention on bloodpressure and hypertension incidence in overweight people with high-normal blood pressure. The Trials of Hypertension Prevention,phase II. The Trials of Hypertension Prevention CollaborativeResearch Group. Arch Intern Med 1997;157:657–67.
55. Appel LJ, Espeland MA, Easter L, et al. Effects of reduced sodiumintake on hypertension control in older individuals: results from theTrial of Nonpharmacologic Interventions in the Elderly (TONE).Arch Intern Med 2001;161:685–93.
56. Espeland MA, Kumanyika S, Yunis C, et al. Electrolyte intake andnonpharmacologic blood pressure control. Ann Epidemiol 2002;12:587–95.
57. Svetkey LP, Simons-Morton DG, Proschan MA, et al. Effect of thedietary approaches to stop hypertension diet and reduced sodiumintake on blood pressure control. Hypertens (Greenwich) 2004;6:373–81.
58. Kumanyika SK, Cook NR, Cutler JA, et al. Sodium reduction forhypertension prevention in overweight adults: further results from
the Trials of Hypertension Prevention Phase II. J Hum Hypertens2005;19:33–45.
59. Cook NR, Kumanyika SK, Cutler JA, et al. Dose-response of so-dium excretion and blood pressure change among overweight,nonhypertensive adults in a 3-year dietary intervention study. J HumHypertens 2005;19:47–54.
60. Hu J, Jiang X, Li N, et al. Effects of salt substitute on pulse waveanalysis among individuals at high cardiovascular risk in rural China:a randomized controlled trial. Hypertens Res 2009;32:282–8.
61. China Salt Substitute Study Collaborative Group. Salt substitution:a low-cost strategy for blood pressure control among rural Chinese.A randomized, controlled trial. J Hypertens 2007;25:2011–8.
62. Charlton KE, Steyn K, Levitt NS, et al. A food-based dietarystrategy lowers blood pressure in a low socio-economic setting: arandomised study in South Africa. Public Health Nutr 2008;11:1397–406.
63. Obarzanek E, Proschan MA, Vollmer WM, et al. Individual bloodpressure responses to changes in salt intake: results from the DASH-Sodium trial. Hypertension 2003;42:459–67.
64. Ard JD, Coffman CJ, Lin P-H, et al. One-year follow-up study ofblood pressure and dietary patterns in dietary approaches to stophypertension (DASH)-sodium participants. Am J Hypertens 2004;17:1156–62.
65. Cappuccio FP, Kerry SM, Micah FB, et al. A community pro-gramme to reduce salt intake and blood pressure in Ghana[ISRCTN88789643]. BMC Public Health 2006;6:13.
66. Cook NR, Cutler JA, Obarzanek E, et al. Long term effects ofdietary sodium reduction on cardiovascular disease outcomes:observational follow-up of the trials of hypertension prevention(TOHP). BMJ 2007;334:885–8.
67. Chang H-Y, Hu Y-W, Yue C-SJ, et al. Effect of potassium-enriched salt on cardiovascular mortality and medical expenses ofelderly men. Am J Clin Nutr 2006;83:1289–96.
68. Cook NR, Obarzanek E, Cutler JA, et al. Joint effects of sodium andpotassium intake on subsequent cardiovascular disease: the Trials ofHypertension Prevention follow-up study. Arch Intern Med 2009;169:32–40.
69. Nagata C, Takatsuka N, Shimizu N, et al. Sodium intake and risk ofdeath from stroke in Japanese men and women. Stroke 2004;35:1543–7.
70. Tuomilehto J, Jousilahti P, Rastenyte D, et al. Urinary sodiumexcretion and cardiovascular mortality in Finland: a prospectivestudy. Lancet 2001;357:848–51.
71. Umesawa M, Iso H, Date C, et al. Relations between dietary sodiumand potassium intakes and mortality from cardiovascular disease: theJapan Collaborative Cohort Study for Evaluation of Cancer Risks.Am J Clin Nutr 2008;88:195–202.
72. Alderman MH, Cohen H, Madhavan S. Dietary sodium intake andmortality: the National Health and Nutrition Examination Survey(NHANES I). Lancet 1998;351:781–5.
73. Cohen HW, Hailpern SM, Fang J, et al. Sodium intake and mortalityin the NHANES II follow-up study. Am J Med 2006;119:e7–14.
74. Cohen HW, Hailpern SM, Alderman MH. Sodium intake andmortality follow-up in the Third National Health and NutritionExamination Survey (NHANES III). J Gen Intern Med 2008;23:1297–302.
75. He J, Ogden LG, Vupputuri S, et al. Dietary sodium intake andsubsequent risk of cardiovascular disease in overweight adults.JAMA 1999;282:2027–34.
76. He J, Ogden LG, Bazzano LA, et al. Dietary sodium intake and inci-dence of congestive heart failure in overweightUSmen andwomen:firstNational Health and Nutrition Examination Survey EpidemiologicFollow-up Study. Arch Intern Med 2002;162:1619–24.
77. Yang Q, Liu T, Kuklina EV, et al. Sodium and potassium intakeand mortality among US adults: prospective data from the ThirdNational Health and Nutrition Examination Survey. Arch InternMed 2011;171:1183–91.
78. O’Donnell MJ, Yusuf S, Mente A, et al. Urinary sodium and po-tassium excretion and risk of cardiovascular events. JAMA 2011;306:2229–38.
79. Marniemi J, Alanen E, Impivaara O, et al. Dietary and serumvitamins and minerals as predictors of myocardial infarction andstroke in elderly subjects. Nutr Metab Cardiovasc Dis 2005;15:188–97.

Eckel et al. JACC Vol. 63, No. 25, 20142013 AHA/ACC Lifestyle Management Guideline July 1, 2014:2960–84
2980
80. Takachi R, Inoue M, Shimazu T, et al. Consumption of sodium andsalted foods in relation to cancer and cardiovascular disease: theJapan Public Health Center-based Prospective Study. Am J ClinNutr 2010;91:456–64.
81. Liang W, Lee AH, Binns CW. Dietary intake of minerals and therisk of ischemic stroke in Guangdong Province, China, 2007-2008.Prev Chronic Dis 2011;8:A38.
82. Gardener H, Rundek T, Wright CB, et al. Dietary sodium andrisk of stroke in the Northern Manhattan study. Stroke 2012;43:1200–5.
83. Ekinci EI, Clarke S, Thomas MC, et al. Dietary salt intake andmortality in patients with type 2 diabetes. Diabetes Care 2011;34:703–9.
84. Stolarz-Skrzypek K, Kuznetsova T, Thijs L, et al. Fatal and nonfataloutcomes, incidence of hypertension, and blood pressure changes inrelation to urinary sodium excretion. JAMA 2011;305:1777–85.
85. Strazzullo P, D’Elia L, Kandala N-B, et al. Salt intake, stroke, andcardiovascular disease: meta-analysis of prospective studies. BMJ2009;339:b4567.
86. Walker J, MacKenzie AD, Dunning J. Does reducing your saltintake make you live longer? Interact Cardiovasc Thorac Surg 2007;6:793–8.
87. Fang J, Madhavan S, Alderman MH. Dietary potassium intake andstroke mortality. Stroke 2000;31:1532–7.
88. Bazzano LA, He J, Ogden LG, et al. Dietary potassium intake andrisk of stroke in US men and women: National Health and NutritionExamination Survey I epidemiologic follow-up study. Stroke 2001;32:1473–80.
89. Al-Delaimy WK, Rimm EB, Willett WC, et al. Magnesium intakeand risk of coronary heart disease among men. J Am Coll Nutr2004;23:63–70.
90. Ascherio A, Rimm EB, Hernán MA, et al. Intake of potassium,magnesium, calcium, and fiber and risk of stroke among US men.Circulation 1998;98:1198–204.
91. Green DM, Ropper AH, Kronmal RA, et al. Serum potassium leveland dietary potassium intake as risk factors for stroke. Neurology2002;59:314–20.
92. Weng L-C, YehW-T, Bai C-H, et al. Is ischemic stroke risk relatedto folate status or other nutrients correlated with folate intake?Stroke 2008;39:3152–8.
93. Geleijnse JM, Witteman JCM, Stijnen T, et al. Sodium and po-tassium intake and risk of cardiovascular events and all-cause mor-tality: the Rotterdam Study. Eur J Epidemiol 2007;22:763–70.
94. Iso H, Stampfer MJ, Manson JE, et al. Prospective study of calcium,potassium, and magnesium intake and risk of stroke in women.Stroke 1999;30:1772–9.
95. National Heart, Lung, and Blood Institute. Your guide to loweringyour blood pressure with DASH. Bethesda, MD: National Heart,Lung, and Blood Institute. Available at: http://catalog.nhlbi.nih.gov/catalog/product/Your-Guide-to-Lowering-Your-Blood-Pressure-with-DASH/06-4082?sortBy¼4; 2013. Accessed January 28, 2014.
96. Centers for Disease Control and Prevention (CDC). Most Ameri-cans should consume less sodium. Atlanta, GA: Centers for DiseaseControl and Prevention. Available at: http://www.cdc.gov/salt/;2013. Accessed January 28, 2014.
97. U.S. Food and Drug Administration. Sodium reduction. SilverSpring, MD; 2013. Available at: http://www.fda.gov/Food/IngredientsPackagingLabeling/FoodAdditivesIngredients/ucm253316.htm. Accessed January 28, 2014.
98. American Heart Association (AHA). Sodium (salt or sodiumchloride). AHA. Dallas, TX: AHA. Available at: http://www.heart.org/HEARTORG/GettingHealthy/NutritionCenter/HealthyDietGoals/Sodium-Salt-or-Sodium-Chloride_UCM_303290_Article.jsp#;2013. Accessed January 28, 2014.
99. Physical Activity Guidelines Advisory Committee. Physical ActivityGuidelines Advisory Committee Report, 2008. Washington, DC:U.S. Department of Health and Human Services; 2008:1–683.
100. Warburton DE, Charlesworth S, Ivey A, et al. A systematic reviewof the evidence for Canada’s Physical Activity Guidelines for Adults.Int J Behav Nutr Phys Act 2010;7:39.
101. World Health Organization. Global recommendations on physicalactivity for health. Geneva, Switzerland: World Health Organiza-tion; 2010:1–60.
102. Shiroma EJ, Lee IM. Physical activity and cardiovascular health:lessons learned from epidemiological studies across age, gender, andrace/ethnicity. Circulation 2010;122:743–52.
103. Sattelmair J, Pertman J, Ding EL, et al. Dose response betweenphysical activity and risk of coronary heart disease: a meta-analysis.Circulation 2011;124:789–95.
104. Lee I-M, Shiroma EJ, Lobelo F, et al. Effect of physical inac-tivity on major non-communicable diseases worldwide: an anal-ysis of burden of disease and life expectancy. Lancet 2012;380:219–29.
105. Guo X, Zhou B, Nishimura T, et al. Clinical effect of qigongpractice on essential hypertension: a meta-analysis of randomizedcontrolled trials. J Altern Complement Med 2008;14:27–37.
106. Mora S, Cook N, Buring JE, et al. Physical activity and reduced riskof cardiovascular events: potential mediating mechanisms. Circula-tion 2007;116:2110–8.
107. Kelley GA, Kelley KS, Tran ZV. Walking and resting blood pres-sure in adults: a meta-analysis. Prev Med 2001;33:120–7.
108. Hamer M, Chida Y. Active commuting and cardiovascular risk: ameta-analytic review. Prev Med 2008;46:9–13.
109. Whelton SP, Chin A, Xin X, et al. Effect of aerobic exercise onblood pressure: a meta-analysis of randomized, controlled trials. AnnIntern Med 2002;136:493–503.
110. Lee MS, Pittler MH, Guo R, et al. Qigong for hypertension: asystematic review of randomized clinical trials. J Hypertens 2007;25:1525–32.
111. Kelley GA, Sharpe Kelley K. Aerobic exercise and resting bloodpressure in older adults: a meta-analytic review of randomizedcontrolled trials. J Gerontol A Biol Sci Med Sci 2001;56:M298–303.
112. Jolly K, Taylor RS, Lip GYH, et al. Home-based cardiac reha-bilitation compared with centre-based rehabilitation and usualcare: a systematic review and meta-analysis. Int J Cardiol 2006;111:343–51.
113. Thomas DE, Elliott EJ, Naughton GA. Exercise for type 2 diabetesmellitus. Cochrane Database Syst Rev 2006:CD002968.
114. Asikainen T-M, Kukkonen-Harjula K, Miilunpalo S. Exercise forhealth for early postmenopausal women: a systematic review ofrandomised controlled trials. Sports Med 2004;34:753–78.
115. Taylor RS, Brown A, Ebrahim S, et al. Exercise-based rehabilitationfor patients with coronary heart disease: systematic review and meta-analysis of randomized controlled trials. Am J Med 2004;116:682–92.
116. Kelley GA, Kelley KS, Tran ZV. Aerobic exercise and lipids andlipoproteins in women: a meta-analysis of randomized controlledtrials. J Womens Health (Larchmt) 2004;13:1148–64.
117. Kelley GA, Kelley KS. Vu Tran Z. Aerobic exercise, lipids andlipoproteins in overweight and obese adults: a meta-analysisof randomized controlled trials. Int J Obes (Lond) 2005;29:881–93.
118. Kelley GA, Kelley KS, Tran ZV. Walking and Non-HDL-C inadults: a meta-analysis of randomized controlled trials. Prev Cardiol2005;8:102–7.
119. Kelley GA, Kelley KS, Tran ZV. Exercise, lipids, and lipoproteinsin older adults: a meta-analysis. Prev Cardiol 2005;8:206–14.
120. Kelley GA, Kelley KS, Tran ZV. Walking, lipids, and lipoproteins:a meta-analysis of randomized controlled trials. Prev Med 2004;38:651–61.
121. Kelley GA, Kelley KS. Aerobic exercise and HDL2-C: a meta-analysis of randomized controlled trials. Atherosclerosis 2006;184:207–15.
122. Kelley GA, Kelley KS. Effects of aerobic exercise on lipids and li-poproteins in adults with type 2 diabetes: a meta-analysis ofrandomized-controlled trials. Public Health 2007;121:643–55.
123. Kelley GA, Kelley KS. Impact of progressive resistance training onlipids and lipoproteins in adults: a meta-analysis of randomizedcontrolled trials. Prev Med 2009;48:9–19.
124. Kelley GA, Kelley KS. Impact of progressive resistance training onlipids and lipoproteins in adults: another look at a meta-analysisusing prediction intervals. Prev Med 2009;49:473–5.
125. Bravata DM, Smith-Spangler C, Sundaram V, et al. Using pe-dometers to increase physical activity and improve health: a sys-tematic review. JAMA 2007;298:2296–304.
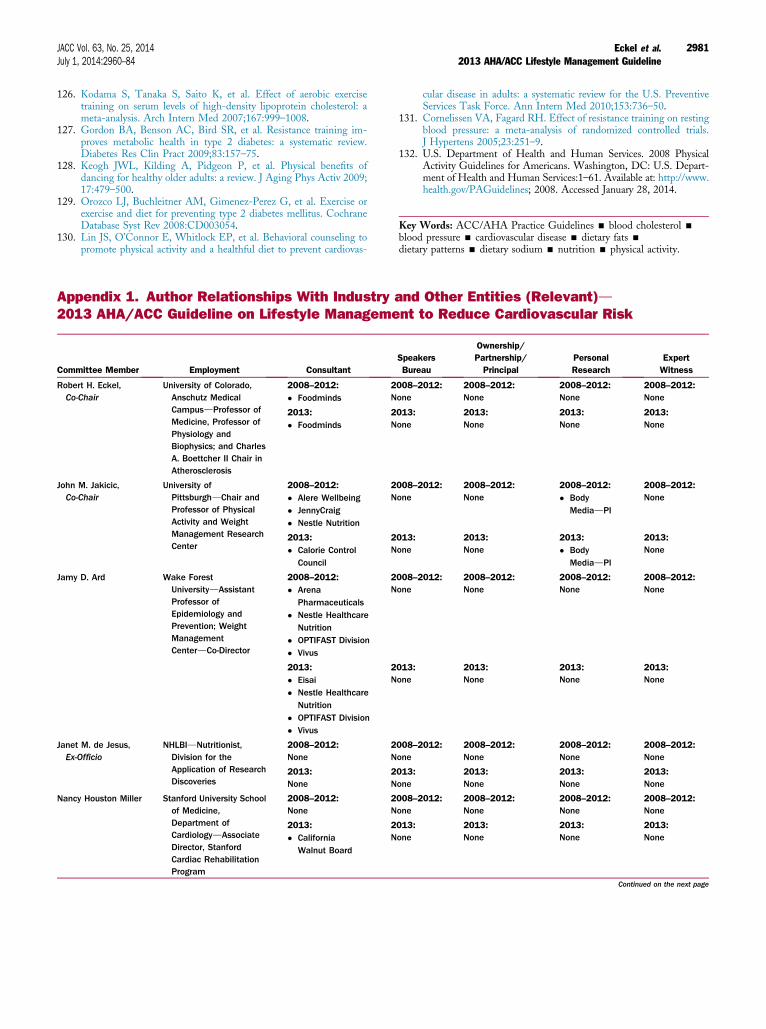
JACC Vol. 63, No. 25, 2014 Eckel et al.July 1, 2014:2960–84 2013 AHA/ACC Lifestyle Management Guideline
2981
126. Kodama S, Tanaka S, Saito K, et al. Effect of aerobic exercisetraining on serum levels of high-density lipoprotein cholesterol: ameta-analysis. Arch Intern Med 2007;167:999–1008.
127. Gordon BA, Benson AC, Bird SR, et al. Resistance training im-proves metabolic health in type 2 diabetes: a systematic review.Diabetes Res Clin Pract 2009;83:157–75.
128. Keogh JWL, Kilding A, Pidgeon P, et al. Physical benefits ofdancing for healthy older adults: a review. J Aging Phys Activ 2009;17:479–500.
129. Orozco LJ, Buchleitner AM, Gimenez-Perez G, et al. Exercise orexercise and diet for preventing type 2 diabetes mellitus. CochraneDatabase Syst Rev 2008:CD003054.
130. Lin JS, O’Connor E, Whitlock EP, et al. Behavioral counseling topromote physical activity and a healthful diet to prevent cardiovas-
Committee Member Employment Consultant
Robert H. Eckel,Co-Chair
University of Colorado,Anschutz MedicalCampusdProfessor ofMedicine, Professor ofPhysiology andBiophysics; and CharlesA. Boettcher II Chair inAtherosclerosis
2008–2012:
� Foodminds2N
2013:
� Foodminds2N
John M. Jakicic,Co-Chair
University ofPittsburghdChair andProfessor of PhysicalActivity and WeightManagement ResearchCenter
2008–2012:
� Alere Wellbeing� JennyCraig� Nestle Nutrition
2N
2013:
� Calorie ControlCouncil
2N
Jamy D. Ard Wake ForestUniversitydAssistantProfessor ofEpidemiology andPrevention; WeightManagementCenterdCo-Director
2008–2012:
� ArenaPharmaceuticals
� Nestle HealthcareNutrition
� OPTIFAST Division� Vivus
2N
2013:
� Eisai� Nestle Healthcare
Nutrition� OPTIFAST Division� Vivus
2N
Janet M. de Jesus,Ex-Officio
NHLBIdNutritionist,Division for theApplication of ResearchDiscoveries
2008–2012:None
2N
2013:None
2N
Nancy Houston Miller Stanford University Schoolof Medicine,Department ofCardiologydAssociateDirector, StanfordCardiac RehabilitationProgram
2008–2012:None
2N
2013:
� CaliforniaWalnut Board
2N
cular disease in adults: a systematic review for the U.S. PreventiveServices Task Force. Ann Intern Med 2010;153:736–50.
131. Cornelissen VA, Fagard RH. Effect of resistance training on restingblood pressure: a meta-analysis of randomized controlled trials.J Hypertens 2005;23:251–9.
132. U.S. Department of Health and Human Services. 2008 PhysicalActivity Guidelines for Americans. Washington, DC: U.S. Depart-ment of Health and Human Services:1–61. Available at: http://www.health.gov/PAGuidelines; 2008. Accessed January 28, 2014.
Key Words: ACC/AHA Practice Guidelines - blood cholesterol -
blood pressure - cardiovascular disease - dietary fats -
dietary patterns - dietary sodium - nutrition - physical activity.
Appendix 1. Author Relationships With Industry and Other Entities (Relevant)d2013 AHA/ACC Guideline on Lifestyle Management to Reduce Cardiovascular Risk
SpeakersBureau
Ownership/Partnership/Principal
PersonalResearch
ExpertWitness
008–2012:one
2008–2012:None
2008–2012:None
2008–2012:None
013:one
2013:None
2013:None
2013:None
008–2012:one
2008–2012:None
2008–2012:
� BodyMediadPI
2008–2012:None
013:one
2013:None
2013:
� BodyMediadPI
2013:None
008–2012:one
2008–2012:None
2008–2012:None
2008–2012:None
013:one
2013:None
2013:None
2013:None
008–2012:one
2008–2012:None
2008–2012:None
2008–2012:None
013:one
2013:None
2013:None
2013:None
008–2012:one
2008–2012:None
2008–2012:None
2008–2012:None
013:one
2013:None
2013:None
2013:None
Continued on the next page

Appendix 1. Continued
Committee Member Employment ConsultantSpeakersBureau
Ownership/Partnership/Principal
PersonalResearch
ExpertWitness
Van S. Hubbard,Ex-Officio
National Institute ofDiabetes and Digestiveand KidneyDiseasesdDirector, NIHDivision of NutritionResearch Coordination
2008–2012:None
2008–2012:None
2008–2012:None
2008–2012:None
2008–2012:None
2013:None
2013:None
2013:None
2013:None
2013:None
I-Min Lee HarvardUniversitydProfessor ofMedicine, HarvardMedical School
2008–2012:
� Virgin HealthMiles2008–2012:None
2008–2012:None
2008–2012:None
2008–2012:None
2013:None
2013:None
2013:None
2013:None
2013:None
Alice H. Lichtenstein Tufts University, USDAHuman NutritionResearch Center onAgingdSenior Scientistand Director,Cardiovascular NutritionLaboratory FriedmanSchool; Stanley N.Gershoff Professor ofNutrition Science andPolicy
2008–2012:None
2008–2012:None
2008–2012:None
2008–2012:None
2008–2012:None
2013:None
2013:None
2013:None
2013:None
2013:None
Catherine M. Loria,Ex-Officio
NHLBIdNutritionalEpidemiologist
2008–2012:None
2008–2012:None
2008–2012:None
2008–2012:None
2008–2012:None
2013:None
2013:None
2013:None
2013:None
2013:None
Barbara E. Millen Boston NutritionFoundationdChairman;MillenniumPreventiondPresident
2008–2012:None
2008–2012:None
2008–2012:� Boston Nutrition
Foundation*� Millennium
Prevention*
2008–2012:None
2008–2012:None
2013:None
2013:None
2013:
� Boston NutritionFoundation*
� MillenniumPrevention*
2013:None
2013:None
Cathy A. Nonas New York City Departmentof Health and MentalHygienedSeniorAdvisor, Bureau forChronic DiseasePrevention and TobaccoControl
2008–2012:None
2008–2012:None
2008–2012:None
2008–2012:None
2008–2012:None
2013:None
2013:None
2013:None
2013:None
2013:None
Frank M. Sacks Harvard School of PublicHealth, Department ofNutritiondProfessor ofCardiovascular DiseasePrevention; Brighamand Women’sHospitaldSeniorPhysician and Professorof Medicine
2008–2012:None
2008–2012:None
2008–2012:None
2008–2012:None
2008–2012:
� Federal TradeCommission;Unilever,Keebler
2013:None
2013:None
2013:None
2013:None
2013:None
Sidney C. Smith, Jr University of NorthCarolinadProfessor ofMedicine; Director,Center forCardiovascular Scienceand Medicine
2008–2012:None
2008–2012:None
2008–2012:None
2008–2012:None
2008–2012:None
2013:None
2013:None
2013:None
2013:None
2013:None
Continued on the next page
Eckel et al. JACC Vol. 63, No. 25, 20142013 AHA/ACC Lifestyle Management Guideline July 1, 2014:2960–84
2982
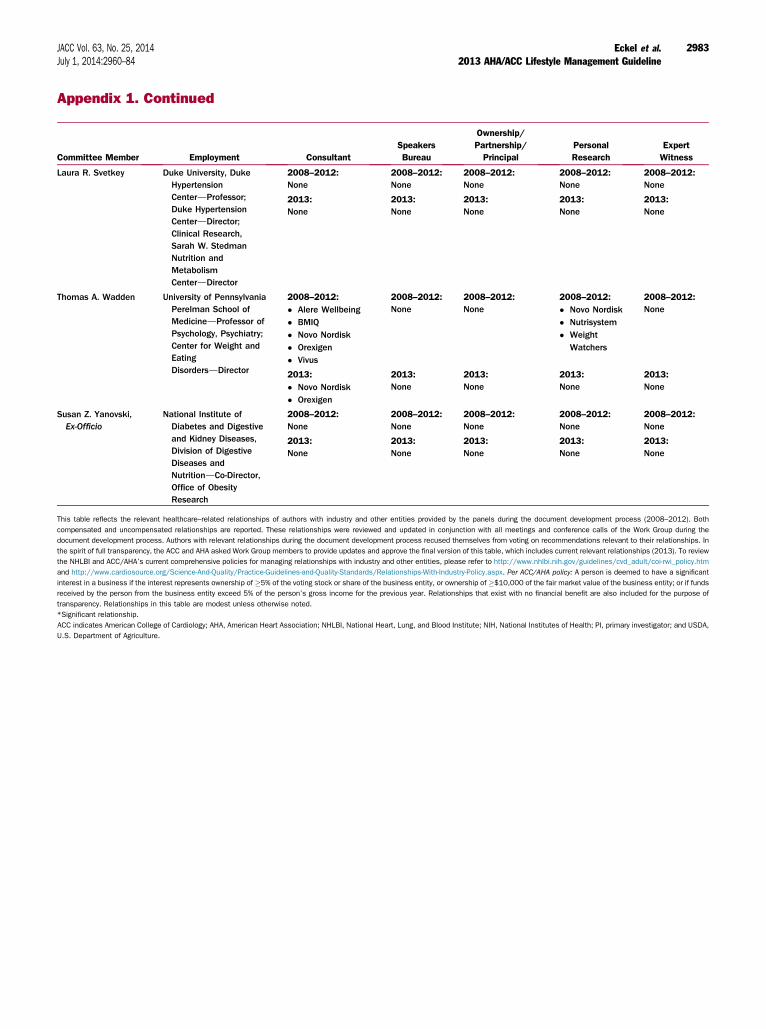
Appendix 1. Continued
Committee Member Employment ConsultantSpeakersBureau
Ownership/Partnership/Principal
PersonalResearch
ExpertWitness
Laura R. Svetkey Duke University, DukeHypertensionCenterdProfessor;Duke HypertensionCenterdDirector;Clinical Research,Sarah W. StedmanNutrition andMetabolismCenterdDirector
2008–2012:None
2008–2012:None
2008–2012:None
2008–2012:None
2008–2012:None
2013:None
2013:None
2013:None
2013:None
2013:None
Thomas A. Wadden University of PennsylvaniaPerelman School ofMedicinedProfessor ofPsychology, Psychiatry;Center for Weight andEatingDisordersdDirector
2008–2012:
� Alere Wellbeing� BMIQ� Novo Nordisk� Orexigen� Vivus
2008–2012:None
2008–2012:None
2008–2012:
� Novo Nordisk� Nutrisystem� Weight
Watchers
2008–2012:None
2013:
� Novo Nordisk� Orexigen
2013:None
2013:None
2013:None
2013:None
Susan Z. Yanovski,Ex-Officio
National Institute ofDiabetes and Digestiveand Kidney Diseases,Division of DigestiveDiseases andNutritiondCo-Director,Office of ObesityResearch
2008–2012:None
2008–2012:None
2008–2012:None
2008–2012:None
2008–2012:None
2013:None
2013:None
2013:None
2013:None
2013:None
This table reflects the relevant healthcare–related relationships of authors with industry and other entities provided by the panels during the document development process (2008–2012). Both
compensated and uncompensated relationships are reported. These relationships were reviewed and updated in conjunction with all meetings and conference calls of the Work Group during the
document development process. Authors with relevant relationships during the document development process recused themselves from voting on recommendations relevant to their relationships. In
the spirit of full transparency, the ACC and AHA asked Work Group members to provide updates and approve the final version of this table, which includes current relevant relationships (2013). To review
the NHLBI and ACC/AHA’s current comprehensive policies for managing relationships with industry and other entities, please refer to http://www.nhlbi.nih.gov/guidelines/cvd_adult/coi-rwi_policy.htm
and http://www.cardiosource.org/Science-And-Quality/Practice-Guidelines-and-Quality-Standards/Relationships-With-Industry-Policy.aspx. Per ACC/AHA policy: A person is deemed to have a significant
interest in a business if the interest represents ownership of �5% of the voting stock or share of the business entity, or ownership of �$10,000 of the fair market value of the business entity; or if funds
received by the person from the business entity exceed 5% of the person’s gross income for the previous year. Relationships that exist with no financial benefit are also included for the purpose of
transparency. Relationships in this table are modest unless otherwise noted.
*Significant relationship.
ACC indicates American College of Cardiology; AHA, American Heart Association; NHLBI, National Heart, Lung, and Blood Institute; NIH, National Institutes of Health; PI, primary investigator; and USDA,
U.S. Department of Agriculture.
JACC Vol. 63, No. 25, 2014 Eckel et al.July 1, 2014:2960–84 2013 AHA/ACC Lifestyle Management Guideline
2983

Eckel et al. JACC Vol. 63, No. 25, 20142013 AHA/ACC Lifestyle Management Guideline July 1, 2014:2960–84
2984
Appendix 2. Expert Reviewer Relationships With Industry and Other Entitiesd2013 AHA/ACC Guideline on Lifestyle Management to Reduce Cardiovascular Risk
Reviewer Employment Representation ConsultantSpeakersBureau
Ownership/Partnership/Principal
PersonalResearch
Institutional,Organizational,
or OtherFinancialBenefit
ExpertWitness
Nancy Albert Cleveland ClinicFoundationdSr. Directorof Nursing Research andCNS, Kaufman Centerfor Heart Failure
ACC/AHA TaskForce onPracticeGuidelines
� BG Medicine� Gambro� Medtronic
None None None None None
Gerald Fletcher Mayo Medical SchoolMayo ClinicJacksonvilledProfessorof Medicine
ACC/AHA None None None None None None
Frederick Kushner Heart Clinic ofLouisianadMedicalDirector;Tulane UniversityMedical CenterdClinicalProfessor
ACC/AHA Federal DrugAdministrationScience Boardy
None None None None None
Linda Van Horn Northwestern UniversityFeinberg School ofMedicinedProfessor,Preventive Medicine;Associate Dean,Faculty Development
ACC/AHA None None None None None None
This table represents the relationships of reviewers with industry and other entities that were self-disclosed at the time of peer review. It does not necessarily reflect relationships with industry at the time
of publication. To review the NHLBI and ACC/AHA’s current comprehensive policies for managing relationships with industry and other entities, please refer to http://www.nhlbi.nih.gov/guidelines/cvd_
adult/coi-rwi_policy.htm and http://www.cardiosource.org/Science-And-Quality/Practice-Guidelines-and-Quality-Standards/Relationships-With-Industry-Policy.aspx.
yNo financial benefit.
ACC indicates American College of Cardiology; and AHA, American Heart Association.
Appendix 3. Abbreviations
BP ¼ blood pressureCOR ¼ Class of RecommendationCQ ¼ critical questionCVD ¼ cardiovascular diseaseDASH ¼ Dietary Approaches to Stop HypertensionES ¼ evidence statementHDL-C ¼ high-density lipoprotein cholesterolLDL-C ¼ low-density lipoprotein cholesterolLOE ¼ Level of EvidenceMED ¼ Mediterranean-style dietNHLBI ¼ National Heart, Lung, and Blood InstitutePICOTS ¼ Population, Intervention, Comparator, Outcomes, Timing, and SettingRCT ¼ randomized controlled trialRWI ¼ relationships with industry and other entitiesUSDA ¼ U.S. Department of Agriculture