2013 airline disclosures handbook - kpmg us llp | … that will materially impact airlines profits...
TRANSCRIPT

GLOBAL AVIATION GROUP
2013 Airline Disclosures Handbook
Financial reporting and management trends in the global aviation industry
kpmg.com

KPMG’s Global Aviation practice
KPMG is a global network of professional firms providing Audit, Tax and Advisory services. We operate in 156 countries and have 152,000 people working in member firms around the world. The independent member firms of the KPMG network are affiliated with KPMG International Cooperative (“KPMG International”), a Swiss entity.
Through its member firms, KPMG has invested extensively in developing an experienced aviation team. KPMG’s understanding of the aviation industry is both current and forward looking, thanks to KPMG’s global experience, knowledge sharing, industry training and use of professionals with direct experience in the aviation industry.
KPMG member firms serve many of the market leaders within the airline sector. We are leading providers of external audit services with 33% market share of the top 50 airlines by revenue. We also provide other services to over half of these top 50 airlines. KPMG member firms’ strength lies in our professionals and their knowledge and experience gathered from working with a large and diverse client base. KPMG’s airline industry experience helps the teams understand both your business priorities and the strategic issues facing your company.
KPMG’s Global Aviation practice’s presence in many international markets, combined with industry knowledge, positions KPMG member firms to assist you in recognizing and making the most of opportunities, as well as implementing changes necessitated by industry developments.
For more information on KPMG’s Global Aviation practice, please contact:
Malcolm RamsayHead of Aviation+61 2 9335 [email protected]
Dr. Ashley SteelGlobal Chair, Transport+44 20 7311 [email protected]
Alternatively, refer to Appendix 2 for your local member firm contact, or visit KPMG’s website at kpmg.com.
Authors
Malcolm RamsayJames StampJessica RegueiroDavid RichardsScott McGilvery

Introduction
Our 4th disclosure handbook takes a detailed look into upcoming changes in accounting guidance that will materially impact airlines profits and balance sheets; looks to where airlines are in terms of industry co-operation and consolidation; and seeks to provide a forward looking view on the never ending task of cost reduction.
Looking to the key developments in International Financial Reporting Standards (IFRS) and US GAAP (where the projects are joint with IFRS), this edition examines:
• The upcoming positive news on hedging for airlines (under IFRS) – including the use of options as economic and accounting hedges, hedging of aviation fuel purchases and reduced compliance costs in terms of hedge accounting testing requirements. However, as always with accounting rules on derivatives, there appears to be a sting in the tail in terms of accounting issues associated with the swapping of foreign currency debt. Our understanding as a result of the January 2013 IASB Board meeting is that this should be resolved by the issuing of the new hedging standard;
• Where is the joint IASB and US Financial Accounting Standards Board (FASB) project on lease accounting up to? Our analysis has highlighted six key issues that
airlines may consider critical for the IASB and FASB to address prior to finalising this standard; and
• Maintenance accounting for leased aircraft – sometimes described as a dark art, we discuss the accounting considerations and include example disclosures.
The handbook then moves into the complexity involved in airline co-operation, co-investment and mergers. The regulatory environment for airlines is relatively unique in terms of foreign ownership rules, the system of route access and other restrictions that inhibit consolidation activity (outside of open sky environments). We look at what is currently happening in this space and offer some insights from other industries which have similarities in their regulatory environments.
Finally, we continue our benchmarking of full service/legacy airline cost bases to their low cost counterparts. This analysis looks at how the “low hanging fruit” has been plucked and where airlines are now in the cost reduction journey.
In compiling this guide, KPMG’s Global Aviation practice professionals have reviewed the financial and other reports of the world’s top 25 airlines by revenue and a select six of the largest lower cost airlines. We have also reviewed other publicly available information within these airlines’ websites and analyst presentations. Details of the principle sources of information used are set out in Appendix 1.
KPMG’s Global Aviation practice has taken direct extracts from various airline financial statements and other published information. These have been extracted from the relevant publicly available regulatory reports noted above. No comment is made by KPMG’s Global Aviation practice in regard to the adequacy or otherwise of these policies, rather the examples used are to demonstrate current disclosure practice and to facilitate discussion on key airline issues as identified by airlines.
© 2013 KPMG International Cooperative (“KPMG International”), a Swiss entity. Member firms of the KPMG network of independent firms are affiliated with KPMG International. KPMG International provides no client services. All rights reserved.

Highlights
Accounting standard changes • Derivatives accounting is
starting to look more like economic reality.
• KPMG investigates six of the accounting impacts of proposed changes to lease accounting, three of which would have significant balance sheet impacts for airlines.
• Under the proposals, airlines will recognize operating lease commitments on balance sheet. This will increase reported debt, lead to balance sheet volatility due to the remeasurement proposals, and accelerate expense recognition in many cases.
• Maintenance accounting for leased aircraft is driven by a combination of the lease contract, return conditions and systems of aircraft maintenance (internal and outsourced). We look to three common accounting scenarios under IFRS.
Airlines are starting to move to more innovative ways of partnering
• Until there is further market deregulation in regions such as Asia, traditional airline partnering through code shares, alliances and direct investments is alive and well and still dominates the co-operation/merger and acquisition landscape. The recent Qantas/Emirates announcement (subject to regulatory approval) demonstrates airlines are starting to consider more innovative tie ups.
• The heavily used joint venture structures in the Energy and Natural Resources sector appear to be available to airlines. We consider whether this is the new frontier for airline consolidation.
Cost structure of low cost and legacy carriers are converging
• During the six years of the KPMG airline unit cost survey, we have seen the cost gap between legacy and low cost carriers narrow from 3.6 to 2.5 US cents per Available Seat Kilometer.
• This narrowing has plateaued since 2009 during the period subsequent to the emergence from bankruptcy protection of a number of carriers during 2009 and the recent global economic downturn continues focus on costs at all airlines.
• KPMG outlines why we believe the remaining portion of this cost gap is structural in nature, and is unlikely to significantly contract into the future.


Contents
1 Hot topic accounting policies 1
2 The long haul to consolidation 11
3 Benchmarking airline costs 16
Appendix 1: Surveyed airline financial reports 25
Appendix 2: KPMG’s Global Aviation practice contacts 27

1 | 2013 Airline Disclosures Handbook
1. Hot topic accounting policies
Since the publication of KPMG’s 2010 handbook the IASB has nearly finalized the new guidance on hedge accounting and is planning to release a new round of proposals for lease accounting soon. Both projects may significantly affect airline balance sheets and results, and the way that risk management is reflected in their accounts.
Hedge accounting
Introduction
Hedge accounting impacts a vast cross section of industries including the airline industry. In addition to foreign currency, interest rate and credit risks the airline industry has to manage significant fuel price exposures. Many airlines have risk management policies that include the use of derivative financial instruments to hedge these risks.
The rules-based approach under IAS 39 Financial Instruments: Recognition and Measurement has created significant difficulties for airlines. The economics of some fuel and foreign currency risk management strategies may not be reflected in the accounts under the current IFRS guidance. Many industries, including the airline industry, raised significant concerns about that. The International Air Transport Association Accounting Working Group (IAWG), in conjunction with KPMG, met with the IASB staff and Board representatives in 2010 and 2011 regarding the airline industries perspective on these issues. In response to these concerns, the IASB proposed amending IAS 39 to align hedge accounting more closely with risk management policies. These proposals were welcomed and supported by the airline industry in general and the industry body the International Air Transport Association (IATA) in particular.
In September 2012, the IASB released a draft of IFRS 9 Chapter 6 Hedge Accounting which has moved to a more principles-based approach and addressed concerns of the airline industry. KPMG notes however that the draft chapter does appear to have a ‘sting in the tail’ as some new prescriptive guidance may result in new forms of hedge ineffectiveness. This has the potential to significantly impact airlines with non-US dollar functional currencies that borrow in US dollars and swap the exposure back to their functional currencies using derivative financial instruments. The current draft of the standard does not allow the derivative valuation to fully offset the ‘hypothetical derivative’ used to value the underlying exposure. The result of the current drafting is ineffectiveness, even when the cash flows of the derivative and the hedged item perfectly match. This issue was discussed at the January 2013 IASB Board meeting and as a result of decisions made at that meeting, we are hopeful this issue will be rectified prior to the standard being released.
The following summarises the three key changes to IAS 39, which address concerns of the airline industry, the IFRS 9 approach and the expected impact on airlines.
Time value of purchased options to be recognised in equity
Under IAS 39, changes in the time value of a purchased option are recognized as ineffectiveness, which creates income statement volatility.
IFRS 9 approach
Under the proposed guidance, the change in fair value of the time value of a purchased option hedging a transaction will be recognised in comprehensive income and brought to the income statement when the underlying transaction occurs.
Airline industry implications
The time value of fuel and foreign currency (usually USD in the airline industry) options will be recognised in other comprehensive income rather than through the income statement. The cumulative change in time value will be recognised against the cost of the fuel purchased. For many airlines this will more closely align IFRS profit with the economics of the hedging strategy and reduce the need for non-GAAP profit measures that airlines are disclosing (e.g. measure of profit used for internal management purposes, as disclosed under IFRS 8 Operating Segments).

2013 Airline Disclosures Handbook | 2
Operating Expenses
Jet fuel costs (34,703,369) (24,096,078)
Movements in fair value of fuel derivative contracts 85,447 1,954,071
Take-off, landing and depot charges (8,740,822) (7,707,019)
Depreciation (9,560,907) (8,569,370)
Aircraft maintenance, repair and overhaul costs (2,612,678) (2,577,185)
Employee compensation costs 6 (12,270,065) (9,851,935)
Air catering charges (2,662,984) (2,044,359)
Aircraft and engine operating lease expenses (3,931,549) (3,488,014)
Other operating lease expenses (668,916) (712,005)
Other flight operation expenses (9,342,935) (8,227,555)
Selling and marketing expenses (5,480,514) (4,602,745)
General and administrative expenses (2,261,549) (1,637,824)
(92,150,841) (71,560,018)
Finance costs 9 (220)
Finance income 9 85
Retranslation charges on currency borrowings (8)
Fuel derivative losses (12)
Net charge relating to available-for-sale financial assets 18 (19)
Share of post-tax profits in associates accounted for using the equity method
17 7
(Loss)/profit on sale of property, plant and equipment and investments
(2)
Net financing credit/(charge) relating to pensions 9 184
Profit before tax 537
Example disclosureSome airlines reporting under IFRS call out the impact on the income statement of volatility related to hedging losses. The changes in IFRS 9 should move most of this volatility to the same income statement line item as the economic exposure. The following are examples of current line items on the face of the income statement that try to ‘call out’ this volatility.
Air China 2011 Annual Report (IFRS)
International Airlines Group 2011 Annual Report (IFRS)

3 | 2013 Airline Disclosures Handbook
Allowing component part hedging of fuel
At present, IAS 39 prohibits the hedging of a component of risk for a non-financial item.
IFRS 9 approach
Under the proposed guidance, an entity will be able to designate changes in cash flows or fair values of a component of an item as the hedged item provided that, based on an assessment within the context of the particular market structure, the risk component is separately identifiable and the changes in cash flows or fair value in relation to that item are reliably measurable. The treatment for financial and non-financial items will be the same.
Airline industry implications
There is a lack of liquidity in the market for jet fuel derivatives with a maturity of greater than six months and therefore many airlines use crude derivatives with maturities of up to 2-3 years to meet their risk management objectives. Under IAS 39, ‘basis risk’ is included in the effectiveness testing, which creates income statement volatility. Under IFRS 9, airlines can designate the component of the jet
fuel price that relates to the crude input as a separately identifiable risk and this should reduce income statement volatility.
Airlines will however need to carefully consider the most appropriate crude oil derivative that best correlates to their interplane pricing benchmark to ensure that the detailed requirements of the proposed standard are met as there is still a risk of ineffectiveness if this is not undertaken.
Removal of the 80-125 percent effectiveness threshold
At present, IAS 39 is rules based and results in income statement volatility despite company risk management objectives being met.
IFRS 9 approach
Under the proposed guidance, the 80-125 percent threshold is removed. A hedge relationship will be considered effective provided that:
• there is an economic relationship between the hedged item and the hedging instrument;
• the effect of credit risk does not dominate the value changes that result from that economic relationship; and
• the hedge ratio of the hedging relationship is the same as that resulting from the quantity of the hedged item that the entity actually hedges and the quantity of the hedged instrument that the entity actually uses to hedge that quantity of hedged item.
Airline industry implications
Since retrospective effectiveness testing is no longer required to support existence of a valid hedging relationship, for fuel hedging in particular this should drive efficiency in back office functions of airline treasuries. We do note that changes to current hedge documentation will be required.
Disclosure changes
Disclosures will be required under IFRS 9 in addition to the requirements of IFRS 7. These disclosures will include:
• the entity’s risk management strategy and how it is applied to manage risk;
• how the entity’s hedging activities may affect the amount, timing and uncertainty of its future cash flows; and
• the effect that hedge accounting has had on the entity’s primary financial statements.
The adoption of the standard is also likely to lead to a reduction in the use of non-statutory financial information in airline financial statements as many airlines are already disclosing an ‘underlying’ or ‘normalised’ profit measure that eliminates some of the income statement volatility that exists under IAS 39 in relation to hedge accounting.
The amendments that will be introduced by IFRS 9 more closely align hedge accounting and management of risk and are likely to be welcomed by the airline industry.

2013 Airline Disclosures Handbook | 4
Leases on the balance sheet
Introduction
The IASB and FASB released a joint exposure draft on lease accounting in August 2010. Since that time the Boards have made significant changes to the proposals. A revised exposure draft is expected in early 2013.
Under the proposals operating lease agreements will be brought onto the balance sheets of lessees, who will recognize new liabilities with corresponding ‘right of-use’ assets that will be depreciated over the term of the lease.
Operating leases of aircraft are used extensively within the airline industry and capitalising these leases will significantly change the balance sheets of many airlines. The current proposals also significantly change the income statement profile of many leases, accelerating expense recognition compared to current operating lease treatment.
The IAWG, in conjunction with KPMG acting as accounting advisor, has identified six issues with a significant impact on airlines, which airlines will wish to see resolved prior to the issuance of a final standard. The following summarises these concerns.
Foreign currency revaluation of the right-of-use asset and lease liabilities
Proposal
The right-of-use asset will be recognised on the balance sheet as a non-financial asset, measured initially at the present value of the estimated future lease payments. As a non-monetary asset this balance will be outside of the scope of IAS 21 for subsequent measurement.
The lease liability will be recognised on the balance sheet as a financial liability – a monetary item – and therefore will be within the scope of IAS 21 for revaluation.
Airline industry implications
Many airlines with a functional currency other than USD are a party to USD denominated leases.
Under the proposals, adjusting the liability but not the asset for changes in exchange rates has the potential to create significant income statement volatility.
If the standard does not address this issue, then airlines in this position that also hold USD denominated debt may consider designating the foreign currency risk on the liability in a hedge. This accounting would require careful consideration and liaison with accounting advisors and auditors.
Introduction of a new lease classification test
Proposal
The current IAS 17 Leases requires capitalisation on the balance sheet as a finance lease only when ‘significantly all’ the risks and rewards of ownership of an asset are transferred to the lessee. The expense for leases that did not fall into this category is generally recognised straight-line over the term of the lease.
The proposals include a new lease classification test and retain the possibility for a straight-line expense recognition for some leases, for example certain real estate leases.
Airline industry implications
Many existing aircraft operating leases are expected to require recognition in the income statement on an accelerated basis under the proposals. This will lead to a greater income statement charge for interest in the first half of the lease than in the second half. This will impact airlines differently depending on the current portfolio of operating leased aircraft.
Component accounting for the right-of-use asset
Proposal
The proposals are unclear in relation to the ability to recognise significant components of the right-of-use asset, consistent with the required treatment under IAS 16 Property, Plant and Equipment.
Airline industry implications
Under IAS 16 airlines are required to identify significant components of aircraft and separately assess the useful economic life and residual value. This ensures that the charge to the income statement is consistent with the use of the asset.
Airlines would welcome the ability to account for the right-of-use asset in the same way. For example, this would allow for the separate measurement of significant maintenance components and ensure consistent treatment across the fleet of owned and leased aircraft.
Identification and separate treatment of service component
Proposal
If a contract includes a service component, then the lessee would account separately for the components unless there are no observable prices that can be used to allocate the payments between service and lease components. Lessors would always account for the components separately, using the revenue guidance to allocate payments.
Airline industry implications
Within the airline industry it is common for contracts to involve items such as complicated maintenance arrangements or the provision of operating crew that are likely to require significant judgment in distinguishing between service and lease components and allocating

5 | 2013 Airline Disclosures Handbook
payments. Whilst this requirement is not new the accounting implications of identifying service contracts versus leases are likely to be greater.
Requirement for additional disclosures
Proposal
The lessee will be required to present or disclose separately the lease liabilities.
The right-of-use assets will be presented or disclosed separately to property, plant & equipment that the entity does not lease.
The amortisation of the right-of-use asset and the interest expense on the lease liability will require identification separate from other amortisation and interest expense.
For leases featuring accelerated expense recognition, payments of principal will be presented as financing activities, payments of interest will be presented as either operating or financing activities, and payment of variable amounts will generally be presented as operating.
Airline industry implications
The requirements above are more detailed and may be more onerous to apply than the current requirements in relation to finance leases that are recognised on the balance sheet.
The separate recognition of the right-of-use asset for aircraft in particular may be confusing to users of the financial statements.
Introduction of new terminology and thresholds specific to leases
Proposal
The exposure draft includes a number of terms that have not previously been included in International Financial Reporting Standards. These include:
• significant economic incentive;
• threshold tests; and
• right-of-use asset.
Airline industry implications
The current IAS 17 terminology and classification criteria relating to finance leases and operating leases are well understood by preparers and users of financial statements.
There is a risk that introducing new, additional terms may create unnecessary complexity.

2013 Airline Disclosures Handbook | 6
Maintenance Accounting
Introduction
Airframes, engines, auxiliary power units, landing gear and other aircraft parts require major maintenance events on a routine basis. The cost of these events may be difficult to predict until the part is inspected.
Many airlines transfer parts of this risk to maintenance providers using ‘risk transfer’ type arrangements. These agreements are generally billed and expensed on a ‘by the hour’ basis and are not covered further in this document.
For owned or finance leased aircraft, industry practice is to capitalise and depreciate maintenance expenses for ‘major’ or ‘heavy’ events. This involves capturing the ‘embedded’ cost of maintenance on new aircraft.
For operating leased aircraft, the treatment differs based on the circumstances. Generally, the lessee is required to return an aircraft with a contractually agreed level of maintenance. Deviations from this agreed level may be settled financially or may require an additional maintenance event to be performed by the airline.
This section highlights observations made from airline disclosures about accounting for maintenance costs.
Owned aircraft and aircraft under a finance lease
IAS 37 Provisions, Contingent Liabilities and Contingent Assets prohibits recognition of a provision for future operating losses and future expenditure that can be avoided. Therefore, the cost of future maintenance of own
assets is not provided for in advance of a maintenance event as it can be avoided by either not flying the aircraft, or by selling the aircraft.
Under IAS 16, major inspections and overhauls are identified and accounted for as a separate component if that component is used over more than one period. When a major inspection or overhaul cost is embedded in the cost of an aircraft, it is necessary to estimate the carrying amount of the component. Disclosures by airlines that account under IFRS demonstrate that this is common practice and ‘embedded’ aircraft and engine maintenance costs are identified as a separate component and depreciated over the period until the next event.
These initial embedded maintenance assets are fully written off by the time when the next maintenance event is performed and the cost of the new event is capitalised and depreciated over the period until the next event.
Although this is common practice, the level of disclosure by airlines varies and at times it can be difficult to determine which maintenance events qualify for capitalisation. Airlines refer to ‘major’ or ‘significant’ events or checks without disclosing specific details.
It was observed that unlike IFRS, the practice under US GAAP is to expense maintenance costs as incurred.

7 | 2013 Airline Disclosures Handbook
Example disclosure: Qantas Airways Limited 2012 Annual Report (IFRS)
Maintenance and Overhaul Costs
An element of the cost of an acquired aircraft (owned and finance leased aircraft) is attributed to its service potential, reflecting the maintenance condition of its engines and airframe. This cost is depreciated over the shorter of the period to the next major inspection event or the remaining life of the asset or remaining lease term.
The costs of subsequent major cyclical maintenance checks for owned and leased aircraft (including operating leases) are capitalised and depreciated over the shorter of the scheduled usage period to the next major inspection event or the remaining life of the aircraft or lease term (as appropriate).
Maintenance checks, which are covered by the third party maintenance agreements where there is a transfer of risk and legal obligation, are expensed on the basis of hours flown.
All other maintenance costs are expensed as incurred.
Example disclosure: Air Canada 2011 Annual Report (IFRS)
“Major maintenance of airframes and engines, including replacement spares and parts, labour costs and/or third party maintenance service costs, are capitalized and amortized over the average expected life between major maintenance events. Major maintenance events typically consist of more complex inspections and servicing of the aircraft. All maintenance of fleet assets provided under power-by-the-hour contracts are charged to operating expenses in the income statement as incurred, respectively.”
Example disclosure: American Airlines 2011 Annual Report (US GAAP)
Maintenance and Repair Costs
Maintenance and repair costs for owned and leased flight equipment are charged to operating expense as incurred, except costs incurred for maintenance and repair under flight hour maintenance contract agreements, which are accrued based on contractual terms when an obligation exists.

2013 Airline Disclosures Handbook | 8
Aircraft under an operating lease
In contrast to the treatment of maintenance of owned aircraft, a lessee may, through use of an aircraft, create an obligation to a lessor to ‘make good’ the aircraft to a level of maintenance determined in the lease agreement. It is also possible that the lessor may be required to reimburse the lessee for returning an aircraft with a level of maintenance greater than the return condition.
At the termination of an agreement the settlement should be relatively straight-forward to determine. During the life of the lease, which may typically be up to ten years, the accounting can be complicated due to the usage of the aircraft and intra-lease maintenance events.
IFRSs do not contain industry specific guidance in relation to the accounting for maintenance return conditions on operating leased aircraft. It remains to be seen how the proposals for the new leases standard may impact the accounting in this area.
Currently airlines turn to IAS 37 and IAS 16 for guidance. The general position observed within the industry is that when flight hours are flown, or cycles operated, to a level that requires remedial maintenance or a settlement with the lessor, then a present obligation exists and must be provided for. It has been observed that some airlines also capitalise modifications that enhance the operating performance or extend the useful lives of aircraft. Such modifications are depreciated over the shorter of the period to the next check and the remaining lease term.
It was observed that both Ryanair and Qantas Airways recognised provisions for maintenance of aircraft, which was leased under an operating lease and had to be returned in a specified condition, during the lease term.
Various observed approaches to accounting for maintenance of aircraft,
which is leased under an operating lease and has to be returned in a specified condition, are illustrated by the following example. The approach is generally dependent upon the particular circumstances of a given airline and the terms of lease contracts.
Example disclosure: Ryanair 2012 Annual Report (IFRS)
“For aircraft held under operating lease agreements, Ryanair is contractually committed to either return the aircraft in a certain condition or to compensate the lessor based on the actual condition of the airframe, engines and life-limited parts upon return. In order to fulfill such conditions of the lease, maintenance, in the form of major airframe overhaul, engine maintenance checks, and restitution of major life-limited parts, is required to be performed during the period of the lease and upon return of the aircraft to the lessor. The estimated airframe and engine maintenance costs and the costs associated with the restitution of major life-limited parts, are accrued and charged to profit or loss over the lease term for this contractual obligation, based on the present value of the estimated future cost of the major airframe overhaul, engine maintenance checks, and restitution of major life-limited parts, calculated by reference to the number of hours flown or cycles operated during the year.”
“Ryanair‘s aircraft operating lease agreements typically have a term of seven years, which closely correlates with the timing of heavy maintenance checks. The contractual obligation to maintain and replenish aircraft held under operating lease exists independently of any future actions within the control of Ryanair. While Ryanair may, in very limited circumstances, sub-lease its aircraft, it remains fully liable to perform all of its contractual obligations under the ‘head lease’ notwithstanding any such sub-leasing.”
Example disclosure: Qantas Airways Limited 2012 Annual Report (IFRS)
“With respect to operating lease agreements, where the Qantas Group is required to return the aircraft with adherence to certain maintenance conditions, provision is made during the lease term. This provision is based on the present value of the expected future cost of meeting the maintenance return condition, having regard to the current fleet plan and long-term maintenance schedules.”
“The costs of subsequent major cyclical maintenance checks for owned and leased aircraft (including operating leases) are capitalised and depreciated over the shorter of the scheduled usage period to the next major inspection event or the remaining life of the aircraft or lease term (as appropriate).”

9 | 2013 Airline Disclosures Handbook
Observed approaches to accounting for maintenance of aircraft leased under an operating lease
Fact pattern:
• Operating lease of a new aircraft;
• Lease term of 9 years;
• Major maintenance events (‘checks’) required on the airframe every 5 years at a cost of 100 units based on consistent use of the aircraft over time;
• Maintenance events are carried out at the end of the life of the previous maintenance event and restore an additional 5 years of maintenance life;
• The lease requires that the aircraft is returned with at least 50% maintenance life (‘half life’) with the option to settle the difference between the maintenance life remaining and 50 units where the aircraft is below 50% maintenance threshold;
• At the end of the lease, the lessee chooses to pay the lessor 30 units to make good the maintenance deficit below ‘half life’ conditions.
The current accounting approaches result in a number of different income statement profiles as highlighted below. The examples ignore discounting.
Profile of value of check remaining compared to value of the check to be returned, and P&L charge/credit for each option
0
10
20
30
40
50
60
70
80
90
100
0 1 2 3 4 5 6 7 8 9
Valu
e of
che
ck re
mai
ning
an
d ch
arge
/cre
dit t
o P&
L
YearCheck value remaining Observed practice 1 – P&L chargeCheck value to be returned to lessor (‘half life’)Observed practice 2 – P&L charge Observed practice 3 – P&L charge
1 2 3 4 5 6 7 8 9 Net P&L charge
Observed Practice 1 20.0 20.0 20.0 20.0 20.0 7.5 7.5 7.5 7.5 130.0
Observed Practice 2 0.0 0.0 10.0 20.0 70.0 0.0 0.0 10.0 20.0 130.0
Observed Practice 3 0.0 0.0 0.0 0.0 0.0 25.0 25.0 35.0 45.0 130.0

Observed Practice 1
Accrue with usage, maintenance costs booked against provision when incurred.
During the first five years, the provision of 100 units for the major maintenance check at the end of year five is recognised as the leased aircraft is flown – usually on a cycles basis. When the major maintenance check is performed at the end of year five, the costs are booked against the provision. From year six to the end of the lease term in year nine, a provision for cash settlement of 30 units is recognised on a straight-line basis.
Observed Practice 2
Provision for contractual obligation for cash settlement is recognised during the lease term, and maintenance expensed as incurred.
When the maintenance condition falls below 50% during year 3, a provision for cash settlement is recognised. At the end of year 3 this is 10 units, representing the contractual ability to settle the difference between the remaining maintenance life (2 years at a cost of 20 units per year) and the 50% threshold. When a maintenance event is performed at the end of year 5, a provision of 50 units will have been recognised as the provision for cash settlement. The cost of the maintenance event is 100 units and 50 units of cost are recognised against the provision and the remaining 50 units are expensed. This results in a charge through the income statement over the period during which the remaining maintenance life is below 50%.
Observed Practice 3
Provision raised for contractual obligation during the last maintenance cycle only, and major maintenance events within the lease are capitalised as leasehold improvements.
When a maintenance event is performed, its cost is capitalised as a leasehold improvement under IAS 16 and depreciated over the remaining maintenance life. This results in an expense ‘holiday’ in the income statement until the first maintenance event is performed. This practice is consistent with the observed approach taken by many IFRS reporting airlines to the capitalisation of significant maintenance events for owned aircraft, where the recognition of a component per IAS 16 is deferred until the first check. The provision for the contractual obligation for cash settlement for the second maintenance event is recognised during the lease term, and maintenance expensed as incurred consistent with Observed Practice 2 above.
Airline Disclosures Handbook | 10

11 | 2013 Airline Disclosures Handbook
2. The long haul to consolidation
Over recent years, government regulations, economic uncertainty, natural disasters, technological change, changes in consumer base and preferences have all collided and resulted in diminishing operating margins. In the last decade we have witnessed tie ups of legacy carriers, overhauled airline alliances and joint services agreements, ownership changes and new code share agreements. We look at some of the most recent initiatives to secure consolidation.

2013 Airline Disclosures Handbook | 12
"The growth LATAM Airlines Group is expected to generate will allow us to offer flights to new destinations for our customers, create more opportunities for our more than 51,000 employees and greater value for shareholders. In addition, we can support the economic, social and cultural development of our region, improving the connectivity of passengers and cargo in South America and the rest of the world."
Mauricio Rolim Amaro, Vice Chairman of TAM S.A.
Mergers/ConsolidationsThe most integrated two airlines can become is when they enter into a merger and act in all ways as one airline.
The most recent tie up was finalised in June 2012 between LAN Airlines S.A. and TAM S.A. to create the LATAM Airlines Group S.A. LATAM comes after a number other mergers, with significant mergers between Air France-KLM, Delta and Northwest, Continental and United.
LATAM Airlines have continued in the tradition of previous mergers with LAN and TAM continuing to operate and market their respective brands in parallel with one another. One of the preeminent advantages of this merger is that LAN and TAM state they partake in complementary markets to each other, increasing their network without further significant capital outlay. Synergies in the first twelve months are estimated to range between US$170 million to US$200 million, increasing to between US$600 million to US$700 million in the following four years. Despite the abundant benefits, such a transaction does not come without costs; LATAM Airlines estimate the costs of the transaction to between US$170 million and US$200 million.
The merger was not achieved without significant negotiation and rigorous
evaluation by regulators and other stakeholders. This is illustrated by the time taken to finalise the transaction. The merger was first announced in August 2010, following which is was referred to the relevant regulatory bodies for review.
AlliancesThe three main alliances continue to grow with the introduction of new members. Since 2008, 22 new members, associates or affiliate members have been announced in total: 5 oneworld, 9 Sky Team and 6 Star Alliance. The Alliances are expanding their membership base with airlines operating in complementary markets to those of existing members.
Star Alliance recently welcomed AviancaTaca and Copa Airlines in 2012, with only one other existing member hailing from the South American region. Invitations to join the alliance have been extended to Eva Air and Shenzhen Airlines, which would increase their presence in Asia.
Sky Team’s access to the Middle East was further developed with the introduction of Saudia and Middle East Airlines.
The oneworld alliance will welcome two new members Malaysian Airlines and SriLankan Airlines, cementing their association with Asian carriers.

13 | 2013 Airline Disclosures Handbook
“The partnership [with Etihad Airways] simultaneously provides international presence, strategic penetration and a bright future for our national carrier.
The aviation industry is under enormous pressure right now, with small airlines especially vulnerable to global economic instability and ongoing oil price volatility. In this context, consolidation offers the best possible solution for Air Seychelles. This agreement will allow Air Seychelles to share the benefits of the visionary strategy of one of the world’s leading airlines and leverage its economies of scale and synergies.”
Joel Morgan, Seychelles Minister of Home Affairs, Environment,
Transport and EnergyJanuary 25, 2012
Direct investmentDirect investment is no longer solely a transitional strategy to acquire a controlling stake in another airline; it has also become a means to commence a strategic partnership.
Etihad Airways has acquired a direct investment in airlines over recent years including Air Berlin, Air Seychelles, Aer Lingus and Virgin Australia. The ownership interest acquired in each has varied but Etihad has articulated benefits from each investment.
The benefits communicated have included:
• Expansion of operations into growth markets, without considerable capital requirements through integration of networks (including through the establishment of code share arrangements).
• Access to training and administration facilities and execution of joint marketing initiatives, reducing the need for duplication.
• Integrated reward programs to include mileage earning and redemption on each carriers flights.
Despite the benefits there may be obstacles to such an investment. It is necessary to consider the relevant laws and regulations of each country, as investment approval is usually required.
Interline and code share arrangements Interline and code share arrangements have been in existence for many years. The aim of these agreements is to effectively allow an airline to increase the number of services that they can sell onto and allocates the selling carrier to market flights across a broader network.
Airlines have continued to use interline and code share arrangements in recent years, with the traditional models expanded to include domestic networks and the integration of additional partners.
“The next milestone will be the expansion of the existing domestic codeshare on each airline's domestic network, further improving connectivity of our services and giving Virgin Australia guests access to 250 destinations across the United States, Canada and Mexico.”
Merren McArthur, Virgin Australia, Delta begin codesharing to USA in
November, published 19 September 2011 by John Walton

2013 Airline Disclosures Handbook | 14
“We have agreed to join forces to give our customers the most comprehensive premium travel experience on the planet.”
Source: The World’s Leading Airline Partnership, Alan Joyce, Qantas Group
CEO, Sydney 06 September 2012
“Qantas and JAL have a long-standing relationship, as codeshare partners and fellow oneworld alliance members. We are also delighted to be joining with Mitsubishi Corporation- one of Japan’s great global brands - to launch Jetstar Japan, building on the successful expansion of the Jetstar brand across Asia.”
“The Qantas Group has a wealth of experience in establishing low cost carriers and we’re looking forward to working with our two partners on this new venture which will offer low fares to the Japanese travelling public.”
Alan Joyce, Qantas Chief Executive Officer, Qantas Airways Limited
Joint service and profit/revenue share agreements We continue to see the expansion of profit, revenue and service arrangements.
One of the latest formal arrangements was the Qantas and Emirates announcement on 6 September 2012 of an airline partnership (subject to regulatory approval). The aspiration of the partnership is to extend beyond the operation of joint routes and to provide customers with access to improved networks, frequencies, lounges, loyalty programs and the overall customer experience.
Such an agreement does not exclude the need for regulatory approval. Qantas states that the arrangement is subject to regulatory approval and would include if permitted, integrated network collaboration including coordinated pricing, sales and scheduling.
This is just one in a long line of arrangements which on the back of Anti Trust Immunity (‘ATI’) allows member airlines to share information, pricing, capacity and frequency, as well as route strategies. Such alliances are designed to offer benefits to the customer (in terms of increased choice), and to the airline: more efficient use of capacity, scheduling, and a “metal-neutral” approach to joint sales, while staying within regulatory constraints including foreign ownership limits.
An interesting development is the extent to which overlapping alliances themselves compete. For example, a
customer wishing to travel from New York JFK to Tokyo Narita has the choice (amongst others) of flying:
• East, via London Heathrow, with the first leg (JFK-LHR) on an alliance between British Airways (AA), American Airlines (AA) and Iberia (IB), and the second sector (LHR-NRT) on another metal neutral alliance between BA and Japan Airlines (JAL); or
• West, via any connecting point in the US (or direct) on a metal neutral alliance between AA and JAL, with certain connections allowed on a codeshare with Cathay Pacific.
FranchiseA concept used in many industries currently being modelled within the aviation industry is franchising. Although not strictly applying the traditional concept, this new model involves bringing together partners who each contribute capital as well as operational strengths.
Jetstar Japan was launched in August 2011 and is a partnership between Qantas Airways, Japan Airlines and Mitsubishi Corporation. The airline adopts the low cost model assumed by Jetstar Airways Australia and uses this as a prototype to establish a low cost airline servicing the domestic Japanese market.
The parties collectively have a firm understanding of the business model, regulatory and legislative environment, consumer demands and capital avenues.

15 | 2013 Airline Disclosures Handbook
Consolidation outlookUntil we see liberalisation of aviation markets in geographics such as Asia we will continue to see more of the “traditional” methods of airline co-operation and “tie-ups”. Why is this the case? There are three key inhibiters to aviation consolidation.
• Ownership and control restricitions;
• Competition regulation; and
• Route right access issues.
Whilst competition regulation affects all industries, it is when you add in foreign ownership caps and route right access based on “nationality” you get a complex web that mergers and acquisitions have to navigate through.
The closest industry we can see to airlines in terms of the above issues is that of the Energy and Natural Resources sector. It is common in this sector to utilise unincorporated commercial joint ventures – usually to develop a specific mine or group of mines. We have noted previously that airlines could contribute assets (eg aircraft), rights and other resources (eg people) that service a route network into a unincorporated commercial joint venture. Whilst the competition regulatory issues remain, a merger of a subset of the airlines could be achieved. Potential benefits could include:
• No legal change in ownership;
• No change in labour agreements for existing workforce;
• No change in Air Operating Certificates – as key post holders and systems of safety are maintained; and
• A re-set of the accounting values – which could include fair valueing new intangibles (some being non depreciable) and property, plant and equipment (very likely downwards).
We recognise these structures would require significant legal and other diligence, the benefits could be significant. It will be interesting to see if any airlines utilises one of these structures prior to the next version of our handbook.

2013 Airline Disclosures Handbook | 16
3. Benchmarking airline costs—the end of low cost flying?
Introduction
KPMG’s study of airline unit costs shows that over the past six years, the difference between the cost base of low cost carriers (LCC’s) and legacy airlines has narrowed dramatically. In many geographies, from a passenger viewpoint, the distinction between the two business models (particularly in short-haul) is also becoming increasingly blurred. So where does the industry go next? We review the trends between 2006 and today as well as consider the ongoing cost implications.
We will show why we consider that:
• The remaining cost gap between long haul and short haul may narrow further but will not be eliminated, as it is inherently structural in nature;
• Legacy airlines are likely to explore new business models in their short-haul feeder networks;
• LCC’s are likely to take one of two routes: certain airlines will remain ruthlessly low price (and by necessity, low cost which is the strategy of the likes of Ryanair), while others will compete against legacy carriers for their higher value customers (as shown by the evolution of Virgin Australia).
The disclosure of successes and the acknowledgement of challenges faced by airlines on the journey to sustained profitability continues to develop, as the industry continues to develop methods for conveying the value of cost saving initiatives.
KPMG investigates the outliers in this space which outline success stories for unit cost containment.
Cost glide-path has convergedAs demonstrated by Chart 1, in 2006 the average unit cost (excluding impairment charges) of legacy carriers was 3.6 US cents/ASK higher than low cost carriers (‘LCC’s’). By 2011, as a result of aggressive streamlining and restructuring the difference was just 2.5 US cents/ASK, a reduction of over 30%.
The majority of this convergence happened in 2008 and 2009 (see Chart 2), which we attribute to aggressive streamlining by legacy carriers in response to the financial crisis. The lack of further convergence after 2009 indicates that the impact of significant restructurings in 2008 (see below) has become business as usual, and also that the “easy-wins” have been taken. We believe that the remaining cost gap is more structural in nature.
In Chart 3, we demonstrate where the cost saving convergence has been achieved. This chart shows that the single-most important component of the cost savings have been made outside of the biggest cost “buckets” for an airline (fuel and staff costs), with a convergence of 0.4 US cents/ASK in “other expenses”: again consistent with the airlines attacking the “low hanging fruit” first.
Sample methodIn our analysis, we have taken a cost per ASK approach to compare the cost bases of both legacy airlines and low cost carriers. We have selected the top 25 legacy carriers by revenue and six low cost carriers, distributed globally.
Six years of financial data (from FY2006 to FY2011 inclusive) were compiled and converted to USD at the average exchange rate across the survey period for the relevant airline.
These were then converted to cost per ASK measures and the weighted average cost per ASK for each of the cost measures discussed for each of the legacy and low cost carriers were compared.
The reporting periods in which the airlines are grouped, are based on yearend dates between 1 April and 31 March of the following year e.g. 2011 cost performance year relates to airlines with balance dates between 1 April 2011 and 31 March 2012.

17 | 2013 Airline Disclosures Handbook
Impact of restructuring commencing during 2008 on the cost differentialDuring 2008, legacy carriers experienced significant impairment charges. These were particularly of note for Delta Airlines, United Airlines and American Airlines.
The restructuring associated with these charges has had significant positive impacts on cost performance in the following years.
These impacts have included:
• Removal of relatively fuel inefficient aircraft from the passenger fleet
• Re-arrangement of employee entitlements
• Re-negotiation of other major contracts with suppliers including MRO operations.
Examples of the impacts of these restructures on the carriers which were subject to significant impairments in the 2008 performance year is provided as follows:
Delta Airlines
• 4,200 employees participating in voluntary redundancies in March 2008
United Airlines
• Announced removal of 100 aircraft from its fleet including 94 B737 and six B747 aircraft
• Estimated FTE reduction of 9,000 positions
American Airlines
• Removed 79 MD-80 aircraft from, and added 90 B737-800 aircraft to its operational fleet since 2008
• Significant reduction in workforce announced
These restructuring activities across the legacy carriers have significantly cut into the cost advantage of low cost carriers.
We note that the impact of the Chapter 11 process for American Airlines and the bankruptcy proceedings for JAL are not reflected in the numbers as the airlines ‘re-set’ the balance sheets on exit from restructuring.

2013 Airline Disclosures Handbook | 18
• $7,296 million — Delta primarily for goodwill ($6,939 million) triggered by significant decline in market capitalisation and high fuel prices at the time.
• $2,625 million — United primarily for goodwill ($2,277 million), triggered by high fuel prices, analyst downgrade of stock, credit rating downgrade and announcement to remove 100 aircraft from fleet.
• $190 million — Alaskan Air retire MD80 fleet
• $183 million — British Airways fleet asset impaired and discontinued operations
• $148 million — China Eastern impairment of fleet assets to market value
• $725 million — AMR Corp impair fleet assets (MD-80s B757s and B767s)
• $371 million — Air China impair fleet assets
• $319 million — Scandinavian Airlines impair fleet assets and holding in Spainair
• $327 million — Air China impair fleet assets
• $182 million — Delta impair fleet assets (50 seater aircraft)
• $121 million — Lufthansa impair aircraft assets
• $291 million — United impair intangibles and fleet assets
• $205 million — Scandinavian Airlines impair fleet
• NB: JAL bankruptcy — financial accounts not reported
• $158 million — Ryan Air impair holdings of Aer Lingus
• $147 million — All Nippon impair fleet assets
• $135 million — JAL impair fleet
• 2011/2012 — Euro Zone crisis (other announcements)
• €740 million Euro — Air France KLM announce major restructuring and derivative losses.
• Large number of European carriers still to report their FY2012 results.
0
3000
6000
9000
12000
15000USD millions
723
2006 2007 2008 2009 2010 2011
748
13,511
1,217 9501,831
Global Financial Crisis
$ million
Delta 7,296
United 2,625
AMR Corp (American Airlines)
1,128
US Airways 640
China Eastern 426
Ryan Air 385
China Southern Airlines 269
Scandinavia Airlines 244
Qantas 152
Thai Airways 145
Source: KPMG analysis for KPMG International, 2013 Airline Disclosures Handbook

19 | 2013 Airline Disclosures Handbook
Chart 1: Legacy versus low cost carrier cost per ASK2006 to 2011 (excluding impairment charges)
2006 2007 2008 2009 2010 20110
2
4
6
8
10
US c
ents
cos
t per
ASK
Reporting PeriodLegacy Low cost
Source: KPMG analysis for KPMG International, 2013 Airline Disclosures Handbook
Chart 2: Reduction in cost per ASK advantage of low cost carriers over legacy carriers from 2006 to 2011 (excluding impairment charges) by year
4.0
Cost advantage to low cost
carriers in 2006
Cost advantage to low cost
carriers in 2011
2007 2008 2009 2010 20110.0
0.5
1.0
1.5
2.0
2.5
3.0
3.5
US c
ents
cos
t adv
anta
ge p
er A
SK
3.6
2.5
0.00.00.7
0.5
0.1
Source: KPMG analysis for KPMG International, 2013 Airline Disclosures Handbook

2013 Airline Disclosures Handbook | 20
Chart 3: Cost per ASK bridge between legacy and low cost carriers by category in 2011 (excluding impairment charges)
0
2
4
6
8
10
9.8
0.50.5 0.3 0.0 0.4 0.3 0.0 0.2 0.1 0.1
7.3
US c
ents
cos
t per
ASK
Lega
cyc/
ASK
2011
Fuel
Man
pow
er
Othe
rex
pens
es
Engi
neer
ing
Selli
ng a
ndM
arke
ting
Depn
, Am
ort
and
Op L
ease IT
Land
ing
and
Park
ing
fees
Airm
eals
Othe
r AOV
Low
cos
tc/
ASK
2011
Source: KPMG analysis for KPMG International, 2013 Airline Disclosures Handbook
Chart 4: Reduction in the composition of cost disadvantage to legacy carriers over low cost carriers between 2006 and 2012 by cost category
0.2 0.10.4 0.1 0.1 0.1 0.1 0.1 0.0 0.0
0.0
0.5
1.0
1.5
2.0
2.5
3.0
3.5
4.0
IT
Cost
dis
adva
ntag
e to
lega
cy c
arrie
rs in
200
6
Cost
dis
adva
ntag
e to
lega
cy c
arrie
rs in
201
1
Fuel
Man
pow
er
Othe
rex
pens
es
Engi
neer
ing
Selli
ng a
ndM
arke
ting
Depn
, Am
ort
and
Op L
ease
Land
ing
and
Park
ing
fees
Airm
eals
Othe
r AOV
3.6
2.5
Source: KPMG analysis for KPMG International, 2013 Airline Disclosures Handbook
21 | 2013 Airline Disclosures Handbook
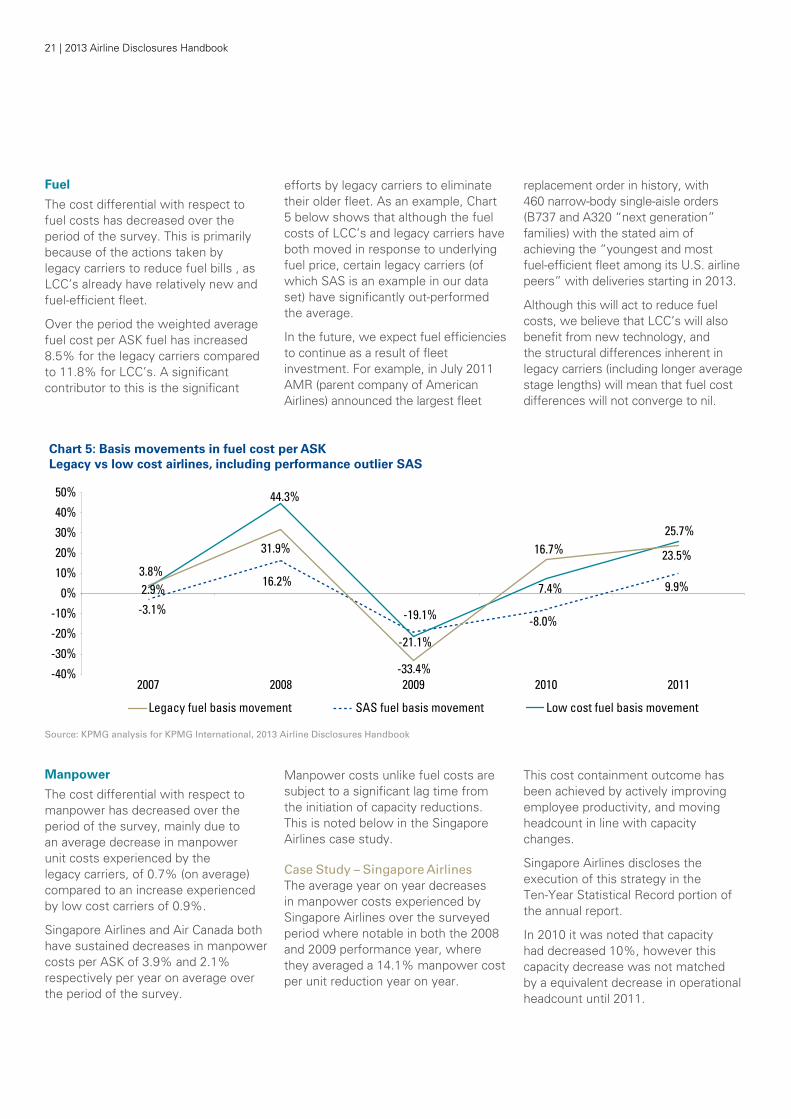
Fuel
The cost differential with respect to fuel costs has decreased over the period of the survey. This is primarily because of the actions taken by legacy carriers to reduce fuel bills , as LCC’s already have relatively new and fuel-efficient fleet.
Over the period the weighted average fuel cost per ASK fuel has increased 8.5% for the legacy carriers compared to 11.8% for LCC’s. A significant contributor to this is the significant
efforts by legacy carriers to eliminate their older fleet. As an example, Chart 5 below shows that although the fuel costs of LCC’s and legacy carriers have both moved in response to underlying fuel price, certain legacy carriers (of which SAS is an example in our data set) have significantly out-performed the average.
In the future, we expect fuel efficiencies to continue as a result of fleet investment. For example, in July 2011 AMR (parent company of American Airlines) announced the largest fleet
replacement order in history, with 460 narrow-body single-aisle orders (B737 and A320 “next generation” families) with the stated aim of achieving the “youngest and most fuel-efficient fleet among its U.S. airline peers” with deliveries starting in 2013.
Although this will act to reduce fuel costs, we believe that LCC’s will also benefit from new technology, and the structural differences inherent in legacy carriers (including longer average stage lengths) will mean that fuel cost differences will not converge to nil.
Chart 5: Basis movements in fuel cost per ASKLegacy vs low cost airlines, including performance outlier SAS
2007 2008 2009 2010 2011-40%
-30%
-20%
-10%
0%
10%
20%
30%
40%
50%
Legacy fuel basis movement Low cost fuel basis movementSAS fuel basis movement
-3.1%
2.9%
44.3%
-21.1%
7.4%
25.7%
3.8%
31.9%
-33.4%
16.7% 23.5%
16.2%
-19.1% -8.0%
9.9%
Source: KPMG analysis for KPMG International, 2013 Airline Disclosures Handbook
Manpower
The cost differential with respect to manpower has decreased over the period of the survey, mainly due to an average decrease in manpower unit costs experienced by the legacy carriers, of 0.7% (on average) compared to an increase experienced by low cost carriers of 0.9%.
Singapore Airlines and Air Canada both have sustained decreases in manpower costs per ASK of 3.9% and 2.1% respectively per year on average over the period of the survey.
Manpower costs unlike fuel costs are subject to a significant lag time from the initiation of capacity reductions. This is noted below in the Singapore Airlines case study.
Case Study – Singapore AirlinesThe average year on year decreases in manpower costs experienced by Singapore Airlines over the surveyed period where notable in both the 2008 and 2009 performance year, where they averaged a 14.1% manpower cost per unit reduction year on year.
This cost containment outcome has been achieved by actively improving employee productivity, and moving headcount in line with capacity changes.
Singapore Airlines discloses the execution of this strategy in the Ten-Year Statistical Record portion of the annual report.
In 2010 it was noted that capacity had decreased 10%, however this capacity decrease was not matched by a equivalent decrease in operational headcount until 2011.

2013 Airline Disclosures Handbook | 22
Singapore Airlines - The Year in Review“The Airline implemented company-wide measures to reduce operational and staff costs including the introduction of a shorter work month scheme for employees, and deferment of non-essential projects.”
Singapore Airlines, Annual Report for the year ended
and as at 31 March 2010
Staff 2011-12 2010-11 2009-10 2008-09 2007-08 2006-07
Average strength
(numbers) 13,893 13,588 13,934 14,343 14,071 13,847
Seat capacity per employee
(seat-km) 8,163,082 7,952,620 7,583,874 8,212,278 8,096,020 8,127,667
Passenger load carried per employee
(tonne-km) 594,663 588,714 563,318 598,047 618,295 613,211
Revenue per employee
($) 868,790 863,931 728,075 909,817 906,801 819,232
Value added per employee
($) 237,472 310,480 219,678 294,666 368,382 368,831
Source: Singapore Airlines, Annual Report, for the year ended and as at 31 March 2012
Case study – Air CanadaAir Canada on average, experienced year on year decreases of 2.1% in manpower costs over the surveyed period.
Air Canada discloses their cost performance across a number of categories in the management
discussion and analysis section of its annual report.
In the 2009 performance year, there was a 4.8% reduction in FTEs, resulting in a significant improvement in the efficiency of manpower costs as capacity had contracted 4.4% in this particular year.
In response to historically high fuel prices, on June 17, 2008 Air Canada announced capacity and staff reductions for the fall and winter schedule.
Air Canada, Annual Report for the year ended
and as at 31 December 2008

23 | 2013 Airline Disclosures Handbook
Full Year Change
(cents per ASM) 2011 2010 cents %
Wages and salaries 2.31 2.39 (0.08) (3.3)
Benefits 0.69 0.62 0.07 11.3
Aircraft fuel 5.08 4.18 0.90 21.5
Airport and navigation fees 1.52 1.51 0.01 0.7
Capacity purchase agreements 1.51 1.53 (0.02) (1.3)
Ownership (DAR)(1) 1.60 1.82 (0.22) (12.1)
Aircraft maintenance 1.03 1.03 - -
Sales and distribution costs 0.92 0.92 - -
Food, beverages and supplies 0.42 0.44 (0.02) (4.5)
Communications and information technology 0.29 0.31 (0.02) (6.5)
Other 1.83 1.87 (0.04) (2.1)
Total operating expense 17.20 16.62 0.58 3.5
Remove:Cost of fuel expense and cost of ground packages at Air Canada Vacations
(5.54) (4.61) (0.93) 20.2
Operating expense, excluding fuel expense and excluding the cost of ground packages at Air Canada Vacations(2)
11.66 12.01 (0.35) (2.9)
(1) DAR refers to the combination of depreciation, amortization and impairment, and aircraft rent expenses.(2) Refer to section 20 “Non-GAAP Financial Measures” of this MD&A for additional information.
Source: Air Canada, Annual Report, for the year ended and as at 31 December 2011
The decrease in manpower costs per unit noted in the 2011 performance year, was predominately driven by productivity improvements offsetting higher average salaries and increases in average FTEs.
Although the legacy airlines have made significant inroads into staff costs, we believe that the residual difference to LLC’s will be more difficult to eliminate due to structural differences, including historical union arrangements, and longer routes involving longer (and costly) layovers.
However, in short-haul, it is increasingly likely that legacy airlines will seek to continue to manage their cost base closely in order to be competitive against the LCC’s. This may involve the continuing development of new businesss models; including lower
cost subsidiaries (e.g. Virgin Australia’s acquisition of Tiger Airways); outsourcing of some or part of short-haul operations (as with Finnair and Flybe); or potentially, closer alliances between LCC’s and legacy carriers (as has previously been explored with JetBlue and Lufthansa with feeder traffic beyond Lufthansa’s US gateways).
Cost outlook
We expect legacy airlines to continue to focus on costs. SAS is an example of an airline that makes extensive disclosures about its efforts in this area.
Many of the easier cost targets have now been eliminated, and while both LCC’s and legacy carriers will continue their focus, we believe that the cost gap will never be eliminated in full because of inherent structural issues:
• Legacy carriers will not be able to fully move away from historical staff cost and practices;
• Only LCC will viably be able to maintain the staff, engineering, and maintenance efficiencies created by single fleet types;
• Because of the lack of network limitations, LCC’s have an inherent ability to seek lower cost airports and routes.
However, LCC’s themselves are likely to diverge in their own business models. Some will seek to continue to be “lowest price”, which inherently means: lowest cost. Others will seek to try and take market share away from the legacy airlines by targeting their higher value customers. This will entail adding new products and services (free baggage, priority boarding,

2013 Airline Disclosures Handbook | 24
pre-assigned seating). The challenge in doing this will be to maintain cost control to remain competitive against increasingly streamlined competitors.
Legacy carriers will continue to need to evolve their business models
through partnership, joint ventures and mergers and acquisitions to meet the cost challenges in competing with the newer and large gulf hub carriers and the growth of the large Chinese international carriers.
Case Study – SASSAS makes significant disclosures of its unit cost performance, which successfully conveys the message that management have taken decisive action in reducing their cost base.
Lower units costs (CASK)
Through Core SAS, Scandinavian Airlines has reduced its unit costs (CASK) by 23% and its operational costs by 24% since 2008. As a result, SAS is now better equipped for the prevailing situation with increased competition, an uncertain macroeconomic trend and accelerating fuel prices.
Cost reduction (excluding fuel costs) 2008-2011
0
5
10
15
20
25
30
35
SEK
billi
on
Curr
ency
-adj
uste
dco
st b
ase
Adju
stm
ent f
orex
traor
dina
ry c
osts
14%
low
er A
SK20
11 v
s. 2
008
Infla
tion
Estim
ated
cos
t bas
e 20
11w
ithou
t Cor
e SA
S
Earn
ings
efle
ct20
08-2
011
Cost
bas
e 20
11
30.123.2
32.0
0.62.1 0.8
6.9
-23%
Source: SAS Annual Report 2011
“Core SAS has generated cost savings of 23% since 2008 and a new platform for profitable growth has been created. The new strategic focus 4Excellence was launched in autumn 2011, entailing that SAS continues to maintain its strong focus on the unit cost. The objective is to reduce unit cost by 3-5% per year. This will be implemented with the support of cost reductions and increased productivity. The part of the unit-cost reduction that is intended to be based on cost efficiency comprises reduced administration, lower IT costs, more efficient purchasing and centralization of international sales activities.
Customers will see a harmonized product offering, which will also entail savings for SAS. In addition to cost efficiency, higher productivity will help reduce the unit cost. Aircraft utilization will increase, partly due to increased production to private travel destinations. The average aircraft size will gradually increase due to changes in the aircraft fleet. Extensive “Lean” efforts are also taking place in many areas throughout the company, which will help SAS handle planned capacity growth in a cost-efficient manner.”
SAS Annual Report 2011
SAS introduces LeanSAS is introducing Lean to continue improving the unit cost. The purpose of Lean is to harmonize SAS’s standard of delivery and quality to customers and achieve cost efficiencies. The aim is that all managers and employees will base their work on these principles. High precision and reliability in SAS’s punctuality and regularity is a strong indicator of efficient and reliable processes. Accordingly,
SAS uses punctuality as a key measure in the Lean program. Motivated and committed employees and managers are a prerequisite for creating permanent results. Everyone will apply the best-known working practice. To achieve the overall targets, SAS has established a “roadmap” for the next few years with a focus on creating an understanding of, and compliance with, the Lean principles.
Source: SAS Annual Report 2011

25 | 2013 Airline Disclosures Handbook
Appendix 1: Surveyed airline financial reports
Company name Reporting GAAP Regulatory filings reviewed
AirAsia Malaysian IFRS Annual Report
Air Berlin EU IFRS Annual Financial Report
Air Canada Canadian GAAP Annual Report
Air China IFRS Annual Report
Air France-KLM Group EU IFRS Annual Financial Report
Alaskan Air Group US GAAP Form 10-K
All Nippon Airways Japanese GAAP Annual Report
AMR Corp (American Airlines) US GAAP Form 10-K
Cathay Pacific Airways Hong Kong IFRS Annual Report
China Eastern Airlines IFRS Annual Report
China Southern Airlines IFRS Annual Report
Delta Airlines US GAAP Form 10-K
Deutsche Lufthansa Group EU IFRS Annual Financial Report
easyJet EU IFRS Annual Report and Accounts
Emirates Airlines IFRS Annual Report
International Airlines Group (British Airways and Iberia)
EU IFRS Annual Report and Accounts
Japan Airlines (JAL) Japanese GAAP Annual Financial Report
JetBlue Airways US GAAP Form 10-K
Korean Air Lines Korean GAAP Annual Financial Report
Qantas Airways Australian IFRS Annual Report
Ryanair IFRS Annual Report and Form 20-F
Scandinavian Airlines System IFRS Annual Report & Sustainability Report
Singaporean Airlines Singaporean IFRS Annual Report
Southwest Airlines US GAAP Form 10-K
TAM Linhas Aéreas IFRS Form 20-F
Thai Airways International Thai GAAP Annual Report
Turkish Airlines CMB IFRS Annual Report
United Continental Holdings US GAAP Form 10-K
US Airways US GAAP Form 10-K
Reporting for relevant period included in survey

2013 Airline Disclosures Handbook | 26

27 | 2013 Airline Disclosures Handbook
Appendix 2: KPMG Contacts
For more information, please contact a professional from the following KPMG member firms.
Global Leadership
Dr Ashley SteelGlobal Chair – Transport 15 Canada SquareLondon, E14 5GLU.K.T: +44 20 7311 6633E: [email protected]
Malcolm RamsayGlobal Head of Aviation10 Shelley StreetSydney 2000AustraliaT: +61 2 9335 8228E: [email protected]
Contact Us
Argentina Eduardo H Crespo +54 11 4316 5894 [email protected]
Australia Malcolm Ramsay + 61 2 9335 8228 [email protected]
Belgium Serge Cosijns +32 3 821 18 07 [email protected]
Brazil Mauricio Endo +55 11 3245 8322 [email protected]
Canada Laurent Giguère +1 514 840 2393 [email protected]
Chile Alejandro Cerda +56 2 798 1201 [email protected]
China Jeffrey Wong +86 21 2212 2721 [email protected]
Cyprus Sylvia Loizides +357 25869104 [email protected]
Czech Republic Eva Rackova +420 222 123 121 [email protected]
Denmark Jesper Ridder Olsen +45 7323 3593 [email protected]
Finland Pauli Salminen +358 20 760 3683 [email protected]
FrancePhilippe Arnaud +33 1 5568 6477 [email protected]
Germany Steffen Wagner +49 69 9587 1507 [email protected]
Greece Dimitra Caravelis +30 2106062188 [email protected]
Hong Kong Shirley Wong +852 2826 7258 [email protected]
Hungary Zoltan Szekely +36 1 887 7394 [email protected]
India Manish Saigal +91 22 3090 2410 [email protected]
Indonesia David East +62 215740877 [email protected]

2013 Airline Disclosures Handbook | 28
Ireland Michele Connolly +353 1 410 1546 [email protected]
Israel Guy Aharoni +972 4 861 4801 [email protected]
Italy Alessandro Guiducci +39 010 553 1913 [email protected]
Japan Atsuki Kanezuka +81 3 3266 7002 [email protected]
Korea Ha Kyoon Kim +82 2 2112 0271 [email protected]
Luxembourg Philippe Neefs +35222 5151 5531 [email protected]
Malta Pierre Portelli +356 2563 1132 [email protected]
Malaysia Hasmanyusri Yusoff +60377213388 [email protected]
Mexico Alejandro Bravo +525552468360 [email protected]
Netherlands Herman van Meel +31 20 656 7222 [email protected]
New Zealand Paul Herrod +64 9 367 5323 [email protected]
Norway John Thomas Sørhaug +47 4063 9293 [email protected]
Peru Victor Ovalle +5116113000 [email protected]
Poland Andrzej Bernatek +48225281196 [email protected]
Portugal João Augusto +351 210 110 000 [email protected]
RussiaAlexei Romanenko +7 495 663 8490 ext.12694 [email protected]
Saudi Arabia Ebrahim Baeshen +96626581616 [email protected]
Singapore Wah Yeow Tan +65 6411 8338 [email protected]
South Africa Dean Wallace +27 83 251 9585 [email protected]
Spain David Hohn +34 91 456 3886 [email protected]
Sweden Anders Rostin +46 8 723 9223 [email protected]
Switzerland Marc Ziegler +41 44 249 20 77 [email protected]
Taiwan Fion Chen +886 2 8101 6666 [email protected]
Turkey Yavuz Oner +90 216 681 90 00 [email protected]
U.K. Ashley Steel +44 20 7311 6633 [email protected]
U.A.E. Andrew Robinson +9 71 4356 9500 [email protected]
U.S.A. Chris Xystros +1 757 616 7009 [email protected]
Uruguay Rodrigo Ribeiro +59829024546 [email protected]
VietnamJohn Ditty +84 8 3821 9266 [email protected]

The information contained herein is of a general nature and is not intended to address the circumstances of any particular individual or entity. Although we endeavor to provide accurate and timely information, there can be no guarantee that such information is accurate as of the date it is received or that it will continue to be accurate in the future. No one should act on such information without appropriate professional advice after a thorough examination of the particular situation.
© 2013 KPMG International Cooperative (“KPMG International”), a Swiss entity. Member firms of the KPMG network of independent firms are affiliated with KPMG International. KPMG International provides no client services. No member firm has any authority to obligate or bind KPMG International or any other member firm vis-à-vis third parties, nor does KPMG International have any such authority to obligate or bind any member firm. All rights reserved.
KPMG and the KPMG logo are registered trademarks of KPMG International Cooperative (“KPMG International”), a Swiss entity.
Designed by Evalueserve.
Publication name: Airline Disclosures Handbook
Publication date: February 2013