2013 annual report - accent group limitedrcgcorp.com.au/wp-content/uploads/2015/05/2013.pdf · 2013...
TRANSCRIPT


2013 Annual Report
RCG Corporation Limited Key Performance Metrics FY2009 to FY2013

2013 Annual Report
RCG CORPORATION LIMITED ABN 85 108 096 251
Annual Report for the financial year ended 30 June 2013
Contents Page
Chairman and CEO’s Review 3
Corporate Governance Statement 7
Directors’ Report 20
Auditor’s Independence Declaration 30
Statement of Profit or Loss and Other Comprehensive Income 31
Statement of Financial Position 32
Statement of Changes in Equity 33
Statement of Cash Flows 34
Notes to the Financial Statements 35
Directors’ Declaration 72
Independent Audit Report 73
Additional Information
Corporate Directory
75
77
Contents

Chairman and CEO’s review
3 2013 Annual Report
‐50.0%
0.0%
50.0%
100.0%
150.0%
200.0%
250.0%
Jul 2008 Jun 2009 Jun 2010 Jun 2011 Jun 2012 Jun 2013
Total Shareholder Returns Over Five Years
Small Ords (XSO) cum totalreturn
Emerging Companies (XEC) cumtotal return
RCG cum total shareholderreturn
Dear fellow shareholder We are delighted to report that, despite a very challenging retail climate, RCG has had an excellent year during which we managed to not only achieve double digit EBITDA growth from continuing operations and increase earnings per share by 10%, but also deliver several significant strategic initiatives that make our business stronger, more resilient and more focussed than ever before. From continuing operations, RCG delivered consolidated EBITDA of $15.1m in FY2013, an increase of 12.6% on the previous financial year. Diluted Earnings Per Share from continuing operations increased 10.1% from 3.92 cents to 4.31 cents. We have maintained our dividend payout target of 90% ‐ 95% and will pay 4 cents per share in fully franked dividends in respect of FY2013, an increase of 33% on the prior year. Moreover, notwithstanding this generous payout ratio and significant capital investments on major projects and store rollout, our balance sheet remains extremely strong with $12.7m of net cash on hand at the end of June. It is a great testament to the strength of our organisational structure and the quality of our management team that we have been able to consistently deliver outstanding results over an extended period of years. This has translated into robust and consistent returns for our shareholders. The chart below shows that over five years RCG has delivered a total cumulative return to shareholders of 219%, which equates to a Compound Annual Growth Rate (CAGR) of 26.1%. By way of comparison, the Emerging Companies Accumulation Index has returned a cumulative return of negative 30%, or CAGR of negative 7% and the Small Ordinaries Accumulation Index has returned a cumulative return of negative 20% or CAGR of negative 4% over the same time period.
To shed more light on both the past year and our expectations for the year ahead, let us deal with each business unit individually. The Athlete's Foot The Athlete's Foot recorded full‐year like‐for‐like sales growth of 4.1% in FY2013, Total group sales were up 3.0% (after adjusting the FY2012 53 week year back to 52 weeks) to $205.1m. Growth slowed in the second half of the financial year, particularly in the last four months, during which like‐for‐like growth moderated to 2.1% for Australian stores. This is an outstanding result given that Australian Bureau of Statics data shows that for the same four month period footwear and accessories retail contracted by 4.1%.

Chairman and CEO’s review
4 2013 Annual Report
TAF delivered EBITDA of $12.2m an increase of 1.5% on the prior year. However, a direct comparison is not entirely valid as the 2012 financial year incorporated an extra week (53 weeks compared to the usual 52). On a comparative basis, TAF’s EBITDA increased approximately 3%. TAF has demonstrated time and again over many years that it is an extremely resilient business which is capable of not only maintaining its position but growing during tough trading conditions. The business’s uncompromising focus on service and the customer experience provides it with a clear, unchallenged and unassailable market position that sets it apart from all other market participants. As a consequence, it has been able to maintain its position as a full‐priced retailer and has maintained its gross profit margins even during a time of unprecedented price driven activity in its sector. The business has not, and will not, engage in the prevalent retail trend of increasingly frequent and deep price‐driven promotional activity in a “race to the bottom” in order to grow sales. This resilience will be an important factor in continuing to drive TAF forward in what appears to be a very challenging outlook for retail. TAF’s core proposition of delivering outstanding and unsurpassed customer service as a value‐add has successfully withstood its greatest ever challenge in the form of offshore online retailers who have often been able to deliver similar products at prices that local retailers are incapable of matching. Whilst other businesses see the price driven online retailers as a threat, TAF views the internet as an enabler that gets it closer to its customers and local communities. It has also successfully integrated the online channel with its bricks and mortar presence, offering its customers buy online/pickup up in store, store‐to‐door and virtual showroom cross channel integration. Moreover, whilst sales from the online store continue to grow at a rapid rate, site visits and social media engagement have grown even more strongly and the site is being used as an entry point for both existing and new customers to find their way to a store, with a very high percentage of browsers navigating to store pages. For the past 12 months the TAF business has been focussed on delivering a number of major long‐term projects to significantly enhance customer experience and engagement levels to further entrench its competitive advantage. We are delighted to report that, in addition to the online work that has been described above, each of these projects has now been, or is in the process of being, delivered. The first of these is a new generation retail management and point of sale system. After more than two years of analysis, development and planning, the system has now been rolled out to almost all Australian stores. This platform, which is entirely cloud hosted and therefore completely mobile and always available to all users, will provide business transforming analytical data, both to head office and store personnel. Moreover, the platform will be utilised to dramatically improve efficiencies in stock control and replenishment processes at the individual store and franchise level, freeing up time from non‐customer facing tasks. The second project is the delivery of what we believe is the world’s most comprehensive retail fitting analysis tool that will, over the next few months, replace the ageing FitPrint that has served the TAF business so well for more than 12 years. Fitzi® is a revolutionary and completely bespoke foot and gait analysis tool that utilises both video and pressure to assist in providing the best possible fitting solution to our customers. The rollout of Fitzi® has begun in earnest and we expect this new store centrepiece to be rolled out to the majority of stores prior to Christmas. The final project, which will tie all the others together, is the implementation of a fully integrated, customer relationship management and cross‐channel marketing platform. TAF has conducted a worldwide search for a suitable solution and we are delighted that we have identified and engaged a best‐of‐breed solution provider. The first phase of the new platform will be up and running before Christmas. This will enable the business to engage in much more targeted, meaningful and personalised direct marketing opportunities with its significant loyal customer base. It will also provide new and valuable insights into customer consumption cycles which in turn will assist in optimising TAF’s loyalty offering. These initiatives are core to our philosophy of continual business improvement and this, together with TAF’s proven resilience, give us great confidence that the business will continue to grow and thrive over the course of the upcoming year and into the future.

Chairman and CEO’s review
5 2013 Annual Report
0
1,000
2,000
3,000
4,000
5,000
6,000
0
5,000
10,000
15,000
20,000
25,000
30,000
35,000
40,000
FY10 FY11 FY12 FY13
EBITDA ($000's)
Total S
ales ($000's)
RCGB performance since inception
EBITDA Sales
RCG Brands RCG Brands (RCGB) is RCG’s wholesale and distribution division. FY2013 was another excellent year for the division. Total sales grew 35.1% to $33.4m with wholesale sales growing 21.2% to $27.8m and retail sales growing 212% to $5.6m. EBITDA grew 23.2% to $5.0m. The chart below shows how the business has performed since its inception in January 2010. Merrell continues to be the flagship brand in the RCGB stable. Despite losing one of its biggest customers in Shoe Superstore (see below) half‐way through year, Merrell wholesale sales continued to grow strongly, with wholesale sales increasing by 7%. With a focussed product offering across multiple categories and a continued investment in inventory and customer relationships, Merrell has grown substantially as a brand in the Australian market place since being acquired by RCG and has defied the trend in the branded footwear space.
During the year, we opened four new Merrell retail stores, including two clearance stores. We now have a total of eight Merrell stores. The stores continue to perform exceptionally well and are a cornerstone in our plans for sustainable growth. We anticipate opening another four to six retail stores during FY2014. We are also pleased to report that RCG has extended its Merrell distribution agreement with the owners of the brand, Wolverine Worldwide, Inc. This extends RCG’s distribution licence to 31 December 2019. The CAT business also continues to grow strongly despite operating in a very challenging corner of the market. Sales grew by 86% during FY2013. The slowdown in the mining sector and the glut of cheap, generic product in the industrial apparel space has made this a particularly tough space to perform in. In light of these factors, the performance of the business is all the more pleasing and we have expectations of strong continued growth through FY2014. We are also delighted to announce that RCG has been awarded the exclusive Australian distribution rights for Sperry Top‐Sider with effect from 1 January 2014. This brand, which was acquired by Wolverine Worldwide Inc. in 2012 as part of its acquisition of the PLG Group from Collective Brands, is the original and iconic boat shoe brand and is now a premium lifestyle brand with global sales in excess of $550m. RCG does not expect the brand to contribute to profit materially in FY2014, but expects the brand to generate incremental EBIT from FY2015 onwards.

Chairman and CEO’s review
6 2013 Annual Report
Shoe Superstore In February we announced that, following a full strategic review, a decision had been made to discontinue the Shoe Superstore business. In our view, both the financial and opportunity cost of continuing to support a loss making business that absorbed significant amounts of management time was not in the long term best interest of either the rest of the business or the shareholders. The business was placed into voluntary administration on 20 February 2013. The joint administrators continued to operate the business until they sold it in April 2013 and the majority of stores continue to trade under new ownership. Creditors subsequently approved a deed of company administration, which is now in the process of being finalised. RCG wrote off its investment in the business at the half‐year and expects no further exposure or financial impact from it. Dividends For the FY2013 year, RCG will pay fully franked ordinary dividends of 4c per share, being a 1.75c interim dividend, which was paid in March, and a 2.25c final dividend which will be paid in September. This represents a 33% increase in the dividends paid in respect of FY2012. The payout ratio is 92% which is in line with our 90% ‐ 95% target. Outlook The highly uncertain and challenging trading outlook makes it difficult to confidently forecast performance. Notwithstanding this, RCG is targeting EPS growth of 10% for FY2014. Conclusion RCG has had another excellent financial year in what can only be described as very difficult trading conditions. The efforts of the staff, management and franchisees of all of our business have been extraordinary and the results are reflective of both their skill and their dedication – they cannot be praised highly enough. Despite the uncertain and challenging outlook for the year ahead, we are confident that the business is extremely well placed to ride out the storm. Our management team has developed and implemented processes, structures and plans ideally suited to countering the threats and capitalising on the opportunities that we expect to face over the next 12 months. Ivan Hammerschlag Hilton Brett Chairman CEO 21 August 2013

7 2013 Annual Report
Corporate governance statement
This Corporate Governance Statement outlines the Company’s main corporate governance practices as at 21 August 2013.
This Corporate Governance Statement also indicates the Company’s conformance with the “Corporate Governance Principles and Recommendations 2nd Edition with 2010 Amendments” issued by the ASX Corporate Governance Council.
The Company has posted copies of its corporate governance practices to its website in accordance with the ASX Corporate Governance Council’s recommendations. THE BOARD Responsibilities The Board is accountable to the Company’s shareholders. It has overall responsibility for the performance of the Company, the execution of the Company’s strategy, and the implementation of sound corporate governance policies and practices. The Company has adopted a Board Charter which formally sets out the functions and responsibilities of the Board. This enables the Board to perform its role more effectively and creates a system of checks and balances to provide a balance of authority. The Board has the following specific responsibilities:
Governance Oversight of the Company, including its control and accountability systems Reviewing, ratifying and monitoring systems of risk management, internal control, and legal
compliance Ensuring the Company’s Code of Conduct is implemented and observed by all employees,
contractors and professionals who have a business association with the Company Reviewing safety and environment issues Reviewing industrial relations issues and quality assurance
Stakeholders Driving corporate performance and delivering shareholder value Authorising the release to the ASX of interim and final results Authorising the release to the ASX of other significant information
Management Appointing and removing the CEO Approving remuneration of the CEO including the setting of performance targets Approving the Company’s remuneration policy Ratifying the appointment and removal of senior executives Monitoring performance by executive management and the achievement of business
objectives and financial performance Ensuring that appropriate resources are available to management to discharge its duties
Strategy and financial management
Approving the strategic direction and related objectives of the Company Approving the annual business plan and budgets Approving and monitoring the progress of major capital expenditure Approving acquisitions or disposals of major assets or businesses Approving and monitoring capital management strategies including the payment of dividends
and issuing of any securities or options Monitoring the financial operations and solvency of the Company

8 2013 Annual Report
Corporate governance statement
ASX Corporate Governance Recommendation 1.1 Composition of the Board The names of the Directors of the Company in office at the date of this statement are set out in the Directors’ Report together with information regarding:
The Directors’ relevant skills and experience. The names of the Directors considered to be independent Directors and The term of office held by each Director.
ASX Corporate Governance Recommendation 2.6 The number of Directors as specified in the Company’s constitution is a minimum of three. At no relevant time has the Company had less than this number. The current number of Directors is six. Independence Throughout the financial year and to the date of this report, the Board has been comprised of six directors. Three of the Directors are full‐time executives of the Company and therefore do not meet the Independence definition. The Chairman of the Board, Ivan Hammerschlag, both provides ongoing consulting services to the Company and is a substantial shareholder (as defined in section 9 of the Corporations Act 2001) and is therefore not Independent either. David Gordon, a non‐executive Director, is a substantial shareholder and does not meet the definition of an independent director. Therefore, Stephen Kulmar is the only Director that is currently an independent Director. Whilst the current structure does not comply with ASX Corporate Governance Recommendation 2.1, the composition of the Board has been determined having regard to the nature and size of the Company’s operations, the skill set of the Directors both individually and collectively, the independence of Directors and the best interests of Shareholders. The Board is comprised of members with strong retailing, financial and corporate experience and is considered to be appropriate given the size and nature of activities of the Company. In addition, in order to facilitate independent judgement in decision making, each Director has the right to seek independent professional advice at the Company’s expense. Using the information provided in the ASX Corporate Governance Principles and Recommendations as a guide, the Board regularly assesses whether or not each non‐executive Director is independent. If a Director’s independence status changes, this is disclosed to the market in a timely manner. ASX Corporate Governance Recommendation 2.1 Chairman The Board Charter requires the Chairman of the Board to be elected on his merits with reference to his experience, track record and the needs of the Company. The Charter does not require the Chairman to be an independent Director. As explained above, the Chairman of the Board is not an independent Director. Whilst this does not comply with ASX Corporate Governance Recommendation 2.2, the use of Mr Hammerschlag, who has considerable and relevant skills in retail and business strategy, as a consultant, is considered to be in the best interests of the Company given the size of the Company and the nature of its activities. ASX Corporate Governance Recommendation 2.2 Day to day management

9 2013 Annual Report
Corporate governance statement
The CEO overseas the day to day management of the business. He holds regular meetings with all his direct reports on both a formal and informal basis and tracks progress against budgets. He also has responsibility for developing and implementing corporate strategies and making recommendations on significant corporate strategic initiatives. ASX Corporate Governance Recommendation 1.1 and 2.3 Appointment, removal and remuneration of Directors The rules governing the appointment, removal and remuneration of Directors are provided for in the Company’s Constitution and the Corporations Act. Notwithstanding these rules, the following principles have been adopted:
The Directors may agree between them to appoint a new Director. The appointment must be ratified by the shareholders at a general meeting.
The principal criterion for the appointment of a new Director is that such person is able to add significant value to the group and its business through having relevant skills and experience.
The Board also recognises the benefits of diversity in driving business results and setting business strategy and will take this into account in its appointment of new Directors. The Board will comprise Directors with complementary and appropriate skills necessary to discharge the duties of the Board in accordance with the Charter.
The maximum remuneration of non‐executive Directors is the subject of Shareholder resolution in accordance with the Company’s Constitution and the Corporations Act as applicable. The apportionment of non‐executive Director remuneration within that maximum will be made by the Board having regard to the inputs and value to the Group of the respective contributions by each non‐executive Director. The Board may award additional remuneration to non‐executive Directors called upon to perform extra services or make special exertions on behalf of the Company (e.g. perform the role of Chairman of the Board or a Board Committee).
Having regard to the small number of Directors, the relative stability of the Board and the size of the Company, the Board has not established a Nominations Committee. The functions of the Nominations Committee are carried out by the Remuneration Committee or the Board, as is appropriate. ASX Corporate Governance Recommendation 2.4 Performance of the Board The members of the Board, actively led by the Chairman with the input and support of the CEO and Company Secretary, evaluate the performance and efficient functioning of the Board, its Committees and its members on an ongoing basis. The following protocols are in place to ensure that the Board is able to perform appropiately and discharge its duties efficiently: New Directors are fully briefed on the business, its financial position, any material risks, the
structure and functions of the Board and the structure of Management and are provided with a copy of the Company’s Corporate Governance documentation
Directors are given direct access to Management and the Company Secretary. These individuals are to provide Directors with any and all information reasonably requested of them in a timely and comprehensive fashion
Directors are given the opportunity to seek reasonable independent, external advice at the Company’s expense if circumstances warrant such advice
The Chairman and CEO have regular contact with the Company’s major shareholders and take on board feedback concerning the performance of the Board and its members
ASX Corporate Governance Recommendation 2.5

10 2013 Annual Report
Corporate governance statement
Establishment of Committees The Board has established the following committees: Audit Committee – to protect the integrity of financial statements (further details of which are
discussed below) Remuneration Committee ‐ to ensure that the Company remunerates fairly and responsibly (further
details of which are discussed below)
ASX Corporate Governance Recommendation 4.1 and 8.1 SAFEGUARDING INTEGRITY IN FINANCIAL REPORTING Audit Committee Overview An independent Audit Committee has been established by the Board to protect the integrity of financial reports as well as to monitor and review the effectiveness of the Company’s structures in the areas of operational risk and legal and regulatory compliance. The importance of an Audit Committee is universally recognised in the practice of good corporate governance and plays a key role in focusing the Board on matters relevant to the integrity of financial reporting. ASX Corporate Governance Recommendation 4.1 Roles and responsibilities The Audit Committee has adopted an Audit Committee Charter which sets out the roles and responsibilities as well as the structure and composition of the Audit Committee. According to the Charter, which is available to view on the Company’s website, the role of the Audit Committee is to assist the Board in fulfilling its corporate governance responsibilities with regard to: The reliability and integrity of information for inclusion in the Company’s financial statements Enterprise‐wide risk management Compliance with legal and regulatory obligations including audit, accounting, tax and financial
reporting obligations The integrity of the Company’s internal control framework Safeguarding the independence of the external auditors
ASX Corporate Governance Recommendation 4.3 and 4.4 Membership The Committee is appointed by the Board in accordance with the Company’s Constitution. Given the size and composition of the Board, it is not possible for all the members of the Audit Committee to be non‐executive Directors. For the same reason, it is not possible for the majority of the members to be Independent Directors. However, the Audit Committee Charter requires all members to bring independent judgement to bear in respect of the discharge of their duties. The following rules apply to the membership of the Audit Committee: There will be at least three members All members will be financially literate At least one member must be a qualified and experienced financial expert (such as a Chartered
Accountant) The Chairman of the Audit Committee must be a non‐executive Director who is not also Chairman
of the Board The table below shows the names of the members of the Audit Committee as at the date of this report and throughout the financial year, together with their qualifications and the number of meetings each member attended:

11 2013 Annual Report
Corporate governance statement
Name Qualifications No of meetings
Eligible to attend Attended
David Gordon (Chairman) BCom, LLB 3 3
Michael Hirschowitz BCom, BAcc, GAICD 3 3
Hilton Brett BCom, PGDA 3 3
ASX Corporate Governance Recommendation 4.2 and 4.4
External Auditors The appointment of, and dealings with, the Company’s external auditors has been delegated to the Audit Committee by the Board. This includes: Recommending to the Board the appointment, reappointment or replacement of the external
auditor Agreeing to the fees to be paid to the auditor Reviewing and approving the audit plans of the auditor Reviewing the overall scope of the audit, including identified risk areas and any additional agreed‐
upon procedures Considering the overall effectiveness and independence of the auditor Resolving any disagreements between Management and the auditor regarding financial reporting. Monitoring and noting compliance by the auditor of the independence requirements imposed by
the Corporations Act ASX Corporate Governance Recommendation 4.4
RECOGNISING AND MANAGING RISK Overview In order to recognise and manage risk the Company has established an internal compliance system allowing risks to be identified, assessed, monitored and managed. The Board and/or Audit Committee oversee the establishment and implementation of the risk management system.
All material risks affecting the Company, including both financial and non‐financial matters, are discussed at each Board meeting and each meeting of the senior executive of the business. All Directors and senior management are encouraged to review the business for risk on an ongoing basis and to raise at each Board meeting any risk issues of concern. These protocols form the basis for the risk management system. The Company has implemented controls at the Company and operating group levels that are designed to safeguard the Company’s interests and ensure the integrity of its reporting. These include accounting, financial reporting, safety, health and environment and other internal policies and procedures, which are directed at ensuring the Company fully complies with all regulatory requirements and community standards. Comprehensive practices are in place such that: Capital expenditure and revenue commitments above a certain size obtain the correct approval; Financial exposures are controlled; Safety, health and environment standards and management systems are monitored and reviewed to
achieve high standards of performance and compliance; and Business transactions are property authorised and executed.

12 2013 Annual Report
Corporate governance statement
The effectiveness of the risk management system is reviewed by the Board on an ongoing basis. The Board and Audit Committee are responsible for ensuring that the appropriate senior managers have established and implemented a risk management system throughout the organisation.
ASX Corporate Governance Recommendation 7.1
Management of risk The Board requires that management design and implement the risk management and internal control systems of the Company. At each Board meeting, the Finance Director is required to give a full report on any material risk items identified since the last Board meeting and a comprehensive review of the steps taken to mitigate or remove material risk items identified in previous Board meetings. All risk items, including any identified weaknesses in internal controls, are thoroughly discussed at each Board meeting and the Board provides the necessary guidance and authority to the relevant personnel to attend to the risk item. In addition to the above, the Company’s external auditors provide the Audit Committee with a report detailing any identified risk items at the completion of each half‐year and full‐year review. The report is discussed by the Audit Committee together with the auditors and any material items are referred to the Board. Given the nature and size of the business and the relative frequency with which the non‐executive Directors interact with all levels of management, an internal audit function has not been established. For the same reasons a Risk Committee has also not been established. However, the Audit Committee carries out the functions normally reserved for a Risk Committee. ASX Corporate Governance Recommendation 7.2 and 7.4 CEO & CFO Assurances In order to create an environment for identifying and capitalising on opportunities, the Board has established a sound system of risk oversight and management. To encourage management accountability in this area both the CEO and CFO (in this case the Finance Director) are required to provide written assurances to the Board, at each meeting of the Board, that the Company’s risk management and internal compliance and control system is operating efficiently and effectively in all material respects and that the integrity of the financial statements is founded on a sound system of risk management and internal compliance and control which implements the policies adopted by the Board.
ASX Corporate Governance Recommendations 7.3 and 7.4 REMUNERATION AND PERFORMANCE The Remuneration Committee Overview The Company has established a Remuneration Committee which is responsible for regularly evaluating the performance of the executive Directors and other senior managers. The evaluation is based on specific criteria including the Company’s business performance, short and long term strategic objectives and the achievement of personal objectives by the executive Directors and other senior managers. The Remuneration Committee has adopted a Remuneration Committee Charter. A copy of the Charter can be found on the Company’s website. ASX Corporate Governance Recommendation 8.1 Composition

13 2013 Annual Report
Corporate governance statement
The Committee is appointed by the Board in accordance with the Company’s Constitution. All the members of the Remuneration Committee are non‐executive Directors. However, given the size and composition of the Board, it is not be possible for all the members of the Remuneration Committee to be independent Directors. However, the Charter requires all members to bring independent judgement to bear in respect of the discharge of their duties. The following rules apply to the membership of the Remuneration Committee: All members must be non‐executive Directors Where possible, there must be at least three members The Chairman of the Remuneration Committee must be a non‐executive Director who is not also
Chairman of the Board The Chairman of the Remuneration Committee is David Gordon. Mr. Gordon is a substantial shareholder and therefore does not pass the independence test. However, given Mr Gordon’s experience and competence in this area, he is considered to be the most appropriate Chair of the Remuneration Committee. The Remuneration Committee has three members, all being non‐executive Directors of the Company. The table below shows the names of the members of the Remuneration Committee as at the date of this report and throughout the financial year and the number of meetings each member attended:
Name No of meetings
Eligible to attend Attended
David Gordon (Chairman) 4 4
Ivan Hammerschlag 4 4
Stephen Kulmar 4 4
ASX Corporate Governance Recommendation 8.2 and 8.3 Responsibilities of the Remuneration Committee The role of the Remuneration Committee is to assist the Board in fulfilling its corporate governance responsibilities with regard to: The Company’s remuneration, recruitment, retention and termination policies for senior executives
including the CEO, CFO and other senior executives Remuneration policies for Non‐Executive Directors Executive equity grants
ASX Corporate Governance Recommendation 8.1 Remuneration Policy The Company’s Remuneration Policy is designed to ensure that the level and composition of remuneration is both competitive and reasonable. Remuneration is intimately connected to performance and is intended to be appropriate for the results delivered. The Company’s policies are designed to attract and maintain talented and motivated employees as well as raising the level of performance of the Company. ASX Corporate Governance Recommendation 8.1 Remuneration of executives RCG’s remuneration policy is designed to attract, motivate and retain employees, including senior executives, and ensure that the interests of the employees are aligned with those of the shareholders. In

14 2013 Annual Report
Corporate governance statement
discharging its duties, the Committee reviews and makes recommendations to the Board on the remuneration of the CEO, CFO, executive Directors and other senior managers, including: Short and long‐term remuneration, including both fixed remuneration and performance‐based
remuneration Any termination payments Appropriate grants of securities under the Employee Option Plan (or any alternate or replacement
plan)
In making its recommendations, the Committee ensures that: Remuneration is set with reference to prevailing market rates for similar positions, adjusted to
account for experience, productivity and ability Remuneration packages are designed to motivate senior executives to pursue the long‐term
growth and success of the Company A clear relationship exists between performance and remuneration
ASX Corporate Governance Recommendation 8.1 and 8.3
Remuneration Policies for Non‐Executive Directors Non‐executive Directors are remunerated by way of fees which are set with reference to the prevailing market rates. They do not participate in the schemes designed for the remuneration of executives, nor do they receive bonus payments or any retirement benefits other than statutory superannuation. A Director Option Plan has been established in which non‐executive Directors are entitled to participate, but any issue of options under that Plan must first be approved by shareholders.
ASX Corporate Governance Recommendation 8.3 and 8.4 Performance measurement for the CEO, CFO, Executive Directors and senior managers The Remuneration Committee is responsible for setting the performance criteria for Executive Directors and senior managers, communicating those criteria to the executives and for assessing their performance against those criteria. In setting and measuring Executive performance, the Remuneration Committee: Ensures that the interests of the employee and the shareholders are aligned Ensures that performance hurdles, targets and KPI’s are set so as to motivate the executives to
achieve measurable outcomes that progress the long term objectives of the Company. Conducts a performance review with the CEO and each of his direct reports at least once per annum
during the course of which at least the following topics are covered: The Executive’s performance relative to the KPI’s set at the previous review Any development objectives for the Executive flowing out of the review Revised or updated KPI’s for the next review period The amount of, and basis for, any increase in base remuneration The amount of, and basis for, any incentive or bonus awards
The aforementioned assessment was carried out for each of the executive Directors and each of the senior managers during the financial year. ASX Corporate Governance Recommendation 1.2 and 1.3 PROMOTING ETHICAL AND RESPONSIBLE DECISION‐MAKING Code of Conduct The RCG Code of Conduct (“Code”) is the RCG Group’s principal corporate governance policy. The Code governs the conduct of RCG and its subsidiaries and its directors, employees, consultants and all other people when they represent the Company. A copy of the Code has been posted on the Company’s website.

15 2013 Annual Report
Corporate governance statement
A summary of the key provisions of the Code is as follows: The Company, its employees and associates must comply, at all times, with all laws governing the
Company’s operations. They must also conduct the Company’s operations in keeping with the highest legal, moral and ethical standards.
All Employees must conduct the business of the Group with the highest level of ethics and integrity. Any breach of applicable laws, prevailing business ethics or other aspects of this Code will result in
disciplinary action. All Employees must report immediately any circumstances which may involve deviation from this
Code. Any Employee who deals with agents, contractors or consultants who represent the Group must
make them aware of this Code and that RCG expects them to conduct their business in accordance with this Code.
Senior Management and all Directors will be required to personally certify compliance with this Code on an annual basis.
All Employees are to be provided with a safe work environment that complies with the relevant Occupational Health and Safety laws.
Employees should not be placed in unnecessary danger nor be asked to carry out potentially dangerous tasks for which they have not been properly trained.
Employees are not to be discriminated against on the basis of their race, beliefs or gender. Employees are not to be harassed, bullied or enticed in an inappropriate, unethical or unlawful
manner. All Employees are entitled to fair and reasonable treatment by their supervisors and all other
Employees. Bribes, kickbacks, inducements or similar payments must not be made. Employees must not seek or accept any type of compensation, fee, commission or gratuity from a
third party in connection with the operations of the Group. Employees must not give, seek or accept any gift, entertainment or other personal favour or
assistance which goes beyond common courtesies associated with accepted ethical and general commercial practice.
Employees are responsible for taking all prudent steps to ensure the protection of Group assets and resources.
Employees must ensure that Group assets and resources are used only for the purposes of the Company and in accordance any appropriate authorisations.
Employees must not, without authority, directly or indirectly state that they are representing RCG or its public position in respect of any matter.
Employees must not directly or indirectly engage in any activity which could by association cause the Group public embarrassment or other damage.
Employees must not use their position for personal benefit independent from the business of the Company.
Employees must not take advantage of any property or information belonging to RCG. No Employee, or any family member or companion over which the Employee has influence, may
directly or indirectly have any equity interest in, or have a significant beneficial connection with, any business or individual which competes with, is a supplier, customer or franchisee of the RCG Group without the prior written consent of the Chairman or his nominee. Passive shareholdings in listed companies of not more than 5% are excluded from this provision.
Employees must not engage directly or indirectly in any outside business activity involving commercial contact with, or work for the benefit of, Group customers, franchisees, suppliers or competitors without the prior written consent of the Chairman or his nominee.
Employees have a duty to notify the Company Secretary of any actual or potential conflicts of interest.
Employees must not disclose confidential RCG Group information to any third party without the prior consent of a Director.

16 2013 Annual Report
Corporate governance statement
Employees must maintain the confidentiality of all Company documents and must not disclose any information contained within the documents to any third party without the prior consent of a Director.
Employees must not use Group information for the purpose of directly or indirectly obtaining personal gain.
Employees must abide by the “RCG Share Trading Policy” which forms part of these Corporate Governance Principles and Practices.
ASX Corporate Governance Recommendation 3.1 and 3.5 Diversity The Company has established a Diversity Policy, a copy of which is posted on its website. The Diversity Policy must be adhered to under the Code of Conduct. Diversity includes differences that relate to gender, age, ethnicity, disability, sexual orientation and cultural background. It also encompasses differences in background, life experience, style, skills, formal training and education and functional expertise. The Company is committed to establishing and actively encouraging diversity in its workforce. It recognises the benefits of a diverse workforce which brings together a range of skills, perspectives, talents and experience. The Company further recognises the importance of diversity at all levels of management in: driving business results; creating, implementing and refining business strategy; and attracting and protecting the Company’s most important asset, it’s people.
Our diversity policy is based on the following core principles: Meritocracy ‐ decisions about recruitment, development, promotion and remuneration are based
on performance and capabilities, and will be made fairly and transparently. Diversity ‐ a focused effort on promoting diversity is not inconsistent with a system based on
meritocracy. Diversity, if implemented correctly stands to enhance performance and capabilities of the Company.
Safety and support ‐ as a Company we do not tolerate unlawful discrimination, bullying or harassment and seek to provide a safe work environment by taking action against individuals that engage in, or practices which promote, those behaviours.
Work/life balance ‐ the Company recognises the need for flexibility in the workplace to accommodate the diverse needs of its workforce and their families and will consider practices such as flexible working hours and leave policies.
Business objectives ‐ our commitment to diversity is an integral part of our ambitions for the Company and its commercial success, by attracting and retaining exceptional individuals and developing those individuals into leaders within the business.
The Company is committed to creating a culture within the workplace that reflects the core principles of this diversity policy. Everyone within the Company has a responsibility to embrace the diversity principles within their own sphere of responsibility. Ideally, the standard of behaviour expected from the Board, Senior Management and the Company’s employees is as follows: the Board will endeavour to promote and drive diversity across the whole of business; the Senior Management will implement the diversity principles at a team level, and provide a work
environment where bullying, harassment and discrimination are not tolerated; and the employees are expected to work collaboratively and to treat their colleagues and customers
with respect, and at all times to be aware of the Company’s policies regarding diversity and to comply with those policies.
A matter of central importance in the Company’s diversity policy is enhancing the gender balance at all levels of the Company. In particular, the Company will endeavour to:

17 2013 Annual Report
Corporate governance statement
actively encourage women to apply for vacant positions; provide flexible working arrangements subject to operational requirements; and promote opportunities for selection and promotion in a manner designed to attract qualified
women.
ASX Corporate Governance Recommendation 3.2
As at end of the financial year, the total number of employees and the proportion of employees who were women are as follows:
Level Total employees % of women
Board 6 0%
Senior Management 10 20%
Other employees 132 62%
Total 148 57%
ASX Corporate Governance Recommendation 3.4 The Company does not have the resources or infrastructure to set, monitor or report on measurable objectives for achieving gender diversity, and as such does not comply with ASX Corporate Governance Recommendation 3.3. However, at each Board meeting, the Directors review a gender diversity report in order to ensure that the policy is being effectively implemented in order to ensure gender diversity across the business. ASX Corporate Governance Recommendation 3.3 & 3.5 Share Trading Policy The Company has established a Share Trading Policy for Dealing in Securities, a copy of which is posted on its website. The Share Trading Policy must be adhered to under the Code of Conduct. The purpose of the Share Trading Policy is to: Explain the types of conduct in dealing in securities that are prohibited under the Corporations Act
2001. Such prohibitions apply to all directors and employees of RCG and its related bodies corporate as defined in the Corporations Act (collectively the Group); and
Establish a best practice procedure for the buying and selling of securities that protects the Company and directors and employees against the misuse of unpublished information which could materially affect the value of securities.
The Share Trading Policy applies to all Relevant Persons. These are: All Directors and officers of RCG and its subsidiaries All employees with access to price sensitive information (Designated Officers) All employees of the group All persons defined as Connected Persons in relation to any of the above
The following restrictions are placed on dealing in the Company’s securities: A Relevant Person may not deal in the Company’s securities if they are in possession of price
sensitive information or if the Company is in possession of price sensitive information and has notified a Relevant Person that they may not deal in the Company’s securities

18 2013 Annual Report
Corporate governance statement
Directors and Designated Officers may not deal in the Company’s securities during a blackout period (the close of trade on the last day of each half and full year until the second day after the announcement of results), unless permission is granted under the exceptional circumstances provisions of the Policy
Relevant Persons must not deal in the Company’s securities on a short term trading basis. Short term trading includes buying and selling securities within a 3 month period, and entering into other short term dealings
Directors and Designated Officers may deal in securities of the Company if: Doing so would not contravene the provisions of any blackout as period described above; They have given written advice to the Chairman (in the case of directors) or the Company Secretary
(in the case of all other Designated Officers) of their intention to do so; The Chairman or the Company Secretary (as the case may be) has given written approval to deal;
and The securities are dealt with within 10 business days of the approval being granted.
Hedging of Company securities by a Relevant Person is subject to the following overriding prohibitions: the hedge transaction must not be entered into, renewed, altered or closed out when the Relevant
Person is in possession of inside information; Company securities must never be hedged prior to the vesting of those Company securities; and Company securities must never be hedged while they are subject to a holding lock or restriction on
dealing under the terms of an employee share plan operated by the Company.
Relevant Persons are otherwise permitted to hedge their Company securities on basis that the hedge transaction is treated as dealing in Company securities for the purposes of this policy, and all the aforementioned restrictions and permissions apply. MAKING TIMELY AND BALANCED DISCLOSURE Continuous Disclosure Policy The Company has established a Continuous Disclosure Policy, a copy of which is posted on its website. The objective of this policy is to ensure that the management and delivery of price sensitive information by RCG is done in a comprehensive and efficient manner that complies with the continuous disclosure obligations of the ASX Listing Rules and the Corporations Act. The overarching principle of this Policy is governed by Listing Rule 7.1 which requires the Company to immediately notify ASX of any information that a reasonable person would expect to have a material effect on the price or value of RCG’s quoted securities, provided that the information does not fall within the exception to disclosure under the Listing Rules. The Policy provides for the exceptions to Listing Rule 7.1 as outlined in Listing Rule 3.1A. The Board is responsible for ensuring that RCG complies with its continuous disclosure obligations. To this end, the Board is responsible for implementing and overseeing compliance with the Continuous Disclosure Policy. In practice, the Board delegates responsibility for making “routine” continuous disclosure to a Disclosure Sub‐Committee. The Disclosure Sub‐Committee comprises the Chairman, the CEO and the Company Secretary. Where disclosure is not “routine”, the input from all relevant board members is sought before disclosure is made. The Disclosure Sub‐Committee can and does seek outside expert advice in relation to disclosure matters from time to time. The Company Secretary is appointed and removed by the Board and is responsible for: Ensuring that RCG complies with the continuous disclosure obligations;

19 2013 Annual Report
Corporate governance statement
Communicating with ASX in relation to Listing Rule matters; Overseeing and co‐ordinating disclosure of information to ASX; Together with the CEO, co‐ordinating the disclosure of information to analysts, brokers,
shareholders, the media and the public; and Educating directors, officers and employees on RCG disclosure obligations, by reference to the
listing Rules and this Policy. ASX Corporate Governance Recommendation 5.1 and 5.2 RESPECTING THE RIGHTS OF SHAREHOLDERS Shareholder Communication Policy The Company has established a Shareholder Communication Policy, a copy of which is posted on its website. The purpose of the Shareholder Communication Policy is to promote effective communication with shareholders and encourage effective participation at General Meetings. The Company is committed to maintaining direct, open and timely communications with all shareholders. The Board’s policy is that shareholders are informed of all material developments that impact on the Company. Information is communicated to shareholders by the Company through: The publication of the annual and interim financial reports; Disclosures to the ASX and ASIC; Notices and explanatory memoranda of general meetings; Updates and announcements to inform shareholders of key matters of interest issued on a needs
basis; Presentations to analysts; and The Annual General Meeting.
The Company posts all the announcements it makes to the ASX on its website and makes them available for viewing for at least three years from the date of the announcement.
ASX Corporate Governance Recommendations 6.1 and 6.2

20 2013 Annual Report
Directors’ report
The Directors submit their report together with the financial statements of the consolidated entity, RCG Corporation Limited, being the Company and its controlled entities, for the financial year ended 30 June 2013, together with the auditors’ report thereon. DIRECTORS The names of the Company’s Directors in office who held office during the year and up to the date of this report are as below: Ivan Hammerschlag BCom, CTA Non‐Executive Chairman, Member of Remuneration Committee Ivan has had over 30 years of specialist retail experience, including as CEO and shareholder in Freedom Furniture prior to its IPO, growing the business from a small group of stores to a national chain. Ivan is also the Non‐Executive Chairman of Smartpay (Ltd) which is listed on the New Zealand Stock Exchange. Smartpay offers advanced payment and data management solutions for retail, business payment and transactional processing. Smartpay has applied for a dual listing on the Australian Stock Exchange. Ivan has also chaired, managed and invested in a number of other successful retail and other businesses. Hilton Brett BCom, PGDA Chief Executive Officer, Member of Audit Committee Hilton has extensive retailing and franchising experience and proven skills in maximizing opportunities in acquiring, growing, re‐engineering and selling businesses. Hilton was the former Chief Executive Officer of Vivien’s Jewellers and has managed and invested in a number of other successful businesses. Hilton, who has been an Executive director of RCG since 2006, was appointed CEO on 25 July 2012. Michael Hirschowitz BCom, BAcc, GAICD Finance Director & Company Secretary, Member of Audit Committee Michael joined The Athlete’s Foot in 1996 and worked in various capacities becoming Commercial Director in 2002. On the formation of RCG Corporation he became Chief Financial Officer. After filling several roles within the group since that time, Michael was appointed Finance Director on 1 July 2006 and was appointed as the Company Secretary on 14 March 2008. Michael Cooper MBA, GAICD Executive Director, Managing Director of The Athlete’s Foot Michael has been with The Athlete’s Foot since 1988, fulfilling a number of operational roles including management of store operations and the merchandising function. Michael was appointed Managing Director of The Athlete’s Foot in March 2002. He has overall responsibility for the day to day operations of all of RCG’s retail businesses. David Gordon BCom, LLB Non‐Executive Director, Chairman of Audit Committee and Remuneration Committee David was formerly a partner at Freehills law firm and is the principal of Lexicon Partners, a boutique advisory and investment business. David was appointed a Director of Ten Network Holdings Limited in April 2010. David has had over 25 years experience advising companies, funds and high net worth individuals on complex corporate and commercial transactions.

21 2013 Annual Report
Directors’ report
Stephen Kulmar Non‐Executive Director, Member of Remuneration Committee Steve is the former CEO and Chairman of IdeaWorks and is currently the CEO of Retail Oasis, a boutique retail marketing services company. Steve has over 30 years experience in advertising and has extensive experience in retail strategy, brand strategy, channel to market strategy, business re‐engineering and new retail business development. COMPANY SECRETARY Michael Hirschowitz DIRECTORS’ MEETINGS The number of meetings of the Company’s board of directors and of each board committee held during the year, and the number of meetings attended by each Director were:
Name
Full Board Audit Committee Rem. Committee
Eligible to
attend
No. Attended
Eligible to
attend
No. Attended
Eligible to
attend
No. Attended
Ivan Hammerschlag 4 4 ‐ ‐ 4 4
David Gordon 4 4 3 3 4 4
Hilton Brett 4 4 3 3 ‐ ‐
Michael Cooper 4 4 ‐ ‐ ‐ ‐
Michael Hirschowitz 4 4 3 3 ‐ ‐
Stephen Kulmar 4 4 ‐ ‐ 4 4
PRINCIPAL ACTIVITIES RCG Corporation is an investment holding company. It owns and operates The Athlete’s Foot Australia Pty Limited, Australia’s largest speciality retailer of athletic footwear and RCG Brands Pty limited, a wholesale and distribution company. RCG Brands has licences to distribute the Merrell, Cushe and CAT brands of footwear and apparel. OPERATING RESULTS The net profit for the financial year ended 30 June 2013 of the consolidated entity after providing for income tax was $6.19 million. Net profit after tax from continuing operations was $10.50 million. DIVIDENDS On 21 August 2013 the Company declared an ordinary fully franked dividend final dividend of 2.25 cents per share to be payable on 26 September 2013 to shareholders registered on the record date of 10 September 2013. On 22 March 2013, the Company paid an ordinary fully franked interim dividend of 1.75 cents per share. REVIEW OF OPERATIONS An overview of the operations of the Group is provided in the Chairman and CEO’s Review on page 3 of this report.

22 2013 Annual Report
Directors’ report
SIGNIFICANT CHANGES IN THE STATE OF AFFAIRS Shoe Superstore Group Pty Ltd was placed into Voluntary Administration on 20 February 2013. There were no other significant changes in the state of affairs of the consolidated entity during the financial year.
MATTERS SUBSEQUENT TO THE END OF THE FINANCIAL YEAR On 21 August 2013 the Company declared an ordinary fully franked final dividend of 2.25 cents per share to be paid on 26 September 2013 to shareholders registered on the record date of 10 September 2013. ENVIRONMENTAL ISSUES The Company and its subsidiaries operate primarily within the retail and wholesale sectors and conduct their business activities with respect for the environment while continuing to meet the expectations of shareholders, customers, employees and suppliers. During the year under review, the Directors are not aware of any particular or significant environmental issues which have been raised in relation to the consolidated entity’s operations. FUTURE DEVELOPMENTS All relevant future developments are outlined in the Chairman and CEO’s review on page 3. REMUNERATION REPORT Remuneration policy Remuneration policy is determined and executed on behalf of the board by the Remuneration Committee. The Remuneration Committee consists of David Gordon (Chairman), Stephen Kulmar and Ivan Hammerschlag, all non‐executive Directors. The Remuneration Committee makes recommendations to the Board on matters relating to remuneration for the entities within the consolidated group. The Remuneration Committee considers recruitment, retention and termination policies and procedures; non‐executive Directors’ remuneration; executive Directors and senior managements’ remuneration and incentive policy and awards; and contractual arrangements with senior managers and executives. More detail on the Company’s remuneration policy is provided in the Corporate Governance section on Page 12 of the Annual Report. The Group’s remuneration reviews take place at the end of the first quarter of each financial year. Prior to these reviews, the CEO makes recommendations to the Remuneration Committee regarding the remuneration of each of his direct reports and the overall remuneration framework for all employees. The Remuneration Committee and subsequently the Board, while all executive Directors are absent, meets to discuss the remuneration of the executive Directors. RCG Corporation’s remuneration policy is designed to attract, motivate and retain employees, while ensuring that the interests of employees are in line with the interests of shareholders. The Board recognises that the success of the Company hinges on the performance and abilities of its employees. Therefore, as a matter of policy, employees of the Group are remunerated on the following basis: Base remuneration Base remuneration is set with reference to prevailing market rates for similar positions, adjusted to account for the experience, ability and productivity of the individual employee. Base remuneration provides fixed remuneration on a total cost‐to‐company basis, which includes any fringe benefits to the employee as well

23 2013 Annual Report
Directors’ report
as superannuation at 9% of the base remuneration up to the statutory cap. Salary packaging options are available for some employees. Short Term Incentives (STI) The Board believes that well designed short term incentive plans are essential elements of remuneration as they provide tangible incentives for employees to strive for excellence. All employees are eligible to earn STI’s if they attain or exceed predetermined key performance indicators (KPI’s) specific to the roles they perform. The STI’s for all non‐store employees are linked to base remuneration and the maximum amount that can be earned is a fixed percentage of that base remuneration. Executive Directors and other senior management personnel are eligible for bonuses based on KPI’s set annually by the Remuneration Committee. The KPI’s are weighted for relative importance and then scored on a matrix of achievement. The resultant weighted score determines the extent to which each staff member becomes entitled to receive a bonus. Senior executives including the Executive Directors have a significant proportion of their STI tied directly to the achievement of pre‐determined profit targets, either for the Group as a whole or the relevant business unit or both as the case may be. During FY2013 the percentage of STI tied directly to these profit targets ranged between 40% and 45%. The remainder of the available STI is dependent on the relative score arising from achieving individual KPI’s relevant to each individual’s role. These KPI’s are a blend of quantitative and qualitative measures. The final scores for the quantitative measures are presented to the Remuneration Committee for sign off. The scores for the qualitative measures are assessed by the CEO and Finance Director and presented to the Remuneration Committee for review and sign off. Once the scores have been signed off by the Remuneration Committee they are fed into the performance matrix for each individual and are used as the basis for a performance review which takes place for all employees during the first quarter of each financial year. Long Term Incentives (LTI) The Company has implemented an LTI under the Employee Option Plan (EOP) and Employee Share Scheme (ESS). The purpose of these plans is to encourage employees to share in the ownership of the Company in order to promote the long‐term success of the Company as a goal shared by the employees and to align employees’ interest to that of shareholders. The EOP, which was implemented during the 2007 financial year, operates under the rules approved by shareholders at the 19 December 2006 Extraordinary General Meeting. A list of the options together with the exercise price and the vesting dates is provided in “Options held by Key Management Personnel” section of this remuneration report. There are currently 14,150,000 outstanding options issued under the Employee Option Plan. The ESS, which was implemented during the 2013 financial year, is a part of the Company’s long‐term retention and corporate alignment strategy. Details of the shares issued are provided in Note 27. There are currently 6,265,000 shares issued under the Employees Share Scheme. Remuneration of non‐executive Directors On an annual basis the Remuneration Committee considers the fees payable to non‐executive Directors. When considering the level of fees, the Committee undertakes a survey of the market and accesses independent advice as well as drawing on the knowledge and experience of its members. The remuneration committee makes recommendations on non‐executive Director fees to the Board. Non‐executive Directors can choose, subject to certain restrictions, the amount of their fees allotted to Superannuation. The Board believes that the remuneration policies in place align the interests of all employees with those of the Company’s shareholders while at the same time enabling the group to retain a high quality team of executives.

24 2013 Annual Report
Directors’ report
Remuneration of Key Management Personnel The following table sets out the details of the remuneration of Key Management Personnel of the Company: 2013
Share
based
payments
Cash, salary
and fees
Cash
Bonus (a)
Proportion
of cash
bonus paid
Other
Monetary
Benefits
Super‐
annuation
Retirement
Benefits
Issue of
Shares/
Options
$ $ % $ $ $ $ $
Ivan Hammerschlag 220,000 ‐ ‐ ‐ ‐ ‐ ‐ 220,000 ‐
David Gordon 65,000 ‐ ‐ ‐ 5,850 ‐ ‐ 70,850 ‐
Stephen Kulmar 45,000 ‐ ‐ ‐ 4,050 ‐ ‐ 49,050 ‐
Michael Cooper 322,289 17,325 25% 10,000 25,000 ‐ ‐ 374,614 0.0%
Michael Hirschowitz 305,788 23,500 35% 16,000 25,000 ‐ ‐ 370,288 0.0%
Hilton Brett 363,971 40,000 58% 10,000 25,000 ‐ 36,000 474,971 7.6%
Total 1,322,048 80,825 36,000 84,900 ‐ 36,000 1,559,773
Names of Key
Management
Personnel
Short‐term benefitsPost‐employment
benefits Total
Remun‐
eration
% of total
made as
share
based
payments
a) No amounts vest in future financial years in respect of the short term incentive bonus for the 2013 financial year.
2012
Share
based
payments
Cash, salary
and fees
Cash
Bonus (b)
Proportion
of cash
bonus paid
Other
Monetary
Benefits
Super‐
annuation
Retirement
Benefits
Issue of
Shares/
Options ‐
excluding
cancelled
options (a)
$ $ % $ $ $ $ $
Ivan Hammerschlag 259,850 ‐ ‐ ‐ ‐ ‐ ‐ 259,850 ‐
David Gordon 65,000 ‐ ‐ ‐ 5,850 ‐ ‐ 70,850 ‐
Stephen Kulmar 45,000 ‐ ‐ ‐ 4,050 ‐ ‐ 49,050 ‐
Michael Cooper 311,500 33,000 50% 10,000 25,000 ‐ 41,823 421,323 9.9%
Michael Hirschowitz 295,000 48,000 75% 16,000 25,000 ‐ 41,823 425,823 9.8%
Hilton Brett 311,500 66,000 100% 10,000 25,000 ‐ 41,823 454,323 9.2%
Total 1,287,850 147,000 36,000 84,900 ‐ 125,468 1,681,218
Names of Key
Management
Personnel
Short‐term benefitsPost‐employment
benefits Total
Remun‐
eration ‐
excluding
cancelled
options (a)
% of total
made as
share
based
payments ‐
excluding
cancelled
options (a)
a) During the 2012 financial year, 1,500,000 options allotted to each of Michael Cooper, Michael Hirschowitz and Hilton
Brett were cancelled for no consideration paid or payable to these executives. In accordance with the accounting standards, the cancellation of the options is accounted for as an acceleration of vesting and the unexpired value of $348,532 was recognised as an expense in the year. This share based payment is attributable to the Key Management Personnel as follows: Michael Cooper $116,177, Michael Hirschowitz $116,177 and Hilton Brett $116,177. These amounts are not reflected in the above table.
b) No amounts vest in future financial years in respect of the short term incentive bonus for the 2012 financial year.

25 2013 Annual Report
Directors’ report
Shares held by Key Management Personnel The number of shares in which the key management personnel of the Company hold a relevant interest is set out in the following table. 2013
Key Management
Personnel
Opening
Balance
1 July 2012
Exercise of
options (a)
Purchase/
(sale) of
shares
Closing
Balance on
30 June 2013
Value of
options on
exercise
date ($)
Ivan Hammerschlag 19,326,395 ‐ ‐ 19,326,395 ‐
David Gordon 18,887,301 ‐ ‐ 18,887,301 ‐
Stephen Kulmar 2,400,000 ‐ ‐ 2,400,000 ‐
Michael Cooper 15,729,313 ‐ ‐ 15,729,313 ‐
Michael Hirschowitz 13,829,313 ‐ ‐ 13,829,313 ‐
Hilton Brett 8,466,666 3,000,000 ‐ 11,466,666 36,000
Total 78,638,988 3,000,000 ‐ 81,638,988 36,000 a) On 28 February 2013 Hilton Brett was granted a loan for $900,000, pursuant to a resolution passed at the AGM on 23
November 2012, to fund the exercising of 3,000,000 employee options. The loan is to be repaid before 28 February 2016. Interest on the loan will be equivalent to any dividends payable on the shares acquired under the loan. The Company’s recourse is limited to the shares.
2012
Key Management
Personnel
Opening
Balance
26 June 2011
Exercise of
options
Sale of
shares
Closing
Balance on
1 July 2012
Value of
options on
exercise
date ($)
Ivan Hammerschlag 19,326,395 ‐ ‐ 19,326,395 ‐
David Gordon 18,887,301 ‐ ‐ 18,887,301 ‐
Stephen Kulmar 2,400,000 ‐ ‐ 2,400,000 ‐
Michael Cooper 14,229,313 2,000,000 (500,000) 15,729,313 108,200
Michael Hirschowitz 11,329,313 3,000,000 (500,000) 13,829,313 162,300
Hilton Brett 8,966,666 ‐ (500,000) 8,466,666 ‐
Total 75,138,988 5,000,000 (1,500,000) 78,638,988 270,500 Table of Employee Options and shares under Employee Share Scheme The number of employee options and shares under the Employee Share Scheme (ESS) in which the key management personnel and other employees held a relevant interest on 30 June 2013, is set out in the following table.

26 2013 Annual Report
Directors’ report
2013 2012 2013 2012
Hilton Brett 14/03/08 1/02/09 5 years 0.345 ‐ 1,000,000 ‐ 1,000,000 1,000,000 ‐
Hilton Brett 14/03/08 1/02/10 5 years 0.345 ‐ 1,000,000 ‐ 1,000,000 1,000,000 ‐
Hilton Brett 14/03/08 1/02/11 5 years 0.345 ‐ 1,000,000 ‐ 1,000,000 1,000,000 ‐
Hilton Brett (a)
28/03/13 28/03/16 3 years 0.345 3,000,000 ‐ 3,000,000 ‐ ‐ 3,000,000
3,000,000 3,000,000 3,000,000 3,000,000 3,000,000 3,000,000
Other employees 17/04/07 Various 5 years 0.172 ‐ 200,000 ‐ 200,000 200,000 ‐
Other employees 28/05/09 Various 5 years 0.307 1,000,000 1,000,000 ‐ 500,000 ‐ 1,000,000
Other employees 4/01/10 Various 5 years 0.452 6,500,000 6,500,000 ‐ 2,900,000 ‐ 6,500,000
Other employees 23/08/10 Various 5 years 0.589 2,600,000 2,600,000 ‐ 650,000 ‐ 2,600,000
Other employees 24/08/11 Various 5 years 0.570 2,550,000 2,550,000 ‐ ‐ ‐ 2,550,000
Share Sale options 14/12/10 30/06/15 6 years 0.660 1,500,000 1,500,000 ‐ ‐ ‐ 1,500,000
Other employees 28/02/13 Various 5 years 0.490 6,265,000 ‐ ‐ ‐ ‐ 6,265,000
Total 23,415,000 17,350,000 3,000,000 7,250,000 3,200,000 23,415,000
Number of Options/
shares Outstanding
Number of Options
Vested Options
exercised/
cancelled in
2013
Number of
options/
shares
outstanding
on 21 Aug
2013
Total held by key management personnel
Name Issue dateVesting
date
Exercise
date No.
of years
from
issue
Exercise
Price and
option
fee $
a) On 28 February 2013 Hilton Brett was granted a loan for $900,000, pursuant to a resolution passed at the AGM on 23
November 2012, to fund the exercising of 3,000,000 employee options. The loan is to be repaid before 28 February 2016. Interest on the loan will be equivalent to any dividends payable on the shares acquired under the loan. The Company’s recourse is limited to the shares
b) On 1 August 2012 200,000 options were exercised for a total consideration of $24,000.
c) The aggregate amount receivable by the Company should all remaining options and shares be exercised and paid for is
$10.68 million.
Fair value of options/shares issued during the year During the year shares were issued under the ESS to employees and are held in escrow until certain vesting conditions are met. The shares were issued at market value at the date of the offer and the Company provided employees with a limited recourse loan to acquire the shares. Interest on the loan is equivalent to the value of franked dividends paid in respect of the shares.
Other employees 28/02/13 6,265,000 0.13 795,083
Total 6,265,000 795,083
Name Issue date
Fair value
on issue
date ($)
Total fair
value on issue
date ($)
Shares
issued
(No.)
Employment Contracts for Key Management Personnel None of the Key Management Personnel is employed under an employment contract. Relationship between the remuneration policy and company performance The following table shows the gross revenue, profits and dividends for the last five years for the listed entity, as well as the share price and market capitalisation at the end of the respective financial years.

27 2013 Annual Report
Directors’ report
2009 2010 2011 2012 2013
Revenue (A$’000) 21,997 30,445 42,339 43,135 51,513
Net profit from continuing operations (A$’000) 5,258 6,865 8,937 9,528 10,515
Net profit attributable to the parent entity (A$’000) 5,258 6,865 8,937 9,188 5,838
Dividends (A$’000) 8,682 1,760 8,339 7,311 8,642
Share price at year‐end (cents per share) 37.0 50.0 59.0 34.0 55.0
Number of shares on issue ('000) 190,829 234,648 238,248 242,078 242,278
Market capitalisation (A$'000) 70,607 117,324 140,566 82,307 133,253 The table above shows that there has been a general trend of increasing net profit from continuing operations. The share price is subject to share market volatility and is beyond the control of the Company. The board is of the opinion that these results can be attributed in part to the previously described remuneration policy and is satisfied that it has contributed in increasing shareholder wealth over the past five years. Share Trading Policy The Company has established a Share Trading Policy, a copy of which is posted on its website. The Share Trading Policy must be adhered to under the Code of Conduct. The purpose of the Share Trading Policy is to: Explain the types of conduct in dealing in securities that are prohibited under the Corporations Act
2001. Such prohibitions apply to all directors and employees of RCG and its related bodies corporate as defined in the Corporations Act (collectively the Group); and
Establish a best practice procedure for the buying and selling of securities that protects the Company and directors and employees against the misuse of unpublished information which could materially affect the value of securities.
The Share Trading Policy applies to all Relevant Persons. These are: All Directors and officers of RCG and its subsidiaries All employees with access to price sensitive information (Designated Officers) All employees of the group All persons defined as Connected Persons in relation to any of the above
The following restrictions are placed on dealing in the Company’s securities: A Relevant Person may not deal in the Company’s securities if they are in possession of price
sensitive information or if the Company is in possession of price sensitive information and has notified a Relevant Person that they may not deal in the Company’s securities
Directors and Designated Officers may not deal in the Company’s securities during a blackout period (the close of trade on the last day of each half and full year until the second day after the announcement of results), unless permission is granted under the exceptional circumstances provisions of the Policy
Relevant Persons must not deal in the Company’s securities on a short term trading basis. Short term trading includes buying and selling securities within a 3 month period, and entering into other short term dealings
Directors and Designated Officers may deal in securities of the Company if: Doing so would not contravene the provisions of any blackout as period described above; They have given written advice to the Chairman (in the case of directors) or the Company Secretary
(in the case of all other Designated Officers) of their intention to do so; The Chairman or the Company Secretary (as the case may be) has given written approval to deal;
and

28 2013 Annual Report
Directors’ report
The securities are dealt with within 10 business days of the approval being granted.
Hedging of Company securities by a Relevant Person is subject to the following overriding prohibitions: the hedge transaction must not be entered into, renewed, altered or closed out when the Relevant
Person is in possession of inside information; Company securities must never be hedged prior to the vesting of those Company securities; and Company securities must never be hedged while they are subject to a holding lock or restriction on
dealing under the terms of an employee share plan operated by the Company.
Relevant Persons are otherwise permitted to hedge their Company securities on basis that the hedge transaction is treated as dealing in Company securities for the purposes of this policy, and all the aforementioned restrictions and permissions apply. Other transactions with specified employees and personally related entities Transactions, if any, with specified employees and their personally related entities are conducted on arm’s length terms and conditions. There are also transactions which are deemed trivial or domestic in nature being in the nature of shopping in our company stores. INSURANCE OF OFFICERS AND AUDITORS During the financial year the company paid a premium in respect of a contract insuring the directors of the Company, the company secretary and all executive officers of the company and any related body corporate, against a liability incurred as such a director, company secretary and executive officer to the extent permitted by the Corporations Act 2001. The contract of insurance prohibits disclosure of the nature of the liability and the amount of the premium. The Company has not, during or since the financial year, indemnified or agreed to indemnify the auditor or any related entity against a liability incurred by the auditor. During the financial year the Company has not paid a premium in respect of a contract to insure the auditor of the Company or a related entity. PROCEEDINGS ON BEHALF OF THE COMPANY No person has applied to the Court under S237 of the Corporations Act 2001 for leave to bring proceedings on behalf of the Company, or intervene in any proceedings to which the Company is a party, for the purpose of taking responsibility on behalf of the Company for all or any part of those proceedings. During the year no proceedings were brought or intervened in on behalf of the Company with leave of the Court under S237 of the Corporations Act 2001. NON‐AUDIT SERVICES The Company may employ its auditors to conduct assignments that are in addition to their statutory audit duties where the auditors’ expertise and knowledge of the Consolidated Entity is relevant. The board of directors, in accordance with advice from the audit committee, is satisfied that the provision of non‐audit services by Deloitte Touche Tohmatsu during the year is compatible with the general standard of independence for auditors imposed by the Corporations Act 2001. The Directors are satisfied that the provision of these services did not compromise the external auditor’s independence because the nature of the services provided do not compromise the general principles relating to auditor independence as set out

29 2013 Annual Report
Directors’ report
in APES 110: Code of Ethics for Professional Accountants issued by the Accounting Professional and Ethical Standards Board. Amounts paid or accrued for non‐audit services during the year were $11,100 (2012: $4,000). These amounts are in respect of accounting and other advisory services.
AUDITOR’S INDEPENDENCE DECLARATION A copy of the auditor’s independence declaration as required under S307C of the Corporations Act 2001 is set out on page 30. CORPORATE GOVERNANCE In recognising the need for the highest standards of corporate behaviour and accountability, the Directors of RCG Corporation Limited support and have adhered to the principles of corporate governance. The Company’s Corporate Governance Statement is set out on pages 7 to 19. ROUNDING OFF OF AMOUNTS The Company is a company of the kind referred to in Class Order 98/100 issued by the Australian Securities and Investments Commission, and in accordance with that Class Order amounts in the directors’ report and in the financial statements are rounded off to the nearest thousand dollars, or in certain cases, to the nearest dollar. Signed in accordance with a resolution of the Board of Directors for and on behalf of the Directors by: Ivan Hammerschlag Hilton Brett Chairman CEO 21 August 2013 21 August 2013

30 2013 Annual Report
Auditor’s independence declaration

31 2013 Annual Report
Consolidated statement of profit or loss and other comprehensive income
for the f inancial year ended 30 June 2013
2013 2012
Note $'000 $'000
Continuing operations
Revenue 4 51,513 43,135
Finished goods used (13,773) (17,505)
Changes in merchandise inventories (1,415) 5,176
Employee benefits expense (10,334) (8,498)
Rental expenses on operating leases (2,414) (1,611)
Advertising and promotion expenses (1,576) (1,227)
Travel and telecommunications expenses (946) (873)
Warehouse and freight expenses (2,100) (1,545)
Depreciation and amortisation expense (900) (561)
Provision for doubtful debts (66) (89)
Finance costs (198) (90)
Other expenses (2,758) (2,598)
Profit before income tax 15,033 13,714
Income tax expense 6 (4,518) (4,186)
Profit for the year from continuing operations 5 10,515 9,528
Discontinued operations
Loss for the year from discontinued operations 32 (4,677) (340)
Profit attributable to the members of the company 5,838 9,188
Other comprehensive income for the year net of tax
Items that will be reclassified to profit or loss:
73 22
Net gain on foreign exchange hedges 380 604
Total comprehensive income for the year 6,291 9,814
Earnings per share
From continuing and discontinued operations
Basic earnings per share (cents per share) 25 2.41 3.80 Diluted earnings per share (cents per share) 25 2.39 3.78
From continuing operations:
Basic earnings per share (cents per share) 25 4.34 3.94
Diluted earnings per share (cents per share) 25 4.31 3.92
Dividends paid
Dividends (cents per shares) 23 3.50 3.00
Exchange differences on translation of foreign operations
The accompanying notes form an integral part of these Consolidated Financial Statements.

32 2013 Annual Report
Consolidated statement of financial position as at 30 June 2013
2013 2012
Note $'000 $'000
Current Assets
Cash and cash equivalents 7 14,785 14,464
Trade and other receivables 8 9,016 7,171
Inventories 9 8,455 11,910
Financial assets 19 493 ‐
Other current assets 10 1,336 1,306
Total current assets 34,085 34,851
Non‐current Assets
Property, plant and equipment 12 4,202 4,935
Intangible assets 13 17,495 18,535
Deferred tax assets 14 937 569
Total non‐current assets 22,634 24,039
TOTAL ASSETS 56,719 58,891
Current Liabilities
Trade and other payables 15 6,656 7,357
Borrowings 16 2,066 1,354
Current tax liabilities 17 1,323 1,161
Short‐term provisions 18 1,159 1,132
19 ‐ 49
20 231 231
Total current liabilities 11,435 11,284
Non‐current Liabilities
Long‐term provisions 18 184 381
Other liabilities 20 175 344
Total non‐current liabilities 359 725
TOTAL LIABILITIES 11,794 12,009
NET ASSETS 44,925 46,882
Equity
Issued capital 22 63,637 63,468
Reserves 21 3,095 2,417
Accumulated losses (21,807) (19,003)
TOTAL EQUITY 44,925 46,882
Financial liabilities
Other liabilities
The accompanying notes form an integral part of these Consolidated Financial Statements.

33 2013 Annual Report
Consolidated statement of changes in f inancial year ended 30 June 2013
Issued
Capital Issued
Foreign
Currency
Share
Plan Hedge
Accum‐
ulated Total
No. in Capital Reserves Reserve Reserve Losses
000 $'000 $'000 $'000 $'000 $'000 $'000
Balance at 26 June 2011 238,248 62,711 (118) 2,074 (639) (20,880) 43,148
Shares issued during the year
Exercise of options 5,500 660 ‐ ‐ ‐ ‐ 660
Capitalised option fees ‐ 196 ‐ ‐ ‐ ‐ 196
Buyback of shares (1,670) (239) ‐ ‐ ‐ ‐ (239)
Proceeds from shares issued to employees ‐ 140 ‐ ‐ ‐ 140
Directors and Employees Options Plan ‐ ‐ ‐ 474 ‐ ‐ 474
‐ ‐ ‐ ‐ ‐ 9,188 9,188
‐ ‐ 22 ‐ 604 ‐ 626
‐ ‐ 22 ‐ 604 9,188 9,814
Dividends paid or provided for ‐ ‐ ‐ ‐ ‐ (7,311) (7,311)
Balance at 01 July 2012 242,078 63,468 (96) 2,548 (35) (19,003) 46,882
Balance at 01 July 2012 242,078 63,468 (96) 2,548 (35) (19,003) 46,882
Shares issued during the year
Exercise of options (a)
200 24 ‐ ‐ ‐ ‐ 24
Exercise of options (b)
3,000 ‐ ‐ ‐ ‐ ‐ ‐
Capitalised option fees (c)
‐ 145 ‐ ‐ ‐ ‐ 145
Issue under Employee Share Scheme (d)
6,265 ‐ ‐ ‐ ‐ ‐ ‐
Treasury shares (e)
(9,265) ‐ ‐ ‐ ‐ ‐ ‐
Payment for ELTIP shares ‐ ‐ ‐ ‐ ‐ ‐ ‐
Directors and Employees Options Plan ‐ ‐ ‐ 225 ‐ ‐ 225
‐ ‐ ‐ ‐ ‐ 5,838 5,838
‐ ‐ 73 ‐ 380 ‐ 453
‐ ‐ 73 ‐ 380 5,838 6,291
Dividends paid or provided for (f)
‐ ‐ ‐ ‐ ‐ (8,642) (8,642)
Balance at 30 June 2013 242,278 63,637 (23) 2,773 345 (21,807) 44,925
Profit for the year
Other Comprehensive Income for the year net of tax
Total Comprehensive Income
Profit for the year
Other Comprehensive Income for the year net of tax
Total Comprehensive Income
a) 200,000 options were exercised on 1 August 2012. b) A further 3,000,000 options were exercised on 28 February 2013.The exercise price was funded by a loan granted
by the Company. The Company’s recourse is limited to the shares. Interest on the loan is equivalent to the value of dividends paid in respect of the shares.
c) Under the option plans approved by the shareholders at the Extraordinary General Meeting held on 19 December 2006, the company provided loans to option recipients in respect of the option fees payable for the right to acquire the options. Under the accounting standards both the loans and the corresponding movement in equity are only recognised in the financial statements when the options are exercised. During the period a number of employees and directors exercised vested options and the increase in equity in respect of the relevant option fees has been recognised.
d) On 28 February 2013, 6,265,000 shares were issued to employees under the Employee Share Scheme. The shares were issued at market value at the date of the offer and the Company provided employees with a limited recourse loan to acquire the shares. Interest on the loan is equivalent to the value of dividends paid in respect of the shares.
e) The shares in points (b) and (d) above are held in escrow until certain conditions are met and are treated as treasury shares.
f) The Company declared an ordinary fully franked dividend of 1.75 cents per share on 21 August 2012. This was paid on 28 September 2012. On 20 February 2013, the Company declared an ordinary fully franked interim dividend of 1.75 cents per share. This was paid on 22 March 2013.
The accompanying notes form an integral part of these Consolidated Financial Statements.

34 2013 Annual Report
Consolidated statement of cash flows for the f inancial year ended 30 June 2013
2013 2012
Note $'000 $'000
CASH FLOWS FROM OPERATING ACTIVITIES
Receipts from customers and franchisees 59,312 58,268
Interest received 784 1,171
Payments to suppliers and employees (42,825) (47,706)
Payments for operating leases (2,655) (3,147)
Net income tax paid (3,936) (3,402)
Net cash provided by operating activities 10,680 5,184
CASH FLOWS FROM INVESTING ACTIVITIES
Net cash outflow from discontinued operation (610) ‐
Payment for property, plant and equipment (1,987) (2,692)
Net cash used in investing activities (2,597) (2,692)
CASH FLOWS FROM FINANCING ACTIVITIES
Trade finance facility 712 1,354
Net proceeds from issue of shares 168 996
Buyback of shares ‐ (239)
Dividends paid (8,642) (7,311)
Net cash used in financing activities (7,762) (5,200)
Net increase/(decrease) in cash held 321 (2,708)
Cash at beginning of the period 14,464 17,172
Cash at end of the period 14,785 14,464
The accompanying notes form an integral part of these Consolidated Financial Statements.

35 2013 Annual Report
Notes to the financial statements forming part of the f inanc ia l statements for the f inancia l year ended 30 June 2013
1. SIGNIFICANT ACCOUNTING POLICIES The financial statements of RCG Corporation Limited covering the period from 1 July 2012 to 30 June 2013 were authorised for issue in accordance with a resolution of the Board of Directors on 21 August 2013. RCG Corporation Limited is an investment holding company. It currently owns The Athlete’s Foot, a well established mid‐sized specialty retailer, which has a distinctive position and competitive advantage in its market; and RCG Brands, which manages the distribution of Merrell, Cushe and Caterpillar brand of outdoor, comfort, active lifestyle, performance footwear, work footwear, and apparel. The company also owns RCG Retail, which manages retail stores for the Merrell brand. Basis of Preparation These general purpose financial statements have been prepared in accordance with Australian Accounting Standards, other authoritative pronouncements of the Australian Accounting Standards Board, Australian Accounting Interpretations and the Corporations Act 2001. The financial statements comply with Australian equivalents to International Financial Reporting Standards (AIFRS) in their entirety ensuring that the financial statements and notes also comply with the International Financial Reporting Standards. The financial statements cover the consolidated entity of RCG Corporation Limited. RCG Corporation Limited is a listed public company incorporated and domiciled in Australia. For the purposes of preparing the consolidated financial statement, the Company is a for‐ profit‐ entity.
The financial statements have been prepared on an accrual basis and are based on historical costs modified by the revaluation of certain non‐current assets, financial assets and financial liabilities for which the fair value basis of accounting has been applied. Principles of Consolidation A controlled entity is any entity controlled by the Company. Control exists where the Company has the capacity to dominate the decision‐making in relation to the financial and operating policies of another entity so that the other entity operates with the Company to achieve the objectives of the Company. The consolidated entity comprises the Company and its controlled entities. A list of controlled entities is contained in Note 11 of the financial statements. Subsidiaries are included in the consolidated entity from the date that control commences until the date control ceases. All intercompany balances and transactions between the entities in the consolidated entity, including any unrealised profits or losses have been eliminated on consolidation. All subsidiaries have the same year end. Financial Assets and Financial Liabilities Financial assets and financial liabilities are initially recognised at fair value on the Statement of Financial Position when the consolidated entity becomes party to the contractual provisions of the financial instrument. Subsequent to initial recognition these instruments are measured as set out below. A financial asset is de‐recognised when the contractual rights to the cash flows from the financial assets expire or are transferred and no longer controlled by the entity. A financial liability is removed from the Statement of Financial Position when the obligation specified in the contract is discharged or cancelled or expires. Loans and receivables are non‐derivative financial assets with fixed or determinable payments that are not quoted in an active market and are measured at amortised cost using the effective interest method.

36 2013 Annual Report
Notes to the financial statements forming part of the f inanc ia l statements for the f inancia l year ended 30 June 2013
Available‐for‐sale financial assets include other financial assets, not included in the above categories. Available‐for‐sale financial assets are reflected at fair value. Unrealised gains and losses arising from changes in fair value are taken directly to equity. Financial liabilities comprise trade and other payables and borrowings and are measured at amortised cost using the effective interest method. Trade accounts payable represent the principal amounts outstanding at balance date plus, where applicable, any accrued interest. The amortised cost of a financial asset or a financial liability is the amount initially recognised minus principal repayments, plus or minus cumulative amortisation of any difference between the initial amount and maturity amount and minus any write‐down for impairment or doubtful collections. Inventories Finished goods and raw materials are stated at lower of cost and net realisable value. Costs are calculated on “first‐in first‐out” or “weighted average” basis and include duty and other inward charges. Net realisable value is the estimated selling price in the ordinary course of business, less the estimated costs of completion and selling costs. Property, plant and equipment Property, plant and equipment is recorded at cost, less any accumulated depreciation or impairment loss. The profit or loss on disposal of all property, plant and equipment is determined as the difference between the carrying amount of the asset at the time of disposal and the proceeds thereof and is included in the profit before income tax in the Statement of profit or loss and other comprehensive income in the year of disposal. The carrying amount of property, plant and equipment is reviewed annually by directors to ensure it is not in excess of the recoverable amount from those assets. The recoverable amount is assessed on the basis of the expected net cash flows, which will be received from the asset’s employment and subsequent disposal. The expected net cash flows have been discounted to present values in determining recoverable amounts. Depreciation Items of property, plant and equipment are depreciated at rates based upon their expected economic life using the straight line method. The depreciation or amortisation rates used for each class of assets are as follows: Plant and equipment 12.5%‐20%
Leases Leases are classified at their inception as either operating or finance leases based on the economic substance of the agreement so as to reflect the risks and benefits incidental to ownership. Where substantially all the risks and benefits incidental to the ownership of a leased fixed asset, but not the legal ownership, are transferred to the consolidated entity, these leases are classified as finance leases. Finance leases are capitalised as an asset and a liability at their fair value at the inception of the lease or, if lower, at the present value of the minimum lease payments, including any guaranteed residual value. Leased assets are amortised on a straight line basis over their estimated useful lives where it is likely that the consolidated entity will obtain ownership of the asset, or over the term of the

37 2013 Annual Report
Notes to the financial statements forming part of the f inanc ia l statements for the f inancia l year ended 30 June 2013
lease. Lease payments are allocated between the lease interest expense for the period and the reduction of the lease liability. Lease payments for operating leases, where substantially all the risks and benefits remain with the lessor, are charged as expenses on straight line basis. Lease incentives under operating leases are recognised as a liability and amortised on a straight line basis over the life of the lease term. Foreign Currency Translation Functional and presentation currency Items included in the financial statements are measured using the currency of the primary economic environment in which the entity operates (‘the functional currency’). The consolidated financial statements are presented in Australian dollars, which is RCG Corporation Limited’s functional and presentation currency. Transactions and balances Foreign currency transactions are converted to Australian currency at the rates of exchange applicable at the dates of the transactions. Amounts receivable and payable in foreign currencies at reporting date are converted at the rates of exchange ruling at that date. Exchange differences arising on the translation of non‐monetary items are recognised directly in equity to the extent that the gain or loss is directly recognised in equity; otherwise the exchange difference is recognised in profit or loss.
Income Tax Deferred tax is based upon temporary differences arising between the tax bases of assets and liabilities and their carrying amounts in the financial statements whereby: • the tax consequences of recovering (settling) all assets (liabilities) are reflected in the financial
statements; • current and deferred tax is recognised as income or expense except to the extent that the tax
relates to equity items or to a business combination; • a deferred tax asset is recognised to the extent that it is probable that future taxable profit will be
available to realise the asset; • deferred tax assets and liabilities are measured at the tax rates that are expected to apply to the
period when the asset is realised or the liability settled. The charge for current income tax expenses is based on the profit for the year adjusted for any non‐ assessable or disallowed items. It is calculated using tax rates that have been enacted or substantively enacted by the reporting date.
Deferred tax is calculated at the tax rates that are expected to apply to the period when the asset is realised or liability is settled. Deferred tax is recognised in profit or loss except where it relates to items that may be recognised directly to equity, in which case the deferred tax is adjusted directly against equity. Deferred income tax assets are recognised to the extent that it is probable that future tax profits will be available against which deductible temporary differences can be utilised.

38 2013 Annual Report
Notes to the financial statements forming part of the f inanc ia l statements for the f inancia l year ended 30 June 2013
Employee Entitlements Provision has been made for the consolidated entity’s liability for employee entitlements arising from services rendered by employees to reporting date. Employee entitlements expected to be settled within one year together with entitlements arising from wages and salaries and annual leave which will be settled after one year, have been measured at amounts expected to be paid when the liability crystallises plus related on‐costs. Other employee entitlements including long service leave payable later than one year have been measured at the present value of the estimated future cash outflows to be made for those entitlements. Contributions are made to an employee superannuation fund and are charged as expenses when incurred. Impairment of assets At each reporting date, the consolidated entity reviews the carrying values of its tangible and intangible assets to determine whether there is any indication that those assets have been impaired. If such indication exists, the recoverable amount of the asset, being the higher of asset’s fair value less cost to sell and value in use, is compared to the asset’s carrying value. Any excess of the asset’s carrying value over its recoverable value is expensed to profit or loss. In assessing value in use, the estimated future cash flows are discounted to their present value using a pre‐tax discount rate. Intangibles Goodwill Goodwill and goodwill on consolidation, representing the excess of the cost of acquisition over the fair value of the identifiable net assets acquired, is recognised as an asset and not amortised, as it has an indefinite useful life, but tested for impairment annually. Wherever there is an indication that the goodwill may be impaired any impairment is recognised immediately in profit or loss. Trademarks Trademarks are recognised at cost of acquisition. Trademarks have an infinite life and are carried at cost less any accumulated impairment loss. Trademarks are tested for impairment annually and wherever there is an indication that it may be impaired, any impairment is recognised immediately in profit or loss. TAF License Fee TAF Licence fee intangible arose on the acquisition of a 249 year royalty‐free licence for the use of the TAF branding and trademarks. This intangible is being amortised on a straight line basis over the license term. This intangible is tested for impairment annually and wherever there is an indication that it may be impaired, any impairment is recognised immediately in profit or loss. Other intangible assets Other intangible assets include amounts pertaining to the development of the larger formatted TAF stores. Other intangible assets also include amounts relating to the setup of the Merrell brand. These intangibles are projected to have a useful life of 5 years and are amortised on a straight line basis over this period. These intangibles are tested for impairment annually and wherever there is an indication that they may be impaired, any impairment is recognised immediately in the profit or loss.
Cash and Cash Equivalents Cash and cash equivalents includes cash on hand, cash in banks and money market investments convertible readily to cash within two working days, net of outstanding bank overdrafts. Dividends Dividends payable are recognised at the reporting date where the dividends are declared, determined or publicly recommended prior to the reporting date.

39 2013 Annual Report
Notes to the financial statements forming part of the f inanc ia l statements for the f inancia l year ended 30 June 2013
Revenue Sale of Goods This comprises revenue earned from sale of goods to customers, net of actual returns, and is recognised when control of the goods passes to the customer. Lay‐by sales are recognised after the final payment is received from the customer.
Franchise Royalty Income Franchise royalty income is recognised as income in the period the sales are recorded by the franchisees.
Franchise Fees Franchise fees are recognised as income in the period when all services are completed and the franchise store opens. Supplier Rebate Supplier rebates, on the purchases made by franchisees, are accounted for on an accrual basis and are recognised as income in the same period as the supplier invoices to which they relate. Finance Income Interest earned on term deposits is accounted for on an accrual basis.
All revenue is stated net of the amount of goods and service tax.
Contributed Equity Issued and paid up capital is recognised at the fair value of consideration received by the Company and classified as equity. Any transaction costs arising on the issue of ordinary shares are recognised directly in equity as a reduction of the share proceeds received, net of any tax effects. Receivables Receivable amounts include sales/royalty receipts not yet collected from customers and purchase rebates due from suppliers, which remain unpaid at reporting date, and are carried at the nominal amount. Amounts outstanding are generally recovered within sixty days of invoicing and the collectability of unpaid amounts is assessed at reporting date to determine whether a provision for doubtful debts is required. Bad debts are written off as incurred. Receivables from related parties are recognised and carried at the nominal amount due.
Payables Liabilities for trade creditors and other amounts are recognised at cost, which is the fair value of the consideration to be paid in the future for the inventories and other goods or services received, whether or not billed to the consolidated entity at reporting date. Trade accounts payable are non‐interest bearing and are normally settled on due dates. Earnings per share (EPS) Basic EPS is calculated as net profit attributable to members of the Company, divided by the weighted average number of ordinary shares adjusted for any bonus element. Diluted EPS is calculated as net profit attributable to members of the Company, adjusted for: the after tax effect of dividends and interest associated with dilutive potential ordinary shares that
have been recognised as expenses; and

40 2013 Annual Report
Notes to the financial statements forming part of the f inanc ia l statements for the f inancia l year ended 30 June 2013
other non‐discretionary changes in revenues or expenses during the period that would result from dilution of potential ordinary shares
divided by the weighted average number of ordinary shares and dilutive potential ordinary shares, adjusted for any bonus element. Business Combinations The acquisition method of accounting is used to account for business combinations regardless of whether equity instruments or other assets are acquired. The consideration transferred is the sum of the acquisition‐date fair values of the assets transferred, equity instruments issued or liabilities incurred by the acquirer to former owners of the acquired. For each business combination, the non‐controlling interest in the acquiree is measured at either fair value or at the proportionate share of the fair value of the acquiree's identifiable net assets. All acquisition costs are expensed as incurred. On the acquisition of a business, the consolidated entity assesses the financial assets acquired and liabilities assumed for appropriate classification and designation in accordance with the contractual terms, economic conditions, the consolidated entity's operating or accounting policies and other pertinent conditions in existence at the acquisition‐date.
Where the business combination is achieved in stages, the consolidated entity remeasures its previously held equity interest in the acquiree at the acquisition‐date fair value and the difference between the fair value and the previous carrying amount is recognised In profit or loss, Contingent consideration to be transferred by the acquirer is recognised at the acquisition‐date fair value. Subsequent changes in the fair value of contingent consideration classified as an asset or liability are recognised in profit or loss. Contingent consideration classified as equity is not remeasured and its subsequent settlement is accounted for within equity. The difference between the acquisition‐date fair value of assets acquired, liabilities assumed and any non‐controlling interest in the acquiree and the fair value of the consideration transferred and the fair value of any pre‐existing investment in the acquiree is recognised as goodwill. If the consideration transferred and the pre‐existing fair value is less than the fair value of the identifiable net assets acquired, being a bargain purchase to the acquirer, the difference is recognised as a gain directly in profit or loss by the acquirer on the acquisition‐date, but only after a reassessment of the identification and measurement of the net assets acquired, the non‐controlling interest in the acquiree, if any, the consideration transferred and the acquirer's previously held equity interest in the acquirer. Business combinations are initially accounted for on a provisional basis. The acquirer retrospectively adjusts the provisional amounts recognised and also recognizes additional assets or liabilities during the measurement period, based on new information obtained about the facts and circumstances that existed at the acquisition‐date. The measurement period ends on either the earlier of: 12 months from the date of the acquisition; or when the acquirer receives all the information possible to determine fair value. Share‐Based Payments Share‐based payments are provided to directors and employees through issue of shares and options. Issue of Shares Share‐based compensation benefits are provided to employees via the RCG Corporation Executive Long Term Incentive Plan and the RCG Employee Share Scheme.

41 2013 Annual Report
Notes to the financial statements forming part of the f inanc ia l statements for the f inancia l year ended 30 June 2013
Issue of options The fair value of options is recognised as a benefit to directors/employees. The fair value is measured at the grant date and recognised over the period during which the options vest to the directors/employees. The fair value at the grant date is determined using the Black‐Scholes binomial convergence model for the employee’s options. This model takes into account the exercise price, the life of the option, the current price of the underlying share, the expected volatility of the share price, dividends expected on the share and the risk‐free interest rate for the life of the option. Goods and Services Tax Revenues, expenses and assets are recognised net of the amount of goods and services tax (GST), except where the amount of GST incurred is not recoverable from tax authorities. In these circumstances, the GST is recognised as part of the acquisition of the asset or as part of an item of expense. Receivables and payables are stated with the amount of GST included. The net amount of GST recoverable from, or payable to, the tax authorities is included as a current asset or a liability in the Statement of Financial Position. Cash flows are included in the Statement of Cash Flows on a gross basis. The GST components of cash flows arising from investing and financing activities which are recoverable from, and or payable to, the tax authorities are classified as operating cash flows. Hedge Accounting The Group designates certain hedging instruments as cash flow hedges. Hedges of foreign exchange risk on firm commitments are accounted for as cash flow hedges. At the inception of the hedge relationship, the entity documents the relationship between the hedging instrument and the hedged item, along with its risk management objectives and its strategy for undertaking various hedge transactions. Furthermore, at the inception of the hedge and on an ongoing basis, the Group documents whether the hedging instrument is highly effective in offsetting changes in fair values or cash flows of the hedged item. Note 19 sets out details of the fair values of the derivative instruments used for hedging purposes. Cash flow hedges The effective portion of changes in the fair value of derivatives that are designated and qualify as cash flow hedges is recognised in other comprehensive income and accumulated under the heading of cash flow hedge reserve. The gain or loss relating to the ineffective portion is recognised immediately in profit or loss, and is included in the ‘other gains and losses’ line item. Amounts previously recognised in other comprehensive income and accumulated in equity are reclassified to profit or loss in the periods when the hedged item is recognised in profit or loss, in the same line of the Statement of profit or loss and other comprehensive income as the recognised hedged item. However, when the forecast transaction that is hedged results in the recognition of a non‐financial asset or a non‐financial liability, the gains and losses previously accumulated in equity are transferred from equity and included in the initial measurement of the cost of the non‐financial asset or non‐financial liability.

42 2013 Annual Report
Notes to the financial statements forming part of the f inanc ia l statements for the f inancia l year ended 30 June 2013
Hedge accounting is discontinued when the Group revokes the hedging relationship, when the hedging instrument expires or is sold, terminated, or exercised, or when it no longer qualifies for hedge accounting. Any gain or loss accumulated in equity at that time remains in equity and is recognised when the forecast transaction is ultimately recognised in profit or loss. When a forecast transaction is no longer expected to occur, the gain or loss accumulated in equity is recognised immediately in profit or loss.
Borrowing Costs Borrowing costs directly attributable to the acquisition, construction or production of assets that necessarily take a substantial period of time to prepare for their intended use or sale, are added to the cost of those assets, until such a time as the assets are substantially ready for their intended use or sale. All other borrowing costs are recognised in profit or loss in the period in which they are incurred. Share Plan Reserve The share plan reserve arises through the recognition of the expenses relating to share options and in‐substance options. Rounding of amounts The Company is a company of the kind referred to in ASIC, Class Order 98/100, dated 10 July 1998, and in accordance with that class order amounts in the directors’ report and in the financial statements are rounded off to the nearest thousand dollars, or in certain cases, to the nearest dollar. Critical accounting estimates and judgements The directors evaluate estimates and judgements incorporated into the financial statements based on historical knowledge and best available current information. Estimates assume a reasonable expectation of future events and are based on current trends and economic data, obtained both externally and within the consolidated entity. Key estimates – Impairment The consolidated entity assesses impairment at each reporting date by evaluating conditions specific to the Group that may lead to impairment of assets. Where an impairment trigger exists, the recoverable amount of the asset is determined, however goodwill is tested annually for impairment. Value‐in‐use calculations performed in assessing recoverable amounts incorporate a number of key estimates.
2. FINANCIAL RISK MANAGEMENT
The consolidated entity’s activities expose it to a variety of financial risks: market risk (including currency risk, interest rate risk and price risk), credit risk and liquidity risk. The consolidated entity's overall risk management program focuses on the unpredictability of financial markets and seeks to minimise potential adverse effects on its financial performance. The consolidated entity uses different methods to measure different types of risk to which it is exposed. These methods include sensitivity analysis in the case of interest rate, foreign exchange and other price risk and ageing analysis for credit risk.
Risk management is carried out by the finance department under general guidelines set down by the Board. The Board provides overall direction for risk management, as well as guidance covering specific areas, such as foreign exchange risk, interest rate risk, and credit risk and investment of excess liquidity.

43 2013 Annual Report
Notes to the financial statements forming part of the f inanc ia l statements for the f inancia l year ended 30 June 2013
The consolidated entity holds the following financial assets and liabilities:
2013 2012
Note $'000 $'000
Financial Assets
Cash and cash equivalents 7 14,785 14,464
Trade and other receivables 8 9,016 7,171
Financial assets ‐ derivatives 19 493 ‐
24,294 21,635
Financial Liabilities
Trade and other payables 15 6,656 7,357
Borrowings 16 2,066 1,354
Financial liabilities ‐ derivatives 19 ‐ 49
8,722 8,760 Market risk Foreign exchange risk The consolidated entity is exposed to foreign exchange risk arising from forecast inventory purchases which are normally denoted in US dollars. Foreign currency exposure is limited by the application of the Group’s hedging policy as detailed in page 41. The Athlete’s Foot Australia Pty Limited and RCG Brands Pty Limited, both subsidiary entities, operate in Australia and New Zealand and are exposed to foreign exchange risk arising from currency exposures, primarily with respect to the New Zealand dollar. Foreign exchange risk arises from future commercial transactions and recognised assets and liabilities denominated in a currency that is not the entity’s functional currency and net investments in foreign operations.
The consolidated entity’s exposure to foreign currency risk in relation to assets and liabilities in currency different from the functional currencies of the entities which had these assets and liabilities, at the reporting date was as follows:
2013 2012
NZD NZD
$'000 $'000
Cash and cash equivalents 294 193
Trade and other receivables 113 70
Trade and other payables (8) (59) The following table details the forward foreign currency contracts outstanding at the end of the reporting period:

44 2013 Annual Report
Notes to the financial statements forming part of the f inanc ia l statements for the f inancia l year ended 30 June 2013
2013 2012 2013 2012 2013 2012 2013 2012
USD/AUD USD/AUD $'000 $'000 $'000 $'000 $'000 $'000
Cash flow Hedge
Buy USD
Less than 3 month 1.00 1.00 2,063 5,445 2,061 5,421 172 (42)
3 to 6 month 1.00 1.00 2,130 750 2,121 753 194 (7)
6 to 12 month 0.93 ‐ 6,200 ‐ 6,686 ‐ 127 ‐
Total 493 (49)
Fair ValueNotional Value AUD US DollarsAve exchange rate
Sensitivity analysis The consolidated entity is mainly exposed to the US Dollar and New Zealand Dollar. The following table details the Group’s sensitivity to a 10% increase and decrease in the Australian dollar against the relevant foreign currencies. 10% is the sensitivity rate used when reporting foreign currency risk internally to key management personnel and represents management’s assessment of the reasonably possible change in foreign exchange rates. A positive number below indicates an increase in profit and other equity and a negative number represents a decrease in profits and other equity.
2013 2012 2013 2012
$'000 $'000 $'000 $'000
Increase of 10%
Profit or loss ‐ ‐ (9) (1)
Equity (1,068) (557) 6 (3)
Decrease of 10%
Profit or loss ‐ ‐ 11 1
Equity 1,178 680 (7) 2
US Dollars NZ Dollars
Price risk The consolidated entity is not exposed to any material equity securities or commodity price risk. Cash flow and fair value interest rate risk The consolidated entity’s exposure to interest rate risk and the effective weighted average interest rate for classes of financial assets and financial liabilities is set out below:
Weighted Floating One One Non‐
Average Interest Year or to Five Interest
Interest Rate Less Years Bearing Total
Note Rate $'000 $'000 $'000 $'000 $'000
As at 30 June 2013
Financial Assets
Cash and cash equivalents 7 4.60% ‐ 14,785 ‐ ‐ 14,785
Trade and other receivables 8 0% ‐ ‐ ‐ 9,016 9,016
‐ 14,785 ‐ 9,016 23,801
Financial Liabilities
Trade finance facility 16 ‐ 2.92% 2,066 ‐ ‐ 2,066
Trade and other payables 15 0% ‐ ‐ ‐ 6,656 6,656
0 2,066 ‐ 6,656 8,722
Maturing in

45 2013 Annual Report
Notes to the financial statements forming part of the f inanc ia l statements for the f inancia l year ended 30 June 2013
Weighted Floating One One Non‐
Average Interest Year or to Five Interest
Interest Rate Less Years Bearing Total
Note Rate $'000 $'000 $'000 $'000 $'000
As at 1 July 2012
Financial Assets
Cash and cash equivalents 7 5.73% ‐ 14,464 ‐ ‐ 14,464
Trade and other Receivables 8 0% ‐ ‐ ‐ 7,171 7,171
‐ 14,464 ‐ 7,171 21,635
Financial Liabilities
Trade finance facility 16 ‐ 3.12% 1,354 ‐ ‐ 1,354
Trade and other payables 15 0% ‐ ‐ ‐ 7,357 7,357
0 1,354 ‐ 7,357 8,711
Maturing in
The consolidated entity invests surplus cash with AA rated banks in term deposits for periods ranging between 30‐180 days. This investment policy is adopted to mitigate risks and enhance returns. Sensitivity analysis If the cash and other equivalents at the year end had been constant during the year and interest rates had changed by ‐/+ 50 basis points from the year end rates with all variables held constant, post‐tax profit for the year would have been $73,900 lower/higher (2012: $72,300 lower/higher). If the interest on Trade finance facility had changed by ‐/+ 50 basis points from the year end rates with all variables held constant, post‐tax profit for the year would have been $10,300 lower/higher (2012: $1,000) Credit risk Credit risk is managed on a group basis. Credit risk arises from cash and cash equivalents and deposits with banks and financial institutions, as well as credit exposures to franchisees and suppliers, including outstanding receivables and committed transactions. For cash deposits, only independently rated banks with a rating of 'AA' are considered. Receivables from franchisees, suppliers and customers are based on the continuing relationship existing with them. The consolidated entity has a prudent policy of creating a provision for overdue trade receivables.
For some trade receivables the consolidated entity may also obtain security in the form of guarantees, deeds of undertaking or letters of credit which can be called upon if the counterparty is in default under the terms of the agreement. The analysis for trade receivables is as follows:
Less than
30 days
Between
30 and 90
days
Over 90
days Total
Note $'000 $'000 $'000 $'000
As at 30 June 2013
Trade receivables 8 7,032 1,092 172 8,296
Provision for doubtful debts 8 ‐ (290) (172) (462)
As at 1 July 2012
Trade receivables 8 5,293 1,322 114 6,729
Provision for doubtful debts 8 ‐ (305) (114) (419)
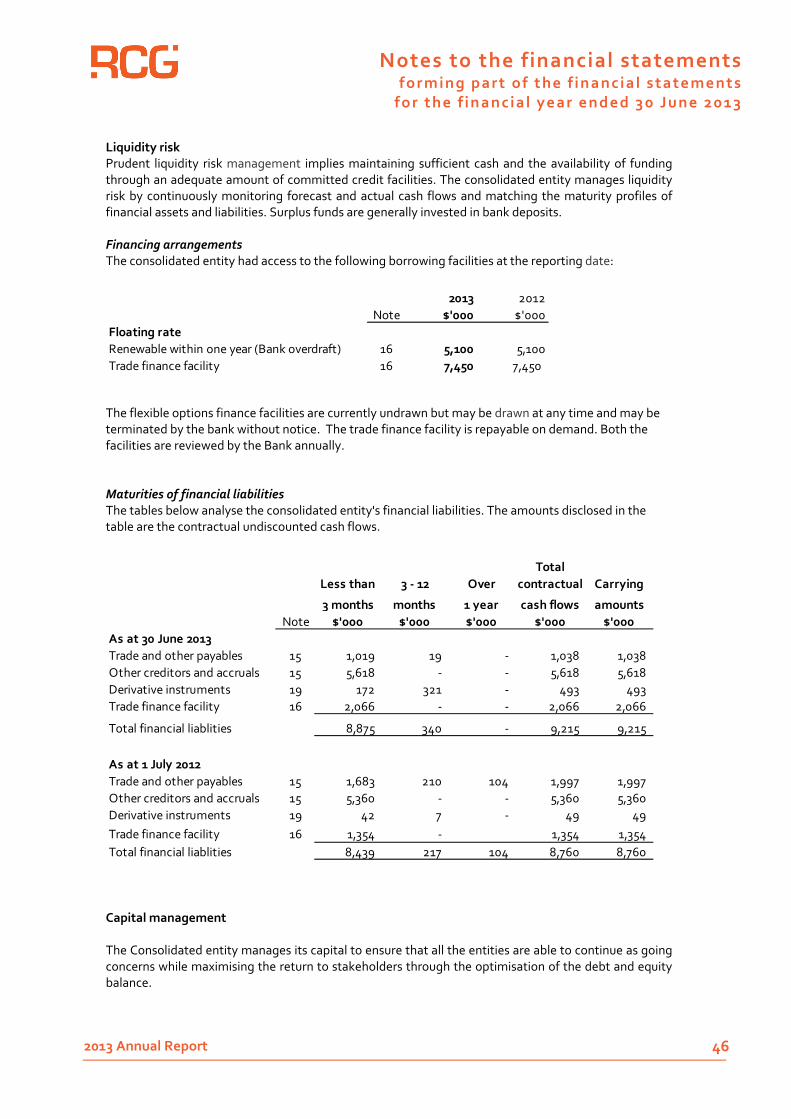
46 2013 Annual Report
Notes to the financial statements forming part of the f inanc ia l statements for the f inancia l year ended 30 June 2013
Liquidity risk Prudent liquidity risk management implies maintaining sufficient cash and the availability of funding through an adequate amount of committed credit facilities. The consolidated entity manages liquidity risk by continuously monitoring forecast and actual cash flows and matching the maturity profiles of financial assets and liabilities. Surplus funds are generally invested in bank deposits. Financing arrangements The consolidated entity had access to the following borrowing facilities at the reporting date:
2013 2012
Note $'000 $'000
Floating rate
Renewable within one year (Bank overdraft) 16 5,100 5,100
Trade finance facility 16 7,450 7,450
The flexible options finance facilities are currently undrawn but may be drawn at any time and may be terminated by the bank without notice. The trade finance facility is repayable on demand. Both the facilities are reviewed by the Bank annually. Maturities of financial liabilities The tables below analyse the consolidated entity's financial liabilities. The amounts disclosed in the table are the contractual undiscounted cash flows.
Less than 3 ‐ 12 Over
Total
contractual Carrying
3 months months 1 year cash flows amounts
Note $'000 $'000 $'000 $'000 $'000
As at 30 June 2013
Trade and other payables 15 1,019 19 ‐ 1,038 1,038
Other creditors and accruals 15 5,618 ‐ ‐ 5,618 5,618
Derivative instruments 19 172 321 ‐ 493 493
Trade finance facility 16 2,066 ‐ ‐ 2,066 2,066
Total financial liablities 8,875 340 ‐ 9,215 9,215
As at 1 July 2012
Trade and other payables 15 1,683 210 104 1,997 1,997
Other creditors and accruals 15 5,360 ‐ ‐ 5,360 5,360
Derivative instruments 19 42 7 ‐ 49 49
Trade finance facility 16 1,354 ‐ 1,354 1,354
Total financial liablities 8,439 217 104 8,760 8,760
Capital management The Consolidated entity manages its capital to ensure that all the entities are able to continue as going concerns while maximising the return to stakeholders through the optimisation of the debt and equity balance.

47 2013 Annual Report
Notes to the financial statements forming part of the f inanc ia l statements for the f inancia l year ended 30 June 2013
The capital structure of the Group consists of cash and cash equivalents, trade and other receivables, inventories, intangibles and net working capital. The equity attributable to equity holders of the parent entity comprises issued capital (disclosed in note 22), reserves (disclosed in note 21) and accumulated losses. Directors effectively manage the Group’s capital by assessing the Group’s financial risks and adjusting the Group’s capital structure in response to changes in these risks and in the market. These responses include the management of debt levels, distributions to shareholders and share issues. On 28 September 2012, the Company paid an ordinary fully franked final dividend of 1.75 cents per share. On 22 March 2013, the Company paid an ordinary fully franked interim dividend of 1.75 cents per share. None of the Group entities are subject to externally‐imposed capital requirements. The capital management policy has not changed since the prior year. Net fair values of financial assets and liabilities The following table provides an analysis of financial instruments that are measured subsequent to initial recognition at fair value, grouped into Levels 1 to 3 based on the degree to which the fair value is observable. • Level 1: fair value measurements are those derived from quoted prices (unadjusted) in active
markets for identical assets or liabilities. • Level 2: fair value measurements are those derived from inputs other than quoted prices included
within Level 1 that are observable for the asset or liability, either directly (i.e. as prices) or indirectly (i.e. derived from prices).
• Level 3: fair value measurements are those derived from valuation techniques that include inputs for the asset or liability that are not based on observable market data (unobservable inputs).
Level 1 Level 2 Level 3 Total
$'000 $'000 $'000 $'000
As at 30 June 2013
Financial assets
Derivatives in a hedging relationship ‐ 493 493
‐ ‐ ‐ ‐
Financial liabilities
Derivatives in a hedging relationship ‐ ‐ ‐ ‐
‐ ‐ ‐ ‐
Derivatives not designated in a relationship
Derivatives not designated in a relationship
Level 1 Level 2 Level 3 Total
$'000 $'000 $'000 $'000
As at 1 July 2012
Financial assets
Derivatives in a hedging relationship ‐ ‐ ‐ ‐
‐ ‐ ‐ ‐
Financial liabilities
Derivatives in a hedging relationship ‐ 49 ‐ 49
‐ ‐ ‐ ‐
Derivatives not designated in a relationship
Derivatives not designated in a relationship

48 2013 Annual Report
Notes to the financial statements forming part of the f inanc ia l statements for the f inancia l year ended 30 June 2013
Other than the above, the carrying amount of the consolidated entity’s identified financial assets and liabilities represents materially their net fair value.
3. ADOPTION OF NEW AND REVISED ACCOUNTING STANDARDS 3.1 Standards and Interpretations affecting amounts reported in the current period (and/or prior
periods) The following new and revised Standards and Interpretations have been adopted in the current year and have affected the amounts reported in these financial statements. 3.2 Standards affecting presentation and disclosure AASB 101.82A Amendments to AASB 101 ‘Presentation of Financial Statements’ The amendment (part of AASB 2011‐9 ‘Amendments to Australian Accounting Standards ‐ Presentation of Items of Other Comprehensive Income’ introduce new terminology for the statement of comprehensive income and income statement. Under the amendments to AASB 101, the statement of comprehensive income is renamed as a statement of profit or loss and other comprehensive income and the income statement is renamed as a statement of profit or loss. The amendments to AASB 101 retain the option to present profit or loss and other comprehensive income in either a single statement or in two separate but consecutive statements. However, the amendments to AASB 101 require items of other comprehensive income to be grouped into two categories in the other comprehensive income section: (a) items that will not be reclassified subsequently to profit or loss and (b) items that may be reclassified subsequently to profit or loss when specific conditions are met. Income tax on items of other comprehensive income is required to be allocated on the same basis – the amendments do not change the option to present items of other comprehensive income either before tax or net of tax. The amendments have been applied retrospectively, and hence the presentation of items of other comprehensive income has been modified to reflect the changes. Other than the above mentioned presentation changes, the application of the amendments to AASB 101 does not result in any impact on profit or loss, other comprehensive income and total comprehensive income. 3.3 Standards and Interpretations affecting the reported results or financial position There are no new and revised Standards and Interpretations adopted in these financial statements affecting the reporting results or financial position.

49 2013 Annual Report
Notes to the financial statements forming part of the f inanc ia l statements for the f inancia l year ended 30 June 2013
3.4 Standards and Interpretations in issue not yet adopted (For use with 30 June 2013 year end)
At the date of authorisation of the financial statements, the Standards and Interpretations listed below were in issue but not yet effective. The potential impact of the new or revised Standards and Interpretations has not yet been determined.
Standard/Interpretation
Effective for annual
reporting periods
beginning on or after
Expected to be
initially applied
in the financial
year ending
AASB 9 ‘Financial Instruments’, and the relevant amending standards 1 January 2015 30 June 2016
AASB 10 ‘Consolidated Financial Statements’, AASB 2011‐7 ‘Amendments to
Australian Accounting Standards arising from the Consolidation and Joint
Arrangements Standards’
1 January 2013 30 June 2014
AASB 11 ‘Joint Arrangements’ and AASB 2011‐7 ‘Amendments to Australian
Accounting Standards arising from the Consolidation and Joint Arrangements
Standards’
1 January 2013 30 June 2014
AASB 12 ‘Disclosure of Interests in Other Entities’ and AASB 2011‐7 ‘Amendments to
Australian Accounting Standards arising from the Consolidation and Joint
Arrangements Standards’
1 January 2013 30 June 2014
AASB 13 ‘Fair Value Measurement’ and AASB 2011‐8 ‘Amendments to Australian
Accounting Standards arising from AASB 13’
1 January 2013 30 June 2014
AASB 119 ‘Employee Benefits’(2011) and AASB 2011‐10 ‘Amendments to Australian
Accounting Standards arising from AASB 119 (2011)’
1 January 2013 30 June 2014
AASB 127 ‘Separate Financial Statements’ (2011) and AASB 2011‐7 ‘Amendments to
Australian Accounting Standards arising from the Consolidation and Joint
Arrangements Standards’
1 January 2013 30 June 2014
AASB 128 ‘Investments in Associates and Joint Ventures’(2011) and AASB 2011‐7
‘Amendments to Australian Accounting Standards arising from the Consolidation
and Joint Arrangements Standards’
1 January 2013 30 June 2014
AASB 2011‐4 ‘Amendments to Australian Accounting Standards to Remove Individual
Key Management Personnel Disclosure Requirements’
1 July 2013 30 June 2014
AASB 2012‐2 ‘Amendments to Australian Accounting Standards – Disclosures –
Offsetting Financial Assets and Financial Liabilities’
1 January 2013 30 June 2014
AASB 2012‐3 ‘Amendments to Australian Accounting Standards – Disclosures –
Offsetting Financial Assets and Financial Liabilities’
1 January 2014 30 June 2015

50 2013 Annual Report
Notes to the financial statements forming part of the f inanc ia l statements for the f inancia l year ended 30 June 2013
2013 2012
$'000 $'000
4. REVENUE
Sales to customers 34,144 25,871
Royalties and other franchise related income 15,779 15,402
Interest received 848 880
Other revenue 742 982 Total Revenue 51,513 43,135
5. EXPENSES
Depreciation and amortisation expense
Property, plant and equipment 794 455
Amortisation expense 106 106 900 561
External Finance costs
Interest on deferred consideration 62 90
Other finance costs 136 ‐ 198 90
Rental expense relating to operating leasesMinimum lease payments 2,414 1,611
Others
Defined contribution ‐ Superannuation plan expense 748 664 Obsolescence of inventory 31 81
Profit from continuing operations before income tax includes the
following specific expenses

51 2013 Annual Report
Notes to the financial statements forming part of the f inanc ia l statements for the f inancia l year ended 30 June 2013
2013 2012
$'000 $'000
6. INCOME TAX
Major components of income tax expense
Current income tax expense 4,542 3,648
Deferred income tax expense 36 543
Overprovision in respect of prior years (60) (5)
4,518 4,186
4,510 4,114
Add/ (less) income tax effect of:
Non‐deductible items
Share option expense 67 142
Entertainment 11 8
Interest on contingent consideration 18 27
Other assessable items 27 32
Net Allowable items
Losses not previously recognised (55) (54)
Others ‐ (83)
Over provision from previous year (60) ‐
4,518 4,186
30.1% 30.5%
before income tax at 30% (2012: 30%)
Income tax expense attributable to entity
Prima facie income tax payable on profit from continuing
Reconciliation between income tax expense and prima facie tax
on accounting profit from continuing operations
Applicable Tax rate
The applicable tax rate is the national tax rate in
Australia of 30%
Weighted Average Tax Rate (%)
Analysis of deferred tax assets:
Provision for doubtful debts 139 125
Provision for shrinkage & stock obsolescence 208 182
Provision for employee entitlements 388 330
Other Provisions 150 21
Accruals 167 135
Difference in accounting and tax depreciation 33 (254)
Listing expenses 1 14
Hedge Reserve (149) 15 937 569

52 2013 Annual Report
Notes to the financial statements forming part of the f inanc ia l statements for the f inancia l year ended 30 June 2013
2013 2012
$'000 $'000
Income tax recognised in other comprehensive income
Deferred tax ‐ ‐ Fair value remeasurement of cash flow hedges 148 15
The movement above in deferred tax assets and liabilities for each temporary difference
during the year is debited/credited to the Statement of Profit or Loss and other Comprehensive Income.
Deferred tax assets not brought to account, the benefits of which will only be realised if the
conditions for deductibility set out in Note 1 occur, are as follows:
Tax losses:
Operating losses ‐ ‐
Capital losses 7,178 7,178 7,178 7,178
7. CASH AND CASH EQUIVALENTS
Cash on hand 13 9
Cash in bank 14,772 14,455
14,785 14,464
8. CURRENT ASSETS ‐ TRADE AND OTHER RECEIVABLES
Trade receivables 8,296 6,729
Other receivables 1,182 861
Provision for doubtful debts (462) (419) 9,016 7,171
9. CURRENT ASSETS ‐ INVENTORIES
Finished goods ‐ at cost 8,988 12,519
Provision for obsolescence (533) (609)
8,455 11,910
10. OTHER CURRENT ASSETS
Security deposits 56 193
Prepayments 207 196
Others 1,073 917
1,336 1,306

53 2013 Annual Report
Notes to the financial statements forming part of the f inanc ia l statements for the f inancia l year ended 30 June 2013
11. CONTROLLED ENTITIES The ultimate parent entity, RCG Corporation Limited, holds the following investments in subsidiaries:
Ownership Interest
2013 2012
The Athlete's Foot Australia Pty Limited 100% 100%
TAF Constructions Pty Limited 100% 100%
A.C.N. 114 805 480 Pty Limited (Administrators appointed) (a)
100% 100%
RCG Brands Pty Limited 100% 100%
RCG Retail Pty Limited 100% 100%
TAF eStore Pty Limited 100% 100%
a) A.C.N. 114 805 480 Pty Ltd formerly Shoe Superstore Group Pty Ltd was placed into Voluntary Administration on 20 February 2013.
b) All controlled entities at 30 June 2013 were incorporated in Australia.
2013 2012
$'000 $'000
12. PROPERTY, PLANT AND EQUIPMENT
Plant and equipment ‐ at cost 7,222 7,576
Less: Accumulated depreciation (3,158) (2,777)
4,064 4,799
Assets under construction 138 136
4,202 4,935
Movements in carrying amounts
Property, plant and equipment ‐ at cost
At cost
Balance at beginning of year 7,576 5,019
Impairment of assets in discontinued operation (refer note
32) (2,244) ‐
Additions 1,890 2,557
7,222 7,576
Accumulated depreciation
Balance at beginning of year 2,777 2,071
Depreciation expense 794 455
Depreciation expense from discontinued operation 170 248
Accumulated depreciation on impaired assets in
discontinued operation (refer note 32) (593) ‐
Rounding Adjustments 10 3
3,158 2,777
4,064 4,799
Assets under construction 138 136
Net book value 4,202 4,935

54 2013 Annual Report
Notes to the financial statements forming part of the f inanc ia l statements for the f inancia l year ended 30 June 2013
2013 2012
$'000 $'000
13. INTANGIBLE ASSETS
a. Trademark
Trademark ‐ The Athlete's Foot ‐ at cost 3,466 3,466
b. Goodwill
Goodwill ‐ The Athlete's Foot ‐ at cost 6,101 6,101
Goodwill ‐ Shoe Superstore ‐ at cost 934 934
Other Goodwill ‐ at cost 94 94
7,129 7,129
Impairment ‐ Shoe Superstore (a)
(934) ‐
6,195 7,129
c. Licence fee
Licence fee ‐ The Athlete's Foot ‐ at cost (b)
7,832 7,832
Amortisation (110) (79)
7,722 7,753
d. Other intangible assets
Other intangible assets ‐ The Athlete's Foot ‐ at cost (c)
175 175
Amortisation (123) (88)
52 87
Other intangible assets ‐ RCG Brands ‐ at cost (d)
200 200
Amortisation (140) (100)
60 100
Total other intangible assets 112 187
Total Intangibles 17,495 18,535
(a) Shoe Superstore was placed into Voluntary Administration on 20 February 2013.The goodwill associated with Shoe Superstore has been fully impaired. Please refer Note 32 for further details.
(b) TAF entered into a 249 year licence agreement with its US licensor for its business in Australia and New Zealand, under which it will pay no ongoing licence fees (Remaining amortisation period is 245 years).
(c) Costs associated with the development of new store concept for The Athlete’s Foot (Amortised over 60 months, remaining amortisation period is 24 months).
(d) Costs associated with setting up of RCG Brands business (Amortised over 60 months, remaining amortisation period is 24 months).

55 2013 Annual Report
Notes to the financial statements forming part of the f inanc ia l statements for the f inancia l year ended 30 June 2013
Movements in intangibles Goodwill
Trademark
s
Licence
Fee
Other
intangible
assets Goodwill Trademarks
Licence
Fee
Other
intangible
assets
$'000 $'000 $'000 $'000 $'000 $'000 $'000 $'000
Balance at the beginning of the year 7,129 3,466 7,754 187 7,129 3,466 7,785 262
Additions ‐ ‐ ‐ ‐ ‐ ‐ ‐ ‐
(934) ‐ ‐ ‐ ‐ ‐ ‐ ‐
Amortisation charge ‐ ‐ (32) (75) ‐ ‐ (31) (75)
Balance at the end of the year 6,195 3,466 7,722 112 7,129 3,466 7,754 187
20122013
Impairment ‐ Shoe Superstore
The Cash Generating Units (CGU) for RCG Corporation Limited are The Athlete's Foot and RCG Brands. These CGU’s must perform an impairment test at each reporting date. Shoe Superstore was placed into Voluntary Administration on 20 February 2013 and was fully impaired. The impairment test of The Athlete’s Foot at 30 June 2013 was carried out using the discounted cash flow method. The following assumptions were used in the calculation:
The Athlete’s Foot: future cash flows based on the present levels of profitability, were discounted to the
present value using a discount rate of 12% and an annual growth rate of 4%.
AASB 136 states that an impairment test must be performed annually for goodwill and other indefinite life intangible assets. Further, companies must also assess at each reporting date whether there is any indication that the asset may be impaired and, if so, perform an impairment test. The impairment test carried out at 30 June 2013 does not indicate any reason for impairment of the intangible assets. The consolidated entity considers that its investment in The Athlete's Foot (Goodwill and Trademark) have
indefinite useful lives because it foresees no impediment to its ability to continue to own and operate the businesses for the foreseeable future.
The License fee for The Athlete’s Foot is for 249 years and is amortised on a straight line basis over the period.
Other intangible assets have a useful life of 5 years and are amortised on a straight line basis over that period.
2013 2012
$'000 $'000
14. DEFERRED TAX ASSETSFuture tax benefit (refer note 6) 937 569
15. CURRENT LIABILITIES ‐ TRADE AND OTHER PAYABLES
Trade creditors 1,038 1,997
Other creditors and accruals 5,618 5,360
6,656 7,357

56 2013 Annual Report
Notes to the financial statements forming part of the f inanc ia l statements for the f inancia l year ended 30 June 2013
2013 2012
$'000 $'000
16. BORROWINGS
Secured, at amortised cost
Current
Trade finance facility 2,066 1,354
Total Borrowings 2,066 1,354
(a) The Group has a trade finance facility on imports of $7.45 million (2012: $7.45 million) and an undrawn flexible
options finance facility of $5.1 million (2012: $5.1 million). These facilities are secured by a fixed and floating charge over the Group’s assets of $38.5 million, as well as interlocking joint and several guarantees from group companies.
17. TAX LIABILITIES
Current
Income tax liability 1,323 1,161
1,323 1,161
18. PROVISIONS
Current
Employee benefits 1,125 1,087
Lease incentive 34 45
1,159 1,132
Non‐current
Employee benefits 64 30
Lease incentive 120 351
184 381
(a) A provision has been recognised for employee benefits relating to annual leave and long service leave. The
calculation of the present value of future cash flows in respect of long service leave is based on historical data. The measurement and recognition criteria relating to employee benefits have been included in Note 1 to this report. There is uncertainty around the exact time of the cash outflows in relation to the above amounts.
(b) Lease incentives pertain to incentives granted in respect of leases for premises. These incentives are taken to income over the life of the leases.

57 2013 Annual Report
Notes to the financial statements forming part of the f inanc ia l statements for the f inancia l year ended 30 June 2013
2013 2012
$'000 $'000
19. DERIVATIVE INSTRUMENTS
a. Financial assets ‐ Current
Foreign currency forward contracts 493 ‐
493 ‐
Financial liabilities ‐ Current
Foreign currency forward contracts ‐ 49
‐ 49
Derivatives designated and effective as hedging
instruments carried at fair value
Derivatives designated and effective as hedging
instruments carried at fair value
20. OTHER LIABILITIES
Current
Deferred consideration 231 231
231 231
Non‐current
Deferred consideration 175 344
175 344
21. RESERVES
Share plan reserve (a)
2,773 2,548
Foreign currency translation reserve (b)
(23) (96)
Cash flow hedge reserve (c)
345 (35)
3,095 2,417
Cash flow hedge reserve movements
Balance at beginning of year (35) (639)
Gain recognised on cash flow hedges 528 589
Income tax related to amounts reclassified to profit or loss (148) 15
Balance at end of year 345 (35)
a) The share plan reserve arises through the recognition of the expenses relating to share options. b) The foreign currency translation reserve records exchange differences arising on translation of a foreign operation. c) The cash flow hedging reserve represents the cumulative portion of gains and losses on hedging instruments
deemed effective in cash flow hedges. The cumulative deferred gain or loss on the hedging instrument is reclassified to profit or loss only when the hedged transaction affects the profit or loss, or is included as a basis adjustment to the non‐financial hedged item, consistent with the relevant accounting policy.

58 2013 Annual Report
Notes to the financial statements forming part of the f inanc ia l statements for the f inancia l year ended 30 June 2013
2013 2012
$'000 $'000
22. PARENT ENTITY INFORMATION
Current assets 19,647 17,625
Non‐current assets 12,906 12,814 Total assets 32,553 30,439
Current liabilities 224 ‐
Non‐current liabilities 56 32 Total liabilities 280 32
Issued Capital 63,637 63,470
Accumulated losses (34,482) (35,576)
Share plan reserve 2,773 2,548
Cash flow hedge reserve 345 (35) Total shareholders equity 32,273 30,407
Profit/(loss) of the parent entity from continuing operation 13,689 8,843
Impairment of investment in loan to discontinued operation (3,956) ‐
9,733 8,843
Other comprehensive income/(loss) 380 604
Total comprehensive profit/(loss) of the parent entity 14,069 9,447
Profit/(loss) of the parent entity from continuing and discontinued
operation
a) The parent entity has bank guarantees outstanding as of 30 June 2013 amounted to approximately $545,347. These are guarantees entered into in relation to the debts of its subsidiaries. ($597,426 in 2012). Refer to note 34 for details of contingent liabilities.
b) Refer to note 28 for details of commitments, note none are in the parent entity.

59 2013 Annual Report
Notes to the financial statements forming part of the f inanc ia l statements for the f inancia l year ended 30 June 2013
2013 2012
$'000 $'000
Movement in issued capital
Balance at beginning of period 63,468 62,711
Issued during the year:
Exercise of options (b)
24 660
Buyback of ELTIP shares ‐ (239)
Fee on granting of options 145 196
Payment for ELTIP shares ‐ 140
Balance at end of period 63,637 63,468
2013 2012
'000 '000
Balance at beginning of period 242,078 238,248
Issued during the year:
Exercise of options (b)
200 5,500
Exercise of options (c)
3,000 ‐
Buyback and cancellation of shares ‐ (1,670)
Issue under Employee Share Scheme (d)
6,265 ‐
251,543 242,078
Treasury Shares (9,265) 0
Balance at end of period 242,278 242,078
No. of Shares
(Fully Paid)
a) Ordinary shares participate in dividends and the proceeds on winding up of the parent entity in proportion to the number of shares held. At the shareholders meetings each ordinary share is entitled to one vote when a poll is called, otherwise each shareholder has one vote on a show of hands. The Company does not have authorised capital or par value in respect of its shares.
b) On 1 August 2012, 200,000 options were exercised for a total consideration of $24,000 (2012: 5,500,000 options for a total consideration of $660,000).
c) On 28 February 2013, 3,000,000 options were exercised for a total consideration of $900,000; the exercise price was funded by a loan granted by the Company. The Company’s recourse is limited to the shares.
d) On 28 February 2013, 6,265,000 shares were issued to employees under Employee Share Scheme.
2013 2012
$'000 $'000
23. DIVIDENDS
Dividends paid or declared by the Company 8,642 7,311
Dividend Franking Account
6,552 6,378 The amount of franking credits available for the subsequent
financial year are:
a) On 23 August 2012 the Company declared an ordinary fully franked dividend final dividend of 1.75 cents per share
paid on 28 September 2012 to shareholders registered on the record date of 12 September 2012. b) On 20 February 2013, the Company declared an ordinary fully franked interim dividend of 1.75 cents per share paid
on 22 March 2013 to shareholders registered on 5 March 2013 record date.

60 2013 Annual Report
Notes to the financial statements forming part of the f inanc ia l statements for the f inancia l year ended 30 June 2013
2013 2012
$ $
24. AUDITOR'S REMUNERATION
148,050 137,050
11,100 4,000
159,150 141,050
Amount received or due and receivable by the auditors of the
parent entity
Audit and review of the financial reports
Other professional services
Deloitte Touche Tohmatsu
25. EARNINGS PER SHARE
Earnings used for calculation of basic and diluted earnings per share
Profit from operations after tax from continuing operations 10,515 9,528
5,838 9,188
Profit from operations after tax from continuing operations and
discontinued operations
'000 '000
Weighted average number of shares
242,261 241,607
1,870 1,652
244,131 243,259
Weighted average number of shares used in the calculation of
diluted EPS
Number of shares
Weighted average number of shares used in the calculation of
basic EPS
Weighted average number of options and ESS on issue
Earnings per share
2.41 3.80
2.39 3.78
4.34 3.94
4.31 3.92
Cents per share
From continuing and discontinued operations
Basic earnings per share attributable to the ordinary equity
holders of the company
Diluted earnings per share attributable to the ordinary equity
holders of the company
From continuing operations
Basic earnings per share attributable to the ordinary equity
holders of the company
Diluted earnings per share attributable to the ordinary equity
holders of the company

61 2013 Annual Report
Notes to the financial statements forming part of the f inanc ia l statements for the f inancia l year ended 30 June 2013
2013 2012
$'000 $'000
26. EMPLOYEE BENEFITS
Provision for employee benefits
‐ Current 1,125 1,087
‐ Non‐current 64 30
855 623
2,044 1,740
Accruals for wages, salaries and bonuses included in "other
payables"
27. SHARE BASED PAYMENTS
Employee Option plan Options issued under the Option Plan convert into one ordinary RCG share on exercise. In addition to the exercise price of each option, an option fee is payable for all options. The option fees vary depending on the date on which the options were issued, but have all been calculated with reference to the Volume Weighted Average Price of RCG’s shares on the ASX for the seven days leading up to the date on which the options were issued. Employee Share Scheme Shares have been issued under the RCG Employee Share Scheme (“ESS”) and are held in escrow until certain vesting conditions are met. The shares were issued at market value at the date of the offer and the Company has provided employees with a limited recourse loan to acquire the shares. Interest on the loan is equivalent to the value of franked dividends paid in respect of the shares. Options and the ESS together with movements are set out in the tables below: 2013
Option/
Shares
Series
Grant
date
Expiry
date
Exercise/
purchase
Price $
Option
Fee $
Fair Value
at grant
date $
Balance at
start of year
Granted/
issued during
the year
Exercised
during the
year
Forfeited/
cancelled
during the
year
Balance at
end of the
year
Vested at
the end of
year
Series 2 19/12/06 19/12/11 0.120 0.034 0.048 ‐ ‐ ‐ ‐ ‐ ‐
Series 5 17/04/07 17/04/12 0.120 0.052 0.064 200,000 ‐ (200,000) ‐ ‐ ‐
Series 7 14/03/08 14/03/13 0.300 0.045 0.037 3,000,000 ‐ (3,000,000) ‐ ‐ ‐
Series 8 28/05/09 29/05/14 0.307 0.027 0.073 1,000,000 ‐ ‐ ‐ 1,000,000 1,000,000
Series 9 4/01/10 4/01/15 0.400 0.052 0.036 6,500,000 ‐ ‐ ‐ 6,500,000 4,100,000
Series 10 23/08/10 23/08/15 0.520 0.069 0.058 1,000,000 ‐ ‐ ‐ 1,000,000 ‐
Series 11 23/08/10 23/08/15 0.520 0.069 0.054 400,000 ‐ ‐ ‐ 400,000 300,000
Series 12 23/08/10 23/08/15 0.520 0.069 0.056 200,000 ‐ ‐ ‐ 200,000 100,000
Series 13 23/08/10 23/08/15 0.520 0.069 0.055 1,000,000 ‐ ‐ ‐ 1,000,000 600,000
Series 15 14/12/10 18/12/15 0.660 0.000 0.071 1,500,000 ‐ ‐ ‐ 1,500,000 ‐
Series 16 24/08/11 24/08/16 0.530 0.040 0.098 2,550,000 ‐ ‐ ‐ 2,550,000 ‐
Share loan 28/02/13 28/02/16 0.300 0.045 0.012 ‐ 3,000,000 ‐ ‐ 3,000,000 3,000,000
ESS 28/02/13 28/02/18 0.490 0.000 0.099 ‐ 6,265,000 ‐ ‐ 6,265,000 ‐
(a) On 1 August 2012 200,000 options were exercised for a total consideration of $24,000. The share price on
that day was $0.35. (b) On 28 February 2013, 3,000,000 options were exercised for a total consideration of $900,000. The share
price on that day was $0.56. (c) The weighted average remaining contractual period for options and shares outstanding on 30 June 2013 is
3.34 years.

62 2013 Annual Report
Notes to the financial statements forming part of the f inanc ia l statements for the f inancia l year ended 30 June 2013
2012
Option
Series
Grant
date
Expiry
date
Exercise
Price $
Option
Fee $
Fair Value
at grant
date $
Balance at
start of year
Granted
during the
year
Exercised
during the
year
Forfeited/
cancelled
during the
year
Balance at
end of the
year
Vested at
the end of
year
Series 2 19/12/06 19/12/11 0.120 0.034 0.048 5,000,000 ‐ (5,000,000) ‐ ‐ ‐
Series 5 17/04/07 17/04/12 0.120 0.052 0.064 800,000 ‐ (500,000) (100,000) 200,000 200,000
Series 7 14/03/08 14/03/13 0.300 0.045 0.037 3,000,000 ‐ ‐ ‐ 3,000,000 3,000,000
Series 8 28/05/09 29/05/14 0.307 0.027 0.073 1,000,000 ‐ ‐ ‐ 1,000,000 500,000
Series 9 4/01/10 4/01/15 0.400 0.052 0.036 6,500,000 ‐ ‐ ‐ 6,500,000 2,900,000
Series 10 23/08/10 23/08/15 0.520 0.069 0.058 1,000,000 ‐ ‐ ‐ 1,000,000 ‐
Series 11 23/08/10 23/08/15 0.520 0.069 0.054 400,000 ‐ ‐ ‐ 400,000 200,000
Series 12 23/08/10 23/08/15 0.520 0.069 0.056 200,000 ‐ ‐ ‐ 200,000 50,000
Series 13 23/08/10 23/08/15 0.520 0.069 0.055 1,000,000 ‐ ‐ ‐ 1,000,000 400,000
Series 14 9/11/10 9/11/16 0.700 0.046 0.143 4,500,000 ‐ ‐ (4,500,000) ‐ ‐
Series 15 14/12/10 18/12/15 0.660 0.000 0.071 1,500,000 ‐ ‐ ‐ 1,500,000 ‐
Series 16 24/08/11 24/08/16 0.530 0.040 0.098 ‐ 2,550,000 ‐ ‐ 2,550,000 ‐
Total 24,900,000 2,550,000 (5,500,000) (4,600,000) 17,350,000 7,250,000
The weighted average fair value of ESS granted during the financial year is $0.127 each. Employees Options and ESS are valued using the Black‐Scholes Option Pricing Model. Where relevant, the expected life of the options was calculated as the midpoint between the vesting date of the options and the expiry of the options. The following variables were used to calculate the fair value of options and ESS: Inputs
into the
Model
Spot price
at grant
date ($)
Exercise
price ($)
Expected
volatility
Option/
share life
Dividend
yield
Risk free
rate
Series 5 0.175 0.172 30% Various ‐ 6.10%
Series 7 0.260 0.345 30% Various ‐ 6.50%
Series 8 0.290 0.307 30% Various ‐ 3.50%
Series 9 0.390 0.452 30% Various ‐ 3.50%
Series 10 0.520 0.589 28% Various ‐ 6.00%
Series 11 0.520 0.589 28% Various ‐ 6.00%
Series 12 0.520 0.589 28% Various ‐ 6.00%
Series 13 0.520 0.589 28% Various ‐ 6.00%
Series 15 0.600 0.660 28% Various ‐ 6.00%
Series 16 0.495 0.570 44% Various ‐ 5.75%
ESS 0.490 0.490 44% Various ‐ 5.75%

63 2013 Annual Report
Notes to the financial statements forming part of the f inanc ia l statements for the f inancia l year ended 30 June 2013
2013 2012
$'000 $'000
28. COMMITMENTS
a. Capital Expenditure Commitments
‐ not later than one year 600 300
b. Operating Lease Commitments
‐ not later than one year 2,727 3,809
‐ later than one year but not later than five years 8,934 11,157
‐ later than five years 1,789 3,470
13,450 18,436
Estimated capital expenditure at reporting date, not provided
for in the financial statements pertaining to plant and
equipment
Future operating lease rentals (minimum lease payments) of
premises, plant and equipment not provided for in the financial
statements and payable under non‐cancellable operating leases.
a) Operating lease commitments predominantly relate to corporate headquarters and stores being leased. Leases
are generally over 5 years and include annual increases linked to CPI. b) The consolidated entity does not have any outstanding finance lease commitments c) The total future minimum sub‐lease payments expected to be received under non‐cancellable sub‐leases at the
end of the year equates to the maximum possible contingent liability, as disclosed in Note 34.
29. RELATED PARTY DISCLOSURES
a. Parent entity The parent entity and ultimate parent entity of the group is RCG Corporation Limited.
b. Subsidiaries Subsidiaries are detailed in Note 11 to the financial statements.
c. Entities associated with key management personnel
Tidereef Pty Limited, a shareholder, is a company associated with Ivan Hammerschlag. Rivan Pty Limited, a shareholder, is a company associated with David Gordon. Vamico Pty Limited, a shareholder, is a company associated with Michael Cooper. Omniday Pty Limited, a shareholder, is a company associated with Michael Hirschowitz. Rastana Holdings Pty Limited, a shareholder, is a company associated with Hilton Brett.
d. Key management personnel Remuneration of Key Management Personnel The following table sets out the details of the remuneration of Key Management Personnel of the Company:

64 2013 Annual Report
Notes to the financial statements forming part of the f inanc ia l statements for the f inancia l year ended 30 June 2013
2013
Share
based
payments
Cash, salary
and fees
Cash
Bonus (a)
Proportion
of cash
bonus paid
Other
Monetary
Benefits
Super‐
annuation
Retirement
Benefits
Issue of
Shares/
Options
$ $ % $ $ $ $ $
Ivan Hammerschlag 220,000 ‐ ‐ ‐ ‐ ‐ ‐ 220,000 ‐
David Gordon 65,000 ‐ ‐ ‐ 5,850 ‐ ‐ 70,850 ‐
Stephen Kulmar 45,000 ‐ ‐ ‐ 4,050 ‐ ‐ 49,050 ‐
Michael Cooper 322,289 17,325 25% 10,000 25,000 ‐ ‐ 374,614 0.0%
Michael Hirschowitz 305,788 23,500 35% 16,000 25,000 ‐ ‐ 370,288 0.0%
Hilton Brett 363,971 40,000 58% 10,000 25,000 ‐ 36,000 474,971 7.6%
Total 1,322,048 80,825 36,000 84,900 ‐ 36,000 1,559,773
Names of Key
Management
Personnel
Short‐term benefitsPost‐employment
benefits Total
Remun‐
eration
% of total
made as
share
based
payments
a) No amounts vest in future financial years in respect of the short term incentive bonus for the 2013 financial year.
2012
Share
based
payments
Cash, salary
and fees
Cash
Bonus (b)
Proportion
of cash
bonus paid
Other
Monetary
Benefits
Super‐
annuation
Retirement
Benefits
Issue of
Shares/
Options ‐
excluding
cancelled
options (a)
$ $ % $ $ $ $ $
Ivan Hammerschlag 259,850 ‐ ‐ ‐ ‐ ‐ ‐ 259,850 ‐
David Gordon 65,000 ‐ ‐ ‐ 5,850 ‐ ‐ 70,850 ‐
Stephen Kulmar 45,000 ‐ ‐ ‐ 4,050 ‐ ‐ 49,050 ‐
Michael Cooper 311,500 33,000 50% 10,000 25,000 ‐ 41,823 421,323 9.9%
Michael Hirschowitz 295,000 48,000 75% 16,000 25,000 ‐ 41,823 425,823 9.8%
Hilton Brett 311,500 66,000 100% 10,000 25,000 ‐ 41,823 454,323 9.2%
Total 1,287,850 147,000 36,000 84,900 ‐ 125,468 1,681,218
Names of Key
Management
Personnel
Short‐term benefitsPost‐employment
benefits Total
Remun‐
eration ‐
excluding
cancelled
options (a)
% of total
made as
share
based
payments ‐
excluding
cancelled
options (a)
a) During the 2012 financial year, 1,500,000 options allotted to each of Michael Cooper, Michael Hirschowitz and
Hilton Brett were cancelled for no consideration paid or payable to these executives. In accordance with the accounting standards, the cancellation of the options is accounted for as an acceleration of vesting and the unexpired value of $348,532 was recognised as an expense in the year. This share based payment is attributable to the Key Management Personnel as follows: Michael Cooper $116,177, Michael Hirschowitz $116,177 and Hilton Brett $116,177. These amounts are not reflected in the above table.
b) No amounts vest in future financial years in respect of the short term incentive bonus for the 2012 financial year.

65 2013 Annual Report
Notes to the financial statements forming part of the f inanc ia l statements for the f inancia l year ended 30 June 2013
Shares held by Key Management Personnel The number of shares in which the key management personnel of the Company held a relevant interest on 30 June 2013, are set out in the following table. 2013
Key Management
Personnel
Opening
Balance
1 July 2012
Exercise of
options (a)
Purchase/
(sale) of
shares
Closing
Balance on
30 June 2013
Value of
options on
exercise
date ($)
Ivan Hammerschlag 19,326,395 ‐ ‐ 19,326,395 ‐
David Gordon 18,887,301 ‐ ‐ 18,887,301 ‐
Stephen Kulmar 2,400,000 ‐ ‐ 2,400,000 ‐
Michael Cooper 15,729,313 ‐ ‐ 15,729,313 ‐
Michael Hirschowitz 13,829,313 ‐ ‐ 13,829,313 ‐
Hilton Brett 8,466,666 3,000,000 ‐ 11,466,666 36,000
Total 78,638,988 3,000,000 ‐ 81,638,988 36,000 a) On 28 February 2013 Hilton Brett was granted a loan for $900,000, pursuant to a resolution passed at the AGM
on 23 November 2012, to fund the exercising of 3,000,000 employee options. The loan is to be repaid before 28 February 2016. Interest on the loan will be equivalent to any dividends payable on the shares acquired under the loan.
b) There has been no movement in options between the reporting date and the date of this report.
2012
Key Management
Personnel
Opening
Balance
26 June 2011
Exercise of
options
Sale of
shares
Closing
Balance on
1 July 2012
Value of
options on
exercise
date ($)
Ivan Hammerschlag 19,326,395 ‐ ‐ 19,326,395 ‐
David Gordon 18,887,301 ‐ ‐ 18,887,301 ‐
Stephen Kulmar 2,400,000 ‐ ‐ 2,400,000 ‐
Michael Cooper 14,229,313 2,000,000 (500,000) 15,729,313 108,200
Michael Hirschowitz 11,329,313 3,000,000 (500,000) 13,829,313 162,300
Hilton Brett 8,966,666 ‐ (500,000) 8,466,666 ‐
Total 75,138,988 5,000,000 (1,500,000) 78,638,988 270,500 Table of options The number of options in which the key management personnel of the Company held a relevant interest on 30 June 2013, are set out in the following table.

66 2013 Annual Report
Notes to the financial statements forming part of the f inanc ia l statements for the f inancia l year ended 30 June 2013
2013 2012 2013 2012
Hilton Brett 14/03/08 1/02/09 5 years 0.345 ‐ 1,000,000 ‐ 1,000,000 1,000,000 ‐
Hilton Brett 14/03/08 1/02/10 5 years 0.345 ‐ 1,000,000 ‐ 1,000,000 1,000,000 ‐
Hilton Brett 14/03/08 1/02/11 5 years 0.345 ‐ 1,000,000 ‐ 1,000,000 1,000,000 ‐
Hilton Brett (a)
28/03/13 28/03/16 3 years 0.345 3,000,000 ‐ 3,000,000 ‐ ‐ 3,000,000
3,000,000 3,000,000 3,000,000 3,000,000 3,000,000 3,000,000
Other employees 17/04/07 Various 5 years 0.172 ‐ 200,000 ‐ 200,000 200,000 ‐
Other employees 28/05/09 Various 5 years 0.307 1,000,000 1,000,000 ‐ 500,000 ‐ 1,000,000
Other employees 4/01/10 Various 5 years 0.452 6,500,000 6,500,000 ‐ 2,900,000 ‐ 6,500,000
Other employees 23/08/10 Various 5 years 0.589 2,600,000 2,600,000 ‐ 650,000 ‐ 2,600,000
Other employees 24/08/11 Various 5 years 0.570 2,550,000 2,550,000 ‐ ‐ ‐ 2,550,000
Share Sale options 14/12/10 30/06/15 6 years 0.660 1,500,000 1,500,000 ‐ ‐ ‐ 1,500,000
Other employees 28/02/13 Various 5 years 0.490 6,265,000 ‐ ‐ ‐ ‐ 6,265,000
Total 23,415,000 17,350,000 3,000,000 7,250,000 3,200,000 23,415,000
Number of Options/
shares Outstanding
Number of Options
Vested Options
exercised/
cancelled in
2013
Number of
options/
shares
outstanding
on 21 Aug
2013
Total held by key management personnel
Name Issue dateVesting
date
Exercise
date No.
of years
from
issue
Exercise
Price and
option
fee $
a) On 1 August 2012 200,000 options were exercised for a total consideration of $24,000 and on 28 February 2013,
3,000,000 options were exercised for a total consideration of $900,000. The aggregate amount receivable by the Company should all remaining options be exercised and paid for is $6.57 million.
b) The weighted average remaining contractual period for options outstanding on 30 June 2013 is 3.34 years. c) Additional disclosures relating to key management personnel are set out in the remuneration report contained
in the Director’s report.
Loans to Key Management Personnel 2013
Key Management
Personnel
Opening
Balance
1 July 2012
Loans
during the
year
Interest
charged
during the
year
Repayments
during the
year
Closing
balance on
30 June 2013
Ivan Hammerschlag 78,200 ‐ ‐ ‐ 78,200
David Gordon 78,200 ‐ ‐ ‐ 78,200
Stephen Kulmar 30,000 ‐ ‐ ‐ 30,000
Michael Cooper 272,000 ‐ ‐ ‐ 272,000
Michael Hirschowitz 272,000 ‐ ‐ ‐ 272,000
Hilton Brett 176,200 1,035,000 52,500 (52,500) 1,211,200
Total 906,600 1,035,000 52,500 (52,500) 1,941,600 Under the option plans approved by the shareholders at the Extraordinary General Meeting held on 19 December 2006, the company provided loans to option recipients in respect of the option fees payable for the right to acquire the options. Under the accounting standards both the loans and the corresponding movement in equity are only recognised in the financial statements when the options are exercised. During the period key management personnel exercised vested options and the interest free loans in respect of the relevant option fees have been recognised.

67 2013 Annual Report
Notes to the financial statements forming part of the f inanc ia l statements for the f inancia l year ended 30 June 2013
2012
Key Management
Personnel
Opening
Balance
26 June 2011
Loans
during the
year
Interest
charged
during the
year
Repayments
during the
year
Closing
balance on
1 July 2012
Ivan Hammerschlag 78,200 ‐ ‐ ‐ 78,200
David Gordon 78,200 ‐ ‐ ‐ 78,200
Stephen Kulmar 30,000 ‐ ‐ ‐ 30,000
Michael Cooper 204,000 68,000 ‐ ‐ 272,000
Michael Hirschowitz 170,000 102,000 ‐ ‐ 272,000
Hilton Brett 176,200 ‐ ‐ ‐ 176,200
Total 736,600 170,000 ‐ ‐ 906,600
e. Transactions with related parties
The following transactions occurred with related parties:
2013 2012
$ $
Services supplied by related parties
Noveltrade International Limited (a)
87,416 80,803
87,416 80,803
(a) Noveltrade International Limited, a company in which Ivan Hammerschlag and David Gordon both hold indirect minority interests, was involved in sourcing store fit‐outs from China on behalf of The Athlete’s Foot. These services were provided on an arms‐length basis.

68 2013 Annual Report
Notes to the financial statements forming part of the f inanc ia l statements for the f inancia l year ended 30 June 2013
2013 2012
$'000 $'000
30. CASH FLOW INFORMATION
Reconciliation of cash at the end of the financial year
Cash and cash equivalents (refer note 7) 14,785 14,464
Reconciliation of cash flow from operations with
10,515 9,188
Non‐cash flows in profit
Depreciation and amortisation 899 809
Share based expense 225 474
Provision for doubtful debts 66 89
Interest on deferred consideration 62 90
Foreign currency (gain)/loss ‐ 9
Provision for obsolescence of inventory 31 272
Changes in assets and liabilities
Receivables and other assets (1,654) (1,405)
Inventories 1,494 (6,388)
Trade creditors and provisions (953) 1,154
Tax assets and liabilities (5) 892
Cash provided by operating activities 10,680 5,184
Profit after income tax from continuing operations
Cash at the end of the financial year as shown in the Statement
of Cash Flows is reconciled to items in the Statement of
Financial Position as follows:
31. SEGMENT INFORMATION
Accounting policies
Segment revenues and expenses are those directly attributable to the segments and include any joint revenue and expenses where a reasonable basis of allocation exists. Segment assets include all assets used by a segment and consist principally of cash, receivables, inventories, intangibles and property, plant and equipment, net of allowances and accumulated depreciation and amortisation. Whilst most such assets can be directly attributed to individual segments, the carrying amount of certain assets used jointly by two or more segments is allocated to the segments on a reasonable basis. Segment liabilities consist principally of accounts payable, employee entitlements, accrued expenses, provisions and borrowings. Segment assets and liabilities do not include deferred income tax balances.

69 2013 Annual Report
Notes to the financial statements forming part of the f inanc ia l statements for the f inancia l year ended 30 June 2013
Business Segments
The operating segments are those that are considered by the chief operating decision makers, being the senior management team and the Board, in monitoring the performance of, and making strategic decisions in relation to the continuing operations of the business. The segments are based on the main continuing business units operational in the business and are as follows:
The Athlete's Foot ‐ Franchisor and Retailer of general sports footwear. RCG Brands ‐ Wholesalers of Merrell, Caterpillar and Cushe branded footwear/apparel in Australia.
2013 2012 2013 2012 2013 2012 2013 2012 2013 2012
$'000 $'000 $'000 $'000 $'000 $'000 $'000 $'000 $'000 $'000
Corporate Stores (No.) 3 2 8 4 ‐ ‐ ‐ ‐ 11 6
Online Stores (No) 1 1 ‐ ‐ 1 1
Franchise Stores (No.) 142 144 ‐ ‐ ‐ ‐ ‐ ‐ 142 144
Total (No.) 146 147 8 4 ‐ ‐ ‐ ‐ 154 151
Total Group Sales (including
franchised stores) 205,121 202,353 33,446 24,756 ‐ ‐ ‐ ‐ 238,567 227,109
Corporate Store Sales 5,384 4,367 5,607 1,794 ‐ ‐ ‐ ‐ 10,991 6,161
Wholesale Sales ‐ ‐ 27,839 22,962 ‐ ‐ (4,686) (3,252) 23,153 19,710
Sales to Customers 5,384 4,367 33,446 24,756 ‐ ‐ (4,686) (3,252) 34,144 25,871
Net Revenue from Franchising activity 15,779 15,402 ‐ ‐ ‐ 46 ‐ ‐ 15,779 15,448
Realised and unrealised FX gain ‐ ‐ ‐ (9) ‐ ‐ ‐ ‐ ‐ (9)
Other Income 704 930 38 15 ‐ ‐ ‐ ‐ 742 945
Dividend received ‐ ‐ ‐ ‐ 15,000 10,000 (15,000) (10,000) ‐ ‐
Total Revenue (a)
21,867 20,699 33,484 24,762 15,000 10,046 (19,686) (13,252) 50,665 42,255
Less: Employee benefits expense 4,294 3,892 4,842 3,384 1,198 1,222 ‐ ‐ 10,334 8,498
Less: Rental expenses on operating
leases 854 889 1,451 632 109 90 ‐ ‐ 2,414 1,611
Less: Total Other Expenses 4,489 3,871 22,186 16,685 922 1,109 (4,765) (2,914) 22,832 18,751
EBITDA from continuing operations 12,230 12,047 5,005 4,061 12,771 7,625 (14,921) (10,338) 15,085 13,395
Less: Depreciation and Amortisation 617 372 168 72 115 117 ‐ ‐ 900 561
EBIT from continuing operations 11,613 11,675 4,837 3,989 12,656 7,508 (14,921) (10,338) 14,185 12,834
Net Interest received 153 26 ‐ ‐ 695 854 848 880
Segment profit before tax from
continuing operations 11,766 11,701 4,837 3,989 13,351 8,362 (14,921) (10,338) 15,033 13,714
Segment Assets 17,715 16,057 16,061 15,629 26,089 25,731 (3,146) (2,971) 56,719 54,446
Segment Liabilities 3,622 3,132 4,498 4,404 3,848 3,796 (174) (696) 11,794 10,636
Total
Year ended Year ended Year ended Year ended
Intercompany
Eliminations
Year ended
The Athlete's
FootRCG Brands Unallocated
Unallocated Segment refers to RCG Corporate which provides company secretarial, legal, financial, human resources
management, investor and public relations services.
Excludes assets and liabilities relating to Shoe Superstore at 1 July 2012.

70 2013 Annual Report
Notes to the financial statements forming part of the f inanc ia l statements for the f inancia l year ended 30 June 2013
(a) Reconciliation with Revenue in Note 4 is as follows:
2013 2012
$'000 $'000
Revenue as per Note 2 51,513 43,135
Interest received (848) (880)
Other gains and losses ‐ (10)
Total Revenue per segment accounts
above 50,665 42,245
Total
32. DISCONTINUED OPERATION
On 20 February 2013, Shoe Superstore Group Pty Ltd was placed into Voluntary Administration. The creditors approved a Deed of Company Arrangement on (DoCA) on 27 May 2013. The Deed Administrators are in the process of finalising the arrangement. The results of the discontinued operations are set out below. The comparative loss and cash flows from discontinued operations have been re‐presented to include the operations classified as discontinued in the current year. Loss for the year from discontinued operations included in the consolidated statement of profit or loss and other comprehensive income
2013 2012
$'000 $'000
Revenue 6,149 8,921
Other Income 67 85
Total Revenue 6,216 9,006
Expenses 7,337 9,444
Loss before tax from operation (1,121) (438)
Loss on impairment of assets
Impairment of goodwill (934) ‐
Impairment of property, plant and equipment (1,651) ‐
Impairment of other net assets (1,938) ‐
Attributable income tax benefit 967 98
Loss for the year from discontinued operations (4,677) (340)
Cash flows from discontinued operation
Net cash used in operating activities (208) (196)
Net cash used in investing activities 290 382
Net cash used in financing activities ‐ ‐
Net cash flows 82 186

71 2013 Annual Report
Notes to the financial statements forming part of the f inanc ia l statements for the f inancia l year ended 30 June 2013
33. SUBSEQUENT EVENTS
Significant events which have taken place between the end of the financial year and the date of this report are as follows: Payment of dividend
On 21 August 2013 the Company declared an ordinary fully franked final dividend of 2.25 cents per share to be paid on 26 September 2013 to shareholders registered on the record date of 10 September 2013.
34. CONTINGENT LIABILITY
a. The parent entity has bank guarantees outstanding as of 30 June 2013 amounted to approximately $545,347. These are guarantees entered into in relation to the debts of its subsidiaries. ($597,426 in 2012).
b. The subsidiaries of the Company have entered into operating lease commitments with landlords in their capacity as head lessor for stores operated by the franchisees. However, the franchisees have simultaneously undertaken to meet the rental commitments through back‐to‐back licence agreements. In addition, some franchisees have provided bank guarantees (generally for a maximum period of 3 months’ rent) and in some instances personal guarantees to the landlords of the properties. The Company and its subsidiaries would become liable in the event of a default by any franchisee. The maximum possible exposure would be $69.6 million (2012: $77.1 million), comprising less than one year $18.5 million (2012: $19.7 million); between one and five years $47.8 million (2012: $51.7 million) and more than 5 years $3.3 million (2012: $5.7 million). This would arise only in the event that all franchisees defaulted at the same time.
35. COMPANY DETAILS
The registered office and principal place of business is: RCG Corporation Limited 719, Elizabeth Street Waterloo, NSW 2017 Australia

72 2013 Annual Report
Directors’ declaration
In accordance with a resolution of the board of directors of RCG Corporation Limited, we declare that:
In the opinion of the directors: a. the financial statements and notes of the consolidated entity are in accordance with the Corporations
Act 2001, including:
(i) giving a true and fair view of the consolidated entity’s financial position as at 30 June 2013 and of its performance for the financial year ended on that date; and
(ii) complying with Accounting Standards, the Corporations Regulations 2001 and other mandatory professional reporting requirements; and
b. there are reasonable grounds to believe that the Company will be able to pay its debts as and when they become due and payable.
c. the audited remuneration disclosures set out on pages 22 to 26 of the Director’s report comply with section 300A of the Corporations Act 2001.
d. The directors have been given the declarations required by S295A of the Corporations Act 2001.
e. The attached financial statements and notes thereto are in compliance with International Financial Reporting Standards, as stated in Note 1 to the financial statements.
This declaration is made in accordance with a resolution of the directors.
Ivan Hammerschlag Hilton Brett Chairman CEO Sydney, 21 August 2013

73 2013 Annual Report
Independent audit report

74 2013 Annual Report
Independent audit report

75 2013 Annual Report
Additional information
Australian Securities Exchange Additional Information for RCG Corporation Limited Shareholder Information (As at 7 August 2013)
Top 20 holders of ordinary shares
Rank Name Units % of Units
1 J P MORGAN NOMINEES AUSTRALIA LIMITED 25,856,510 10.28
2 TIDEREEF PTY LIMITED (a)
16,787,302 6.67
3 HSBC CUSTODY NOMINEES (AUSTRALIA) LIMITED 12,042,376 4.79
4 UBS WEALTH MANAGEMENT AUSTRALIA NOMINEES PTY LTD 11,116,798 4.42
5 RIVAN PTY LTD (b)
9,991,650 3.97
6 GRAHGER CAPITAL SECURITIES PTY LTD 9,000,000 3.58
7 MICHAEL COOPER (c)
8,142,857 3.24
8 MICHAEL HIRSCHOWITZ (d)
8,142,857 3.24
9 NATIONAL NOMINEES LIMITED 7,763,373 3.09
10 VAMICO PTY LIMITED ( c)
7,586,456 3.02
11 HILTON BRETT (e)
7,300,000 2.90
12 BNP PARIBAS NOMS PTY LTD 7,250,001 2.88
13 CITICORP NOMINEES PTY LIMITED 6,719,444 2.67
14 OMNIDAY PTY LIMITED (d)
5,686,456 2.26
15 GRAHGER CAPITAL SECURITIES PTY LTD 5,500,000 2.19
16 RIVAN PTY LTD (b)
5,395,651 2.15
17 RASTANA HOLDINGS PTY LIMITED ( e)
4,166,666 1.66
18 RBC INVESTOR SERVICES AUSTRALIA NOMINEES PTY LTD 4,000,000 1.59
19 GRAHGER CAPITAL SECURITIES PTY LTD 3,900,000 1.55
20 TIDEREEF PTY LIMITED (a)
2,539,093 1.01
Total of top 20 shareholdersholders 168,887,490 67.14
Total remaining holders balance 82,655,717 32.86
(a) Ivan Hammerschlag, a non‐executive director has a relevant interest. (b) David Gordon, a non‐executive director has a relevant interest. (c) Michael Cooper, an executive director has a relevant interest. (d) Michael Hirschowitz, an executive director has a relevant interest. (e) Hilton Brett, an executive director has a relevant interest.

76 2013 Annual Report
Additional information
Distribution schedule of ordinary shares
Range Total holders Units % of Issued Capital
1 ‐ 1,000 104 61,172 0.02
1,001 ‐ 5,000 566 1,890,487 0.75
5,001 ‐ 10,000 459 3,682,781 1.46
10,001 ‐ 100,000 799 25,684,414 10.21
Greater than 100,000 144 220,224,353 87.56
Total 2,072 251,543,207 100.00
Unmarketable parcels The number of shareholders holding less than a marketable parcel of shares is 54 representing 12,152 shares. Substantial shareholders The following substantial holder notices have been received by the Company:
Name
Number of shares in which the
holder and its associates have
relevant interest
Hunter Hall Investment Management Ltd 22,894,408
Ivan Hammerschlag 19,326,395
Michael Cooper 16,229,313
David Gordon 18,887,301
Michael Hirschowitz 14,329,313
Grahger Group 22,700,000 Voting Rights All ordinary shares carry one vote per share without restriction Restricted Securities Nil

77 2013 Annual Report
Corporate directory
Company Details RCG Corporation Limited ABN 85 108 096 251
Directors Ivan Hammerschlag (Chairman)
Michael Cooper
Michael Hirschowitz
David Gordon
Hilton Brett
Stephen Kulmar
Company Secretary Michael Hirschowitz Registered and Administration Office 719 Elizabeth Street Waterloo, Sydney
NSW 2017, Australia Telephone: 02 8310‐0000 Facsimile: 02 8310‐0066 Email: [email protected] Web: www.rcgcorp.com.au
Share Registry Computershare Investor Services Pty Limited
ACN 078 279 277 GPO Box 2975 Melbourne VIC 3001 Telephone: 1300 850 505
Auditors Deloitte Touche Tohmatsu 225 George St, Sydney NSW 2000, Australia
Bankers Westpac Banking Corporation Securities Exchange Listing Australian Securities Exchange (ASX Code: RCG)