2013 annual report - akita-drillingusa.com · as a company founded to break through traditional...
TRANSCRIPT

2013 ANNUAL REPORT
GREATER DEPTHS. NEW HEIGHTS.

ABOUT XTREMEXtreme rilling an Coil Services Cor . esigns, uil s an o erates a eet o
high-s eci cation rilling rigs an coile tu ing well service units. ur eet is
equipped with numerous patented and proprietary technologies developed to
improve sa ety, per ormance and mo ility. We currently operate our X R drilling
rigs and XSR coiled tubing units under contracts with oil and natural gas explora-
tion and production companies and integrated oil eld service providers in orth
America and Asia.
A YEAR OF NEW BENCHMARKS
REVENUE (in millions) OPERATING DAYS EBITDA (in millions)
2009 2009 20092010 2010 2010
$229.8
8,068
$73.7
$174.5
6,550$35.0$104.0
4,602
$21.9
$85.6
3,247$22.1
$99.4
3,899 $26.0
2011 2011 20112012 2012 20122013 2013 2013

As a company founded to break through traditional barriers in our industry, Xtreme Drilling and Coil Services has been setting records almost since inception. However, nothing in our history quite compares to 2013.
It was an exceptional year on many fronts, as we established
new industry benchmarks with our eld performance and
surged past previous high-water marks for the company,
both operationally and nancially.
Our primary goal for 2013 was optimizing our operations
and maximizing ef ciency to capitalize on the aggressive
eet expansion we undertook previously. We are proud to
report we accomplished that mission, as last year was our
busiest and most productive ever for both the XDR and
XSR divisions of our company. Our operating days topped
8,000 for the rst time ever, pushing our revenue to a
record $229,823,000 even as we maintained the same rig
count. Other key nancial metrics hit historic levels as well,
including pro t margins and EBITDA.
Xtreme also made great strides in strengthening the balance
sheet, using our growing free cash ows to substantially
reduce leverage incurred during our $200+ million capital
expansion program. We are pleased that the marketplace
recognized this progress, as our share price increased by
118 in 2013.
Also of note, our business came full circle in an important
sense in 2013. Xtreme s history is deeply rooted in driving
innovation in coiled tubing drilling technology, and we have
numerous patents to show for it. However, in recent years
we shifted our focus almost entirely to traditional jointed
pipe drilling in response to the rapid proliferation of horizontal
wells in orth American resource plays. ow we are excited
to be putting that breakthrough coiled tubing technology to
work again this time, for ultra-deep completions in those
same long-lateral wells.
Commencing operations with XSR Unit #116 in the Eagle Ford

It was a landmark year for both our XDR drilling division and XSR coiled tubing division.
XDR/XSRBUSINESS DIVISIONS After growing our XDR drilling eet dramatically in prior years,
we maximized utilization levels on an unprecedented scale in
2013. At year-end, all 21 of these Tier 1 rigs were working
mostly on long-term contracts. Total operating days for the
XDR division reached an all-time high of 6,834.
Geographically, we continued to focus on two of North
America s most proli c shale oil plays. Our largest presence
is in the Niobrara Shale in Colorado and Wyoming, where
12 XDR rigs were working at year-end. There, our high-
speci cation rigs continued to set the performance standard
with superior mobility that accelerates drilling and reduces
move times between well pads. We also further grew our
presence in the Bakken Shale in North Dakota, where we had
six rigs working at year-end. The other three XDR rigs were
working in Canada.
“Our leading-edge technology and outstanding service quality
truly set us apart in the XDR division s core operating areas
of Colorado and North Dakota,” Chief Executive Of cer Tom
Wood noted. “The market remains strong for Xtreme s drilling
services in the Bakken and Niobrara, as our operational
ef ciency and best-in-class mobilization times continue to
drive down costs for our customers.”
Eagle Ford 4 XSR COILED TUBING UNITS
XDR RIGS ACTIVE
100% At Year-End
XDR ALL-TIME HIGH UTILIZATION
6,834 Operating Days
Niobrara Shale 12 XDR DRILLING RIGS
Bakken Shale 6 XDR DRILLING RIGS
Canada 3 XDR DRILLING RIGS

The XDR division s high utilization levels are expected to
continue into the future, as our large backlog of contracted
work grew to approximately 6,000 days last year. We are also
expanding into new international markets which may offer
greater opportunity for our smaller rigs.
For our XSR coiled tubing division, last year was full of
accomplishment. After launching our extended-reach
completion services in 2012, we have rapidly established
ourselves as a market leader in the Eagle Ford Shale in South
Texas. We are also the longest-reach provider in this basin,
which has the largest production of oil and natural gas liquids
among U.S. resource plays. In fact, we set an Eagle Ford
record in 2013 by reaching a total measured depth of
20,344 feet with coiled tubing including a lateral length
over 10,000 feet. These distinctions allowed us to increase
both our service rates and utilization levels, as total operating
days for the XSR division reached a new high of 1,234.
In addition to superior reach, Xtreme has established a
reputation for outstanding performance with our proprietary
large-diameter coil. XSR units are substantially accelerating
plug millouts and reducing stuck-in-hole incidents and
ran 16.8 million feet of coiled tubing in 2013 without ever
leaving pipe downhole. We are especially proud of that last
accomplishment as it highlights the unmatched reliability
of our coiled tubing services. With that stellar track record,
Xtreme is not only completing ultra-deep wells, but also
gaining traction in the 14,000-16,000 foot market as operators
seek to mitigate risk.
Xtreme is achieving these successes by leveraging
innovations we originally developed for coiled tubing drilling.
For example, our XSR units utilize electric injectors and
PLC-based controls for greater power and precision, and
2-5 8” coiled tubing for extended lateral reach. Recognizing
the advantages, the market is increasingly favoring these
technologies over traditional features such as hydraulic
power and smaller-diameter coil. We believe this clearly
differentiates Xtreme in the marketplace and offers our
customers a value proposition no other company can match.
Additionally, two XSR units continue to perform re-entry
drilling in Saudi Arabia, where we signed new three-year
contracts with the operators we have worked with there
since 2010. This project has been a tremendous technical and
nancial success for the company.
XSR EAGLE FORD RECORD
20,344 ftTotal Measured Depth
XSR ALL-TIME HIGH UTILIZATION
1,234Operating Days

After keeping the rig count unchanged and concentrating on our core markets last year, Xtreme’s focus will return to
and geographical footprint.
Our burgeoning XSR division will add new coiled tubing units
as it pursues expansion into West Texas. We anticipate
funding this initiative entirely with free cash, given the
strength of our operating revenues.
“As our reputation for excellence in coiled tubing services
continued to build in 2013, customer demand in the Eagle Ford
began to consistently outstrip our capacity,” Chief Executive
Of cer Tom Wood commented. “Xtreme is moving quickly to
meet that demand and pursue expansion into other
markets by making new-build XSR units the focus of our
2014 capital investment program.”
Also in 2014, the XDR division will explore opportunities to
move smaller drilling rigs into new international markets as
the push toward deeper wells and larger equipment continues
in the U.S. These efforts were already yielding results early in
the year, when we signed a multi-year contract to relocate
two XDR 300 rigs to India.
Finally, even with all that we accomplished last year, we see
opportunities to further optimize our operations and drive
pro t margins. These efforts will continue in 2014, as we seek
to maximize our return on previous capital investments while
building on the unprecedented successes of the past year.
North AmericaIndia
Saudi Arabia
INTERNATIONAL PRESENCE
(Note: India operations expected to commence in Q3 2014)
Coiled tubing re-entry drilling in Saudi Arabia

Xtreme Drilling and Coil Services Corp. For the year ended December 31, 2013 March 11, 2014
Management’s Discussion and Analysis ($ in thousands, except where indicated)
Management for Xtreme Drilling and Coil Services Corp. (“Xtreme” or the “Company”), formerly known as Xtreme Coil Drilling Corp., based this Management’s Discussion and Analysis (“MD&A”) on operating and financial results for the three and twelve months ended December 31, 2013, and provides comparative information for the three and twelve months ended December 31, 2012. Management recommends reading this discussion and analysis of Xtreme’s financial condition and results of operations in conjunction with the Company’s audited consolidated financial statements for the year ended December 31, 2013 and related notes (the “Audited Financial Statement”). Xtreme’s common shares trade on the Toronto Stock Exchange under the symbol “XDC”. The Company prepares its consolidated financial statements and comparative information in accordance with International Financial Reporting Standards (“IFRS”) as issued by the International Accounting Standards Board (“IASB”). Unless otherwise stated, all amounts are expressed in Canadian dollars (“CAD”). Management’s discussion and analysis is based on information available as of March 11, 2014. Forward-Looking Information This MD&A, or documents incorporated herein, contains forward-looking information (“FLI”). FLI is typically contained in statements with words such as “anticipate”, “believe”, “estimate”, “expect”, “plan”, “schedule”, “intend”, “propose” or similar words suggesting future outcomes or an outlook. More particularly, this MD&A contains FLI that may relate to contracting, marketing, financing, construction, modifications, deployment, operation, and utilization of drilling and service rigs in the Company’s current and future fleet. Although Xtreme believes expectations reflected in such FLI are reasonable, readers should not place undue reliance on them because Xtreme can give no assurance they will prove to be correct. There are many factors that could cause FLI not to be correct, including risks and uncertainties inherent in the Company's business. FLI is based on certain factors and assumptions including, but not limited to: the assessment of current and projected future drilling, well servicing and related operations; ongoing and future strategic business alliances, negotiations and opportunities to enter new, extend or complete existing contracts; the availability and cost of financing; currency exchange rates; timing and magnitude of capital expenditures; expenses and other variables affecting rig operation, modification and construction; the ability and commitment of vendors to provide rig component equipment, services and supplies, including labor, in a cost-effective and timely manner; the issuance of applied-for patents; changes in tax structures and rates; and, government regulations. Although Xtreme considers the assumptions used to prepare this MD&A reasonable, based on information available to management as of March 11, 2014, ultimately the assumptions may prove to be incorrect. FLI is also subject to certain factors, including risks and uncertainties, which could cause actual results to differ materially from management's current expectations. These factors include, but are not limited to: the cyclical nature of drilling and well servicing market demand, currency exchange rates and commodity prices; access to credit and to equity markets; the availability and retention of qualified personnel; vendor-provided equipment components and services; and, competition for customers. Management’s assumptions considered the following: compliance with the terms of the Company’s current credit facility; ongoing access to key services, supplies and components required to continue operating and maintaining equipment, including fuel; continued successful performance of drilling, well servicing and related equipment; expectations regarding gross margin; recruitment and retention of qualified personnel; continuation or extension of existing long-term, multi-well contracts or other contracts; revenue expectations related to shorter-term drilling and well servicing opportunities; willingness and ability of customers to remit amounts owing to Xtreme in accordance with normal industry practices; and, management of accounts receivable in direct relation to revenue generation.
5

Xtreme Drilling and Coil Services Corp. For the year ended December 31, 2013 March 11, 2014
Management’s Discussion and Analysis ($ in thousands, except where indicated)
In preparing this MD&A, management considered the following risk factors: fluctuations in crude oil and natural gas prices, as well as supply and demand; fluctuation in currency exchange and interest rates; financial stability of Xtreme’s customers; current and future applications for Xtreme's proprietary technology; related services provided by, and competition from, other drilling and well servicing contractors; regulatory and economic conditions in regions where Xtreme operates; environmental constraints; changes to government legislation; international trade barriers or restrictions; and, where appropriate, global economic, political and military events. FLI contained in this MD&A about prospective results of operations, financial position or cash provided by operating activities is based on assumptions about future events, including economic conditions and proposed courses of action, and on management’s assessment of relevant information currently available. Readers are cautioned such financial outlook information contained in this MD&A is not appropriate for purposes other than for which it is disclosed here. Readers should not place undue importance on FLI and should not rely on this information as of any other date. Except as required pursuant to applicable securities laws, Xtreme disclaims any intention, and assumes no obligation, to update publicly or revise FLI to reflect actual results, whether as a result of new information, future events, changes in assumptions, changes in factors affecting such FLI or otherwise. Description of the Business Xtreme designs, builds, and operates a fleet of high-specification drilling rigs and coiled tubing well service units featuring leading-edge proprietary technology including alternating current (“AC”) high capacity coil injectors, deep re-entry drilling capability, modular transportation systems and continuous integration of in-house advances in methodologies. Currently Xtreme operates two service lines: drilling services (“XDR”) and coil services (“XSR”) under contracts with oil and natural gas exploration and production companies and integrated oilfield service providers in Canada, the United States of America (“United States” or “US”) and the Kingdom of Saudi Arabia (“Saudi Arabia”). Xtreme continues to evaluate opportunities for additional projects within, and beyond, these core regions of operation. Drilling Services In the United States, Xtreme contracts to drill primarily in the resource plays of the Williston Basin and the Greater Denver-Julesburg Basin. Xtreme’s XDR 300, 400 and 500 rigs are designed for these deeper geological zones. In Canada, the XDR 200 rigs are working primarily in Canada’s unconventional plays. Xtreme recently entered into a letter agreement for two XDR 300 drilling rigs on a multi-year drilling contract in an international market. This agreement provides a long-term solution for these two 300 series rigs as they are optimal for the contracted market. The operation is expected to begin in the third quarter of 2014. At December 31, 2013, the Company had all 21 drilling rigs working. Coil Services Xtreme offers some of the deepest-reach coiled tubing service units in the world. The Company continues to respond to the rapid growth of drilling activity in North American resource plays, customizing units for operations in deeper shale formations. Xtreme deployed the first of the new extended-reach units in early 2012 to the Eagle Ford Shale in South Texas. In Saudi Arabia, Xtreme has two coiled tubing units deployed on a deep horizontal re-entry drilling project in the Middle East, which are critical to overall reserves recovery. The target re-entry wells are deep and technically challenging, have multi-lateral well profiles and require under-balanced drilling.
6

Xtreme Drilling and Coil Services Corp. For the year ended December 31, 2013 March 11, 2014
Management’s Discussion and Analysis ($ in thousands, except where indicated)
At December 31, 2013, the Company had five of the seven coil services rigs working. Fleet The following table summarizes the Company’s fleet as of March 11, 2014.
Model Drilling Rigs Coil Service Units
XSR 200 4
XSR 200 Plus 3
XDR 200 4
XDR 300 4
XDR 400 2
XDR 500 11
21 7
Utilization rates are a key statistic for the drilling industry since they measure revenue volume and influence pricing. During 2013, Xtreme achieved 8,063 operating days, which corresponded to an average utilization rate of 85 percent. The drilling and coil services units had utilization of 89 percent and 69 percent, respectively. It should be noted that Xtreme calculates utilization rates based upon drilling rigs and coil service units available for service. Standby revenue is taken into account in Xtreme’s utilization statistic.
During the fourth quarter of 2013, the Company adjusted the methodology for calculating utilization in the US coil services division. Available operating days is now defined as 22 days per month for each unit as opposed to total calendar days as calculated in the past. This was based on the fact that on average the coil service units in the US spends 5 to 6 days mobilizing between wells and 2 to 3 days on preventive maintenance during the month. Utilization for prior periods presented has been restated to conform to the current presentation.
From time to time, the Company enters into drilling contracts for extended terms. At December 31, 2013, Xtreme had 13 XDR rigs with multi-year contracts that extend into 2014 or beyond. Of these contracts, six are anticipated to expire in 2014 and seven in 2015.
Patents At March 11, 2014, Xtreme held 36 patents related to technologies for drilling with coiled tubing and conventional drill pipe as well as for certain rig and equipment transportation methods. These patents have been issued in the United States, Canada, Eurasia, Mexico, Indonesia, Australia, and Russia. Xtreme has more than 34 patent-related applications in progress in the United States, Canada and other worldwide jurisdictions.
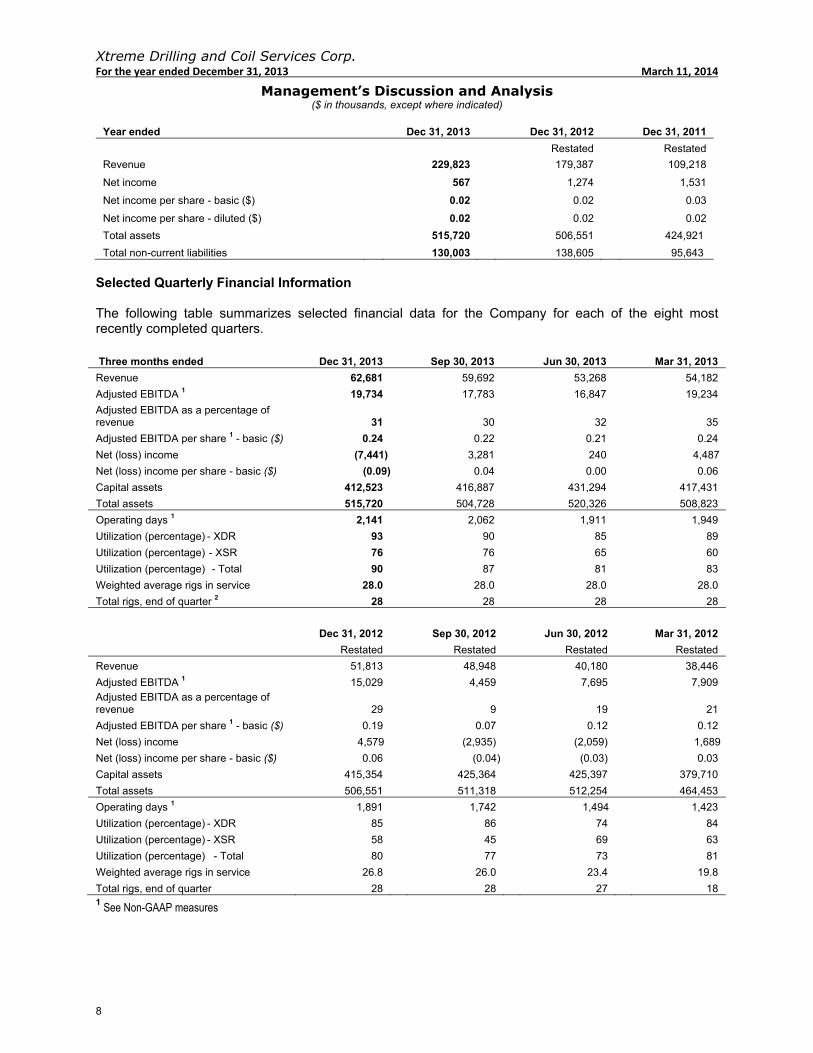
Selected Annual Information The following table summarizes selected financial data for the Company for each of the three most recently completed financial years. The information set forth below should be read in conjunction with the consolidated Annual Financial Statements.
7
Xtreme Drilling and Coil Services Corp. For the year ended December 31, 2013 March 11, 2014
Management’s Discussion and Analysis ($ in thousands, except where indicated)
Year ended Dec 31, 2013 Dec 31, 2012 Dec 31, 2011
Restated Restated
Revenue 229,823 179,387 109,218
Net income 567 1,274 1,531
Net income per share - basic ($) 0.02 0.02 0.03
Net income per share - diluted ($) 0.02 0.02 0.02
Total assets 515,720 506,551 424,921
Total non-current liabilities 130,003 138,605 95,643
Selected Quarterly Financial Information The following table summarizes selected financial data for the Company for each of the eight most recently completed quarters. Three months ended Dec 31, 2013 Sep 30, 2013 Jun 30, 2013 Mar 31, 2013
Revenue 62,681 59,692 53,268 54,182
Adjusted EBITDA 1 19,734 17,783 16,847 19,234
Adjusted EBITDA as a percentage of revenue 31 30 32 35
Adjusted EBITDA per share 1 - basic ($) 0.24 0.22 0.21 0.24
Net (loss) income (7,441) 3,281 240 4,487
Net (loss) income per share - basic ($) (0.09) 0.04 0.00 0.06
Capital assets 412,523 416,887 431,294 417,431
Total assets 515,720 504,728 520,326 508,823
Operating days 1 2,141 2,062 1,911 1,949
Utilization (percentage) - XDR 93 90 85 89
Utilization (percentage) - XSR 76 76 65 60
Utilization (percentage) - Total 90 87 81 83
Weighted average rigs in service 28.0 28.0 28.0 28.0
Total rigs, end of quarter 2 28 28 28 28
Dec 31, 2012 Sep 30, 2012 Jun 30, 2012 Mar 31, 2012
Restated Restated Restated Restated
Revenue 51,813 48,948 40,180 38,446
Adjusted EBITDA 1 15,029 4,459 7,695 7,909 Adjusted EBITDA as a percentage of revenue 29 9 19 21
Adjusted EBITDA per share 1 - basic ($) 0.19 0.07 0.12 0.12
Net (loss) income 4,579 (2,935) (2,059) 1,689
Net (loss) income per share - basic ($) 0.06 (0.04) (0.03) 0.03
Capital assets 415,354 425,364 425,397 379,710
Total assets 506,551 511,318 512,254 464,453
Operating days 1 1,891 1,742 1,494 1,423
Utilization (percentage) - XDR 85 86 74 84
Utilization (percentage) - XSR 58 45 69 63
Utilization (percentage) - Total 80 77 73 81
Weighted average rigs in service 26.8 26.0 23.4 19.8
Total rigs, end of quarter 28 28 27 18 1 See Non-GAAP measures
8

Xtreme Drilling and Coil Services Corp. For the year ended December 31, 2013 March 11, 2014
Management’s Discussion and Analysis ($ in thousands, except where indicated)
Quarter by Quarter Analysis
2012 Analysis
In the first quarter of 2012, the core drilling services segment continued to perform well. The US drilling segment delivered two new-build XDR 500 rigs and three rigs previously idle in the US began working in Canada. In the US, the coil services segment rolled out at a slower than desired pace due to pump delays and personnel shortages. The Saudi Arabia coil services segment continued strong performance of the two units.
In the second quarter the Company continued to focus on the deployment of the new build XDR drilling rigs as well as building the XSR coil service segment. In the US, operating days increased over the first quarter, a result of the deployment of the new-build XDR drilling rigs. Canada drilling services segment had a slow post break up start based on very wet weather in Alberta. The US XSR business was still challenging due to the softness in the market coupled with a slower roll out than anticipated. While the operating days doubled in the second quarter, the Company was not profitable in this segment based on higher than anticipated coil expenses in the period. The Saudi Arabian coil services segment continued to be the Company strongest operating segment.
In the third quarter, Xtreme recognized significant revenue growth with all but one of the new-build XDR 500 rigs completed and in operation. Revenue and Adjusted EBITDA was from the previous period. Both of these represent the highest quarterly results the Company had achieved to date. Canada drilling services segment continued to be slow as a result of a decrease in horizontal well permits. The US coil services segment was scaled back to one operating unit in the third quarter, which negatively impacted financial results. In Saudi Arabia, the coil services segment operating days decreased slightly, but operations continued to excess expectations.
In the fourth quarter of 2012, the Company mobilized the final XDR 500 drilling rig in the United States. The Company had 19 or 21 drilling rigs working in the United States and three drilling rigs working in Canada. The US coil services segment had two of five units working and the Saudi Arabia coil services segment continued strong performance on the two units working.
2013 Analysis
In the first quarter of 2013, Xtreme’s drilling services segment continued to be the largest revenue segment in the Company, mostly attributable to the US drilling operations. The Canadian operations were slowed as a result of fewer horizontal well permits issued. The US coil services segment began to hit a stride on the latter half of the first quarter and the Saudi Arabian coil services segment continued strong performance as a result of strong utilization.
In the second quarter of 2013, the Company continued to focus on improving financial and operating performance. Utilization in the US XDR drilling segment remained strong with only one idle rig. In Canada the three XDR rigs that operated in the second quarter had a significantly higher utilization than industry average; however margins remain under pressure based on lower day rates. The US XSR business had a significant increase in utilization and operating margin during the second quarter. The Saudi XSR business maintained strong utilization and margins during the second quarter.
In the third quarter, the US drilling services segment was negatively impacted by substantial rain and flooding in Colorado. The Company had nine XDR rigs operating in Colorado for September. During the quarter, repair and maintenance expenses were up per operating day due to the associated equipment failures, additional maintenance on a previously stacked rig and modifications to a XDR 300 rig that
9

Xtreme Drilling and Coil Services Corp. For the year ended December 31, 2013 March 11, 2014
Management’s Discussion and Analysis ($ in thousands, except where indicated)
switched customers. These expenses along with increased inventory consumption decreased operating margin in the US as compared to the second quarter. The Canadian drilling services segment had higher utilization due to increased operating days. The coil services segment had another strong quarter based on improvement of performance and pricing. In the US coil services segment’s operating margin increased due to additional operating days.
At the end of the fourth quarter of 2013, the US drilling services segment had all rigs working, resulting in the Company highest revenue and operating days to date. Operating days and utilization was down slightly in Canada. The US coil services segment utilization increased slightly over the third quarter. Additionally, two XSR units continued to have strong performance in Saudi Arabia.
Year over Year Analysis
An assessment or comparison of Xtreme’s quarterly results, at any given time, requires consideration of seasonality. From a seasonality perspective, Xtreme operates rigs in Canada; therefore, operations are impacted by weather and seasonal factors. The winter season, which incorporates the first quarter, is generally a busy period in Canada as oil and gas companies take advantage of frozen conditions to move drilling rigs into regions which might otherwise be inaccessible to heavy equipment due to swampy conditions. The second quarter normally encompasses a slow period referred to as spring break-up. During this period, melting conditions result in temporary municipal road bans that effectively prohibit the movement of drilling rigs. The third and fourth quarters in Canada are usually representative of average activity levels. See also “Seasonality of Operations” below for a discussion of how the Company’s operations in areas of the United States and in Saudi Arabia are impacted by weather and seasonal factors. Operating days increased four percent sequentially to 2,141 and 23 percent year-over-year. Revenue increased five percent sequentially to $62,681 and 21 percent year-over-year. The Company recorded a net loss for the fourth quarter of $7,441 compared to a net income of $3,281 for the sequential period. The decrease in income from the third quarter is primarily driven by the impact of accelerated depreciation, a result of changes in estimated useful lives of certain assets, the write-off of certain property and equipment, the write-off of unamortized deferred loan fees, a result of extinguishment of the previous credit facility, and the unfavorable impact of the foreign exchange loss of $3,025, a result of translating the Company’s USD denominated debt to CAD as of the end of the fourth quarter. The month end exchange rate used to translate the USD-denominated assets and liabilities to CAD was 1.0636 at December 31, 2013 (1.1105 at March 11, 2014).
Adjusted EBITDA for the fourth quarter of $19,734 increased 11 percent sequentially and 31 percent year-over-year. Adjusted EBITDA was $0.24 per share, a $0.02 per share increase sequentially and a $0.05 per share increase from the prior year period. Capital assets of $412,523 decreased one percent year-over-year. Capital and total assets decreased due primarily to the sale of an XSR rig package during the first quarter of 2013, lower capital expenditures, and an increase in depreciation expense due to a change in methodology and change in useful lives. During the fourth quarter of 2013, the Company had capital additions of approximately $3,900, compared to approximately $6,600 in the third quarter and approximately $9,200 in the prior year quarter.
10

Xtreme Drilling and Coil Services Corp. For the year ended December 31, 2013 March 11, 2014
Management’s Discussion and Analysis ($ in thousands, except where indicated)
Results of Operations - Year ended December 31, 2013 compared to December 31, 2012 Revenue, Operating Expenses and Gross Margin
2013 2012 Change % Change
Restated
Revenue 229,823 179,387 50,436 28
Operating expenses 144,873 127,835 17,038 13
Gross margin 84,950 51,552 33,398 65
Operating days 8,063 6,550 1,513 23
Revenue per operating day 28.5 27.4 1.1 4
Operating expenses per operating day 18.0 19.5 (1.5) (8)
Gross margin per operating day 10.5 7.9 2.6 33
Rig utilization (percentage) – XDR 89 83 6 7
Rig utilization (percentage) – XSR 69 58 11 19
Rig utilization (percentage) - Total 85 78 7 9
Revenue increased to $229,823 for the year ended December 31, 2013, from $179,387 for the year ended December 31, 2012. Stronger market conditions and the improvement in performance of coil servicing operations in the United States resulted in the Company achieving 8,063 operating days in 2013 compared to 6,550 in 2012. The stronger market and service offerings for the coil services in the United States had a positive impact on day rates, as the average revenue per operating day increased from $27.4 to $28.5. Revenue improvements were broadly based, as drilling revenue increased as a result of increased demand for the Company’s rigs, more operating days and better utilization in both drilling and coil services in 2013. Drilling services revenue for the year ended December 31, 2013, was $173,147 compared to $141,440 for the year ended December 31, 2012. Coil services revenue for the year ended December 31, 2013, was $56,676 compared to $37,947 for the year ended December 31, 2012. Rig utilization for drilling services was 89 percent for the year ended December 31, 2013, compared to 83 percent for the year ended December 31, 2012. Rig utilization for coil services was 69 percent for the year ended December 31, 2013, compared to 58 percent for the year ended December 31, 2012. Operating expenses increased to $144,873 for the year ended December 31, 2013, from $127,835 for the year ended December 31, 2012. This increase in total operating expenses was the result of increased activity, offset by a decrease in field-level expenses, a result of cost control measure implemented in late 2012. Operating expenses are tied to activity levels and were $18.0 per operating day, for the year ended December 31, 2013, compared to $19.5 per operating day, for the year ended December 31, 2012. Operating expenses for drilling services were $108,752 in 2013 compared to $95,922 in 2012. Operating expenses for coil services for 2013 were $36,121 compared to $31,913 for 2012. Gross margin was $84,950 for the year ended December 31, 2013, up from $51,552 for the year ended December 31, 2012. The improvement in gross margin was a combined result of higher rig utilization, higher day rates, and a decrease in operating costs at the field level, a result of cost control measures implemented in late 2012. The gross margin per operating day increased from $7.9 for the year ended December 31, 2012, to $10.5 for the year ended December 31, 2013.
11

Xtreme Drilling and Coil Services Corp. For the year ended December 31, 2013 March 11, 2014
Management’s Discussion and Analysis ($ in thousands, except where indicated)
General and Administrative (“G&A”) Expenses
2013 2012 % Change
G&A expenses 11,280 10,226 10
G&A expenses were $11,280 in 2013 compared to $10,226 in 2012. The Company recovered legal costs of approximately $510 and $1,600 in 2013 and 2012, respectively, a result of the settlement of litigation. Exclusive of the recovery of these legal costs, G&A would be $11,790 and $11,826 for the years ended December 31, 2013 and 2012, respectively. The decrease from 2012 is primarily due to a decrease in legal fees. G&A expenses represented five percent of total revenue in 2013 compared to six percent in 2012.
Impairment of Accounts Receivable
2013 2012 % Change
Impairment of accounts receivable 72 6,235 (99)
Impairment of accounts receivable was $72 for 2013, a decrease from $6,235 in 2012. In September 2013, the Company recovered approximately $2,690 relating to previously billed amounts plus legal fees of approximately $510. The carrying amount of trade accounts receivable was approximately $2,760, resulting in an additional write-off of approximately $70 for uncollected amounts. In 2012, the Company won a judgement against a former customer for certain billed amounts, but recognized an impairment loss of $1,500 related to the write-off of uncollected amounts. In 2012, the Company also entered into a confidential legal settlement with another former customer and recovered certain previously billed amounts, but recognized an impairment loss of $4,735. Change in Fair Value of Non-controlling Interest Liability
2013 2012 % Change
Change in fair value of non-controlling interest liability 1,481 (829) n/a
Change in fair value of non-controlling interest liability was $1,481 in 2013 compared to ($829) in 2012. The change in fair value of non-controlling interest liability relates to the increase in the fair value of the put option held by the minority interest partner.
Depreciation and Amortization 2013 2012 % Change
Depreciation and amortization 51,495 27,569 87
As of January 1, 2013, the Company changed its estimate of depreciable lives of rig components and related equipment from units-of-production to straight-line, resulting in an increase of depreciation expense of approximately $4,600. Exclusive of the increase due to the change in estimate, the increase in depreciation and amortization from $27,569 to $51,495 is mostly attributable to approximately $9,500 in depreciation of capital spares not previously depreciated under units-of-production and the write-off of certain equipment as a result of a physical asset verification for approximately $3,900. Effective October 1, 2013, the Company accelerated depreciation on capital spares and certain other rig equipment for approximately $3,500 for capital spares which are not expected to be fully recoverable.
12

Xtreme Drilling and Coil Services Corp. For the year ended December 31, 2013 March 11, 2014
Management’s Discussion and Analysis ($ in thousands, except where indicated)
Stock-Based Compensation
2013 2012 % Change
Stock-based compensation 1,321 1,245 6
Stock-based compensation was $1,321 for 2013, an increase from $1,245 in 2012. The increase is due primarily to the impact of restricted stock units issued during the year, offset by fewer awards of options to purchase future shares were granted. Foreign Exchange
2013 2012 % Change
Foreign exchange loss (gain) 6,494 (1,790) n/a
Foreign exchange gains and losses result directly from the fluctuation in values of the USD relative to the CAD on the assets and liabilities denominated in USD. Operations in the United States and Saudi Arabia are denominated primarily in USD. For 2013 the Company recorded a foreign exchange loss of $6,494 compared to a foreign exchange gain of $1,790 for 2012. The foreign exchange loss was due primarily to the realized loss on translation of the USD-denominated debt as a result of the higher value of the USD relative to the CAD. Interest Expense
2013 2012 % Change
Interest expense 7,866 7,919 1
Interest expense for 2013, was $7,866 compared to $7,919 for 2012. Included in interest expense in 2013 is $1,199 of deferred loan fees written-off due to repayment of borrowings under the prior financing arrangements. Exclusive of the deferred loan fees interest expense for 2013 would have been $6,677. The decrease from 2012 is a result of lower interest rates during the period. Exclusive of the write-off, the effective interest rate for 2013 was 5.1 percent, compared to 7.4 percent for 2012.
Income (loss) Before Tax
2013 2012 % Change
Income (loss) before tax 4,920 (3,126) n/a
Income before tax for 2013 was $4,920, an increase from loss before tax of $3,126 recorded in 2012. The increase is due primarily to the increase in revenue and gross margin, offset by the increase in depreciation expense, the unfavorable impact of the foreign exchange loss reflected in the year ended December 31, 2013, and the write-off of deferred loan fees.
Income Tax 2013 2012 % Change
Income tax expense (benefit) 4,353 (4,400) n/a
Income tax expense for 2013, was $4,353 compared to income tax benefit of $4,400 recorded in the prior year period. The increase from the prior year is due to increase in pre-tax income.
Net Income 2013 2012 % Change
Net income 567 1,274 (55)
Net income for 2013 was $567, a decrease from net income $1,274 recorded in 2012. The decrease in the respective periods is due primarily to the increase in depreciation expense, the unfavorable impact of
13

Xtreme Drilling and Coil Services Corp. For the year ended December 31, 2013 March 11, 2014
Management’s Discussion and Analysis ($ in thousands, except where indicated)
the foreign exchange loss, the write-off of deferred loan fees, and the increase in income tax expense, offset by the increase in revenue and gross margins. Results of Operations – Three months ended December 31, 2013 compared to December 31, 2012 Revenue, Operating Expenses and Gross Margin
Three months ended
Dec 31, 2013 Dec 31, 2012 Change % Change
Restated
Revenue 62,681 51,813 10,868 21
Operating expenses 39,631 34,467 5,164 15
Gross margin 23,050 17,346 5,704 33
Operating days 2,141 1,891 250 13
Revenue per operating day 29.3 27.4 1.9 7
Operating expenses per operating day 18.5 18.2 0.3 2
Gross margin per operating day 10.8 9.2 1.6 17
Rig utilization (percentage) – XDR 93 85 8 9
Rig utilization (percentage) – XSR 76 58 18 31
Rig utilization (percentage) - Total 90 80 10 13
Revenue increased to $62,681 for the three months ended December 31, 2013, from $51,813 for the three months ended December 31, 2012. The expansion of the drilling rig fleet, coupled with stronger market conditions, and the the improvement in performance of coil servicing operations in the United States resulted in the Company achieving 2,141 operating days compared to 1,891 in 2012. The stronger market and service offerings for the coil services in the United States had a positive impact on day rates, as the average revenue per operating day increased from $27.4 to $29.3. Revenue improvements were broadly based, as drilling revenue increased as a result of increased demand for the Company’s rigs, more operating days and better utilization in both drilling and coil services in 2013. Drilling services revenue for the three months ended December 31, 2013 was $45,286 compared to $40,701 for the three months ended December 31, 2012. Coil services revenue for the three months ended December 31, 2013, was $17,395 compared to $11,112 for the three months ended December 31, 2012. Rig utilization for drilling services was 93 percent for the three months ended December 31, 2013, compared to 85 percent for the three months ended December 31, 2012. Rig utilization for coil services was 76 percent for the three months ended December 31, 2013, compared to 58 percent for the three months ended December 31, 2012. Operating expenses increased to $39,631 for the three months ended December 31, 2013, from $34,467 for the three months ended December 31, 2012. Operating expenses are tied to activity levels and were $18.5 per operating day, for the three months ended December 31, 2013 and 2012. The increase in total operating expenses was the result of increased activity coupled with an increase in repair and maintenance costs. Operating expenses for drilling services were $29,660 for the three months ended December 31, 2013, compared to $26,583 for the three months ended December 31, 2012. Operating expenses for coil services for 2013 were $9,970 for the three months ended December 31, 2013 compared to $7,884 for the three months ended December 31, 2012. Gross margin was $23,807 for the three months ended December 31, 2013, up from $17,346 for the three months ended December 31, 2012. The improvement in gross margin was a combined result of higher rig utilization, higher day rates, and a decrease in operating costs at the field level, a result of cost
14

Xtreme Drilling and Coil Services Corp. For the year ended December 31, 2013 March 11, 2014
Management’s Discussion and Analysis ($ in thousands, except where indicated)
control measures implemented in late 2012. The gross margin per operating day increased from $9.2 for the three months ended December 31, 2012, to $11.1 for the three months ended December 31, 2013. General and Administrative (“G&A”) Expenses
Dec 31, 2013 Dec 31, 2012 % Change
G&A expenses 3,316 2,316 43
G&A expenses increased to $3, 316 in the fourth quarter of 2013 from $2,316 in the fourth quarter of 2012, due primarily to an increase in professional fees. G&A expenses represented five percent of total revenue in the fourth quarter of 2013 and 2012, respectively.
Change in Fair Value of Non-controlling Interest Liability
Three months ended
Dec 31, 2013 Dec 31, 2012 % Change
Change in fair value of non-controlling interest liability 2,375 1,022 n/a
Change in fair value of non-controlling interest liability was $2,375 in the fourth quarter of 2013 compared to $1,022 in the fourth quarter of 2012. The change in fair value of non-controlling interest liability relates to the increase in the fair value of the put option held by the minority interest partner.
Depreciation and Amortization
Three months ended
Dec 31, 2013 Dec 31, 2012 % Change
Depreciation and amortization 20,886 10,127 n/a
As of January 1, 2013, the Company changed its estimate of depreciable lives of rig components and related equipment from units-of-production to straight-line, resulting in an increase of depreciation expense of approximately $1,100. Exclusive of the increase due to the change in estimate, the increase in depreciation and amortization from $10,127 to $20,886 is mostly attributable to approximately $9,500 in depreciation of capital spares not previously depreciated under units-of-production and the write-off of certain equipment as a result of a physical asset verification of approximately $3,900. Effective October 1, 2013, the Company accelerated depreciation on capital spares for approximately $3,500 for capital spares which are not expected to be fully recoverable.
Stock-Based Compensation
Three months ended
Dec 31, 2013 Dec 31, 2012 % Change
Stock-based compensation 355 73 n/a
Stock-based compensation was $355 for the fourth quarter of 2013, an increase from $73 in the fourth quarter of 2012. The increase is due primarily to the awards of restricted stock units during the period.
15

Xtreme Drilling and Coil Services Corp. For the year ended December 31, 2013 March 11, 2014
Management’s Discussion and Analysis ($ in thousands, except where indicated)
Foreign Exchange
Three months ended
Dec 31, 2013 Dec 31, 2012 % Change
Foreign exchange loss 3,025 937 n/a
Foreign exchange gains and losses result directly from the fluctuation in values of the USD relative to the CAD on the assets and liabilities denominated in USD. Operations in the United States and Saudi Arabia are denominated primarily in USD. For the fourth quarter of 2013 the Company recorded a foreign exchange loss of $3,025 compared to a foreign exchange loss of $937 for the fourth quarter of 2012. The foreign exchange loss was due primarily to the realized loss on translation of the USD-denominated debt as a result of the higher value of the USD relative to the CAD. Interest Expense
Three months ended
Dec 31, 2013 Dec 31, 2012 % Change
Interest expense 2,588 2,408 7
Interest expense for the fourth quarter of 2013, was $2,588 compared to $2,408 for the fourth quarter of 2012. Included in interest expense in 2013 is $1,199 of deferred loan fees written-off due to repayment of borrowings under the prior financing arrangements. Exclusive of the deferred loan fees interest expense for 2013 would have been $1,389. The decrease from 2012 is a result of lower interest rates during the period. Exclusive of the write-off, the effective interest rate for 2013 was 4.5 percent, compared to 7.1 percent for 2012.
Impairment on Assets Held for Sale
Three months ended
Dec 31, 2013 Dec 31, 2012 % Change
Impairment on assets held for sale – 3,133 n/a
Impairment on assets held for sale for the fourth quarter of 2012 of $3,133 was a result of a difference between the sales price of certain assets sold to an independent third party, less selling costs, and the net book value of the assets of $12,441.
Loss Before Tax
Three months ended
Dec 31, 2013 Dec 31, 2012 % Change
Loss before tax 9,431 2,829 n/a
Loss before tax for the fourth quarter of 2013, was $9,431 reflecting an increase from loss before tax of $2,829 recorded in the fourth quarter of 2012. The increase is the increase in depreciation expense, the unfavorable impact of the foreign exchange loss, and the write-off of deferred loan fees, offset by an increase in revenue and gross margin, for three months ended December 31, 2013. Income Tax
Three months ended
Dec 31, 2013 Dec 31, 2012 % Change
Income tax benefit 1,990 6,656 n/a
16
Xtreme Drilling and Coil Services Corp. For the year ended December 31, 2013 March 11, 2014
Management’s Discussion and Analysis ($ in thousands, except where indicated)
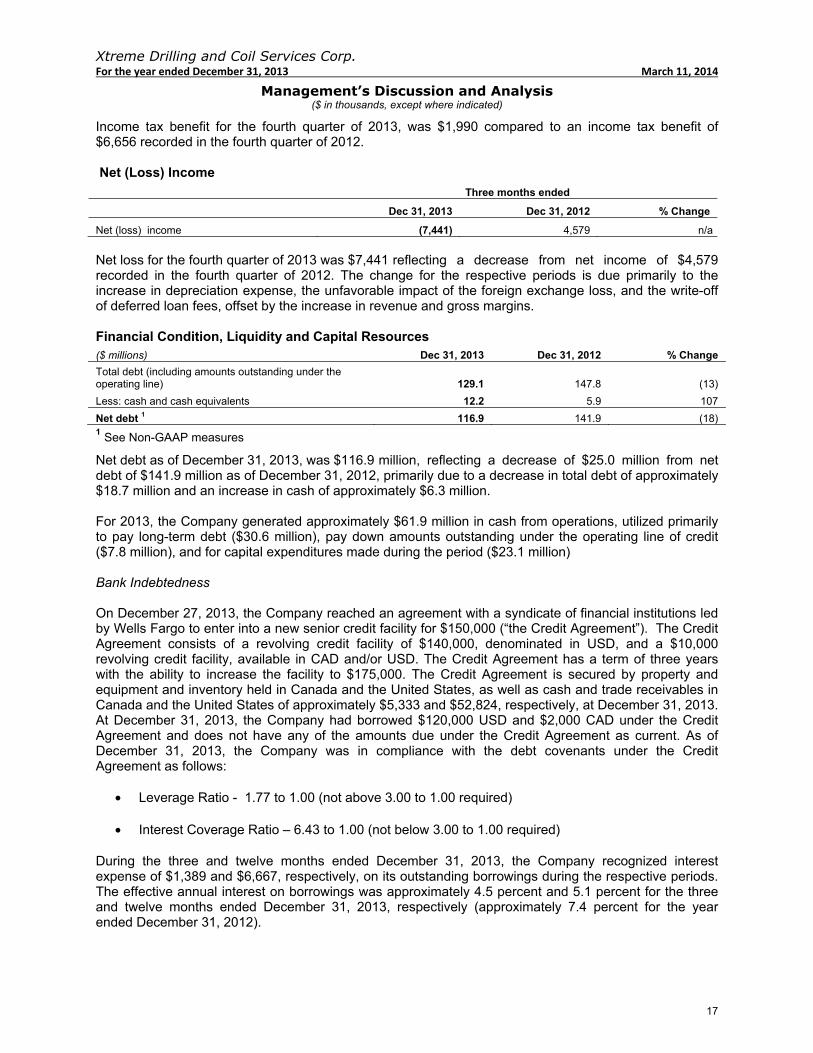
Income tax benefit for the fourth quarter of 2013, was $1,990 compared to an income tax benefit of $6,656 recorded in the fourth quarter of 2012. Net (Loss) Income
Three months ended
Dec 31, 2013 Dec 31, 2012 % Change
Net (loss) income (7,441) 4,579 n/a
Net loss for the fourth quarter of 2013 was $7,441 reflecting a decrease from net income of $4,579 recorded in the fourth quarter of 2012. The change for the respective periods is due primarily to the increase in depreciation expense, the unfavorable impact of the foreign exchange loss, and the write-off of deferred loan fees, offset by the increase in revenue and gross margins. Financial Condition, Liquidity and Capital Resources ($ millions) Dec 31, 2013 Dec 31, 2012 % Change
Total debt (including amounts outstanding under the operating line) 129.1 147.8 (13)
Less: cash and cash equivalents 12.2 5.9 107
Net debt 1 116.9 141.9 (18) 1 See Non-GAAP measures
Net debt as of December 31, 2013, was $116.9 million, reflecting a decrease of $25.0 million from net debt of $141.9 million as of December 31, 2012, primarily due to a decrease in total debt of approximately $18.7 million and an increase in cash of approximately $6.3 million. For 2013, the Company generated approximately $61.9 million in cash from operations, utilized primarily to pay long-term debt ($30.6 million), pay down amounts outstanding under the operating line of credit ($7.8 million), and for capital expenditures made during the period ($23.1 million) Bank Indebtedness On December 27, 2013, the Company reached an agreement with a syndicate of financial institutions led by Wells Fargo to enter into a new senior credit facility for $150,000 (“the Credit Agreement”). The Credit Agreement consists of a revolving credit facility of $140,000, denominated in USD, and a $10,000 revolving credit facility, available in CAD and/or USD. The Credit Agreement has a term of three years with the ability to increase the facility to $175,000. The Credit Agreement is secured by property and equipment and inventory held in Canada and the United States, as well as cash and trade receivables in Canada and the United States of approximately $5,333 and $52,824, respectively, at December 31, 2013. At December 31, 2013, the Company had borrowed $120,000 USD and $2,000 CAD under the Credit Agreement and does not have any of the amounts due under the Credit Agreement as current. As of December 31, 2013, the Company was in compliance with the debt covenants under the Credit Agreement as follows:
• Leverage Ratio - 1.77 to 1.00 (not above 3.00 to 1.00 required)
• Interest Coverage Ratio – 6.43 to 1.00 (not below 3.00 to 1.00 required)
During the three and twelve months ended December 31, 2013, the Company recognized interest expense of $1,389 and $6,667, respectively, on its outstanding borrowings during the respective periods. The effective annual interest on borrowings was approximately 4.5 percent and 5.1 percent for the three and twelve months ended December 31, 2013, respectively (approximately 7.4 percent for the year ended December 31, 2012).
17
Xtreme Drilling and Coil Services Corp. For the year ended December 31, 2013 March 11, 2014
Management’s Discussion and Analysis ($ in thousands, except where indicated)
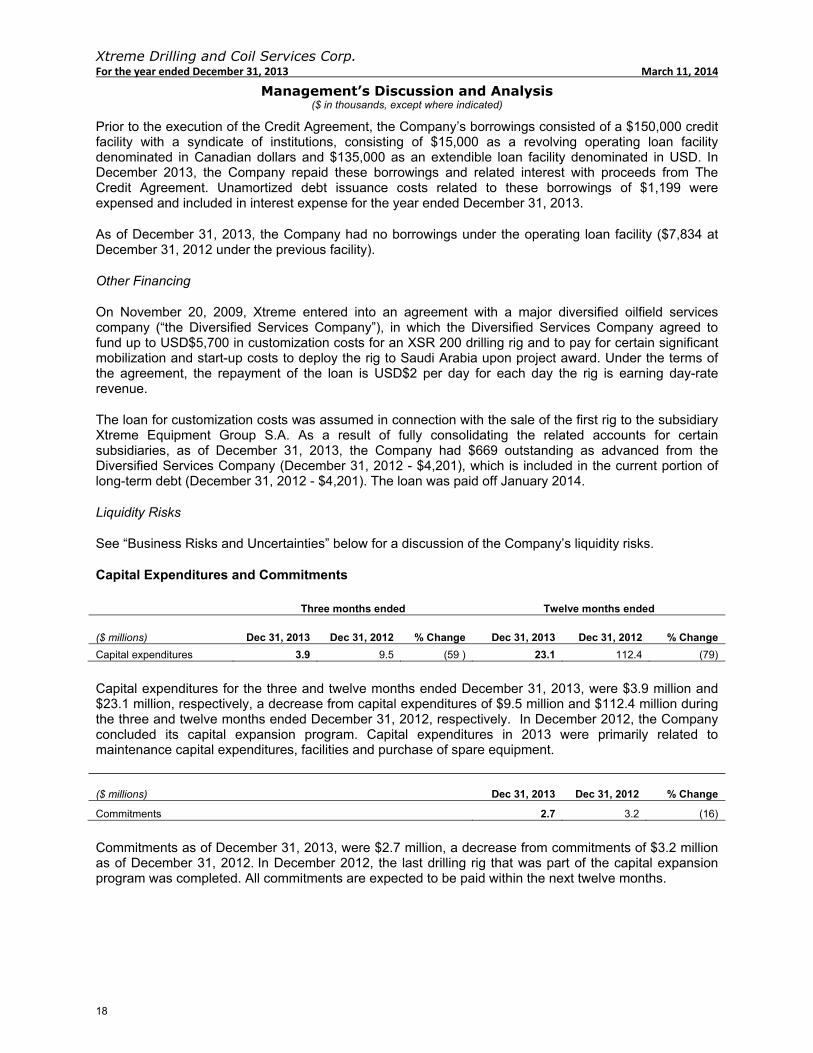
Prior to the execution of the Credit Agreement, the Company’s borrowings consisted of a $150,000 credit facility with a syndicate of institutions, consisting of $15,000 as a revolving operating loan facility denominated in Canadian dollars and $135,000 as an extendible loan facility denominated in USD. In December 2013, the Company repaid these borrowings and related interest with proceeds from The Credit Agreement. Unamortized debt issuance costs related to these borrowings of $1,199 were expensed and included in interest expense for the year ended December 31, 2013.
As of December 31, 2013, the Company had no borrowings under the operating loan facility ($7,834 at December 31, 2012 under the previous facility).
Other Financing
On November 20, 2009, Xtreme entered into an agreement with a major diversified oilfield services company (“the Diversified Services Company”), in which the Diversified Services Company agreed to fund up to USD$5,700 in customization costs for an XSR 200 drilling rig and to pay for certain significant mobilization and start-up costs to deploy the rig to Saudi Arabia upon project award. Under the terms of the agreement, the repayment of the loan is USD$2 per day for each day the rig is earning day-rate revenue.
The loan for customization costs was assumed in connection with the sale of the first rig to the subsidiary Xtreme Equipment Group S.A. As a result of fully consolidating the related accounts for certain subsidiaries, as of December 31, 2013, the Company had $669 outstanding as advanced from the Diversified Services Company (December 31, 2012 - $4,201), which is included in the current portion of long-term debt (December 31, 2012 - $4,201). The loan was paid off January 2014.
Liquidity Risks
See “Business Risks and Uncertainties” below for a discussion of the Company’s liquidity risks.
Capital Expenditures and Commitments Three months ended Twelve months ended
($ millions) Dec 31, 2013 Dec 31, 2012 % Change Dec 31, 2013 Dec 31, 2012 % Change
Capital expenditures 3.9 9.5 (59 ) 23.1 112.4 (79)
Capital expenditures for the three and twelve months ended December 31, 2013, were $3.9 million and $23.1 million, respectively, a decrease from capital expenditures of $9.5 million and $112.4 million during the three and twelve months ended December 31, 2012, respectively. In December 2012, the Company concluded its capital expansion program. Capital expenditures in 2013 were primarily related to maintenance capital expenditures, facilities and purchase of spare equipment.
($ millions) Dec 31, 2013 Dec 31, 2012 % Change
Commitments 2.7 3.2 (16)
Commitments as of December 31, 2013, were $2.7 million, a decrease from commitments of $3.2 million as of December 31, 2012. In December 2012, the last drilling rig that was part of the capital expansion program was completed. All commitments are expected to be paid within the next twelve months.
18

Xtreme Drilling and Coil Services Corp. For the year ended December 31, 2013 March 11, 2014
Management’s Discussion and Analysis ($ in thousands, except where indicated)
Contractual Obligations The table below illustrates various contractual obligations which the Company expects to repay, including any interest payments required.
Less than 1 1 – 3 4 –5 After 5
Contractual obligations Total Year Years Years Years
Accounts payable and accrued liabilities 28,051 28,051 – – _
Long-term debt 130,358 669 129,689 – _
Commitments 2,710 2,710 – – _
Operating leases 3,158 979 1,283 896 _
Total contractual obligations 164,277 32,409 130,972 896 _
Segmented Information The Company determines its operating segments based on internal information regularly reviewed by management to allocate resources and assess performance. The Company operates in three geographic areas within two operating segments, which are Drilling Services and Coil Services. Such services are provided in Canada, the United States and internationally. Beginning in the first quarter of 2012, the Company revised the presentation format of its segment disclosure to better align with the Company’s service offerings and management structure. As a result of this change in presentation, the Company reports revenue and expenses and assets based on the Drilling Services, Coil Services, and Corporate and Other segments. This change reflects the Company’s evolution into new market offerings and management’s focus on allocating resources and measuring performance. This change in segment reporting had no impact on the Company’s consolidated statement of financial position, statement of income or cash flows for any periods.
• Drilling represents assets, revenues and expenses associated with the fleet of high specification drilling rigs contracted with oil and natural gas exploration and production companies and integrated oilfield service providers. These drilling rigs are designed for deeper geological zones.
• Coil Services represents the assets, revenues and expenses associated with Xtreme’s coiled
tubing well service units, targeting primarily post fracture treatment cleanouts, re-entry, and horizontal drilling. The change in the fair value of non-controlling interest liability is allocated to coil services.
• Corporate and Other represents the general and administrative costs of the Company,
depreciation and amortization expense, interest expense, realized and unrealized foreign exchange gains and losses and employee incentive compensation charges. The Company views its corporate segment as a support function that provides assistance to more than one segment.
The tables below segment the Company’s revenue, operating earnings (loss) and assets by service line and geographic area.
19

Xtreme Drilling and Coil Services Corp. For the year ended December 31, 2013 March 11, 2014
Management’s Discussion and Analysis ($ in thousands, except where indicated)
Drilling
Services Coil Services Corporate and
Other Total
For the year ended December 31, 2013
Revenue 173,147 56,676 – 229,823
Income (loss) before tax 64,395 20,555 (80,030) 4,920
Total assets 367,686 104,350 43,684 515,720
Total liabilities 12,457 24,997 134,032 171,486
Intangible assets – – 3,917 3,917
Capital additions 17,281 5,456 322 23,059
Drilling
Services Coil Services Corporate and
Other Total
For the year ended December 31, 2012
Revenue 141,440 37,947 – 179,387
Income (loss) before tax 45,518 6,033 (54,677) (3,126)
Total assets 343,874 125,297 37,380 506,551
Total liabilities 11,082 21,504 155,958 188,544
Intangible assets – – 4,220 4,220
Capital additions 89,093 23,234 30 112,357
Canada United States Other
International Total
For the year ended December 31, 2013
Revenue 14,860 185,064 29,899 229,823
Total assets 64,138 403,812 47,770 515,720
Canada United States Other
International Total
For the year ended December 31, 2012
Revenue 12,527 140,675 26,185 179,387
Total assets 58,765 394,280 53,506 506,551 Outstanding Shares Data
Dec 31, 2013 Dec 31, 2012
Balance, beginning of period 80,790,315 65,666,266
Shares issued during the period – 15,001,750
Employee options exercised 371,665 122,299
Restricted stock units exercised 103,752 –
Balance, end of period 81,265,732 80,790,315
At December 31, 2013, the Company had outstanding options to purchase 3,161,335 common shares (December 31, 2012 – 3,464,000) at a weighted average exercise price of $2.98 per share (December 31, 2012 – $3.13). The Company’s shareholders approved an Incentive and Retention Plan on April 18, 2012 designed to provide the Company’s directors, officers and key employees and consultants with an opportunity to
20
Xtreme Drilling and Coil Services Corp. For the year ended December 31, 2013 March 11, 2014
Management’s Discussion and Analysis ($ in thousands, except where indicated)
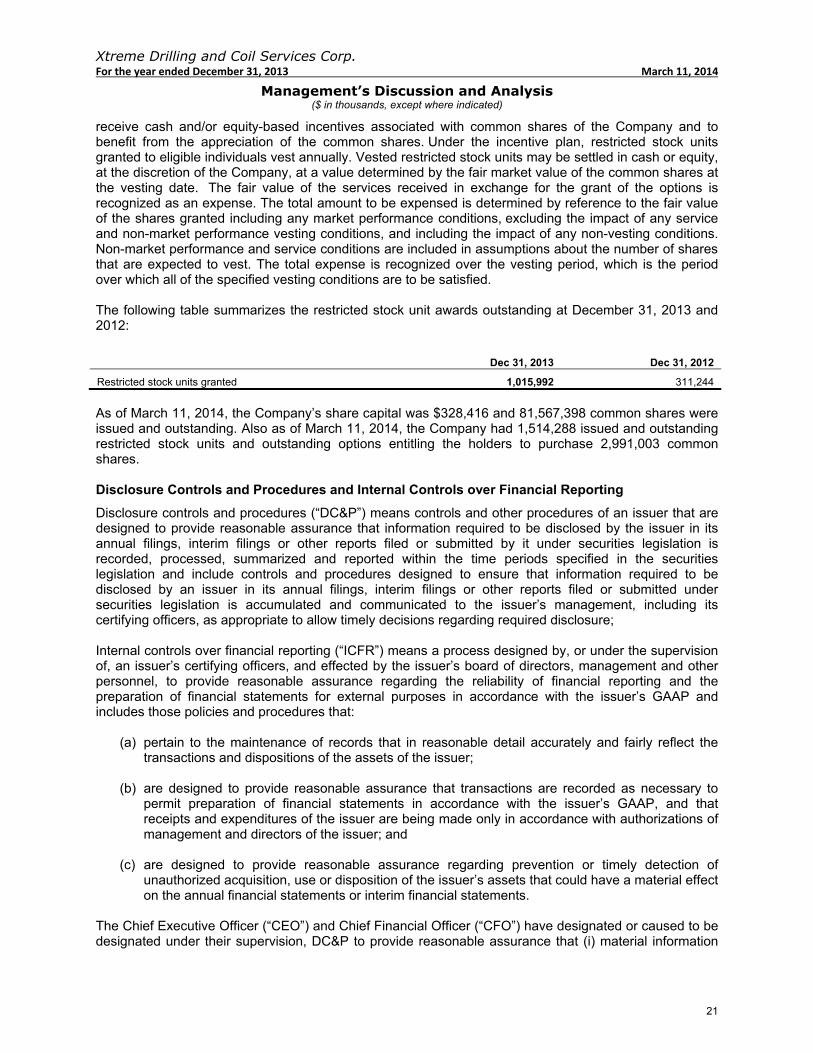
receive cash and/or equity-based incentives associated with common shares of the Company and to benefit from the appreciation of the common shares. Under the incentive plan, restricted stock units granted to eligible individuals vest annually. Vested restricted stock units may be settled in cash or equity, at the discretion of the Company, at a value determined by the fair market value of the common shares at the vesting date. The fair value of the services received in exchange for the grant of the options is recognized as an expense. The total amount to be expensed is determined by reference to the fair value of the shares granted including any market performance conditions, excluding the impact of any service and non-market performance vesting conditions, and including the impact of any non-vesting conditions. Non-market performance and service conditions are included in assumptions about the number of shares that are expected to vest. The total expense is recognized over the vesting period, which is the period over which all of the specified vesting conditions are to be satisfied. The following table summarizes the restricted stock unit awards outstanding at December 31, 2013 and 2012:
Dec 31, 2013 Dec 31, 2012
Restricted stock units granted 1,015,992 311,244
As of March 11, 2014, the Company’s share capital was $328,416 and 81,567,398 common shares were issued and outstanding. Also as of March 11, 2014, the Company had 1,514,288 issued and outstanding restricted stock units and outstanding options entitling the holders to purchase 2,991,003 common shares. Disclosure Controls and Procedures and Internal Controls over Financial Reporting
Disclosure controls and procedures (“DC&P”) means controls and other procedures of an issuer that are designed to provide reasonable assurance that information required to be disclosed by the issuer in its annual filings, interim filings or other reports filed or submitted by it under securities legislation is recorded, processed, summarized and reported within the time periods specified in the securities legislation and include controls and procedures designed to ensure that information required to be disclosed by an issuer in its annual filings, interim filings or other reports filed or submitted under securities legislation is accumulated and communicated to the issuer’s management, including its certifying officers, as appropriate to allow timely decisions regarding required disclosure; Internal controls over financial reporting (“ICFR”) means a process designed by, or under the supervision of, an issuer’s certifying officers, and effected by the issuer’s board of directors, management and other personnel, to provide reasonable assurance regarding the reliability of financial reporting and the preparation of financial statements for external purposes in accordance with the issuer’s GAAP and includes those policies and procedures that:
(a) pertain to the maintenance of records that in reasonable detail accurately and fairly reflect the transactions and dispositions of the assets of the issuer;
(b) are designed to provide reasonable assurance that transactions are recorded as necessary to
permit preparation of financial statements in accordance with the issuer’s GAAP, and that receipts and expenditures of the issuer are being made only in accordance with authorizations of management and directors of the issuer; and
(c) are designed to provide reasonable assurance regarding prevention or timely detection of
unauthorized acquisition, use or disposition of the issuer’s assets that could have a material effect on the annual financial statements or interim financial statements.
The Chief Executive Officer (“CEO”) and Chief Financial Officer (“CFO”) have designated or caused to be designated under their supervision, DC&P to provide reasonable assurance that (i) material information
21

Xtreme Drilling and Coil Services Corp. For the year ended December 31, 2013 March 11, 2014
Management’s Discussion and Analysis ($ in thousands, except where indicated)
relating to the Company, including its consolidated subsidiaries, is made known to the CEO and CFO by others within those entities, particularly during the period in which the interim filings of the Company are prepared; and (ii) information required to be disclosed by the Company in its annual filings, interim filings or other reports filed or submitted by it under securities legislation is recorded, processed, summarized and reported within the time period specified in securities legislation. The CEO and CFO do not expect that DC&P will prevent or detect all errors, misstatements and fraud but are designed to provide reasonable assurance of achieving their objectives. A control system, no matter how well designed or operated, can only provide reasonable, not absolute, assurance that the objectives of the control system are met. In addition to the DC&P, the CEO and CFO have designed ICFR or caused them to be designed under their supervision to provide reasonable assurance regarding the reliability of financial reporting and the preparation of financial statements for external purposes in accordance with International Financial Reporting Standards. The Company’s ICFR may not prevent or detect all errors, misstatements and fraud. The design of internal controls must take into account cost-benefit constraints. A control system, no matter how well designed or operated, can only provide reasonable, not absolute, assurance that objectives of the control system are met. While the Company is continually enhancing its ICFR, no material changes were made during the year ended December 31, 2013, that would materially affect, or are reasonably likely to materially affect, the Company’s ICFR. Management concluded that the Company’s DC&P and ICFR were effective as of December 31, 2013. Non-GAAP Measures Certain supplementary measures in this MD&A do not have any standardized meaning as prescribed under IFRS and, therefore, are considered non-GAAP measures. These measures have been described and presented to provide shareholders and potential investors with additional information regarding the Company’s financial results, liquidity and ability to generate funds to finance its operations. These measures may not be comparable to similar measures presented by other entities, and are further explained as follows. For the three and twelve months ended December 31, 2012, operating days, rig utilization (percentage), weighted average rigs in service and completed rigs, includes 100 percent of the statistical rig data for the two rigs operating in Saudi Arabia which, for financial reporting purposes, is proportionally consolidated. Operating Days Operating days represent the total of all drilling, moving, standby and other revenue days for each drilling rig in the fleet during the period. Management uses operating days to measure rig utilization which quantifies the revenue-generating activity of the fleet of drilling rigs.
Rig Utilization Xtreme calculates rig utilization as total operating days for all rigs divided by total days in service for all rigs. During the fourth quarter of 2013, the Company adjusted the methodology for calculating utilization in the US coil services division. Available operating days is now defined as 22 days per month for each unit as opposed to total calendar days as calculated in the past. This was based on the fact that on average the coil service units in the US spends 5 to 6 days mobilizing between wells and 2 to 3 days on preventive maintenance during the month. Utilization for prior periods presented has been restated to conform to the current presentation. Gross Margin Gross margin represents revenue less operating expenses. Management believes gross margin is a useful supplemental measure of the financial performance of Xtreme’s principal business activities before
22

Xtreme Drilling and Coil Services Corp. For the year ended December 31, 2013 March 11, 2014
Management’s Discussion and Analysis ($ in thousands, except where indicated)
considering how activities are financed or taxed, as well as other expenses not closely associated with activity levels. The following is the calculation of gross margin.
2013 2012
Revenue 229,823 179,387
Less: Operating expenses 144,873 127,835
Gross margin 84,950 51,552
EBITDA
EBITDA is a measure of the Company’s operating profitability. EBITDA provides an indication of the results generated by the Company’s principal business activities prior to how these activities are financed, assets are depreciated and amortized, or how results are taxed in various jurisdictions. EBITDA is defined as net income (loss) before interest, income taxes, and depreciation and amortization.
2013 2012
Net income 567 1,274
Tax expense (benefit) 4,353 (4,400)
Interest expense 7,866 7,919
Amortization of intangibles 303 303
Depreciation of property and equipment 51,192 27,266
EBITDA 64,281 32,362
Adjusted EBITDA
Adjusted EBITDA is used by management and investors to analyze EBITDA (as defined above) prior to the effect of foreign exchange and share-based payment expense and is not intended to represent net earnings as calculated in accordance with IFRS. Adjusted EBITDA is calculated as follows:
2013 2012
EBITDA 64,281 32,362
Adjustments for non-cash items 9,317 (404)
Adjusted EBITDA 73,598 31,958
Adjusted EBITDA per share ($) 0.91 0.46
Net (loss) income per share ($) (0.09) 0.02
Adjusted EBITDA attributable to:
Owners of the parent 72,704 30,107
Non-controlling interest 894 1,851
73,598 31,958
Adjustment for non-cash items include share-based payment expenses, foreign exchange gains and losses, and non-recurring losses on damage to property and equipment. It is management’s view that these items referred to above are not normal operating costs and / or are non-cash operating expenses that should be added back to earnings as they are not reflective of sustainable, ongoing operations.
23

Xtreme Drilling and Coil Services Corp. For the year ended December 31, 2013 March 11, 2014
Management’s Discussion and Analysis ($ in thousands, except where indicated)
The adjustments for non-cash items are as follows:
2013 2012
Stock-based compensation 1,321 1,245
(Gain) loss on sale of equipment (132) 257
Foreign exchange (gain) loss 6,494 (1,790)
Change in fair value of non-controlling interest liability 1,481 (829)
Loss on damage of property and equipment – 538
Other expense 153 175
9,317 (404)
The Company believes Adjusted EBITDA and Adjusted EBITDA per share are important measures of operating performance because it allows management, investors and others to evaluate and compare core operating results, including the return on capital and operating efficiencies, from period to period by removing the impact of the capital structure (interest expense from outstanding debt), asset base (depreciation and amortization), tax consequences, other non-operating items and share-based compensation. Furthermore, the Company uses Adjusted EBITDA for business planning purposes and to evaluate and price potential acquisitions. In addition to its use by management, the Company also believes Adjusted EBITDA is a measure widely used by securities analysts, investors and others to evaluate the financial performance of the Company and other companies in the drilling services industry. Other companies may calculate Adjusted EBITDA differently, and therefore the Adjusted EBITDA presented by the Company may not be comparable to similarly titled measures of other companies.
Net Debt
Net debt is a measurement used by management and the investment community which is composed of total debt, including amounts outstanding under the operating line, less cash and cash equivalents. Critical accounting estimates and judgments The preparation of financial statements requires management to use judgment in applying its accounting policies and estimates and assumptions about the future. Estimates and other judgments are continuously evaluated and are based on management’s experience and other factors, including expectations about future events that are believed to be reasonable under the circumstances. Critical accounting judgments Significant judgments are used in the application of accounting policies related to the following material amounts recognized in the consolidated financial statements: Consolidation
See “New and amended standards adopted by the Company” below for a discussion of the Company’s decision to consolidate Xtreme Equipment Group S.A. and Xtreme Coil Drilling Saudi Arabia Ltd. at January 1, 2013.
Assessment of Impairment Indicators For its long lived assets with determinable useful lives, Xtreme assesses for impairment at least annually as well as when circumstances suggest that the carrying amount exceed the recoverable amount, as well as the internal and external factors to determine if an impairment test is warranted.
24

Xtreme Drilling and Coil Services Corp. For the year ended December 31, 2013 March 11, 2014
Management’s Discussion and Analysis ($ in thousands, except where indicated)
Cash Generating Units Assets are grouped into cash generating units for the purpose of impairment testing. A CGU is defined as the lower grouping of integrated assets that generate identifiable cash inflows that are largely independent of cash inflows of other assets or groups of assets. The allocation of assets into CGUs requires significant judgment and interpretation with respect to interchangeability of rig characteristics and technology, geographic proximity, and other economic factors, including price and contract risk, operational risk, development costs and tax regimes. Critical accounting estimates Xtreme uses significant estimates in the determination of a number of account balances. These estimates have a significant risk of causing a material adjustment to the carrying amounts of the underlying assets and liabilities within the next fiscal year. Material accounts subject to significant estimates are as follows: Allowance for Doubtful Accounts
The Company performs ongoing customer credit evaluations and grants credit based on a review of historical collection experience, current aging status, financial condition of the customer and anticipated industry conditions. Customer payments are regularly monitored and a provision for doubtful accounts is established based on specific situations and overall industry conditions. Impairment of Long-lived Assets
The Company evaluates its property and equipment for impairment annually and whenever events or changes in circumstances indicate the carrying amount may not be recoverable. If there is any indication of impairment, the recoverable amount of the asset is estimated to determine the impairment loss, if any. To calculate the recoverable amount, estimates are made regarding the following factors: future demand for the Company's services by oil and gas exploration and production companies, foreign currency exchange rates and interest rates, changes in the cost and availability of financing, replacement costs of drilling equipment, future repair and maintenance costs, and the Company's future operating and financial results. In assessing fair value less costs to disposal, the estimated future cash flows are discounted to their present value using a discount rate that reflects current market assessments of the time value of money and the risks specific to the asset for which the estimates of future cash flows have not been adjusted. As a result, any impairment losses are a result of management’s best estimates of expected revenues, expenses and cash flows at a specific point in time. These estimates are subject to measurement uncertainty as they are dependent on factors outside management’s control. Depreciation
Depreciation of the Company’s property and equipment incorporates estimates of useful lives and residual values. These estimates may change as more experience is obtained or as general market conditions change, thereby impacting the value of the Company’s property and equipment. During the first quarter of 2013, the Company performed a review of the depreciable lives of the rig components and related equipment. The Company’s rig components and related equipment were being depreciated on the units-of-production (“UOP”) method over a period of 3,650 to 9,125 operating days. Some rig components and equipment was also being depreciated on a straight line basis over a period of 3 to 10 years. Based on the review of the rig components and related equipment and their performance, it was determined that the estimated useful lives should be modified to better reflect the current operations and expected usage and future economic benefits. As a result of the review, management determined the following:
25

Xtreme Drilling and Coil Services Corp. For the year ended December 31, 2013 March 11, 2014
Management’s Discussion and Analysis ($ in thousands, except where indicated)
• For rigs operating in the US and Saudi Arabia, rig components and related equipment previously depreciated under UOP would be depreciated on a straight-line basis over a period of 10 to 15 years;
• For rigs operating in Canada, rig components and related equipment previously depreciated under UOP would be depreciated on a straight-line basis over a period of 13 to 20 years. The reason for the extended life versus the US and Saudi rigs is that Canadian rigs operate 9 to 10 months of the year due to break-up whereas the US and Saudi rigs work or are capable of working for the full year;
• Some rig components and related equipment previously depreciated under UOP were converted to straight line as their usage over time has no relation to production;
• The lives of assets previously depreciated under the straight-line method appeared reasonable and no changes were deemed necessary;
• The salvage value estimate of 20 percent continues to appear reasonable and no changes were made.
Management reviewed the remaining assets, such as drill pipe, vehicles, office and leasehold improvements, etc. and determined that no changes were required at this time. These assets are depreciated on a straight-line basis over a period of 3 to 10 years. Additionally, starting October 1, 2013, a second change in estimate on useful lives for certain property, plant and equipment and capital spares assets took place during the year. Essentially this arose after the completion of the physical asset verification undertaken by the Company.
Fair Value of Financial Instruments
The Company’s financial instruments included in the consolidated statements of financial position are comprised of cash and cash equivalents, accounts receivable, current liabilities, bank indebtedness and long-term debt. The fair values of financial instruments included in the consolidated statement of financial positions approximate their carrying amounts due to the short-term maturity of those instruments. Long-term debt is carried at amortized cost using the effective interest method of amortization. Income Taxes
Deferred tax assets and liabilities are recognized for the future tax consequences attributable to differences between the financial statement amounts of existing assets and liabilities and their respective tax bases. Estimates of the Company’s future taxable income have been considered in assessing the utilization of available tax losses. The Company’s business is complex and the calculation of income taxes involves many complex factors as well as the Company’s interpretation of relevant tax legislation and regulations. Stock-Based Compensation
The fair value of options is estimated at the grant date using the Black-Scholes option pricing model, which includes underlying assumptions related to the risk-free interest rate, average expected option life, estimated forfeitures, estimated volatility of the Company’s shares and anticipated dividends. The fair value of deferred stock units and performance stock units is recognized based on the market value of the Company’s common shares underlying these compensation programs.
26

Xtreme Drilling and Coil Services Corp. For the year ended December 31, 2013 March 11, 2014
Management’s Discussion and Analysis ($ in thousands, except where indicated)
Critical Accounting Policies Depreciation
Depreciation on assets is calculated using the straight-line method to allocate the cost of each asset to its residual value over its estimated useful life. Xtreme depreciates drilling and service equipment using units–of–production, assuming useful lives of between 3,650 and 9,125 operating days, excluding standby days, with an estimated residual value of 20 percent of historical cost. The Company believes the units-of-production method of depreciation, which recognizes usage of the various components of drilling equipment, is the most appropriate basis for allocating the depreciable value over its useful life.
Inventory
Inventory is composed of consumables, minor spare parts, and servicing equipment and is recorded at the lower of cost and net realizable value determined on a specific-item basis. The cost of inventory is comprised of the purchase price paid to a third party plus applicable duties, freight and shipping costs. Net realizable value is the estimated selling price in the ordinary course of business less applicable selling expenses. If carrying value exceeds net realizable amount, a write-down is recognized. The write-down may be reversed in a subsequent period if the circumstances which caused it no longer exist. Revenue recognition
The Company’s services are generally sold based upon service orders or contracts with customers that include fixed or determinable prices based on daily, hourly, or job rates. Customer contract terms do not include provisions for significant post-service delivery obligations. Revenue is recognized when services are rendered and only when collectability is reasonably assured. Revenue from drilling and service operations is recognized during the accounting period in which services are rendered. Revenue associated with the services where the Company acts as an agent are recorded as services are provided. New and amended standards adopted by the Company The Company has adopted the following new and revised standards, along with any consequential amendments, effective January 1, 2013. These changes were made in accordance with applicable transitional provisions. IFRS 10 Consolidated Financial Statements IFRS 10, Consolidated Financial Statements (“IFRS 10”), establishes principles for the presentation and preparation of consolidated financial statements when an entity controls one or more other entities and outlines specific criteria to use in determining whether control exists. IFRS 10 superseded IAS 27, Consolidated and Separate Financial Statements, and Standing Interpretations Committee Interpretation 12, Consolidation—Special Purpose Entities. IFRS 10 requires consolidation of an investee if the investor is exposed or has the rights, to variable returns from its involvement with the investee and has the ability to affect those returns through its power over the investee. Evaluation of Saudi Arabia Operations As disclosed in Note 3 of the Company’s Annual Financial Statements, the Company conducts a portion of its operations through entities in Luxembourg and Saudi Arabia in which the Company holds an 80 percent interest. Based on the criteria outlined in IFRS 10, at January 1, 2013, the Company concluded that it has control over Xtreme Equipment Group S.A. and Xtreme Coil Drilling Saudi Arabia Ltd. and these entities should be fully consolidated. The Company's review took into consideration the fact that the sole purpose of Xtreme Coil Drilling Saudi Arabia Ltd. is providing services to a single customer in the region. The services are performed with the assets of Xtreme Equipment Group S.A. and under the direct guidance of the Company and Company personnel. In connection with the operations of the joint ventures, some strategic decisions require unanimous approval by both parties. However, it is management's view that
27

Xtreme Drilling and Coil Services Corp. For the year ended December 31, 2013 March 11, 2014
Management’s Discussion and Analysis ($ in thousands, except where indicated)
given the design and purpose of the entities and the business activities undertaken, those protective decisions are not considered to be relevant as defined under IFRS 10. The operations have remained relatively consistent with the two rigs working for the same customer. Demand of activities is mainly and exclusively driven by the ultimate customer and the budgeting process has limited ability to control those activities. Thus, there have not been many variables in the budgeting process. However, should growth or revisions to the existing business plan occur, this could change and become a relevant activity. Prior to the adoption of IFRS 10, the Company applied the provisions of IAS 31, Interests in Joint Ventures (“IAS 31”), to account for its interests in the two entities. Under IAS 31, the Company determined that the establishment of the two legal entities, coupled with the provisions of the respective shareholder agreements, resulted in jointly controlled entities. A jointly controlled entity is a joint venture that involves the establishment of a corporation, partnership or other entity in which each venture has an interest. The entity operates in the same way as other entities, except that a contractual arrangement between the venturers established joint control over the economic activity of the entity. The Company considered certain strategic decisions that required unanimous approval in accordance with the respective shareholder agreements. Under IAS 31, these were considered decisions which were unanimous and factored into the assessment of joint control. Such decisions included, but were not limited to, the following:
• appointing, removing or changing the auditors of the joint venture; • incurring or assuming any debt or establishing any credit lines, outstanding loans or credit
facilities, in excess of a threshold to be agreed on by the shareholders of the Company; • approving the annual business plan and budget • forming or acquiring any subsidiary of the joint venture; • amending the articles or bylaws of the joint venture • encumbering all or substantially all of the property or capital assets of the joint venture; • owning or acquiring any securities of an unrelated issuer; • approving the annual accounts of the joint venture; • licensing, transferring or encumbering any proprietary technology for the joint venture; • selling or transferring all or substantially all of the property or capital assets for the joint venture; • issuing new shares or securities, warrants, options or granting any other rights to newly issued
shares except if that issuance or grant has been approved as a part of the approval of an annual business plan or budget;
• suspension of dividends, creating voluntary reserves or retaining any earnings but not limited to working capital reserves.
IAS 31 allowed two treatments of accounting for an investment in jointly controlled entities – proportionate consolidation or equity method. As a result of the assessment under IAS 31, the Company’s 80 percent ownership interest in each of these two entities was previously accounted for as joint ventures using the proportionate consolidation method of accounting. Evaluating these decisions under IFRS 10, the Company concluded that such decisions were not considered “relevant” as defined and were not key for the purposes of evaluating control. Although the joint venture partner was allotted some rights under the respective shareholder agreements, none of these were designed to drive financial returns on the investment. The agreement with the joint venture partner for the Saudi Arabia joint ventures dated March 12, 2010 (“the SA JV Agreement”) contains an option that allows the Company to exercise a call option to acquire all of the partner’s interest in the two entities in consideration for payment in cash in CAD or in shares of the Company’s stock of an amount equal to the valuation amount of the partner’s interest, as defined in the agreement, after the fifth anniversary, but before the sixth anniversary, of the establishment of the legal entities. The SA JV Agreement also provides for the partner to exercise a put option to require the Company to acquire all of the partner’s interest. Based on the details of the arrangement, the Company has recorded the present value of this potential payment obligation as a liability on the financial statements.
28

Xtreme Drilling and Coil Services Corp. For the year ended December 31, 2013 March 11, 2014
Management’s Discussion and Analysis ($ in thousands, except where indicated)
In addition, as part of the SA JV Agreement between both parties, the Company has a right to acquire the joint venture's interest should a dispute arise. However, the joint venture partner does not have the right to acquire the Company's interest. Therefore, based on the criteria outlined in IFRS 10, the Company has concluded that it has control over Xtreme Equipment Group S.A. and Xtreme Coil Drilling Saudi Arabia Ltd. and these entities should be fully consolidated. On July 15, 2013, the Company informed the joint venture partner of both Xtreme Equipment Group S.A. and Xtreme Coil Drilling Saudi Arabia Ltd. of its intent to exercise its option to purchase all the of the partner’s interest in both entities. On February 25, 2014, the Company and the partner finalized negotiations on the agreed purchase price of $13,500 USD ($14,359 CAD), of which $12,000 USD ($12,763 CAD) is due for repayment within twelve months. IFRS 13 Fair value measurement IFRS 13, Fair value measurement (“IFRS 13”), provides a single framework for measuring fair value. The measurement of the fair value of an asset or liability is based on assumptions that market participants would use when pricing the asset or liability under current market conditions, including assumptions about risk. The Company adopted IFRS 13 on January 1, 2013, on a prospective basis. IFRS 12 Disclosure of interests in other entities IFRS 12, Disclosures of interests in other entities (“IFRS 12”) includes the disclosure requirements for all forms of interests in other entities, including joint arrangements, associates, structured entities and other off balance sheet vehicles. Amendment to IAS 1 Financial Statement Presentation Amendment to IAS 1, Financial statement presentation (“IAS 1”) regarding other comprehensive income. The main change resulting from these amendments is a requirement for entities to group items presented in other comprehensive income on the basis of whether they are potentially reclassifiable to profit or loss subsequently (reclassification adjustments). Amendment to IAS 36 Impairment of assets Amendments to IAS 36, Impairment of assets (“IAS 36”), on the recoverable amount disclosures for non-financial assets. This amendment removed certain disclosures of the recoverable amount of cash generating units which had been included in IAS 36 by the issue of IFRS 13. The amendment is not mandatory for the Company until January 1, 2014, however the Company has decided to early adopt the amendment as of January 1, 2013. See also “Accounting standards and amendments issued but not get adopted” below for a further discussion of amendments to IAS 36. In addition, several other new standards and amendments that are effective as of January 1, 2013, do not impact the consolidated financial statements of the Company. Seasonality of Operations Areas of the US where Xtreme has drilling operations are infrequently subject to weather constraints like hurricanes in the southern states, but may experience operational constraints such as blizzards and other extreme winter conditions in the Rocky Mountain region in addition to operational restrictions for a variety of other reasons. Some areas are subject to environmental orders which include specific well leases and can prevent drilling activity during certain periods when authorities prioritize wildlife or habitat protection. These restrictions may also affect activity levels and operating results. The weather in Saudi Arabia features extreme aridity and heat. It is among few countries in the world where temperatures during the summer reach above 50 degrees C (120 degrees F). The region is also
29

Xtreme Drilling and Coil Services Corp. For the year ended December 31, 2013 March 11, 2014
Management’s Discussion and Analysis ($ in thousands, except where indicated)
subject to severe sand storms. These weather conditions may constrain drilling operations and interrupt periods of activity which could adversely impact operating results. Canadian drilling operations are impacted during the spring months when the ground thaws and becomes unstable to move heavy equipment. Government road bans restrict movement of equipment in and out of certain areas during the “spring break up” season. These seasonal trends lead to quarterly fluctuations in operating results. Rig utilization peaks in the fourth and first quarters and decreases in the second and third quarters. Business Risks and Uncertainties A number of risks and uncertainties affect the Company’s operations. Although the Company takes action to mitigate these risks where possible, many risks are beyond management's control. The following discussion does not constitute an exhaustive list of all possible risks. Operational and Financial Risks - The Company’s ability to operate, generate cash flows and complete projects is dependent on operational and financial risks, including commodity prices, continued market demand for its services and other risk factors outside of its control, which include: general business and market conditions; economic recessions and financial market turmoil; the ability to secure and maintain cost-effective financing for its commitments; environmental and regulatory matters; unexpected cost increases; taxes; the availability of drilling, well servicing, and other equipment; weather; technology failures; accidents; and the availability of skilled labor. To mitigate these risks, as part of the capital approval process, the Company’s projects are evaluated on a fully-risked basis. When making operating and investing decisions, Xtreme’s business model allows flexibility in capital allocation to optimize investments focused on project returns, long-term value creation, and risk mitigation. The Company also mitigates operational risks through a number of other policies, systems and processes as well as by maintaining a comprehensive insurance program. Dependence on Key Contracts and Customers - The business operations of the Company depend on successful execution of drilling and service contracts, primarily written agreements that are cancellable at any time, most of which are subject to termination costs. In addition, the majority of the Corporation’s rigs are subject to renewable contracts in respect of which no assurances can be given as to their renewal. The key factors which determine whether a client continues to use the Company are service quality and availability, reliability and performance of equipment used to perform its services, technical knowledge and experience, reputation for safety and competitive price. There can be no assurance that the Company’s relationships with its customers will continue, and a significant reduction or total loss of the business from these customers, if not offset by sales to new or existing customers, could have a material adverse effect on the Company’s business, financial condition, results of operations and cash flows and, therefore, on the trading price of the common shares.
A substantial amount of the Company’s revenues are currently derived from contracts with two customers. The relationship between the Company and such parties is key to the continued success of the Company’s operations, and any impairment of such relationship could have a material adverse effect on the Company and its business and operations. No assurance can be given that the Company will be successful in maintaining its relationship with such parties. Seasonality of Operations – In Canada and the northern part of the United States, the level of activity in the oilfield service industry is influenced by seasonal weather patterns. During the spring months, wet weather and the spring thaw make the ground unstable. Consequently, municipalities and counties and provincial and state transportation departments enforce road bans that restrict the movement of rigs and other heavy equipment, thereby reducing activity levels and placing an increased level of importance on the location of Xtreme’s equipment prior to imposition of the road bans. The timing and length of road bans is dependent upon the weather conditions leading to the spring thaw and the weather conditions during the thawing period. Additionally, certain oil and natural gas producing areas are located in areas of western Canada that are inaccessible, other than during the winter months, because the ground
30

Xtreme Drilling and Coil Services Corp. For the year ended December 31, 2013 March 11, 2014
Management’s Discussion and Analysis ($ in thousands, except where indicated)
surrounding or containing the drilling sites in these areas consists of terrain known as muskeg. Until the muskeg freezes, the rigs and other necessary equipment cannot cross the terrain to reach the drilling site. Moreover, once the rigs and other equipment have been moved to a drilling site, they may become stranded or otherwise unable to relocate to another site should the muskeg thaw unexpectedly. Xtreme’s business results depend, at least in part, upon the severity and duration of the winter season. Political and Foreign Risk – The Company provides drilling and coil services throughout much of North America and in certain international onshore areas. The Canadian and United States regulatory regimes are stable and, in general, supportive of energy industry activity. However there can be no assurance that any legislative changes relating to the energy industry and any related effect on demand for services industry will not have a material adverse effect on Xtreme’s business, financial condition, results of operations and cash flows. Internationally, the Company’s operations are subject to regulations in various jurisdictions and support of the oil and natural gas industry can vary in different jurisdictions. Some international markets that the Company operated or where it considered operating have experienced civil unrest and/or warfare in recent years. In general, the Company monitors local conditions and attempts to negotiate long-term contracts for drilling and coil services that include early termination clauses and other clauses to protect the Company’s interests. Credit Risk – Credit risk is managed on a consolidated basis, except for credit risk relating to accounts receivable balances. Each operating unit is responsible for managing and analyzing the credit risk for each of their new clients before standard payment and delivery terms and conditions are offered. Credit risk arises from deposits with banks, as well as credit exposures to customers, including outstanding receivables and committed transactions. For deposits, the Company only deals with independently rated institutions that have a minimum rating of ‘A’. Most of the Company’s customers are not independently rated, therefore the quality of the customer is considered by taking into account its financial position, past experience and other factors. Individual risk limits are set based on internal ratings in accordance with limits set by the board. The utilization of credit limits is regularly monitored. No credit limits were exceeded during the reporting period. The Company is exposed to a significant concentration of credit risk because the majority of the accounts receivable balances are with a small group of customers. At December 31, 2013, the Company did not have a provision for doubtful accounts (December 31, 2012 – nil). The maximum exposure to credit risk for deposits approximates the amount recognized on the statement of financial position. The Company does not hold any collateral as security. The following table summarizes the Company’s accounts receivable amounts which management does not consider impaired. Accounts receivable Dec 31, 2013 Dec 31, 2012
Less than 90 days 58,661 39,236
Greater than 90 days and less than 180 days 1,417 2,130
Greater than 180 days 6 3,512
60,084 44,878
In September 2013, the Company recovered previously billed amounts of approximately $2,690 plus legal fees of approximately $510 from the settlement of litigation with one of its customers. The carrying amount of trade accounts receivable was approximately $2,760, resulting in an additional write-off of approximately $70 for uncollected amounts. Fair Value – The carrying values of cash and cash equivalents, accounts receivable and other receivables, bank indebtedness, accounts payable and accrued liabilities approximate their fair value due to the relatively short periods to maturity of the instruments. Long-term debt is initially recorded at fair value, net of transaction costs directly attributable to the issuance of the debt and approximates fair value
31

Xtreme Drilling and Coil Services Corp. For the year ended December 31, 2013 March 11, 2014
Management’s Discussion and Analysis ($ in thousands, except where indicated)
as of December 31, 2013 due to the fact that interest is adjusted periodically based on changes in the relevant benchmark interest rates and changes in the Company’s own credit risk. The fair value of the agreement with the Diversified Services Company is approximately $648 (December 31, 2012 - $3,300).
Fair Value of Non-controlling Interest Liability
The Company performed a valuation analysis of its interest in the Saudi joint ventures to determine the fair value of the non-controlling interest. The Income Approach methodology was the primary valuation method utilized. The fair value is recurring. The following unobservable (Level 3) inputs were used in the valuation:
• Discounted cash flows (a 16 percent discount rate was used; this is the asset specific rate for
valuing this liability) • Management’s estimates of financial performance for the service rigs
o Revenue assumptions - the revenue projections were based on management’s best
estimate while taking into account the most recent contract outcomes o Cost assumptions – the model took into account the effect of inflation at two percent
to account for the increase in expenses
• Historical financial data for the Saudi Arabia operations • Economic data relating to Saudi Arabia
As disclosed in Note 22 of the Annual Financial Statements, the balance in non-controlling interest at December 31, 2013, is based on the negotiated purchase price of the acquisition of the partner’s 20 percent ownership in the put option in the non-controlling interest. Liquidity Risk – The impact on capital markets resulting from investor uncertainty related to the North American economy can constrain access to capital for Xtreme’s customers in the crude oil and natural gas exploration, development and production sector, and, subsequently, the contract services sector. As new contracts are negotiated, the Company expects to finance future capital expenditures from funds generated from operating activities, from borrowings and possible future debt or equity financings. Xtreme’s ability to source new capital is dependent on, among other factors, the overall state of capital markets, investor appetite for investments in oilfield services companies and, in particular, the Company’s securities. To the extent external sources of capital become limited or unavailable, or available on unacceptable terms, the Company's ability to make capital investments and to maintain existing assets may be impaired, and its assets, liabilities, business, financial condition and, as a consequence, results of operations may be materially and adversely affected. It is possible that the Company, along with all other oilfield services companies, may experience restricted access to capital, credit facilities and equity, and may face increased borrowing costs, if the lending capacity of financial institutions continues to fluctuate with the global economy resulting in diminished capacity and higher risk premiums. Any adverse conditions in capital markets could have a material adverse effect on Xtreme’s business, financial condition, results of operations and cash flows and, therefore, on the trading price of the Common Shares. Xtreme’s ability to continue its drilling and servicing activities and any future activities, and to continue to execute its operating and growth plan, will depend in part on its ability to continue to generate drilling and service revenues and / or to obtain suitable financing. The Company had a consolidated working capital of approximately $43,300 as of December 31, 2013. The Company intends to fund its plan of operations from its drilling and service operations and obtaining additional financing as needed. The Company will continue to review and explore strategic options for financing as needed.
32

Xtreme Drilling and Coil Services Corp. For the year ended December 31, 2013 March 11, 2014
Management’s Discussion and Analysis ($ in thousands, except where indicated)
The Company’s ability to continue its activities depend, in part, on its ability to generate revenue from operations and / or obtain financing through debt financing, joint ventures, or other means. There can be no assurance that additional financing will be available to Xtreme when needed or on acceptable terms. Xtreme’s inability to access financing to support ongoing operations or to fund capital expenditures or acquisitions could limit Xtreme’s growth and may have a material adverse effect. Xtreme is relying on the Credit Facility to be extended to a two-year non revolving term loan. The failure of the Company to meet its ongoing obligations and debt service on a timely basis could result in a failure to execute under current customer contracts and agreements and realization of assets and settlement of liabilities in other than the normal course of business may be at amounts significantly different than those included in the Company’s annual information form for the year ended December 31, 2013. Following is a summary of the Company’s funding and liquidity risk management.
Foreign Exchange – Foreign exchange volatility may give rise to gains or losses which have an effect on Xtreme’s financial results. Xtreme currently reports all activities in CAD. As a result, fluctuations in the value of the USD relative to the CAD give rise to fluctuations in reported revenue. Xtreme is also exposed to risk from fluctuations in foreign currency exchange rates in the United States and Saudi Arabia where revenue, expenses, assets and liabilities are denominated in USD and Saudi Riyal are translated into CAD during the reporting periods. As a result, Xtreme’s statement of income, statement of financial position and statement of cash flow are impacted by changes in exchange rates between CAD and USD. For the year ended December 31, 2013, a one percent change in the month-end exchange rate would have changed the net loss before tax by approximately $20. Month-end exchange rates used to translate the USD-denominated assets and liabilities to CAD were 1.0636 at December 31, 2013, 1.0303 at September 30, 2013, 1.0518 at June 30, 2013, 1.0165 at March 31, 2013, and 0.9949 at December 31, 2012.
Monetary and non-monetary assets and liabilities denominated in foreign currencies are translated at the current rate as of the balance sheet date and any realized foreign exchange gains or losses are included in income, except for unrealized gains and losses in self-sustaining foreign subsidiaries, which are recorded in other comprehensive income. The Company does not currently utilize derivative instruments to manage its exposure to foreign currency rate fluctuations. Presently, a one percent change in the foreign currency exchange rate would result in a change in other comprehensive income of approximately $1,490. Interest Rates – Xtreme is exposed to interest rate risk to the extent changes in market interest rates can impact operating and long-term debt facilities subject to floating interest rates. For the year ended December 31, 2013, a one percent change in the effective interest rate would have changed net loss before tax by approximately $1,280. Proprietary Technologies – Integral to Xtreme’s equipment design and operation are certain technologies which require proving in actual field operations. The Company cannot assure the current and future applications for Xtreme's proprietary technology nor the effectiveness of these technologies in field operations. Competing technologies could prove more effective than those developed and used by Xtreme. In addition, patents for which we have applied may not be issued. Demand for Offerings – Demand for Xtreme's contract drilling and coil services offerings depends to a large extent on the level of oil and natural gas industry activity which also influences the potential to
Amount Availability Currency Use for Maturity
Credit agreement $150,000 $28,000 USD Capital expenditures and general corporate purposes December 27, 2016
Letters of guarantee $955 Undrawn USD Importation of coil service units
33

Xtreme Drilling and Coil Services Corp. For the year ended December 31, 2013 March 11, 2014
Management’s Discussion and Analysis ($ in thousands, except where indicated)
extend or continue our existing long-term contracts. Volatility in short-term drilling and well service activity can result in revenue unpredictability. Numerous factors, over which Xtreme has no control, influence industry activity including, but not limited to, fluctuations in crude oil and natural gas prices, changes in supply of, or demand for, commodities, oil and natural gas operator budgets, competition from other contractors, government legislation, regulatory and economic conditions, global economic, political and military events, international trade barriers, location access or labor disputes, as well as fuel prices and availability and environmental conservation or incidents. Xtreme attempts to mitigate against these risks by targeting relationships with customers operating in either liquid rich gas or oil to limit exposure to the weak North American dry gas market. Vendor Services and Supplies – Xtreme sources certain key rig components, raw materials, equipment and component parts from a variety of suppliers located in Canada, the United States and overseas. Xtreme also outsources some or all services for the construction of drilling and service rigs. While alternate suppliers exist for most of these components, materials, equipment, parts and services, cost increases, delays in delivery due to high activity or other unforeseen circumstances may be, and in fact have been experienced. Xtreme maintains relationships with a number of key suppliers and contractors, maintains an inventory of key components, materials, equipment and parts and orders long lead time components in advance. However, if the current or alternate suppliers are unable to provide or deliver the necessary components, materials, equipment, parts and services, any resulting delays by Xtreme in the provision of services to customers may have a material adverse effect on Xtreme’s revenues, cash flows and earnings. To attempt to mitigate this risk Xtreme maintains relationships with a number of key suppliers and uses internal procurement operations when appropriate. Performance of Equipment and Employees – Xtreme's financial and operating results are dependent on continued successful performance of drilling and service rigs and related equipment and the continued operation of the existing fleet without additional significant capital expenditures. Xtreme’s ability to expand its drilling and coil services offering depends on successful recruitment and retention of qualified personnel, when needed. Any unexpected loss of Xtreme’s key personnel, or inability to retain or recruit skilled personnel, could have an adverse effect on Xtreme’s business, results of operations and financial performance. Technology - Complex drilling and coil services programs for the exploration and development of remaining conventional and unconventional oil and natural gas reserves demand high performance equipment. The ability of drilling rig and well service providers to meet this demand will depend on continuous improvement of existing technology such as drive systems, control systems, automation, mud systems and top drives to improve efficiency. Xtreme’s ability to deliver equipment and services that meet customer demand is critical to its continued success. Xtreme cannot assure that competitors will not achieve technological improvements that are more advantageous, timely or cost effective than improvements developed by Xtreme. To attempt to mitigate this risk Xtreme has an experienced internal engineering department which works closely with operations and marketing on equipment design and improvements. Competitive Industry - The drilling and coil services business is highly competitive with numerous industry participants. Xtreme believes pricing and rig availability are the primary factors considered by Xtreme’s potential customers in determining which contractor to select. Xtreme believes other factors are also important. Among those factors are: the capabilities and condition of equipment; the quality of service and experience of crews; the safety record of the contractor and the particular equipment; the offering of ancillary services; the ability to provide equipment adaptable to, and personnel familiar with, new technologies and drilling techniques; and the mobility and efficiency of equipment. Capital Overbuild in the Industry - Because of the long life nature of drilling and well servicing equipment and the lag between the moment a decision to build a piece of equipment is made and the moment the equipment is placed into service, the amount of available equipment in the industry does not
34

Xtreme Drilling and Coil Services Corp. For the year ended December 31, 2013 March 11, 2014
Management’s Discussion and Analysis ($ in thousands, except where indicated)
always correlate to the level of demand for that equipment. Periods of high demand often spur increased capital expenditures on rigs, and those capital expenditures may exceed actual demand. Any capital overbuild could cause Xtreme’s competitors to lower their rates and could lead to a decrease in rates in the oilfield services industry generally, which would have an adverse effect on the revenues, cash flows and earnings of Xtreme. Environmental - There is growing concern about the apparent connection between the burning of fossil fuels and climate change. The issue of energy and the environment has created intense public debate in Canada and around the world in recent years that is likely to continue for the foreseeable future and could potentially have a significant impact on all aspects of the economy including the demand for hydrocarbons and resulting in lower demand for Xtreme’s services. To attempt to mitigate against these risk, Xtreme maintains a comprehensive insurance and risk management program to protect its assets and operations. Xtreme monitors and complies with current environmental requirements. Safety Risk - Standards for the prevention of incidents in the oil and gas industry are governed by the Company safety policies and procedures, accepted industry safety practices, customer specific safety requirements and health and safety legislation. A key factor considered by Xtreme’s customers in selecting providers is safety. Deterioration in Xtreme’s safety performance could result in a decline in the demand for services and could have a material adverse effect on Xtreme’s revenues, cash flows and earnings. Through its Safety Actions for Excellence program Xtreme maintains a comprehensive training and assessment program designed to work towards a vision of no work place incidents resulting in injury. Taxes - The Company is subject to many different forms of taxation in various jurisdictions throughout the world, including but not limited to, income tax, withholding tax, commodity tax and social security and other payroll related taxes, which may lead to disagreements with tax authorities regarding the application of tax law. Tax law and administration is extremely complex and often requires the Company to make subjective determinations. The computation of income, payroll and other taxes involves many factors, including the interpretation of tax legislation in various jurisdictions in which the Company is subject to ongoing tax assessments. The Company’s estimate of tax related assets, liabilities, recoveries and expenses incorporates significant assumptions. These assumptions include, but are not limited to, the tax rates in various jurisdictions, the effect of tax treaties between jurisdictions and taxable income projections. To the extent that such assumptions differ from actual results, the Company may have to record additional tax expenses and liabilities, including interest and penalties.
Leverage and Restrictive Covenants - Xtreme’s ability to pay dividends or make other payments or advances will be subject to applicable laws and contractual restrictions in the instruments governing any indebtedness of those entities. The degree to which Xtreme is leveraged could have important consequences for the shareholders of Xtreme including, but not limited to: (i) Xtreme’s ability to obtain additional financing for working capital, capital expenditures or acquisitions in the future may be limited; (ii) all or part of Xtreme’s cash flow from operating activities may be dedicated to the payment of the principal of and interest on Xtreme’s indebtedness, thereby reducing funds available for future operations or for payment of dividends to shareholders; (iii) certain of Xtreme’s borrowings will be at variable rates of interest, which exposes Xtreme to the risk of increased interest rates; and (iv) Xtreme may be more vulnerable to economic downturns and be limited in its ability to withstand competitive pressures. These factors could have a material adverse effect on Xtreme’s business, financial condition, results of operations and cash flows and, therefore, on the trading price of the Common Shares.
Legal Proceedings - From time to time, Xtreme may be subject to litigation and regulatory proceedings arising in the normal course of its business. Xtreme cannot determine whether such litigation and regulatory proceedings will, individually or collectively, have a material adverse effect on its business, results or operations and financial condition. To the extent expenses incurred in connection with litigation or any potential regulatory proceeding or action (which may include substantial fees of attorneys and other professional advisors and potential obligations to indemnify officers and directors who may be
35

Xtreme Drilling and Coil Services Corp. For the year ended December 31, 2013 March 11, 2014
Management’s Discussion and Analysis ($ in thousands, except where indicated)
parties to such actions) are not covered by available insurance, such expenses could adversely affect Xtreme’s cash position.
Accounting standards and amendments issued but not yet adopted Unless otherwise noted, the following revised standards and amendments are effective for annual periods beginning on or after January 1, 2014, with earlier application permitted. The Company has not yet assessed the impact of these standards and amendments or determined whether it will early adopt them. IFRS 9, Financial instruments (“IFRS 9”), addresses the classification, measurement and recognition of financial assets and financial liabilities. IFRS 9 was issued in November 2009 and October 2010. It replaces the parts of IAS 39 that relate to the classification and measurement of financial instruments. IFRS 9 requires financial assets to be classified into two measurement categories: those measured at fair value and those measured at amortized cost. The determination is made at initial recognition. The classification depends on the entity’s business model for managing its financial instruments and the contractual cash flow characteristics of the instrument. For financial liabilities, the standard retains most of the IAS 39 requirements. The main change is that, in cases where the fair value option is taken for financial liabilities, the part of a fair value change due to an entity’s own credit risk is recorded in other comprehensive income rather than the income statement, unless this creates an accounting mismatch. The Company is yet to assess IFRS 9’s full impact. The Company will also consider the impact of the remaining phases of IFRS 9 when completed by the board of directors. Subsequent Events On February 25, 2014, the Company finalized negotiations on the purchase of remaining 20 percent non-controlling interest with its partners in relation to its Saudi Arabian Operations. Specifically, the Company and the partner finalized negotiations on the agreed purchase price of $13,500 USD ($14,359 CAD), of which $12,000 USD ($12,763 CAD) is due for repayment within twelve months.
The Company made the initial payment of $10,500 USD ($11,168 CAD) on February 25, 2014. It expects to pay an additional $1,500 USD ($1,596 CAD) during 2014 and settle the remaining $1,500 USD ($1,596 CAD) by July 2015.
Outlook
As a company founded to break through traditional barriers in the industry, Xtreme has been setting records almost since inception. However, nothing in the Company’s history quite compares to 2013. It was an exceptional year on many fronts as Xtreme established new industry benchmarks with the Company’s field performance and surged past previous high-water marks for the Company, both operationally and financially.
Xtreme’s primary goal for 2013 was optimizing the Company’s operations and maximizing efficiency to capitalize on the aggressive fleet expansion undertaken in 2011 and 2012. Xtreme is proud to report the Company accomplished that mission. Last year was Xtreme’s busiest and most productive ever for both the drilling and coil service segments of the Company. The Company’s operating days topped 8,000 for the first time ever, pushing revenue to a record $229.8 million even as the Company maintained a similar rig count to 2012. Other key financial metrics hit historic levels as well, including operating profit margins and EBITDA.
Xtreme also made great strides in strengthening the balance sheet, using the Company’s growing free cash flows to substantially reduce leverage incurred during the $200 plus million capital expansion program. Xtreme is pleased that the marketplace recognized this progress, as the Company’s share price increased by 118 percent in 2013.
Also of note, the Company’s business came full circle in an important sense in 2013. Xtreme’s history is deeply rooted in driving innovation in coiled tubing drilling technology, and we have numerous patents to
36

Xtreme Drilling and Coil Services Corp. For the year ended December 31, 2013 March 11, 2014
Management’s Discussion and Analysis ($ in thousands, except where indicated)
show for it. However, in recent years the Company shifted its focus almost entirely to traditional jointed pipe drilling in response to the rapid proliferation of horizontal wells in North American resource plays. Now the Company is are excited to be putting that breakthrough coiled tubing technology to work again; this time for ultra-deep completions in those same long-lateral wells.
Drilling Services (XDR)
After growing the Company’s XDR drilling fleet dramatically in prior years, Xtreme maximized utilization levels on an unprecedented scale in 2013. At year-end, all 21 of these Tier 1 rigs were working, mostly on long-term contracts. Total operating days for the XDR division reached an all-time high of 6,834 days and utilization was 89 percent for 2013 as compared to 82 percent in the prior year.
Geographically, the Company continued to focus on two of North America’s most prolific resource plays. Xtreme’s largest presence is in the Niobrara Shale in Colorado and Wyoming, where 12 XDR rigs were working at year-end. There, the Company’s high-specification rigs continued to set the performance standard with superior mobility that accelerates drilling and reduces move times between well pads. Xtreme also further grew presence in the Bakken Shale in North Dakota, where the Company had six rigs working at year-end. The other three XDR rigs were working in Canada.
“Our leading-edge technology and outstanding service quality truly set us apart in the XDR division’s core operating areas of Colorado and North Dakota,” Chief Executive Officer Tom Wood noted. “The market remains strong for Xtreme’s drilling services in the Bakken and Niobrara, as our operational efficiency and best-in-class mobilization times continue to drive down costs for our customers.”
Also in 2014, the XDR division will look for opportunities to optimize the existing fleet and potentially move shallower depth capacity drilling rigs into new markets as the push toward deeper wells and larger equipment continues in the US. These efforts were already yielding results early in the year, when the Company signed a letter of arrangement to relocate two XDR 300 rigs to India. The Company anticipates that the Company will sign a multi-year contract in the first quarter of 2014 and expects that these rigs will commence operations in the third quarter of 2014.
The XDR division’s high utilization levels are expected to continue into the future, as the Company’s large backlog of contracted days was in excess of 5,800 at the beginning of 2014.
Coil Services (XSR)
Last year was full of accomplishment for the Company’s XSR coiled tubing division. After launching extended-reach completion services in 2012, the Company has rapidly established itself as a market leader in the Eagle Ford Shale in South Texas. Xtreme is also the longest-reach provider in this basin, which ranks second in production volume among shale oil plays in the US. In fact, the Company set an Eagle Ford record in 2013 by reaching a total measured depth of 20,344 feet with coiled tubing—including a lateral length over 10,000 feet. These distinctions allowed the Company to increase both its service rates and utilization levels, as total operating days for the XSR division reached a new high of 1,234.
In addition to superior reach, Xtreme has established a reputation for outstanding performance with its proprietary large-diameter coil. XSR units are substantially accelerating completion plug millouts and reducing stuck-in-hole incidents. The XSR division had in excess of 16.8 million round trip run-in feet with coiled tubing in 2013 without ever leaving pipe down hole. The Company is especially proud of that last accomplishment, as it highlights the unmatched reliability of its coiled tubing services. With that stellar track record, Xtreme is not only completing ultra-deep wells, but also gaining traction in the 14,000-16,000 foot market, as operators seek to mitigate risk.
Xtreme is achieving these successes by leveraging innovations originally developed for coiled tubing drilling. For example, the Company’s XSR units utilize electric injectors and PLC-based controls for greater power and precision, and 2-5/8” coiled tubing for extended lateral reach. Recognizing the
37

Xtreme Drilling and Coil Services Corp. For the year ended December 31, 2013 March 11, 2014
Management’s Discussion and Analysis ($ in thousands, except where indicated)
advantages, the market is increasingly favoring these technologies over traditional features such as hydraulic power and smaller-diameter coil. The Company believes this clearly differentiates Xtreme in the marketplace and offers its customers a value proposition no other company can match.
Additionally, two XSR units continue to perform re-entry drilling in Saudi Arabia, where the Company has worked since 2010 and signed new three-year contracts with the operators. This project has been a tremendous technical and financial success for Xtreme.
After keeping the rig count unchanged and concentrating on its core markets last year, Xtreme’s focus will return to growth in 2014—for both its fleet and geographical footprint.
The Company’s XSR division will add new coiled tubing units as it seeks to meet demand in the Eagle Ford of South Texas, and looks at potential expansion into the Permian Basin in West Texas. Xtreme anticipate funding this initiative entirely with free cash, given the strength of our operating margins.
“As our reputation for excellence in coiled tubing services continued to build in 2013, customer demand in the Eagle Ford began to consistently outstrip our capacity,” Chief Executive Officer Tom Wood commented. “Xtreme is moving quickly to meet that demand—and pursue expansion into other markets—by making new-build XSR units the focus of our 2014 capital investment program.”
Finally, even with all that was accomplished last year, the Company seeks opportunities to further optimize its operations and drive profit margins. These efforts will continue in 2014, as the Company focuses on pushing to greater depths and new heights while emphasizing capital discipline and ultimately working to maximizing value to its shareholders.
Additional Information Information relating to Xtreme is available on SEDAR at www.sedar.com. To obtain copies of published corporate information, contact the Corporate Secretary at Xtreme Drilling and Coil Services Corp., 770, 340 – 12th Avenue S.W., Calgary, AB T2R 1L5 (telephone +1 403 262-9500), visit Xtreme's website www.xtremecoil.com or [email protected].
38

PricewaterhouseCoopers LLP 111 5th Avenue SW, Suite 3100, Calgary, Alberta, Canada T2P 5L3 T: +1 403 509 7500, F: +1 403 781 1825 “PwC” refers to PricewaterhouseCoopers LLP, an Ontario limited liability partnership.
Independent Auditor’s Report To the Shareholders of Xtreme Drilling and Coil Services Corp. We have audited the accompanying consolidated financial statements of Xtreme Drilling and Coil Services Corp., which comprise the consolidated statements of financial position as at December 31, 2013, December 31, 2012 and January 1, 2012 and the consolidated statements of income, comprehensive income (loss), changes in equity and cash flows for the years ended December 31, 2013 and December 31, 2012, and the related notes, which comprise a summary of significant accounting policies and other explanatory information. Management’s responsibility for the consolidated financial statements Management is responsible for the preparation and fair presentation of these consolidated financial statements in accordance with International Financial Reporting Standards, and for such internal control as management determines is necessary to enable the preparation of consolidated financial statements that are free from material misstatement, whether due to fraud or error. Auditor’s responsibility Our responsibility is to express an opinion on these consolidated financial statements based on our audits. We conducted our audits in accordance with Canadian generally accepted auditing standards. Those standards require that we comply with ethical requirements and plan and perform the audits to obtain reasonable assurance about whether the consolidated financial statements are free from material misstatement. An audit involves performing procedures to obtain audit evidence about the amounts and disclosures in the consolidated financial statements. The procedures selected depend on the auditor’s judgment, including the assessment of the risks of material misstatement of the consolidated financial statements, whether due to fraud or error. In making those risk assessments, the auditor considers internal control relevant to the entity’s preparation and fair presentation of the consolidated financial statements in order to design audit procedures that are appropriate in the circumstances, but not for the purpose of expressing an opinion on the effectiveness of the entity’s internal control. An audit also includes evaluating the appropriateness of accounting policies used and the reasonableness of accounting estimates made by management, as well as evaluating the overall presentation of the consolidated financial statements. We believe that the audit evidence we have obtained in our audits is sufficient and appropriate to provide a basis for our audit opinion. Opinion In our opinion, the consolidated financial statements present fairly, in all material respects, the financial position of Xtreme Drilling and Coil Services Corp. as at December 31, 2013, December 31, 2012 and January 1, 2012 and its financial performance and its cash flows for the years ended December 31, 2013 and December 31, 2012 in accordance with International Financial Reporting Standards. Chartered Accountants Calgary, Alberta March 11, 2014
39

Xtreme Drilling and Coil Services Corp.
Consolidated Statements of Financial Position
At December 31, 2013, December 31, 2012 and January 1, 2012 (in thousands of Canadian dollars)
Dec 31, 2013 Dec 31, 2012 Jan 1, 2012
(Restated – Note 3) (Restated – Note 3)
Assets
Current assets
Cash and cash equivalents 12,220 5,921 6,873
Accounts receivable (Note 5) 60,084 44,878 46,653
Other receivables 1,306 2,975 1,636
Prepaid expenses and other 2,491 2,047 2,114
Assets held for sale (Note 7) – 9,308 – Income tax recoverable 462 368 928
Inventory (Note 6) 8,181 6,474 6,470
84,744 71,971 64,674
Non-current assets
Deferred tax asset (Note 16) 14,536 15,006 7,576
Property and equipment (Note 7) 412,523 415,354 348,148
Intangible assets (Note 8) 3,917 4,220 4,523
Total Assets 515,720 506,551 424,921
Liabilities and Shareholders' Equity
Current liabilities
Bank indebtedness (Note 10) – 7,834 –
Accounts payable and accrued liabilities (Note 9) 28,051 27,904 26,902
Fair value of non-controlling interest liability (Note 19) 12,763 – –
Current portion of long-term debt (Note 10) 669 14,201 500
41,483 49,939 27,402
Long-term liabilities
Fair value of non-controlling interest liability (Note 19) 1,596 12,878 13,707
Long-term debt (Note 10) 128,407 125,727 81,936
Total Liabilities 171,486 188,544 123,045
Shareholders' equity
Share capital (Note 11) 328,416 327,197 310,296
Share option reserve (Note 11) 12,419 11,572 10,338
Accumulated deficit (12,697) (12,370) (12,212)
Foreign currency translation reserve 15,143 (11,314) (8,209)
Total Equity 343,281 315,085 300,213
Non-controlling interest (Note 3) 953 2,922 1,663
Total Shareholders’ Equity 344,234 318,007 301,876
Total Liabilities and Shareholders' Equity 515,720 506,551 424,921
Contingencies and commitments (Note 17)
The accompanying notes are an integral part of the consolidated financial statements. On behalf of the board of directors,
Doug Dafoe David Wehlmann Director Director
40
(Signed) Doug Dafoe (Signed) David Wehlmann

Xtreme Drilling and Coil Services Corp. Consolidated Statements of Income For the years ended December 31, 2013 and 2012 (in thousands of Canadian dollars, except share and per share data)
2013 2012
(Restated – Note 3)
Revenue 229,823 179,387
Expenses
Operating expenses 144,873 127,835
General and administrative expenses (Note 14) 11,280 10,226
Depreciation of property and equipment (Note 7) 51,192 27,266
Amortization of intangibles (Note 8) 303 303
Stock-based compensation 1,321 1,245
Foreign exchange loss (gain) 6,494 (1,790)
(Gain) loss on sale of equipment (132) 257
Change in value of non-controlling interest liability 1,481 (829)
Impairment of accounts receivable (Note 5) 72 6,235
Impairment of assets held for sale – 3,133
Loss on damage of property and equipment – 538
Other expense 153 175
Interest expense (Note 10) 7,866 7,919
Income (loss) before tax for the year 4,920 (3,126)
Tax expense (recovery)
Current (Note 16) 3,870 2,775
Deferred (Note 16) 483 (7,175)
Total tax expense (recovery) 4,353 (4,400)
Net income for the year 567 1,274
Net (loss) income for the year attributable to:
Owners of the parent (327) (158)
Non-controlling interest 894 1,432
567 1,274
Net (loss) per common share attributable to equity owners of the parent
– basic (0.00) (0.00)
– diluted (0.00) (0.00)
Weighted average number of
common shares (Note 13)
– basic 80,935,473 69,618,457
– diluted 80,935,473 69,759,835
The accompanying notes are an integral part of the consolidated financial statements.
41

Xtreme Drilling and Coil Services Corp. Consolidated Statements of Comprehensive Income (Loss) For the years ended December 31, 2013 and 2012 (in thousands of Canadian dollars)
2013 2012
(Restated – Note 3)
Net income for the year 567 1,274
Other comprehensive income (loss)
Items may be subsequently reclassified to profit or loss
Unrealized gain (loss) on translating
financial statements of foreign operations 26,751 (3,278)
Comprehensive income (loss) for the year 27,318 (2,004)
The accompanying notes are an integral part of the consolidated financial statements.
42

Xtreme Drilling and Coil Services Corp. Consolidated Statements of Changes in Equity For the years ended December 31, 2013 and 2012
(in thousands of Canadian dollars)
Equity attributable to the owners of the parent
Share capital
Share option reserve
Accumulated deficit
Foreign currency
translation reserve
Total Non-
controlling interest
Total shareholders’
equity
Balance at Jan 1, 2012 (Previously reported)
310,296 10,338 (4,325) (8,596) 307,713 – 307,713
Effect of change in accounting policies
– – (7,887) 387 (7,500) 1,663 (5,837)
Balance at Jan 1, 2012 (Restated)
310,296 10,338 (12,212) (8,209) 300,213 1,663 301,876
Net (loss) income for the year – – (158) – (158) 1,432 1,274
Other comprehensive loss
Currency translation differences
– – – (3,105) (3,105) (173) (3,278)
Total comprehensive (loss) income
– – (158) (3,105) (3,263) 1,259 (2,004)
Employee share option scheme: Value of employees services 105 1,339 – – 1,444 – 1,444
Proceeds from shares issued 16,796 (105) – – 16,691 – 16,691
Total transactions with owners
16,901 1,234 – – 18,135 – 18,135
Balance at Dec 31, 2012 (Restated)
327,197 11,572 (12,370) (11,314) 315,085 2,922 318,007
Balance at Jan 1, 2013 327,197 11,572 (12,370) (11,314) 315,085 2,922 318,007
Net (loss) income for the year – – (327) – (327) 894 567
Other comprehensive income
Currency translation differences
– – – 26,457 26,457 294 26,751
Total comprehensive income (loss)
– – (327) 26,457 26,130 1,188 27,318
Dividends paid to non-controlling interest holder
– – – – – (3,157) (3,157)
Employee share option scheme: Value of employee services 478 1,325 – – 1,803 – 1,803
Proceeds from shares issued 741 (478) – – 263 – 263
Total transactions with owners
1,219 847 – – 2,066 (3,157) (1,091)
Balance at Dec 31, 2013 328,416 12,419 (12,697) 15,143 343,281 953 344,234
The accompanying notes are an integral part of the consolidated financial statements.
43

Xtreme Drilling and Coil Services Corp. Consolidated Statements of Cash Flows For the years ended December 31, 2013 and 2012 (in thousands of Canadian dollars)
2013 2012
(Restated – Note 3)
Cash flow provided by:
Operating activities Net income for the year 567 1,274
Items not affecting cash:
Depreciation and amortization 51,495 27,569
Stock-based compensation 1,321 1,245
Unrealized foreign exchange loss (gain) 6,494 (1,659)
(Gain) loss on sale of equipment (132) 257
Change in fair value of non-controlling interest liability 1,481 (829)
Impairment on accounts receivable 72 6,235
Impairment on assets held for sale – 3,133
Loss on damage of property and equipment – 538
Interest expense 7,866 6,963
Interest paid (7,656) (6,491)
Amortization of debt issuance costs 1,380 966
Current tax expense 3,870 2,775
Deferred tax expense (recovery) 483 (7,175)
Taxes paid (217) –
Changes in items of working capital (Note 21) (5,122) (12,900)
Net cash generated from operating activities 61,902 21,901
Financing activities
Proceeds from shares issued, net of issue costs – 16,192
Proceeds from exercise of stock options 741 255
Proceeds from long-term debt 12,512 66,260
Proceeds from long-term debt 129,632 –
Repayment of long-term debt (158,609) (5,605)
(Repayment of) proceeds from operating facility (7,834) 7,834
Dividends paid to non-controlling interest partner (1,276) –
Debt issuance cost (1,247) (1,459)
Net cash (used in) generated from financing activities (26,081) 83,477
Investing activities
Proceeds from sale of equipment 569 681
Capital expenditures (23,059) (112,357)
Net cash used in investing activities (22,490) (111,676)
Effect of exchange rate changes on cash and cash equivalents (7,032) 5,346
Increase (decrease) in cash and cash equivalents 6,299 (952)
Cash and cash equivalents - beginning of year 5,921 6,873
Cash and cash equivalents - end of year 12,220 5,921 There were $217 in taxes paid on income during the year ended December 31, 2013 (December 31, 2012 – nil) The accompanying notes are an integral part of the consolidated financial statements.
44

Xtreme Drilling and Coil Services Corp. Notes to the Consolidated Financial Statements (in thousands of Canadian dollars)
1. General Information
Xtreme Drilling and Coil Services Corp. (“Xtreme” or the "Company"), is a publically traded company incorporated May 24, 2005, under the Business Corporations Act of Alberta. The Company’s head office is located at 770, 340 – 12th Avenue S.W., Calgary, Alberta T2R1L5 and its registered office is located at 4300, 888 – 3rd Street S.W., Calgary, Alberta T2P 5C5. The Company also maintains a headquarters in Houston, Texas, has a regional office and yard in Greeley, Colorado, a regional office in the City of Luxembourg, Luxembourg, as well as field offices in Mills, Wyoming, Jourdanton, Texas, and Dammam, Saudi Arabia. Xtreme designs, builds, and operates a fleet of high specification drilling rigs and coiled tubing well service units featuring leading-edge proprietary technology including alternating current high capacity coil injectors, deep re-entry drilling capability, modular transportation systems and continuous integration of in-house advances in methodologies. Currently, Xtreme operates two service lines: drilling services (“XDR”) and coil services (“XSR”) under contracts with oil and natural gas exploration and production companies and integrated oilfield service providers in the United States of America (“United States” or “US”), the Kingdom of Saudi Arabia (“Saudi Arabia”), and Canada. The Company is listed on the Toronto Stock Exchange under the symbol “XDC”.
2. Basis of preparation
The Company prepares its consolidated financial statements in accordance with International Financial Reporting Standards (“IFRS”) as issued by the International Accounting Standards Board (“IASB”). These financial statements were approved by the Board of Directors for issue on March 4, 2014.
3. Summary of significant accounting policies
The significant accounting policies used in the preparation of these consolidated financial statements are described below. These policies have been consistently applied to all years presented, unless otherwise stated. Certain amounts in prior year have been reclassified to conform to the current year’s presentation.
Basis of measurement The consolidated financial statements have been prepared under the historical cost convention, as modified by the revaluation of financial assets and financial liabilities (including derivative instruments) at fair value through profit and loss. Consolidation The consolidated financial statements include the accounts of Xtreme and its subsidiaries (including structured entities) over which the Company has control. The Company controls an entity when the Company is exposed to, or has rights to, variable returns from its involvement with the entity and has the ability to affect those returns through its power over the entity. Subsidiaries are consolidated from the date of acquisition of control and continue to be consolidated until the date that there is a loss of control. All intercompany transactions, balances and unrealized gains and losses from intercompany transactions, are eliminated on consolidation.
45

Xtreme Drilling and Coil Services Corp. Notes to the Consolidated Financial Statements (in thousands of Canadian dollars)
The following table summarizes Xtreme’s subsidiaries whose financial position and results have been consolidated in Xtreme’s consolidated financial statements:
Segment reporting Operating segments are reported in a manner consistent with the internal reporting provided to the chief operating decision-maker. The chief operating decision-maker is responsible for allocating resources and assessing performance of the operating segments and has been identified by the Board of Directors of Xtreme. Foreign currency translation
(i) Functional and presentation currency
Items included in the financial statements of each of the Company’s entities are measured using the currency of the primary economic environment in which the entity operates (“the functional currency”). The functional currency of Xtreme is the Canadian dollar (“CAD”) and the functional currency of its subsidiaries is the United States dollar (“USD”). The consolidated financial statements are presented in CAD, which is the Company’s functional and presentation currency.
(ii) Transactions and balances
Foreign currency transactions are translated into the functional currency using the exchange rates prevailing at the dates of the transactions. Generally, foreign exchange gains and losses resulting from the settlement of such transactions and from the translation at year-end exchange rates of monetary assets and liabilities denominated in currency other than an operating foreign currency are recognized in the consolidated statement of income.
Cash and cash equivalents Cash and cash equivalents include cash on hand, deposits held at call with banks and other short-term, highly liquid investments with original maturities of three months or less. Financial instruments Financial assets and liabilities are recognized when the Company becomes a party to the contractual provisions of the instrument. Financial assets are derecognized when the rights to receive cash flows from the assets have expired or have been transferred and the Company has transferred substantially all risks and rewards of ownership. Financial liabilities are derecognized when the obligation specified in the contract is discharged, cancelled or expires.
Percentage of
Ownership Country of formation Nature of Business
Xtreme Equipment Inc. 100% United States Asset Corporation
Xtreme Drilling and Coil Services, Inc. 100% United States Operating Corporation
Xtreme Drilling and Coil Services Luxembourg S.A. 100% Luxembourg Asset Corporation
Xtreme Equipment Group S.A. 80% Luxembourg Asset Corporation
Xtreme Coil Drilling Saudi Arabia Ltd. 80% Saudi Arabia Operating Corporation
46

Xtreme Drilling and Coil Services Corp. Notes to the Consolidated Financial Statements (in thousands of Canadian dollars)
At initial recognition, the Company classifies its financial instruments in the following categories: (i) Loans and receivables
Loans and receivables are non-derivative financial assets with fixed or determinable payments not quoted in an active market. The Company’s loans and receivables comprise trade receivables, other receivables, and cash and cash equivalents and are included in current assets due to their short-term nature. Loans and receivables are initially recognized at the amount expected to be received less, when material, a discount to reduce the receivables to fair value. Subsequently, loans and receivables are measured at amortized cost using the effective interest method less a provision for impairment.
(ii) Financial liabilities at amortized cost
Financial liabilities at amortized cost include accounts payable and accrued liabilities, bank indebtedness and long-term debt. Accounts payable and accrued liabilities are initially recognized at the amount required to be paid less, when material, a discount to reduce the payables to fair value. Subsequently, accounts payable and accrued liabilities are measured at amortized cost using the effective interest method. Bank indebtedness and long-term debt are recognized initially at fair value, net of any transaction costs incurred, and, subsequently, at amortized cost using the effective interest method. Financial liabilities are classified as current liabilities if payment is due within twelve months. Otherwise, they are presented as non-current liabilities.
(iii) Derivative financial instruments
Derivatives are initially recognized at fair value on the date a derivative contract is entered into and are subsequently re-measured at their fair value at each reporting date. Gains or losses arising from changes in the fair value of the derivatives are presented in the income statement in the period in which they arise.
Impairment of financial assets At each reporting date, the Company assesses whether there is objective evidence that a financial asset is impaired. If such evidence exists, the Company recognizes an impairment loss as the difference between the amortized cost of the receivable and the present value of the estimated future cash flows, discounted using the instrument’s original effective interest rate. The carrying amount of the asset is reduced by this amount, either directly or indirectly, through the use of an allowance account. Impairment losses on financial assets are carried at amortized cost and are reversed in subsequent periods if the amount of the loss decreases and the decrease can be related objectively to an event occurring after the impairment was recognized. Inventory Inventory is composed of consumables, minor spare parts, and servicing equipment and is recorded at the lower of cost or net realizable value determined on a specific-item basis. The cost of inventory is comprised of the purchase price paid to a third party plus applicable duties, freight and shipping costs. Net realizable value is the estimated selling price in the ordinary course of business less applicable selling expenses. If carrying value exceeds net realizable amount, a write-down is
47

Xtreme Drilling and Coil Services Corp. Notes to the Consolidated Financial Statements (in thousands of Canadian dollars)
recognized. The write-down may be reversed in a subsequent period if the circumstances which caused it no longer exist. Property and equipment Property and equipment are stated at cost less accumulated depreciation and any accumulated impairment losses. Cost includes expenditures directly attributable to the acquisition of the asset. Subsequent costs are included in the asset’s carrying amount or recognized as a separate asset, as appropriate, only when it is probable the future economic benefits associated with the item will flow to the Company and the cost of the item can be measured reliably. Costs related to major inspection and overhaul are recognized as part of the carrying amount of property and equipment if they meet the asset recognition criteria. The major overhaul component will then be depreciated on a straight-line basis over the useful life, which is estimated to be over the period to the next overhaul. Any remaining costs will be derecognized when the next overhaul is performed. Costs of the day-to-day servicing of property and equipment are expensed as incurred. The cost of self-constructed assets includes the cost of materials, direct labor, and any other costs directly attributable to bringing the asset to the location and condition necessary for it to be capable of operating in the manner intended by management.
Depreciation on assets is calculated using the straight-line method to allocate the cost of each asset to its residual value over its estimated useful life, as follows:
The Company allocates the amount initially recognized in respect of an item of property and equipment to its significant parts and depreciates separately each such part. The carrying amount of a replaced part is derecognized when replaced. Residual values, method of amortization and useful lives of the assets are reviewed annually and adjusted if appropriate.
The asset’s residual values and useful lives are reviewed, and adjusted if appropriate, at each balance sheet date. An asset’s carrying amount is written down immediately to its recoverable amount if the asset’s carrying amount is greater than its estimated recoverable amount. Gains and losses on disposals are determined by comparing proceeds with the carrying amount. These are included in the consolidated statement of income.
Identifiable intangible assets Xtreme capitalizes legal costs incurred with the registration of its drilling and technology patents and pending patent applications. The Company amortizes drilling and technology patents and pending patent applications on a straight-line basis over a period of 20 years, which is the life of each patent. Costs of maintenance and defense of patents is expensed as incurred.
Drilling and servicing equipment, including capital spares 3 - 20 years
Office and shop equipment 1 - 5 years
Vehicles and trucking equipment 3 - 10 years
Drill pipe 3 years
Building 39 years
48

Xtreme Drilling and Coil Services Corp. Notes to the Consolidated Financial Statements (in thousands of Canadian dollars)
Goodwill Goodwill arises on the acquisition of subsidiaries and represents the excess of the consideration transferred over the Company’s interest in net fair value of the net identifiable assets, liabilities and contingent liabilities of the acquiree and the fair value of the non-controlling interest in the acquirees. Goodwill is not amortized. Borrowing costs Borrowing costs directly attributable to the acquisition, construction or production of qualifying assets, which are assets that necessarily take a substantial period of time to get ready for their intended use or sale, are added to the cost of those assets, until such time as the assets are substantially ready for their intended use or sale. Investment income earned on the temporary investment of specific borrowings pending their expenditure on qualifying assets is deducted from the borrowing costs eligible for capitalization. All other borrowing costs are recognized in the profit and loss in the period in which they are incurred. Impairment of non-financial assets Property and equipment and intangible assets (other than goodwill) are tested for impairment when events or changes in circumstances indicate that the carrying amount may not be recoverable. For the purpose of measuring recoverable amounts, assets are grouped at the lowest levels for which there are separately identifiable cash flows (cash-generating units or “CGUs”). Recoverable amount is the higher of an asset’s fair value less costs of disposal and value in use (being the present value of the expected future cash flows of the relevant asset or CGU, as determined by management). The Company evaluates impairment losses, other than goodwill impairment, for potential reversals when events or circumstances warrant such consideration and accordingly, goodwill is assessed for impairment together with the assets and liabilities of the related segment.
The Company assesses at each year-end whether there is any objective evidence that its interests in associates are impaired. If so, the carrying value of the Company’s share of the underlying assets of associates is written down to its net recoverable amount (being the higher of fair value less cost of disposal and value in use) and the loss is charged to the consolidated statement of income in “other gains and losses (net)”. Employee benefits (i) Termination benefits
The Company recognizes termination benefits when it is demonstrably committed to either terminating the employment of current employees according to a detailed formal plan without possibility of withdrawal, or providing benefits as a result of an offer made to encourage voluntary termination. Benefits falling due more than twelve months after the end of the reporting period are discounted to their present value.
(ii) Stock-based compensation – Stock options
The Company grants stock options to certain employees of Xtreme. Stock options vest equally over three years and expire after five years. Each tranche in an award is considered a
49

Xtreme Drilling and Coil Services Corp. Notes to the Consolidated Financial Statements (in thousands of Canadian dollars)
separate award with its own vesting period and grant date fair value. The fair value of each tranche is measured at the date of grant using the Black-Scholes option pricing model. Compensation expense is recognized over the tranche’s vesting period by increasing share option reserve based on the number of awards expected to vest. This number is reviewed at least annually, with any change in estimate recognized immediately in compensation expense with a corresponding adjustment to share option reserve.
(iii) Stock-based compensation – Incentive and Retention Plan
The Incentive and Retention Plan is designed to provide the Company’s directors, officers and key employees and consultants with an opportunity to receive cash and/or equity-based incentives associated with common shares of the Company and to benefit from the appreciation of the common shares. Under the incentive plan, shares granted to eligible individuals vest annually. Vested shares may be settled in cash or equity, at the discretion of the Company, at a value determined by the fair market value of the shares at the vesting date. The fair value of the services received in exchange for the grant of the options is recognized as an expense. The total amount to be expensed is determined by reference to the fair value of the shares granted including any market performance conditions, excluding the impact of any service and non-market performance vesting conditions, and including the impact of any non-vesting conditions. Non-market performance and service conditions are included in assumptions about the number of shares that are expected to vest. The total expense is recognized over the vesting period, which is the period over which all of the specified vesting conditions are to be satisfied.
Other liabilities Provisions for restructuring costs and legal claims, where applicable, are recognized when the Company has a present legal or constructive obligation as a result of past events, it is more likely than not an outflow of resources will be required to settle the obligation and the amount can be reliably estimated. Provisions are not recognized for future operating losses. Provisions are measured at management’s best estimate of the expenditure required to settle the obligation at the end of the reporting period and are discounted to present value where the effect is material. The Company performs evaluations to identify onerous contracts and, where applicable, records provisions for such contracts. Income tax Income tax comprises current and deferred tax. Income tax is recognized in the statement of income except to the extent that it relates to items recognized directly in other comprehensive income or directly in equity, in which case the income tax is also recognized directly in other comprehensive income or equity, respectively. Current tax is the expected tax payable on the taxable income for the year, using tax rates enacted or substantively enacted, at the end of the reporting period, and any adjustment to tax payable in respect of previous years. In general, deferred tax is recognized in respect of temporary differences arising between the tax bases of assets and liabilities and their carrying amounts in the consolidated financial statements. However, deferred tax is not recognized if it arises from the initial recognition of goodwill or the initial recognition of an asset or liability in a transaction other than a business combination that, at the time of the transaction, affects neither accounting nor taxable profit or loss. Deferred income tax is provided on temporary differences arising on investments in subsidiaries and associates, except, in
50

Xtreme Drilling and Coil Services Corp. Notes to the Consolidated Financial Statements (in thousands of Canadian dollars)
the case of subsidiaries, where the timing of the reversal of the temporary difference is controlled by the company and it is probable that the temporary difference will not reverse in the foreseeable future. Deferred income tax is determined on a non-discounted basis using tax rates and laws that have been enacted or substantively enacted at the balance sheet date and are expected to apply when the deferred tax asset is realized or liability is settled. Deferred tax assets are recognized to the extent that it is probable that future taxable profit will be available against which the deductible temporary differences can be utilized. Deferred income tax assets and liabilities are presented as non-current. Revenue Revenue is measured at the fair value of the consideration received or receivable, and represents amounts receivable for goods supplied or services rendered. The Company recognizes revenue when the amount of revenue can be reliably measured; when it is probable that future economic benefits will flow to the entity; and when specific criteria have been met for each of the Company’s activities, as specified below. The Company’s services are generally sold based upon service orders or contracts with customers that include fixed or determinable prices based on daily, hourly, or job rates. Customer contract terms do not include provisions for significant post-service delivery obligations. Revenue is recognized when services are rendered and only when collectability is reasonably assured. Drilling and service operations revenue is recognized in the accounting period in which the services are rendered, with reference to the stage of completion of the specific transaction and assessed on the basis of the actual services provided as a proportion of the total services to be provided. Share capital Incremental costs directly attributable to the issuance of shares are recognized as a deduction from equity. Earnings per share Basic earnings per share (“EPS”) is calculated by dividing the net income (loss) for the period attributable to equity owners of Xtreme by the weighted average number of common shares outstanding during the period. Diluted EPS is calculated by adjusting the weighted average number of common shares outstanding for dilutive instruments. The number of shares included with respect to options, warrants and similar instruments is computed using the treasury stock method. Xtreme’s potentially dilutive common shares comprise options granted to employees and warrants. New and amended standards adopted by the Company The Company has adopted the following new and revised standards, along with any consequential amendments, effective January 1, 2013. These changes were made in accordance with applicable transitional provisions. IFRS 10 Consolidated Financial Statements IFRS 10, Consolidated Financial Statements (“IFRS 10”), establishes principles for the presentation and preparation of consolidated financial statements when an entity controls one or more other
51

Xtreme Drilling and Coil Services Corp. Notes to the Consolidated Financial Statements (in thousands of Canadian dollars)
entities and outlines specific criteria to use in determining whether control exists. IFRS 10 superseded IAS 27, Consolidated and Separate Financial Statements, and Standing Interpretations Committee Interpretation 12, Consolidation—Special Purpose Entities. IFRS 10 requires consolidation of an investee if the investor is exposed or has the rights, to variable returns from its involvement with the investee and has the ability to affect those returns through its power over the investee.
Evaluation of Saudi Arabia Operations
The Company conducts a portion of its operations through entities in Luxembourg and Saudi Arabia in which the Company holds an 80 percent interest.
Based on the criteria outlined in IFRS 10, as of January 1 2013, the Company concluded that it has control over Xtreme Equipment Group S.A. and Xtreme Coil Drilling Saudi Arabia Ltd. and these entities should be fully consolidated. The Company's review took into consideration the fact that the sole purpose of Xtreme Coil Drilling Saudi Arabia Ltd. is providing services to a single customer in the region. The services are performed with the assets of Xtreme Equipment Group S.A. and under the direct guidance of the Company and Company personnel. In connection with the operations of the joint ventures, some strategic decisions require unanimous approval by both parties. However, it is management's view that given the design and purpose of the entities and the business activities undertaken, those protective decisions are not considered to be relevant as defined under IFRS 10. The operations have remained relatively consistent with the two rigs working for the same customer. Demand of activities is mainly and exclusively driven by the ultimate customer and the budgeting process has limited ability to control those activities. Thus, there have not been many variables in the budgeting process. However, should growth or revisions to the existing business plan occur, this could change and become a relevant activity.
Prior to the adoption of IFRS 10, the Company applied the provisions of IAS 31, Interests in Joint Ventures (“IAS 31”), to account for its interests in the two entities. Under IAS 31, the Company determined that the establishment of the two legal entities, coupled with the provisions of the respective shareholder agreements, resulted in jointly controlled entities. A jointly controlled entity is a joint venture that involves the establishment of a corporation, partnership or other entity in which each venture has an interest. The entity operates in the same way as other entities, except that a contractual arrangement between the venturers established joint control over the economic activity of the entity. The Company considered certain strategic decisions that required unanimous approval in accordance with the respective shareholder agreements. Under IAS 31, these were considered decisions which were unanimous and factored into the assessment of joint control. Such decisions included, but were not limited to, the following:
• appointing, removing or changing the auditors of the joint venture; • incurring or assuming any debt or establishing any credit lines, outstanding loans or credit
facilities, in excess of a threshold to be agreed on by the shareholders of the Company; • approving the annual business plan and budget; • forming or acquiring any subsidiary of the joint venture; • amending the articles or bylaws of the joint venture; • encumbering all or substantially all of the property or capital assets of the joint venture; • owning or acquiring any securities of an unrelated issuer; • approving the annual accounts of the joint venture; • licensing, transferring or encumbering any proprietary technology for the joint venture; • selling or transferring all or substantially all of the property or capital assets for the joint venture; • issuing new shares or securities, warrants, options or granting any other rights to newly issued
shares except if that issuance or grant has been approved as a part of the approval of an annual business plan or budget;
52
Xtreme Drilling and Coil Services Corp. Notes to the Consolidated Financial Statements (in thousands of Canadian dollars)
• suspension of dividends, creating voluntary reserves or retaining any earnings but not limited to working capital reserves.
IAS 31 allowed two treatments of accounting for an investment in jointly controlled entities – proportionate consolidation or equity method. As a result of the assessment under IAS 31, the Company’s 80 percent ownership interest in each of these two entities was previously accounted for as joint ventures using the proportionate consolidation method of accounting. Evaluating these decisions under IFRS 10, the Company concluded that such decisions were not considered “relevant” as defined and were not key for the purposes of evaluating control. Although the joint venture partner was allotted some rights under the respective shareholder agreements, none of these were designed to drive financial returns on the investment. The agreement with the joint venture partner for the Saudi Arabia joint ventures dated March 12, 2010 (the “SA JV Agreement”), contains an option that allows the Company to exercise a call option to acquire all of the partner’s interest in the two entities in consideration for payment in cash in CAD or in shares of the Company’s stock of an amount equal to the valuation amount of the partner’s interest, as defined in the agreement, after the fifth anniversary, but before the sixth anniversary, of the establishment of the legal entities. The SA JV Agreement also provides for the partner to exercise a put option to require the Company to acquire all of the partner’s interest. Based on the details of the arrangement, the Company has recorded the present value of this potential payment obligation as a liability on the financial statements.
In addition, as part of the SA JV Agreement between both parties, the Company has a right to acquire the joint venture's interest should a dispute arise. However, the joint venture partner does not have the right to acquire the Company's interest. Therefore, based on the criteria outlined in IFRS 10, the Company has concluded that it has control over Xtreme Equipment Group S.A. and Xtreme Coil Drilling Saudi Arabia Ltd. and these entities should be fully consolidated.
On July 15, 2013, the Company informed the joint venture partner of both Xtreme Equipment Group S.A. and Xtreme Coil Drilling Saudi Arabia Ltd. of its intent to exercise its option to purchase all of the partner’s interest in both entities. On February 25, 2014, the Company and the partner finalized negotiations on the agreed purchase price of $13,500 USD ($14,359 CAD), of which $12,000 USD ($12,763 CAD) is classified as current.
The Company made the initial payment of $10,500 USD ($11,168 CAD) on February 25, 2014. It expects to pay an additional $1,500 USD ($1,596 CAD) during 2014. The remaining $1,500 USD ($1,596 CAD) is expected to be paid by July 2015.
IFRS 10 was applied retrospectively in these consolidated financial statements. The adjustments for each financial statement line item affected are presented in the following tables.
53

Xtreme Drilling and Coil Services Corp. Notes to the Consolidated Financial Statements (in thousands of Canadian dollars)
Reconciliation of Consolidated Statements of Financial Position Adjustments for changes in accounting policies
Dec 31, 2012 Jan 1, 2012
Before accounting
change IFRS 10
adjustments
After accounting
change
Before accounting
change IFRS 10
adjustments
After accounting
change
Current assets Cash and cash equivalents 5,177 744 5,921 5,892 981 6,873
Accounts receivable 43,669 1,209 44,878 45,353 1,300 46,653
Other receivables 35 2,940 2,975 1,906 (270) 1,636
Prepaid expenses and other 2,021 26 2,047 2,090 24 2,114
Assets held for sale 9,308 – 9,308 – – –
Income tax recoverable 391 (23) 368 934 (6) 928
Inventory 5,746 728 6,474 5,863 607 6,470
66,347 5,624 71,971 62,038 2,636 64,674
Non-current assets
Deferred tax asset 15,002 4 15,006 7,566 10 7,576
Property and equipment 408,573 6,781 415,354 341,198 6,950 348,148
Intangible assets 4,220 – 4,220 4,523 – 4,523
Total Assets 494,142 12,409 506,551 415,325 9,596 424,921
Current liabilities
Bank indebtedness 7,834 – 7,834 – – –
Accounts payable and accrued liabilities 26,642 1,262 27,904 26,175 727 26,902
Current portion of long-term debt 13,361 840 14,201 500 – 500
47,837 2,102 49,939 26,675 727 27,402
Long-term liabilities Fair value of non-controlling interest liability – 12,878 12,878 – 13,707 13,707
Long-term debt 125,727 – 125,727 80,937 999 81,936
Total Liabilities 173,564 14,980 188,544 107,612 15,433 123,045
Equity
Shareholders’ equity
Share capital 327,197 – 327,197 310,296 – 310,296
Share option reserve 11,572 – 11,572 10,338 – 10,338
Accumulated deficit (5,312) (7,058) (12,370) (4,325) (7,887) (12,212)
Foreign currency translation reserve (12,879) 1,565 (11,314) (8,596) 387 (8,209)
320,578 (5,493) 315,085 307,713 (7,500) 300,213
Non-controlling interest – 2,922 2,922 – 1,663 1,663
Total Liabilities and Equity 494,142 12,409 506,551 415,325 9,596 424,921
54

Xtreme Drilling and Coil Services Corp. Notes to the Consolidated Financial Statements (in thousands of Canadian dollars)
Reconciliation of Consolidated Statements of Income Adjustments for changes in accounting policies
December 31, 2012
Before accounting
change IFRS 10
adjustments After accounting
change
Revenue 174,150 5,237 179,387
Expenses
Operating expenses 125,529 2,306 127,835
General and administrative expenses 9,147 1,079 10,226
Depreciation of property and equipment 26,974 292 27,266
Amortization of intangibles 303 – 303
Stock-based compensation 1,229 16 1,245
Foreign exchange gain (1,792) 2 (1,790)
Loss on sale of equipment 257 – 257
Change in fair value of non-controlling interest liability – (829) (829)
Impairment of accounts receivable 6,235 – 6,235
Impairments of assets held for sale 3,133 – 3,133
Loss on damage of property and equipment 538 – 538
Other expense 175 – 175
Interest expense 7,919 – 7,919
Loss before tax for the year (5,497) 2,371 (3,126)
Tax expense
Current 2,666 109 2,775
Deferred (7,176) 1 (7,175)
Total tax expense (4,510) 110 (4,400)
Net (loss) income for the year (987) 2,261 1,274
Net (loss) income attributable to:
Owners of the parent (987) 829 (158)
Non-controlling interest – 1,432 1,432
(987) 2,261 1,274
Net loss per common share attributable to equity owners of the parent
Basic (0.01) 0.01 (0.00)
Diluted (0.01) 0.01 (0.00)
55

Xtreme Drilling and Coil Services Corp. Notes to the Consolidated Financial Statements (in thousands of Canadian dollars)
Reconciliation of Consolidated Statements of Comprehensive Income Adjustments for changes in accounting policies
December 31, 2012
Before accounting
change IFRS 10
adjustments After accounting
change
Net (loss) income for the year (987) 2,261 1,274
Other comprehensive loss Items that may be subsequently reclassified to profit or loss
Unrealized loss on translating financial statements of foreign operations (4,283) 1,005 (3,278)
Comprehensive loss for the year (5,270) 3,266 (2,004)
Comprehensive loss attributable to:
Owners of the parent (5,270) 2,007 (3,263)
Non-controlling interest – 1,259 1,259
(5,270) 3,266 (2,004)
56

Xtreme Drilling and Coil Services Corp. Notes to the Consolidated Financial Statements (in thousands of Canadian dollars)
Reconciliation of Consolidated Statement of Cash Flows Adjustments for changes in accounting policies
December 31, 2012
Before accounting
change IFRS 10 adjustments After accounting
change
Cash flow provided by:
Operating activities
Net (loss) income for the year (987) 2,261 1,274
Items not affecting cash:
Depreciation and amortization 27,278 291 27,569
Stock-based compensation 1,229 16 1,245
Unrealized foreign exchange gain (1,659) – (1,659)
Loss on sale of equipment 257 – 257
Change in fair value of non-controlling interest liability – (829) (829)
Impairment of accounts receivable 6,235 – 6,235
Impairment of assets held for sale 3,133 – 3,133
Loss on damage of property and equipment 538 – 538
Interest expense 6,963 – 6,963
Interest paid (6,491) – (6,491)
Amortization of debt issuance costs 966 – 966
Current tax expense – 2,775 2,775
Deferred tax recovery (7,176) 1 (7,175)
Changes in items of working capital (1,692) (11,208) (12,900)
Net cash generated from operating activities 28,594 (6,693) 21,901
Financing activities
Proceeds from shares issued, net of issue costs 16,192 – 16,192
Proceeds from exercise of stock options 255 – 255
Proceeds from long-term debt 66,260 – 66,260
Repayment of long-term debt (5,466) (139) (5,605)
Proceeds from operating facility 7,834 – 7,834
Debt issuance cost (1,459) – (1,459)
Net cash generated from financing activities 83,616 (139) 83,477
Investing activities
Proceeds from sale of equipment 681 – 681
Capital expenditures (112,260) (97) (112,357)
Net cash used in investing activities (111,579) (97) (111,676)
Effect of exchange rate changes on cash and cash equivalents (1,346) 6,692 5,346
Decrease in cash and cash equivalents (715) (237) (952)
Cash and cash equivalents – beginning of year 5,892 981 6,873
Cash and cash equivalents – end of year 5,177 744 5,921
57

Xtreme Drilling and Coil Services Corp. Notes to the Consolidated Financial Statements (in thousands of Canadian dollars)
IFRS 13 Fair value measurement IFRS 13, Fair value measurement (“IFRS 13”), provides a single framework for measuring fair value. The measurement of the fair value of an asset or liability is based on assumptions that market participants would use when pricing the asset or liability under current market conditions, including assumptions about risk. The Company adopted IFRS 13 on January 1, 2013, on a prospective basis. IFRS 12 Disclosure of interests in other entities IFRS 12, Disclosures of interests in other entities (“IFRS 12”) includes the disclosure requirements for all forms of interests in other entities, including joint arrangements, associates, structured entities and other off balance sheet vehicles. Amendment to IAS 1 Financial Statement Presentation Amendment to IAS 1, Financial statement presentation (“IAS 1”) regarding other comprehensive income. The main change resulting from these amendments is a requirement for entities to group items presented in other comprehensive income on the basis of whether they are potentially reclassifiable to profit or loss subsequently (reclassification adjustments). Amendment to IAS 36 Impairment of assets
Amendments to IAS 36, Impairment of assets (“IAS 36”), on the recoverable amount disclosures for non-financial assets. This amendment removed certain disclosures of the recoverable amount of cash generating units (“CGU”) which had been included in IAS 36 by the issue of IFRS 13. The amendment is not mandatory for the Company until January 1, 2014, however the Company has decided to early adopt the amendment as of January 1, 2013. See also “Accounting standards and amendments issued but not get adopted” below for a further discussion of amendments to IAS 36. In addition, several other new standards and amendments that are effective as of January 1, 2013, do not impact the consolidated financial statements of the Company. Accounting standards and amendments issued but not yet adopted
Unless otherwise noted, the following revised standards and amendments are effective for annual periods beginning on or after January 1, 2014, with earlier application permitted. The Company has not yet assessed the impact of these standards and amendments or determined whether it will early adopt them. IFRS 9, Financial instruments (“IFRS 9”), addresses the classification, measurement and recognition of financial assets and financial liabilities. IFRS 9 was issued in November 2009 and October 2010. It replaces the parts of IAS 39 that relate to the classification and measurement of financial instruments. IFRS 9 requires financial assets to be classified into two measurement categories: those measured at fair value and those measured at amortized cost. The determination is made at initial recognition. The classification depends on the entity’s business model for managing its financial instruments and the contractual cash flow characteristics of the instrument. For financial liabilities, the standard retains most of the IAS 39 requirements. The main change is that, in cases where the fair value option is taken for financial liabilities, the part of a fair value change due to an entity’s own credit risk is recorded in other comprehensive income rather than the income statement, unless this creates an
58

Xtreme Drilling and Coil Services Corp. Notes to the Consolidated Financial Statements (in thousands of Canadian dollars)
accounting mismatch. The Company is yet to assess IFRS 9’s full impact. The Company will also consider the impact of the remaining phases of IFRS 9 when completed by the board of directors.
4. Critical accounting estimates and judgments
The preparation of financial statements requires management to use judgment in applying its accounting policies and estimates and assumptions about the future. Estimates and other judgments are continuously evaluated and are based on management’s experience and other factors, including expectations about future events that are believed to be reasonable under the circumstances. Critical accounting judgments Significant judgments are used in the application of accounting policies related to the following material amounts recognized in the consolidated financial statements: Consolidation
See “New and amended standards adopted by the Company” in Note 3 for a discussion of the Company’s decision to consolidate Xtreme Equipment Group S.A. and Xtreme Coil Drilling Saudi Arabia Ltd. at January 1, 2013. Assessment of Impairment Indicators For its long lived assets with determinable useful lives, Xtreme assesses for impairment at least annually as well as when circumstances suggest that the carrying amount exceed the recoverable amount, as well as the internal and external factors to determine if an impairment test is warranted. Cash Generating Units Assets are grouped into cash generating units for the purpose of impairment testing. A CGU is defined as the lower grouping of integrated assets that generate identifiable cash inflows that are largely independent of cash inflows of other assets or groups of assets. The allocation of assets into CGUs requires significant judgment and interpretation with respect to interchangeability of rig characteristics and technology, geographic proximity, and other economic factors, including price and contract risk, operational risk, development costs and tax regimes. Critical accounting estimates Xtreme uses significant estimates in the determination of a number of account balances. These estimates have a significant risk of causing a material adjustment to the carrying amounts of the underlying assets and liabilities within the next fiscal year. Material accounts subject to significant estimates are as follows: Allowance for Doubtful Accounts The Company performs ongoing customer credit evaluations and grants credit based on a review of historical collection experience, current aging status, financial condition of the customer and anticipated industry conditions. Customer payments are regularly monitored and a provision for doubtful accounts is established based on specific situations and overall industry conditions.
59

Xtreme Drilling and Coil Services Corp. Notes to the Consolidated Financial Statements (in thousands of Canadian dollars)
Impairment of Long-Lived Assets
The Company evaluates its property and equipment for impairment annually and whenever events or changes in circumstances indicate the carrying amount may not be recoverable. If there is any indication of impairment, the recoverable amount of the asset is estimated to determine the impairment loss, if any. To calculate the recoverable amount, estimates are made regarding the following factors: future demand for the Company's services by oil and gas exploration and production companies, foreign currency exchange rates and interest rates, changes in the cost and availability of financing, replacement costs of drilling equipment, future repair and maintenance costs, and the Company's future operating and financial results. In assessing fair value less costs to disposal, the estimated future cash flows are discounted to their present value using a discount rate that reflects current market assessments of the time value of money and the risks specific to the asset for which the estimates of future cash flows have not been adjusted. As a result, any impairment losses are a result of management’s best estimates of expected revenues, expenses and cash flows at a specific point in time. These estimates are subject to measurement uncertainty as they are dependent on factors outside management’s control. Depreciation Depreciation of the Company’s property and equipment incorporates estimates of useful lives and residual values. These estimates may change as more experience is obtained or as general market conditions change, thereby impacting the value of the Company’s property and equipment. During the first quarter of 2013, management of the Company performed a review of the depreciable lives of the rig components and related equipment. The Company’s rig components and related equipment were being depreciated on the units-of-production (“UOP”) method over a period of 3,650 to 9,125 operating days. Some rig components and equipment were also being depreciated on a straight line basis over a period of 3 to 10 years. Based on the review of the rig components and related equipment and their performance, it was determined that the estimated useful lives should be modified to better reflect the current operations and expected usage and future economic benefits. As a result of the review, management determined the following:
• For rigs operating in the US and Saudi Arabia, rig components and related equipment previously depreciated under UOP would be depreciated on a straight-line basis over a period of 10 to 15 years;
• For rigs operating in Canada, rig components and related equipment previously depreciated under UOP would be depreciated on a straight-line basis over a period of 13 to 20 years. The reason for the extended life versus the US and Saudi rigs is that Canadian rigs operate 9 to 10 months of the year due to break-up whereas the US and Saudi rigs work or are capable of working for the full year;
• Some rig components and related equipment previously depreciated under UOP were converted to straight line as their usage over time has no relation to production;
• The lives of assets previously depreciated under the straight-line method appeared reasonable and no changes were deemed necessary;
• The salvage value estimate of 20 percent continues to appear reasonable.
60

Xtreme Drilling and Coil Services Corp. Notes to the Consolidated Financial Statements (in thousands of Canadian dollars)
Management reviewed the remaining assets, such as drill pipe, vehicles, office and leasehold improvements, etc. and determined that no changes were required at this time. These assets are depreciated on a straight-line basis over a period of 3 to 10 years. Additionally, starting October 1, 2013, a second change in estimate on useful lives for certain property and equipment and capital spares took place. This was a result of the completion of the physical asset verification undertaken by the Company. Fair value of Financial Instruments The Company’s financial instruments included in the consolidated statement of financial position are comprised of cash and cash equivalents, accounts receivable, current liabilities, bank indebtedness and long-term debt. The fair values of financial instruments included in the consolidated statement of financial position approximate their carrying amounts due to the short-term maturity of those instruments. Long-term debt is carried at amortized cost using the effective interest method of amortization. Income Taxes Deferred tax assets and liabilities are recognized for the future tax consequences attributable to differences between the financial statement amounts of existing assets and liabilities and their respective tax basis. Estimates of the Company’s future taxable income have been considered in assessing the utilization of available tax losses. The Company’s business is complex and the calculation of income taxes involves many complex factors as well as the Company’s interpretation of relevant tax legislation and regulations. Stock-based Compensation
The fair value of options is estimated at the grant date using the Black-Scholes option pricing model, which includes underlying assumptions related to the risk-free interest rate, average expected option life, estimated forfeitures, estimated volatility of the Company’s shares and anticipated dividends. The fair value of deferred stock units and performance stock units is recognized based on the market value of the Company’s common shares underlying these compensation programs.
5. Accounts receivables
In September 2013, the Company recovered previously billed amounts of approximately $2,690 plus legal fees of approximately $510 (recorded in general and administrative expenses in the statement of income) from the settlement of litigation with one of its customers. The carrying amount of trade accounts receivable was approximately $2,760, resulting in a loss of approximately $70 for uncollected amounts.
Trade receivables Dec 31, 2013 Dec 31, 2012 Jan 1, 2012
(Restated – Note 3) (Restated – Note 3)
Less than 90 days 58,661 39,236 25,958
Greater than 90 days and less than 180 days 1,417 2,130 –
Greater than 180 days 6 3,512 20,695
60,084 44,878 46,653
61

Xtreme Drilling and Coil Services Corp. Notes to the Consolidated Financial Statements (in thousands of Canadian dollars)
6. Inventory
Following is a summary of inventory purchased and consumed during the years ended December 31, 2013 and 2012.
Dec 31, 2013 Dec 31, 2012
(Restated – Note 3)
Inventory
Opening balance 6,474 6,470
Purchases 10,350 8,099
Consumption (9,131) (7,367)
Write-offs – (587)
Foreign currency translation 488 (141)
Closing balance 8,181 6,474
The Company used approximately $9,100 in inventory during the year (2012 - $7,400). This amount was recognized as an expense in the consolidated statement of loss and comprehensive income during the year.
62

Xtreme Drilling and Coil Services Corp. Notes to the Consolidated Financial Statements (in thousands of Canadian dollars)
7. Property and equipment
The Company concluded the sale of one of its new-build XSR extended reach coiled tubing units in February 2013, and the assets were delivered to the buyer. These assets amounting to $9,308 were classified as held for sale in the accompanying consolidated statement of financial position at December 31, 2012.
Drilling and servicing
equipment
Vehicles and
trucking equipment
Office and shop
equipment Building and land
Drilling and servicing
equipment - CIP Total
At Jan 1, 2012 (Restated)
Cost 306,074 4,455 3,112 973 74,115 388,729Accumulated depreciation (37,813) (1,203) (1,561) (4) – (40,581)
Net book value 268,261 3,252 1,551 969 74,115 348,148
Year Ended Dec 31, 2012 (Restated)
Opening net book value 268,261 3,252 1,551 969 74,115 348,148
Additions 25,551 1,620 430 227 84,529 112,357
Disposals (35) (35) (15) (752) – (837)Loss on damage of equipment (538) – – – – (538)
Transfers 144,697 44 19 – (144,760) –
Depreciation expense (25,861) (1,065) (333) (7) – (27,266)
Assets held for sale (69) (101) (12,271) (12,441)
Exchange differences (3,579) 13 (13) (23) (467) (4,069)
Closing net book value 408,427 3,728 1,639 414 1,146 415,354
At Dec 31, 2012 (Restated) Cost 470,172 5,783 3,366 423 1,146 480,890
Accumulated depreciation (61,745) (2,055) (1,727) (9) – (65,536)
Net book value 408,427 3,728 1,639 414 1,146 415,354
Year Ended Dec 31, 2013
Opening net book value 408,427 3,728 1,639 414 1,146 415,354
Additions 12,964 808 64 1,979 7,244 23,059
Disposals (656) – – – – (656)
Transfers 1,998 150 – – (2,148) –
Depreciation expense (49,332) (916) (910) (34) – (51,192)
Exchange differences 25,500 210 75 86 87 25,958
Closing net book value 398,901 3,980 868 2,445 6,329 412,523
At Dec 31, 2013
Cost 508,377 6,951 3,505 2,488 6,329 527,650
Accumulated depreciation (109,476) (2,971) (2,637) (43) – (115,127)
Net book value 398,901 3,980 868 2,445 6,329 412,523
63

Xtreme Drilling and Coil Services Corp. Notes to the Consolidated Financial Statements (in thousands of Canadian dollars)
Change in accounting estimate
Effective January 1, 2013, management determined that rig components and equipment previously depreciated under UOP would be depreciated on a straight-line basis over a period of 10 to 20 years. No changes were made to the salvage value estimate.
This change in accounting estimate resulted in an additional depreciation charge of approximately $4,600 for the year ended December 31, 2013, on the rig equipment and components. It is impracticable to estimate the effect of these changes in accounting estimates on future periods as such an estimate would depend on a forecast of future operating activity levels.
At December 31, 2012, capital spares amounted to approximately $25,000. Starting January 1, 2013, the Company began to depreciate capital spares on a straight-line basis and recognized approximately $9,500 in depreciation expense in relation to these assets.
During the year ended December 31, 2013, the Company undertook a physical asset verification process for property and equipment. As a result of the physical asset verification, the Company expensed approximately $3,900 of costs associated with assets that no longer exist or are obsolete. In addition, management reviewed the useful life of certain components of property and equipment and identified that useful life estimates had changed. As such, management has revised the useful life estimates as at October 1, 2013, for these components and applied the change in estimate prospectively from that date. This resulted in an additional depreciation expense of $3,500 for the period from October 1, 2013. The effect of the change in accounting on future periods is expected to be $7,300 in additional depreciation each year until the assets are fully depreciated. This assumes that the useful life estimate and cost associated with the assets remains consistent over the remaining life of the assets.
8. Intangible assets
Intangible assets include the value assigned to the Company’s drilling and technology patents. The Company capitalizes legal costs incurred with the registration of its drilling and technology patents and pending patent applications and amortizes these costs on a straight-line basis over a period of 20 years.
Following is a summary intangible assets at December 31, 2013 and 2012.
64

Xtreme Drilling and Coil Services Corp. Notes to the Consolidated Financial Statements (in thousands of Canadian dollars)
At January 1, 2012 (Restated)
Cost 6,067
Accumulated amortization (1,544)
Net book value 4,523
Year ended December 31, 2012 (Restated)
Opening net book value 4,523
Additions –
Amortization for the year (303)
Net book value 4,220
At January 1, 2013 (Restated)
Cost 6,067
Accumulated amortization (1,847)
Net book value 4,220
Year ended December 31, 2013 (Restated)
Opening net book value 4,220
Additions –
Amortization for the year (303)
Net book value 3,917
At December 31, 2013
Cost 6,067
Accumulated amortization (2,150)
Net book value 3,917
9. Accounts payable and accrued liabilities
Dec 31, 2013 Dec 31, 2012 Jan 1, 2012
(Restated – Note 3) (Restated – Note 3)
Trade payables 10,860 10,026 13,536
Accrued expenses 1,383 3,674 5,563 Customer deposit on assets held for sale – 2,912 –
Accrued payroll 4,941 3,151 3,154
Withholding taxes payable 9,099 6,158 3,191
Sales taxes payable 91 496 114
Property taxes payable 1,677 1,487 1,344
Accounts payable and accrued liabilities 28,051 27,904 26,902
65

Xtreme Drilling and Coil Services Corp. Notes to the Consolidated Financial Statements (in thousands of Canadian dollars)
10. Debt Dec 31, 2013 Dec 31, 2012
(Restated – Note 3)
Long-term debt
Opening balance 139,928 82,436
New debt 142,144 66,260
Repayment of debt (158,609) (5,605)
Debt issuance costs (1,225) (1,459)
Amortization of debt issuance cost 1,380 966
Realized loss on foreign currency translation 6,301 –
Unrealized gain on foreign currency translation (843) (2,670)
Closing balance 129,076 139,928
Current portion 669 14,201
Non-current portion 128,407 125,727
Closing balance 129,076 139,928
Bank Indebtedness On December 27, 2013, the Company reached an agreement with a syndicate of financial institutions led by Wells Fargo to enter into a new senior credit facility for $150,000 (“the Credit Agreement”). The Credit Agreement consists of a revolving credit facility of $140,000, denominated in USD, and a $10,000 revolving credit facility, available in CAD and/or USD. The Credit Agreement has a term of three years with the ability to increase the facility to $175,000 at the Company’s discretion. The Credit Agreement is secured by property and equipment and inventory held in Canada and the United States, as well as cash and trade receivables in Canada and the United States of approximately $5,333 and $52,824, respectively, at December 31, 2013. At December 31, 2013, the Company had borrowed $120,000 USD and $2,000 CAD under the Credit Agreement and does not have any of the amounts due under the Credit Agreement as current. The interest rates on the United States facility range from the Prime Rate (3.25 percent at December 31, 2013) to the Federal Funds Rate (0.07 percent at December 31, 2013) plus 0.50 percent or LIBOR (0.17 percent at December 31, 2013) plus 1.0 percent. The interest rates on the Canadian facility range from the Prime Rate (3.0 percent at December 31, 2013) to the Federal Funds Rate (0.07 percent at December 31, 2013) plus 0.50 percent or LIBOR (0.17 percent at December 31, 2013) plus 1.0 percent. Long-term debt has been recognized net of approximately $1,225 in unamortized transaction costs, which are recognized over the term of the facility using the effective interest rate method. As of December 31, 2013, the Company was in compliance with the debt covenants under the Credit Agreement as follows:
• Leverage Ratio - 1.77 to 1.00 (not above 3.00 to 1.00 required)
• Interest Coverage Ratio – 6.43 to 1.00 (not below 3.00 to 1.00 required)
Prior to the execution of the Credit Agreement, the Company’s borrowings consisted of a $150,000 credit facility with a syndicate of institutions, consisting of $15,000 as a revolving operating loan facility denominated in CAD and $135,000 as an extendible loan facility denominated in USD. In December 2013, the Company repaid these borrowings and related interest with proceeds from the
66

Xtreme Drilling and Coil Services Corp. Notes to the Consolidated Financial Statements (in thousands of Canadian dollars)
Credit Agreement. As part of the repayment of prior borrowings, $1,199 of unamortized debt issuance costs related to the prior financing arrangements were included in interest expense for the year ended December 31, 2013. As of December 31, 2013, the Company had no borrowings under the operating loan facility ($7,834 at December 31, 2012, under the previous facility). Exclusive of the accelerated amortization of the debt issuance costs, the Company recognized interest expense of $6,667 and $7,919 for the years ended December 31, 2013 and 2012, respectively, on its outstanding borrowings, resulting in an effective annual interest rate on borrowings of approximately 5.1 percent in 2013 and 7.4 percent in 2012. Following is a summary of principal payments schedule.
Year 1 Years 2 – 3 Year 4-5 Total
Principal payment schedule 669 – 128,407 129,076
Other Financing
On November 20, 2009, the Company entered into an agreement with a major diversified oilfield services company (“the Diversified Services Company”), in which the Diversified Services Company agreed to fund up to USD$5,700 in customization costs for an XSR 200 drilling rig and to pay for certain significant mobilization and start-up costs to deploy the rig to Saudi Arabia upon project award. Under the terms of the agreement, the repayment of the loan is USD$2 per day for each day the rig is earning day-rate revenue.
The loan for customization costs was assumed in connection with the sale of the first rig to the subsidiary Xtreme Equipment Group S.A. As a result of fully consolidating the related accounts for the certain subsidiaries, as of December 31, 2013, the Company had $669 outstanding as advanced from the Diversified Services Company (December 31, 2012 - $4,201), which is included in the current portion of long-term debt (December 31, 2012 - $4,201). The loan was paid off January 2014.
11. Share capital
The Company is authorized to issue an unlimited number of common voting and preferred shares without nominal or par value. The Company has no preferred shares outstanding.
Following is a summary of issued and outstanding common shares.
67

Xtreme Drilling and Coil Services Corp. Notes to the Consolidated Financial Statements (in thousands of Canadian dollars)
2013 2012
Number Amount Number Amount
Balance, beginning of year
80,790,315 327,197
65,666,266 310,296
Shares issued during the year, net of share issue costs of 795, net of taxes – – 15,001,750 16,457
Employee options exercised 371,665 741 122,299 255
Restricted stock units exercised 103,752 – – –
Transferred from share option reserve – 478 – 105
Future income tax effect of common share issue cost at expected tax rates – – – 84
475,417 1,219
15,124,049 16,901
Balance, end of year 81,265,732 328,416 80,790,315 327,197
Stock Option Plan The Company’s Stock Option Plan (the "Plan") for directors, officers, employees and consultants permits granting of options to purchase up to a maximum of 10 percent of issued and outstanding common shares. The board of directors sets the number of options and the exercise price thereof at the time of the option grant provided that the exercise price is not less than that permitted under the current rules of any stock exchange upon which Xtreme’s common shares are listed. Options granted under the Plan may be exercisable for a period not exceeding ten years, generally with one-third of the options vesting each year for the first three years, commencing on the one-year anniversary of the grant. During the year ended December 31, 2013, the board of directors approved granting of options to purchase 470,000 common shares (December 31, 2012 – 736,000). As of December 31, 2013, a total of 3,161,335 options (December 31, 2012 – 3,464,000) were outstanding. Included in share option reserve for the year ended December 31, 2013, is stock-based compensation of $661 (December 31, 2012 - $1,276), of which $661 was recorded as stock-based compensation expense (December 31, 2011 - $1,179) and none was capitalized to property and equipment as directly attributable costs (December 31, 2012 - $97). The Company uses the fair value method of accounting for stock-based compensation. The fair value of options granted was estimated on the date of grant using the Black-Scholes option pricing model with weighted average assumptions for grants assuming: • no dividends are paid on common shares; • a risk-free interest rate ranging from 0.9 to 1.25 percent; • an average life of 3.0 years and expiry of 5.0 years; • an expected volatility ranging from 64 percent to 72 percent;. • and a forfeiture rate of 10 percent.
The amounts computed according to the Black-Scholes pricing model may not be indicative of the actual values realized upon the exercise of these options by the holders. The amount of the fair value is charged to earnings over the period of vesting of the options, with a corresponding credit to share option reserve.
This table summarizes the status of the Company’s Stock Option Plan at December 31, 2013 and 2012.
68

Xtreme Drilling and Coil Services Corp. Notes to the Consolidated Financial Statements (in thousands of Canadian dollars)
Dec 31, 2013 Dec 31, 2012 Weighted Weighted average average
Options exercise
price Options exercise
price Outstanding, beginning of year 3,464,000 3.13 4,239,298 3.74 Granted 470,000 2.60 736,000 1.65 Exercised (371,665) 2.03 (122,299) 2.09 Expired (272,330) 4.98 (674,988) 4.78 Forfeited (128,670) 3.98 (714,011) 3.88 Outstanding, end of year 3,161,335 2.98 3,464,000 3.13 Options exercisable, end of year 1,982,318 3.21 1,658,316 3.31
Dec 31, 2013 Options outstanding Options exercisable
Range of exercise prices
Number outstanding
Weighted average
remaining contractual
life
Weighted average exercise
price Number
exercisable
Weighted
average exercise
price
$0.00 - $ 1.49 508,335 3.8 yrs 1.12 169,995 1.12 $1.50 - $ 4.50 2,459,000 2.5 yrs 3.20 1,666,659 3.26 $4.51 - $ 6.99 194,000 2.2 yrs 5.11 145,664 5.10
3,161,335 2.7 yrs 2.98 1,982,318 3.21
Restricted Stock Units (RSUs) The Company grants restricted stock unit awards to the Company’s directors, officers, and key employees and consultants. Shares granted to eligible individuals vest annually. Vested shares may be settled in cash or equity, at the discretion of the Company. The RSUs are measured at the fair market value of the shares at the grant date. Restricted stock unit awards are granted with vesting based on time of service of three years. Additionally, a 10 percent forfeiture rate and expiry of three years have been incorporated into the calculation of the fair values for the RSUs. Shares of common stock are issued to recipients of restricted stock units only when they have satisfied the applicable vesting conditions. The amount of the fair value is charged to earnings over the period of vesting of the options, with a corresponding credit to share option reserve. During the year ended December 31, 2013, the board of directors approved granting of 808,500 restricted stock units (331,944 at December 31, 2012). As of December 31, 2013, a total of 1,015,992 restricted stock units were outstanding (311,244 at December 31, 2012). Included in share option reserve for the year ended December 31, 2013, is restricted stock unit expense of $665 (December 31, 2012 - $63). This table summarizes the status of the Company’s Incentive and Retention Plan at December 31, 2013.
69

Xtreme Drilling and Coil Services Corp. Notes to the Consolidated Financial Statements (in thousands of Canadian dollars)
Dec 31, 2013 Dec 31, 2012 Weighted Weighted average average
Options exercise
price Options exercise
price Outstanding, beginning of year 311,244 1.56 – – Granted 808,500 3.26 331,944 1.64 Exercised (103,752) 3.37 – 2.85 Forfeited – – (20,700) – Outstanding, end of year 1,015,992 2.73 311,244 1.56
Dec 31, 2013 Dec 31, 2012 Share option reserve, beginning of year 11,572 10,338 Stock-based compensation 1,325 1,339 Share option reserve transferred on exercise of options (308) (105) Share option reserve transferred on exercise of RSUs (170) – Share option reserve, end of year 12,419 11,572
At December 31, 2013, Xtreme’s stock price was $3.62 (December 31, 2012 - $1.66).
12. Interest in Non-controlling Interest
The Company fully consolidates its interest in two of its jointly-controlled entities. The first is Xtreme Coil Drilling S.A. Ltd., an 80 percent interest in an operating company in Saudi Arabia. The second is Xtreme Equipment Group S.A., an 80 percent interest whose purpose is to lease drilling equipment to Xtreme Saudi Arabia for its operations. The following is the summarized financial statement amounts for the subsidiaries.
Statements of Financial Positions
Current assets 6,574
Non-current assets 73,903
Current liabilities 8,165
Long-term liabilities 22,647
13. Earnings per share
Common shares potentially issuable in exchange for options, purchase warrants and performance warrants are not included in the computation of diluted earnings per share when to do so would be anti-dilutive. Diluted weighted average common shares outstanding is calculated using the treasury stock method, which assumes any proceeds obtained on the exercise of options is used to purchase common shares at the average price for the period.
Dec 31, 2013 Dec 31, 2012
Weighted average common shares outstanding - basic 80,935,473 69,618,457
Effect of options – 141,378
Weighted average common shares outstanding - diluted 80,935,473 69,759,835
70

Xtreme Drilling and Coil Services Corp. Notes to the Consolidated Financial Statements (in thousands of Canadian dollars)
At December 31, 2013, shares totaling 470,026 could be potentially anti-dilutive to investors in the future.
14. Expenses by nature
Dec 31, 2013 Dec 31, 2012
(Restated – Note 3)
Operating expenses:
Wages and employee benefits expense 81,406 67,757
Other operating expenses 38,520 37,124
Mobilization expenses 5,736 9,341
Repairs and maintenance 19,211 13,613
144,873 127,835
General and administrative expenses:
Wages and employee benefits expense 5,483 3,531
Professional fees expenses 1,890 2,281
Other general and administrative expenses 3,907 4,414
11,280 10,226
Total operating and general and administrative expenses 156,153 138,061
15. Wages and employee benefits
Compensation awarded to key management included:
Dec 31, 2013 Dec 31, 2012
Salaries and short-term employee benefits 2,685 1,372
Stock-based compensation 682 581
3,367 1,953
Key management includes the Company’s directors and officers (Chief Executive Officer, Chief Financial Officer, President and Chief Technology Officer, Vice President of Sales and Marketing, Vice President of Human Resources, Vice President of Operations (XDR), Vice President of Coil Services – North America, Vice President of Health Safety and Environmental).
16. Income tax
Dec 31, 2013 Dec 31, 2012
(Restated – Note 3)
Current tax:
Current tax on profits for the year 3,870 2,775
Total current tax 3,870 2,775
Deferred tax:
Origination and reversal of timing differences 483 (7,175)
Total deferred tax 483 (7,175)
Income tax expense (recovery) 4,353 (4,400)
The tax on the Company’s income (loss) profit before tax differs from the amount that would arise using the weighted average tax rate applicable to profits of the consolidated entities as follows:
71

Xtreme Drilling and Coil Services Corp. Notes to the Consolidated Financial Statements (in thousands of Canadian dollars)
Dec 31, 2013 Dec 31, 2012
(Restated – Note 3)
Income (loss) before tax 4,920 (3,126)
Tax at statutory rates applicable to losses 1,230 (1,374)
Tax effects of:
Income at lower rates (2,124) (8,049)
Non-deductible expenses 463 1,124
Withholding taxes 1,906 616
Other (185) 722 Changes in unrecognized deferred tax assets 3,063 2,561
Income tax expense (recovery) 4,353 (4,400)
The statutory tax rate was 25 percent in 2013 and 2012. The analysis of deferred tax assets and deferred tax liabilities is as follows:
Dec 31, 2013 Dec 31, 2012
(Restated – Note 3)
Deferred tax assets:
Deferred tax assets to be recovered after more than 12 months 68,968 62,474
Deferred tax assets to be recovered within 12 months 5,200 3,700
Deferred tax liabilities:
Deferred tax liabilities to be recovered after more than 12 months (59,632) (51,168)
Deferred tax liabilities to be recovered within 12 months – –
Deferred tax assets (net) 14,536 15,006
The movement of the deferred income tax account is as follows:
2013 2012
(Restated – Note 3)
At January 1 15,006 7,576
Change to the statement of income (483) 7,176
Balance sheet reclass – 265
Exchange differences 9 (5)
Non-controlling interest 4 (6)
At December 31 14,536 15,006
The movement in deferred income tax assets and liabilities during the year is as follows:
72

Xtreme Drilling and Coil Services Corp. Notes to the Consolidated Financial Statements (in thousands of Canadian dollars)
Jan 1, 2013 (Restated –
Note 3)
Changes to the statement
of income
Balance sheet
reclass Exchange differences
Non-controlling
interest Dec 31, 2013
Deferred tax asset Non-capital losses carried forward 47,927 11,451 –
– 4 59,382
Share issue costs 796 (341) –
– – 455
Stock-based compensation 1,262 448
–
– – 1,710
SR&ED expenditure 1,164 –
–
– – 1,164
Accrued charges and other 14,251 (3,881)
– 9 – 10,379
Tax credits 774 304 – – – 1,078
Total 66,174 7,981 – 9 4 74,168
Deferred tax liabilities
Depreciation on capital assets (48,456) (8,127)
–
– – (56,583)
Amortization of intangible assets (501) (102)
–
– – (603)
Unbilled revenue (2,211) (235)
–
– – (2,446)
Total (51,168) (8,464) –
– – (59,632)
Deferred tax assets (net) 15,006 (483) – 9 4 14,536
Jan 1, 2012
Changes to the statement
of income
Balance sheet
reclass Exchange differences
Non-controlling
interest Dec 31, 2012
(Restated – Note 3) Deferred tax asset Non-capital losses carried forward 19,533
28,400
–
– (6) 47,927
Share issue costs 917 (386) 265
– – 796
Stock-based compensation 1,249
13
–
– – 1,262
SR&ED expenditure 723 441
–
– – 1,164
Accrued charges and other 6,868
7,388
– (5) – 14,251
Tax credits 2,272
(1,498) – – 774
Total 31,562 34,358 265 (5) (6) 66,174
Deferred tax liabilities
Depreciation on capital assets (21,468) (26,988)
–
– – (48,456)
Amortization of intangible assets (175) (326)
–
– – (501)
Unbilled revenue (2,343) 132
–
– – (2,211)
Total (23,986) (27,182) –
– – (51,168)
Deferred tax assets (net) 7,576 7,176 265 (5) (6) 15,006
73

Xtreme Drilling and Coil Services Corp. Notes to the Consolidated Financial Statements (in thousands of Canadian dollars)
Deferred income tax assets are recognized for tax loss carry-forwards and tax credits to the extent that the realization of the related tax benefit through future taxable profits is probable. The Company did not recognize the benefit of tax losses and tax credits as follows: Assets not recognized for accounting purposes: Dec 31, 2013 Dec 31, 2012
Non-capital loss carry-forwards 6,263 5,676
Capital loss carry-forwards 6,491 190
Foreign tax credits 4,713 2,493
17,467 8,359
The non-capital losses carried forward expire primarily between 2015 and 2033. The Company has temporary differences related to its investments in Canadian and foreign subsidiaries for which no deferred taxes have been recorded. As no taxes are expected to be paid with respect to the temporary differences related to its Canadian subsidiaries, the Company has not determined the amount of these temporary differences, as timing of the reversal of the temporary differences is controlled by the Company and it is probable that the temporary difference will not reverse in the foreseeable future.
17. Contingencies and commitments
Contingencies The Company is involved in claims and actions arising in the course of the Company’s operations and is subject to various legal actions and exposures, including tax positions taken by the Company. Although the outcome of these claims cannot be predicted with certainty, the Company does not expect these matters to have a material adverse effect on the Company’s financial position, cash flows or results of operations. If an unfavorable outcome were to occur, there exists the possibility of a material adverse impact on the Company’s consolidated net earnings or loss in the period in which the outcome is determined. Accruals for litigation, claims and assessments are recognized if the Company determines that the loss is probable and the amount can be reasonably estimated. The Company believes it has made adequate provision for such legal claims. While fully supportable in the Company’s view, some of these positions, including uncertain tax positions, if challenged may not be fully sustained on review. The Company is committed to operating leases for office and field facilities and the table below details approximate annual base rental payments. Lease terms also require Xtreme to remit a proportionate share of realty taxes, operating costs and utilities.
Dec 31, 2013 Dec 31, 2012 Jan 1, 2012
(Restated – Note 3) (Restated – Note 3)
Less than 1 year 979 1,141 1,182
Between 1 and 5 years 2,179 925 727
3,158 2,066 1,909
Included in the consolidated statement of income is rent expense of approximately $960 for the year ended December 31, 2013 (2012 - $898).
74

Xtreme Drilling and Coil Services Corp. Notes to the Consolidated Financial Statements (in thousands of Canadian dollars)
Purchase commitments The Company has commitments for maintenance, drilling and servicing equipment, drill pipe, planned rig modifications and upgrades, and spare equipment totaling approximately $2,710 at December 31, 2013 (December 31, 2012 – $3,188), which are not reflected in these consolidated financial statements. The Company expects to pay such costs within the next twelve months. Guarantees As of December 31, 2013, the Company has two letters of guarantee outstanding with a financial institution amounting to approximately $1,016 (December 31, 2012 - $951). These letters relate to the importation of the coil servicing units in Saudi Arabia. As of December 31, 2013, no amounts have been drawn against these letters.
18. Segment reporting
The Company determines its operating segments based on internal information regularly reviewed by management to allocate resources and assess performance. The Company operates within two operating segments, which are Drilling Services and Coil Services.
• Drilling represents assets, revenues and expenses associated with the fleet of high specification drilling rigs contracted with oil and natural gas exploration and production companies and integrated oilfield service providers. These drilling rigs are designed for deeper geological zones.
• Coil Services represents the assets, revenues and expenses associated with Xtreme’s coiled
tubing well service units, targeting primarily post fracture treatment cleanouts, re-entry, and horizontal drilling.
• Corporate and Other represents the general and administrative costs of the Company,
depreciation and amortization expense, interest expense, realized and unrealized foreign exchange gains and losses and employee incentive compensation charges. The Company views its corporate segment as a support function that provides assistance to more than one segment.
The tables below segment the Company’s revenue, operating earnings (loss) and assets and liabilities by service line.
Drilling
Services Coil Services Corporate and
Other Total
For the year ended Dec 31, 2013
Revenue 173,147 56,676 – 229,823
Income (loss) before tax 64,395 20,555 (80,030) 4,920
Total assets 367,686 104,350 43,684 515,720
Total liabilities 12,457 24,997 134,032 171,486
Intangible assets – – 3,917 3,917
Capital additions 17,281 5,456 322 23,059
75

Xtreme Drilling and Coil Services Corp. Notes to the Consolidated Financial Statements (in thousands of Canadian dollars)
Drilling
Services Coil Services Corporate and
Other Total
For the year ended Dec 31, 2012
(Restated – Note 3)
Revenue 141,440 37,947 – 179,387
Income (loss) before tax 45,518 6,033 (54,677) (3,126)
Total assets 343,874 125,297 37,380 506,551
Total liabilities 11,082 21,504 155,958 188,544
Intangible assets – – 4,220 4,220
Capital additions 89,093 23,234 30 112,357
Canada United States Other
International Total
For the year ended Dec 31, 2013
Revenue 14,860 185,064 29,899 229,823
Total assets 64,138 403,812 47,770 515,720
Canada United States Other
International Total
For the year ended Dec 31, 2012
Revenue 12,527 140,675 26,185 179,387
Total assets 58,765 394,280 53,506 506,551
For the year ended December 31, 2013, four customers accounted for revenue of $147,379, or 64 percent. Of these amounts, for the year ended December 31, 2013, Customer A accounted for $71,526 (31 percent), Customer B accounted for $29,899 (13 percent), Customer C accounted for $24,641 (11 percent), and Customer E accounted for $21,313 (nine percent). For the year ended December 31, 2012, four customers accounted for revenue of $124,453, or 69 percent. Of these amounts, for the year ended December 31, 2012, Customer A accounted for $65,196 (36 percent), Customer B accounted for $26,185 (15 percent), Customer C accounted for $16,971 (10 percent), and Customer D accounted for $16,101 (nine percent).
19. Financial instruments and fair values
Measurement categories As explained in Note 3, financial assets and liabilities have been classified into categories that determine their basis of measurement and, for items measured at fair value, whether changes in fair value are recognized in the statement of income or comprehensive income. Those categories are: loans and receivables and for liabilities, amortized cost. The following table shows the carrying values of assets and liabilities for each of these categories at December 31, 2013 and 2012 and January 1, 2012.
Dec 31, 2013 Dec 31, 2012 Jan 1, 2012
(Restated – Note 3) (Restated – Note 3)
Assets
Loans and receivables
Cash and cash equivalents 12,220 5,921 6,873
Trade receivables 60,084 44,878 46,653
Other receivables 1,306 2,975 1,636
76

Xtreme Drilling and Coil Services Corp. Notes to the Consolidated Financial Statements (in thousands of Canadian dollars)
Dec 31, 2013 Dec 31, 2012 Jan 1, 2012
(Restated – Note 3) (Restated – Note 3)
Liabilities
Amortized cost
Accounts payable and accrued liabilities 28,051 27,904 26,902
Bank indebtedness – 7,834 –
Fair Value Fair value of non-controlling interest liability 14,359 12,878 13,707 Fair values The carrying values of cash and cash equivalents, accounts receivable and other receivables, bank indebtedness, accounts payable and accrued liabilities approximate their fair value due to the relatively short periods to maturity of the instruments. Long-term debt is initially recorded at fair value, net of transaction costs directly attributable to the issuance of the debt and approximates fair value as of December 31, 2013 due to the fact that interest is adjusted periodically based on changes in the relevant benchmark interest rates and changes in the Company’s own credit risk. The fair value of the agreement with the Diversified Services Company is approximately $648 (December 31, 2012 - $3,300).
Fair Value of Non-controlling Interest Liability The Company performed a valuation analysis of its interest in the Saudi joint ventures to determine the fair value of the non-controlling interest liability. The Income Approach methodology was the primary valuation method utilized. The fair value is recurring. The following unobservable (Level 3) inputs were used in the valuation:
• Discounted cash flows (a 16 percent discount rate was used; this is the asset specific rate for valuing this liability)
• Management’s estimates of financial performance for the service rigs
o Revenue assumptions - the revenue projections were based on management’s best estimate while taking into account the most recent contract outcomes
o Cost assumptions – the model took into account the effect of inflation at two percent
to account for the increase in expenses
• Historical financial data for the Saudi Arabia operations
• Economic data relating to Saudi Arabia
As disclosed in Note 22, the balance in non-controlling interest at December 31, 2013, is based on the negotiated purchase price of the acquisition of the partner’s 20 percent ownership in the put option in the non-controlling interest.
The following table summarizes the changes in Level 3 measurement of the non-controlling interest liability at December 31, 2013 and 2012 and January 1, 2012.
77

Xtreme Drilling and Coil Services Corp. Notes to the Consolidated Financial Statements (in thousands of Canadian dollars)
A one percent change in the discount rate will have a $55 impact on pre-tax income for the year ended December 31, 2012. Fair Value of the Debt
The Company performed the fair value analysis of its new debt agreement that it entered into on December 27, 2013. The following (Level 2) inputs were used in the valuation of the new Credit Agreement as described in Note 10:
• Implicit interest rates from the new agreement
• Potential prepayments
• The ability of the enterprise to service its debt obligations
Financial risks factors
The Company’s activities expose it to a variety of financial risks: market risk (including currency risk and interest rate risk), credit risk and liquidity risk. Risk management is carried out by management under policies approved by the board of directors. Management identifies and evaluates the financial risks in co-operation with the Company’s operating units. The board provides guidance for overall risk management, as well as written policies covering specific areas, such as foreign exchange risk, interest rate risk, credit risk, use of derivative financial instruments, and non-derivative financial instruments, and investment of excess liquidity. The Company’s overall risk management program seeks to minimize potential adverse effects on the Company’s financial performance. (a) Market risk
(i) Foreign exchange risk
The Company operates internationally and is exposed to foreign exchange risk arising from various currency exposures, primarily with respect to the US dollar and the Saudi Riyal. Foreign exchange risk arises on recognized assets and liabilities, principally trade receivables and trade payables. Foreign exchange risk arises when future recognized assets or liabilities are denominated in a currency that is not the entity’s functional currency. Management has set up a policy that requires Xtreme and its subsidiaries to manage their foreign exchange risk and imposes strict limits on the maximum exposures that can be entered into. The Company does not hedge foreign currency exposures. At December 31, 2013, if the Canadian dollar had weakened/strengthened by one percent against the US dollar with all other variables held constant, post-tax profit for the year would
Dec 31, 2013 Dec 31, 2012 Jan 1, 2012
Opening balance 12,878 13,707 15,887
Loss (gain) recognized in profit and loss 1,481 (829) (2,180)
Closing balance 14,359 12,878 13,707
Current portion 12,763 – –
Non-current potions 1,596 12,878 13,707
Closing balance 14,359 12,878 13,707
78

Xtreme Drilling and Coil Services Corp. Notes to the Consolidated Financial Statements (in thousands of Canadian dollars)
have been approximately $20 (2012 - $865) higher/lower, mainly as a result of foreign exchange gains/losses on US dollar-denominated trade receivables and payables. Monetary and non-monetary assets and liabilities denominated in foreign currencies are translated at the current rate as of the balance sheet date and any realized foreign exchange gains or losses are included in income, except for unrealized gains and losses in self-sustaining foreign subsidiaries, which are recorded in other comprehensive income. The Company does not currently utilize derivative instruments to manage its exposure to foreign currency rate fluctuations. At December 31, 2013, a one percent change in the foreign currency exchange rate would result in a change in other comprehensive income of approximately $1,490 (2012 – $765).
(ii) Interest rate risk
Xtreme is exposed to interest rate risk to the extent the changes in market interest rates can impact operating and long-term debt facilities which have a floating interest rate. For 2013, a one percent change in the effective interest rate would result in a change to net income before tax of approximately $1,280 on an annualized basis (2012 - $1,040).
(b) Credit risk
Credit risk is managed on a consolidated basis, except for credit risk relating to accounts receivable balances. Each operating unit is responsible for managing and analyzing the credit risk for each of their new clients before standard payment and delivery terms and conditions are offered. Credit risk arises from deposits with banks, as well as credit exposures to customers, including outstanding receivables and committed transactions. For deposits, the Company only deals with independently rated institutions that have a minimum rating of ‘A’. Most of the Company’s customers are not independently rated, therefore the quality of the customer is considered by taking into account its financial position, past experience and other factors. Individual risk limits are set based on internal ratings in accordance with limits set by the board. The utilization of credit limits is regularly monitored. No credit limits were exceeded during the reporting period. The Company is exposed to a significant concentration of credit risk because the majority of the accounts receivable balances are with a small group of customers (Note 18). The maximum exposure to credit risk for deposits approximates the amount recognized on the statement of financial position. The Company does not hold any collateral as security.
The following table summarizes the aging of the Company’s accounts receivable which management does not consider impaired.
In September 2013, the Company recovered previously billed amounts of approximately $2,690 plus legal fees of approximately $510 from the settlement of litigation with one of its customers. The carrying amount of trade accounts receivable was approximately $2,760, resulting in an additional write-off of approximately $70 for uncollected amounts.
Accounts receivable Dec 31, 2013 Dec 31, 2012
(Restated – Note 3)
Less than 90 days 58,661 39,236 Greater than 90 days and less than 180 days 1,417 2,130 Greater than 180 days 6 3,512
60,084 44,878
79

Xtreme Drilling and Coil Services Corp. Notes to the Consolidated Financial Statements (in thousands of Canadian dollars)
(c) Liquidity risk
Liquidity risk relates to risks Xtreme may encounter in meeting obligations associated with financial liabilities and commitments. Xtreme anticipates the current level of financial capacity will be sufficient to fund commitments and working capital. In December 2013, the Company reached an agreement with a syndicated of financial institution for new $150,000 senior credit facility consisting of a revolving credit facility of $140,000, denominated in USD, and a $10,000 revolving credit facility, available in Canadian and/or United States dollars, replacing the previous $150,000 credit facility. The new credit facility includes the ability to increase to $175,000 should the company need additional capacity. At December 31, 2013, the total borrowing capacity of the Company was $20,000 USD and $8,000 CAD or USD. Contractual Obligations
The table below illustrates various contractual obligations which the Company expects to repay, including any interest payments required.
Less than 1 1 – 3 4 –5 After 5
Contractual obligations Total Year Years Years Years Accounts payable and accrued liabilities 28,051 28,051 – –
_
Long-term debt 130,358 669 129,689 – _
Commitments 2,710 2,710 – – _
Operating leases 3,158 979 1,283 896 _
Total contractual obligations 164,277 32,409 130,972 896 _
Payments for long-term debt include an estimate for variable interest.
20. Capital Management
Xtreme defines capital as the aggregate of shareholders’ equity and long-term debt less cash and cash equivalents. Xtreme’s capital management framework is designed to maintain a flexible capital structure that allows for optimization of the cost of capital at acceptable risk while balancing the interests of both equity and debt holders. Xtreme targets a net debt to equity ratio of less than 0.5 : 1.0, although there is a degree of variability associated with the timing of cash flows. If appropriate opportunities are identified, Xtreme is prepared to increase this ratio as high as 1.0 : 1.0. This policy remains unchanged from previous years.
Dec 31, 2013 Dec 31, 2012 (Restated – Note 3) Shareholders' equity 343,281 327,197 Long-term debt 129,076 139,928 Bank indebtedness – 7,834 Less: Cash and cash equivalents (12,220) (5,921)Capital under management 460,137 469,038 Net debt as a percentage of capital under management 25 29 Net debt to equity ratio 0.3 : 1.0 0.4 : 1.0
Net debt is defined as total long-term debt plus bank indebtedness less cash and cash equivalents.
80

Xtreme Drilling and Coil Services Corp. Notes to the Consolidated Financial Statements (in thousands of Canadian dollars)
Xtreme is subject to various requirements relating to existing covenants under its credit facility, including leverage and interest coverage ratio requirements. As of December 31, 2013, Xtreme was in compliance with the required covenants (Note 10).
21. Changes in working capital
Supplemental Disclosure of Cash Flow Information
For the year ended Dec 31, 2013 Dec 31, 2012
(Restated – Note 3)
Accounts receivable and other receivables (13,537) 436
Prepaid expenses and other (444) 67
Inventory (1,707) (4)
Assets held for sale 9,308 (9,308)
Accounts payable and accrued liabilities 147 1,002
Income taxes (94) 560
Total (6,327) (7,247)
At December 31, 2013, accounts receivable and other receivables include $72 for impairment of accounts receivable (December 31, 2012 - $6,235) and accounts payable and accrued liabilities include $57 for accrued interest (December 31, 2012 - $1,262). In addition, there was $0 transferred from inventory to property and equipment during the year (December 31, 2012 - $1,055). These amounts are excluded from the changes in working capital in the statement of cash flows.
22. Subsequent Events
On February 25, 2014, the Company finalized negotiations on the purchase of remaining 20 percent non-controlling interest with its partners in relation to its Saudi Arabian Operations. Specifically, the Company and the partner finalized negotiations on the agreed purchase price of $13,500 USD ($14,359 CAD), of which $12,000 USD ($12,763 CAD) is due for repayment within twelve months.
The Company made the initial payment of $10,500 USD ($11,168 CAD) on February 25, 2014. It expects to pay an additional $1,500 USD ($1,596 CAD) during 2014 and settle the remaining $1,500 USD ($1,596 CAD) by July 2015.
81

[THIS PAGE INTENTIONALLY LEFT BLANK]

Shareholders and other interested individuals can view Xtreme Drilling and Coil Services Corp. public documents at www.xtremecoil.com, where we have posted drilling rigs and coiled tubing units, locations, historical information, shareholder reports, news releases, the current corporate presentation, as well as trading and contact information.
BOARD OF DIRECTORSDouglas A. Dafoe 1,2
Ember ResourcesCalgary, AB
Thomas D. Wood
Xtreme Drilling and Coil ServicesCalgary, AB
Randolph M. Charron 3,4,5 PresidentCharaco CorporationCalgary, AB
James B. Renfroe, Jr. 4,5 Independent BusinessmanLaRue, TX USA
Peter J. Sharpe 5 Executive Vice President, WellsShell International Exploration and Production BVThe Hague, Netherlands
J. William Franklin, Jr. 2,3 Managing DirectorLime Rock PartnersHouston, TX USA
David W. Wehlmann 2,3 Independent BusinessmanHouston, TX USA
1 Chairman of the Board2 Audit Committee3 Compensation Committee4 Governance and Nominating Committee 5 Health, Safety, Environment Committee
OFFICERSThomas D. Wood
Richard D. Havinga
Matthew S. Porter
Martin RamirezCorporate Controller
Thomas FellowsVice President of Sales and Marketing
Ben SmithVice President of Human Resources
David CharronVice President of Drilling Operations
Charlie ProulxVice President of Coil Services – North America
Allan RoachellVice President of Health, Safety and Environment
AUDITORSPricewaterhouseCoopers LLP Calgary, AB
BANKSHSBC Bank Canada Calgary, AB
Wells Fargo Bank Houston, TX USA
SOLICITORSStikeman Elliot LLP Calgary, AB
STOCK EXCHANGE AND SYMBOLTSX, “XDC”
TRANSFER AGENT AND REGISTRARValiant Trust Company Calgary, AB
T +1 866 313-1872 E [email protected]
WHOLLY OWNED SUBSIDIARIESXtreme Drilling and Coil Services Houston, TX USA
T +1 281 994-4600 F +1 281 994-4661
Xtreme Coil Drilling Mexico, S.A. de C.V. Mexico
Xtreme Drilling and Coil Services (Luxembourg) S.A.Xtreme Equipment Group S.A. Luxembourg
Xtreme Coil Drilling Saudi Arabia Ltd.Saudi Arabia
JOINT VENTURESLucas-Xtreme Drilling Pty Ltd.Australia
CORPORATE INFORMATION

340 12th Avenue SW, Suite 770 Calgary, AB T2R 1L5
T +1 403 262-9500 F +1 403 262-9522
9805 Katy Freeway, Suite 650 Houston, TX USA 77024
T +1 281 994-4600 F +1 281 994-4661
CORPORATE AND INVESTOR RELATIONS
T +1 281 994-4604E [email protected]