2013 annual report form 10-k...2013 annual report form 10-k 2013 annual report ... financial crisis...
TRANSCRIPT

2 0 1 3 A N N U A L R E P O R T F O R M 1 0 - K
20
13
A
NN
UA
L
RE
PO
RT
F
OR
M
10
-K
39601 Merrill_COVER.indd 3 4/9/14 12:07 AM

(All amounts in thousands, except share data and per square foot amounts)
1
Financial Highlights
Operating Data 2013 2012 2011 2010 2009
Total Revenues $ 1,029,475 $ 797,517 $ 684,744 $ 630,977 $ 675,062
Shopping center and operating expenses
$ 329,795 $ 251,923 $ 213,832 $ 195,608 $ 201,134
Management companies’ operating expenses
$ 93,461 $ 85,610 $ 86,587 $ 90,414 $ 79,305
REIT general and administrative expenses
$ 27,772 $ 20,412 $ 21,113 $ 20,703 $ 25,933
Net income attributable to common stockholders
$ 420,090 $ 337,426 $ 156,866 $ 25,190 $ 120,742
Net income per share attributable to common stockholders - diluted
$ 3.00 $ 2.51 $ 1.18 $ 0.19 $ 1.45
Balance Sheet Data 2013 2012 2011 2010 2009Investment in real estate (before accumulated depreciation)
$ 9,181,338 $ 9,012,706 $ 7,489,735 $ 6,908,507 $ 6,697,259
Total assets $ 9,075,250 $ 9,311,209 $ 7,938,549 $ 7,645,010 $ 7,252,471
Total mortgage and notes payable $ 4,582,727 $ 5,261,370 $ 4,206,074 $ 3,892,070 $ 4,531,634
Redeemable noncontrolling interests $ — $ — $ — $ 11,366 $ 20,591
Equity $ 3,718,717 $ 3,416,251 $ 3,164,651 $ 3,187,996 $ 2,128,466
Common shares outstanding 140,733,683 137,507,010 132,153,444 130,452,032 96,667,689
See “Item 6. - Selected Financial Data” in our Form 10-K included herein for additional information regarding the data presented in this table.
See our Company’s forward-looking statements disclosure under “Important Factors Related to Forward-Looking Statements” in our Form 10-K included herein.
Other Data 2013 2012 2011 2010 2009Regional shopping centers portfolio occupancy
94.6% 93.8% 92.7% 93.1% 91.3%
Regional shopping centers portfolio sales per square foot
$ 562 $ 517 $ 489 $ 433 $ 407
Distributions declared per common share
$ 2.36 $ 2.23 $ 2.05 $ 2.10 $ 2.60
39601 Merrill_COVER.indd 2 4/9/14 12:08 AM

Macerich 2013 Annual Report
2
Dear Fellow Stockholders:
The year 2013 was a transformational one for our Company in many ways. We recently celebrated our 20th anniversary as a public company and it is remarkable how our Company has developed over those years. On March 9, 1994, Macerich went public with a total market capitalization of about $714 million and as of December 31, 2013, our total market capitalization was approximately $15 billion. I am pleased to report that today we are in the top 10% of all REITs as measured by total enterprise value.
As I look back over those 20 years, I am proud of our progress and accomplishments across all aspects of our business. We have grown from a base of 12 malls to over 50 malls and now own some of the most productive and iconic retail venues in the country. Our mall productivity over this 20-year span has more than doubled with our current sales per square foot at $562. One of the key highlights in our history occurred in 2013 when our Company was added to the S&P 500 Index. When we went public, Macerich was not even one of the top 25 mall owners in the country. Today we are clearly recognized as one of the top mall companies in the U.S.
We also are especially proud that Macerich ranks in the top 25% of all publicly traded equity REITs in terms of our total stockholder return over our 20-year history and, in the most recent five years, our total stockholder return ranks in the top 10% of this REIT group.
Overall, 2013 was a particularly outstanding year and we achieved many of the primary goals that we established for our Company as we emerged from the global financial crisis of 2008 and 2009.
You may recall that in spring 2009, our Company elected not to sell “survival equity” as we believed it would unfairly dilute our stockholders on a permanent basis. Instead, we pursued a multi-faceted strategy to initially generate capital through non-core asset dispositions and property-specific joint ventures. We later issued equity but at much higher prices than were available in spring 2009. This financial crisis taught us many lessons and we transformed our Company into one with a strong balance sheet in terms of our assets as well as our liabilities and equity. We learned our fortress centers – the “must have” assets for retailers and shoppers – performed significantly better during that severe recession
than our lesser quality assets. The lessons we learned from 2009 will never be forgotten. As a result, we have substantially upgraded the quality of our asset base through the acquisition of properties, including Kings Plaza and Green Acres, the consolidation of partnership interests in Arrowhead Towne Center and FlatIron Crossing, and the development of world-class assets such as Fashion Outlets of Chicago.
Although we had already substantially improved our portfolio, we decided in 2013 to pursue a strategy of further upgrading our asset base by disposing of additional non-core assets – those assets with lower sales productivity and slower growing net operating income (NOI). We successfully disposed of eight malls and one office complex during 2013 and generated gross sales proceeds of $856 million. Effectively, the entire amount of these proceeds was used to deleverage our balance sheet. As a result of our accomplishments, our Company has the strongest balance sheet in our history.
The composition of our “A quality” assets dramatically improved as a result of these
39601 Merrill_TEXT.indd 1 4/9/14 12:09 AM

Tysons Corner Center, McLean, VAA decade in the making, the expanded, mixed-use Tysons Corner Center will debut its new office, hotel and residential towers, as well as a signature elevated plaza that connects all the elements, in phases through spring 2015. This new urban environment will be even more accessible when the Metro Silver Line opens in summer 2014.
39601 Merrill_TEXT.indd 2 4/9/14 12:09 AM

4
* AFFO-diluted represents adjusted funds from operations on a fully-diluted basis. For the definition of AFFO-diluted and a reconciliation of AFFO-diluted to net income attributable to common stockholders-diluted, see “Management’s Discussion and Analysis of Financial Condition and Results of Operations - Funds from Operations and Adjusted Funds from Operations” in the Form 10-K included herein.
dispositions. At December 31, 2013, after giving effect to our dispositions, acquisitions and new development, our portfolio consisted of interests in 54 regional malls averaging sales per square foot of $562 compared to 61 regional malls averaging sales per square foot of $517 at December 31, 2012. Our top 40 malls at December 31, 2012, generated 77.9% of our pro rata NOI. By December 31, 2013, our top 40 malls generated 89% of our pro rata NOI.
The short-term balance sheet impact of our dispositions was to pay off our line of credit and other debt. Long term, we successfully rebalanced our portfolio and will recycle that capital by expanding and redeveloping our highly productive, core assets. As I later outline, our development and redevelopment projects are focused on our best and most productive properties.
Several other companies, particularly in the mall sector, pursued the separation of their
core and non-core assets through either spin-offs or corporate reorganizations. We elected not to follow this strategy because we wanted to retain the proceeds from our non-core dispositions to benefit our stockholders by investing those proceeds into our proven centers and new centers, such as Fashion Outlets of Chicago. Our plan is to focus on fewer but more dominant assets in densely populated urban markets. As several analysts have noted, our Company has greater population density per mall than any other mall company in the U.S. This is important to note as ease of shopping and proximity to retail stores become even more critical in the years ahead with retailers, through their omni-channel strategies, implementing same-day delivery and “click-and-collect” initiatives which allow customers to buy goods online for pick-up at their local stores.
Developments and RedevelopmentsDuring 2013, Macerich made substantial progress on our major
development and redevelopment projects that we believe will fuel our Company’s growth over the years to come. As we move into 2014 and beyond, we will reinvest our capital into exciting new development, redevelopment and expansion projects.
Fashion Outlets of Chicago. The most notable development of 2013 within our portfolio was Fashion Outlets of Chicago. This breakthrough outlet project opened in August over 90% leased, with fashion-leading anchors Last Call by Neiman Marcus, Bloomingdale’s The Outlet Store, Saks Fifth Avenue Off 5th and Forever 21. In addition, the tenant roster included luxury outlet retailers Longchamp, Brunello Cucinelli, Prada, DVF, Moncler, Gucci, Giorgio Armani, Michael Kors, Coach, Coach Men’s and Tory Burch. We fully anticipate that this center will be one of the top centers of our portfolio as measured by sales per square foot.
Tysons Corner Center. We made significant progress toward the 2014-2015 opening of the office, residential and hotel towers at Tysons Corner. We successfully signed leases for a substantial portion of the office tower and it is currently more than 70% committed, with Intelsat, the world’s leading provider of satellite services, as our marquee anchor. We strongly believe that our office tower will open in the third quarter of 2014 more than 80% leased and with rents above our original projections. Tysons’ 300-room Hyatt Regency hotel along with our 430-unit residential tower are scheduled to open in spring 2015, coupled
AFFO-Diluted*($ in Millions)
2009 2010 2011 2012 2013
$380.0$351.3
$411.8$460.9
$527.6
Macerich 2013 Annual Report
39601 Merrill_TEXT.indd 3 4/9/14 12:09 AM

with a new 1.5-acre plaza that will provide Tysons Corner with direct access to the expanded Metro Silver Line opening in summer 2014. We are already reaping the benefits of our Tysons development and see the positive impact on retail rents for the shopping center. The retail community is recognizing the dramatic impact the densification of Tysons Corner will have on overall sales productivity and traffic. We remain confident that upon completion, this development will be one of the premier projects of its kind in the U.S.
The Shops at North Bridge. Another major addition to our portfolio in 2013 was the December opening of the nation’s second Eataly at The Shops at North Bridge. This 63,000 square-foot, dynamic artisanal Italian food and wine emporium is already changing the retail traffic flow on Michigan Avenue and generating additional retail interest for North Bridge and our surrounding properties. In addition, Eddie V’s restaurant and a new mall entrance were added to this center during 2013.
Fashion Outlets of Niagara Falls USA. We began construction on the 175,000 square-foot expansion of this outlet center in 2013 and had lease commitments for approximately 71% at year-end. During 2014, we anticipate substantially completing the expansion of this already highly successful outlet center.
Broadway Plaza. We recently began a $260 million expansion of this extremely productive retail center in Walnut Creek, California, that currently has
Eataly, The Shops at North Bridge, Chicago, ILEataly, the largest artisanal Italian food and wine marketplace in the world, opened its second U.S. – and only mall – location in Chicago at The Shops at North Bridge on December 2, 2013.
Fashion Outlets of Chicago, Chicago, ILMacerich opened Fashion Outlets of Chicago, a fully enclosed luxury outlet mall on August 1, 2013. This breakthrough retail destination opened over 90% leased and is home to 130 stores.
39601 Merrill_TEXT.indd 4 4/9/14 12:09 AM

sales over $700 per square foot. We will be expanding this open-air center by adding approximately 235,000 square feet of net new shop space to the existing 776,000 square feet currently anchored by Nordstrom, Neiman Marcus and Macy’s. We are recreating this new retail complex by demolishing about 80,000 square feet of existing retail space as well as two older, inefficient parking structures which will be replaced with a modern, five-level parking deck. This project will open in phases beginning in late 2015.
Santa Monica Place. We are very excited to have recently received approval to add a 48,000 square-foot state-of-the-art, 12-screen ArcLight Cinemas to the third-level entertainment and dining deck of Santa Monica Place. We are also honored that Santa Monica Place received the most prestigious design and development award from the International Council of Shopping Centers in 2013,
winning the Best-of-the-Best VIVA Global Design and Development Award which recognized Santa Monica Place as the best retail center built in the world. While we are pleased with our initial results, we are confident that Santa Monica Place has an even brighter future with our planned theatre addition, which we believe will drive significant incremental traffic and sales productivity to this iconic center.
Los Cerritos Center. We will begin the redevelopment of Los Cerritos Center in 2014 with the addition of a new state-of-the-art theatre and a major sporting goods junior anchor. Los Cerritos is a very successful center with sales per square foot of $674 and we are confident that these additional anchors will continue to expand its drawing power.
Scottsdale Fashion Square. We will begin a 130,000 square-foot expansion this year at Scottsdale Fashion Square, involving the addition of a new major sporting
goods junior anchor and a new state-of-the-art cinema.
Kings Plaza Shopping Center. Even though we only recently acquired Kings Plaza, we began remerchandising this well-positioned property in Brooklyn as well as redeveloping the mall’s interior and parking structure.
Green Acres Mall. Shortly after our acquisition of Green Acres Mall, we acquired 20 acres of land contiguous to this center and we plan to build more than 300,000 square feet of retail space, which we anticipate opening in fall 2016.
Excellence in OperationsOur operational fundamentals are very strong, and our core metrics reflect this robust performance. We increased our AFFO per share-diluted by approximately 11% during 2013 even after factoring in the dilution from our dispositions. Annual sales per square foot ended the year at $562 compared to $517 for the prior
6
* Tenants 10,000 square feet and under.
Sales Per Square Foot*
2004 2005 2006 2007 2008 2009 2010 2011 2012 2013
$391$417
$452 $467$441
$407
$433
$489
$517
$562
Macerich 2013 Annual Report
39601 Merrill_TEXT.indd 5 4/9/14 12:09 AM

Broadway Plaza, Walnut Creek, CA – Future RedevelopmentThis redevelopment of Broadway Plaza is underway, including 235,000 square feet of additional shop space, improved parking and new amenities to bring more of the best retail mix to the East Bay.
39601 Merrill_TEXT.indd 6 4/9/14 12:09 AM

8
year. Our releasing spreads for 2013 were extremely positive at 17.2% and we ended the year with mall occupancy at 94.6%. As a result, we achieved 2013 same center NOI growth in our portfolio of 4.1%. In addition to overall occupancy gains and strong releasing spreads, we achieved this increase in our same center NOI growth by converting temporary leases to permanent leases, and disposing of our slower growing and less productive centers. The average sales per square foot of the assets that we sold in 2013 was $340, substantially below our portfolio average. By disposing of assets that historically have not grown at the same rate as our more productive assets and redeploying the proceeds via redevelopment into our top 20 centers, we believe we will substantially enhance our net asset value as well as benefit our same center NOI growth.
Balance Sheet and LiquidityIn addition to selling approximately $856 million of
non-core assets during the year, we also deleveraged by selling common equity of $171 million at approximately $70 per share concurrent with our inclusion in the S&P 500 Index. As previously noted, our balance sheet today is the strongest it has been in the history of our Company. We further extended our average debt maturity schedule to approximately six years and reduced our debt-to-EBITDA ratio to 7.2x. We ended the year with significant liquidity, with only $30 million outstanding on our $2 billion line of credit and $102 million of cash on the balance sheet.
Macro ConcernsAfter meeting with a significant number of investors over the past three months, it is clear to me that there are macro concerns in the regional mall industry about the impact of e-commerce on brick-and-mortar sales as well as the future of JCPenney and Sears. In terms of the impact of e-commerce on brick-and-mortar sales, it is evident to us that the
dot.com business of each of our retailers is synergistic with its other distribution channels, whether these retailers are full price, off price or outlet. If, for example, you think of a retailer’s e-commerce distribution channel as a single store, and that retailer has 500 stores, most likely the e-commerce store will always be the highest-volume and fastest-growing store. The fact that the e-commerce distribution channel may be the highest-volume store, however, does not mean that any particular retail chain would ever consider closing its brick-and-mortar stores to rely solely on its e-commerce channel. Our most successful retailers fully believe that each of their channels of distribution is synergistic with one another. We believe fortress centers are a key component of not only a retailer’s brick-and-mortar strategy but also its e-commerce strategy. I do believe that malls and retail stores located in the center of dense populations, such as our current portfolio, will have an advantage as retailers utilize such options
2004 2005 2006 2007 2008 2009 2010 2011 2012 2013
92.5%93.3%
93.4%93.1%
92.3%91.3%
93.1% 92.7%
93.8%94.6%
Occupancy at Year-End
Macerich 2013 Annual Report
39601 Merrill_TEXT.indd 7 4/9/14 12:09 AM

viii
as same-day delivery, “click-and-collect” and other logistical conveniences for their customers.
With respect to JCPenney and Sears, we are always hopeful that each of our anchor department stores will be successful. Macerich substantially reduced the number, and relative risk, of JCPenney and Sears stores in our portfolio through our recent disposition program. We experienced numerous anchor evolutions over the years, and, in almost every case, when one anchor goes out of business or is purchased by another anchor, the Darwinian nature of the retail business results in greater productivity from the replacement anchor. We are constantly evaluating how to upgrade the uses of various spaces at our properties. As we continue to enhance our portfolio and focus on major urban markets, we believe that a recapture of our anchors will result in replacement anchors and/or uses that upgrade the quality of these centers over time. For example, in 2005, Santa Monica Place was anchored by Robinsons May and Macy’s. These two anchors together generated less business than either Bloomingdale’s or Nordstrom generate in that center today. We believe owning dominant, “A quality” fortress malls in dense trade areas provides us with the ability to remerchandise both small store space as well as anchor space in the event of any tenant closure.
SummaryAs we emerged from the severe recession, we committed to you that Macerich would create a strong and much improved balance sheet both in terms of
Los Cerritos Center, Cerritos, CALos Cerritos is currently undergoing a redevelopment to accommodate a new theater and new big box retail, as well as updates to this strong regional draw in the Los Angeles area.
Santa Monica Place, Santa Monica, CARecipient of the ICSC 2013 Best-of-the-Best VIVA Global Design and Development Award, Santa Monica Place recently announced a new 12-screen ArcLight Cinemas to open on the third-level dining deck.
39601 Merrill_TEXT.indd 8 4/9/14 12:09 AM

10
Total Stockholder Returns
2011-2013 2009-2013 2004-2013(Three Year) (Five Year) (Ten Year)
33.3% 40.0%
118.3%128.0%
341.0%
128.5%
104.2%
132.0%
56.7%
The Macerich Company
S&P 500 Index
FTSE NAREIT All Equity REITs Index
our assets and our liabilities and equity. We believe that we accomplished that goal. We significantly strengthened our capital and liquidity positions, bolstered the quality of our portfolio and expanded our business opportunities. However, we are never satisfied and will strive to further enhance the productivity of our centers as well as continue to improve our balance sheet. As a result of our accomplishments, 89% of our NOI is now generated from properties that average sales in excess of $600 per square foot and are located in some of the most densely populated and fastest-growing markets in the U.S. We have a very strong management team that is focusing their attention on recycling capital from our less productive assets into our proven winning assets. We are
well-positioned to refinance our loan maturities due over the next several years. Based on current underwriting standards, we believe we could generate excess financing proceeds to completely fund our development/redevelopment pipeline. Furthermore, given the high average existing interest rates on debt maturing in the next three years, interest rates would need to increase dramatically for us not to realize a lower interest rate on our refinancings.
I want to thank our stockholders and our board of directors for their guidance and support during the year. In particular, I would like to thank our directors that have been with us since we went public 20 years ago, including our lead director, Fred Hubbell, as well as Stan Moore, Dr. William Sexton and, of
course, our founding directors, Dana Anderson and Edward Coppola. We also would like to welcome Steven Soboroff who was appointed to the board earlier this year. Mr. Soboroff has been a strong community leader and real estate developer in Los Angeles for over 35 years and is currently the President of the Los Angeles Police Commission. We are confident that he will be a valuable addition to our already strong board.
I look forward to reporting to you during the balance of this year.
Very truly yours,
Arthur M. Coppola Chairman and Chief Executive Officer
Macerich 2013 Annual Report
39601 Merrill_TEXT.indd 9 4/9/14 12:09 AM

11
PropertiesSales PSF
12/31/2013 (a)
Occupancy % 12/31/2013
(b)
% of Portfolio Forecast 2014 Pro Rata NOI
(c)
GROUP 1: TOP 10
1 Washington Square $1,090 92.2%
2 Queens Center $1,038 98.8%
3 Biltmore Fashion Park $927 90.0%
4 North Bridge, The Shops at $906 97.3%
5 Corte Madera, Village at $902 97.8%
6 Tysons Corner Center $824 98.2%
7 Santa Monica Place $734 90.5%
8 Broadway Plaza $726 87.1%
9 Tucson La Encantada $694 92.2%
10 Scottsdale Fashion Square $694 94.5%
TOTAL TOP 10: $855 95.0% 22.8%
GROUP 2: TOP 11-20
11 Fashion Outlets of Chicago (d) n/a 95.4%
12 Kings Plaza Shopping Center $675 95.9%
13 Los Cerritos Center $674 97.3%
14 Arrowhead Towne Center $649 96.8%
15 Kierland Commons $637 97.2%
16 Danbury Fair Mall $636 96.6%
17 Freehold Raceway Mall $619 98.5%
18 Twenty Ninth Street $613 95.7%
19 Fresno Fashion Fair $609 96.8%
20 Vintage Faire Mall $594 99.3%
TOTAL TOP 11-20: $632 97.0% 27.7%
GROUP 3: TOP 21-30
21 Chandler Fashion Center $567 97.5%
22 Green Acres Mall $541 93.4%
23 Fashion Outlets of Niagara Falls USA $532 94.6%
24 West Acres $527 99.8%
25 FlatIron Crossing $525 93.7%
26 Stonewood Center $522 96.1%
27 Victor Valley, Mall of $509 97.0%
28 Deptford Mall $505 96.7%
29 Oaks, The $502 97.2%
30 SanTan Village Regional Center $495 96.7%
TOTAL TOP 21-30: $524 95.9% 22.6%
The Macerich CompanySales Per Square Foot by Property Ranking (Unaudited)
(a) Sales are based on reports by retailers leasing mall and freestanding stores for the trailing 12 months for tenants which have occupied such stores for a minimum of 12 months. Sales per square foot are based on tenants 10,000 square feet and under.(b) Occupancy is the percentage of mall and freestanding GLA leased as of the last day of the reporting period.
39601 Merrill_TEXT.indd 10 4/9/14 12:09 AM

12
PropertiesSales PSF
12/31/2013 (a)
Occupancy % 12/31/2013
(b)
% of Portfolio Forecast 2014 Pro Rata NOI
(c)
GROUP 4: TOP 31-40
31 Valley River Center $478 98.2%
32 South Plains Mall $468 88.3%
33 Lakewood Center $430 97.5%
34 Inland Center $417 97.9%
35 Pacific View $405 98.7%
36 Northgate Mall $396 97.9%
37 La Cumbre Plaza $396 86.4%
38 Eastland Mall $395 98.8%
39 South Towne Center $352 88.9%
40 Westside Pavilion $348 94.7%
TOTAL TOP 31-40: $410 95.1% 15.9%
TOTAL TOP 40: $607 95.8% 89.0%
GROUP 5: 41-54
41 Superstition Springs Center $345 96.9%
42 Towne Mall $331 86.4%
43 Capitola Mall $326 85.3%
44 NorthPark Mall $313 91.6%
45 Flagstaff Mall $310 78.8%
46 Cascade Mall $298 91.5%
47 Wilton Mall $296 90.7%
48 Valley Mall $286 95.4%
49 Somersville Towne Center $278 73.2%
50 Desert Sky Mall $270 89.2%
51 Lake Square Mall $251 78.6%
52 Great Northern Mall $247 95.5%
53 SouthPark Mall $228 79.4%
54 Paradise Valley Mall (e) n/a n/a
TOTAL 41-54: $293 88.6% 7.8%
REGIONAL SHOPPING CENTERS (f) $562 94.6% 96.8%
OTHER NON-REGIONAL MALL ASSETS 3.2%
GRAND TOTAL 100.0%
(c) The percent of Portfolio Forecast 2014 Pro Rata NOI is based on guidance provided on February 4, 2014. NOI excludes the following items: straight-line rent, above/below market adjustments to minimum rents, termination fee income and bad debt expense. It does not ref lect REIT expenses and net management company expenses. See our Company’s forward-looking statements disclosure under “Important Factors Related to Forward-Looking Statements” in our Form 10-K included herein. (d) Fashion Outlets of Chicago opened on August 1, 2013 and is included in “Group 2: Top 11 - 20” based on our expectations for Sales per square foot at this property.(e) Tenant spaces have been intentionally held off the market and remain vacant because of redevelopment plans. As a result, our Company believes the Sales per square foot and Occupancy at this redevelopment property is not meaningful data.(f) Our Company sold Rotterdam Square on January 15, 2014, and it is excluded from the table.
Macerich 2013 Annual Report
39601 Merrill_TEXT.indd 11 4/9/14 12:09 AM

13
Directors
Executive Officers
Arthur M. Coppola Chairman and Chief Executive Officer
Dana K. Anderson Vice Chairman of the Board
Edward C. Coppola President and Director
Douglas D. Abbey Director
Fred S. Hubbell Director
Diana M. Laing Director
Stanley A. Moore Director Mason G. Ross Director
Dr. William P. Sexton Director Steven L. Soboroff Director Andrea M. Stephen Director
Thomas J. Leanse Senior Executive Vice President, Chief Legal Officer and Secretary
Randy L. Brant Executive Vice President, Real Estate
Thomas E. O’Hern Senior Executive Vice President, Chief Financial Officer and Treasurer
Robert D. Perlmutter Executive Vice President, Leasing
Eric V. Salo Executive Vice President
Macerich 2013 Annual Report
39601 Merrill_TEXT.indd 12 4/9/14 12:09 AM

UNITED STATESSECURITIES AND EXCHANGE COMMISSION
Washington, D.C. 20549
FORM 10-KANNUAL REPORT PURSUANT TO SECTION 13 OR 15(d)
OF THE SECURITIES EXCHANGE ACT OF 1934
FOR THE FISCAL YEAR ENDED DECEMBER 31, 2013
Commission File No. 1-12504
THE MACERICH COMPANY(Exact name of registrant as specified in its charter)
MARYLAND 95-4448705(State or other jurisdiction of (I.R.S. Employerincorporation or organization) Identification Number)
401 Wilshire Boulevard, Suite 700, Santa Monica, California 90401(Address of principal executive office, including zip code)
Registrant’s telephone number, including area code (310) 394-6000
Securities registered pursuant to Section 12(b) of the Act
Title of each class Name of each exchange on which registered
Common Stock, $0.01 Par Value New York Stock Exchange
Securities registered pursuant to Section 12(g) of the Act: None
Indicate by check mark if the registrant is a well-known seasoned issuer, as defined in Rule 405 of the SecuritiesAct YES � NO �
Indicate by check mark if the registrant is not required to file reports pursuant to Section 13 or Section 15(d) of theAct YES � NO �
Indicate by check mark whether the registrant (1) has filed all reports required to be filed by Section 13 or 15(d) ofthe Securities Exchange Act of 1934 during the preceding 12 months (or for such shorter period that the registrant wasrequired to file such reports) and (2) has been subject to such filing requirements for the past 90 days. YES � NO �
Indicate by check mark whether the registrant has submitted electronically and posted on its corporate Web site, ifany, every Interactive Data File required to be submitted and posted pursuant to Rule 405 of Regulation S-T (§ 232.405of this chapter) during the preceding 12 months (or for such shorter period that the registrant was required to submitand post such files). YES � NO �
Indicate by check mark if disclosure of delinquent filers pursuant to Item 405 of Regulation S-K is not containedherein, and will not be contained, to the best of registrant’s knowledge, in definitive proxy or information statementsincorporated by reference in Part III of this Form 10-K or any amendment on to this Form 10-K. �
Indicate by check mark whether the registrant is a large accelerated filer, an accelerated filer, a non-acceleratedfiler, or a smaller reporting company. See definitions of ‘‘large accelerated filer,’’ ‘‘accelerated filer,’’ and ‘‘smallerreporting company’’ in Rule 12b-2 of the Exchange Act. (Check one):
Large accelerated filer � Accelerated filer � Non-accelerated filer � Smaller reporting company �(Do not check if a
smaller reporting company)
Indicate by check mark whether the registrant is a shell company (as defined in Rule 12b-2 of the Exchange Act).YES � NO �
The aggregate market value of voting and non-voting common equity held by non-affiliates of the registrant wasapproximately $8.5 billion as of the last business day of the registrant’s most recently completed second fiscal quarterbased upon the price at which the common shares were last sold on that day.
Number of shares outstanding of the registrant’s common stock, as of February 18, 2014: 140,553,257 shares
DOCUMENTS INCORPORATED BY REFERENCE
Portions of the proxy statement for the annual stockholders meeting to be held in 2014 are incorporated byreference into Part III of this Form 10-K.

THE MACERICH COMPANYANNUAL REPORT ON FORM 10-K
FOR THE YEAR ENDED DECEMBER 31, 2013INDEX
Page
Part IItem 1. Business . . . . . . . . . . . . . . . . . . . . . . . . . . . . . . . . . . . . . . . . . . . . . . . . . . . . . . . . . 3Item 1A. Risk Factors . . . . . . . . . . . . . . . . . . . . . . . . . . . . . . . . . . . . . . . . . . . . . . . . . . . . . . 18Item 1B. Unresolved Staff Comments . . . . . . . . . . . . . . . . . . . . . . . . . . . . . . . . . . . . . . . . . . 27Item 2. Properties . . . . . . . . . . . . . . . . . . . . . . . . . . . . . . . . . . . . . . . . . . . . . . . . . . . . . . . 28Item 3. Legal Proceedings . . . . . . . . . . . . . . . . . . . . . . . . . . . . . . . . . . . . . . . . . . . . . . . . . . 35Item 4. Mine Safety Disclosures . . . . . . . . . . . . . . . . . . . . . . . . . . . . . . . . . . . . . . . . . . . . . 35Part IIItem 5. Market for Registrant’s Common Equity, Related Stockholder Matters and Issuer
Purchases of Equity Securities . . . . . . . . . . . . . . . . . . . . . . . . . . . . . . . . . . . . . . . 36Item 6. Selected Financial Data . . . . . . . . . . . . . . . . . . . . . . . . . . . . . . . . . . . . . . . . . . . . . 38Item 7. Management’s Discussion and Analysis of Financial Condition and Results of
Operations . . . . . . . . . . . . . . . . . . . . . . . . . . . . . . . . . . . . . . . . . . . . . . . . . . . . . 44Item 7A. Quantitative and Qualitative Disclosures About Market Risk . . . . . . . . . . . . . . . . . . . 63Item 8. Financial Statements and Supplementary Data . . . . . . . . . . . . . . . . . . . . . . . . . . . . . 65Item 9. Changes in and Disagreements With Accountants on Accounting and Financial
Disclosure . . . . . . . . . . . . . . . . . . . . . . . . . . . . . . . . . . . . . . . . . . . . . . . . . . . . . . 65Item 9A. Controls and Procedures . . . . . . . . . . . . . . . . . . . . . . . . . . . . . . . . . . . . . . . . . . . . . 65Item 9B. Other Information . . . . . . . . . . . . . . . . . . . . . . . . . . . . . . . . . . . . . . . . . . . . . . . . . 67Part IIIItem 10. Directors and Executive Officers and Corporate Governance . . . . . . . . . . . . . . . . . . . 68Item 11. Executive Compensation . . . . . . . . . . . . . . . . . . . . . . . . . . . . . . . . . . . . . . . . . . . . . 68Item 12. Security Ownership of Certain Beneficial Owners and Management and Related
Stockholder Matters . . . . . . . . . . . . . . . . . . . . . . . . . . . . . . . . . . . . . . . . . . . . . . 68Item 13. Certain Relationships and Related Transactions, and Director Independence . . . . . . . 68Item 14. Principal Accountant Fees and Services . . . . . . . . . . . . . . . . . . . . . . . . . . . . . . . . . . 68Part IVItem 15. Exhibits and Financial Statement Schedule . . . . . . . . . . . . . . . . . . . . . . . . . . . . . . . . 69Signatures . . . . . . . . . . . . . . . . . . . . . . . . . . . . . . . . . . . . . . . . . . . . . . . . . . . . . . . . . . . . . . . 135
2

PART I
IMPORTANT FACTORS RELATED TO FORWARD-LOOKING STATEMENTS
This Annual Report on Form 10-K of The Macerich Company (the ‘‘Company’’) containsstatements that constitute forward-looking statements within the meaning of the federal securities laws.Any statements that do not relate to historical or current facts or matters are forward-lookingstatements. You can identify some of the forward-looking statements by the use of forward-lookingwords, such as ‘‘may,’’ ‘‘will,’’ ‘‘could,’’ ‘‘should,’’ ‘‘expects,’’ ‘‘anticipates,’’ ‘‘intends,’’ ‘‘projects,’’‘‘predicts,’’ ‘‘plans,’’ ‘‘believes,’’ ‘‘seeks,’’ ‘‘estimates,’’ ‘‘scheduled’’ and variations of these words andsimilar expressions. Statements concerning current conditions may also be forward-looking if they implya continuation of current conditions. Forward-looking statements appear in a number of places in thisForm 10-K and include statements regarding, among other matters:
• expectations regarding the Company’s growth;
• the Company’s beliefs regarding its acquisition, redevelopment, development, leasing andoperational activities and opportunities, including the performance of its retailers;
• the Company’s acquisition, disposition and other strategies;
• regulatory matters pertaining to compliance with governmental regulations;
• the Company’s capital expenditure plans and expectations for obtaining capital for expenditures;
• the Company’s expectations regarding income tax benefits;
• the Company’s expectations regarding its financial condition or results of operations; and
• the Company’s expectations for refinancing its indebtedness, entering into and servicing debtobligations and entering into joint venture arrangements.
Stockholders are cautioned that any such forward-looking statements are not guarantees of futureperformance and involve risks, uncertainties and other factors that may cause actual results,performance or achievements of the Company or the industry to differ materially from the Company’sfuture results, performance or achievements, or those of the industry, expressed or implied in suchforward-looking statements. You are urged to carefully review the disclosures we make concerning risksand other factors that may affect our business and operating results, including those made in ‘‘Item 1A.Risk Factors’’ of this Annual Report on Form 10-K, as well as our other reports filed with theSecurities and Exchange Commission (‘‘SEC’’). You are cautioned not to place undue reliance on theseforward-looking statements, which speak only as of the date of this document. The Company does notintend, and undertakes no obligation, to update any forward-looking information to reflect events orcircumstances after the date of this document or to reflect the occurrence of unanticipated events,unless required by law to do so.
ITEM 1. BUSINESS
General
The Company is involved in the acquisition, ownership, development, redevelopment, managementand leasing of regional and community/power shopping centers located throughout the United States.The Company is the sole general partner of, and owns a majority of the ownership interests in, TheMacerich Partnership, L.P., a Delaware limited partnership (the ‘‘Operating Partnership’’). As ofDecember 31, 2013, the Operating Partnership owned or had an ownership interest in 55 regionalshopping centers and nine community/power shopping centers totaling approximately 57 million squarefeet of gross leasable area (‘‘GLA’’). These 64 regional and community/power shopping centers arereferred to herein as the ‘‘Centers,’’ and consist of consolidated Centers (‘‘Consolidated Centers’’) and
3

unconsolidated joint venture Centers (‘‘Unconsolidated Joint Venture Centers’’) as set forth in ‘‘Item 2.Properties,’’ unless the context otherwise requires.
The Company is a self-administered and self-managed real estate investment trust (‘‘REIT’’) andconducts all of its operations through the Operating Partnership and the Company’s managementcompanies, Macerich Property Management Company, LLC, a single member Delaware limited liabilitycompany, Macerich Management Company, a California corporation, Macerich Arizona Partners LLC,a single member Arizona limited liability company, Macerich Arizona Management LLC, a singlemember Delaware limited liability company, Macerich Partners of Colorado LLC, a Colorado limitedliability company, MACW Mall Management, Inc., a New York corporation, and MACW PropertyManagement, LLC, a single member New York limited liability company. All seven of the managementcompanies are collectively referred to herein as the ‘‘Management Companies.’’
The Company was organized as a Maryland corporation in September 1993. All references to theCompany in this Annual Report on Form 10-K include the Company, those entities owned orcontrolled by the Company and predecessors of the Company, unless the context indicates otherwise.
Financial information regarding the Company for each of the last three fiscal years is contained inthe Company’s Consolidated Financial Statements included in ‘‘Item 15. Exhibits and FinancialStatement Schedules.’’
Recent Developments
Acquisitions and Dispositions:
On January 24, 2013, the Company acquired Green Acres Mall, a 1,787,000 square foot regionalshopping center in Valley Stream, New York, for a purchase price of $500.0 million. The purchase pricewas funded from the placement of a $325.0 million mortgage note on the property and fromborrowings under the Company’s line of credit.
On April 25, 2013, the Company acquired a 19 acre parcel of land adjacent to Green Acres Mallfor $22.6 million. The purchase price was funded by borrowings under the Company’s line of credit.
On May 29, 2013, the Company’s joint venture in Pacific Premier Retail LP sold Redmond TownCenter Office, a 582,000 square foot office building in Redmond, Washington, for $185.0 million,resulting in a gain on the sale of assets of $89.2 million to the joint venture. The Company’s share ofthe gain was $44.4 million. The Company used its share of the proceeds from the sale to pay down itsline of credit and for general corporate purposes.
On May 31, 2013, the Company sold Green Tree Mall, a 793,000 square foot regional shoppingcenter in Clarksville, Indiana, for $79.0 million, resulting in a gain on the sale of assets of $59.8 million.The Company used the proceeds from the sale to pay down its line of credit and for general corporatepurposes.
On June 4, 2013, the Company sold Northridge Mall, an 890,000 square foot regional shoppingcenter in Salinas, California, and Rimrock Mall, a 603,000 square foot regional shopping center inBillings, Montana. The properties were sold in a combined transaction for $230.0 million, resulting in again on the sale of assets of $82.2 million. The Company used the proceeds from the sale to pay downits line of credit and for general corporate purposes.
On June 12, 2013, the Company’s joint venture in Pacific Premier Retail LP sold Kitsap Mall, an846,000 square foot regional shopping center in Silverdale, Washington, for $127.0 million, resulting ina gain on the sale of assets of $55.2 million to the joint venture. The Company’s share of the gain was$28.1 million. The Company used its share of the proceeds from the sale to pay down its line of creditand for general corporate purposes.
4

On August 1, 2013, the Company’s joint venture in Pacific Premier Retail LP sold Redmond TownCenter, a 695,000 square foot community center in Redmond, Washington, for $127.0 million, resultingin a gain on the sale of assets of $38.4 million to the joint venture. The Company’s share of the gainwas $18.3 million. The Company used its share of the proceeds from the sale to pay down its line ofcredit and for general corporate purposes.
On September 11, 2013, the Company sold a former Mervyn’s store in Milpitas, California for$12.0 million, resulting in a loss on the sale of assets of $2.6 million. The Company used the proceedsfrom the sale to pay down its line of credit and for general corporate purposes.
On September 17, 2013, the Company’s joint venture in Camelback Colonnade, a 619,000 squarefoot community center in Phoenix, Arizona, was restructured. As a result of the restructuring, theCompany’s ownership interest in Camelback Colonnade decreased from 73.2% to 67.5%. Prior to therestructuring, the Company had accounted for its investment in Camelback Colonnade under the equitymethod of accounting due to substantive participation rights held by the outside partners. Uponcompletion of the restructuring, these substantive participation rights were terminated and theCompany obtained voting control of the joint venture. This transaction is referred to herein as the‘‘Camelback Colonnade Restructuring.’’ Since the date of the restructuring, the Company has includedCamelback Colonnade in its consolidated financial statements.
On October 8, 2013, the Company’s joint venture in Ridgmar Mall, a 1,273,000 square footregional shopping center in Fort Worth, Texas, sold the property for $60.9 million, resulting in a gainon the sale of assets of $6.2 million to the joint venture. The Company’s share of the gain was$3.1 million. The cash proceeds from the sale were used to pay off the $51.7 million mortgage loan onthe property and the remaining $9.2 million, net of closing costs, was distributed to the partners. TheCompany used its share of the proceeds from the sale to pay down its line of credit and for generalcorporate purposes.
On October 15, 2013, the Company sold a former Mervyn’s store in Midland, Texas for$5.7 million, resulting in a loss on the sale of assets of $2.0 million. The Company used the proceedsfrom the sale to pay down its line of credit and for general corporate purposes.
On October 23, 2013, the Company sold a former Mervyn’s store in Grand Junction, Colorado for$5.4 million, resulting in a gain on the sale of assets of $1.7 million. The Company used the proceedsfrom the sale to pay down its line of credit and for general corporate purposes.
On October 24, 2013, the Company acquired the remaining 33.3% ownership interest inSuperstition Springs Center, a 1,082,000 square foot regional shopping center in Mesa, Arizona, that itdid not own for $46.2 million. The purchase price was funded by a cash payment of $23.7 million andthe assumption of the third party’s pro rata share of the mortgage note payable on the property of$22.5 million.
On December 4, 2013, the Company sold a former Mervyn’s store in Livermore, California for$10.5 million, resulting in a loss on the sale of assets of $5.3 million. The Company used the proceedsfrom the sale to pay down its line of credit and for general corporate purposes.
On December 11, 2013, the Company sold Chesterfield Towne Center, a 1,016,000 square footregional shopping center in Richmond, Virginia, and Centre at Salisbury, an 862,000 square footregional shopping center in Salisbury, Maryland. The properties were sold in a combined transactionfor $292.5 million, resulting in a gain on the sale of assets of $151.5 million. The sales price was fundedby a cash payment of $67.8 million, the assumption of the $109.7 million mortgage note payable onChesterfield Towne Center and the assumption of the $115.0 million mortgage note payable on Centreat Salisbury. The Company used the cash proceeds from the sale to pay down its line of credit and forgeneral corporate purposes.
5

On January 15, 2014, the Company sold Rotterdam Square, a 585,000 square foot regionalshopping center in Schenectady, New York, for $8.5 million. The Company used the proceeds from thesale to pay down its line of credit and for general corporate purposes. Rotterdam Square is referred toherein as the ‘‘2014 Disposition Center’’.
Financing Activity:
On January 2, 2013, the Company’s joint venture in Kierland Commons replaced the existing loanson the property with a new $135.0 million loan that bears interest at LIBOR plus 1.90% and matureson January 2, 2018, including extension options.
On January 3, 2013, the Company exercised its option to borrow an additional $146.0 million onthe loan on Kings Plaza Shopping Center.
On January 24, 2013, in connection with the Company’s acquisition of Green Acres Mall (See‘‘Acquisitions and Dispositions’’ in Recent Developments), the Company placed a new loan on theproperty that allowed for borrowings of up to $325.0 million, bears interest at an effective rate of3.61% and matures on February 3, 2021. Concurrent with the acquisition, the Company borrowed$100.0 million on the loan. On January 31, 2013, the Company exercised its option to borrow anadditional $225.0 million on the loan.
On March 6, 2013, the Company’s joint venture in Scottsdale Fashion Square replaced the existingloan on the property with a new $525.0 million loan that bears interest at an effective rate of 3.02%and matures on April 3, 2023.
On April 30, 2013, the loan on South Towne Center was transferred to Vintage Faire Mall.Concurrently, the Company borrowed an additional $15.2 million on the loan on Vintage Faire Mallthat bears interest at an effective rate of 2.91% and matures on November 5, 2015.
On May 30, 2013, the consolidated joint venture in SanTan Village Regional Center replaced theexisting loan on the property with a new $138.0 million loan that bears interest at an effective rate of3.14% and matures on June 1, 2019.
On August 6, 2013, the Company’s line of credit was amended and extended. The amended facilityprovides for an interest rate of LIBOR plus a spread of 1.375% to 2.0%, depending on the Company’soverall leverage levels, and matures on August 6, 2018. In addition, the line of credit can be expanded,depending on certain conditions, up to a total facility of $2.0 billion, without giving effect to theCompany’s $125.0 million unsecured term loan.
On August 30, 2013, the Company’s joint venture in Tysons Corner Center replaced the existingloan on the property with a new $850.0 million loan that bears interest at an effective rate of 4.13%and matures on January 1, 2024.
On September 3, 2013, the Company’s joint venture in Boulevard Shops modified and extendedthe loan on the property to bear interest at LIBOR plus 1.75% and to mature on December 16, 2018,including extension options.
On September 17, 2013, the Company obtained control of the consolidated joint venture inCamelback Colonnade (See ‘‘Acquisitions and Dispositions’’ in Recent Developments). In connectionwith the Camelback Colonnade Restructuring, the Company assumed the loan on the property with afair value of $49.5 million that bears interest at an effective rate of 2.16% and matures on October 12,2015.
On October 24, 2013, the Company purchased the remaining 33.3% interest in Superstition SpringsCenter that it did not own (See ‘‘Acquisitions and Dispositions’’ in Recent Developments). In
6

connection with the acquisition, the Company assumed the loan on the property with a fair value of$68.4 million that bears interest at an effective rate of 2.00% and matures on October 28, 2016.
On November 8, 2013, the Company placed a new $268.0 million loan on FlatIron Crossing thatbears interest at an effective rate of 3.90% and matures on January 5, 2021.
Redevelopment and Development Activity:
In August 2011, the Company entered into a joint venture agreement with a subsidiary of AWE/Talisman for the development of Fashion Outlets of Chicago in the Village of Rosemont, Illinois. TheCompany owns 60% of the joint venture and AWE/Talisman owns 40%. The Company accounts forFashion Outlets of Chicago as a consolidated joint venture. The Center is a fully enclosed two level,528,000 square foot outlet center. The site is located within a mile of O’Hare International Airport.The project broke ground in November 2011 and opened on August 1, 2013. The total estimatedproject cost is approximately $211.0 million. As of December 31, 2013, the consolidated joint venturehad incurred $181.7 million of development costs. On March 2, 2012, the consolidated joint ventureobtained a construction loan on the property that allows for borrowings of up to $140.0 million, bearsinterest at LIBOR plus 2.50% and matures on March 5, 2017. As of December 31, 2013, theconsolidated joint venture had borrowed $91.4 million under the loan.
The Company’s joint venture in Tysons Corner Center, a 2,130,000 square foot regional shoppingcenter in McLean, Virginia, is currently expanding the property to include a 500,000 square foot officetower, a 430 unit residential tower and a 300 room Hyatt Regency hotel. The joint venture started theexpansion project in October 2011 and expects the office tower to be completed in 2014 and thebalance of the project to be completed in early 2015. The total cost of the project is estimated at$524.0 million, of which $262.0 million is estimated to be the Company’s pro rata share. The Companyhas funded $125.2 million of the total of $250.5 million incurred by the joint venture as ofDecember 31, 2013.
In November 2013, the Company started construction on the 175,000 square foot expansion ofFashion Outlets of Niagara Falls USA, a 525,000 square foot outlet center in Niagara Falls, New York.The Company expects to complete the project in late 2014. The total estimated project cost is$75.0 million. As of December 31, 2013, the Company had incurred $17.1 million of development costs.
Other Transactions and Events:
On September 30, 2013, the Company conveyed Fiesta Mall, a 933,000 square foot regionalshopping center in Mesa, Arizona, to the mortgage note lender by a deed-in-lieu of foreclosure. Themortgage loan was non-recourse. As a result of the conveyance, the Company recognized a gain on theextinguishment of debt of $1.3 million.
The Shopping Center Industry
General:
There are several types of retail shopping centers, which are differentiated primarily based on sizeand marketing strategy. Regional shopping centers generally contain in excess of 400,000 square feet ofGLA and are typically anchored by two or more department or large retail stores (‘‘Anchors’’) and arereferred to as ‘‘Regional Shopping Centers’’ or ‘‘Malls.’’ Regional Shopping Centers also typicallycontain numerous diversified retail stores (‘‘Mall Stores’’), most of which are national or regionalretailers typically located along corridors connecting the Anchors. ‘‘Strip centers,’’ ‘‘urban villages’’ or‘‘specialty centers’’ (‘‘Community/Power Shopping Centers’’) are retail shopping centers that aredesigned to attract local or neighborhood customers and are typically anchored by one or moresupermarkets, discount department stores and/or drug stores. Community/Power Shopping Centers
7

typically contain 100,000 to 400,000 square feet of GLA. Outlet Centers generally contain a widevariety of designer and manufacturer stores, often located in an open-air center, and typically range insize from 200,000 to 850,000 square feet of GLA (‘‘Outlet Centers’’). In addition, freestanding retailstores are located along the perimeter of the shopping centers (‘‘Freestanding Stores’’). Mall Stores andFreestanding Stores over 10,000 square feet are also referred to as ‘‘Big Box.’’ Anchors, Mall Stores,Freestanding Stores and other tenants typically contribute funds for the maintenance of the commonareas, property taxes, insurance, advertising and other expenditures related to the operation of theshopping center.
Regional Shopping Centers:
A Regional Shopping Center draws from its trade area by offering a variety of fashionmerchandise, hard goods and services and entertainment, often in an enclosed, climate controlledenvironment with convenient parking. Regional Shopping Centers provide an array of retail shops andentertainment facilities and often serve as the town center and a gathering place for community,charity, and promotional events.
Regional Shopping Centers have generally provided owners with relatively stable income despitethe cyclical nature of the retail business. This stability is due both to the diversity of tenants and to thetypical dominance of Regional Shopping Centers in their trade areas.
Regional Shopping Centers have different strategies with regard to price, merchandise offered andtenant mix, and are generally tailored to meet the needs of their trade areas. Anchors are located alongcommon areas in a configuration designed to maximize consumer traffic for the benefit of the MallStores. Mall GLA, which generally refers to GLA contiguous to the Anchors for tenants other thanAnchors, is leased to a wide variety of smaller retailers. Mall Stores typically account for the majorityof the revenues of a Regional Shopping Center.
Business of the Company
Strategy:
The Company has a long-term four-pronged business strategy that focuses on the acquisition,leasing and management, redevelopment and development of Regional Shopping Centers.
Acquisitions. The Company principally focuses on well-located, quality Regional Shopping Centersthat can be dominant in their trade area and have strong revenue enhancement potential. In addition,the Company pursues other opportunistic acquisitions of property that include retail and willcomplement the Company’s portfolio such as Outlet Centers. The Company subsequently seeks toimprove operating performance and returns from these properties through leasing, management andredevelopment. Since its initial public offering, the Company has acquired interests in shopping centersnationwide. The Company believes that it is geographically well positioned to cultivate and maintainongoing relationships with potential sellers and financial institutions and to act quickly when acquisitionopportunities arise (See ‘‘Acquisitions and Dispositions’’ in Recent Developments).
Leasing and Management. The Company believes that the shopping center business requiresspecialized skills across a broad array of disciplines for effective and profitable operations. For thisreason, the Company has developed a fully integrated real estate organization with in-house acquisition,accounting, development, finance, information technology, leasing, legal, marketing, propertymanagement and redevelopment expertise. In addition, the Company emphasizes a philosophy ofdecentralized property management, leasing and marketing performed by on-site professionals. TheCompany believes that this strategy results in the optimal operation, tenant mix and drawing power ofeach Center, as well as the ability to quickly respond to changing competitive conditions of the Center’strade area.
8

The Company believes that on-site property managers can most effectively operate the Centers.Each Center’s property manager is responsible for overseeing the operations, marketing, maintenanceand security functions at the Center. Property managers focus special attention on controlling operatingcosts, a key element in the profitability of the Centers, and seek to develop strong relationships withand be responsive to the needs of retailers.
Similarly, the Company generally utilizes on-site and regionally located leasing managers to betterunderstand the market and the community in which a Center is located. The Company continuallyassesses and fine tunes each Center’s tenant mix, identifies and replaces underperforming tenants andseeks to optimize existing tenant sizes and configurations.
On a selective basis, the Company provides property management and leasing services for thirdparties. The Company currently manages three regional shopping centers and three community centersfor third party owners on a fee basis.
Redevelopment. One of the major components of the Company’s growth strategy is its ability toredevelop acquired properties. For this reason, the Company has built a staff of redevelopmentprofessionals who have primary responsibility for identifying redevelopment opportunities that theybelieve will result in enhanced long-term financial returns and market position for the Centers. Theredevelopment professionals oversee the design and construction of the projects in addition toobtaining required governmental approvals (See ‘‘Redevelopment and Development Activity’’ in RecentDevelopments).
Development. The Company pursues ground-up development projects on a selective basis. TheCompany has supplemented its strong acquisition, operations and redevelopment skills with itsground-up development expertise to further increase growth opportunities (See ‘‘Redevelopment andDevelopment Activity’’ in Recent Developments).
The Centers:
As of December 31, 2013, the Centers, excluding the 2014 Disposition Center, consisted of 54Regional Shopping Centers and nine Community/Power Shopping Centers totaling approximately56 million square feet of GLA. The 54 Regional Shopping Centers in the Company’s portfolio averageapproximately 945,000 square feet of GLA and range in size from 2.1 million square feet of GLA atTysons Corner Center to 243,000 square feet of GLA at Tucson La Encantada. The Company’s nineCommunity/Power Shopping Centers have an average of approximately 429,000 square feet of GLA. Asof December 31, 2013, excluding the 2014 Disposition Center, the Centers included 210 Anchorstotaling approximately 29.2 million square feet of GLA and approximately 6,200 Mall Stores andFreestanding Stores totaling approximately 27.3 million square feet of GLA.
Competition:
There are numerous owners and developers of real estate that compete with the Company in itstrade areas. There are eight other publicly traded mall companies, a number of publicly tradedshopping center companies and several large private mall companies in the United States, any of whichunder certain circumstances could compete against the Company for an acquisition of an Anchor or atenant. In addition, other REITs, private real estate companies or investors, and financial buyerscompete with the Company in terms of acquisitions. This results in competition for both the acquisitionof properties or centers and for tenants or Anchors to occupy space. Competition for propertyacquisitions may result in increased purchase prices and may adversely affect the Company’s ability tomake suitable property acquisitions on favorable terms. The existence of competing shopping centerscould have a material adverse impact on the Company’s ability to lease space and on the level of rentsthat can be achieved. There is also increasing competition from other retail formats and technologies,such as lifestyle centers, power centers, outlet centers, Internet shopping, home shopping networks,
9

catalogs, telemarketing and discount shopping clubs that could adversely affect the Company’srevenues.
In making leasing decisions, the Company believes that retailers consider the following materialfactors relating to a center: quality, design and location, including consumer demographics; rental rates;type and quality of Anchors and retailers at the center; and management and operational experienceand strategy of the center. The Company believes it is able to compete effectively for retail tenants inits local markets based on these criteria in light of the overall size, quality and diversity of its Centers.
Major Tenants:
The Centers derived approximately 74% of their total rents for the year ended December 31, 2013from Mall Stores and Freestanding Stores under 10,000 square feet. Big Box and Anchor tenantsaccounted for 26% of total rents for the year ended December 31, 2013.
The following retailers (including their subsidiaries) represent the 10 largest rent payers in theCenters, excluding the 2014 Disposition Center, based upon total rents in place as of December 31,2013:
Number ofLocations
in the % of TotalTenant Primary DBAs Portfolio Rents(1)
L Brands, Inc. . . . . . . . . . . . . . . . . . Victoria’s Secret, Bath and Body Works, 100 2.6%PINK
Forever 21, Inc. . . . . . . . . . . . . . . . . Forever 21, XXI Forever, For Love 21 39 2.4%
Gap, Inc., The . . . . . . . . . . . . . . . . . Athleta, Banana Republic, The Gap, 64 2.3%Gap Kids, Old Navy and others
Foot Locker, Inc. . . . . . . . . . . . . . . . Champs Sports, Foot Locker, Kids Foot 100 1.8%Locker, Lady Foot Locker, NikeYardline, Foot Action USA, House ofHoops
Dick’s Sporting Goods, Inc. . . . . . . . Dick’s Sporting Goods 12 1.3%
Sears Holdings Corporation . . . . . . . . Sears 31 1.3%
Abercrombie & Fitch Co. . . . . . . . . . Abercrombie & Fitch, Hollister and 48 1.2%others
Luxottica Group S.P.A. . . . . . . . . . . . Ilori, LensCrafters, Oakley, Optical 105 1.2%Shop of Aspen, Sunglass Hut and others
Best Buy Co., Inc. . . . . . . . . . . . . . . Best Buy, Best Buy Mobile 26 1.1%
Nordstrom, Inc. . . . . . . . . . . . . . . . . Nordstrom, Last Chance, Nordstrom 16 1.1%Rack, Nordstrom Spa, NordstromEspresso Bar
(1) Total rents include minimum rents and percentage rents.
Mall Stores and Freestanding Stores:
Mall Store and Freestanding Store leases generally provide for tenants to pay rent comprised of abase (or ‘‘minimum’’) rent and a percentage rent based on sales. In some cases, tenants pay only
10

minimum rent, and in other cases, tenants pay only percentage rent. The Company has generallyentered into leases for Mall Stores and Freestanding Stores that require tenants to pay a stated amountfor operating expenses, generally excluding property taxes, regardless of the expenses the Companyactually incurs at any Center. Additionally, certain leases for Mall Stores and Freestanding Storescontain provisions that require tenants to pay their pro rata share of maintenance of the commonareas, property taxes, insurance, advertising and other expenditures related to the operations of theCenter.
Tenant space of 10,000 square feet and under in the Company’s portfolio at December 31, 2013comprises approximately 65% of all Mall Store and Freestanding Store space. The Company usestenant spaces of 10,000 square feet and under for comparing rental rate activity because this space ismore consistent in terms of shape and configuration and, as such, the Company is able to provide ameaningful comparison of rental rate activity for this space. Mall Store and Freestanding Store spacegreater than 10,000 square feet is inconsistent in size and configuration throughout the Company’sportfolio and as a result does not lend itself to a meaningful comparison of rental rate activity with theCompany’s other space. Most of the non-Anchor space over 10,000 square feet is not physicallyconnected to the mall, does not share the same common area amenities and does not benefit from thefoot traffic in the mall. As a result, space greater than 10,000 square feet has a unique rent structurethat is inconsistent with mall space under 10,000 square feet.
The following tables set forth the average base rent per square foot for the Centers, as ofDecember 31 for each of the past five years:
Mall Stores and Freestanding Stores under 10,000 square feet:
Avg. Base Rent Avg. Base RentPer Sq. Ft. on Per Sq. Ft. on
Avg. Base Leases Executed Leases ExpiringRent Per During the During the
For the Years Ended December 31, Sq. Ft.(1)(2) Year(2)(3) Year(2)(4)
Consolidated Centers:2013 . . . . . . . . . . . . . . . . . . . . . . . . . . . . . . . . . . . . . . . . . . . $44.51 $45.06 $40.002012 . . . . . . . . . . . . . . . . . . . . . . . . . . . . . . . . . . . . . . . . . . . $40.98 $44.01 $38.002011 . . . . . . . . . . . . . . . . . . . . . . . . . . . . . . . . . . . . . . . . . . . $38.80 $38.35 $35.842010 . . . . . . . . . . . . . . . . . . . . . . . . . . . . . . . . . . . . . . . . . . . $37.93 $34.99 $37.022009 . . . . . . . . . . . . . . . . . . . . . . . . . . . . . . . . . . . . . . . . . . . $37.77 $38.15 $34.10Unconsolidated Joint Venture Centers (at the Company’s prorata share):2013 . . . . . . . . . . . . . . . . . . . . . . . . . . . . . . . . . . . . . . . . . . . $62.47 $63.44 $48.432012 . . . . . . . . . . . . . . . . . . . . . . . . . . . . . . . . . . . . . . . . . . . $55.64 $55.72 $48.742011 . . . . . . . . . . . . . . . . . . . . . . . . . . . . . . . . . . . . . . . . . . . $53.72 $50.00 $38.982010 . . . . . . . . . . . . . . . . . . . . . . . . . . . . . . . . . . . . . . . . . . . $46.16 $48.90 $38.392009 . . . . . . . . . . . . . . . . . . . . . . . . . . . . . . . . . . . . . . . . . . . $45.56 $43.52 $37.56
11

Big Box and Anchors:
Avg. Base Rent Number of Avg. Base Rent Number ofPer Sq. Ft. on Leases Per Sq. Ft. on Leases
Avg. Base Leases Executed Executed Leases Expiring ExpiringRent Per During the During During the During
For the Years Ended December 31, Sq. Ft.(1)(2) Year(2)(3) the Year Year(2)(4) the Year
Consolidated Centers:2013 . . . . . . . . . . . . . . . . . . . . . . . . . . . . . $10.94 $14.61 29 $14.08 212012 . . . . . . . . . . . . . . . . . . . . . . . . . . . . . $ 9.34 $15.54 21 $ 8.85 222011 . . . . . . . . . . . . . . . . . . . . . . . . . . . . . $ 8.42 $10.87 21 $ 6.71 142010 . . . . . . . . . . . . . . . . . . . . . . . . . . . . . $ 8.64 $13.79 31 $10.64 102009 . . . . . . . . . . . . . . . . . . . . . . . . . . . . . $ 9.66 $10.13 19 $20.84 5Unconsolidated Joint Venture Centers(at the Company’s pro rata share):2013 . . . . . . . . . . . . . . . . . . . . . . . . . . . . . $13.36 $37.45 22 $24.58 102012 . . . . . . . . . . . . . . . . . . . . . . . . . . . . . $12.52 $23.25 21 $ 8.88 102011 . . . . . . . . . . . . . . . . . . . . . . . . . . . . . $12.50 $21.43 15 $14.19 72010 . . . . . . . . . . . . . . . . . . . . . . . . . . . . . $11.90 $24.94 20 $15.63 262009 . . . . . . . . . . . . . . . . . . . . . . . . . . . . . $11.60 $31.73 16 $19.98 16
(1) Average base rent per square foot is based on spaces occupied as of December 31 for each of theCenters and gives effect to the terms of each lease in effect, as of such date, including anyconcessions, abatements and other adjustments or allowances that have been granted to thetenants. The 2014 Disposition Center is excluded as of December 31, 2013.
(2) Centers under development and redevelopment are excluded from average base rents. The leasesfor Paradise Valley Mall were excluded for the year ended December 31, 2013. The leases for TheShops at Atlas Park and Southridge Center were excluded for the years ended December 31, 2012and 2011. The leases for Santa Monica Place were excluded for the years ended December 31,2010 and 2009. The leases for The Market at Estrella Falls were excluded for the year endedDecember 31, 2009. The leases for Valley View Center were excluded for the years endedDecember 31, 2011 and 2010.
(3) The average base rent per square foot on leases executed during the year represents the actualrent paid on a per square foot basis during the first twelve months of the lease.
(4) The average base rent per square foot on leases expiring during the year represents the actual rentto be paid on a per square foot basis during the final twelve months of the lease.
Cost of Occupancy:
A major factor contributing to tenant profitability is cost of occupancy, which consists of tenantoccupancy costs charged by the Company. Tenant expenses included in this calculation are minimumrents, percentage rents and recoverable expenditures, which consist primarily of property operatingexpenses, real estate taxes and repair and maintenance expenditures. These tenant charges arecollectively referred to as tenant occupancy costs. These tenant occupancy costs are compared to tenantsales. A low cost of occupancy percentage shows more capacity for the Company to increase rents atthe time of lease renewal than a high cost of occupancy percentage. The following table summarizes
12

occupancy costs for Mall Store and Freestanding Store tenants in the Centers as a percentage of totalMall Store sales for the last five years:
For the Years Ended December 31,
2013(1) 2012 2011 2010 2009
Consolidated Centers:Minimum rents . . . . . . . . . . . . . . . . . . . . . . . . . . . . . . . . . . . . . . . 8.4% 8.1% 8.2% 8.6% 9.1%Percentage rents . . . . . . . . . . . . . . . . . . . . . . . . . . . . . . . . . . . . . . 0.4% 0.4% 0.5% 0.4% 0.4%Expense recoveries(2) . . . . . . . . . . . . . . . . . . . . . . . . . . . . . . . . . . 4.5% 4.2% 4.1% 4.4% 4.7%
13.3% 12.7% 12.8% 13.4% 14.2%
Unconsolidated Joint Venture Centers:Minimum rents . . . . . . . . . . . . . . . . . . . . . . . . . . . . . . . . . . . . . . . 8.8% 8.9% 9.1% 9.1% 9.4%Percentage rents . . . . . . . . . . . . . . . . . . . . . . . . . . . . . . . . . . . . . . 0.4% 0.4% 0.4% 0.4% 0.4%Expense recoveries(2) . . . . . . . . . . . . . . . . . . . . . . . . . . . . . . . . . . 4.0% 3.9% 3.9% 4.0% 4.3%
13.2% 13.2% 13.4% 13.5% 14.1%
(1) The 2014 Disposition Center is excluded for the year ended December 31, 2013.
(2) Represents real estate tax and common area maintenance charges.
Lease Expirations:
The following tables show scheduled lease expirations for Centers owned as of December 31, 2013,excluding the 2014 Disposition Center, for the next ten years, assuming that none of the tenantsexercise renewal options:
Mall Stores and Freestanding Stores under 10,000 square feet:
% of Total Ending BaseLeased GLA Rent per % of Base Rent
Number of Approximate Represented Square Foot RepresentedLeases GLA of Leases by Expiring of Expiring by Expiring
Year Ending December 31, Expiring Expiring(1) Leases(1) Leases(1) Leases(1)
Consolidated Centers:2014 . . . . . . . . . . . . . . . . . . . . . . . . . . . . . 456 892,318 12.56% $43.34 11.86%2015 . . . . . . . . . . . . . . . . . . . . . . . . . . . . . 384 852,883 12.00% $41.37 10.82%2016 . . . . . . . . . . . . . . . . . . . . . . . . . . . . . 378 838,069 11.79% $42.23 10.86%2017 . . . . . . . . . . . . . . . . . . . . . . . . . . . . . 378 905,778 12.74% $46.47 12.91%2018 . . . . . . . . . . . . . . . . . . . . . . . . . . . . . 354 813,975 11.45% $46.67 11.65%2019 . . . . . . . . . . . . . . . . . . . . . . . . . . . . . 270 661,291 9.30% $49.64 10.07%2020 . . . . . . . . . . . . . . . . . . . . . . . . . . . . . 187 422,984 5.95% $54.27 7.04%2021 . . . . . . . . . . . . . . . . . . . . . . . . . . . . . 205 505,431 7.11% $47.04 7.29%2022 . . . . . . . . . . . . . . . . . . . . . . . . . . . . . 169 402,224 5.66% $47.35 5.84%2023 . . . . . . . . . . . . . . . . . . . . . . . . . . . . . 186 394,415 5.55% $49.34 5.97%Unconsolidated Joint Venture Centers(at the Company’s pro rata share):2014 . . . . . . . . . . . . . . . . . . . . . . . . . . . . . 213 207,826 11.33% $65.42 11.63%2015 . . . . . . . . . . . . . . . . . . . . . . . . . . . . . 196 219,571 11.97% $67.28 12.64%2016 . . . . . . . . . . . . . . . . . . . . . . . . . . . . . 181 202,350 11.03% $62.68 10.85%2017 . . . . . . . . . . . . . . . . . . . . . . . . . . . . . 139 182,321 9.94% $59.91 9.35%2018 . . . . . . . . . . . . . . . . . . . . . . . . . . . . . 155 181,013 9.87% $64.95 10.06%2019 . . . . . . . . . . . . . . . . . . . . . . . . . . . . . 113 122,533 6.68% $72.94 7.65%2020 . . . . . . . . . . . . . . . . . . . . . . . . . . . . . 113 145,147 7.91% $67.72 8.41%2021 . . . . . . . . . . . . . . . . . . . . . . . . . . . . . 124 169,923 9.27% $58.53 8.51%2022 . . . . . . . . . . . . . . . . . . . . . . . . . . . . . 95 113,481 6.19% $62.79 6.10%2023 . . . . . . . . . . . . . . . . . . . . . . . . . . . . . 94 155,813 8.50% $55.11 7.35%
13

Big Boxes and Anchors:
% of TotalLeased Ending Base % of Base
Approximate GLA Rent per RentNumber of GLA of Represented Square Foot Represented
Leases Leases by Expiring of Expiring by ExpiringYear Ending December 31, Expiring Expiring(1) Leases(1) Leases(1) Leases(1)
Consolidated Centers:2014 . . . . . . . . . . . . . . . . . . . . . . . . . . . . . . . . 16 391,545 2.89% $15.99 4.01%2015 . . . . . . . . . . . . . . . . . . . . . . . . . . . . . . . . 24 697,592 5.15% $ 8.85 3.96%2016 . . . . . . . . . . . . . . . . . . . . . . . . . . . . . . . . 33 1,974,548 14.59% $ 5.77 7.30%2017 . . . . . . . . . . . . . . . . . . . . . . . . . . . . . . . . 38 1,581,327 11.68% $ 7.96 8.07%2018 . . . . . . . . . . . . . . . . . . . . . . . . . . . . . . . . 27 682,017 5.04% $10.94 4.78%2019 . . . . . . . . . . . . . . . . . . . . . . . . . . . . . . . . 30 1,028,006 7.59% $11.34 7.47%2020 . . . . . . . . . . . . . . . . . . . . . . . . . . . . . . . . 24 705,029 5.21% $12.23 5.53%2021 . . . . . . . . . . . . . . . . . . . . . . . . . . . . . . . . 27 1,026,974 7.59% $13.91 9.16%2022 . . . . . . . . . . . . . . . . . . . . . . . . . . . . . . . . 23 883,959 6.53% $16.03 9.08%2023 . . . . . . . . . . . . . . . . . . . . . . . . . . . . . . . . 23 958,164 7.08% $13.61 8.36%Unconsolidated Joint Venture Centers (at theCompany’s pro rata share):2014 . . . . . . . . . . . . . . . . . . . . . . . . . . . . . . . . 8 99,868 2.79% $17.82 3.39%2015 . . . . . . . . . . . . . . . . . . . . . . . . . . . . . . . . 19 406,686 11.38% $11.38 8.81%2016 . . . . . . . . . . . . . . . . . . . . . . . . . . . . . . . . 13 288,867 8.08% $10.71 5.89%2017 . . . . . . . . . . . . . . . . . . . . . . . . . . . . . . . . 10 181,289 5.07% $15.25 5.26%2018 . . . . . . . . . . . . . . . . . . . . . . . . . . . . . . . . 15 303,412 8.49% $ 7.26 4.19%2019 . . . . . . . . . . . . . . . . . . . . . . . . . . . . . . . . 12 215,173 6.02% $21.14 8.66%2020 . . . . . . . . . . . . . . . . . . . . . . . . . . . . . . . . 17 720,013 20.15% $12.31 16.87%2021 . . . . . . . . . . . . . . . . . . . . . . . . . . . . . . . . 9 129,716 3.63% $21.36 5.27%2022 . . . . . . . . . . . . . . . . . . . . . . . . . . . . . . . . 8 123,024 3.44% $24.53 5.74%2023 . . . . . . . . . . . . . . . . . . . . . . . . . . . . . . . . 11 120,608 3.37% $41.70 9.57%
(1) The ending base rent per square foot on leases expiring during the period represents the final yearminimum rent, on a cash basis, for tenant leases expiring during the year. Currently, 68% of leaseshave provisions for future consumer price index increases that are not reflected in ending baserent. The leases for Paradise Valley Mall were excluded as this property is under redevelopment.
Anchors:
Anchors have traditionally been a major factor in the public’s identification with RegionalShopping Centers. Anchors are generally department stores whose merchandise appeals to a broadrange of shoppers. Although the Centers receive a smaller percentage of their operating income fromAnchors than from Mall Stores and Freestanding Stores, strong Anchors play an important part inmaintaining customer traffic and making the Centers desirable locations for Mall Store andFreestanding Store tenants.
Anchors either own their stores, the land under them and in some cases adjacent parking areas, orenter into long-term leases with an owner at rates that are lower than the rents charged to tenants ofMall Stores and Freestanding Stores. Each Anchor that owns its own store and certain Anchors thatlease their stores enter into reciprocal easement agreements with the owner of the Center covering,among other things, operational matters, initial construction and future expansion.
Anchors accounted for approximately 6.8% of the Company’s total rents for the year endedDecember 31, 2013.
14

The following table identifies each Anchor, each parent company that owns multiple Anchors andthe number of square feet owned or leased by each such Anchor or parent company in the Company’sportfolio, excluding the 2014 Disposition Center, at December 31, 2013.
Number of Total GLAAnchor GLA Owned GLA Leased Occupied by
Name Stores by Anchor by Anchor Anchor
Macy’s Inc.Macy’s . . . . . . . . . . . . . . . . . . . . . . . . . . . . . . . . . . . . . . 45 5,041,000 2,683,000 7,724,000Bloomingdale’s . . . . . . . . . . . . . . . . . . . . . . . . . . . . . . . . . 2 — 355,000 355,000
47 5,041,000 3,038,000 8,079,000Sears . . . . . . . . . . . . . . . . . . . . . . . . . . . . . . . . . . . . . . . . 31 2,754,000 1,598,000 4,352,000JCPenney . . . . . . . . . . . . . . . . . . . . . . . . . . . . . . . . . . . . . 30 1,744,000 2,360,000 4,104,000Dillard’s . . . . . . . . . . . . . . . . . . . . . . . . . . . . . . . . . . . . . . 16 2,488,000 257,000 2,745,000Nordstrom . . . . . . . . . . . . . . . . . . . . . . . . . . . . . . . . . . . . . 13 720,000 1,477,000 2,197,000Target . . . . . . . . . . . . . . . . . . . . . . . . . . . . . . . . . . . . . . . . 9 728,000 453,000 1,181,000Forever 21 . . . . . . . . . . . . . . . . . . . . . . . . . . . . . . . . . . . . . 8 155,000 658,000 813,000The Bon-Ton Stores, Inc.
Younkers . . . . . . . . . . . . . . . . . . . . . . . . . . . . . . . . . . . . 3 — 317,000 317,000Bon-Ton, The . . . . . . . . . . . . . . . . . . . . . . . . . . . . . . . . . . 1 — 71,000 71,000Herberger’s . . . . . . . . . . . . . . . . . . . . . . . . . . . . . . . . . . . 1 188,000 — 188,000
5 188,000 388,000 576,000Kohl’s . . . . . . . . . . . . . . . . . . . . . . . . . . . . . . . . . . . . . . . . 5 89,000 356,000 445,000Hudson Bay Company
Lord & Taylor . . . . . . . . . . . . . . . . . . . . . . . . . . . . . . . . . 3 121,000 199,000 320,000Saks Fifth Avenue . . . . . . . . . . . . . . . . . . . . . . . . . . . . . . 1 — 92,000 92,000
4 121,000 291,000 412,000Home Depot . . . . . . . . . . . . . . . . . . . . . . . . . . . . . . . . . . . 3 — 395,000 395,000Wal-Mart . . . . . . . . . . . . . . . . . . . . . . . . . . . . . . . . . . . . . . 2 165,000 173,000 338,000Costco . . . . . . . . . . . . . . . . . . . . . . . . . . . . . . . . . . . . . . . 2 — 321,000 321,000Dick’s Sporting Goods . . . . . . . . . . . . . . . . . . . . . . . . . . . . . 3 — 257,000 257,000Belk . . . . . . . . . . . . . . . . . . . . . . . . . . . . . . . . . . . . . . . . . 3 — 201,000 201,000Neiman Marcus . . . . . . . . . . . . . . . . . . . . . . . . . . . . . . . . . . 2 — 188,000 188,000Von Maur . . . . . . . . . . . . . . . . . . . . . . . . . . . . . . . . . . . . . 2 187,000 — 187,000Burlington Coat Factory . . . . . . . . . . . . . . . . . . . . . . . . . . . . 2 187,000 — 187,000La Curacao . . . . . . . . . . . . . . . . . . . . . . . . . . . . . . . . . . . . 1 — 165,000 165,000Boscov’s . . . . . . . . . . . . . . . . . . . . . . . . . . . . . . . . . . . . . . 1 — 161,000 161,000BJ’s Wholesale Club . . . . . . . . . . . . . . . . . . . . . . . . . . . . . . . 1 — 123,000 123,000Lowe’s . . . . . . . . . . . . . . . . . . . . . . . . . . . . . . . . . . . . . . . 1 — 114,000 114,000Mercado de los Cielos . . . . . . . . . . . . . . . . . . . . . . . . . . . . . 1 — 78,000 78,000L.L. Bean . . . . . . . . . . . . . . . . . . . . . . . . . . . . . . . . . . . . . 1 — 76,000 76,000Best Buy . . . . . . . . . . . . . . . . . . . . . . . . . . . . . . . . . . . . . . 1 66,000 — 66,000Des Moines Area Community College . . . . . . . . . . . . . . . . . . . 1 64,000 — 64,000Barneys New York . . . . . . . . . . . . . . . . . . . . . . . . . . . . . . . . 1 — 60,000 60,000Sports Authority . . . . . . . . . . . . . . . . . . . . . . . . . . . . . . . . . 1 — 52,000 52,000Bealls . . . . . . . . . . . . . . . . . . . . . . . . . . . . . . . . . . . . . . . . 1 — 40,000 40,000Vacant Anchors(1) . . . . . . . . . . . . . . . . . . . . . . . . . . . . . . . . 6 — 706,000 706,000
204 14,697,000 13,986,000 28,683,000Anchors at Centers not owned by the Company(2):Forever 21 . . . . . . . . . . . . . . . . . . . . . . . . . . . . . . . . . . . . . 4 — 316,000 316,000Burlington Coat Factory . . . . . . . . . . . . . . . . . . . . . . . . . . . . 1 — 85,000 85,000Kohl’s . . . . . . . . . . . . . . . . . . . . . . . . . . . . . . . . . . . . . . . . 1 — 83,000 83,000
Total . . . . . . . . . . . . . . . . . . . . . . . . . . . . . . . . . . . . . . . . 210 14,697,000 14,470,000 29,167,000
(1) The Company is currently seeking replacement tenants and/or contemplating redevelopment opportunities for these vacantsites. The Company continues to collect rent under terms of an agreement on one of these vacant locations.
(2) The Company owns a portfolio of 14 stores located at shopping centers not owned by the Company. Of these 14 stores,four have been leased to Forever 21, one has been leased to Burlington Coat Factory, one has been leased to Kohl’s andeight have been leased for non-Anchor usage.
15

Environmental Matters
Each of the Centers has been subjected to an Environmental Site Assessment—Phase I (whichinvolves review of publicly available information and general property inspections, but does not involvesoil sampling or ground water analysis) completed by an environmental consultant.
Based on these assessments, and on other information, the Company is aware of the followingenvironmental issues, which may result in potential environmental liability and cause the Company toincur costs in responding to these liabilities or in other costs associated with future investigation orremediation:
• Asbestos. The Company has conducted asbestos-containing materials (‘‘ACM’’) surveys at variouslocations within the Centers. The surveys indicate that ACMs are present or suspected in certainareas, primarily vinyl floor tiles, mastics, roofing materials, drywall tape and joint compounds.The identified ACMs are generally non-friable, in good condition, and possess low probabilitiesfor disturbance. At certain Centers where ACMs are present or suspected, however, someACMs have been or may be classified as ‘‘friable,’’ and ultimately may require removal undercertain conditions. The Company has developed and implemented an operations andmaintenance (‘‘O&M’’) plan to manage ACMs in place.
• Underground Storage Tanks. Underground storage tanks (‘‘USTs’’) are or were present at certainCenters, often in connection with tenant operations at gasoline stations or automotive tire,battery and accessory service centers located at such Centers. USTs also may be or have beenpresent at properties neighboring certain Centers. Some of these tanks have either leaked or aresuspected to have leaked. Where leakage has occurred, investigation, remediation, andmonitoring costs may be incurred by the Company if responsible current or former tenants, orother responsible parties, are unavailable to pay such costs.
• Chlorinated Hydrocarbons. The presence of chlorinated hydrocarbons such as perchloroethylene(‘‘PCE’’) and its degradation byproducts have been detected at certain Centers, often inconnection with tenant dry cleaning operations. Where PCE has been detected, the Companymay incur investigation, remediation and monitoring costs if responsible current or formertenants, or other responsible parties, are unavailable to pay such costs.
See ‘‘Item 1A. Risk Factors—Possible environmental liabilities could adversely affect us.’’
Insurance
Each of the Centers has comprehensive liability, fire, extended coverage and rental loss insurancewith insured limits customarily carried for similar properties. The Company does not insure certaintypes of losses (such as losses from wars) because they are either uninsurable or not economicallyinsurable. In addition, while the Company or the relevant joint venture, as applicable, carries specificearthquake insurance on the Centers located in California, the policies are subject to a deductibleequal to 5% of the total insured value of each Center, a $100,000 per occurrence minimum and acombined annual aggregate loss limit of $150 million on these Centers. The Company or the relevantjoint venture, as applicable, carries specific earthquake insurance on the Centers located in the PacificNorthwest and in the New Madrid seismic zone. However, the policies are subject to a deductible equalto 2% of the total insured value of each Center, a $50,000 per occurrence minimum and a combinedannual aggregate loss limit of $200 million on these Centers. While the Company or the relevant jointventure also carries terrorism insurance on the Centers, the policies are subject to a $50,000 deductibleand a combined annual aggregate loss limit of $800 million. Each Center has environmental insurancecovering eligible third-party losses, remediation and non-owned disposal sites, subject to a $100,000deductible and a $50 million three-year aggregate loss limit. Some environmental losses are not coveredby this insurance because they are uninsurable or not economically insurable. Furthermore, the
16
Company carries title insurance on substantially all of the Centers for generally less than their fullvalue. The Terrorism Risk Insurance Act (or TRIA), which creates a federally-funded backstop forterrorism-related insurance claims, is set to expire on December 31, 2014. Although it is expected thatTRIA will be extended by Congress, if TRIA expires, then the number of insurers offering terrorisminsurance will likely decrease and/or the cost to purchase terrorism insurance will increase.
Qualification as a Real Estate Investment Trust
The Company elected to be taxed as a REIT under the Internal Revenue Code of 1986, asamended (the ‘‘Code’’), commencing with its first taxable year ended December 31, 1994, and intendsto conduct its operations so as to continue to qualify as a REIT under the Code. As a REIT, theCompany generally will not be subject to federal and state income taxes on its net taxable income thatit currently distributes to stockholders. Qualification and taxation as a REIT depends on theCompany’s ability to meet certain dividend distribution tests, share ownership requirements and variousqualification tests prescribed in the Code.
Employees
As of December 31, 2013, the Company had approximately 1,143 employees, of whichapproximately 980 were full-time. The Company believes that relations with its employees are good.
Seasonality
For a discussion of the extent to which the Company’s business may be seasonal, see ‘‘Item 7.Management’s Discussion and Analysis of Financial Condition and Results of Operations—Management’s Overview and Summary—Seasonality.’’
Available Information; Website Disclosure; Corporate Governance Documents
The Company’s corporate website address is www.macerich.com. The Company makes availablefree-of-charge through this website its reports on Forms 10-K, 10-Q and 8-K and all amendmentsthereto, as soon as reasonably practicable after the reports have been filed with, or furnished to, theSEC. These reports are available under the heading ‘‘Investing—Financial Information—SEC Filings’’,through a free hyperlink to a third-party service. Information provided on our website is notincorporated by reference into this Form 10-K.
The following documents relating to Corporate Governance are available on the Company’swebsite at www.macerich.com under ‘‘Investing—Corporate Governance’’:
Guidelines on Corporate GovernanceCode of Business Conduct and EthicsCode of Ethics for CEO and Senior Financial OfficersAudit Committee CharterCompensation Committee CharterExecutive Committee CharterNominating and Corporate Governance Committee Charter
You may also request copies of any of these documents by writing to:
Attention: Corporate SecretaryThe Macerich Company401 Wilshire Blvd., Suite 700Santa Monica, CA 90401
17

ITEM 1A. RISK FACTORS
The following factors could cause our actual results to differ materially from those contained inforward-looking statements made in this Annual Report on Form 10-K and presented elsewhere by ourmanagement from time to time. This list should not be considered to be a complete statement of allpotential risks or uncertainties as it does not describe additional risks of which we are not presently aware orthat we do not currently consider material. We may update our risk factors from time to time in our futureperiodic reports. Any of these factors may have a material adverse effect on our business, financialcondition, operating results and cash flows. For purposes of this ‘‘Risk Factor’’ section, Centers whollyowned by us are referred to as ‘‘Wholly Owned Centers’’ and Centers that are partly but not wholly ownedby us are referred to as ‘‘Joint Venture Centers.’’
RISKS RELATED TO OUR BUSINESS AND PROPERTIES
We invest primarily in shopping centers, which are subject to a number of significant risks that are beyondour control.
Real property investments are subject to varying degrees of risk that may affect the ability of ourCenters to generate sufficient revenues to meet operating and other expenses, including debt service,lease payments, capital expenditures and tenant improvements, and to make distributions to us and ourstockholders. A number of factors may decrease the income generated by the Centers, including:
• the national economic climate;
• the regional and local economy (which may be negatively impacted by rising unemployment,declining real estate values, increased foreclosures, higher taxes, plant closings, industryslowdowns, union activity, adverse weather conditions, natural disasters and other factors);
• local real estate conditions (such as an oversupply of, or a reduction in demand for, retail spaceor retail goods, decreases in rental rates, declining real estate values and the availability andcreditworthiness of current and prospective tenants);
• decreased levels of consumer spending, consumer confidence, and seasonal spending (especiallyduring the holiday season when many retailers generate a disproportionate amount of theirannual sales);
• negative perceptions by retailers or shoppers of the safety, convenience and attractiveness of aCenter;
• acts of violence, including terrorist activities; and
• increased costs of maintenance, insurance and operations (including real estate taxes).
Income from shopping center properties and shopping center values are also affected by applicablelaws and regulations, including tax, environmental, safety and zoning laws.
A significant percentage of our Centers are geographically concentrated and, as a result, are sensitive to localeconomic and real estate conditions.
A significant percentage of our Centers are located in California and Arizona, and ten Centers inthe aggregate are located in New York, New Jersey and Connecticut. To the extent that weak economicor real estate conditions or other factors affect California, Arizona, New York, New Jersey orConnecticut (or their respective regions) more severely than other areas of the country, our financialperformance could be negatively impacted.
18

We are in a competitive business.
There are numerous owners and developers of real estate that compete with us in our trade areas.There are eight other publicly traded mall companies, a number of publicly traded shopping centercompanies and several large private mall companies in the United States, any of which under certaincircumstances could compete against us for an acquisition of an Anchor or a tenant. In addition, otherREITs, private real estate companies or investors, and financial buyers compete with us in terms ofacquisitions. This results in competition both for the acquisition of properties or centers and for tenantsor Anchors to occupy space. Competition for property acquisitions may result in increased purchaseprices and may adversely affect our ability to make suitable property acquisitions on favorable terms.The existence of competing shopping centers could have a material adverse impact on our ability tolease space and on the level of rents that can be achieved. There is also increasing competition fromother retail formats and technologies, such as lifestyle centers, power centers, outlet centers, Internetshopping, home shopping networks, catalogs, telemarketing and discount shopping clubs that couldadversely affect our revenues.
We may be unable to renew leases, lease vacant space or re-let space as leases expire on favorable terms or atall, which could adversely affect our financial condition and results of operations.
There are no assurances that our leases will be renewed or that vacant space in our Centers willbe re-let at net effective rental rates equal to or above the current average net effective rental rates orthat substantial rent abatements, tenant improvements, early termination rights or below-marketrenewal options will not be offered to attract new tenants or retain existing tenants. If the rental ratesat our Centers decrease, if our existing tenants do not renew their leases or if we do not re-let asignificant portion of our available space and space for which leases will expire, our financial conditionand results of operations could be adversely affected.
If Anchors or other significant tenants experience a downturn in their business, close or sell stores or declarebankruptcy, our financial condition and results of operations could be adversely affected.
Our financial condition and results of operations could be adversely affected if a downturn in thebusiness of, or the bankruptcy or insolvency of, an Anchor or other significant tenant leads them toclose retail stores or terminate their leases after seeking protection under the bankruptcy laws fromtheir creditors, including us as lessor. In recent years a number of companies in the retail industry,including some of our tenants, have declared bankruptcy or have gone out of business. We may beunable to re-let stores vacated as a result of voluntary closures or the bankruptcy of a tenant.Furthermore, if the store sales of retailers operating at our Centers decline significantly due to adverseeconomic conditions or for any other reason, tenants might be unable to pay their minimum rents orexpense recovery charges. In the event of a default by a lessee, the affected Center may experiencedelays and costs in enforcing its rights as lessor.
In addition, Anchors and/or tenants at one or more Centers might terminate their leases as aresult of mergers, acquisitions, consolidations or dispositions in the retail industry. The sale of anAnchor or store to a less desirable retailer may reduce occupancy levels, customer traffic and rentalincome. Depending on economic conditions, there is also a risk that Anchors or other significanttenants may sell stores operating in our Centers or consolidate duplicate or geographically overlappingstore locations. Store closures by an Anchor and/or a significant number of tenants may allow otherAnchors and/or certain other tenants to terminate their leases, receive reduced rent and/or ceaseoperating their stores at the Center or otherwise adversely affect occupancy at the Center.
19

Our real estate acquisition, development and redevelopment strategies may not be successful.
Our historical growth in revenues, net income and funds from operations has been in part tied tothe acquisition, development and redevelopment of shopping centers. Many factors, including theavailability and cost of capital, our total amount of debt outstanding, our ability to obtain financing onattractive terms, if at all, interest rates and the availability of attractive acquisition targets, amongothers, will affect our ability to acquire, develop and redevelop additional properties in the future. Wemay not be successful in pursuing acquisition opportunities, and newly acquired properties may notperform as well as expected. Expenses arising from our efforts to complete acquisitions, develop andredevelop properties or increase our market penetration may have a material adverse effect on ourbusiness, financial condition and results of operations. We face competition for acquisitions primarilyfrom other REITs, as well as from private real estate companies and financial buyers. Some of ourcompetitors have greater financial and other resources. Increased competition for shopping centeracquisitions may result in increased purchase prices and may impact adversely our ability to acquireadditional properties on favorable terms. We cannot guarantee that we will be able to implement ourgrowth strategy successfully or manage our expanded operations effectively and profitably.
We may not be able to achieve the anticipated financial and operating results from newly acquiredassets. Some of the factors that could affect anticipated results are:
• our ability to integrate and manage new properties, including increasing occupancy rates andrents at such properties;
• the disposal of non-core assets within an expected time frame; and
• our ability to raise long-term financing to implement a capital structure at a cost of capitalconsistent with our business strategy.
Our business strategy also includes the selective development and construction of retail properties.Any development, redevelopment and construction activities that we may undertake will be subject tothe risks of real estate development, including lack of financing, construction delays, environmentalrequirements, budget overruns, sunk costs and lease-up. Furthermore, occupancy rates and rents at anewly completed property may not be sufficient to make the property profitable. Real estatedevelopment activities are also subject to risks relating to the inability to obtain, or delays in obtaining,all necessary zoning, land-use, building, and occupancy and other required governmental permits andauthorizations. If any of the above events occur, our ability to pay dividends to our stockholders andservice our indebtedness could be adversely affected.
We may be unable to sell properties at the time we desire and on favorable terms.
Investments in real estate are relatively illiquid, which limits our ability to adjust our portfolio inresponse to changes in economic or other conditions. Moreover, there are some limitations underfederal income tax laws applicable to REITs that limit our ability to sell assets. In addition, because ourproperties are generally mortgaged to secure our debts, we may not be able to obtain a release of alien on a mortgaged property without the payment of the associated debt and/or a substantialprepayment penalty, which restricts our ability to dispose of a property, even though the sale mightotherwise be desirable. Furthermore, the number of prospective buyers interested in purchasingshopping centers is limited. Therefore, if we want to sell one or more of our Centers, we may not beable to dispose of it in the desired time period and may receive less consideration than we originallyinvested in the Center.
Possible environmental liabilities could adversely affect us.
Under various federal, state and local environmental laws, ordinances and regulations, a current orprevious owner or operator of real property may be liable for the costs of removal or remediation of
20

hazardous or toxic substances on, under or in that real property. These laws often impose liabilitywhether or not the owner or operator knew of, or was responsible for, the presence of hazardous ortoxic substances. The costs of investigation, removal or remediation of hazardous or toxic substancesmay be substantial. In addition, the presence of hazardous or toxic substances, or the failure to remedyenvironmental hazards properly, may adversely affect the owner’s or operator’s ability to sell or rentaffected real property or to borrow money using affected real property as collateral.
Persons or entities that arrange for the disposal or treatment of hazardous or toxic substances mayalso be liable for the costs of removal or remediation of hazardous or toxic substances at the disposalor treatment facility, whether or not that facility is owned or operated by the person or entity arrangingfor the disposal or treatment of hazardous or toxic substances. Laws exist that impose liability forrelease of asbestos containing materials (‘‘ACMs’’) into the air, and third parties may seek recoveryfrom owners or operators of real property for personal injury associated with exposure to ACMs. Inconnection with our ownership, operation, management, development and redevelopment of theCenters, or any other centers or properties we acquire in the future, we may be potentially liable underthese laws and may incur costs in responding to these liabilities.
Some of our properties are subject to potential natural or other disasters.
Some of our Centers are located in areas that are subject to natural disasters, including ourCenters in California or in other areas with higher risk of earthquakes, our Centers in flood plains orin areas that may be adversely affected by tornados, as well as our Centers in coastal regions that maybe adversely affected by increases in sea levels or in the frequency or severity of hurricanes, tropicalstorms or other severe weather conditions. The occurrence of natural disasters can delay redevelopmentor development projects, increase investment costs to repair or replace damaged properties, increasefuture property insurance costs and negatively impact the tenant demand for lease space. If insurance isunavailable to us or is unavailable on acceptable terms, or our insurance is not adequate to cover lossesfrom these events, our financial condition and results of operations could be adversely affected.
Uninsured losses could adversely affect our financial condition.
Each of our Centers has comprehensive liability, fire, extended coverage and rental loss insurancewith insured limits customarily carried for similar properties. We do not insure certain types of losses(such as losses from wars), because they are either uninsurable or not economically insurable. Inaddition, while we or the relevant joint venture, as applicable, carry specific earthquake insurance onthe Centers located in California, the policies are subject to a deductible equal to 5% of the totalinsured value of each Center, a $100,000 per occurrence minimum and a combined annual aggregateloss limit of $150 million on these Centers. We or the relevant joint venture, as applicable, carryspecific earthquake insurance on the Centers located in the Pacific Northwest and in the New MadridSeismic Zone. However, the policies are subject to a deductible equal to 2% of the total insured valueof each Center, a $50,000 per occurrence minimum and a combined annual aggregate loss limit of$200 million on these Centers. While we or the relevant joint venture also carry terrorism insurance onthe Centers, the policies are subject to a $50,000 deductible and a combined annual aggregate loss limitof $800 million. Each Center has environmental insurance covering eligible third-party losses,remediation and non-owned disposal sites, subject to a $100,000 deductible and a $50 million three-yearaggregate loss limit. Some environmental losses are not covered by this insurance because they areuninsurable or not economically insurable. Furthermore, we carry title insurance on substantially all ofthe Centers for generally less than their full value. The Terrorism Risk Insurance Act (or TRIA), whichcreates a federally-funded backstop for terrorism-related insurance claims, is set to expire onDecember 31, 2014. Although it is expected that TRIA will be extended by Congress, if TRIA expires,then the number of insurers offering terrorism insurance will likely decrease and/or the cost topurchase terrorism insurance will increase.
21

If an uninsured loss or a loss in excess of insured limits occurs, we could lose all or a portion ofthe capital we have invested in a property, as well as the anticipated future revenue from the property,but may remain obligated for any mortgage debt or other financial obligations related to the property.
Inflation may adversely affect our financial condition and results of operations.
If inflation increases in the future, we may experience any or all of the following:
• Difficulty in replacing or renewing expiring leases with new leases at higher rents;
• Decreasing tenant sales as a result of decreased consumer spending which could adversely affectthe ability of our tenants to meet their rent obligations and/or result in lower percentage rents;and
• An inability to receive reimbursement from our tenants for their share of certain operatingexpenses, including common area maintenance, real estate taxes and insurance.
Inflation also poses a risk to us due to the possibility of future increases in interest rates. Suchincreases would adversely impact us due to our outstanding floating-rate debt as well as result in higherinterest rates on new fixed-rate debt. In certain cases, we may limit our exposure to interest ratefluctuations related to a portion of our floating-rate debt by the use of interest rate cap and swapagreements. Such agreements, subject to current market conditions, allow us to replace floating-ratedebt with fixed-rate debt in order to achieve our desired ratio of floating-rate to fixed-rate debt.However, in an increasing interest rate environment the fixed rates we can obtain with suchreplacement fixed-rate cap and swap agreements or the fixed-rate on new debt will also continue toincrease.
We have substantial debt that could affect our future operations.
Our total outstanding loan indebtedness at December 31, 2013 was $6.0 billion (consisting of$4.6 billion of consolidated debt, less $0.3 billion attributable to noncontrolling interests, plus$1.7 billion of our pro rata share of unconsolidated joint venture debt). Approximately $119.0 millionof such indebtedness (at our pro rata share) matures in 2014. As a result of this substantialindebtedness, we are required to use a material portion of our cash flow to service principal andinterest on our debt, which limits the amount of cash available for other business opportunities. We arealso subject to the risks normally associated with debt financing, including the risk that our cash flowfrom operations will be insufficient to meet required debt service and that rising interest rates couldadversely affect our debt service costs. In addition, our use of interest rate hedging arrangements mayexpose us to additional risks, including that the counterparty to the arrangement may fail to honor itsobligations and that termination of these arrangements typically involves costs such as transaction feesor breakage costs. Furthermore, most of our Centers are mortgaged to secure payment of indebtedness,and if income from the Center is insufficient to pay that indebtedness, the Center could be foreclosedupon by the mortgagee resulting in a loss of income and a decline in our total asset value. CertainCenters also have debt that could become recourse debt to us if the Center is unable to discharge suchdebt obligation and, in certain circumstances, we may incur liability with respect to such debt greaterthan our legal ownership.
We are obligated to comply with financial and other covenants that could affect our operating activities.
Our unsecured credit facilities contain financial covenants, including interest coveragerequirements, as well as limitations on our ability to incur debt, make dividend payments and makecertain acquisitions. These covenants may restrict our ability to pursue certain business initiatives orcertain transactions that might otherwise be advantageous. In addition, failure to meet certain of these
22

financial covenants could cause an event of default under and/or accelerate some or all of suchindebtedness which could have a material adverse effect on us.
We depend on external financings for our growth and ongoing debt service requirements.
We depend primarily on external financings, principally debt financings and, in more limitedcircumstances, equity financings, to fund the growth of our business and to ensure that we can meetongoing maturities of our outstanding debt. Our access to financing depends on the willingness ofbanks, lenders and other institutions to lend to us based on their underwriting criteria which canfluctuate with market conditions and on conditions in the capital markets in general. In addition, levelsof market disruption and volatility could materially adversely impact our ability to access the capitalmarkets for equity financings. There are no assurances that we will continue to be able to obtain thefinancing we need for future growth or to meet our debt service as obligations mature, or that thefinancing will be available to us on acceptable terms, or at all. Any debt refinancing could also imposemore restrictive terms.
RISKS RELATED TO OUR ORGANIZATIONAL STRUCTURE
Certain individuals have substantial influence over the management of both us and the Operating Partnership,which may create conflicts of interest.
Under the limited partnership agreement of the Operating Partnership, we, as the sole generalpartner, are responsible for the management of the Operating Partnership’s business and affairs. Threeof the principals of the Operating Partnership serve as our executive officers and as members of ourboard of directors. Accordingly, these principals have substantial influence over our management andthe management of the Operating Partnership. As a result, certain decisions concerning our operationsor other matters affecting us may present conflicts of interest for these individuals.
Outside partners in Joint Venture Centers result in additional risks to our stockholders.
We own partial interests in property partnerships that own 24 Joint Venture Centers as well asseveral development sites. We may acquire partial interests in additional properties through jointventure arrangements. Investments in Joint Venture Centers involve risks different from those ofinvestments in Wholly Owned Centers.
We have fiduciary responsibilities to our partners that could affect decisions concerning the JointVenture Centers. Third parties in certain Joint Venture Centers (notwithstanding our majority legalownership) share control of major decisions relating to the Joint Venture Centers, including decisionswith respect to sales, refinancings and the timing and amount of additional capital contributions, as wellas decisions that could have an adverse impact on us.
In addition, we may lose our management and other rights relating to the Joint Venture Centers if:
• we fail to contribute our share of additional capital needed by the property partnerships; or
• we default under a partnership agreement for a property partnership or other agreementsrelating to the property partnerships or the Joint Venture Centers.
Our legal ownership interest in a joint venture vehicle may, at times, not equal our economicinterest in the entity because of various provisions in certain joint venture agreements regardingdistributions of cash flow based on capital account balances, allocations of profits and losses andpayments of preferred returns. As a result, our actual economic interest (as distinct from our legalownership interest) in certain of the Joint Venture Centers could fluctuate from time to time and maynot wholly align with our legal ownership interests. Substantially all of our joint venture agreementscontain rights of first refusal, buy-sell provisions, exit rights, default dilution remedies and/or other
23

break up provisions or remedies which are customary in real estate joint venture agreements and whichmay, positively or negatively, affect the ultimate realization of cash flow and/or capital or liquidationproceeds.
Our holding company structure makes us dependent on distributions from the Operating Partnership.
Because we conduct our operations through the Operating Partnership, our ability to service ourdebt obligations and pay dividends to our stockholders is strictly dependent upon the earnings and cashflows of the Operating Partnership and the ability of the Operating Partnership to make distributions tous. Under the Delaware Revised Uniform Limited Partnership Act, the Operating Partnership isprohibited from making any distribution to us to the extent that at the time of the distribution, aftergiving effect to the distribution, all liabilities of the Operating Partnership (other than somenon-recourse liabilities and some liabilities to the partners) exceed the fair value of the assets of theOperating Partnership. An inability to make cash distributions from the Operating Partnership couldjeopardize our ability to maintain qualification as a REIT.
An ownership limit and certain anti-takeover defenses could inhibit a change of control or reduce the value ofour common stock.
The Ownership Limit. In order for us to maintain our qualification as a REIT, not more than 50%in value of our outstanding stock (after taking into account options to acquire stock) may be owned,directly or indirectly, by five or fewer individuals (as defined in the Internal Revenue Code to includesome entities that would not ordinarily be considered ‘‘individuals’’) during the last half of a taxableyear. Our Charter restricts ownership of more than 5% (the ‘‘Ownership Limit’’) of the lesser of thenumber or value of our outstanding shares of stock by any single stockholder or a group ofstockholders (with limited exceptions for some holders of limited partnership interests in the OperatingPartnership, and their respective families and affiliated entities, including all three principals who serveas one of our executive officers and directors). In addition to enhancing preservation of our status as aREIT, the Ownership Limit may:
• have the effect of delaying, deferring or preventing a change in control of us or othertransaction without the approval of our board of directors, even if the change in control or othertransaction is in the best interest of our stockholders; and
• limit the opportunity for our stockholders to receive a premium for their common stock orpreferred stock that they might otherwise receive if an investor were attempting to acquire ablock of stock in excess of the Ownership Limit or otherwise effect a change in control of us.
Our board of directors, in its sole discretion, may waive or modify (subject to limitations) theOwnership Limit with respect to one or more of our stockholders, if it is satisfied that ownership inexcess of this limit will not jeopardize our status as a REIT.
Selected Provisions of our Charter, Bylaws and Maryland Law. Some of the provisions of ourCharter, bylaws and Maryland law may have the effect of delaying, deferring or preventing a third partyfrom making an acquisition proposal for us and may inhibit a change in control that some, or amajority, of our stockholders might believe to be in their best interest or that could give ourstockholders the opportunity to realize a premium over the then-prevailing market prices for ourshares. These provisions include the following:
• advance notice requirements for stockholder nominations of directors and stockholder proposalsto be considered at stockholder meetings;
• the obligation of the directors to consider a variety of factors (in addition to maximizingstockholder value) with respect to a proposed business combination or other change of controltransaction;
24

• the authority of the directors to classify or reclassify unissued shares and issue one or moreseries of common stock or preferred stock;
• the authority to create and issue rights entitling the holders thereof to purchase shares of stockor other securities or property from us; and
• limitations on the amendment of our Charter and bylaws, the change in control of us, and theliability of our directors and officers.
In addition, the Maryland General Corporation Law prohibits business combinations between aMaryland corporation and an interested stockholder (which includes any person who beneficially holds10% or more of the voting power of the corporation’s outstanding voting stock or any affiliate orassociate of ours who was the beneficial owner, directly or indirectly, of 10% or more of the votingpower of the corporation’s outstanding stock at any time within the two year period prior to the date inquestion) or its affiliates for five years following the most recent date on which the interestedstockholder became an interested stockholder and, after the five-year period, requires therecommendation of the board of directors and two supermajority stockholder votes to approve abusiness combination unless the stockholders receive a minimum price determined by the statute. Aspermitted by Maryland law, our Charter exempts from these provisions any business combinationbetween us and the principals and their respective affiliates and related persons. Maryland law alsoallows the board of directors to exempt particular business combinations before the interestedstockholder becomes an interested stockholder. Furthermore, a person is not an interested stockholderif the transaction by which he or she would otherwise have become an interested stockholder isapproved in advance by the board of directors.
The Maryland General Corporation Law also provides that the acquirer of certain levels of votingpower in electing directors of a Maryland corporation (one-tenth or more but less than one-third,one-third or more but less than a majority and a majority or more) is not entitled to vote the shares inexcess of the applicable threshold, unless voting rights for the shares are approved by holders oftwo-thirds of the disinterested shares or unless the acquisition of the shares has been specifically orgenerally approved or exempted from the statute by a provision in our Charter or bylaws adoptedbefore the acquisition of the shares. Our Charter exempts from these provisions voting rights of sharesowned or acquired by the principals and their respective affiliates and related persons. Our bylaws alsocontain a provision exempting from this statute any acquisition by any person of shares of our commonstock. There can be no assurance that this bylaw will not be amended or eliminated in the future. TheMaryland General Corporation Law and our Charter also contain supermajority voting requirementswith respect to our ability to amend our Charter, merge, or sell all or substantially all of our assets.Furthermore, the Maryland General Corporation Law permits our board of directors, withoutstockholder approval and regardless of what is currently provided in our Charter or bylaws, toimplement certain takeover defenses.
FEDERAL INCOME TAX RISKS
The tax consequences of the sale of some of the Centers and certain holdings of the principals may createconflicts of interest.
The principals will experience negative tax consequences if some of the Centers are sold. As aresult, the principals may not favor a sale of these Centers even though such a sale may benefit ourother stockholders. In addition, the principals may have different interests than our stockholdersbecause they are significant holders of the Operating Partnership.
25

If we were to fail to qualify as a REIT, we would have reduced funds available for distributions to ourstockholders.
We believe that we currently qualify as a REIT. No assurance can be given that we will remainqualified as a REIT. Qualification as a REIT involves the application of highly technical and complexInternal Revenue Code provisions for which there are only limited judicial or administrativeinterpretations. The complexity of these provisions and of the applicable income tax regulations isgreater in the case of a REIT structure like ours that holds assets in partnership form. Thedetermination of various factual matters and circumstances not entirely within our control, includingdeterminations by our partners in the Joint Venture Centers, may affect our continued qualification asa REIT. In addition, legislation, new regulations, administrative interpretations or court decisions couldsignificantly change the tax laws with respect to our qualification as a REIT or the U.S. federal incometax consequences of that qualification.
In addition, we currently hold certain of our properties through subsidiaries that have elected to betaxed as REITs and we may in the future determine that it is in our best interests to hold one or moreof our other properties through one or more subsidiaries that elect to be taxed as REITs. If any ofthese subsidiaries fails to qualify as a REIT for U.S. federal income tax purposes, then we may also failto qualify as a REIT for U.S. federal income tax purposes.
If in any taxable year we were to fail to qualify as a REIT, we will suffer the following negativeresults:
• we will not be allowed a deduction for distributions to stockholders in computing our taxableincome; and
• we will be subject to U.S. federal income tax on our taxable income at regular corporate rates.
In addition, if we were to lose our REIT status, we would be prohibited from qualifying as a REITfor the four taxable years following the year during which the qualification was lost, absent relief understatutory provisions. As a result, net income and the funds available for distributions to ourstockholders would be reduced for at least five years and the fair market value of our shares could bematerially adversely affected. Furthermore, the Internal Revenue Service could challenge our REITstatus for past periods. Such a challenge, if successful, could result in us owing a material amount oftax for prior periods. It is possible that future economic, market, legal, tax or other considerationsmight cause our board of directors to revoke our REIT election.
Even if we remain qualified as a REIT, we might face other tax liabilities that reduce our cashflow. Further, we might be subject to federal, state and local taxes on our income and property. Any ofthese taxes would decrease cash available for distributions to stockholders.
Complying with REIT requirements might cause us to forego otherwise attractive opportunities.
In order to qualify as a REIT for U.S. federal income tax purposes, we must satisfy testsconcerning, among other things, our sources of income, the nature of our assets, the amounts wedistribute to our stockholders and the ownership of our stock. We may also be required to makedistributions to our stockholders at disadvantageous times or when we do not have funds readilyavailable for distribution. Thus, compliance with REIT requirements may cause us to foregoopportunities we would otherwise pursue.
In addition, the REIT provisions of the Internal Revenue Code impose a 100% tax on incomefrom ‘‘prohibited transactions.’’ Prohibited transactions generally include sales of assets that constituteinventory or other property held for sale in the ordinary course of business, other than foreclosureproperty. This 100% tax could impact our desire to sell assets and other investments at otherwiseopportune times if we believe such sales could be considered prohibited transactions.
26

Complying with REIT requirements may force us to borrow or take other measures to make distributions toour stockholders.
As a REIT, we generally must distribute 90% of our annual taxable income (subject to certainadjustments) to our stockholders. From time to time, we might generate taxable income greater thanour net income for financial reporting purposes, or our taxable income might be greater than our cashflow available for distributions to our stockholders. If we do not have other funds available in thesesituations, we might be unable to distribute 90% of our taxable income as required by the REIT rules.In that case, we would need to borrow funds, liquidate or sell a portion of our properties orinvestments (potentially at disadvantageous or unfavorable prices), in certain limited cases distribute acombination of cash and stock (at our stockholders’ election but subject to an aggregate cash limitestablished by the Company) or find another alternative source of funds. These alternatives couldincrease our costs or reduce our equity. In addition, to the extent we borrow funds to pay distributions,the amount of cash available to us in future periods will be decreased by the amount of cash flow wewill need to service principal and interest on the amounts we borrow, which will limit cash flowavailable to us for other investments or business opportunities.
Tax legislative or regulatory action could adversely affect us or our investors.
In recent years, numerous legislative, judicial, and administrative changes have been made to theU.S. federal income tax laws applicable to investments similar to an investment in our stock. Additionalchanges to tax laws are likely to continue in the future, and we cannot assure you that any suchchanges will not adversely affect the taxation of us or our stockholders. Any such changes could havean adverse effect on an investment in our stock or on the market value or the resale potential of ourproperties.
ITEM 1B. UNRESOLVED STAFF COMMENTS
None.
27

ITEM 2. PROPERTIES
The following table sets forth certain information regarding the Centers and other locations thatare wholly owned or partly owned by the Company as of December 31, 2013, excluding the 2014Disposition Center.
Year of Year of PercentageOriginal Most Recent Mall and of Mall and Company
Company’s Name of Construction/ Expansion/ Total Freestanding Freestanding Non-Owned Owned SalesCount Ownership(1) Center/Location(2) Acquisition Renovation GLA(3) GLA GLA Leased Anchors(3) Anchors(3) PSF(4)
CONSOLIDATED CENTERS:
1 100% Arrowhead Towne Center 1993/2002 2004 1,198,000 390,000 96.8% Dillard’s, Dick’s Sporting $ 649Glendale, Arizona JCPenney, Goods,
Macy’s, Forever 21Sears
2 100% Capitola Mall(5) 1977/1995 1988 586,000 196,000 85.3% Macy’s, Kohl’s $ 326Capitola, California Sears,
Target
3 50.1% Chandler Fashion Center 2001/2002 — 1,321,000 636,000 97.5% Dillard’s, $ 567Chandler, Arizona Macy’s,
Nordstrom,Sears
4 100% Danbury Fair Mall 1986/2005 2010 1,272,000 583,000 96.6% JCPenney, Forever 21, $ 636Danbury, Connecticut Macy’s, Lord & Taylor
Sears
5 100% Deptford Mall 1975/2006 1990 1,040,000 344,000 96.7% JCPenney, Boscov’s $ 505Deptford, New Jersey Macy’s,
Sears
6 100% Desert Sky Mall 1981/2002 2007 891,000 280,000 89.2% Burlington Coat La Curacao, $ 270Phoenix, Arizona Factory, Mercado de los
Dillard’s, CielosSears
7 100% Eastland Mall(5) 1978/1998 1996 1,043,000 554,000 98.8% Dillard’s, JCPenney $ 395Evansville, Indiana Macy’s
8 60% Fashion Outlets of Chicago 2013/— — 528,000 528,000 95.4% — — (6)Rosemont, Illinois
9 100% Fashion Outlets of Niagara Falls 1982/2011 2009 525,000 525,000 94.6% — — $ 532USANiagara Falls, New York
10 100% Flagstaff Mall 1979/2002 2007 347,000 143,000 78.8% Dillard’s, JCPenney $ 310Flagstaff, Arizona Sears
11 100% FlatIron Crossing 2000/2002 2009 1,435,000 792,000 93.7% Dillard’s, Dick’s Sporting $ 525Broomfield, Colorado Macy’s, Goods
Nordstrom
12 50.1% Freehold Raceway Mall 1990/2005 2007 1,674,000 876,000 98.5% JCPenney, — $ 619Freehold, New Jersey Lord & Taylor,
Macy’s,Nordstrom,Sears
13 100% Fresno Fashion Fair 1970/1996 2006 967,000 406,000 96.8% Macy’s Women’s & Forever 21, $ 609Fresno, California Home JCPenney,
Macy’sMen’s &Children’s
14 100% Great Northern Mall(7) 1988/2005 — 895,000 565,000 95.5% Macy’s, Sears — $ 247Clay, New York
15 100% Green Acres Mall(5) 1956/2013 2007 1,787,000 743,000 93.4% — BJ’s Wholesale $ 541Valley Stream, New York Club,
JCPenney,Kohl’s,Macy’s,Macy’s Men’s/FurnitureGallery, Sears,Walmart
16 100% Kings Plaza Shopping Center(5) 1971/2012 2002 1,195,000 466,000 95.9% Macy’s Lowe’s, $ 675Brooklyn, New York Sears
17 100% La Cumbre Plaza(5) 1967/2004 1989 494,000 177,000 86.4% Macy’s Sears $ 396Santa Barbara, California
18 100% Lake Square Mall 1980/1998 1995 559,000 263,000 78.6% Target Belk, $ 251Leesburg, Florida JCPenney,
Sears
19 100% Northgate Mall 1964/1986 2010 720,000 250,000 97.9% — Kohl’s, $ 396San Rafael, California Macy’s,
Sears
28
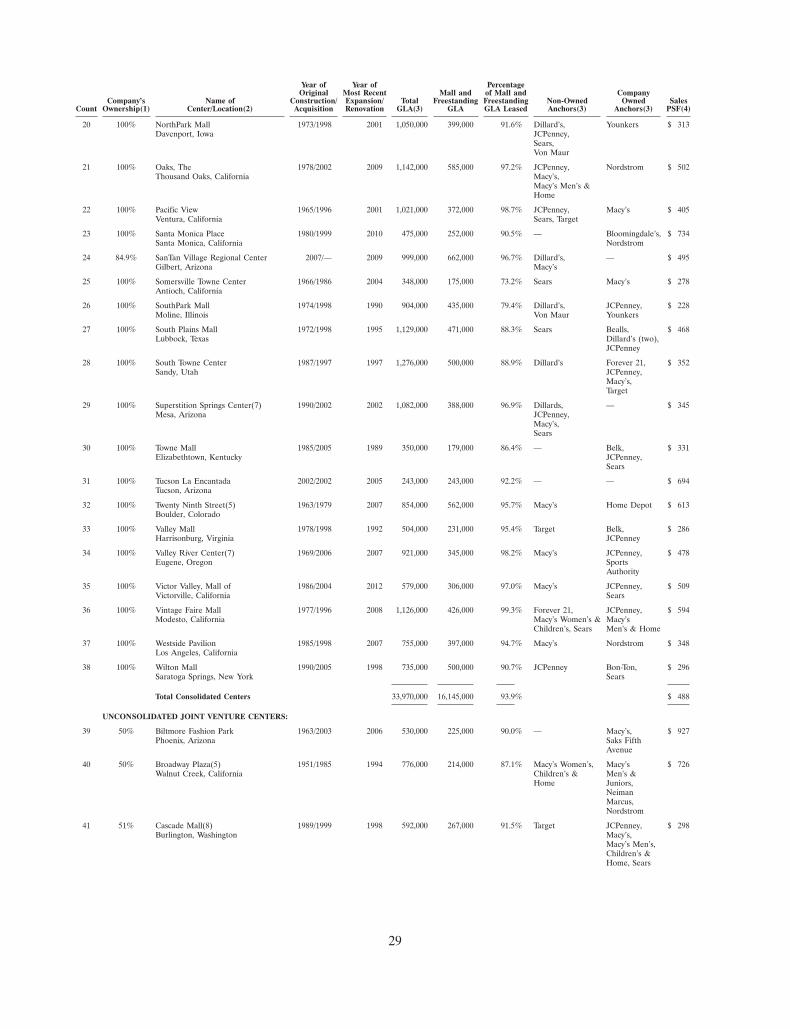
Year of Year of PercentageOriginal Most Recent Mall and of Mall and Company
Company’s Name of Construction/ Expansion/ Total Freestanding Freestanding Non-Owned Owned SalesCount Ownership(1) Center/Location(2) Acquisition Renovation GLA(3) GLA GLA Leased Anchors(3) Anchors(3) PSF(4)
20 100% NorthPark Mall 1973/1998 2001 1,050,000 399,000 91.6% Dillard’s, Younkers $ 313Davenport, Iowa JCPenney,
Sears,Von Maur
21 100% Oaks, The 1978/2002 2009 1,142,000 585,000 97.2% JCPenney, Nordstrom $ 502Thousand Oaks, California Macy’s,
Macy’s Men’s &Home
22 100% Pacific View 1965/1996 2001 1,021,000 372,000 98.7% JCPenney, Macy’s $ 405Ventura, California Sears, Target
23 100% Santa Monica Place 1980/1999 2010 475,000 252,000 90.5% — Bloomingdale’s, $ 734Santa Monica, California Nordstrom
24 84.9% SanTan Village Regional Center 2007/— 2009 999,000 662,000 96.7% Dillard’s, — $ 495Gilbert, Arizona Macy’s
25 100% Somersville Towne Center 1966/1986 2004 348,000 175,000 73.2% Sears Macy’s $ 278Antioch, California
26 100% SouthPark Mall 1974/1998 1990 904,000 435,000 79.4% Dillard’s, JCPenney, $ 228Moline, Illinois Von Maur Younkers
27 100% South Plains Mall 1972/1998 1995 1,129,000 471,000 88.3% Sears Bealls, $ 468Lubbock, Texas Dillard’s (two),
JCPenney
28 100% South Towne Center 1987/1997 1997 1,276,000 500,000 88.9% Dillard’s Forever 21, $ 352Sandy, Utah JCPenney,
Macy’s,Target
29 100% Superstition Springs Center(7) 1990/2002 2002 1,082,000 388,000 96.9% Dillards, — $ 345Mesa, Arizona JCPenney,
Macy’s,Sears
30 100% Towne Mall 1985/2005 1989 350,000 179,000 86.4% — Belk, $ 331Elizabethtown, Kentucky JCPenney,
Sears
31 100% Tucson La Encantada 2002/2002 2005 243,000 243,000 92.2% — — $ 694Tucson, Arizona
32 100% Twenty Ninth Street(5) 1963/1979 2007 854,000 562,000 95.7% Macy’s Home Depot $ 613Boulder, Colorado
33 100% Valley Mall 1978/1998 1992 504,000 231,000 95.4% Target Belk, $ 286Harrisonburg, Virginia JCPenney
34 100% Valley River Center(7) 1969/2006 2007 921,000 345,000 98.2% Macy’s JCPenney, $ 478Eugene, Oregon Sports
Authority
35 100% Victor Valley, Mall of 1986/2004 2012 579,000 306,000 97.0% Macy’s JCPenney, $ 509Victorville, California Sears
36 100% Vintage Faire Mall 1977/1996 2008 1,126,000 426,000 99.3% Forever 21, JCPenney, $ 594Modesto, California Macy’s Women’s & Macy’s
Children’s, Sears Men’s & Home
37 100% Westside Pavilion 1985/1998 2007 755,000 397,000 94.7% Macy’s Nordstrom $ 348Los Angeles, California
38 100% Wilton Mall 1990/2005 1998 735,000 500,000 90.7% JCPenney Bon-Ton, $ 296Saratoga Springs, New York Sears
Total Consolidated Centers 33,970,000 16,145,000 93.9% $ 488
UNCONSOLIDATED JOINT VENTURE CENTERS:
39 50% Biltmore Fashion Park 1963/2003 2006 530,000 225,000 90.0% — Macy’s, $ 927Phoenix, Arizona Saks Fifth
Avenue
40 50% Broadway Plaza(5) 1951/1985 1994 776,000 214,000 87.1% Macy’s Women’s, Macy’s $ 726Walnut Creek, California Children’s & Men’s &
Home Juniors,NeimanMarcus,Nordstrom
41 51% Cascade Mall(8) 1989/1999 1998 592,000 267,000 91.5% Target JCPenney, $ 298Burlington, Washington Macy’s,
Macy’s Men’s,Children’s &Home, Sears
29

Year of Year of PercentageOriginal Most Recent Mall and of Mall and Company
Company’s Name of Construction/ Expansion/ Total Freestanding Freestanding Non-Owned Owned SalesCount Ownership(1) Center/Location(2) Acquisition Renovation GLA(3) GLA GLA Leased Anchors(3) Anchors(3) PSF(4)
42 50.1% Corte Madera, Village at 1985/1998 2005 441,000 223,000 97.8% Macy’s, — $ 902Corte Madera, California Nordstrom
43 50% Inland Center(5)(7) 1966/2004 2004 933,000 205,000 97.9% Macy’s, Sears Forever 21 $ 417San Bernardino, California
44 50% Kierland Commons 1999/2005 2003 434,000 434,000 97.2% — — $ 637Scottsdale, Arizona
45 51% Lakewood Center(8) 1953/1975 2008 2,066,000 1,001,000 97.5% — Costco, $ 430Lakewood, California Forever 21,
Home Depot,JCPenney,Macy’s,Target
46 51% Los Cerritos Center(7)(8) 1971/1999 2010 1,309,000 514,000 97.3% Macy’s, Forever 21 $ 674Cerritos, California Nordstrom,
Sears
47 50% North Bridge, The Shops at(5) 1998/2008 — 675,000 415,000 97.3% — Nordstrom $ 906Chicago, Illinois
48 51% Queens Center(5) 1973/1995 2004 971,000 415,000 98.8% JCPenney, — $1,038Queens, New York Macy’s
49 50% Scottsdale Fashion Square 1961/2002 2009 1,723,000 753,000 94.5% Dillard’s Barneys New $ 694Scottsdale, Arizona York,
Macy’s,NeimanMarcus,Nordstrom
50 51% Stonewood Center(5)(8) 1953/1997 1991 935,000 361,000 96.1% — JCPenney, $ 522Downey, California Kohl’s,
Macy’s,Sears
51 50% Tysons Corner Center(5) 1968/2005 2005 1,957,000 1,072,000 98.2% — Bloomingdale’s, $ 824McLean, Virginia L.L. Bean,
Lord & Taylor,Macy’s,Nordstrom
52 51% Washington Square(8) 1974/1999 2005 1,443,000 508,000 92.2% Macy’s, Sears Dick’s Sporting $1,090Portland, Oregon Goods,
JCPenney,Nordstrom
53 19% West Acres 1972/1986 2001 972,000 419,000 99.8% Herberger’s, JCPenney, $ 527Fargo, North Dakota Macy’s Sears
Total Unconsolidated Joint Ventures 15,757,000 7,026,000 96.2% $ 717
REGIONAL SHOPPING CENTERS UNDER REDEVELOPMENT54 100% Paradise Valley Mall(9) 1979/2002 2009 1,145,000 365,000 (10) Dillard’s, Costco, Sears (10)
Phoenix, Arizona JCPenney,Macy’s
54 Total Regional Shopping Centers 50,872,000 23,536,000 94.6% $ 562
COMMUNITY/POWER SHOPPING CENTERS
1 50% Atlas Park, The Shops at(11) 2006/2011 2013 313,000 313,000 64.7% — — —Queens, New York
2 50% Boulevard Shops(11) 2001/2002 2004 185,000 185,000 100.0% — — —Chandler, Arizona
3 67.5% Camelback Colonnade(7)(9) 1961/2002 1994 619,000 539,000 97.3% — — —Phoenix, Arizona
4 39.7% Estrella Falls, The Market at(11) 2009/— 2009 242,000 242,000 96.1% — — —Goodyear, Arizona
5 100% Flagstaff Mall, The Marketplace 2007/— — 268,000 146,000 100.0% — Home Depot —at(5)(9)Flagstaff, Arizona
6 100% Panorama Mall(9) 1955/1979 2005 312,000 147,000 98.6% Wal-Mart — —Panorama, California
7 89.4% Promenade at Casa Grande(9) 2007/— 2009 909,000 471,000 94.9% Dillard’s, — —Casa Grande, Arizona JCPenney, Kohl’s,
Target
30

Year of Year of PercentageOriginal Most Recent Mall and of Mall and Company
Company’s Name of Construction/ Expansion/ Total Freestanding Freestanding Non-Owned Owned SalesCount Ownership(1) Center/Location(2) Acquisition Renovation GLA(3) GLA GLA Leased Anchors(3) Anchors(3) PSF(4)
8 100% Southridge Center(9) 1975/1998 2013 811,000 422,000 82.2% Des Moines Sears, Target, —Des Moines, Iowa Community Younkers
College
9 100.0% Superstition Springs Power 1990/2002 2002 206,000 53,000 100.0% Best Buy, — —Center(9) Burlington CoatMesa, Arizona Factory
9 Total Community/Power Shopping Centers 3,865,000 2,518,000 90.6%
63 Total before other assets 54,737,000 26,054,000
OTHER ASSETS:
100% Various(9)(12) 897,000 413,000 100.0% — Burlington —Coat Factory,Forever 21,Kohl’s
100% 500 North Michigan Avenue(9) 1997/1999 2004 323,000 323,000 71.7% — — —Chicago, Illinois
50% Atlas Park, The Shops at-Office(11) 2006/2011 — 68,000 68,000 25.5% — — —Queens, New York
100% Paradise Village Ground Leases(9) 58,000 58,000 65.5% — — —Phoenix, Arizona
100% Paradise Village Office Park II(9) 46,000 46,000 94.1% — — —Phoenix, Arizona
50% Scottsdale Fashion Square-Office(11) 123,000 123,000 85.7% — — —Scottsdale, Arizona
50% Tysons Corner Center-Office(11) 173,000 173,000 100.0% — — —McLean, Virginia
30% Wilshire Boulevard(11) 40,000 40,000 100.0% — — —Santa Monica, California
Total Other Assets 1,728,000 1,244,000
Grand Total 56,465,000 27,298,000
(1) The Company’s ownership interest in this table reflects its legal ownership interest. Legal ownership may, at times, not equal the Company’s economic interest in the listed propertiesbecause of various provisions in certain joint venture agreements regarding distributions of cash flow based on capital account balances, allocations of profits and losses and payments ofpreferred returns. As a result, the Company’s actual economic interest (as distinct from its legal ownership interest) in certain of the properties could fluctuate from time to time and maynot wholly align with its legal ownership interests. Substantially all of the Company’s joint venture agreements contain rights of first refusal, buy-sell provisions, exit rights, default dilutionremedies and/or other break up provisions or remedies which are customary in real estate joint venture agreements and which may, positively or negatively, affect the ultimate realizationof cash flow and/or capital or liquidation proceeds. See ‘‘Item 1A.-Risks Related to Our Organizational Structure-Outside partners in Joint Venture Centers result in additional risks toour stockholders.’’
(2) With respect to 50 Centers, the underlying land controlled by the Company is owned in fee entirely by the Company, or, in the case of Joint Venture Centers, by the joint ventureproperty partnership or limited liability company. With respect to the remaining 13 Centers, the underlying land controlled by the Company is owned by third parties and leased to theCompany, or the joint venture property partnership or limited liability company pursuant to long-term ground leases. Under the terms of a typical ground lease, the Company, or jointventure property partnership or limited liability company has an option or right of first refusal to purchase the land. The termination dates of the ground leases range from 2014 to 2078.
(3) Total GLA includes GLA attributable to Anchors (whether owned or non-owned) and Mall and Freestanding Stores as of December 31, 2013. ‘‘Non-owned Anchors’’ is space not ownedby the Company (or, in the case of Joint Venture Centers, by the joint venture property partnership or limited liability company) which is occupied by Anchor tenants. ‘‘Company ownedAnchors’’ is space owned (or leased) by the Company (or, in the case of Joint Venture Centers, by the joint venture property partnership or limited liability company) and leased (orsubleased) to Anchor tenants.
(4) Sales per square foot are based on reports by retailers leasing Mall Stores and Freestanding Stores for the trailing 12 months for tenants which have occupied such stores for a minimumof 12 months. Sales per square foot are also based on tenants 10,000 square feet and under for Regional Shopping Centers.
(5) Portions of the land on which the Center is situated are subject to one or more long-term ground leases.
(6) This Center opened on August 1, 2013. Sales per square foot are not available since no tenant has been open for twelve months.
(7) These Centers have a vacant Anchor location. The Company is seeking various replacement tenants and/or contemplating redevelopment opportunities for these vacant sites. TheCompany continues to collect rent under the terms of an agreement on one of these six vacant anchor locations.
(8) These properties are owned by Pacific Premier Retail LP, an unconsolidated joint venture.
(9) Included in Consolidated Centers.
(10) Tenant spaces have been intentionally held off the market and remain vacant because of redevelopment plans. As a result, the Company believes the percentage of mall and freestandingGLA leased and the sales per square foot at this redevelopment property are not meaningful data.
(11) Included in Unconsolidated Joint Venture Centers.
(12) The Company owns a portfolio of 14 stores located at shopping centers not owned by the Company. Of these 14 stores, four have been leased to Forever 21, one has been leased toKohl’s, one has been leased to Burlington Coat Factory and eight have been leased for non-Anchor usage. With respect to nine of the 14 stores, the underlying land is owned in feeentirely by the Company. With respect to the remaining five stores, the underlying land is owned by third parties and leased to the Company pursuant to long-term building or groundleases. Under the terms of a typical building or ground lease, the Company pays rent for the use of the building or land and is generally responsible for all costs and expenses associatedwith the building and improvements. In some cases, the Company has an option or right of first refusal to purchase the land. The termination dates of the ground leases range from 2018to 2027.
31

Mortgage Debt
The following table sets forth certain information regarding the mortgages encumbering theCenters, including those Centers in which the Company has less than a 100% interest. The informationset forth below is as of December 31, 2013 (dollars in thousands):
Earliest DateEffective Annual Balance Notes Can Be
Fixed or Carrying Interest Debt Maturity Due on Defeased orProperty Pledged as Collateral Floating Amount(1) Rate(2) Service(3) Date(4) Maturity Be Prepaid
Consolidated Centers:Arrowhead Towne Center . . . . . . . . . Fixed $ 236,028 2.76% $13,572 10/5/18 $199,487 Any TimeCamelback Colonnade(5) . . . . . . . . . . Fixed 49,120 2.16% 2,136 10/12/15 47,000 Any TimeChandler Fashion Center(6) . . . . . . . . Fixed 200,000 3.77% 7,500 7/1/19 200,000 7/1/15Danbury Fair Mall(7) . . . . . . . . . . . . Fixed 234,240 5.53% 18,456 10/1/20 188,854 Any TimeDeptford Mall . . . . . . . . . . . . . . . . . Fixed 201,622 3.76% 11,364 4/3/23 160,294 12/5/15Deptford Mall . . . . . . . . . . . . . . . . . Fixed 14,551 6.46% 1,212 6/1/16 13,877 Any TimeEastland Mall . . . . . . . . . . . . . . . . . . Fixed 168,000 5.79% 9,732 6/1/16 168,000 Any TimeFashion Outlets of Chicago(8) . . . . . . Floating 91,383 2.96% 2,436 3/5/17 91,383 Any TimeFashion Outlets of Niagara Falls USA . Fixed 124,030 4.89% 8,724 10/6/20 103,810 Any TimeFlagstaff Mall . . . . . . . . . . . . . . . . . . Fixed 37,000 5.03% 1,836 11/1/15 37,000 Any TimeFlatIron Crossing(9) . . . . . . . . . . . . . Fixed 268,000 3.90% 16,716 1/5/21 216,740 Any TimeFreehold Raceway Mall(6) . . . . . . . . . Fixed 232,900 4.20% 9,660 1/1/18 216,258 1/1/2014Fresno Fashion Fair(7) . . . . . . . . . . . . Fixed 158,781 6.76% 13,248 8/1/15 154,596 Any TimeGreat Northern Mall . . . . . . . . . . . . . Fixed 35,484 5.19% 2,808 (10) 35,328 Any TimeGreen Acres Mall(11) . . . . . . . . . . . . Fixed 319,850 3.61% 17,364 2/3/21 269,922 3/21/15Kings Plaza Shopping Center(12) . . . . Fixed 490,548 3.67% 26,748 12/3/19 427,423 2/25/15Northgate Mall(13) . . . . . . . . . . . . . . Floating 64,000 3.04% 1,560 3/1/17 64,000 Any TimeOaks, The . . . . . . . . . . . . . . . . . . . . Fixed 214,239 4.14% 12,768 6/5/22 174,311 Any TimePacific View . . . . . . . . . . . . . . . . . . . Fixed 135,835 4.08% 8,016 4/1/22 110,597 4/12/2017Santa Monica Place . . . . . . . . . . . . . . Fixed 235,445 2.99% 12,048 1/3/18 214,118 12/28/2015SanTan Village Regional Center(14) . . Fixed 136,629 3.14% 7,068 6/1/19 120,238 8/9/15South Plains Mall . . . . . . . . . . . . . . . Fixed 99,833 6.59% 7,776 4/11/15 97,824 Any TimeSuperstition Springs Center(15) . . . . . . Floating 68,395 2.00% 1,668 10/28/16 67,500 Any TimeTowne Mall . . . . . . . . . . . . . . . . . . . Fixed 22,996 4.48% 1,404 11/1/22 18,886 12/19/14Tucson La Encantada(16) . . . . . . . . . . Fixed 72,870 4.23% 4,416 3/1/22 59,788 Any TimeValley Mall . . . . . . . . . . . . . . . . . . . Fixed 42,155 5.85% 3,360 6/1/16 40,169 Any TimeValley River Center . . . . . . . . . . . . . . Fixed 120,000 5.59% 6,696 2/1/16 120,000 Any TimeVictor Valley, Mall of(17) . . . . . . . . . . Floating 90,000 2.73% 2,196 11/6/14 90,000 Any TimeVintage Faire Mall(18) . . . . . . . . . . . Fixed 99,083 5.81% 7,032 11/5/15 96,358 Any TimeWestside Pavilion . . . . . . . . . . . . . . . Fixed 152,173 4.49% 9,396 10/1/22 125,489 9/28/14
$4,415,190
32

Earliest DateEffective Annual Balance Notes Can Be
Fixed or Carrying Interest Debt Maturity Due on Defeased orProperty Pledged as Collateral Floating Amount(1) Rate(2) Service(3) Date(4) Maturity Be Prepaid
Unconsolidated Joint Venture Centers(at Company’s Pro Rata Share):Biltmore Fashion Park(50.0%) . . . . . . Fixed $ 28,981 8.25% $ 2,642 10/1/14 $ 28,758 Any TimeBoulevard Shops(50.0%)(19) . . . . . . . Floating 10,133 2.05% 389 12/16/18 9,133 Any TimeBroadway Plaza(50.0%)(16) . . . . . . . . Fixed 69,486 6.12% 5,460 8/15/15 67,443 Any TimeCorte Madera, The Village at(50.1%) . Fixed 38,287 7.27% 3,265 11/1/16 36,696 Any TimeEstrella Falls, The Market
at(39.7%)(20) . . . . . . . . . . . . . . . . Floating 13,310 3.13% 388 6/1/15 13,310 Any TimeInland Center(50.0%)(21) . . . . . . . . . Floating 25,000 3.42% 793 4/1/16 25,000 Any TimeKierland Commons(50.0%)(22) . . . . . . Floating 67,500 2.26% 1,394 1/2/18 64,502 Any TimeLakewood Center(51.0%) . . . . . . . . . Fixed 127,500 5.43% 6,899 6/1/15 127,500 Any TimeLos Cerritos Center(51.0%)(7) . . . . . . Fixed 98,015 4.50% 6,173 7/1/18 89,057 Any TimeNorth Bridge, The Shops at(50.0%)(16) Fixed 97,632 7.52% 8,601 6/15/16 94,258 Any TimeQueens Center(51.0%) . . . . . . . . . . . Fixed 306,000 3.65% 10,670 1/1/25 306,000 1/29/15Scottsdale Fashion Square(50.0%)(23) . Fixed 258,953 3.02% 13,281 4/3/23 201,331 4/11/15Stonewood Center(51.0%) . . . . . . . . . Fixed 54,149 4.67% 3,918 11/1/17 48,180 Any TimeTysons Corner Center(50.0%)(24) . . . . Fixed 423,190 4.13% 24,643 1/1/24 333,233 Any TimeWashington Square(51.0%) . . . . . . . . . Fixed 118,815 6.04% 9,173 1/1/16 114,482 Any TimeWest Acres(19.0%) . . . . . . . . . . . . . . Fixed 11,340 6.41% 1,069 10/1/16 10,315 Any TimeWilshire Boulevard(30.0%) . . . . . . . . . Fixed 1,648 6.35% 153 1/1/33 — Any Time
$1,749,939
(1) The mortgage notes payable balances include the unamortized debt premiums (discounts). Debt premiums(discounts) represent the excess (deficiency) of the fair value of debt over (under) the principal value of debtassumed in various acquisitions. The debt premiums (discounts) are being amortized into interest expenseover the term of the related debt in a manner which approximates the effective interest method.
The debt premiums (discounts) as of December 31, 2013 consisted of the following:
Consolidated Centers
Property Pledged as Collateral
Arrowhead Towne Center . . . . . . . . . . . . . . . . . . . . . . . . . . . . . . . . . . . . . . . . . . $14,642Camelback Colonnade . . . . . . . . . . . . . . . . . . . . . . . . . . . . . . . . . . . . . . . . . . . . 2,120Deptford Mall . . . . . . . . . . . . . . . . . . . . . . . . . . . . . . . . . . . . . . . . . . . . . . . . . . (14)Fashion Outlets of Niagara Falls USA . . . . . . . . . . . . . . . . . . . . . . . . . . . . . . . . . 6,342Superstition Springs Center . . . . . . . . . . . . . . . . . . . . . . . . . . . . . . . . . . . . . . . . . 895Valley Mall . . . . . . . . . . . . . . . . . . . . . . . . . . . . . . . . . . . . . . . . . . . . . . . . . . . . (219)
$23,766
Unconsolidated Joint Venture Centers (at Company’s Pro Rata Share)
Property Pledged as Collateral
Wilshire Boulevard . . . . . . . . . . . . . . . . . . . . . . . . . . . . . . . . . . . . . . . . . . . . . . . . (100)
$(100)
(2) The interest rate disclosed represents the effective interest rate, including the debt premiums (discounts) anddeferred finance costs.
(3) The annual debt service represents the annual payment of principal and interest.
(4) The maturity date assumes that all extension options are fully exercised and that the Company does not optto refinance the debt prior to these dates. These extension options are at the Company’s discretion, subject tocertain conditions, which the Company believes will be met.
33

(5) On September 17, 2013, the Company obtained control of the consolidated joint venture as a result of theCamelback Colonnade Restructuring (See ‘‘Item 1. Business—Recent Developments—Acquisitions andDispositions’’). The loan on the property bears interest at an effective rate of 2.16% and matures onOctober 12, 2015.
(6) A 49.9% interest in the loan has been assumed by a third party in connection with a co-venture arrangement.
(7) Northwestern Mutual Life (‘‘NML’’) is the lender of 50% of the loan. NML is considered a related party as itis a joint venture partner with the Company in Broadway Plaza.
(8) The construction loan on the property allows for borrowings of up to $140,000, bears interest at LIBOR plus2.50% and matures on March 5, 2017, including extension options.
(9) On June 4, 2013, the loan was paid off in full, which resulted in a gain of $2,791 on the early extinguishmentof debt. On November 8, 2013, the Company placed a new $268,000 loan on the property that bears interestat an effective rate of 3.90% and matures on January 5, 2021.
(10) The loan’s original maturity date was December 1, 2013. Accordingly, the loan was in maturity defaultsubsequent to that date. As a result, the Company accrued default interest on the loan at a rate of 4% inaddition to the effective rate of interest of 5.19%. In February 2014, the Company reached an agreement withthe lender to extend the loan to January 1, 2015 and waive the default interest.
(11) On January 24, 2013, in connection with the Company’s acquisition of Green Acres Mall (See ‘‘Item 1.Business—Recent Developments—Acquisitions and Dispositions’’), the Company placed a new loan on theproperty that allowed for borrowings of up to $325,000, bears interest at an effective interest rate of 3.61%and matures on February 3, 2021. Concurrent with the acquisition, the Company borrowed $100,000 on theloan. On January 31, 2013, the Company exercised its option to borrow the remaining $225,000 on the loan.
(12) On January 3, 2013, the Company exercised its option to borrow an additional $146,000 on the loan.
(13) The loan bears interest at LIBOR plus 2.25% and matures on March 1, 2017.
(14) On May 30, 2013, the consolidated joint venture replaced the existing loan on the property with a new$138,000 loan that bears interest at an effective rate of 3.14% and matures on June 1, 2019.
(15) On October 24, 2013, the Company purchased the 33.3% interest in Superstition Springs Center that it didnot own (See ‘‘Item 1. Business—Recent Developments—Acquisitions and Dispositions’’). In connection withthe acquisition, the Company assumed the loan on the property with a fair value of $68,448 that bearsinterest at an effective rate of 2.00% and matures on October 28, 2016.
(16) NML is the lender on this loan.
(17) The loan bears interest at LIBOR plus 2.25% and matures on November 6, 2014.
(18) On April 30, 2013, the existing loan on Vintage Faire Mall was paid off in full, resulting in a loss of $853 onthe early extinguishment of debt. Concurrently, the existing loan on South Towne Center was transferred toVintage Faire Mall. An additional $15,200 was borrowed on the loan on Vintage Faire Mall that bears interestat an effective rate of 2.91% and matures on November 5, 2015.
(19) On September 3, 2013, the joint venture modified and extended the loan on the property to bear interest atLIBOR plus 1.75% and to mature on December 16, 2018, including extension options.
(20) The loan bears interest at LIBOR plus 2.75% and matures on June 1, 2015.
(21) The loan bears interest at LIBOR plus 3.0% and matures on April 1, 2016.
(22) On January 2, 2013, the joint venture replaced the existing loan on the property with a new $135,000 loanthat bears interest at LIBOR plus 1.90% and matures on January 2, 2018.
(23) On March 6, 2013, the joint venture replaced the existing loan on the property with a new $525,000 loan thatbears interest at an effective rate of 3.02% and matures on April 3, 2023.
(24) On August 30, 2013, the joint venture replaced the existing loan on the property with a new $850,000 loan onthe property that bears interest at an effective rate of 4.13% and matures on January 1, 2024. NML is thelender of 33.3% of the loan.
34

ITEM 3. LEGAL PROCEEDINGS
None of the Company, the Operating Partnership, the Management Companies or their respectiveaffiliates is currently involved in any material legal proceedings.
ITEM 4. MINE SAFETY DISCLOSURES
Not applicable.
35

PART II
ITEM 5. MARKET FOR REGISTRANT’S COMMON EQUITY, RELATED STOCKHOLDERMATTERS AND ISSUER PURCHASES OF EQUITY SECURITIES
The common stock of the Company is listed and traded on the New York Stock Exchange underthe symbol ‘‘MAC’’. The common stock began trading on March 10, 1994 at a price of $19 per share.In 2013, the Company’s shares traded at a high of $72.19 and a low of $55.13.
As of February 18, 2014, there were approximately 563 stockholders of record. The following tableshows high and low sales prices per share of common stock during each quarter in 2013 and 2012 anddividends per share of common stock declared and paid by quarter:
Market QuotationPer Share Dividends
Quarter Ended High Low Declared/Paid
March 31, 2013 . . . . . . . . . . . . . . . . . . . . . . . . . . . . $64.47 $57.66 $0.58June 30, 2013 . . . . . . . . . . . . . . . . . . . . . . . . . . . . . $72.19 $56.68 $0.58September 30, 2013 . . . . . . . . . . . . . . . . . . . . . . . . . $66.12 $55.19 $0.58December 31, 2013 . . . . . . . . . . . . . . . . . . . . . . . . . $60.76 $55.13 $0.62March 31, 2012 . . . . . . . . . . . . . . . . . . . . . . . . . . . . $58.08 $49.67 $0.55June 30, 2012 . . . . . . . . . . . . . . . . . . . . . . . . . . . . . $62.83 $54.37 $0.55September 30, 2012 . . . . . . . . . . . . . . . . . . . . . . . . . $61.80 $56.02 $0.55December 31, 2012 . . . . . . . . . . . . . . . . . . . . . . . . . $60.03 $54.32 $0.58
To maintain its qualification as a REIT, the Company is required each year to distribute tostockholders at least 90% of its net taxable income after certain adjustments. The Company paid all ofits 2013 and 2012 quarterly dividends in cash. The timing, amount and composition of future dividendswill be determined in the sole discretion of the Company’s board of directors and will depend on actualand projected cash flow, financial condition, funds from operations, earnings, capital requirements,annual REIT distribution requirements, contractual prohibitions or other restrictions, applicable lawand such other factors as the board of directors deems relevant. For example, under the Company’sexisting financing arrangements, the Company may pay cash dividends and make other distributionsbased on a formula derived from funds from operations (See ‘‘Item 7. Management’s Discussion andAnalysis of Financial Condition and Results of Operations—Funds From Operations (‘‘FFO’’) andAdjusted Funds From Operations (‘‘AFFO’’)’’) and only if no default under the financing agreementshas occurred, unless, under certain circumstances, payment of the distribution is necessary to enable theCompany to continue to qualify as a REIT under the Code.
Stock Performance Graph
The following graph provides a comparison, from December 31, 2008 through December 31, 2013,of the yearly percentage change in the cumulative total stockholder return (assuming reinvestment ofdividends) of the Company, the Standard & Poor’s (‘‘S&P’’) 500 Index, the S&P Midcap 400 Index andthe FTSE NAREIT All Equity REITs Index, an industry index of publicly-traded REITs (including theCompany). The Company was added to the S&P 500 Index on May 8, 2013 and was previously part ofthe S&P Midcap 400 Index. The Company is, therefore, providing information on both indices.
The graph assumes that the value of the investment in each of the Company’s common stock andthe indices was $100 at the close of the market on December 31, 2008.
Upon written request directed to the Secretary of the Company, the Company will provide anystockholder with a list of the REITs included in the FTSE NAREIT All Equity REITs Index. Thehistorical information set forth below is not necessarily indicative of future performance.
36

25FEB201417323763
Data for the FTSE NAREIT All Equity REITs Index, the S&P 500 Index and the S&P Midcap400 Index were provided by Research Data Group.
Period Ended
Inde
x V
alue
2008 20132012201120102009
$0
$500
$300
$400
$200
$100
The Macerich Company S&P 500 Index
S&P Midcap 400 Index FTSE NAREIT All Equity REITs Index
Copyright� 2014 S&P, a division of The McGraw-Hill Companies Inc. All rights reserved.
12/31/08 12/31/09 12/31/10 12/31/11 12/31/12 12/31/13
The Macerich Company . . . . . . . . . . . . . . $100.00 $228.80 $318.44 $354.29 $424.26 $445.48
S&P 500 Index . . . . . . . . . . . . . . . . . . . . 100.00 126.46 145.51 148.59 172.37 228.19
S&P Midcap 400 Index . . . . . . . . . . . . . . 100.00 137.38 173.98 170.96 201.53 269.04
FTSE NAREIT All Equity REITs Index . . 100.00 127.99 163.78 177.36 209.39 214.56
Recent Sales of Unregistered Securities
None.
Issuer Repurchases of Equity Securities
None.
37

ITEM 6. SELECTED FINANCIAL DATA
The following sets forth selected financial data for the Company on a historical basis. Thefollowing data should be read in conjunction with the consolidated financial statements (and the notesthereto) of the Company and ‘‘Management’s Discussion and Analysis of Financial Condition andResults of Operations,’’ each included elsewhere in this Form 10-K. All amounts are in thousands,except per share data.
Years Ended December 31,
2013 2012 2011 2010 2009
OPERATING DATA:Revenues:
Minimum rents(1) . . . . . . . . . . . . . . . . . . . . . . . . . . . . . . $ 578,113 $447,321 $381,274 $345,862 $395,123Percentage rents . . . . . . . . . . . . . . . . . . . . . . . . . . . . . . . . 23,156 21,388 16,818 14,424 12,959Tenant recoveries . . . . . . . . . . . . . . . . . . . . . . . . . . . . . . . 337,772 247,593 215,872 201,344 200,972Management Companies . . . . . . . . . . . . . . . . . . . . . . . . . . 40,192 41,235 40,404 42,895 40,757Other . . . . . . . . . . . . . . . . . . . . . . . . . . . . . . . . . . . . . . 50,242 39,980 30,376 26,452 25,251
Total revenues . . . . . . . . . . . . . . . . . . . . . . . . . . . . . . . . . 1,029,475 797,517 684,744 630,977 675,062
Shopping center and operating expenses . . . . . . . . . . . . . . . . . . 329,795 251,923 213,832 195,608 201,134Management Companies’ operating expenses . . . . . . . . . . . . . . . 93,461 85,610 86,587 90,414 79,305REIT general and administrative expenses . . . . . . . . . . . . . . . . 27,772 20,412 21,113 20,703 25,933Depreciation and amortization . . . . . . . . . . . . . . . . . . . . . . . . 357,165 277,621 227,980 203,574 200,870Interest expense . . . . . . . . . . . . . . . . . . . . . . . . . . . . . . . . . 197,247 164,392 167,249 178,181 227,103(Gain) loss on extinguishment of debt, net(2) . . . . . . . . . . . . . . . (1,432) — 1,485 (3,661) (29,161)
Total expenses . . . . . . . . . . . . . . . . . . . . . . . . . . . . . . . . . 1,004,008 799,958 718,246 684,819 705,184Equity in income of unconsolidated joint ventures(3) . . . . . . . . . . 167,580 79,281 294,677 79,529 68,160Co-venture expense(4) . . . . . . . . . . . . . . . . . . . . . . . . . . . . . (8,864) (6,523) (5,806) (6,193) (2,262)Income tax benefit(5) . . . . . . . . . . . . . . . . . . . . . . . . . . . . . . 1,692 4,159 6,110 9,202 4,761(Loss) gain on remeasurement, sale or write down of assets, net . . . (26,852) 228,690 (22,037) 495 161,249
Income from continuing operations . . . . . . . . . . . . . . . . . . . . 159,023 303,166 239,442 29,191 201,786
Discontinued operations:(6)Gain (loss) on disposition of assets, net . . . . . . . . . . . . . . . . . 286,414 50,811 (67,333) (21) (39,483)Income (loss) from discontinued operations . . . . . . . . . . . . . . 3,522 12,412 (3,034) (750) (23,053)
Total income (loss) from discontinued operations . . . . . . . . . . . 289,936 63,223 (70,367) (771) (62,536)
Net income . . . . . . . . . . . . . . . . . . . . . . . . . . . . . . . . . . . . 448,959 366,389 169,075 28,420 139,250Less net income attributable to noncontrolling interests . . . . . . . . 28,869 28,963 12,209 3,230 18,508
Net income attributable to the Company . . . . . . . . . . . . . . . . . . $ 420,090 $337,426 $156,866 $ 25,190 $120,742
Earnings per common share (‘‘EPS’’) attributable to theCompany—basic:Income from continuing operations . . . . . . . . . . . . . . . . . . . . $ 1.07 $ 2.07 $ 1.67 $ 0.20 $ 2.12Discontinued operations . . . . . . . . . . . . . . . . . . . . . . . . . . . 1.94 0.44 (0.49) (0.01) (0.67)
Net income attributable to common stockholders . . . . . . . . . . . $ 3.01 $ 2.51 $ 1.18 $ 0.19 $ 1.45
EPS attributable to the Company—diluted:(7)(8)Income from continuing operations . . . . . . . . . . . . . . . . . . . . $ 1.06 $ 2.07 $ 1.67 $ 0.20 $ 2.12Discontinued operations . . . . . . . . . . . . . . . . . . . . . . . . . . . 1.94 0.44 (0.49) (0.01) (0.67)
Net income attributable to common stockholders . . . . . . . . . . . $ 3.00 $ 2.51 $ 1.18 $ 0.19 $ 1.45
38

As of December 31,
2013 2012 2011 2010 2009
BALANCE SHEET DATA:Investment in real estate (before accumulated depreciation) . $9,181,338 $9,012,706 $7,489,735 $6,908,507 $6,697,259Total assets . . . . . . . . . . . . . . . . . . . . . . . . . . . . . . . . $9,075,250 $9,311,209 $7,938,549 $7,645,010 $7,252,471Total mortgage and notes payable . . . . . . . . . . . . . . . . . . $4,582,727 $5,261,370 $4,206,074 $3,892,070 $4,531,634Redeemable noncontrolling interests . . . . . . . . . . . . . . . . $ — $ — $ — $ 11,366 $ 20,591Equity(9) . . . . . . . . . . . . . . . . . . . . . . . . . . . . . . . . . $3,718,717 $3,416,251 $3,164,651 $3,187,996 $2,128,466OTHER DATA:Funds from operations (‘‘FFO’’)—diluted(10) . . . . . . . . . . $ 527,574 $ 577,862 $ 399,559 $ 351,308 $ 380,043Cash flows provided by (used in):
Operating activities . . . . . . . . . . . . . . . . . . . . . . . . . $ 422,035 $ 351,296 $ 237,285 $ 200,435 $ 120,890Investing activities . . . . . . . . . . . . . . . . . . . . . . . . . . $ 271,867 $ (963,374) $ (212,086) $ (142,172) $ 302,356Financing activities . . . . . . . . . . . . . . . . . . . . . . . . . . $ (689,980) $ 610,623 $ (403,596) $ 294,127 $ (396,520)
Number of Centers at year end . . . . . . . . . . . . . . . . . . . 64 70 79 84 86Regional Shopping Centers portfolio occupancy(11) . . . . . . 94.6% 93.8% 92.7% 93.1% 91.3%Regional Shopping Centers portfolio sales per square
foot(12) . . . . . . . . . . . . . . . . . . . . . . . . . . . . . . . . . $ 562 $ 517 $ 489 $ 433 $ 407Weighted average number of shares outstanding—EPS basic . 139,598 134,067 131,628 120,346 81,226Weighted average number of shares outstanding—EPS
diluted(8) . . . . . . . . . . . . . . . . . . . . . . . . . . . . . . . 139,680 134,148 131,628 120,346 81,226Distributions declared per common share . . . . . . . . . . . . . $ 2.36 $ 2.23 $ 2.05 $ 2.10 $ 2.60
(1) Minimum rents were increased by amortization of above and below-market leases of $6.6 million, $5.2 million, $9.3 million,$7.1 million and $9.0 million for the years ended December 31, 2013, 2012, 2011, 2010 and 2009, respectively.
(2) The Company repurchased $180.3 million, $18.5 million and $89.1 million of its convertible senior notes (the ‘‘SeniorNotes’’) during the years ended December 31, 2011, 2010 and 2009, respectively, that resulted in (loss) gain of $(1.5)million, $(0.5) million and $29.8 million on the extinguishment of debt for the years ended December 31, 2011, 2010 and2009, respectively. The gain (loss) on extinguishment of debt, net for the years ended December 31, 2013 and 2010 alsoincludes the gain on the extinguishment of mortgage notes payable of $1.4 million and $4.2 million, respectively.
(3) On July 30, 2009, the Company sold a 49% ownership interest in Queens Center, a 971,000 square foot regional shoppingcenter in Queens, New York, to a third party for approximately $152.7 million, resulting in a gain on sale of assets of$154.2 million. The Company used the proceeds from the sale of the ownership interest in the property to pay down a termloan and for general corporate purposes. As of the date of the sale, the Company has accounted for the operations ofQueens Center under the equity method of accounting.
On September 3, 2009, the Company formed a joint venture with a third party, whereby the Company sold a 75% interestin FlatIron Crossing, a 1,435,000 square foot regional shopping center in Broomfield, Colorado, and received approximately$123.8 million in cash proceeds for the overall transaction. The Company used the proceeds from the sale of the ownershipinterest in the property to pay down a term loan and for general corporate purposes. As part of this transaction, theCompany issued three warrants for an aggregate of approximately 1.3 million shares of common stock of the Company. OnOctober 3, 2012, the Company repurchased the 75% ownership interest in FlatIron Crossing for $310.4 million. As a resultof this repurchase, the Company recognized a remeasurement gain of $84.2 million during the year ended December 31,2012.
On February 24, 2011, the Company’s joint venture in Kierland Commons Investment LLC (‘‘KCI’’) acquired an additionalownership interest in PHXAZ/Kierland Commons, L.L.C. (‘‘Kierland Commons’’), a 434,000 square foot regional shoppingcenter in Scottsdale, Arizona, for $105.6 million. The Company’s share of the purchase price consisted of a cash payment of$34.2 million and the assumption of a pro rata share of debt of $18.6 million. As a result of this transaction, KCI increasedits ownership interest in Kierland Commons from 49% to 100%. KCI accounted for the acquisition as a businesscombination achieved in stages and recognized a remeasurement gain of $25.0 million based on the acquisition date fairvalue and its previously held investment in Kierland Commons. As a result of this transaction, the Company’s ownershipinterest in KCI increased from 24.5% to 50%. The Company’s pro rata share of the gain recognized by KCI was$12.5 million and was included in equity in income from unconsolidated joint ventures.
On February 28, 2011, the Company in a 50/50 joint venture, acquired The Shops at Atlas Park, a 381,000 square footcommunity center in Queens, New York, for a total purchase price of $53.8 million. The Company’s share of the purchaseprice was $26.9 million.
On February 28, 2011, the Company acquired the remaining 50% ownership interest in Desert Sky Mall, an 891,000 squarefoot regional shopping center in Phoenix, Arizona, that it did not own for $27.6 million. The purchase price was funded bya cash payment of $1.9 million and the assumption of the third party’s pro rata share of the mortgage note payable on theproperty of $25.8 million. Prior to the acquisition, the Company had accounted for its investment in Desert Sky Mall underthe equity method. As of the date of acquisition, the Company has included Desert Sky Mall in its consolidated financialstatements.
On April 1, 2011, the Company’s joint venture in SDG Macerich Properties, L.P. (‘‘SDG Macerich’’) conveyed Granite Run
39

Mall, a 1,033,000 square foot regional shopping center in Media, Pennsylvania, to the mortgage note lender by adeed-in-lieu of foreclosure. The mortgage note was non-recourse. The Company’s pro rata share of gain on theextinguishment of debt was $7.8 million.
On December 31, 2011, the Company and its joint venture partner reached agreement for the distribution and conveyanceof interests in SDG Macerich that owned 11 regional shopping centers in a 50/50 partnership. Six of the eleven assets weredistributed to the Company on December 31, 2011. The Company received 100% ownership of Eastland Mall, a 1,043,000square foot regional shopping center in Evansville, Indiana, Lake Square Mall, a 559,000 square foot regional shoppingcenter in Leesburg, Florida, SouthPark Mall, a 904,000 square foot regional shopping center in Moline, Illinois, SouthridgeCenter, an 811,000 square foot community center in Des Moines, Iowa, NorthPark Mall, a 1,050,000 square foot regionalshopping center in Davenport, Iowa and Valley Mall, a 504,000 square foot regional shopping center in Harrisonburg,Virginia. These wholly-owned assets were recorded at fair value at the date of transfer, which resulted in a gain of$188.3 million. The gain reflected the fair value of the net assets received in excess of the book value of the Company’sinterest in SDG Macerich.
On March 30, 2012, the Company sold its 50% ownership interest in Chandler Village Center, a 273,000 square footcommunity center in Chandler, Arizona, for a total sales price of $14.8 million, resulting in a gain on the sale of assets of$8.2 million. The sales price was funded by a cash payment of $6.0 million and the assumption of the Company’s share ofthe mortgage note payable on the property of $8.8 million. The Company used the cash proceeds from the sale to paydown its line of credit and for general corporate purposes.
On March 30, 2012, the Company sold its 50% ownership interest in Chandler Festival, a 500,000 square foot communitycenter in Chandler, Arizona, for a total sales price of $31.0 million, resulting in a gain on the sale of assets of $12.3 million.The sales price was funded by a cash payment of $16.2 million and the assumption of the Company’s share of the mortgagenote payable on the property of $14.8 million. The Company used the cash proceeds from the sale to pay down its line ofcredit and for general corporate purposes.
On March 30, 2012, the Company’s joint venture in SanTan Village Power Center, a 491,000 square foot community centerin Gilbert, Arizona, sold the property for $54.8 million, resulting in a gain on the sale of assets of $23.3 million for the jointventure. The Company’s pro rata share of the gain recognized was $7.9 million, net of noncontrolling interests of$3.6 million. The Company used its share of the proceeds from the sale to pay down its line of credit and for generalcorporate purposes.
On May 31, 2012, the Company sold its 50% ownership interest in Chandler Gateway, a 260,000 square foot communitycenter in Chandler, Arizona, for a total sales price of $14.3 million, resulting in a gain on the sale of assets of $3.4 million.The sales price was funded by a cash payment of $4.9 million and the assumption of the Company’s share of the mortgagenote payable on the property of $9.4 million. The Company used the cash proceeds from the sale to pay down its line ofcredit and for general corporate purposes.
On August 10, 2012, the Company was bought out of its ownership interest in NorthPark Center, a 1,946,000 square footregional shopping center in Dallas, Texas, for $118.8 million, resulting in a gain on sale of assets of $24.6 million. TheCompany used the cash proceeds from the sale to pay down its line of credit.
On October 26, 2012, the Company acquired the remaining 33.3% ownership interest in Arrowhead Towne Center, a1,196,000 square foot regional shopping center in Glendale, Arizona, that it did not own for $144.4 million. The purchaseprice was funded by a cash payment of $69.0 million and the assumption of the third party’s pro rata share of the mortgagenote payable on the property of $75.4 million. As a result of this transaction, the Company recognized a remeasurementgain of $115.7 million.
On May 29, 2013, the Company’s joint venture in Pacific Premier Retail LP sold Redmond Town Center Office, a 582,000square foot office building in Redmond, Washington, for $185.0 million, resulting in a gain on the sale of assets of$89.2 million to the joint venture. The Company’s share of the gain was $44.4 million. The Company used its share of theproceeds from the sale to pay down its line of credit and for general corporate purposes.
On June 12, 2013, the Company’s joint venture in Pacific Premier Retail LP sold Kitsap Mall, an 846,000 square footregional shopping center in Silverdale, Washington, for $127.0 million, resulting in a gain on the sale of assets of$55.2 million to the joint venture. The Company’s share of the gain was $28.1 million. The Company used its share of theproceeds from the sale to pay down its line of credit and for general corporate purposes.
On August 1, 2013, the Company’s joint venture in Pacific Premier Retail LP sold Redmond Town Center, a 695,000 squarefoot community center in Redmond, Washington, for $127.0 million, resulting in a gain on the sale of assets of $38.4 millionto the joint venture. The Company’s share of the gain was $18.3 million. The Company used its share of the proceeds fromthe sale to pay down its line of credit and for general corporate purposes.
On September 17, 2013, the Company’s joint venture in Camelback Colonnade, a 619,000 square foot community center inPhoenix, Arizona, was restructured. As a result of the restructuring, the Company’s ownership interest in CamelbackColonnade decreased from 73.2% to 67.5%. Prior to the restructuring, the Company had accounted for its investment inCamelback Colonnade under the equity method of accounting due to substantive participation rights held by the outsidepartners. Upon completion of the restructuring, these substantive participation rights were terminated and the Companyobtained voting control of the joint venture. As a result of this transaction, the Company recognized a remeasurement gainof $36.3 million. Since the date of the restructuring, the Company has included Camelback Colonnade in its consolidatedfinancial statements.
40

On October 8, 2013, the Company’s joint venture in Ridgmar Mall, a 1,273,000 square foot regional shopping center in FortWorth, Texas, sold the property for $60.9 million, which resulted in a gain of $6.2 million to the joint venture. TheCompany’s share of the gain was $3.1 million. The cash proceeds from the sale were used to pay off the $51.7 millionmortgage loan on the property and the remaining $9.2 million net of closing costs was distributed to the partners. TheCompany used its share of the proceeds from the sale to pay down its line of credit and for general corporate purposes.
On October 24, 2013, the Company acquired the remaining 33.3% ownership interest in Superstition Springs Center, a1,082,000 square foot regional shopping center in Mesa, Arizona, that it did not own for $46.2 million. The purchase pricewas funded by a cash payment of $23.7 million and the assumption of the third party’s pro rata share of the mortgage notepayable on the property of $22.5 million. Prior to the acquisition, the Company had accounted for its investment inSuperstition Springs Center under the equity method. As a result of this transaction, the Company recognized aremeasurement gain of $14.9 million. Since the date of acquisition, the Company has included Superstition Springs Centerin its consolidated financial statements.
(4) On September 30, 2009, the Company formed a joint venture with a third party, whereby the third party acquired a 49.9%interest in Freehold Raceway Mall, a 1,674,000 square foot regional shopping center in Freehold, New Jersey, and ChandlerFashion Center, a 1,321,000 square foot regional shopping center in Chandler, Arizona. The Company receivedapproximately $174.6 million in cash proceeds for the overall transaction. The Company used the proceeds from thistransaction to pay down the Company’s line of credit and for general corporate purposes. As part of this transaction, theCompany issued a warrant for an aggregate of approximately 0.9 million shares of common stock of the Company. Thetransaction was accounted for as a profit-sharing arrangement, and accordingly the assets, liabilities and operations of theproperties remain on the books of the Company and a co-venture obligation was established for the amount of$168.2 million representing the net cash proceeds received from the third party less costs allocated to the warrant.
(5) The Company’s taxable REIT subsidiaries are subject to corporate level income taxes (See Note 22—Income Taxes in theCompany’s Notes to the Consolidated Financial Statements).
(6) Discontinued operations include the following:
In June 2009, the Company recorded an impairment charge of $26.0 million related to the fee and/or ground leaseholdinterests in five former Mervyn’s stores due to the anticipated loss on the sale of these properties in July 2009. TheCompany subsequently sold the properties in July 2009 for $52.7 million in total proceeds, resulting in an additional$0.5 million loss related to transaction costs. The Company used the proceeds from the sales to pay down the Company’sterm loan and for general corporate purposes.
In June 2009, the Company recorded an impairment charge of $1.0 million related to the anticipated loss on the sale ofVillage Center, a 170,801 square foot urban village property, in July 2009. The Company subsequently sold the property onJuly 14, 2009 for $11.9 million in total proceeds, resulting in a gain of $0.1 million related to a change in estimate intransaction costs. The Company used the proceeds from the sale to pay down the term loan and for general corporatepurposes.
On September 29, 2009, the Company sold a leasehold interest in a former Mervyn’s store for $4.5 million, resulting in again on the sale of assets of $4.1 million. The Company used the proceeds from the sale to pay down the Company’s line ofcredit and for general corporate purposes.
During the fourth quarter of 2009, the Company sold five non-core community centers for $71.3 million, resulting in anaggregate loss on sale of $16.9 million. The Company used the proceeds from these sales to pay down the Company’s lineof credit and for general corporate purposes.
On March 4, 2011, the Company sold a former Mervyn’s store in Santa Fe, New Mexico for $3.7 million, resulting in a losson the sale of assets of $1.9 million. The proceeds from the sale were used for general corporate purposes.
In June 2011, the Company recorded an impairment charge of $35.7 million related to Shoppingtown Mall, a 969,000square foot regional shopping center in Dewitt, New York. As a result of the maturity default on the mortgage note payableand the corresponding reduction of the expected holding period, the Company wrote down the carrying value of thelong-lived assets to its estimated fair value of $39.0 million. On December 30, 2011, the Company conveyed ShoppingtownMall to the lender by a deed-in-lieu of foreclosure. As a result, the Company recognized a $3.9 million additional loss onthe disposal of the asset.
On October 14, 2011, the Company sold a former Mervyn’s store in Salt Lake City, Utah for $8.1 million, resulting in again on the sale of assets of $3.8 million. The proceeds from the sale were used for general corporate purposes.
On November 30, 2011, the Company sold a former Mervyn’s store in West Valley City, Utah for $2.3 million, resulting in aloss on the sale of assets of $0.2 million. The proceeds from the sale were used for general corporate purposes.
In March 2012, the Company recorded an impairment charge of $54.3 million related to Valley View Center. As a result ofthe sale of the property on April 23, 2012, the Company wrote down the carrying value of the long-lived assets to theirestimated fair value of $33.5 million, which was equal to the sales price of the property. On April 23, 2012, the propertywas sold by a court appointed receiver, which resulted in a gain on the extinguishment of debt of $104.0 million.
On April 30, 2012, the Company sold The Borgata, a 94,000 square foot community center in Scottsdale, Arizona, for$9.2 million, resulting in a loss on the sale of assets of $1.3 million. The Company used the proceeds from the sale to paydown its line of credit and for general corporate purposes.
41

On May 11, 2012, the Company sold a former Mervyn’s store in Montebello, California for $20.8 million, resulting in a losson the sale of assets of $0.4 million. The proceeds from the sale were used for general corporate purposes.
On May 17, 2012, the Company sold Hilton Village, an 80,000 square foot community center in Scottsdale, Arizona, for$24.8 million, resulting in a gain on the sale of assets of $3.1 million. The Company used the proceeds from the sale to paydown its line of credit and for general corporate purposes.
On May 31, 2012, the Company conveyed Prescott Gateway, a 584,000 square foot regional shopping center in Prescott,Arizona, to the mortgage note lender by a deed-in-lieu of foreclosure. As a result of the conveyance, the Companyrecognized a gain on the extinguishment of debt of $16.3 million.
On June 28, 2012, the Company sold Carmel Plaza, a 112,000 square foot community center in Carmel, California, for$52.0 million, resulting in a gain on the sale of assets of $7.8 million. The Company used the proceeds from the sale to paydown its line of credit.
On May 31, 2013, the Company sold Green Tree Mall, a 793,000 square foot regional shopping center in Clarksville,Indiana, for $79.0 million, resulting in a gain on the sale of assets of $59.8 million. The Company used the proceeds fromthe sale to pay down its line of credit and for general corporate purposes.
On June 4, 2013, the Company sold Northridge Mall, an 890,000 square foot regional shopping center in Salinas, California,and Rimrock Mall, a 603,000 square foot regional shopping center in Billings, Montana. The properties were sold in acombined transaction for $230.0 million, resulting in a gain on the sale of assets of $82.2 million. The Company used theproceeds from the sale to pay down its line of credit and for general corporate purposes.
On September 11, 2013, the Company sold a former Mervyn’s store in Milpitas, California for $12.0 million, resulting in aloss on the sale of assets of $2.6 million. The Company used the proceeds from the sale to pay down its line of credit andfor general corporate purposes.
On September 30, 2013, the Company conveyed Fiesta Mall, a 933,000 square foot regional shopping center in Mesa,Arizona, to the mortgage note lender by a deed-in-lieu of foreclosure. The mortgage loan was non-recourse. As a result ofthe conveyance, the Company recognized a gain on the extinguishment of debt of $1.3 million.
On October 15, 2013, the Company sold a former Mervyn’s store in Midland, Texas for $5.7 million, resulting in a loss onthe sale of assets of $2.0 million. The Company used the proceeds from the sale to pay down its line of credit and forgeneral corporate purposes.
On October 23, 2013, the Company sold a former Mervyn’s store in Grand Junction, Colorado for $5.4 million, resulting ina gain on the sale of assets of $1.7 million. The Company used the proceeds from the sale to pay down its line of creditand for general corporate purposes.
On December 4, 2013, the Company sold a former Mervyn’s store in Livermore, California for $10.5 million, resulting in aloss on the sale of assets of $5.3 million. The Company used the proceeds from the sale to pay down its line of credit andfor general corporate purposes.
On December 11, 2013, the Company sold Chesterfield Towne Center, a 1,016,000 square foot regional shopping center inRichmond, Virginia, and Centre at Salisbury, an 862,000 square foot regional shopping center in Salisbury, Maryland, in acombined transaction for $292.5 million, resulting in a gain on the sale of assets of $151.5 million. The sales price wasfunded by a cash payment of $67.8 million, the assumption of the $109.7 million mortgage note payable on ChesterfieldTowne Center and the assumption of the $115.0 million mortgage note payable on Centre at Salisbury. The Company usedthe proceeds from the sale to pay down its line of credit and for general corporate purposes.
The Company has classified the results of operations and gain or loss on sale for all of the above dispositions asdiscontinued operations for all years presented.
(7) Assumes the conversion of Operating Partnership units to the extent they are dilutive to the EPS computation. It alsoassumes the conversion of MACWH, LP common and preferred units to the extent that they are dilutive to the EPScomputation.
(8) Includes the dilutive effect, if any, of share and unit-based compensation plans and the Senior Notes then outstandingcalculated using the treasury stock method and the dilutive effect, if any, of all other dilutive securities calculated using the‘‘if converted’’ method.
(9) Equity includes the noncontrolling interests in the Operating Partnership, nonredeemable noncontrolling interests inconsolidated joint ventures and common and non-participating convertible preferred units of MACWH, LP.
(10) The Company uses FFO in addition to net income to report its operating and financial results and considers FFO andFFO-diluted as supplemental measures for the real estate industry and a supplement to Generally Accepted AccountingPrinciples (‘‘GAAP’’) measures. The National Association of Real Estate Investment Trusts (‘‘NAREIT’’) defines FFO asnet income (loss) (computed in accordance with GAAP), excluding gains (or losses) from extraordinary items and sales ofdepreciated operating properties, plus real estate related depreciation and amortization, impairment write-downs of realestate and write-downs of investments in an affiliate where the write-downs have been driven by a decrease in the value ofreal estate held by the affiliate and after adjustments for unconsolidated joint ventures. Adjustments for unconsolidatedjoint ventures are calculated to reflect FFO on the same basis.
42

Adjusted FFO (‘‘AFFO’’) excludes the FFO impact of Shoppingtown Mall and Valley View Center for the years endedDecember 31, 2012 and 2011. In December 2011, the Company conveyed Shoppingtown Mall to the lender by adeed-in-lieu of foreclosure. In July 2010, a court-appointed receiver assumed operational control of Valley View Center andresponsibility for managing all aspects of the property. Valley View Center was sold by the receiver on April 23, 2012, andthe related non-recourse mortgage loan obligation was fully extinguished on that date, resulting in a gain on extinguishmentof debt of $104.0 million. On May 31, 2012, the Company conveyed Prescott Gateway to the lender by a deed-in-lieu offoreclosure and the debt was forgiven resulting in a gain on extinguishment of debt of $16.3 million. AFFO excludes thegain on extinguishment of debt on Prescott Gateway for the twelve months ended December 31, 2012.
FFO and FFO on a diluted basis are useful to investors in comparing operating and financial results between periods. Thisis especially true since FFO excludes real estate depreciation and amortization, as the Company believes real estate valuesfluctuate based on market conditions rather than depreciating in value ratably on a straight-line basis over time. TheCompany believes that such a presentation provides investors with a more meaningful measure of its operating results incomparison to the operating results of other REITs. The Company believes that AFFO and AFFO on a diluted basisprovide useful supplemental information regarding the Company’s performance as they show a more meaningful andconsistent comparison of the Company’s operating performance and allow investors to more easily compare the Company’sresults without taking into account non-cash credits and charges on properties controlled by either a receiver or loanservicer. The Company believes that FFO and AFFO on a diluted basis are measures investors find most useful inmeasuring the dilutive impact of outstanding convertible securities.
The Company believes that FFO and AFFO do not represent cash flow from operations as defined by GAAP, should notbe considered as an alternative to net income as defined by GAAP, and are not indicative of cash available to fund all cashflow needs. The Company also cautions that FFO and AFFO, as presented, may not be comparable to similarly titledmeasures reported by other real estate investment trusts.
Management compensates for the limitations of FFO and AFFO by providing investors with financial statements preparedaccording to GAAP, along with this detailed discussion of FFO and AFFO and a reconciliation of FFO and AFFO andFFO and AFFO-diluted to net income available to common stockholders. Management believes that to further understandthe Company’s performance, FFO and AFFO should be compared with the Company’s reported net income and consideredin addition to cash flows in accordance with GAAP, as presented in the Company’s Consolidated Financial Statements. Fordisclosure of net income, the most directly comparable GAAP financial measure, for the periods presented and areconciliation of FFO and AFFO and FFO and AFFO—diluted to net income, see ‘‘Item 7. Management’s Discussion andAnalysis of Financial Condition and Results of Operations—Funds From Operations (‘‘FFO’’) and Adjusted Funds FromOperations (‘‘AFFO’’)’’.
The computation of FFO and AFFO—diluted includes the effect of share and unit-based compensation plans and theSenior Notes calculated using the treasury stock method. It also assumes the conversion of MACWH, LP common andpreferred units and all other securities to the extent that they are dilutive to the FFO and AFFO—diluted computation.
(11) Occupancy is the percentage of Mall and Freestanding GLA leased as of the last day of the reporting period. Occupancyfor the year ended December 31, 2013 excludes Rotterdam Square (the ‘‘2014 Disposition Center’’), which was sold onJanuary 15, 2014. Occupancy excludes Centers under development and redevelopment. Occupancy for the years endedDecember 31, 2011 and 2010 excludes Valley View Mall. Occupancy for the years ended December 31, 2010 and 2009excludes Santa Monica Place. Occupancy for the year ended December 31, 2009 also excludes Northgate Mall andShoppingtown Mall.
(12) Sales per square foot are based on reports by retailers leasing Mall Stores and Freestanding Stores for the trailing twelvemonths for tenants which have occupied such stores for a minimum of twelve months. Sales per square foot also are basedon tenants 10,000 square feet and under for Regional Shopping Centers. The sales per square foot exclude Centers underdevelopment and redevelopment. The sales per square foot for the year ended December 31, 2013 exclude the 2014Disposition Center. The sales per square foot for the years ended December 31, 2011 and 2010 exclude Valley View Mall.The sales per square foot for the years ended December 31, 2010 and 2009 exclude Santa Monica Place, which was underredevelopment during the year ended December 31, 2009 and open partially during the year ended December 31, 2010.Sales per square foot for the year ended December 31, 2009 also exclude Northgate Mall and Shoppingtown Mall.
43

ITEM 7. MANAGEMENT’S DISCUSSION AND ANALYSIS OF FINANCIAL CONDITION ANDRESULTS OF OPERATIONS
Management’s Overview and Summary
The Company is involved in the acquisition, ownership, development, redevelopment, managementand leasing of regional and community/power shopping centers located throughout the United States.The Company is the sole general partner of, and owns a majority of the ownership interests in, theOperating Partnership. As of December 31, 2013, the Operating Partnership owned or had anownership interest in 55 regional shopping centers and nine community/power shopping centers totalingapproximately 57 million square feet of gross leasable area (‘‘GLA’’). These 64 regional and community/power shopping centers are referred to herein as the ‘‘Centers,’’ unless the context otherwise requires.The Company is a self-administered and self-managed REIT and conducts all of its operations throughthe Operating Partnership and the Management Companies.
The following discussion is based primarily on the consolidated financial statements of theCompany for the years ended December 31, 2013, 2012 and 2011. It compares the results of operationsand cash flows for the year ended December 31, 2013 to the results of operations and cash flows forthe year ended December 31, 2012. Also included is a comparison of the results of operations and cashflows for the year ended December 31, 2012 to the results of operations and cash flows for the yearended December 31, 2011. This information should be read in conjunction with the accompanyingconsolidated financial statements and notes thereto.
Acquisitions and Dispositions:
The financial statements reflect the following acquisitions, dispositions and changes in ownershipsubsequent to the occurrence of each transaction.
On February 24, 2011, the Company’s joint venture in Kierland Commons Investment LLC(‘‘KCI’’) acquired an additional ownership interest in PHXAZ/Kierland Commons, L.L.C. (‘‘KierlandCommons’’), a 434,000 square foot regional shopping center in Scottsdale, Arizona. As a result of thistransaction, the Company’s ownership interest in KCI increased from 24.5% to 50.0%. The Company’sshare of the purchase price consisted of a cash payment of $34.2 million and the assumption of a prorata share of debt of $18.6 million.
On February 28, 2011, the Company, in a 50/50 joint venture, acquired The Shops at Atlas Park, a381,000 square foot community center in Queens, New York, for a total purchase price of $53.8 million.The Company’s share of the purchase price was $26.9 million and was funded from the Company’s cashon hand.
On February 28, 2011, the Company acquired the remaining 50% ownership interest in Desert SkyMall, an 891,000 square foot regional shopping center in Phoenix, Arizona, that it did not own. Thetotal purchase price was $27.6 million, which included the assumption of the third party’s pro rata shareof the mortgage note payable on the property of $25.8 million. Concurrent with the purchase of thepartnership interest, the Company paid off the $51.5 million loan on the property.
On March 4, 2011, the Company sold a fee interest in a former Mervyn’s store in Santa Fe, NewMexico for $3.7 million, resulting in a loss on the sale of assets of $1.9 million. The Company used theproceeds from the sale for general corporate purposes.
On April 29, 2011, the Company purchased a fee interest in a freestanding Kohl’s store at CapitolaMall in Capitola, California for $28.5 million. The purchase price was paid from cash on hand.
On June 3, 2011, the Company acquired an additional 33.3% ownership interest in ArrowheadTowne Center, a 1,198,000 square foot regional shopping center in Glendale, Arizona, an additional33.3% ownership interest in Superstition Springs Center, a 1,082,000 square foot regional shopping
44

center in Mesa, Arizona, and an additional 50% ownership interest in the land under SuperstitionSprings Center (‘‘Superstition Springs Land’’) in exchange for the Company’s ownership interest in sixanchor stores, including five former Mervyn’s stores and a cash payment of $75.0 million. The cashpurchase price was funded from borrowings under the Company’s line of credit. This transaction isreferred to herein as the ‘‘GGP Exchange’’.
On July 22, 2011, the Company acquired Fashion Outlets of Niagara Falls USA, a 525,000 squarefoot outlet center in Niagara Falls, New York. The initial purchase price of $200.0 million was fundedby a cash payment of $78.6 million and the assumption of the mortgage note payable of $121.4 million.The cash purchase price was funded from borrowings under the Company’s line of credit. The purchaseand sale agreement includes contingent consideration based on the performance of Fashion Outlets ofNiagara Falls USA from the acquisition date through July 21, 2014 that could increase the purchaseprice from the initial $200.0 million up to a maximum of $218.3 million. As of December 31, 2013, theCompany estimated the fair value of the contingent consideration as $17.5 million, which has beenincluded in other accrued liabilities.
On October 14, 2011, the Company sold a former Mervyn’s store in Salt Lake City, Utah for$8.1 million, resulting in a gain on the sale of assets of $3.8 million. The proceeds from the sale wereused for general corporate purposes.
On November 30, 2011, the Company sold a former Mervyn’s store in West Valley City, Utah for$2.3 million, resulting in a loss on the sale of assets of $0.2 million. The proceeds from the sale wereused for general corporate purposes.
On December 31, 2011, the Company and its joint venture partner reached agreement for thedistribution and conveyance of interests in SDG Macerich Properties, L.P. (‘‘SDG Macerich’’) thatowned 11 regional shopping centers in a 50/50 partnership. Six of the eleven assets were distributed tothe Company on December 31, 2011. The Company received 100% ownership of Eastland Mall, a1,043,000 square foot regional shopping center in Evansville, Indiana, Lake Square Mall, a 559,000square foot regional shopping center in Leesburg, Florida, SouthPark Mall, a 904,000 square footregional shopping center in Moline, Illinois, Southridge Center, an 811,000 square foot communitycenter in Des Moines, Iowa, NorthPark Mall, a 1,050,000 square foot regional shopping center inDavenport, Iowa and Valley Mall, a 504,000 square foot regional shopping center in Harrisonburg,Virginia (collectively referred to herein as the ‘‘SDG Acquisition Properties’’). These wholly-ownedassets were recorded at fair value at the date of transfer, which resulted in a gain to the Company of$188.3 million. The gain reflected the fair value of the net assets received in excess of the book valueof the Company’s interest in SDG Macerich. The distribution and conveyance of the properties fromSDG Macerich to the Company is referred to herein as the ‘‘SDG Transaction’’.
On February 29, 2012, the Company acquired a 323,000 square foot mixed-use retail/office building(‘‘500 North Michigan Avenue’’) in Chicago, Illinois for $70.9 million. The purchase price was paidfrom borrowings under the Company’s line of credit.
On March 30, 2012, the Company sold its 50% ownership interest in Chandler Village Center, a273,000 square foot community center in Chandler, Arizona, for a total sales price of $14.8 million,resulting in a gain on the sale of assets of $8.2 million. The sales price was funded by a cash paymentof $6.0 million and the assumption of the Company’s share of the mortgage note payable on theproperty of $8.8 million. The Company used the cash proceeds from the sale to pay down its line ofcredit and for general corporate purposes.
On March 30, 2012, the Company sold its 50% ownership interest in Chandler Festival, a 500,000square foot community center in Chandler, Arizona, for a total sales price of $31.0 million, resulting ina gain on the sale of assets of $12.3 million. The sales price was funded by a cash payment of$16.2 million and the assumption of the Company’s share of the mortgage note payable on the property
45

of $14.8 million. The Company used the cash proceeds from the sale to pay down its line of credit andfor general corporate purposes.
On March 30, 2012, the Company’s joint venture in SanTan Village Power Center, a 491,000square foot community center in Gilbert, Arizona, sold the property for $54.8 million, resulting in again on the sale of assets of $23.3 million for the joint venture. The Company’s pro rata share of thegain recognized was $7.9 million, net of noncontrolling interests of $3.6 million. The Company used itsshare of the proceeds from the sale to pay down its line of credit and for general corporate purposes.
On April 30, 2012, the Company sold The Borgata, a 94,000 square foot community center inScottsdale, Arizona, for $9.2 million, resulting in a loss on the sale of assets of $1.3 million. TheCompany used the proceeds from the sale to pay down its line of credit and for general corporatepurposes.
On May 11, 2012, the Company sold a former Mervyn’s store in Montebello, California for$20.8 million, resulting in a loss on the sale of assets of $0.4 million. The Company used the proceedsfrom the sale for general corporate purposes.
On May 17, 2012, the Company sold Hilton Village, an 80,000 square foot community center inScottsdale, Arizona, for $24.8 million, resulting in a gain on the sale of assets of $3.1 million. TheCompany used the proceeds from the sale to pay down its line of credit and for general corporatepurposes.
On May 31, 2012, the Company sold its 50% ownership interest in Chandler Gateway, a 260,000square foot community center in Chandler, Arizona, for a total sales price of $14.3 million, resulting ina gain on the sale of assets of $3.4 million. The sales price was funded by a cash payment of$4.9 million and the assumption of the Company’s share of the mortgage note payable on the propertyof $9.4 million. The Company used the cash proceeds from the sale to pay down its line of credit andfor general corporate purposes.
On June 28, 2012, the Company sold Carmel Plaza, a 112,000 square foot community center inCarmel, California, for $52.0 million, resulting in a gain on the sale of assets of $7.8 million. TheCompany used the proceeds from the sale to pay down its line of credit.
On August 10, 2012, the Company was bought out of its ownership interest in NorthPark Center, a1,946,000 square foot regional shopping center in Dallas, Texas, for $118.8 million, resulting in a gainon the sale of assets of $24.6 million. The Company used the cash proceeds to pay down its line ofcredit.
On October 3, 2012, the Company acquired the 75% ownership interest in FlatIron Crossing, a1,435,000 square foot regional shopping center in Broomfield, Colorado, that it did not own for a cashpayment of $195.9 million and the assumption of the third party’s share of the mortgage note payableof $114.5 million. The cash payment was funded from borrowings under the Company’s line of credit.
On October 26, 2012, the Company acquired the remaining 33.3% ownership interest inArrowhead Towne Center that it did not own for $144.4 million. The Company funded the purchaseprice by a cash payment of $69.0 million and the assumption of the third party’s pro rata share of themortgage note payable on the property of $75.4 million. The cash payment was funded fromborrowings under the Company’s line of credit.
On November 28, 2012, the Company acquired Kings Plaza Shopping Center, a 1,195,000 squarefoot regional shopping center in Brooklyn, New York, for a purchase price of $756.0 million. Thepurchase price was funded from a cash payment of $726.0 million and the issuance of $30.0 million inrestricted common stock of the Company. The cash payment was provided by the placement of amortgage note on the property that allowed for borrowings up to $500.0 million and from borrowingsunder the Company’s line of credit. Concurrent with the acquisition, the Company borrowed
46

$354.0 million on the loan. On January 3, 2013, the Company exercised its option to borrow theremaining $146.0 million of the loan.
On January 24, 2013, the Company acquired Green Acres Mall, a 1,787,000 square foot regionalshopping center in Valley Stream, New York, for a purchase price of $500.0 million. The purchase pricewas funded from the placement of a $325.0 million mortgage note on the property and $175.0 millionfrom borrowings under the Company’s line of credit.
On April 25, 2013, the Company acquired a 19 acre parcel of land adjacent to Green Acres Mallfor $22.6 million. The payment was provided by borrowings from the Company’s line of credit.
On May 29, 2013, the Company’s joint venture in Pacific Premier Retail LP sold Redmond TownCenter Office, a 582,000 square foot office building in Redmond, Washington, for $185.0 million,resulting in a gain on the sale of assets of $89.2 million to the joint venture. The Company’s share ofthe gain was $44.4 million. The Company used its share of the proceeds from the sale to pay down itsline of credit and for general corporate purposes.
On May 31, 2013, the Company sold Green Tree Mall, a 793,000 square foot regional shoppingcenter in Clarksville, Indiana, for $79.0 million, resulting in a gain on the sale of assets of $59.8 million.The Company used the proceeds from the sale to pay down its line of credit and for general corporatepurposes.
On June 4, 2013, the Company sold Northridge Mall, an 890,000 square foot regional shoppingcenter in Salinas, California, and Rimrock Mall, a 603,000 square foot regional shopping center inBillings, Montana. The properties were sold in a combined transaction for $230.0 million, resulting in again on the sale of assets of $82.2 million. The Company used the proceeds from the sale to pay downits line of credit and for general corporate purposes.
On June 12, 2013, the Company’s joint venture in Pacific Premier Retail LP sold Kitsap Mall, an846,000 square foot regional shopping center in Silverdale, Washington, for $127.0 million, resulting ina gain on the sale of assets of $55.2 million to the joint venture. The Company’s share of the gain was$28.1 million. The Company used its share of the proceeds from the sale to pay down its line of creditand for general corporate purposes.
On August 1, 2013, the Company’s joint venture in Pacific Premier Retail LP sold Redmond TownCenter, a 695,000 square foot community center in Redmond, Washington, for $127.0 million, resultingin a gain on the sale of assets of $38.4 million to the joint venture. The Company’s share of the gainwas $18.3 million. The Company used its share of the proceeds from the sale to pay down its line ofcredit and for general corporate purposes.
On September 11, 2013, the Company sold a former Mervyn’s store in Milpitas, California for$12.0 million, resulting in a loss on the sale of assets of $2.6 million. The Company used the proceedsfrom the sale to pay down its line of credit and for general corporate purposes.
On September 17, 2013, the Company’s joint venture in Camelback Colonnade, a 619,000 squarefoot community center in Phoenix, Arizona, was restructured. As a result of the restructuring, theCompany’s ownership interest in Camelback Colonnade decreased from 73.2% to 67.5%. Prior to therestructuring, the Company had accounted for its investment in Camelback Colonnade under the equitymethod of accounting due to substantive participation rights held by the outside partners. Uponcompletion of the restructuring, these substantive participation rights were terminated and theCompany obtained voting control of the joint venture. This transaction is referred to herein as the‘‘Camelback Colonnade Restructuring.’’ Since the date of the restructuring, the Company has includedCamelback Colonnade in its consolidated financial statements.
On October 8, 2013, the Company’s joint venture in Ridgmar Mall, a 1,273,000 square footregional shopping center in Fort Worth, Texas, sold the property for $60.9 million, resulting in a gain
47

on the sale of assets of $6.2 million to the joint venture. The Company’s share of the gain was$3.1 million. The proceeds from the sale were used to pay off the $51.7 million mortgage loan on theproperty and the remaining $9.2 million, net of closing costs, was distributed to the partners. TheCompany used its share of the proceeds from the sale to pay down its line of credit and for generalcorporate purposes.
On October 15, 2013, the Company sold a former Mervyn’s store in Midland, Texas for$5.7 million, resulting in a loss on the sale of assets of $2.0 million. The Company used the proceedsfrom the sale to pay down its line of credit and for general corporate purposes.
On October 23, 2013, the Company sold a former Mervyn’s store in Grand Junction, Colorado for$5.4 million, resulting in a gain on the sale of assets of $1.7 million. The Company used the proceedsfrom the sale to pay down its line of credit and for general corporate purposes.
On October 24, 2013, the Company acquired the remaining 33.3% ownership interest inSuperstition Springs Center that it did not own for $46.2 million. The purchase price was funded by acash payment of $23.7 million and the assumption of the third party’s pro rata share of the mortgagenote payable on the property of $22.5 million.
On December 4, 2013, the Company sold a former Mervyn’s store in Livermore, California for$10.5 million, resulting in a loss on the sale of assets of $5.3 million. The Company used the proceedsfrom the sale to pay down its line of credit and for general corporate purposes.
On December 11, 2013, the Company sold Chesterfield Towne Center, a 1,016,000 square footregional shopping center in Richmond, Virginia, and Centre at Salisbury, an 862,000 square footregional shopping center in Salisbury, Maryland. The properties were sold in a combined transactionfor $292.5 million, resulting in a gain on the sale of assets of $151.5 million. The sales price was fundedby a cash payment of $67.8 million, the assumption of the $109.7 million mortgage note payable onChesterfield Towne Center and the assumption of the $115.0 million mortgage note payable on Centreat Salisbury. The Company used the cash proceeds from the sale to pay down its line of credit and forgeneral corporate purposes.
On January 15, 2014, the Company sold Rotterdam Square, a 585,000 square foot regionalshopping center in Schenectady, New York, for $8.5 million. The Company used the proceeds from thesale to pay down its line of credit and for general corporate purposes.
Other Transactions and Events:
On July 15, 2010, a court appointed receiver assumed operational control of Valley View Centerand responsibility for managing all aspects of the property. In March 2012, the Company recorded animpairment charge of $54.3 million to write down the carrying value of the long-lived assets to theirestimated fair value. On April 23, 2012, the property was sold by the receiver for $33.5 million, whichresulted in a gain on the extinguishment of debt of $104.0 million.
On April 1, 2011, the Company’s joint venture in SDG Macerich conveyed Granite Run Mall, a1,033,000 square foot regional center in Media, Pennsylvania, to the mortgage note lender by adeed-in-lieu of foreclosure. The mortgage note was non-recourse. The Company’s pro rata share ofgain on the extinguishment of debt was $7.8 million.
On May 11, 2011, the non-recourse mortgage note payable on Shoppingtown Mall went intomaturity default. As a result of the maturity default and the corresponding reduction of the estimatedholding period, the Company recognized an impairment charge of $35.7 million to write down thecarrying value of the long-lived assets to their estimated fair value. On September 14, 2011, theCompany exercised its right and redeemed the outside ownership interests in the Center for a cashpayment of $11.4 million. On December 30, 2011, the Company conveyed the property to the mortgage
48

note lender by a deed-in-lieu of foreclosure. As a result of the conveyance, the Company recognized anadditional $3.9 million loss on the disposal of the property.
On May 31, 2012, the Company conveyed Prescott Gateway, a 584,000 square foot regionalshopping center in Prescott, Arizona, to the mortgage note lender by a deed-in-lieu of foreclosure. Themortgage loan was non-recourse. As a result of the conveyance, the Company recognized a gain on theextinguishment of debt of $16.3 million.
In December 2012, the Company recognized an impairment charge of $24.6 million on Fiesta Mall,a 933,000 square foot regional shopping center in Mesa, Arizona, to write down the carrying value ofthe long-lived assets to their estimated fair value due to a reduction in the estimated holding period ofthe property. On September 30, 2013, the Company conveyed Fiesta Mall to the mortgage note lenderby a deed-in-lieu of foreclosure. The mortgage loan was non-recourse. As a result of the conveyance,the Company recognized a gain on the extinguishment of debt of $1.3 million.
Redevelopment and Development Activity:
In August 2011, the Company entered into a joint venture agreement with a subsidiary of AWE/Talisman for the development of Fashion Outlets of Chicago in the Village of Rosemont, Illinois. TheCompany owns 60% of the joint venture and AWE/Talisman owns 40%. The Company accounts forFashion Outlets of Chicago as a consolidated joint venture. The Center is a fully enclosed two level,528,000 square foot outlet center. The site is located within a mile of O’Hare International Airport.The project broke ground in November 2011 and opened on August 1, 2013. The total estimatedproject cost is approximately $211.0 million. As of December 31, 2013, the consolidated joint venturehad incurred $181.7 million of development costs. On March 2, 2012, the consolidated joint ventureobtained a construction loan on the property that allows for borrowings of up to $140.0 million, bearsinterest at LIBOR plus 2.50% and matures on March 5, 2017. As of December 31, 2013, theconsolidated joint venture had borrowed $91.4 million under the loan.
The Company’s joint venture in Tysons Corner Center, a 2,130,000 square foot regional shoppingcenter in McLean, Virginia, is currently expanding the property to include a 500,000 square foot officetower, a 430 unit residential tower and a 300 room Hyatt Regency hotel. The joint venture started theexpansion project in October 2011 and expects the office tower to be completed in 2014 and thebalance of the project to be completed in early 2015. The total cost of the project is estimated at$524.0 million, of which $262.0 million is estimated to be the Company’s pro rata share. The Companyhas funded $125.2 million of the total of $250.5 million incurred by the joint venture as ofDecember 31, 2013.
In November 2013, the Company started construction on the 175,000 square foot expansion ofFashion Outlets of Niagara Falls USA, a 525,000 square foot outlet center in Niagara Falls, New York.The Company expects to complete the project in late 2014. The total estimated project cost is$75.0 million. As of December 31, 2013, the Company had incurred $17.1 million of development costs.
Inflation:
In the last five years, inflation has not had a significant impact on the Company because of arelatively low inflation rate. Most of the leases at the Centers have rent adjustments periodicallythroughout the lease term. These rent increases are either in fixed increments or based on using anannual multiple of increases in the Consumer Price Index (‘‘CPI’’). In addition, approximately 6% to13% of the leases for spaces 10,000 square feet and under, expire each year, which enables theCompany to replace existing leases with new leases at higher base rents if the rents of the existingleases are below the then existing market rate. The Company has generally entered into leases thatrequire tenants to pay a stated amount for operating expenses, generally excluding property taxes,regardless of the expenses actually incurred at any Center, which places the burden of cost control on
49

the Company. Additionally, certain leases require the tenants to pay their pro rata share of operatingexpenses.
Seasonality:
The shopping center industry is seasonal in nature, particularly in the fourth quarter during theholiday season when retailer occupancy and retail sales are typically at their highest levels. In addition,shopping malls achieve a substantial portion of their specialty (temporary retailer) rents during theholiday season and the majority of percentage rent is recognized in the fourth quarter. As a result ofthe above, earnings are generally higher in the fourth quarter.
Critical Accounting Policies
The preparation of financial statements in conformity with generally accepted accounting principles(‘‘GAAP’’) in the United States of America requires management to make estimates and assumptionsthat affect the reported amounts of assets and liabilities and disclosure of contingent assets andliabilities at the date of the financial statements and the reported amounts of revenues and expensesduring the reporting period. Actual results could differ from those estimates.
Some of these estimates and assumptions include judgments on revenue recognition, estimates forcommon area maintenance and real estate tax accruals, provisions for uncollectible accounts,impairment of long-lived assets, the allocation of purchase price between tangible and intangible assets,and estimates for environmental matters. The Company’s significant accounting policies are describedin more detail in Note 2—Summary of Significant Accounting Policies in the Company’s Notes to theConsolidated Financial Statements. However, the following policies are deemed to be critical.
Revenue Recognition:
Minimum rental revenues are recognized on a straight-line basis over the term of the related lease.The difference between the amount of rent due in a year and the amount recorded as rental income isreferred to as the ‘‘straight line rent adjustment.’’ Currently, 68% of the Mall Store and FreestandingStore leases contain provisions for CPI rent increases periodically throughout the term of the lease.The Company believes that using an annual multiple of CPI increases, rather than fixed contractualrent increases, results in revenue recognition that more closely matches the cash revenue from eachlease and will provide more consistent rent growth throughout the term of the leases. Percentage rentsare recognized when the tenants’ specified sales targets have been met. Estimated recoveries fromcertain tenants for their pro rata share of real estate taxes, insurance and other shopping centeroperating expenses are recognized as revenues in the period the applicable expenses are incurred.Other tenants pay a fixed rate and these tenant recoveries are recognized as revenues on a straight-linebasis over the term of the related leases.
Property:
Maintenance and repair expenses are charged to operations as incurred. Costs for majorreplacements and betterments, which includes HVAC equipment, roofs, parking lots, etc., arecapitalized and depreciated over their estimated useful lives. Gains and losses are recognized upondisposal or retirement of the related assets and are reflected in earnings.
Property is recorded at cost and is depreciated using a straight-line method over the estimateduseful lives of the assets as follows:
Buildings and improvements . . . . . . . . . . . . . . . . . . . . . . . . . . . . . . 5 - 40 yearsTenant improvements . . . . . . . . . . . . . . . . . . . . . . . . . . . . . . . . . . . 5 - 7 yearsEquipment and furnishings . . . . . . . . . . . . . . . . . . . . . . . . . . . . . . . 5 - 7 years
50

Capitalization of Costs:
The Company capitalizes costs incurred in redevelopment, development, renovation andimprovement of properties. The capitalized costs include pre-construction costs essential to thedevelopment of the property, development costs, construction costs, interest costs, real estate taxes,salaries and related costs and other costs incurred during the period of development. These capitalizedcosts include direct and certain indirect costs clearly associated with the project. Indirect costs includereal estate taxes, insurance and certain shared administrative costs. In assessing the amounts of directand indirect costs to be capitalized, allocations are made to projects based on estimates of the actualamount of time spent on each activity. Indirect costs not clearly associated with specific projects areexpensed as period costs. Capitalized indirect costs are allocated to development and redevelopmentactivities based on the square footage of the portion of the building not held available for immediateoccupancy. If costs and activities incurred to ready the vacant space cease, then cost capitalization isalso discontinued until such activities are resumed. Once work has been completed on a vacant space,project costs are no longer capitalized. For projects with extended lease-up periods, the Company endsthe capitalization when significant activities have ceased, which does not exceed the shorter of aone-year period after the completion of the building shell or when the construction is substantiallycomplete.
Acquisitions:
The Company allocates the estimated fair value of acquisitions to land, building, tenantimprovements and identified intangible assets and liabilities, based on their estimated fair values. Inaddition, any assumed mortgage notes payable are recorded at their estimated fair values. Theestimated fair value of the land and buildings is determined utilizing an ‘‘as if vacant’’ methodology.Tenant improvements represent the tangible assets associated with the existing leases valued on a fairvalue basis at the acquisition date prorated over the remaining lease terms. The tenant improvementsare classified as an asset under property and are depreciated over the remaining lease terms.Identifiable intangible assets and liabilities relate to the value of in-place operating leases which comein three forms: (i) leasing commissions and legal costs, which represent the value associated with ‘‘costavoidance’’ of acquiring in-place leases, such as lease commissions paid under terms generallyexperienced in the Company’s markets; (ii) value of in-place leases, which represents the estimated lossof revenue and of costs incurred for the period required to lease the ‘‘assumed vacant’’ property to theoccupancy level when purchased; and (iii) above or below market value of in-place leases, whichrepresents the difference between the contractual rents and market rents at the time of the acquisition,discounted for tenant credit risks. Leasing commissions and legal costs are recorded in deferred chargesand other assets and are amortized over the remaining lease terms. The value of in-place leases arerecorded in deferred charges and other assets and amortized over the remaining lease terms plus anestimate of renewal of the acquired leases. Above or below market leases are classified in deferredcharges and other assets or in other accrued liabilities, depending on whether the contractual terms areabove or below market, and the asset or liability is amortized to minimum rents over the remainingterms of the leases. The remaining lease terms of below-market leases may include certain below-market fixed-rate renewal periods. In considering whether or not a lessee will execute a below-marketfixed-rate lease renewal option, the Company evaluates economic factors and certain qualitative factorsat the time of acquisition such as tenant mix in the center, the Company’s relationship with the tenantand the availability of competing tenant space.
The Company immediately expenses costs associated with business combinations as period costs.
Asset Impairment:
The Company assesses whether an indicator of impairment in the value of its properties exists byconsidering expected future operating income, trends and prospects, as well as the effects of demand,
51

competition and other economic factors. Such factors include projected rental revenue, operating costsand capital expenditures as well as estimated holding periods and capitalization rates. If an impairmentindicator exists, the determination of recoverability is made based upon the estimated undiscountedfuture net cash flows, excluding interest expense. The amount of impairment loss, if any, is determinedby comparing the fair value, as determined by a discounted cash flows analysis, with the carrying valueof the related assets. The Company generally holds and operates its properties long-term, whichdecreases the likelihood of their carrying values not being recoverable. Properties classified as held forsale are measured at the lower of the carrying amount or fair value less cost to sell.
The Company reviews its investments in unconsolidated joint ventures for a series of operatinglosses and other factors that may indicate that a decrease in the value of its investments has occurredwhich is other-than-temporary. The investment in each unconsolidated joint venture is evaluatedperiodically, and as deemed necessary, for recoverability and valuation declines that are other thantemporary.
Fair Value of Financial Instruments:
The fair value hierarchy distinguishes between market participant assumptions based on marketdata obtained from sources independent of the reporting entity and the reporting entity’s ownassumptions about market participant assumptions.
Level 1 inputs utilize quoted prices in active markets for identical assets or liabilities that theCompany has the ability to access. Level 2 inputs are inputs other than quoted prices included inLevel 1 that are observable for the asset or liability, either directly or indirectly. Level 2 inputs mayinclude quoted prices for similar assets and liabilities in active markets, as well as inputs that areobservable for the asset or liability (other than quoted prices), such as interest rates, foreign exchangerates, and yield curves that are observable at commonly quoted intervals. Level 3 inputs areunobservable inputs for the asset or liability, which is typically based on an entity’s own assumptions, asthere is little, if any, related market activity. In instances where the determination of the fair valuemeasurement is based on inputs from different levels of the fair value hierarchy, the level in the fairvalue hierarchy within which the entire fair value measurement falls is based on the lowest level inputthat is significant to the fair value measurement in its entirety. The Company’s assessment of thesignificance of a particular input to the fair value measurement in its entirety requires judgment, andconsiders factors specific to the asset or liability.
The Company calculates the fair value of financial instruments and includes this additionalinformation in the notes to consolidated financial statements when the fair value is different than thecarrying value of those financial instruments. When the fair value reasonably approximates the carryingvalue, no additional disclosure is made.
Deferred Charges:
Costs relating to obtaining tenant leases are deferred and amortized over the initial term of theagreement using the straight-line method. As these deferred leasing costs represent productive assetsincurred in connection with the Company’s provision of leasing arrangements at the Centers, therelated cash flows are classified as investing activities within the Company’s consolidated statements ofcash flows. Costs relating to financing of shopping center properties are deferred and amortized overthe life of the related loan using the straight-line method, which approximates the effective interestmethod. The ranges of the terms of the agreements are as follows:
Deferred lease costs . . . . . . . . . . . . . . . 1 - 15 yearsDeferred financing costs . . . . . . . . . . . . 1 - 15 years
52

Results of Operations
Many of the variations in the results of operations, discussed below, occurred because of thetransactions affecting the Company’s properties described above, including those related to theAcquisition Properties and the Redevelopment Properties as defined below.
For purposes of the discussion below, the Company defines ‘‘Same Centers’’ as those Centers thatare substantially complete and in operation for the entirety of both periods of the comparison.Non-Same Centers for comparison purposes include recently acquired properties (‘‘AcquisitionProperties’’) and those Centers or properties that are going through a substantial redevelopment oftenresulting in the closing of a portion of the Center (‘‘Redevelopment Properties’’). The Company movesa Center in and out of Same Centers based on whether the Center is substantially complete and inoperation for the entirety of both periods of the comparison. Accordingly, the Same Centers consist ofall consolidated centers, excluding the Acquisition Properties and the Redevelopment Properties for theperiods of comparison.
For comparison of the year ended December 31, 2013 to the year ended December 31, 2012, theAcquisition Properties include 500 North Michigan Avenue, FlatIron Crossing, Arrowhead TowneCenter, Kings Plaza Shopping Center, Green Acres Mall, Green Acres Adjacent, Camelback Colonnadeand Superstition Springs Center. For comparison of the year ended December 31, 2012 to the yearended December 31, 2011, the Acquisition Properties include Desert Sky Mall, the Kohl’s store atCapitola Mall, Superstition Springs Land, Fashion Outlets of Niagara Falls USA, the SDG AcquisitionProperties, 500 North Michigan Avenue, FlatIron Crossing, Arrowhead Towne Center and Kings PlazaShopping Center. The increase in revenues and expenses of the Acquisition Properties from the yearended December 31, 2012 to the year ended December 31, 2013 is primarily due to the acquisition ofKings Plaza Shopping Center and Green Acres Mall (See ‘‘Acquisitions and Dispositions’’ inManagement’s Overview and Summary). The increase in revenues and expenses of the AcquisitionProperties from the year ended December 31, 2011 to the year ended December 31, 2012 is primarilydue to the acquisition of the SDG Acquisition Properties (See ‘‘Acquisitions and Dispositions’’ inManagement’s Overview and Summary).
For the comparison of the year ended December 31, 2013 to the year ended December 31, 2012,the ‘‘Redevelopment Properties’’ are Fashion Outlets of Chicago and Paradise Valley Mall. For thecomparison of the year ended December 31, 2012 to the year ended December 31, 2011, the‘‘Redevelopment Property’’ is Fashion Outlets of Chicago. The increase in revenue and expenses of theRedevelopment Properties from the year ended December 31, 2012 to the year ended December 31,2013 is primarily due to the opening of Fashion Outlets of Chicago on August 1, 2013.
Unconsolidated joint ventures are reflected using the equity method of accounting. The Company’spro rata share of the results from these Centers is reflected in the consolidated statements ofoperations as equity in income of unconsolidated joint ventures.
The Company considers tenant annual sales per square foot (for tenants in place for a minimumof 12 months or longer and 10,000 square feet and under) for regional shopping centers, occupancyrates (excluding large retail stores or ‘‘Anchors’’) for the Centers and releasing spreads (i.e. acomparison of initial average base rent per square foot on leases executed during the trailing twelvemonths to average base rent per square foot at expiration for the leases expiring during the year basedon the spaces 10,000 square feet and under) to be key performance indicators of the Company’sinternal growth.
Tenant sales per square foot increased from $517 for the twelve months ended December 31, 2012to $562 for the twelve months ended December 31, 2013. Occupancy rate increased from 93.8% atDecember 31, 2012 to 94.6% at December 31, 2013. Releasing spreads increased 17.2% for the twelvemonths ended December 31, 2013. These calculations exclude Centers under development orredevelopment, the 2013 property dispositions (See ‘‘Acquisitions and Dispositions’’ and ‘‘OtherTransactions and Events’’ in Management’s Overview and Summary) and the 2014 Disposition Center.
53

Releasing spreads remained positive as the Company was able to lease available space at averagehigher rents than the expiring rental rates, resulting in a releasing spread of $7.21 per square foot($49.09 on new and renewal leases executed compared to $41.88 on leases expiring), representing a17.2% increase for the trailing twelve months ended December 31, 2013. The Company expects thatreleasing spreads will continue to be positive in 2014 as it renews or relets leases that are scheduled toexpire. These leases that are scheduled to expire represent 1,100,000 square feet of the Centers,accounting for 8.0% of the GLA of mall stores and freestanding stores, for spaces 10,000 square feetand under, as of December 31, 2013.
During the trailing twelve months ended December 31, 2013, the Company signed 317 new leasesand 384 renewal leases comprising approximately 1.2 million square feet of GLA, of which 1.0 millionsquare feet related to the consolidated Centers. The annual initial average base rent for new andrenewal leases was $49.09 per square foot for the trailing twelve months ended December 31, 2013 withan average tenant allowance of $12.58 per square foot.
Comparison of Years Ended December 31, 2013 and 2012
Revenues:
Minimum and percentage rents (collectively referred to as ‘‘rental revenue’’) increased by$132.6 million, or 28.3%, from 2012 to 2013. The increase in rental revenue is attributed to an increaseof $114.4 million from the Acquisition Properties, $9.6 million from the Same Centers and $8.6 millionfrom the Redevelopment Properties. The increase at the Same Centers is primarily attributed to anincrease in releasing spreads and an increase in tenant occupancy.
Rental revenue includes the amortization of above and below-market leases, the amortization ofstraight-line rents and lease termination income. The amortization of above and below-market leasesincreased from $5.2 million in 2012 to $6.6 million in 2013. The amortization of straight-line rentsincreased from $5.4 million in 2012 to $7.5 million in 2013. Lease termination income decreased from$4.6 million in 2012 to $3.3 million in 2013.
Tenant recoveries increased $90.2 million, or 36.4%, from 2012 to 2013. The increase in tenantrecoveries is attributed to increases of $80.5 million from the Acquisition Properties, $5.1 million fromthe Same Centers and $4.6 million from the Redevelopment Properties. The increase at the SameCenters is due to an increase in rent and tenant occupancy.
Management Companies’ revenue decreased from $41.2 million in 2012 to $40.2 million in 2013primarily due to a reduction in management fees from the sales of Kitsap Mall, Redmond Town Centerand Ridgmar Mall in 2013 and the conversion of Arrowhead Towne Center and FlatIron Crossing fromjoint ventures to consolidated Centers in 2012 (See ‘‘Acquisitions and Dispositions’’ in Management’sOverview and Summary).
Other revenues increased $10.3 million, or 25.7%, from 2012 to 2013. The increase in otherrevenues is attributed to an increase of $8.4 million from the Acquisition Properties and $2.1 millionfrom the Redevelopment Properties offset in part by a decrease of $0.2 million from the Same Centers.
Shopping Center and Operating Expenses:
Shopping center and operating expenses increased $77.9 million, or 30.9%, from 2012 to 2013. Theincrease in shopping center and operating expenses is attributed to an increase of $76.4 million fromthe Acquisition Properties and $4.8 million from Redevelopment Properties offset in part by a decreaseof $3.3 million from the Same Centers. The decrease at the Same Centers is primarily due to adecrease in property taxes and operations and maintenance costs.
54

Management Companies’ Operating Expenses:
Management Companies’ operating expenses increased $7.9 million from 2012 to 2013 due to anincrease in compensation costs.
REIT General and Administrative Expenses:
REIT general and administrative expenses increased by $7.4 million from 2012 to 2013 due to anincrease in share and unit-based compensation costs.
Depreciation and Amortization:
Depreciation and amortization increased $79.5 million from 2012 to 2013. The increase indepreciation and amortization is primarily attributed to an increase of $79.0 million from theAcquisition Properties and $2.4 million from the Redevelopment Properties offset in part by a decreaseof $1.9 million from the Same Centers.
Interest Expense:
Interest expense increased $32.9 million from 2012 to 2013. The increase in interest expense wasprimarily attributed to increases of $34.7 million from the Acquisition Properties and $5.0 million fromthe Same Centers offset in part by decreases of $4.7 million from the convertible senior notes (‘‘SeniorNotes’’), which were paid off in full in March 2012 (See Liquidity and Capital Resources), $1.6 millionfrom reduced borrowings under the line of credit, $0.1 million from the term loan and $0.4 millionfrom the Redevelopment Properties.
The above interest expense items are net of capitalized interest, which increased from $10.7 millionin 2012 to $10.8 million in 2013.
Equity in Income of Unconsolidated Joint Ventures:
Equity in income of unconsolidated joint ventures increased $88.3 million from 2012 to 2013. Theincrease is primarily attributed to the Company’s share of the gains on the sales in 2013 of RedmondTown Center Office of $44.4 million, Kitsap Mall of $28.1 million, Redmond Town Center of$18.3 million and Ridgmar Mall of $3.1 million offset in part by the Company’s share of the gain onthe sale of SanTan Village Power Center of $11.5 million in 2012 (See ‘‘Acquisitions and Dispositions’’in Management’s Overview and Summary).
(Loss) Gain on Remeasurement, Sale or Write down of Assets, net:
Gain on remeasurement, sale or write down of assets, net decreased $255.5 million from 2012 to2013. The decrease is primarily attributed to the $200.0 million of remeasurement gains from thepurchase of ownership interests in Arrowhead Towne Center and FlatIron Crossing in 2012, the$48.5 million gain on the sales of the Company’s ownership interests in Chandler Festival, ChandlerVillage Center, Chandler Gateway and NorthPark Center in 2012 and the $82.2 million impairment lossin 2013 offset in part by the $51.2 million of remeasurement gains from the Camelback ColonnadeRestructuring, the purchase of the remaining ownership interest in Superstition Springs Center (See‘‘Acquisitions and Dispositions’’ in Management’s Overview and Summary) and the $19.4 millionwrite-off of development costs in 2012.
Total Income from Discontinued Operations:
Total income from discontinued operations increased $226.7 million from 2012 to 2013. Theincrease in income from discontinued operations is primarily due to the $293.4 million of gain on thesales of Green Tree Mall, Northridge Mall, Rimrock Mall, Chesterfield Towne Center and Centre at
55

Salisbury in 2013 offset in part by the $24.6 million impairment loss on Fiesta Mall in 2012 (See‘‘Acquisitions and Dispositions’’ and ‘‘Other Transactions and Events’’ in Management’s Overview andSummary). This overall increase was offset in part by the $77.0 million of gain on the sales anddispositions of Valley View Center, Prescott Gateway, Carmel Plaza and Hilton Village in 2012 (See‘‘Acquisitions and Dispositions’’ and ‘‘Other Transactions and Events’’ in Management’s Overview andSummary).
Net Income:
Net income increased $82.6 million from 2012 to 2013. The increase in net income is primarilyattributed to increases of $226.7 million from discontinued operations, $88.3 million from equity inincome of unconsolidated joint ventures and $27.9 million from the operating results of theconsolidated properties offset in part by a decrease of $255.5 million from gains on remeasurement,sale or write down of assets, net, as discussed above.
Funds From Operations (‘‘FFO’’):
Primarily as a result of the factors mentioned above, FFO—diluted decreased 8.7% from$577.9 million in 2012 to $527.6 million in 2013. For a reconciliation of FFO and FFO—diluted to netincome available to common stockholders, the most directly comparable GAAP financial measure, see‘‘Funds From Operations (‘‘FFO’’) and Adjusted Funds From Operations (‘‘AFFO’’).’’
Operating Activities:
Cash provided by operating activities increased from $351.3 million in 2012 to $422.0 million in2013. The increase was primarily due to changes in assets and liabilities and the results of theAcquisition Properties as discussed above.
Investing Activities:
Cash provided by investing activities increased $1.2 billion from 2012 to 2013. The increase in cashprovided by investing activities was primarily due to a decrease in the acquisitions of property of$545.6 million, an increase in distributions from unconsolidated joint ventures of $393.6 million and anincrease in proceeds from the sale of assets of $279.4 million. The increase in distributions fromunconsolidated joint ventures is primarily attributed to the distribution of the Company’s share of netproceeds from the refinancing of the mortgage note payable on Tysons Corner Center in 2013 (SeeLiquidity and Capital Resources) and the Company’s share of cash proceeds from the sales of KitsapMall, Redmond Town Center and Redmond Town Center Office in 2013 (See ‘‘Acquisitions andDispositions’’ and ‘‘Other Transactions and Events’’ in Management’s Overview and Summary).
Financing Activities:
Cash used in financing activities increased $1.3 billion from 2012 to 2013. The increase in cashused in financing activities was primarily due to an increase in payments on mortgages, bank and othernotes payable of $679.2 million and a decrease in proceeds from mortgages, bank and other notespayable of $620.7 million.
Comparison of Years Ended December 31, 2012 and 2011
Revenues:
Rental revenue increased by $70.6 million, or 17.7%, from 2011 to 2012. The increase in rentalrevenue is attributed to a increase of $74.0 million from the Acquisition Properties offset in part by adecrease of $3.4 million from the Same Centers. The decrease at the Same Centers is primarily
56

attributed to the decrease in above and below-market leases and lease termination income as notedbelow.
The amortization of above and below market leases decreased from $9.3 million in 2011 to$5.2 million in 2012. The amortization of straight-line rents increased from $4.6 million in 2011 to$5.4 million in 2012. Lease termination income decreased from $5.5 million in 2011 to $4.6 million in2012.
Tenant recoveries increased by $31.7 million from 2011 to 2012. The increase in tenant recoveriesis primarily attributed to an increase of $32.3 million from the Acquisition Properties offset in part by adecrease of $0.6 million from the Same Centers.
Management Companies’ revenue increased from $40.4 million in 2011 to $41.2 million in 2012primarily due to an increase in development fees.
Shopping Center and Operating Expenses:
Shopping center and operating expenses increased $38.1 million, or 17.8%, from 2011 to 2012. Theincrease in shopping center and operating expenses is attributed to an increase of $41.2 million fromthe Acquisition Properties offset in part by a decrease of $3.1 million from the Same Centers. Thedecrease at the Same Centers is primarily due to a reduction in property taxes and maintenance costs.
Management Companies’ Operating Expenses:
Management Companies’ operating expenses decreased $1.0 million from 2011 to 2012 due to adecrease in compensation costs.
REIT General and Administrative Expenses:
REIT general and administrative expenses decreased by $0.7 million from 2011 to 2012.
Depreciation and Amortization:
Depreciation and amortization increased $49.6 million from 2011 to 2012. The increase indepreciation and amortization is primarily attributed to an increase of $45.8 million from theAcquisition Properties and $3.8 million from the Same Centers.
Interest Expense:
Interest expense decreased $2.9 million from 2011 to 2012. The decrease in interest expense wasprimarily attributed to decreases of $25.3 million from the Senior Notes, which were paid off in full inMarch 2012 (See Liquidity and Capital Resources), $7.7 million from the Same Centers and$1.3 million from the Redevelopment Property. These decreases were offset in part by increases of$19.5 million from the Acquisition Properties, $8.9 million from the borrowings under the line of creditand $3.0 million from the term loans. The decrease from the Same Centers was primarily due to thematurity of a $400.0 million interest rate swap agreement in April 2011.
The above interest expense items are net of capitalized interest, which decreased from$11.9 million in 2011 to $10.7 million in 2012 due to a decrease in interest rates in 2012.
Loss on Early Extinguishment of Debt:
The loss on early extinguishment of debt of $1.5 million is due to the loss from the repurchase ofthe Senior Notes in 2011.
57

Equity in Income of Unconsolidated Joint Ventures:
Equity in income of unconsolidated joint ventures decreased $215.4 million from 2011 to 2012. Thedecrease in equity in income of unconsolidated joint ventures is primarily attributed to the Company’spro rata share of the gain of $188.3 million in connection with the SDG Transaction (See ‘‘Acquisitionsand Dispositions’’ in Management’s Overview and Summary) in 2011. The remaining decrease in equityin income from unconsolidated joint ventures is attributed to the Company’s $12.5 million pro ratashare of the remeasurement gain on the acquisition of an underlying ownership interest in KierlandCommons in 2011 (See ‘‘Acquisitions and Dispositions’’ in Management’s Overview and Summary), andthe Company’s $7.8 million pro rata share of the gain on early extinguishment of debt of its jointventure in Granite Run Mall in 2011 (See ‘‘Other Transactions and Events’’ in Management’s Overviewand Summary).
Gain (loss) on Remeasurement, Sale or Write down of Assets, net:
Gain on remeasurement, sale or write down of assets, net increased $250.7 million from 2011 to2012. The increase is primarily attributed to the $115.7 million remeasurement gain on the purchase ofownership interest in Arrowhead Towne Center in 2012, the $84.2 million remeasurement gain on thepurchase of ownership interest in FlatIron Crossing in 2012 and the $24.6 million gain on the buyout ofthe Company’s ownership interest in NorthPark Center in 2012 (See ‘‘Acquisitions and Dispositions’’ inManagement’s Overview and Summary).
Total Income (loss) from Discontinued Operations:
Total income from discontinued operations increased $133.6 million from 2011 to 2012. Theincrease is primarily due to the gains on the 2012 dispositions of Valley View Center of $49.7 million,Prescott Gateway of $16.3 million and Carmel Plaza of $7.8 million and the loss on the 2011disposition of Shoppingtown Mall of $39.7 million and the impairment charge of $19.2 million on TheBorgata in 2011. These increases were offset in part by the impairment loss of $24.6 million on FiestaMall in 2012. See ‘‘Acquisitions and Dispositions’’ and ‘‘Other Transactions and Events’’ inManagement’s Overview and Summary.
Net Income:
Net income increased $197.3 million from 2011 to 2012. The increase in net income is primarilyattributed to increases of $250.7 million from gains on remeasurement, sale or write down of assets,net, and $133.6 million from discontinued operations offset in part by a decrease of $215.4 million fromequity in income of unconsolidated joint ventures.
Funds From Operations (‘‘FFO’’):
Primarily as a result of the factors mentioned above, FFO—diluted increased 44.6% from$399.6 million in 2011 to $577.9 million in 2012. For a reconciliation of FFO and FFO—diluted to netincome available to common stockholders, the most directly comparable GAAP financial measure, see‘‘Funds From Operations (‘‘FFO’’) and Adjusted Funds From Operations (‘‘AFFO’’).’’
Operating Activities:
Cash provided by operating activities increased from $237.3 million in 2011 to $351.3 million in2012. The increase was primarily due to changes in assets and liabilities and the results at the Centersas discussed above.
58

Investing Activities:
Cash used in investing activities increased from $212.1 million in 2011 to $963.4 million in 2012.The increase in cash used in investing activities was primarily due to increases of $936.7 million fromacquisitions of properties and $83.3 million from the development, redevelopment and renovations ofproperties offset in part by an increase of $119.7 million in proceeds from the sale of assets, anincrease of $106.6 million in distributions from unconsolidated joint ventures and a decrease of$60.0 million in contributions to unconsolidated joint ventures. The increase in the acquisitions ofproperties is primarily due to the purchases of Kings Plaza Shopping Center and the remainingownership interests in FlatIron Crossing and Arrowhead Towne Center in 2012 (See ‘‘Acquisitions andDispositions’’ in Management’s Overview and Summary). The increase in proceeds from the sale ofassets is primarily due to the buyout of the Company’s ownership interest in NorthPark Center and thesales of The Borgata, Carmel Plaza, Hilton Village and ownership interests in Chandler Festival,Chandler Village Center and Chandler Gateway in 2012. The increase in distributions from theunconsolidated joint ventures is primarily due to the distribution of the Company’s pro rata share ofthe excess refinancing proceeds of Queens Center in 2012.
Financing Activities:
Cash provided by financing activities increased from a deficit of $403.6 million in 2011 to a surplusof $610.6 million in 2012. The increase in cash provided by financing activities was primarily due to anincrease in proceeds from mortgages, bank and other notes payable of $2.4 billion, the repurchase ofthe Senior Notes of $180.3 million in 2012 and the net proceeds from the at-the-market program of$175.6 million (See Liquidity and Capital Resources) offset in part by an increase in payments onmortgages, bank and other notes payable of $1.7 billion.
Liquidity and Capital Resources
The Company anticipates meeting its liquidity needs for its operating expenses and debt serviceand dividend requirements for the next twelve months through cash generated from operations,working capital reserves and/or borrowings under its unsecured line of credit.
The following tables summarize capital expenditures and lease acquisition costs incurred at theCenters for the years ended December 31:
2013 2012 2011(Dollars in thousands)
Consolidated Centers:Acquisitions of property and equipment . . . . . . . . . . . . . . . . . . . . . $591,565 $1,313,091 $314,575Development, redevelopment, expansion and renovation of Centers . 164,340 158,474 88,842Tenant allowances . . . . . . . . . . . . . . . . . . . . . . . . . . . . . . . . . . . . . 20,949 18,116 19,418Deferred leasing charges . . . . . . . . . . . . . . . . . . . . . . . . . . . . . . . . 23,926 23,551 29,280
$800,780 $1,513,232 $452,115
Joint Venture Centers (at Company’s pro rata share):Acquisitions of property and equipment . . . . . . . . . . . . . . . . . . . . . $ 8,182 $ 5,080 $143,390Development, redevelopment, expansion and renovation of Centers . 118,764 79,642 37,712Tenant allowances . . . . . . . . . . . . . . . . . . . . . . . . . . . . . . . . . . . . . 8,086 6,422 8,406Deferred leasing charges . . . . . . . . . . . . . . . . . . . . . . . . . . . . . . . . 3,331 4,215 4,910
$138,363 $ 95,359 $194,418
The Company expects amounts to be incurred during the next twelve months for tenant allowancesand deferred leasing charges to be comparable or less than 2013 and that capital for those expenditureswill be available from working capital, cash flow from operations, borrowings on property specific debt
59

or unsecured corporate borrowings. The Company expects to incur between $250 million and$350 million during the next twelve months for development, redevelopment, expansion andrenovations. Capital for these major expenditures, developments and/or redevelopments has been, andis expected to continue to be, obtained from a combination of debt or equity financings, which areexpected to include borrowings under the Company’s line of credit and construction loans. TheCompany has also generated liquidity in the past through equity offerings, property refinancings, jointventure transactions and the sale of non-core assets. For example, during the year ended December 31,2013, the Company refinanced the mortgage note payable at Tysons Corner Center. The Company’s prorata share of the net proceeds was $275.0 million, which was used to pay down its line of credit. TheCompany has also recently sold certain non-core assets and has announced plans to sell additionalnon-core assets in 2014, depending on market conditions. Furthermore, the Company has filed a shelfregistration statement which registered an unspecified amount of common stock, preferred stock,depositary shares, debt securities, warrants, rights and units.
The capital and credit markets can fluctuate and, at times, limit access to debt and equity financingfor companies. As demonstrated by the Company’s activity in 2013, including through its $500 millionATM Program as discussed below and its $1.5 billion line of credit, the Company has been able toaccess capital; however, there is no assurance the Company will be able to do so in future periods oron similar terms and conditions. Many factors impact the Company’s ability to access capital, such as itsoverall debt level, interest rates, interest coverage ratios and prevailing market conditions. In the eventthat the Company has significant tenant defaults as a result of the overall economy and general marketconditions, the Company could have a decrease in cash flow from operations, which could result inincreased borrowings under its line of credit. These events could result in an increase in the Company’sproportion of floating rate debt, which would cause it to be subject to interest rate fluctuations in thefuture.
The Company has an equity distribution agreement (‘‘Distribution Agreement’’) with a number ofsales agents to issue and sell, from time to time, shares of common stock, having an aggregate offeringprice of up to $500 million (the ‘‘Shares’’). Sales of the Shares, if any, may be made in privatelynegotiated transactions and/or any other method permitted by law, including sales deemed to be an ‘‘atthe market’’ offering, which includes sales made directly on the New York Stock Exchange or salesmade to or through a market maker other than on an exchange. This offering is referred to herein asthe ‘‘ATM Program’’. During the three months ended December 31, 2013, the Company did not sellany shares of common stock under the ATM Program. During the year ended December 31, 2013, theCompany sold 2,456,956 shares of common stock under the ATM Program in exchange for aggregategross proceeds of $173.0 million and net proceeds of $171.1 million after commissions and othertransaction costs. The proceeds from the sales were used to pay down the Company’s line of credit. Asof December 31, 2013, $149.1 million remained available to be sold under the ATM Program. Actualfuture sales will depend upon a variety of factors including but not limited to market conditions, thetrading price of the Company’s common stock and our capital needs. The Company has no obligationto sell the remaining shares available for sale under the ATM Program.
The Company’s total outstanding loan indebtedness at December 31, 2013 was $6.0 billion(consisting of $4.6 billion of consolidated debt, less $0.3 billion attributable to noncontrolling interests,plus $1.7 billion of its pro rata share of unconsolidated joint venture debt). The majority of theCompany’s debt consists of fixed-rate conventional mortgage notes collateralized by individualproperties. The Company expects that all of the maturities during the next twelve months will berefinanced, restructured, extended and/or paid off from the Company’s line of credit or cash on hand.
The Company has a $1.5 billion revolving line of credit that initially bore interest at LIBOR plus aspread of 1.75% to 3.0%, depending on the Company’s overall leverage levels, and was to mature onMay 2, 2015 with a one-year extension option. The line of credit had the ability to be expanded,depending on certain conditions, up to a total facility of $2.0 billion less the outstanding balance of the$125.0 million unsecured term loan, as discussed below.
60

On August 6, 2013, the Company’s line of credit was amended and extended. The amended facilityprovides for an interest rate of LIBOR plus a spread of 1.375% to 2.0%, depending on the Company’soverall leverage levels, and matures on August 6, 2018. Based on the Company’s leverage level as ofDecember 31, 2013, the borrowing rate on the facility was LIBOR plus 1.50%. In addition, the line ofcredit can now be expanded, depending on certain conditions, up to a total facility of $2.0 billion(without giving effect to the $125.0 million unsecured term loan described below). All obligations underthe amended facility are unconditionally guaranteed only by the Company. At December 31, 2013, totalborrowings under the line of credit were $30.0 million with an average effective interest rate of 1.85%.
The Company has a $125.0 million unsecured term loan under the Company’s line of credit thatbears interest at LIBOR plus a spread of 1.95% to 3.20%, depending on the Company’s overallleverage levels, and matures on December 8, 2018. Based on the Company’s leverage level atDecember 31, 2013, the borrowing rate was LIBOR plus 2.20%. As of December 31, 2013, the totalinterest rate was 2.51%.
At December 31, 2013, the Company was in compliance with all applicable loan covenants underits agreements.
At December 31, 2013, the Company had cash and cash equivalents available of $69.7 million.
Off-Balance Sheet Arrangements:
The Company accounts for its investments in joint ventures that it does not have a controllinginterest or is not the primary beneficiary using the equity method of accounting and those investmentsare reflected on the consolidated balance sheets of the Company as investments in unconsolidated jointventures.
In addition, one joint venture has secured debt that could become recourse debt to the Companyin excess of the Company’s pro rata share, should the joint venture be unable to discharge theobligation of the related debt. At December 31, 2013, the balance of the debt that could be recourse tothe Company was $33.5 million offset in part by an indemnity agreement from a joint venture partnerfor $16.8 million. The maturity of the recourse debt, net of indemnification, is $16.8 million in 2015.
Additionally, as of December 31, 2013, the Company is contingently liable for $18.9 million inletters of credit guaranteeing performance by the Company of certain obligations relating to theCenters. The Company does not believe that these letters of credit will result in a liability to theCompany.
Contractual Obligations:
The following is a schedule of contractual obligations as of December 31, 2013 for theconsolidated Centers over the periods in which they are expected to be paid (in thousands):
Payment Due by Period
Less than More thanContractual Obligations Total 1 year 1 - 3 years 3 - 5 years five years
Long-term debt obligations(includes expected interest payments) . . . . . . $5,002,357 $169,673 $1,048,824 $1,344,239 $2,439,621Operating lease obligations(1) . . . . . . . . . . . 369,416 15,339 30,749 26,641 296,687Purchase obligations(1) . . . . . . . . . . . . . . . . 57,969 57,969 — — —Other long-term liabilities . . . . . . . . . . . . . . 331,833 291,315 3,138 3,470 33,910
$5,761,575 $534,296 $1,082,711 $1,374,350 $2,770,218
(1) See Note 18—Commitments and Contingencies in the Company’s Notes to the Consolidated FinancialStatements.
61

Funds From Operations (‘‘FFO’’) and Adjusted Funds From Operations (‘‘AFFO’’)
The Company uses FFO in addition to net income to report its operating and financial results andconsiders FFO and FFO-diluted as supplemental measures for the real estate industry and asupplement to Generally Accepted Accounting Principles (‘‘GAAP’’) measures. The NationalAssociation of Real Estate Investment Trusts (‘‘NAREIT’’) defines FFO as net income (loss)(computed in accordance with GAAP), excluding gains (or losses) from extraordinary items and sales ofdepreciated operating properties, plus real estate related depreciation and amortization, impairmentwrite-downs of real estate and write-downs of investments in an affiliate where the write-downs havebeen driven by a decrease in the value of real estate held by the affiliate and after adjustments forunconsolidated joint ventures. Adjustments for unconsolidated joint ventures are calculated to reflectFFO on the same basis.
Adjusted FFO (‘‘AFFO’’) excludes the FFO impact of Shoppingtown Mall and Valley View Centerfor the years ended December 31, 2012 and 2011. In December 2011, the Company conveyedShoppingtown Mall to the lender by a deed-in-lieu of foreclosure. In July 2010, a court-appointedreceiver assumed operational control of Valley View Center and responsibility for managing all aspectsof the property. Valley View Center was sold by the receiver on April 23, 2012, and the relatednon-recourse mortgage loan obligation was fully extinguished on that date, resulting in a gain onextinguishment of debt of $104.0 million. On May 31, 2012, the Company conveyed Prescott Gatewayto the lender by a deed-in-lieu of foreclosure and the debt was forgiven resulting in a gain onextinguishment of debt of $16.3 million. AFFO excludes the gain on extinguishment of debt on PrescottGateway for the twelve months ended December 31, 2012.
FFO and FFO on a diluted basis are useful to investors in comparing operating and financialresults between periods. This is especially true since FFO excludes real estate depreciation andamortization, as the Company believes real estate values fluctuate based on market conditions ratherthan depreciating in value ratably on a straight-line basis over time. The Company believes that such apresentation also provides investors with a more meaningful measure of its operating results incomparison to the operating results of other REITs. The Company believes that AFFO and AFFO ona diluted basis provide useful supplemental information regarding the Company’s performance as theyshow a more meaningful and consistent comparison of the Company’s operating performance and allowinvestors to more easily compare the Company’s results without taking into account non-cash creditsand charges on properties controlled by either a receiver or loan servicer. The Company believes thatFFO and AFFO on a diluted basis are measures investors find most useful in measuring the dilutiveimpact of outstanding convertible securities.
The Company believes that FFO and AFFO do not represent cash flow from operations as definedby GAAP, should not be considered as an alternative to net income as defined by GAAP, and are notindicative of cash available to fund all cash flow needs. The Company also cautions that FFO andAFFO, as presented, may not be comparable to similarly titled measures reported by other real estateinvestment trusts.
Management compensates for the limitations of FFO and AFFO by providing investors withfinancial statements prepared according to GAAP, along with this detailed discussion of FFO andAFFO and a reconciliation of FFO and AFFO and FFO and AFFO-diluted to net income available tocommon stockholders. Management believes that to further understand the Company’s performance,FFO and AFFO should be compared with the Company’s reported net income and considered inaddition to cash flows in accordance with GAAP, as presented in the Company’s consolidated financialstatements.
62

The following reconciles net income attributable to the Company to FFO and FFO-diluted for theyears ended December 31, 2013, 2012, 2011, 2010 and 2009 and FFO and FFO—diluted to AFFO andAFFO—diluted for the same periods (dollars and shares in thousands):
2013 2012 2011 2010 2009
Net income attributable to the Company . . . . . . . . . . . . . . . . $ 420,090 $ 337,426 $ 156,866 $ 25,190 $ 120,742Adjustments to reconcile net income attributable to the Company
to FFO—basic:Noncontrolling interests in the Operating Partnership . . . . . . . 29,637 27,359 13,529 2,497 17,517(Gain) loss on remeasurement, sale or write down of
consolidated assets, net . . . . . . . . . . . . . . . . . . . . . . . . . (258,310) (159,575) 76,338 (474) (121,766)Add: gain (loss) on undepreciated assets—consolidated assets . . 2,546 (390) 2,277 — 4,762Add: noncontrolling interests share of (loss) gain on sale of
assets—consolidated joint ventures . . . . . . . . . . . . . . . . . (2,082) 1,899 (1,441) 2 310(Gain) loss on remeasurement, sale or write down of assets—
unconsolidated joint ventures(1) . . . . . . . . . . . . . . . . . . . (94,372) (2,019) (200,828) (823) 7,642Add: gain (loss) on sale of undepreciated assets—
unconsolidated joint ventures(1) . . . . . . . . . . . . . . . . . . . 602 1,163 51 613 (152)Depreciation and amortization on consolidated assets . . . . . . . 374,425 307,193 269,286 246,812 266,164Less: noncontrolling interests in depreciation and
amortization—consolidated joint ventures . . . . . . . . . . . . . (19,928) (18,561) (18,022) (17,979) (7,871)Depreciation and amortization—unconsolidated joint
ventures(1) . . . . . . . . . . . . . . . . . . . . . . . . . . . . . . . . 86,866 96,228 115,431 109,906 106,435Less: depreciation on personal property . . . . . . . . . . . . . . . . (11,900) (12,861) (13,928) (14,436) (13,740)
FFO—basic and diluted . . . . . . . . . . . . . . . . . . . . . . . . . . . 527,574 577,862 399,559 351,308 380,043Shoppingtown Mall . . . . . . . . . . . . . . . . . . . . . . . . . . . . . — 422 3,491 — —Valley View Center . . . . . . . . . . . . . . . . . . . . . . . . . . . . . — (101,105) 8,786 — —Prescott Gateway . . . . . . . . . . . . . . . . . . . . . . . . . . . . . . — (16,296) — — —
AFFO and AFFO—diluted . . . . . . . . . . . . . . . . . . . . . . . . . $ 527,574 $ 460,883 $ 411,836 $351,308 $ 380,043
Weighted average number of FFO shares outstanding for:FFO—basic(2) . . . . . . . . . . . . . . . . . . . . . . . . . . . . . . . . . 149,444 144,937 142,986 132,283 93,010Adjustments for the impact of dilutive securities in computing
FFO—diluted:Share and unit-based compensation . . . . . . . . . . . . . . . . . . 82 — — — —
FFO—diluted(3) . . . . . . . . . . . . . . . . . . . . . . . . . . . . . . . . 149,526 144,937 142,986 132,283 93,010
(1) Unconsolidated assets are presented at the Company’s pro rata share.
(2) Calculated based upon basic net income as adjusted to reach basic FFO. During the years ended December 31, 2013, 2012,2011, 2010 and 2009, there were 9.8 million, 10.9 million, 11.4 million, 11.6 million and 11.8 million OP Units outstanding,respectively.
(3) The computation of FFO and AFFO—diluted shares outstanding includes the effect of share and unit-based compensationplans and the Senior Notes using the treasury stock method. It also assumes the conversion of MACWH, LP common andpreferred units to the extent that they are dilutive to the FFO and AFFO-diluted computation.
ITEM 7A. QUANTITATIVE AND QUALITATIVE DISCLOSURES ABOUT MARKET RISK
The Company’s primary market risk exposure is interest rate risk. The Company has managed andwill continue to manage interest rate risk by (1) maintaining a ratio of fixed rate, long-term debt tototal debt such that floating rate exposure is kept at an acceptable level, (2) reducing interest rateexposure on certain long-term floating rate debt through the use of interest rate caps and/or swaps withmatching maturities where appropriate, (3) using treasury rate locks where appropriate to fix rates onanticipated debt transactions, and (4) taking advantage of favorable market conditions for long-termdebt and/or equity.
63

The following table sets forth information as of December 31, 2013 concerning the Company’s longterm debt obligations, including principal cash flows by scheduled maturity, weighted average interestrates and estimated fair value (‘‘FV’’) (dollars in thousands):
For the years ending December 31,
2014 2015 2016 2017 2018 Thereafter Total FV
CONSOLIDATED CENTERS:Long term debt:
Fixed rate . . . . . . . . . . . . . $ 74,253 $507,350 $421,630 $ 69,312 $696,435 $2,344,969 $4,113,949 $4,201,081Average interest rate . . . . . . 3.88% 5.56% 5.40% 3.67% 3.38% 4.04% 4.25%Floating rate . . . . . . . . . . . 90,000 — 67,500 156,278 155,000 — 468,778 461,226Average interest rate . . . . . . 2.72% —% 2.00% 2.98% 2.38% —% 2.59%
Total debt—ConsolidatedCenters . . . . . . . . . . . . . . . $164,253 $507,350 $489,130 $225,590 $851,435 $2,344,969 $4,582,727 $4,662,307
UNCONSOLIDATED JOINTVENTURE CENTERS:
Long term debt (at Company’spro rata share):Fixed rate . . . . . . . . . . . . . $ 50,786 $217,219 $274,705 $ 66,131 $105,144 $ 920,011 $1,633,996 $1,663,306Average interest rate . . . . . . 6.66% 5.55% 6.59% 4.45% 4.39% 3.70% 4.60%Floating rate . . . . . . . . . . . 563 14,312 26,067 1,137 73,864 — 115,943 114,304Average interest rate . . . . . . 2.31% 3.06% 3.37% 2.20% 2.23% —% 2.59%
Total debt—Unconsolidated JointVenture Centers . . . . . . . . . $ 51,349 $231,531 $300,772 $ 67,268 $179,008 $ 920,011 $1,749,939 $1,777,610
The Consolidated Centers’ total fixed rate debt at December 31, 2013 and 2012 was $4.1 billionand $3.7 billion, respectively. The average interest rate on such fixed rate debt at December 31, 2013and 2012 was 4.25% and 4.40%, respectively. The Consolidated Centers’ total floating rate debt atDecember 31, 2013 and 2012 was $0.5 billion and $1.5 billion, respectively. The average interest rate onfloating rate debt at December 31, 2013 and 2012 was 2.59% and 3.05%, respectively.
The Company’s pro rata share of the Unconsolidated Joint Venture Centers’ fixed rate debt atDecember 31, 2013 and 2012 was $1.6 billion and $1.5 billion, respectively. The average interest rate onsuch fixed rate debt at December 31, 2013 and 2012 was 4.60% and 5.27%, respectively. TheCompany’s pro rata share of the Unconsolidated Joint Venture Centers’ floating rate debt atDecember 31, 2013 and 2012 was $115.9 million and $178.3 million, respectively. The average interestrate on such floating rate debt at December 31, 2013 and 2012 was 2.59% and 3.69%, respectively.
The Company uses derivative financial instruments in the normal course of business to manage orhedge interest rate risk and records all derivatives on the balance sheet at fair value (See Note 5—Derivative Instruments and Hedging Activities in the Company’s Notes to the Consolidated FinancialStatements). Interest rate cap agreements offer protection against floating rates on the notional amountfrom exceeding the rates noted in the above schedule, and interest rate swap agreements effectivelyreplace a floating rate on the notional amount with a fixed rate as noted above. As of December 31,2013, the Company did not have any interest rate cap or swap agreements in place.
In addition, the Company has assessed the market risk for its floating rate debt and believes that a1% increase in interest rates would decrease future earnings and cash flows by approximately$5.8 million per year based on $584.7 million of floating rate debt outstanding at December 31, 2013.
The fair value of the Company’s long-term debt is estimated based on a present value modelutilizing interest rates that reflect the risks associated with long-term debt of similar risk and duration.In addition, the method of computing fair value for mortgage notes payable included a credit valueadjustment based on the estimated value of the property that serves as collateral for the underlyingdebt (See Note 10—Mortgage Notes Payable and Note 11—Bank and Other Notes Payable in theCompany’s Notes to the Consolidated Financial Statements).
64

ITEM 8. FINANCIAL STATEMENTS AND SUPPLEMENTARY DATA
Refer to the Index to Financial Statements and Financial Statement Schedules for the requiredinformation appearing in Item 15.
ITEM 9. CHANGES IN AND DISAGREEMENTS WITH ACCOUNTANTS ON ACCOUNTING ANDFINANCIAL DISCLOSURE
None.
ITEM 9A. CONTROLS AND PROCEDURES
Conclusion Regarding Effectiveness of Disclosure Controls and Procedures
As required by Rule 13a-15(b) under the Securities and Exchange Act of 1934, as amended (the‘‘Exchange Act’’), management carried out an evaluation, under the supervision and with theparticipation of the Company’s Chief Executive Officer and Chief Financial Officer, of the effectivenessof the Company’s disclosure controls and procedures as of the end of the period covered by thisAnnual Report on Form 10-K. Based on their evaluation as of December 31, 2013, the Company’sChief Executive Officer and Chief Financial Officer have concluded that the Company’s disclosurecontrols and procedures (as defined in Rule 13a-15(e) and 15d-15(e) under the Exchange Act) wereeffective to ensure that the information required to be disclosed by the Company in the reports that itfiles or submits under the Exchange Act is (a) recorded, processed, summarized, and reported withinthe time periods specified in the SEC’s rules and forms and (b) accumulated and communicated to theCompany’s management, including its Chief Executive Officer and Chief Financial Officer, or personsperforming similar functions, as appropriate to allow timely decisions regarding required disclosure.
Management’s Report on Internal Control Over Financial Reporting
The Company’s management is responsible for establishing and maintaining adequate internalcontrol over financial reporting (as defined in Rule 13a-15(f) under the Exchange Act). The Company’smanagement assessed the effectiveness of the Company’s internal control over financial reporting as ofDecember 31, 2013. In making this assessment, the Company’s management used the criteria set forthby the Committee of Sponsoring Organizations of the Treadway Commission in Internal Control—Integrated Framework (1992). The Company’s management concluded that, as of December 31, 2013,its internal control over financial reporting was effective based on this assessment.
KPMG LLP, the independent registered public accounting firm that audited the Company’s 2013,2012 and 2011 consolidated financial statements included in this Annual Report on Form 10-K, hasissued a report on the Company’s internal control over financial reporting which follows below.
Changes in Internal Control over Financial Reporting
There were no changes in the Company’s internal control over financial reporting during thequarter ended December 31, 2013 that have materially affected, or are reasonably likely to materiallyaffect, the Company’s internal control over financial reporting.
65

Report of Independent Registered Public Accounting Firm
The Board of Directors and Stockholders ofThe Macerich Company:
We have audited The Macerich Company’s (the ‘‘Company’’) internal control over financialreporting as of December 31, 2013, based on criteria established in Internal Control—IntegratedFramework (1992) issued by the Committee of Sponsoring Organizations of the Treadway Commission(COSO). The Company’s management is responsible for maintaining effective internal control overfinancial reporting and for its assessment of the effectiveness of internal control over financialreporting, included in the accompanying Management’s Report on Internal Control over FinancialReporting. Our responsibility is to express an opinion on the Company’s internal control over financialreporting based on our audit.
We conducted our audit in accordance with the standards of the Public Company AccountingOversight Board (United States). Those standards require that we plan and perform the audit to obtainreasonable assurance about whether effective internal control over financial reporting was maintainedin all material respects. Our audit included obtaining an understanding of internal control overfinancial reporting, assessing the risk that a material weakness exists, and testing and evaluating thedesign and operating effectiveness of internal control based on the assessed risk. Our audit alsoincluded performing such other procedures as we considered necessary in the circumstances. We believethat our audit provides a reasonable basis for our opinion.
A company’s internal control over financial reporting is a process designed to provide reasonableassurance regarding the reliability of financial reporting and the preparation of financial statements forexternal purposes in accordance with generally accepted accounting principles. A company’s internalcontrol over financial reporting includes those policies and procedures that (1) pertain to themaintenance of records that, in reasonable detail, accurately and fairly reflect the transactions anddispositions of the assets of the company; (2) provide reasonable assurance that transactions arerecorded as necessary to permit preparation of financial statements in accordance with generallyaccepted accounting principles, and that receipts and expenditures of the company are being made onlyin accordance with authorizations of management and directors of the company; and (3) providereasonable assurance regarding prevention or timely detection of unauthorized acquisition, use, ordisposition of the company’s assets that could have a material effect on the financial statements.
Because of its inherent limitations, internal control over financial reporting may not prevent ordetect misstatements. Also, projections of any evaluation of effectiveness to future periods are subjectto the risk that controls may become inadequate because of changes in conditions, or that the degreeof compliance with the policies or procedures may deteriorate.
In our opinion, The Macerich Company maintained, in all material respects, effective internalcontrol over financial reporting as of December 31, 2013, based on criteria established in InternalControl—Integrated Framework (1992) issued by the Committee of Sponsoring Organizations of theTreadway Commission.
We also have audited, in accordance with the standards of the Public Company AccountingOversight Board (United States), the consolidated balance sheets of the Company as of December 31,2013 and 2012, and the related consolidated statements of operations, comprehensive income, equityand redeemable noncontrolling interests and cash flows for each of the years in the three-year periodended December 31, 2013, and the related financial statement schedule III—Real Estate andAccumulated Depreciation, and our report dated February 21, 2014 expressed an unqualified opinionon those consolidated financial statements and the financial statement schedule.
/s/ KPMG LLP
Los Angeles, CaliforniaFebruary 21, 2014
66

ITEM 9B. OTHER INFORMATION
Additional Material Federal Income Tax Considerations
The following is a summary of certain additional material federal income tax considerations withrespect to the ownership of the Company’s shares of common stock. This summary supplements andshould be read together with ‘‘Material United States Federal Income Tax Considerations’’ in theprospectus dated September 9, 2011 and filed as part of a registration statement on Form S-3(No. 333-176762), as supplemented by ‘‘Supplemental Material United States Federal Income TaxConsiderations’’ in the prospectus supplement thereto, dated August 17, 2012.
FATCA Withholding
Pursuant to Sections 1471 through 1474 of the Code and the U.S. Treasury regulationspromulgated thereunder (‘‘FATCA’’), beginning after June 30, 2014, a U.S. withholding tax will beimposed at a rate of 30% on dividends paid on the Company’s common stock received by or throughcertain foreign financial institutions (as defined by FATCA) that fail to comply with certain informationreporting obligations relating to U.S. persons that either have accounts with such institutions or owncertain debt or equity interests in such institutions. Similarly, dividends in respect of the Company’scommon stock held by a stockholder that is a non-financial non-U.S. entity may be subject towithholding at a rate of 30% unless such entity either (i) certifies that such entity does not have any‘‘substantial United States owners’’ or (ii) provides certain information regarding its ‘‘substantial UnitedStates owners,’’ which the Company will in turn provide to the Secretary of the Treasury. Accordingly, astockholder could be subject to FATCA withholding with respect to dividends received with respect toour common stock either because such stockholder (A) is a foreign financial institution or non-financialnon-U.S. entity that fails to comply with the information reporting obligations mentioned above or(B) holds our common stock through a non-U.S. intermediary (e.g., a foreign bank or broker) that failsto comply with these requirements (regardless of whether such stockholder, itself, complies with theserequirements). In addition, in the cases described above, 30% withholding will also apply to grossproceeds from the disposition of the Company’s common stock occurring after December 31, 2016.Certain countries have entered into, and other countries are expected to enter into, intergovernmentalagreements with the United States to facilitate the type of information reporting required underFATCA. While the existence of these intergovernmental agreements is expected to reduce the risk ofFATCA withholding for non-U.S. stockholders resident in (or stockholders holding our common stockthrough financial institutions resident in) those countries, such agreements will not eliminate that risk.
Neither the Company nor any intermediary will pay any additional amounts in respect of anyamounts withheld. Prospective investors are, therefore, urged to consult their tax advisors regarding theimpact of FATCA on their investment in our common stock.
Recent Legislation
Pursuant to recently enacted legislation, as of January 1, 2013, (1) the maximum tax rate on‘‘qualified dividend income’’ received by U.S. stockholders taxed at individual rates is 20%, (2) themaximum tax rate on long-term capital gain applicable to U.S. stockholders taxed at individual rates is20%, and (3) the highest marginal individual income tax rate is 39.6%. Pursuant to such legislation, thebackup withholding rate remains at 28%. Such legislation also makes permanent certain federal incometax provisions that were scheduled to expire on December 31, 2012. Stockholders are urged to consulttheir tax advisors regarding the impact of this legislation on the purchase, ownership and sale of theCompany’s common stock.
67

PART III
ITEM 10. DIRECTORS AND EXECUTIVE OFFICERS AND CORPORATE GOVERNANCE
There is hereby incorporated by reference the information which appears under the captions‘‘Information Regarding our Director Nominees,’’ ‘‘Executive Officers,’’ ‘‘Section 16(a) BeneficialOwnership Reporting Compliance’’ and ‘‘Audit Committee Matters’’ in the Company’s definitive proxystatement for its 2014 Annual Meeting of Stockholders that is responsive to the information requiredby this Item.
The Company has adopted a Code of Business Conduct and Ethics that provides principles ofconduct and ethics for its directors, officers and employees. This Code complies with the requirementsof the Sarbanes-Oxley Act of 2002 and applicable rules of the Securities and Exchange Commission andthe New York Stock Exchange. In addition, the Company has adopted a Code of Ethics for its CEOand senior financial officers which supplements the Code of Business Conduct and Ethics applicable toall employees and complies with the additional requirements of the Sarbanes-Oxley Act of 2002 andapplicable rules of the Securities and Exchange Commission. To the extent required by applicable rulesof the Securities and Exchange Commission and the New York Stock Exchange, the Company intendsto promptly disclose future amendments to certain provisions of these Codes or waivers of suchprovisions granted to directors and executive officers, including the Company’s principal executiveofficer, principal financial officer, principal accounting officer or persons performing similar functions,on the Company’s website at www.macerich.com under ‘‘Investing—Corporate Governance-Code ofEthics.’’ Each of these Codes of Conduct is available on the Company’s website at www.macerich.comunder ‘‘Investing—Corporate Governance.’’
During 2013, there were no material changes to the procedures described in the Company’s proxystatement relating to the 2013 Annual Meeting of Stockholders by which stockholders may recommendnominees to the Company.
ITEM 11. EXECUTIVE COMPENSATION
There is hereby incorporated by reference the information which appears under the caption‘‘Election of Directors’’ in the Company’s definitive proxy statement for its 2014 Annual Meeting ofStockholders that is responsive to the information required by this Item.
ITEM 12. SECURITY OWNERSHIP OF CERTAIN BENEFICIAL OWNERS AND MANAGEMENTAND RELATED STOCKHOLDER MATTERS
There is hereby incorporated by reference the information which appears under the captions‘‘Principal Stockholders,’’ ‘‘Information Regarding Our Director Nominees,’’ ‘‘Executive Officers’’ and‘‘Equity Compensation Plan Information’’ in the Company’s definitive proxy statement for its 2014Annual Meeting of Stockholders that is responsive to the information required by this Item.
ITEM 13. CERTAIN RELATIONSHIPS AND RELATED TRANSACTIONS, AND DIRECTORINDEPENDENCE
There is hereby incorporated by reference the information which appears under the captions‘‘Certain Transactions’’ and ‘‘The Board of Directors and its Committees’’ in the Company’s definitiveproxy statement for its 2014 Annual Meeting of Stockholders that is responsive to the informationrequired by this Item.
ITEM 14. PRINCIPAL ACCOUNTANT FEES AND SERVICES
There is hereby incorporated by reference the information which appears under the captions‘‘Principal Accountant Fees and Services’’ and ‘‘Audit Committee Pre-Approval Policy’’ in theCompany’s definitive proxy statement for its 2014 Annual Meeting of Stockholders that is responsive tothe information required by this Item.
68

PART IV
ITEM 15. EXHIBITS AND FINANCIAL STATEMENT SCHEDULE
Page
(a) and (c) 1 Financial StatementsReport of Independent Registered Public Accounting Firm . . . . . . . . . . . . . . . 70Consolidated balance sheets as of December 31, 2013 and 2012 . . . . . . . . . . . . 71Consolidated statements of operations for the years ended December 31, 2013,
2012 and 2011 . . . . . . . . . . . . . . . . . . . . . . . . . . . . . . . . . . . . . . . . . . . . . . 72Consolidated statements of comprehensive income for the years ended
December 31, 2013, 2012 and 2011 . . . . . . . . . . . . . . . . . . . . . . . . . . . . . . . 73Consolidated statements of equity and redeemable noncontrolling interests for
the years ended December 31, 2013, 2012 and 2011 . . . . . . . . . . . . . . . . . . . 74Consolidated statements of cash flows for the years ended December 31, 2013,
2012 and 2011 . . . . . . . . . . . . . . . . . . . . . . . . . . . . . . . . . . . . . . . . . . . . . . 77Notes to consolidated financial statements . . . . . . . . . . . . . . . . . . . . . . . . . . . 79
2 Financial Statement ScheduleSchedule III—Real estate and accumulated depreciation . . . . . . . . . . . . . . . . . 131
69

Report of Independent Registered Public Accounting Firm
The Board of Directors and Stockholders ofThe Macerich Company:
We have audited the accompanying consolidated balance sheets of The Macerich Company andsubsidiaries (the ‘‘Company’’) as of December 31, 2013 and 2012, and the related consolidatedstatements of operations, comprehensive income, equity and redeemable noncontrolling interests andcash flows for each of the years in the three-year period ended December 31, 2013. In connection withour audits of the consolidated financial statements, we have also audited the financial statementschedule III—Real Estate and Accumulated Depreciation. These consolidated financial statements andthe financial statement schedule are the responsibility of the Company’s management. Ourresponsibility is to express an opinion on these consolidated financial statements and financialstatement schedule based on our audits.
We conducted our audits in accordance with the standards of the Public Company AccountingOversight Board (United States). Those standards require that we plan and perform the audit to obtainreasonable assurance about whether the financial statements are free of material misstatement. Anaudit includes examining, on a test basis, evidence supporting the amounts and disclosures in thefinancial statements. An audit also includes assessing the accounting principles used and significantestimates made by management, as well as evaluating the overall financial statement presentation. Webelieve that our audits provide a reasonable basis for our opinion.
In our opinion, the consolidated financial statements referred to above present fairly, in allmaterial respects, the financial position of The Macerich Company and subsidiaries as of December 31,2013 and 2012, and the results of their operations and their cash flows for each of the years in thethree-year period ended December 31, 2013, in conformity with U.S. generally accepted accountingprinciples. Also, in our opinion, the related financial statement schedule III—Real Estate andAccumulated Depreciation, when considered in relation to the basic consolidated financial statementstaken as a whole, presents fairly, in all material respects, the information set forth therein.
We also have audited, in accordance with the standards of the Public Company AccountingOversight Board (United States), the Company’s internal control over financial reporting as ofDecember 31, 2013, based on criteria established in Internal Control—Integrated Framework (1992)issued by the Committee of Sponsoring Organizations of the Treadway Commission (COSO), and ourreport dated February 21, 2014, expressed an unqualified opinion on the effectiveness of the Company’sinternal control over financial reporting.
/s/ KPMG LLP
Los Angeles, CaliforniaFebruary 21, 2014
70

THE MACERICH COMPANY
CONSOLIDATED BALANCE SHEETS
(Dollars in thousands, except par value)
December 31,
2013 2012
ASSETS:Property, net . . . . . . . . . . . . . . . . . . . . . . . . . . . . . . . . . . . . . . . . . . . . . . . $7,621,766 $7,479,546Cash and cash equivalents . . . . . . . . . . . . . . . . . . . . . . . . . . . . . . . . . . . . . . 69,715 65,793Restricted cash . . . . . . . . . . . . . . . . . . . . . . . . . . . . . . . . . . . . . . . . . . . . . . 16,843 78,658Marketable securities . . . . . . . . . . . . . . . . . . . . . . . . . . . . . . . . . . . . . . . . . — 23,667Tenant and other receivables, net . . . . . . . . . . . . . . . . . . . . . . . . . . . . . . . . . 99,497 103,744Deferred charges and other assets, net . . . . . . . . . . . . . . . . . . . . . . . . . . . . . 533,058 565,130Loans to unconsolidated joint ventures . . . . . . . . . . . . . . . . . . . . . . . . . . . . 2,756 3,345Due from affiliates . . . . . . . . . . . . . . . . . . . . . . . . . . . . . . . . . . . . . . . . . . . 30,132 17,068Investments in unconsolidated joint ventures . . . . . . . . . . . . . . . . . . . . . . . . 701,483 974,258
Total assets . . . . . . . . . . . . . . . . . . . . . . . . . . . . . . . . . . . . . . . . . . . . $9,075,250 $9,311,209
LIABILITIES AND EQUITY:Mortgage notes payable:
Related parties . . . . . . . . . . . . . . . . . . . . . . . . . . . . . . . . . . . . . . . . . . . . $ 269,381 $ 274,609Others . . . . . . . . . . . . . . . . . . . . . . . . . . . . . . . . . . . . . . . . . . . . . . . . . . 4,145,809 4,162,734
Total . . . . . . . . . . . . . . . . . . . . . . . . . . . . . . . . . . . . . . . . . . . . . . . . 4,415,190 4,437,343Bank and other notes payable . . . . . . . . . . . . . . . . . . . . . . . . . . . . . . . . . . . 167,537 824,027Accounts payable and accrued expenses . . . . . . . . . . . . . . . . . . . . . . . . . . . . 76,941 70,251Other accrued liabilities . . . . . . . . . . . . . . . . . . . . . . . . . . . . . . . . . . . . . . . 363,158 318,174Distributions in excess of investments in unconsolidated joint ventures . . . . . . 252,192 152,948Co-venture obligation . . . . . . . . . . . . . . . . . . . . . . . . . . . . . . . . . . . . . . . . . 81,515 92,215
Total liabilities . . . . . . . . . . . . . . . . . . . . . . . . . . . . . . . . . . . . . . . . . 5,356,533 5,894,958
Commitments and contingenciesEquity:
Stockholders’ equity:Common stock, $0.01 par value, 250,000,000 shares authorized,
140,733,683 and 137,507,010 shares issued and outstanding atDecember 31, 2013 and 2012, respectively . . . . . . . . . . . . . . . . . . . . . 1,407 1,375
Additional paid-in capital . . . . . . . . . . . . . . . . . . . . . . . . . . . . . . . . . . . 3,906,148 3,715,895Accumulated deficit . . . . . . . . . . . . . . . . . . . . . . . . . . . . . . . . . . . . . . . (548,806) (639,741)
Total stockholders’ equity . . . . . . . . . . . . . . . . . . . . . . . . . . . . . . . . . 3,358,749 3,077,529Noncontrolling interests . . . . . . . . . . . . . . . . . . . . . . . . . . . . . . . . . . . . . . . 359,968 338,722
Total equity . . . . . . . . . . . . . . . . . . . . . . . . . . . . . . . . . . . . . . . . . . . 3,718,717 3,416,251
Total liabilities and equity . . . . . . . . . . . . . . . . . . . . . . . . . . . . . . . . . $9,075,250 $9,311,209
The accompanying notes are an integral part of these consolidated financial statements.
71

THE MACERICH COMPANY
CONSOLIDATED STATEMENTS OF OPERATIONS
(Dollars in thousands, except per share amounts)
For The Years Ended December 31,
2013 2012 2011
Revenues:Minimum rents . . . . . . . . . . . . . . . . . . . . . . . . . . . . . . . . . . . . . . $ 578,113 $ 447,321 $ 381,274Percentage rents . . . . . . . . . . . . . . . . . . . . . . . . . . . . . . . . . . . . . 23,156 21,388 16,818Tenant recoveries . . . . . . . . . . . . . . . . . . . . . . . . . . . . . . . . . . . . . 337,772 247,593 215,872Management Companies . . . . . . . . . . . . . . . . . . . . . . . . . . . . . . . . 40,192 41,235 40,404Other . . . . . . . . . . . . . . . . . . . . . . . . . . . . . . . . . . . . . . . . . . . . 50,242 39,980 30,376
Total revenues . . . . . . . . . . . . . . . . . . . . . . . . . . . . . . . . . . . . . 1,029,475 797,517 684,744
Expenses:Shopping center and operating expenses . . . . . . . . . . . . . . . . . . . . . 329,795 251,923 213,832Management Companies’ operating expenses . . . . . . . . . . . . . . . . . . 93,461 85,610 86,587REIT general and administrative expenses . . . . . . . . . . . . . . . . . . . . 27,772 20,412 21,113Depreciation and amortization . . . . . . . . . . . . . . . . . . . . . . . . . . . . 357,165 277,621 227,980
808,193 635,566 549,512
Interest expense:Related parties . . . . . . . . . . . . . . . . . . . . . . . . . . . . . . . . . . . . . 15,016 15,386 16,743Other . . . . . . . . . . . . . . . . . . . . . . . . . . . . . . . . . . . . . . . . . . . 182,231 149,006 150,506
197,247 164,392 167,249(Gain) loss on extinguishment of debt, net . . . . . . . . . . . . . . . . . . . . (1,432) — 1,485
Total expenses . . . . . . . . . . . . . . . . . . . . . . . . . . . . . . . . . . . . . 1,004,008 799,958 718,246Equity in income of unconsolidated joint ventures . . . . . . . . . . . . . . . . . 167,580 79,281 294,677Co-venture expense . . . . . . . . . . . . . . . . . . . . . . . . . . . . . . . . . . . . . (8,864) (6,523) (5,806)Income tax benefit . . . . . . . . . . . . . . . . . . . . . . . . . . . . . . . . . . . . . 1,692 4,159 6,110(Loss) gain on remeasurement, sale or write down of assets, net . . . . . . . (26,852) 228,690 (22,037)
Income from continuing operations . . . . . . . . . . . . . . . . . . . . . . . . . . 159,023 303,166 239,442
Discontinued operations:Gain (loss) on disposition of assets, net . . . . . . . . . . . . . . . . . . . . . . 286,414 50,811 (67,333)Income (loss) from discontinued operations . . . . . . . . . . . . . . . . . . . 3,522 12,412 (3,034)
Total income (loss) from discontinued operations . . . . . . . . . . . . . . . . . 289,936 63,223 (70,367)
Net income . . . . . . . . . . . . . . . . . . . . . . . . . . . . . . . . . . . . . . . . . . 448,959 366,389 169,075Less net income attributable to noncontrolling interests . . . . . . . . . . . . . 28,869 28,963 12,209
Net income attributable to the Company . . . . . . . . . . . . . . . . . . . . . . . $ 420,090 $ 337,426 $ 156,866
Earnings per common share attributable to Company—basic:Income from continuing operations . . . . . . . . . . . . . . . . . . . . . . . . . $ 1.07 $ 2.07 $ 1.67Discontinued operations . . . . . . . . . . . . . . . . . . . . . . . . . . . . . . . . 1.94 0.44 (0.49)
Net income attributable to common stockholders . . . . . . . . . . . . . . . . $ 3.01 $ 2.51 $ 1.18
Earnings per common share attributable to Company—diluted:Income from continuing operations . . . . . . . . . . . . . . . . . . . . . . . . . $ 1.06 $ 2.07 $ 1.67Discontinued operations . . . . . . . . . . . . . . . . . . . . . . . . . . . . . . . . 1.94 0.44 (0.49)
Net income attributable to common stockholders . . . . . . . . . . . . . . . . $ 3.00 $ 2.51 $ 1.18
Weighted average number of common shares outstanding:Basic . . . . . . . . . . . . . . . . . . . . . . . . . . . . . . . . . . . . . . . . . . . . . 139,598,000 134,067,000 131,628,000
Diluted . . . . . . . . . . . . . . . . . . . . . . . . . . . . . . . . . . . . . . . . . . . 139,680,000 134,148,000 131,628,000
The accompanying notes are an integral part of these consolidated financial statements.
72

THE MACERICH COMPANY
CONSOLIDATED STATEMENTS OF COMPREHENSIVE INCOME
(Dollars in thousands)
For The Years Ended December 31,
2013 2012 2011
Net income . . . . . . . . . . . . . . . . . . . . . . . . . . . . . . . . . . . . . . . . . . . $448,959 $366,389 $169,075Other comprehensive income:
Interest rate swap/cap agreements . . . . . . . . . . . . . . . . . . . . . . . . . — — 3,237
Comprehensive income . . . . . . . . . . . . . . . . . . . . . . . . . . . . . . . . . . 448,959 366,389 172,312Less comprehensive income attributable to noncontrolling interests . 28,869 28,963 12,209
Comprehensive income attributable to the Company . . . . . . . . . . . . . $420,090 $337,426 $160,103
The accompanying notes are an integral part of these consolidated financial statements.
73

THE MACERICH COMPANY
CONSOLIDATED STATEMENTS OF EQUITY ANDREDEEMABLE NONCONTROLLING INTERESTS
(Dollars in thousands, except per share data)
Stockholders’ Equity
AccumulatedCommon StockAdditional Other Total Redeemable
Par Paid-in Accumulated Comprehensive Stockholders’ Noncontrolling Total NoncontrollingShares Value Capital Deficit Income (Loss) Equity Interests Equity Interests
Balance at January 1, 2011 . . . . . . 130,452,032 $1,304 $3,456,569 $(564,357) $(3,237) $2,890,279 $297,717 $3,187,996 $ 11,366Net income . . . . . . . . . . . . . . . — — — 156,866 — 156,866 12,044 168,910 165Interest rate swap/cap agreements . . — — — — 3,237 3,237 — 3,237 —Amortization of share and unit-based
plans . . . . . . . . . . . . . . . . . . 597,415 6 18,513 — — 18,519 — 18,519 —Exercise of stock options . . . . . . . 10,800 — 266 — — 266 — 266 —Exercise of stock warrants . . . . . . . — — (1,278) — — (1,278) — (1,278) —Employee stock purchases . . . . . . . 17,285 — 766 — — 766 — 766 —Distributions paid ($2.05) per share . — — — (271,140) — (271,140) — (271,140) —Distributions to noncontrolling
interests . . . . . . . . . . . . . . . . — — — — — — (25,643) (25,643) (165)Contributions from noncontrolling
interests . . . . . . . . . . . . . . . . — — — — — — 78,921 78,921 —Other . . . . . . . . . . . . . . . . . . — — 4,139 — — 4,139 — 4,139 —Conversion of noncontrolling
interests to common shares . . . . . 1,075,912 11 21,687 — — 21,698 (21,698) — —Redemption of noncontrolling
interests . . . . . . . . . . . . . . . . — — (26) — — (26) (16) (42) (11,366)Adjustment of noncontrolling interest
in Operating Partnership . . . . . . — — (9,989) — — (9,989) 9,989 — —
Balance at December 31, 2011 . . . . 132,153,444 $1,321 $3,490,647 $(678,631) $ — $2,813,337 $351,314 $3,164,651 $ —
The accompanying notes are an integral part of these consolidated financial statements.
74

THE MACERICH COMPANY
CONSOLIDATED STATEMENTS OF EQUITY ANDREDEEMABLE NONCONTROLLING INTERESTS (Continued)
(Dollars in thousands, except per share data)
Stockholders’ Equity
Common StockAdditional Total Redeemable
Par Paid-in Accumulated Stockholders’ Noncontrolling Total NoncontrollingShares Value Capital Deficit Equity Interests Equity Interests
Balance at December 31, 2011 . . . . . . . . . . . . 132,153,444 $1,321 $3,490,647 $(678,631) $2,813,337 $351,314 $3,164,651 $—Net income . . . . . . . . . . . . . . . . . . . . . . . . — — — 337,426 337,426 28,963 366,389 —Amortization of share and unit-based plans . . . . . 566,717 6 14,964 — 14,970 — 14,970 —Exercise of stock options . . . . . . . . . . . . . . . . 10,800 — 307 — 307 — 307 —Exercise of stock warrants . . . . . . . . . . . . . . . — — (7,371) — (7,371) — (7,371) —Employee stock purchases . . . . . . . . . . . . . . . 20,372 — 956 — 956 — 956 —Stock offering, net . . . . . . . . . . . . . . . . . . . 2,961,903 30 175,619 — 175,649 — 175,649 —Stock issued to acquire property . . . . . . . . . . . 535,265 5 29,995 — 30,000 — 30,000 —Distributions paid ($2.23) per share . . . . . . . . . — — — (298,536) (298,536) — (298,536) —Distributions to noncontrolling interests . . . . . . . — — — — — (30,694) (30,694) —Contributions from noncontrolling interests . . . . . — — — — — 605 605 —Other . . . . . . . . . . . . . . . . . . . . . . . . . . . — — (589) — (589) — (589) —Conversion of noncontrolling interests to common
shares . . . . . . . . . . . . . . . . . . . . . . . . . 1,258,509 13 26,978 — 26,991 (26,991) — —Redemption of noncontrolling interests . . . . . . . — — (58) — (58) (28) (86) —Adjustment of noncontrolling interest in Operating
Partnership . . . . . . . . . . . . . . . . . . . . . . — — (15,553) — (15,553) 15,553 — —
Balance at December 31, 2012 . . . . . . . . . . . . 137,507,010 $1,375 $3,715,895 $(639,741) $3,077,529 $338,722 $3,416,251 $—
The accompanying notes are an integral part of these consolidated financial statements.
75

THE MACERICH COMPANY
CONSOLIDATED STATEMENTS OF EQUITY ANDREDEEMABLE NONCONTROLLING INTERESTS (Continued)
(Dollars in thousands, except per share data)
Stockholders’ Equity
Common StockAdditional Total Redeemable
Par Paid-in Accumulated Stockholders’ Noncontrolling Total NoncontrollingShares Value Capital Deficit Equity Interests Equity Interests
Balance at December 31, 2012 . . . . . . . . . . . . 137,507,010 $1,375 $3,715,895 $(639,741) $3,077,529 $338,722 $3,416,251 $—Net income . . . . . . . . . . . . . . . . . . . . . . . . — — — 420,090 420,090 28,869 448,959 —Amortization of share and unit-based plans . . . . . 88,039 — 28,122 — 28,122 — 28,122 —Exercise of stock options . . . . . . . . . . . . . . . . 2,700 — 99 — 99 — 99 —Employee stock purchases . . . . . . . . . . . . . . . 22,112 — 1,089 — 1,089 — 1,089 —Stock offerings, net . . . . . . . . . . . . . . . . . . . 2,456,956 25 171,077 — 171,102 — 171,102 —Distributions paid ($2.36) per share . . . . . . . . . — — — (329,155) (329,155) — (329,155) —Distributions to noncontrolling interests . . . . . . . — — — — — (31,202) (31,202) —Contributions from noncontrolling interests . . . . . — — — — — 18,079 18,079 —Other . . . . . . . . . . . . . . . . . . . . . . . . . . . — — (3,561) — (3,561) — (3,561) —Conversion of noncontrolling interests to common
shares . . . . . . . . . . . . . . . . . . . . . . . . . 656,866 7 12,977 — 12,984 (12,984) — —Redemption of noncontrolling interests . . . . . . . — — (733) — (733) (333) (1,066) —Adjustment of noncontrolling interest in Operating
Partnership . . . . . . . . . . . . . . . . . . . . . . — — (18,817) — (18,817) 18,817 — —
Balance at December 31, 2013 . . . . . . . . . . . . 140,733,683 $1,407 $3,906,148 $(548,806) $3,358,749 $359,968 $3,718,717 $—
The accompanying notes are an integral part of these consolidated financial statements.
76

THE MACERICH COMPANY
CONSOLIDATED STATEMENTS OF CASH FLOWS
(Dollars in thousands)
For the Years Ended December 31,
2013 2012 2011
Cash flows from operating activities:Net income . . . . . . . . . . . . . . . . . . . . . . . . . . . . . . . . . . . . . . . . $ 448,959 $ 366,389 $ 169,075Adjustments to reconcile net income to net cash provided by
operating activities:(Gain) loss on early extinguishment of debt, net . . . . . . . . . . . . . (1,432) — 1,485Loss (gain) on remeasurement, sale or write down of assets, net . 26,852 (228,690) 22,037(Gain) loss on disposition of assets, net from discontinued
operations . . . . . . . . . . . . . . . . . . . . . . . . . . . . . . . . . . . . . . (286,414) (50,811) 58,333Depreciation and amortization . . . . . . . . . . . . . . . . . . . . . . . . . 383,002 322,720 282,643Amortization of net (premium) discount on mortgages, bank and
other notes payable . . . . . . . . . . . . . . . . . . . . . . . . . . . . . . . (6,822) (1,600) 9,060Amortization of share and unit-based plans . . . . . . . . . . . . . . . . 24,207 12,324 12,288Straight-line rent adjustment . . . . . . . . . . . . . . . . . . . . . . . . . . . (7,987) (6,698) (5,398)Amortization of above and below-market leases . . . . . . . . . . . . . (6,726) (5,405) (9,723)Provision for doubtful accounts . . . . . . . . . . . . . . . . . . . . . . . . . 4,150 3,329 3,212Income tax benefit . . . . . . . . . . . . . . . . . . . . . . . . . . . . . . . . . . (1,692) (4,159) (6,110)Equity in income of unconsolidated joint ventures . . . . . . . . . . . (167,580) (79,281) (294,677)Co-venture expense . . . . . . . . . . . . . . . . . . . . . . . . . . . . . . . . . 8,864 6,523 5,806Distributions of income from unconsolidated joint ventures . . . . . 8,538 29,147 12,778Changes in assets and liabilities, net of acquisitions and
dispositions:Tenant and other receivables . . . . . . . . . . . . . . . . . . . . . . . . . (5,482) (2,554) (2,651)Other assets . . . . . . . . . . . . . . . . . . . . . . . . . . . . . . . . . . . . . 7,761 (17,094) (8,081)Due from affiliates . . . . . . . . . . . . . . . . . . . . . . . . . . . . . . . . 266 (1,181) 3,106Accounts payable and accrued expenses . . . . . . . . . . . . . . . . . (747) 13,430 (11,797)Other accrued liabilities . . . . . . . . . . . . . . . . . . . . . . . . . . . . (5,682) (5,093) (4,101)
Net cash provided by operating activities . . . . . . . . . . . . . . . . . . . . 422,035 351,296 237,285
Cash flows from investing activities:Acquisition of properties . . . . . . . . . . . . . . . . . . . . . . . . . . . . . . . (516,239) (1,061,851) (125,105)Development, redevelopment, expansion and renovation of
properties . . . . . . . . . . . . . . . . . . . . . . . . . . . . . . . . . . . . . . . . (158,682) (142,210) (58,932)Property improvements . . . . . . . . . . . . . . . . . . . . . . . . . . . . . . . . (51,683) (45,654) (62,974)Redemption of redeemable non-controlling interests . . . . . . . . . . . — — (11,366)Proceeds from note receivable . . . . . . . . . . . . . . . . . . . . . . . . . . . 8,347 — —Issuance of notes receivable . . . . . . . . . . . . . . . . . . . . . . . . . . . . . (13,330) (12,500) —Proceeds from maturities of marketable securities . . . . . . . . . . . . . 23,769 1,378 1,362Deposit on acquisition of property . . . . . . . . . . . . . . . . . . . . . . . . — (30,000) —Deferred leasing costs . . . . . . . . . . . . . . . . . . . . . . . . . . . . . . . . . (27,669) (30,614) (33,955)Distributions from unconsolidated joint ventures . . . . . . . . . . . . . . 715,825 322,242 215,651Contributions to unconsolidated joint ventures . . . . . . . . . . . . . . . . (195,675) (95,358) (155,351)Collections of/loans to unconsolidated joint ventures, net . . . . . . . . 589 650 (900)Proceeds from sale of assets . . . . . . . . . . . . . . . . . . . . . . . . . . . . 416,077 136,707 16,960Restricted cash . . . . . . . . . . . . . . . . . . . . . . . . . . . . . . . . . . . . . . 70,538 (6,164) 2,524
Net cash provided by (used in) investing activities . . . . . . . . . . . . . 271,867 (963,374) (212,086)
The accompanying notes are an integral part of these consolidated financial statements.
77

THE MACERICH COMPANY
CONSOLIDATED STATEMENTS OF CASH FLOWS (Continued)
(Dollars in thousands)
For the Years Ended December 31,
2013 2012 2011
Cash flows from financing activities:Proceeds from mortgages, bank and other notes payable . . . . . . . 2,572,764 3,193,451 757,000Payments on mortgages, bank and other notes payable . . . . . . . . . (3,051,072) (2,371,890) (627,369)Repurchase of convertible senior notes . . . . . . . . . . . . . . . . . . . . — — (180,314)Deferred financing costs . . . . . . . . . . . . . . . . . . . . . . . . . . . . . . (11,966) (15,108) (18,976)Proceeds from share and unit-based plans . . . . . . . . . . . . . . . . . . 1,188 1,263 1,032Net proceeds from stock offerings . . . . . . . . . . . . . . . . . . . . . . . 171,102 175,649 —Exercise of stock warrants . . . . . . . . . . . . . . . . . . . . . . . . . . . . . — (7,371) (1,278)Redemption of noncontrolling interests . . . . . . . . . . . . . . . . . . . (1,066) (86) (42)Contributions from noncontrolling interests . . . . . . . . . . . . . . . . . 4,140 379 4,204Dividends and distributions . . . . . . . . . . . . . . . . . . . . . . . . . . . . (355,506) (326,185) (296,948)Distributions to co-venture partner . . . . . . . . . . . . . . . . . . . . . . . (19,564) (39,479) (40,905)
Net cash (used in) provided by financing activities . . . . . . . . . . . . (689,980) 610,623 (403,596)
Net increase (decrease) in cash and cash equivalents . . . . . . . . . . 3,922 (1,455) (378,397)Cash and cash equivalents, beginning of year . . . . . . . . . . . . . . . . . 65,793 67,248 445,645
Cash and cash equivalents, end of year . . . . . . . . . . . . . . . . . . . . . $ 69,715 $ 65,793 $ 67,248
Supplemental cash flow information:Cash payments for interest, net of amounts capitalized . . . . . . . . . $ 205,958 $ 181,971 $ 175,902
Non-cash investing and financing activities:Accrued development costs included in accounts payable and
accrued expenses and other accrued liabilities . . . . . . . . . . . . . $ 41,334 $ 26,322 $ 13,291
Mortgage notes payable settled in deed-in-lieu of foreclosure . . . . $ 84,000 $ 185,000 $ 38,968
Conversion of Operating Partnership Units to common stock . . . . $ 12,984 $ 26,991 $ 21,698
Acquisition of properties by assumption of mortgage note payableand other accrued liabilities . . . . . . . . . . . . . . . . . . . . . . . . . . $ 257,064 $ 420,123 $ 192,566
Mortgage notes payable assumed by buyers in sale of properties . . $ 224,737 $ — $ —
Assumption of mortgage notes payable and other liabilities fromunconsolidated joint ventures . . . . . . . . . . . . . . . . . . . . . . . . . $ 54,271 $ — $ 240,537
Application of deposit to acquire property . . . . . . . . . . . . . . . . . $ 30,000 $ — $ —
Acquisition of property by issuance of common stock . . . . . . . . . . $ — $ 30,000 $ —
Property distributed from unconsolidated joint venture . . . . . . . . . $ — $ — $ 445,004
Contribution of development rights from noncontrolling interests . $ — $ — $ 74,717
Disposition of property in exchange for investments inunconsolidated joint ventures . . . . . . . . . . . . . . . . . . . . . . . . . $ — $ — $ 56,952
The accompanying notes are an integral part of these consolidated financial statements.
78

THE MACERICH COMPANY
NOTES TO CONSOLIDATED FINANCIAL STATEMENTS
(Dollars in thousands, except per share amounts)
1. Organization:
The Macerich Company (the ‘‘Company’’) is involved in the acquisition, ownership, development,redevelopment, management and leasing of regional and community/power shopping centers (the‘‘Centers’’) located throughout the United States.
The Company commenced operations effective with the completion of its initial public offering onMarch 16, 1994. As of December 31, 2013, the Company was the sole general partner of and held a93% ownership interest in The Macerich Partnership, L.P. (the ‘‘Operating Partnership’’). The Companywas organized to qualify as a real estate investment trust (‘‘REIT’’) under the Internal Revenue Codeof 1986, as amended (the ‘‘Code’’).
The property management, leasing and redevelopment of the Company’s portfolio is provided bythe Company’s management companies, Macerich Property Management Company, LLC, a singlemember Delaware limited liability company, Macerich Management Company, a California corporation,Macerich Arizona Partners LLC, a single member Arizona limited liability company, Macerich ArizonaManagement LLC, a single member Delaware limited liability company, Macerich Partners ofColorado, LLC, a Colorado limited liability company, MACW Mall Management, Inc., a New Yorkcorporation, and MACW Property Management, LLC, a single member New York limited liabilitycompany. All seven of the management companies are collectively referred to herein as the‘‘Management Companies.’’
2. Summary of Significant Accounting Policies:
Basis of Presentation:
These consolidated financial statements have been prepared in accordance with generally acceptedaccounting principles (‘‘GAAP’’) in the United States of America. The accompanying consolidatedfinancial statements include the accounts of the Company and the Operating Partnership. Investmentsin entities in which the Company has a controlling financial interest or entities that meet the definitionof a variable interest entity in which the Company has, as a result of ownership, contractual or otherfinancial interests, both the power to direct activities that most significantly impact the economicperformance of the variable interest entity and the obligation to absorb losses or the right to receivebenefits that could potentially be significant to the variable interest entity are consolidated; otherwisethey are accounted for under the equity method of accounting and are reflected as investments inunconsolidated joint ventures. All intercompany accounts and transactions have been eliminated in theconsolidated financial statements.
Cash and Cash Equivalents and Restricted Cash:
The Company considers all highly liquid investments with an original maturity of three months orless when purchased to be cash equivalents, for which cost approximates fair value. Restricted cashincludes impounds of property taxes and other capital reserves required under loan agreements.
Revenues:
Minimum rental revenues are recognized on a straight-line basis over the terms of the relatedleases. The difference between the amount of rent due in a year and the amount recorded as rentalincome is referred to as the ‘‘straight-line rent adjustment.’’ Minimum rents were increased by $7,498,
79

THE MACERICH COMPANY
NOTES TO CONSOLIDATED FINANCIAL STATEMENTS (Continued)
(Dollars in thousands, except per share amounts)
2. Summary of Significant Accounting Policies: (Continued)
$5,399 and $4,557 due to the straight-line rent adjustment during the years ended December 31, 2013,2012 and 2011, respectively. Percentage rents are recognized and accrued when tenants’ specified salestargets have been met.
Estimated recoveries from certain tenants for their pro rata share of real estate taxes, insuranceand other shopping center operating expenses are recognized as revenues in the period the applicableexpenses are incurred. Other tenants pay a fixed rate and these tenant recoveries are recognized asrevenues on a straight-line basis over the term of the related leases.
The Management Companies provide property management, leasing, corporate, development,redevelopment and acquisition services to affiliated and non-affiliated shopping centers. Inconsideration for these services, the Management Companies receive monthly management feesgenerally ranging from 1.5% to 5% of the gross monthly rental revenue of the properties managed.
Property:
Maintenance and repair expenses are charged to operations as incurred. Costs for majorreplacements and betterments, which includes HVAC equipment, roofs, parking lots, etc., arecapitalized and depreciated over their estimated useful lives. Gains and losses are recognized upondisposal or retirement of the related assets and are reflected in earnings.
Property is recorded at cost and is depreciated using a straight-line method over the estimateduseful lives of the assets as follows:
Buildings and improvements . . . . . . . . . . . . . . . . . . . . . . . . . . . . . . 5 - 40 yearsTenant improvements . . . . . . . . . . . . . . . . . . . . . . . . . . . . . . . . . . . 5 - 7 yearsEquipment and furnishings . . . . . . . . . . . . . . . . . . . . . . . . . . . . . . . 5 - 7 years
Capitalization of Costs:
The Company capitalizes costs incurred in redevelopment, development, renovation andimprovement of properties. The capitalized costs include pre-construction costs essential to thedevelopment of the property, development costs, construction costs, interest costs, real estate taxes,salaries and related costs and other costs incurred during the period of development. These capitalizedcosts include direct and certain indirect costs clearly associated with the project. Indirect costs includereal estate taxes, insurance and certain shared administrative costs. In assessing the amounts of directand indirect costs to be capitalized, allocations are made to projects based on estimates of the actualamount of time spent on each activity. Indirect costs not clearly associated with specific projects areexpensed as period costs. Capitalized indirect costs are allocated to development and redevelopmentactivities based on the square footage of the portion of the building not held available for immediateoccupancy. If costs and activities incurred to ready the vacant space cease, then cost capitalization isalso discontinued until such activities are resumed. Once work has been completed on a vacant space,project costs are no longer capitalized. For projects with extended lease-up periods, the Company endsthe capitalization when significant activities have ceased, which does not exceed the shorter of aone-year period after the completion of the building shell or when the construction is substantiallycomplete.
80

THE MACERICH COMPANY
NOTES TO CONSOLIDATED FINANCIAL STATEMENTS (Continued)
(Dollars in thousands, except per share amounts)
2. Summary of Significant Accounting Policies: (Continued)
Investment in Unconsolidated Joint Ventures:
The Company accounts for its investments in joint ventures using the equity method of accountingunless the Company has a controlling financial interest in the joint venture or the joint venture meetsthe definition of a variable interest entity in which the Company is the primary beneficiary throughboth its power to direct activities that most significantly impact the economic performance of thevariable interest entity and the obligation to absorb losses or the right to receive benefits that couldpotentially be significant to the variable interest entity. Although the Company has a greater than 50%interest in Corte Madera Village, LLC, Pacific Premier Retail LP and Queens JV LP, the Companydoes not have a controlling financial interest in these joint ventures as it shares management controlwith the partners in these joint ventures and, therefore, accounts for its investments in these jointventures using the equity method of accounting.
Acquisitions:
The Company allocates the estimated fair value of acquisitions to land, building, tenantimprovements and identified intangible assets and liabilities, based on their estimated fair values. Inaddition, any assumed mortgage notes payable are recorded at their estimated fair values. Theestimated fair value of the land and buildings is determined utilizing an ‘‘as if vacant’’ methodology.Tenant improvements represent the tangible assets associated with the existing leases valued on a fairvalue basis at the acquisition date prorated over the remaining lease terms. The tenant improvementsare classified as an asset under property and are depreciated over the remaining lease terms.Identifiable intangible assets and liabilities relate to the value of in-place operating leases which comein three forms: (i) leasing commissions and legal costs, which represent the value associated with ‘‘costavoidance’’ of acquiring in-place leases, such as lease commissions paid under terms generallyexperienced in the Company’s markets; (ii) value of in-place leases, which represents the estimated lossof revenue and of costs incurred for the period required to lease the ‘‘assumed vacant’’ property to theoccupancy level when purchased; and (iii) above or below market value of in-place leases, whichrepresents the difference between the contractual rents and market rents at the time of the acquisition,discounted for tenant credit risks. Leasing commissions and legal costs are recorded in deferred chargesand other assets and are amortized over the remaining lease terms. The value of in-place leases arerecorded in deferred charges and other assets and amortized over the remaining lease terms plus anestimate of renewal of the acquired leases. Above or below market leases are classified in deferredcharges and other assets or in other accrued liabilities, depending on whether the contractual terms areabove or below market, and the asset or liability is amortized to minimum rents over the remainingterms of the leases. The remaining lease terms of below-market leases may include certain below-market fixed-rate renewal periods. In considering whether or not a lessee will execute a below-marketfixed-rate lease renewal option, the Company evaluates economic factors and certain qualitative factorsat the time of acquisition such as tenant mix in the center, the Company’s relationship with the tenantand the availability of competing tenant space.
The Company immediately expenses costs associated with business combinations as period costs.
81

THE MACERICH COMPANY
NOTES TO CONSOLIDATED FINANCIAL STATEMENTS (Continued)
(Dollars in thousands, except per share amounts)
2. Summary of Significant Accounting Policies: (Continued)
Marketable Securities:
The Company accounted for its investments in marketable debt securities as held-to-maturitysecurities as the Company had the intent and the ability to hold these securities until maturity.Accordingly, investments in marketable securities were carried at their amortized cost. The discount onmarketable securities was amortized into interest income on a straight-line basis over the term of thenotes, which approximates the effective interest method.
Deferred Charges:
Costs relating to obtaining tenant leases are deferred and amortized over the initial term of thelease agreement using the straight-line method. As these deferred leasing costs represent productiveassets incurred in connection with the Company’s leasing arrangements at the Centers, the related cashflows are classified as investing activities within the accompanying Consolidated Statements of CashFlows. Costs relating to financing of shopping center properties are deferred and amortized over thelife of the related loan using the straight-line method, which approximates the effective interestmethod.
The range of the terms of the agreements is as follows:
Deferred lease costs . . . . . . . . . . . . . . . 1 - 15 yearsDeferred financing costs . . . . . . . . . . . . 1 - 15 years
Accounting for Impairment:
The Company assesses whether an indicator of impairment in the value of its properties exists byconsidering expected future operating income, trends and prospects, as well as the effects of demand,competition and other economic factors. Such factors include projected rental revenue, operating costsand capital expenditures as well as estimated holding periods and capitalization rates. If an impairmentindicator exists, the determination of recoverability is made based upon the estimated undiscountedfuture net cash flows, excluding interest expense. The amount of impairment loss, if any, is determinedby comparing the fair value, as determined by a discounted cash flows analysis, with the carrying valueof the related assets. The Company generally holds and operates its properties long-term, whichdecreases the likelihood of their carrying values not being recoverable. Properties classified as held forsale are measured at the lower of the carrying amount or fair value less cost to sell.
The Company reviews its investments in unconsolidated joint ventures for a series of operatinglosses and other factors that may indicate that a decrease in the value of its investments has occurredwhich is other-than-temporary. The investment in each unconsolidated joint venture is evaluatedperiodically, and as deemed necessary, for recoverability and valuation declines that areother-than-temporary.
Derivative Instruments and Hedging Activities:
The Company recognizes all derivatives in the consolidated financial statements and measures thederivatives at fair value. The Company uses interest rate swap and cap agreements (collectively,‘‘interest rate agreements’’) in the normal course of business to manage or reduce its exposure to
82

THE MACERICH COMPANY
NOTES TO CONSOLIDATED FINANCIAL STATEMENTS (Continued)
(Dollars in thousands, except per share amounts)
2. Summary of Significant Accounting Policies: (Continued)
adverse fluctuations in interest rates. The Company designs its hedges to be effective in reducing therisk exposure that they are designated to hedge. Any instrument that meets the cash flow hedgingcriteria is formally designated as a cash flow hedge at the inception of the derivative contract. On anongoing quarterly basis, the Company adjusts its balance sheet to reflect the current fair value of itsderivatives. To the extent they are effective, changes in fair value are recorded in comprehensiveincome. Ineffective portions, if any, are included in net income (loss).
Amounts paid (received) as a result of interest rate agreements are recorded as an addition(reduction) to (of) interest expense.
If any derivative instrument used for risk management does not meet the hedging criteria, it ismarked-to-market each period with the change in value included in the consolidated statements ofoperations.
Share and Unit-based Compensation Plans:
The cost of share and unit-based compensation awards is measured at the grant date based on thecalculated fair value of the awards and is recognized on a straight-line basis over the requisite serviceperiod, which is generally the vesting period of the awards. For market-indexed LTIP awards,compensation cost is recognized under the graded attribution method.
Income Taxes:
The Company elected to be taxed as a REIT under the Code commencing with its taxable yearended December 31, 1994. To qualify as a REIT, the Company must meet a number of organizationaland operational requirements, including a requirement that it distribute at least 90% of its taxableincome to its stockholders. It is management’s current intention to adhere to these requirements andmaintain the Company’s REIT status. As a REIT, the Company generally will not be subject tocorporate level federal income tax on taxable income it distributes currently to its stockholders. If theCompany fails to qualify as a REIT in any taxable year, then it will be subject to federal income taxesat regular corporate rates (including any applicable alternative minimum tax) and may not be able toqualify as a REIT for four subsequent taxable years. Even if the Company qualifies for taxation as aREIT, the Company may be subject to certain state and local taxes on its income and property and tofederal income and excise taxes on its undistributed taxable income, if any.
Each partner is taxed individually on its share of partnership income or loss, and accordingly, noprovision for federal and state income tax is provided for the Operating Partnership in the consolidatedfinancial statements. The Company’s taxable REIT subsidiaries (‘‘TRSs’’) are subject to corporate levelincome taxes, which are provided for in the Company’s consolidated financial statements.
Deferred tax assets and liabilities are recognized for the expected future tax consequences ofevents that have been included in the financial statements or tax returns. Under this method, deferredtax assets and liabilities are determined based on the differences between the financial reporting andtax bases of assets and liabilities using enacted tax rates in effect for the year in which the differencesare expected to reverse. The deferred tax assets and liabilities of the TRSs relate primarily todifferences in the book and tax bases of property and to operating loss carryforwards for federal andstate income tax purposes. A valuation allowance for deferred tax assets is provided if the Company
83

THE MACERICH COMPANY
NOTES TO CONSOLIDATED FINANCIAL STATEMENTS (Continued)
(Dollars in thousands, except per share amounts)
2. Summary of Significant Accounting Policies: (Continued)
believes it is more likely than not that all or some portion of the deferred tax assets will not berealized. Realization of deferred tax assets is dependent on the Company generating sufficient taxableincome in future periods.
Segment Information:
The Company currently operates in one business segment, the acquisition, ownership,development, redevelopment, management and leasing of regional and community shopping centers.Additionally, the Company operates in one geographic area, the United States.
Fair Value of Financial Instruments:
The fair value hierarchy distinguishes between market participant assumptions based on marketdata obtained from sources independent of the reporting entity and the reporting entity’s ownassumptions about market participant assumptions.
Level 1 inputs utilize quoted prices in active markets for identical assets or liabilities that theCompany has the ability to access. Level 2 inputs are inputs other than quoted prices included inLevel 1 that are observable for the asset or liability, either directly or indirectly. Level 2 inputs mayinclude quoted prices for similar assets and liabilities in active markets, as well as inputs that areobservable for the asset or liability (other than quoted prices), such as interest rates, foreign exchangerates, and yield curves that are observable at commonly quoted intervals. Level 3 inputs areunobservable inputs for the asset or liability, which are typically based on an entity’s own assumptions,as there is little, if any, related market activity. In instances where the determination of the fair valuemeasurement is based on inputs from different levels of the fair value hierarchy, the level in the fairvalue hierarchy within which the entire fair value measurement falls is based on the lowest level inputthat is significant to the fair value measurement in its entirety. The Company’s assessment of thesignificance of a particular input to the fair value measurement in its entirety requires judgment, andconsiders factors specific to the asset or liability.
The Company calculates the fair value of financial instruments and includes this additionalinformation in the notes to consolidated financial statements when the fair value is different than thecarrying value of those financial instruments. When the fair value reasonably approximates the carryingvalue, no additional disclosure is made.
The fair values of interest rate agreements are determined using the market standard methodologyof discounting the future expected cash receipts that would occur if variable interest rates fell below orrose above the strike rate of the interest rate agreements. The variable interest rates used in thecalculation of projected receipts on the interest rate agreements are based on an expectation of futureinterest rates derived from observable market interest rate curves and volatilities. The Companyincorporates credit valuation adjustments to appropriately reflect both its own nonperformance risk andthe respective counterparty’s nonperformance risk in the fair value measurements. In adjusting the fairvalue of its derivative contracts for the effect of nonperformance risk, the Company has considered theimpact of netting and any applicable credit enhancements, such as collateral postings, thresholds,mutual puts, and guarantees.
84

THE MACERICH COMPANY
NOTES TO CONSOLIDATED FINANCIAL STATEMENTS (Continued)
(Dollars in thousands, except per share amounts)
2. Summary of Significant Accounting Policies: (Continued)
Concentration of Risk:
The Company maintains its cash accounts in a number of commercial banks. Accounts at thesebanks are guaranteed by the Federal Deposit Insurance Corporation (‘‘FDIC’’) up to $250. At varioustimes during the year, the Company had deposits in excess of the FDIC insurance limit.
No Center or tenant generated more than 10% of total revenues during the years endedDecember 31, 2013, 2012 or 2011.
Management Estimates:
The preparation of financial statements in conformity with GAAP requires management to makeestimates and assumptions that affect the reported amounts of assets and liabilities and disclosure ofcontingent assets and liabilities at the date of the financial statements and the reported amounts ofrevenues and expenses during the reporting period. Actual results could differ from those estimates.
85

THE MACERICH COMPANY
NOTES TO CONSOLIDATED FINANCIAL STATEMENTS (Continued)
(Dollars in thousands, except per share amounts)
3. Earnings Per Share (‘‘EPS’’):
The following table reconciles the numerator and denominator used in the computation ofearnings per share for the years ended December 31 (shares in thousands):
2013 2012 2011
NumeratorIncome from continuing operations . . . . . . . . . . . . . . . . . . . . . . . . . $159,023 $303,166 $239,442Income (loss) from discontinued operations . . . . . . . . . . . . . . . . . . . 289,936 63,223 (70,367)Net income attributable to noncontrolling interests . . . . . . . . . . . . . . (28,869) (28,963) (12,209)Net income attributable to the Company . . . . . . . . . . . . . . . . . . . . . 420,090 337,426 156,866Allocation of earnings to participating securities . . . . . . . . . . . . . . . . (397) (577) (1,436)Numerator for basic and diluted earnings per share—net income
attributable to common stockholders . . . . . . . . . . . . . . . . . . . . . . . $419,693 $336,849 $155,430
DenominatorDenominator for basic earnings per share—weighted average number
of common shares outstanding . . . . . . . . . . . . . . . . . . . . . . . . . . . 139,598 134,067 131,628Effect of dilutive securities(1)
Stock warrants . . . . . . . . . . . . . . . . . . . . . . . . . . . . . . . . . . . . . . . — 63 —Share and unit based compensation . . . . . . . . . . . . . . . . . . . . . . . 82 18 —
Denominator for diluted earnings per share—weighted averagenumber of common shares outstanding . . . . . . . . . . . . . . . . . . . . . 139,680 134,148 131,628
Earnings per common share—basic:Income from continuing operations . . . . . . . . . . . . . . . . . . . . . . . . $ 1.07 $ 2.07 $ 1.67Discontinued operations . . . . . . . . . . . . . . . . . . . . . . . . . . . . . . . . 1.94 0.44 (0.49)Net income attributable to common stockholders . . . . . . . . . . . . . . $ 3.01 $ 2.51 $ 1.18
Earnings per common share—diluted:Income from continuing operations . . . . . . . . . . . . . . . . . . . . . . . . $ 1.06 $ 2.07 $ 1.67Discontinued operations . . . . . . . . . . . . . . . . . . . . . . . . . . . . . . . . 1.94 0.44 (0.49)Net income attributable to common stockholders . . . . . . . . . . . . . . $ 3.00 $ 2.51 $ 1.18
(1) The convertible senior notes (‘‘Senior Notes’’) are excluded from diluted EPS for the years endedDecember 31, 2012 and 2011 as their effect would be antidilutive. The Senior Notes were paid offin full on March 15, 2012 (See Note 11—Bank and Other Notes Payable).
Diluted EPS excludes 184,304, 193,945 and 208,640 convertible preferred units for the years endedDecember 31, 2013, 2012 and 2011, respectively, as their impact was antidilutive.
Diluted EPS excludes 1,203,280 of unexercised stock appreciation rights for the year endedDecember 31, 2011 as their effect was antidilutive.
Diluted EPS excludes 94,685 of unexercised stock options for the year ended December 31, 2011as their effect was antidilutive.
Diluted EPS excludes 935,650 of unexercised stock warrants for the year ended December 31, 2011as their effect was antidilutive.
Diluted EPS excludes 9,845,602 and 10,870,454 and 11,356,922 Operating Partnership units (‘‘OPUnits’’) for the years ended December 31, 2013, 2012 and 2011, respectively, as their effect wasantidilutive.
86

THE MACERICH COMPANY
NOTES TO CONSOLIDATED FINANCIAL STATEMENTS (Continued)
(Dollars in thousands, except per share amounts)
4. Investments in Unconsolidated Joint Ventures:
The following are the Company’s investments in various joint ventures with third parties. TheCompany’s ownership interest in each joint venture as of December 31, 2013 was as follows:
Joint Venture Ownership %(1)
Biltmore Shopping Center Partners LLC . . . . . . . . . . . . . . . . . . . . . . . . . . . . . . . . . . . 50.0%Coolidge Holding LLC . . . . . . . . . . . . . . . . . . . . . . . . . . . . . . . . . . . . . . . . . . . . . . . . 37.5%Corte Madera Village, LLC . . . . . . . . . . . . . . . . . . . . . . . . . . . . . . . . . . . . . . . . . . . . 50.1%Jaren Associates #4 . . . . . . . . . . . . . . . . . . . . . . . . . . . . . . . . . . . . . . . . . . . . . . . . . . 12.5%Kierland Commons Investment LLC . . . . . . . . . . . . . . . . . . . . . . . . . . . . . . . . . . . . . . 50.0%La Sandia Santa Monica LLC . . . . . . . . . . . . . . . . . . . . . . . . . . . . . . . . . . . . . . . . . . 50.0%Macerich Northwestern Associates—Broadway Plaza . . . . . . . . . . . . . . . . . . . . . . . . . . 50.0%MetroRising AMS Holding LLC . . . . . . . . . . . . . . . . . . . . . . . . . . . . . . . . . . . . . . . . . 15.0%North Bridge Chicago LLC . . . . . . . . . . . . . . . . . . . . . . . . . . . . . . . . . . . . . . . . . . . . 50.0%One Scottsdale Investors LLC . . . . . . . . . . . . . . . . . . . . . . . . . . . . . . . . . . . . . . . . . . 50.0%Pacific Premier Retail LP . . . . . . . . . . . . . . . . . . . . . . . . . . . . . . . . . . . . . . . . . . . . . . 51.0%Propcor Associates . . . . . . . . . . . . . . . . . . . . . . . . . . . . . . . . . . . . . . . . . . . . . . . . . . . 25.0%Propcor II Associates, LLC—Boulevard Shops . . . . . . . . . . . . . . . . . . . . . . . . . . . . . . 50.0%Queens JV LP . . . . . . . . . . . . . . . . . . . . . . . . . . . . . . . . . . . . . . . . . . . . . . . . . . . . . . 51.0%Scottsdale Fashion Square Partnership . . . . . . . . . . . . . . . . . . . . . . . . . . . . . . . . . . . . 50.0%The Market at Estrella Falls LLC . . . . . . . . . . . . . . . . . . . . . . . . . . . . . . . . . . . . . . . . 39.7%Tysons Corner LLC . . . . . . . . . . . . . . . . . . . . . . . . . . . . . . . . . . . . . . . . . . . . . . . . . . 50.0%Tysons Corner Property Holdings II LLC . . . . . . . . . . . . . . . . . . . . . . . . . . . . . . . . . . 50.0%Tysons Corner Property LLC . . . . . . . . . . . . . . . . . . . . . . . . . . . . . . . . . . . . . . . . . . . 50.0%West Acres Development, LLP . . . . . . . . . . . . . . . . . . . . . . . . . . . . . . . . . . . . . . . . . . 19.0%Westcor/Gilbert, L.L.C. . . . . . . . . . . . . . . . . . . . . . . . . . . . . . . . . . . . . . . . . . . . . . . . 50.0%Westcor/Queen Creek LLC . . . . . . . . . . . . . . . . . . . . . . . . . . . . . . . . . . . . . . . . . . . . 37.9%Westcor/Surprise Auto Park LLC . . . . . . . . . . . . . . . . . . . . . . . . . . . . . . . . . . . . . . . . 33.3%Wilshire Boulevard—Tenants in Common . . . . . . . . . . . . . . . . . . . . . . . . . . . . . . . . . . 30.0%WMAP, L.L.C.—Atlas Park . . . . . . . . . . . . . . . . . . . . . . . . . . . . . . . . . . . . . . . . . . . . 50.0%WM Inland LP . . . . . . . . . . . . . . . . . . . . . . . . . . . . . . . . . . . . . . . . . . . . . . . . . . . . . 50.0%Zengo Restaurant Santa Monica LLC . . . . . . . . . . . . . . . . . . . . . . . . . . . . . . . . . . . . . 50.0%
(1) The Company’s ownership interest in this table reflects its legal ownership interest. Legalownership may, at times, not equal the Company’s economic interest in the listed propertiesbecause of various provisions in certain joint venture agreements regarding distributions of cashflow based on capital account balances, allocations of profits and losses and payments of preferredreturns. As a result, the Company’s actual economic interest (as distinct from its legal ownershipinterest) in certain of the properties could fluctuate from time to time and may not wholly alignwith its legal ownership interests. Substantially all of the Company’s joint venture agreementscontain rights of first refusal, buy-sell provisions, exit rights, default dilution remedies and/or otherbreak up provisions or remedies which are customary in real estate joint venture agreements andwhich may, positively or negatively, affect the ultimate realization of cash flow and/or capital orliquidation proceeds.
87

THE MACERICH COMPANY
NOTES TO CONSOLIDATED FINANCIAL STATEMENTS (Continued)
(Dollars in thousands, except per share amounts)
4. Investments in Unconsolidated Joint Ventures: (Continued)
The Company has recently made the following investments and dispositions in unconsolidated jointventures:
On February 24, 2011, the Company’s joint venture in Kierland Commons Investment LLC(‘‘KCI’’) acquired an additional ownership interest in PHXAZ/Kierland Commons, L.L.C. (‘‘KierlandCommons’’), a 434,000 square foot regional shopping center in Scottsdale, Arizona, for $105,550. TheCompany’s share of the purchase price consisted of a cash payment of $34,162 and the assumption of apro rata share of debt of $18,613. As a result of this transaction, KCI increased its ownership interestin Kierland Commons from 49% to 100%. KCI accounted for the acquisition as a business combinationachieved in stages and recognized a remeasurement gain of $25,019 based on the acquisition date fairvalue and its previously held investment in Kierland Commons. As a result of this transaction, theCompany’s ownership interest in KCI increased from 24.5% to 50%. The Company’s pro rata share ofthe gain recognized by KCI was $12,510 and was included in equity in income from unconsolidatedjoint ventures.
On February 28, 2011, the Company in a 50/50 joint venture acquired The Shops at Atlas Park, a381,000 square foot community center in Queens, New York, for a total purchase price of $53,750. TheCompany’s share of the purchase price was $26,875. The results of The Shops at Atlas Park areincluded below for the period subsequent to the acquisition.
On February 28, 2011, the Company acquired the additional 50% ownership interest in Desert SkyMall, an 891,000 square foot regional shopping center in Phoenix, Arizona, that it did not own for$27,625. The purchase price was funded by a cash payment of $1,875 and the assumption of the thirdparty’s pro rata share of the mortgage note payable on the property of $25,750. Concurrent with thepurchase of the partnership interest, the Company paid off the $51,500 loan on the property. Prior tothe acquisition, the Company had accounted for its investment in Desert Sky Mall under the equitymethod. Since the date of acquisition, the Company has included Desert Sky Mall in its consolidatedfinancial statements (See Note 15—Acquisitions).
On April 1, 2011, the Company’s joint venture in SDG Macerich Properties, L.P. (‘‘SDGMacerich’’) conveyed Granite Run Mall, a 1,033,000 square foot regional shopping center in Media,Pennsylvania, to the mortgage note lender by a deed-in-lieu of foreclosure. The mortgage note wasnon-recourse. The Company’s pro rata share of gain on the extinguishment of debt was $7,753 and wasincluded in equity in income from unconsolidated joint ventures.
On June 3, 2011, the Company entered into a transaction with General Growth Properties, Inc.,whereby the Company acquired an additional 33.3% ownership interest in Arrowhead Towne Center, a1,198,000 square foot regional shopping center in Glendale, Arizona, an additional 33.3% ownershipinterest in Superstition Springs Center, a 1,082,000 square foot regional shopping center in Mesa,Arizona, and an additional 50% ownership interest in the land under Superstition Springs Center(‘‘Superstition Springs Land’’) that it did not own in exchange for six anchor locations, including fiveformer Mervyn’s stores (See Note 16—Discontinued Operations) and a cash payment of $75,000. As aresult of this transaction, the Company owned a 66.7% ownership interest in Arrowhead Towne Center,a 66.7% ownership interest in Superstition Springs Center and a 100% ownership interest inSuperstition Springs Land. Although the Company had a 66.7% ownership interest in ArrowheadTowne Center and Superstition Springs Center upon completion of the transaction, the Company did
88

THE MACERICH COMPANY
NOTES TO CONSOLIDATED FINANCIAL STATEMENTS (Continued)
(Dollars in thousands, except per share amounts)
4. Investments in Unconsolidated Joint Ventures: (Continued)
not have a controlling financial interest in these joint ventures due to the substantive participationrights of the outside partner and, therefore, continued to account for its investments in these jointventures under the equity method of accounting. Accordingly, no remeasurement gain was recorded onthe increase in ownership. The Company has consolidated its investment in Superstition Springs Landsince the date of acquisition (See Note 15—Acquisitions) and recorded a remeasurement gain of $1,734that was included in (loss) gain on remeasurement, sale or write down of assets, net as a result of theincrease in ownership. This transaction is referred to herein as the ‘‘GGP Exchange’’.
On December 31, 2011, the Company and its joint venture partner reached agreement for thedistribution and conveyance of interests in SDG Macerich that owned 11 regional shopping centers in a50/50 partnership. Six of the eleven assets were distributed to the Company on December 31, 2011. TheCompany received 100% ownership of Eastland Mall, a 1,043,000 square foot regional shopping centerin Evansville, Indiana, Lake Square Mall, a 559,000 square foot regional shopping center in Leesburg,Florida, SouthPark Mall, a 904,000 square foot regional shopping center in Moline, Illinois, SouthridgeCenter, an 811,000 square foot community center in Des Moines, Iowa, NorthPark Mall, a 1,050,000square foot regional shopping center in Davenport, Iowa and Valley Mall, a 504,000 square footregional shopping center in Harrisonburg, Virginia (collectively referred to herein as the ‘‘SDGAcquisition Properties’’). The ownership interests in the remaining five regional malls were distributedto the outside partner. The remaining net assets of SDG Macerich were distributed during the yearended December 31, 2012. The SDG Acquisition Properties were recorded at fair value at the date oftransfer, which resulted in a gain to the Company of $188,264, which was included in equity in incomeof unconsolidated joint ventures, based on the fair value of the assets acquired and the liabilitiesassumed in excess of the book value of the Company’s interest in SDG Macerich. The distribution andconveyance of the 11 regional shopping centers is referred to herein as the ‘‘SDG Transaction’’. Priorto the SDG Transaction, the Company accounted for its investment in the SDG Acquisition Propertiesunder the equity method of accounting. Since the date of distribution and conveyance, the Companyhas included the SDG Acquisition Properties in its consolidated financial statements (See Note 15—Acquisitions).
On March 30, 2012, the Company sold its 50% ownership interest in Chandler Village Center, a273,000 square foot community center in Chandler, Arizona, for a total sales price of $14,795, resultingin a gain of $8,184 that was included in(loss) gain on remeasurement, sale or write down of assets, netduring the year ended December 31, 2012. The sales price was funded by a cash payment of $6,045 andthe assumption of the Company’s share of the mortgage note payable on the property of $8,750. TheCompany used the cash proceeds from the sale to pay down its line of credit and for general corporatepurposes.
On March 30, 2012, the Company sold its 50% ownership interest in Chandler Festival, a 500,000square foot community center in Chandler, Arizona, for a total sales price of $30,975, resulting in again of $12,347 that was included in (loss) gain on remeasurement, sale or write down of assets, netduring the year ended December 31, 2012. The sales price was funded by a cash payment of $16,183and the assumption of the Company’s share of the mortgage note payable on the property of $14,792.The Company used the cash proceeds from the sale to pay down its line of credit and for generalcorporate purposes.
89

THE MACERICH COMPANY
NOTES TO CONSOLIDATED FINANCIAL STATEMENTS (Continued)
(Dollars in thousands, except per share amounts)
4. Investments in Unconsolidated Joint Ventures: (Continued)
On March 30, 2012, the Company’s joint venture in SanTan Village Power Center, a 491,000square foot community center in Gilbert, Arizona, sold the property for $54,780, resulting in a gain tothe joint venture of $23,294. The Company’s share of the gain recognized was $11,502, which wasincluded in equity in income of unconsolidated joint ventures, offset in part by $3,565 that was includedin net income attributable to noncontrolling interests. The cash proceeds from the sale were used topay off the $45,000 mortgage loan on the property and the remaining $9,780 was distributed to thepartners. The Company used its share of the proceeds to pay down its line of credit and for generalcorporate purposes.
On May 31, 2012, the Company sold its 50% ownership interest in Chandler Gateway, a 260,000square foot community center in Chandler, Arizona, for a total sales price of $14,315, resulting in again of $3,363 that was included in (loss) gain on remeasurement, sale or write down of assets, netduring the year ended December 31, 2012. The sales price was funded by a cash payment of $4,921 andthe assumption of the Company’s share of the mortgage note payable on the property of $9,394. TheCompany used the cash proceeds from the sale to pay down its line of credit and for general corporatepurposes.
On August 10, 2012, the Company sold its ownership interest in NorthPark Center, a 1,946,000square foot regional shopping center in Dallas, Texas, for $118,810, resulting in a gain of $24,590 thatwas included in (loss) gain on remeasurement sale or write down of assets, net during the year endedDecember 31, 2012. The Company used the cash proceeds from the sale to pay down its line of credit.
On October 3, 2012, the Company acquired the 75% ownership interest in FlatIron Crossing, a1,435,000 square foot regional shopping center in Broomfield, Colorado, that it did not own for$310,397. The purchase price was funded by a cash payment of $195,900 and the assumption of thethird party’s share of the mortgage note payable on the property of $114,497. Prior to the acquisition,the Company had accounted for its investment in FlatIron Crossing under the equity method. Since thedate of acquisition, the Company has included FlatIron Crossing in its consolidated financial statements(See Note 15—Acquisitions).
On October 26, 2012, the Company acquired the remaining 33.3% ownership interest inArrowhead Towne Center, a 1,198,000 square foot regional shopping center in Glendale, Arizona, thatit did not own for $144,400. The purchase price was funded by a cash payment of $69,025 and theassumption of the third party’s pro rata share of the mortgage note payable on the property of $75,375.Prior to the acquisition, the Company had accounted for its investment in Arrowhead Towne Centerunder the equity method. Since the date of acquisition, the Company has included Arrowhead TowneCenter in its consolidated financial statements (See Note 15—Acquisitions).
On May 29, 2013, the Company’s joint venture in Pacific Premier Retail LP sold Redmond TownCenter Office, a 582,000 square foot office building in Redmond, Washington, for $185,000, resulting ina gain on the sale of assets of $89,157 to the joint venture. The Company’s share of the gain was$44,424, which was included in equity in income of unconsolidated joint ventures during the year endedDecember 31, 2013. The Company used its share of the proceeds from the sale to pay down its line ofcredit and for general corporate purposes.
On June 12, 2013, the Company’s joint venture in Pacific Premier Retail LP sold Kitsap Mall, a846,000 square foot regional shopping center in Silverdale, Washington, for $127,000, resulting in a gain
90

THE MACERICH COMPANY
NOTES TO CONSOLIDATED FINANCIAL STATEMENTS (Continued)
(Dollars in thousands, except per share amounts)
4. Investments in Unconsolidated Joint Ventures: (Continued)
on the sale of assets of $55,150 to the joint venture. The Company’s share of the gain was $28,127,which was included in equity in income of unconsolidated joint ventures during the year endedDecember 31, 2013. The Company used its share of the proceeds from the sale to pay down its line ofcredit and for general corporate purposes.
On August 1, 2013, the Company’s joint venture in Pacific Premier Retail LP sold Redmond TownCenter, a 695,000 square foot community center in Redmond, Washington, for $127,000, resulting in again on the sale of assets of $38,447 to the joint venture. The Company’s share of the gain was $18,251,which was included in equity in income of unconsolidated joint ventures during the year endedDecember 31, 2013. The Company used its share of the proceeds from the sale to pay down its line ofcredit and for general corporate purposes.
On September 17, 2013, the Company’s joint venture in Camelback Colonnade, a 619,000 squarefoot community center in Phoenix, Arizona, was restructured. As a result of the restructuring, theCompany’s ownership interest in Camelback Colonnade decreased from 73.2% to 67.5%. Prior to therestructuring, the Company had accounted for its investment in Camelback Colonnade under the equitymethod of accounting due to substantive participation rights held by the outside partners. Uponcompletion of the restructuring, these substantive participation rights were terminated and theCompany obtained voting control of the joint venture. This transaction is referred to herein as the‘‘Camelback Colonnade Restructuring.’’ Since the date of the restructuring, the Company has includedCamelback Colonnade in its consolidated financial statements (See Note 15—Acquisitions).
On October 8, 2013, the Company’s joint venture in Ridgmar Mall, a 1,273,000 square footregional shopping center in Fort Worth, Texas, sold the property for $60,900, resulting in a gain of$6,243 to the joint venture. The Company’s share of the gain was $3,121, which was included in equityin income from joint ventures for the year ended December 31, 2013. The cash proceeds from the salewere used to pay off the $51,657 mortgage loan on the property and the remaining $9,243, net ofclosing costs, was distributed to the partners. The Company used its share of the proceeds from thesale to pay down its line of credit and for general corporate purposes.
On October 24, 2013, the Company acquired the remaining 33.3% ownership interest inSuperstition Springs Center that it did not own for $46,162. The purchase price was funded by a cashpayment of $23,662 and the assumption of the third party’s pro rata share of the mortgage notepayable on the property of $22,500. Prior to the acquisition, the Company had accounted for itsinvestment in Superstition Springs Center under the equity method. Since the date of acquisition, theCompany has included Superstition Springs Center in its consolidated financial statements (SeeNote 15—Acquisitions).
Combined and condensed balance sheets and statements of operations are presented below for allunconsolidated joint ventures.
91

THE MACERICH COMPANY
NOTES TO CONSOLIDATED FINANCIAL STATEMENTS (Continued)
(Dollars in thousands, except per share amounts)
4. Investments in Unconsolidated Joint Ventures: (Continued)
Combined and Condensed Balance Sheets of Unconsolidated Joint Ventures as of December 31:
2013 2012
Assets(1):Properties, net . . . . . . . . . . . . . . . . . . . . . . . . . . . . . . . . . . . . . . . . . . . . $3,435,737 $3,653,631Other assets . . . . . . . . . . . . . . . . . . . . . . . . . . . . . . . . . . . . . . . . . . . . . . 295,719 411,862
Total assets . . . . . . . . . . . . . . . . . . . . . . . . . . . . . . . . . . . . . . . . . . . . . . . $3,731,456 $4,065,493
Liabilities and partners’ capital(1):Mortgage notes payable(2) . . . . . . . . . . . . . . . . . . . . . . . . . . . . . . . . . . . . $3,518,215 $3,240,723Other liabilities . . . . . . . . . . . . . . . . . . . . . . . . . . . . . . . . . . . . . . . . . . . . 202,444 148,711Company’s capital . . . . . . . . . . . . . . . . . . . . . . . . . . . . . . . . . . . . . . . . . . (25,367) 304,477Outside partners’ capital . . . . . . . . . . . . . . . . . . . . . . . . . . . . . . . . . . . . . 36,164 371,582
Total liabilities and partners’ capital . . . . . . . . . . . . . . . . . . . . . . . . . . . . . $3,731,456 $4,065,493
Investment in unconsolidated joint ventures:Company’s capital . . . . . . . . . . . . . . . . . . . . . . . . . . . . . . . . . . . . . . . . . . $ (25,367) $ 304,477Basis adjustment(3) . . . . . . . . . . . . . . . . . . . . . . . . . . . . . . . . . . . . . . . . . 474,658 516,833
$ 449,291 $ 821,310
Assets—Investments in unconsolidated joint ventures . . . . . . . . . . . . . . . . $ 701,483 $ 974,258Liabilities—Distributions in excess of investments in unconsolidated joint
ventures . . . . . . . . . . . . . . . . . . . . . . . . . . . . . . . . . . . . . . . . . . . . . . . (252,192) (152,948)
$ 449,291 $ 821,310
(1) These amounts include the assets and liabilities of the following joint ventures as of December 31,2013 and 2012:
PacificPremier Tysons
Retail LP Corner LLC
As of December 31, 2013Total Assets . . . . . . . . . . . . . . . . . . . . . . . . . . . . . . . . . . . . . . . . . . $ 775,012 $356,871Total Liabilities . . . . . . . . . . . . . . . . . . . . . . . . . . . . . . . . . . . . . . . $ 812,725 $887,413As of December 31, 2012Total Assets . . . . . . . . . . . . . . . . . . . . . . . . . . . . . . . . . . . . . . . . . . $1,039,742 $409,622Total Liabilities . . . . . . . . . . . . . . . . . . . . . . . . . . . . . . . . . . . . . . . $ 942,370 $329,145
(2) Certain mortgage notes payable could become recourse debt to the Company should the jointventure be unable to discharge the obligations of the related debt. As of December 31, 2013 and2012, a total of $33,540 and $51,171, respectively, could become recourse debt to the Company. Asof December 31, 2013 and 2012, the Company has indemnity agreements from joint venturepartners for $16,770 and $21,270, respectively, of the guaranteed amount.
Included in mortgage notes payable are amounts due to affiliates of Northwestern Mutual Life
92

THE MACERICH COMPANY
NOTES TO CONSOLIDATED FINANCIAL STATEMENTS (Continued)
(Dollars in thousands, except per share amounts)
4. Investments in Unconsolidated Joint Ventures: (Continued)
(‘‘NML’’) of $712,455 and $436,857 as of December 31, 2013 and 2012, respectively. NML isconsidered a related party because it is a joint venture partner with the Company in MacerichNorthwestern Associates—Broadway Plaza. Interest expense incurred on these borrowingsamounted to $31,549, $43,732 and $42,451 for the years ended December 31, 2013, 2012 and 2011,respectively.
(3) The Company amortizes the difference between the cost of its investments in unconsolidated jointventures and the book value of the underlying equity into income on a straight-line basis consistentwith the lives of the underlying assets. The amortization of this difference was $10,734, $15,480 and$9,257 for the years ended December 31, 2013, 2012 and 2011, respectively.
93

THE MACERICH COMPANY
NOTES TO CONSOLIDATED FINANCIAL STATEMENTS (Continued)
(Dollars in thousands, except per share amounts)
4. Investments in Unconsolidated Joint Ventures: (Continued)
Combined and Condensed Statements of Operations of Unconsolidated Joint Ventures:
Pacific OtherPremier Tysons Joint
Retail LP Corner LLC Ventures Total
Year Ended December 31, 2013Revenues:
Minimum rents . . . . . . . . . . . . . . . . . . . . . . . . . . . . . $118,164 $ 62,072 $238,488 $418,724Percentage rents . . . . . . . . . . . . . . . . . . . . . . . . . . . . 4,586 2,057 12,946 19,589Tenant recoveries . . . . . . . . . . . . . . . . . . . . . . . . . . . . 52,470 45,452 106,249 204,171Other . . . . . . . . . . . . . . . . . . . . . . . . . . . . . . . . . . . . 5,882 3,110 36,635 45,627
Total revenues . . . . . . . . . . . . . . . . . . . . . . . . . . . . 181,102 112,691 394,318 688,111
Expenses:Shopping center and operating expenses . . . . . . . . . . . 53,039 36,798 139,981 229,818Interest expense . . . . . . . . . . . . . . . . . . . . . . . . . . . . 43,445 15,751 86,126 145,322Depreciation and amortization . . . . . . . . . . . . . . . . . . 39,616 18,139 89,554 147,309
Total operating expenses . . . . . . . . . . . . . . . . . . . . . . 136,100 70,688 315,661 522,449
Gain on sale of assets . . . . . . . . . . . . . . . . . . . . . . . . . . 182,754 — 7,772 190,526Gain on extinguishment of debt . . . . . . . . . . . . . . . . . . . — 14 — 14
Net income . . . . . . . . . . . . . . . . . . . . . . . . . . . . . . . . . $227,756 $ 42,017 $ 86,429 $356,202
Company’s equity in net income . . . . . . . . . . . . . . . . . . $110,798 $ 15,126 $ 41,656 $167,580
Year Ended December 31, 2012Revenues:
Minimum rents . . . . . . . . . . . . . . . . . . . . . . . . . . . . . $132,247 $ 63,569 $316,186 $512,002Percentage rents . . . . . . . . . . . . . . . . . . . . . . . . . . . . 5,390 1,929 15,768 23,087Tenant recoveries . . . . . . . . . . . . . . . . . . . . . . . . . . . . 56,397 44,225 149,546 250,168Other . . . . . . . . . . . . . . . . . . . . . . . . . . . . . . . . . . . . 5,650 3,341 37,248 46,239
Total revenues . . . . . . . . . . . . . . . . . . . . . . . . . . . . 199,684 113,064 518,748 831,496
Expenses:Shopping center and operating expenses . . . . . . . . . . . 59,329 35,244 192,661 287,234Interest expense . . . . . . . . . . . . . . . . . . . . . . . . . . . . 52,139 11,481 136,296 199,916Depreciation and amortization . . . . . . . . . . . . . . . . . . 43,031 19,798 115,168 177,997
Total operating expenses . . . . . . . . . . . . . . . . . . . . . . 154,499 66,523 444,125 665,147
Gain on sale of assets . . . . . . . . . . . . . . . . . . . . . . . . . . 90 — 29,211 29,301
Net income . . . . . . . . . . . . . . . . . . . . . . . . . . . . . . . . . $ 45,275 $ 46,541 $103,834 $195,650
Company’s equity in net income . . . . . . . . . . . . . . . . . . $ 23,026 $ 17,969 $ 38,286 $ 79,281
94

THE MACERICH COMPANY
NOTES TO CONSOLIDATED FINANCIAL STATEMENTS (Continued)
(Dollars in thousands, except per share amounts)
4. Investments in Unconsolidated Joint Ventures: (Continued)
PacificSDG Premier Tysons Other Joint
Macerich Retail LP Corner LLC Ventures Total
Year Ended December 31, 2011Revenues:
Minimum rents . . . . . . . . . . . . . . . . . . . $ 84,523 $133,191 $ 63,950 $351,982 $ 633,646Percentage rents . . . . . . . . . . . . . . . . . . 4,742 6,124 2,068 18,491 31,425Tenant recoveries . . . . . . . . . . . . . . . . . 43,845 55,088 41,286 169,516 309,735Other . . . . . . . . . . . . . . . . . . . . . . . . . . 3,668 5,248 3,061 37,743 49,720
Total revenues . . . . . . . . . . . . . . . . . . 136,778 199,651 110,365 577,732 1,024,526
Expenses:Shopping center and operating expenses . 51,037 59,723 34,519 218,981 364,260Interest expense . . . . . . . . . . . . . . . . . . 41,300 50,174 14,237 154,382 260,093Depreciation and amortization . . . . . . . . 27,837 41,448 20,115 126,267 215,667
Total operating expenses . . . . . . . . . . . . 120,174 151,345 68,871 499,630 840,020
Gain on sale or distribution of assets . . . . . 366,312 — — 23,395 389,707Gain on extinguishment of debt . . . . . . . . . 15,704 — — — 15,704
Net income . . . . . . . . . . . . . . . . . . . . . . . $398,620 $ 48,306 $ 41,494 $101,497 $ 589,917
Company’s equity in net income . . . . . . . . $204,439 $ 24,568 $ 16,209 $ 49,461 $ 294,677
Significant accounting policies used by the unconsolidated joint ventures are similar to those usedby the Company.
5. Derivative Instruments and Hedging Activities:
The Company recorded other comprehensive income related to the marking-to-market of interestrate agreements of $3,237 for the year ended December 31, 2011. There were no derivativesoutstanding at December 31, 2013 or 2012.
The Company had an interest rate swap agreement designated as a hedging instrument with a fairvalue of $3,237 that was included in other accrued liabilities at January 1, 2011. This instrument expiredduring the year ended December 31, 2011.
95

THE MACERICH COMPANY
NOTES TO CONSOLIDATED FINANCIAL STATEMENTS (Continued)
(Dollars in thousands, except per share amounts)
6. Property:
Property at December 31, 2013 and 2012 consists of the following:
2013 2012
Land . . . . . . . . . . . . . . . . . . . . . . . . . . . . . . . . . . . . . . $ 1,707,005 $ 1,572,621Buildings and improvements . . . . . . . . . . . . . . . . . . . . . . 6,555,212 6,417,674Tenant improvements . . . . . . . . . . . . . . . . . . . . . . . . . . . 537,754 496,203Equipment and furnishings . . . . . . . . . . . . . . . . . . . . . . . 152,198 149,959Construction in progress . . . . . . . . . . . . . . . . . . . . . . . . 229,169 376,249
9,181,338 9,012,706Less accumulated depreciation . . . . . . . . . . . . . . . . . . . . (1,559,572) (1,533,160)
$ 7,621,766 $ 7,479,546
Depreciation expense for the years ended December 31, 2013, 2012 and 2011 was $269,790,$216,447 and $189,555, respectively.
The (loss) gain on remeasurement, sale or write down of assets, net for the year endedDecember 31, 2013, includes a remeasurement gain of $36,341 on the Camelback ColonnadeRestructuring (See Note 15—Acquisitions), a remeasurement gain of $14,864 on the purchase of a33.3% interest in Superstition Springs Center (See Note 15—Acquisitions) and a $5,390 gain on thesale of assets. These gains were offset in part by a loss on impairment of $82,197 due to the reductionin the estimated holding period of the long lived assets of Promenade at Casa Grande, RotterdamSquare, Lake Square Mall and Somersville Towne Center. In addition, the Company recognized a lossof $1,250 on the write off of development costs.
The (loss) gain on remeasurement, sale or write down of assets, net for the year endedDecember 31, 2012, includes a remeasurement gain of $84,227 on the purchase of a 75% interest inFlatIron Crossing (See Note 15—Acquisitions), a remeasurement gain of $115,729 on the purchase of a33.3% interest in Arrowhead Towne Center (See Note 15—Acquisitions) and a $48,484 gain on thesales of Chandler Village Center, Chandler Festival, Chandler Gateway and NorthPark Center (SeeNote 4—Investments in Unconsolidated Joint Ventures). This was offset in part by a loss of $19,360 onthe write off of development costs and a loss of $390 on sale of assets.
The (loss) gain on remeasurement, sale or write down of assets, net for the year endedDecember 31, 2011, includes a loss on impairment of $25,216 and a loss on the sale of assets $423. Thelosses were offset in part by a remeasurement gain of $1,734 on the purchase of Superstition SpringsLand (See Note 15—Acquisitions) in connection with the GGP Exchange (See Note 4—Investments inUnconsolidated Joint Ventures) and a remeasurement gain of $1,868 on the purchase of a 50% interestin Desert Sky Mall (See Note 15—Acquisitions). The loss on impairment was due to the decision toabandon a development project in Arizona.
96

THE MACERICH COMPANY
NOTES TO CONSOLIDATED FINANCIAL STATEMENTS (Continued)
(Dollars in thousands, except per share amounts)
7. Marketable Securities:
Marketable securities at December 31, 2013 and 2012 consists of the following:
2013 2012
Government debt securities, at par value . . . . . . . . . . . . . . . . . . . . . $— $23,769Less discount . . . . . . . . . . . . . . . . . . . . . . . . . . . . . . . . . . . . . . . . . — (102)
— 23,667Unrealized gain . . . . . . . . . . . . . . . . . . . . . . . . . . . . . . . . . . . . . . . — 685
Fair value . . . . . . . . . . . . . . . . . . . . . . . . . . . . . . . . . . . . . . . . . . . $— $24,352
The proceeds from maturities and interest receipts from the marketable securities were restrictedto the service of the Greeley Note (See Note 11—Bank and Other Notes Payable). On September 1,2013, the Greeley note was paid off in full.
8. Tenant and Other Receivables:
Included in tenant and other receivables, net is an allowance for doubtful accounts of $2,878 and$2,374 at December 31, 2013 and 2012, respectively. Also included in tenant and other receivables, net,are accrued percentage rents of $9,824 and $9,168 at December 31, 2013 and 2012, respectively, and adeferred rent receivable due to straight-line rent adjustments of $53,380 and $49,129 at December 31,2013 and 2012, respectively.
Included in tenant and other receivables, net are the following notes receivable:
On March 31, 2006, the Company received a note receivable that was secured by a deed of trust,bore interest at 5.5% and was to mature on March 31, 2031. This loan was collected in full onAugust 23, 2013. At December 31, 2012, the note had a balance of $8,502.
On August 18, 2009, the Company received a note receivable from J&R Holdings XV, LLC(‘‘Pederson’’) that bore interest at an effective rate of 16.3% and was to mature on December 31, 2013.Pederson was considered a related party because it had an ownership interest in Promenade at CasaGrande. The note was secured by Pederson’s interest in Promenade at Casa Grande. On November 26,2013, the Company acquired Pederson’s ownership interest in Casa Grande in exchange for the notereceivable. Interest income on the note was $561, $518 and $413 for the years ended December 31,2013, 2012 and 2011, respectively. The balance on the note at December 31, 2012 was $3,963.
97

THE MACERICH COMPANY
NOTES TO CONSOLIDATED FINANCIAL STATEMENTS (Continued)
(Dollars in thousands, except per share amounts)
9. Deferred Charges and Other Assets, net:
Deferred charges and other assets, net at December 31, 2013 and 2012 consist of the following:
2013 2012
Leasing . . . . . . . . . . . . . . . . . . . . . . . . . . . . . . . . . . . . . . . $ 223,038 $ 234,498Financing . . . . . . . . . . . . . . . . . . . . . . . . . . . . . . . . . . . . . . 51,695 42,868Intangible assets:
In-place lease values(1) . . . . . . . . . . . . . . . . . . . . . . . . . . 205,651 175,735Leasing commissions and legal costs(1) . . . . . . . . . . . . . . . 50,594 46,419Above-market leases . . . . . . . . . . . . . . . . . . . . . . . . . . . . 118,770 118,033
Deferred tax assets . . . . . . . . . . . . . . . . . . . . . . . . . . . . . . . 31,356 33,414Deferred compensation plan assets . . . . . . . . . . . . . . . . . . . 30,932 24,670Acquisition deposit . . . . . . . . . . . . . . . . . . . . . . . . . . . . . . . — 30,000Other assets . . . . . . . . . . . . . . . . . . . . . . . . . . . . . . . . . . . . 65,793 72,811
777,829 778,448Less accumulated amortization(2) . . . . . . . . . . . . . . . . . . . . (244,771) (213,318)
$ 533,058 $ 565,130
(1) The estimated amortization of these intangible assets for the next five years andthereafter is as follows:
Year Ending December 31,
2014 . . . . . . . . . . . . . . . . . . . . . . . . . . . . . . . . . . . . . . . . . . . . $ 43,0592015 . . . . . . . . . . . . . . . . . . . . . . . . . . . . . . . . . . . . . . . . . . . . 29,2932016 . . . . . . . . . . . . . . . . . . . . . . . . . . . . . . . . . . . . . . . . . . . . 21,3532017 . . . . . . . . . . . . . . . . . . . . . . . . . . . . . . . . . . . . . . . . . . . . 15,6232018 . . . . . . . . . . . . . . . . . . . . . . . . . . . . . . . . . . . . . . . . . . . . 12,540Thereafter . . . . . . . . . . . . . . . . . . . . . . . . . . . . . . . . . . . . . . . . 45,236
$167,104
(2) Accumulated amortization includes $89,141 and $62,792 relating to in-place lease values,leasing commissions and legal costs at December 31, 2013 and 2012, respectively.Amortization expense for in-place lease values, leasing commissions and legal costs was$53,139, $32,456 and $13,222 for the years ended December 31, 2013, 2012 and 2011,respectively.
98

THE MACERICH COMPANY
NOTES TO CONSOLIDATED FINANCIAL STATEMENTS (Continued)
(Dollars in thousands, except per share amounts)
9. Deferred Charges and Other Assets, net: (Continued)
The allocated values of above-market leases and below-market leases consist of the following:
2013 2012
Above-Market LeasesOriginal allocated value . . . . . . . . . . . . . . . . . . . . . . . . . . . . . $118,770 $118,033Less accumulated amortization . . . . . . . . . . . . . . . . . . . . . . . (46,912) (46,361)
$ 71,858 $ 71,672
Below-Market Leases(1)Original allocated value . . . . . . . . . . . . . . . . . . . . . . . . . . . . . $187,537 $164,489Less accumulated amortization . . . . . . . . . . . . . . . . . . . . . . . (79,271) (77,131)
$108,266 $ 87,358
(1) Below-market leases are included in other accrued liabilities.
The allocated values of above and below-market leases will be amortized into minimum rents on astraight-line basis over the individual remaining lease terms. The estimated amortization of these valuesfor the next five years and thereafter is as follows:
Above BelowYear Ending December 31, Market Market
2014 . . . . . . . . . . . . . . . . . . . . . . . . . . . . . . . . . . . . . . . . . . . $14,822 $ 20,2542015 . . . . . . . . . . . . . . . . . . . . . . . . . . . . . . . . . . . . . . . . . . . 12,824 14,9652016 . . . . . . . . . . . . . . . . . . . . . . . . . . . . . . . . . . . . . . . . . . . 10,682 11,9852017 . . . . . . . . . . . . . . . . . . . . . . . . . . . . . . . . . . . . . . . . . . . 8,641 9,5132018 . . . . . . . . . . . . . . . . . . . . . . . . . . . . . . . . . . . . . . . . . . . 6,755 7,878Thereafter . . . . . . . . . . . . . . . . . . . . . . . . . . . . . . . . . . . . . . . 18,134 43,671
$71,858 $108,266
99

THE MACERICH COMPANY
NOTES TO CONSOLIDATED FINANCIAL STATEMENTS (Continued)
(Dollars in thousands, except per share amounts)
10. Mortgage Notes Payable:
Mortgage notes payable at December 31, 2013 and 2012 consist of the following:
Carrying Amount of Mortgage Notes(1)
2013 2012 Effective MonthlyRelated Related Interest Debt Maturity
Property Pledged as Collateral Party Other Party Other Rate(2) Service(3) Date(4)
Arrowhead Towne Center . . . . . . . . . . . . $ — $ 236,028 $ — $ 243,176 2.76% $1,131 2018Camelback Colonnade(5) . . . . . . . . . . . . — 49,120 — — 2.16% 178 2015Chandler Fashion Center(6) . . . . . . . . . . . — 200,000 — 200,000 3.77% 625 2019Chesterfield Towne Center(7) . . . . . . . . . — — — 110,000 — — —Danbury Fair Mall . . . . . . . . . . . . . . . . . 117,120 117,120 119,823 119,823 5.53% 1,538 2020Deptford Mall . . . . . . . . . . . . . . . . . . . — 201,622 — 205,000 3.76% 947 2023Deptford Mall . . . . . . . . . . . . . . . . . . . — 14,551 — 14,800 6.46% 101 2016Eastland Mall . . . . . . . . . . . . . . . . . . . . — 168,000 — 168,000 5.79% 811 2016Fashion Outlets of Chicago(8) . . . . . . . . . — 91,383 — 9,165 2.96% 203 2017Fashion Outlets of Niagara Falls USA . . . . — 124,030 — 126,584 4.89% 727 2020Fiesta Mall(9) . . . . . . . . . . . . . . . . . . . . — — — 84,000 — — —Flagstaff Mall . . . . . . . . . . . . . . . . . . . . — 37,000 — 37,000 5.03% 153 2015FlatIron Crossing(10) . . . . . . . . . . . . . . . — 268,000 — 173,561 3.90% 1,393 2021Freehold Raceway Mall(6) . . . . . . . . . . . — 232,900 — 232,900 4.20% 805 2018Fresno Fashion Fair . . . . . . . . . . . . . . . . 79,391 79,390 80,601 80,602 6.76% 1,104 2015Great Northern Mall . . . . . . . . . . . . . . . — 35,484 — 36,395 5.19% 234 (11)Green Acres Mall(12) . . . . . . . . . . . . . . — 319,850 — — 3.61% 1,447 2021Kings Plaza Shopping Center(13) . . . . . . . — 490,548 — 354,000 3.67% 2,229 2019Northgate Mall(14) . . . . . . . . . . . . . . . . — 64,000 — 64,000 3.04% 130 2017Oaks, The . . . . . . . . . . . . . . . . . . . . . . — 214,239 — 218,119 4.14% 1,064 2022Pacific View . . . . . . . . . . . . . . . . . . . . . — 135,835 — 138,367 4.08% 668 2022Paradise Valley Mall(15) . . . . . . . . . . . . . — — — 81,000 — — —Promenade at Casa Grande(16) . . . . . . . . — — — 73,700 — — —Salisbury, Centre at(7) . . . . . . . . . . . . . . — — — 115,000 — — —Santa Monica Place . . . . . . . . . . . . . . . . — 235,445 — 240,000 2.99% 1,004 2018SanTan Village Regional Center(17) . . . . . — 136,629 — 138,087 3.14% 589 2019South Plains Mall . . . . . . . . . . . . . . . . . — 99,833 — 101,340 6.59% 648 2015South Towne Center(18) . . . . . . . . . . . . . — — — 85,247 — — —Superstition Springs Center(19) . . . . . . . . — 68,395 — — 2.00% 139 2016Towne Mall . . . . . . . . . . . . . . . . . . . . . — 22,996 — 23,369 4.48% 117 2022Tucson La Encantada . . . . . . . . . . . . . . . 72,870 — 74,185 — 4.23% 368 2022Twenty Ninth Street(20) . . . . . . . . . . . . . — — — 107,000 — — —Valley Mall . . . . . . . . . . . . . . . . . . . . . . — 42,155 — 42,891 5.85% 280 2016Valley River Center . . . . . . . . . . . . . . . . — 120,000 — 120,000 5.59% 558 2016Victor Valley, Mall of(21) . . . . . . . . . . . . — 90,000 — 90,000 2.73% 183 2014Vintage Faire Mall(18) . . . . . . . . . . . . . . — 99,083 — 135,000 5.81% 586 2015Westside Pavilion . . . . . . . . . . . . . . . . . . — 152,173 — 154,608 4.49% 783 2022Wilton Mall(22) . . . . . . . . . . . . . . . . . . — — — 40,000 — — —
$269,381 $4,145,809 $274,609 $4,162,734
(1) The mortgage notes payable balances include the unamortized debt premiums (discounts). Debt premiums(discounts) represent the excess (deficiency) of the fair value of debt over (under) the principal value of debtassumed in various acquisitions and are amortized into interest expense over the remaining term of the related debtin a manner that approximates the effective interest method.
100

THE MACERICH COMPANY
NOTES TO CONSOLIDATED FINANCIAL STATEMENTS (Continued)
(Dollars in thousands, except per share amounts)
10. Mortgage Notes Payable: (Continued)
The debt premiums (discounts) as of December 31, 2013 and 2012 consist of the following:
Property Pledged as Collateral 2013 2012
Arrowhead Towne Center . . . . . . . . . . . . . . . . . . . . . . . . . . . . . . . . . . . . . . $14,642 $17,716Camelback Colonnade . . . . . . . . . . . . . . . . . . . . . . . . . . . . . . . . . . . . . . . . 2,120 —Deptford Mall . . . . . . . . . . . . . . . . . . . . . . . . . . . . . . . . . . . . . . . . . . . . . (14) (19)Fashion Outlets of Niagara Falls USA . . . . . . . . . . . . . . . . . . . . . . . . . . . . . . 6,342 7,270FlatIron Crossing . . . . . . . . . . . . . . . . . . . . . . . . . . . . . . . . . . . . . . . . . . . — 5,232Great Northern Mall . . . . . . . . . . . . . . . . . . . . . . . . . . . . . . . . . . . . . . . . . — (28)Superstition Springs Center . . . . . . . . . . . . . . . . . . . . . . . . . . . . . . . . . . . . . 895 —Valley Mall . . . . . . . . . . . . . . . . . . . . . . . . . . . . . . . . . . . . . . . . . . . . . . . (219) (307)
$23,766 $29,864
(2) The interest rate disclosed represents the effective interest rate, including the debt premiums (discounts) anddeferred finance costs.
(3) The monthly debt service represents the payment of principal and interest.
(4) The maturity date assumes that all extension options are fully exercised and that the Company does not opt torefinance the debt prior to these dates. These extension options are at the Company’s discretion, subject to certainconditions, which the Company believes will be met.
(5) On September 17, 2013, the Company obtained control of the consolidated joint venture as a result of theCamelback Colonnade Restructuring (See Note 15—Acquisitions). The loan on the property bears interest at aneffective rate of 2.16% and matures on October 12, 2015.
(6) A 49.9% interest in the loan has been assumed by a third party in connection with a co-venture arrangement (SeeNote 12—Co-Venture Arrangement).
(7) On December 11, 2013, in connection with the sale of the property (See Note 16—Discontinued Operations), athird party assumed the existing loan on the property. As a result, the Company has been discharged from thisnon-recourse loan.
(8) The construction loan on the property allows for borrowings up to $140,000, bears interest at LIBOR plus 2.50%and matures on March 5, 2017, including extension options. At December 31, 2013 and 2012, the total interest ratewas 2.96% and 3.00%, respectively.
(9) On September 30, 2013, the Company conveyed the property to the lender by a deed-in-lieu of foreclosure. As aresult, the Company has been discharged from this non-recourse loan (See Note 16—Discontinued Operations).
(10) On June 4, 2013, the existing loan was paid off in full, which resulted in a gain of $2,791 on the earlyextinguishment of debt. On November 8, 2013, the Company placed a new $268,000 loan on the property that bearsinterest at an effective rate of 3.90% and matures on January 5, 2021.
(11) The loan’s original maturity date was December 1, 2013. Accordingly, the loan was in maturity default subsequent tothat date. As a result, the Company accrued default interest on the loan at a rate of 4% in addition to the effectiverate of interest of 5.19%. In February 2014, the Company reached an agreement with the lender to extend the loanto January 1, 2015 and waive the default interest.
(12) On January 24, 2013, in connection with the Company’s acquisition of the property (See Note 15—Acquisitions), theCompany placed a new loan on the property that allowed for borrowings of up to $325,000, bears interest at aneffective interest rate of 3.61% and matures on February 3, 2021. Concurrent with the acquisition, the Companyborrowed $100,000 on the loan. On January 31, 2013, the Company exercised its option to borrow an additional$225,000 on the loan.
(13) On January 3, 2013, the Company exercised its option to borrow an additional $146,000 on the loan.
101

THE MACERICH COMPANY
NOTES TO CONSOLIDATED FINANCIAL STATEMENTS (Continued)
(Dollars in thousands, except per share amounts)
10. Mortgage Notes Payable: (Continued)
(14) The loan bears interest at LIBOR plus 2.25% and matures on March 1, 2017. At December 31, 2013 and 2012, thetotal interest rate was 3.04% and 3.09%, respectively.
(15) On August 26, 2013, the loan was paid off in full.
(16) On December 30, 2013, the loan was paid off in full.
(17) On May 30, 2013, the consolidated joint venture replaced the existing loan on the property with a new $138,000 loanthat bears interest at an effective rate of 3.14% and matures on June 1, 2019.
(18) On April 30, 2013, the existing loan on Vintage Faire Mall was paid off in full, resulting in a loss of $853 on theearly extinguishment of debt. Concurrently, the loan on South Towne Center was transferred to Vintage Faire Mall.An additional $15,200 was borrowed on the loan on Vintage Faire Mall that bears interest at an effective rate of2.91% and matures on November 5, 2015.
(19) On October 24, 2013, the Company purchased the 33.3% interest in Superstition Springs Center that it did not own(See Note 15—Acquisitions). In connection with the acquisition, the Company assumed the loan on the propertywith a fair value of $68,448 that bears interest at an effective rate of 2.00% and matures on October 28, 2016.
(20) On November 8, 2013, the loan was paid off in full, which resulted in a loss of $506 on the early extinguishment ofdebt.
(21) The loan bears interest at LIBOR plus 2.25% and matures on November 6, 2014. At December 31, 2013 and 2012,the total interest rate was 2.73% and 2.12%, respectively.
(22) On August 1, 2013, the loan was paid off in full.
Most of the mortgage loan agreements contain a prepayment penalty provision for the earlyextinguishment of the debt.
Most of the Company’s mortgage notes payable are secured by the properties on which they areplaced and are non-recourse to the Company. As of December 31, 2013 and 2012, a total of $77,192and $213,466, respectively, of the mortgage notes payable could become recourse to the Company. TheCompany had indemnity agreements from consolidated joint venture partners for $28,208 of theguaranteed amount at December 31, 2012.
The Company expects all loan maturities during the next twelve months will be refinanced,restructured, extended and/or paid-off from the Company’s line of credit or with cash on hand.
Total interest expense capitalized during the years ended December 31, 2013, 2012 and 2011 was$10,829, $10,703 and $11,905, respectively.
Related party mortgage notes payable are amounts due to affiliates of NML. See Note 19—Related Party Transactions for interest expense associated with loans from NML.
The estimated fair value (Level 2 measurement) of mortgage notes payable at December 31, 2013and 2012 was $4,500,177 and $4,567,658, respectively, based on current interest rates for comparableloans. The method for computing fair value was determined using a present value model and aninterest rate that included a credit value adjustment based on the estimated value of the property thatserves as collateral for the underlying debt.
102

THE MACERICH COMPANY
NOTES TO CONSOLIDATED FINANCIAL STATEMENTS (Continued)
(Dollars in thousands, except per share amounts)
10. Mortgage Notes Payable: (Continued)
The future maturities of mortgage notes payable are as follows:
2014 . . . . . . . . . . . . . . . . . . . . . . . . . . . . . . . . . . . . . . . . . . . . . . . . . . $ 157,5292015 . . . . . . . . . . . . . . . . . . . . . . . . . . . . . . . . . . . . . . . . . . . . . . . . . . 500,7722016 . . . . . . . . . . . . . . . . . . . . . . . . . . . . . . . . . . . . . . . . . . . . . . . . . . 476,0592017 . . . . . . . . . . . . . . . . . . . . . . . . . . . . . . . . . . . . . . . . . . . . . . . . . . 220,7122018 . . . . . . . . . . . . . . . . . . . . . . . . . . . . . . . . . . . . . . . . . . . . . . . . . . 693,060Thereafter . . . . . . . . . . . . . . . . . . . . . . . . . . . . . . . . . . . . . . . . . . . . . 2,343,292
4,391,424Debt premium, net . . . . . . . . . . . . . . . . . . . . . . . . . . . . . . . . . . . . . . . 23,766
$4,415,190
The future maturities reflected above reflect the extension options that the Company believes willbe exercised.
11. Bank and Other Notes Payable:
Bank and other notes payable consist of the following:
Senior Notes:
On March 16, 2007, the Company issued $950,000 in Senior Notes that matured on March 15,2012. The Senior Notes bore interest at 3.25%, were payable semiannually, were senior to unsecureddebt of the Company and were guaranteed by the Operating Partnership.
During the year ended December 31, 2011, the Company repurchased and retired $180,314 of theSenior Notes for $180,792 and recorded a loss on the early extinguishment of debt of $1,449. Therepurchase was funded by borrowings under the Company’s line of credit. On March 15, 2012, theCompany paid-off in full the $439,318 of Senior Notes then outstanding.
Line of Credit:
The Company has a $1,500,000 revolving line of credit that initially bore interest at LIBOR plus aspread of 1.75% to 3.0%, depending on the Company’s overall leverage levels, and was to mature onMay 2, 2015 with a one-year extension option. The line of credit had the ability to be expanded,depending on certain conditions, up to a total facility of $2,000,000 less the outstanding balance of the$125,000 unsecured term loan as described below.
On August 6, 2013, the Company’s line of credit was amended and extended. The amended facilityprovides for an interest rate of LIBOR plus a spread of 1.375% to 2.0%, depending on the Company’soverall leverage levels, and matures on August 6, 2018. Based on the Company’s leverage level as ofDecember 31, 2013, the borrowing rate on the facility was LIBOR plus 1.50%. In addition, the line ofcredit can be expanded, depending on certain conditions, up to a total facility of $2,000,000 (withoutgiving effect to the $125,000 unsecured term loan described below).
103

THE MACERICH COMPANY
NOTES TO CONSOLIDATED FINANCIAL STATEMENTS (Continued)
(Dollars in thousands, except per share amounts)
11. Bank and Other Notes Payable: (Continued)
As of December 31, 2013 and 2012, borrowings under the line of credit were $30,000 and$675,000, respectively, at an average interest rate of 1.85% and 2.76%, respectively. The estimated fairvalue (Level 2 measurement) of the line of credit at December 31, 2013 and 2012 was $28,214 and$675,107, respectively, based on a present value model using a credit interest rate spread offered to theCompany for comparable debt.
Term Loan:
On December 8, 2011, the Company obtained a $125,000 unsecured term loan under the line ofcredit that bears interest at LIBOR plus a spread of 1.95% to 3.20%, depending on the Company’soverall leverage level, and matures on December 8, 2018. Based on the Company’s current leveragelevels, the borrowing rate is LIBOR plus 2.20%. As of December 31, 2013 and 2012, the total interestrate was 2.51% and 2.57%, respectively. The estimated fair value (Level 2 measurement) of the termloan at December 31, 2013 and 2012 was $120,802 and $121,821, respectively, based on a present valuemodel using a credit interest rate spread offered to the Company for comparable debt.
Greeley Note:
On July 27, 2006, concurrent with the sale of Greeley Mall, the Company provided marketablesecurities to replace Greeley Mall as collateral for the mortgage note payable on the property (SeeNote 7—Marketable Securities). As a result of this transaction, the mortgage note payable wasreclassified to bank and other notes payable. On September 1, 2013, the loan was paid off in full. AtDecember 31, 2012, the Greeley Note had a balance outstanding of $24,027.
Prasada Note:
On March 29, 2013, the Company issued a $13,330 note payable that bears interest at 5.25% andmatures on March 29, 2016. The note payable is collateralized by a portion of a developmentreimbursement agreement with the City of Surprise, Arizona. At December 31, 2013, the note had abalance of $12,537. The estimated fair value (Level 2 measurement) of the note at December 31, 2013was $13,114 based on current interest rates for comparable notes. The method for computing fair valuewas determined using a present value model and an interest rate that included a credit valueadjustment based on the estimated value of the collateral for the underlying debt.
As of December 31, 2013 and 2012, the Company was in compliance with all applicable financialloan covenants.
The future maturities of bank and other notes payable are as follows:
2014 . . . . . . . . . . . . . . . . . . . . . . . . . . . . . . . . . . . . . . . . . . . . . . . . . . . $ 1,6602015 . . . . . . . . . . . . . . . . . . . . . . . . . . . . . . . . . . . . . . . . . . . . . . . . . . . 1,7502016 . . . . . . . . . . . . . . . . . . . . . . . . . . . . . . . . . . . . . . . . . . . . . . . . . . . 9,1272018 . . . . . . . . . . . . . . . . . . . . . . . . . . . . . . . . . . . . . . . . . . . . . . . . . . . 155,000
$167,537
104

THE MACERICH COMPANY
NOTES TO CONSOLIDATED FINANCIAL STATEMENTS (Continued)
(Dollars in thousands, except per share amounts)
12. Co-Venture Arrangement:
On September 30, 2009, the Company formed a joint venture, whereby a third party acquired a49.9% interest in Freehold Raceway Mall, a 1,674,000 square foot regional shopping center in Freehold,New Jersey, and Chandler Fashion Center, a 1,321,000 square foot regional shopping center inChandler, Arizona. As part of this transaction, the Company issued a warrant in favor of the thirdparty to purchase 935,358 shares of common stock of the Company at an exercise price of $46.68 pershare (See ‘‘Stock Warrants’’ in Note 14—Stockholders’ Equity). The Company received approximately$174,650 in cash proceeds for the overall transaction, of which $6,496 was attributed to the warrants.The Company used the proceeds from this transaction to pay down its line of credit and for generalcorporate purposes.
As a result of the Company having certain rights under the agreement to repurchase the assetsafter the seventh year of the venture formation, the transaction did not qualify for sale treatment. TheCompany, however, is not obligated to repurchase the assets. The transaction has been accounted foras a profit-sharing arrangement, and accordingly the assets, liabilities and operations of the propertiesremain on the books of the Company and a co-venture obligation was established for the amount of$168,154, representing the net cash proceeds received from the third party less costs allocated to thewarrant. The co-venture obligation is increased for the allocation of income to the co-venture partnerand decreased for distributions to the co-venture partner. The co-venture obligation was $81,515 and$92,215 at December 31, 2013 and 2012, respectively.
13. Noncontrolling Interests:
The Company allocates net income of the Operating Partnership based on the weighted averageownership interest during the period. The net income of the Operating Partnership that is notattributable to the Company is reflected in the consolidated statements of operations as noncontrollinginterests. The Company adjusts the noncontrolling interests in the Operating Partnership at the end ofeach period to reflect its ownership interest in the Company. The Company had a 93% ownershipinterest in the Operating Partnership as of December 31, 2013 and 2012. The remaining 7% limitedpartnership interest as of December 31, 2013 and 2012 was owned by certain of the Company’sexecutive officers and directors, certain of their affiliates, and other third party investors in the form ofOP Units. The OP Units may be redeemed for shares of stock or cash, at the Company’s option. Theredemption value for each OP Unit as of any balance sheet date is the amount equal to the average ofthe closing price per share of the Company’s common stock, par value $0.01 per share, as reported onthe New York Stock Exchange for the ten trading days ending on the respective balance sheet date.Accordingly, as of December 31, 2013 and 2012, the aggregate redemption value of thethen-outstanding OP Units not owned by the Company was $587,917 and $586,409, respectively.
The Company issued common and cumulative preferred units of MACWH, LP in April 2005 inconnection with the acquisition of the Wilmorite portfolio. The common and preferred units ofMACWH, LP are redeemable at the election of the holder, the Company may redeem them for cash orshares of the Company’s stock at the Company’s option, and they are classified as permanent equity.
Included in permanent equity are outside ownership interests in various consolidated jointventures. The joint ventures do not have rights that require the Company to redeem the ownershipinterests in either cash or stock.
105

THE MACERICH COMPANY
NOTES TO CONSOLIDATED FINANCIAL STATEMENTS (Continued)
(Dollars in thousands, except per share amounts)
13. Noncontrolling Interests: (Continued)
The outside ownership interests in the Company’s joint venture in Shoppingtown Mall had apurchase option for $11,366. Due to the redemption feature of the ownership interest in ShoppingtownMall, these noncontrolling interests were included in temporary equity. The Company exercised its rightto redeem the outside ownership interests in the partnership in cash and the redemption closed onSeptember 14, 2011. On December 30, 2011, the Company conveyed Shoppingtown Mall to themortgage note lender by a deed-in-lieu of foreclosure (See Note 16—Discontinued Operations).
14. Stockholders’ Equity:
Stock Warrants:
On September 30, 2009, the Company issued a warrant in connection with its formation of aco-venture to own and operate Freehold Raceway Mall and Chandler Fashion Center (See Note 12—Co-Venture Arrangement). The warrant provided for the purchase of 935,358 shares of the Company’scommon stock. The warrant was valued at $6,496 and recorded as a credit to additional paid-in capital.The warrant had an exercise price of $46.68 per share, with such price subject to anti-dilutiveadjustments. In December 2011, the holders requested a net issue exercise of 311,786 shares of thewarrant and the Company elected to deliver a cash payment of $1,278 in exchange for the portion ofthe warrant exercised. On April 10, 2012, the holders requested a net exercise of an additional 311,786shares of the warrant and the Company elected to deliver a cash payment of $3,448 in exchange for theportion of the warrant exercised. On October 24, 2012, the holders requested a net exercise of theremaining 311,786 shares of the warrant and the Company elected to deliver a cash payment of $3,923in exchange for the portion of the warrant exercised.
At-The-Market Stock Offering Program (‘‘ATM Program’’):
On August 17, 2012, the Company entered into an equity distribution agreement (‘‘DistributionAgreement’’) with a number of sales agents to issue and sell, from time to time, shares of commonstock, par value $0.01 per share, having an aggregate offering price of up to $500,000 (the ‘‘Shares’’).Sales of the Shares, if any, may be made in privately negotiated transactions and/or any other methodpermitted by law, including sales deemed to be an ‘‘at the market’’ offering, which includes sales madedirectly on the New York Stock Exchange or sales made to or through a market maker other than onan exchange. The Company will pay each sales agent a commission that will not exceed, but may belower than, 2% of the gross proceeds of the Shares sold through such sales agent under theDistribution Agreement.
During the year ended December 31, 2012, the Company sold 2,961,903 shares of common stockunder the ATM Program in exchange for aggregate gross proceeds of $177,896 and net proceeds of$175,649 after commissions and other transaction costs. The proceeds from the sales were used to paydown the Company’s line of credit. During the year ended December 31, 2013, the Company sold2,456,956 shares of common stock under the ATM Program in exchange for aggregate gross proceedsof $173,011 and net proceeds of $171,102 after commissions and other transaction costs. The proceedsfrom the sales were used to pay down the Company’s line of credit.
As of December 31, 2013, $149,093 remained available to be sold under the ATM Program. Actualfuture sales will depend upon a variety of factors including but not limited to market conditions, the
106

THE MACERICH COMPANY
NOTES TO CONSOLIDATED FINANCIAL STATEMENTS (Continued)
(Dollars in thousands, except per share amounts)
14. Stockholders’ Equity: (Continued)
trading price of the Company’s common stock and the Company’s capital needs. The Company has noobligation to sell the remaining shares available for sale under the ATM Program.
Stock Issued to Acquire Property:
On November 28, 2012, the Company issued 535,265 restricted shares of common stock inconnection with the acquisition of Kings Plaza Shopping Center (See Note 15—Acquisitions) for avalue of $30,000, based on the average closing price of the Company’s common stock for the tenpreceding trading days.
15. Acquisitions:
Desert Sky Mall:
On February 28, 2011, the Company acquired the remaining 50% ownership interest in Desert SkyMall that it did not own for $27,625. The acquisition was completed in order to gain 100% ownershipand control over this well located asset. The purchase price was funded by a cash payment of $1,875and the assumption of the third party’s pro rata share of the mortgage note payable on the property of$25,750. Concurrent with the purchase of the partnership interest, the Company paid off the $51,500loan on the property. Prior to the acquisition, the Company had accounted for its investment under theequity method (See Note 4—Investments in Unconsolidated Joint Ventures). As a result of thistransaction, the Company obtained 100% ownership of Desert Sky Mall.
The following is a summary of the allocation of the fair value of Desert Sky Mall:
Property . . . . . . . . . . . . . . . . . . . . . . . . . . . . . . . . . . . . . . . . . . . . . . . . . $46,603Deferred charges . . . . . . . . . . . . . . . . . . . . . . . . . . . . . . . . . . . . . . . . . . . 5,474Cash and cash equivalents . . . . . . . . . . . . . . . . . . . . . . . . . . . . . . . . . . . . 6,057Tenant receivables . . . . . . . . . . . . . . . . . . . . . . . . . . . . . . . . . . . . . . . . . . 202Other assets . . . . . . . . . . . . . . . . . . . . . . . . . . . . . . . . . . . . . . . . . . . . . . 4,481
Total assets acquired . . . . . . . . . . . . . . . . . . . . . . . . . . . . . . . . . . . . . . 62,817
Mortgage note payable . . . . . . . . . . . . . . . . . . . . . . . . . . . . . . . . . . . . . . 51,500Accounts payable . . . . . . . . . . . . . . . . . . . . . . . . . . . . . . . . . . . . . . . . . . 33Other accrued liabilities . . . . . . . . . . . . . . . . . . . . . . . . . . . . . . . . . . . . . . 3,017
Total liabilities assumed . . . . . . . . . . . . . . . . . . . . . . . . . . . . . . . . . . . . 54,550
Fair value of acquired net assets (at 100% ownership) . . . . . . . . . . . . . . $ 8,267
The Company determined that the purchase price represented the fair value of the additionalownership interest in Desert Sky Mall that was acquired. Accordingly, the Company also determined
107

THE MACERICH COMPANY
NOTES TO CONSOLIDATED FINANCIAL STATEMENTS (Continued)
(Dollars in thousands, except per share amounts)
15. Acquisitions: (Continued)
that the fair value of the acquired ownership interest in Desert Sky Mall equaled the fair value of theCompany’s existing ownership interest.
Fair value of existing ownership interest (at 50% ownership) . . . . . . . . . . . $ 4,164Carrying value of investment in Desert Sky Mall . . . . . . . . . . . . . . . . . . . . (2,296)
Gain on remeasurement . . . . . . . . . . . . . . . . . . . . . . . . . . . . . . . . . . . . $ 1,868
The Company has included the gain in (loss) gain on remeasurement, sale or write down of assets,net for the year ended December 31, 2011 (See Note 6—Property).
Superstition Springs Land:
On June 3, 2011, the Company acquired the additional 50% ownership interest in SuperstitionSprings Land that it did not own in connection with the GGP Exchange (See Note 4—Investments inUnconsolidated Joint Ventures). Prior to the acquisition, the Company had accounted for its investmentin Superstition Springs Land under the equity method. As a result of this transaction, the Companyobtained 100% ownership of the land.
The Company recorded the fair value of Superstition Springs Land at $12,914. As a result ofobtaining control of this property, the Company recognized a gain of $1,734, which is included in (loss)gain on remeasurement, sale or write down of assets, net for the year ended December 31, 2011 (SeeNote 6—Property). Since the date of acquisition, the Company has included Superstition Springs Landin its consolidated financial statements.
Fashion Outlets of Niagara Falls USA:
On July 22, 2011, the Company acquired the Fashion Outlets of Niagara Falls USA, a 525,000square foot outlet center in Niagara Falls, New York. The initial purchase price of $200,000 was fundedby a cash payment of $78,579 and the assumption of the mortgage note payable with a carrying valueof $121,421 and a fair value of $130,006. The cash purchase price was funded from borrowings underthe Company’s line of credit.
The purchase and sale agreement includes contingent consideration based on the performance ofthe Fashion Outlets of Niagara Falls USA from the acquisition date through July 21, 2014 that couldincrease the purchase price from the initial $200,000 up to a maximum of $218,322. The Companyestimated the fair value of the contingent consideration as of December 31, 2013 to be $17,491, whichhas been included in other accrued liabilities as part of the fair value of the total liabilities assumed.
108

THE MACERICH COMPANY
NOTES TO CONSOLIDATED FINANCIAL STATEMENTS (Continued)
(Dollars in thousands, except per share amounts)
15. Acquisitions: (Continued)
The following is a summary of the allocation of the fair value of the Fashion Outlets of NiagaraFalls USA:
Property . . . . . . . . . . . . . . . . . . . . . . . . . . . . . . . . . . . . . . . . . . . . . . . . $228,720Deferred charges . . . . . . . . . . . . . . . . . . . . . . . . . . . . . . . . . . . . . . . . . . 10,383Restricted cash . . . . . . . . . . . . . . . . . . . . . . . . . . . . . . . . . . . . . . . . . . . 5,367Other assets . . . . . . . . . . . . . . . . . . . . . . . . . . . . . . . . . . . . . . . . . . . . . 3,090
Total assets acquired . . . . . . . . . . . . . . . . . . . . . . . . . . . . . . . . . . . . . . 247,560
Mortgage note payable . . . . . . . . . . . . . . . . . . . . . . . . . . . . . . . . . . . . . 130,006Accounts payable . . . . . . . . . . . . . . . . . . . . . . . . . . . . . . . . . . . . . . . . . . 231Other accrued liabilities . . . . . . . . . . . . . . . . . . . . . . . . . . . . . . . . . . . . . 38,037
Total liabilities assumed . . . . . . . . . . . . . . . . . . . . . . . . . . . . . . . . . . . 168,274
Fair value of acquired net assets . . . . . . . . . . . . . . . . . . . . . . . . . . . . . $ 79,286
The Company determined that the purchase price, including the estimated fair value of contingentconsideration, represented the fair value of the assets acquired and liabilities assumed.
SDG Acquisition Properties:
On December 31, 2011, the Company acquired the SDG Acquisition Properties as a result of theSDG Transaction. The Company completed the SDG Transaction in order to gain 100% control of theSDG Acquisition Properties. In connection with the acquisition, the Company assumed the mortgagenotes payable on Eastland Mall and Valley Mall. Prior to the acquisition, the Company had accountedfor its investment in SDG Macerich under the equity method (See Note 4—Investments inUnconsolidated Joint Ventures). As a result of this transaction, the Company obtained 100% ownershipof the SDG Acquisition Properties.
The following is a summary of the allocation of the fair value of the SDG Acquisition Properties:
Property . . . . . . . . . . . . . . . . . . . . . . . . . . . . . . . . . . . . . . . . . . . . . . . . $371,344Deferred charges . . . . . . . . . . . . . . . . . . . . . . . . . . . . . . . . . . . . . . . . . . 30,786Tenant receivables . . . . . . . . . . . . . . . . . . . . . . . . . . . . . . . . . . . . . . . . . 10,048Other assets . . . . . . . . . . . . . . . . . . . . . . . . . . . . . . . . . . . . . . . . . . . . . 32,826
Total assets acquired . . . . . . . . . . . . . . . . . . . . . . . . . . . . . . . . . . . . . . 445,004
Mortgage note payable . . . . . . . . . . . . . . . . . . . . . . . . . . . . . . . . . . . . . 211,543Accounts payable . . . . . . . . . . . . . . . . . . . . . . . . . . . . . . . . . . . . . . . . . . 10,416Other accrued liabilities . . . . . . . . . . . . . . . . . . . . . . . . . . . . . . . . . . . . . 18,578
Total liabilities assumed . . . . . . . . . . . . . . . . . . . . . . . . . . . . . . . . . . . 240,537
Fair value of acquired net assets . . . . . . . . . . . . . . . . . . . . . . . . . . . . . $204,467
The Company determined that the purchase price represented the fair value of the assets acquiredand liabilities assumed.
109

THE MACERICH COMPANY
NOTES TO CONSOLIDATED FINANCIAL STATEMENTS (Continued)
(Dollars in thousands, except per share amounts)
15. Acquisitions: (Continued)
Capitola Kohl’s:
On April 29, 2011, the Company purchased a fee interest in a freestanding Kohl’s store at CapitolaMall for $28,500. The purchase price was paid from cash on hand.
500 North Michigan Avenue:
On February 29, 2012, the Company acquired a 323,000 square foot mixed-use retail/office buildingin Chicago, Illinois (‘‘500 North Michigan Avenue’’) for $70,925. The purchase price was funded fromborrowings under the Company’s line of credit. The acquisition was completed in order to gain controlover the property adjacent to The Shops at North Bridge.
The following is a summary of the allocation of the fair value of 500 North Michigan Avenue:
Property . . . . . . . . . . . . . . . . . . . . . . . . . . . . . . . . . . . . . . . . . . . . . . . . . $66,033Deferred charges . . . . . . . . . . . . . . . . . . . . . . . . . . . . . . . . . . . . . . . . . . . 7,450Other assets . . . . . . . . . . . . . . . . . . . . . . . . . . . . . . . . . . . . . . . . . . . . . . 2,143
Total assets acquired . . . . . . . . . . . . . . . . . . . . . . . . . . . . . . . . . . . . . . 75,626
Other accrued liabilities . . . . . . . . . . . . . . . . . . . . . . . . . . . . . . . . . . . . . . 4,701
Total liabilities assumed . . . . . . . . . . . . . . . . . . . . . . . . . . . . . . . . . . . . 4,701
Fair value of acquired net assets . . . . . . . . . . . . . . . . . . . . . . . . . . . . . . $70,925
The Company determined that the purchase price represented the fair value of the assets acquiredand liabilities assumed.
Since the date of acquisition, the Company has included 500 North Michigan Avenue in itsconsolidated financial statements.
FlatIron Crossing:
On October 3, 2012, the Company acquired the 75% ownership interest in FlatIron Crossing thatit did not own for $310,397. The acquisition was completed in order to gain 100% ownership andcontrol over this asset. The purchase price was funded by a cash payment of $195,900 and theassumption of the third party’s share of the mortgage note payable on the property of $114,497. Priorto the acquisition, the Company had accounted for its investment under the equity method (SeeNote 4—Investments in Unconsolidated Joint Ventures). As a result of this transaction, the Companyobtained 100% ownership of FlatIron Crossing.
110

THE MACERICH COMPANY
NOTES TO CONSOLIDATED FINANCIAL STATEMENTS (Continued)
(Dollars in thousands, except per share amounts)
15. Acquisitions: (Continued)
The following is a summary of the allocation of the fair value of FlatIron Crossing:
Property . . . . . . . . . . . . . . . . . . . . . . . . . . . . . . . . . . . . . . . . . . . . . . . . $443,391Deferred charges . . . . . . . . . . . . . . . . . . . . . . . . . . . . . . . . . . . . . . . . . . 25,251Cash and cash equivalents . . . . . . . . . . . . . . . . . . . . . . . . . . . . . . . . . . . 3,856Other assets . . . . . . . . . . . . . . . . . . . . . . . . . . . . . . . . . . . . . . . . . . . . . 2,101
Total assets acquired . . . . . . . . . . . . . . . . . . . . . . . . . . . . . . . . . . . . . . 474,599
Mortgage note payable . . . . . . . . . . . . . . . . . . . . . . . . . . . . . . . . . . . . . 175,720Accounts payable . . . . . . . . . . . . . . . . . . . . . . . . . . . . . . . . . . . . . . . . . . 366Other accrued liabilities . . . . . . . . . . . . . . . . . . . . . . . . . . . . . . . . . . . . . 11,071
Total liabilities assumed . . . . . . . . . . . . . . . . . . . . . . . . . . . . . . . . . . . 187,157
Fair value of acquired net assets (at 100% ownership) . . . . . . . . . . . . . $287,442
The Company determined that the purchase price represented the fair value of the additionalownership interest in FlatIron Crossing that was acquired.
Fair value of existing ownership interest (at 25% ownership) . . . . . . . . . . $ 91,542Carrying value of investment . . . . . . . . . . . . . . . . . . . . . . . . . . . . . . . . . (33,382)Prior gain deferral recognized . . . . . . . . . . . . . . . . . . . . . . . . . . . . . . . . . 26,067
Gain on remeasurement . . . . . . . . . . . . . . . . . . . . . . . . . . . . . . . . . . . $ 84,227
The following is the reconciliation of the purchase price to the fair value of the acquired netassets:
Purchase price . . . . . . . . . . . . . . . . . . . . . . . . . . . . . . . . . . . . . . . . . . . $ 310,397Less debt assumed . . . . . . . . . . . . . . . . . . . . . . . . . . . . . . . . . . . . . . . . (114,497)Carrying value of investment . . . . . . . . . . . . . . . . . . . . . . . . . . . . . . . . . 33,382Remeasurement gain . . . . . . . . . . . . . . . . . . . . . . . . . . . . . . . . . . . . . . 84,227Less prior gain deferral . . . . . . . . . . . . . . . . . . . . . . . . . . . . . . . . . . . . (26,067)
Fair value of acquired net assets (at 100% ownership) . . . . . . . . . . . . . . $ 287,442
The Company has included the gain in (loss) gain on remeasurement, sale or write down of assets,net for the year ended December 31, 2012 (See Note 6—Property). The prior gain deferral relates tothe prior sale of the 75% ownership interest in FlatIron Crossing. Due to certain contractual rights thatwere afforded to the buyer of the interest, a portion of that gain was deferred.
Since the date of acquisition, the Company has included FlatIron Crossing in its consolidatedfinancial statements.
Arrowhead Towne Center:
On October 26, 2012, the Company acquired the remaining 33.3% ownership interest inArrowhead Towne Center that it did not own for $144,400. The acquisition was completed in order to
111

THE MACERICH COMPANY
NOTES TO CONSOLIDATED FINANCIAL STATEMENTS (Continued)
(Dollars in thousands, except per share amounts)
15. Acquisitions: (Continued)
gain 100% ownership and control over this asset. The purchase price was funded by a cash payment of$69,025 and the assumption of the third party’s pro rata share of the mortgage note payable on theproperty of $75,375. Prior to the acquisition, the Company had accounted for its investment under theequity method (See Note 4—Investments in Unconsolidated Joint Ventures). As a result of thistransaction, the Company obtained 100% ownership of Arrowhead Towne Center.
The following is a summary of the allocation of the fair value of Arrowhead Towne Center:
Property . . . . . . . . . . . . . . . . . . . . . . . . . . . . . . . . . . . . . . . . . . . . . . . . $423,349Deferred charges . . . . . . . . . . . . . . . . . . . . . . . . . . . . . . . . . . . . . . . . . . 31,500Restricted cash . . . . . . . . . . . . . . . . . . . . . . . . . . . . . . . . . . . . . . . . . . . 4,009Tenant receivables . . . . . . . . . . . . . . . . . . . . . . . . . . . . . . . . . . . . . . . . . 926Other assets . . . . . . . . . . . . . . . . . . . . . . . . . . . . . . . . . . . . . . . . . . . . . 4,234
Total assets acquired . . . . . . . . . . . . . . . . . . . . . . . . . . . . . . . . . . . . . . 464,018
Mortgage note payable . . . . . . . . . . . . . . . . . . . . . . . . . . . . . . . . . . . . . 244,403Accounts payable . . . . . . . . . . . . . . . . . . . . . . . . . . . . . . . . . . . . . . . . . . 815Other accrued liabilities . . . . . . . . . . . . . . . . . . . . . . . . . . . . . . . . . . . . . 10,449
Total liabilities assumed . . . . . . . . . . . . . . . . . . . . . . . . . . . . . . . . . . . 255,667
Fair value of acquired net assets (at 100% ownership) . . . . . . . . . . . . . $208,351
The Company determined that the purchase price represented the fair value of the additionalownership interest in Arrowhead Towne Center that was acquired.
Fair value of existing ownership interest (at 66.7% ownership) . . . . . . . . . $139,326Carrying value of investment . . . . . . . . . . . . . . . . . . . . . . . . . . . . . . . . . (23,597)
Gain on remeasurement . . . . . . . . . . . . . . . . . . . . . . . . . . . . . . . . . . . $115,729
The following is the reconciliation of the purchase price to the fair value of the acquired netassets:
Purchase price . . . . . . . . . . . . . . . . . . . . . . . . . . . . . . . . . . . . . . . . . . . . $144,400Less debt assumed . . . . . . . . . . . . . . . . . . . . . . . . . . . . . . . . . . . . . . . . . (75,375)Carrying value of investment . . . . . . . . . . . . . . . . . . . . . . . . . . . . . . . . . 23,597Remeasurement gain . . . . . . . . . . . . . . . . . . . . . . . . . . . . . . . . . . . . . . . 115,729
Fair value of acquired net assets (at 100% ownership) . . . . . . . . . . . . . . . $208,351
The Company has included the gain in (loss) gain on remeasurement, sale or write down of assets,net for the year ended December 31, 2012 (See Note 6—Property).
Since the date of acquisition, the Company has included Arrowhead Towne Center in itsconsolidated financial statements.
112

THE MACERICH COMPANY
NOTES TO CONSOLIDATED FINANCIAL STATEMENTS (Continued)
(Dollars in thousands, except per share amounts)
15. Acquisitions: (Continued)
Kings Plaza Shopping Center:
On November 28, 2012, the Company acquired Kings Plaza Shopping Center, a 1,195,000 squarefoot regional shopping center in Brooklyn, New York for a purchase price of $756,000. The purchaseprice was funded from a cash payment of $726,000 and the issuance of $30,000 in restricted commonstock of the Company. The cash payment was provided by the placement of a mortgage note payableon the property that allowed for borrowings of up to $500,000. Concurrent with the acquisition, theCompany borrowed $354,000 on the loan. On January 3, 2013, the Company exercised its option toborrow an additional $146,000 on the loan. The acquisition was completed to acquire a prominentcenter in Brooklyn, New York.
The following is a summary of the allocation of the fair value of Kings Plaza Shopping Center:
Property . . . . . . . . . . . . . . . . . . . . . . . . . . . . . . . . . . . . . . . . . . . . . . . . $714,589Deferred charges . . . . . . . . . . . . . . . . . . . . . . . . . . . . . . . . . . . . . . . . . . 37,371Other assets . . . . . . . . . . . . . . . . . . . . . . . . . . . . . . . . . . . . . . . . . . . . . 29,282
Total assets acquired . . . . . . . . . . . . . . . . . . . . . . . . . . . . . . . . . . . . . . 781,242
Other accrued liabilities . . . . . . . . . . . . . . . . . . . . . . . . . . . . . . . . . . . . . 25,242
Total liabilities assumed . . . . . . . . . . . . . . . . . . . . . . . . . . . . . . . . . . . 25,242
Fair value of acquired net assets . . . . . . . . . . . . . . . . . . . . . . . . . . . . . $756,000
The Company determined that the purchase price represented the fair value of the assets acquiredand liabilities assumed.
Since the date of acquisition, the Company has included Kings Plaza Shopping Center in itsconsolidated financial statements.
Green Acres Mall:
On January 24, 2013, the Company acquired Green Acres Mall, a 1,787,000 square foot regionalshopping center in Valley Stream, New York, for a purchase price of $500,000. A purchase deposit of$30,000 was funded during the year ended December 31, 2012, and the remaining $470,000 was fundedupon closing of the acquisition. The cash payment made at the time of closing was provided by theplacement of a mortgage note payable on the property that allowed for borrowings of up to $325,000and from borrowings under the Company’s line of credit. Concurrent with the acquisition, theCompany borrowed $100,000 on the loan. On January 31, 2013, the Company exercised its option toborrow the remaining $225,000 on the loan. The acquisition was completed to acquire anotherprominent shopping center in the New York metropolitan area.
113

THE MACERICH COMPANY
NOTES TO CONSOLIDATED FINANCIAL STATEMENTS (Continued)
(Dollars in thousands, except per share amounts)
15. Acquisitions: (Continued)
The following is a summary of the allocation of the fair value of Green Acres Mall:
Property . . . . . . . . . . . . . . . . . . . . . . . . . . . . . . . . . . . . . . . . . . . . . . . . $477,673Deferred charges . . . . . . . . . . . . . . . . . . . . . . . . . . . . . . . . . . . . . . . . . . 45,130Other assets . . . . . . . . . . . . . . . . . . . . . . . . . . . . . . . . . . . . . . . . . . . . . 19,125
Total assets acquired . . . . . . . . . . . . . . . . . . . . . . . . . . . . . . . . . . . . . . 541,928
Other accrued liabilities . . . . . . . . . . . . . . . . . . . . . . . . . . . . . . . . . . . . . 41,928
Total liabilities assumed . . . . . . . . . . . . . . . . . . . . . . . . . . . . . . . . . . . 41,928
Fair value of acquired net assets . . . . . . . . . . . . . . . . . . . . . . . . . . . . . $500,000
The Company determined that the purchase price represented the fair value of the assets acquiredand liabilities assumed.
Since the date of acquisition, the Company has included Green Acres Mall in its consolidatedfinancial statements. The property has generated incremental revenue of $65,958 and incrementalearnings of $824 during the year ended December 31, 2013.
Green Acres Adjacent:
On April 25, 2013, the Company acquired a 19 acre parcel of land adjacent to Green Acres Mallfor $22,577. The payment was provided by borrowings from the Company’s line of credit. Theacquisition was completed to allow for future expansion of Green Acres Mall.
Camelback Colonnade Restructuring:
On September 17, 2013, the Company’s joint venture in Camelback Colonnade was restructured.As a result of the restructuring, the Company’s ownership interest in Camelback Colonnade decreasedfrom 73.2% to 67.5%. Prior to the restructuring, the Company had accounted for its investment inCamelback Colonnade under the equity method of accounting due to substantive participation rightsheld by the outside partners. Upon completion of the restructuring, these substantive participationrights were terminated and the Company obtained voting control of the joint venture (See Note 4—Investments in Unconsolidated Joint Ventures).
114

THE MACERICH COMPANY
NOTES TO CONSOLIDATED FINANCIAL STATEMENTS (Continued)
(Dollars in thousands, except per share amounts)
15. Acquisitions: (Continued)
The following is a summary of the allocation of the fair value of Camelback Colonnade:
Property . . . . . . . . . . . . . . . . . . . . . . . . . . . . . . . . . . . . . . . . . . . . . . . . $ 98,160Deferred charges . . . . . . . . . . . . . . . . . . . . . . . . . . . . . . . . . . . . . . . . . . 8,284Cash and cash equivalents . . . . . . . . . . . . . . . . . . . . . . . . . . . . . . . . . . . 1,280Restricted cash . . . . . . . . . . . . . . . . . . . . . . . . . . . . . . . . . . . . . . . . . . . 1,139Tenant receivables . . . . . . . . . . . . . . . . . . . . . . . . . . . . . . . . . . . . . . . . . 615Other assets . . . . . . . . . . . . . . . . . . . . . . . . . . . . . . . . . . . . . . . . . . . . . 380
Total assets acquired . . . . . . . . . . . . . . . . . . . . . . . . . . . . . . . . . . . . . . 109,858
Mortgage note payable . . . . . . . . . . . . . . . . . . . . . . . . . . . . . . . . . . . . . 49,465Accounts payable . . . . . . . . . . . . . . . . . . . . . . . . . . . . . . . . . . . . . . . . . . 54Other accrued liabilities . . . . . . . . . . . . . . . . . . . . . . . . . . . . . . . . . . . . . 4,752
Total liabilities assumed . . . . . . . . . . . . . . . . . . . . . . . . . . . . . . . . . . . 54,271
Fair value of acquired net assets (at 100% ownership) . . . . . . . . . . . . . $ 55,587
The Company recognized the following remeasurement gain on the Camelback ColonnadeRestructuring:
Fair value of existing ownership interest (at 73.2% ownership) . . . . . . . . . . $41,690Carrying value of investment . . . . . . . . . . . . . . . . . . . . . . . . . . . . . . . . . . (5,349)
Gain on remeasurement . . . . . . . . . . . . . . . . . . . . . . . . . . . . . . . . . . . . $36,341
The Company has included the gain in (loss) gain on remeasurement, sale or write down of assets,net for the year ended December 31, 2013 (See Note 6—Property). Since the date of the restructuring,the Company has included Camelback Colonnade in its consolidated financial statements. The propertyhas generated incremental revenue of $3,540 and incremental earnings of $384 during the year endedDecember 31, 2013.
Superstition Springs Center:
On October 24, 2013, the Company acquired the remaining 33.3% ownership interest inSuperstition Springs Center that it did not own for $46,162. The purchase price was funded by a cashpayment of $23,662 and the assumption of the third party’s share of the mortgage note payable on theproperty of $22,500. Prior to the acquisition, the Company had accounted for its investment under theequity method (See Note 4—Investments in Unconsolidated Joint Ventures). As a result of thistransaction, the Company obtained 100% ownership of Superstition Springs Center. The acquisitionwas completed in order to gain 100% ownership and control over this asset.
115

THE MACERICH COMPANY
NOTES TO CONSOLIDATED FINANCIAL STATEMENTS (Continued)
(Dollars in thousands, except per share amounts)
15. Acquisitions: (Continued)
The following is a summary of the allocation of the fair value of Superstition Springs Center:
Property . . . . . . . . . . . . . . . . . . . . . . . . . . . . . . . . . . . . . . . . . . . . . . . . $114,373Deferred charges . . . . . . . . . . . . . . . . . . . . . . . . . . . . . . . . . . . . . . . . . . 12,353Cash and cash equivalents . . . . . . . . . . . . . . . . . . . . . . . . . . . . . . . . . . . 8,894Tenant receivables . . . . . . . . . . . . . . . . . . . . . . . . . . . . . . . . . . . . . . . . . 51Other assets . . . . . . . . . . . . . . . . . . . . . . . . . . . . . . . . . . . . . . . . . . . . . 11,535
Total assets acquired . . . . . . . . . . . . . . . . . . . . . . . . . . . . . . . . . . . . . . 147,206
Mortgage note payable . . . . . . . . . . . . . . . . . . . . . . . . . . . . . . . . . . . . . 68,448Accounts payable . . . . . . . . . . . . . . . . . . . . . . . . . . . . . . . . . . . . . . . . . . 119Other accrued liabilities . . . . . . . . . . . . . . . . . . . . . . . . . . . . . . . . . . . . . 7,637
Total liabilities assumed . . . . . . . . . . . . . . . . . . . . . . . . . . . . . . . . . . . 76,204
Fair value of acquired net assets (at 100% ownership) . . . . . . . . . . . . . $ 71,002
The Company determined that the purchase price represented the fair value of the additionalownership interest in Superstition Springs Center that was acquired.
Fair value of existing ownership interest (at 66.7% ownership) . . . . . . . . . $ 47,340Carrying value of investment . . . . . . . . . . . . . . . . . . . . . . . . . . . . . . . . . (32,476)
Gain on remeasurement . . . . . . . . . . . . . . . . . . . . . . . . . . . . . . . . . . . $ 14,864
The following is the reconciliation of the purchase price to the fair value of the acquired netassets:
Purchase price . . . . . . . . . . . . . . . . . . . . . . . . . . . . . . . . . . . . . . . . . . . . $ 46,162Less debt assumed . . . . . . . . . . . . . . . . . . . . . . . . . . . . . . . . . . . . . . . . . (22,500)Carrying value of investment . . . . . . . . . . . . . . . . . . . . . . . . . . . . . . . . . 32,476Remeasurement gain . . . . . . . . . . . . . . . . . . . . . . . . . . . . . . . . . . . . . . . 14,864
Fair value of acquired net assets (at 100% ownership) . . . . . . . . . . . . . . . $ 71,002
The Company has included the gain in (loss) gain on remeasurement, sale or write down of assets,net for the year ended December 31, 2013 (See Note 6—Property).
Since the date of acquisition, the Company has included Superstition Springs Center in itsconsolidated financial statements. Superstition Springs Center has generated incremental revenue of$3,666 and incremental earnings of $1,062 during the year ended December 31, 2013.
116

THE MACERICH COMPANY
NOTES TO CONSOLIDATED FINANCIAL STATEMENTS (Continued)
(Dollars in thousands, except per share amounts)
15. Acquisitions: (Continued)
Pro Forma Results of Operations:
The following unaudited pro forma total revenue and income from continuing operations for 2013and 2012 assumes the 2012 and 2013 property acquisitions took place on January 1, 2012:
Total Income fromrevenue continuing operations
Supplemental pro forma for the year ended December 31, 2013(1) . . . $1,056,075 $108,417Supplemental pro forma for the year ended December 31, 2012(1) . . . $1,094,559 $ 92,193
(1) This unaudited pro forma supplemental information does not purport to be indicative of what theCompany’s operating results would have been had the acquisitions occurred on January 1, 2012,and may not be indicative of future operating results. The Company has excluded remeasurementgains and acquisition costs from these pro forma results as they are considered significantnon-recurring adjustments directly attributable to the acquisitions.
16. Discontinued Operations:
On March 4, 2011, the Company sold a former Mervyn’s store in Santa Fe, New Mexico for$3,732, resulting in a loss on the sale of assets of $1,913. The proceeds from the sale were used forgeneral corporate purposes.
On June 3, 2011, the Company disposed of six anchor stores at centers not owned by the Company(collectively referred to as the ‘‘GGP Anchor Stores’’), including five former Mervyn’s stores, as part ofthe GGP Exchange (See Note 4—Investments in Unconsolidated Joint Ventures). The Companydetermined that the fair value received in exchange for the GGP Anchor Stores was equal to theircarrying value.
On October 14, 2011, the Company sold a former Mervyn’s store in Salt Lake City, Utah for$8,061, resulting in a gain on the sale of assets of $3,783. The proceeds from the sale were used forgeneral corporate purposes.
On November 30, 2011, the Company sold a former Mervyn’s store in West Valley City, Utah for$2,300, resulting in a loss on the sale of assets of $200. The proceeds from the sale were used forgeneral corporate purposes.
In June 2011, the Company recorded an impairment charge of $35,729 related to ShoppingtownMall. As a result of the maturity default on the mortgage note payable and the correspondingreduction of the estimated holding period, the Company wrote down the carrying value of thelong-lived assets to their estimated fair value of $38,968. The Company had classified the estimated fairvalue as a Level 3 measurement due to the highly subjective nature of the computation, which involvesestimates of holding period, market conditions, future occupancy levels, rental rates, capitalizationrates, lease-up periods and capital improvements. On December 30, 2011, the Company conveyedShoppingtown Mall to the mortgage note lender by a deed-in-lieu of foreclosure. As a result of theconveyance, the Company recognized an additional $3,929 loss on the disposal of the property.
117

THE MACERICH COMPANY
NOTES TO CONSOLIDATED FINANCIAL STATEMENTS (Continued)
(Dollars in thousands, except per share amounts)
16. Discontinued Operations: (Continued)
In March 2012, the Company recorded an impairment charge of $54,306 related to Valley ViewCenter. As a result of the sale of the property on April 23, 2012, the Company wrote down the carryingvalue of the long-lived assets to their estimated fair value of $33,450 (Level 1 measurement), which wasequal to the sales price of the property. On April 23, 2012, the property was sold by a court appointedreceiver, which resulted in a gain on the extinguishment of debt of $104,023.
On April 30, 2012, the Company sold The Borgata, a 94,000 square foot community center inScottsdale, Arizona, for $9,150, resulting in a loss on the sale of assets of $1,275. The Company usedthe proceeds from the sale to pay down its line of credit and for general corporate purposes.
On May 11, 2012, the Company sold a former Mervyn’s store in Montebello, California for$20,750, resulting in a loss on the sale of assets of $407. The Company used the proceeds from the salefor general corporate purposes.
On May 17, 2012, the Company sold Hilton Village, a 80,000 square foot community center inScottsdale, Arizona, for $24,820, resulting in a gain on the sale of assets of $3,127. The Company usedthe proceeds from the sale to pay down its line of credit and for general corporate purposes.
On May 31, 2012, the Company conveyed Prescott Gateway, a 584,000 square foot regionalshopping center in Prescott, Arizona, to the mortgage note lender by a deed-in-lieu of foreclosure. As aresult of the conveyance, the Company recognized a gain on the extinguishment of debt of $16,296.
On June 28, 2012, the Company sold Carmel Plaza, a 112,000 square foot community center inCarmel, California, for $52,000, resulting in a gain on the sale of assets of $7,844. The Company usedthe proceeds from the sale to pay down its line of credit.
In December 2012, the Company recognized an impairment charge of $24,555 on Fiesta Mall, a933,000 square foot regional shopping center in Mesa, Arizona, to write down the carrying value of thelong-lived assets to their estimated fair value due a reduction in the estimated holding period of theproperty. On September 30, 2013, the Company conveyed Fiesta Mall to the mortgage note lender by adeed-in-lieu of foreclosure. The mortgage loan was non-recourse. As a result of the conveyance, theCompany recognized a gain on the extinguishment of debt of $1,252, which is included in gain (loss) onthe disposition of assets, net (See Note 10—Mortgage Notes Payable).
On May 31, 2013, the Company sold Green Tree Mall, a 793,000 square foot regional shoppingcenter in Clarksville, Indiana, for $79,000, resulting in a gain on the sale of assets of $59,767. TheCompany used the proceeds from the sale to pay down its line of credit and for general corporatepurposes.
On June 4, 2013, the Company sold Northridge Mall, an 890,000 square foot regional shoppingcenter in Salinas, California, and Rimrock Mall, a 603,000 square foot regional shopping center inBillings, Montana. The properties were sold in a combined transaction for $230,000, resulting in a gainon the sale of assets of $82,151. The Company used the cash proceeds from the sale to pay down itsline of credit and for general corporate purposes.
On September 11, 2013, the Company sold a former Mervyn’s store in Milpitas, California for$12,000, resulting in a loss on the sale of assets of $2,633. The Company used the proceeds from thesale to pay down its line of credit and for general corporate purposes.
118

THE MACERICH COMPANY
NOTES TO CONSOLIDATED FINANCIAL STATEMENTS (Continued)
(Dollars in thousands, except per share amounts)
16. Discontinued Operations: (Continued)
On October 15, 2013, the Company sold a former Mervyn’s store in Midland, Texas for $5,700,resulting in a loss on the sale of assets of $2,031. The Company used the proceeds from the sale to paydown its line of credit and for general corporate purposes.
On October 23, 2013, the Company sold a former Mervyn’s store in Grand Junction, Colorado for$5,430, resulting in a gain on the sale of assets of $1,695. The Company used the proceeds from thesale to pay down its line of credit and for general corporate purposes.
On December 4, 2013, the Company sold a former Mervyn’s store in Livermore, California for$10,475, resulting in a loss on the sale of assets of $5,257. The Company used the proceeds from thesale to pay down its line of credit and for general corporate purposes.
On December 11, 2013, the Company sold Chesterfield Towne Center, a 1,016,000 square footregional shopping center in Richmond, Virginia, and Centre at Salisbury, an 862,000 square footregional shopping center in Salisbury, Maryland in a combined transaction for $292,500, resulting in again on the sale of assets of $151,467. The sales price was funded by a cash payment of $67,763, theassumption of the $109,737 mortgage note payable on Chesterfield Towne Center and the assumptionof the $115,000 mortgage note payable on Centre at Salisbury. The Company used the cash proceedsfrom the sale to pay down its line of credit and for general corporate purposes.
The Company has classified the results of operations and gain or loss on sale for all of the abovedispositions as discontinued operations for the years ended December 31, 2013, 2012 and 2011.
Revenues from discontinued operations were $54,752, $94,406 and $118,558 for the years endedDecember 31, 2013, 2012 and 2011, respectively. Total income (loss) from discontinued operations,including the gain (loss) from disposition of assets, net was $289,936, $63,223 and $(70,367) for theyears ended December 31, 2013, 2012 and 2011, respectively.
17. Future Rental Revenues:
Under existing non-cancelable operating lease agreements, tenants are committed to pay thefollowing minimum rental payments to the Company:
Year Ending December 31,
2014 . . . . . . . . . . . . . . . . . . . . . . . . . . . . . . . . . . . . . . . . . . . . . . . . . . $ 561,8332015 . . . . . . . . . . . . . . . . . . . . . . . . . . . . . . . . . . . . . . . . . . . . . . . . . . 491,2612016 . . . . . . . . . . . . . . . . . . . . . . . . . . . . . . . . . . . . . . . . . . . . . . . . . . 433,7762017 . . . . . . . . . . . . . . . . . . . . . . . . . . . . . . . . . . . . . . . . . . . . . . . . . . 371,6382018 . . . . . . . . . . . . . . . . . . . . . . . . . . . . . . . . . . . . . . . . . . . . . . . . . . 308,827Thereafter . . . . . . . . . . . . . . . . . . . . . . . . . . . . . . . . . . . . . . . . . . . . . 1,081,719
$3,249,054
119

THE MACERICH COMPANY
NOTES TO CONSOLIDATED FINANCIAL STATEMENTS (Continued)
(Dollars in thousands, except per share amounts)
18. Commitments and Contingencies:
The Company has certain properties subject to non-cancelable operating ground leases. The leasesexpire at various times through 2098, subject in some cases to options to extend the terms of the lease.Certain leases provide for contingent rent payments based on a percentage of base rental income, asdefined in the lease. Ground rent expenses were $10,579, $8,681 and $8,607 for the years endedDecember 31, 2013, 2012 and 2011, respectively. No contingent rent was incurred for the years endedDecember 31, 2013, 2012 or 2011.
Minimum future rental payments required under the leases are as follows:
Year Ending December 31,
2014 . . . . . . . . . . . . . . . . . . . . . . . . . . . . . . . . . . . . . . . . . . . . . . . . . . . $ 15,3392015 . . . . . . . . . . . . . . . . . . . . . . . . . . . . . . . . . . . . . . . . . . . . . . . . . . . 15,3562016 . . . . . . . . . . . . . . . . . . . . . . . . . . . . . . . . . . . . . . . . . . . . . . . . . . . 15,3932017 . . . . . . . . . . . . . . . . . . . . . . . . . . . . . . . . . . . . . . . . . . . . . . . . . . . 15,3782018 . . . . . . . . . . . . . . . . . . . . . . . . . . . . . . . . . . . . . . . . . . . . . . . . . . . 11,263Thereafter . . . . . . . . . . . . . . . . . . . . . . . . . . . . . . . . . . . . . . . . . . . . . . . 296,687
$369,416
As of December 31, 2013, the Company was contingently liable for $18,862 in letters of creditguaranteeing performance by the Company of certain obligations relating to the Centers. The Companydoes not believe that these letters of credit will result in a liability to the Company.
The Company has entered into a number of construction agreements related to its redevelopmentand development activities. Obligations under these agreements are contingent upon the completion ofthe services within the guidelines specified in the agreement. At December 31, 2013, the Company had$57,969 in outstanding obligations, which it believes will be settled in the next twelve months.
19. Related Party Transactions:
Certain unconsolidated joint ventures have engaged the Management Companies to manage theoperations of the Centers. Under these arrangements, the Management Companies are reimbursed forcompensation paid to on-site employees, leasing agents and project managers at the Centers, as well asinsurance costs and other administrative expenses. The following are fees charged to unconsolidatedjoint ventures for the years ended December 31:
2013 2012 2011
Management Fees . . . . . . . . . . . . . . . . . . . . . . . . . . . $21,993 $24,007 $26,838Development and Leasing Fees . . . . . . . . . . . . . . . . . 10,859 13,165 9,955
$32,852 $37,172 $36,793
Certain mortgage notes on the properties are held by NML (See Note 10—Mortgage NotesPayable). Interest expense in connection with these notes was $15,016, $15,386 and $16,743 for theyears ended December 31, 2013, 2012 and 2011, respectively. Included in accounts payable and accrued
120

THE MACERICH COMPANY
NOTES TO CONSOLIDATED FINANCIAL STATEMENTS (Continued)
(Dollars in thousands, except per share amounts)
19. Related Party Transactions: (Continued)
expenses is interest payable to this related party of $1,240 and $1,264 at December 31, 2013 and 2012,respectively.
As of December 31, 2013 and 2012, the Company had loans to unconsolidated joint ventures of$2,756 and $3,345, respectively. Interest income associated with these notes was $281, $254 and $276for the years ended December 31, 2013, 2012 and 2011, respectively. These loans represent initial fundsadvanced to development stage projects prior to construction loan funding. Correspondingly, loanpayables in the same amount have been accrued as an obligation by the various joint ventures.
Due from affiliates includes $3,822 and $4,568 of unreimbursed costs and fees due fromunconsolidated joint ventures under management agreements at December 31, 2013 and 2012,respectively.
Due from affiliates at December 31, 2013 and 2012 also includes two notes receivable fromprincipals of AWE/Talisman that bear interest at 5.0% and mature based on the refinancing or sale ofFashion Outlets of Chicago, or certain other specified events. The notes are collateralized by theprincipals’ interests in Fashion Outlets of Chicago. AWE/Talisman is considered a related party becauseit has an ownership interest in Fashion Outlets of Chicago. The balance on these notes was $13,603 and$12,500 at December 31, 2013 and 2012, respectively. Interest income earned on these notes was $625and $478 for the years ended December 31, 2013 and 2012, respectively.
In addition, due from affiliates at December 31, 2013 includes a note receivable of $12,707 fromRED/303 LLC (‘‘RED’’) that bears interest at 5.25% and matures on March 29, 2016. Interest incomeearned on this note was $525 for the year ended December 31, 2013. RED is considered a relatedparty because it is a partner in a joint venture development project. The note is collateralized byRED’s membership interest in a development agreement.
20. Share and Unit-based Plans:
The Company has established share and unit-based compensation plans for the purpose ofattracting and retaining executive officers, directors and key employees.
2003 Equity Incentive Plan:
The 2003 Equity Incentive Plan (‘‘2003 Plan’’) authorizes the grant of stock awards, stock options,stock appreciation rights, stock units, stock bonuses, performance-based awards, dividend equivalentrights and OP Units or other convertible or exchangeable units. As of December 31, 2013, stockawards, stock units, LTIP Units (as defined below), stock appreciation rights (‘‘SARs’’) and stockoptions have been granted under the 2003 Plan. All stock options or other rights to acquire commonstock granted under the 2003 Plan have a term of 10 years or less. These awards were generallygranted based on the performance of the Company and the employees. None of the awards haveperformance requirements other than a service condition of continued employment unless otherwiseprovided. All awards are subject to restrictions determined by the Company’s compensation committee.The aggregate number of shares of common stock that may be issued under the 2003 Plan is 13,825,428shares. As of December 31, 2013, there were 5,701,863 shares available for issuance under the 2003Plan.
121

THE MACERICH COMPANY
NOTES TO CONSOLIDATED FINANCIAL STATEMENTS (Continued)
(Dollars in thousands, except per share amounts)
20. Share and Unit-based Plans: (Continued)
Stock Awards:
The value of the stock awards was determined by the market price of the Company’s commonstock on the date of the grant. The following table summarizes the activity of non-vested stock awardsduring the years ended December 31, 2013, 2012 and 2011:
2013 2012 2011
Weighted Weighted WeightedAverage Average Average
Grant Date Grant Date Grant DateShares Fair Value Shares Fair Value Shares Fair Value
Balance at beginning of year . . . . . . . . 20,924 $49.36 21,130 $40.68 63,351 $53.69Granted . . . . . . . . . . . . . . . . . . . . . 8,963 61.84 9,639 54.43 11,350 48.47Vested . . . . . . . . . . . . . . . . . . . . . . (10,886) 46.70 (9,845) 35.69 (53,571) 57.36Forfeited . . . . . . . . . . . . . . . . . . . . . — — — — — —
Balance at end of year . . . . . . . . . . . . 19,001 $56.77 20,924 $49.36 21,130 $40.68
Stock Units:
The stock units represent the right to receive upon vesting one share of the Company’s commonstock for one stock unit. The value of the outstanding stock units was determined by the market priceof the Company’s common stock on the date of the grant. The following table summarizes the activityof non-vested stock units during the years ended December 31, 2013, 2012 and 2011:
2013 2012 2011
Weighted Weighted WeightedAverage Average Average
Grant Date Grant Date Grant DateUnits Fair Value Units Fair Value Units Fair Value
Balance at beginning of year . . . . . 114,677 $52.19 576,340 $11.71 1,038,549 $ 7.17Granted . . . . . . . . . . . . . . . . . . 67,920 62.01 72,322 54.43 64,463 48.36Vested . . . . . . . . . . . . . . . . . . . (45,279) 51.59 (533,985) 8.80 (519,272) 7.17Forfeited . . . . . . . . . . . . . . . . . — — — — (7,400) 12.35
Balance at end of year . . . . . . . . . 137,318 $57.24 114,677 $52.19 576,340 $11.71
SARs:
The executives have up to 10 years from the grant date to exercise the SARs. Upon exercise, theexecutives will receive unrestricted common shares for the appreciation in value of the SARs from thegrant date to the exercise date.
The Company determined the value of each SAR awarded during the year ended December 31,2012 to be $9.67 using the Black-Scholes Option Pricing Model based upon the following assumptions:volatility of 25.85%, dividend yield of 3.69%, risk free rate of 1.20%, current value of $59.57 and anexpected term of 8 years. The value of each of the other outstanding SARs was determined at thegrant date to be $7.68 based upon the following assumptions: volatility of 22.52%, dividend yield of
122

THE MACERICH COMPANY
NOTES TO CONSOLIDATED FINANCIAL STATEMENTS (Continued)
(Dollars in thousands, except per share amounts)
20. Share and Unit-based Plans: (Continued)
5.23%, risk free rate of 3.15%, current value of $61.17 and an expected term of 8 years. Theassumptions for volatility and dividend yield were based on the Company’s historical experience as apublicly traded company, the current value was based on the closing price on the date of grant and therisk free rate was based upon the interest rate of the 10-year Treasury bond on the date of grant. Thefollowing table summarizes the activity of SARs awards during the years ended December 31, 2013,2012 and 2011:
2013 2012 2011
Weighted Weighted WeightedAverage Average AverageExercise Exercise Exercise
Units Price Units Price Units Price
Balance at beginning of year . . . . . . . 1,164,185 $56.66 1,156,985 $56.55 1,242,314 $56.56Granted . . . . . . . . . . . . . . . . . . . . — — 39,932 59.57 — —Exercised . . . . . . . . . . . . . . . . . . . (93,194) 56.63 (32,732) 56.63 — —Forfeited . . . . . . . . . . . . . . . . . . . . — — — — (85,329) 56.63
Balance at end of year . . . . . . . . . . . 1,070,991 $56.66 1,164,185 $56.66 1,156,985 $56.55
Long-Term Incentive Plan Units:
Under the Long-Term Incentive Plan (‘‘LTIP’’), each award recipient is issued a form of operatingpartnership units (‘‘LTIP Units’’) in the Operating Partnership. Upon the occurrence of specified eventsand subject to the satisfaction of applicable vesting conditions, LTIP Units (after conversion into OPUnits) are ultimately redeemable for common stock of the Company, or cash at the Company’s option,on a one-unit for one-share basis. LTIP Units receive cash dividends based on the dividend amountpaid on the common stock of the Company. The LTIP may include both market-indexed awards andservice-based awards.
The market-indexed LTIP units vest over the service period of the award based on the percentileranking of the Company in terms of total return to stockholders (the ‘‘Total Return’’) per commonstock share relative to the Total Return of a group of peer REITs, as measured at the end of themeasurement period.
On February 28, 2011, the Company granted 190,000 market-indexed LTIP Units to four executiveofficers at a weighted average grant date fair value of $43.30 per LTIP Unit. The grants vested over aservice period ending January 31, 2012. On February 7, 2012, the compensation committee determinedthat the LTIP Units granted under the LTIP on February 28, 2011 had vested at the 150% level basedon the Company’s percentile ranking in terms of Total Return per common stock share compared tothe Total Return of a group of peer REITs during the period of February 1, 2011 to January 31, 2012.As a result, the compensation committee granted an additional 95,000 LTIP Units, which vested as ofJanuary 31, 2012.
On February 23, 2012, the Company granted 190,000 market-indexed LTIP Units to four executiveofficers at a weighted average grant date fair value of $37.77 per LTIP Unit. On April 16, 2012, theCompany granted 10,000 market-indexed LTIP Units to a new executive officer at a weighted averagegrant date fair value of $54.97 per LTIP Unit. The market-indexed LTIP Unit grants vested over a
123

THE MACERICH COMPANY
NOTES TO CONSOLIDATED FINANCIAL STATEMENTS (Continued)
(Dollars in thousands, except per share amounts)
20. Share and Unit-based Plans: (Continued)
service period ending January 31, 2013. On September 1, 2012, the Company granted 20,000 LTIPUnits to a new executive officer at a weighted average fair value of $59.57 per LTIP Unit that werefully vested on the grant date. On February 11, 2013, the compensation committee determined that themarket-indexed LTIP Units granted under the LTIP in 2012 had vested at the 100% level, based on theCompany’s percentile ranking in terms of Total Return per common stock share compared to the TotalReturn of a group of peer REITs during the period of February 1, 2012 to January 31, 2013. As aresult, the 200,000 market-indexed LTIP Units vested as of January 31, 2013.
On February 15, 2013, the Company granted 332,189 market-indexed LTIP Units (‘‘2013 LTIPUnits’’) to seven executive officers at a weighted average grant date fair value of $66.58 per LTIP Unit.The grants vested over a service period ending December 31, 2013. On January 16, 2014, thecompensation committee determined that the 2013 LTIP Units had vested at the 96% level, based onthe Company’s percentile ranking in terms of Total Return per common stock share compared to theTotal Return of a group of peer REITs during the January 1, 2013 to December 31, 2013. As a result,318,900 LTIP Units vested and 13,289 LTIP Units were forfeited as of December 31, 2013.
The fair value of the market-indexed LTIP Units was estimated on the date of grant using aMonte Carlo Simulation model. The stock price of the Company, along with the stock prices of thegroup of peer REITs (for market-indexed awards), is assumed to follow the Multivariate GeometricBrownian Motion Process. Multivariate Geometric Brownian Motion is a common assumption whenmodeling in financial markets, as it allows the modeled quantity (in this case, the stock price) to varyrandomly from its current value and take any value greater than zero. The volatilities of the returns onthe share price of the Company and the peer group REITs were estimated based on a look-backperiod. The expected growth rate of the stock prices over the ‘‘derived service period’’ is determinedwith consideration of the risk free rate as of the grant date.
The following table summarizes the activity of non-vested LTIP Units during the years endedDecember 31, 2013, 2012 and 2011:
2013 2012 2011
Weighted Weighted WeightedAverage Average Average
Grant Date Grant Date Grant DateUnits Fair Value Units Fair Value Units Fair Value
Balance at beginning of year . . . . . 200,000 $38.63 190,000 $43.30 272,226 $50.68Granted . . . . . . . . . . . . . . . . . . 332,189 66.58 315,000 40.53 422,631 46.48Vested . . . . . . . . . . . . . . . . . . . (518,900) 55.81 (305,000) 44.85 (504,857) 49.85Forfeited . . . . . . . . . . . . . . . . . (13,289) 66.58 — — — —
Balance at end of year . . . . . . . . . — $ — 200,000 $38.63 190,000 $43.30
Stock Options:
The Company measured the value of each option awarded during the year ended December 31,2012 to be $9.67 using the Black-Scholes Option Pricing Model based upon the following assumptions:volatility of 25.85%, dividend yield of 3.69%, risk free rate of 1.20%, current value of $59.57 and anexpected term of 8 years. The assumptions for volatility and dividend yield were based on the
124

THE MACERICH COMPANY
NOTES TO CONSOLIDATED FINANCIAL STATEMENTS (Continued)
(Dollars in thousands, except per share amounts)
20. Share and Unit-based Plans: (Continued)
Company’s historical experience as a publicly traded company, the current value was based on theclosing price on the date of grant and the risk free rate was based upon the interest rate of the 10-yearTreasury bond on the date of grant.
The following table summarizes the activity of stock options for the years ended December 31,2013, 2012 and 2011:
2013 2012 2011
Weighted Weighted WeightedAverage Average AverageExercise Exercise Exercise
Options Price Options Price Options Price
Balance at beginning of year . . . . . . . . . . . . 12,768 $54.69 2,700 $36.51 110,711 $75.08Granted . . . . . . . . . . . . . . . . . . . . . . . . . — — 10,068 59.57 — —Exercised . . . . . . . . . . . . . . . . . . . . . . . . (2,700) 36.51 — — — —Forfeited . . . . . . . . . . . . . . . . . . . . . . . . — — — — (108,011) 76.05
Balance at end of year . . . . . . . . . . . . . . . . 10,068 $59.57 12,768 $54.69 2,700 $36.51
Directors’ Phantom Stock Plan:
The Directors’ Phantom Stock Plan offers non-employee members of the board of directors(‘‘Directors’’) the opportunity to defer their cash compensation and to receive that compensation incommon stock rather than in cash after termination of service or a predetermined period.Compensation generally includes the annual retainers payable by the Company to the Directors.Deferred amounts are generally credited as units of phantom stock at the beginning of each three-yeardeferral period by dividing the present value of the deferred compensation by the average fair marketvalue of the Company’s common stock at the date of award. Compensation expense related to thephantom stock awards was determined by the amortization of the value of the stock units on astraight-line basis over the applicable service period. The stock units (including dividend equivalents)vest as the Directors’ services (to which the fees relate) are rendered. Vested phantom stock units areultimately paid out in common stock on a one-unit for one-share basis. To the extent elected by aDirector, stock units receive dividend equivalents in the form of additional stock units based on thedividend amount paid on the common stock. The aggregate number of phantom stock units that maybe granted under the Directors’ Phantom Stock Plan is 500,000. As of December 31, 2013, there were223,694 units available for grant under the Directors’ Phantom Stock Plan.
125

THE MACERICH COMPANY
NOTES TO CONSOLIDATED FINANCIAL STATEMENTS (Continued)
(Dollars in thousands, except per share amounts)
20. Share and Unit-based Plans: (Continued)
The following table summarizes the activity of the non-vested phantom stock units for the yearsended December 31, 2013, 2012 and 2011:
2013 2012 2011
Weighted Weighted WeightedAverage Average Average
Grant Date Grant Date Grant DateUnits Fair Value Units Fair Value Units Fair Value
Balance at beginning of year . . . . . . . — $ — 15,745 $34.84 29,783 $34.18Granted . . . . . . . . . . . . . . . . . . . . . 34,266 59.04 7,896 57.29 10,534 48.51Vested . . . . . . . . . . . . . . . . . . . . . . (16,691) 59.44 (22,179) 45.24 (24,572) 39.89Forfeited . . . . . . . . . . . . . . . . . . . . — — (1,462) 33.74 — —
Balance at end of year . . . . . . . . . . . . 17,575 $58.66 — $ — 15,745 $34.84
Employee Stock Purchase Plan (‘‘ESPP’’):
The ESPP authorizes eligible employees to purchase the Company’s common stock throughvoluntary payroll deductions made during periodic offering periods. Under the ESPP common stock ispurchased at a 15% discount from the lesser of the fair value of common stock at the beginning andend of the offering period. A maximum of 750,000 shares of common stock is available for purchaseunder the ESPP. The number of shares available for future purchase under the plan at December 31,2013 was 565,325.
Compensation:
The following summarizes the compensation cost under the share and unit-based plans for theyears ended December 31, 2013, 2012 and 2011:
2013 2012 2011
Stock awards . . . . . . . . . . . . . . . . . . . . . . . . . . . . . . . $ 497 $ 598 $ 749Stock units . . . . . . . . . . . . . . . . . . . . . . . . . . . . . . . . 3,839 3,379 7,526LTIP units . . . . . . . . . . . . . . . . . . . . . . . . . . . . . . . . . 22,778 9,436 8,955SARs . . . . . . . . . . . . . . . . . . . . . . . . . . . . . . . . . . . . — 583 626Stock options . . . . . . . . . . . . . . . . . . . . . . . . . . . . . . 16 21 —Phantom stock units . . . . . . . . . . . . . . . . . . . . . . . . . 992 953 980
$28,122 $14,970 $18,836
During the year ended December 31, 2011, as part of the separation agreements with six formeremployees, the Company modified the terms of 61,570 stock units, 2,281 stock awards and 43,204SARs. As a result of these modifications, the Company recognized additional compensation cost of$3,333 during the year ended December 31, 2011.
During the year ended December 31, 2012, the Company modified the terms of 20,000 LTIP unitsand 54,405 SARs of a former executive officer. As a result of this modification, the Companyrecognized an additional compensation cost of $1,214 during the year ended December 31, 2012.
126

THE MACERICH COMPANY
NOTES TO CONSOLIDATED FINANCIAL STATEMENTS (Continued)
(Dollars in thousands, except per share amounts)
20. Share and Unit-based Plans: (Continued)
The Company capitalized share and unit-based compensation costs of $3,915, $2,646 and $6,231 forthe years ended December 31, 2013, 2012 and 2011, respectively.
The fair value of the stock awards and stock units that vested during the years endedDecember 31, 2013, 2012 and 2011 was $3,516, $30,454 and $27,160, respectively. Unrecognizedcompensation costs of share and unit-based plans at December 31, 2013 consisted of $765 from stockawards, $2,976 from stock units, $59 from stock options and $1,031 from phantom stock units.
21. Employee Benefit Plans:
401(k) Plan:
The Company has a defined contribution retirement plan that covers its eligible employees (the‘‘Plan’’). The Plan is a defined contribution retirement plan covering eligible employees of TheMacerich Property Management Company LLC and participating affiliates. The Plan is qualified inaccordance with section 401(a) of the Code. Effective January 1, 1995, the Plan was amended toconstitute a qualified cash or deferred arrangement under section 401(k) of the Code, wherebyemployees can elect to defer compensation subject to Internal Revenue Service withholding rules. ThisPlan was further amended effective as of February 1, 1999 to add The Macerich Company CommonStock Fund as a new investment alternative under the Plan. A total of 150,000 shares of common stockwere reserved for issuance under the Plan, which was subsequently increased by an additional 500,000shares in February 2013. On January 1, 2004, the Plan adopted the ‘‘Safe Harbor’’ provision underSections 401(k)(12) and 401(m)(11) of the Code. In accordance with adopting these provisions, theCompany makes matching contributions equal to 100 percent of the first three percent of compensationdeferred by a participant and 50 percent of the next two percent of compensation deferred by aparticipant. During the years ended December 31, 2013, 2012 and 2011, these matching contributionsmade by the Company were $3,017, $3,094 and $3,077, respectively. Contributions and matchingcontributions to the Plan by the plan sponsor and/or participating affiliates are recognized as anexpense of the Company in the period that they are made.
Deferred Compensation Plans:
The Company has established deferred compensation plans under which key executives of theCompany may elect to defer receiving a portion of their cash compensation otherwise payable in onecalendar year until a later year. The Company may, as determined by the Board of Directors in its solediscretion prior to the beginning of the plan year, credit a participant’s account with a matchingamount equal to a percentage of the participant’s deferral. The Company contributed $843, $648 and$570 to the plans during the years ended December 31, 2013, 2012 and 2011, respectively.Contributions are recognized as compensation in the periods they are made.
127

THE MACERICH COMPANY
NOTES TO CONSOLIDATED FINANCIAL STATEMENTS (Continued)
(Dollars in thousands, except per share amounts)
22. Income Taxes:
For income tax purposes, distributions paid to common stockholders consist of ordinary income,capital gains, unrecaptured Section 1250 gain and return of capital or a combination thereof. Thefollowing table details the components of the distributions, on a per share basis, for the years endedDecember 31:
2013 2012 2011
Ordinary income . . . . . . . . . . . . . . . . . . . . . . . . . . . $1.02 43.3% $0.74 33.2% $0.85 41.5%Capital gains . . . . . . . . . . . . . . . . . . . . . . . . . . . . . . 1.24 52.5% 1.13 50.7% 0.01 0.5%Unrecaptured Section 1250 gain . . . . . . . . . . . . . . . . 0.10 4.2% 0.36 16.1% 0.04 2.0%Return of capital . . . . . . . . . . . . . . . . . . . . . . . . . . . — —% — —% 1.15 56.0%
Dividends paid . . . . . . . . . . . . . . . . . . . . . . . . . . . . $2.36 100.0% $2.23 100.0% $2.05 100.0%
The Company has made Taxable REIT Subsidiary elections for all of its corporate subsidiariesother than its Qualified REIT Subsidiaries. The elections, effective for the year beginning January 1,2001 and future years were made pursuant to Section 856(l) of the Code.
The income tax (expense) benefit of the TRSs for the years ended December 31, 2013, 2012 and2011 are as follows:
2013 2012 2011
Current . . . . . . . . . . . . . . . . . . . . . . . . . . . . . . . . . . . . . $ (142) $ — $ —Deferred . . . . . . . . . . . . . . . . . . . . . . . . . . . . . . . . . . . . 1,834 4,159 6,110
Income tax benefit . . . . . . . . . . . . . . . . . . . . . . . . . . . . . $1,692 $4,159 $6,110
Income tax benefit of the TRSs for the years ended December 31, 2013, 2012 and 2011 arereconciled to the amount computed by applying the Federal Corporate tax rate as follows:
2013 2012 2011
Book loss for TRSs . . . . . . . . . . . . . . . . . . . . . . . . . . $11,709 $16,154 $19,558
Tax at statutory rate on earnings from continuingoperations before income taxes . . . . . . . . . . . . . . . . $ 3,981 $ 5,493 $ 6,650
Other . . . . . . . . . . . . . . . . . . . . . . . . . . . . . . . . . . . . (2,289) (1,334) (540)
Income tax benefit . . . . . . . . . . . . . . . . . . . . . . . . . . . $ 1,692 $ 4,159 $ 6,110
The net operating loss carryforwards are currently scheduled to expire through 2033, beginning in2021. Net deferred tax assets of $31,356 and $33,414 were included in deferred charges and otherassets, net at December 31, 2013 and 2012, respectively. The tax effects of temporary differences and
128

THE MACERICH COMPANY
NOTES TO CONSOLIDATED FINANCIAL STATEMENTS (Continued)
(Dollars in thousands, except per share amounts)
22. Income Taxes: (Continued)
carryforwards of the TRSs included in the net deferred tax assets at December 31, 2013 and 2012 aresummarized as follows:
2013 2012
Net operating loss carryforwards . . . . . . . . . . . . . . . . . . . . . . . . $26,394 $33,781Property, primarily differences in depreciation and amortization,
the tax basis of land assets and treatment of certain othercosts . . . . . . . . . . . . . . . . . . . . . . . . . . . . . . . . . . . . . . . . . . . 3,673 (1,973)
Other . . . . . . . . . . . . . . . . . . . . . . . . . . . . . . . . . . . . . . . . . . . 1,289 1,606
Net deferred tax assets . . . . . . . . . . . . . . . . . . . . . . . . . . . . . . . $31,356 $33,414
For the years ended December 31, 2013, 2012 and 2011 there were no unrecognized tax benefits.
The tax years 2009 through 2012 remain open to examination by the taxing jurisdictions to whichthe Company is subject. The Company does not expect that the total amount of unrecognized taxbenefit will materially change within the next 12 months.
23. Quarterly Financial Data (Unaudited):
The following is a summary of quarterly results of operations for the years ended December 31,2013 and 2012:
2013 Quarter Ended 2012 Quarter Ended
Dec 31 Sep 30 Jun 30 Mar 31 Dec 31 Sep 30 Jun 30 Mar 31
Revenues(1) . . . . . . . . . . . . . $282,137 $258,154 $245,877 $243,307 $229,207 $195,799 $185,055 $187,456Net income (loss) attributable
to the Company(2) . . . . . . . $144,878 $ 38,123 $218,997 $ 18,092 $174,247 $ 43,893 $133,354 $(14,068)Net income (loss) attributable
to common stockholders pershare-basic . . . . . . . . . . . . 1.03 0.27 1.57 0.13 1.27 0.33 1.00 (0.11)
Net income (loss) attributableto common stockholders pershare-diluted . . . . . . . . . . . 1.03 0.27 1.57 0.13 1.27 0.33 1.00 (0.11)
(1) Revenues as reported on the Company’s Quarterly Reports on Form 10-Q have been reclassified to reflectadjustments for discontinued operations.
(2) Net income attributable to the Company for the quarter ended December 31, 2013 includes the gain of$151,467 on the sale of Chesterfield Towne Center and Centre at Salisbury (See Note 16—DiscontinuedOperations). Net income attributable to the Company for the fourth quarter 2012 includes a remeasurementgain of $84,227 on the purchase of the ownership interest in FlatIron Crossing and a remeasurement gain of$115,729 on the purchase of the ownership interest in Arrowhead Towne Center (See Note 15—Acquisitions).
129

THE MACERICH COMPANY
NOTES TO CONSOLIDATED FINANCIAL STATEMENTS (Continued)
(Dollars in thousands, except per share amounts)
24. Subsequent Events:
On January 15, 2014, the Company sold Rotterdam Square, a 585,000 square foot regionalshopping center in Schenectady, New York, for $8,500. The Company used the proceeds from the saleto pay down its line of credit and for general corporate purposes.
On January 30, 2014, the Company announced a dividend/distribution of $0.62 per share forcommon stockholders and OP Unit holders of record on February 21, 2014. All dividends/distributionswill be paid 100% in cash on March 7, 2014.
130

131
TH
E M
AC
ER
ICH
CO
MPA
NY
Sche
dule
III
—R
eal
Est
ate
and
Acc
umul
ated
Dep
reci
atio
n
Dec
embe
r 31
, 20
13
(Dol
lars
in
thou
sand
s)
Init
ial
Cos
t to
Com
pany
Gro
ss A
mou
nt a
t W
hich
Car
ried
at
Clo
se o
f Pe
riod
Cos
tTo
tal
Cos
tE
quip
men
tC
apit
aliz
edE
quip
men
tN
et o
fB
uild
ing
and
and
Subs
eque
nt t
oB
uild
ing
and
and
Con
stru
ctio
nA
ccum
ulat
edA
ccum
ulat
edSh
oppi
ng C
ente
rs/E
ntit
ies
Lan
dIm
prov
emen
tsFu
rnis
hing
sA
cqui
siti
onL
and
Impr
ovem
ents
Furn
ishi
ngs
in P
rogr
ess
Tota
lD
epre
ciat
ion
Dep
reci
atio
n
Arr
owhe
ad T
owne
Cen
ter
..
..
..
..
.$
36,6
87$3
86,6
62$
—$
2,88
5$
36,6
87$3
89,2
31$
316
$—
$426
,234
$12
,919
$413
,315
Bla
ck C
anyo
n A
uto
Park
..
..
..
..
.20
,600
——
12,0
7332
,664
——
932
,673
—32
,673
Cam
elba
ck C
olon
nade
..
..
..
..
..
.16
,015
82,1
45—
773
16,1
2182
,801
11—
98,9
3362
898
,305
Cap
itola
Mal
l.
..
..
..
..
..
..
..
.20
,395
59,2
21—
11,1
3720
,392
68,7
781,
317
266
90,7
5327
,977
62,7
76C
hand
ler
Fash
ion
Cen
ter
..
..
..
..
.24
,188
223,
143
—11
,622
24,1
8823
0,54
94,
216
—25
8,95
375
,200
183,
753
Dan
bury
Fai
r M
all
..
..
..
..
..
..
.13
0,36
731
6,95
1—
88,7
6714
2,75
138
8,38
04,
942
1253
6,08
591
,563
444,
522
Dep
tfor
d M
all
..
..
..
..
..
..
..
.48
,370
194,
250
—36
,111
61,0
2921
3,96
91,
680
2,05
327
8,73
144
,444
234,
287
Des
ert
Sky
Mal
l.
..
..
..
..
..
..
.9,
447
37,2
4512
1,72
39,
447
38,2
5965
962
48,4
273,
875
44,5
52E
astla
nd M
all
..
..
..
..
..
..
..
..
22,0
5015
1,60
5—
3,15
322
,066
154,
333
409
—17
6,80
89,
122
167,
686
Est
rella
Fal
ls.
..
..
..
..
..
..
..
.10
,550
——
74,3
3610
,747
——
74,1
3984
,886
—84
,886
Fash
ion
Out
lets
of
Chi
cago
..
..
..
..
——
—24
7,78
140
,575
196,
505
2,06
28,
639
247,
781
3,99
424
3,78
7Fa
shio
n O
utle
ts o
f N
iaga
ra F
alls
USA
.18
,581
210,
139
—18
,680
16,9
9820
7,66
527
22,7
1024
7,40
018
,357
229,
043
Fla
gsta
ff M
all
..
..
..
..
..
..
..
..
5,48
031
,773
—16
,824
5,48
048
,115
482
—54
,077
14,9
3239
,145
Fla
gsta
ff M
all,
The
Mar
ketp
lace
at
..
.—
——
52,8
36—
52,8
306
—52
,836
14,0
7138
,765
Fla
tIro
n C
ross
ing
..
..
..
..
..
..
..
109,
851
333,
540
—11
,342
109,
851
343,
662
314
906
454,
733
14,5
1244
0,22
1Fr
eeho
ld R
acew
ay M
all
..
..
..
..
..
164,
986
362,
841
—95
,393
168,
098
451,
340
3,71
567
623,
220
120,
982
502,
238
Fres
no F
ashi
on F
air
..
..
..
..
..
..
17,9
6672
,194
—46
,233
17,9
6611
6,73
51,
692
—13
6,39
349
,738
86,6
55G
reat
Nor
ther
n M
all
..
..
..
..
..
.12
,187
62,6
57—
(18,
482)
7,48
148
,533
348
—56
,362
19,5
6736
,795
Gre
en A
cres
Mal
l.
..
..
..
..
..
..
156,
640
321,
034
—25
,890
156,
640
323,
046
148
23,7
3050
3,56
411
,915
491,
649
Kin
gs P
laza
Sho
ppin
g C
ente
r.
..
..
.20
9,04
148
5,54
820
,000
4,69
220
9,04
148
7,56
520
,736
1,93
971
9,28
118
,067
701,
214
La
Cum
bre
Plaz
a.
..
..
..
..
..
..
.18
,122
21,4
92—
23,3
2217
,280
45,2
3123
319
262
,936
18,6
4544
,291
Lak
e Sq
uare
Mal
l.
..
..
..
..
..
..
6,38
614
,739
—(7
,095
)4,
018
9,91
894
—14
,030
1,05
112
,979
See
acco
mpa
nyin
g re
port
of
inde
pend
ent
regi
ster
ed p
ublic
acc
ount
ing
firm
.

132
TH
E M
AC
ER
ICH
CO
MPA
NY
Sche
dule
III
—R
eal
Est
ate
and
Acc
umul
ated
Dep
reci
atio
n (C
onti
nued
)
Dec
embe
r 31
, 20
13
(Dol
lars
in
thou
sand
s)
Init
ial
Cos
t to
Com
pany
Gro
ss A
mou
nt a
t W
hich
Car
ried
at
Clo
se o
f Pe
riod
Cos
tTo
tal
Cos
tE
quip
men
tC
apit
aliz
edE
quip
men
tN
et o
fB
uild
ing
and
and
Subs
eque
nt t
oB
uild
ing
and
and
Con
stru
ctio
nA
ccum
ulat
edA
ccum
ulat
edSh
oppi
ng C
ente
rs/E
ntit
ies
Lan
dIm
prov
emen
tsFu
rnis
hing
sA
cqui
siti
onL
and
Impr
ovem
ents
Furn
ishi
ngs
in P
rogr
ess
Tota
lD
epre
ciat
ion
Dep
reci
atio
n
Mac
eric
h M
anag
emen
t C
o..
..
..
..
..
—8,
685
26,5
6242
,663
1,96
96,
695
65,9
993,
247
77,9
1056
,448
21,4
62M
AC
WH
, LP
..
..
..
..
..
..
..
..
.—
25,7
71—
15,7
6011
,557
27,4
55—
2,51
941
,531
6,28
935
,242
Nor
thga
te M
all
..
..
..
..
..
..
..
..
8,40
034
,865
841
100,
496
13,4
1412
7,30
83,
201
679
144,
602
55,3
2589
,277
Nor
thPa
rk M
all
..
..
..
..
..
..
..
..
7,74
674
,661
—3,
703
7,88
578
,101
124
—86
,110
5,48
380
,627
Oak
s, T
he.
..
..
..
..
..
..
..
..
..
32,3
0011
7,15
6—
237,
237
55,5
2732
7,07
42,
299
1,79
338
6,69
388
,783
297,
910
Paci
fic V
iew
..
..
..
..
..
..
..
..
..
8,69
78,
696
—12
8,55
97,
854
135,
852
2,24
6—
145,
952
49,6
4496
,308
Pano
ram
a M
all
..
..
..
..
..
..
..
..
4,37
317
,491
—9,
298
4,42
024
,322
396
2,02
431
,162
8,10
323
,059
Para
dise
Val
ley
Mal
l.
..
..
..
..
..
..
24,5
6512
5,99
6—
41,7
5635
,921
153,
897
2,13
136
819
2,31
752
,065
140,
252
Para
dise
Vill
age
Gro
und
Lea
ses
..
..
..
8,88
02,
489
—(6
,876
)3,
870
623
——
4,49
324
44,
249
Para
dise
Vill
age
Off
ice
Park
II
..
..
..
.1,
150
1,79
0—
3,25
62,
300
3,61
727
9—
6,19
62,
049
4,14
7Pr
omen
ade
at C
asa
Gra
nde
..
..
..
..
.15
,089
——
84,7
748,
851
91,0
066
—99
,863
28,2
5871
,605
Rot
terd
am S
quar
e.
..
..
..
..
..
..
.7,
018
32,7
36—
(20,
793)
1,84
917
,011
101
—18
,961
10,7
058,
256
Sant
a M
onic
a Pl
ace
..
..
..
..
..
..
..
26,4
0010
5,60
0—
286,
156
48,3
7435
9,95
27,
709
2,12
141
8,15
651
,143
367,
013
SanT
an A
djac
ent
Lan
d.
..
..
..
..
..
.29
,414
——
5,07
529
,506
——
4,98
334
,489
—34
,489
SanT
an V
illag
e R
egio
nal
Cen
ter
..
..
..
7,82
7—
—19
2,76
36,
344
193,
429
815
220
0,59
062
,288
138,
302
Som
ersv
ille
Tow
ne C
ente
r.
..
..
..
..
.4,
096
20,3
171,
425
9,79
23,
054
32,0
0051
363
35,6
3024
,414
11,2
16So
uthP
ark
Mal
l.
..
..
..
..
..
..
..
.7,
035
38,2
15—
367
7,01
738
,097
9740
645
,617
2,85
742
,760
Sout
h Pl
ains
Mal
l.
..
..
..
..
..
..
..
23,1
0092
,728
—31
,321
23,1
0012
2,82
01,
223
614
7,14
949
,229
97,9
20So
uth
Tow
ne C
ente
r.
..
..
..
..
..
..
19,6
0078
,954
—28
,358
20,3
6010
5,10
41,
368
8012
6,91
246
,464
80,4
48So
uthr
idge
Cen
ter
..
..
..
..
..
..
..
6,76
4—
—16
,526
6,51
416
,747
29—
23,2
9055
922
,731
Supe
rstit
ion
Spri
ngs
Cen
ter
..
..
..
..
.10
,928
112,
718
—15
79,
273
112,
441
492,
040
123,
803
558
123,
245
Supe
rstit
ion
Spri
ngs
Pow
er C
ente
r.
..
..
1,61
84,
420
—(1
1)1,
618
4,32
683
—6,
027
1,33
94,
688
Tang
erin
e (M
aran
a), T
he S
hops
at
..
..
.36
,158
——
(1,5
53)
16,9
22—
—17
,683
34,6
05—
34,6
05T
he M
acer
ich
Part
ners
hip,
L.P
..
..
..
..
—2,
534
—4,
641
——
6,30
187
47,
175
1,71
95,
456
Tow
ne M
all.
..
..
..
..
..
..
..
..
..
6,65
231
,184
—3,
308
6,87
734
,016
251
—41
,144
10,4
4830
,696
See
acco
mpa
nyin
g re
port
of
inde
pend
ent
regi
ster
ed p
ublic
acc
ount
ing
firm
.

133
TH
E M
AC
ER
ICH
CO
MPA
NY
Sche
dule
III
—R
eal
Est
ate
and
Acc
umul
ated
Dep
reci
atio
n (C
onti
nued
)
Dec
embe
r 31
, 20
13
(Dol
lars
in
thou
sand
s)
Init
ial
Cos
t to
Com
pany
Gro
ss A
mou
nt a
t W
hich
Car
ried
at
Clo
se o
f Pe
riod
Cos
tTo
tal
Cos
tE
quip
men
tC
apit
aliz
edE
quip
men
tN
et o
fB
uild
ing
and
and
Subs
eque
nt t
oB
uild
ing
and
and
Con
stru
ctio
nA
ccum
ulat
edA
ccum
ulat
edSh
oppi
ng C
ente
rs/E
ntit
ies
Lan
dIm
prov
emen
tsFu
rnis
hing
sA
cqui
siti
onL
and
Impr
ovem
ents
Furn
ishi
ngs
in P
rogr
ess
Tota
lD
epre
ciat
ion
Dep
reci
atio
n
Tucs
on L
a E
ncan
tada
..
..
..
..
12,8
0019
,699
—55
,209
12,8
0074
,709
199
—87
,708
35,3
1952
,389
Twen
ty N
inth
Str
eet
..
..
..
..
.—
37,8
4364
211,
796
23,5
9922
5,06
21,
042
—24
9,70
382
,564
167,
139
Val
ley
Mal
l.
..
..
..
..
..
..
.16
,045
26,0
98—
3,92
915
,616
30,1
7564
217
46,0
722,
052
44,0
20V
alle
y R
iver
Cen
ter
..
..
..
..
.24
,854
147,
715
—16
,629
24,8
5416
2,69
81,
530
116
189,
198
39,1
1215
0,08
6V
icto
r V
alle
y, M
all
of.
..
..
..
.15
,700
75,2
30—
49,5
8420
,080
118,
513
1,91
011
140,
514
29,5
4411
0,97
0V
inta
ge F
aire
Mal
l..
..
..
..
..
14,9
0260
,532
—53
,659
17,6
4711
0,17
61,
270
—12
9,09
351
,898
77,1
95W
ests
ide
Pavi
lion
..
..
..
..
..
.34
,100
136,
819
—70
,299
34,1
0020
1,18
25,
754
182
241,
218
81,8
4015
9,37
8W
ilton
Mal
l.
..
..
..
..
..
..
.19
,743
67,8
55—
14,5
5219
,810
81,1
651,
159
1610
2,15
020
,743
81,4
0750
0 N
orth
Mic
higa
n A
venu
e.
..
.12
,851
55,3
58—
1,83
712
,851
56,4
6392
640
70,0
463,
838
66,2
08M
ervy
n’s
(for
mer
loc
atio
ns)
..
..
12,5
9787
,551
—13
,335
11,4
7193
,219
418
8,37
511
3,48
321
,701
91,7
82O
ther
lan
d an
d de
velo
pmen
tpr
oper
ties
..
..
..
..
..
..
..
49,9
13—
—76
,767
50,2
8130
,266
133
46,0
0012
6,68
04,
988
121,
692
$1,5
69,2
24$5
,018
,885
$48,
904
$2,5
44,3
25$1
,707
,005
$7,0
92,9
66$1
52,1
98$2
29,1
69$9
,181
,338
$1,5
59,5
72$7
,621
,766
See
acco
mpa
nyin
g re
port
of
inde
pend
ent
regi
ster
ed p
ublic
acc
ount
ing
firm
.

THE MACERICH COMPANY
Schedule III—Real Estate and Accumulated Depreciation (Continued)
December 31, 2013
(Dollars in thousands)
Depreciation of the Company’s investment in buildings and improvements reflected in theconsolidated statements of operations are calculated over the estimated useful lives of the asset asfollows:
Buildings and improvements . . . . . . . . . . . . . . . . . . . . . . . . . . . . . . . 5 - 40 yearsTenant improvements . . . . . . . . . . . . . . . . . . . . . . . . . . . . . . . . . . . . 5 - 7 yearsEquipment and furnishings . . . . . . . . . . . . . . . . . . . . . . . . . . . . . . . . 5 - 7 years
The changes in total real estate assets for the three years ended December 31, 2013 are as follows:
2013 2012 2011
Balances, beginning of year . . . . . . . . . . . . . . $9,012,706 $7,489,735 $6,908,507Additions . . . . . . . . . . . . . . . . . . . . . . . . . . . 943,159 1,909,530 784,717Dispositions and retirements . . . . . . . . . . . . . (774,527) (386,559) (203,489)
Balances, end of year . . . . . . . . . . . . . . . . . . $9,181,338 $9,012,706 $7,489,735
The aggregate gross cost of the property included in the table above for federal income taxpurposes was $7,343,322 (unaudited) at December 31, 2013.
The changes in accumulated depreciation for the three years ended December 31, 2013 are asfollows:
2013 2012 2011
Balances, beginning of year . . . . . . . . . . . . . . $1,533,160 $1,410,692 $1,234,380Additions . . . . . . . . . . . . . . . . . . . . . . . . . . . 284,500 241,231 223,630Dispositions and retirements . . . . . . . . . . . . . (258,088) (118,763) (47,318)
Balances, end of year . . . . . . . . . . . . . . . . . . $1,559,572 $1,533,160 $1,410,692
See accompanying report of independent registered public accounting firm.
134

SIGNATURES
Pursuant to the requirements of Section 13 or 15(d) of the Securities Exchange Act of 1934, theregistrant has duly caused this report to be signed on its behalf by the undersigned, thereunto dulyauthorized, on February 21, 2014.
THE MACERICH COMPANY
By /s/ ARTHUR M. COPPOLA
Arthur M. CoppolaChairman and Chief Executive Officer
Pursuant to the requirements of the Securities Exchange Act of 1934, this report has been signedbelow by the following persons on behalf of the registrant and in the capacities and on the datesindicated.
Signature Capacity Date
Chairman and Chief Executive Officer/s/ ARTHUR M. COPPOLAand Director (Principal Executive February 21, 2014
Arthur M. Coppola Officer)
/s/ DANA K. ANDERSONVice Chairman of the Board February 21, 2014
Dana K. Anderson
/s/ EDWARD C. COPPOLAPresident and Director February 21, 2014
Edward C. Coppola
/s/ DOUGLAS ABBEYDirector February 21, 2014
Douglas Abbey
/s/ FREDERICK HUBBELLDirector February 21, 2014
Frederick Hubbell
/s/ DIANA LAINGDirector February 21, 2014
Diana Laing
/s/ STANLEY MOOREDirector February 21, 2014
Stanley Moore
135

Signature Capacity Date
/s/ MASON ROSSDirector February 21, 2014
Mason Ross
/s/ DR. WILLIAM SEXTONDirector February 21, 2014
Dr. William Sexton
/s/ STEVEN SOBOROFFDirector February 21, 2014
Steven Soboroff
/s/ ANDREA STEPHENDirector February 21, 2014
Andrea Stephen
Senior Executive Vice President,/s/ THOMAS E. O’HERN Treasurer and Chief Financial and February 21, 2014Accounting Officer (Principal FinancialThomas E. O’Hern
and Accounting Officer)
136

EXHIBIT INDEX
ExhibitNumber Description
2.1 Contribution Agreement and Joint Escrow Instructions, dated October 21, 2012, by andamong Alexander’s Kings Plaza, LLC, Alexander’s of Kings, LLC, Kings Parking, LLC andBrooklyn Kings Plaza LLC (incorporated by reference as an exhibit to the Company’sCurrent Report on Form 8-K, event date November 28, 2012).
2.2 Agreement of Sale and Purchase, dated October 21, 2012, by and among Green Acres Mall,L.L.C. and Valley Stream Green Acres LLC (incorporated by reference as an exhibit to theCompany’s Current Report on Form 8-K, event date January 24, 2013).
3.1 Articles of Amendment and Restatement of the Company (incorporated by reference as anexhibit to the Company’s Registration Statement on Form S-11, as amended(No. 33-68964)).
3.1.1 Articles Supplementary of the Company (incorporated by reference as an exhibit to theCompany’s Current Report on Form 8-K, event date May 30, 1995).
3.1.2 Articles Supplementary of the Company (with respect to the first paragraph) (incorporatedby reference as an exhibit to the Company’s 1998 Form 10-K).
3.1.3 Articles Supplementary of the Company (Series D Preferred Stock) (incorporated byreference as an exhibit to the Company’s Current Report on Form 8-K, event date July 26,2002).
3.1.4 Articles Supplementary of the Company (incorporated by reference as an exhibit to theCompany’s Registration Statement on Form S-3, as amended (No. 333-88718)).
3.1.5 Articles of Amendment (declassification of Board) (incorporated by reference as an exhibitto the Company’s 2008 Form 10-K).
3.1.6 Articles Supplementary (incorporated by reference as an exhibit to the Company’s CurrentReport on Form 8-K, event date February 5, 2009).
3.1.7 Articles of Amendment (increased authorized shares) (incorporated by reference as anexhibit to the Company’s Quarterly Report on Form 10-Q for the quarter ended June 30,2009).
3.2 Amended and Restated Bylaws of the Company (incorporated by reference as an exhibit tothe Company’s Current Report on Form 8-K, event date January 29, 2014).
4.1 Form of Common Stock Certificate (incorporated by reference as an exhibit to theCompany’s Current Report on Form 8-K, as amended, event date November 10, 1998).
4.2 Form of Preferred Stock Certificate (Series D Preferred Stock) (incorporated by referenceas an exhibit to the Company’s Registration Statement on Form S-3 (No. 333-107063)).
10.1 Amended and Restated Limited Partnership Agreement for the Operating Partnershipdated as of March 16, 1994 (incorporated by reference as an exhibit to the Company’s 1996Form 10-K).
10.1.1 Amendment to Amended and Restated Limited Partnership Agreement for the OperatingPartnership dated June 27, 1997 (incorporated by reference as an exhibit to the Company’sCurrent Report on Form 8-K, event date June 20, 1997).
137

ExhibitNumber Description
10.1.2 Amendment to Amended and Restated Limited Partnership Agreement for the OperatingPartnership dated November 16, 1997 (incorporated by reference as an exhibit to theCompany’s 1997 Form 10-K).
10.1.3 Fourth Amendment to Amended and Restated Limited Partnership Agreement for theOperating Partnership dated February 25, 1998 (incorporated by reference as an exhibit tothe Company’s 1997 Form 10-K).
10.1.4 Fifth Amendment to Amended and Restated Limited Partnership Agreement for theOperating Partnership dated February 26, 1998 (incorporated by reference as an exhibit tothe Company’s 1997 Form 10-K).
10.1.5 Sixth Amendment to Amended and Restated Limited Partnership Agreement for theOperating Partnership dated June 17, 1998 (incorporated by reference as an exhibit to theCompany’s 1998 Form 10-K).
10.1.6 Seventh Amendment to Amended and Restated Limited Partnership Agreement for theOperating Partnership dated December 23, 1998 (incorporated by reference as an exhibit tothe Company’s 1998 Form 10-K).
10.1.7 Eighth Amendment to Amended and Restated Limited Partnership Agreement for theOperating Partnership dated November 9, 2000 (incorporated by reference as an exhibit tothe Company’s 2000 Form 10-K).
10.1.8 Ninth Amendment to Amended and Restated Limited Partnership Agreement for theOperating Partnership dated July 26, 2002 (incorporated by reference as an exhibit to theCompany’s Current Report on Form 8-K event date July 26, 2002).
10.1.9 Tenth Amendment to Amended and Restated Limited Partnership Agreement for theOperating Partnership dated October 26, 2006 (incorporated by reference as an exhibit tothe Company’s 2006 Form 10-K).
10.1.10 Eleventh Amendment to Amended and Restated Limited Partnership Agreement for theOperating Partnership dated as of March 16, 2007 (incorporated by reference as an exhibitto the Company’s Current Report on Form 8-K, event date March 16, 2007).
10.1.11 Twelfth Amendment to the Amended and Restated Limited Partnership Agreement of theOperating Partnership dated as of April 30, 2009 (incorporated by reference as an exhibit tothe Company’s Quarterly Report on Form 10-Q for the quarter ended June 30, 2009).
10.1.12 Thirteenth Amendment to the Amended and Restated Limited Partnership Agreement ofthe Operating Partnership dated as of October 29, 2009 (incorporated by reference as anexhibit to the Company’s 2009 Form 10-K).
10.1.13 Form of Fourteenth Amendment to Amended and Restated Limited Partnership Agreementfor the Operating Partnership (incorporated by reference as an exhibit to the Company’sCurrent Report on Form 8-K, event date April 25, 2005).
10.2 [Intentionally omitted]
10.3 [Intentionally omitted]
10.4 [Intentionally omitted]
10.5* Amended and Restated Deferred Compensation Plan for Executives (2003) (incorporatedby reference as an exhibit to the Company’s 2003 Form 10-K).
138

ExhibitNumber Description
10.5.1* Amendment Number 1 to Amended and Restated Deferred Compensation Plan forExecutives (October 30, 2008) (incorporated by reference as an exhibit to the Company’s2008 Form 10-K).
10.5.2* Amendment Number 2 to Amended and Restated Deferred Compensation Plan forExecutives (May 1, 2011) (incorporated by reference as an exhibit to the Company’sQuarterly Report on Form 10-Q for the quarter ended June 30, 2011).
10.5.3* Amendment Number 3 to Amended and Restated Deferred Compensation Plan forExecutives (September 27, 2012) (incorporated by reference as an exhibit to the Company’sQuarterly Report on Form 10-Q for the quarter ended September 30, 2012).
10.6* Amended and Restated Deferred Compensation Plan for Senior Executives (2003)(incorporated by reference as an exhibit to the Company’s 2003 Form 10-K).
10.6.1* Amendment Number 1 to Amended and Restated Deferred Compensation Plan for SeniorExecutives (October 30, 2008) (incorporated by reference as an exhibit to the Company’s2008 Form 10-K).
10.6.2* Amendment Number 2 to Amended and Restated Deferred Compensation Plan for SeniorExecutives (May 1, 2011) (incorporated by reference as an exhibit to the Company’sQuarterly Report on Form 10-Q for the quarter ended June 30, 2011).
10.6.3* Amendment Number 3 to Amended and Restated Deferred Compensation Plan for SeniorExecutives (September 27, 2012) (incorporated by reference as an exhibit to the Company’sQuarterly Report on Form 10-Q for the quarter ended September 30, 2012).
10.7* Eligible Directors’ Deferred Compensation/Phantom Stock Plan (as amended and restatedas of January 1, 2013) (incorporated by reference as an exhibit to the Company’s QuarterlyReport on Form 10-Q for the quarter ended June 30, 2013).
10.8* 2013 Deferred Compensation Plan for Executives (incorporated by reference as an exhibitto the Company’s Quarterly Report on Form 10-Q for the quarter ended September 30,2012).
10.8.1* Amendment Number 1 to 2013 Deferred Compensation Plan for Executives (March 29,2013) (incorporated by reference as an exhibit to the Company’s Quarterly Report onForm 10-Q for the quarter ended March 31, 2013).
10.9 Deferred Compensation Plan Rabbi Trust between the Company and Wilmington Trust,National Association, effective as of October 1, 2012 (incorporated by reference as anexhibit to the Company’s Quarterly Report on Form 10-Q for the quarter endedSeptember 30, 2012).
10.10 Registration Rights Agreement, dated as of March 16, 1994, among the Company and MaceSiegel, Dana K. Anderson, Arthur M. Coppola and Edward C. Coppola (incorporated byreference as an exhibit to the Company’s 1996 Form 10-K).
10.11 Registration Rights Agreement, dated as of March 16, 1994, between the Company and TheNorthwestern Mutual Life Insurance Company (incorporated by reference as an exhibit tothe Company’s 1996 Form 10-K).
10.12 Registration Rights Agreement dated as of December 18, 2003 by the OperatingPartnership, the Company and Taubman Realty Group Limited Partnership (Registrationrights assigned by Taubman to three assignees) (incorporated by reference as an exhibit tothe Company’s 2003 Form 10-K).
139

ExhibitNumber Description
10.13 Incidental Registration Rights Agreement dated March 16, 1994 (incorporated by referenceas an exhibit to the Company’s 1996 Form 10-K).
10.14 Incidental Registration Rights Agreement dated as of July 21, 1994 (incorporated byreference as an exhibit to the Company’s 1997 Form 10-K).
10.15 Incidental Registration Rights Agreement dated as of August 15, 1995 (incorporated byreference as an exhibit to the Company’s 1997 Form 10-K).
10.16 Incidental Registration Rights Agreement dated as of December 21, 1995 (incorporated byreference as an exhibit to the Company’s 1997 Form 10-K).
10.17 List of Omitted Incidental/Demand Registration Rights Agreements (incorporated byreference as an exhibit to the Company’s 1997 Form 10-K).
10.18 Redemption, Registration Rights and Lock-Up Agreement dated as of July 24, 1998between the Company and Harry S. Newman, Jr. and LeRoy H. Brettin (incorporated byreference as an exhibit to the Company’s 1998 Form 10-K).
10.19 Form of Indemnification Agreement between the Company and its executive officers anddirectors (incorporated by reference as an exhibit to the Company’s 2008 Form 10-K).
10.20 Form of Registration Rights Agreement with Series D Preferred Unit Holders(incorporated by reference as an exhibit to the Company’s Current Report on Form 8-K,event date July 26, 2002).
10.20.1 List of Omitted Registration Rights Agreements (incorporated by reference as an exhibit tothe Company’s Current Report on Form 8-K, event date July 26, 2002).
10.21 $1,500,000,000 Revolving Loan Facility and $125,000,000 Term Loan Facility Amended andRestated Credit Agreement, dated as of August 6, 2013, by and among the Company, TheMacerich Partnership, L.P., Deutsche Bank Trust Company Americas, as administrativeagent; Deutsche Bank Securities Inc., J.P. Morgan Securities LLC and Wells FargoSecurities, LLC as joint lead arrangers and joint bookrunning managers; JP Morgan ChaseBank, N.A. and Wells Fargo Bank, N.A. as co-syndication agents, and various lenders partythereto (incorporated by reference as an exhibit to the Company’s Current Report onForm 8-K, event date August 6, 2013).
10.22 Amended and Restated Unconditional Guaranty, dated as of August 6, 2013, by theCompany in favor of Deutsche Bank Trust Company Americas, as administrative agent(incorporated by reference as an exhibit to the Company’s Current Report on Form 8-K,event date August 6, 2013).
10.23 [Intentionally omitted]
10.24 Tax Matters Agreement dated as of July 26, 2002 between The Macerich Partnership L.P.and the Protected Partners (incorporated by reference as an exhibit to the Company’sQuarterly Report on Form 10-Q for the quarter ended September 30, 2002).
10.24.1 Tax Matters Agreement (Wilmorite) (incorporated by reference as an exhibit to theCompany’s Current Report on Form 8-K, event date April 25, 2005).
10.25 [Intentionally omitted]
10.26 [Intentionally omitted]
140

ExhibitNumber Description
10.27* 2003 Equity Incentive Plan, as amended and restated as of June 8, 2009 (incorporated byreference as an exhibit to the Company’s Current Report on Form 8-K, event date June 12,2009).
10.27.1* Amended and Restated Cash Bonus/Restricted Stock/Stock Unit and LTIP Unit AwardProgram under the 2003 Equity Incentive Plan (incorporated by reference as an exhibit tothe Company’s 2010 Form 10-K).
10.27.2* Form of Restricted Stock Award Agreement under 2003 Equity Incentive Plan(incorporated by reference as an exhibit to the Company’s 2008 Form 10-K).
10.27.3* Form of Stock Unit Award Agreement under 2003 Equity Incentive (incorporated byreference as an exhibit to the Company’s 2011 Form 10-K).
10.27.4* Form of Employee Stock Option Agreement under 2003 Equity Incentive Plan(incorporated by reference as an exhibit to the Company’s 2008 Form 10-K).
10.27.5* Form of Non-Qualified Stock Option Grant under 2003 Equity Incentive Plan (incorporatedby reference as an exhibit to the Company’s 2008 Form 10-K).
10.27.6* Form of Restricted Stock Award Agreement for Non-Management Directors (incorporatedby reference as an exhibit to the Company’s 2008 Form 10-K).
10.27.7* Form of Stock Unit Award Agreement under 2003 Equity Incentive Plan for Non-EmployeeDirectors.
10.27.8* Form of Stock Appreciation Right under 2003 Equity Incentive Plan (incorporated byreference as an exhibit to the Company’s 2008 Form 10-K).
10.27.9* Form of LTIP Award Agreement under 2003 Equity Incentive Plan (Service-Based)(incorporated by reference as an exhibit to the Company’s Quarterly Report on Form 10-Qfor the quarter ended March 31, 2008).
10.27.10* Form of LTIP Unit Award Agreement under 2003 Equity Incentive Plan (Performance-Based) (incorporated by reference as an exhibit to the Company’s 2011 Form 10-K).
10.27.11* Form of LTIP Unit Award Agreement under 2003 Equity Incentive Plan (Performance-Based/Outperformance) (incorporated by reference as an exhibit to the Company’s 2011Form 10-K).
10.28* Amendment and Restatement of the Employee Stock Purchase Plan (as amended andrestated as of June 1, 2013) (incorporated by reference as an exhibit to the Company’sQuarterly Report on Form 10-Q for the quarter ended June 30, 2013).
10.29* Form of Management Continuity Agreement (incorporated by reference as an exhibit to theCompany’s 2008 Form 10-K).
10.29.1* List of Omitted Management Continuity Agreements.
10.29.2* Termination of Management Continuity Agreement between the Company and Arthur M.Coppola, effective March 15, 2013 (incorporated by reference as an exhibit to theCompany’s Quarterly Report on Form 10-Q for the quarter ended March 31, 2013).
10.29.3* Notices dated August 28, 2013 from the Company to Edward Coppola and Thomas O’Hernregarding their respective management continuity agreements (incorporated by reference asan exhibit to the Company’s Quarterly Report on Form 10-Q for the quarter endedSeptember 30, 2013).
141

ExhibitNumber Description
10.29.4* Management Continuity Agreement between the Company and Thomas J. Leanse, effectiveJanuary 1, 2013 (incorporated by reference as an exhibit to the Company’s QuarterlyReport on Form 10-Q for the quarter ended September 30, 2012).
10.30* Employment Agreement between the Company, The Macerich Partnership, L.P. andThomas J. Leanse, effective as of September 1, 2012 (incorporated by reference as anexhibit to the Company’s Quarterly Report on Form 10-Q for the quarter endedSeptember 30, 2012).
10.31 2005 Amended and Restated Agreement of Limited Partnership of MACWH, LP dated asof April 25, 2005 (incorporated by reference as an exhibit to the Company’s Current Reporton Form 8-K, event date April 25, 2005).
10.32 Registration Rights Agreement dated as of April 25, 2005 among the Company and thepersons names on Exhibit A thereto (incorporated by reference as an exhibit to theCompany’s Current Report on Form 8-K, event date April 25, 2005).
10.33* Description of Director and Executive Compensation Arrangements
21.1 List of Subsidiaries
23.1 Consent of Independent Registered Public Accounting Firm (KPMG LLP)
31.1 Section 302 Certification of Arthur Coppola, Chief Executive Officer
31.2 Section 302 Certification of Thomas O’Hern, Chief Financial Officer
32.1 Section 906 Certifications of Arthur Coppola and Thomas O’Hern
101.INS XBRL Instance Document
101.SCH XBRL Taxonomy Extension Schema Document
101.CAL XBRL Taxonomy Extension Calculation Linkbase Document
101.LAB XBRL Taxonomy Extension Label Linkbase Document
101.PRE XBRL Taxonomy Extension Presentation Linkbase Document
101.DEF XBRL Taxonomy Extension Definition Linkbase Document
* Represents a management contract, or compensatory plan, contract or arrangement required to befiled pursuant to Regulation S-K.
142

Exhibit 21.1
LIST OF SUBSIDIARIES
2013 BRONX VENTURE LLC, a Delaware limited liability company
3105 WILSHIRE INVESTMENTS LLC, a Delaware limited liability company
ARROWHEAD TOWNE CENTER LLC, a Delaware limited liability company
BILTMORE SHOPPING CENTER PARTNERS LLC, an Arizona limited liability company
BROAD RAFAEL ASSOCIATES (LIMITED PARTNERSHIP), a Pennsylvania limited partnership
BROAD RAFAEL PROPERTIES CORP., a Delaware corporation
BROOKLYN KINGS PLAZA LLC, a Delaware limited liability company
CAM-CARSON LLC, a Delaware limited liability company
CAMELBACK COLONNADE ASSOCIATES LLC, an Arizona limited liability company
CAMELBACK COLONNADE SPE LLC, a Delaware limited liability company
CAMELBACK SHOPPING CENTER LIMITED PARTNERSHIP, an Arizona limited partnership
CAM NY 2013 LLC, a Delaware limited liability company
CAPITOLA MALL LLC, a Delaware limited liability company
CHANDLER SOLAR LLC, a Delaware limited liability company
CHICAGO 500 NORTH MICHIGAN LLC, a Delaware limited liability company
COOLIDGE HOLDING LLC, an Arizona limited liability company
CORTE MADERA VILLAGE, LLC, a Delaware limited liability company
DANBURY MALL, LLC, a Delaware limited liability company
DB HOLDINGS LLC, a Delaware limited liability company
DELIV, INC., a Delaware corporation
DEPTFORD MALL ASSOCIATES L.L.C., a New Jersey limited liability company
DESERT SKY MALL LLC, a Delaware limited liability company
EAST MESA ADJACENT LLC, a Delaware limited liability company
EAST MESA LAND, L.L.C., a Delaware limited liability company
EAST MESA MALL, L.L.C., a Delaware limited liability company
FASHION OUTLETS II LLC, a Delaware limited liability company
FASHION OUTLETS OF CHICAGO LLC, a Delaware limited liability company
FLAGSTAFF MALL ASSOCIATES LLC, a Delaware limited liability company
FLAGSTAFF MALL SPE LLC, a Delaware limited liability company
FLATIRON PROPERTY HOLDING, L.L.C., a Delaware limited liability company
FOC ADJACENT LLC, a Delaware limited liability company
FON ADJACENT LLC, a Delaware limited liability company
143

FREE RACE MALL REST., L.P., a New Jersey limited partnership
FREEHOLD I, LLC, a Delaware limited liability company
FREEHOLD I SPC, INC., a Delaware corporation
FREEHOLD CHANDLER HOLDINGS LP, a Delaware limited partnership
FREEHOLD CHANDLER TRUST LLC, a Delaware limited liability company
FREEMALL ASSOCIATES, LLC, a Delaware limited liability company
FREEMALL ASSOCIATES, L.P., a New Jersey limited partnership
FRMR B LLC, a Delaware limited liability company
FRMR, INC., a New Jersey corporation
GRANITE MALL GP, LLC, a Delaware limited liability company
GREAT NORTHERN HOLDINGS, LLC, a Delaware limited liability company
GREAT NORTHERN SPE, LLC, a Delaware limited liability company
GREEN ACRES ADJACENT LLC, a Delaware limited liability company
GREEN ACRES EAT MANAGER LLC, a Delaware limited liability company
GREEN TREE MALL LLC, a Delaware limited liability company
HUDSON PROPERTIES, L.P., a Delaware limited partnership
HUDWIL I, LLC, a Delaware limited liability company
HUDWIL I SPC, INC., a Delaware corporation
HUDWIL IV, LLC, a Delaware limited liability company
HUDWIL IV SPC, INC., a Delaware corporation
INLAND SOLAR LLC, a Delaware limited liability company
JAREN ASSOCIATES #4, an Arizona general partnership
KIERLAND COMMONS INVESTMENT LLC, a Delaware limited liability company
KIERLAND COMMONS TRADENAME LLC, a Delaware limited liability company
KIERLAND GREENWAY, LLC, a Delaware limited liability company
KIERLAND TOWER LOFTS, LLC, a Delaware limited liability company
KINGS PLAZA EAT MANAGER LLC, a Delaware limited liability company
KINGS PLAZA ENERGY LLC, a Delaware limited liability company
KINGS PLAZA GROUND LEASE LLC, a Delaware limited liability company
KITSAPARTY, a Washington non-profit corporation
KTL INVESTMENT LLC, a Delaware limited liability company
LA SANDIA SANTA MONICA LLC, a Delaware limited liability company
LIGHTSTONE BRONX VENTURE LLC, a Delaware limited liability company
LIGHTSTONE BRONX VENTURE HOLDINGS LLC, a Delaware limited liability company
144

MACD LLC, a Delaware limited liability company
MACDAN CORP., a Delaware corporation
MACDB CORP., a Delaware corporation
MACERICH ARIZONA MANAGEMENT LLC, a Delaware limited liability company
MACERICH ARIZONA PARTNERS LLC, an Arizona limited liability company
MACERICH ARROWHEAD LLC, a Delaware limited liability company
MACERICH ARROWHEAD HOLDINGS LLC, a Delaware limited liability company
MACERICH ATLAS LLC, a Delaware limited liability company
MACERICH BILTMORE CI, LLC, a Delaware limited liability company
MACERICH BILTMORE MM, LLC, a Delaware limited liability company
MACERICH BILTMORE OPI, LLC, a Delaware limited liability company
MACERICH BROADWAY PLAZA LLC, a Delaware limited liability company
MACERICH BUENAVENTURA GP CORP., a Delaware corporation
MACERICH BUENAVENTURA LIMITED PARTNERSHIP, a California limited partnership
MACERICH CAPITOLA ADJACENT GP LLC, a Delaware limited liability company
MACERICH CAPITOLA ADJACENT LIMITED PARTNERSHIP, a Delaware limited partnership
MACERICH CASA GRANDE MEMBER LLC, a Delaware limited liability company
MACERICH CERRITOS, LLC, a Delaware limited liability company
MACERICH CERRITOS ADJACENT, LLC, a Delaware limited liability company
MACERICH CERRITOS HOLDINGS LLC, a Delaware limited liability company
MACERICH CERRITOS MALL CORP., a Delaware corporation
MACERICH CHICAGO FASHION OUTLETS LLC, a Delaware limited liability company
MACERICH CM VILLAGE GP CORP., a Delaware corporation
MACERICH CM VILLAGE LIMITED PARTNERSHIP, a California limited partnership
MACERICH COTTONWOOD HOLDINGS LLC, a Delaware limited liability company
MACERICH CROSS COUNTY SECURITY LLC, a Delaware limited liability company
MACERICH CROSSROADS PLAZA HOLDINGS GP CORP., a Delaware corporation
MACERICH CROSSROADS PLAZA HOLDINGS LP, a Delaware limited partnership
MACERICH DEPTFORD LLC, a Delaware limited liability company
MACERICH DEPTFORD II LLC, a Delaware limited liability company
MACERICH DEPTFORD GP CORP., a Delaware corporation
MACERICH DEPTFORD LIMITED PARTNERSHIP, a California limited partnership
MACERICH DESERT SKY MALL HOLDINGS LLC, a Delaware limited liability company
MACERICH EQ GP LLC, a Delaware limited liability company
145

MACERICH EQ LIMITED PARTNERSHIP, a California limited partnership
MACERICH FARGO ASSOCIATES, a California general partnership
MACERICH FIESTA MALL ADJACENT LLC, a Delaware limited liability company
MACERICH FIESTA MALL LLC, a Delaware limited liability company
MACERICH FLATIRON LLC, a Delaware limited liability company
MACERICH FM SPE LLC, a Delaware limited liability company
MACERICH FREEHOLD CHANDLER GP LLC, a Delaware limited liability company
MACERICH FRESNO GP CORP., a Delaware corporation
MACERICH FRESNO LIMITED PARTNERSHIP, a California limited partnership
MACERICH GREAT FALLS GP CORP., a Delaware corporation
MACERICH GREELEY ASSOCIATES, a California general partnership
MACERICH HOLDINGS LLC, a Delaware limited liability company
MACERICH INLAND GP LLC, a Delaware limited liability company
MACERICH INLAND LP, a Delaware limited partnership
MACERICH JANSS MARKETPLACE HOLDINGS LLC, a Delaware limited liability company
MACERICH LA CUMBRE 9.45 AC LLC, a Delaware limited liability company
MACERICH LA CUMBRE LLC, a Delaware limited liability company
MACERICH LA CUMBRE SPE LLC, a Delaware limited liability company
MACERICH LAKE SQUARE MALL LLC, a Delaware limited liability company
MACERICH LAKEWOOD, LLC, a Delaware limited liability company
MACERICH LAKEWOOD HOLDINGS LLC, a Delaware limited liability company
MACERICH LUBBOCK GP CORP., a Delaware corporation
MACERICH LUBBOCK HOLDINGS LLC, a Delaware limited liability company
MACERICH LUBBOCK LIMITED PARTNERSHIP, a California limited partnership
MACERICH MALL DEL NORTE HOLDINGS LLC, a Delaware limited liability company
MACERICH MANAGEMENT COMPANY, a California corporation
MACERICH MARYSVILLE HOLDINGS LLC, a Delaware limited liability company
MACERICH MERCHANTWIRED, LLC, a Delaware limited liability company
MACERICH MESA MALL HOLDINGS LLC, a Delaware limited liability company
MACERICH MIDLAND HOLDINGS LLC, a Delaware limited liability company
MACERICH MILPITAS HOLDINGS LLC, a Delaware limited liability company
MACERICH NEW RIVER HOLDINGS LLC, a Delaware limited liability company
MACERICH NIAGARA LLC, a Delaware limited liability company
MACERICH NORTH BRIDGE LLC, a Delaware limited liability company
146

MACERICH NORTHGATE GP I LLC, a Delaware limited liability company
MACERICH NORTHGATE GP II LLC, a Delaware limited liability company
MACERICH NORTHGATE HOLDINGS LLC, a Delaware limited liability company
MACERICH NORTH PARK MALL LLC, a Delaware limited liability company
MACERICH NORTHRIDGE LP, a California limited partnership
MACERICH NORTHWESTERN ASSOCIATES, a California general partnership
MACERICH NP LLC, a Delaware limited liability company
MACERICH OAKS ADJACENT LLC, a Delaware limited liability company
MACERICH OAKS GP CORP., a Delaware corporation
MACERICH OAKS LP, a Delaware limited partnership
MACERICH ONE SCOTTSDALE LLC, a Delaware limited liability company
MACERICH PANORAMA GP CORP., a Delaware corporation
MACERICH PANORAMA LP, a Delaware limited partnership
MACERICH PARTNERS OF COLORADO LLC, a Colorado limited liability company
MACERICH PLAZA 580 HOLDINGS LLC, a Delaware limited liability company
MACERICH PPR CORP., a Maryland corporation
MACERICH PPR GP LLC, a Delaware limited liability company
MACERICH PROPERTY EQ GP CORP., a Delaware corporation
MACERICH PROPERTY MANAGEMENT COMPANY, LLC, a Delaware limited liability company
MACERICH PVIC ADJACENT LLC, an Arizona limited liability company
MACERICH QUEENS ADJACENT GUARANTOR GP CORP., a Delaware corporation
MACERICH QUEENS GP CORP., a Delaware corporation
MACERICH RIDGMAR LLC, a Delaware limited liability company
MACERICH RIMROCK GP LLC, a Delaware limited liability company
MACERICH RIMROCK LIMITED PARTNERSHIP, a California limited partnership
MACERICH SANTA MONICA ADJACENT GP CORP., a Delaware corporation
MACERICH SANTA MONICA ADJACENT LP, a Delaware limited partnership
MACERICH SANTA MONICA LP, a Delaware limited partnership
MACERICH SANTA MONICA PLACE CORP., a Delaware corporation
MACERICH SANTAN PHASE 2 SPE LLC, a Delaware limited liability company
MACERICH SCG GP CORP., a Delaware corporation
MACERICH SCG GP LLC, a Delaware limited liability company
MACERICH SCG LIMITED PARTNERSHIP, a California limited partnership
MACERICH SMP GP LLC, a Delaware limited liability company
147

MACERICH SMP LP, a Delaware limited partnership
MACERICH SOLAR LLC, a Delaware limited liability company
MACERICH SOUTH PARK MALL LLC, a Delaware limited liability company
MACERICH SOUTH PLAINS GP I LLC, a Delaware limited liability company
MACERICH SOUTH PLAINS GP II LLC, a Delaware limited liability company
MACERICH SOUTH PLAINS GP III LLC, a Delaware limited liability company
MACERICH SOUTH PLAINS LP, a Delaware limited partnership
MACERICH SOUTH PLAINS MEMBER LP, a Delaware limited partnership
MACERICH SOUTH PLAINS MEZZ LP, a Delaware limited partnership
MACERICH SOUTHRIDGE MALL LLC, a Delaware limited liability company
MACERICH SOUTH TOWNE GP LLC, a Delaware limited liability company
MACERICH SOUTH TOWNE LIMITED PARTNERSHIP, a California limited partnership
MACERICH ST MARKETPLACE GP LLC, a Delaware limited liability company
MACERICH ST MARKETPLACE LIMITED PARTNERSHIP, a California limited partnership
MACERICH STONEWOOD, LLC, a Delaware limited liability company
MACERICH STONEWOOD CORP., a Delaware corporation
MACERICH STONEWOOD HOLDINGS LLC, a Delaware limited liability company
MACERICH SUNLAND PARK HOLDINGS LLC, a Delaware limited liability company
MACERICH SUPERSTITION ADJACENT HOLDINGS LLC, a Delaware limited liability company
MACERICH SUPERSTITION LAND HOLDINGS LLC, a Delaware limited liability company
MACERICH SUPERSTITION MALL HOLDINGS LLC, a Delaware limited liability company
MACERICH TRUST LLC, a Delaware limited liability company
MACERICH TWC II CORP., a Delaware corporation
MACERICH TWC II LLC, a Delaware limited liability company
MACERICH TWENTY NINTH STREET LLC, a Delaware limited liability company
MACERICH TYSONS LLC, a Delaware limited liability company
MACERICH VALLE VISTA HOLDINGS LLC, a Delaware limited liability company
MACERICH VALLEY RIVER CENTER LLC, a Delaware limited liability company
MACERICH VICTOR VALLEY LLC, a Delaware limited liability company
MACERICH VINTAGE FAIRE GP CORP., a Delaware corporation
MACERICH VINTAGE FAIRE LIMITED PARTNERSHIP, a California limited partnership
MACERICH VV SPE LLC, a Delaware limited liability company
MACERICH WALLEYE LLC, a Delaware limited liability company
148

MACERICH WASHINGTON SQUARE PETALUMA HOLDINGS LLC, a Delaware limited liabilitycompany
MACERICH WESTSIDE GP CORP., a Delaware corporation
MACERICH WESTSIDE LIMITED PARTNERSHIP, a California limited partnership
MACERICH WESTSIDE PAVILION PROPERTY LLC, a Delaware limited liability company
MACERICH WHITTWOOD HOLDINGS GP CORP., a Delaware corporation
MACERICH WHITTWOOD HOLDINGS LP, a Delaware limited partnership
MACERICH WRLP CORP., a Delaware corporation
MACERICH WRLP LLC, a Delaware limited liability company
MACERICH WRLP II CORP., a Delaware corporation
MACERICH WRLP II L.P., a Delaware limited partnership
MACERICH YUMA HOLDINGS LLC, a Delaware limited liability company
MACJ, LLC, a Delaware limited liability company
MAC NORTHRIDGE GP LLC, a Delaware limited liability company
MACW FREEHOLD, LLC, a Delaware limited liability company
MACWH, LP, a Delaware limited partnership
MACW MALL MANAGEMENT, INC., a New York corporation
MACW MIDWEST, LLC, a Delaware limited liability company
MACWPII LLC, a Delaware limited liability company
MACW PROPERTY MANAGEMENT, LLC, a New York limited liability company
MACW TYSONS, LLC, a Delaware limited liability company
MERCHANTWIRED, LLC, a Delaware limited liability company
METROCENTER PERIPHERAL PROPERTY LLC, a Delaware limited liability company
METRORISING AMS HOLDING LLC, a Delaware limited liability company
METRORISING AMS MEZZ1 LLC, a Delaware limited liability company
METRORISING AMS MEZZ2 LLC, a Delaware limited liability company
METRORISING AMS OWNER LLC, a Delaware limited liability company
MIDCOR ASSOCIATES V, LLC, an Arizona limited liability company
MPP LLC, a Delaware limited liability company
MVRC HOLDING LLC, a Delaware limited liability company
MW INVESTMENT GP CORP., a Delaware corporation
MW INVESTMENT LP, a Delaware limited partnership
NEW LAKE LLC, a Delaware limited liability company
NEW RIVER ASSOCIATES, an Arizona general partnership
149

NORCINO SANTA MONICA LLC, a Delaware limited liability company
NORTH BRIDGE CHICAGO LLC, a Delaware limited liability company
NORTHGATE MALL ASSOCIATES, a California general partnership
NORTH VALLEY PLAZA ASSOCIATES, a California general partnership
ONE SCOTTSDALE INVESTORS LLC, a Delaware limited liability company
PACIFIC PREMIER RETAIL LP, a Delaware limited partnership
PACIFIC PREMIER RETAIL TRUST, a Maryland real estate investment trust
PALISENE REGIONAL MALL LLC, an Arizona limited liability company
PARADISE VALLEY MALL SPE LLC, a Delaware limited liability company
PARADISE WEST #1, L.L.C., an Arizona limited liability company
PARADISE WEST RSC LLC, an Arizona limited liability company
PHXAZ/KIERLAND COMMONS, L.L.C., a Delaware limited liability company
PPR CASCADE LLC, a Delaware limited liability company
PPR CREEKSIDE CROSSING LLC, a Delaware limited liability company
PPR CROSS COURT LLC, a Delaware limited liability company
PPR KITSAP PLACE LLC, a Delaware limited liability company
PPR LAKEWOOD ADJACENT, LLC, a Delaware limited liability company
PPR NORTH POINT LLC, a Delaware limited liability company
PPR REDMOND ADJACENT LLC, a Delaware limited liability company
PPR REDMOND ADJACENT DEVELOPMENT LLC, a Delaware limited liability company
PPR REDMOND OFFICE LLC, a Delaware limited liability company
PPR SQUARE TOO LLC, a Delaware limited liability company
PPR WASHINGTON SQUARE LLC, a Delaware limited liability company
PPRT KITSAP MALL REIT I GP LLC, a Delaware limited liability company
PPRT LAKEWOOD MALL CORP., a Delaware corporation
PPRT REDMOND OFFICE REIT I GP LLC, a Delaware limited liability company
PPRT REDMOND RETAIL REIT I GP LLC, a Delaware limited liability company
PPRT SOLAR LLC, a Delaware limited liability company
PPRT TRUST LLC, a Delaware limited liability company
PRIMI SANTA MONICA LLC, a Delaware limited liability company
PROPCOR ASSOCIATES, an Arizona general partnership
PROPCOR II ASSOCIATES, LLC, an Arizona limited liability company
QUEENS CENTER PLEDGOR LLC, a Delaware limited liability company
QUEENS CENTER REIT LLC, a Delaware limited liability company
150

QUEENS CENTER SPE LLC, a Delaware limited liability company
QUEENS JV GP LLC, a Delaware limited liability company
QUEENS JV LP, a Delaware limited partnership
RACEWAY ONE, LLC, a New Jersey limited liability company
RACEWAY TWO, LLC, a New Jersey limited liability company
RAILHEAD ASSOCIATES, L.L.C., an Arizona limited liability company
RN 116 COMPANY, L.L.C., a Delaware limited liability company
RN 120 COMPANY, L.L.C., a Delaware limited liability company
RN 124/125 COMPANY, L.L.C., a Delaware limited liability company
RN 540 HOTEL COMPANY L.L.C., a Delaware limited liability company
ROTTERDAM SQUARE, LLC, a Delaware limited liability company
SAN TAN SOLAR LLC, a Delaware limited liability company
SANTAN VILLAGE PHASE 2 LLC, an Arizona limited liability company
SARWIL ASSOCIATES, L.P., a New York limited partnership
SARWIL ASSOCIATES II, L.P., a New York limited partnership
SCOTTSDALE FASHION ADJACENT LLC, a Delaware limited liability company
SCOTTSDALE FASHION OFFICE LLC, a Delaware limited liability company
SCOTTSDALE FASHION SQUARE LLC, a Delaware limited liability company
SCOTTSDALE FASHION SQUARE PARTNERSHIP, an Arizona general partnership
SDG MACERICH PROPERTIES, L.P., a Delaware limited partnership
SHOPPINGTOWN MALL HOLDINGS, LLC, a Delaware limited liability company
SHOPPINGTOWN MALL, LLC, a Delaware limited liability company
SHOPPINGTOWN MALL, L.P., a Delaware limited partnership
SM EASTLAND MALL, LLC, a Delaware limited liability company
SM PORTFOLIO LIMITED PARTNERSHIP, a Delaware limited partnership
SM VALLEY MALL, LLC, a Delaware limited liability company
SOUTHRIDGE ADJACENT, LLC, a Delaware limited liability company
SUPERSTITION SPRINGS HOLDING LLC, a Delaware limited liability company
THE MACERICH PARTNERSHIP, L.P., a Delaware limited partnership
THE MARKET AT ESTRELLA FALLS LLC, an Arizona limited liability company
THE WESTCOR COMPANY LIMITED PARTNERSHIP, an Arizona limited partnership
THE WESTCOR COMPANY II LIMITED PARTNERSHIP, an Arizona limited partnership
TOWNE MALL, L.L.C., a Delaware limited liability company
TWC CHANDLER LLC, a Delaware limited liability company
151

TWC LIMITED PARTNER LLC, a Delaware limited liability company
TWC SCOTTSDALE CORP., an Arizona corporation
TWC SCOTTSDALE MEZZANINE, L.L.C., an Arizona limited liability company
TWC TUCSON, LLC, an Arizona limited liability company
TYSONS CORNER LLC, a Virginia limited liability company
TYSONS CORNER HOLDINGS LLC, a Delaware limited liability company
TYSONS CORNER HOTEL I LLC, a Delaware limited liability company
TYSONS CORNER HOTEL PLAZA LLC, a Delaware limited liability company
TYSONS CORNER OFFICE I LLC, a Delaware limited liability company
TYSONS CORNER PROPERTY HOLDINGS LLC, a Delaware limited liability company
TYSONS CORNER PROPERTY HOLDINGS II LLC, a Delaware limited liability company
TYSONS CORNER PROPERTY LLC, a Virginia limited liability company
TYSONS CORNER RESIDENTIAL I LLC, a Delaware limited liability company
VALLEY STREAM GA MEZZANINE LLC, a Delaware limited liability company
VALLEY STREAM GREEN ACRES LLC, a Delaware limited liability company
WALLEYE LLC, a Delaware limited liability company
WALLEYE RETAIL INVESTMENTS LLC, a Delaware limited liability company
WALLEYE TRS HOLDCO, INC., a Delaware corporation
WALTON RIDGMAR, G.P., L.L.C., a Delaware limited liability company
WEST ACRES DEVELOPMENT, LLP, a North Dakota limited liability partnership
WESTCOR 303 CPC LLC, an Arizona limited liability company
WESTCOR 303 RSC LLC, an Arizona limited liability company
WESTCOR 303 WCW LLC, an Arizona limited liability company
WESTCOR/303 AUTO PARK LLC, an Arizona limited liability company
WESTCOR/303 LLC, an Arizona limited liability company
WESTCOR/BLACK CANYON MOTORPLEX LLC, an Arizona limited liability company
WESTCOR/BLACK CANYON RETAIL LLC, an Arizona limited liability company
WESTCOR/CASA GRANDE LLC, an Arizona limited liability company
WESTCOR/COOLIDGE LLC, an Arizona limited liability company
WESTCOR/GILBERT, L.L.C., an Arizona limited liability company
WESTCOR/GILBERT PHASE 2 LLC, an Arizona limited liability company
WESTCOR/GOODYEAR, L.L.C., an Arizona limited liability company
WESTCOR GOODYEAR PC LLC, an Arizona limited liability company
WESTCOR GOODYEAR RSC LLC, an Arizona limited liability company
152

WESTCOR MARANA LLC, an Arizona limited liability company
WESTCOR/MERIDIAN LLC, an Arizona limited liability company
WESTCOR ONE SCOTTSDALE LLC, an Arizona limited liability company
WESTCOR/PARADISE RIDGE, L.L.C., an Arizona limited liability company
WESTCOR PARADISE RIDGE RSC LLC, an Arizona limited liability company
WESTCOR/QUEEN CREEK LLC, an Arizona limited liability company
WESTCOR REALTY LIMITED PARTNERSHIP, a Delaware limited partnership
WESTCOR SANTAN ADJACENT LLC, a Delaware limited liability company
WESTCOR SANTAN HOLDINGS LLC, a Delaware limited liability company
WESTCOR SANTAN VILLAGE LLC, a Delaware limited liability company
WESTCOR SURPRISE CPC LLC, an Arizona limited liability company
WESTCOR SURPRISE RSC LLC, an Arizona limited liability company
WESTCOR SURPRISE WCW LLC, an Arizona limited liability company
WESTCOR/SURPRISE LLC, an Arizona limited liability company
WESTCOR/SURPRISE AUTO PARK LLC, an Arizona limited liability company
WESTCOR TRS LLC, a Delaware limited liability company
WESTDAY ASSOCIATES LLC, a Delaware limited liability company
WESTPEN ASSOCIATES LLC, a Delaware limited liability company
WILSAR, LLC, a Delaware limited liability company
WILSAR SPC, INC., a Delaware corporation
WILTON MALL, LLC, a Delaware limited liability company
WILTON SPC, INC., a Delaware corporation
WMAP, L.L.C., a Delaware limited liability company
WMGTH, INC., a Delaware corporation
WM INLAND ADJACENT LLC, a Delaware limited liability company
WM INLAND LP, a Delaware limited partnership
WM INLAND INVESTORS IV GP LLC, a Delaware limited liability company
WM INLAND INVESTORS IV LP, a Delaware limited partnership
WM INLAND (MAY) IV, L.L.C., a Delaware limited liability company
WM RIDGMAR, L.P., a Delaware limited partnership
WP CASA GRANDE RETAIL LLC, an Arizona limited liability company
ZENGO RESTAURANT SANTA MONICA LLC, a Delaware limited liability company
153

Exhibit 23.1
Consent of Independent Registered Public Accounting Firm
The Board of DirectorsThe Macerich CompanySanta Monica, California
We consent to the incorporation by reference in the registration statements (Nos. 333-176762,333-107063 and 333-121630) on Form S-3 and (Nos. 333-00584, 333-42309, 333-42303, 333-69995,333-108193, 333-120585, 333-161371, 333-186915 and 333-186916) on Form S-8 of The MacerichCompany of our reports dated February 21, 2014, with respect to the consolidated balance sheets ofThe Macerich Company as of December 31, 2013 and 2012, and the related consolidated statements ofoperations, comprehensive income, equity and redeemable noncontrolling interests and cash flows foreach of the years in the three-year period ended December 31, 2013, the financial statement schedule,and the effectiveness of internal control over financial reporting as of December 31, 2013, whichreports appear in the December 31, 2013 annual report on Form 10-K of The Macerich Company.
/s/ KPMG LLP
Los Angeles, CaliforniaFebruary 21, 2014
154

Exhibit 31.1
SECTION 302 CERTIFICATION
I, Arthur M. Coppola, certify that:
1. I have reviewed this report on Form 10-K for the year ended December 31, 2013 of The MacerichCompany;
2. Based on my knowledge, this report does not contain any untrue statement of a material fact oromit to state a material fact necessary to make the statements made, in light of the circumstancesunder which such statements were made, not misleading with respect to the period covered by thisreport;
3. Based on my knowledge, the financial statements, and other financial information included in thisreport, fairly present in all material respects the financial condition, results of operations and cashflows of the registrant as of, and for, the periods presented in this report;
4. The registrant’s other certifying officer(s) and I are responsible for establishing and maintainingdisclosure controls and procedures (as defined in Exchange Act Rules 13a-15(e) and 15d-15(e))and internal control over financial reporting (as defined in Exchange Act Rules 13a-15(f) and15d-15(f)) for the registrant and have:
(a) Designed such disclosure controls and procedures, or caused such disclosure controls andprocedures to be designed under our supervision, to ensure that material information relatingto the registrant, including its consolidated subsidiaries, is made known to us by others withinthose entities, particularly during the period in which this report is being prepared;
(b) Designed such internal control over financial reporting, or caused such internal control overfinancial reporting to be designed under our supervision, to provide reasonable assuranceregarding the reliability of financial reporting and the preparation of financial statements forexternal purposes in accordance with generally accepted accounting principles;
(c) Evaluated the effectiveness of the registrant’s disclosure controls and procedures andpresented in this report our conclusions about the effectiveness of the disclosure controls andprocedures, as of the end of the period covered by this report based on such evaluation; and
(d) Disclosed in this report any change in the registrant’s internal control over financial reportingthat occurred during the registrant’s most recent fiscal quarter (the registrant’s fourth fiscalquarter in the case of an annual report) that has materially affected, or is reasonably likely tomaterially affect, the registrant’s internal control over financial reporting; and
5. The registrant’s other certifying officer(s) and I have disclosed, based on our most recentevaluation of internal control over financial reporting, to the registrant’s auditors and the auditcommittee of the registrant’s board of directors (or persons performing the equivalent functions):
(a) All significant deficiencies and material weaknesses in the design or operation of internalcontrol over financial reporting which are reasonably likely to adversely affect the registrant’sability to record, process, summarize and report financial information; and
(b) Any fraud, whether or not material, that involves management or other employees who have asignificant role in the registrant’s internal control over financial reporting.
Date: February 21, 2014 /s/ ARTHUR M. COPPOLA
Arthur M. CoppolaChairman and Chief Executive Officer
155

Exhibit 31.2
SECTION 302 CERTIFICATION
I, Thomas E. O’Hern, certify that:
1. I have reviewed this report on Form 10-K for the year ended December 31, 2013 of The MacerichCompany;
2. Based on my knowledge, this report does not contain any untrue statement of a material fact oromit to state a material fact necessary to make the statements made, in light of the circumstancesunder which such statements were made, not misleading with respect to the period covered by thisreport;
3. Based on my knowledge, the financial statements, and other financial information included in thisreport, fairly present in all material respects the financial condition, results of operations and cashflows of the registrant as of, and for, the periods presented in this report;
4. The registrant’s other certifying officer(s) and I are responsible for establishing and maintainingdisclosure controls and procedures (as defined in Exchange Act Rules 13a-15(e) and 15d-15(e))and internal control over financial reporting (as defined in Exchange Act Rules 13a-15(f) and15d-15(f)) for the registrant and have:
(a) Designed such disclosure controls and procedures, or caused such disclosure controls andprocedures to be designed under our supervision, to ensure that material information relatingto the registrant, including its consolidated subsidiaries, is made known to us by others withinthose entities, particularly during the period in which this report is being prepared;
(b) Designed such internal control over financial reporting, or caused such internal control overfinancial reporting to be designed under our supervision, to provide reasonable assuranceregarding the reliability of financial reporting and the preparation of financial statements forexternal purposes in accordance with generally accepted accounting principles;
(c) Evaluated the effectiveness of the registrant’s disclosure controls and procedures andpresented in this report our conclusions about the effectiveness of the disclosure controls andprocedures, as of the end of the period covered by this report based on such evaluation; and
(d) Disclosed in this report any change in the registrant’s internal control over financial reportingthat occurred during the registrant’s most recent fiscal quarter (the registrant’s fourth fiscalquarter in the case of an annual report) that has materially affected, or is reasonably likely tomaterially affect, the registrant’s internal control over financial reporting; and
5. The registrant’s other certifying officer(s) and I have disclosed, based on our most recentevaluation of internal control over financial reporting, to the registrant’s auditors and the auditcommittee of the registrant’s board of directors (or persons performing the equivalent functions):
(a) All significant deficiencies and material weaknesses in the design or operation of internalcontrol over financial reporting which are reasonably likely to adversely affect the registrant’sability to record, process, summarize and report financial information; and
(b) Any fraud, whether or not material, that involves management or other employees who have asignificant role in the registrant’s internal control over financial reporting.
Date: February 21, 2014 /s/ THOMAS E. O’HERN
Thomas E. O’HernSenior Executive Vice President andChief Financial Officer
156

Exhibit 32.1
THE MACERICH COMPANY (The Company)WRITTEN STATEMENT PURSUANT TO 18 U.S.C. SECTION 1350
The undersigned, Arthur M. Coppola and Thomas E. O’Hern, the Chief Executive Officer andChief Financial Officer, respectively, of The Macerich Company (the ‘‘Company’’), pursuant to18 U.S.C. §1350, each hereby certify that, to the best of his knowledge:
(i) the Annual Report on Form 10-K for the year ended December 31, 2013 of the Company (the‘‘Report’’) fully complies with the requirements of Section 13(a) and 15(d) of the SecuritiesExchange Act of 1934; and
(ii) the information contained in the Report fairly presents, in all material respects, the financialcondition and results of operations of the Company.
Date: February 21, 2014 /s/ ARTHUR M. COPPOLA
Arthur M. CoppolaChairman and Chief Executive Officer
/s/ THOMAS E. O’HERN
Thomas E. O’HernSenior Executive Vice President andChief Financial Officer
157

(This page has been left blank intentionally.)

(This page has been left blank intentionally.)

(This page has been left blank intentionally.)

Corporate Information
Principal Outside Counsel
O’Melveny & Myers LLPLos Angeles, California
Independent Auditor
KPMG LLPLos Angeles, California
Transfer Agent
ComputershareP.O. Box 30170College Station, Texas 77842-3170www.computershare.com
Macerich Website
For an electronic version of this annual report, our SEC filings and documents relating to corporate governance, please visit www.macerich.com
Corporate Headquarters
401 Wilshire Boulevard, Suite 700Santa Monica, California 90401310.394.6000
Dividend Reinvestment Plan
Stockholders may automatically reinvest their dividends in additional common stock of the Company through the Direct Investment Program, which also provides for purchase by voluntary cash contributions. For additional information, please contact Computershare at 877.373.6374.
Stock Exchange Listing
New York Stock ExchangeSymbol: MAC
The common stock of the Company is listed and traded on the New York Stock Exchange under the symbol “MAC.” The common stock began trading on March 10, 1994 at a price of $19 per share. In 2013, the Company’s shares traded at a high of $72.19 and a low of $55.13.
As of February 18, 2014, there were 563 stockholders of record. The following table shows high and low sales prices per share of common stock during each quarter in 2012 and 2013 and dividends per share of common stock declared and paid by quarter:
Market Quotation per Share
DividendsDeclared/PaidHigh Low
QUARTER ENDED
March 31, 2012 $58.08 $49.67 $0.55
June 30, 2012 $62.83 $54.37 $0.55
September 30, 2012 $61.80 $56.02 $0.55
December 31, 2012 $60.03 $54.32 $0.58
March 31, 2013 $64.47 $57.66 $0.58
June 30, 2013 $72.19 $56.68 $0.58
September 30, 2013 $66.12 $55.19 $0.58
December 31, 2013 $60.76 $55.13 $0.62
39601 Merrill_COVER.indd 4 4/9/14 12:08 AM

4 0 1 W I L S H I R E B O U L E V A R D , S U I T E 7 0 0
S A N T A M O N I C A , C A 9 0 4 0 1 - 1 4 5 2 | 3 1 0 . 3 9 4 . 6 0 0 0 | W W W . M A C E R I C H . C O M
20
13
A
NN
UA
L
RE
PO
RT
F
OR
M
10
-K
39601 Merrill_COVER.indd 1 4/9/14 12:07 AM