2013 cfo letter and audited financials
DESCRIPTION
Resiliency & Resurgence 2013 will be remembered as a year filled with ebbs and flows for The Redwoods Group.TRANSCRIPT

10—2013 Report
Resiliency & Resurgence
2 0 1 3 — CFO Letter
The Redwoods Group believes in building community. Our real estate investments in downtown Durham have provided a healthy return, while contributing to the vibrant turnaround of this once struggling city.
Photo: K. Brown kbrownphotography.com

During the second quarter of 2013, we parted company with our Workers’ Compensation carrier and diligently worked to create a new, long-lasting partnership to serve our stakeholders’ needs for employee safety from a mission-aligned perspective.
?M�KWUXTM\ML�\PI\�[MIZKP�IVL�JMOIV�\W�WٺMZ�Workers’ Compensation in limited geographies again in the fourth quarter. We are enthusiastic about the opportunities to continue to provide our broad range of coverage and risk consulting to our customers. In the intervening months, when we were out of the market, Redwoods saw a material decline in XZWÅ\IJQTQ\a��*]\�\Z]M�to our long-term view of sustainability, our employees turned their attention to other important work during those months, and we I^WQLML�TIaWٺ[�WZ�IVa�reduction in work hours.
I am pleased to report that Redwoods again earned an WXMZI\QVO�XZWÅ\�QV�������?WZSQVO�KIXQ\IT�at the end of 2013 totaled $1.1 million and stockholders’ equity ended the year at $2.5 million. Redwoods saw growth in Written Premium in both the Package/Umbrella and ,QZMK\WZ[�IVL�7ٻKMZ[�TQVM[�QV�������?ZQ\QVO[�QV�the YMCA and Camp segments were up, with a slight decrease in our JCC business segment. We continue to see new customers in all segments joining our program as well as former partners coming back home to Redwoods.
<PM�:ML_WWL[�/ZW]X�Q[�I�NWZ�JMVMÅ\�KWZXWZI\QWV#�an organization formed to create shared value for all stakeholders. This mindset extends into all areas of the enterprise, even into our investment WX\QWV[��7^MZ�\PM�XI[\�Å^M�aMIZ[��_M�PI^M�JMMV�invested in two real estate projects in downtown ,]ZPIU��6WZ\P�+IZWTQVI��7]Z�PWXM�_I[�\W�ÅVL�an attractive return while also participating in the transformation of Durham from a tobacco town to a diverse and thriving entrepreneurial hub. The
ÅZ[\�WN�\PM[M�QV^M[\UMV\[�KIUM�\W�KWVKT][QWV�QV�2013, and I can report that both goals were met.
Redwoods began an Employee Stock Grant Program in 2013, granting all employees who participate in our 401k program shares of stock in The Redwoods Group as a part of their matching funds. Additionally, shares have been set aside for direct purchase by any interested employee. I’m happy to note that 62
employees/owners of The Redwoods Group held vested shares on January 1, 2014.
Also during 2013, there was a change in the capital
structure of our related entity, Redwoods Managers, Inc. This change resulted in a one-time gain for The Redwoods Group in 2013, and it means that for 2014 and
beyond you will see Redwoods Managers as
a part of the consolidated ÅVIVKQIT�[\I\MUMV\�I]LQ\�
of The Redwoods Group. I encourage you to review those
audited statements and the accompanying footnotes for more detail on this and other ÅVIVKQIT�UI\\MZ[�
Thanks for all you do to support our WVOWQVO�MٺWZ\[�\W�[MZ^M�W\PMZ[�
Brian R. Keel CPA, CGMA Senior Vice President and CFO The Redwoods Group, Inc.
2013 Report—11
2 0 1 3 — CFO Letter
Financial Summary 2013 2012Written Premium $48,620 $53,276
Total Revenues $12,139 $12,252
Net Income $138 $328
Total Assets $15,439 $15,758
Stockholders’ Equity $2,520 $2,546
2013 will be remembered as a year filled with ebbs and flows for The Redwoods Group.
“Changing the world was
never meant to be just an expression. It’s what you were made to do—and it’s
what you will accomplish when you invite your holy discontent
to ignite your heart. “ —Bill Hybels
Founder & Senior Pastor, Willow Creek Community Church
($ in thousands)

The Redwoods Group, Inc.
Audited Consolidated Financial Statements
Years ended December 31, 2013 and 2012with Report of Independent Auditors

The Redwoods Group, Inc.
Audited Consolidated Financial Statements
Years ended December 31, 2013 and 2012
Contents
Report of Independent Auditors................................................................................................................................................................................................................................................................................................................................................................................................................................................................................................................................1
Audited Consolidated Financial Statements
Consolidated Balance Sheets................................................................................................................................................................................................................................................................................................................................................................................................................................................................................................................................2Consolidated Statements of Comprehensive Income................................................................................................................................................................................................................................................................................................................................................................................................................................................................................................................................3Consolidated Statements of Changes in Stockholders' Equity................................................................................................................................................................................................................................................................................................................................................................................................................................................................................................................................4Consolidated Statements of Cash Flows................................................................................................................................................................................................................................................................................................................................................................................................................................................................................................................................5Notes to Consolidated Financial Statements................................................................................................................................................................................................................................................................................................................................................................................................................................................................................................................................6 - 17
Supplemental Schedules
Report of Independent Auditors on Accompanying Information................................................................................................................................................................................................................................................................................................................................................................................................................................................................................................................................18Consolidating Balance Sheet................................................................................................................................................................................................................................................................................................................................................................................................................................................................................................................................19 - 20

Report of Independent Auditors
Board of DirectorsThe Redwoods Group, Inc.
We have audited the accompanying consolidated financial statements of The Redwoods Group, Inc. (theCompany) and its subsidiaries which comprise the consolidated balance sheets as of December 31, 2013and 2012, and the related consolidated statements of comprehensive income, changes in stockholders’equity and cash flows for years then ended and the related notes to the consolidated financial statements.
Management’s Responsibility for the Financial StatementsManagement is responsible for the preparation and fair presentation of these consolidated financialstatements in accordance with accounting principles generally accepted in the United States of America;this includes the design, implementation, and maintenance of internal control relevant to the preparationand fair presentation of consolidated financial statements that are free from material misstatement,whether due to fraud or error.
Auditor’s ResponsibilityOur responsibility is to express an opinion on these consolidated financial statements based on our audits.We conducted our audits in accordance with auditing standards generally accepted in the United States ofAmerica. Those standards require that we plan and perform the audits to obtain reasonable assuranceabout whether the consolidated financial statements are free from material misstatement.
An audit involves performing procedures to obtain audit evidence about the amounts and disclosures inthe consolidated financial statements. The procedures selected depend on the auditor’s judgment,including the assessment of the risks of material misstatement of the consolidated financial statements,whether due to fraud or error. In making those risk assessments, the auditor considers internal controlrelevant to the entity’s preparation and fair presentation of the consolidated financial statements in orderto design audit procedures that are appropriate in the circumstances, but not for the purpose of expressingan opinion on the effectiveness of the entity’s internal control. Accordingly, we express no such opinion.An audit also includes evaluating the appropriateness of accounting policies used and the reasonablenessof significant accounting estimates made by management, as well as evaluating the overall presentation ofthe consolidated financial statements.
We believe that the audit evidence we have obtained is sufficient and appropriate to provide a basis forour audit opinion.
OpinionIn our opinion, the consolidated financial statements referred to above present fairly, in all materialrespects, the financial position of the Company and its subsidiaries as of December 31, 2013 and 2012and the results of their operations and their cash flows for the years then ended in conformity withaccounting principles generally accepted in the United States of America.
Raleigh, North CarolinaMarch 31, 2014

The Redwoods Group, Inc.
Consolidated Balance Sheets
As of December 31,2013 2012
AssetsCash and cash equivalents $ 500,938 $ 49,750Certificate of deposits - 870,021Investments 107,919 113,481Restricted cash 3,539,613 3,892,432Premiums and commissions receivable 7,518,221 7,136,176Prepaid expenses 315,480 177,872Deferred income taxes, net 122,969 62,042Other current assets 158,050 147,441
Total current assets 12,263,190 12,449,215Property and equipment, net 368,587 430,780Investment in affiliate - 827,595Investments - other 368,497 250,000Property held for investment 755,622 782,176Deferred income taxes, long-term, net 664,271 318,460Other long-term assets 850,562 749,187
Total assets $ 15,270,729 $ 15,807,413
Liabilities and stockholders' equityLiabilities:Accounts payable $ 211,382 $ 150,211Funds held for others 3,539,613 3,892,432Premiums and commissions payable 5,826,640 5,324,610Accrued expenses 209,642 195,190Notes payable 18,592 518,426Due to affiliate - 25,000Income taxes payable - 114,488Stock repurchase payable 41,958 41,958Deferred revenue 1,121,256 1,142,299
Total current liabilities 10,969,083 11,404,614Due to affiliate - 453,536Stock repurchase payable 41,958 83,916Deferred revenue, long-term 213,438 217,513Deferred compensation 776,799 706,055Deferred rent 419,504 370,785Other 6,233 24,826
Total liabilities 12,427,015 13,261,245
Stockholders' equity:Common stock; $0.01 par value, 1,000,000 shares authorized and 455,377
and 468,388 shares issued and 439,688 and 468,388 shares outstanding,respectively 4,554 4,684
Treasury stock (269,215) -Additional paid-in capital 1,094,679 983,731Retained earnings 1,434,422 1,549,143Accumulated other comprehensive income 5,172 8,610
Total Redwoods Group stockholders' equity 2,269,612 2,546,168Non-controlling interests 574,102 -
Total stockholders' equity 2,843,714 2,546,168Total liabilities and stockholders' equity $ 15,270,729 $ 15,807,413
See accompanying notes to consolidated financial statements2

The Redwoods Group, Inc.
Consolidated Statements of Comprehensive Income
Years ended December 31,2013 2012
RevenuesCommissions and fees $ 11,659,986 $ 12,105,800Investment and other income 533,972 146,393
Total revenues 12,193,958 12,252,193
ExpensesCommission expense 1,611,696 1,710,238Compensation and benefits 7,209,757 7,083,652Operating and administrative 2,952,692 2,762,076Depreciation and amortization 160,472 141,376
Total expenses 11,934,617 11,697,342
Income before income taxes 259,341 554,851
Income tax expense 101,905 226,906
Net income 157,436 327,945
Other comprehensive income: unrealized holding (losses) gainsarising during period, net of tax benefit (expense) of $2,198 and($1,148), respectively
(3,438) 1,796
Total comprehensive income $ 153,998 $ 329,741
See accompanying notes to consolidated financial statements3

The Redwoods Group, Inc.
Consolidated Statements of Changes in Stockholders' Equity
Common Stock Treasury StockAdditional
Paid-in CapitalRetainedEarnings
AccumulatedOther
ComprehensiveIncome
Non-controllinginterests Total
Balance at January 1, 2012 $ 4,917 $ - $ 982,246 $ 1,619,022 $ 6,814 $ - $ 2,612,999
Net income - - - 327,945 - - 327,945Stock grants, including realized income
tax benefits of $310 18 - 22,993 - - - 23,011Stock redeemed (251) - (51,008) (397,824) - - (449,083)Stock option expense - - 29,500 - - - 29,500Stock forfeited - - - - - - -Other comprehensive income - - - - 1,796 - 1,796
Balance at December 31, 2012 4,684 - 983,731 1,549,143 8,610 - 2,546,168
Net income - - - 157,436 - - 157,436Stock grants, including realized income
tax expense of $6,454 90 - 118,416 - - - 118,506Stock issued 9 - 15,401 - - - 15,410Stock redeemed (229) - (52,369) (272,157) - - (324,755)Stock option expense - - 29,500 - - - 29,500Initial consolidating entries - (269,215) - - - 574,102 304,887Other comprehensive income - - - - (3,438) - (3,438)
Balance at December 31, 2013 $ 4,554 $ (269,215) $ 1,094,679 $ 1,434,422 $ 5,172 $ 574,102 $ 2,843,714
See accompanying notes to the consolidated financial statements4

The Redwoods Group, Inc.
Consolidated Statements of Cash Flows
Years ended December 31,2013 2012
Cash flows from operating activities Net income $ 157,436 $ 327,945
Adj. to reconcile net income to net cash from operating activitiesDepreciation and amortization expense 160,472 141,376Amortization of bond discount (75) (72)Stock grants 118,506 23,009Stock options 29,500 29,500Deferred tax effects of unrealized capital gains 2,198 (1,148)Gain on sale or disposal of assets, net (8,675) 5,408Net realized gain on investments (71,947) -Net (gain) loss from investment in affiliate (238,595) 16,234Services provided to affiliate (24,621) (54,878)Net change in operating assets and liabilities:
Premiums and commissions receivable (382,045) 590,330Prepaid expenses (136,784) (40,724)Other assets (143,548) (151,623)Deferred income taxes (27,636) (51,963)Accounts payable 106,670 (58,597)Premiums and commissions payable 502,030 (525,997)Accrued expenses 14,454 40,455Income taxes payable (114,488) (8,625)Deferred revenue (25,118) 4,801Deferred compensation 70,744 75,710Deferred rent 48,719 370,785
Net cash from operating activities 37,197 731,926
Cash flows from investing activitiesPurchase of property held for investment - (497,465)Purchase of property and equipment (119,593) (321,056)Proceeds from disposal of property and equipment 57,115 620Purchase of investments - (46,166)Proceeds from sale of investments 1,191,968 -
Net cash from investing activities 1,129,490 (864,067)
Cash flows from financing activitiesProceeds from issuance of common stock 15,410 -Cost of common stock repurchased (366,710) (514,416)Borrowings under line of credit and financing 310,000 1,555,888Payment to line of credit and financing (828,427) (1,012,635)
Net cash from financing activities (869,727) 28,837
Net change in cash and cash equivalents 296,960 (103,304)Cash and cash equivalents from initial consolidation of affiliate 154,228 -Cash and cash equivalents, beginning of year 49,750 153,054Cash and cash equivalents, end of year $ 500,938 $ 49,750
Supplemental disclosuresInterest paid $ 4,913 $ 7,032Income tax paid $ 250,000 $ 288,300
See accompanying notes to consolidated financial statements5

The Redwoods Group, Inc.
Notes to Consolidated Financial Statements
Years ended December 31, 2013 and 2012
Note A - Organization and Significant Accounting Policies
OrganizationThe Redwoods Group, Inc. (the Company) was formed in 1997. The Company is a managingunderwriter of property, liability and workers' compensation insurance coverage provided by insurancecarriers for the Company's programs for Young Men's Christian Associations (YMCAs), JewishCommunity Centers (JCCs), and not-for-profit camps (Camps) throughout the United States.
Premiums written under the Company's YMCA, JCC, and Camps programs amounted to $48.6 millionand $53.3 million during calendar year 2013 and 2012, respectively. The Company has agreements withinsurance carriers through which it provides underwriting, policy administration and claimsadministration services and receives commissions and fees which are normally paid when policypremiums are collected. The Company's home office is in Morrisville, North Carolina.
The Redwoods Group Foundation (the Foundation) is sponsored by the Company. The Foundation is anon-profit organization that works to spread preventive safety solutions that protect and save lives. Asof December 31, 2013 and 2012, the Company had an intercompany receivable from the Foundation for$86,250 and $31,990, respectively.
On December 31, 2012, the Company purchased BWS Durham (BWS), a limited liability company, for$500,246. BWS's main asset is an office building in Durham, NC that was rented to a third party for theentirety of 2013. BWS is a wholly owned subsidiary of the Company and consolidated according toaccounting principles generally accepted in the United States of America (GAAP) within theseconsolidated financial statements. Refer to Note B for further information.
Effective December 27, 2013, the Company holds a controlling interest (65%) in Redwoods Managers,Inc. (RMI). RMI's primary business plan is to invest in program administrators and to help themimprove their program management expertise and their operating and risk-bearing results. Refer to NoteB.
Basis of Presentation The accompanying consolidated financial statements have been prepared in accordance with GAAP.Preparation of financial statements in accordance with GAAP requires management to make estimatesand assumptions that affect the reported amounts of assets and liabilities and disclosure of contingentassets and liabilities at the date of the financial statements, and the reported amounts of revenues andexpenses during the reporting period. Actual results could differ from those estimates. Theaccompanying consolidated financial statements include the accounts of the Company, BWS (effectiveDecember 31, 2012) and RMI (effective December 31, 2013). Intercompany activity and balances fromthe effective date each entity qualifies for consolidation have been eliminated in consolidation.
6

The Redwoods Group, Inc.
Notes to Consolidated Financial Statements (Continued)
Note A - Organization and Significant Accounting Policies (continued)
Cash and Cash Equivalents The Company considers all highly liquid investments with original maturities of three months or less,including money market funds, to be cash and cash equivalents. The Company maintains certain cashand cash equivalent balances that exceed FDIC insured limits, which management considers to be anormal business risk.
Restricted Cash and Funds Held for OthersRestricted cash represents premiums collected by the Company that are not yet due to the insurancecarriers. The corresponding liability to the insurance carriers is reported as funds held for others. TheCompany also maintains certain cash accounts, which consist of insurance carrier funds advanced forthe payment of claims, that are not reflected in the accompanying balance sheets. The amount of suchbalances at December 31, 2013 and 2012 were $3,146,094 and $2,300,373, respectively. The inclusionof such accounts in the balance sheets would result in an increase to restricted cash and a correspondingincrease to funds held for others, with no net impact on reported stockholders' equity.
Fair Value of InvestmentsGAAP provides guidance for measuring assets and liabilities at fair value and establishes a three-levelhierarchy that prioritizes the inputs to valuation techniques used to measure fair value. The fair valuehierarchy gives the highest priority to quoted prices in active markets for identical assets or liabilities(Level 1), the next priority to quoted prices for identical assets and liabilities in inactive markets orsimilar assets and liabilities in active markets (Level 2), and the lowest priority to unobservable inputs(Level 3).
InvestmentsThe Company designates investments in debt securities as available-for-sale and, accordingly, reportsthese investments at fair value with unrealized holding gains and losses reported as other comprehensiveincome, net of estimated tax. Fair values for the Company's debt securities are based on average bidprices of identical or similar issues with the same life and expected yields (Level 2). Bond premiums ordiscounts are amortized over the life of the bond using the constant yield method. The Company'sinvestments in certificates of deposit are reported at cost. Prior to December 31, 2013, the Company'sinvestment in RMI was accounted for on the equity method. The Company's investment in a residentialcondominium is reflected at cost and is being depreciated using the straight-line method over anestimated useful life of 27.5 years. BWS holds a building which is reflected at cost and is beingdepreciated using the straight-line method over an estimated useful life of 39 years. The Company's 9%holdings in an unconsolidated limited liability company real estate venture is carried at cost for 2012.During 2013, this interest was sold, resulting in a realized gain of $71,947. Investments - other atDecember 31, 2013 includes an investment RMI has in a insurance broker, which is recorded under theequity method of accounting. See Note B for further information.
Realized gains and losses on the disposition of investments are determined using the specificidentification basis. Realized gains of $71,947 were recognized on the disposition of investments duringthe year ended December 31, 2013. No realized gains or losses on the disposition of investments wererecognized during the year ended December 31, 2012.
7

The Redwoods Group, Inc.
Notes to Consolidated Financial Statements (Continued)
Note A - Organization and Significant Accounting Policies (continued)
Investments (continued)Unrealized losses on investments in debt securities, which are deemed other than temporary, are chargedto income when such determination is made. All other invested assets are subject to various impairmenttesting requirements depending on the nature of the investment and accounting method used for theinvestment. No impairment of invested assets (including other than temporary impairment of debtsecurities) was recorded during 2013 and 2012.
Premiums and Commissions ReceivableThe Company bills and collects insurance premiums for the insurance carriers. For the applicableinsurance policies, the Company is required to remit premiums to the insurance carriers, net of theCompany's commission, regardless of whether or not the Company has collected such premiums whendue. Management continually monitors the collectability of receivables, and amounts specificallyidentified as uncollectible are charged to expense in the year the determination is made. Based upon theCompany's past history of negligible uncollectible accounts and management's assessment of its currentreceivables, no allowance for doubtful accounts has been provided in these financial statements.
Property and Equipment Property and equipment are carried at cost less accumulated depreciation. Depreciation is computedusing the straight-line method over the estimated useful lives of assets, which range from 3 to 7 years.
Commission Revenue and Expense Recognition The Company records commission and fee revenues on policies and commission expense to be paid toagents as of the date that the policies are written. Policy cancellations are not material; therefore, aprovision for potential refunds of commissions has not been provided. Premium adjustments, includingpolicy cancellations, are recorded as they occur.
Claim Administration FeesThe Company is paid a fee by insurance companies to administer policy claims for the duration of theclaims. The Company defers these fee revenues and earns the fees over the period that claims servicesare expected to be provided, based upon actual historical data.
Income Taxes Current income taxes are based upon the fiscal year's income that is taxable for federal and state taxreporting purposes. Deferred tax assets and liabilities are recognized for the tax consequencesattributable to temporary differences between the GAAP carrying value of assets and liabilities and theirrespective tax basis. Deferred tax assets and liabilities are measured using enacted tax rates expected toapply to taxable income in the years in which those temporary differences are expected to be recoveredor settled. The Company considers uncertain tax positions during the preparation of its income taxprovision and management does not believe any significant income tax uncertainties exist as ofDecember 31, 2013 and 2012. The Company utilized no tax planning strategies in 2013 or 2012.
8

The Redwoods Group, Inc.
Notes to Consolidated Financial Statements (Continued)
Note A - Organization and Significant Accounting Policies (continued)
Stock GrantsAs discussed in further detail in Note H, the Company issued stock grant agreements to certainmanagement personnel. The fair value of shares granted is determined on the date shares are awarded,and compensation expense is recorded over the requisite vesting period with a corresponding credit toadditional paid in capital. Share valuation at the date of grant is estimated based upon the Company'sannual financial statements, using industry multiples, and is discounted to reflect the stock's limitedmarketability.
Stock OptionsAs discussed further in Note I, the Company granted options, exercisable at a future date, to certainmanagement personnel to purchase common stock. The Company accounts for the stock options usingthe intrinsic value method. The Company records compensation expense that represents the differencebetween exercise price and the current company stock value multiplied by the number of stock optionshares outstanding. Additionally, the Company records a corresponding credit to additional paid incapital.
Subsequent EventsThe Company evaluated subsequent events for disclosure and recognition through March 31, 2014, thedate on which these financial statements were available to be issued, and considered any relevantmatters in the preparation of the consolidated financial statements.
Note B - Investments
As of December 31, 2013 and 2012, the Company's investments included investments in certificates ofdeposit of $0 and $870,021, respectively. All certificates of deposit were issued by BB&T and maturedin 2013.
The Company owns a residential condominium real estate property in Chapel Hill, North Carolina,which it paid $302,106. The Company rents the property and as such, it is classified as property held forinvestment. The Company recognized $10,986 in depreciation expense during both 2013 and 2012.The carrying value of the residential condominium is $273,726 and $284,712 as of December 31, 2013and 2012, respectively.
The Company's 9% interest in a limited liability company real estate venture in downtown Durham,North Carolina amounted to $250,000 as of December 31, 2012 and was reported in investments - other.During 2013, the limited liability company sold its primary real estate asset, which led to the dissolutionof the limited liability company. The Company recognized a gain of $71,947 as a result of thedissolution, which is included in investment and other income on the accompanying 2013 consolidatedstatement of comprehensive income.
9

The Redwoods Group, Inc.
Notes to Consolidated Financial Statements (Continued)
Note B - Investments (continued)
Amortized cost and fair value of the Company's investment in debt securities at December 31, 2013 andDecember 31, 2012 are summarized as follows:
At December 31, 2013:Amortized
Cost
GrossUnrealized
Gains
GrossUnrealized
Losses Fair ValueAvailable-for-sale:
Bonds - Obligations ofstates, municipalities andpolitical subdivisions $ 99,441 $ 8,478 $ - $ 107,919
Total available-for-sale $ 99,441 $ 8,478 $ - $ 107,919
At December 31,2012:Amortized
Cost
GrossUnrealized
Gains
GrossUnrealized
Losses Fair ValueAvailable-for-sale:
Bonds - Obligations ofstates, municipalities andpolitical subdivisions $ 99,366 $ 14,115 $ - $ 113,481
Total available-for-sale $ 99,366 $ 14,115 $ - $ 113,481
Bonds mature in 2020; however, the expected maturities may differ from the contractual maturitiesbecause certain borrowers may have the right to call or prepay obligations with or without penalty.
RMIEffective October 1, 2009, the Company entered into a joint venture with Risk Specialists Companies,Inc. (a Chartis U.S. company), and William C. Mecklenburg, Jr. (a Company shareholder/executive), toform RMI. The Company owned 31% of RMI's common stock, which it received in exchange forservices to be provided to RMI valued at $710,000. On December 27, 2013, RMI repurchased andretired all of the shares owned by Risk Specialists Companies, Inc., which made up 52 percent of RMI'soutstanding common stock at that time. The repurchased shares were subsequently retired and, as aresult, the Company's 31% ownership increased to 65%, which now gives the Company control of RMI.The Company did not provide any consideration for the additional ownership. In accordance withequity method accounting guidance, the Company recognized a pre-tax gain of approximately $295,000,resulting from the share buyback RMI transacted with Risk Specialists Companies, Inc., which isincluded in investment and other income on the accompanying 2013 consolidated statement ofcomprehensive income. The Company has consolidated RMI's balance sheet as of December 31, 2013.The Company carried the investment under the equity method prior to December 31, 2013. TheCompany has accounted for this investment on the equity method for the entire year ended December31, 2013 as there was no significant activity between the transaction date and year-end. The Company’sshare of RMI’s net operating losses, which are reported as a reduction in revenue from investment andother income in the accompanying consolidated statements of comprehensive income, amounted to netlosses of $56,968 and $16,234 for the years ended December 31, 2013 and 2012, respectively.
10

The Redwoods Group, Inc.
Notes to Consolidated Financial Statements (Continued)
Note B - Investments (continued)
RMI (continued)At December 31, 2013 and 2012, RMI holds a 16% and 39% interest, respectively, in an insurancebroker investee which RMI accounts for under the equity method of accounting. That investment, whichhas a carrying value of $368,497 at December 31, 2013 is included in investments - other in theDecember 31, 2013 consolidated balance sheet.
At the inception of RMI, Mr. Mecklenburg exchanged 29,138 shares of the Company’s common stockfor shares of RMI common stock. The Company repurchased 13,449 of those shares during 2013 andRMI recognized a loss of approximately $91,000 on the sale. As of December 31, 2013 and 2012, RMIowned 15,689 and 29,138 shares of the Company’s common stock, respectively. In the accompanyingDecember 31, 2013 consolidated balance sheet, in accordance with consolidation accounting guidance,this investment was reclassed to treasury stock. Services valued at $24,621 and $54,879 were providedby the Company to RMI during 2013 and 2012, respectively. The remaining liability for future servicesas of December 31, 2013 amounts to $453,915 and was eliminated during consolidation. As ofDecember 31, 2012, the remaining liability for future services was $478,536 and is reflected on theaccompanying consolidated balance sheets as due to affiliate, of which $25,000 is included in currentliabilities and $453,536 is in long-term liabilities.
RMI has a Management Agreement with the Company whereby Mr. Mecklenburg works full time forRMI as its President and CEO and other Company employees provide services to RMI as requested byRMI. The cost of services provided by Mr. Mecklenburg are reimbursed by RMI and offset againstrelated Company expenses. The Company’s expense reimbursements during 2013 and 2012 amountedto $320,198 and $319,650 respectively. $32,761 was included in accounts receivable at December 31,2012. The 2013 balance of $32,615 was eliminated during consolidation. The Company also has aServices Agreement with RMI, whereby RMI provides certain consulting and other program businessservices to the Company. These service fees to RMI for 2013 amounted to $228,932 and the relatedpayable of $47,075 was eliminated during consolidation. Services for 2012 totaled $216,795, of which$43,351 was included in accounts payable at December 31, 2012.
BWSOn December 31, 2012, the Company purchased BWS for $500,246. The Company purchased 50% ofBWS from a related party, the Redwoods Group Foundation (the Foundation), and the remaining 50%from a third party. The entire purchase price was paid to the Foundation to discharge the noteoutstanding secured by the property. There are no amounts due to or from the Foundation related to thistransaction at December 31, 2013 or 2012. The only substantial asset held in BWS is an office buildingin Durham, NC. BWS collects rental income on the property and therefore the property is listed asproperty held for investment on the face of the consolidated balance sheets. The amount paid for BWSapproximates the fair value of the assets purchased. The primary purpose of the acquisition is to furtherdevelop and market the property utilizing the resources of the Company. In 2013, the Company granteda 2.5% profit interest to Carl Webb, a former partner of BWS. The Company recognized $15,568 indepreciation expense during 2013.
11

The Redwoods Group, Inc.
Notes to Consolidated Financial Statements (Continued)
Note B - Investments (continued)
BWS (continued)At December 31, 2013 and 2012, the carrying value of the building, which is included in property heldfor investment, is:
2013 2012Building $ 428,119 $ 428,119Land 69,345 69,345
Subtotal 497,464 497,464Accumulated depreciation (15,568) -
Total $ 481,896 $ 497,464
Note C - Property and Equipment
Property and equipment as of December 31, 2013 and 2012, consists of the following:
2013 2012Furniture and equipment $ 513,729 $ 530,228Computer equipment 276,858 308,443Vehicles 212,364 288,439Leasehold improvements 82,179 82,179Computer software 86,051 88,413
Property and equipment, gross 1,171,181 1,297,702Accumulated depreciation (802,594) (866,922)
Property and equipment, net $ 368,587 $ 430,780
Note D - Line-of-Credit
In May 2012, the Company renewed a $500,000 working capital line-of-credit bearing interest at theprime rate plus 1%, and was scheduled to mature on June 30, 2013. The line of credit was renewed onJune 17, 2013, with an interest rate of 3.25% and a maturity date of August 23, 2014. At December 31,2013 and 2012, $0 and $500,000 was drawn on the line-of-credit, respectively. The terms of thepromissory note require that the Company make regular monthly payments of all accrued unpaidinterest. The line-of-credit was secured by personal property of the Company.
12

The Redwoods Group, Inc.
Notes to Consolidated Financial Statements (Continued)
Note E - 401(k) Defined Contribution Plan
The Company maintains a 401(k) defined contribution plan (the Plan) that covers substantially allemployees with more than one month of service. The Company matches 100% of each employee dollarcontributed, up to a maximum contribution of 6% of an employee's eligible compensation. Beginning in2013, the Company changed the funding of the match, so that each employee dollar contributed will bematched with a 50 cent cash contribution and 50 cents worth of Company stock. Shares granted as partof the 401(k) plan vest immediately. During the year ended December 31, 2013, 4,016 shares ofCompany stock were granted as matching contributions, of which 1,987 shares were repurchased by theCompany. The Company's expenses related to the Plan, including the value of the shares granted above,during the years ended December 31, 2013 and 2012 amounted to $218,300 and $214,842, respectively.
Note F - Deferred Compensation
The Company has non-qualified deferred compensation agreements with certain executives under whichfuture defined benefits are expected to be funded by individual life insurance policies owned by theCompany. The deferred compensation benefits are forfeited if future service requirements are not met.The present value of future benefits, discounted using rates of 4.50% to 4.75%, is recognized over therequisite service periods of the individual executives. The accrued present value of future benefits underthese agreements as of December 31, 2013 and 2012 amounted to $776,799 and $706,055, respectively,and is included as deferred compensation on the accompanying consolidated balance sheets. AtDecember 31, 2013 and 2012, the aggregate cash surrender value of life insurance policies on suchexecutives, amounting to $775,487 and $668,641, respectively, is included in other long-term assets onthe accompanying consolidated balance sheets.
Note G - Income Taxes
The significant components of the Company's income tax expense for 2013 and 2012 are as follows:
2013 2012Current $ 118,527 $ 279,976Deferred (16,622) (53,070)
Total income tax expense $ 101,905 $ 226,906
Actual income tax expense reported during the years ended December 31, 2013 and 2012 differs fromthat which would result from applying the statutory tax rates to pretax income, primarily due to certainnon-deductible expenses and adjustments related to under or over accrual of the prior year income taxprovision. The tax returns for years 2010 through 2013 remain subject to examination.
BWS is a limited liability company, which is 97.5% owned by the Company. BWS does not recordincome taxes separately from the Company since BWS is taxed as a passthrough entity and its taxableincome is included proportionally in its members' taxable income. RMI files a separate tax return and isnot part of a consolidated federal tax return with the Company.
13
The Redwoods Group, Inc.
Notes to Consolidated Financial Statements (Continued)
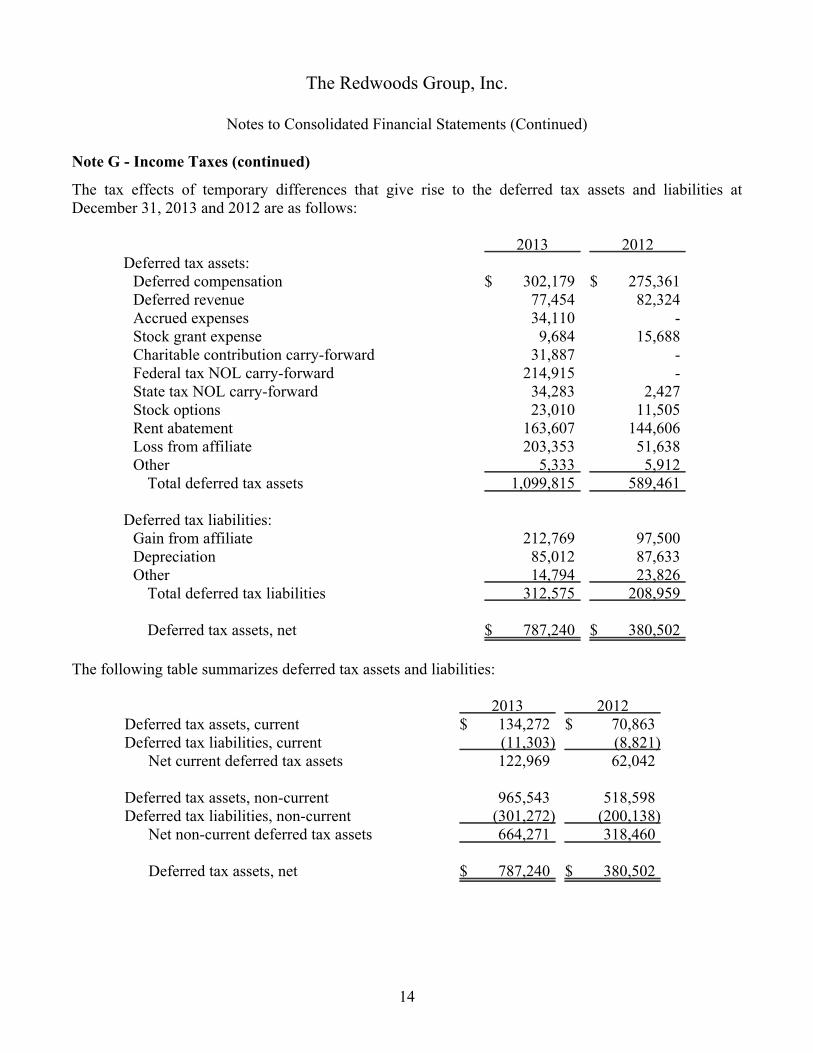
Note G - Income Taxes (continued)
The tax effects of temporary differences that give rise to the deferred tax assets and liabilities atDecember 31, 2013 and 2012 are as follows:
2013 2012Deferred tax assets:
Deferred compensation $ 302,179 $ 275,361Deferred revenue 77,454 82,324Accrued expenses 34,110 -Stock grant expense 9,684 15,688Charitable contribution carry-forward 31,887 -Federal tax NOL carry-forward 214,915 -State tax NOL carry-forward 34,283 2,427Stock options 23,010 11,505Rent abatement 163,607 144,606Loss from affiliate 203,353 51,638Other 5,333 5,912
Total deferred tax assets 1,099,815 589,461
Deferred tax liabilities:Gain from affiliate 212,769 97,500Depreciation 85,012 87,633Other 14,794 23,826
Total deferred tax liabilities 312,575 208,959
Deferred tax assets, net $ 787,240 $ 380,502
The following table summarizes deferred tax assets and liabilities:
2013 2012Deferred tax assets, current $ 134,272 $ 70,863Deferred tax liabilities, current (11,303) (8,821)
Net current deferred tax assets 122,969 62,042
Deferred tax assets, non-current 965,543 518,598Deferred tax liabilities, non-current (301,272) (200,138)
Net non-current deferred tax assets 664,271 318,460
Deferred tax assets, net $ 787,240 $ 380,502
14

The Redwoods Group, Inc.
Notes to Consolidated Financial Statements (Continued)
Note H - Stock Grants
The Company has a stock award plan (the Plan) under which certain management personnel receivestock grant awards subject to shareholder agreements. Up to 125,000 shares have been authorized forawards under the Plan, of which 68,687 shares are available for future grants at December 31, 2013.The shares vest over periods up to three years. The fair value of each stock grant is calculated at thedate the grant is awarded, and is recognized as compensation expense using the straight line methodover the requisite vesting periods. Compensation expense amounted to $32,455 and $22,701 (net offorfeiture credit of $0 and $9,413) for the years ended December 31, 2013 and 2012, respectively.During the year ended December 31, 2013, the Company granted 7,200 shares with an aggregate grantdate fair value of $142,704. During the year ended December 31, 2012, the Company granted 2,500shares with an aggregate grant date fair value of $44,575. During years ended December 31, 2013 and2012, 5,000 and 1,834 shares vested with a value of $99,100 and $32,700, respectively.
Shares granted but not vested amounted to 9,700 shares as of December 31, 2013, which will vest inyears 2015 to 2016. The remaining cost to be recognized in future years for these nonvested awardsamounts to $97,242 as of December 31, 2013. There were 7,500 nonvested granted shares as ofDecember 31, 2012.
Note I - Stock Options
On January 3, 2012, the Company granted options to certain management personnel to purchase up to25,000 shares of common stock at an exercise price of $16.65 per share based on the Company's 2011stock value determined by the stock valuation formula specified in the stock award plan. The option topurchase shares vests on January 3, 2015, and expires on January 3, 2018. All options were outstandingand not vested at both December 31, 2013 and 2012. The stock valuation at December 31, 2013 was$19.82 per share resulting in compensation expense of $29,500 during 2013 and a deferred tax asset of$23,010 at December 31, 2013. The stock valuation at December 31, 2012 was $17.83 per shareresulting in compensation expense of $29,500 during 2012 and a deferred tax asset of $11,505 atDecember 31, 2012.
15

The Redwoods Group, Inc.
Notes to Consolidated Financial Statements (Continued)
Note J - Stockholders' Equity
The Company's shareholders are subject to certain rights and limitations, as documented in theunderlying shareholder agreements.
Shares issued under the Company’s stock agreements are eligible to be put back to the Company, at theoption of the shareholders, once qualifying time periods have been met per the underlying agreements,with up to 25% of qualified shares eligible for put options in any calendar year during the term of theshareholder's employment. During the year ended December 31, 2013, 20,898 shares were redeemed byshareholders at repurchase values totaling $283,638. Included in the 2013 shares redeemed byshareholders, the Company purchased 5,333 shares from a charitable organization, that had receiveddonated shares, at a purchase price of $105,700. During the year ended December 31, 2012, 33,187shares were redeemed by shareholders at repurchase values totaling $591,883. Included in the 2012shares redeemed by shareholders, the Company purchased 2,667 shares from a charitable organization,that had received donated shares, at a purchase price of $47,565.
Employees who retire from the Company are required to put 100% of their remaining shares back to theCompany. There were 438 shares redeemed at a repurchase value of $8,681 under this arrangement in2013. In accordance with the terms of these certain share repurchase agreements, the Company will payproceeds ratably over periods ranging from two to four years. The payable is recorded as stockrepurchase proceeds payable on the consolidated balance sheets. Shares repurchased by the Companyhave been subsequently retired. There were no such purchases under this arrangement in 2012.
As of December 31, 2013, 8,236 shares are eligible to be put to the Company during the year endingDecember 31, 2014 in accordance with the terms of the underlying stock agreements. The purchaseprice, in the event the put options are exercised, is based upon the fair value of the shares as of thecalendar year-end immediately preceding the year in which the Company is notified of the intent toexercise the put option. Based on the repurchase value of the shares as of December 31, 2013, such putoptions have an estimated value of $163,238.
Note K - Lease Commitments
The Company leases office space and certain equipment under non-cancelable leases with unrelatedparties. The aggregate rent expense for the years ended December 31, 2013 and 2012 was $423,572 and$463,665, respectively. In 2012, the Company signed an office lease agreement for eleven years forwhich the Company received a one year rent abatement. The Company recognizes rental expense on astraight line basis over the life of the lease, resulting in $370,785 of rental expense related to the officelease for both 2013 and 2012. Deferred rent related to the office lease was $419,504 and $370,785 atDecember 31, 2013 and 2012, respectively.
16

The Redwoods Group, Inc.
Notes to Consolidated Financial Statements (Continued)
Note K - Lease Commitments (continued)
The following is a schedule of future minimum lease payments under the Company's non-cancelableoperating leases:
Year ending December 31,2014 $ 421,5752015 433,6542016 445,9652017 455,9352018 460,859Thereafter 2,025,486
Total minimum lease commitments $ 4,243,474
Note L - Risks and Uncertainties
The Company is a managing underwriter of property, casualty, liability and workers’ compensationinsurance coverage for YMCAs, JCCs, and Camps throughout the United States. The Company hasseveral insurance carriers that underwrite its insurance policies, although a majority of these policies areunderwritten by one carrier. If this carrier should discontinue providing this insurance coverage, theCompany would have some exposure related to finding another primary underwriting company. Thisrisk is mitigated by the fact that the Company’s principal carrier is rated A (excellent) by A. M. BestCompany. This risk has been further reduced by limiting the share of risk born by the primary carrierand spreading the excess risk among one or more “A” or better rated reinsurers.
17

Report of Independent Auditorson Accompanying Information
Board of DirectorsThe Redwoods Group, Inc.
The report on our audit of the consolidated financial statements of The Redwoods Group, Inc. ("theCompany") as of December 31, 2013 and 2012, and for the years then ended is presented on page 1 ofthis document. Our audit was conducted for the purpose of forming an opinion on the consolidatedfinancial statements taken as a whole. The accompanying Consolidating Balance Sheet of the Companyas of December 31, 2013 is presented for purposes of additional analysis and is not a required part of thefinancial statements. Such information is the responsibility of management and was derived from andrelates directly to the underlying accounting and other records used to prepare the consolidated financialstatements. The information has been subjected to the auditing procedures applied in the audit of theconsolidated financial statements and certain additional procedures, including comparing andreconciling such information directly to the underlying accounting and other records used to prepare theconsolidated financial statements or to the financial statements themselves, and other additionalprocedures in accordance with auditing standards generally accepted in the United States of America. Inour opinion, the information is fairly stated in all material respects in relation to the consolidatedfinancial statements as a whole.
Raleigh, North CarolinaMarch 31, 2014

The Redwoods Group, Inc.Consolidating Balance Sheet
December 31, 2013
TheRedwoodsGroup, Inc. BWS
RedwoodsManagers,
Inc. Eliminations TotalAssets
Cash and cash equivalents $ 302,040 $ 44,669 $ 154,229 $ - $ 500,938Investments 107,919 - - - 107,919Restricted cash 3,539,613 - - - 3,539,613Premiums and commissions receivable 7,518,221 - - - 7,518,221Prepaid expenses 314,656 - 824 - 315,480Deferred income taxes, net 122,522 - 447 - 122,969Other current assets 190,665 - 72,075 (104,690) 158,050
Total current assets 12,095,636 44,669 227,575 (104,690) 12,263,190Property and equipment 368,013 - 574 - 368,587Investment in affiliate 770,627 - 269,215 (1,039,842) -Investments - other - - 368,497 - 368,497Property held for investment 273,726 481,896 - - 755,622Deferred income taxes, long-term, net 400,885 - 378,655 (115,269) 664,271Other long-term assets 849,512 - 429,965 (428,915) 850,562
Total assets $14,758,399 $ 526,565 $ 1,674,481 $ (1,688,716) $15,270,729
19

The Redwoods Group, Inc.Consolidating Balance Sheet (Continued)
December 31, 2013
TheRedwoodsGroup, Inc. BWS
RedwoodsManagers,
Inc. Eliminations TotalLiabilities and Stockholder's EquityLiabilities
Accounts payable $ 256,883 $ - $ 34,191 $ (79,692) $ 211,382Funds held for others 3,539,613 - - - 3,539,613Premiums and commissions payable 5,826,640 - - - 5,826,640Accrued expenses 207,182 2,460 - - 209,642Notes payable 18,592 - - - 18,592Due to affiliate 25,000 - - (25,000) -Stock repurchase payable 41,958 - - - 41,958Deferred revenue 1,116,650 4,606 - - 1,121,256
Total current liabilities 11,032,518 7,066 34,191 (104,692) 10,969,083Due to affiliate 428,915 - - (428,915) -Stock repurchase payable 41,958 - - - 41,958Deferred revenue, long-term 213,438 - - - 213,438Deferred compensation 776,799 - - - 776,799Deferred rent 419,504 - - - 419,504Other 6,233 - - - 6,233
Total liabilities 12,919,365 7,066 34,191 (533,607) 12,427,015
Stockholder's equityCommon stock 4,554 - 1,210,000 (1,210,000) 4,554Additional paid-in capital 1,094,679 - 1,054,230 (1,054,230) 1,094,679Retained earnings 734,629 519,499 (623,940) 804,234 1,434,422Accumulated other comprehensive income 5,172 - - - 5,172Treasury stock - - - (269,215) (269,215)
Total Redwoods Group stockholder's equity 1,839,034 519,499 1,640,290 (1,729,211) 2,269,612Non-controlling interests - - - 574,102 574,102Total stockholders' equity 1,839,034 519,499 1,640,290 (1,155,109) 2,843,714Total liabilities and stockholder's equity $14,758,399 $ 526,565 $ 1,674,481 $ (1,688,716) $15,270,729
20