2013 colorado school district cost of living analysis
TRANSCRIPT

Prepared By: Corona Insights © Corona Insights, 2014 CoronaInsights.com
2013 Colorado School District
Cost of Living Analysis Colorado Legislative Council

CONTENTS
Section 1: Introduction .......................................................................................................................... 1
Section 2: Overview of Research Design ............................................................................................... 2
Section 3: 2013 Colorado School District Cost of Living Results .......................................................... 3
Section 4: Methodology ........................................................................................................................ 11
Identifying the Benchmark Household .................................................................................................................... 11
Identifying the Market Basket of Goods and Services ........................................................................................... 13
Identifying and Measuring Geographic Shopping Patterns .................................................................................. 16
Data Collection Procedures ........................................................................................................................................ 17
Developing Final Cost of Living Measures .............................................................................................................. 29
Appendix A: Detailed Results .............................................................................................................. 31
Appendix B: Detailed Methodological Discussion – Data Collection ............................................... 38
Appendix C: Changes from the Previous Study & Implications ........................................................ 50
Appendix D: Raw Pricing Data for Selected Purchase Categories .................................................... 52
Appendix E: Statistical Measures Used in This Report ..................................................................... 53

Page 1
2013 COLORADO SCHOOL DISTRICT
COST OF LIVING ANALYSIS
CONDUCTED FOR THE COLORADO LEGISLATIVE C OUNCIL
SECTION 1: INTRODUCTION
Corona Insights is pleased to present this report to the Colorado Legislative Council. The following
report provides the 2013 cost of living index for each of Colorado’s 178 school districts, along with a
description of the project design and research methodology.
BACKGROUND
In July of 2013, Corona Insights was retained to conduct the 2013 Colorado School District Cost of
Living Study for the Colorado Legislative Council. This study measures the differences in the cost to
purchase a typical “market basket” of goods among the 178 public school districts in the State of Colorado.
Final cost of living factors detailed within this study reflect the relative cost differences for all notable site-
specific living expenses (i.e., housing, transportation, goods, services and taxes) among Colorado’s school
districts. The cost of living index developed herein is used as one component of each district’s per pupil
funding formula.
This report is the latest in a series of biennial reports that were first conducted as a result of the Public
School Finance Act of 1994.

Page 2
SECTION 2: OVERVIEW OF RESEARCH DESIGN
The goal of the study is to develop comparative cost of living figures for each of the 178 school districts
in the state. Five major questions guide the project:
1. What is a “typical” (archetypal) Colorado household in terms of size and income?
2. What types of goods and services does that archetypal household buy?
3. Where do they buy those goods and services?
4. How much do those goods and services cost in differing geographic locations?
5. If an archetypal household lives in each of the 178 school districts, what is the difference between their costs to buy those goods, based on the prices where they shop?
The cost of living estimates are developed using the following process to answer the questions listed
above:
RESEARCH STRUCTURE
We begin with an archetypal household of three people with a total household income of $49,100, which
is the average teacher income for 2012 in Colorado;
Then we place that household in each school district in Colorado;
That household then spends their income on the same suite of goods and services that are purchased by
the average household of that size and income level throughout the United States;
The archetypal household then shops inside and outside their district in a pattern that emulates the
geographic shopping patterns of all households in that district;
The price for goods and services in each district where they shop may differ, even if the good or service
is identical, based on market factors;
The final cost of living index is then calculated. This final index details the differences in costs of living
for the archetypal household in each district to purchase a standard suite of goods and services.
An overview of the methodology is provided in Section 4 of this report, with additional detail provided in
Appendix B. Appendix C denotes notable methodological changes between the 2011 study and the 2013
study.

Page 3
SECTION 3: 2013 COLORADO SCHOOL
DISTRICT COST OF LIVING RESULTS
The table that extends across the following several pages provides the overall cost of living in each of
Colorado’s 178 school districts, as calculated in 2013. Figures are reported in order by District number (and
alphabetically by County name), along with appropriate rankings, ratings, and comparisons.
Cost of living figures relate to the cost of buying a market basket of goods and services that represents
the spending patterns in the United States of the average archetypal household. (See Section 4 for more
discussion of the archetypal household.) More detailed results by expense category may be seen in Appendix
A. Raw data for selected goods may be seen in Appendix D.
The findings are largely consistent with previous years. Once again, Aspen has the highest cost of living,
however its disparity is somewhat less extreme in 2013 than it was in 2011, largely because of declines in the
housing market. Other mountain resort districts make up the top of the list, including Telluride, Summit
County, and Steamboat Springs districts. Boulder continued to climb in the rankings in 2013, moving to #5,
up from #8 in 2011, and #11 in 2009. The districts with the lowest costs of living are primarily located in the
southeastern corner of the state.
Below, two maps provide a visual summary of the cost of living index for the 178 school districts. The
first map is a statewide view and the second is a detailed view of the Denver and Colorado Springs metro
areas. Statewide maps for each major expenditure category are provided in Appendix A.

Page 4
EXHIBIT 3-1: MAP OF COST OF LIVING INDEX FOR COLORADO SCHOOL
DISTRICTS, 2013
Note. The index value is the ratio of the cost of the market basket in each district to the statewide average
cost of the market basket. An index value that is greater than 100 means that district is more expensive
than average, while a value less than 100 means that district is less expensive than average. In this map,
shades of green depict less expensive districts, while shades of orange depict more expensive districts.

Page 5
EXHIBIT 3-2: DETAILED MAP OF COST OF LIVING INDEX FOR SCHOOL
DISTRICTS IN THE DENVER AND COLORADO SPRINGS METRO AREAS, 2013
Note. The index value is the ratio of the cost of the market basket in each district to the statewide average
cost of the market basket. An index value that is greater than 100 means that district is more expensive
than average, while a value less than 100 means that district is less expensive than average. In this map,
shades of green depict less expensive districts, while shades of orange depict more expensive districts.

Page 6
EXHIBIT 3-3: 2013 COST OF LIVING INDEX FOR COLORADO SCHOOL DISTRICTS
Note. The rank value orders the districts from the most expensive (#1) to the least expensive (#178). The
index value is the ratio of the cost of the market basket in each district to the statewide average cost of the
market basket. An index value that is greater than 100 means that district is more expensive than average,
while a value less than 100 means that district is less expensive than average.
District ID County District Total Index Rank
State $49,100 100
10 Adams MAPLETON 1 $46,782 95.3 69
20 Adams ADAMS 12 FIVE STAR SCHOOLS $47,855 97.5 46
30 Adams ADAMS COUNTY 14 $46,195 94.1 78
40 Adams BRIGHTON 27J $46,694 95.1 71
50 Adams BENNETT 29J $47,193 96.1 59
60 Adams STRASBURG 31J $47,366 96.5 54
70 Adams WESTMINSTER 50 $48,630 99.0 35
100 Alamosa ALAMOSA RE-11J $45,307 92.3 98
110 Alamosa SANGRE DE CRISTO RE-22J $45,634 92.9 93
120 Arapahoe ENGLEWOOD 1 $52,018 105.9 11
123 Arapahoe SHERIDAN 2 $48,985 99.8 29
130 Arapahoe CHERRY CREEK 5 $48,496 98.8 37
140 Arapahoe LITTLETON 6 $50,802 103.5 16
170 Arapahoe DEER TRAIL 26J $44,611 90.9 109
180 Arapahoe ADAMS-ARAPAHOE 28J $47,012 95.7 62
190 Arapahoe BYERS 32J $45,381 92.4 97
220 Archuleta ARCHULETA COUNTY 50 JT $44,540 90.7 111
230 Baca WALSH RE-1 $40,444 82.4 172
240 Baca PRITCHETT RE-3 $40,190 81.9 176
250 Baca SPRINGFIELD RE-4 $41,145 83.8 164
260 Baca VILAS RE-5 $40,434 82.4 173
270 Baca CAMPO RE-6 $40,238 82.0 175
290 Bent LAS ANIMAS RE-1 $41,611 84.7 160
310 Bent MC CLAVE RE-2 $40,625 82.7 168
470 Boulder ST VRAIN VALLEY RE 1J $48,310 98.4 42
480 Boulder BOULDER VALLEY RE 2 $54,210 110.4 5
490 Chaffee BUENA VISTA R-31 $47,390 96.5 52
500 Chaffee SALIDA R-32 $47,253 96.2 56
510 Cheyenne KIT CARSON R-1 $40,637 82.8 167
520 Cheyenne CHEYENNE COUNTY RE-5 $42,425 86.4 143
540 Clear Creek CLEAR CREEK RE-1 $49,949 101.7 22
550 Conejos NORTH CONEJOS RE-1J $41,772 85.1 157
560 Conejos SANFORD 6J $42,042 85.6 147
580 Conejos SOUTH CONEJOS RE-10 $41,846 85.2 155

Page 7
EXHIBIT 3-3(CONTINUED): 2013 COST OF LIVING INDEX FOR COLORADO
SCHOOL DISTRICTS
District ID County District Total Index Rank
State $49,100 100
640 Costilla CENTENNIAL R-1 $42,661 86.9 140
740 Costilla SIERRA GRANDE R-30 $44,549 90.7 110
770 Crowley CROWLEY COUNTY RE-1-J $41,447 84.4 163
860 Custer CUSTER COUNTY SCHOOL DISTRICT C-1 $46,346 94.4 76
870 Delta DELTA COUNTY 50(J) $46,514 94.7 73
880 Denver DENVER COUNTY 1 $53,797 109.6 8
890 Dolores DOLORES COUNTY RE NO.2 $43,943 89.5 121
900 Douglas DOUGLAS COUNTY RE 1 $49,722 101.3 24
910 Eagle EAGLE COUNTY RE 50 $53,910 109.8 7
920 Elbert ELIZABETH C-1 $47,523 96.8 48
930 Elbert KIOWA C-2 $48,380 98.5 40
940 Elbert BIG SANDY 100J $44,067 89.7 119
950 Elbert ELBERT 200 $49,643 101.1 25
960 Elbert AGATE 300 $45,797 93.3 86
970 El Paso CALHAN RJ-1 $47,441 96.6 51
980 El Paso HARRISON 2 $47,206 96.1 58
990 El Paso WIDEFIELD 3 $47,369 96.5 53
1000 El Paso FOUNTAIN 8 $47,485 96.7 49
1010 El Paso COLORADO SPRINGS 11 $48,409 98.6 38
1020 El Paso CHEYENNE MOUNTAIN 12 $51,209 104.3 14
1030 El Paso MANITOU SPRINGS 14 $51,440 104.8 13
1040 El Paso ACADEMY 20 $49,466 100.7 27
1050 El Paso ELLICOTT 22 $47,117 96.0 60
1060 El Paso PEYTON 23 JT $48,857 99.5 32
1070 El Paso HANOVER 28 $45,081 91.8 102
1080 El Paso LEWIS-PALMER 38 $50,614 103.1 17
1110 El Paso FALCON 49 $47,650 97.0 47
1120 El Paso EDISON 54 JT $47,014 95.8 61
1130 El Paso MIAMI/YODER 60 JT $45,650 93.0 92
1140 Fremont CANON CITY RE-1 $45,395 92.5 96
1150 Fremont FLORENCE RE-2 $44,952 91.6 106
1160 Fremont COTOPAXI RE-3 $45,872 93.4 84
1180 Garfield ROARING FORK RE-1 $54,066 110.1 6
1195 Garfield GARFIELD RE-2 $46,791 95.3 68
1220 Garfield GARFIELD 16 $44,157 89.9 117
1330 Gilpin GILPIN COUNTY RE-1 $47,252 96.2 57

Page 8
EXHIBIT 3-3(CONTINUED): 2013 COST OF LIVING INDEX FOR COLORADO
SCHOOL DISTRICTS
District ID County District Total Index Rank
State $49,100 100
1340 Grand WEST GRAND 1-JT. $48,329 98.4 41
1350 Grand EAST GRAND 2 $52,961 107.9 9
1360 Gunnison GUNNISON WATERSHED RE1J $50,350 102.5 18
1380 Hinsdale HINSDALE COUNTY RE 1 $51,031 103.9 15
1390 Huerfano HUERFANO RE-1 $42,159 85.9 145
1400 Huerfano LA VETA RE-2 $46,321 94.3 77
1410 Jackson NORTH PARK R-1 $44,834 91.3 107
1420 Jefferson JEFFERSON COUNTY R-1 $50,107 102.1 19
1430 Kiowa EADS RE-1 $40,520 82.5 171
1440 Kiowa PLAINVIEW RE-2 $40,134 81.7 177
1450 Kit Carson ARRIBA-FLAGLER C-20 $43,364 88.3 126
1460 Kit Carson HI-PLAINS R-23 $43,572 88.7 123
1480 Kit Carson STRATTON R-4 $43,962 89.5 120
1490 Kit Carson BETHUNE R-5 $44,209 90.0 114
1500 Kit Carson BURLINGTON RE-6J $45,053 91.8 103
1510 Lake LAKE COUNTY R-1 $49,745 101.3 23
1520 La Plata DURANGO 9-R $51,565 105.0 12
1530 La Plata BAYFIELD 10 JT-R $48,810 99.4 33
1540 La Plata IGNACIO 11 JT $46,960 95.6 63
1550 Larimer POUDRE R-1 $48,537 98.9 36
1560 Larimer THOMPSON R-2J $47,471 96.7 50
1570 Larimer PARK (ESTES PARK) R-3 $52,654 107.2 10
1580 Las Animas TRINIDAD 1 $43,256 88.1 127
1590 Las Animas PRIMERO REORGANIZED 2 $43,099 87.8 130
1600 Las Animas HOEHNE REORGANIZED 3 $44,286 90.2 113
1620 Las Animas AGUILAR REORGANIZED 6 $41,893 85.3 153
1750 Las Animas BRANSON REORGANIZED 82 $40,920 83.3 166
1760 Las Animas KIM REORGANIZED 88 $41,818 85.2 156
1780 Lincoln GENOA-HUGO C113 $41,974 85.5 150
1790 Lincoln LIMON RE-4J $43,386 88.4 125
1810 Lincoln KARVAL RE-23 $41,456 84.4 162
1828 Logan VALLEY RE-1 $45,786 93.3 87
1850 Logan FRENCHMAN RE-3 $42,769 87.1 137
1860 Logan BUFFALO RE-4 $44,197 90.0 115
1870 Logan PLATEAU RE-5 $42,752 87.1 138

Page 9
EXHIBIT 3-3(CONTINUED): 2013 COST OF LIVING INDEX FOR COLORADO
SCHOOL DISTRICTS
District ID County District Total Index Rank
State $49,100 100
1980 Mesa DE BEQUE 49JT $42,883 87.3 135
1990 Mesa PLATEAU VALLEY 50 $45,974 93.6 82
2000 Mesa MESA COUNTY VALLEY 51 $46,004 93.7 81
2010 Mineral CREEDE CONSOLIDATED 1 $48,222 98.2 43
2020 Moffat MOFFAT COUNTY RE:NO 1 $47,874 97.5 45
2035 Montezuma MONTEZUMA-CORTEZ RE-1 $45,171 92.0 101
2055 Montezuma DOLORES RE-4A $45,837 93.4 85
2070 Montezuma MANCOS RE-6 $46,873 95.5 65
2180 Montrose MONTROSE COUNTY RE-1J $45,489 92.6 94
2190 Montrose WEST END RE-2 $47,350 96.4 55
2395 Morgan BRUSH RE-2(J) $46,057 93.8 80
2405 Morgan FORT MORGAN RE-3 $46,848 95.4 66
2505 Morgan WELDON VALLEY RE-20(J) $45,954 93.6 83
2515 Morgan WIGGINS RE-50(J) $46,950 95.6 64
2520 Otero EAST OTERO R-1 $42,165 85.9 144
2530 Otero ROCKY FORD R-2 $41,911 85.4 152
2535 Otero MANZANOLA 3J $40,622 82.7 169
2540 Otero FOWLER R-4J $41,719 85.0 158
2560 Otero CHERAW 31 $41,611 84.7 159
2570 Otero SWINK 33 $42,957 87.5 134
2580 Ouray OURAY R-1 $49,488 100.8 26
2590 Ouray RIDGWAY R-2 $50,100 102.0 20
2600 Park PLATTE CANYON 1 $48,405 98.6 39
2610 Park PARK COUNTY RE-2 $50,057 101.9 21
2620 Phillips HOLYOKE RE-1J $43,534 88.7 124
2630 Phillips HAXTUN RE-2J $44,119 89.9 118
2640 Pitkin ASPEN 1 $94,573 192.6 1
2650 Prowers GRANADA RE-1 $39,687 80.8 178
2660 Prowers LAMAR RE-2 $41,541 84.6 161
2670 Prowers HOLLY RE-3 $40,256 82.0 174
2680 Prowers WILEY RE-13 JT $40,595 82.7 170
2690 Pueblo PUEBLO CITY 60 $45,250 92.2 99
2700 Pueblo PUEBLO COUNTY RURAL 70 $46,716 95.1 70
2710 Rio Blanco MEEKER RE1 $45,785 93.2 88
2720 Rio Blanco RANGELY RE-4 $46,127 93.9 79

Page 10
EXHIBIT 3-3(CONTINUED): 2013 COST OF LIVING INDEX FOR COLORADO
SCHOOL DISTRICTS
District ID County District Total Index Rank
State $49,100 100
2730 Rio Grande DEL NORTE C-7 $46,437 94.6 75
2740 Rio Grande MONTE VISTA C-8 $44,972 91.6 105
2750 Rio Grande SARGENT RE-33J $44,168 90.0 116
2760 Routt HAYDEN RE-1 $48,792 99.4 34
2770 Routt STEAMBOAT SPRINGS RE-2 $56,191 114.4 4
2780 Routt SOUTH ROUTT RE 3 $48,870 99.5 31
2790 Saguache MOUNTAIN VALLEY RE 1 $43,030 87.6 131
2800 Saguache MOFFAT 2 $45,003 91.7 104
2810 Saguache CENTER 26 JT $42,038 85.6 148
2820 San Juan SILVERTON 1 $49,197 100.2 28
2830 San Miguel TELLURIDE R-1 $56,864 115.8 3
2840 San Miguel NORWOOD R-2J $46,470 94.6 74
2862 Sedgwick JULESBURG RE-1 $43,193 88.0 128
2865 Sedgwick PLATTE VALLEY RE-3 $41,993 85.5 149
3000 Summit SUMMIT RE-1 $59,895 122.0 2
3010 Teller CRIPPLE CREEK-VICTOR RE-1 $45,723 93.1 89
3020 Teller WOODLAND PARK RE-2 $47,946 97.7 44
3030 Washington AKRON R-1 $42,999 87.6 133
3040 Washington ARICKAREE R-2 $42,703 87.0 139
3050 Washington OTIS R-3 $42,492 86.5 142
3060 Washington LONE STAR 101 $43,021 87.6 132
3070 Washington WOODLIN R-104 $42,778 87.1 136
3080 Weld WELD COUNTY RE-1 $45,192 92.0 100
3085 Weld EATON RE-2 $46,683 95.1 72
3090 Weld KEENESBURG RE-3(J) $45,408 92.5 95
3100 Weld WINDSOR RE-4 $48,872 99.5 30
3110 Weld JOHNSTOWN-MILLIKEN RE-5J $46,816 95.3 67
3120 Weld GREELEY 6 $45,656 93.0 91
3130 Weld PLATTE VALLEY RE-7 $44,694 91.0 108
3140 Weld WELD COUNTY S/D RE-8 $45,700 93.1 90
3145 Weld AULT-HIGHLAND RE-9 $44,454 90.5 112
3146 Weld BRIGGSDALE RE-10 $43,915 89.4 122
3147 Weld PRAIRIE RE-11 $41,856 85.2 154
3148 Weld PAWNEE RE-12 $41,135 83.8 165
3200 Yuma YUMA 1 $42,623 86.8 141
3210 Yuma WRAY RD-2 $43,147 87.9 129
3220 Yuma IDALIA RJ-3 $42,103 85.7 146
3230 Yuma LIBERTY J-4 $41,925 85.4 151

Page 11
SECTION 4: METHODOLOGY
As described in Section 2, the project was structured around five distinct research questions. These
research questions included:
1. What is a typical (archetypal, or benchmark) Colorado household?
(See “Identifying the Benchmark Household” in this section)
2. What types of goods and services does that archetypal household buy?
(See “Identifying the Market Basket of Goods and Services” in this section)
3. Where do they buy those goods and services?
(See “Identifying and Measuring Geographic Shopping Patterns” in this section)
4. How much do those goods and services cost in each geographic location?
(See “Data Collection” in this section)
5. If an archetypal household lives in each of the 178 school districts, what is the difference between their costs to buy those goods, based on the prices where they shop?
(See “Developing Final Cost of Living Measures” in this section)
Corona’s methodological approach to answering each of these research questions is presented in this
section of the report. Appendix B provides additional detail for each methodological section of the study for
interested readers.
IDENTIFYING THE BENCHMARK HOUSEHOLD
The characteristics of the 2013 benchmark household mirrored the benchmark households used in the
previous Colorado School District Cost of Living studies. The benchmark household used in past studies has
typically been a household of average size for the state, with an income related to typical teaching incomes.
The 2013 benchmark household was defined by the Colorado Legislative Council to be a three-person
household with a total household income of $49,100, which is the average teacher income for 2012 in
Colorado.
Over the past studies, the household size has remained constant, and the household income has increased
at a moderate rate. The exhibit provided below details the current and previous benchmark households used
for the study:

Page 12
EXHIBIT 4-1: DEFINITION OF THE ARCHETYPAL HOUSEHOLD
YearSize of the Benchmark
Household
Household Income of
Benchmark Household
2013 Study (Current) 3 people $49,100
2011 Study 3 people $49,200
2009 Study 3 people $47,500
2007 Study 3 people $44,500
2005 Study 3 people $43,000
2003 Study 3 people $40,000

Page 13
IDENTIFYING THE MARKET BASKET OF GOODS AND SERVICES
Methodology at a Glance
Goal: Develop a list of specific goods and services that collectively serve as a proxy for all
spending by the archetype household.
1. The Bureau of Labor Statistics compiles annual data on consumer spending habits through Consumer Expenditures Surveys.
2. Corona Insights examined the most recent Consumer Expenditure Survey Data (2011 - 2012) to identify major categories of spending (housing, food at home, etc.) for a three person household with the target income level. A total of 18 categories were defined.
3. Corona Insights and the Colorado Legislative Council jointly identified a “market basket” of individual items that represent each major category of spending. For example, a variety of goods such as milk, bread, and other foods were identified to represent grocery expenditures.
4. All items that were selected to be included in the “market basket” were identified with as much specificity as possible in terms of size and quality, so that directly comparable data could be gathered in every school district where that item was sold.
5. Some items, such as energy costs, are monopolistic goods or services. These items were merely measured on a per-unit cost in each district.
6. The market basket was designed to be consistent with the 2011 study where possible and appropriate. In fact, only two notable items were changed from 2011: a woman’s cardigan sweater replaced a woman’s polo shirt, and for pricing vehicle insurance and repairs, a Ford F-150 replaced a Ford Ranger. See Appendix C for more detail.
7. The average expenditures per major category were calculated and set aside for the final calculations, as the collected data was weighted in proportion to those average expenditures.
The goal of this step of the process is to develop a list of goods and services that, in combination, can
represent the full range of purchases for the archetypal household. The primary data source for this type of
analysis is Consumer Expenditure Surveys (CES) that are compiled by the Bureau of Labor Statistics. Data
was used from the 2011-2012 Consumer Expenditure Survey, which was the most recently published CES
available at the time of analysis.
Data in the Consumer Expenditure Surveys are available by household size and year. Corona used the
data for three-person households, and interpolated between the results for three-person household incomes
of $40,000 to $49,999 and three-person household incomes of $50,000 to $69,999 (from CES Table 38) to
estimate expenditures for a household with an income of $49,100.
Two key types of data are produced from this analysis: 1) a set of categories that reflect major types of
expenditures and 2) average spending levels for the archetypal household within each of those categories.
That data is shown in the following exhibit. Also shown in the exhibit are individual items that were selected
jointly by the Corona Insights team and the Colorado Legislative Council as being representative of each
major expenditure category. Prices gathered for these items (with statistical weightings to ensure that their
pricing matches total spending) formed the basis of 2013 Cost of Living estimates.

Page 14
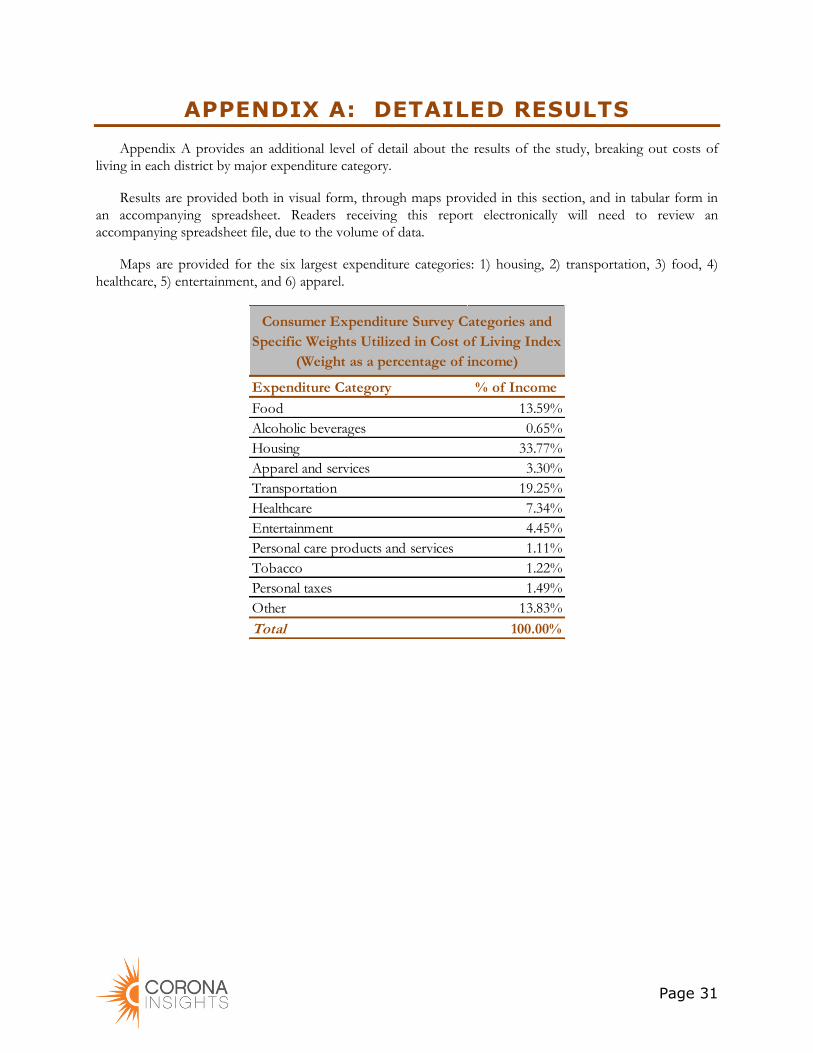
EXHIBIT 4-2: SPENDING PATTERNS BY CATEGORY OF THE ARCHETYPAL
HOUSEHOLD
Expenditure Category % of Income
Food 13.59%
Alcoholic beverages 0.65%
Housing 33.77%
Apparel and services 3.30%
Transportation 19.25%
Healthcare 7.34%
Entertainment 4.45%
Personal care products and services 1.11%
Tobacco 1.22%
Personal taxes 1.49%
Other 13.83%
Total 100.00%
Consumer Expenditure Survey Categories and
Specific Weights Utilized in Cost of Living Index
(Weight as a percentage of income)

Page 15
EXHIBIT 4-3: SPENDING PATTERNS OF THE ARCHETYPAL HOUSEHOLD
Expenditure Category % of Income Representative Market Basket Items
Food 13.59%
Food at home 8.51%
Cereals and bakery products 1.26% White Bread, Spaghetti
Meats, poultry, fish, and eggs 1.92%
Beef 1.22% Ground Beef
Poultry 0.69% Whole Fryer Chicken
Dairy products 0.90% Milk
Fruits and vegetables 1.43%
Fresh fruits 0.50% Bananas
Fresh vegetables 0.43% Potatoes
Processed fruits 0.23% Canned Peaches
Processed vegetables 0.26% Canned Green Beans
Other food at home 3.01% Coffee, Soup, Frozen Waffles
Food away from home 5.08% Cheeseburger Meal, Cheese Pizza Meal, Steak Meal
Alcoholic beverages 0.65% Beer
Housing 33.77%
Mortgage interest and charges 14.06% Mortgage Payment
Property taxes 2.83% Property Taxes
Maintenance, repairs, insurance, other expenses 1.56% Homeowner's Insurance
Utilities, fuels, and public services 8.68%
Natural gas 0.88% Natural Gas
Electricity 3.51% Electric
Telephone services 3.19% Telephone
Water and other public services 1.11% Water & Wastewater
Household operations 2.44% Day Care Services
Housekeeping supplies 1.37% Laundry Soap
Household furnishings and equipment 2.83% Refrigerator
Apparel and services 3.30%
Men and boys 0.77% Men's Dress Shirt, Men's T-Shirt
Women and girls 1.56% Women's Cardigan Sweater, Women's Pantyhose
Footwear 0.96% Men's Canvas Lace-up Shoes
Transportation 19.25%
Vehicle purchases (net outlay) 7.05% Car Payment / Auto Financing
Gasoline and motor oil 7.00% Gasoline: 85 Unleaded
Other vehicle expenses 5.70%
Vehicle finance charges 0.59% Interest Rate, Bank Financing Fees
Maintenance and repairs 1.90% Oil Change, Front End Alignment
Vehicle insurance 3.31% Insurance Premiums
Healthcare 7.34% Health Insurance Premium
Entertainment 4.45%
Fees and admissions 0.77% Movie Ticket (First Run, Full Length Film)
Audio and visual equipment and services 2.06% Television
Pets, toys, hobbies, and playground equipment 1.05% Pet Food
Other entertainment supplies, equipment, and services 0.56% AA Batteries
Personal care products and services 1.11%
Women's Haircut, Men's Haircut, Toothpaste,
Tampons, Shaving Cream
Reading 0.15%
Education 1.91%
Tobacco products and smoking supplies 1.22% Cigarettes
Miscellaneous 1.45%
Cash contributions 2.08%
Personal insurance and pensions 8.23%
Personal taxes 1.49%
Income Tax with Itemized Deductions for
Mortgage Interest
Total (bold level) 100.00%
Consumer Expenditure Survey Categories and Specific Weights Utilized in Cost of Living Index
(Weight as a percentage of income)
Note. Disaggregated results
for the cost of living by
major category are
provided in Section 5 and
detailed raw data are
provided in Appendix D.
Page 16
IDENTIFYING AND MEASURING GEOGRAPHIC SHOPPING
PATTERNS
The shopping patterns database was not updated in 2013, so the shopping patterns data used for the
2013 Cost of Living Study was the same as that used for the 2011 study. Below we provide a brief
description of the database.
If every resident in a school district made all of their purchases within a school district, calculating the
cost of living in that district would be straightforward. However, this is not the case. Often, residents leave
their district to make purchases, either because they can obtain a better price, better selection, more
convenience, or some other benefit. Because prices will vary across district boundaries (sometimes notably),
it is necessary to understand these geographic shopping patterns in order to develop the actual cost of living
in each school district.
In 2007, 2009, and 2011, Corona Insights conducted a survey of residents of each district to gather input
about where they most recently purchased a series of goods. The data from these surveys, in conjunction with
mathematical modeling methods, were used to construct a geographic shopping matrix describing where the
residents of each school district typically purchase particular products (i.e., what proportion of purchases are
made in the home district, in each neighboring district, online, etc.).

Page 17
DATA COLLECTION PROCEDURES
Methodology at a Glance
Goal: Gather pricing data for a large variety of goods and services in all school districts where
those goods and services are sold.
Note. Different data collection techniques were used to collect the various items in the market basket.
Below we provide a very short summary of the methodological approaches that were used to obtain
prices for each category of goods. Additional overview information is provided in this section of the
report, and detailed information is provided in Appendix B.
1. Retail Purchases – Pricing for a number of basic retail items was gathered on-site at retail stores across the state. These included all “food at home” items (perishables, non-perishables, and produce), alcoholic beverages, household goods, pet food, personal care products, tobacco, clothing, shoes, furniture, entertainment (TV), electronics, and restaurant meals.
2. Service Purchases – Pricing for a number of services was gathered by making telephone calls to a stratified random sample of businesses across the state. This included prices for men’s and women’s haircuts; auto repair services, including an oil and filter change and front-end alignment; movie tickets; and auto loan rates. Gasoline prices are also gathered by telephone because all prices must be gathered on a single day.
3. Housing – Average home values for a home with specified characteristics were provided by the Colorado Legislative Council as a product of a separate research contract with another consulting firm.
4. Property Taxes – County and school district mill levies for each district are applied to the home values to obtain property tax costs for each school district.
5. Homeowner’s Insurance – Pricing data for a home with specified characteristics was provided by a large insurance company that provides coverage throughout the state.
6. Utilities - Data on utility prices was gathered from the Colorado Association of Municipal Utilities (CAMU) and the Public Utilities Commission via 2012 annual reports and/or sales reports filed by electric, telephone, and gas utility providers. (Some adjustment and estimation was required above and beyond the report data.)
7. Water/Wastewater – Data was gathered via phone calls from Corona Insights to over 250 cities and towns throughout the state, as well as visits to municipal web sites. Rates were then applied to specified “typical” usage rates.
8. Day Care – Information by county was obtained from the 2013 Market Rate Survey of Child Care Providers, conducted by Qualistar Colorado as part of a contract with the Colorado Department of Human Services, Division of Child Care. These rates were then combined with data on the population of children in each age group and the proportion of children in day care in each age group obtained from the U.S. Census Bureau and the Department of Health and Human Services, and then applied to specific school districts.
9. Transportation – Vehicle financing rates and fees were gathered for a specified vehicle (a 2011 Honda Civic) from local lending institutions throughout the state. Using the standard blue book value for purchase price, local sales taxes, payment costs (principal and interest), and registration and ownership taxes, costs were estimated by county and then mapped to school districts.

Page 18
10. Vehicle Insurance – Pricing data for two vehicles with specified characteristics was provided by a large vehicle insurance company that provides coverage throughout the state.
11. Health Insurance – Prices from four of the largest health insurance providers in the state – the top two most popular health plans for each company – were used to develop pricing for a three-person family of a specified age and gender profile.
12. Personal Taxes – Income taxes for the benchmark family are calculated for each district itemizing deductions for mortgage interest and property taxes.
13. Other Expenses – Some types of expenses that were deemed to be more or less constant across geographic areas were not analyzed. These include reading, education, “miscellaneous expenses”, contributions, personal insurance, and pension payments. However, it should be noted that sales taxes were added to all of the previous categories where applicable.
For each category of market basket items listed below, we describe how the cost of those items was
collected, and also summarize the amount of data that was collected in the 2013 study. Additional data
collection details for each category are presented in Appendix B.
Methodology Note
Corona developed a sophisticated sampling plan for data collection efforts where onsite collection was
required at retail establishments. Using a list of firms compiled by InfoUSA, Corona examined revenue
data by store and then developed an algorithm to sample firms within each district in a manner that
ensured that a representative variety of stores were being sampled, based on their market share. The
algorithm first identified the preferred number of stores to be sampled, and then identified specific stores
based on their revenue size compared to their competitors. This approach ensured that high-sales outlets
were sampled in proportion to their sales, as opposed to a random sampling approach that would
oversample smaller stores.
FOOD AT HOME
Food at home items consisted of potatoes, bananas, canned green beans, canned peaches, ground beef,
whole fryer chicken, milk, white bread, spaghetti, coffee, soup, and frozen waffles. Prices for these items
were gathered by in-person visits to grocery stores throughout the state. The number of grocery stores
visited (and in metro areas, the selection of stores to visit) were determined with a sampling algorithm
developed by Corona Insights, applied to a database of business listings provided by InfoUSA, that was
supplemented with lists of Walmart Supercenters and Super Targets. This was the same sampling
methodology used in the three previous studies, to ensure comparability. All sampling for items making up
the food at home category was done at the school district level after geo-coding business listings within the
appropriate school district locations. After prices were collected, the dataset of prices for each item was
screened for outliers, taxes were added, average prices were computed for each district, and then average
prices were weighted using the shopping patterns survey to produce final prices for each district.
Detailed descriptions of the food at home items used in the 2013 market basket and the number of prices
collected for each market basket item is provided in the table below:

Page 19
CES Category Specific Item DescriptionCollection
Method
N of
Observations
Fruits and
vegetablesPotatoes
Price for a 10 lb. bag of lowest price Russet potatoes. If 10 lb. bag is
not available, substitute nearest sack size and note size. If potatoes
only sold individually, record price per pound and note. If sold
individually, regardless of weight, record price and weigh potato. DO
NOT USE PRICE OF POTATOES BY THE POUND IF SOLD
IN ANY SIZE SACK.
On-Site 362
Fruits and
vegetablesBananas
Price per pound. If bananas are priced by the bag or by the banana,
report the price and weigh a bunch, note weight and number of
bananas in bunch. DO NOT PRICE ORGANIC.
On-Site 352
Fruits and
vegetables
Canned Green
Beans
Price of store brand cut green beans, 14.5 oz. If no store brand,
collect the cheapest brand and note brand.On-Site 465
Fruits and
vegetables
Canned
Peaches
Price of store brand sliced peaches in heavy syrup, 15 to 15.25 oz. If
no store brand, collect the cheapest brand and note brand.On-Site 387
Meats, poultry
fish and eggsGround Beef
Price per pound of prepackaged, regular ground beef, 80% lean or
most comparable, from a 1 to 2 pound package of loose ground
beef. Note if different percent lean. DO NOT PRICE FAMILY
PACK. DO NOT PRICE PRE-FORMED BEEF PATTIES OR
TUBE PACKAGING.
On-Site 332
Meats, poultry
fish and eggs
Chicken, whole
fryer
Price per pound of one whole fryer chicken, least expensive brand. If
whole fryer not available, price whole fryer chicken, cut up and note.On-Site 299
Dairy Milk
Price for one gallon (128 Fl. oz.) 2% milk, store brand. If no store
brand, collect cheapest price and note. If no 2%, then price (in order
of preference) 1%, skim, whole. Note if not 2%. NO ORGANIC,
NO SOY, NO FLAVORED MILKS (e.g. chocolate, etc.). DO
NOT PRICE HALF GALLON.
On-Site 518
Cereals and
bakery productsWhite Bread
Price for store brand 24 oz. (1.5 lb.) loaf of sliced white bread. If
store brand not available, record price of lowest priced brand with a
24 oz. loaf. Note any differences in brand or loaf size. (Safeway
store brand is 22 oz. - record this price and note difference.)
On-Site 383
Cereals and
bakery productsSpaghetti
Price of store brand spaghetti noodles, 16 oz. package. If store brand
is not available, record price of lowest priced brand and note brand.
DO NOT PRICE PREMIUM STORE BRANDS.
On-Site 456
Other food at
homeCoffee
Price for a 11.3 oz. can of Folgers Classic Roast Coffee, ground, red
can. If Folgers Classic Roast not available, price other ground Folgers
in similar sizing (approx. 11 oz.). If not Folgers, price Maxwell House
11.5 oz. or nearest size. Note brand, product, and any size
differences. DO NOT PRICE DECAFFINATED OR WHOLE
BEAN. DO NOT PRICE ANY OTHER BRANDS.
On-Site 557
Other food at
homeSoup
Price for a 10 ¾ oz. can of Campbell’s Original Chicken Noodle
Soup. If no Campbell’s (rare), price store brand and note brand and
any size difference. DO NOT PRICE “HomeStyle” or “Classic”
PACKAGING OR OTHER VARIATIONS.
On-Site 531
Other food at
homeFrozen Waffles
Price of store brand frozen waffles, buttermilk or plain flavored,
prebaked, 10 pack, 12.3 oz. If store brand not available, record price
of lowest priced brand and note brand and any differences in size.
(Walmart store brand only has 8 pack - record price and note
quantity.)
On-Site 286
Food At Home

Page 20
FOOD AWAY FROM HOME
Food away from home items consisted of a cheeseburger meal, a pizza, and a steak meal. Prices for these
items were gathered by in-person visits to restaurants throughout the state. The number of restaurants to be
visited was determined with a sampling algorithm developed by Corona Insights, applied to a database of
business listings provided by InfoUSA that was supplemented with online directory listings. All sampling for
food away from home items was done at the school district level after coding the business listings to the
appropriate school district. After prices were collected, the dataset of prices for each item was screened for
outliers, taxes were added, average prices were computed for each district, and then average prices were
weighted using the shopping patterns survey results to produce final prices for each district.
Detailed descriptions of the food away from home items in the market basket and the number of prices
collected are provided in the table below:
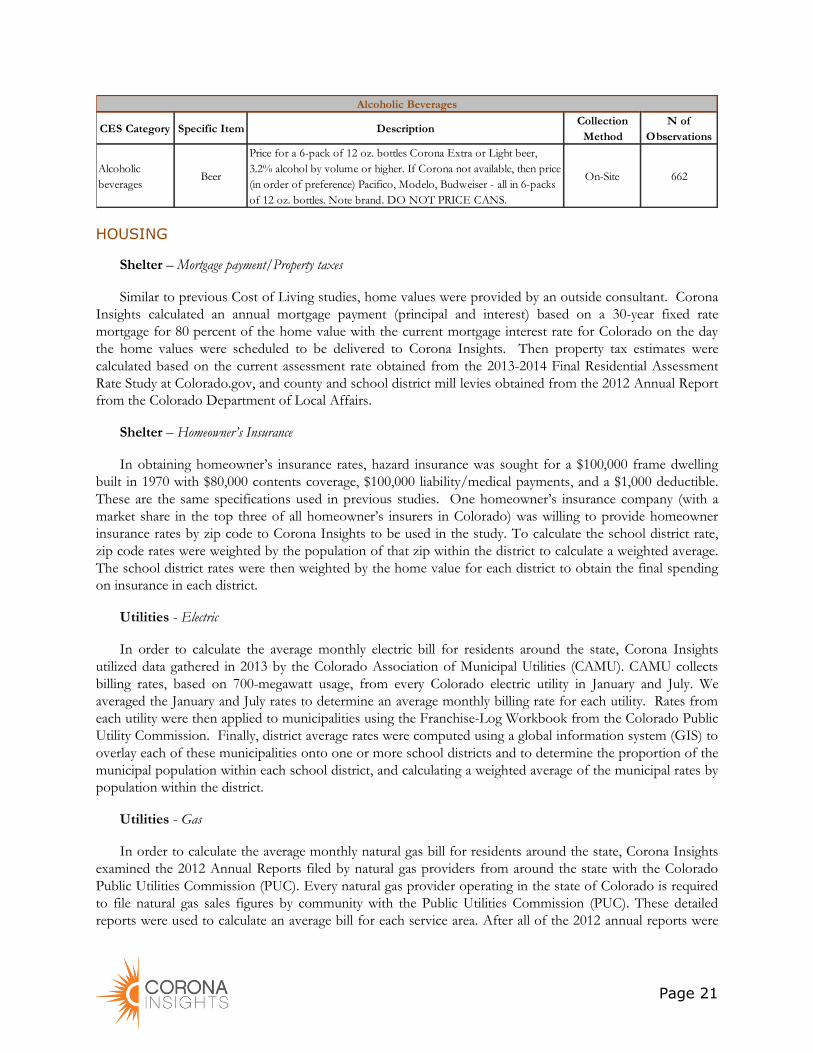
ALCOHOLIC BEVERAGES
Alcoholic beverage prices were collected for a 6-pack of beer. Prices were gathered by in-person visits to
grocery and liquor stores throughout the state. Beer was treated as a grocery item and so the initial sample of
stores were the grocery stores selected by the food at home sampling. However, because not all grocery
stores sell beer, the sample of stores was supplemented with a list of Liquor Stores from InfoUSA. All
sampling for alcoholic beverages was done at the school district level after coding the business listings to the
appropriate school district. After prices were collected, the dataset of prices for each item was screened for
outliers, taxes were added, average prices were computed for each district, and then average prices were
weighted using the shopping patterns survey results to produce final prices for each district.
A detailed description of the alcoholic beverage item in the market basket and the number of prices
collected are provided in the table below:
CES Category Specific Item DescriptionCollection
Method
N of
Observations
Restaurants Lunch
Price for a McDonald's quarter pounder with cheese meal (including
fries and a regular 21 oz Coke). If you're not collecting at a
McDonald's, price a cheeseburger with a medium fries, and a coke
(the most similar type meal to a quarter pounder with cheese meal).
On-Site 813
Restaurants DinnerPrice for a Pizza Hut cheese pizza, regular or thin crust, 14” diameter
(note size if other).On-Site 367
Restaurants Dinner
Price for 12 oz. Ribeye steak and two sides (potato, vegetable, soup
or salad). If only one side is included, then add a side (potato or
vegetable) or side salad. Note differences. If 12 oz. not available,
price Ribeye in different size (note size). If Ribeye not available, price
a New York Strip. If the NY Strip is not available, price a Sirloin.
Note size of steak if not 12 oz. (Price this item at Applebees and
Chilis, where available; price the 10 oz Sirloin at TGI Fridays.)
DO NOT PRICE CHOPPED SIRLOIN.
On-Site 418
Food Away From Home
Page 21
HOUSING
Shelter – Mortgage payment/Property taxes
Similar to previous Cost of Living studies, home values were provided by an outside consultant. Corona
Insights calculated an annual mortgage payment (principal and interest) based on a 30-year fixed rate
mortgage for 80 percent of the home value with the current mortgage interest rate for Colorado on the day
the home values were scheduled to be delivered to Corona Insights. Then property tax estimates were
calculated based on the current assessment rate obtained from the 2013-2014 Final Residential Assessment
Rate Study at Colorado.gov, and county and school district mill levies obtained from the 2012 Annual Report
from the Colorado Department of Local Affairs.
Shelter – Homeowner’s Insurance
In obtaining homeowner’s insurance rates, hazard insurance was sought for a $100,000 frame dwelling
built in 1970 with $80,000 contents coverage, $100,000 liability/medical payments, and a $1,000 deductible.
These are the same specifications used in previous studies. One homeowner’s insurance company (with a
market share in the top three of all homeowner’s insurers in Colorado) was willing to provide homeowner
insurance rates by zip code to Corona Insights to be used in the study. To calculate the school district rate,
zip code rates were weighted by the population of that zip within the district to calculate a weighted average.
The school district rates were then weighted by the home value for each district to obtain the final spending
on insurance in each district.
Utilities - Electric
In order to calculate the average monthly electric bill for residents around the state, Corona Insights
utilized data gathered in 2013 by the Colorado Association of Municipal Utilities (CAMU). CAMU collects
billing rates, based on 700-megawatt usage, from every Colorado electric utility in January and July. We
averaged the January and July rates to determine an average monthly billing rate for each utility. Rates from
each utility were then applied to municipalities using the Franchise-Log Workbook from the Colorado Public
Utility Commission. Finally, district average rates were computed using a global information system (GIS) to
overlay each of these municipalities onto one or more school districts and to determine the proportion of the
municipal population within each school district, and calculating a weighted average of the municipal rates by
population within the district.
Utilities - Gas
In order to calculate the average monthly natural gas bill for residents around the state, Corona Insights
examined the 2012 Annual Reports filed by natural gas providers from around the state with the Colorado
Public Utilities Commission (PUC). Every natural gas provider operating in the state of Colorado is required
to file natural gas sales figures by community with the Public Utilities Commission (PUC). These detailed
reports were used to calculate an average bill for each service area. After all of the 2012 annual reports were
CES Category Specific Item DescriptionCollection
Method
N of
Observations
Alcoholic
beveragesBeer
Price for a 6-pack of 12 oz. bottles Corona Extra or Light beer,
3.2% alcohol by volume or higher. If Corona not available, then price
(in order of preference) Pacifico, Modelo, Budweiser - all in 6-packs
of 12 oz. bottles. Note brand. DO NOT PRICE CANS.
On-Site 662
Alcoholic Beverages

Page 22
gathered and analyzed, natural gas monthly rates were assigned to school districts based on the service areas
for all natural gas providers. It should also be noted that some service areas do not utilize natural gas, but
instead depend on propane for their heating needs. In specific cases where services areas (and the school
districts residing within those areas) used propane, Corona used data from the Energy Information
Administration to calculate the relative cost of using propane for energy instead of natural gas, based on the
actual energy output for each fuel in BTU’s and the 2012 average cost for each fuel in Colorado. After
determining this “conversion factor,” the cost of propane service for each school district without natural gas
service was computed by averaging the natural gas bills of the surrounding districts and inflating that average
based on the analysis described above.
Utilities - Telephone
In order to calculate the average monthly telephone bill for residents around the state, Corona obtained
the most current telephone rates from the Public Utilities Commission. This dataset detailed the monthly
base rates being charged by each incumbent local exchange carrier (ILEC) around the state. The methodology
used to calculate the average monthly telephone bill within each school district mirrored the methodology
described for electricity providers. The monthly base rates were assigned to each of the school districts based
on the providers’ coverage areas. In addition to the base rates found in each school district, a variety of other
fees (unique to each area and provider) were incorporated into the final total monthly telephone bill for an
area (and ultimately school district). Final monthly telephone rates were calculated for each district depending
on the service providers in a district’s area and the fees attached to those providers operating within a specific
school district.
Utilities – Water/Wastewater
In order to determine the average monthly payments for water and wastewater bills in each school
district, Corona Insights conducted a telephone survey of over 250 cities throughout the state of Colorado in
order to collect water/wastewater rate information for municipalities located within Colorado’s school
districts. Corona also gathered water/wastewater rate information from provider/city websites where
available. An attempt was made to collect data from each of the 258 agencies contacted in previous studies,
but in certain municipalities or areas where no contact information could be found, or in towns that used only
wells or septic tanks, proxy values were used based on the rates charged in another town in the same school
district. In some cases where this method was not applicable, proxy values were used based on the rates
charged in another school district in the same county or those charged in the nearest town. Once all
water/wastewater rate information was collected, final district averages were calculated and weighted based
on the total populations of cities and municipalities located within a school district.
Household Operations – Day Care
The average cost of child day care for the 2013 Cost of Living study was based on day care costs in each
county in Colorado. Average day care cost information was obtained from the 2013 Market Rate Survey of
Child Care Providers, conducted by Qualistar Colorado. The Market Rate Survey of Child Care Providers
provides full-time weekly rates of caring for children between 0 and 12 months, 1 to 2 years, and between 2
to 5 years in all 64 Colorado counties.
In determining the average weekly costs for childcare services, an average rate was calculated for each age
group across child care centers (CCC’s), family care centers (FCC’s). The averages were then weighted based
on the proportion of children in day care in each age group obtained from the Department of Health and
Human Services data on children participating in CCDF-funded programs. Final district average day care

Page 23
costs were then reallocated from the county level to the final district level using a weighted average method to
aggregate based on the population of the counties in each district.
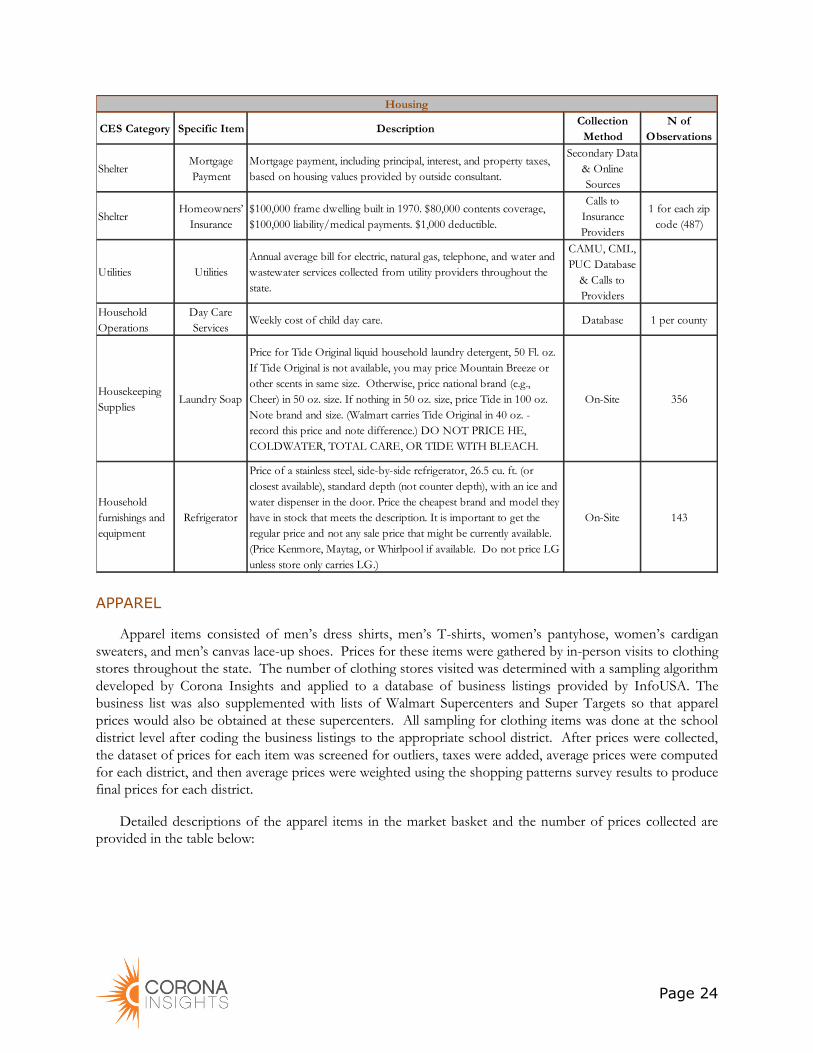
Housekeeping Supplies – Laundry Soap
Expenditures for housekeeping supplies were gathered by collecting prices for laundry soap. Prices were
gathered by in-person visits to grocery stores throughout the state. Laundry soap was treated as a grocery
item and so the stores sampled were the grocery stores selected by the food at home sampling, as well as
discount department stores like Target and Walmart. After prices were collected, the dataset of prices for
each item was screened for outliers, taxes were added, average prices were computed for each district, and
then average prices were weighted using the shopping patterns survey to produce final prices for each district.
A detailed description of the housekeeping supplies item in the market basket and the number of prices
collected are provided in the table at the end of this section (below).
Household Furnishings and Equipment - Refrigerator
Expenditures for household furnishings were gathered by collecting prices for refrigerators. Prices were
gathered by in-person visits to department stores, home stores, and electronics stores throughout the state.
After prices were collected, the dataset of prices for each item was screened for outliers, taxes were added,
average prices were computed for each district, and then average prices were weighted using the shopping
patterns survey to produce final prices for each district.
A detailed description of the household furnishings item in the market basket and the number of prices
collected are provided in the table at the end of this section (below).
Page 24
APPAREL
Apparel items consisted of men’s dress shirts, men’s T-shirts, women’s pantyhose, women’s cardigan
sweaters, and men’s canvas lace-up shoes. Prices for these items were gathered by in-person visits to clothing
stores throughout the state. The number of clothing stores visited was determined with a sampling algorithm
developed by Corona Insights and applied to a database of business listings provided by InfoUSA. The
business list was also supplemented with lists of Walmart Supercenters and Super Targets so that apparel
prices would also be obtained at these supercenters. All sampling for clothing items was done at the school
district level after coding the business listings to the appropriate school district. After prices were collected,
the dataset of prices for each item was screened for outliers, taxes were added, average prices were computed
for each district, and then average prices were weighted using the shopping patterns survey results to produce
final prices for each district.
Detailed descriptions of the apparel items in the market basket and the number of prices collected are
provided in the table below:
CES Category Specific Item DescriptionCollection
Method
N of
Observations
ShelterMortgage
Payment
Mortgage payment, including principal, interest, and property taxes,
based on housing values provided by outside consultant.
Secondary Data
& Online
Sources
ShelterHomeowners’
Insurance
$100,000 frame dwelling built in 1970. $80,000 contents coverage,
$100,000 liability/medical payments. $1,000 deductible.
Calls to
Insurance
Providers
1 for each zip
code (487)
Utilities Utilities
Annual average bill for electric, natural gas, telephone, and water and
wastewater services collected from utility providers throughout the
state.
CAMU, CML,
PUC Database
& Calls to
Providers
Household
Operations
Day Care
ServicesWeekly cost of child day care. Database 1 per county
Housekeeping
SuppliesLaundry Soap
Price for Tide Original liquid household laundry detergent, 50 Fl. oz.
If Tide Original is not available, you may price Mountain Breeze or
other scents in same size. Otherwise, price national brand (e.g.,
Cheer) in 50 oz. size. If nothing in 50 oz. size, price Tide in 100 oz.
Note brand and size. (Walmart carries Tide Original in 40 oz. -
record this price and note difference.) DO NOT PRICE HE,
COLDWATER, TOTAL CARE, OR TIDE WITH BLEACH.
On-Site 356
Household
furnishings and
equipment
Refrigerator
Price of a stainless steel, side-by-side refrigerator, 26.5 cu. ft. (or
closest available), standard depth (not counter depth), with an ice and
water dispenser in the door. Price the cheapest brand and model they
have in stock that meets the description. It is important to get the
regular price and not any sale price that might be currently available.
(Price Kenmore, Maytag, or Whirlpool if available. Do not price LG
unless store only carries LG.)
On-Site 143
Housing

Page 25
TRANSPORTATION
Vehicle Financing
Vehicle financing estimates were derived by contacting lending institutions in all possible districts and
gathering data on finance rates and fees for a four-year loan for a 2011 Honda Civic LX Sedan. The Corona
Insights team then calculated a monthly payment that included the purchase price, sales tax, loan charges, and
any applicable taxes, title fees, or registration fees.
Vehicle insurance
Insurance companies with a large market share for vehicle insurance in Colorado were determined by
analyzing the 2012 “Annual Report of the Commissioner of Insurance”. Companies with the largest market
share were then contacted to determine vehicle insurance rates by zip code. Corona was able to obtain vehicle
insurance data (by zip code, for the entire state) from one willing insurance company. That insurance
company had a large portion of the market share in Colorado (the company’s name will not be released, in
order to ensure pricing confidentiality of the company).
Insurance rates were gathered and averaged for the two vehicles types used throughout the study (a 2011
Honda Civic and a 2009 Ford F-150) at the zip code level and the reassigned to the proper school district (in
order to determine final vehicle insurance costs per district).
Vehicle expenses – Oil Change & Front-End Alignment
Vehicle maintenance expense items consisted of oil changes and front-end alignments. Prices for these
items were gathered by phone calls to auto repair shops throughout the state. The number of shops to
CES Category Specific Item DescriptionCollection
Method
N of
Observations
Men and BoysMen’s Dress
Shirt
Price for white or solid color Oxford (button-down collar), long
sleeve, button cuff shirt. Arrow brand where possible, poly/cotton
blend. If store does not have Arrow, price comparable label that
meets the same criteria. Try to get prices for shirts sized 15/32
through 16/34.
On-Site 216
Men and Boys Men’s T-Shirt
Price for one 3-pack of men’s white t-shirts, v-neck. Hanes brand
where possible, Fruit of the Loom or Jockey, otherwise, 100%
cotton. Must be in a 3-pack.
On-Site 250
Women and
Girls
Women's
Pantyhose
Price of Legg Sheer Energy pantyhose, with control top and sheer
toe design, size M. If not available, price the most similar type Legg
pantyhose. If Legg pantyhose is not available, price the most similar
available brand of pantyhose. Note brand and features.
On-Site 347
Women and
Girls
Women's
Cardigan
Sweater
Price a women's solid color, long-sleeved v-neck, button front
cardigan sweater, size M. 100% cotton or cotton/poly (or
rayon/poly) blend. Price Old Navy brand, where available; at Target,
price Mossimo brand; at Walmart, price Bella Bird brand; at JC
Penny’s price Worthington brand; at Sears price Route 66. Note if
other brand. DO NOT PRICE CASHMERE OR OTHER
WOOL.
On-Site 204
FootwearMen's Canvas
Lace-up Shoe
Price a men's canvas lace-up sneaker, flat bottom (no arch), with
molded or ridged tread, size 9 - 11. Price the lowest priced men's
canvas shoe that meets the described criteria.
On-Site 264
Apparel

Page 26
sample was determined with a sampling algorithm developed by Corona Insights which was applied to a
database of business listings provided by InfoUSA. In areas where the list of businesses was insufficient,
online yellow pages were utilized to create a more robust list of vehicle maintenance businesses. All sampling
for vehicle maintenance items was done at the school district level after coding the business listings to the
appropriate district. After prices were collected, the dataset of prices for each item was screened for outliers,
taxes were added where applicable, average prices were computed for each district, and then average prices
were weighted using the shopping patterns survey results to produce final prices for each district.
Detailed descriptions of the vehicle maintenance items in the market basket and the number of prices
collected are provided at the end of this section.
Gasoline
Gasoline prices were gathered on a single day via telephone calls to gas stations across the state. The
number of shops to sample was determined with a sampling algorithm developed by Corona Insights which
was applied to a database of business listings provided by InfoUSA. In areas where the list of gas stations was
insufficient, online yellow pages were utilized to create a more robust list of gas stations. All sampling for
gasoline prices was done at the school district level after coding the business listings to the appropriate
district. After prices were collected, the dataset of prices for each item was screened for outliers, average
prices were computed for each district, and then average prices were weighted using the shopping patterns
survey results to produce final prices for each district.
Detailed descriptions of the transportation items in the market basket and the number of prices collected
are provided in the table below:
HEALTH CARE – HEALTH INSURANCE MONTHLY PREMIUM
In order to determine the average monthly health insurance premium rate in each school district, Corona
Insights collected rate information from four of the largest health insurance providers in the state. Data was
collected for PPO’s from three of the companies, and an HMO from the remaining provider. Rates for the
CES Category Specific Item DescriptionCollection
Method
N of
Observations
TransportationVehicle
Payment
Payment calculated using Blue Book purchase value and interest rate
on loan for full purchase price and bank charges, taxes and
registration fees for 2011 Honda Civic for four years. (2011 Honda
Civic LX Sedan, 4-door. Engine: 4-cyl. 1.8L. Trans: 5-speed manual.
Mileage: 24,000. Amenities: air conditioning, pwr. steering, cruise
control, air bags)
Online
(Bluebook
Values & Other
Sources)
Phone
388
TransportationVehicle
Insurance
Insurance premiums for 2009 Ford F150 and 2011 Honda Civic
(2009 Ford F150 XL 6.5 ft. Bed Pickup. Engine: V6 4.6L Trans:
automatic, Drive: 2-wheel drive. Mileage: 60,000. Amenities: A/C,
pwr. steering, air bags standard)
Phone Calls to
Insurance
Providers
2 for each zip
code (974)
TransportationOil and Filter
Change
Price of an oil and filter change for a 2009 Ford F150 pickup. Oil
must not be synthetic; filter should be the least expensive available.
DO NOT PRICE WITH TAX.
Phone 434
TransportationFront-End
Alignment
Price of front-end alignment for a 2009 Ford F150 pickup; 2 wheel
drive.Phone 277
Transportation Gasoline Price of self-serve, 85 Octane, unleaded gasoline.Phone
(one-day)450
Transportation

Page 27
two most popular plans for each of the four participating companies were obtained. Heath insurance monthly
premium rates were collected by zip code and/or county (depending on the provider) and weighted averages
were created for each health care company (based on market share). Finally, district average rates were
calculated by taking a weighted average of the county rates by population within the district.
Note. Final monthly health care costs were assessed with the assumption that monthly costs were for a
family of three non-smokers who were all in good health. Criteria are detailed in the table below:
ENTERTAINMENT
Entertainment items consisted of movie tickets, a television, batteries, and pet food. Prices for movie
tickets were gathered by phone calls to movie theaters throughout the state. Prices for the television,
batteries, and pet food were gathered by in-person visits to grocery and electronics stores throughout the
state. The number of stores visited was determined with a sampling algorithm developed by Corona Insights
that was applied to a database of business listings provided by InfoUSA. The business list was also
supplemented with lists of Walmart Supercenters and Super Targets so that entertainment item prices would
also be obtained at these supercenters. All sampling for entertainment items was done at the school district
level after coding the business listings to the appropriate school district. After prices were collected, the
dataset was screened for outliers, taxes were added where applicable, average prices were computed for each
district, and then average prices were weighted using the shopping patterns survey results to produce final
prices for each district.
Detailed descriptions of the entertainment items in the market basket and the number of prices collected
are provided in the table below:
CES Category Specific Item DescriptionCollection
Method
N of
Observations
Health Care
Health
Insurance
Premium
Monthly cost of family health insurance coverage for a family of
three, all non-smokers, all in good health.
Phone &
Database6-8 per county
Health Care
CES Category Specific Item DescriptionCollection
Method
N of
Observations
Fees and
AdmissionsMovie Price of adult admission to a first-run, full-length movie. Phone 69
Television,
Radios, Sound
Equipment
TV
Price of a 32" flat screen, LED TV: 720p, 60Hz HDTV. Samsung
brand. If not available, LG brand, then Sony, then Panasonic. If
exact options are not available, then price 120Hz (32”, LED, 720p).
If no 32” then price next largest TV with same specs. Note brand
and any differences in size or features. Do not price Plasma, LCD,
or 3D models.
On-Site 141
Other supplies,
equipment, and
services
Batteries
4 Pack AA Batteries. Energizer brand; if not available then Duracell,
otherwise cheapest 4 pack of AA. DO NOT PRICE LITHIUM
BATTERIES. DO NOT PRICE RECHARGEABLES.
On-Site 446
Pets, Toys, and
Playground
Equipment
Pet Food
Price for a 5.5 oz. can of Friskies Classic cat food. If Friskies not
available, price of 9 Lives or Whiskas. Note brand and size. DO
NOT PRICE MULTI PACKS.
On-Site 574
Entertainment

Page 28
PERSONAL CARE PRODUCTS AND SERVICES
Personal care items consisted of haircuts, shaving cream, toothpaste, and tampons. Prices for men’s and
women’s haircuts were gathered by phone calls to beauty and barber shops throughout the state. Prices for
shaving cream, toothpaste, and tampons were gathered by in-person visits to grocery stores and drug stores
throughout the state. The number of stores visited was determined with a sampling algorithm developed by
Corona Insights that was applied to a database of business listings provided by InfoUSA. The business list
was also supplemented with lists of Walmart Supercenters and Super Targets so that personal care product
prices would also be obtained at these supercenters. All sampling for personal care items was done at the
school district level after coding the business listings to the appropriate school district. After prices were
collected, the dataset of prices for each item was screened for outliers, taxes were added where applicable,
average prices were computed for each district, and then average prices were weighted using the shopping
patterns survey results to produce final prices for each district.
Detailed descriptions of the personal care items in the market basket and the number of prices collected
are provided in the table below:
TOBACCO
Tobacco and smoking expenditures were represented by a carton of cigarettes. Prices for cigarettes were
gathered by in-person visits to grocery stores throughout the state. The number of stores visited was
determined with a sampling algorithm developed by Corona Insights that was applied to a database of
business listings provided by InfoUSA. The business list was also supplemented with lists of Walmart
Supercenters and Super Targets so that tobacco prices would also be obtained at these supercenters. All
sampling for tobacco items was done at the school district level after coding the business listings to the
appropriate school district. After prices were collected, the dataset of prices for each item was screened for
outliers, taxes were added, average prices were computed for each district, and then average prices were
weighted using the shopping patterns survey results to produce final prices for each district.
A detailed description of the tobacco item in the market basket and the number of prices collected are
provided in the table below:
CES Category Specific Item DescriptionCollection
Method
N of
Observations
Pesonal Care
ServicesMan's Haircut Price of man's wash, cut and dry. Phone 493
Pesonal Care
Services
Woman's
HaircutPrice of woman's wash, cut and dry. Phone 477
Personal Care
ProductsShaving Cream
Price of Barbasol regular shaving cream 10.0 oz. If Barbasol not
available, price Gillette Regular Foamy, 11.0 oz. If neither, go to
other sizes of Barbasol, then Gillette before going to next similar
brand. Note brand and size.
On-Site 452
Personal Care
ProductsToothpaste
Price of Crest Regular Paste Tartar Protection 6.4 oz. If Crest not
available, get Colgate 6.4 ounces. Note brand and size. DO NOT
PRICE CREST PRO-HEALTH, WHITENING, WITH SCOPE,
OR OTHER VARIETIES.
On-Site 391
Personal Care
ProductsTampons
Price for one box of Tampax Regular Absorbency, 20 ct. Note if
different size box. DO NOT PRICE SLENDER STYLE OR
PEARL.
On-Site 299
Personal Care Products and Services

Page 29
READING, EDUCATION, AND MISCELLANEOUS EXPENSES
The major expenditure categories for Reading, Education, Miscellaneous Expenses, Cash Contributions,
and Personal Insurance and Pensions were considered to be constant for the relevant benchmark household
and were not sampled in this 2013 Cost of Living study. These categories have been held constant throughout
all previous Cost of Living studies. No geographical variations are expected for these across the state of
Colorado, so all districts receive the same average costs for each of these categories.
PERSONAL (INCOME) TAXES
Income taxes for the benchmark family are calculated for each district itemizing deductions for mortgage
interest and property taxes as well as ownership taxes on the vehicles.
DEVELOPING FINAL COST OF LIVING MEASURES
After the collection of all pricing data and shopping patterns data, two major steps were taken to develop
the final cost of living measures. First, the price data for the market basket items was integrated with the
shopping patterns model in order to develop prices for each district that reflect where people in the district
purchase their items. Second, annual expenditures are calculated by determining the ratio of the district
average price to the statewide average price for each good and then multiplying by the typical expenditure on
that item according to the Consumer Expenditure Survey. This second step scales up costs so that the
limited numbers of (for example) grocery items for which data are collected represent the full expenditures
for food for the benchmark household. Each of these steps is described in further detail below.
INTEGRATE PRICE DATA WITH SHOPPING PATTERNS SURVEY
As previously described, people do not make all of their purchases in the school district in which they
live. The shopping patterns survey gathered data which examined where people shop for 12 categories of
items and services: produce, perishable groceries, non-perishable groceries, alcoholic beverages, household
products, clothing and shoes, gas, car maintenance and repair, furniture and appliances, TVs, and where they
go for haircuts and restaurant meals. For each of these items, Corona Insights developed matrices that
specify where people living in each district shop for each item, based on the proportional location of surveyed
shoppers’ most recent purchases. For example, people who live in the Denver County school district may
buy gasoline in not only Denver but also neighboring school districts such as Adams-Arapahoe, Boulder
Valley, Brighton, Cherry Creek, Jefferson County, and others. By multiplying the shopping patterns matrices
that link “home district” with “shopping districts”, regional variations in costs and shopping preferences are
reflected.
CALCULATE ANNUAL EXPENDITURES
Calculating the annual expenditures for each district involved determining the district average price for
each item, weighting that price by the proportion of teachers in the district to calculate a state average price,
CES Category Specific Item DescriptionCollection
Method
N of
Observations
Tobacco CigarettesPrice for one carton (200 cigarettes) of Marlboro Filter, hard pack,
flip-top cigarettes. If Marlboro is not available,price Camel cigarettes.On-Site 705
Tobacco Products/Smoking Supplies

Page 30
calculating the ratio of the district average price to the state average price, and then multiplying that ratio by
the typical expenditures in a category according to the Consumer Expenditure Survey. These steps are
elaborated below.
Mirroring the methodology used since the 2007 cost of living study, the majority of the market basket
items were sampled by school district in 2013. This helped to ensure that all final cost of living data was
specific to an exact school district. In a few cases, the data was only available at a county or region level, and
needed to be applied to districts based on location. Utilities prices, day care prices, and insurance prices are a
few of the cases where data was available at the county or region level and had to be applied to districts. In
these cases, the county (or other) price was assigned to each district located in that county in order to arrive at
a price for each district.
Statewide average prices were then calculated by weighting the average price in each district by the
proportion of the state’s teachers in that district and then adding together the weighted prices for all districts.
District average prices were then compared to state average prices by calculating the ratio of the district
average price to the state average price. These ratios were then multiplied by the typical expenditure for the
category according to the Consumer Expenditure Survey in order to determine a final annual expenditure on
that item for each district.
This process was conducted for each market basket item, and then all of the expenditures on items in a
common category were added to determine annual expenditures for that category (i.e., categories include food
at home, food away from home, housing, transportation, etc.). Finally, annual expenditures in each category
were combined to provide total annual expenditures for each district.
CALCULATE CONFIDENCE INTERVALS
Confidence intervals were also calculated for most expenditure categories to estimate the uncertainty in
the prices available to consumers in each district. For each district sampled, the variance of the mean (i.e.,
standard error), was calculated for the prices obtained from that district. These variances were weighted by
the shopping patterns for each district and the teacher populations to calculate a state average variance, and
then ratio variances were calculated by comparing the variance for a district to the state average variance.
Ratio variances were aggregated over items in a category and a confidence interval was calculated for the
category as a whole. Details of the statistical methods involved are provided in Appendix E.
Essentially, large confidence intervals reflect a large variance of the mean, which means there is a large
variability in the prices collected and relatively few prices collected. In some cases, variability in the error may
be reduced by additional sampling in those districts; however, this is only likely to be true in large districts
where the universe of stores available to sample from is large. In, for example, a small, rural district with only
one substantial grocery store, where a convenience store has also been sampled, the variance of the mean will
be large, but sampling additional convenience stores (if even any are available) is likely to only artificially
inflate the mean price for the district, because convenience stores tend to charge higher prices than grocery
stores. In cases like this there is a tradeoff between reducing error variability and accurately estimating the
cost of living in a district. Whether additional sampling is needed should be evaluated on a case by case basis.
It should be noted that other factors in addition to the variability of the mean district price will affect
uncertainty in the cost of living indices, but currently no additional factors are incorporated in the confidence
interval estimates.
See Appendix E for a more detailed discussion of statistical measures used in this study.
Page 31
APPENDIX A: DETAILED RESULTS
Appendix A provides an additional level of detail about the results of the study, breaking out costs of
living in each district by major expenditure category.
Results are provided both in visual form, through maps provided in this section, and in tabular form in
an accompanying spreadsheet. Readers receiving this report electronically will need to review an
accompanying spreadsheet file, due to the volume of data.
Maps are provided for the six largest expenditure categories: 1) housing, 2) transportation, 3) food, 4)
healthcare, 5) entertainment, and 6) apparel.
Expenditure Category % of Income
Food 13.59%
Alcoholic beverages 0.65%
Housing 33.77%
Apparel and services 3.30%
Transportation 19.25%
Healthcare 7.34%
Entertainment 4.45%
Personal care products and services 1.11%
Tobacco 1.22%
Personal taxes 1.49%
Other 13.83%
Total 100.00%
Consumer Expenditure Survey Categories and
Specific Weights Utilized in Cost of Living Index
(Weight as a percentage of income)
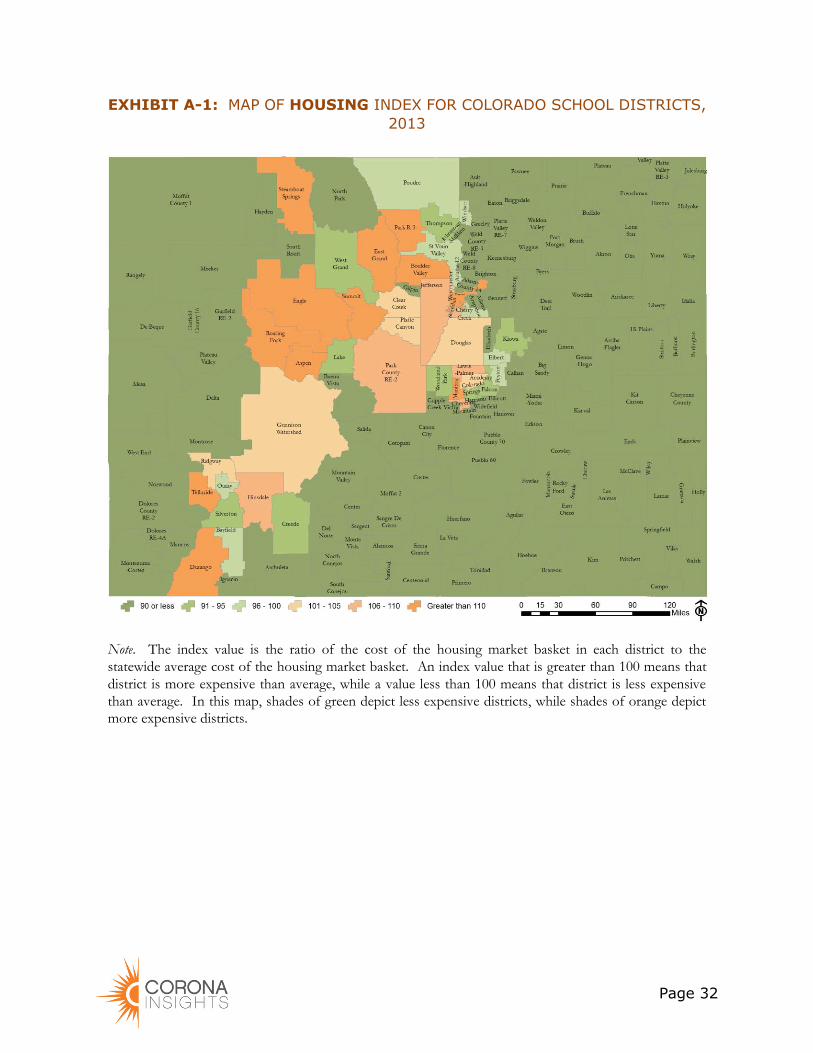
Page 32
EXHIBIT A-1: MAP OF HOUSING INDEX FOR COLORADO SCHOOL DISTRICTS,
2013
Note. The index value is the ratio of the cost of the housing market basket in each district to the
statewide average cost of the housing market basket. An index value that is greater than 100 means that
district is more expensive than average, while a value less than 100 means that district is less expensive
than average. In this map, shades of green depict less expensive districts, while shades of orange depict
more expensive districts.

Page 33
EXHIBIT A-2: MAP OF TRANSPORTATION INDEX FOR COLORADO SCHOOL
DISTRICTS, 2013
Note. The index value is the ratio of the cost of the transportation market basket in each district to the
statewide average cost of the transportation market basket. An index value that is greater than 100 means
that district is more expensive than average, while a value less than 100 means that district is less
expensive than average. In this map, shades of green depict less expensive districts, while shades of
orange depict more expensive districts.

Page 34
EXHIBIT A-3: MAP OF FOOD INDEX FOR COLORADO SCHOOL DISTRICTS, 2013
Note. The index value is the ratio of the cost of the food market basket in each district to the statewide
average cost of the food market basket. An index value that is greater than 100 means that district is
more expensive than average, while a value less than 100 means that district is less expensive than
average. In this map, shades of green depict less expensive districts, while shades of orange depict more
expensive districts.

Page 35
EXHIBIT A-4: MAP OF HEALTHCARE INDEX FOR COLORADO SCHOOL
DISTRICTS, 2013
Note. The index value is the ratio of the cost of the healthcare market basket in each district to the
statewide average cost of the healthcare market basket. An index value that is greater than 100 means
that district is more expensive than average, while a value less than 100 means that district is less
expensive than average. In this map, shades of green depict less expensive districts, while shades of
orange depict more expensive districts.

Page 36
EXHIBIT A-5: MAP OF ENTERTAINMENT INDEX FOR COLORADO SCHOOL
DISTRICTS, 2013
Note. The index value is the ratio of the cost of the entertainment market basket in each district to the
statewide average cost of the entertainment market basket. An index value that is greater than 100 means
that district is more expensive than average, while a value less than 100 means that district is less
expensive than average. In this map, shades of green depict less expensive districts, while shades of
orange depict more expensive districts.

Page 37
EXHIBIT A-6: MAP OF APPAREL INDEX FOR COLORADO SCHOOL DISTRICTS,
2013
Note. The index value is the ratio of the cost of the apparel market basket in each district to the statewide
average cost of the apparel market basket. An index value that is greater than 100 means that district is
more expensive than average, while a value less than 100 means that district is less expensive than
average. In this map, shades of green depict less expensive districts, while shades of orange depict more
expensive districts.

Page 38
APPENDIX B: DETAILED METHODOLOGICAL
DISCUSSION – DATA COLLECTION
In Section 4 of the report, a methodological overview is provided regarding the data collection methods
for each major expenditure category, and for the development of geographic shopping patterns matrices.
Appendix B provides additional detail on those topics for the interested reader.
In the bulk of this appendix, data collection techniques are expanded upon. Notable sampling techniques,
data collection procedures and weighting techniques are expanded upon for each major expenditure category.
Reporting Note: Where sampling, data collection, and weighting techniques were identical between expenditure
categories, these techniques will not be repeated in each write-up in order to reduce redundancy. To facilitate
this, we have grouped items based on the methodology used to collect data those items.
FIELD DATA COLLECTION
Training Note: A Corona principal who has been involved in past data collections for this project served as the
field research manager and was in charge of training and overseeing the staff. Corona recruited temporary
contractors to perform the data collection. These contractors were hired in the region they would be
working; this helped facilitate local knowledge of communities and stores, and helped manage travel costs for
the project. All hires were screened, interviewed, and background checked prior to employment. Data
collectors were paid hourly, plus expenses. To encourage efficient and quality work, an incentive structure
was set up based on timely work, accurate price collection, and accurate data entry.
When initially hired, Corona provided an overview and training guide for data collectors to review prior to
training, as well as to have with them while doing data collection. Corona then conducted a two-hour
training with all data collectors in each region, including in-store training. Training time was focused on the
importance of collecting data in the exact same manner across the state, including a thorough review of the
market basket and substitutions, following the sampling plan of stores, how to record prices, and how to
enter data. The research manager and other Corona staff were available for questions by telephone during
the entire data collection period. The research managers also made periodic check-in calls with the data
collectors to answer questions and monitor progress. Data were recorded on paper, then entered online.
Corona retained the paper data sheets and did random data quality checks on each data collector. In the
Denver metro area, some data collectors were given iPads to enter data directly online.
Most of the field data collection was completed in a two-week period. In the first week, the field research
manager drove around the state conducting trainings at each location. Data collectors had one week to
complete their districts, and then the field research manager made a second loop around the state to follow-
up with data collectors at each location, collect materials, and so on. While in the field, the field research
manager conducted random data checks to ensure the right stores were visited and correct prices were
collected. Some Front Range metro districts require more than one week of data collection because of the
number of stores to be visited, but data collectors in those regions came to Corona’s Denver office for
trainings and debriefings.

Page 39
FOOD AT HOME
All Food At Home item prices were collected in-person throughout each of the 178 school districts in
Colorado. Business listings for grocery stores in Colorado were collected from the InfoUSA database. This
list was supplemented with a complete list of Walmart Supercenters and Super Target locations to ensure that
food prices were collected at these stores. Corona labeled each of the businesses with the school district it is
located in using arc-GIS software. Then a sampling plan was developed based on the number of businesses in
each school district, which resulted in a goal of sampling the larger of five (businesses) or five percent of
businesses in each district. Corona attempted to sample all businesses from districts with fewer than five
stores in a given category. In metro area districts with large numbers of businesses in each category, the
businesses to be sampled were chosen based on store revenues provided by InfoUSA. The total revenue for
a district was divided by the number of stores to be sampled from that district (n), then stores were rank-
ordered by their revenue values and one store was chosen from each n-tile of the distribution.
Field research was then conducted by data collectors who visited each district and attempted to collect
prices from the number of stores identified by the sampling plan. Gathering prices at gas stations or
convenience stores was to be avoided unless no other businesses could be identified in a district. All data that
was collected by the data collection team was uploaded to a final database with market basket prices for all
goods and for all districts. The database was checked for outliers by identifying prices that were outside three
standard deviations from the mean for their region (using regions from the shopping patterns survey to group
similar districts together). Grocery tax for each location was then added to each price, and an average price
was calculated for each district.
FOOD AWAY FROM HOME
All Food Away From Home item prices were collected in-person throughout the school districts.
Business listings for eating places in Colorado were collected from the InfoUSA database, and then Corona
mapped each business to a school district using arc-GIS software. The sampling plan for items in the Food
Away From Home Category was developed similarly to the Food At Home Category (see above). The main
difference between the sampling for the Food Away From Home Category was data collectors were asked to
obtain at least three different prices for each of the three different Food Away From Home items (that would
be three different prices in each district for cheeseburgers meals, pizza meals and steak meals). In Colorado
metro areas with a plethora of eating places, data collectors were instructed to obtain an increased number of
prices for each Food Away From Home item so that the overall sample for those districts would be more
representative of the overall eating places district population. Corona attempted to sample all businesses from
districts with fewer than three stores in a given category (cheeseburger, pizza or steak dining establishments).
Field data collection and training was conducted and entered with the same research method described in
the Food At Home Methodology section (see above). It should be noted that since 2009 prices have been
gathered at fast food restaurants, specifically for the cheeseburger meal. This methodological shift was made
in an effort to enhance the comparability of cheeseburger meals across all districts. All outliers for Food
Away From Home were analyzed and checked with the same method described in the Food At Home
Section (see above). Dining tax for each location was then added to each price, and an average price was
calculated for each district.
ALCOHOLIC BEVERAGES
All Alcoholic Beverage item prices (a six pack of beer) were collected in-person throughout the school
districts. Alcoholic Beverage prices and Food At Home items were collected at the same time and utilized the

Page 40
same methodology described in the Food At Home Methodology section (see above). Beer prices were
collected at all grocery stores where beer was sold. In districts where beer prices were not obtainable at
grocery stores (or if there were too few grocery stores available in a district), data collectors were instructed to
obtain beer prices at local convenience or liquor stores. It should be noted that business listings for liquor
stores in Colorado were collected from the InfoUSA database and added to the final data collector list of
stores to be sampled (data was collected primarily at liquor stores in districts that had fewer than five total
grocery stores to be sampled). Liquor stores were also geo-coded and labeled to the appropriate district using
arc-GIS.
After all data was collected, entered and outliers were analyzed and removed, sales tax was added to each
price, and an average price was calculated for each district.
HOUSING - HOUSEKEEPING SUPPLIES – LAUNDRY SOAP
All Housekeeping Supplies item prices were collected in-person across the school districts. Laundry soap
was used as the item to be collected for the Housekeeping Supplies Category. Laundry Soap prices were
collected at the same time and using the same sampling methodology described for the Food At Home
Methodology section (see above).
After all data was collected, entered and outliers were analyzed and removed, sales tax was added to each
price, and an average price was calculated for each district.
HOUSING - HOUSEHOLD FURNISHINGS AND EQUIPMENT – REFRIGERATOR
In 2011, a refrigerator was selected to represent the Household Furnishings and Equipment category, and
was retained in 2013. In 2013, refrigerator prices were collected in-person across the school districts.
Business listings for appliance stores in Colorado were collected from the InfoUSA database, and then
Corona labeled each by school district using arc-GIS software. Additional listings for appliance stores were
obtained from web sources to ensure that small-town appliance dealers (e.g., Sears Hometown Stores) were
represented. The sampling plan for refrigerators was developed similarly to the Food At Home
Methodology section (see above) in that the goal was to sample the larger of five (appliance businesses) or
five percent of appliance businesses in each district.
After all data was collected, entered and outliers were analyzed and removed, sales tax was added to each
price, and an average price was calculated for each district.
APPAREL
Apparel prices were collected in-person throughout the school districts. The apparel items to be collected
for the Apparel Category included Men’s dress shirts, Men’s T-shirts, Women’s pantyhose, Women’s cardigan
sweaters, and Men’s canvas lace-up shoes. Business listings for apparel business in Colorado were collected
from the InfoUSA database. The InfoUSA list was also supplemented with lists of Walmart Supercenters and
Super Targets so that apparel prices would also be obtained at these supercenters. Corona then geo-coded
and labeled each apparel store into the appropriate school district using arc-GIS software.
Similar to the sampling plan detailed in the Food At Home Methodology section (see above), the
sampling plan for apparel was based on the number of businesses in each school district, which resulted in a
goal of sampling the larger of five (apparel stores) or five percent of apparel stores in each district for each
apparel item. Corona attempted to sample all apparel stores from districts with fewer than five stores in a

Page 41
given category. Overall, in each district it was the minimum goal to obtain five different prices for each item,
but this was not possible in many districts which did not have five total apparel stores.
It should be noted that specific brands and types of clothing items were targeted for pricing for each
item, but often those specific brands would not be available within a given store. When this was the case, data
collectors were instructed to find brands and item types which most closely replicated the initial target brands.
After all data was collected, entered and outliers were analyzed and removed, sales tax was added to each
price, and an average price for each apparel item was calculated for each district.
ENTERTAINMENT – TELEVISION SET
The market basket good for Television, Radios and Sound Equipment was a television that would be
commonly available across stores and across districts. Television prices were collected in-person throughout
all of the districts.
Business listings for electronics and home appliance stores in Colorado were collected from the InfoUSA
database, and online yellow pages information was used to supplement those lists when additional electronics
stores were needed to sample in a specific district. Each electronic store was then geo-coded and labeled into
the appropriate school district using arc-GIS software.
Similar to the sampling plan detailed in the Food At Home Methodology section (see above), Corona
attempted to sample the larger of five (electronics stores) or five percent of all electronics stores in each
district. Ultimately, many of the smaller (mostly rural) districts often did not have electronics stores, and in
those districts data collectors would do their best to obtain at least one price per district. In several districts,
there were no TV prices to be obtained (due to a general shortage of available stores selling TVs in that
district).
After all data was collected, entered and outliers were analyzed and removed, sales tax was added to each
price, and an average price was calculated for each district.
ENTERTAINMENT – BATTERIES
All battery prices were obtained in-person at the same time grocery prices were collected. Therefore, the
sampling, data collection and analysis plan for batteries is exactly the same as described in the Food At
Home Methodology section (see above).
After all data was collected, entered and outliers were analyzed and removed, sales tax was added to each
price, and an average price was calculated for each district.
ENTERTAINMENT – PET FOOD
All pet food prices were sampled in-person at the same time grocery prices were collected. Therefore, the
sampling, data collection and analysis plan for pet food is exactly the same as described in the Food At
Home Methodology section (see above). Cat food was the specific item priced for pet food.
After all data was collected, entered and outliers were analyzed and removed, sales tax was added to each
price, and an average price was calculated for each district.

Page 42
PERSONAL CARE PRODUCTS - SHAVING CREAM, TOOTHPASTE, TAMPONS
All personal care product prices such as shaving cream, toothpaste and tampons were sampled in-person
at the same time grocery prices were collected. Therefore, the sampling, data collection and analysis plan for
shaving cream, toothpaste, and tampons is exactly the same as described in the Food At Home
Methodology section (see above).
After all data was collected, entered and outliers were analyzed and removed, sales tax was added to each
price for each personal care product, and an average price was calculated for each district for each of the
three products in this category.
TOBACCO
Cigarette prices were sampled in-person at the same time grocery prices were collected. Therefore, the
sampling, data collection and analysis plan for cigarette prices is exactly the same as described in the Food At
Home Methodology section (see above). An attempt was made to obtain cigarette prices at all grocery
stores that were visited by data collectors. Similar to the sampling approach used for beer prices, data
collectors were instructed to obtain cigarette prices at local convenience or liquor stores in districts where
cigarette prices were not obtainable at grocery stores (or if there were too few grocery stores available in a
district).
It should be noted that business listings for liquor stores in Colorado were collected from the InfoUSA
database and added to the final data collector list of stores to be sampled for cigarettes (cigarette data was
collected primarily at liquor stores in districts that had fewer than five total grocery stores to be sampled).
Liquor stores were also geo-coded and labeled to the appropriate district using arc-GIS. The InfoUSA list was
also supplemented with lists of Walmart Supercenters and Super Targets so that cigarette prices would also be
obtained at these supercenters.
After all data was collected, entered and outliers were analyzed and removed, sales tax was added to each
price, and an average price was calculated for each district.
DATA COLLECTION BY PHONE
TRANSPORTATION – OIL AND FILTER CHANGE
Oil change prices were collected by telephone for every district. Business listings for automobile
maintenance and repair shops in Colorado were collected from the InfoUSA database, and online yellow
pages information was used to supplement those lists when additional automobile maintenance shops were
needed to sample in a specific district. Each gas station was then geo-coded and labeled into the appropriate
school district using arc-GIS software. The oil change prices obtained were for a 2009 Ford F-150 (see the
Transportation table in Section 4).
Similar to the sampling plan detailed in the Food At Home Methodology section (see above), Corona
attempted to sample the larger of five (auto maintenance shops) or five percent of all auto maintenance shops
in each district. Ultimately, in many of the smaller (mostly rural) districts where fewer automotive
maintenance and repair shops existed, an attempt to obtain oil change prices was made at any (and all)
maintenance shops available in the district.

Page 43
After all data was collected, entered and outliers were analyzed and removed, sales tax was added to each
price, and an average price was calculated for each district. It should be noted that sales tax was only applied
to the parts of an oil change, and this was standardized across all oil change prices to reflect approximately 40
percent of the total oil change price. Therefore, 40 percent of all final oil change prices were taxed with the
local sales tax, and the remaining 60 percent was left untaxed.
TRANSPORTATION – FRONT-END ALIGNMENT
Front-end alignment prices were collected at the same time and with the exact same methodology as oil
change prices (see Oil Change Methodology, above). After all data was collected, entered and outliers were
analyzed and removed, an average price was calculated for each district. It should be noted that no tax was
applied to front-end alignment prices, because it is considered a service that is not taxed.
TRANSPORTATION – GASOLINE
Gasoline prices were gathered on a single day via telephone calls to gas stations across the state. All gas
prices had to be obtained on the same day due to the relative instability of gas prices on a national and
regional level. Unleaded grade 85 octane gasoline was priced for the category. Business listings for gas stations
in Colorado were collected from the InfoUSA database. Each gas station was then geo-coded and labeled into
the appropriate school district using arc-GIS software.
Similar to the sampling plan detailed in the Food At Home Methodology section (see above), the
sampling plan for gas stations was based on the number of businesses in each school district, which resulted
in a goal of sampling the larger of five (gas stations) or five percent of all gas stations in each district. Corona
attempted to sample all gas stations from districts with fewer than five stores in a given category, and an
attempt was made to obtain gas prices for each district (though some districts had no gas stations located in
their boundaries or the few gas stations that were in their boundaries would not divulge that information over
the phone).
After all data was collected, entered and outliers were analyzed and removed, an average price was
calculated for each district.
ENTERTAINMENT – MOVIE TICKET
Movie Ticket prices were collected by telephone for every district. Business listings for movie theaters in
Colorado were collected from the InfoUSA database, and online yellow pages information was used to
supplement those lists when additional movie theaters were needed to sample in a specific district. Each
movie theater was then geo-coded and labeled into the appropriate school district using arc-GIS software.
Data collectors were instructed to obtain the price of an adult admission ticket for each movie theater
sampled, and only movie theaters showing current release movies were sampled (no dollar movie theater
prices or dinner theater prices were used in the final district averages).
After all data was collected, entered and outliers were analyzed and removed, an average price for movie
tickets was calculated for each district. It should be noted that no tax was applied to movie theater prices
because it is not considered a taxable good.
Page 44
PERSONAL CARE PRODUCTS AND SERVICES – MEN’S & WOMEN’S HAIRCUTS
Both men’s and women’s haircut prices were collected by telephone for every district. Business listings
for beauty salons and barber shops in Colorado were collected from the InfoUSA database, and online yellow
pages information was used to supplement those lists when additional beauty salons/barber shops were
needed to sample in a specific district. Each beauty shop/barber shop was then geo-coded and labeled into
the appropriate school district using arc-GIS software.
Data collectors were instructed to ask for the price of full cut, wash and dry haircut. Each beauty
salon/barber shop were asked for the price of both women’s and men’s haircuts, but some stores only
offered either women’s or men’s cuts.
Corona attempted to sample the larger of five (beauty shops) or five percent of all beauty shops in each
district for both men’s and women’s haircuts. As seen in other market basket categories, many of the smaller
(mostly rural) districts often did not have as many beauty shops, and in those districts data collectors would
do their best to obtain at least one price per district.
After all data was collected, entered and outliers were analyzed and removed, an average price was
calculated for each district. No sales tax was applied to the final haircut prices, because haircuts are
considered a service and not a taxable good.
TRANSPORTATION – VEHICLE PAYMENTS
Vehicle financing rates and fees, which are one component of calculating vehicle payment costs, are
collected by telephone calls to banks and credit unions in every district. See additional detail in the “Vehicle
Payments” subsection under “Data Collection from Miscellaneous Database Sources.”
DATA COLLECTION FROM MISCELLANEOUS DATABASE
SOURCES
HOUSING – SHELTER – MORTGAGE PAYMENT/PROPERTY TAXES
Home values were provided to Corona Insights by the Colorado Legislative Council via a study by an
outside consultant, and they were based on a specified home size. This is the same approach used in previous
years. Corona Insights calculated an annual mortgage payment (principal and interest) based on a 30-year
fixed rate mortgage for 80 percent of the home value with the current mortgage interest rate for Colorado on
the day the home values were delivered to Corona Insights.
Owners of residential homes are subject to property tax on their dwelling. The entire value of the home
is not taxed; only the assessed value of the home can be taxed. The assessed value of a home is the actual
home value multiplied by an assessment percentage. This assessment percentage is the same for the entire
state of Colorado and is 9.13% for 2013. The assessed value of the home is then multiplied by the decimal
equivalent of the total mill levy. The total mill levy is the sum of the mill levies from the county, city, school
district, and any other special levies an area may have. To get the decimal equivalent of a mill levy, the levy is
multiplied by .001.
Mill levies are obtained from the 2012 annual report for the Department of Local Affairs. This report
was the most recent report available from the Division of Property Taxation. The report includes mill levies
for every county, city, school district, and any other applicable levy in the state of Colorado. The mill levies
Page 45
were summed by school district. The stated home price for each school district was multiplied by the
assessment percentage to get the assessed value. The assessed value was multiplied by the total of all
applicable mill levies for the district (county, school district, average municipal value in the county, and any
special levy). This value is the property tax. This process was repeated for all school districts.
HOUSING – SHELTER – HOMEOWNER’S INSURANCE
Insurance companies with a large market share for homeowners insurance in Colorado were determined
by analyzing the most recent Colorado Insurance Industry Statistical Report, obtained from the Colorado
Department of Regulatory Agencies (DORA), Division of Insurance. These companies were contacted to
determine homeowner’s insurance rates by zip code. In obtaining homeowner’s insurance rates, hazard
insurance was sought for a $100,000 frame dwelling built in 1970 with $80,000 contents coverage, $100,000
liability/medical payments, and a $1,000 deductible. These are the same specifications use in previous
studies.
The rates were provided to Corona Insights by zip code. The rates were averaged to the school district
level, then weighted by the home value for each district to obtain the final spending on insurance in each
district.
HOUSING – UTILITIES – ELECTRIC
We estimated an average monthly electric bill for each school district using data gathered in 2013 by the
Colorado Association of Municipal Utilities (CAMU). CAMU collects billing rates, based on 700-megawatt
usage, from every Colorado electric utility in January and July. These rates include tax equivalents, either the
exact PILOT (payment in lieu of taxes) or transfer to the municipal general fund, but do not include county
or municipal sales tax. We averaged the January and July rates to determine an average monthly billing rate for
each utility.
To assign an average monthly bill to each school district, we retrieved the Franchise-Log Workbook from
the Colorado Public Utility Commission website that listed the utility provider for about 300 municipalities.
We used a global information system (GIS) to overlay each of these municipalities onto one or more school
districts and to determine the proportion of the municipal population within each school district. Then we
assigned the previously calculated average monthly electric bill rate to each school district weighed by the
population proportion in that district. We also used GIS to match residents of municipalities that were not
listed in the Franchise-Log Workbook and unincorporated residents to their school district, and we used a
map from CAMU to match unincorporated areas to utility rates.
One possible limitation of this methodology is that the monthly electric bill is averaged across each
utility’s entire service area, but usage and rates are likely to vary across geographies. Further, some providers’
rates may fluctuate more than others throughout the year. Nonetheless, we believe this methodology
produced robust results given the available data.
HOUSING – UTILITIES – GAS
In order to calculate the average monthly natural gas bill for residents around the state, Corona used a
methodology very similar to that described for electric providers. We estimated an average monthly natural
gas bill for each school district using data gathered from annual reports filed with the Colorado Public Utility
Commission in 2012. These reports contain annual residential revenues and the number of residential
customers for each of the providers’ service areas. We used these data to calculate an average bill for each

Page 46
service area. To assign an average monthly natural gas bill to each school district, we employed the same
methodology that we used to assign electric rates (described above).
Residents within some school districts depend on propane (a type of liquid petroleum) for their heating
needs rather than natural gas. Indeed, no natural gas is available for residential use in some school districts.
While it is possible to gather information on propane prices around the state, propane providers do not have
an accurate measurement of the actual propane usage in their area. Trying to estimate the true cost of
propane service based on some estimated usage value, therefore, would likely be very inaccurate. Instead,
Corona used data from the Energy Information Administration to calculate the relative cost of using propane
for energy instead of natural gas, based on the actual energy output for each fuel in BTU’s and the 2012
average cost for propane in Colorado.
After determining this “conversion factor,” the cost of propane service for each school district without
natural gas service was computed by averaging the natural gas bills of the surrounding districts and inflating
that average based on the analysis discussed above.
HOUSING – UTILITIES – TELEPHONE
To estimate the average monthly telephone bill for Colorado residents, Corona obtained the most current
telephone rates from the Public Utilities Commission. This dataset detailed the monthly base rates charged by
each incumbent local exchange carrier (ILEC). ILECs charge the same rate throughout their service area,
with the exception of CenturyTel. In this case, each of CenturyTel’s rate areas was considered to be a
separate provider for the purposes of computing an average bill.
Similar to the process used for electric providers, these rates were assigned to each of the school districts
based on the providers’ coverage areas. In areas where multiple providers serve a single school district, a
weighted average based on population size covered was used to calculate the rate to be assigned to each
district.
In addition to the base rates being charged by each company, a variety of other fees contribute to the
total monthly bill in an area. First, a number of fees are assessed on telephone bills across the entire state.
Specifically, the high cost surcharge, hearing impaired relay fund, low income surcharge, and subscriber line
charges are the same across the entire state. Similarly, state taxes were applied for all districts. Other charges,
such as the 911 surcharge, vary from one area of the state to another. These charges were, therefore, applied
on a district-by-district basis to calculate the overall average bill.
HOUSING – UTILITIES – WATER/WASTEWATER
In order to determine the average monthly payments for water and wastewater bills in each school
district, Corona Insights collected rate information for 258 cities and towns throughout the state. The data
collection was initiated by using a spreadsheet that held contact data and information from similar research
performed in 2011. Corona employees attempted to collect data from each of the 258 agencies; most of the
information was collected via phone calls, although rates for some towns were found online. Phone calls
proved to be the fastest source of information in most cases. In the event that no contact information could
be found, or if a town used only wells or septic tanks, proxy values were used based on rates charged in
another town in the same school district, or based on rates charged in another school district in the same
county. In some cases where neither of these methods was applicable, proxy values were used based on the
rates charged the nearest town.

Page 47
After data collection was complete, equations for determining monthly totals were written into the
spreadsheet for each of the 258 towns. The equations figured rate totals based on a home that uses 6,000
gallons of water per month, and produces 6,000 gallons of wastewater for processing per month. These
totals were then applied to the appropriate school districts. In some cases, rates had only been researched for
one town within a district; in these cases, that rate was simply applied to the entire district. Other school
districts were host to multiple towns, and data had been collected from several towns within the district. In
those cases, each rate was weighted according to population so that a more accurate value for each district
could be determined.
HOUSING – HOUSEHOLD OPERATIONS – DAY CARE
Average day care costs (by Colorado County) were obtained from the 2013 Market Rate Survey of Child
Care Providers, which is conducted by Qualistar Colorado. Qualistar Colorado is the result of a merger that
occurred in 2004 between two early education non-profit organizations based in Colorado – Educare
Colorado and the Colorado Office of Resource and Referral Agencies (CORRA). Qualistar is under contract
to the Colorado Department of Human Services, Division of Child Care as the State Resource and Referral
Agency. As part of this contract they conduct this bi-yearly market research study of state-wide day care costs.
Included in the Market Rate Survey of Child Care Providers are costs for licensed child care centers
(CCC), family child care providers (FCC), and school-age child care (SACC) facilities in all 64 counties. Full-
time weekly rates of caring for children between 0 to 12 months, 1 to 2 years, and 2 to 5 years were provided
in Qualistar’s 2013 report.
In determining the average weekly costs for childcare services, the average of child care centers (CCC’s)
and family care centers (FCC’s) was calculated for each of the three age groups: 0 to 12 months, 1 to 2 years,
and 2 to 5 years. The averages were then weighted based on the age makeup of children of in “Center” or
“Family” day care. These proportions were obtained from the FFY 2011 CCDF Data Tables, U.S.
Department of Health and Human Services, Administration for Children & Families, data for State of
Colorado.
Weekly rates were then converted to a monthly cost by multiplying the weekly cost of care by 52 weeks
per year and then dividing it by 12. Final district average day care costs were then reallocated from the county
level to the final district level using a weighted average method to aggregate based on the population of the
counties in each district.
TRANSPORTATION – VEHICLE PAYMENTS
Vehicle pricing was gathered for a 2011 Honda Civic LX Sedan. The purchase price of the 2011 Honda
Civic was $14,614 (per Kelley Blue Book information assuming the vehicle had 24,000 miles at the time of
purchase). This was the base price used to determine annual car payments for a four-year loan. This price was
assumed to be constant throughout the state, which insures that the identical vehicle is being purchased in
each district. With a used car purchase, not only is availability of a specific model limited across districts, but
the specific condition and features on each available vehicle can vary widely making it impossible to compare
available pricing for a specific vehicle. Instead, the vehicle value is held constant at the KBB value, and the
variance between districts comes from the sales and registration taxes and fees, as well as the financing rates
and fees available. Ownership taxes, registration & licensing fees, other fees (title) are provided in the
“Colorado Motor Vehicle Law Resource Book” from the Colorado Legislative Council. The vehicle weight is
also required for calculating taxes; this was obtained from the vehicle manufacturer’s website.

Page 48
Financing rates for vehicle loans were obtained from telephone surveys of banking institutions and credit
unions throughout the state. The list of banking institutions to survey was obtained from InfoUSA.
Businesses were mapped to the district level to obtain the rate for each district. Average monthly car
payments were then calculated, given the total amount financed (including the purchase price, all bank loan
charges, and any applicable tax, title, and registration fees) and the interest rate charged by the bank or credit
union.
TRANSPORTATION – VEHICLE INSURANCE
Insurance companies with a large market share for vehicle insurance in Colorado were determined by
analyzing the most recent Colorado Insurance Industry Statistical Report, obtained from the Colorado
Department of Regulatory Agencies (DORA), Division of Insurance. These companies were contacted to
determine vehicle insurance rates by zip code.
For vehicle insurance, two vehicles were used to calculate rates. The first vehicle was a 2009 Honda Civic
LX sedan with a four cylinder 1.8 liter engine, five speed manual transmission, 24,000 miles, air conditioning,
power steering, power windows, power locks, cruise control, and dual airbags. The coverage was
comprehensive with liability policy limits of $25,000/$50,000/$15,000 with a $250 deductible and 15,000
miles per year. The second vehicle was a 2009 Ford F-150 XL 6.5 ft. Bed Pickup with a 4.6 liter V6 engine,
automatic transmission with two wheel drive, 60,000 miles, air conditioning, power steering, and airbags. The
coverage was liability only with liability policy limits of $25,000/$50,000/$15,000 with 15,000 miles per year.
These two cars are similar to the ones used in previous studies and represent highly popular makes and
models. The model year was updated from the previous study so that the vehicles are always 2 years old and
4 years old, and some features have to be adjusted accordingly.
For each car and across each zip code, the driver’s characteristics were held constant. The driver of the
Honda Civic was assumed to be a thirty-six year old married woman with good credit and a good driving
record. The driver of the Ford F-150 was assumed to be a thirty-seven year old married man with good
credit and a good driving record. The particular characteristics of the driver were not vitally important
because the comparison of the rates were done using ratios, and as long as the driver’s information was held
constant by each insurance company, the utilization of the ratio method can be assumed to be a valid method
of comparison. Data was given for six months, so the total of the two vehicle’s insurance was summed and
multiplied by two to get the yearly rate for both cars.
As previously detailed in the main body of the report, vehicle insurance data was obtained from one
vehicle insurance provider that has a large share of the vehicle insurance market in Colorado. The name of
that company will not be provided in this report in order to ensure pricing confidentiality to that company.
Vehicle insurance rates were provided from the participating vehicle insurance company for each vehicle by
zip code. Once the zip codes for each county were determined, the rates for each zip code were averaged for
each county and then were weighted by population to the proper school district as final vehicle insurance
rates.
HEALTH CARE
Insurance companies with a large market share for health insurance in Colorado were determined by analyzing the most recent Annual Report of the Commissioner of Insurance to The Colorado General Assembly on Health Insurance Costs. In order to determine the average monthly health insurance premium rate in each school district, Corona Insights contacted the four largest health insurance providers to identify the two most popular plans for each provider. Corona then collected rate information for the identified plans

Page 49
from the providers’ websites. Data were collected for PPOs from three of the companies, and an HMO from the remaining provider. Using each insurance provider’s website, Corona employees gathered rates as they would apply to a family of three, all non-smokers, and in good health. The family of three was described as:
1 Male, 37, DOB 6/20/1976;
1 Female, 36, DOB 2/4/1977; and
1 Male, 4, DOB 4/5/2009.
Most of the websites determined rates based on location within the state as indicated by county or zip code. In the cases when a zip code was required, the code from the applicable county seat was used.
Rates for the two most popular plans for each of the four participating companies were obtained. Corona
project staff consulted with representatives from each of the four companies to select the final plans that
were used from each company. The plans are not necessarily comparable between all companies because
benefits varied widely among the providers. In addition to recording plan rates, Corona employees also noted
the benefits provided by each plan.
Average health insurance costs were averaged for each of the four companies (between the two most
popular plans) and then final health care costs were calculated by multiplying these final company averages by
the weighted (comparative) average market share of each company to obtain final costs by zip code. The
costs collected for each zip code were then applied to school districts within each county.
PERSONAL (INCOME) TAXES
Personal income taxes were calculated for the benchmark family in each district using the IRS Form 1040
for federal income tax, and adding state income tax and occupational/head taxes for relevant local
jurisdictions. For federal income taxes, the standard deduction was compared to the itemized deduction
calculated using mortgage interest and property taxes, as well as specific ownership taxes from the vehicles,
state income taxes, and cash contributions based on the CES, and the higher of the two deductions was used
for each district. IRS Publication 936 was used to calculate the allowable limits on home mortgage interest
deductions for high home value districts (e.g., Aspen). Specific ownership taxes are calculated from the
original Manufacturer’s Suggested Retail Price (MSRP) value for each vehicle, and the tax formula from the
Colorado Motor Vehicle Law Resource Book. Colorado state income taxes are calculated from the formulas
in publication, DR 1098 “Colorado Income Tax Withholding Tables for Employers”.
READING, EDUCATION, MISCELLANEOUS EXPENSES, CASH CONTRIBUTIONS, AND
PERSONAL INSURANCE AND PENSIONS
Mirroring previous Cost of Living studies, the major expenditure categories for Reading, Education,
Miscellaneous Expenses, Cash Contributions, and Personal Insurance and Pensions were not sampled in this
2013 Cost of Living study. Similar to the previous studies, these expenditure categories were expected to be
constant for the relevant benchmark family and were thus held constant for all districts. No significant
geographic variation or trends were expected to be seen for these goods, and the final costs divvied across the
districts came directly from the benchmark families spending level calculated for each category from the
Consumer Expenditure Survey.

Page 50
APPENDIX C: CHANGES FROM THE PREVIOUS
STUDY & IMPLICATIONS
A few notable methodological changes were implemented between the 2011 and 2013 Cost of Living
Studies. In the opinion of the research team, each of these changes had a positive impact on the quality of the
data.
BENCHMARK HOUSEHOLD INCOME
Benchmark income based on most recent teacher salary data. Due to faster release dates from the Colorado Department of Education, in 2013 we were able to use the average teacher salary from 2012 as the benchmark household income, whereas in previous years we used the average teacher salary from two years prior to the study year. This means the benchmark income is more closely tied to economic changes for the state. The benchmark income determines the spending profile for the household. In recent years the benchmark income has changed very little, resulting in very minimal changes in the household spending profile. In general, lower income levels spend proportionally more on housing, transportation, and food, and less on apparel, healthcare, and entertainment, so as income rises, the cost of living index will be weighted somewhat less strongly toward housing, transportation and food, however those remain the largest categories for a range of incomes around the average teacher salary.
CHANGES TO THE MARKET BASKET
Each year we review market basket items based on our experiences pricing items in the previous study,
and current year availability of items. As a result, minor changes were made to a few of the goods included in
the market basket. These changes are detailed below:
TV specifications updated. The electronics market has rapid turnover in available technology. Prior to 2007, the entertainment category was represented by a then-standard television model, but in 2007, flat screen TVs were becoming available, and it had become difficult to find a commonly available television model. In 2007, we began pricing a DVD Player that was commonly available. However, by 2011, DVD Players were being taken over by Blu-Ray players and a commonly available model of DVD Player was difficult to identify. So, in 2011 we returned to a television set item, and identified a now-common flat screen LCD TV with a set of features produced by most manufacturers and widely available across stores. In 2013, the TV was again updated to a commonly-available flat screen LED TV. Because this cost of living index is a point-in-time snapshot of differences across school districts, the most critical need is to be able to price identical or near-identical items in each district (as opposed to pricing the same item over time). The electronics item is likely to need regular updating to ensure a currently popular item that will be available widely.
Women’s Polo Shirt changed to Women’s Cardigan Sweater. In 2013 we collected prices for both a women’s polo shirt and a women’s cardigan sweater during field data collection. Upon reviewing the data obtained for each item, it was determined that the cardigan sweater was more commonly available statewide resulting in better data for the item category. In total, 204 prices for women’s cardigan sweaters were obtained, compared to only 128 prices for women’s polo shirts.
Vehicle updates. Each year the vehicles are updated to a two-year old sedan and a four-year old truck. This year the truck model was updated to the Ford F-150 from the Ford Ranger because the F-150 is currently the most popular truck model.

Page 51
ANALYSIS PROCEDURES
The geographic shopping patterns matrix was not updated in 2013. The shopping patterns matrix is built from a growing database containing data from the 2007, 2009, and 2011 studies. Because the matrix was not updated in 2013, data may lag current shopping patterns slightly. However, this matrix is designed for a ten-year rotating collection cycle, so the impact of the lag will be minor.
Improvements to calculations where data is collected by county, zip code, or municipality. In 2013 we utilized a geographic information system (GIS) approach to extract population totals for counties within districts, zip codes within districts, and municipalities within districts. This method allowed us to more precisely calculate weighted average prices for districts using data available for counties, zip codes, or municipalities.

Page 52
APPENDIX D: RAW PRICING DATA FOR
SELECTED PURCHASE CATEGORIES
This appendix provides the raw pricing data that underpins the analysis. Readers receiving this report
electronically will need to review an accompanying spreadsheet file, due to the volume of data.

Page 53
APPENDIX E: STATISTICAL MEASURES USED
IN THIS REPORT
This appendix is reproduced from previous Cost of Living reports to ensure that this information on the
development of confidence intervals is available to readers each year. The general concept employed in this
methodology is the propagation of uncertainty. Uncertainty propagation examines how the uncertainty in a
calculated result depends on the uncertainty in the measured values that are entered into the formula. The
generalized equation for error propagation for a function f(x, y, z …) where variables x, y and z are
uncorrelated is:
...2
2
2
2
2
2
2
zyxf
z
f
y
f
x
f [1]
where 2
i is the variance of variable i. For this project, we are interested in determining the variances (the
95% confidence interval of f is approximately f96.1 ) of the cost of living index ),,,( wpSfCOL D
where D are the mean prices of consumer products in the district, S are the shopping patterns, p are the
decimal population fractions in each district, and w are weights that determine the contributions of individual
consumer products to the overall cost of living. All four of these variable types are estimated from surveys of
one type or another, and hence have error associated with them. However, only the errors in the district
consumer prices D are considered in the Bengtsson treatment.
The Bengtsson derivations for the propagation of D errors are approximate in that equation [1] is not
applied directly to the COL function. Rather, for simplicity, equation [1] is applied successively to
components of the COL function in order to build up the final expression for 2
f . This simplification is
probably necessary given the complexity of the COL function. An amplification of the derivation of the
variances of interest is provided later. The conceptual part of this appendix will address some key questions.
Does a large variance in the item cost data automatically translate to a large confidence interval? Consider that you
wanted to get a haircut in Aspen. It is likely that you could find haircuts ranging from around $20 to well over
$100, leading to a large variance in the price of haircuts in Aspen. Does this necessarily mean that the cost of
living index will have a large confidence error? No, because the confidence interval depends on the variance of
the estimate of the mean price as opposed to the variance of the sample. But districts with large price variances do
require more intensive sampling. Consider a simplified example where there are 20 places to get a haircut in
Aspen, and at half of them you can get a $20 haircut and at the other half haircuts cost $100. Let’s also
assume that by chance whenever we sample haircut prices that we sample equally between the two haircut
prices. Table 1 illustrates what happens to the variance and 95% confidence interval of the estimate of the
mean price as a function of number of prices sampled.

Page 54
EXHIBIT E-1: VARIANCE AND CONFIDENCE INTERVAL OF MEAN PRICE ESTIMATE
AS A FUNCTION OF SAMPLE SIZE.
N Estimate of Mean
Price
Variance of
Sample
Variance of
Estimate of
Mean Price
95% Confidence
Interval of
Estimate of Mean
Price
2 $60 3200 1516 $76
4 $60 2133 449 $42
8 $60 1829 144 $24
16 $60 1797 24 $10
While this example is somewhat extreme, it does illustrate that large variances in the district prices can be
overcome by more intensive sampling. However, a question arises; are the higher priced haircuts even
pertinent to the middle-income population targeted by the study, given the availability of lower priced
haircuts? Seemingly, much of this problem would go away with a careful outlier detection process, as was
implemented in the 2007 study and used in the current 2009 study. If additional sampling of certain districts
is indicated by large CI, more detailed outlier removal for that shopping district may be indicated.
Does a large CI always signal a need for additional price sampling? The primary motivation of determining
confidence intervals of COL indices is to determine if additional sampling is needed. The question arises, is
additional sampling always in indicated when the CI is large? Probably not. Consider a rural area where there
may be one grocery store in which the majority of people shop, but also several small convenience stores with
somewhat higher prices. Provided the initial price sampling included the grocery store, additional sampling of
convenience stores will likely artificially inflate the mean price. The uncertainty in the size of the shopping
universe also complicates this situation (see first paragraph of the appendix). As n approaches U, the
uncertainty in the mean price estimate approaches zero. So, in a small district with large price variances, the
strategy for reducing the CI would be to sample every store. However, in some cases the number of stores
sampled to date exceeded the size supposed value of U. This uncertainty of U makes it difficult to be certain
that every store has been sampled. The need to increase sampling of high CI districts needs to be evaluated
on a case by case basis. Most of the challenges described so far could be eliminated with store-specific
shopping patterns for the target income groups. However, reliable collection of such data is probably
impossible.
What are the limitations of the methodology used to calculate the confidence intervals of the COL indices? One of the
major limitations of the methodology of calculating CI is that only uncertainty in mean district prices is taken
into account. There is also likely to be uncertainty in the shopping patterns, which also propagates through
the calculation and would affect the uncertainty in the COL indices. There may also be smaller errors
associated with the weighting and population factors, depending on what these measures are designed to
represent. Mathematically, the derivation of an analytical expression to propagate uncertainty in the district
prices, shopping patterns, and other sources of uncertainty may be difficult. A Monte Carlo method may be
more practical. However, given the expected size of the uncertainty in the shopping patterns, the overall
uncertainty in the COL indices may appear to be unacceptably large to the client without prior education.

Page 55
Alternatively, a separate CI interval could be calculated using uncertainty of the shopping pattern alone,
without consideration of the uncertainty in shopping patterns. The purpose of this CI would be to determine
if additional surveying of shopping patterns is needed.
What does the confidence interval actually tell us? The confidence interval as calculated by the Bengtsson
method indicates the level of uncertainty in the COL indices as affected by uncertainty in the prices available
to consumers. It does not reflect the overall uncertainty in the mean COL estimates. It can be used as a
screening tool to identify districts that may potentially benefit from additional price sampling. However, once
identified, some additional consideration needs to be given to whether additional price sampling would
actually be beneficial or whether tools such as outlier detection may be more appropriate. In general,
shopping areas that have a large number of consumer choices and large price variances may benefit from
additional sampling. If the shopping district has relatively few choices, additional sampling could help
provided 1) the new stores sampled actually capture a significant market share and 2) the total universe of
stores in the district is known with certainty.
Statistical Appendix
To illustrate the application of equation 1 to the COL function and to aid in decoding the vector notation
in the Bengtsson methodology, we will consider a simple case in which there are two school districts and
three shopping districts in the state. For each consumer item that contributes to the COL index, we estimate
the mean price within the district D by a shopping survey of a subset n of the stores. We also calculate the
variance of the sample D from the sample data. The variance of the estimate of D is given by nD
22 ,
which is also the square of the standard error of the sample. As n approaches the total number of stores that
have that item (U), the accuracy of our estimate of D increases. We account for this effect on 2
by
multiplying by the factor )1()( UnU . So for our example we have: )',,( 321 DDD Dμ and
)',,( 2
3
2
2
2
1 μσ . We also have the shopping pattern matrix (note that the shopping matrix assembled
by Corona Insights is actually S’ as shown below):
23
13
2221
1211'
S
S
SS
SSS [2]
The actual prices paid by consumer in the district is the shopping-pattern-weighted costs DD μSμ 'S . If
we expand this for school district 1 we get:
3132121111 DDDSD SSS [3]
If we now apply equation [1] to find2
1 S (the variance of 1SD ):
2
3
2
13
2
2
2
12
2
1
2
11
2
3
2
3
12
2
2
2
12
1
2
1
12
1
SSS
D
SD
D
SD
D
SDS

Page 56
This corresponds to the vector notation:
SSS
22 '
Where 2
and 2
S are square matrices with the elements of interest on the diagonals.
The state-average price is given by:
323213122221211212111
32322212123132121111
)()()(
)()(
DDD
DDDDDDSS
SpSpSpSpSpSp
SSSpSSSp
To find the variance of the state-average price we again apply equation [1]:
2
3
2
232131
2
2
2
222121
2
1
2
212111
2
3
2
3
2
2
2
2
2
1
2
1
2
)()()(
SpSpSpSpSpSp
D
SS
D
SS
D
SSSS
This corresponds to the vector notation:
SpSpSS
22 '' ← imagine this in bold
The COL is a weighted function of the ratios SSSDDr . Now for district 1 we calculate the
variance 2
1r of the ratio SSSDDr 11 by application of equation [1] again, remembering that the
variances of 1SD and SS are 2
1 S and 2
SS , respectively:
22
1
2
12
2
4
2
12
12
2
2
2
1
2
1
2
1
11SSDS
SS
SS
SS
SDS
SS
SS
SS
DS
SD
Dr
r
rr
where we assume 1Dr can be approximated by 1. Finally the cost of living index over i items is given by:
DiirwCOL
and its variance is given by:
222
riiCOL w