2013 full year results - nufarm · net working capital (nwc) 1,011.0 770.8 240.2 s average nwc(1)...
TRANSCRIPT

2013 Full Year Results
September 2013

Disclaimer
Forward looking statements
This presentation has been prepared by Nufarm Limited. The information contained in this presentation is for informational purposes only. The information contained in this presentation is not investment or financial product advice and is not intended to be used as the basis for making an investment decision. This presentation has been prepared without taking into account the investment objectives, financial situation or particular needs of any particular person.
No representation or warranty, express or implied, is made as to the fairness, accuracy, completeness or correctness of the information, opinions and conclusions contained in this presentation. To the maximum extent permitted by law, none of Nufarm Limited, its directors, employees or agents, nor any other person accepts any liability, including, without limitation, any liability arising out of fault or negligence, for any loss arising from the use of the information contained in this presentation. In particular, no representation or warranty, express or implied, is given as to the accuracy, completeness or correctness, likelihood of achievement or reasonableness of any forecasts, prospects or returns contained in this presentation. Such forecasts, prospects or returns are by their nature subject to significant uncertainties and contingencies.
Before making an investment decision, you should consider, with or without the assistance of a financial adviser, whether an investment is appropriate in light of your particular investment needs, objectives and financial circumstances. Past performance is no guarantee of future performance.
Non-IFRS information
Nufarm Limited results are reported under International Financial Reporting Standards (IFRS) including Underlying EBIT and Underlying EBITDA which are used to measure segment performance. This presentation also includes certain non-IFRS measures including Underlying net profit after tax and Gross profit margin. These measures are used internally by management to assess the performance of our business, make decisions on the allocation of our resources and assess operational management. Non-IFRS measures have not been subject to audit or review. Refer to “Supplementary information” for the definition and calculation of non-IFRS information.

FY 2013 results: Overview Doug Rathbone, Managing Director / CEO

Results underline importance of business diversification
Group FY13 headline results
4
• Exceptionally weak demand in Australia
– Dry conditions prevail for most of the year
– Margin pressure due to more competition for fewer sales
– Impact of fixed cost base
• Solid growth in all other regions + seeds
– No ‘free kicks’ in terms of seasonal conditions
– Important progress on execution of strategic growth plans
Strong performance from overseas businesses mitigates weaker Australian conditions
12 months ended 31 July
(A$ millions) 2013 2012 Change
Revenue 2,277 2,182 4.4%
Underlying EBITDA
261 268 -2.6%
Underlying EBIT 187 206 -9.3%
Underlying NPAT 83 115 -28%
Full Year dividend 8 cents 6 cents 33%

A stronger global platform….
5
$2,277.3m
Total Group Revenues 2013
$260.8m
Asia 6%
North America
23%
South America
16%
Europe 21%
South America
19%
Aust/NZ 26%
Europe 21%
North America
23%
Asia 5%
Total Group EBITDA 2013
Seed tech 6%
South America
15%
Aust/NZ 19%
Europe 28%
North America
18%
Asia 8%
Seed tech 12%
….and a diversified earnings base

FY 2013 results: Financials Paul Binfield, Chief Financial Officer

2013 full year results
• All regions delivering profitable growth except for Australia / NZ – Strong performance in Brazil (>40% sales growth in local currency) and valuable contributions from
NAFTA and Europe – Seeds continues to deliver a high margin contribution
• Underlying EBIT down to $186.8 million due to: – Intense competition in Australia, driven by extreme seasonal conditions and weaker overhead
recoveries due to reduced volumes – Increased gross margin in the business ex-ANZ – Increased investment undertaken in Brazil and Seeds business to meet forecast growth
• Underlying NPAT down to $83.2 million, driven by higher interest expense due to increased net debt levels and the impact of FX movements on net financing and trading balances
Solid Group result despite unprecedented Australian climatic conditions, demonstrating benefit of geographical diversification
7
(A$ millions)
Year ended 31 July
2013 2012 Change
Revenue 2,277.3 2,181.6 4.4% p
Underlying gross profit(1) 623.3 610.9 2.0% p
Gross profit margin 27.4% 28.0% (63 bps) q
Underlying EBITDA(1) 260.8 267.8 (2.6%) q
EBITDA margin 11.5% 12.3% (82 bps) q
Underlying EBIT(1) 186.8 206.0 (9.3%) q
EBIT margin 8.2% 9.4% (124 bps) q
Underlying NPAT(1) 83.2 115.4 (27.9%) q
Dividend (cents per share) 8.0¢ 6.0¢ 33.3% p
(1) Excludes material items.

Impact of foreign exchange
• Movement in FX rates during year had little net impact on Underlying EBIT
• Majority of FX loss for the year and occurred in 1H, with FX exposures largely hedged in 2H (aided by the implementation of the US High Yield Bond)
– Majority of FX loss remains unrealised
8
(A$ millions)
Year ended 31 July
2013
Actual
2012
Constant FX(1)2012
Actual
Revenue 2,277.3 2,202.8 2,181.6
Underlying EBIT 186.8 211.1 206.0
Underlying NPAT 83.2 117.9 115.4
Underlying EBIT at constant FX Impact of FX on net financing costs (A$ millions)
Year ended 31 July
1H13 2H13 2013 2012
Net FX gains/(losses) on
Nufarm Step-up
Securities (NSS) (2)
n/a n/a n/a 11.1
Net underlying FX
gains/(losses)(9.2) (1.5) (10.7) 8.2
Net FX gains/(losses) inc.
in net financing cost(9.2) (1.5) (10.7) 19.3
Note: Underlying EBIT and NPAT exclude material items. (1) 2012 Actual results converted at 2013 FX rates. (2) Net FX gains /(losses) on NSS treated as a material item in the prior period.
• If recent depreciation of A$ prevails for the remainder of the year, it will provide a net benefit to the Group.

Impact of material items
• Balance of class action settlement ($3.2 million) pre tax, $2.2 million after tax in 1H13
• FX gains/(losses) on the NSS have been included in net FX gains / (losses), consistent with the treatment in 1H13
No material items in 2H13
9
Reconciliation of Underlying NPAT to Reported NPAT
Year ended 31 July
1H13 2H13 2013 2012
Underlying NPAT 83.2 115.4
Material items after tax
Class action settlement (2.2) - (2.2) (30.1)
Restructuring costs - - - (5.0)
Debt re-financing costs - - - (7.0)
Due diligence & litigation costs - - - (2.4)
Investment in associate writedown - - - (2.0)
Intangibles write-off - Brazil - - - (3.7)
Net FX gains/(losses) on Nufarm Step-Up Securities - - - 7.7
Total material items after tax (2.2) - (2.2) (42.8)
Reported NPAT attributable to equity holders 81.0 72.6
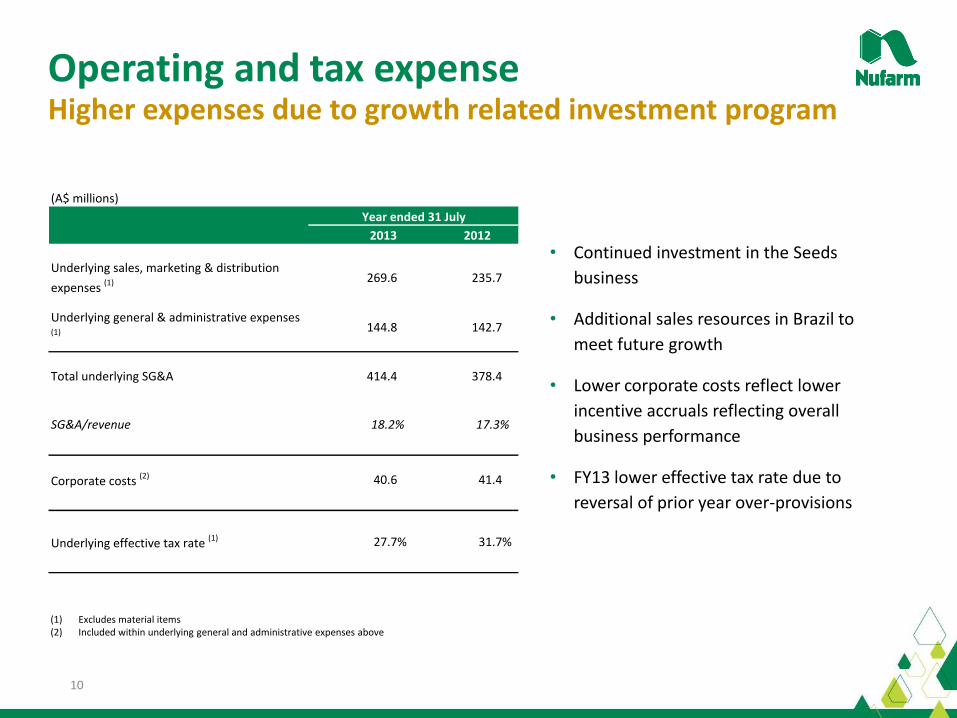
Operating and tax expense
• Continued investment in the Seeds
business
• Additional sales resources in Brazil to
meet future growth
• Lower corporate costs reflect lower
incentive accruals reflecting overall
business performance
• FY13 lower effective tax rate due to
reversal of prior year over-provisions
10
(A$ millions)
Year ended 31 July
2013 2012
Underlying sales, marketing & distribution
expenses (1) 269.6 235.7
Underlying general & administrative expenses (1) 144.8 142.7
Total underlying SG&A 414.4 378.4
SG&A/revenue 18.2% 17.3%
Corporate costs (2) 40.6 41.4
Underlying effective tax rate (1) 27.7% 31.7%
Higher expenses due to growth related investment program
(1) Excludes material items (2) Included within underlying general and administrative expenses above

Working capital Net working capital build relates to elevated inventory levels
11
Average net working capital trend
53.9%
50.2%
45.3%
46.8%
850
900
950
1000
1050
1100
1150
1200
FY10 FY11 FY12 FY13
Average Net Working Capital (ANWC) ($m) ANWC / Sales (%)
Net working capital (NWC)
(A$ millions)
Year ended 31 July
2013 2012 Change
Receivables 758.5 730.5 28.0 p
Inventories 802.8 515.3 287.5 p
Payables (550.3) (475.0) (75.3) p
Net working capital
(NWC)1,011.0 770.8 240.2 p
Average NWC(1) 1,066.7 988.2 78.5 p
Avg NWC/Sales (%) 46.8% 45.3% 150 bps p
(1) Average Net Working Capital (ANWC) is the average NWC balance calculated over 12 months (2) ANWC/sales is ANWC divided by the last 12 months sales revenue
• Net working capital remains a key focus across the Group, with the accumulation of inventory in FY13 expected to be temporary
• Management remain committed to reducing ANWC/sales
• Longer-term initiatives in place to support this focus include cash pooling, strengthened S&OP processes, SKU rationalisation and in-sourced manufacturing of strategic products

Working capital
• Key drivers of the inventory build in FY13 are:
– Build up of inventory in Brazil in anticipation of strong season
– FX translation impact on overseas inventory balances (non-cash)
– Excess inventory in Australia due to poor season
12
Inventory bridge FY12 to FY13
$515
$803
$76
$112$24 $15
$9 $52
$0
$100
$200
$300
$400
$500
$600
$700
$800
$900
FY2012 July FX Impact (Translation)
Expectation of LAS Season
Weak Australian Season
Glyphosate Cost Acquisitions Other FY2013 July
Inventory build is largely temporary
$m

Net debt & financing costs
• Higher average net debt for the period largely due to acquisitions completed ($30.7 million), higher net working capital compared to the prior period and payment of class action settlement ($46.7 million)
• Higher net interest expense driven by higher average net debt and interest expense on high yield bond partially offset by lower rates on bank debt
• Indicative discussions regarding the early refinancing of the revolver are positive
Interest expense elevated due to higher average net debt
13
2013 2012
Net financing costs excluding FX gains/(losses)
Interest expense (54.5) (47.4)
Lease interest expense (1.5) (1.4)
Interest income 5.5 7.9
Net interest expense (50.5) (40.9)
Debt re-financing costs amortisation (9.5) (13.0)
Net financing costs excluding FX gains/(losses) (60.0) (53.9)
Net debt at balance date 633.1 467.8
Net debt at balance date (in constant currency) 552.4 467.8
Average net debt for the period (1) 753.3 650.3
Net debt and net financing costs
(1) Average net debt is the average of the month end net debt over the last 12 months

FY 2013 results: Business report Brian Benson, Group Executive Agriculture

Sales revenue by region Crop protection segment
15
$2,145.6m
2013 2012
$2,060.6m
Aust/NZ 34%
Asia 6%
North America
23%
South America
16%
Europe 21%
South America
20%
Aust/NZ 28%
Europe 22%
North America
24%
Asia 6%

2013 Results – regional review Australia/New Zealand
16
Australia
• Very challenging seasonal/ climatic conditions impact demand
• Margins also impacted, with more competition for fewer sales and fixed overhead of a large manufacturing presence
• Competition remains strong in glyphosate segment, but transition to Nufarm brands is on plan
2013 $m 2012 $m
Sales 604.4 701.0
Underlying EBIT 35.4 106.0
New Zealand
• Improved sales and profit performance
• Dry conditions also a negative impact on demand
*Other = PGRs, machinery, adjuvants, industrial
Herbicides 69%
Insecticides 5%
Fungicides 8%
Other* 18%
Regional revenues by major product segment

2013 Results – regional review
• Transition from BASF portfolio
• Transition from 'Roundup' brand
Australia - update
17
Excluding these arrangements, all other current third party distribution
arrangements equate to approx. 5% of group revenues

2013 Results – regional review Asia
18
• Indonesia impacted by palm oil and increased competition
• Malaysia profitability grows as new mixture products gain traction
• Japan: Solid performance
• New Asian strategic plan developed
– New growth countries and segments
• Increased toll manufacturing revenue
2013 $m 2012 $m
Sales 125.2 125.6
Underlying EBIT 19.6 16.7
Herbicides 84%
Insecticides 3%
Fungicides 6%
Other 7%
Regional revenues by major product segment

2013 Results – regional review North America
19
USA
• Late season reduces burndown opportunity
• Cooler/weather conditions impact T&O segment
• Cleary acquisition completed
• Increased focus and resource in TNV
• Alsip facility commissioned
2013 $m 2012 $m
Sales 516.3 470.2
Underlying EBIT 42.2 33.3
Canada
• Canada recovery very strong as new management and strategy gain traction
• Solid growth in Sumitomo brands
Herbicides 78%
Insecticides 4%
Fungicides 9%
Other 9%
Regional revenues by major product segment

2013 Results – regional review South America
20
Brazil
• Very strong growth on a local currency basis
• Dry conditions in pasture segment
• Improved market penetration and additional sales resources
• Expanded portfolio
• Successful launch of high load glyphosate product, 'Crucial'
2013 $m 2012 $m
Sales 431.4 332.6
Underlying EBIT 40.6 17.5
Other
• Argentina posts strong growth and better margins driven by portfolio diversification
• Colombia in line with previous year
• Chile meets expectations
• Regional role for Fortaleza plant
Herbicides 55%
Insecticides 29%
Fungicides 13%
Other 3%
Regional revenues by major product segment

2013 Results – regional review Europe
21
• Mixed seasonal conditions/impacts
• Growth in cereal herbicides
• Strong contributions from manufacturing plants
• 'One Europe' structural changes implemented
• Refocus of R&D to support strategic crops and seed treatment
• Value creation shift underway
2013 $m 2012 $m
Sales 468.3 431.1
Underlying EBIT 57.2 43.2
Herbicides 67%
Insecticides 7%
Fungicides 13%
Other 13%
Regional revenues by major product segment

Major product segments Crop protection % total segment revenues
22
$2,145.6m
2013 2012
$2,060.6m
Insecticides 10%
Herbicides 69%
Fungicides 10%
Other 11%
Insecticides 9%
Herbicides 70%
Fungicides 10%
Other 11%

2013 Results – Product segment review Herbicides
23
• Lower demand and margin pressure in Australia
• Higher input costs and selling prices for glyphosate
• Phenoxy herbicides perform strongly despite weaker demand in some markets /segments
• Dicamba products find increased role in resistance management
• Robust pipeline of mixture products
2013 2012
Group sales 1,478.6 1,426.4
Average GM 25% 26%

2013 Results – Product segment review Insecticides
24
• Lower value product mix, with chlorpyrifos volumes up strongly in Brazil
• Low insect pressure in some markets
• Regulatory pressure on imidacloprid
• New lambda-cyhalothrin formulations achieve good margins and sales growth
• Supply related constraints impact fipronil sales
• Sumitomo insecticides added in Europe, Canada and Indonesia
2013 2012
Group sales 215.1 184.3
Average GM 32% 35%

2013 Results – Product segment review Fungicides
25
• Strong sales in South America, North America and Europe offset very low demand in Australia in the 2013 year
• Differentiated copper formulations secure support in Europe
• Azoxystrobin sales up and more registrations imminent
2013 2012
Group sales 218.7 212.7
Average GM 28% 28%

2013 Results – Product segment review Other*
26
• Plant growth regulator (PGR) sales down in cotton, but up in European cereals
• Valent (Sumitomo) distribution arrangements in Canada drive growth in horticulture segment
• Successful launch of proprietary 'Clementgros' in Chile
• Initial position in biopesticides established
• Croplands spray machinery sales (Aust / NZ) down on prior year
2013 2012
Group sales 233.2 232.8
Average GM 29% 26%
* Other includes plant growth regulators (PGRs); Croplands machinery business; adjuvants; and industrial sales

2013 Results – Seed technologies segment review Seed technologies
27
• Dry conditions a negative impact on Australian canola seed sales
• A record year for sorghum business
• Cold US spring impacted seed treatment opportunities; good sales growth in Eastern Europe
• ‘Beyond yield' strategic milestones with launch of ‘Wholis’, ‘Monola’ sales to Japan and Omega-3 introgression into Canola
2013 $m 2012 $m
Sales 131.7 121.0
Average GM 55% 53%
Underlying EBIT 32.4 30.6
Seed 69%
Seed Treatment
31%

2013 Results – Seed technologies segment review A stronger platform to drive sustainable growth
28
• Expansion into South America with Atlantica acquisition
• European breeding and product development capabilities enhanced
• Investment in hybrid pipeline optimisation
• Recruitment of new molecular research leader
• Alsip facility custom seed treatment blend capability attracts customer interest and support
• Seed treatment strengthened with recruitment of experienced global commercial lead

FY 2013 results: Group outlook Doug Rathbone, Managing Director / CEO

Corporate growth strategy
30
Protect / enhance value of our core
positions
Invest in new growth
opportunities
Leverage the existing operating/
asset base
• Formulation developments in phenoxy herbicides
• Glyphosate product development and differentiation
• Emphasis on value and quality
• Build insecticides and fungicides platform
• Biopesticides
• Seed treatments
• Elite seed varieties
• Downstream seed products
• Higher sales/volume across fixed cost base
• Utilising manufacturing plants for adjacent markets
• Increased tolling activity
• Driving greater efficiencies

Corporate growth strategy
31
Protect / enhance value of our core
positions
Invest in new growth
opportunities
Leverage the existing operating/
asset base
Growing into higher value and more
defendable product and market
segments
Key crop focus
Turf & Ornamental
Differentiated formulations & mixtures
Seed technologies
Generate improved
returns

Group outlook
• Strong recovery anticipated in Australia based on return to more normal seasonal conditions and demand patterns – Negative EBIT impact from loss of BASF distribution arrangements
– Transition to 'Weedmaster' glyphosate brands in Australia to be earnings neutral
• Continued growth in Brazil, with initial sales (August/September) at record levels – Investment required to consolidate recent gains; build platform for next growth phase
• North America and Europe also positioned for continued growth
• Asia expected to be down due to margin pressure on glyphosate
• Strong focus on balance sheet metrics – with significant improvement targeted for working capital and average debt
32
Assuming average seasonal conditions in major markets, we
expect to achieve underlying EBIT growth in FY 2014


Supplementary information

35
Term Definition
Underlying NPAT Profit / (loss) for the period attributable to the equity holders of Nufarm Limited less material items.
Underlying EBIT Earnings before net finance costs, taxation and material items.
Underlying EBITDA Earnings before net finance costs, taxation, depreciation and amortisation and material items.
Gross profit margin Gross profit as a percentage of revenue.
Average gross profit Revenue less a standardised estimate of production costs excluding material items and non-product specific rebates and other pricing adjustments.
Average gross margin Average gross profit as a percentage of revenue.
Net debt Total debt less cash and cash equivalents.
Average net debt Net debt measured at each month end as an average.
Net working capital Current trade and other receivables and inventories less current trade and other payables.
Average net working capital Net working capital measured at each month end as an average.
ANWC/sales (%) Average net working capital as a percentage of last twelve months revenue.
Net external interest expense Comprises Interest income – external, Interest expense – external and Lease expense – finance charges as described in note 10 to the 31 July 2012 Nufarm Limited financial report.
Gearing Net debt / (net debt plus equity)
Constant currency Reconciled as per the below – whereby “(a)” represents the impact from the fluctuation in exchange rates between all foreign currency denominated amounts and the Australian dollar.
Non IFRS disclosures and definitions
Year ended 31 July
Net Working
Capital
'$000
Net debt
'$000
FY 2012 as reported 770,759 467,804
Foreign currency translation impact (a) 144,686 84.575
Constant currency adjusted 915,445 552,379
FY 2013 as reported 1,011,004 633,113

36
Non IFRS information reconciliation
12 months ended 31 July 2013 12 months ended 31 July 2012
Underlying Material items Total Underlying
Material
items Total
$000 $000 $000 $000 $000 $000
Revenue 2,277,292 2,277,292 2,181,551 2,181,551
Cost of sales (1,653,991) (1,653,991) (1,569,852) 805 (1,570,657)
Gross profit 623,301 - 623,301 611,699 805 610,894
Other income 20,677 20,677 10,124 10,124
Sales, marketing and distribution expenses (269,582) (269,582) (235,697) 4,846 (240,543)
General and administrative expenses (144,835) 3,177 (148,012) (142,657) 55,350 (198,007)
Research and development expenses (42,698) (42,698) (37,874) (37,874)
Share of net profits/(losses) of associates (60) (60) 378 378
Operating profit 186,803 3,177 183,626 205,973 61,001 144,972
Financial income excluding fx 5,491 5,491 7,910 7,910
Net foreign exchange gains/(losses) (10,734) (10,734) 8,187 (11,050) 19,237
Net financial income (5,243) - (5,243) 16,097 (11,050) 27,147
Financial expenses (65,460) (65,460) (52,818) 8,978 (61,796)
Net financing costs (70,703) - (70,703) (36,721) (2,072) (34,649)
Profit before tax 116,100 3,177 112,923 169,252 58,929 110,323
Income tax benefit/(expense) (32,126) (953) (31,173) (53,584) (16,083) (37,501)
Profit for the period 83,974 2,224 81,750 115,668 42,846 72,822
Attributable to:
Equity holders of the parent 83,223 2,224 80,999 115,440 42,846 72,594
Non-controlling interest 751 751 228 228
Profit for the period 83,974 2,224 81,750 115,668 42,846 72,822
37
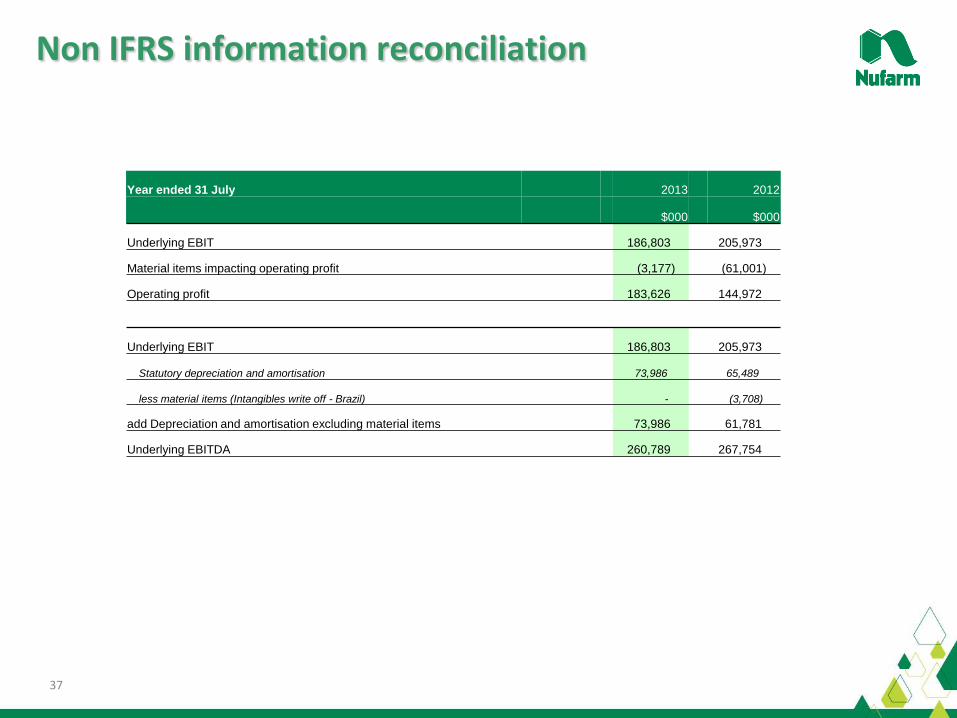
Non IFRS information reconciliation
Year ended 31 July 2013 2012
$000 $000
Underlying EBIT 186,803 205,973
Material items impacting operating profit (3,177) (61,001)
Operating profit 183,626 144,972
Underlying EBIT 186,803 205,973
Statutory depreciation and amortisation 73,986 65,489
less material items (Intangibles write off - Brazil) - (3,708)
add Depreciation and amortisation excluding material items 73,986 61,781
Underlying EBITDA 260,789 267,754

Head office – 103 Pipe Road, Laverton North, 3026, Australia Tel: +61 3 9282 1000 | Fax: +61 3 9282 1002 www.nufarm.com