2013 index of economic freedom: no boost in trade...
TRANSCRIPT
2013 Index of Economic Freedom: No Boost in Trade Freedom
Bryan Riley and Ambassador Terry Miller
SPECIAL REPORT No. 123 | OCTOBER 25, 2012from THE CENTER for INTERNATIONAL TRADE and ECONOMICS
SR-123
2013 Index of Economic Freedom: No Boost in Trade FreedomBryan Riley and Ambassador Terry Miller
Photo on the Cover—© Martin Barraud / Alamy
This paper, in its entirety, can be found at:http://report.heritage.org/sr123
Produced by the Center for International Trade and Economics (CITE)
The Heritage Foundation214 Massachusetts Avenue, NEWashington, DC 20002(202) 546-4400 | heritage.org
Nothing written here is to be construed as necessarily reflecting the views of The Heritage Foundation or as an attempt to aid or hinder the passage of any bill before Congress.
About the AuthorsBryan Riley is Jay Van Andel Senior Analyst in Trade Policy in the Center for International Trade and Economics (CITE) at the Heritage Foundation.Ambassador Terry Miller is Director of CITE and Mark A. Kolokotrones Fellow in Economic Freedom at The Heritage Foundation.
1
speciAl report | NO. 123OCTOBER 25, 2012
The latest rankings of trade free-dom around the world,1 developed
by The Heritage Foundation and The Wall Street Journal in the forthcom-ing 2013 Index of Economic Freedom,2 once again demonstrate how citi-zens of countries that embrace free trade are better off than citizens of countries that do not. The case for pending trade agreements, such as the Trans-Pacific Partnership and Africa’s Continental Free Trade Area, is bolstered by international statis-tics showing a strong correlation between trade freedom and a variety of positive indicators, including eco-nomic prosperity, low poverty rates, and clean environments.
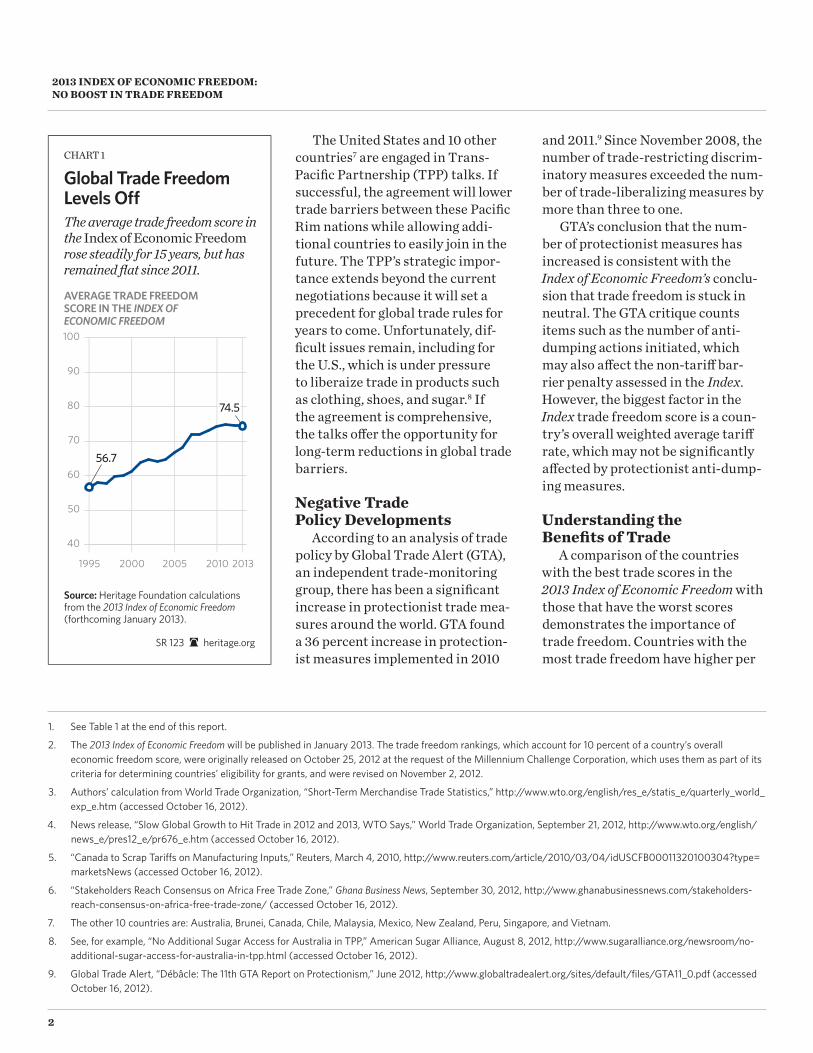
Worldwide, the average trade free-dom score remained unchanged from 2012, at 74.5 of a possible top score of 100. Although trade freedom remains at the second-highest level since The Heritage Foundation began tracking it in 1995, it is troubling that progress has stalled in recent years.
Trade freedom scores have shown significant improvement since 1995, when the inaugural Index of Economic Freedom was released, but there is plenty of room for additional improvement.
trade Volume on the rise According to the World Trade
Organization (WTO), trade vol-ume has recovered strongly from the global recession. The volume of world trade dropped by $3.6 trillion from 2008 to 2009, but in the next two years rebounded by $5.7 trillion to record-high levels.3 However, the WTO recently lowered its projec-tions for continued trade growth to a 2.5 percent increase in 2012, and a 4.5 percent increase in 2013. These downgrades were due not to increas-es in protectionist trade barriers, but to a variety of troubling economic events, including the debt crisis in Europe, slower economic growth in China, and continued weak levels
of output and employment in the United States.4
positive trade policy Developments
Several positive developments in trade policy are taking place around the globe. Canada is unilaterally phasing out tariffs on more than 1,500 materials used by the country’s manufacturers.5 Cutting tariffs on such inputs will make Canada’s man-ufacturers more competitive, provid-ing a simple example of how coun-tries can strengthen their economies by reducing or eliminating tariffs.
Many African countries are pursuing a Continental Free Trade Area (CFTA) modeled after other successful continental trade deals, such as the North American Free Trade Agreement (NAFTA) and the European Common Market. One study found that such an agreement would boost intra-African trade by as much as 22 percent.6
2013 Index of Economic Freedom: No Boost in Trade FreedomBryan Riley and Ambassador Terry Miller
Abstract: The Heritage Foundation has been tracking and ranking trade freedom around the world since 1995. The rankings have consistently shown a correlation between trade freedom and improved lives for people around the world—and vice versa. The latest rankings, in the forthcoming 2013 Index of Economic Freedom, once again confirm that connection. For that reason, it is a matter of concern that the worldwide trade freedom score has not improved over the past year. The United States used to be a free trade leader, serving as an example to other countries. It can, and should, be a leader again. This Special Report describes which trade policies are helpful, which are harmful, and what the U.S. Congress can do now to put the U.S. back on a path to free trade leadership.
2
2013 iNDeX oF ecoNoMic FreeDoM: No Boost iN trADe FreeDoM
The United States and 10 other countries7 are engaged in Trans-Pacifi c Partnership (TPP) talks. If successful, the agreement will lower trade barriers between these Pacifi c Rim nations while allowing addi-tional countries to easily join in the future. The TPP’s strategic impor-tance extends beyond the current negotiations because it will set a precedent for global trade rules for years to come. Unfortunately, dif-fi cult issues remain, including for the U.S., which is under pressure to liberaize trade in products such as clothing, shoes, and sugar.8 If the agreement is comprehensive, the talks off er the opportunity for long-term reductions in global trade barriers.
Negative trade policy Developments
According to an analysis of trade policy by Global Trade Alert (GTA), an independent trade-monitoring group, there has been a signifi cant increase in protectionist trade mea-sures around the world. GTA found a 36 percent increase in protection-ist measures implemented in 2010
and 2011.9 Since November 2008, the number of trade-restricting discrim-inatory measures exceeded the num-ber of trade-liberalizing measures by more than three to one.
GTA’s conclusion that the num-ber of protectionist measures has increased is consistent with the Index of Economic Freedom’s conclu-sion that trade freedom is stuck in neutral. The GTA critique counts items such as the number of anti-dumping actions initiated, which may also aff ect the non-tariff bar-rier penalty assessed in the Index. However, the biggest factor in the Index trade freedom score is a coun-try’s overall weighted average tariff rate, which may not be signifi cantly aff ected by protectionist anti-dump-ing measures.
Understanding the Benefi ts of trade
A comparison of the countries with the best trade scores in the 2013 Index of Economic Freedom with those that have the worst scores demonstrates the importance of trade freedom. Countries with the most trade freedom have higher per
1. See Table 1 at the end of this report.
2. The 2013 Index of Economic Freedom will be published in January 2013. The trade freedom rankings, which account for 10 percent of a country’s overall economic freedom score, were originally released on October 25, 2012 at the request of the Millennium Challenge Corporation, which uses them as part of its criteria for determining countries’ eligibility for grants, and were revised on November 2, 2012.
3. Authors’ calculation from World Trade Organization, “Short-Term Merchandise Trade Statistics,” http://www.wto.org/english/res_e/statis_e/quarterly_world_exp_e.htm (accessed October 16, 2012).
4. News release, “Slow Global Growth to Hit Trade in 2012 and 2013, WTO Says,” World Trade Organization, September 21, 2012, http://www.wto.org/english/news_e/pres12_e/pr676_e.htm (accessed October 16, 2012).
5. “Canada to Scrap Tariff s on Manufacturing Inputs,” Reuters, March 4, 2010, http://www.reuters.com/article/2010/03/04/idUSCFB00011320100304?type=marketsNews (accessed October 16, 2012).
6. “Stakeholders Reach Consensus on Africa Free Trade Zone,” Ghana Business News, September 30, 2012, http://www.ghanabusinessnews.com/stakeholders-reach-consensus-on-africa-free-trade-zone/ (accessed October 16, 2012).
7. The other 10 countries are: Australia, Brunei, Canada, Chile, Malaysia, Mexico, New Zealand, Peru, Singapore, and Vietnam.
8. See, for example, “No Additional Sugar Access for Australia in TPP,” American Sugar Alliance, August 8, 2012, http://www.sugaralliance.org/newsroom/no-additional-sugar-access-for-australia-in-tpp.html (accessed October 16, 2012).
9. Global Trade Alert, “Débâcle: The 11th GTA Report on Protectionism,” June 2012, http://www.globaltradealert.org/sites/default/fi les/GTA11_0.pdf (accessed October 16, 2012).
40
50
60
70
80
90
100
1995 2000 2005 2010 2013
CHART 1
Source: Heritage Foundation calculations from the 2013 Index of Economic Freedom (forthcoming January 2013).
The average trade freedom score in the Index of Economic Freedom rose steadily for 15 years, but has remained flat since 2011.
AVERAGE TRADE FREEDOM SCORE IN THE INDEX OF ECONOMIC FREEDOM
Global Trade Freedom Levels O�
heritage.orgSR 123
56.7
74.574.5
3
speciAl report | NO. 123OCTOBER 25, 2012
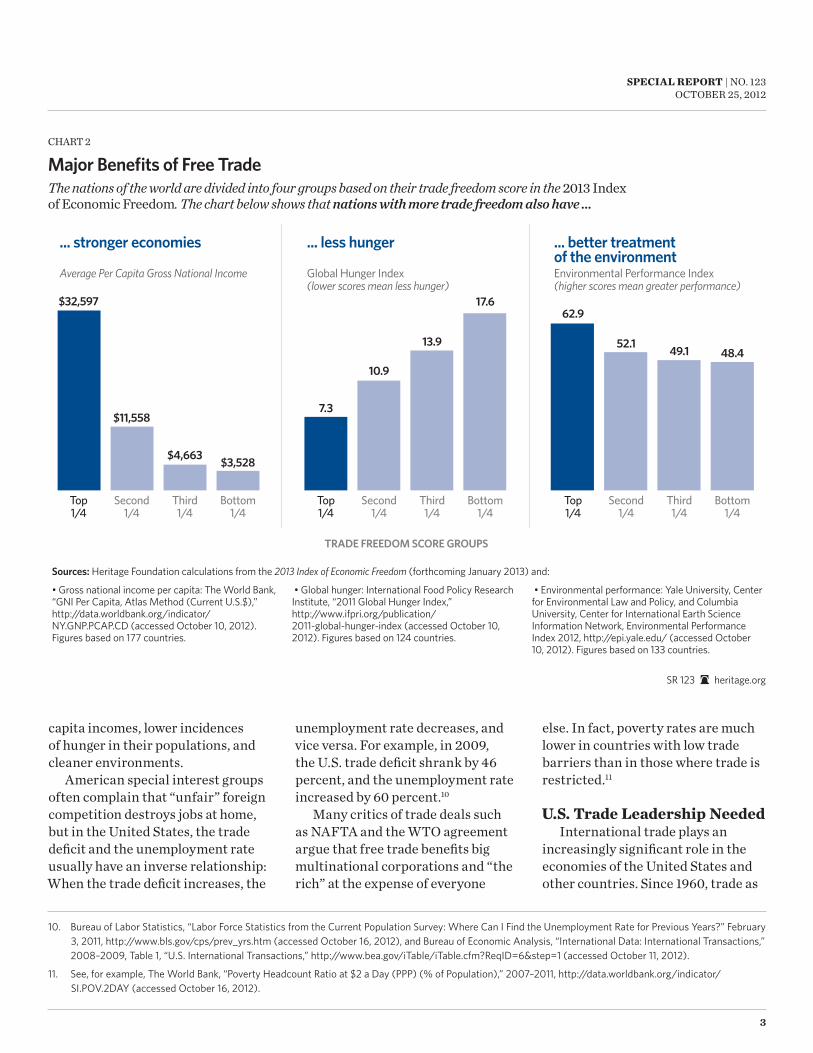
capita incomes, lower incidences of hunger in their populations, and cleaner environments.
American special interest groups often complain that “unfair” foreign competition destroys jobs at home, but in the United States, the trade deficit and the unemployment rate usually have an inverse relationship: When the trade deficit increases, the
unemployment rate decreases, and vice versa. For example, in 2009, the U.S. trade deficit shrank by 46 percent, and the unemployment rate increased by 60 percent.10
Many critics of trade deals such as NAFTA and the WTO agreement argue that free trade benefits big multinational corporations and “the rich” at the expense of everyone
else. In fact, poverty rates are much lower in countries with low trade barriers than in those where trade is restricted.11
U.s. trade leadership Needed International trade plays an
increasingly significant role in the economies of the United States and other countries. Since 1960, trade as
10. Bureau of Labor Statistics, “Labor Force Statistics from the Current Population Survey: Where Can I Find the Unemployment Rate for Previous Years?” February 3, 2011, http://www.bls.gov/cps/prev_yrs.htm (accessed October 16, 2012), and Bureau of Economic Analysis, “International Data: International Transactions,” 2008–2009, Table 1, “U.S. International Transactions,” http://www.bea.gov/iTable/iTable.cfm?ReqID=6&step=1 (accessed October 11, 2012).
11. See, for example, The World Bank, “Poverty Headcount Ratio at $2 a Day (PPP) (% of Population),” 2007–2011, http://data.worldbank.org/indicator/SI.POV.2DAY (accessed October 16, 2012).
Top1/4
Second1/4
Third1/4
Bottom1/4
$32,597
$11,558
$4,663 $3,528
Average Per Capita Gross National Income
... stronger economies
TRADE FREEDOM SCORE GROUPS
Top1/4
Second1/4
Third1/4
Bottom1/4
7.3
10.9
13.9
17.6
Global Hunger Index(lower scores mean less hunger)
... less hunger
Top1/4
Second1/4
Third1/4
Bottom1/4
62.9
52.1 49.1 48.4
Environmental Performance Index(higher scores mean greater performance)
... better treatment of the environment
Sources: Heritage Foundation calculations from the 2013 Index of Economic Freedom (forthcoming January 2013) and:
• Gross national income per capita: The World Bank, “GNI Per Capita, Atlas Method (Current U.S.$),” http://data.worldbank.org/indicator/ NY.GNP.PCAP.CD (accessed October 10, 2012). Figures based on 177 countries.
• Global hunger: International Food Policy Research Institute, “2011 Global Hunger Index,” http://www.ifpri.org/publication/ 2011-global-hunger-index (accessed October 10, 2012). Figures based on 124 countries.
• Environmental performance: Yale University, Center for Environmental Law and Policy, and Columbia University, Center for International Earth Science Information Network, Environmental Performance Index 2012, http://epi.yale.edu/ (accessed October 10, 2012). Figures based on 133 countries.
CHART 2
The nations of the world are divided into four groups based on their trade freedom score in the 2013 Index of Economic Freedom. The chart below shows that nations with more trade freedom also have ...
Major Benefits of Free Trade
heritage.orgSR 123
4
2013 iNDeX oF ecoNoMic FreeDoM: No Boost iN trADe FreeDoM
a percentage of gross domestic prod-uct (GDP) for the world has doubled. Trade as a percentage of U.S. GDP has nearly tripled, but remains lower than the world average due to the large U.S. internal market.12
Historically, the United States has led eff orts to expand global trade freedom. Since 1980, U.S. tariff rates have dropped by 58 percent, and tariff s in other countries have fallen an average of 50 percent just since 1998.13 With the U.S.–Canada free trade agreement and then NAFTA,
the United States initiated a healthy global contest to see which coun-try can sign the most free trade agreements. Today, 239 regional trade agreements are in force, and dozens more are currently being negotiated.14
Thanks to U.S. leadership in the Uruguay Round trade talks, 123 countries collectively implemented the largest global tax cut in his-tory and created the World Trade Organization to mediate trade disputes. Trade disagreements that
could have escalated into trade wars in the past can now be moderated by impartial referees.
By eliminating U.S. quotas on textiles and apparel in 2005, the U.S. government allowed America’s poor-est citizens more access to aff ordable clothing. And, by off ering people in developing countries more oppor-tunities to do business with the U.S., they gained an alternative to depen-dence on foreign aid.
Unfortunately, the long delays by the Obama Administration in imple-menting the Colombia, Panama, and South Korea free trade agreements eff ectively destroyed momentum for trade liberalization in the United States. A much ballyhooed pivot to Asia has only increased atten-tion on excessive U.S. posturing on environmental standards and labor regulations in connection with the negotiations of the Trans-Pacifi c Partnership, not to mention U.S. foot-dragging on long-standing U.S. protectionism in dairy, sugar, and textiles.
excessive Federal spending and trade policy
The U.S. trade defi cit has led some Members of Congress to call for new trade barriers, but they would better serve their constituents by restrain-ing excessive government spend-ing and the resulting federal budget defi cit. The government recently announced that it is expected to run a budget defi cit of more than $1 trillion for the fourth straight year. One often-overlooked result of these large budget defi cits is their negative impact on U.S. exporters.
12. The World Bank, “Trade (% of GDP),” http://data.worldbank.org/indicator/NE.TRD.GNFS.ZS (accessed October 18, 2012).
13. Authors’ calculations from U.S. International Trade Commission, “Interactive Tariff and Trade Dataweb,” http://dataweb.usitc.gov/ (accessed October 17, 2012), and World Bank, “Weighted Mean Applied Tariff ,” http://data.worldbank.org/indicator/TM.TAX.MRCH.WM.AR.ZS (accessed October 17, 2012).
14. World Trade Organization, Regional Trade Agreements Integration System, http://rtais.wto.org/UI/PublicAllRTAList.aspx (accessed October 12, 2012).
$0
$50
$100
$150
$200
$250
$300
Services Capital goods*
Treasury securities
Industrial supplies
and materials
Consumer goods
Auto-motive
vehicles, etc.
Foods, feeds, and beverages
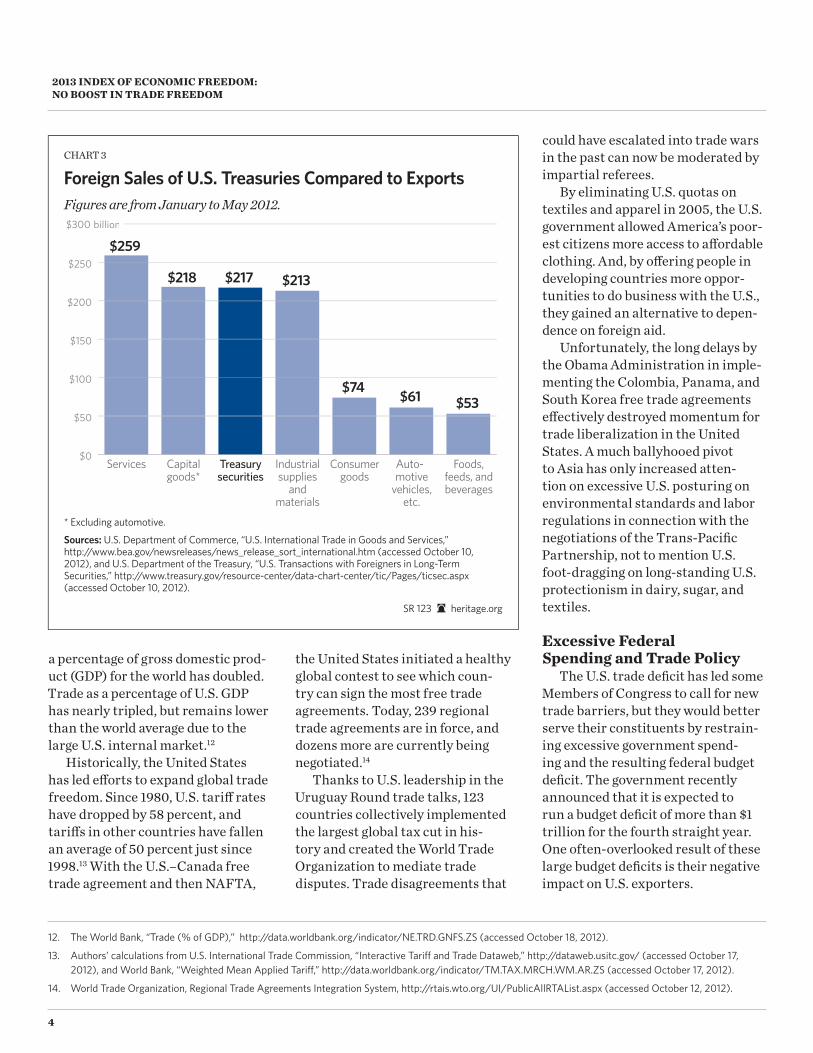
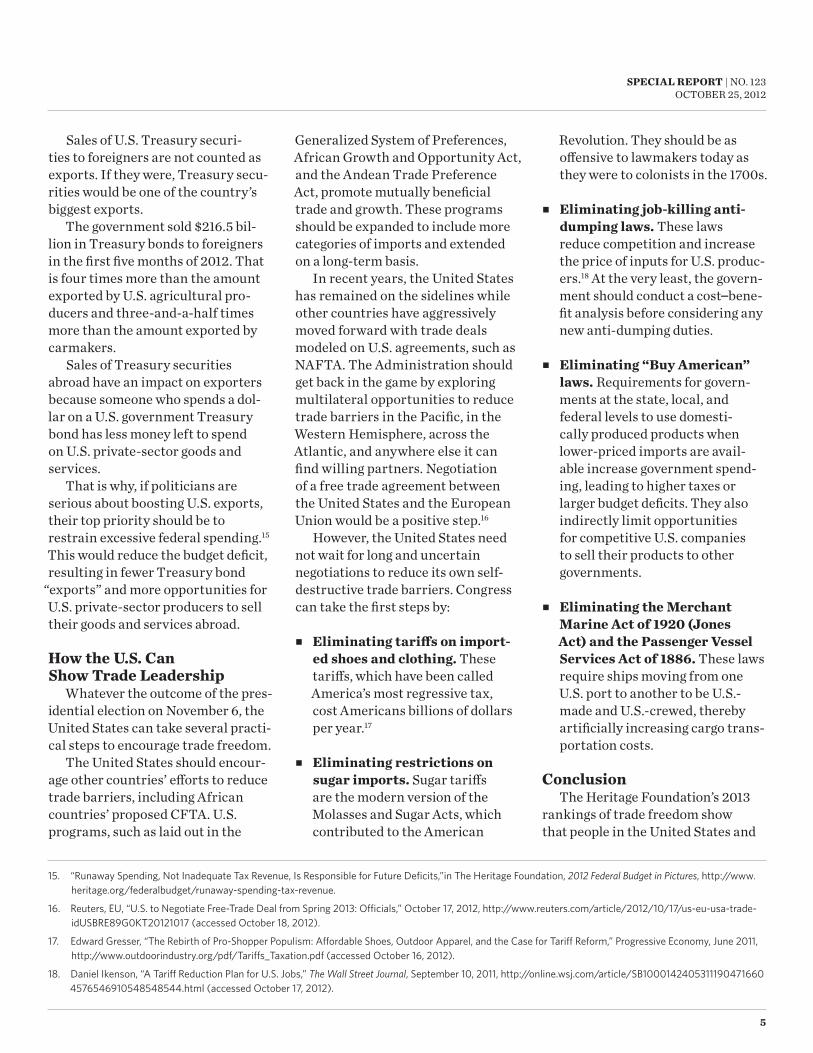
$259
$218 $217 $213
$74 $61 $53
* Excluding automotive.
CHART 3
Sources: U.S. Department of Commerce, “U.S. International Trade in Goods and Services,” http://www.bea.gov/newsreleases/news_release_sort_international.htm (accessed October 10, 2012), and U.S. Department of the Treasury, “U.S. Transactions with Foreigners in Long-Term Securities,” http://www.treasury.gov/resource-center/data-chart-center/tic/Pages/ticsec.aspx (accessed October 10, 2012).
Figures are from January to May 2012.
Foreign Sales of U.S. Treasuries Compared to Exports
heritage.orgSR 123
billionbillion
5
speciAl report | NO. 123OCTOBER 25, 2012
Sales of U.S. Treasury securi-ties to foreigners are not counted as exports. If they were, Treasury secu-rities would be one of the country’s biggest exports.
The government sold $216.5 bil-lion in Treasury bonds to foreigners in the first five months of 2012. That is four times more than the amount exported by U.S. agricultural pro-ducers and three-and-a-half times more than the amount exported by carmakers.
Sales of Treasury securities abroad have an impact on exporters because someone who spends a dol-lar on a U.S. government Treasury bond has less money left to spend on U.S. private-sector goods and services.
That is why, if politicians are serious about boosting U.S. exports, their top priority should be to restrain excessive federal spending.15 This would reduce the budget deficit, resulting in fewer Treasury bond
“exports” and more opportunities for U.S. private-sector producers to sell their goods and services abroad.
How the U.s. can show trade leadership
Whatever the outcome of the pres-idential election on November 6, the United States can take several practi-cal steps to encourage trade freedom.
The United States should encour-age other countries’ efforts to reduce trade barriers, including African countries’ proposed CFTA. U.S. programs, such as laid out in the
Generalized System of Preferences, African Growth and Opportunity Act, and the Andean Trade Preference Act, promote mutually beneficial trade and growth. These programs should be expanded to include more categories of imports and extended on a long-term basis.
In recent years, the United States has remained on the sidelines while other countries have aggressively moved forward with trade deals modeled on U.S. agreements, such as NAFTA. The Administration should get back in the game by exploring multilateral opportunities to reduce trade barriers in the Pacific, in the Western Hemisphere, across the Atlantic, and anywhere else it can find willing partners. Negotiation of a free trade agreement between the United States and the European Union would be a positive step.16
However, the United States need not wait for long and uncertain negotiations to reduce its own self-destructive trade barriers. Congress can take the first steps by:
■■ eliminating tariffs on import-ed shoes and clothing. These tariffs, which have been called America’s most regressive tax, cost Americans billions of dollars per year.17
■■ eliminating restrictions on sugar imports. Sugar tariffs are the modern version of the Molasses and Sugar Acts, which contributed to the American
Revolution. They should be as offensive to lawmakers today as they were to colonists in the 1700s.
■■ eliminating job-killing anti-dumping laws. These laws reduce competition and increase the price of inputs for U.S. produc-ers.18 At the very least, the govern-ment should conduct a cost–bene-fit analysis before considering any new anti-dumping duties.
■■ eliminating “Buy American” laws. Requirements for govern-ments at the state, local, and federal levels to use domesti-cally produced products when lower-priced imports are avail-able increase government spend-ing, leading to higher taxes or larger budget deficits. They also indirectly limit opportunities for competitive U.S. companies to sell their products to other governments.
■■ eliminating the Merchant Marine Act of 1920 (Jones Act) and the passenger Vessel services Act of 1886. These laws require ships moving from one U.S. port to another to be U.S.-made and U.S.-crewed, thereby artificially increasing cargo trans-portation costs.
conclusion The Heritage Foundation’s 2013
rankings of trade freedom show that people in the United States and
15. “Runaway Spending, Not Inadequate Tax Revenue, Is Responsible for Future Deficits,”in The Heritage Foundation, 2012 Federal Budget in Pictures, http://www.heritage.org/federalbudget/runaway-spending-tax-revenue.
16. Reuters, EU, “U.S. to Negotiate Free-Trade Deal from Spring 2013: Officials,” October 17, 2012, http://www.reuters.com/article/2012/10/17/us-eu-usa-trade-idUSBRE89G0KT20121017 (accessed October 18, 2012).
17. Edward Gresser, “The Rebirth of Pro-Shopper Populism: Affordable Shoes, Outdoor Apparel, and the Case for Tariff Reform,” Progressive Economy, June 2011, http://www.outdoorindustry.org/pdf/Tariffs_Taxation.pdf (accessed October 16, 2012).
18. Daniel Ikenson, “A Tariff Reduction Plan for U.S. Jobs,” The Wall Street Journal, September 10, 2011, http://online.wsj.com/article/SB10001424053111904716604576546910548548544.html (accessed October 17, 2012).
6
2013 Index of economIc freedom: no Boost In trade freedom
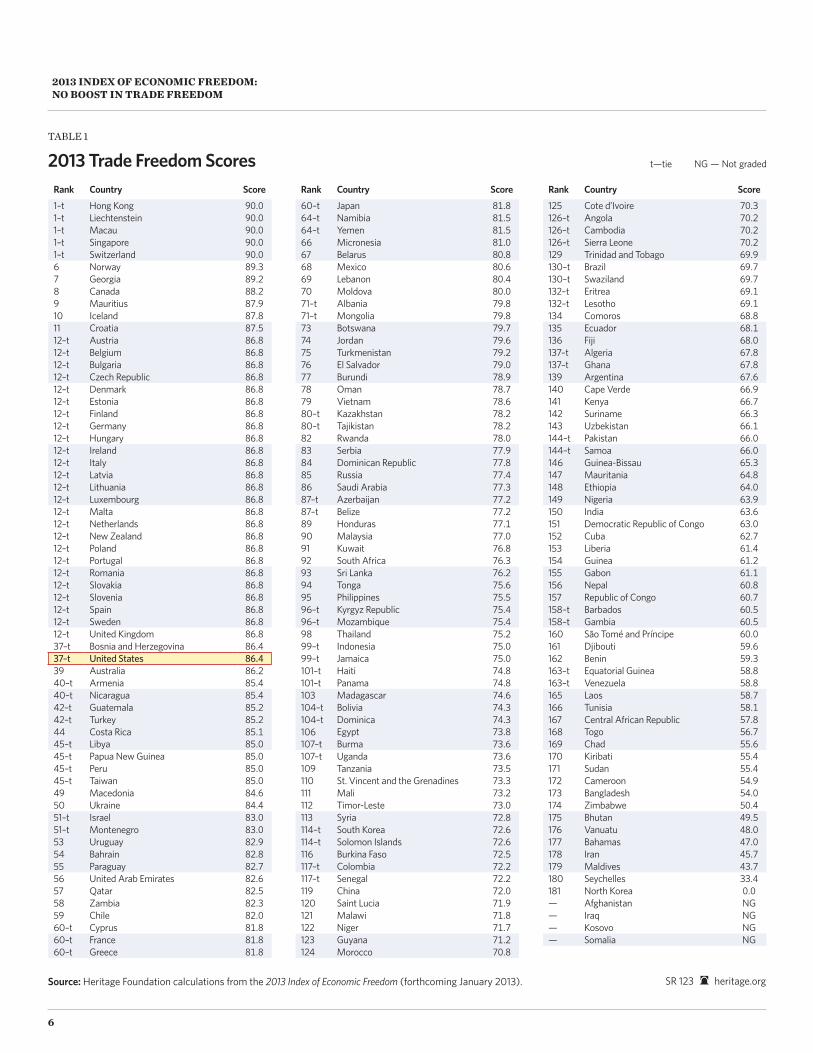
Rank Country Score Rank Country Score Rank Country Score
1–t Hong Kong 90.0 60–t Japan 81.8 125 Cote d’Ivoire 70.31–t Liechtenstein 90.0 64–t Namibia 81.5 126–t Angola 70.21–t Macau 90.0 64–t Yemen 81.5 126–t Cambodia 70.21–t Singapore 90.0 66 Micronesia 81.0 126–t Sierra Leone 70.21–t Switzerland 90.0 67 Belarus 80.8 129 Trinidad and Tobago 69.96 Norway 89.3 68 Mexico 80.6 130–t Brazil 69.77 Georgia 89.2 69 Lebanon 80.4 130–t Swaziland 69.78 Canada 88.2 70 Moldova 80.0 132–t Eritrea 69.19 Mauritius 87.9 71–t Albania 79.8 132–t Lesotho 69.110 Iceland 87.8 71–t Mongolia 79.8 134 Comoros 68.811 Croatia 87.5 73 Botswana 79.7 135 Ecuador 68.112–t Austria 86.8 74 Jordan 79.6 136 Fiji 68.012–t Belgium 86.8 75 Turkmenistan 79.2 137–t Algeria 67.812–t Bulgaria 86.8 76 El Salvador 79.0 137–t Ghana 67.812–t Czech Republic 86.8 77 Burundi 78.9 139 Argentina 67.612–t Denmark 86.8 78 Oman 78.7 140 Cape Verde 66.912–t Estonia 86.8 79 Vietnam 78.6 141 Kenya 66.712–t Finland 86.8 80–t Kazakhstan 78.2 142 Suriname 66.312–t Germany 86.8 80–t Tajikistan 78.2 143 Uzbekistan 66.112–t Hungary 86.8 82 Rwanda 78.0 144–t Pakistan 66.012–t Ireland 86.8 83 Serbia 77.9 144–t Samoa 66.012–t Italy 86.8 84 Dominican Republic 77.8 146 Guinea-Bissau 65.312–t Latvia 86.8 85 Russia 77.4 147 Mauritania 64.812–t Lithuania 86.8 86 Saudi Arabia 77.3 148 Ethiopia 64.012–t Luxembourg 86.8 87–t Azerbaijan 77.2 149 Nigeria 63.912–t Malta 86.8 87–t Belize 77.2 150 India 63.612–t Netherlands 86.8 89 Honduras 77.1 151 Democratic Republic of Congo 63.012–t New Zealand 86.8 90 Malaysia 77.0 152 Cuba 62.712–t Poland 86.8 91 Kuwait 76.8 153 Liberia 61.412–t Portugal 86.8 92 South Africa 76.3 154 Guinea 61.212–t Romania 86.8 93 Sri Lanka 76.2 155 Gabon 61.112–t Slovakia 86.8 94 Tonga 75.6 156 Nepal 60.812–t Slovenia 86.8 95 Philippines 75.5 157 Republic of Congo 60.712–t Spain 86.8 96–t Kyrgyz Republic 75.4 158–t Barbados 60.512–t Sweden 86.8 96–t Mozambique 75.4 158–t Gambia 60.512–t United Kingdom 86.8 98 Thailand 75.2 160 São Tomé and Príncipe 60.037–t Bosnia and Herzegovina 86.4 99–t Indonesia 75.0 161 Djibouti 59.637–t United States 86.4 99–t Jamaica 75.0 162 Benin 59.339 Australia 86.2 101–t Haiti 74.8 163–t Equatorial Guinea 58.840–t Armenia 85.4 101–t Panama 74.8 163–t Venezuela 58.840–t Nicaragua 85.4 103 Madagascar 74.6 165 Laos 58.742–t Guatemala 85.2 104–t Bolivia 74.3 166 Tunisia 58.142–t Turkey 85.2 104–t Dominica 74.3 167 Central African Republic 57.844 Costa Rica 85.1 106 Egypt 73.8 168 Togo 56.745–t Libya 85.0 107–t Burma 73.6 169 Chad 55.645–t Papua New Guinea 85.0 107–t Uganda 73.6 170 Kiribati 55.445–t Peru 85.0 109 Tanzania 73.5 171 Sudan 55.445–t Taiwan 85.0 110 St. Vincent and the Grenadines 73.3 172 Cameroon 54.949 Macedonia 84.6 111 Mali 73.2 173 Bangladesh 54.050 Ukraine 84.4 112 Timor-Leste 73.0 174 Zimbabwe 50.451–t Israel 83.0 113 Syria 72.8 175 Bhutan 49.551–t Montenegro 83.0 114–t South Korea 72.6 176 Vanuatu 48.053 Uruguay 82.9 114–t Solomon Islands 72.6 177 Bahamas 47.054 Bahrain 82.8 116 Burkina Faso 72.5 178 Iran 45.755 Paraguay 82.7 117–t Colombia 72.2 179 Maldives 43.756 United Arab Emirates 82.6 117–t Senegal 72.2 180 Seychelles 33.457 Qatar 82.5 119 China 72.0 181 North Korea 0.058 Zambia 82.3 120 Saint Lucia 71.9 — Afghanistan NG59 Chile 82.0 121 Malawi 71.8 — Iraq NG60–t Cyprus 81.8 122 Niger 71.7 — Kosovo NG60–t France 81.8 123 Guyana 71.2 — Somalia NG60–t Greece 81.8 124 Morocco 70.8
TABLE 1
2013 Trade Freedom Scores t—tie NG — Not graded
Source: Heritage Foundation calculations from the 2013 Index of Economic Freedom (forthcoming January 2013). SR 123 heritage.org
7
speciAl report | NO. 123OCTOBER 25, 2012
around the world benefit when their governments allow them to trade freely. Reducing trade barriers in the United States and in other countries would generate beneficial results including less poverty and greater prosperity for the 7 billion people across the globe.
8
2013 Index of economIc freedom: no Boost In trade freedom
AppendixMethodology
The trade freedom scores report-ed in this paper are based on two inputs: trade-weighted average tariff rates and non-tariff barriers (NTBs).
Different imports entering a coun-try can, and often do, face different tariffs. The weighted average tariff uses weights for each tariff based on the share of imports for each good. Weighted average tariffs are a purely quantitative measure and account for the basic calculation of the score using the equation
Trade Freedomi = (((Tariffmax – Tariffmin) / (Tariffmax – Tariffmin)) x 100) – NTBi
where “Trade Freedomi” repre-sents the trade freedom in country i, “Tariffmax” and “Tariffmin” represent the upper and lower bounds for tariff rates, and “Tariffi”represents the weighted average tariff rate in coun-try i. The minimum tariff is naturally zero, and the upper bound was set as a score of 50. An NTB penalty is then subtracted from the base score. The penalty of 5, 10, 15, or 20 points is assigned according to the following scale:
■■ Penalty of 20: NTBs are used extensively across many goods and services and/or act to impede a significant amount of interna-tional trade.
■■ Penalty of 15: NTBs are wide-spread across many goods and services and/or act to impede a majority of potential internation-al trade.
■■ Penalty of 10: NTBs are used to protect certain goods and services
and impede some international trade.
■■ Penalty of 5: NTBs are uncommon, protecting few goods and services, and/or have very limited impact on international trade.
■■ No penalty: NTBs are not used to limit international trade.
Both qualitative and quantitative information is used to determine the extent of NTBs in a country’s trade policy regime. Restrictive rules that hinder trade vary widely, and their overlapping and shifting nature makes it difficult to gauge their com-plexity. The categories of NTBs con-sidered in the trade freedom penalty include:
■■ Quantity restrictions: import quotas, export limitations, vol-untary export restraints, import/export embargoes and bans, coun-tertrade measures, etc.;
■■ price restrictions: antidump-ing duties, countervailing duties, border tax adjustments, variable levies/tariff rate quotas;
■■ regulatory restrictions: licens-ing; domestic content and mixing requirements; sanitary and phy-tosanitary standards; safety and industrial standards regulations; packaging, labeling, and trade-mark regulations; advertising and media regulations;
■■ customs restrictions: advance deposit requirements; customs valuation procedures; cus-toms classification procedures;
customs clearance procedures; and
■■ Direct government interven-tion: subsidies and other aids; government industrial policy and regional development mea-sures; government-financed research and other technology policies; national taxes and social insurance; competition policies; immigration policies; government procurement policies; state trad-ing, government monopolies, and exclusive franchises.
An example: In 2013, France received a trade freedom score of 81.8, based on the weighted average tariff of 1.6 percent common to all European Union countries. The tariff yields a base score of 96.8, but the existence of significant French NTBs reduces the nation’s trade freedom score by 15 points.
Gathering data on tariffs to make a consistent cross-country compari-son can be a challenging task. Unlike data on inflation, for instance, coun-tries do not report their weighted average tariff rate or simple average tariff rate every year. To preserve consistency in grading trade policy, the authors use the World Bank’s most recently reported weighted average tariff rate for a country. If another reliable source reports more updated information on a country’s tariff rate, the authors note this fact and may review the grading if there is strong evidence that the most recently reported weighted average tariff rate is outdated.
The World Bank produces the most comprehensive and con-sistent information on weighted
9
speciAl report | NO. 123OCTOBER 25, 2012
average applied tariff rates. When the weighted average applied tariff rate is not available, the authors use the country’s average applied tariff rate; and when the country’s average applied tariff rate is not available, the authors use the weighted average or the simple average of most-favored-nation (MFN) tariff rates.19 In the very few cases in which data on duties and customs revenues are not available, the authors use interna-tional trade tax data instead.
In all cases, the authors clarify the type of data used and the dif-ferent sources for those data in the corresponding write-up for the trade policy factor. Sometimes, when none of this information is available, the authors simply analyze the over-all tariff structure and estimate an effective tariff rate.
The trade freedom scores for 2013 are based on data for the period
covering the second half of 2011 through the first half of 2012. To the extent possible, the information con-sidered is current as of June 30, 2012. Any changes in law effective after that date have no positive or negative impact.
Finally, unless otherwise noted, the authors used the following sources to determine scores for trade policy, in order of priority:
■■ The World Bank, World Development Indicators 2012 and Data on Trade and Import Barriers: Trends in Average Applied Tariff Rates in Developing and Industrial Countries, 1981–2009;
■■ The World Trade Organization, Trade Policy Review, 1995–2012;
■■ Office of the U.S. Trade Representative, 2012 National
Trade Estimate Report on Foreign Trade Barriers;
■■ The World Bank, Doing Business 2011 and Doing Business 2012;
■■ U.S. Department of Commerce, Country Commercial Guide, 2009–2012;
■■ Economist Intelligence Unit, Country Report, Country Profile, and Country Commerce, 2008–2011; and
■■ Official government publications of each country.
19. The most-favored-nation tariff rate is the “normal” non-discriminatory tariff charged on imports. In commercial diplomacy, exporters seek MFN treatment—that is, the promise that they will be treated as well as the most favored exporter. The MFN rule requires that the concession be extended to all other members of the World Trade Organization. MFN is now referred to as permanent normal trade relations (PNTR).

214 Massachusetts Avenue, NEWashington, DC 20002
(202) 546-4400 heritage.org