2013 integrated annual report - jse avi’s stakeholders with a ... the release of avi’s...
TRANSCRIPT
2013 integrated annUaL rePOrt
aV
i 20
13
int
eg
ra
te
d a
nn
Ua
L r
eP
Or
t
about this rePOrt
board resPOnsibiLity
contents
AVI’s Integrated Annual Report covers the economic, environmental and social activities of the Group for the period 1 July 2012 to 30 June 2013 and aims to provide AVI’s stakeholders with a transparent, balanced and holistic view of the Group’s performance. In addition, where it is informative to add information post 30 June 2013, this has been included and noted.
This report covers the entire Group, comprising Entyce Beverages, Snackworks, I&J and Fashion brands. Since the release of AVI’s Integrated Annual Report for the year ended 30 June 2012, there has been no significant change to the structure, ownership or products and services of the Group other than the acquisition of the business of Green Cross with effect from 1 July 2012 and the disposal of the fresh fruit juice manufacturing operation of Real Juice with effect from 1 October 2012. Changes to the structure of the Group during the year have been noted in the Directors’ Report on page 75.
In compiling the report, AVI has considered the Companies Act, No 71 of 2008, as amended; the Listings Requirements of the JSE Limited; the King Report on Governance for South Africa, 2009 and the International Financial Reporting Standards (“IFRS”) in respect to the annual financial statements.
The Board of directors (“the Board”) acknowledges its responsibility to ensure the integrity of the Integrated Report. The Board has accordingly applied its mind to the Integrated Report and in their opinion the Integrated Report addresses all material issues, and presents fairly the integrated performance of the organisation and its impacts.
Any questions or comments on the report can be forwarded to [email protected].
AVI LIMITED
ISIN: ZAE000049433Share code: AVIRegistration number: 1944/017201/06(“AVI” or “the Group” or “the Company”)
www.avi.co.za
1 OVERVIEW
1 Our business
1 Operating structure
2 Our business highlights
4 Objectives and strategies
6 BUSINESS REVIEW
6 Chairman and CEO’s review
10 Operational reviews
10 entyce beverages
12 snackworks
14 I & J
16 FashIon brands
22 InternatIonal
24 Financial review
32 Sustainable development report
54 GOVERNANCE
54 Board of directors
56 Corporate governance report
66 Remuneration report
71 ANNUAL FINANCIAL STATEMENTS
156 SHAREHOLDER INFORMATION

1
our business
OPeRATinG STruCTurE
AVi
enTYCe beVeRAGes snACKWORKs i&J PeRsOnAL CARe FOOTWeAR AnD APPAReL sHAReD seRViCes
TeA bisCuiTs seAFOOD inDiGO sPiTZ inTeRnATiOnAL
COFFee snACKs GeneRAL FOODs KuRT GeiGeR iT
CReAMeR GAnT HuMAn ResOuRCes
OuT OF HOMe GReen CROss FinAnCe
LOGisTiCs
FieLD MARKeTinG
MARKeTinG
Listed on the Johannesburg Stock Exchange in the
Food Products sector, AVI Limited’s extensive brand
portfolio includes more than 50 brands.
AVI’s lifeblood is its portfolio of remarkable brands,
many of which carry a heritage and pedigree built up
over decades and some of which occupy a place in our
national character. It would not be a stretch to claim
that the vast majority of South Africa’s population has
at some time or another been conscious of, consumed
or aspired to own, one of our brands.
AVI’s brands that have grown into great South African
favourites include:
• Five Roses, Freshpak, House of Coffees, Frisco,
Koffiehuis, Ellis Brown, Ciro and Lavazza in the
Beverages category;
• Bakers, Pyotts, Provita, Baumann’s and Willards in the
Biscuits and Snacks category;
• I&J in the Frozen category;
• Yardley, Lenthéric and Coty in Personal care and
Spitz, Carvela, Green Cross, Kurt Geiger, Lacoste,
Tosoni, Nina Roche and Gant in our Footwear and
Apparel portfolio.
We have 130 branded retail outlets under the Spitz, Kurt Geiger, Green Cross, Gant and Carvela brands.
This privileged position carries with it an obligation to
develop and manage each brand to its fullest potential.
We have structured our business to best suit this end.
We have four business units taking care of: beverages
including out of home solutions, sweet and savoury
snacks, frozen foods, and fashion brands are separated
into personal care brands, and footwear and apparel.
We also have a well-developed shared services
structure spanning: International, IT, Finance, Human
Resources, Logistics, Marketing and Field Marketing
that allows us to take advantage of our scale and
deliver more for less.
With a turnover of R9,22 billion in this last financial year,
AVI’s brands are a household name in South Africa and
growing every day.
OV
ER
VIE
WB
USIN
ESS R
EV
IEW
GO
VE
RN
AN
CE
AN
NU
AL FIN
AN
CIA
L STATE
ME
NTS
SHA
RE
HO
LDE
R IN
FOR
MA
TION
2
OuR business HIGHLIGHTS
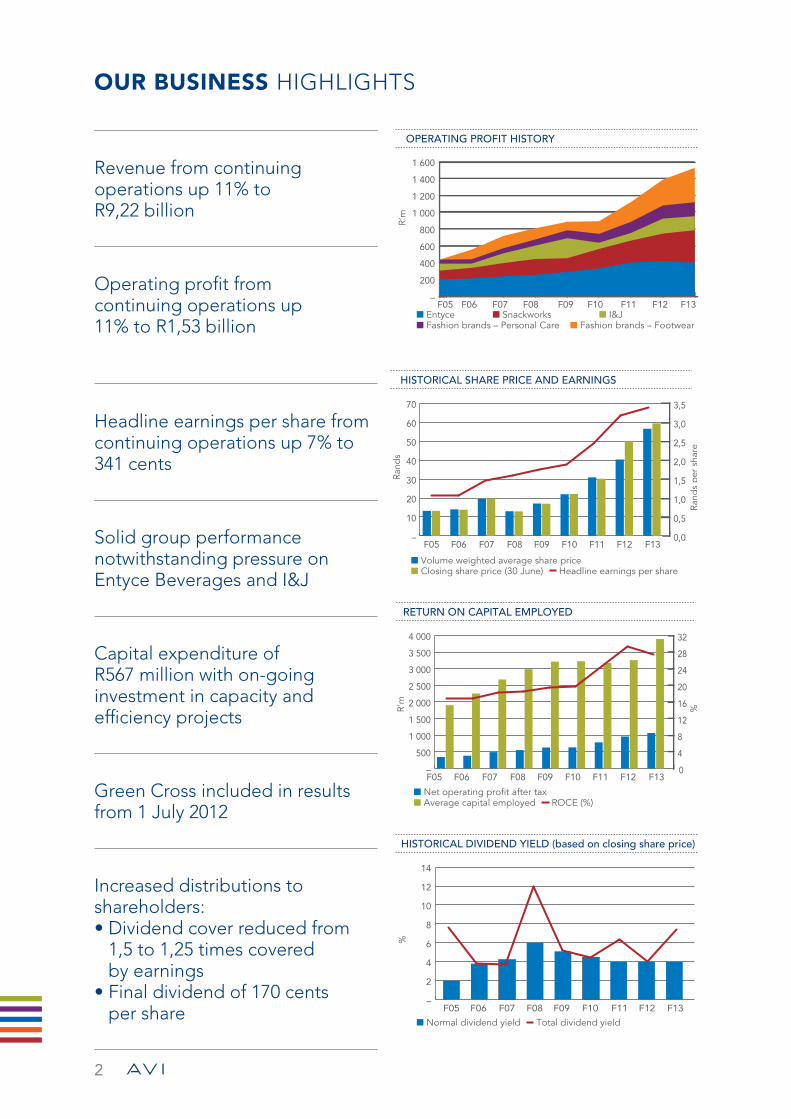
revenue from continuing operations up 11% to r9,22 billion
operating profit from continuing operations up 11% to r1,53 billion
Headline earnings per share from continuing operations up 7% to 341 cents
Solid group performance notwithstanding pressure on Entyce Beverages and I&J
Capital expenditure of r567 million with on-going investment in capacity and efficiency projects
Green Cross included in results from 1 July 2012
Increased distributions to shareholders:• Dividend cover reduced from
1,5 to 1,25 times covered by earnings
• Final dividend of 170 cents per share
OPERATING PROFIT HISTORY
R’m
■ Entyce ■ Snackworks ■ I&J■ Fashion brands – Personal Care ■ Fashion brands – Footwear
–
200
400
600
800
1 000
1 200
1 400
1 600
F05 F06 F07 F08 F09 F10 F11 F12 F13
HISTORICAL SHARE PRICE AND EARNINGSRa
nds
■ Volume weighted average share price ■ Closing share price (30 June) Headline earnings per share
F05 F06 F07 F08 F09 F10 F11 F12 F13–
10
20
30
40
50
60
70
0,0
0,5
1,0
1,5
2,0
2,5
3,0
3,5
Rand
s p
er s
hare
RETURN ON CAPITAL EMPLOYED
■ Net operating pro�t after tax ■ Average capital employed ROCE (%)
F05 F06 F07 F08 F09 F10 F11 F12 F13–
500
1 000
1 500
2 000
2 500
3 000
3 500
4 000
0
4
8
12
16
20
24
28
32
R’m
%
HISTORICAL DIVIDEND YIELD (based on closing share price)
%
■ Normal dividend yield Total dividend yield
F05 F06 F07 F08 F09 F10 F11 F12 F13–
2
4
6
8
10
12
14
3
2013R’m
2012R’m
2011R’m
2010R’m
2009R’m
Change 2013
vs 2012 %
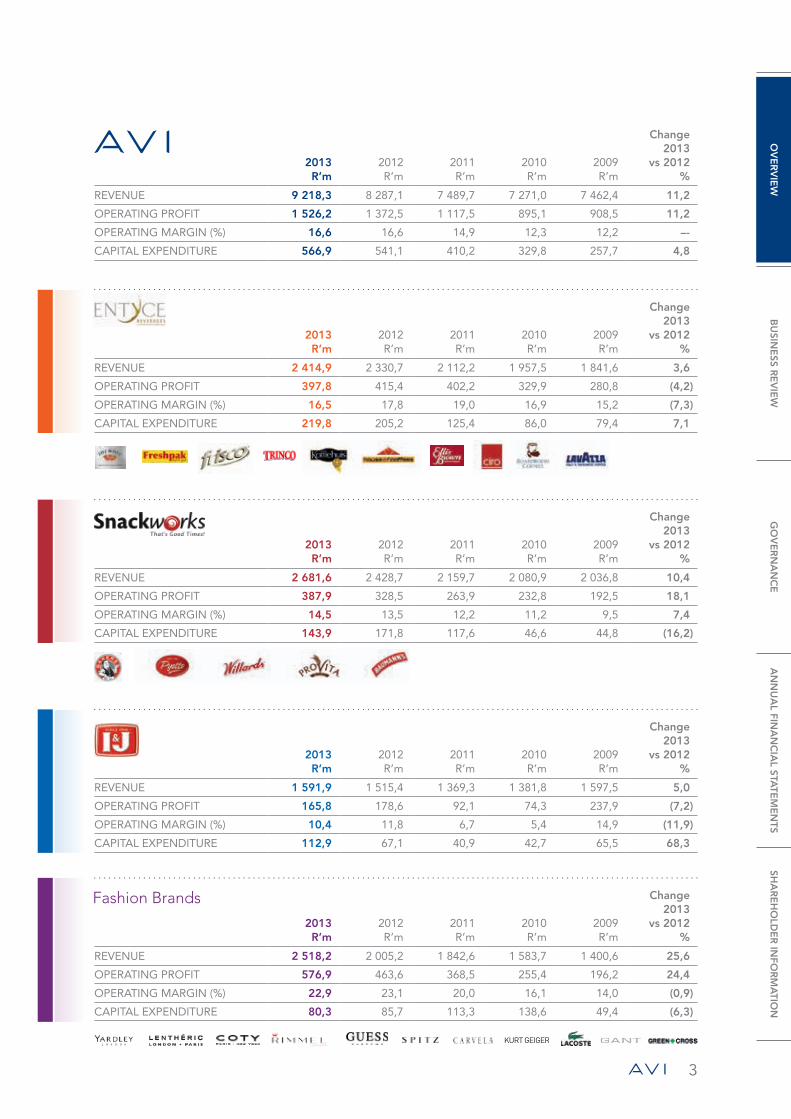
REVENUE 9 218,3 8 287,1 7 489,7 7 271,0 7 462,4 11,2
OPERATING PROFIT 1 526,2 1 372,5 1 117,5 895,1 908,5 11,2
OPERATING MARGIN (%) 16,6 16,6 14,9 12,3 12,2 –-
CAPITAL EXPENDITURE 566,9 541,1 410,2 329,8 257,7 4,8
2013R’m
2012R’m
2011R’m
2010R’m
2009R’m
Change 2013
vs 2012 %
REVENUE 2 414,9 2 330,7 2 112,2 1 957,5 1 841,6 3,6
OPERATING PROFIT 397,8 415,4 402,2 329,9 280,8 (4,2)
OPERATING MARGIN (%) 16,5 17,8 19,0 16,9 15,2 (7,3)
CAPITAL EXPENDITURE 219,8 205,2 125,4 86,0 79,4 7,1
2013R’m
2012R’m
2011R’m
2010R’m
2009R’m
Change 2013
vs 2012 %
REVENUE 1 591,9 1 515,4 1 369,3 1 381,8 1 597,5 5,0
OPERATING PROFIT 165,8 178,6 92,1 74,3 237,9 (7,2)
OPERATING MARGIN (%) 10,4 11,8 6,7 5,4 14,9 (11,9)
CAPITAL EXPENDITURE 112,9 67,1 40,9 42,7 65,5 68,3
2013R’m
2012R’m
2011R’m
2010R’m
2009R’m
Change 2013
vs 2012 %
REVENUE 2 518,2 2 005,2 1 842,6 1 583,7 1 400,6 25,6
OPERATING PROFIT 576,9 463,6 368,5 255,4 196,2 24,4
OPERATING MARGIN (%) 22,9 23,1 20,0 16,1 14,0 (0,9)
CAPITAL EXPENDITURE 80,3 85,7 113,3 138,6 49,4 (6,3)
2013R’m
2012R’m
2011R’m
2010R’m
2009R’m
Change 2013
vs 2012 %
REVENUE 2 681,6 2 428,7 2 159,7 2 080,9 2 036,8 10,4
OPERATING PROFIT 387,9 328,5 263,9 232,8 192,5 18,1
OPERATING MARGIN (%) 14,5 13,5 12,2 11,2 9,5 7,4
CAPITAL EXPENDITURE 143,9 171,8 117,6 46,6 44,8 (16,2)
OV
ER
VIE
WB
USIN
ESS R
EV
IEW
GO
VE
RN
AN
CE
AN
NU
AL FIN
AN
CIA
L STATE
ME
NTS
SHA
RE
HO
LDE
R IN
FOR
MA
TION
4
AVi ObJeCTiVes AnD STraTEGIES
To be recognised as South Africa’s leading consumer brands manager
Brands are AVI’s lifeblood and we are endowed with a portfolio of remarkable brands, many of which carry a heritage and pedigree built up over decades and some of which occupy a place in our national character. It would not be a stretch to claim that the vast majority of South Africa’s population has at some time or another been conscious of, consumed or aspired to own, one of our brands. Coupled with this privileged position is an obligation to develop and manage each brand to its fullest potential.
The strength of our brands is a function of the value they deliver to our consumers which is underpinned by their quality, price and the innovation they embody. We strive to constantly improve this value by making our products more accessible and more desirable and we are committed to supporting the long-term competitiveness of our brands with appropriate investments behind marketing, research and new product development. We view our role not merely in terms of enhancing the position of our brands within a category, but of being a material contributor to the development of the categories themselves. It is not our objective to serve all consumers, but to service those whose needs are aligned with our business objectives better than anyone else by providing them with the most rewarding consumption experience. A happy consumer is the foundation of the growing volumes, market shares, profit margins and brand loyalty which drive success in the consumer products space.
To consistently outperform our peer group, both operationally and in shareholder returns
AVI’s financial success is measured first and foremost by the adequacy of returns generated for our shareholder community. Our twin return objectives reflect our goal of being an attractive investment vehicle over the long term, both relative to our peer set, and on an absolute basis. The benchmark for success against our relative
performance target is to earn top quartile total shareholder returns over successive rolling three-year periods, while that of our absolute performance target is to deliver real combined dividend and share price appreciation exceeding 10% per annum. The achievement of these benchmarks will depend crucially on AVI’s ability to service its customers and communities efficiently and effectively. This is not only a strong endorsement of the value added by our organisation but also a key underpin of the ongoing sustainability thereof.
To build sustainable and defensible positions in each of our priority markets and categories
We do not view legacy as an inhibitor of opportunity and are committed to operating in any market or category where our brands, products and organisational competencies endow us with a sustainable advantage over our competitors. We believe that long-term success is a function of focus and the discipline required to recognise where we can and cannot compete effectively.
Practically this perspective demands that we regularly reappraise the extent of our current activities and consider exiting areas where growth or profitability are deemed poor in the long run or where the competitive landscape is changing in ways that inhibit our on-going success. It also materially shapes the development of our organic and acquisitive growth initiatives by ensuring that the imperative and desire for growth are tempered by a true assessment of any new opportunity and our ability to sustain and enhance our competitiveness in the new market or category over the long term.
To maintain and develop a corporate structure that adds material value to our underlying business portfolio
Our corporate and shared services structures play a meaningful role in defining and enhancing our
5
competitiveness and are capable of supporting heightened long-term earnings growth. While we operate in many distinct categories our corporate ethos and enabling structures embrace a “one company” philosophy. They are an effective mechanism for leveraging the strength of our brands and exploiting the efficiency and productivity improvement, process simplification and cost-reduction opportunities inherent in their combined scale. They allow us to serve more consumers in more markets more efficiently and strengthen our importance to our key national retail partners.
To advance our absolute and relative competitiveness in each core category every year
The global consumer products’ environment is a vibrant space and one in which sustaining the saliency of one’s brands has become increasingly challenging. Rapid technological development, increased access to information and the relentless pace of global innovation have all contributed to the most fluid consumer environment in history. Better informed consumers have ever more demanding expectations from their brands and are faced with a wider portfolio of choices when making their consumption decision.
Our response to new opportunities, changing consumer preferences and lifestyles, and competitor activity will need to be quicker and more flexible than ever before. On-going success in this increasingly “winner-takes-all” environment demands a strong commitment to continuous improvement in all areas of our operations.
To sustain and develop an impeccable corporate reputation with all stakeholders
AVI’s standing as a leading South African corporate requires continued focus on ethical management practices. Beyond integrity and transparency in our dealings with our shareholders, customers, consumers,
employees and other stakeholders this also encompasses a commitment to ensuring that AVI plays its role as a corporate citizen to minimise any adverse environmental impact as a result of its operations and to improve the living standards and address the on-going need for transformation in the society in which it operates.
To attract, develop and retain the best talent in the industry
In the fierce competition for skills and talent AVI actively seeks to recruit, nurture and retain exceptional people recognising that they remain our strongest asset in developing our leading brand centric culture. We believe that our scale and opportunity reinforce our ability to attract and retain the talented individuals necessary to execute our strategies and contribute to the quality of functional leadership in an environment characterised by increasing skills shortages and intense competition for human capital.
Reinforce business returns with a prudent but nimble corporate capital allocation philosophy
The strength of its brand portfolio has resulted in AVI generating robust cash flows which often exceed the supply of investment opportunities that meet our strategic risk and return criteria. While we have strong ambitions for organic and value-adding acquisitive growth, this paradigm of cash generation in excess of reinvestment need is likely to persist in future. AVI will seek to supplement underlying shareholder return generation through an appropriate dividend cover and the prudent use of corporate capital management strategies including share repurchases, leverage and special dividends where appropriate.
OV
ER
VIE
WB
USIN
ESS R
EV
IEW
GO
VE
RN
AN
CE
AN
NU
AL FIN
AN
CIA
L STATE
ME
NTS
SHA
RE
HO
LDE
R IN
FOR
MA
TION

6
CHAiRMAn AnD CeO’s rEvIEw
GAVIN TIPPERChairman
OverviewSouth Africa’s economy continues to provide little new momentum for growth in consumer spending. In a year characterised by violent labour unrest, particularly in the mining sector, maturing credit extension to households and limited increases in house prices, consumers’ levels of disposable income have been limited with consequent effects on their spend. AVI’s results were sound taking account of the challenging consumer environment, the difficult first semester for I&J, increased competition in some categories and increased pressure on input costs stemming from the weaker Rand.
Snackworks delivered an excellent result for the year with strong volume growth supported by improved factory performance. Spitz also achieved high volume growth from new trading space and enduring strong demand for its core brands, resulting in leverage and profit growth despite the material negative impact of a weaker Rand on gross profit margins. Entyce had a more difficult year, having to contend with significant increases in tea input costs and increased competition in all of its categories which led to a small decrease in operating profit. I&J had an improved second semester, recovering much of the decline in first half results.
Green Cross was included from 1 July 2012 and made a contribution to the Group result for the year in line with our expectations at acquisition. The previous owners managed the business up to completion of the earn-out period at the end of February 2013 and then assisted with the transition to AVI appointed management by the end of the financial year.
Increased focus on our business in selected African markets yielded pleasing results with revenue growing 14,7% and operating profit 9,7%.
We witnessed yet again the strength of the Group’s brand portfolio over the last year. It has been a year notable for increasing competition amongst retailers and increased promotional activity with consumers chasing price points. It is apparent that many consumers are budget constrained and growth in many of the categories in which we operate slowed or declined over the year. It is a credit to our heritage brands and the role they play in consumers’ lives that many grew market share and sustained profitability despite the constraints for many consumers.
Notwithstanding the muted demand environment we continued to invest substantially in supporting our brands to ensure we delivered value, quality and innovation and by doing so secure the vital relationship between our brands and consumers for coming years.
AVI is dedicated to ensuring our operations are efficient with a strong emphasis on safety. We have made substantial progress over the last number of years in this regard, but we did see a deterioration in our disabling injury frequency rate from 0,83 to 1,01. Steps are continually being taken to proactively identify and prevent potentially harmful situations and improve employee training.

7
The first tranche of shares in the Company’s Black Staff Empowerment Share Scheme has vested and approximately 8 300 employees have benefited as participants and have received a total gross benefit of R71,3 million to date.
The Group has maintained its BBBEE rating at a level 4 during the year. As a responsible corporate citizen we will continue to strive for improvements in the various elements of the score card.
Financial reviewRevenue from continuing operations rose by 11,2%, from R8,29 billion to R9,22 billion with mostly cost driven selling price increases and volume growth in most categories. Gross profit rose by 9,2% to R4,11 billion with the consolidated gross profit margin declining from 45,4% to 44,6% largely due to higher fishing costs at I&J and the decision at Spitz to absorb part of the impact of a weaker Rand to support sales volumes. Operating profit increased by 11,2%, from R1,37 billion to R1,53 billion with the consolidated operating profit margin maintained at 16,6%.
Headline earnings from continuing operations rose by 9,4%, from R957,5 million to R1,05 billion due to higher net finance costs and lower earnings from I&J’s joint venture with Simplot in Australia, partially offset by a lower effective tax rate with Withholding Tax on Dividends replacing Secondary Tax on Companies. Headline earnings per share from continuing operations increased 6,6% from 320,0 cents to 341,2 cents with more shares in issue due to the vesting of employee share options.
Cash generated by operations remained strong, increasing by 7,2% to R1,56 billion. Working capital increased by R194,1 million reflecting volume growth and higher stock levels at year end in some of the businesses. Capital expenditure increased to R566,9 million with on-going expenditure on major projects to improve capacity, technology and efficiency as well as the purchase of previously leased office premises in Johannesburg. Other material cash out-flows during the period were dividends of R1,20 billion (including the special dividend of 180 cents per share), the acquisition of Green Cross for R379,8 million net of cash acquired, and taxation of R406,6 million. Net debt at the end of June 2013 was R697,2 million compared to net cash of R163,2 million at the end of June 2012.
In keeping with our objective of focusing our portfolio of brands AVI entered into an agreement in terms of which Clover Limited acquired 100% of Real Juice. The conditions precedent were fulfilled in September 2012 and consequently the transaction was recognised with
effect from 1 October 2012. The final purchase price of R62,4 million (after adjustments and interest) resulted in a capital profit of R40,9 million, after de-recognising the minority interest.
Denny was sold with effect from 1 July 2011 resulting in a capital profit in the prior period of R27,3 million before Capital Gains Taxation of R10,3 million.
DividendThe Board has approved a reduction in AVI’s annual dividend pay-out ratio from 1,5 to 1,25 times covered by diluted headline earnings from continuing operations. This is intended to return cash to shareholders more evenly, noting the frequent special dividends and share buy-backs over the last few years, and recognises the Group’s strong cash-generating ability and capacity for further gearing should attractive acquisition opportunities arise.
In terms of this new policy a final dividend of 170 cents per share has been declared, bringing the total normal dividend for the year to 260 cents, 28,1% higher than last year.
Investing for growthGrowth remains a key objective for the Group and a number of material projects were completed during the year. Operationally it was another busy year with over R567 million invested in capital projects which have enhanced efficiency and added capacity. These projects were well executed with very limited disruption to our businesses and were materially on time and on budget. These investments add to the benefits of similar projects of recent years and underscore our determination to deliver to consumers their loved brands both cost effectively and at the highest quality, and provide additional capacity for coming years. The Isando packaging automation and Westmead line upgrades were completed during the year with limited disruption and are contributing to improved yields, service levels and throughput. At I&J the new Marel wet-fish processing line was successfully commissioned during the second half and is operating at levels that will deliver the expected savings in the coming financial year.
Corporate governance AVI’s Board remains committed to ensuring that our continued success is achieved with a clear appreciation of the interdependency of the Company with its wider stakeholders including the over-arching need for our profitability to be achieved in a sustainable way. Our efforts in this regard are set out in the detailed sustainable development section of this report.
OV
ER
VIE
WB
USIN
ESS R
EV
IEW
GO
VE
RN
AN
CE
AN
NU
AL FIN
AN
CIA
L STATE
ME
NTS
SHA
RE
HO
LDE
R IN
FOR
MA
TION

chairman and ceo’s review continued
8
The recommendations of the King Report (“King III”) have been integrated into AVI’s corporate governance charter as have the requirements of the new Companies Act, the details of which are set out in the corporate governance section of this report.
BoardWe are pleased to announce the appointment of Michael Koursaris to the Board as an executive director with effect from 9 September 2013. Michael joined AVI in 2002 as Business Development Analyst and was appointed to the role of Business Development Executive in January 2011.
OutlookWe do not anticipate any material improvements in the South African economy in the coming year; equally meaningful improvements in the economic growth of many of South Africa’s important trade partners look unlikely. Our expectation is that we will do business in an environment characterised by increased competition for market share and that it will be essential to find the best balance between selling prices and volumes. The substantial devaluation of the Rand has and will impact on many costs and we will need to work hard to ensure we limit the impact this has on margins across the business.
Notwithstanding expectations of a difficult trading environment we remain optimistic that our unique brand portfolio coupled with our marketing and selling plans for the year will deliver growth in key categories. Our continued determination to reduce overheads and improve the efficiency of our factories and support services will also contribute to the bottom line.
At business unit level, Entyce and Snackworks have well established capabilities to defend market share and profit margins and will be seeking to grow sales volumes where there is opportunity. I&J will benefit from the weaker Rand, increased sales volumes and more efficient processing at Woodstock. Indigo is working hard to build momentum in aerosol volumes and will benefit from a number of meaningful new product initiatives. The Spitz and Kurt Geiger businesses continue to expand the footprint of their premium footwear and apparel brands while investment in Green Cross’s growth opportunities will gather momentum. In addition we have built a strong presence in selected African markets and will continue growing our brands in these and other targeted countries.
Our business depends substantially on the financial health of consumers, which we do not expect to improve materially in the coming year. There are simply too many South Africans whose economic lives are held back by a combination of poor education and unemployment. For this to change South Africa’s economy needs to grow materially faster than it has for several years and the macro stimulus for this is lacking. We continue to be concerned about service delivery – both the rising cost and efficiency of which are increasing impediments to business at a municipal and national level. Unchecked this will erode South Africa’s competitiveness and substantially limit investment in industries that would provide employment for the many South Africans who should be participating meaningfully in our economy and society.
SIMON CRUTCHLEYChief Executive Officer

9
We remain acquisitive for credible brands that we can add to either our food or fashion categories, both domestically and regionally, and are confident that our on-going efforts to build market leadership in selected regional markets in our key categories will sustain momentum over the medium term.
AcknowledgementsAVI’s business is built substantially off our unique brand portfolio but equally on the vitality of our people whose many talents, energy and passion sustain the on-going performance of your company. We acknowledge and thank them for their on-going service to the Company in a challenging year. Our success depends on their diverse skills, daily efforts and passion for our heritage brands. In addition the partnership and vital contribution of all our consumers, customers, suppliers and service providers is acknowledged and appreciated.
Gavin TipperChairman
Simon CrutchleyChief Executive Officer
OV
ER
VIE
WB
USIN
ESS R
EV
IEW
GO
VE
RN
AN
CE
AN
NU
AL FIN
AN
CIA
L STATE
ME
NTS
SHA
RE
HO
LDE
R IN
FOR
MA
TION
10
operational reviews
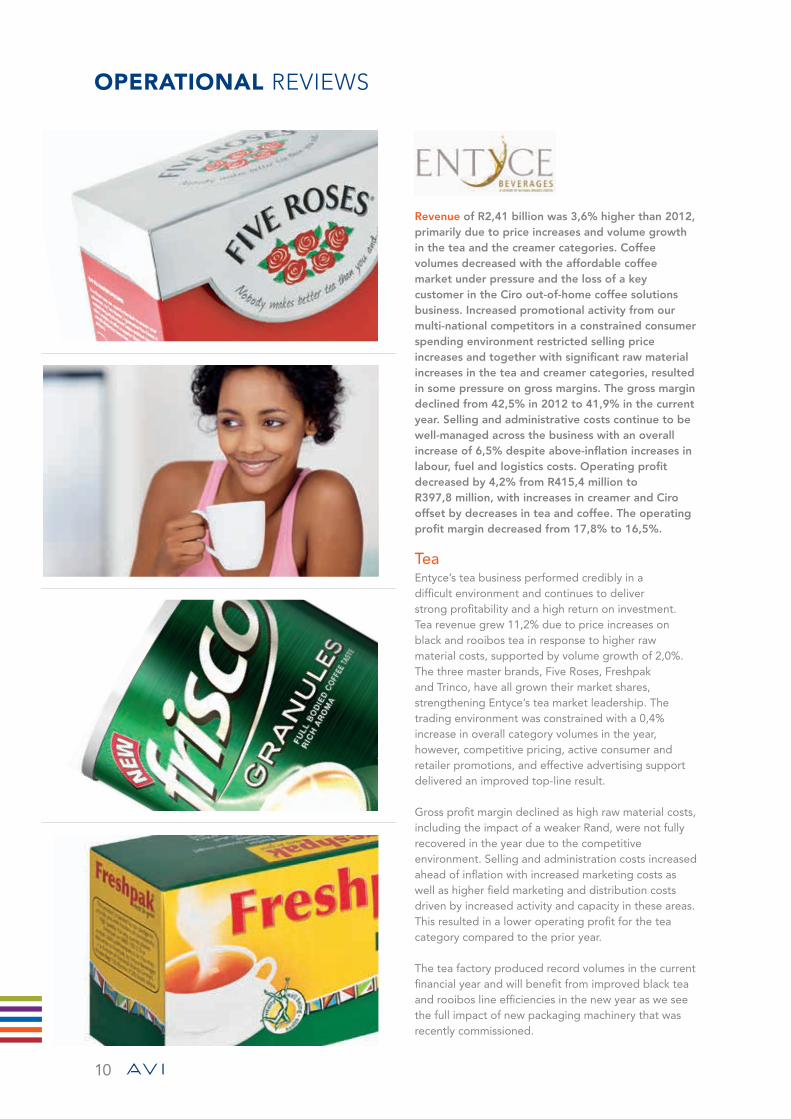
Revenue of R2,41 billion was 3,6% higher than 2012, primarily due to price increases and volume growth in the tea and the creamer categories. Coffee volumes decreased with the affordable coffee market under pressure and the loss of a key customer in the Ciro out-of-home coffee solutions business. Increased promotional activity from our multi-national competitors in a constrained consumer spending environment restricted selling price increases and together with significant raw material increases in the tea and creamer categories, resulted in some pressure on gross margins. The gross margin declined from 42,5% in 2012 to 41,9% in the current year. Selling and administrative costs continue to be well-managed across the business with an overall increase of 6,5% despite above-inflation increases in labour, fuel and logistics costs. Operating profit decreased by 4,2% from R415,4 million to R397,8 million, with increases in creamer and Ciro offset by decreases in tea and coffee. The operating profit margin decreased from 17,8% to 16,5%.
TeaEntyce’s tea business performed credibly in a difficult environment and continues to deliver strong profitability and a high return on investment. Tea revenue grew 11,2% due to price increases on black and rooibos tea in response to higher raw material costs, supported by volume growth of 2,0%. The three master brands, Five Roses, Freshpak and Trinco, have all grown their market shares, strengthening Entyce’s tea market leadership. The trading environment was constrained with a 0,4% increase in overall category volumes in the year, however, competitive pricing, active consumer and retailer promotions, and effective advertising support delivered an improved top-line result.
Gross profit margin declined as high raw material costs, including the impact of a weaker Rand, were not fully recovered in the year due to the competitive environment. Selling and administration costs increased ahead of inflation with increased marketing costs as well as higher field marketing and distribution costs driven by increased activity and capacity in these areas. This resulted in a lower operating profit for the tea category compared to the prior year.
The tea factory produced record volumes in the current financial year and will benefit from improved black tea and rooibos line efficiencies in the new year as we see the full impact of new packaging machinery that was recently commissioned.
11
CoffeeCoffee volumes declined by 10,6% and revenue declined by 4,2%. Most of the pressure was in affordable coffee with our premium brands improving profitability and contribution with more resilient demand and lower arabica coffee bean prices. The total mixed instant and mixed brewed coffee market shrank with price points reaching levels that inhibited consumption in a constrained environment, and this was compounded by sustained promotional activity by competitors. Frisco, including the new granulated variant, and House of Coffees market shares grew by 6,7% and 9,2% respectively, but market shares of some of the smaller brands declined. From an input cost perspective, lower robusta and arabica coffee bean prices had a favourable impact on margins although this was partially offset by the weaker Rand.
Gross profit was adversely impacted by lower sales volumes and additional energy, maintenance and depreciation costs. However, the increase in selling and administration costs was well below inflation with lower sales volumes partially offsetting increases in selling and distribution costs, as well as a reduction in marketing expenditure following the high expenditure on launching Frisco granules last year. The lower volumes and gross margins led to a decrease in operating profit. Operating profit margin also decreased but remained at healthy levels.
Investment in coffee manufacturing capability and capacity continued apace in 2013, with improvements to handling and control systems as well as granulation yields. A new roaster and packing line will be commissioned in the new year and this business is well positioned to benefit from volume leverage in future years.
CreamerCreamer volumes were up 2,8% and revenue increased by 7,6%. Selling prices were increased in response to higher glucose and palm oil costs. Strong first-half sales
volumes included some stock build by customers which was released in the second half and, together with sustained promotional activity by competitors, this resulted in muted volume growth for the full year.
The gross profit margin was positively impacted by lower manufacturing costs from making all product in-house in the new spray drying tower that was commissioned last year. Selling and administration costs were well contained and both operating profit and operating profit margin improved on last year.
With significant spare capacity in a category which continues to achieve relatively high growth, Entyce is well positioned to leverage creamer performance in future years.
Ciro out-of-home coffee solutionsRevenue for the year declined by 1% and volume declined by 10,1% primarily due to the loss of a major supply contract. The impact of the loss was ameliorated by new customers and savings on fixed overheads. Together with improved gross profit margins owing to an improved product mix and lower coffee bean prices this resulted in an improved operating profit margin and a pleasing 18,5% growth in operating profit from R32,3 million last year to R38,2 million this year.
Capital expenditureEntyce’s capital expenditure of R219,8 million in 2013 included R35,3 million to replace and upgrade coffee handling and extraction processes and R20,3 million for a new coffee roaster that was commissioned in August 2013. R14,1 million was spent on new rooibos tea packing lines to cater for current and future demand and R10,0 million was spent on new tea envelope packing lines to allow this activity to be done in-house and not by a contract packer. In addition, Ciro spent R21,4 million on new vending equipment and initial payments have been made for further projects at the coffee factory, including new packing lines that will be commissioned in the new year.
2013R’m
2012R’m
2011R’m
2010R’m
2009R’m
2008R’m
2007R’m
2006R’m
Change 2013
vs 2012 %
REVENUE 2 414,9 2 330,7 2 112,2 1 957,5 1 841,6 1 638,7 1 417,0 1 307,3 3,6
OPERATING PROFIT 397,8 415,4 402,2 329,9 280,8 253,9 237,0 210,1 (4,2)
OPERATING MARGIN (%) 16,5 17,8 19,0 16,9 15,2 15,5 16,7 16,1 (7,3)
CAPITAL EXPENDITURE 219,8 205,2 125,4 86,0 79,4 56,8 36,4 33,9 7,1
OV
ER
VIE
WB
USIN
ESS R
EV
IEW
GO
VE
RN
AN
CE
AN
NU
AL FIN
AN
CIA
L STATE
ME
NTS
SHA
RE
HO
LDE
R IN
FOR
MA
TION
12
operational review continued
Snackworks revenue grew by 10,4% to R2,68 billion as a result of continued biscuit volume growth and improved selling prices in the snacks category. Gross profit margin improved slightly with little pressure in biscuits from raw material prices and the benefit of an improved factory performance. Operating profit grew from R328,5 million to R387,9 million, up 18,1% from 2012, with the operating profit margin increasing from 13,5% to 14,5%.
BiscuitsBiscuit volumes grew by 10,1% and revenue by 11,8%. The volume traction gained in 2012 through realignment of prices to consumer expectations was sustained with extended tactical pricing and effective on-shelf price management across the range to counter competitor activity and continued pressure on consumer spending, resulting in market share gains in both the sweet and savoury segments.
There was little overall pressure from raw material costs, with lower butter prices offsetting increases in flour and sugar. Together with improved efficiency and
throughput in the factories this allowed gross profit
margin to be maintained with limited selling price
inflation. Selling and administration costs increases
were above inflation due to higher variable selling
and distribution costs as well as increased marketing
expenditure. The improved gross profit and controlled
selling and administration cost growth resulted in a
material improvement in operating profit and operating
profit margin expansion.
SnacksSnacks benefited from price increases and an improved
sales mix to increase revenue by 6,5%, with sales
volumes slightly higher than last year. Overall category
volumes were flat year-on-year with higher prices taking
a while to be accepted by consumers following many
years of unrealistic pricing that devalued the category.
Higher commodity costs were more than offset by price
increases and factory cost savings resulting in an
improvement in the gross profit margin. Selling and
administration costs were well controlled and operating
profit increased materially. While the operating profit
13
margin remains suboptimal it is encouraging to see value coming back into the category.
Capital expenditureSnackworks capital expenditure of R143,9 million in 2013 was spent predominantly in the biscuit factories. The investment in the Isando factory included R10,1 million to complete the packaging automation project, while Westmead invested R53,2 million to improve quality, yields and throughput on three key
lines. A further R12,2 million was spent to complete the installation of back-up power supply.
Further projects to improve efficiency in the biscuit factories are being evaluated and it is likely that the prospect of improving snacks margins will result in increased investment in the Rosslyn snacks factory in the new year.
2013R’m
2012R’m
2011R’m
2010R’m
2009R’m
2008R’m
2007R’m
2006R’m
Change 2013
vs 2012 %
REVENUE 2 681,6 2 428,7 2 159,7 2 080,9 2 036,8 1 677,2 1 394,2 1 279,7 10,4
OPERATING PROFIT 387,9 328,5 263,9 232,8 192,5 185,8 156,8 127,0 18,1
OPERATING MARGIN (%) 14,5 13,5 12,2 11,2 9,5 11,1 11,2 9,9 7,4
CAPITAL EXPENDITURE 143,9 171,8 117,6 46,6 44,8 58,3 47,3 59,2 (16,2)
OV
ER
VIE
WB
USIN
ESS R
EV
IEW
GO
VE
RN
AN
CE
AN
NU
AL FIN
AN
CIA
L STATE
ME
NTS
SHA
RE
HO
LDE
R IN
FOR
MA
TION
14
operational review continued
Revenue for the year increased by 5,0% to R1,59 billion due to improved export and domestic selling prices, partially offset by a 5,9% decline in sales volumes. Export markets remain under pressure due to the constrained European economy and increased supply from other white fish resources; however, export exchange rates were materially weaker than in the prior year, resulting in higher prices in rand terms. The decline in sales volumes was largely due to decreases in non-quota sales – mostly by-catch and processed retail products. Sales of hake products were slightly higher than last year with the expected benefit of increased quota offset by quota lost in the first half of the year due to poor catch volumes, as well as higher fillet stocks on board the freezer vessels at the end of the year which will be sold in the new year.
2013R’m
2012R’m
2011R’m
2010R’m
2009R’m
2008R’m
2007R’m
2006*R’m
Change 2013
vs 2012 %
REVENUE 1 591,9 1 515,4 1 369,3 1 381,8 1 597,5 1 476,8 1 427,2 1 432,5 5,0
OPERATING PROFIT 165,8 178,6 92,1 74,3 237,9 160,4 112,9 5,8 (7,2)
OPERATING MARGIN (%) 10,4 11,8 6,7 5,4 14,9 10,9 7,9 0,4 (11,9)
CAPITAL EXPENDITURE 112,9 67,1 40,9 42,7 65,5 27,1 35,0 65,7 68,3
* Includes Alpesca.
15
Gross profit declined largely due to the lower sales volumes, combined with an increase in fishing and production costs. I&J had a difficult first semester impacted by low fishing fleet availability, lower catch rates and higher fuel costs. In the second semester fishing performance was better, exchange rates were favourable and the relative increase in fuel costs was lower, however, operating costs were adversely impacted by the once-off Marel project commissioning activity and increased volumes of quota caught by third parties. This was largely offset by recognition of a pension fund surplus of R24,7 million and well controlled selling and administration costs. The full-year operating profit decreased from R178,6 million to R165,8 million and the operating profit margin decreased from 11,8% to 10,4%.
Simplot joint ventureIn addition to the operating profit shown above, I&J’s joint venture with Simplot (Australia) Proprietary Limited (“Simplot”) yielded equity earnings of R23,9 million compared to R46,8 million last year. Simplot’s sales volumes and prices were lower than the prior year due to strong competition in both the retail and food service sectors combined with a constrained Australian economy.
Capital expenditureCapital expenditure of R112,9 million related mainly to vessel refurbishments and R62,4 million for the new Marel fish processing line. This line was successfully commissioned in January 2013 and is operating at levels that will deliver the expected savings in the new year.
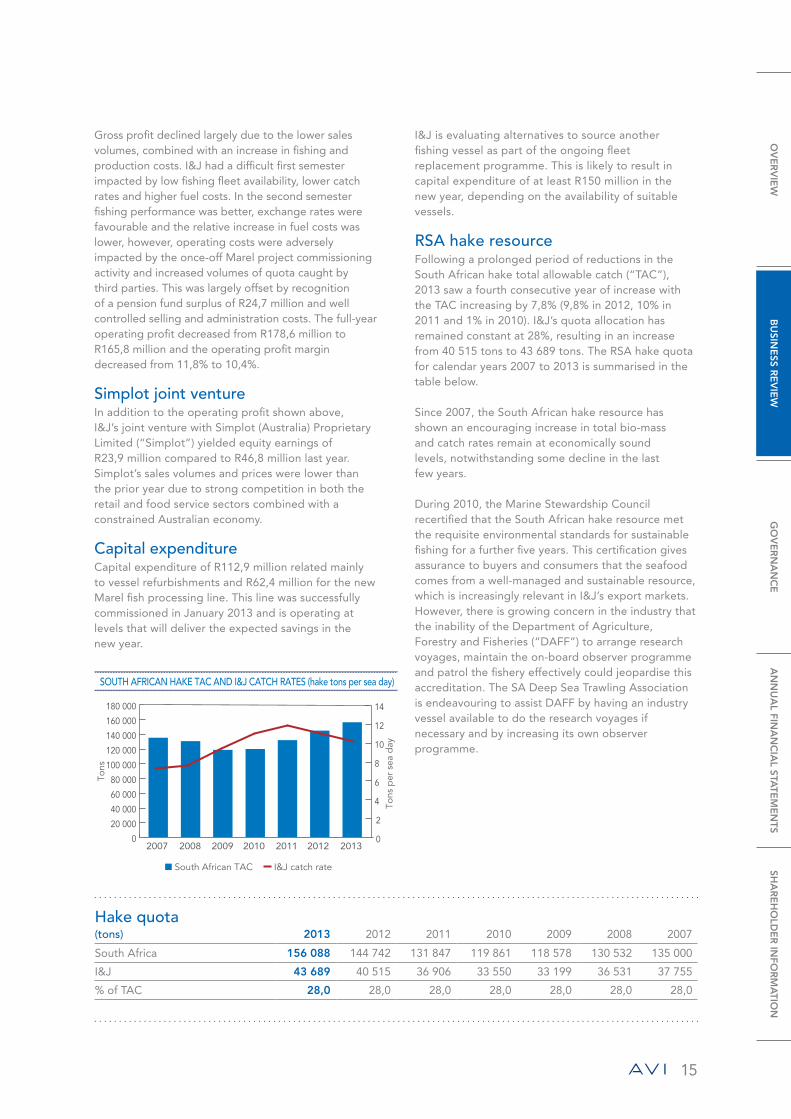
SOUTH AFRICAN HAKE TAC AND I&J CATCH RATES (hake tons per sea day)
Tons
Tons
per
sea
day
■ South African TAC I&J catch rate
2007 2008 2009 2010 2011 2012 20130
20 000
40 000
60 000
80 000
100 000
120 000
140 000
160 000
180 000
0
2
4
6
8
10
12
14
Hake quota(tons) 2013 2012 2011 2010 2009 2008 2007
South Africa 156 088 144 742 131 847 119 861 118 578 130 532 135 000
I&J 43 689 40 515 36 906 33 550 33 199 36 531 37 755
% of TAC 28,0 28,0 28,0 28,0 28,0 28,0 28,0
I&J is evaluating alternatives to source another fishing vessel as part of the ongoing fleet replacement programme. This is likely to result in capital expenditure of at least R150 million in the new year, depending on the availability of suitable vessels.
RSA hake resourceFollowing a prolonged period of reductions in the South African hake total allowable catch (“TAC”), 2013 saw a fourth consecutive year of increase with the TAC increasing by 7,8% (9,8% in 2012, 10% in 2011 and 1% in 2010). I&J’s quota allocation has remained constant at 28%, resulting in an increase from 40 515 tons to 43 689 tons. The RSA hake quota for calendar years 2007 to 2013 is summarised in the table below.
Since 2007, the South African hake resource has shown an encouraging increase in total bio-mass and catch rates remain at economically sound levels, notwithstanding some decline in the last few years.
During 2010, the Marine Stewardship Council recertified that the South African hake resource met the requisite environmental standards for sustainable fishing for a further five years. This certification gives assurance to buyers and consumers that the seafood comes from a well-managed and sustainable resource, which is increasingly relevant in I&J’s export markets. However, there is growing concern in the industry that the inability of the Department of Agriculture, Forestry and Fisheries (“DAFF”) to arrange research voyages, maintain the on-board observer programme and patrol the fishery effectively could jeopardise this accreditation. The SA Deep Sea Trawling Association is endeavouring to assist DAFF by having an industry vessel available to do the research voyages if necessary and by increasing its own observer programme.
OV
ER
VIE
WB
USIN
ESS R
EV
IEW
GO
VE
RN
AN
CE
AN
NU
AL FIN
AN
CIA
L STATE
ME
NTS
SHA
RE
HO
LDE
R IN
FOR
MA
TION

16
operational review continued
2013R’m
2012R’m
2011R’m
2010R’m
2009R’m
2008R’m
2007R’m
2006R’m
Change 2013
vs 2012 %
REVENUE 2 518,2 2 005,2 1 842,6 1 583,7 1 400,6 1 253,3 1 058,1 868,6 25,6
OPERATING PROFIT 576,9 463,6 368,5 255,4 196,2 206,3 208,4 165,6 24,4
OPERATING MARGIN (%) 22,9 23,1 20,0 16,1 14,0 16,5 19,7 19,1 (0,9)
CAPITAL EXPENDITURE 80,3 85,7 113,3 138,6 49,4 89,3 55,0 26,4 (6,3)
Revenue rose by 25,6% to R2,52 billion owing largely to the acquisition of Green Cross and volume growth in the Spitz business. Gross margins were adversely affected by the weaker Rand, however, most of this impact was offset by volume leverage and selling price increases. Operating profit increased by 24,4%, from R463,6 million to R576,9 million, and the operating profit margin decreased slightly from 23,1% to 22,9%.
Fashion Brands

17
2013R’m
2012R’m
2011R’m
2010R’m
2009R’m
2008R’m
2007R’m
2006R’m
Change 2013
vs 2012 %
REVENUE 982,1 918,1 890,3 802,8 730,2 623,5 555,9 476,8 7,0
OPERATING PROFIT 167,1 155,7 132,4 104,7 94,5 73,4 63,3 50,5 7,3
OPERATING MARGIN (%) 17,0 17,0 14,9 13,0 12,9 11,8 11,4 10,6 –
CAPITAL EXPENDITURE 31,5 35,0 71,5 127,2 26,8 24,9 17,3 16,9 (10,0)
Indigo’s revenue grew by 7,0% to R982,1 million largely due to price increases and volume growth in colour cosmetics, offset by lower fragranced body spray sales volumes that resulted from the constrained environment and increased competition. The category saw extensive promotional activity in response to constrained consumer spending. Gross profit margin
decreased marginally owing to pressure from the weaker Rand and the sales mix change, however, this was offset by more focused marketing spend and good cost control. Operating profit increased by 7,3% to R167,1 million and the operating profit margin was maintained at 17,0%.
Capital expenditureCapital expenditure of R31,5 million for the year included the addition of automated case packing and palletisation on the new aerosol line.
OV
ER
VIE
WB
USIN
ESS R
EV
IEW
GO
VE
RN
AN
CE
AN
NU
AL FIN
AN
CIA
L STATE
ME
NTS
SHA
RE
HO
LDE
R IN
FOR
MA
TION

18
operational review continued
In the footwear and apparel category, revenue increased by 41,3% to R1,54 billion and operating profit increased by 33,1% from R307,9 million to R409,8 million. The increase was due to the acquisition of Green Cross which added R327,5 million of revenue and R80,0 million of operating profit for the year, as well as strong volume led growth in Spitz with the
Footwear and Apparel
2013*R’m
2012R’m
2011R’m
2010R’m
2009R’m
2008R’m
2007R’m
2006R’m
Change 2013
vs 2012 %
REVENUE 1 536,1 1 087,1 952,3 780,9 670,4 629,8 502,2 391,8 41,3
OPERATING PROFIT 409,8 307,9 236,1 150,7 101,7 132,9 145,1 115,1 33,1
OPERATING MARGIN (%) 26,7 28,3 24,8 19,3 15,2 21,1 28,9 29,4 (5,7)
CAPITAL EXPENDITURE 48,8 50,7 41,8 11,4 22,6 64,4 37,7 9,5 (3,7)
* Includes Green Cross from 1 July 2012.
core Carvela, Kurt Geiger and Lacoste brands performing well. The category was impacted by a weaker Rand putting pressure on gross margin, but this was ameliorated by volume leverage and cost containment that reduced the impact on the operating margin.The operating profit margin decreased from 28,3% to 26,7%.

19
Revenue grew by 12,1% with the Spitz stores growing by 8,9% and the Kurt Geiger stores by 47,9%. Footwear sales volumes grew by 6,6% with good performance from the core Carvela and Lacoste ranges, while Kurt Geiger clothing revenue increased due to maturing revenue from stores opened last year and six new stores opened in the current period. Clothing gross profit margins were maintained, however, footwear gross profit margins were materially impacted by the weaker Rand with higher costs absorbed in key product ranges for much of the year to support sales volumes. This pressure was ameliorated with price increases taken in the fourth quarter, and leverage from volume growth resulted in a 7,2% increase in operating profit from R304,6 million to R326,4 million, while operating profit margin declined from 29,2% to 27,9%.
Key trading statistics are shown below. Spitz benefited materially from successful new store openings in the year and Kurt Geiger has achieved good improvement in trading density, although still short of targeted levels.
Capital expenditureCapital expenditure of R44,0 million was primarily directed at new store openings and refurbishment of older stores. Spitz opened four new stores and refurbished eight, while Kurt Geiger opened six new doors and refurbished two. Store investment planned for the 2014 financial year includes 10 new Kurt Geiger doors and eight new Spitz doors.
2013R’m
2012R’m
2011R’m
2010R’m
2009R’m
2008R’m
2007R’m
2006R’m
Change 2013
vs 2012 %
REVENUE 1 170,4 1 044,3 900,5 732,2 629,9 601,5 502,2 391,8 12,1
OPERATING PROFIT 326,4 304,6 238,6 157,8 114,2 139,0 145,1 115,1 7,2
OPERATING MARGIN (%) 27,9 29,2 26,5 21,6 18,1 23,1 28,9 29,4 (4,5)
CAPITAL EXPENDITURE 44,0 49,3 41,6 11,2 21,1 55,3 37,7 9,5 (10,8)
Spitz 2013 2012 2011 2010
NUMBER OF STORES 64 61 57 56
TURNOVER (R’m) 1 044 959 876 720
AVERAGE (m2) 16 357 15 107 15 233 15 147
TRADING DENSITY (R/m2) 63 820 63 460 57 480 47 539
CLOSING (m2) 16 586 15 662 14 991 15 012
Kurt Geiger 2013 2012 2011 2010
NUMBER OF STORES 30 26 15 3
TURNOVER (R’m) 127 86 25 12
AVERAGE (m2) 3 845 2 839 953 318
TRADING DENSITY (R/m2) 32 897 30 140 26 149 38 241
CLOSING (m2) 3 751 3 507 1 910 318
OV
ER
VIE
WB
USIN
ESS R
EV
IEW
GO
VE
RN
AN
CE
AN
NU
AL FIN
AN
CIA
L STATE
ME
NTS
SHA
RE
HO
LDE
R IN
FOR
MA
TION

20
operational review continued
Green Cross performed soundly, with the previous owners managing the business up to completion of the earn-out period at the end of February 2013 and then assisting with the transition to AVI appointed management by the end of the financial year. Selling prices increased in line with rising input costs in a difficult consumer environment, however, sales volumes declined due to constrained consumer demand and limited growth in trading space with only one new store compared to last year. Combined with higher employee costs incurred to transition the business into the Group, this restricted operating profit for the year to R80,0 million with an operating profit margin of 24,4%. Investment in the product offering and retail format to leverage the growth opportunities inherent in the Green Cross brand will commence in the 2014 financial year.
Key trading statistics, including the prior year for the sake of comparability, are shown in the following table:
2013R’m
2012R’m
Change 2013
vs 2012 %
REVENUE 327,5 315,5 3,8
OPERATING PROFIT 79,9 82,6 (3,3)
OPERATING MARGIN (%) 24,4 26,2 (6,8)
CAPITAL EXPENDITURE 3,5 3,4 2,9
Green Cross has been included in the Group result from 1 July 2012.

21
Green Cross* 2013 2012
NUMBER OF STORES 29 29
TURNOVER (R’m) 180,0 167
AVERAGE (m2) 3 225 3 167
TRADING DENSITY (R/m2) 55 795 52 786
CLOSING (m2) 3 225 3 225
* Green Cross has been included in the Group result from 1 July 2012.
Capital expenditureCapital expenditure of R3,5 million was primarily directed at maintenance expenditure in the Cape Town factory. Store investment planned for the 2014 financial year includes six Green Cross mono-branded stores and the commencement of a refurbishment programme for the old stores.
OV
ER
VIE
WB
USIN
ESS R
EV
IEW
GO
VE
RN
AN
CE
AN
NU
AL FIN
AN
CIA
L STATE
ME
NTS
SHA
RE
HO
LDE
R IN
FOR
MA
TION

22
operational review continued
The aggregated result of our business outside South Africa, excluding I&J’s export business, is summarised in the table below. AVI International has subsidiaries in Botswana, Zambia and Namibia, with the balance of countries being supported by a network of third-party distributors. During the year under review our Botswana operation was relocated to larger premises to relieve capacity constraints, and we took over the operations of our Namibian distributors to form our own subsidiary. Some tea products are packed in Botswana and Zambia with further investment in packing capacity being considered for the new year. We have had particularly good growth in Mozambique following the appointment of a new distributor.
Revenue for the year increased by 14,7% from R557,5 million last year to R639,4 million mainly as a result of growth in Mozambique, Zambia, Angola and Botswana. Namibia was in line with last year due to the disruption from taking direct control of the sales and
distribution activity, but should benefit from the new structure in the year ahead. The overall gross profit margin for the year reduced slightly due to changes in product mix and higher product costs from the South African operations.
Selling and administration costs increased by 33,2% compared to the prior year as a result of higher marketing costs attributable to the increased investment in our brands in export countries, higher sales volumes and increased employment costs associated with the new International structure. Operating profit of R128,9 million is 9,7% higher than last year’s R117,5 million.
The more focused structure and operational initiatives introduced during the year leave AVI International well placed for the continued growth of our brands in targeted countries in the new year.
aVi iNTerNATiONAL
AVI International
2013R’m
2012R’m
2011R’m
2010R’m
2009R’m
2008R’m
Change 2013
vs 2012 %
REVENUE 639,4 557,5 497,8 446,1 392,9 315,5 14,7
OPERATING PROFIT 128,9 117,5 91,7 76,2 58,3 55,8 9,7
OPERATING MARGIN (%) 20,2 21,1 18,4 17,1 14,8 17,7 (4,3)This table is an aggregation of results included in Entyce Beverages, Snackworks and Indigo Brands.
INTERNATIONAL OPERATING PROFIT HISTORY
R’m
■ Tea ■ Biscuits ■ Other
0
20
40
60
80
100
120
140
F08 F09 F10 F11 F12 F13

23
OV
ER
VIE
WB
USIN
ESS R
EV
IEW
GO
VE
RN
AN
CE
AN
NU
AL FIN
AN
CIA
L STATE
ME
NTS
SHA
RE
HO
LDE
R IN
FOR
MA
TION

24
FINANCIAL review
Continuing operationsAVI’s results for the year reflect a solid overall performance notwithstanding a difficult first semester for I&J and a challenging trading environment characterised by constrained consumer spending, increased competition in some categories and increased pressure on input costs stemming from the weaker Rand.
Snackworks delivered an excellent result for the year with strong volume growth supported by improved factory performance. Spitz also achieved high volume growth from new trading space and enduring strong demand for its core brands, resulting in leverage and profit growth despite the material negative impact of a weaker Rand on gross profit margins. Entyce had a more difficult year, having to contend with significant increases in tea input costs and increased competition in all of its categories which led to a small decrease in operating profit. I&J had an improved second semester, recovering much of the decline in first-half results. Green Cross was included from 1 July 2012 and made a contribution to the Group result for the year in line with our expectations at acquisition.
Increased focus on our business in selected African markets yielded pleasing results with revenue growing 14,7% and operating profit 9,7%.
Revenue from continuing operations rose by 11,2%, from R8,29 billion to R9,22 billion, with mostly cost-driven selling price increases and volume growth in most categories. Gross profit rose by 9,2% to R4,11 billion with the consolidated gross profit margin declining from 45,4% to 44,6% primarily due to higher fishing costs at I&J and the decision to absorb part of the impact of a weaker Rand at Spitz to support sales volumes. Operating profit increased by 11,2%, from
R1,37 billion to R1,53 billion with the consolidated operating profit margin maintained at 16,6%.
Headline earnings from continuing operations rose by 9,4%, from R957,5 million to R1,05 billion due to higher net finance costs and lower earnings from I&J’s joint venture with Simplot in Australia, partially offset by a lower effective tax rate with Withholding Tax on Dividends replacing Secondary Tax on Companies. Headline earnings per share from continuing operations increased 6,6% from 320,0 cents to 341,2 cents with more shares in issue due to the vesting of employee share options.
Cash generated by operations remained strong, increasing by 7,2% to R1,56 billion. Working capital increased by R194,1 million reflecting volume growth and higher stock levels at year-end in some of the businesses. Capital expenditure increased to R566,9 million with ongoing expenditure on major projects to improve capacity, technology and efficiency as well as the purchase of previously leased office premises in Johannesburg. Other material cash out-flows during the period were dividends of R1,20 billion (including the special dividend of 180 cents per share), the acquisition of Green Cross for R379,8 million net of cash acquired, and taxation of R406,6 million. Net debt at the end of June 2013 was R697,2 million compared to net cash of R163,2 million at the end of June 2012.

25
Segmental review – continuing operations
Year ended 30 June
Segmental revenue Segmental operating profit
2013R’m
2012R’m
Change%
2013R’m
2012R’m
Change%
Food and Beverage brands 6 688,4 6 274,8 6,6 951,5 922,5 3,1Entyce Beverages 2 414,9 2 330,7 3,6 397,8 415,4 (4,2)Snackworks 2 681,6 2 428,7 10,4 387,9 328,5 18,1I&J 1 591,9 1 515,4 5,0 165,8 178,6 (7,2)Fashion brands 2 518,2 2 005,2 25,6 576,9 463,6 24,4Personal Care 982,1 918,1 7,0 167,1 155,7 7,3Footwear & Apparel 1 536,1 1 087,1 41,3 409,8 307,9 33,1Corporate 11,7 7,1 (2,2) (13,6)
Group 9 218,3 8 287,1 11,2 1 526,2 1 372,5 11,2
DefinitionsNumber of ordinary shares in issueTotal issued ordinary share capital.
Weighted average number of ordinary shares in issueThe time weighted average number of ordinary shares in issue, excluding shares held by AVI share trusts and subsidiaries.
Earnings per ordinary share• Earnings and headline earnings respectively for the
year in cents divided by the weighted average number of ordinary shares in issue.
• Diluted earnings and diluted headline earnings per ordinary share are calculated taking account of the unexercised share options as disclosed in Note 35 of the annual financial statements on pages 132 to 134, duly adjusted to take account of the shares to be issued at fair value calculated in accordance with IAS33. Calculations are presented in Note 32 of the annual financial statements.
Dividend coverHeadline earnings per share from continuing operations divided by the dividends declared to ordinary shareholders of the Company in respect of the results for the year.
Financial ratios• Operating margin
Operating profit as a percentage of revenue.• Return on capital employed
Operating profit before capital items and after taxation from continuing operations, as a percentage of average capital employed. Capital employed is total equity plus net interest bearing debt.
• Net working capital Inventories and trade receivables, less trade payables.
• Free cash flow Cash available from operating activities and investments, less net capital expenditure.
• Free cash flow per ordinary share Free cash flow for the year in cents divided by the weighted average number of ordinary shares in issue.
• EBITDA Operating profit before capital items and depreciation and amortisation
• Net debt/(cash) Financial liabilities and borrowings and current borrowings less cash and cash equivalents
• Interest cover ratio EBITDA divided by net finance costs
• Net debt/capital employed Net debt divided by capital employed
OV
ER
VIE
WB
USIN
ESS R
EV
IEW
GO
VE
RN
AN
CE
AN
NU
AL FIN
AN
CIA
L STATE
ME
NTS
SHA
RE
HO
LDE
R IN
FOR
MA
TION

26
FINANCIAL review continued
Key statistics for continuing operations
2013 2012 2011 2010 2009
Financial ratios (%)– operating margin 16,6 16,6 14,9 12,3 12,2 – return on capital employed 27,4 29,4 24,7 19,7 19,6 – net working capital as a percentage of
revenue 19,1 18,1 17,5 17,5 16,8 – EBITDA 1 785,2 1 593,2 1 310,3 1 074,8 1 095,9
Liquidity– free cash flow (R’m) 551,2 510,5 599,9 597,9 391,9 – free cash flow per ordinary share (cents) 179,5 170,6 198,3 199,7 131,6 – net debt/capital employed 15,6 (5,1) 8,0 9,6 20,5 – interest cover ratio 33,9 111,4 32,6 12,6 8,8
Employees at 30 June 10 500 9 659 9 548 9 557 8 923 Revenue – continuing operations (R’m) 9 218,3 8 287,1 7 489,7 7 271,0 7 462,4
Revenue per employee (R’000) 877,9 858,0 784,4 760,8 836,3
Share statistics – five-year summary
2013 2012 2011 2010 2009
Number of ordinary shares in issue (’000) 343 953 342 145 349 108 343 482 342 638 Weighted average number of ordinary shares in issue (’000) 306 994 299 229 302 548 299 493 297 806 Share performance – continuing operations (cents per share)Earnings 340,1 316,7 244,3 187,5 180,8 Diluted earnings 325,5 302,0 236,0 180,9 177,5
Headline earnings 341,2 320,0 246,4 189,4 174,7 Diluted headline earnings 326,5 305,2 238,0 182,9 171,5
Dividends declared (excluding special dividends) 260,0 203,0 125,0 100,0 88,0 Dividend cover 1,25 1,5 2,0 2,0 2,0
Market price per share (cents)– at year-end 5 945 5 000 3 120 2 210 1 700 – highest 6 338 5 150 3 200 2 699 2 200 – lowest 4 952 2 846 2 100 1 684 1 150 – volume weighted average 5 662 4 036 2 842 2 071 1 699
Total market capitalisation at closing prices (R’m) 20 448,0 17 107,3 10 892,2 7 591,0 5 824,9 Price earnings ratio1 17,4 15,6 12,6 11,7 9,7 Value of shares traded (R’m) 15 022,0 12 023,0 4 823,8 4 244,9 4 362,4 Value traded as a percentage of average capitalisation (%) 77,1 87,1 48,6 59,1 78,7 Number of shares traded (millions) 265,3 297,9 169,8 205,0 256,8 Liquidity – number traded as percentage of shares in issue at year-end (%) 77,1 87,1 48,6 59,7 75,0
Average weekly Rand value traded (R’m) 294,5 235,7 94,6 83,2 83,5 1 Calculated based on the published headline earnings per share and the share price at year-end.
27
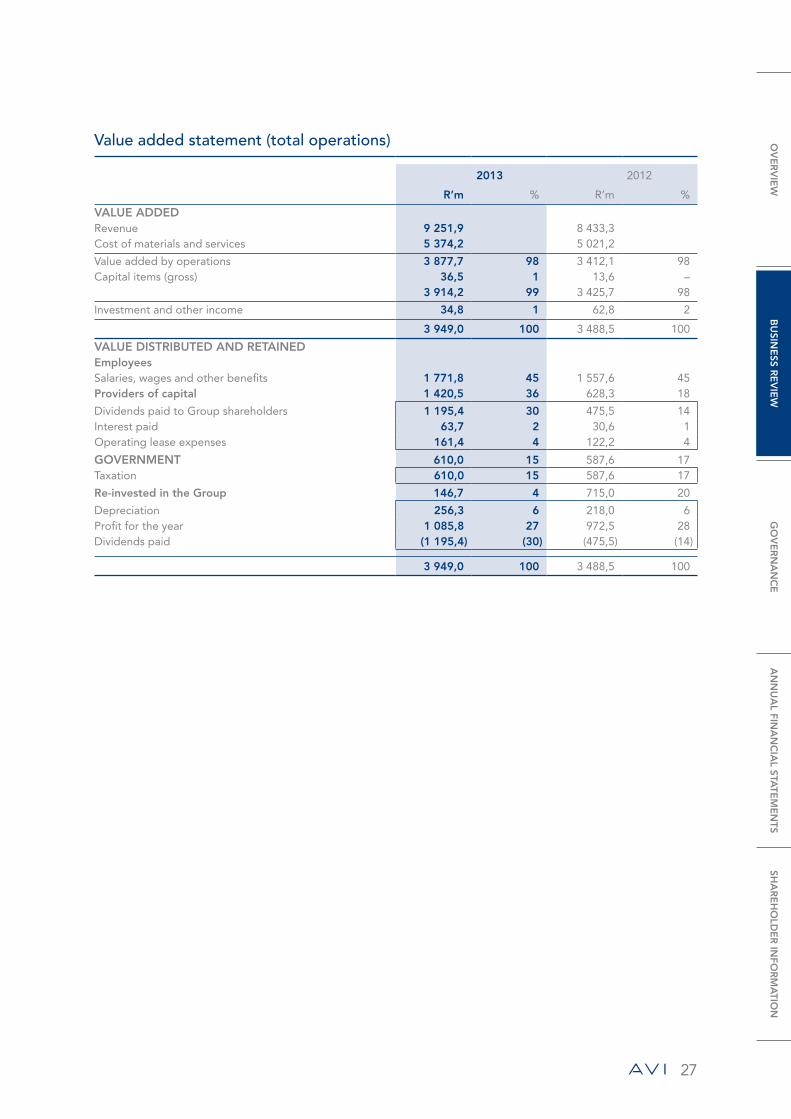
Value added statement (total operations)
2013 2012
R’m % R’m %
VALUE ADDEDRevenue 9 251,9 8 433,3 Cost of materials and services 5 374,2 5 021,2
Value added by operations 3 877,7 98 3 412,1 98Capital items (gross) 36,5 1 13,6 –
3 914,2 99 3 425,7 98
Investment and other income 34,8 1 62,8 2
3 949,0 100 3 488,5 100
VALUE DISTRIBUTED AND RETAINEDEmployeesSalaries, wages and other benefits 1 771,8 45 1 557,6 45Providers of capital 1 420,5 36 628,3 18
Dividends paid to Group shareholders 1 195,4 30 475,5 14Interest paid 63,7 2 30,6 1Operating lease expenses 161,4 4 122,2 4
GOVERNMENT 610,0 15 587,6 17Taxation 610,0 15 587,6 17
Re-invested in the Group 146,7 4 715,0 20
Depreciation 256,3 6 218,0 6Profit for the year 1 085,8 27 972,5 28Dividends paid (1 195,4) (30) (475,5) (14)
3 949,0 100 3 488,5 100
OV
ER
VIE
WB
USIN
ESS R
EV
IEW
GO
VE
RN
AN
CE
AN
NU
AL FIN
AN
CIA
L STATE
ME
NTS
SHA
RE
HO
LDE
R IN
FOR
MA
TION

28
FINANCIAL review continued
Group at a glance
2013R’m
2012R’m
2011R’m
2010R’m
2009R’m
Change13 vs 12
%
AVI (continuing operations)Revenue 9 218,3 8 287,1 7 489,7 7 271,0 7 462,4 11,2 Operating profit 1 526,2 1 372,5 1 117,5 895,1 908,5 11,2 Operating margin (%) 16,6 16,6 14,9 12,3 12,2 –
Capital expenditure 566,9 541,1 410,2 329,8 257,7 4,8
Entyce beverages (including Out of Home and excluding Real Juice)Revenue 2 414,9 2 330,7 2 112,2 1 957,5 1 841,6 3,6 Operating profit 397,8 415,4 402,2 329,9 280,8 (4,2)Operating margin (%) 16,5 17,8 19,0 16,9 15,2 (7,3)
Capital expenditure 219,8 205,2 127,9 90,4 81,3 7,1
SnackworksRevenue 2 681,6 2 428,7 2 159,7 2 080,9 2 036,8 10,4 Operating profit 387,9 328,5 263,9 232,8 192,5 18,1 Operating margin (%) 14,5 13,5 12,2 11,2 9,5 7,4
Capital expenditure 143,9 171,8 117,6 46,6 44,8 (16,2)
I&JRevenue 1 591,9 1 515,4 1 369,3 1 381,8 1 597,5 5,0 Operating profit 165,8 178,6 92,1 74,3 237,9 (7,2)Operating margin (%) 10,4 11,8 6,7 5,4 14,9 (11,9)
Capital expenditure 112,9 67,1 40,9 42,7 65,5 68,3
Fashion brandsRevenue 2 518,2 2 005,2 1 842,6 1 583,7 1 400,6 25,6 Operating profit 576,9 463,6 368,5 255,4 196,2 24,4 Operating margin (%) 22,9 23,1 20,0 16,1 14,0 (0,9)
Capital expenditure 80,3 85,7 113,3 138,6 49,4 (6,3)
Personal CareRevenue 982,1 918,1 890,3 802,8 730,2 7,0 Operating profit 167,1 155,7 132,4 104,7 94,5 7,3 Operating margin (%) 17,0 17,0 14,9 13,0 12,9 –
Capital expenditure 31,5 35,0 71,5 127,2 26,8 (10,0)
Footwear & Apparel*Revenue 1 536,1 1 087,1 952,3 780,9 670,4 41,3 Operating profit 409,8 307,9 236,1 150,7 101,7 33,1 Operating margin (%) 26,7 28,3 24,8 19,3 15,2 (5,7)
Capital expenditure 48,8 50,7 41,8 11,4 22,6 (3,7)* Includes Green Cross from 1 July 2012
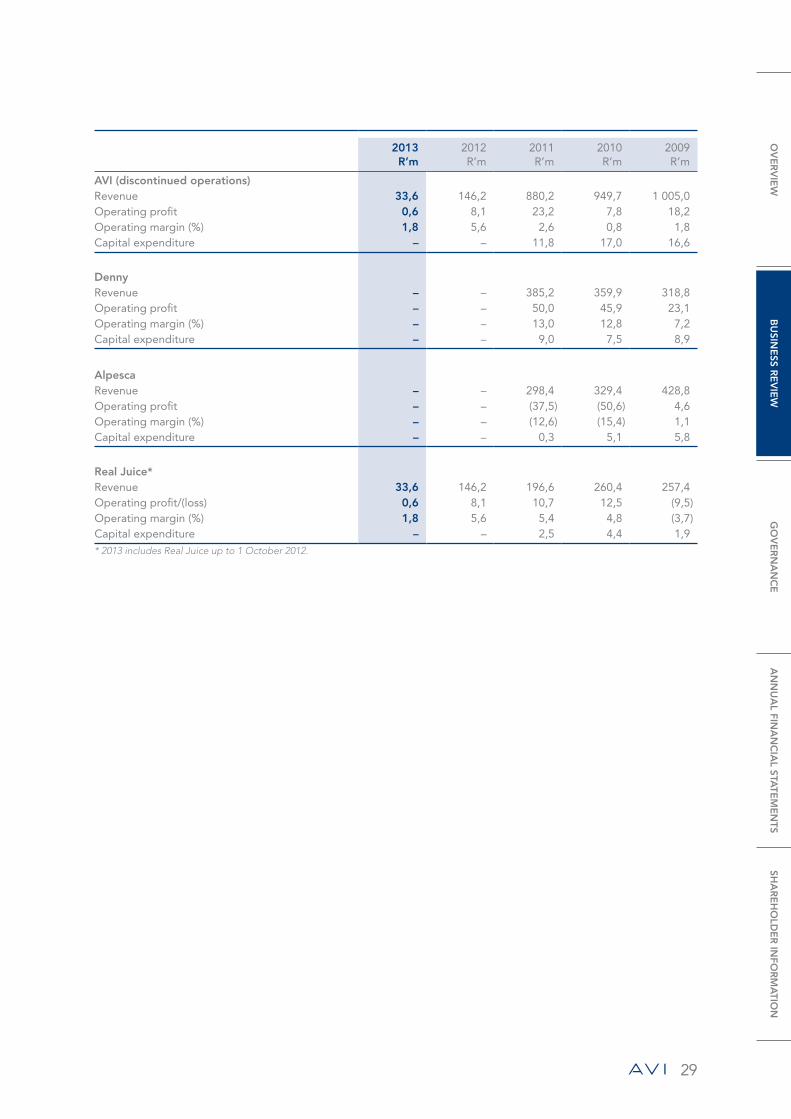
29
2013R’m
2012R’m
2011R’m
2010R’m
2009R’m
AVI (discontinued operations)Revenue 33,6 146,2 880,2 949,7 1 005,0 Operating profit 0,6 8,1 23,2 7,8 18,2 Operating margin (%) 1,8 5,6 2,6 0,8 1,8Capital expenditure – – 11,8 17,0 16,6
DennyRevenue – – 385,2 359,9 318,8 Operating profit – – 50,0 45,9 23,1 Operating margin (%) – – 13,0 12,8 7,2Capital expenditure – – 9,0 7,5 8,9
AlpescaRevenue – – 298,4 329,4 428,8 Operating profit – – (37,5) (50,6) 4,6 Operating margin (%) – – (12,6) (15,4) 1,1Capital expenditure – – 0,3 5,1 5,8
Real Juice*Revenue 33,6 146,2 196,6 260,4 257,4 Operating profit/(loss) 0,6 8,1 10,7 12,5 (9,5)Operating margin (%) 1,8 5,6 5,4 4,8 (3,7)Capital expenditure – – 2,5 4,4 1,9 * 2013 includes Real Juice up to 1 October 2012.
OV
ER
VIE
WB
USIN
ESS R
EV
IEW
GO
VE
RN
AN
CE
AN
NU
AL FIN
AN
CIA
L STATE
ME
NTS
SHA
RE
HO
LDE
R IN
FOR
MA
TION
30
FINANCIAL review continued
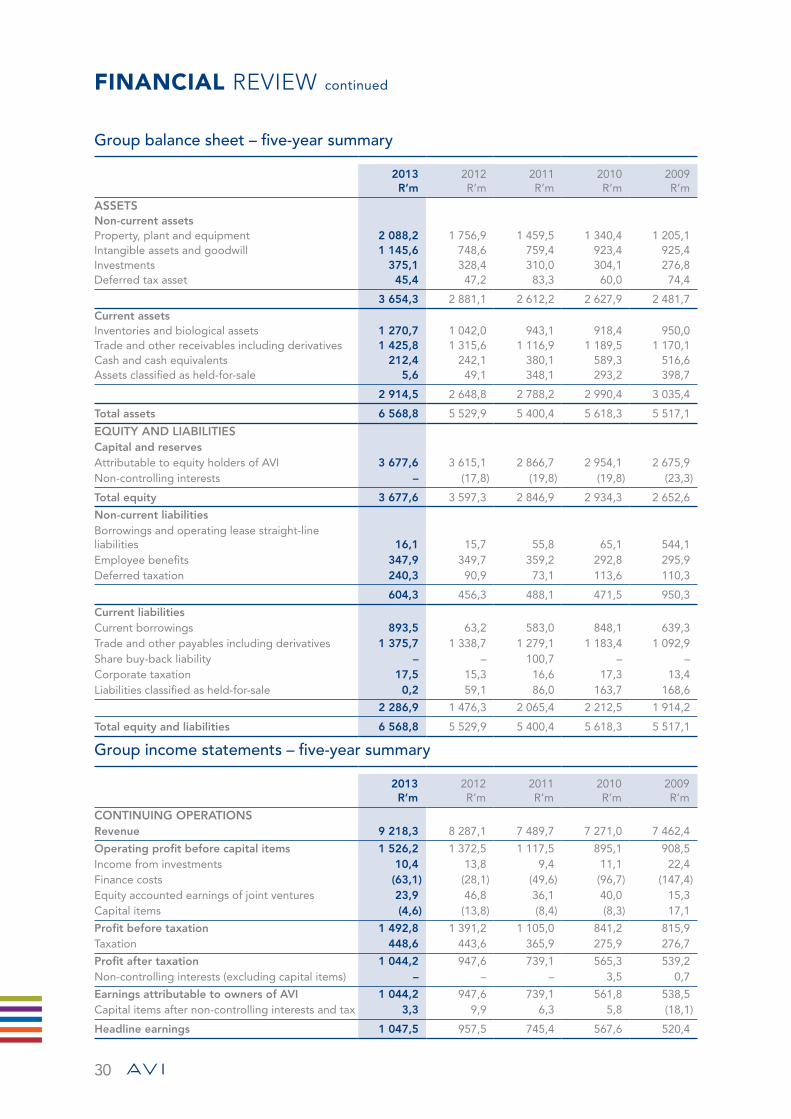
Group balance sheet – five-year summary
2013R’m
2012R’m
2011R’m
2010R’m
2009R’m
ASSETSNon-current assetsProperty, plant and equipment 2 088,2 1 756,9 1 459,5 1 340,4 1 205,1 Intangible assets and goodwill 1 145,6 748,6 759,4 923,4 925,4 Investments 375,1 328,4 310,0 304,1 276,8 Deferred tax asset 45,4 47,2 83,3 60,0 74,4
3 654,3 2 881,1 2 612,2 2 627,9 2 481,7
Current assetsInventories and biological assets 1 270,7 1 042,0 943,1 918,4 950,0 Trade and other receivables including derivatives 1 425,8 1 315,6 1 116,9 1 189,5 1 170,1 Cash and cash equivalents 212,4 242,1 380,1 589,3 516,6 Assets classified as held-for-sale 5,6 49,1 348,1 293,2 398,7
2 914,5 2 648,8 2 788,2 2 990,4 3 035,4
Total assets 6 568,8 5 529,9 5 400,4 5 618,3 5 517,1
EQUITY AND LIABILITIESCapital and reservesAttributable to equity holders of AVI 3 677,6 3 615,1 2 866,7 2 954,1 2 675,9 Non-controlling interests – (17,8) (19,8) (19,8) (23,3)
Total equity 3 677,6 3 597,3 2 846,9 2 934,3 2 652,6
Non-current liabilitiesBorrowings and operating lease straight-line liabilities 16,1 15,7 55,8 65,1 544,1 Employee benefits 347,9 349,7 359,2 292,8 295,9 Deferred taxation 240,3 90,9 73,1 113,6 110,3
604,3 456,3 488,1 471,5 950,3
Current liabilitiesCurrent borrowings 893,5 63,2 583,0 848,1 639,3 Trade and other payables including derivatives 1 375,7 1 338,7 1 279,1 1 183,4 1 092,9 Share buy-back liability – – 100,7 – – Corporate taxation 17,5 15,3 16,6 17,3 13,4 Liabilities classified as held-for-sale 0,2 59,1 86,0 163,7 168,6
2 286,9 1 476,3 2 065,4 2 212,5 1 914,2
Total equity and liabilities 6 568,8 5 529,9 5 400,4 5 618,3 5 517,1
Group income statements – five-year summary
2013R’m
2012R’m
2011R’m
2010R’m
2009R’m
CONTINUING OPERATIONSRevenue 9 218,3 8 287,1 7 489,7 7 271,0 7 462,4
Operating profit before capital items 1 526,2 1 372,5 1 117,5 895,1 908,5 Income from investments 10,4 13,8 9,4 11,1 22,4 Finance costs (63,1) (28,1) (49,6) (96,7) (147,4)Equity accounted earnings of joint ventures 23,9 46,8 36,1 40,0 15,3 Capital items (4,6) (13,8) (8,4) (8,3) 17,1
Profit before taxation 1 492,8 1 391,2 1 105,0 841,2 815,9 Taxation 448,6 443,6 365,9 275,9 276,7
Profit after taxation 1 044,2 947,6 739,1 565,3 539,2 Non-controlling interests (excluding capital items) – – – 3,5 0,7
Earnings attributable to owners of AVI 1 044,2 947,6 739,1 561,8 538,5 Capital items after non-controlling interests and tax 3,3 9,9 6,3 5,8 (18,1)
Headline earnings 1 047,5 957,5 745,4 567,6 520,4
31
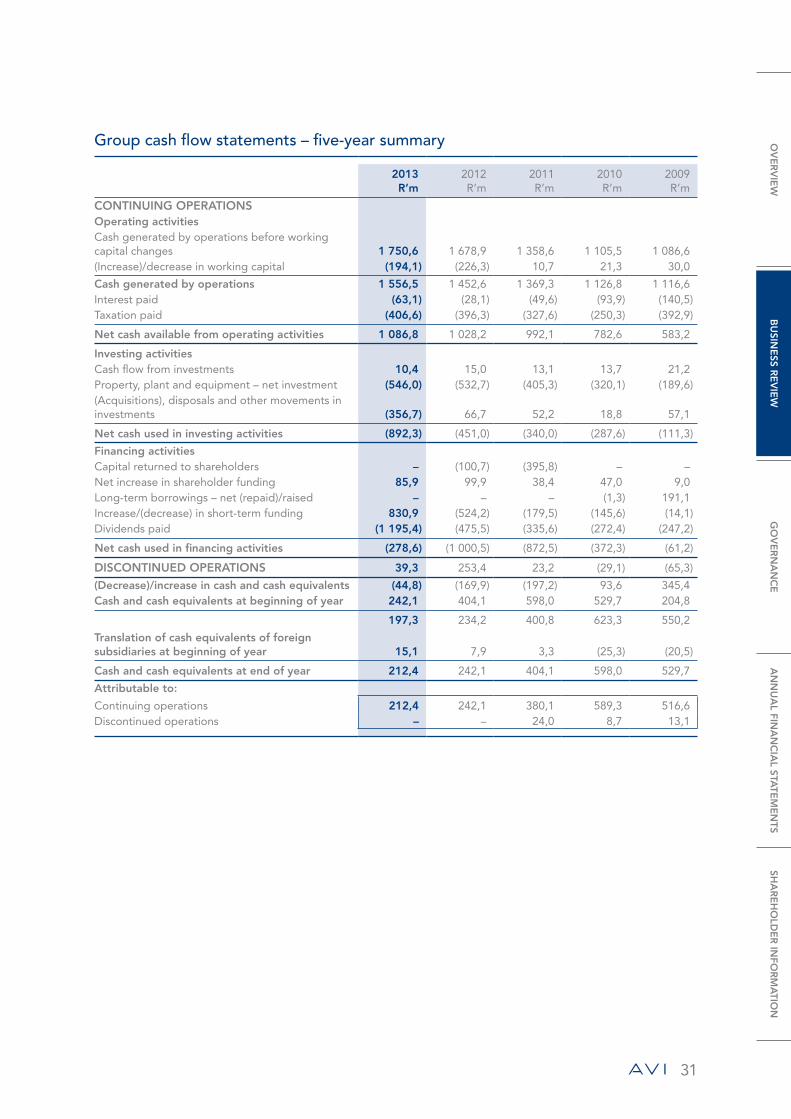
Group cash flow statements – five-year summary
2013R’m
2012R’m
2011R’m
2010R’m
2009R’m
CONTINUING OPERATIONSOperating activitiesCash generated by operations before working capital changes 1 750,6 1 678,9 1 358,6 1 105,5 1 086,6 (Increase)/decrease in working capital (194,1) (226,3) 10,7 21,3 30,0
Cash generated by operations 1 556,5 1 452,6 1 369,3 1 126,8 1 116,6 Interest paid (63,1) (28,1) (49,6) (93,9) (140,5)Taxation paid (406,6) (396,3) (327,6) (250,3) (392,9)
Net cash available from operating activities 1 086,8 1 028,2 992,1 782,6 583,2
Investing activitiesCash flow from investments 10,4 15,0 13,1 13,7 21,2 Property, plant and equipment – net investment (546,0) (532,7) (405,3) (320,1) (189,6)(Acquisitions), disposals and other movements in investments (356,7) 66,7 52,2 18,8 57,1
Net cash used in investing activities (892,3) (451,0) (340,0) (287,6) (111,3)
Financing activitiesCapital returned to shareholders – (100,7) (395,8) – – Net increase in shareholder funding 85,9 99,9 38,4 47,0 9,0 Long-term borrowings – net (repaid)/raised – – – (1,3) 191,1 Increase/(decrease) in short-term funding 830,9 (524,2) (179,5) (145,6) (14,1)Dividends paid (1 195,4) (475,5) (335,6) (272,4) (247,2)
Net cash used in financing activities (278,6) (1 000,5) (872,5) (372,3) (61,2)
DISCONTINUED OPERATIONS 39,3 253,4 23,2 (29,1) (65,3)
(Decrease)/increase in cash and cash equivalents (44,8) (169,9) (197,2) 93,6 345,4 Cash and cash equivalents at beginning of year 242,1 404,1 598,0 529,7 204,8
197,3 234,2 400,8 623,3 550,2
Translation of cash equivalents of foreign subsidiaries at beginning of year 15,1 7,9 3,3 (25,3) (20,5)
Cash and cash equivalents at end of year 212,4 242,1 404,1 598,0 529,7
Attributable to:
Continuing operations 212,4 242,1 380,1 589,3 516,6 Discontinued operations – – 24,0 8,7 13,1
OV
ER
VIE
WB
USIN
ESS R
EV
IEW
GO
VE
RN
AN
CE
AN
NU
AL FIN
AN
CIA
L STATE
ME
NTS
SHA
RE
HO
LDE
R IN
FOR
MA
TION

32
sustAINAbLe development report
Introduction and overviewSustainable development enables corporate citizens to prosper in a responsible manner and within a framework that safeguards both their and future generations’ long-term sustainability. It requires the identification and active management of those issues that could materially affect the long-term successful existence of the enterprise in the context of all stakeholders – including, but not exhaustively, shareholders and institutional investors, consumers, employees, customers, suppliers, government, unions and local communities.
AVI Limited (“the Company”) has a well-run governance framework that enables it to identify and manage those material sustainability issues that exist, or that may come to exist. The Company also operates in a manner that ensures that the needs of the present generation of stakeholders are met without compromising future generations. Sustainability matters are monitored and managed, for example, by the appropriate Diversity Committee, Health and Safety Committee, Internal Review Committee, Audit Committee or Social and Ethics Committee, while the overarching responsibility for matters before these committees remains vested with the Board of directors (“Board”). Sustainability matters that are deemed to be of a material nature, or
that require heightened focus, are elevated to the Board. Executives within the Company remain responsible for specific matters and are held accountable for their successful implementation and management.
The Company considers its sustainability responsibilities under the following three broad categories:• Ethics – ethics are at the foundation of an effective
and sustainable organisation that must be able to operate without censure or compromise in the long term. Proper ethics and appropriate values are central to the Company’s culture and therefore the behaviour of its employees. They assist in establishing a willingness to accept and embrace broader issues in our society, forming the basis of the Company’s interactions with its stakeholders.
• Scarce resources – in order to ensure future generations have access to the resources on which the Company is reliant, and that the Company’s viability is not compromised in the long term, the Company is intent on carefully managing those resources relevant to its operation. In addition to managing the very specific risk relating to its finite hake fishing resources, the Company is committed to the application of sustainable practices across its operations.

33
• Transformation and good corporate citizenship – the Company recognises the moral, social and economic imperative to embrace and support transformation in South Africa and to be regarded as a valuable participant in the South African economy and society. The Company also recognises the need to be, and to be seen as, a good corporate and socially responsible citizen that it is desirable to do business with.
Guiding frameworkThe following guidelines and/or standards were consulted when compiling this report:• The King Report on Corporate Governance for
South Africa, 2009 (“King III Report”).• The Listings Requirements of the JSE Limited
(“Listings Requirements”).• The JSE Socially Responsible Investment Index
(“JSE SRI”) criteria.• The Global Reporting Initiative (“GRI”) framework.
While the King III Report and Listings Requirements require the Company to prepare an integrated report, various other reporting frameworks deal with the underlying sustainability reporting criteria. The GRI framework and JSE SRI have been identified by the Company as appropriate frameworks for reporting on these issues based on the Company’s specific needs, its areas of operation and stakeholder concerns.
During the year the Company identified material Group-wide issues for reporting purposes and an index indicating where these issues are referenced throughout this annual report can be found on page 48. While these issues have been categorised according to the GRI framework, the Company has not undertaken a detailed self-assessment nor been formally assessed and the decision to use the GRI and JSE SRI frameworks for guidance in compiling this report is not intended to declare compliance as understood in either framework. The Company remains committed to further developing its approach to integrated reporting over the period ahead and will during that process continually review and re-assess the scope of its reporting, as well as the advisability and need for formal reporting or assessment against the accepted frameworks.
Disclosures on the Company’s approach to managing the matters reflecting on the Company’s sustainability can be found throughout the report either as an introduction to the relevant sections or as specific disclosures on relevant issues.
Social and Ethics CommitteeThe Social and Ethics Committee was constituted in August 2011 in terms of the Companies Act No 71 of 2008, as amended, and the Regulations thereto (“the Companies Act 2008”), and adopted formal terms of reference, delegated to it by the Board, as its charter. The charter is subject to the provisions of the Companies Act 2008 (in particular Section 72 as read with Regulation 43). The committee has discharged its functions in terms of its charter, and in particular performed the following duties:• Reviewed the Company’s activities, having regard to
relevant legislation and other legal requirements and best practice, relating to:– social and economic development;– good corporate citizenship;– the environment, health and public safety;– consumer relationships;– labour and employment; and– the Company’s ethics’ codes and performance.
The committee has unrestricted access to all Company information, employees and directors and is authorised, after discussion with the Chairman of the Board or the Chief Executive Officer where necessary, to investigate any matters within its terms of reference; seek external professional advice; secure the attendance of relevant consultants at its meetings; and implement policies approved by the Board. In addition, the committee has the mandate to bring matters within its remit to the attention of the Board and to report back to shareholders at the Annual General Meeting.
For further details regarding the composition and meetings of the committee, shareholders are referred to the Corporate Governance Report on pages 58 and 59.
Stakeholder engagementStakeholder engagement is an important aspect of the Company’s sustainability responsibilities and it formally identifies and recognises the material stakeholders with legitimate interests with whom it engages on relevant issues. Engagement with these stakeholders takes a variety of forms, depending on the matter at hand, and may vary in frequency. Where key topics and concerns are raised through such stakeholder engagements, the Company responds to the relevant stakeholders in a variety of ways, including directly or through its annual reporting. The table on page 34 lists the more obvious stakeholders and provides examples of the nature of the engagements that the Company has with them.
OV
ER
VIE
WB
USIN
ESS R
EV
IEW
GO
VE
RN
AN
CE
AN
NU
AL FIN
AN
CIA
L STATE
ME
NTS
SHA
RE
HO
LDE
R IN
FOR
MA
TION

34
sustAINAbLe development report continued
Stakeholder type Nature of engagement
Shareholders, analysts and media Annual General Meeting at which shareholders have an opportunity to vote on material resolutions, including the appointment and remuneration of directorsDistribution of information via the website, including financial, brand, governance, social, ethics and sustainability mattersPress releases and SENS announcementsFormal presentation of the half-year and final financial results in Cape Town and JohannesburgAnnual Integrated ReportInterviews and media briefingsScheduled bi-annual meetings with analystsAd hoc meetings with analysts and investors, both locally and overseas, as required
Customers and consumers Daily contact in own and customers’ storesMeetingsConsumer and product researchMarketing campaignsWebsiteCustomer care and complaint linesCustomer audits
Employees and employee representative bodies (including unions)
Intranet and published newsletters or noticesBi-annual presentations by the Chief Executive Officer to the executive communityPresentations and written communication (e.g. newsletters and posters) on material issues and regulations affecting employeesConferences and general staff meetingsPerformance appraisalsUnion representative forumsWorkplace forums such as the employment equity and learning and development forumsIndustry relevant Sector Education and Training AuthoritiesIndependent anonymous reporting hotlineIntranet-based incident reporting systemAd hoc events
Suppliers Supplier product and relationship management conferencesVisits and meetingsSupplier auditsSenior operational and procurement staff day-to-day interactions
Communities and non-profit organisations Corporate social investment programmesWorkplace learning and development programmes for unemployed learnersPartnerships and sponsorshipsAd hoc community engagements in surrounding communities, including Company-sponsored employee volunteer days
Business associations Participation in, or membership of, numerous associations such as Business Against Crime; the Consumer Goods Council; a number of fishing industry associations including the Deep-Sea Fishing Industry Association, the Abalone Farmers Association and the Mid-water Trawling Association; the Association of Food and Science Technology; the Restaurant Association; the Speciality Coffee Association; the Cosmetic, Toiletry and Fragrance Association; the Aerosol Manufacturers’ Association; and the Institute of PackagingParticipation in association initiatives
Government or regulators Regular contact with significant industry regulators through business associations

35
EthicsThe Company has a well-established and comprehensive Code of Conduct and Ethics (“the code”) that applies to all directors and employees and provides clear guidance on what is considered to be acceptable conduct. The code requires all directors and employees to maintain the highest ethical standards and ensure that the Company’s affairs are conducted in a manner which is beyond reproach. The code is communicated to all new employees as part of their induction training, published on the intranet for access at all times by employees, and published on the external website for public access. The code is aligned with the recommendations in the King III Report and was recently reviewed by the Social and Ethics Committee to ensure that it remains up-to-date and relevant.
In order to monitor on-going compliance with the code, the Company has a formal governance framework. Within the governance framework material issues are highlighted in management reports that are reviewed by the operating executives. If appropriate, matters are elevated to the Company’s Board or Audit and Risk Committee. This formal framework is supported by the Company’s internal audit function, which is responsible for investigating identified areas of concern and reporting its findings to the Company’s Chief Financial Officer and the Audit and Risk Committee. The Company believes that an independent and professional hotline disclosure service is an important component of an ethical environment and subscribes to “Be Heard”. This service facilitates confidential reporting on fraud and other unethical conduct. Communication drives are undertaken from time to time to remind employees of this “whistleblowing” service. In addition, the Company has implemented an in-house intranet-based incident reporting service that requires employees to report incidents, or potential incidents, which have caused, or could have caused, harm to the Company’s property or people on the Company’s premises. A senior employee actively manages the incident management reporting system and also engages with the “Be Heard” service providers. All anonymous reports and other reported incidents are reviewed on a daily basis and, if appropriate, thoroughly investigated. The Company has a proven track record of dealing appropriately with matters arising from the “Be Heard” and incident management reporting system. Investigations and disciplinary hearings have been held and, where appropriate, civil and criminal action has been taken.
In addition to the formal framework, it is imperative to promote a culture that is consistent with the ethical values that the Company aspires to. This is achieved through the example set by the Board and executive management, consistent enforcement of these values, and the careful selection of employees that display the desired attributes and values. The Company continues
to communicate formally with suppliers and customers to secure their support for and compliance with its ethical standards.
Scarce resources and biodiversityThe Company’s primary exposure to scarce resources that could materially impact its business is the performance of its fishing resources in South Africa. I&J has secured long-term hake fishing rights at a level that can support economic returns provided that the resource remains healthy.
The health of the South African fishing resource is managed by the Department of Agriculture, Forestry and Fisheries (“the Department”). The Department sets an industry-wide annual “total allowable catch” (“the TAC”) for each species under management and, for certain species, also sets a “total allowance effort” (“the TAE”) in which a limit is placed on the number of boats, number of men, and the number of days per year that each boat is licensed to fish (“sea days”). The limit on sea days seeks to ensure that the capacity of the deep-sea trawling fleet does not grow too big for the available resources which could result in the phenomenon of “too many boats chasing too few fish”.
Between 2002 and 2009, in response to falling catch rates and a high proportion of juvenile fish in the catches, the TAC was substantially reduced. Since then scientific surveys and catches have shown that the hake stocks are healthy and have been growing steadily for the past five years. In 2011, after seven years of TAC cuts, the annual catch limit was increased by 10%, followed by an increase of 9,78% in 2012. It was thereafter raised by a further 7,8% to 43 689 tons for I&J for the 2013 fishing season and it is anticipated that the hake TAC will continue to climb in 2014. Of concern, however, at the moment is the management by the Department of the research and patrol vessels and on-board observer programme used to maintain the scientific input underlying the TAC calculations, for which the contracts have not been renewed. These activities are essential to maintaining South Africa’s Marine Stewardship Council accreditation. The SA Deep Sea Trawling Association is endeavouring to assist the Fisheries’ Branch by having an industry vessel available to do the research voyages if necessary and by increasing its own observer programme to ensure the necessary research.
During 2010 the Marine Stewardship Council recertified that the South African hake resources met the requisite environmental standards for sustainable fishing for a further five years. This certification gives assurance to buyers and consumers that the seafood comes from a well-managed and sustainable resource, which is increasingly relevant in I&J’s export markets.
I&J strives to lead initiatives to manage fishing effort and protect breeding areas off the South African coast.
OV
ER
VIE
WB
USIN
ESS R
EV
IEW
GO
VE
RN
AN
CE
AN
NU
AL FIN
AN
CIA
L STATE
ME
NTS
SHA
RE
HO
LDE
R IN
FOR
MA
TION
36
sustAINAbLe development report continued
Effort control measures, such as the ring-fencing initiative for the demarcation of trawling grounds, are being monitored and I&J continues to partner with the Department to ensure compliance and enforcement thereof. I&J has a good working relationship with the World Wildlife Fund South Africa (“WWF-SA”), which has resulted in the development of projects such as the responsible fisheries training programme and initiatives to reduce the incidental mortality of sea birds. During 2009 WWF-SA and I&J, together with other major South African fishing companies, formed the Responsible Fisheries Alliance (“RFA”). The alliance is intended to ensure that all stakeholders understand and support the implementation of an Ecosystem Approach to Fisheries (“EAF”) management in South Africa’s fisheries. EAF seeks to protect and enhance the health of marine ecosystems. The goals of the RFA include promoting responsible fisheries practices, influencing policy on fishery governance, and supporting skills development and research in the industry.
I&J has recently signed a Participation Agreement with WWF-SA’s Sustainable Seafood Initiative (“WWF-SASSI”) which provides that by the end of 2015 all seafood sold by I&J will be either:• certified by the Marine Stewardship Council (“MSC”)
for wild caught products; or• certified by the Aquaculture Stewardship Council
(“ASC”) for farmed products; or• green-listed by the South African Sustainable
Seafood Initiative (“WWF-SASSI”); or• the subject of a credible, time-bound improvement
project.
I&J’s commitments have been incorporated into the I&J Sustainable Seafood Policy (“SSP”), a comprehensive document that sets out the standards to which I&J strives to adhere and the standards expected from its suppliers. With the policy in place customers are assured that all I&J seafood products are derived from sustainably managed fisheries or aquaculture operations or fisheries working under an improvement programme.
I&J’s Danger Point abalone farm is situated immediately adjacent to the sea and is the Company’s only property in or adjacent to an area of high biodiversity. South Africa’s high-energy coastline is generally unsuitable for offshore fish farming and land-based aquaculture allows for better control over environmental factors so that the impact on the environment can be limited. Although abalone aquaculture has a relatively low impact on the environment, in order to minimise any potential harm, the global abalone farming industry, including I&J, has engaged with the WWF to develop a set of standards. The Danger Point abalone farm is working towards adopting these recently developed Global Abalone
Standards and once the Aquaculture Stewardship Council has established the audit standards for abalone, the Danger Point farm will apply for certification. Once certification is achieved, an eco-label will be used to guarantee that I&J’s abalone products are and continue to be raised in an environmentally responsible manner.
Transformation and good corporate citizenshipTransformationThe Company recognises the moral, social and economic imperative to embrace and support transformation in South Africa and to be a valuable participant in the South African economy and society. A transformed company in the South African context is not only one that has a workforce that is representative of the country’s racial and gender demographics and that operates with a bias towards broad-based empowerment opportunities, but one that also embraces diversity.
The Company continues to focus on its transformation and remains intent on providing a workplace that encourages diversity. Transformation is considered in the context of broad-based black economic empowerment (“BBBEE”) and is measured annually by an external verification agency against the generic BBBEE scorecard. A central senior manager actively co-ordinates the Company’s efforts and ensures that the subsidiaries are well educated on the various facets of transformation. The subsidiaries’ progress is monitored and they are centrally assisted in the implementation of targets and various initiatives. During the year under review significant time and funds were invested in advancing the transformation plans that had been developed during the previous years. The progress of these plans was reviewed at half-year, where appropriate, and revised activities were agreed upon, where necessary.
On 7 February 2012 the Minister of Trade and Industry gazetted the implementation of the six to ten year targets in respect of employment equity and preferential procurement as outlined in the Codes of Good Practice (“BBBEE Codes”) published in 2007. As a result the Company’s BBBEE measurement for FY12 and FY13 was conducted in accordance with the increased targets and the Company’s scores on both of these elements reduced in FY12. However, owing to the Company’s on-going efforts, these scores increased again in FY13 and the Company has managed to maintain its consolidated BBBEE rating of level 4. The Company continues to qualify as a “Value Adding Vendor” as defined in the BBBEE Codes and is entitled to apply a 1,25 multiple to its level 4 BEE procurement recognition level of 100%, thereby offering its customers an effective 125% procurement recognition.
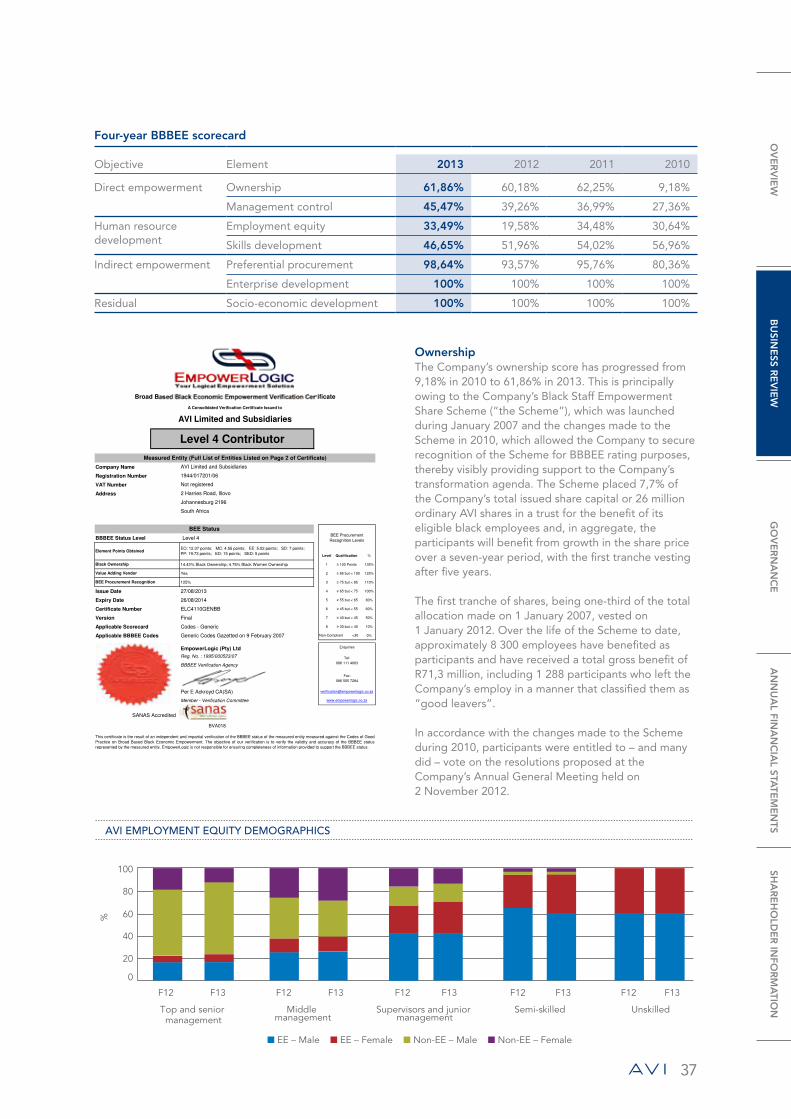
37
Four-year BBBEE scorecard
Objective Element 2013 2012 2011 2010
Direct empowerment Ownership 61,86% 60,18% 62,25% 9,18%
Management control 45,47% 39,26% 36,99% 27,36%
Human resource development
Employment equity 33,49% 19,58% 34,48% 30,64%
Skills development 46,65% 51,96% 54,02% 56,96%
Indirect empowerment Preferential procurement 98,64% 93,57% 95,76% 80,36%
Enterprise development 100% 100% 100% 100%
Residual Socio-economic development 100% 100% 100% 100%
Company Name
Registration Number
VAT Number
Address
BBBEE Status Level Level 4
Level Qualification %
14.42% Black Ownership; 4.75% Black Women Ownership 1 100 Points 135%
Yes 2 85 but < 100 125%
125% 3 75 but < 85 110%
Issue Date 27/08/2013 4 65 but < 75 100%
Expiry Date 26/08/2014 5 55 but < 65 80%
Certificate Number ELC4110GENBB 6 45 but < 55 60%
Version Final 7 40 but < 45 50%
Applicable Scorecard Codes - Generic 8 30 but < 40 10%
Applicable BBBEE Codes Generic Codes Gazetted on 9 February 2007 0%
EmpowerLogic (Pty) Ltd
Reg. No. : 1995/000523/07
BBBEE Verification Agency
Per E Ackroyd CA(SA)
Member - Verification Committee
SANAS Accredited
BVA018
086 111 4003
Fax:
086 505 7284
www.empowerlogic.co.za
This certificate is the result of an independent and impartial verification of the BBBEE status of the measured entity measured against the Codes of Good
Practice on Broad Based Black Economic Empowerment. The objective of our verification is to verify the validity and accuracy of the BBBEE status
represented by the measured entity. EmpowerLogic is not responsible for ensuring completeness of information provided to support the BBBEE status.
Tel:
Johannesburg 2196
South Africa
BEE StatusBEE Procurement
Recognition Levels
Element Points ObtainedEO: 12.37 points; MC: 4.55 points; EE: 5.02 points; SD: 7 points;
PP: 19.73 points; ED: 15 points; SED: 5 points
Black Ownership
Value Adding Vendor
BEE Procurement Recognition
Non-Compliant <30
Enquiries
2 Harries Road, Illovo
Broad Based Black Economic Empowerment Verification Certificate
A Consolidated Verification Certificate Issued to
AVI Limited and Subsidiaries
Level 4 Contributor
Measured Entity (Full List of Entities Listed on Page 2 of Certificate)
AVI Limited and Subsidiaries
1944/017201/06
Not registered
Certificate Page 1 of 2
OwnershipThe Company’s ownership score has progressed from 9,18% in 2010 to 61,86% in 2013. This is principally owing to the Company’s Black Staff Empowerment Share Scheme (“the Scheme”), which was launched during January 2007 and the changes made to the Scheme in 2010, which allowed the Company to secure recognition of the Scheme for BBBEE rating purposes, thereby visibly providing support to the Company’s transformation agenda. The Scheme placed 7,7% of the Company’s total issued share capital or 26 million ordinary AVI shares in a trust for the benefit of its eligible black employees and, in aggregate, the participants will benefit from growth in the share price over a seven-year period, with the first tranche vesting after five years.
The first tranche of shares, being one-third of the total allocation made on 1 January 2007, vested on 1 January 2012. Over the life of the Scheme to date, approximately 8 300 employees have benefited as participants and have received a total gross benefit of R71,3 million, including 1 288 participants who left the Company’s employ in a manner that classified them as “good leavers”.
In accordance with the changes made to the Scheme during 2010, participants were entitled to – and many did – vote on the resolutions proposed at the Company’s Annual General Meeting held on 2 November 2012.
%
Top and senior management
Middle management
Supervisors and junior management
Semi-skilled Unskilled
F12 F13 F12 F13 F12 F13 F12 F13 F12 F13
100
80
60
40
20
0
■ EE – Male ■ EE – Female ■ Non-EE – Male ■ Non-EE – Female
AVI EMPLOYMENT EQUITY DEMOGRAPHICS
OV
ER
VIE
WB
USIN
ESS R
EV
IEW
GO
VE
RN
AN
CE
AN
NU
AL FIN
AN
CIA
L STATE
ME
NTS
SHA
RE
HO
LDE
R IN
FOR
MA
TION
38
sustAINAbLe development report continued
At a subsidiary level, the Company remains committed to ensuring that a direct economic benefit flows to I&J employees, and the Company’s Board has approved the continuation of a 5% black staff shareholding up to 2020. The total amount paid to participants in the first cycle of the scheme amounted to R21,6 million – a significant contribution towards the financial and social upliftment of I&J’s employees. This is an important aspect of the focus on the transformation of the fishing industry.
Management control and employment equityThe Company increased its management control and employment equity scores during the year under review from 39,26% to 45,47% and 19,58% to 33,49% respectively. These improvements arise from key senior roles being populated with talented black candidates. This being said, the Company continues confronting the challenge of attracting senior black candidates from their current employment in these less certain economic times.
During the year the Company has furthered its efforts to appoint, develop and retain black employees, especially where representation is required in the middle and senior management and executive bands. The Company’s employment equity efforts, that are expected to continue to show success in the medium term, remain behind training, developing and mentoring black employees with the objective of retaining them and preparing them for more senior roles. Progress made by the Company in the area of management control and employment equity (as per the BBBEE Codes) over the past three years is material and mostly as a result of focused recruitment of suitable black candidates and the progression and retention of black staff. This will continue to be an area of heightened focus in the year ahead.
Skills developmentDevelopment of the Company’s employees remains a priority and, under the leadership of the senior learning and development manager and the group HR executive, the central learning and development service has made material progress over the past few years by successfully originating relevant learning opportunities for a broad community of employees, continually reviewing current learning services and requirements and enhancing their alignment to the Company’s needs, assisting the Company in developing its employees in an appropriate manner and progressing the Company’s transformation agenda. The Company has a credible relationship with the Food and Beverage Sector Education and Training Authority which enables the Company to successfully access discretionary grants. During the year the Company had 380 learners (all of whom were black) on adult basic education and training programmes, as well as learnerships, apprenticeships, in-service training and internships, with 446 black learners having access to discretionary grant funding for these and other skills development programmes.
Significant funds continue to be spent on customised programmes that run in the various subsidiary companies, including Prepare to Lead, in which the Company has partnered with PMI – a leading provider of human capital development solutions – to run Supervisory Development courses for the Group; and the Graduate Development Programme, which creates a talent pipeline by ensuring that young graduates and students with critical scarce skills are properly trained and ready to enter the workplace. In addition, the central learning and development service conducts workshops on matters such as goal setting, development of the HR community, performance management, and learning and development benchmarking, to name just a few.
In addition to the central learning and development function, the individual subsidiary companies invested considerable time and funds in skills development programmes. For example, I&J remains a leading training provider to the wider South African maritime community with its training courses for seamen which are accredited by the South African Maritime Safety Authority and the Transport Education and Training Seta; Indigo Brands continues with the three academic programmes specific to the production environment which it implemented during the previous year, namely the National Certificate: Production Technology (NQF level 2), the Operations Management Development Programme (NQF level 4) and the Diploma in Production Management (NQF level 5); and Ciro registered its Barista Upliftment Programme as a formal learnership, certified by the internationally recognised City & Guilds. The majority of learners on these programmes are black.
Post year-end the Company also successfully finalised the second year of its Group-wide senior management leadership programme titled “Licence to Lead”. Young senior managers, who had been nominated for their potential to populate executive positions in due course, were subjected to a leadership development programme in which the Company partnered with the University of Stellenbosch’s business school.
During the year under review the Company spent approximately R29,7 million on recorded skills development initiatives, an amount equivalent to 1,8% of its total payroll costs (in comparison with 2% in the previous year), while simultaneously improving the relevance of the skills development initiatives. 4 517 employees or 58% of the total workforce (including permanent and fixed-term contract employees) were trained during the year, 87% of whom were black and 55% male. On average these employees were subjected to 35 hours of training each.
Preferential procurementPreferential procurement remained an area of particular focus during the year under review. As mentioned above the implementation of the six to ten year targets for the year under review resulted in a marginal decrease of this score from 95,76% in 2011 to 93,57% in 2012, while the measured spend increased from
39
R2,6 billion to R3,2 billion. The collaboration of specialist procurers in the Company and a focus on favouring local suppliers with higher BBBEE ratings than their competitors has played a large role in the on-going improvement in the Company’s preferential procurement performance and the subsidiaries adjusted their targets in line with the six to ten year targets, resulting in an improvement of the score to 98,64% in 2013.
The Company continues to engage with suppliers regarding their transformation needs and to require its suppliers to register on the Department of Trade and Industry IT portal, which provides a single national catalogue of vendors and their BBBEE profiles.
The subsidiaries have procurement policies in place addressing such matters as BBBEE targets, origin of materials, environmental awareness and sustainability, as well as labour practices and ethics. Potential suppliers are required to undergo a thorough vendor evaluation and selection process in which they address these issues. Wherever possible, locally based suppliers are preferred over international suppliers. The Company makes every effort to ensure that it only does business with suppliers who comply with all applicable legislation and has not identified any of its suppliers where employees’ labour and human rights are, or are at risk of, being violated.
Good corporate citizenshipThe Company recognises the benefits of being a good corporate citizen with a commitment to contributing to sustainable economic, social and environmental development through working with employees, their families, the local communities and society at large to improve quality of life, and being an organisation that it is desirous to do business with.
Labour data and practices
2013 2012
Number of permanent employees (at 30 June) 7 668i 7 233
Gender split (%)Male 61 64Female 39 36
Ethnic split (%)African 56 58White 10 12Indian/Chinese 5 5Coloured 28 24Non-South African 1 1
Ethnic and gender split (%)Blackii male 55 57White male 6 6Black female 34 31White female 5 6
i The increase in headcount reflects, inter alia, the acquisition of Green Cross.
ii Black includes African, Indian and Coloured as defined in the BBBEE Codes.
Approximately 37% of the Company’s permanent employees are members of recognised trade unions covered by collective agreements defining the terms of the relationship between the Company, the unions and the members, as well as their engagement on matters ranging from operational changes to annual negotiations on wages and other substantive issues. Union engagement is managed at an executive level within the subsidiaries, with oversight from the Company.
The Company requires the subsidiaries to have appropriate policies and procedures in place to address employee and industrial relations issues and to ensure that these policies and procedures are communicated to all employees and other relevant stakeholders. Every two years the Company conducts a comprehensive audit of HR operational standards in the Group. This exercise was most recently conducted during April 2012 when no material shortcomings were identified and will again be conducted in 2014.
The Company complies with all applicable labour and employment legislation, including legislation pertaining to freedom of association, child labour, and forced and compulsory labour, and is committed to the protection of all employees’ human rights, the provision of decent work, and fair and sustainable labour practices. During the year no infringements of these rights or incidents of discrimination were reported.
Health, safety and wellnessThe Company provides a healthy and safe work environment to its employees as a basic right and recognises that a healthy and safe workplace enhances employee morale and productivity. It is also recognised that a healthy and safe workplace is essential in the food handling industry and ensures that consumers are protected and product quality assured.
Health and safety requirements are firstly monitored and reviewed within the risk management framework of the Company and legislative compliance is required as a minimum standard. The requisite health and safety committees are in place and training occurs on an on-going basis. These on-site committees deal with issues as and when required, and if necessary they elevate matters to the internal review committees that they report to. If necessary, matters are referred to the Company’s Board of directors or Audit and Risk Committee. In addition, the Social and Ethics Committee also monitors these matters. There are also various supplementary health and wellness initiatives that form part of the Company’s employee engagement framework.
The Company’s safety record is viewed against the industry standard disabling injury frequency rate (“DIFR”), which measures the percentage of employees that suffer a disabling injury for every 200 000 man-hours worked. A disabling injury is an injury that causes employees to miss a shift following the one on which they were injured. At a Company level the Company experienced 130 disabling injuries, resulting
OV
ER
VIE
WB
USIN
ESS R
EV
IEW
GO
VE
RN
AN
CE
AN
NU
AL FIN
AN
CIA
L STATE
ME
NTS
SHA
RE
HO
LDE
R IN
FOR
MA
TION
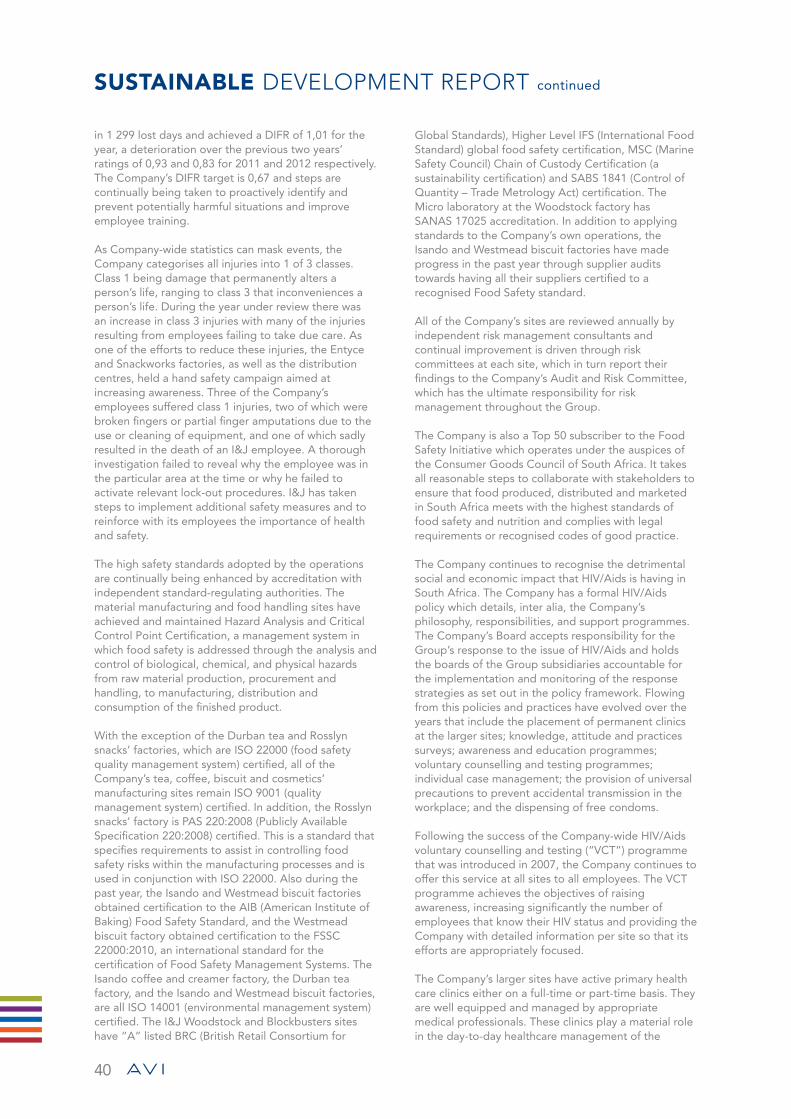
40
sustAINAbLe development report continued
in 1 299 lost days and achieved a DIFR of 1,01 for the year, a deterioration over the previous two years’ ratings of 0,93 and 0,83 for 2011 and 2012 respectively. The Company’s DIFR target is 0,67 and steps are continually being taken to proactively identify and prevent potentially harmful situations and improve employee training.
As Company-wide statistics can mask events, the Company categorises all injuries into 1 of 3 classes. Class 1 being damage that permanently alters a person’s life, ranging to class 3 that inconveniences a person’s life. During the year under review there was an increase in class 3 injuries with many of the injuries resulting from employees failing to take due care. As one of the efforts to reduce these injuries, the Entyce and Snackworks factories, as well as the distribution centres, held a hand safety campaign aimed at increasing awareness. Three of the Company’s employees suffered class 1 injuries, two of which were broken fingers or partial finger amputations due to the use or cleaning of equipment, and one of which sadly resulted in the death of an I&J employee. A thorough investigation failed to reveal why the employee was in the particular area at the time or why he failed to activate relevant lock-out procedures. I&J has taken steps to implement additional safety measures and to reinforce with its employees the importance of health and safety.
The high safety standards adopted by the operations are continually being enhanced by accreditation with independent standard-regulating authorities. The material manufacturing and food handling sites have achieved and maintained Hazard Analysis and Critical Control Point Certification, a management system in which food safety is addressed through the analysis and control of biological, chemical, and physical hazards from raw material production, procurement and handling, to manufacturing, distribution and consumption of the finished product.
With the exception of the Durban tea and Rosslyn snacks’ factories, which are ISO 22000 (food safety quality management system) certified, all of the Company’s tea, coffee, biscuit and cosmetics’ manufacturing sites remain ISO 9001 (quality management system) certified. In addition, the Rosslyn snacks’ factory is PAS 220:2008 (Publicly Available Specification 220:2008) certified. This is a standard that specifies requirements to assist in controlling food safety risks within the manufacturing processes and is used in conjunction with ISO 22000. Also during the past year, the Isando and Westmead biscuit factories obtained certification to the AIB (American Institute of Baking) Food Safety Standard, and the Westmead biscuit factory obtained certification to the FSSC 22000:2010, an international standard for the certification of Food Safety Management Systems. The Isando coffee and creamer factory, the Durban tea factory, and the Isando and Westmead biscuit factories, are all ISO 14001 (environmental management system) certified. The I&J Woodstock and Blockbusters sites have “A” listed BRC (British Retail Consortium for
Global Standards), Higher Level IFS (International Food Standard) global food safety certification, MSC (Marine Safety Council) Chain of Custody Certification (a sustainability certification) and SABS 1841 (Control of Quantity – Trade Metrology Act) certification. The Micro laboratory at the Woodstock factory has SANAS 17025 accreditation. In addition to applying standards to the Company’s own operations, the Isando and Westmead biscuit factories have made progress in the past year through supplier audits towards having all their suppliers certified to a recognised Food Safety standard.
All of the Company’s sites are reviewed annually by independent risk management consultants and continual improvement is driven through risk committees at each site, which in turn report their findings to the Company’s Audit and Risk Committee, which has the ultimate responsibility for risk management throughout the Group.
The Company is also a Top 50 subscriber to the Food Safety Initiative which operates under the auspices of the Consumer Goods Council of South Africa. It takes all reasonable steps to collaborate with stakeholders to ensure that food produced, distributed and marketed in South Africa meets with the highest standards of food safety and nutrition and complies with legal requirements or recognised codes of good practice.
The Company continues to recognise the detrimental social and economic impact that HIV/Aids is having in South Africa. The Company has a formal HIV/Aids policy which details, inter alia, the Company’s philosophy, responsibilities, and support programmes. The Company’s Board accepts responsibility for the Group’s response to the issue of HIV/Aids and holds the boards of the Group subsidiaries accountable for the implementation and monitoring of the response strategies as set out in the policy framework. Flowing from this policies and practices have evolved over the years that include the placement of permanent clinics at the larger sites; knowledge, attitude and practices surveys; awareness and education programmes; voluntary counselling and testing programmes; individual case management; the provision of universal precautions to prevent accidental transmission in the workplace; and the dispensing of free condoms.
Following the success of the Company-wide HIV/Aids voluntary counselling and testing (“VCT”) programme that was introduced in 2007, the Company continues to offer this service at all sites to all employees. The VCT programme achieves the objectives of raising awareness, increasing significantly the number of employees that know their HIV status and providing the Company with detailed information per site so that its efforts are appropriately focused.
The Company’s larger sites have active primary health care clinics either on a full-time or part-time basis. They are well equipped and managed by appropriate medical professionals. These clinics play a material role in the day-to-day healthcare management of the
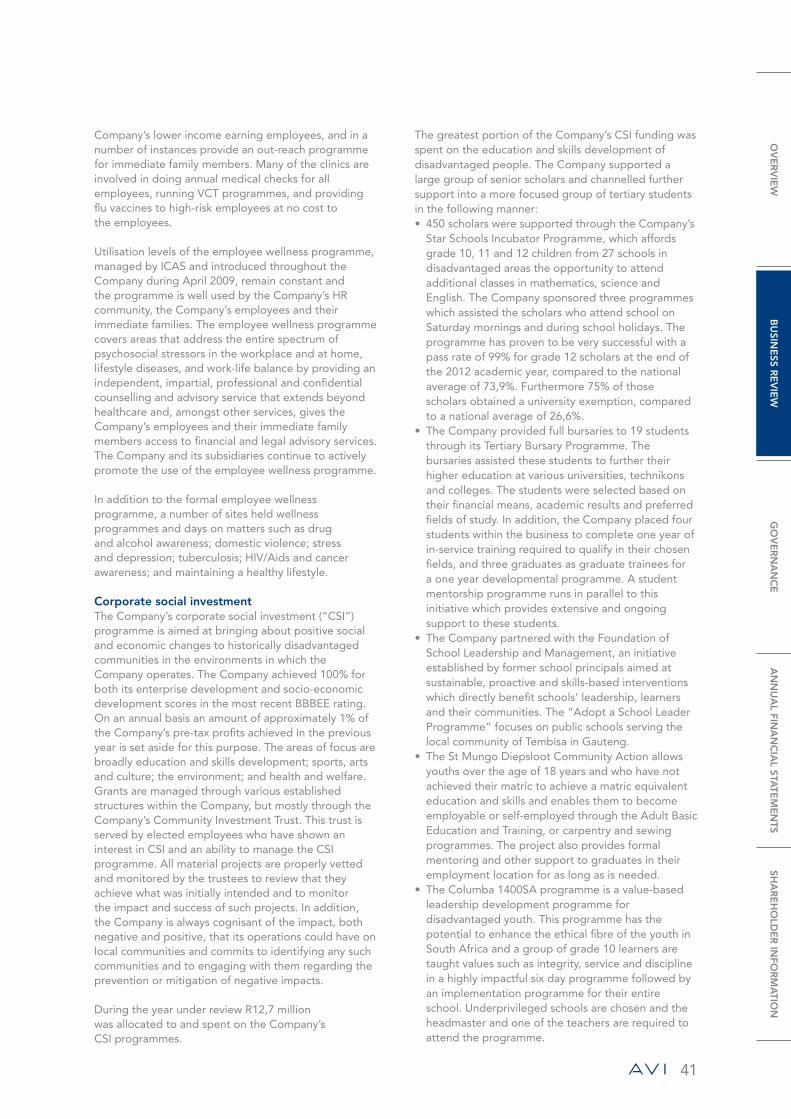
41
Company’s lower income earning employees, and in a number of instances provide an out-reach programme for immediate family members. Many of the clinics are involved in doing annual medical checks for all employees, running VCT programmes, and providing flu vaccines to high-risk employees at no cost to the employees.
Utilisation levels of the employee wellness programme, managed by ICAS and introduced throughout the Company during April 2009, remain constant and the programme is well used by the Company’s HR community, the Company’s employees and their immediate families. The employee wellness programme covers areas that address the entire spectrum of psychosocial stressors in the workplace and at home, lifestyle diseases, and work-life balance by providing an independent, impartial, professional and confidential counselling and advisory service that extends beyond healthcare and, amongst other services, gives the Company’s employees and their immediate family members access to financial and legal advisory services. The Company and its subsidiaries continue to actively promote the use of the employee wellness programme.
In addition to the formal employee wellness programme, a number of sites held wellness programmes and days on matters such as drug and alcohol awareness; domestic violence; stress and depression; tuberculosis; HIV/Aids and cancer awareness; and maintaining a healthy lifestyle.
Corporate social investmentThe Company’s corporate social investment (“CSI”) programme is aimed at bringing about positive social and economic changes to historically disadvantaged communities in the environments in which the Company operates. The Company achieved 100% for both its enterprise development and socio-economic development scores in the most recent BBBEE rating. On an annual basis an amount of approximately 1% of the Company’s pre-tax profits achieved in the previous year is set aside for this purpose. The areas of focus are broadly education and skills development; sports, arts and culture; the environment; and health and welfare. Grants are managed through various established structures within the Company, but mostly through the Company’s Community Investment Trust. This trust is served by elected employees who have shown an interest in CSI and an ability to manage the CSI programme. All material projects are properly vetted and monitored by the trustees to review that they achieve what was initially intended and to monitor the impact and success of such projects. In addition, the Company is always cognisant of the impact, both negative and positive, that its operations could have on local communities and commits to identifying any such communities and to engaging with them regarding the prevention or mitigation of negative impacts.
During the year under review R12,7 million was allocated to and spent on the Company’s CSI programmes.
The greatest portion of the Company’s CSI funding was spent on the education and skills development of disadvantaged people. The Company supported a large group of senior scholars and channelled further support into a more focused group of tertiary students in the following manner:• 450 scholars were supported through the Company’s
Star Schools Incubator Programme, which affords grade 10, 11 and 12 children from 27 schools in disadvantaged areas the opportunity to attend additional classes in mathematics, science and English. The Company sponsored three programmes which assisted the scholars who attend school on Saturday mornings and during school holidays. The programme has proven to be very successful with a pass rate of 99% for grade 12 scholars at the end of the 2012 academic year, compared to the national average of 73,9%. Furthermore 75% of those scholars obtained a university exemption, compared to a national average of 26,6%.
• The Company provided full bursaries to 19 students through its Tertiary Bursary Programme. The bursaries assisted these students to further their higher education at various universities, technikons and colleges. The students were selected based on their financial means, academic results and preferred fields of study. In addition, the Company placed four students within the business to complete one year of in-service training required to qualify in their chosen fields, and three graduates as graduate trainees for a one year developmental programme. A student mentorship programme runs in parallel to this initiative which provides extensive and ongoing support to these students.
• The Company partnered with the Foundation of School Leadership and Management, an initiative established by former school principals aimed at sustainable, proactive and skills-based interventions which directly benefit schools’ leadership, learners and their communities. The “Adopt a School Leader Programme” focuses on public schools serving the local community of Tembisa in Gauteng.
• The St Mungo Diepsloot Community Action allows youths over the age of 18 years and who have not achieved their matric to achieve a matric equivalent education and skills and enables them to become employable or self-employed through the Adult Basic Education and Training, or carpentry and sewing programmes. The project also provides formal mentoring and other support to graduates in their employment location for as long as is needed.
• The Columba 1400SA programme is a value-based leadership development programme for disadvantaged youth. This programme has the potential to enhance the ethical fibre of the youth in South Africa and a group of grade 10 learners are taught values such as integrity, service and discipline in a highly impactful six day programme followed by an implementation programme for their entire school. Underprivileged schools are chosen and the headmaster and one of the teachers are required to attend the programme.
OV
ER
VIE
WB
USIN
ESS R
EV
IEW
GO
VE
RN
AN
CE
AN
NU
AL FIN
AN
CIA
L STATE
ME
NTS
SHA
RE
HO
LDE
R IN
FOR
MA
TION
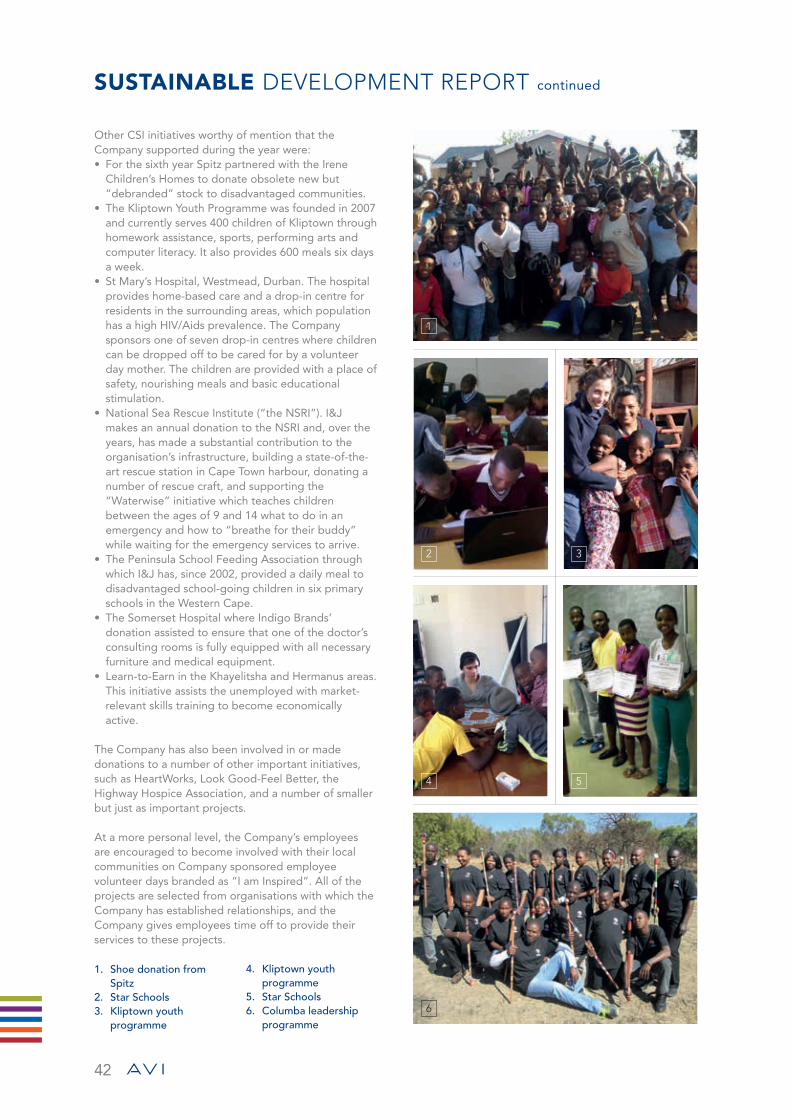
42
sustAINAbLe development report continued
Other CSI initiatives worthy of mention that the Company supported during the year were:• For the sixth year Spitz partnered with the Irene
Children’s Homes to donate obsolete new but “debranded” stock to disadvantaged communities.
• The Kliptown Youth Programme was founded in 2007 and currently serves 400 children of Kliptown through homework assistance, sports, performing arts and computer literacy. It also provides 600 meals six days a week.
• St Mary’s Hospital, Westmead, Durban. The hospital provides home-based care and a drop-in centre for residents in the surrounding areas, which population has a high HIV/Aids prevalence. The Company sponsors one of seven drop-in centres where children can be dropped off to be cared for by a volunteer day mother. The children are provided with a place of safety, nourishing meals and basic educational stimulation.
• National Sea Rescue Institute (“the NSRI”). I&J makes an annual donation to the NSRI and, over the years, has made a substantial contribution to the organisation’s infrastructure, building a state-of-the-art rescue station in Cape Town harbour, donating a number of rescue craft, and supporting the “Waterwise” initiative which teaches children between the ages of 9 and 14 what to do in an emergency and how to “breathe for their buddy” while waiting for the emergency services to arrive.
• The Peninsula School Feeding Association through which I&J has, since 2002, provided a daily meal to disadvantaged school-going children in six primary schools in the Western Cape.
• The Somerset Hospital where Indigo Brands’ donation assisted to ensure that one of the doctor’s consulting rooms is fully equipped with all necessary furniture and medical equipment.
• Learn-to-Earn in the Khayelitsha and Hermanus areas. This initiative assists the unemployed with market-relevant skills training to become economically active.
The Company has also been involved in or made donations to a number of other important initiatives, such as HeartWorks, Look Good-Feel Better, the Highway Hospice Association, and a number of smaller but just as important projects.
At a more personal level, the Company’s employees are encouraged to become involved with their local communities on Company sponsored employee volunteer days branded as “I am Inspired”. All of the projects are selected from organisations with which the Company has established relationships, and the Company gives employees time off to provide their services to these projects.
1. Shoe donation from Spitz
2. Star Schools3. Kliptown youth
programme
4. Kliptown youth programme
5. Star Schools6. Columba leadership
programme
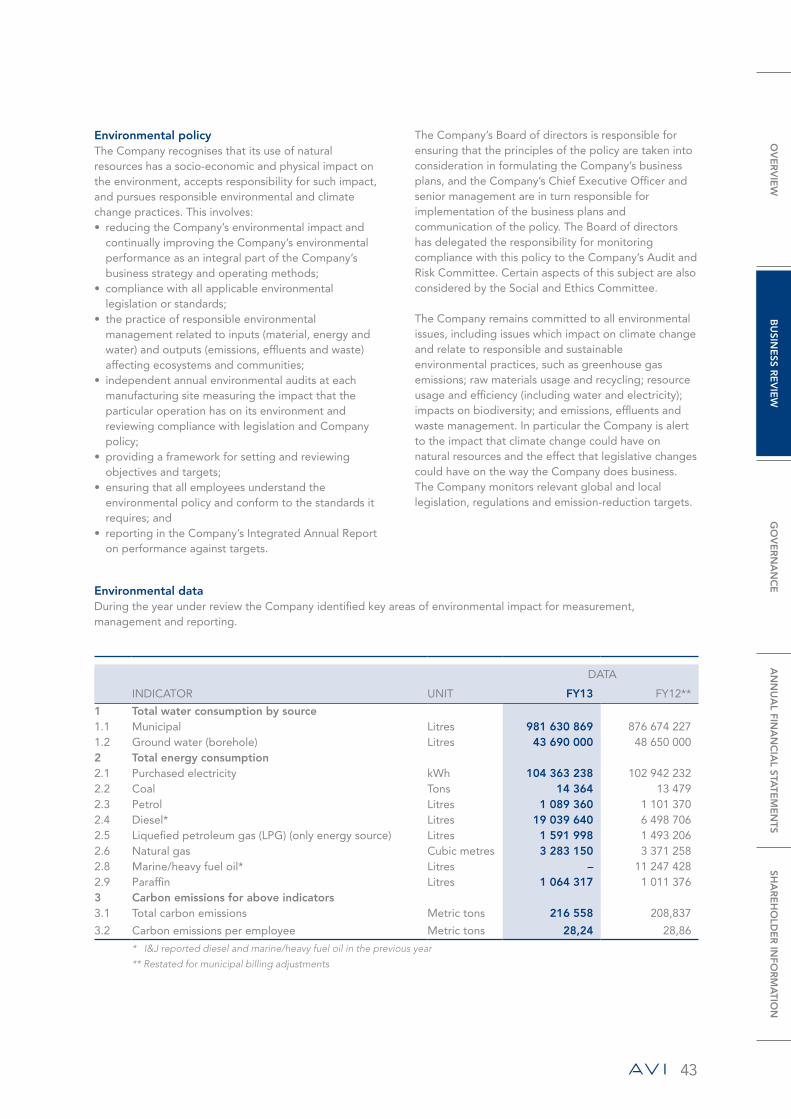
43
Environmental policyThe Company recognises that its use of natural resources has a socio-economic and physical impact on the environment, accepts responsibility for such impact, and pursues responsible environmental and climate change practices. This involves:• reducing the Company’s environmental impact and
continually improving the Company’s environmental performance as an integral part of the Company’s business strategy and operating methods;
• compliance with all applicable environmental legislation or standards;
• the practice of responsible environmental management related to inputs (material, energy and water) and outputs (emissions, effluents and waste) affecting ecosystems and communities;
• independent annual environmental audits at each manufacturing site measuring the impact that the particular operation has on its environment and reviewing compliance with legislation and Company policy;
• providing a framework for setting and reviewing objectives and targets;
• ensuring that all employees understand the environmental policy and conform to the standards it requires; and
• reporting in the Company’s Integrated Annual Report on performance against targets.
Environmental dataDuring the year under review the Company identified key areas of environmental impact for measurement, management and reporting.
INDICATOR UNIT
DATA
FY13 FY12**
1 Total water consumption by source 1.1 Municipal Litres 981 630 869 876 674 227 1.2 Ground water (borehole) Litres 43 690 000 48 650 000 2 Total energy consumption 2.1 Purchased electricity kWh 104 363 238 102 942 232 2.2 Coal Tons 14 364 13 479 2.3 Petrol Litres 1 089 360 1 101 370 2.4 Diesel* Litres 19 039 640 6 498 706 2.5 Liquefied petroleum gas (LPG) (only energy source) Litres 1 591 998 1 493 206 2.6 Natural gas Cubic metres 3 283 150 3 371 258 2.8 Marine/heavy fuel oil* Litres – 11 247 428 2.9 Paraffin Litres 1 064 317 1 011 376 3 Carbon emissions for above indicators3.1 Total carbon emissions Metric tons 216 558 208,837
3.2 Carbon emissions per employee Metric tons 28,24 28,86
* I&J reported diesel and marine/heavy fuel oil in the previous year
** Restated for municipal billing adjustments
The Company’s Board of directors is responsible for ensuring that the principles of the policy are taken into consideration in formulating the Company’s business plans, and the Company’s Chief Executive Officer and senior management are in turn responsible for implementation of the business plans and communication of the policy. The Board of directors has delegated the responsibility for monitoring compliance with this policy to the Company’s Audit and Risk Committee. Certain aspects of this subject are also considered by the Social and Ethics Committee.
The Company remains committed to all environmental issues, including issues which impact on climate change and relate to responsible and sustainable environmental practices, such as greenhouse gas emissions; raw materials usage and recycling; resource usage and efficiency (including water and electricity); impacts on biodiversity; and emissions, effluents and waste management. In particular the Company is alert to the impact that climate change could have on natural resources and the effect that legislative changes could have on the way the Company does business. The Company monitors relevant global and local legislation, regulations and emission-reduction targets.
OV
ER
VIE
WB
USIN
ESS R
EV
IEW
GO
VE
RN
AN
CE
AN
NU
AL FIN
AN
CIA
L STATE
ME
NTS
SHA
RE
HO
LDE
R IN
FOR
MA
TION
44
sustAINAbLe development report continued
The Company will continue defining and implementing the scope and methods of monitoring and reporting on these issues and, whereas the quantity of water, energy and materials used, and the waste produced vary depending on the operational objectives of the Company at any given time, establishing a method to set relevant objectives and targets.
In addition to the key areas referred to above, the Company will during the year ahead consider further areas of environmental impact for possible measurement and reporting, as well as initiatives to mitigate environmental impacts of products and services and the extent of impact mitigation.
Environmental practicesDuring the year, the subsidiary companies continued their initiatives to measure and mitigate detrimental environmental impact. Some of the Company’s activities and achievements were:• Environmental management systems – As
mentioned above, the Isando coffee and creamer factory, the Durban tea factory and both the Isando and Westmead biscuit factories are all ISO 14001 certified. This environmental quality management system enables the factories to identify and control the environmental impact of their activities; continually improve their environmental performance; and implement a systematic approach to setting environmental objectives and targets, achieving these and demonstrating that they have been achieved. I&J has the Marine Safety Council’s Chain of Custody Certification for sustainability in the fishing industry.
• Energy conservation – The current energy shortage and global efforts to reduce greenhouse gas emissions make conserving energy a priority for the Company by, inter alia, electricity-saving initiatives such as:– improving the efficiencies of production machinery,
equipment and processes, and the installation of energy-efficient lighting solutions, to maximise energy savings and limit wastage;
– optimising the use of cold storage space at I&J and decommissioning under-utilised cold storage space;
– the installation of electricity meters per site for the measurement of electricity consumption and consumption patterns to enable the formulation of improvement plans to correct excessive use or wastage; and
– electrical load-shifting where possible, bearing in mind the Company’s operational requirements and the installation of power correction units to maintain a constant, minimum level power supply.
In addition, the Company’s subsidiaries are taking steps to measure and manage their carbon footprint
through, inter alia, the use of the Greenhouse Gas Accounting Protocol and the ISO 14064 International Standard for GHG Emissions Inventories and Verification.
• Water conservation – Poor water quality and shortages are a significant potential risk to the Company, and the subsidiaries take steps to minimise these risks. These steps include utilising boreholes and reservoirs for storing water, recycling condensate produced during the heating processes back to the boilers, and adopting environmentally friendly stormwater reticulation, while simultaneously taking measures to measure and manage water consumption.
• Fuel consumption – Within its distribution operations there is ongoing focus on optimisation of delivery routes and consideration of distribution networks through the utilisation of routing and scheduling software throughout the Company, the deployment of on-board technology, advanced fuel management systems, more efficient engines and matching of loads to vehicles, as well as driver training academies, which all remain key issues in reducing fuel consumption and the Company’s carbon footprint.
• Emissions, effluents and waste – The Company is committed to formulating an overall waste management strategy, reducing the use of raw materials, reducing waste, re-using waste wherever possible, and recycling waste that cannot be eliminated or re-used. Key to managing waste is the monitoring and analysis of waste volumes and component parts to give the Company the information it needs to manage waste effectively. The Company also recognises its responsibility in terms of the Air Quality Act of 2004 and is committed to efficient and effective air quality management and thus ensures that all ovens, paraffin and oil-fired boilers, and boiler stacks are correctly operated, well maintained and routinely inspected. In addition, the Snackworks’ factories are engaging with approved inspection authorities and conducting air emission surveys.– Effluent management at the Snackworks’ factories
involves flocculation and removal of solids from the water, and reduction of the pH and chemical oxygen demand (“COD”) levels. Waste materials are classified for possible re-use, recycling or disposal and disposals are done through registered waste disposal and recycling companies.
– Where appropriate the tea and coffee factories are installing new equipment and modifying old equipment in order to reduce emissions, including the planned installation of an afterburner on the coffee roaster, modification of the fine emissions handling systems on the coffee spray driers, installation of a new agglomeration system and the possible conversion of the boilers from coal to

45
natural gas at the Isando coffee factory. By-products recycled by Entyce Beverages include spent groundbeans and cardboard outer packaging from raw materials.
– I&J routinely recycles corrugated cartons, used sunflower oil and used marine oil and contracts a specialist waste management partner, certified by the Institute of Waste Management of Southern Africa, to assist it with the integrated management of solid waste generated by fishing and processing operations. In 2010, I&J commenced on-site waste sorting and management trials at its primary processing facility in Woodstock. The objective of the trials is to reduce the amount of solid waste that ends up in landfill sites by 90% by 2015. Entyce Beverages has implemented various initiatives to reduce the weight (and resultant waste) of packaging by down-gauging of flexible packaging and tin and removing excess packaging. In addition, they are encouraging consumers to recycle by including recycle logos and categorisation on their packaging.
– Indigo Brands has committed itself to being part of the local government’s initiative of waste management for their sector, which will result in a formal waste management plan with the view to introducing waste reduction and management actions. In addition, they recycle corrugated cartons, aerosol cans and glass bottles.
• Raw materials – The Company’s use of sustainable raw materials, including recycled and recyclable materials and materials derived from ethical and sustainable sources as certified by bodies such as the Roundtable on Sustainable Palm Oil (“RSPO”), the Forestry Stewardship Council (“FSC”) (for packaging materials produced from sustainable forests), the Convention on Biological Diversity and the Right Rooibos initiative, is an integral part of the Company’s sustainability strategy. All of the palm oil procured by the Company is from sustainable farms certified by the RSPO. The high-performance paperboard used in I&J retail packs is produced from a certified, renewable resource and all paperboard materials can be recycled multiple times. These retail cartons are packed into outer cartons supplied by local companies that meet the environmental management standard ISO 14001 and are certified by the FSC, and all I&J outer cartons are 100% recyclable. All paperboard materials used by National Brands are produced from sustainable forests which are FSC compliant, contain no heavy metals or mineral oils, and no fossil fuel energy is used in the production of these products. These materials are also 100% recyclable.
No fines or non-monetary sanctions for infringement of or non-compliance with environmental laws and regulations were recorded and/or levied against the Company, directors, officers or employees during the period under review and the Company experienced no major environmental incidents. No formal requests or directives have been issued by government agencies or the local authority for the reduction of air emissions.
Consumer and product legislationThe Company’s internal legal advisers keep the Company abreast of generic and industry-specific consumer and product-related legislative and regulatory developments, both pending and apparent, and ensure that the Board, management and employees are informed and, where necessary, trained on these developments and the implementation thereof.
In the year under review the Company continued addressing changes brought about by, particularly, the Consumer Protection Act of 2008 (including the guidelines for the development of industry Codes of Conduct and the establishment of an industry-specific Ombudsman, as well as the consumer product safety recall guidelines), the draft amendments to the Consumer Protection Act Regulations relating to Product Labelling and Trade Descriptions, the various regulations published in terms of the Foodstuffs, Cosmetics and Disinfectants Act, 1972, and the Medicines and Controlled Substances Amendment Act. The Company’s central marketing function, together with the Group legal advisers, ensures that there is adherence to laws, standards and voluntary codes relating to marketing and communications, including advertising, promotions, competitions and sponsorships. All applicable labelling legislation is regularly reviewed and, where appropriate, changes are made to the Company’s labelling. The research and development managers in the subsidiary companies are responsible for ensuring compliance.
The Company remains a member of a number of industry associations as set out in more detail in the stakeholder engagement table.
No judgments, damages, penalties or fines for infringement of or non-compliance with consumer or product-related legislation were recorded and/or levied against the Company, directors, officers or employees during the period under review.
OV
ER
VIE
WB
USIN
ESS R
EV
IEW
GO
VE
RN
AN
CE
AN
NU
AL FIN
AN
CIA
L STATE
ME
NTS
SHA
RE
HO
LDE
R IN
FOR
MA
TION
46
sustAINAbLe development report continued
Major risksThe Company and its subsidiaries have well-run governance processes and sound systems of internal control which are effective in managing the conventional key areas of business risk such as brand management, manufacturing, financial management and information technology. Other risks that are often more challenging to manage, and pose a greater threat to business success, are summarised below:
Key risks Comments
Failure to stay in touch with changing consumer perspectives and needs, resulting in lost growth opportunities or erosion of market share
• Product formats and price points are managed flexibly in different parts of the consumer cycle, in line with consumer needs.
• Each business unit gives high priority to understanding the risks and opportunities that South Africa’s growing black consumer base presents, and responding in a manner appropriate to each category.
• The characteristics of our African export geographies are studied carefully so that we can enhance the relevance of our offering in each geography.
• New product development is aligned with the points above and actively pursued.• Brand investment is material and consistent, with on-going efforts to improve the
efficiency and effectiveness of this spend.
Availability of experienced and commercially minded business leaders to seek improvement and grow profits
• This is an on-going challenge, particularly given the diversity of AVI’s operations. Considerable resources are expended in identifying people and, where appropriate, attracting them.
• The Group has a flexible operating model which provides high transparency to the centre and facilitates effective interaction on key matters when needed.
• Remuneration and reward systems provide meaningful wealth generation opportunities for managers who excel.
• Various formal and informal internal learning and development initiatives are provided.
Changing competitive landscape that impacts profitability
• A volatile currency with the risk of rapid and material weakening has traditionally been an effective protection against import competition, but has proven less so in the last few years and may not be in the future.
• A fairly small domestic market reduces the attractiveness of major greenfield investment in South Africa with the risk that surplus capacity will inhibit the ability to generate economic returns on investment.
• New suppliers or customers entering the South African FMCG market can present both risks and opportunities. We believe that the Company has sufficient scale and relevance with its strong brand portfolio to be important to new entrants, and to be able to forge mutually beneficial trading relationships.
• The Company’s best protection in a changing competitive landscape is to continually work to keep our brands and products relevant to consumers, to improve efficiency so that margins can be sustained when prices are constrained, and to be diligent in managing the price/volume/margin equation flexibly as circumstances require.
Overreliance on third-party brands and diminished profitability if licences are not renewed
• Most of the Company’s core brands are owned.• Key third-party brands that the Company has access to are the Lacoste brand in Spitz,
and the Coty brand held by Indigo Brands. We have a long history of strong and successful relationships with both parties and believe that our business units represent compelling opportunities to each licensor that will be difficult for other licensees to match.
47
Key risks Comments
Sustaining and growing profit margins
• Top-line growth is a continual focus area for all of our businesses and brings with it the opportunity to leverage fixed costs and expand profit margins. While the most notable achievements in this regard have been in our Fashion Brands businesses, our more mature categories have all maintained or improved their market positions over the last few years, with some of them such as coffee and creamer achieving strong volume growth.
• Many of the Company’s Key Value Items (“KVIs”) enjoy a brand premium because of their long legacy of delivery and quality with consumers. We seek to preserve this premium through retention of product intrinsics and high focus on product quality. We will continue to invest replacement capital expenditure in those parts of our business where it is necessary to sustain efficient and high-quality production.
• The Company has extensive exposure to foreign exchange and commodity price volatility. These exposures are hedged in a manner that allows selling prices to be managed predictably and responsibly, and historically our businesses with their strong brands have demonstrated the ability to recover lost profit margin fairly quickly after periods of pressure. The notable exception being I&J, which has little ability to compensate for the impact of a strong Rand on its material export revenues, but similarly also benefits materially when the Rand is weaker.
• There remain many opportunities to improve profit margins across the Group over the next few years. These include initiatives such as central procurement, on-going improvements in logistics and field marketing, new technology and increased automation in our factories.
Social and political environment
• I&J’s annual allocation in terms of its long-term fishing rights is dependent on an on-going review process. If this process becomes politicised and disregards I&J’s ownership of an economic right it may result in a reduced allocation of hake quota to I&J.
• The inability of the Department of Agriculture, Forestry and Fisheries to meet its responsibility to ensure regular research and patrols as part of the Marine Stewardship Council accreditation, puts this accreditation at risk.
• On-going increases in administered charges for electricity, water and property rates create additional cost pressure and reduce competitiveness relative to imports.
• In a two-tiered economy the Company increasingly competes with smaller operators who are not measured or monitored effectively against increasing and onerous legislated requirements.
• Inflexible labour legislation reduces competitiveness against imports and increases investment hurdles.
• Availability of utilities necessary to run business can be mitigated at extra cost, but reduces competitiveness. The Company has commenced a programme of installing full back-up power generation at key sites.
• The imposition of price controls pursuant to a populist political and social agenda could impact parts of the Company’s product portfolio.
• Dissatisfaction with service delivery by government and municipalities could lead to civil disruption and strikes with a material adverse effect on volumes and profit.
• The continued decline of educational standards erodes the supply of essential skills to maintain our medium-term competitiveness.
• The emergence of new and ambitious social programmes that place too heavy a burden on organised business and tax-payers, to the extent that the availability of capital reduces in South Africa and over time compromises our ability to sustain our current asset base and competitiveness.
Environmental • The impact of climate change on natural resources through changing weather patterns and increased global temperatures could affect natural and agricultural resources on which the Company is dependent.
• Climate change will attract regulatory costs which will increase operating costs.• Government commitments to emission-reduction targets could have a significant
impact on the operating and distribution practices of the Company.• Deteriorating water quality through pollution, including tainted groundwater from
mining operations.
OV
ER
VIE
WB
USIN
ESS R
EV
IEW
GO
VE
RN
AN
CE
AN
NU
AL FIN
AN
CIA
L STATE
ME
NTS
SHA
RE
HO
LDE
R IN
FOR
MA
TION
48
sustAINAbLe development report continued
Going forwardIn the year ahead the Company will continue formalising its approach to integrated sustainability reporting and to providing a balanced view of the economic, social and environmental aspects of the Company. In particular there will be focus on:• further defining and implementing the scope and
methods of monitoring and reporting on the environmental issues identified during the year under
review, and establishing a method to set relevant objectives and targets for these issues;
• reviewing and evolving the principles and practices of sustainable development established throughout the Company; and
• reviewing and evolving the Company’s integrated reporting to ensure the appropriate reporting of environmental, social and economic sustainability, underpinned by good corporate governance.
Index of material issues
ASPECT CORE INDICATOR PAGE/S
Standard disclosures: ProfileStrategy and analysis 1.1 Statement from the most senior decision maker of
the Company about the relevance of sustainability to the Company and its strategy, particularly with regard to managing the challenges associated with economic, environmental and social performance
6 – 9
1.2 Description of key impacts, risks and opportunities 6 – 9; 32 – 53
Organisational profile 2.1 Name of the Company Inside front and back cover
2.2 Primary brands, products and/or services 1
2.3 Operational structure of the Company 1
2.4 Location of Company’s headquarters Inside back cover
2.5 Number of countries where the Company operates and names of countries with major operations or that are specifically relevant to the sustainability issues covered in the report
Inside front cover; 82 – 85
2.6 Nature of ownership and legal form 1
2.7 Markets served (geographical, sector and types of customers)
1; 82 – 85
2.8 Scale of the Company, including:• number of employees;• number of operations;• net sales;• total capitalisation in terms of debt and equity; and• quantity of products provided.
Annual financial statements from page 71
2.9 Significant changes during the reporting period regarding size, structure or ownership
Directors’ report from page 74
2.10 Awards received in the reporting periodNote: No awards were received
GRI table
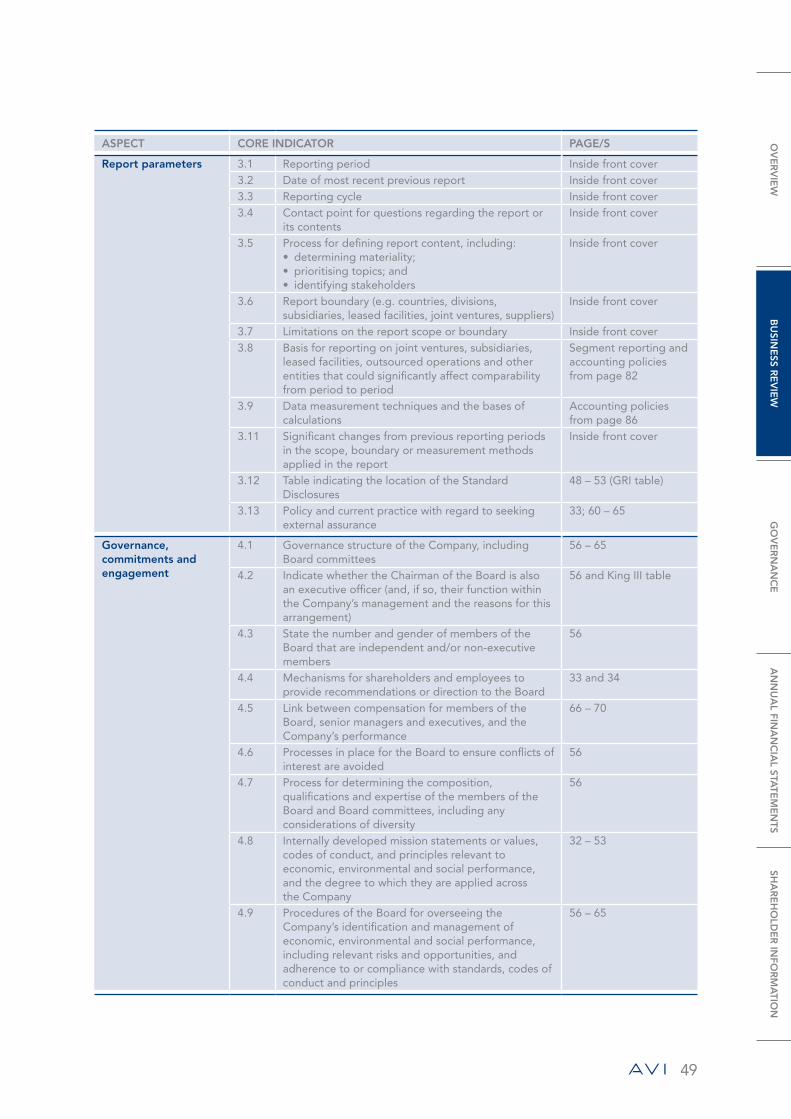
49
ASPECT CORE INDICATOR PAGE/S
Report parameters 3.1 Reporting period Inside front cover3.2 Date of most recent previous report Inside front cover3.3 Reporting cycle Inside front cover3.4 Contact point for questions regarding the report or
its contentsInside front cover
3.5 Process for defining report content, including:• determining materiality;• prioritising topics; and• identifying stakeholders
Inside front cover
3.6 Report boundary (e.g. countries, divisions, subsidiaries, leased facilities, joint ventures, suppliers)
Inside front cover
3.7 Limitations on the report scope or boundary Inside front cover3.8 Basis for reporting on joint ventures, subsidiaries,
leased facilities, outsourced operations and other entities that could significantly affect comparability from period to period
Segment reporting and accounting policies from page 82
3.9 Data measurement techniques and the bases of calculations
Accounting policies from page 86
3.11 Significant changes from previous reporting periods in the scope, boundary or measurement methods applied in the report
Inside front cover
3.12 Table indicating the location of the Standard Disclosures
48 – 53 (GRI table)
3.13 Policy and current practice with regard to seeking external assurance
33; 60 – 65
Governance, commitments and engagement
4.1 Governance structure of the Company, including Board committees
56 – 65
4.2 Indicate whether the Chairman of the Board is also an executive officer (and, if so, their function within the Company’s management and the reasons for this arrangement)
56 and King III table
4.3 State the number and gender of members of the Board that are independent and/or non-executive members
56
4.4 Mechanisms for shareholders and employees to provide recommendations or direction to the Board
33 and 34
4.5 Link between compensation for members of the Board, senior managers and executives, and the Company’s performance
66 – 70
4.6 Processes in place for the Board to ensure conflicts of interest are avoided
56
4.7 Process for determining the composition, qualifications and expertise of the members of the Board and Board committees, including any considerations of diversity
56
4.8 Internally developed mission statements or values, codes of conduct, and principles relevant to economic, environmental and social performance, and the degree to which they are applied across the Company
32 – 53
4.9 Procedures of the Board for overseeing the Company’s identification and management of economic, environmental and social performance, including relevant risks and opportunities, and adherence to or compliance with standards, codes of conduct and principles
56 – 65
OV
ER
VIE
WB
USIN
ESS R
EV
IEW
GO
VE
RN
AN
CE
AN
NU
AL FIN
AN
CIA
L STATE
ME
NTS
SHA
RE
HO
LDE
R IN
FOR
MA
TION

50
sustAINAbLe development report continued
ASPECT CORE INDICATOR PAGE/S
Governance, commitments and engagement continued
4.10 Process for evaluating the Board’s own performance, particularly with respect to economic, environmental and social performance
56
4.11 Explanation of whether and how the precautionary approach or principle is addressed by the Company
32 and 33
4.12 Externally developed economic, environmental and social charters, principles or other initiatives to which the Company subscribes or endorses
32 – 53
4.13 Membership in associations and/or national/international advocacy groups in which the Company:• has positions in governance bodies;• participates in projects or committees;• provides substantive funding beyond routine
membership dues; and• views membership as strategic
32 – 53
4.14 List of stakeholder groups engaged by the Company 33 and 344.15 Basis for identification and selection of stakeholders
with whom to engage33
4.16 Approaches to stakeholder engagement, including frequency of engagement
33 and 34
4.17 Key topics and concerns that have been raised through stakeholder engagement, and how the Company has responded to those key topics and concerns, including through its reporting
33; 34 and 65
Standard disclosures: Performance indicatorsEnvironmental EN2 Percentage of materials used that are recycled input
materials43 – 45
EN3 Direct energy consumption by primary energy source 43EN8 Total water withdrawal by source 43EN11 Location and size of land owned, leased, managed
in, or adjacent to, protected areas and areas of high biodiversity value outside protected areas
36
EN12 Description of significant impacts of activities, products and services on biodiversity in protected areas and areas of high biodiversity value outside protected areas
36
EN16 Total direct and indirect greenhouse gas emissions by weight
43
EN26 Initiatives to mitigate environmental impacts of products and services and extent of impact mitigation
44 and 45
EN28 Monetary value of significant fines and total number of non-monetary sanctions for non-compliance with environmental laws and regulations
45
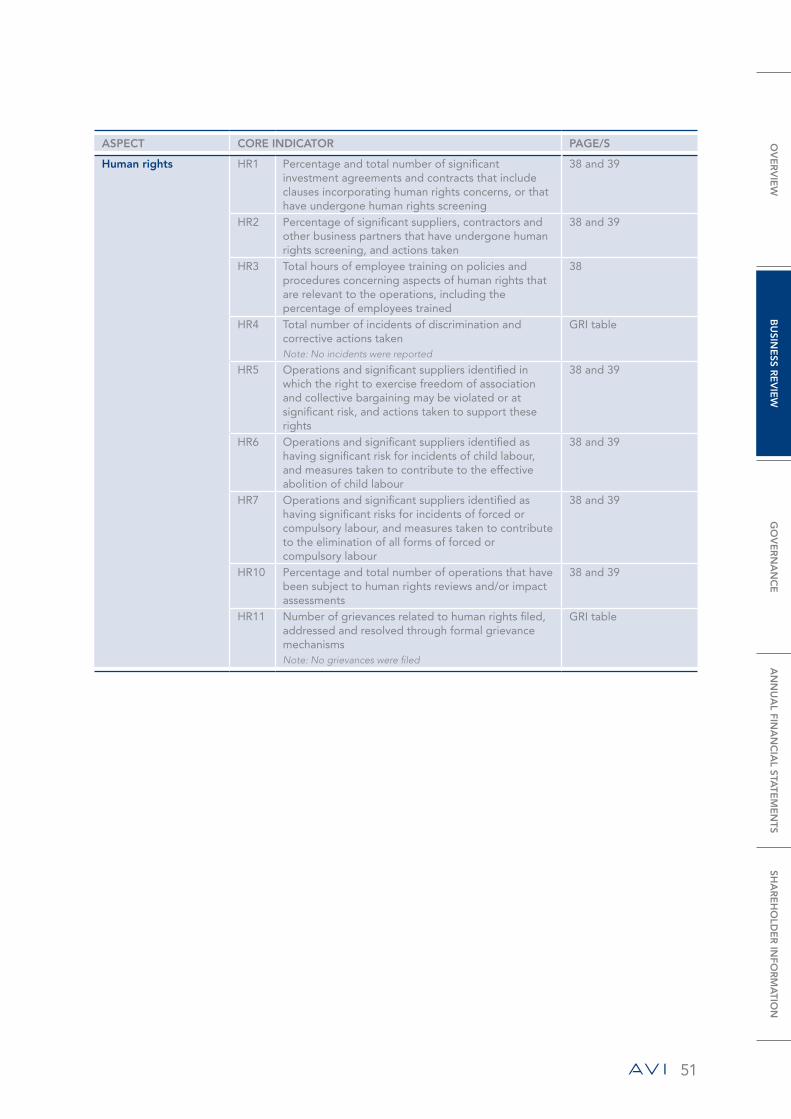
51
ASPECT CORE INDICATOR PAGE/S
Human rights HR1 Percentage and total number of significant investment agreements and contracts that include clauses incorporating human rights concerns, or that have undergone human rights screening
38 and 39
HR2 Percentage of significant suppliers, contractors and other business partners that have undergone human rights screening, and actions taken
38 and 39
HR3 Total hours of employee training on policies and procedures concerning aspects of human rights that are relevant to the operations, including the percentage of employees trained
38
HR4 Total number of incidents of discrimination and corrective actions takenNote: No incidents were reported
GRI table
HR5 Operations and significant suppliers identified in which the right to exercise freedom of association and collective bargaining may be violated or at significant risk, and actions taken to support these rights
38 and 39
HR6 Operations and significant suppliers identified as having significant risk for incidents of child labour, and measures taken to contribute to the effective abolition of child labour
38 and 39
HR7 Operations and significant suppliers identified as having significant risks for incidents of forced or compulsory labour, and measures taken to contribute to the elimination of all forms of forced or compulsory labour
38 and 39
HR10 Percentage and total number of operations that have been subject to human rights reviews and/or impact assessments
38 and 39
HR11 Number of grievances related to human rights filed, addressed and resolved through formal grievance mechanismsNote: No grievances were filed
GRI table
OV
ER
VIE
WB
USIN
ESS R
EV
IEW
GO
VE
RN
AN
CE
AN
NU
AL FIN
AN
CIA
L STATE
ME
NTS
SHA
RE
HO
LDE
R IN
FOR
MA
TION

52
sustAINAbLe development report continued
ASPECT CORE INDICATOR PAGE/S
Labour practices and decent work
LA1 Total workforce by employment type, employment contract and region, and broken down by gender
39
LA4 Percentage of employees covered by collective bargaining agreements
39
LA5 Minimum notice period(s) regarding operational changes, including whether it is specified in collective agreements
39
LA7 Rates of injury, occupational diseases, lost days and absenteeism, and number of work-related fatalities by region and gender
39 and 40
LA8 Education, training, counselling, prevention and risk-control programmes in place to assist workforce members, their families or community members regarding serious diseases
40 and 41
LA10 Average hours of training per year per employee by gender and by employee category
38
LA13 Composition of governance bodies and breakdown of employees per employee category according to gender, age group, minority group membership and other indicators of diversity
39; 56 – 59
Society SO1 Percentage of operations with implemented local community engagement, impact assessments and development programmes
41 and 42
SO2 Percentage and total number of business units analysed for risks related to corruption
35; 63 and 64
SO4 Actions taken in response to incidents of corruption 35SO8 Monetary value of significant fines and total number
of non-monetary sanctions for non-compliance with laws and regulations
45
SO9 Operations with significant potential or actual negative impacts on local communities
35 and 36; 43 – 45
SO10 Prevention and mitigation measures implemented in operations with significant potential or actual negative impacts on local communities
35 and 36; 43 – 45

53
ASPECT CORE INDICATOR PAGE/S
Product responsibility PR6 Programmes for adherence to laws, standards and voluntary codes related to marketing communications, including advertising, promotion and sponsorship
45
PR9 Monetary value of significant fines for non-compliance with laws and regulations concerning the provision and use of products and services
45
Economic EC1 Direct economic value generated and distributed 27EC2 Financial implications and other risks and
opportunities for the organisation’s activities due to climate change
43 – 45; 47
EC3 Coverage of the organisation’s defined benefit plan obligations
88 and 89; 118 and 119
EC4 Significant financial assistance received from governmentNote: Other than discretionary grants from sector Education and Training authorities, no financial assistance was received from government
38
EC6 Policy, practices and proportion of spending on locally-based suppliers at significant locations of operations
38 and 39
EC7 Procedures for local hiring and proportion of senior management hired from the local community at locations of significant operations
38 and 39
EC8 Development and impact of infrastructure investments and services provided primarily for public benefit through commercial, in-kind, or pro bono engagement
41 and 42
OV
ER
VIE
WB
USIN
ESS R
EV
IEW
GO
VE
RN
AN
CE
AN
NU
AL FIN
AN
CIA
L STATE
ME
NTS
SHA
RE
HO
LDE
R IN
FOR
MA
TION
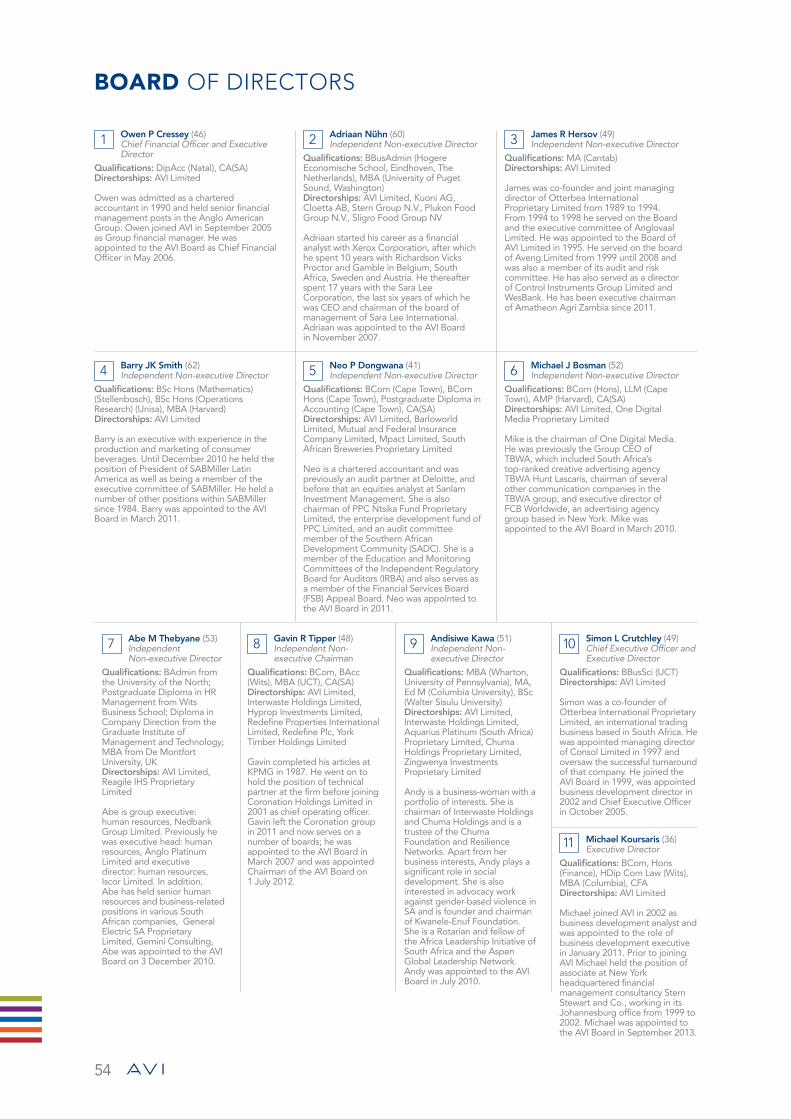
54
board of directors
Abe M Thebyane (53) Independent
Non-executive DirectorQualifications: BAdmin from the University of the North; Postgraduate Diploma in HR Management from Wits Business School; Diploma in Company Direction from the Graduate Institute of Management and Technology; MBA from De Montfort University, UK Directorships: AVI Limited, Reagile IHS Proprietary Limited
Abe is group executive: human resources, Nedbank Group Limited. Previously he was executive head: human resources, Anglo Platinum Limited and executive director: human resources, Iscor Limited. In addition, Abe has held senior human resources and business-related positions in various South African companies, General Electric SA Proprietary Limited, Gemini Consulting, Abe was appointed to the AVI Board on 3 December 2010.
Gavin R Tipper (48) Independent Non-
executive ChairmanQualifications: BCom, BAcc (Wits), MBA (UCT), CA(SA)Directorships: AVI Limited, Interwaste Holdings Limited, Hyprop Investments Limited, Redefine Properties International Limited, Redefine Plc, York Timber Holdings Limited
Gavin completed his articles at KPMG in 1987. He went on to hold the position of technical partner at the firm before joining Coronation Holdings Limited in 2001 as chief operating officer. Gavin left the Coronation group in 2011 and now serves on a number of boards; he was appointed to the AVI Board in March 2007 and was appointed Chairman of the AVI Board on 1 July 2012.
Andisiwe Kawa (51) Independent Non-
executive DirectorQualifications: MBA (Wharton, University of Pennsylvania), MA, Ed M (Columbia University), BSc (Walter Sisulu University)Directorships: AVI Limited, Interwaste Holdings Limited, Aquarius Platinum (South Africa) Proprietary Limited, Chuma Holdings Proprietary Limited, Zingwenya Investments Proprietary Limited
Andy is a business-woman with a portfolio of interests. She is chairman of Interwaste Holdings and Chuma Holdings and is a trustee of the Chuma Foundation and Resilience Networks. Apart from her business interests, Andy plays a significant role in social development. She is also interested in advocacy work against gender-based violence in SA and is founder and chairman of Kwanele-Enuf Foundation. She is a Rotarian and fellow of the Africa Leadership Initiative of South Africa and the Aspen Global Leadership Network. Andy was appointed to the AVI Board in July 2010.
Simon L Crutchley (49) Chief Executive Officer and
Executive DirectorQualifications: BBusSci (UCT)Directorships: AVI Limited
Simon was a co-founder of Otterbea International Proprietary Limited, an international trading business based in South Africa. He was appointed managing director of Consol Limited in 1997 and oversaw the successful turnaround of that company. He joined the AVI Board in 1999, was appointed business development director in 2002 and Chief Executive Officer in October 2005.
Michael Koursaris (36) Executive Director
Qualifications: BCom, Hons (Finance), HDip Com Law (Wits), MBA (Columbia), CFADirectorships: AVI Limited
Michael joined AVI in 2002 as business development analyst and was appointed to the role of business development executive in January 2011. Prior to joining AVI Michael held the position of associate at New York headquartered financial management consultancy Stern Stewart and Co., working in its Johannesburg office from 1999 to 2002. Michael was appointed to the AVI Board in September 2013.
Owen P Cressey (46) Chief Financial Officer and Executive
DirectorQualifications: DipAcc (Natal), CA(SA)Directorships: AVI Limited
Owen was admitted as a chartered accountant in 1990 and held senior financial management posts in the Anglo American Group. Owen joined AVI in September 2005 as Group financial manager. He was appointed to the AVI Board as Chief Financial Officer in May 2006.
Adriaan Nühn (60) Independent Non-executive Director
Qualifications: BBusAdmin (Hogere Economische School, Eindhoven, The Netherlands), MBA (University of Puget Sound, Washington)Directorships: AVI Limited, Kuoni AG, Cloetta AB, Stern Group N.V., Plukon Food Group N.V., Sligro Food Group NV
Adriaan started his career as a financial analyst with Xerox Corporation, after which he spent 10 years with Richardson Vicks Proctor and Gamble in Belgium, South Africa, Sweden and Austria. He thereafter spent 17 years with the Sara Lee Corporation, the last six years of which he was CEO and chairman of the board of management of Sara Lee International. Adriaan was appointed to the AVI Board in November 2007.
Barry JK Smith (62) Independent Non-executive Director
Qualifications: BSc Hons (Mathematics) (Stellenbosch), BSc Hons (Operations Research) (Unisa), MBA (Harvard)Directorships: AVI Limited
Barry is an executive with experience in the production and marketing of consumer beverages. Until December 2010 he held the position of President of SABMiller Latin America as well as being a member of the executive committee of SABMiller. He held a number of other positions within SABMiller since 1984. Barry was appointed to the AVI Board in March 2011.
Neo P Dongwana (41) Independent Non-executive Director
Qualifications: BCom (Cape Town), BCom Hons (Cape Town), Postgraduate Diploma in Accounting (Cape Town), CA(SA)Directorships: AVI Limited, Barloworld Limited, Mutual and Federal Insurance Company Limited, Mpact Limited, South African Breweries Proprietary Limited
Neo is a chartered accountant and was previously an audit partner at Deloitte, and before that an equities analyst at Sanlam Investment Management. She is also chairman of PPC Ntsika Fund Proprietary Limited, the enterprise development fund of PPC Limited, and an audit committee member of the Southern African Development Community (SADC). She is a member of the Education and Monitoring Committees of the Independent Regulatory Board for Auditors (IRBA) and also serves as a member of the Financial Services Board (FSB) Appeal Board. Neo was appointed to the AVI Board in 2011.
Michael J Bosman (52) Independent Non-executive Director
Qualifications: BCom (Hons), LLM (Cape Town), AMP (Harvard), CA(SA)Directorships: AVI Limited, One Digital Media Proprietary Limited
Mike is the chairman of One Digital Media. He was previously the Group CEO of TBWA, which included South Africa’s top-ranked creative advertising agency TBWA Hunt Lascaris, chairman of several other communication companies in the TBWA group, and executive director of FCB Worldwide, an advertising agency group based in New York. Mike was appointed to the AVI Board in March 2010.
James R Hersov (49) Independent Non-executive Director
Qualifications: MA (Cantab)Directorships: AVI Limited
James was co-founder and joint managing director of Otterbea International Proprietary Limited from 1989 to 1994. From 1994 to 1998 he served on the Board and the executive committee of Anglovaal Limited. He was appointed to the Board of AVI Limited in 1995. He served on the board of Aveng Limited from 1999 until 2008 and was also a member of its audit and risk committee. He has also served as a director of Control Instruments Group Limited and WesBank. He has been executive chairman of Amatheon Agri Zambia since 2011.

55
OV
ER
VIE
WB
USIN
ESS R
EV
IEW
GO
VE
RN
AN
CE
AN
NU
AL FIN
AN
CIA
L STATE
ME
NTS
SHA
RE
HO
LDE
R IN
FOR
MA
TION
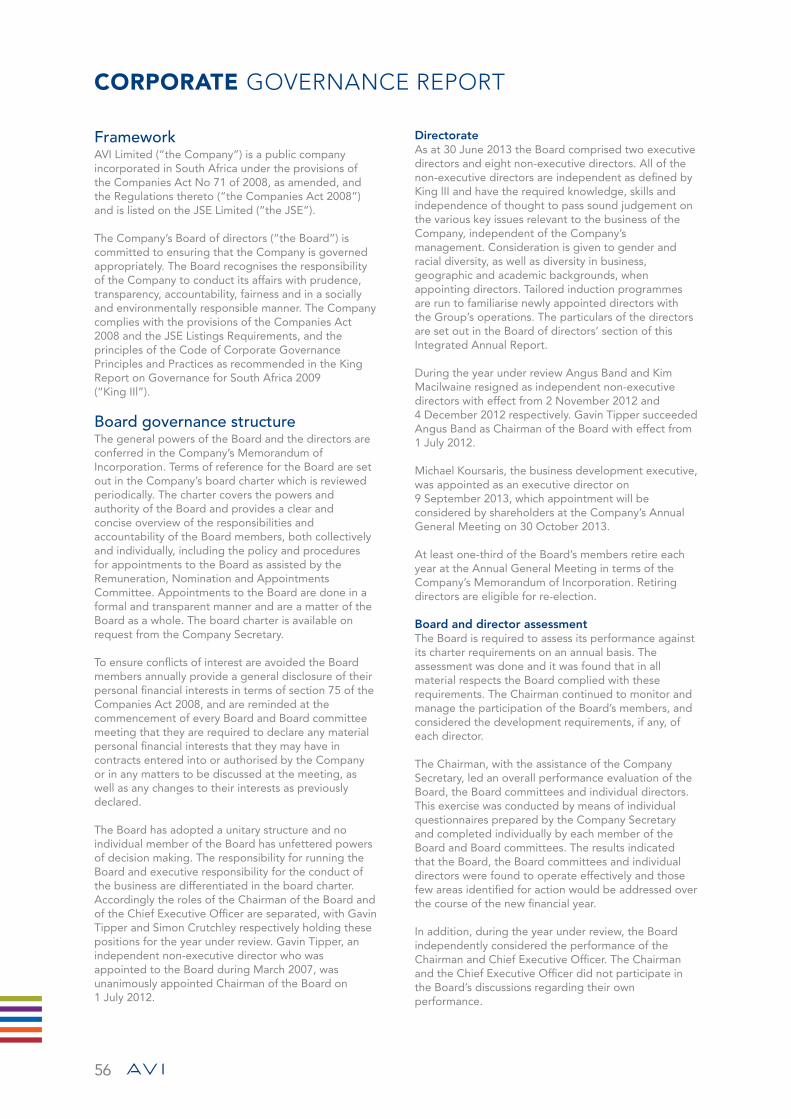
56
corporate governance report
FrameworkAVI Limited (“the Company”) is a public company incorporated in South Africa under the provisions of the Companies Act No 71 of 2008, as amended, and the Regulations thereto (“the Companies Act 2008”) and is listed on the JSE Limited (“the JSE”).
The Company’s Board of directors (“the Board”) is committed to ensuring that the Company is governed appropriately. The Board recognises the responsibility of the Company to conduct its affairs with prudence, transparency, accountability, fairness and in a socially and environmentally responsible manner. The Company complies with the provisions of the Companies Act 2008 and the JSE Listings Requirements, and the principles of the Code of Corporate Governance Principles and Practices as recommended in the King Report on Governance for South Africa 2009 (“King IIl”).
Board governance structureThe general powers of the Board and the directors are conferred in the Company’s Memorandum of Incorporation. Terms of reference for the Board are set out in the Company’s board charter which is reviewed periodically. The charter covers the powers and authority of the Board and provides a clear and concise overview of the responsibilities and accountability of the Board members, both collectively and individually, including the policy and procedures for appointments to the Board as assisted by the Remuneration, Nomination and Appointments Committee. Appointments to the Board are done in a formal and transparent manner and are a matter of the Board as a whole. The board charter is available on request from the Company Secretary.
To ensure conflicts of interest are avoided the Board members annually provide a general disclosure of their personal financial interests in terms of section 75 of the Companies Act 2008, and are reminded at the commencement of every Board and Board committee meeting that they are required to declare any material personal financial interests that they may have in contracts entered into or authorised by the Company or in any matters to be discussed at the meeting, as well as any changes to their interests as previously declared.
The Board has adopted a unitary structure and no individual member of the Board has unfettered powers of decision making. The responsibility for running the Board and executive responsibility for the conduct of the business are differentiated in the board charter. Accordingly the roles of the Chairman of the Board and of the Chief Executive Officer are separated, with Gavin Tipper and Simon Crutchley respectively holding these positions for the year under review. Gavin Tipper, an independent non-executive director who was appointed to the Board during March 2007, was unanimously appointed Chairman of the Board on 1 July 2012.
DirectorateAs at 30 June 2013 the Board comprised two executive directors and eight non-executive directors. All of the non-executive directors are independent as defined by King lII and have the required knowledge, skills and independence of thought to pass sound judgement on the various key issues relevant to the business of the Company, independent of the Company’s management. Consideration is given to gender and racial diversity, as well as diversity in business, geographic and academic backgrounds, when appointing directors. Tailored induction programmes are run to familiarise newly appointed directors with the Group’s operations. The particulars of the directors are set out in the Board of directors’ section of this Integrated Annual Report.
During the year under review Angus Band and Kim Macilwaine resigned as independent non-executive directors with effect from 2 November 2012 and 4 December 2012 respectively. Gavin Tipper succeeded Angus Band as Chairman of the Board with effect from 1 July 2012.
Michael Koursaris, the business development executive, was appointed as an executive director on 9 September 2013, which appointment will be considered by shareholders at the Company’s Annual General Meeting on 30 October 2013.
At least one-third of the Board’s members retire each year at the Annual General Meeting in terms of the Company’s Memorandum of Incorporation. Retiring directors are eligible for re-election.
Board and director assessmentThe Board is required to assess its performance against its charter requirements on an annual basis. The assessment was done and it was found that in all material respects the Board complied with these requirements. The Chairman continued to monitor and manage the participation of the Board’s members, and considered the development requirements, if any, of each director.
The Chairman, with the assistance of the Company Secretary, led an overall performance evaluation of the Board, the Board committees and individual directors. This exercise was conducted by means of individual questionnaires prepared by the Company Secretary and completed individually by each member of the Board and Board committees. The results indicated that the Board, the Board committees and individual directors were found to operate effectively and those few areas identified for action would be addressed over the course of the new financial year.
In addition, during the year under review, the Board independently considered the performance of the Chairman and Chief Executive Officer. The Chairman and the Chief Executive Officer did not participate in the Board’s discussions regarding their own performance.

57
Board meetingsDuring the year under review the Board met formally on four occasions to conduct the normal business of the Company. Attendance at these meetings is summarised in the table below:
Name 07/09/2012 22/11/2012 08/03/2013 05/06/2013
AWB Band √
MJ Bosman X √ √ √
SL Crutchley √ √ √ √
OP Cressey √ √ √ √
NP Dongwana √ √ √ √
JR Hersov √ √ √ √
A Kawa √ √ √ √
KE Macilwaine √ √
A Nühn √ √ √ √
BJK Smith √ √ √ √
GR Tipper √ √ √ √
AM Thebyane √ √ √ √
Key: √ = in attendance; X = not in attendance; = resigned
In addition to these formal meetings and as a prelude to the Board meeting of 5 June 2013, the Board met with the executive management of the Company’s subsidiaries on 4 and 5 June 2013 and reviewed their performance for the past year and considered their objectives, strategies and budgeted performance for the year ahead.
Company SecretaryThe Company Secretary for the year under review was Sureya Naidoo.
All directors have unlimited access to the advice and services of the Company Secretary, who is accountable to the Board for ensuring that Board procedures are complied with and that sound corporate governance and ethical principles are adhered to.
The Company Secretary’s principal responsibilities to the Board and to the individual directors are to:• guide them in the discharge of their duties,
responsibilities and powers;• provide information, advice and education on
matters of ethics and good governance; and• ensure that their proceedings and affairs, and those
of the Company, are properly administered in compliance with all relevant legislation, in particular the Companies Act 2008 and the JSE Listings Requirements.
As required by the JSE Listings Requirements, the Board assessed and satisfied itself at the Board meeting of 6 September 2013, of the competence, qualifications and experience of the Company Secretary and that she has maintained an arm’s length relationship with the Board and its directors.
Board committeesThe Board is assisted in the discharge of its duties and responsibilities by the Audit and Risk Committee, the Remuneration, Nomination and Appointments Committee, and the Social and Ethics Committee. The ultimate responsibility at all times, however, resides in the Board and it therefore does not abdicate its responsibilities to these committees.
These committees act within formalised terms of reference which have been approved by the Board and which have been reviewed to reflect the Company’s application, where appropriate, of the principles embodied in King III, the statutory requirements of the Companies Act 2008 and the JSE Listings Requirements. The terms of reference set out the committees’ purpose, membership requirements, duties and reporting procedures. Relevant legislative requirements, such as those incorporated in the Companies Act 2008, are incorporated in the committee charters. Board committees, and the members thereof, may take independent professional advice at the Company’s expense.
When appropriate, ad hoc committees are formed to facilitate the achievement of specific short-term objectives.
There is full disclosure, transparency and reporting from these committees to the Board at each Board meeting, and the chairpersons of the committees attend the Annual General Meeting to respond to shareholders’ queries.
Audit and Risk Committee (“Audit Committee”)During the year under review the Audit Committee comprised Mike Bosman (the Chairman), Gavin Tipper, James Hersov and Neo Dongwana, all of whom are independent non-executive directors. On 7 September 2012, following his appointment as Chairman of the Board, Mr Tipper resigned as a member of the committee and Mr Hersov was appointed as a member of the committee. In compliance with the Companies Act 2008 shareholders will be asked at the annual general meeting on 30 October 2013 to elect the members of the Audit Committee. The current members will be available for re-election.
The Company’s external auditors, the Chairman of the Board, the Chief Executive Officer, the Chief Financial Officer, the Group’s head of internal audit and other senior executives attend the Audit Committee meetings by invitation.
Each operating subsidiary has an internal review committee which monitors risk management and compliance activities. These committees are chaired by the Company’s Chief Financial Officer and meet at least twice a year with the external auditors, the Group’s head of internal audit with the relevant financial and managing directors in attendance. Audit Committee members attend the subsidiary internal review meetings by open invitation. There is a formal reporting line from the various internal review committees into the Audit Committee via the Company’s Chief Financial Officer.
OV
ER
VIE
WB
USIN
ESS R
EV
IEW
GO
VE
RN
AN
CE
AN
NU
AL FIN
AN
CIA
L STATE
ME
NTS
SHA
RE
HO
LDE
R IN
FOR
MA
TION

58
corporate governance report continued
The Audit Committee met three times during the year under review. The attendance of the members is reflected in detail in the table below:
Name 30/08/2012 21/11/2012 28/02/2013MJ Bosman √ √ √NP Dongwana √ √ √JR Hersov √ √GR Tipper √Key: √ = in attendance; X = not in attendance;
= not yet in office; = resigned
The Audit Committee is responsible for the management of key financial and operating control risks and in particular assists the Board in the following matters:• Monitoring the financial reporting process;• Recommending the appointment of an independent
registered auditor, determining the terms of engagement and approving fees for audit and non-audit work undertaken;
• Monitoring the operation and effectiveness of internal control systems, including information technology controls;
• Overseeing the internal audit function, monitoring its effectiveness, and reviewing corrective action;
• Overseeing the implementation and effective operation of a structured risk management process that incorporates insurance, health and safety, and environmental issues;
• Implementing sound corporate governance policies;• Reviewing and recommending to the Board for
approval the interim and annual financial statements, the going-concern status of the Company, interim and final dividends, and other special payments to shareholders; and
• Considering and satisfying itself, on an annual basis, of the expertise and experience of the Chief Financial Officer.
KPMG Incorporated was reappointed as the Company’s external auditor by shareholders at the Company’s Annual General Meeting on 2 November 2012. With specific reference to the non-audit services provided by the external auditor, and at the recommendation of the Audit Committee, the Board has resolved that the auditors shall not:• function in the role of management;• audit their own work; and• serve in an advocacy role for the Company.
In accordance with the requirements of the Companies Act 2008, all non-audit specific service engagements with the external auditors were preapproved by the Audit Committee. Dedicated internal audit resources continued to be provided via a service provision arrangement with Ernst & Young Advisory Services Limited.
The Audit Committee discharged the functions ascribed to it in terms of the Companies Act 2008 and the JSE Listings Requirements as reported in the Directors’ Report. It also complied in all material respects with its mandate and responsibilities prescribed in the applicable charter.
Remuneration, Nomination and Appointments Committee (“Remcom”)During the year under review the members of Remcom were Adriaan Nühn (the Chairman), Angus Band, Andy Kawa, Abe Thebyane and Gavin Tipper. On 7 September 2012 Mr Nühn was appointed the chairman and Mr Thebyane was appointed a member of Remcom. Mr Band resigned as a member of the committee on 2 November 2012. The Company’s Chief Executive Officer and human resources executive attend relevant parts of Remcom meetings by invitation.
Remcom met four times during the year under review and the attendance detail is reflected in the table below:
Name 02/08/2012 06/09/2012 21/11/2012 03/06/2013A Nühn √ √AWB Band √ √A Kawa √ √ √ √AM Thebyane √ √GR Tipper √ √ √ √Key: √ = in attendance; X = not in attendance;
= not yet in office; = resigned
Remcom assists the Board by overseeing the following matters:• Ensuring that the Company’s directors and the
Group’s senior executives are competitively rewarded for their individual contributions to the Group’s overall performance. Remcom ensures that the remuneration of the senior executive members of the Group is set by a committee of Board members who have no personal interest in the outcomes of their decisions and who will give due regard to the interests of shareholders and to the financial and commercial health of the Company;
• Succession planning for, and approving the appointment of, senior executives within the Group;
• Recommending an appropriate remuneration and reward framework (including salaries, benefits, share options and incentive schemes) to ensure that the Group’s employees are appropriately engaged and retained. The framework considers guaranteed remuneration, short-term and long-term incentives, and benefits;
• Reviewing the composition of the Board and its committees with respect to size, diversity, skills and experience; and
• Recommending the appointment of directors to shareholders.
Remcom complied in all material respects with its mandate and responsibilities prescribed in the applicable charter.
Social and Ethics CommitteeDuring the year under review the Social and Ethics Committee comprised two independent non-executive directors, namely Neo Dongwana (the Chairman) and Barry Smith, as well as four executive members, namely Paul Presbury, the Group HR and legal executive; Willem Visser, the Group asset protection manager; Donnee MacDougall, the managing director of Entyce Beverages; and Catherine Makin, the Group marketing executive. Mrs MacDougall resigned as a member of
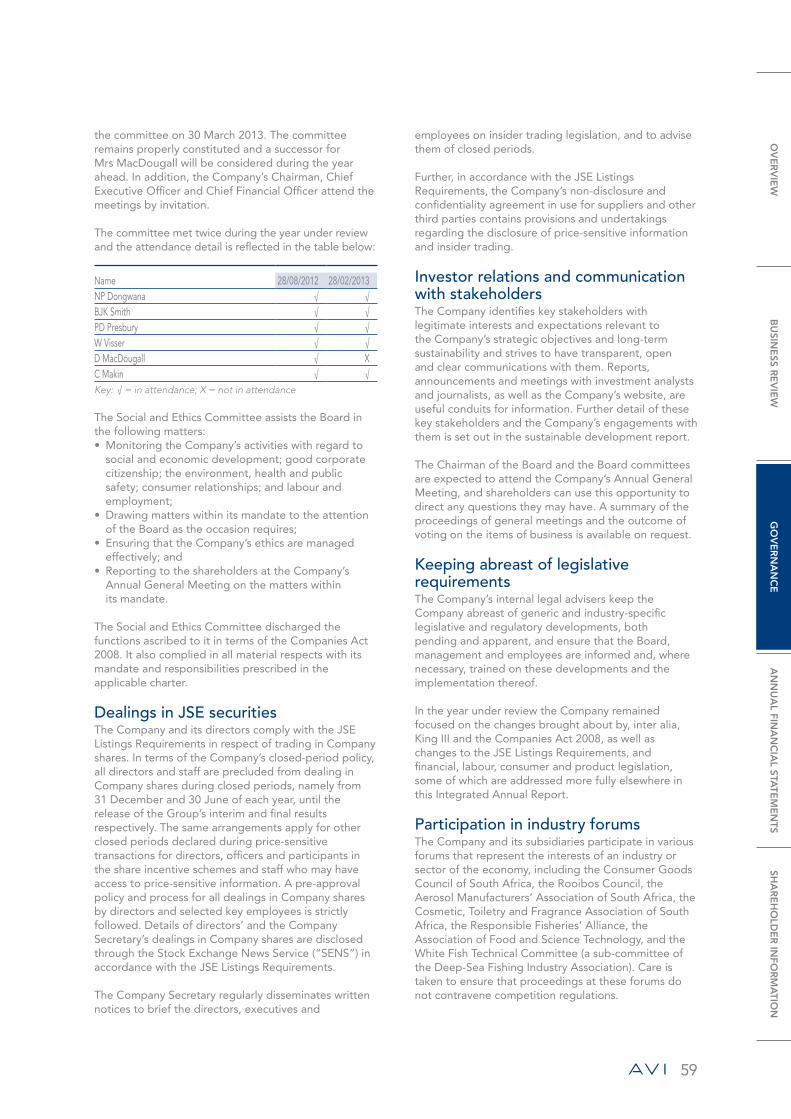
59
the committee on 30 March 2013. The committee remains properly constituted and a successor for Mrs MacDougall will be considered during the year ahead. In addition, the Company’s Chairman, Chief Executive Officer and Chief Financial Officer attend the meetings by invitation.
The committee met twice during the year under review and the attendance detail is reflected in the table below:
Name 28/08/2012 28/02/2013NP Dongwana √ √BJK Smith √ √PD Presbury √ √W Visser √ √D MacDougall √ XC Makin √ √Key: √ = in attendance; X = not in attendance
The Social and Ethics Committee assists the Board in the following matters:• Monitoring the Company’s activities with regard to
social and economic development; good corporate citizenship; the environment, health and public safety; consumer relationships; and labour and employment;
• Drawing matters within its mandate to the attention of the Board as the occasion requires;
• Ensuring that the Company’s ethics are managed effectively; and
• Reporting to the shareholders at the Company’s Annual General Meeting on the matters within its mandate.
The Social and Ethics Committee discharged the functions ascribed to it in terms of the Companies Act 2008. It also complied in all material respects with its mandate and responsibilities prescribed in the applicable charter.
Dealings in JSE securitiesThe Company and its directors comply with the JSE Listings Requirements in respect of trading in Company shares. In terms of the Company’s closed-period policy, all directors and staff are precluded from dealing in Company shares during closed periods, namely from 31 December and 30 June of each year, until the release of the Group’s interim and final results respectively. The same arrangements apply for other closed periods declared during price-sensitive transactions for directors, officers and participants in the share incentive schemes and staff who may have access to price-sensitive information. A pre-approval policy and process for all dealings in Company shares by directors and selected key employees is strictly followed. Details of directors’ and the Company Secretary’s dealings in Company shares are disclosed through the Stock Exchange News Service (“SENS”) in accordance with the JSE Listings Requirements.
The Company Secretary regularly disseminates written notices to brief the directors, executives and
employees on insider trading legislation, and to advise them of closed periods.
Further, in accordance with the JSE Listings Requirements, the Company’s non-disclosure and confidentiality agreement in use for suppliers and other third parties contains provisions and undertakings regarding the disclosure of price-sensitive information and insider trading.
Investor relations and communication with stakeholdersThe Company identifies key stakeholders with legitimate interests and expectations relevant to the Company’s strategic objectives and long-term sustainability and strives to have transparent, open and clear communications with them. Reports, announcements and meetings with investment analysts and journalists, as well as the Company’s website, are useful conduits for information. Further detail of these key stakeholders and the Company’s engagements with them is set out in the sustainable development report.
The Chairman of the Board and the Board committees are expected to attend the Company’s Annual General Meeting, and shareholders can use this opportunity to direct any questions they may have. A summary of the proceedings of general meetings and the outcome of voting on the items of business is available on request.
Keeping abreast of legislative requirementsThe Company’s internal legal advisers keep the Company abreast of generic and industry-specific legislative and regulatory developments, both pending and apparent, and ensure that the Board, management and employees are informed and, where necessary, trained on these developments and the implementation thereof.
In the year under review the Company remained focused on the changes brought about by, inter alia, King III and the Companies Act 2008, as well as changes to the JSE Listings Requirements, and financial, labour, consumer and product legislation, some of which are addressed more fully elsewhere in this Integrated Annual Report.
Participation in industry forumsThe Company and its subsidiaries participate in various forums that represent the interests of an industry or sector of the economy, including the Consumer Goods Council of South Africa, the Rooibos Council, the Aerosol Manufacturers’ Association of South Africa, the Cosmetic, Toiletry and Fragrance Association of South Africa, the Responsible Fisheries’ Alliance, the Association of Food and Science Technology, and the White Fish Technical Committee (a sub-committee of the Deep-Sea Fishing Industry Association). Care is taken to ensure that proceedings at these forums do not contravene competition regulations.
OV
ER
VIE
WB
USIN
ESS R
EV
IEW
GO
VE
RN
AN
CE
AN
NU
AL FIN
AN
CIA
L STATE
ME
NTS
SHA
RE
HO
LDE
R IN
FOR
MA
TION

60
corporate governance report continued
King III compliance disclosuresIn compliance with the JSE Listings Requirements the Company discloses hereunder details pertaining to its compliance with the principles of King III. In addition to these specific disclosures, statements are included throughout the Integrated Annual Report dealing with these principles.
PRINCIPLE IMPLEMENTATION
Chapter 1: Ethical leadership and corporate citizenship
1.1 The Board should provide effective leadership based on an ethical foundation
The Board operates within the powers conferred on it in the Memorandum of Incorporation and Board Charter; bases all deliberations, decisions and actions on strategic objectives, and ethical and moral values; considers the legitimate interests of all stakeholders; and aligns its conduct with the values that drive the Company’s business
1.2 The Board should ensure that the Company is and is seen to be a responsible corporate citizen
The Board is responsible for economic, social and environmental performance and reporting, and the Company has credible and well co-ordinated programmes in respect of social and environmental issues and stakeholder engagement
1.3 The Board should ensure that the Company’s ethics are managed effectively
The Company has a code of conduct and ethics which is communicated internally and externally and the importance of ethical behaviour is emphasised in all of the Company’s engagements. Ethical issues are considered by risk committees, internal review committees, the Company’s Audit Committee and Social and Ethics Committee, and at Board level
Chapter 2: Boards and directors
2.1 The Board should act as the focal point for and custodian of corporate governance
The Board operates within the powers conferred in the Memorandum of Incorporation and Board Charter which place it in the position to direct, govern and effectively control the Company
2.2 The Board should appreciate that strategy, risk, performance and sustainability are inseparable
The Board annually reviews the Company’s objectives, strategies and risks
2.3 The Board should provide effective leadership based on an ethical foundation
See 1.1 above
2.4 The Board should ensure that the Company is and is seen to be a responsible corporate citizen
See 1.2 above
2.5 The Board should ensure that the Company’s ethics are managed effectively
See 1.3 above
2.6 The Board should ensure that the Company has an effective and independent Audit Committee
See Chapter 3 below
2.7 The Board should be responsible for the governance of risk
See Chapter 4 below
2.8 The Board should be responsible for information technology governance
See Chapter 5 below
2.9 The Board should ensure that the Company complies with applicable laws and considers adherence to non-binding rules, codes and standards
See Chapter 6 below
2.10 The Board should ensure that there is an effective risk-based internal audit
See Chapter 7 below
2.11 The Board should appreciate that stakeholders’ perceptions affect the Company’s reputation
See Chapter 8 below

61
PRINCIPLE IMPLEMENTATION
Chapter 2: Boards and directors continued
2.12 The Board should ensure the integrity of the Company’s integrated report
See Chapter 9 below
2.13 The Board should report on the effectiveness of the Company’s system of internal controls
See Chapters 7 and 9 below
2.14 The Board and its directors should act in the best interests of the Company
The Board and directors are, inter alia, required to exercise care, skill and diligence; act in good faith; exercise objective judgement; declare any personal financial interests or conflicts of interest; and not deal in the Company’s securities during closed or other price-sensitive periods
2.15 The Board should consider business rescue proceedings or other turnaround mechanisms as soon as the Company is financially distressed as defined in the Companies Act
The Board monitors the Company’s solvency and liquidity and is aware of and understands its responsibilities regarding business rescue proceedings
2.16 The Board should elect a Chairman of the board who is an independent non-executive director. The CEO of the Company should not also fulfil the role of Chairman of the Board
The position of Chairman is held by an independent non-executive director
2.17 The Board should appoint the CEO and establish a framework for the delegation of authority
The CEO is appointed by the board and his role and responsibilities are set out in the Board Charter
2.18 The Board should comprise a balance of power, with a majority of non-executive directors. The majority of non-executive directors should be independent
The Board comprises a majority of independent non-executive directors
2.19 Directors should be appointed through a formal process
The Board Charter defines a formal process for the appointment of directors by the Board with the assistance of the Remuneration, Nomination and Appointments Committee
2.20 The induction of and on-going training and development of directors should be conducted through formal processes
New directors undergo a thorough induction and orientation programme as well as on-going training and development regarding matters relevant to the Company, including but not limited to accounting standards and policies, the environment in which the Company operates, corporate governance, and legislation
2.21 The Board should be assisted by a competent, suitably qualified and experienced Company Secretary
A Company Secretary is appointed in compliance with the Companies Act 2008, the JSE Listings Requirements and the recommendations of King III
2.22 The evaluation of the Board, its committees and the individual directors should be performed every year
The Board, committees and directors are evaluated annually against their roles, functions, duties and performance criteria and the results of the evaluation of executive directors are considered in determining their remuneration and benefits
2.23 The Board should delegate certain functions to well-structured committees but without abdicating its own responsibilities
The Board has delegated certain responsibilities, but without abdicating responsibility, to the Audit and Risk Committee; the Remuneration, Nomination and Appointments Committee; the Social and Ethics Committee; and, from time to time, ad hoc committees appointed to deal with specific matters. In particular, the functions of the Risk Committee are incorporated into the Audit Committee, and the functions of the Nomination Committee are incorporated into the Remuneration, Nomination and Appointments Committee
2.24 A governance framework should be agreed between the Group and its subsidiary boards
A governance framework exists between the Company and its subsidiaries which recognises the legal and regulatory requirements that apply to subsidiaries of a listed company, including the Companies Act 2008 and the JSE Listings Requirements
OV
ER
VIE
WB
USIN
ESS R
EV
IEW
GO
VE
RN
AN
CE
AN
NU
AL FIN
AN
CIA
L STATE
ME
NTS
SHA
RE
HO
LDE
R IN
FOR
MA
TION
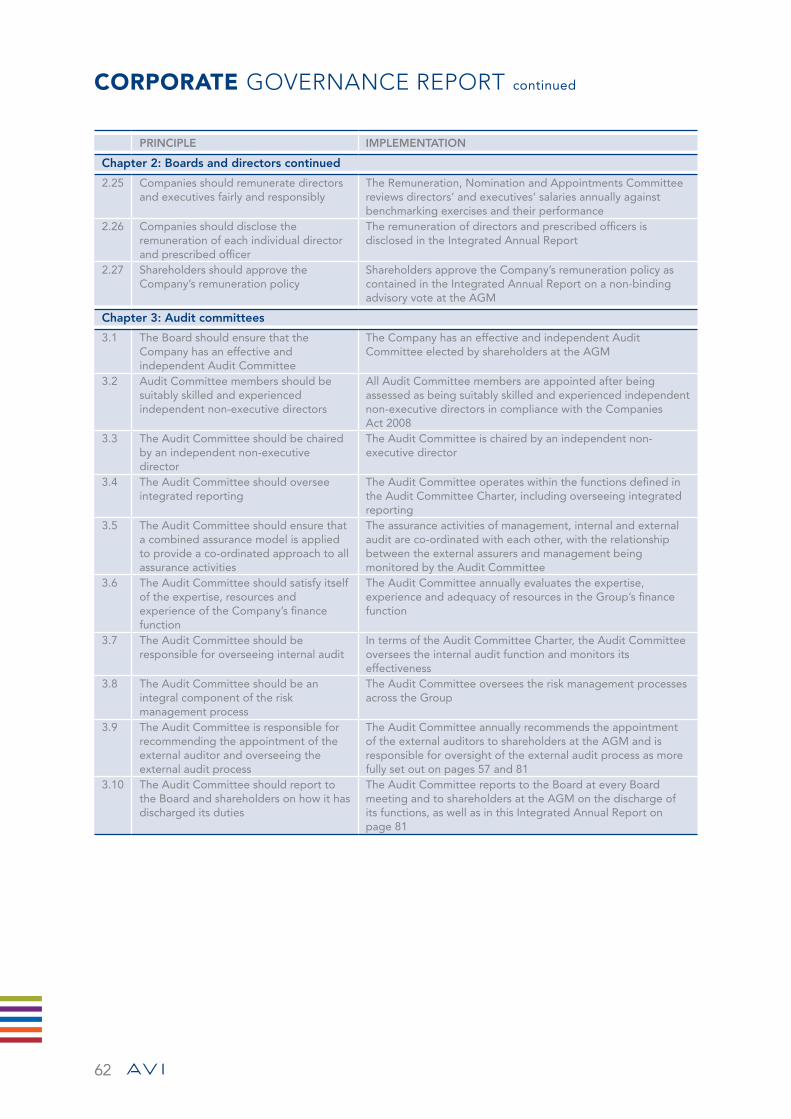
62
corporate governance report continued
PRINCIPLE IMPLEMENTATION
Chapter 2: Boards and directors continued
2.25 Companies should remunerate directors and executives fairly and responsibly
The Remuneration, Nomination and Appointments Committee reviews directors’ and executives’ salaries annually against benchmarking exercises and their performance
2.26 Companies should disclose the remuneration of each individual director and prescribed officer
The remuneration of directors and prescribed officers is disclosed in the Integrated Annual Report
2.27 Shareholders should approve the Company’s remuneration policy
Shareholders approve the Company’s remuneration policy as contained in the Integrated Annual Report on a non-binding advisory vote at the AGM
Chapter 3: Audit committees
3.1 The Board should ensure that the Company has an effective and independent Audit Committee
The Company has an effective and independent Audit Committee elected by shareholders at the AGM
3.2 Audit Committee members should be suitably skilled and experienced independent non-executive directors
All Audit Committee members are appointed after being assessed as being suitably skilled and experienced independent non-executive directors in compliance with the Companies Act 2008
3.3 The Audit Committee should be chaired by an independent non-executive director
The Audit Committee is chaired by an independent non-executive director
3.4 The Audit Committee should oversee integrated reporting
The Audit Committee operates within the functions defined in the Audit Committee Charter, including overseeing integrated reporting
3.5 The Audit Committee should ensure that a combined assurance model is applied to provide a co-ordinated approach to all assurance activities
The assurance activities of management, internal and external audit are co-ordinated with each other, with the relationship between the external assurers and management being monitored by the Audit Committee
3.6 The Audit Committee should satisfy itself of the expertise, resources and experience of the Company’s finance function
The Audit Committee annually evaluates the expertise, experience and adequacy of resources in the Group’s finance function
3.7 The Audit Committee should be responsible for overseeing internal audit
In terms of the Audit Committee Charter, the Audit Committee oversees the internal audit function and monitors its effectiveness
3.8 The Audit Committee should be an integral component of the risk management process
The Audit Committee oversees the risk management processes across the Group
3.9 The Audit Committee is responsible for recommending the appointment of the external auditor and overseeing the external audit process
The Audit Committee annually recommends the appointment of the external auditors to shareholders at the AGM and is responsible for oversight of the external audit process as more fully set out on pages 57 and 81
3.10 The Audit Committee should report to the Board and shareholders on how it has discharged its duties
The Audit Committee reports to the Board at every Board meeting and to shareholders at the AGM on the discharge of its functions, as well as in this Integrated Annual Report on page 81

63
PRINCIPLE IMPLEMENTATION
Chapter 4: The Governance of risk
4.1 The Board should be responsible for the governance of risk
In terms of the Board Charter, the Board is responsible for the governance of risk which is delegated to the Audit Committee but without abdicating the Board’s responsibility
4.2 The Board should determine the levels of risk tolerance
Risks are reviewed and prioritised by the Board on a regular basis and as part of normal operational management processes
4.3 The Risk Committee or Audit Committee should assist the Board in carrying out its risk responsibilities
See principle 4.1 above
4.4 The Board should delegate to management the responsibility to design, implement and monitor the risk management plan
Management has responsibility for the risk management plan in accordance with the Board-approved policy and framework, which is monitored by the Audit Committee
4.5 The Board should ensure that risk assessments are performed on a continual basis
Formal risk assessments are conducted at least annually. Risks are assessed on an on-going basis as part of normal operational management processes
4.6 The Board should ensure that frameworks and methodologies are implemented to increase the probability of anticipating unpredictable risks
The consideration of unpredictable risks is incorporated into regular business review processes
4.7 The Board should ensure that management considers and implements appropriate risk responses
Appropriate risk responses are considered and implemented by management on an on-going basis
4.8 The Board should ensure continual risk monitoring by management
The monitoring of risk is incorporated into regular business review processes and exceptions are highlighted to the Board
4.9 The Board should receive assurance regarding the effectiveness of the risk management process
Assurance by management regarding the risk management process is incorporated into regular business review processes
4.10 The Board should ensure that there are processes in place enabling complete, timely, relevant, accurate and accessible risk disclosure to stakeholders
The statutory annual financial statements include disclosure on financial risks and the operating environment is commented on in this Integrated Annual Report to the extent deemed prudent taking into account commercially privileged information
Chapter 5: The governance of information technology
5.1 The Board should be responsible for information technology (IT) governance
The Board is responsible for IT governance in terms of the Board Charter and the IT governance policy, which is delegated to the Audit Committee but without abdicating responsibility
5.2 IT should be aligned with the performance and sustainability objectives of the Company
IT is aligned with the performance and sustainability objectives of the Company in accordance with the IT Governance Charter
5.3 The Board should delegate to management the responsibility for the implementation of an IT governance framework
Management has the responsibility for the implementation of the IT governance framework in accordance with the IT Governance Charter
5.4 The Board should monitor and evaluate significant IT investments and expenditure
The Board monitors and evaluates significant IT investments and expenditures in accordance with the IT Governance Charter
5.5 IT should form an integral part of the Company’s risk management
IT forms an integral part of the Company’s risk management in accordance with the risk management framework and IT Governance Charter
5.6 The Board should ensure that information assets are managed effectively
The management of IT assets is incorporated into regular business review processes
5.7 A Risk Committee and Audit Committee should assist the Board in carrying out its IT responsibilities
See principle 5.1 above
OV
ER
VIE
WB
USIN
ESS R
EV
IEW
GO
VE
RN
AN
CE
AN
NU
AL FIN
AN
CIA
L STATE
ME
NTS
SHA
RE
HO
LDE
R IN
FOR
MA
TION

64
corporate governance report continued
PRINCIPLE IMPLEMENTATION
Chapter 6: Compliance with laws, codes, rules and standards
6.1 The Board should ensure that the Company complies with applicable laws and considers adherence to non-binding rules, codes and standards
In terms of the Board Charter, the Company is committed to compliance with applicable laws and the Company remains informed on, and complies with all applicable laws, and considers adherence to relevant non-binding rules, codes and standards
6.2 The Board and each individual director should have a working understanding of the effect of the applicable laws, rules, codes and standards on the Company and its business
In terms of the Board Charter, the Board and individual directors are required to have a working knowledge of all applicable laws, rules, codes and standards, and they are educated on these matters on an on-going basis
6.3 Compliance risk should form an integral part of the Company’s risk management process
Compliance risk forms part of the Company’s risk management framework and processes
6.4 The Board should delegate to management the implementation of an effective compliance framework and processes
Compliance risk forms part of the risk management framework, the implementation of which is delegated to management and overseen by the Audit Committee and Board
Chapter 7: Internal audit
7.1 The Board should ensure that there is an effective risk-based internal audit
The Company has an effective risk-based internal audit function outsourced to an independent professional firm, whose duties and responsibilities are defined in the internal audit charter
7.2 Internal review should follow a risk-based approach to its plan
Internal audit follows a risk-based approach in accordance with the internal audit charter
7.3 Internal audit should provide a written assessment of the effectiveness of the Company’s system of internal control and risk management
Internal audit is outsourced to an independent professional firm. The need for and requirements that need to be met in order to obtain this assurance are being evaluated
7.4 The Audit Committee should be responsible for overseeing internal audit
In terms of the Audit Committee Charter the Audit Committee is responsible for overseeing internal audit
7.5 Internal audit should be strategically positioned to achieve its objectives
Internal audit is independent and objective and well-positioned to achieve its objectives

65
PRINCIPLE IMPLEMENTATION
Chapter 8: Governing stakeholder relationships
8.1 The Board should appreciate that stakeholders’ perceptions affect a company’s reputation
Stakeholder engagement is an important aspect of the Company’s responsibilities and it formally identifies and recognises the material stakeholders with legitimate interests with whom it engages on relevant issues
8.2 The Board should delegate to management to proactively deal with stakeholder relationships
Management has the responsibility to proactively deal with stakeholder relationships and engagements
8.3 The Board should strive to achieve the appropriate balance between its various stakeholder groupings, in the best interests of the Company
The Company recognises material stakeholders with legitimate interests with whom it engages as necessary on relevant issues
8.4 Companies should ensure the equitable treatment of shareholders
All holders of the same class of shares, including minorities, are treated equitably in accordance with the preferences, rights, limitations and other terms applicable to such shares and any other relevant provisions of the Companies Act 2008 and the JSE Listings Requirements
8.5 Transparent and effective communication with stakeholders is essential for building and maintaining their trust and confidence
The Company communicates with stakeholders in a variety of forms as more fully set out in this Integrated Annual Report on pages 33 and 34
8.6 The Board should ensure that disputes are resolved as effectively, efficiently and expeditiously as possible
Disputes with stakeholders would be addressed in the appropriate forum and steps taken to ensure that such disputes are resolved as effectively, efficiently and expeditiously as possible
Chapter 9: Integrated reporting and disclosure
9.1 The Board should ensure the integrity of the Company’s Integrated Annual Report
The Board is responsible for integrated reporting, including the integrity of the report
9.2 Sustainability reporting and disclosure should be integrated with the Company’s financial reporting
Sustainability reporting and disclosure form an integral part of the Integrated Annual Report
9.3 Sustainability reporting and disclosure should be independently assured
External assurance will be considered when the sustainable development report has been more fully developed
OV
ER
VIE
WB
USIN
ESS R
EV
IEW
GO
VE
RN
AN
CE
AN
NU
AL FIN
AN
CIA
L STATE
ME
NTS
SHA
RE
HO
LDE
R IN
FOR
MA
TION
66
remuneration report
This report sets out the Company’s remuneration and reward philosophy, policy and practice for non-executive directors, executive directors, executives and senior managers. It also provides details of the remuneration paid to and interest in shares and share options acquired by non-executive directors, executive directors and certain executives during the financial year ended 30 June 2013.
Remuneration and reward philosophyThe intended consequence of the Company’s remuneration and reward framework is to attract, retain and motivate the most talented people available to the Group to align with its determination to deliver superior returns to shareholders.
The reward framework is designed to:• attract and recruit talented people from a shrinking
pool of talent;• retain competent employees that enhance business
performance;• direct employees’ activities towards business
priorities;• recognise and reward employees for superior
performance;• support a high-performance environment;• address diverse employee motivational needs across
differing categories; and• support the Company’s transformation agenda.
During the year under review the Company’s remuneration and reward practices played a material role in retaining key talent and supporting the Company to progress its objectives and achieve its results.
Key developmentsAt the Annual General Meeting held on 2 November 2012 and in accordance with the recommendations of the King Report on Corporate Governance for South Africa, 2009 (“King III”), shareholders endorsed the Company’s remuneration policy as set out in the remuneration report contained in the Integrated Annual Report, by way of a non-binding advisory vote. The shareholders will be asked annually to consider the remuneration policy and pass this vote.
During the year under review the Remuneration, Nomination and Appointments Committee (“Remcom”) conducted a detailed review of the continued appropriateness of the nature and mechanisms of the Company’s short-term incentive schemes and considered the introduction of a further long-term incentive scheme. It was resolved to retain both the short- and long-term incentive schemes in their current format.
Composition of remuneration and rewardsIn the year under review, the remuneration packages of executive directors and senior management continued to comprise:• a guaranteed remuneration package (structured as
the employee’s total cost to the Company);• an annual bonus based on business and individual
performance;• long-term incentive plans; and• access to retirement fund and medical aid benefits
funded from their guaranteed remuneration package.
Guaranteed remunerationRemcom reviews the salaries of the executive directors and executive management annually. At least once every two years Remcom appoints an independent remuneration consultant to review the remuneration paid to the Group’s executive management as well as selected positions within the next levels of management. Assessments against the market are done in respect of total remuneration as well as the component parts. For the 2013 financial year a detailed benchmarking exercise was carried out by the Company’s Reward and Remuneration Manager in respect of executive and other senior managers’ remuneration using the Deloitte Executive survey and the Pricewaterhouse Coopers REMchannel benchmarking tool, which, together with an AVI-specific company-sizing methodology, determined a competitive and reasonable market against which to measure AVI executive remuneration. The AVI-specific company-sizing methodology was reviewed and tested by an independent external consultant. This benchmarking exercise then informed the adjustments made by Remcom during the annual salary review process.
The Company remunerates its employees that are regarded as established performers within reasonable proximity to the market median, subject to their experience and individual contribution to the Company. Employees that are clear out-performers may be remunerated from the median to within reasonable proximity to the upper quartile, while employees that are regarded as under-performers are paid below the median and are actively managed. This approach recognises both the market forces in play and the heightened requirement to attract and retain talented employees. More often in recent times the Company has found that it is necessary to offer to remunerate executives with proven track records at the upper quartile to attract them to the Company.

67
Short-term incentive schemesAnnual or short-term incentives are based on both the financial achievement of the subsidiary to which an employee is accountable and on individual performance measured against the achievement of key performance indicators that may be both financial and non-financial. The more an employee is able to influence the financial performance of a subsidiary, due to his/her role and levels of responsibility, the greater his/her annual incentive is aligned with the financial performance of that subsidiary. Executive management recommends annual incentives to Remcom for approval. Remcom retains the absolute discretion to authorise incentives.
The annual incentives payable to executive and other management, for targeted levels of performance, range between 15% and 60% of an employee’s guaranteed remuneration package, depending on roles, responsibilities and individual contributions, and as deemed appropriate by Remcom and determined with reference to market norms. The actual incentive payment for the year under review for executive and other management was R44 million which was 12,5% of the total remuneration cost to the Company of this group of employees, excluding the cost of the incentives. The payment for the prior year was R70 million – 21% of the total remuneration cost to the Company.
Long-term incentive schemesLong-term share incentive schemes remain a material part of the Group’s reward framework. The schemes are designed to ensure that appropriate employees are retained over a medium to long-term period, rewarded adequately for their efforts, and that their interests are aligned with the interests of shareholders.
The share incentive schemes currently in operation at the Company were all approved by shareholders. There are currently three share incentive schemes in place – the AVI Limited Executive Share Incentive Scheme, the AVI Limited Out-Performance Scheme and the Black Staff Empowerment Share Scheme. The participants, and their level of participation, are benchmarked against the market and are all approved by Remcom.
In addition to the Company’s long-term incentive schemes, the Group’s subsidiary companies operate so-called “phantom share option schemes” which enable the Company to reward appropriate employees for the results that their efforts generate within the subsidiaries in which they are employed. Notional share options in the subsidiaries are granted to select deserving employees that are either within the top three levels of management or that are regarded as key skills that require retention. The recipients benefit from the appreciation of the notional share price. Annual allocations of notional shares are made to eligible employees within a range of 35% to 165% of their guaranteed remuneration package, depending on their role and individual contribution to the subsidiary. The value of the shares is calculated based on the Company’s price earnings ratio and the audited operating profit after tax of the relevant subsidiary company, with constraints to ensure that the schemes do not reward undeserved outcomes. Remcom approves the allocations annually.
During 2006 specific approval was granted by shareholders for the shares made available to the Black Staff Empowerment Share Scheme, and a maximum of 6% of the issued share capital of the Company may be allocated to the other share incentive schemes. In addition, no individual may accumulate more than 2% of the issued share capital. The current allocations to share schemes, excluding the Black Staff Empowerment Share Scheme, represent 0,45% of the issued share capital of the Company. Details of share options issued are set out in the Directors’ Report.
The first tranche of shares in the AVI Black Staff Empowerment Scheme, being one-third of the total allocation made on 1 January 2007, vested on 1 January 2012. Over the life of the Scheme to date, approximately 8 300 employees have benefited as participants and have received a total gross benefit of R71,3 million, including 1 299 participants who left the Company’s employ in a manner that classified them as “good leavers”.
OV
ER
VIE
WB
USIN
ESS R
EV
IEW
GO
VE
RN
AN
CE
AN
NU
AL FIN
AN
CIA
L STATE
ME
NTS
SHA
RE
HO
LDE
R IN
FOR
MA
TION
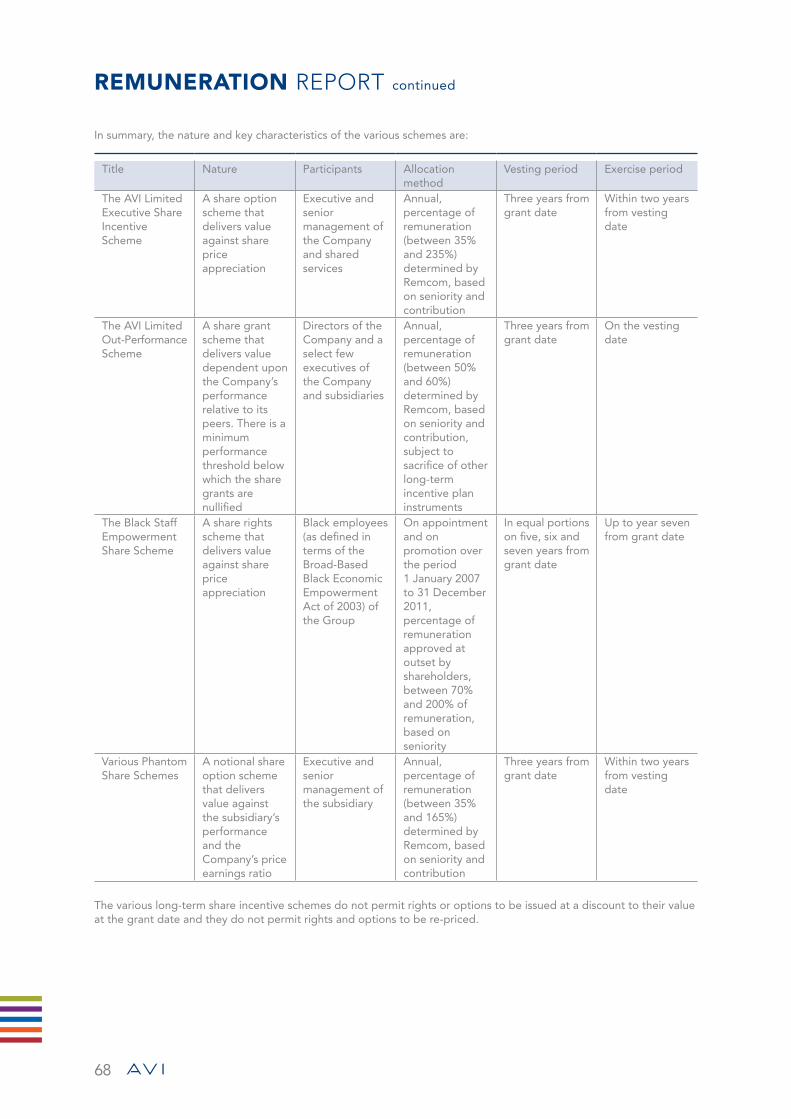
68
remuneration report continued
In summary, the nature and key characteristics of the various schemes are:
Title Nature Participants Allocation method
Vesting period Exercise period
The AVI Limited Executive Share Incentive Scheme
A share option scheme that delivers value against share price appreciation
Executive and senior management of the Company and shared services
Annual, percentage of remuneration (between 35% and 235%) determined by Remcom, based on seniority and contribution
Three years from grant date
Within two years from vesting date
The AVI Limited Out-Performance Scheme
A share grant scheme that delivers value dependent upon the Company’s performance relative to its peers. There is a minimum performance threshold below which the share grants are nullified
Directors of the Company and a select few executives of the Company and subsidiaries
Annual, percentage of remuneration (between 50% and 60%) determined by Remcom, based on seniority and contribution, subject to sacrifice of other long-term incentive plan instruments
Three years from grant date
On the vesting date
The Black Staff Empowerment Share Scheme
A share rights scheme that delivers value against share price appreciation
Black employees (as defined in terms of the Broad-Based Black Economic Empowerment Act of 2003) of the Group
On appointment and on promotion over the period 1 January 2007 to 31 December 2011, percentage of remuneration approved at outset by shareholders, between 70% and 200% of remuneration, based on seniority
In equal portions on five, six and seven years from grant date
Up to year seven from grant date
Various Phantom Share Schemes
A notional share option scheme that delivers value against the subsidiary’s performance and the Company’s price earnings ratio
Executive and senior management of the subsidiary
Annual, percentage of remuneration (between 35% and 165%) determined by Remcom, based on seniority and contribution
Three years from grant date
Within two years from vesting date
The various long-term share incentive schemes do not permit rights or options to be issued at a discount to their value at the grant date and they do not permit rights and options to be re-priced.
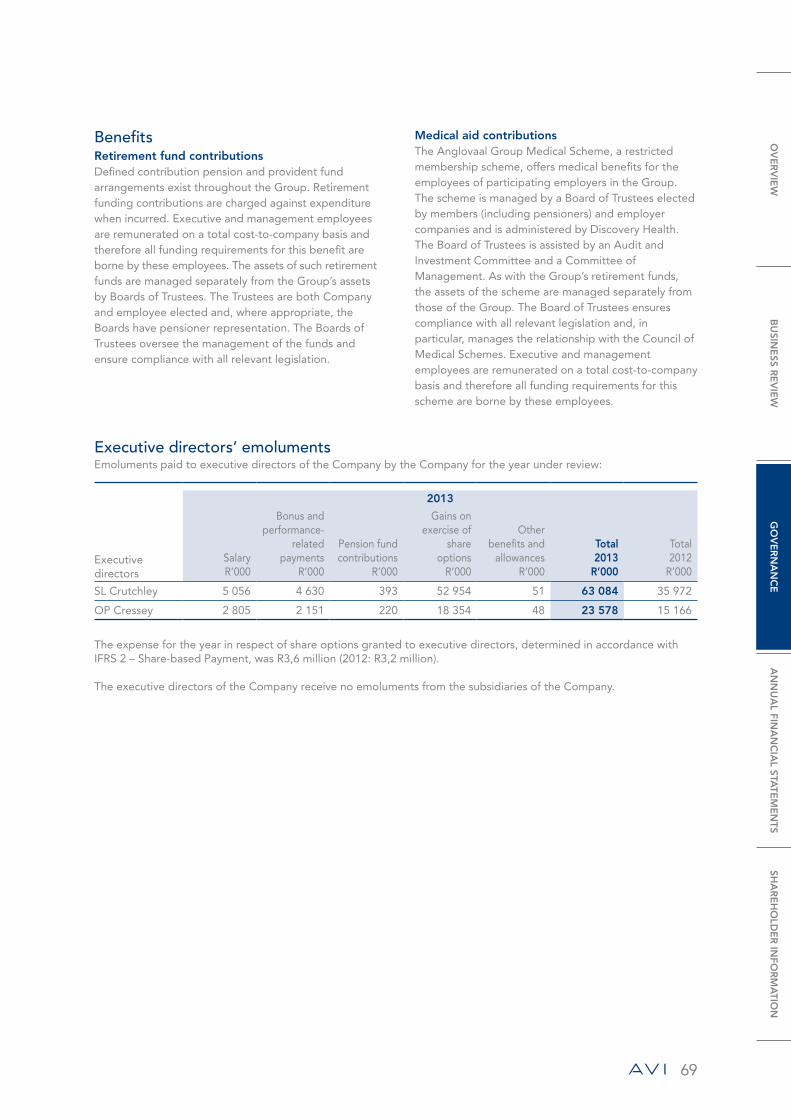
69
BenefitsRetirement fund contributionsDefined contribution pension and provident fund arrangements exist throughout the Group. Retirement funding contributions are charged against expenditure when incurred. Executive and management employees are remunerated on a total cost-to-company basis and therefore all funding requirements for this benefit are borne by these employees. The assets of such retirement funds are managed separately from the Group’s assets by Boards of Trustees. The Trustees are both Company and employee elected and, where appropriate, the Boards have pensioner representation. The Boards of Trustees oversee the management of the funds and ensure compliance with all relevant legislation.
Executive directors’ emolumentsEmoluments paid to executive directors of the Company by the Company for the year under review:
Executive directors
2013
SalaryR’000
Bonus and performance-
related payments
R’000
Pension fund contributions
R’000
Gains on exercise of
share options
R’000
Other benefits and
allowancesR’000
Total2013
R’000
Total 2012
R’000
SL Crutchley 5 056 4 630 393 52 954 51 63 084 35 972
OP Cressey 2 805 2 151 220 18 354 48 23 578 15 166
The expense for the year in respect of share options granted to executive directors, determined in accordance with IFRS 2 – Share-based Payment, was R3,6 million (2012: R3,2 million).
The executive directors of the Company receive no emoluments from the subsidiaries of the Company.
Medical aid contributionsThe Anglovaal Group Medical Scheme, a restricted membership scheme, offers medical benefits for the employees of participating employers in the Group. The scheme is managed by a Board of Trustees elected by members (including pensioners) and employer companies and is administered by Discovery Health. The Board of Trustees is assisted by an Audit and Investment Committee and a Committee of Management. As with the Group’s retirement funds, the assets of the scheme are managed separately from those of the Group. The Board of Trustees ensures compliance with all relevant legislation and, in particular, manages the relationship with the Council of Medical Schemes. Executive and management employees are remunerated on a total cost-to-company basis and therefore all funding requirements for this scheme are borne by these employees.
OV
ER
VIE
WB
USIN
ESS R
EV
IEW
GO
VE
RN
AN
CE
AN
NU
AL FIN
AN
CIA
L STATE
ME
NTS
SHA
RE
HO
LDE
R IN
FOR
MA
TION
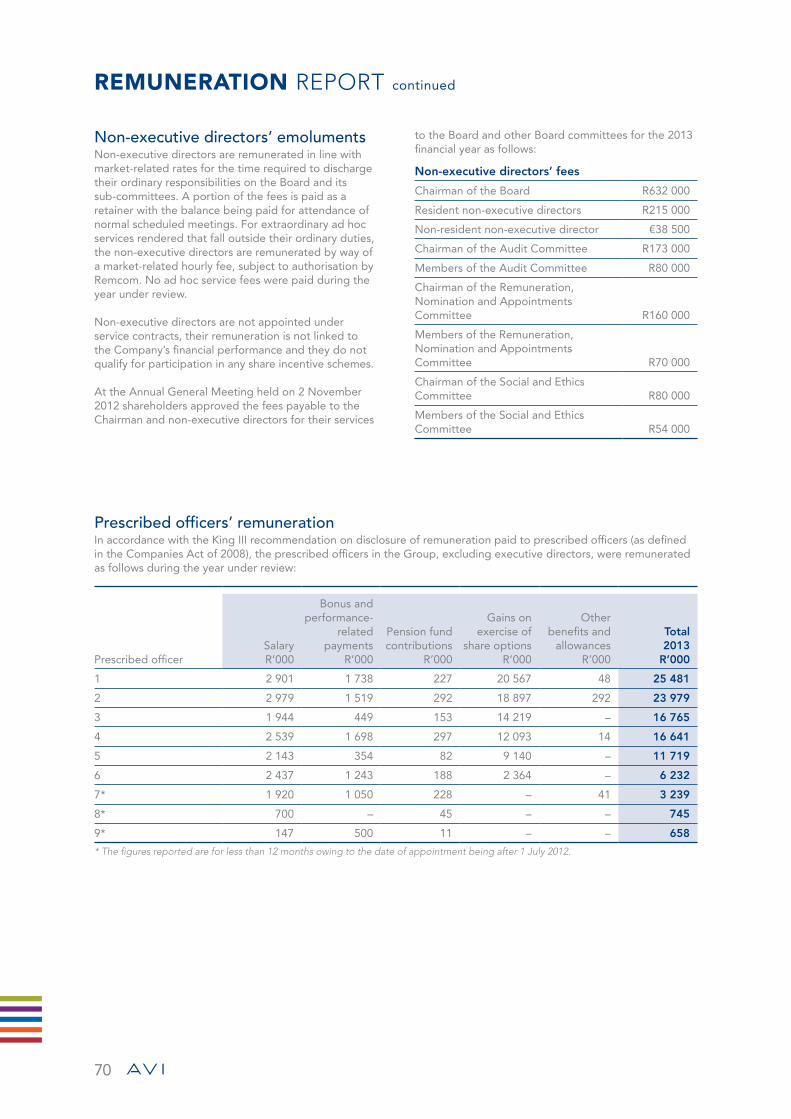
70
remuneration report continued
Non-executive directors’ emolumentsNon-executive directors are remunerated in line with market-related rates for the time required to discharge their ordinary responsibilities on the Board and its sub-committees. A portion of the fees is paid as a retainer with the balance being paid for attendance of normal scheduled meetings. For extraordinary ad hoc services rendered that fall outside their ordinary duties, the non-executive directors are remunerated by way of a market-related hourly fee, subject to authorisation by Remcom. No ad hoc service fees were paid during the year under review.
Non-executive directors are not appointed under service contracts, their remuneration is not linked to the Company’s financial performance and they do not qualify for participation in any share incentive schemes.
At the Annual General Meeting held on 2 November 2012 shareholders approved the fees payable to the Chairman and non-executive directors for their services
Prescribed officers’ remunerationIn accordance with the King III recommendation on disclosure of remuneration paid to prescribed officers (as defined in the Companies Act of 2008), the prescribed officers in the Group, excluding executive directors, were remunerated as follows during the year under review:
Prescribed officerSalaryR’000
Bonus and performance-
related payments
R’000
Pension fund contributions
R’000
Gains on exercise of
share optionsR’000
Other benefits and
allowancesR’000
Total 2013
R’000
1 2 901 1 738 227 20 567 48 25 481
2 2 979 1 519 292 18 897 292 23 979
3 1 944 449 153 14 219 – 16 765
4 2 539 1 698 297 12 093 14 16 641
5 2 143 354 82 9 140 – 11 719
6 2 437 1 243 188 2 364 – 6 232
7* 1 920 1 050 228 – 41 3 239
8* 700 – 45 – – 745
9* 147 500 11 – – 658
* The figures reported are for less than 12 months owing to the date of appointment being after 1 July 2012.
to the Board and other Board committees for the 2013 financial year as follows:
Non-executive directors’ fees
Chairman of the Board R632 000
Resident non-executive directors R215 000
Non-resident non-executive director €38 500
Chairman of the Audit Committee R173 000
Members of the Audit Committee R80 000
Chairman of the Remuneration, Nomination and Appointments Committee R160 000
Members of the Remuneration, Nomination and Appointments Committee R70 000
Chairman of the Social and Ethics Committee R80 000
Members of the Social and Ethics Committee R54 000

71
annual financial statements
72 Approval of annual financial statements
72 Certificate of the company secretary
73 Independent auditors’ report
74 Directors’ report
79 Directors’ remuneration report
81 Audit committee report
82 Segment reporting
86 Accounting policies
98 Balance sheets
99 Statements of comprehensive income
100 Statements of cash flows
101 Statements of changes in equity
103 Notes to the annual financial statements
155 Analysis of ordinary shareholders
shareholder information
156 Shareholders’ diary
157 Notice of Annual General Meeting
161 Form of proxy
CONTENTS
These annual financial statements have been prepared under the supervision of Owen Cressey CA(SA) the AVI Group Chief Financial Officer.
OV
ER
VIE
WB
USIN
ESS R
EV
IEW
GO
VE
RN
AN
CE
AN
NU
AL FIN
AN
CIA
L STATE
ME
NTS
SHA
RE
HO
LDE
R IN
FOR
MA
TION
72
In terms of section 88(2)(e) of the Companies Act, No 71 of 2008, as amended, I certify that, to the best of my knowledge and belief, the Company has lodged with the Companies and Intellectual Property Commission for the financial year ended 30 June 2013, all such returns required of a public company in terms of the Companies Act, No 71 of 2008, as amended, and that all such returns are true, correct and up to date.
S Naidoo Company SecretaryIllovo, Johannesburg6 September 2013
The Group annual financial statements and Company annual financial statements of AVI Limited which appear on pages 74 to 155 were authorised for issue by the Board of directors on 6 September 2013 and are signed on their behalf.
GR Tipper SL CrutchleyNon-Executive Chairman Chief Executive Officer
apprOval of annual financial statements
CErTifiCaTE of the company secretary

73
iNdEpENdENT auditors’ report
to the shareholders of aVi limited
report on the financial statementsWe have audited the Group financial statements and the financial statements of AVI Limited, which comprise the balance sheets at 30 June 2013, and the statements of comprehensive income, changes in equity and cash flows for the year then ended, and the notes to the financial statements, which include a summary of significant accounting policies and other explanatory notes as set out on pages 79 to 80 and pages 82 to 154.
directors’ responsibility for the financial statementsThe Company’s directors are responsible for the preparation and fair presentation of these financial statements in accordance with International Financial Reporting Standards and the requirements of the Companies Act of South Africa, and for such internal control as the directors determine is necessary to enable the preparation of financial statements that are free from material misstatement, whether due to fraud or error.
auditors’ responsibilityOur responsibility is to express an opinion on these financial statements based on our audit. We conducted our audit in accordance with International Standards on Auditing. Those standards require that we comply with ethical requirements and plan and perform the audit to obtain reasonable assurance about whether the financial statements are free from material misstatement.
An audit involves performing procedures to obtain audit evidence about the amounts and disclosures in the financial statements. The procedures selected depend on the auditor’s judgement, including the assessment of the risks of material misstatement of the financial statements, whether due to fraud or error. In making those risk assessments, the auditor considers internal control relevant to the entity’s preparation and fair presentation of the financial statements in order to design audit procedures that are appropriate in the circumstances, but not for the purpose of expressing an opinion on the effectiveness of the entity’s internal control. An audit also includes evaluating the appropriateness of accounting policies used and the reasonableness of accounting estimates made by management, as well as evaluating the overall presentation of the financial statements.
We believe that the audit evidence we have obtained is sufficient and appropriate to provide a basis for our audit opinion.
opinionIn our opinion, these financial statements present fairly, in all material respects, the consolidated and separate financial position of AVI Limited at 30 June 2013, and its consolidated and separate financial performance and consolidated and separate cash flows for the year then ended in accordance with International Financial Reporting Standards, and the requirements of the Companies Act of South Africa.
other reports required by the companies actAs part of our audit of the financial statements for the year ended 30 June 2013, we have read the directors’ report, the Audit Committee’s report and the company secretary’s certificate for the purpose of identifying whether there are material inconsistencies between these reports and the audited financial statements. These reports are the responsibility of the respective preparers. Based on reading these reports we have not identified material inconsistencies between these reports and the audited financial statements. However, we have not audited these reports and accordingly do not express an opinion on these.
KPMG Inc.Registered Auditor
Per G StanierChartered Accountant (SA) KPMG CrescentRegistered Auditor 85 Empire RoadDirector Parktown6 September 2013 Johannesburg
OV
ER
VIE
WB
USIN
ESS R
EV
IEW
GO
VE
RN
AN
CE
AN
NU
AL FIN
AN
CIA
L STATE
ME
NTS
SHA
RE
HO
LDE
R IN
FOR
MA
TION

74
dirECTOrS’ report
Business of the company and GroupAVI Limited (“the Company”), which is registered and incorporated in the Republic of South Africa and listed on the JSE Limited (“JSE”), is a branded consumer products company. The Company registration number is 1944/017201/06. The Group currently comprises trading subsidiaries that manufacture, process, market and distribute branded consumer products in the food, beverage, footwear, apparel and cosmetics sectors.
directors’ responsibilities relating to the annual financial statementsThe annual financial statements were compiled under the supervision of Mr OP Cressey, CA(SA), the AVI Group’s Chief Financial Officer.
The Company’s directors are responsible for the preparation and fair presentation of the Group annual financial statements and separate parent annual financial statements, comprising the balance sheets at 30 June 2013, and the statements of comprehensive income, changes in equity and cash flows for the year then ended, and the notes to the financial statements, which include a summary of significant accounting policies and other explanatory notes, and the Directors’ Report, in accordance with International Financial Reporting Standards and the requirements of the Companies Act of South Africa.
The directors are also responsible for such internal control as the directors determine is necessary to enable the preparation of financial statements that are free from material misstatement, whether due to fraud or error, and for maintaining adequate accounting records and an effective system of risk management.
The directors have made an assessment of the Company and its subsidiaries’ ability to continue as going concerns and there is no reason to believe they will not be going concerns in the year ahead.
The auditor is responsible for reporting on whether the Group financial statements and separate parent financial statements are fairly presented in accordance with the applicable financial reporting framework.
financialThe results of operations for the year are set out in the statement of comprehensive income on page 99.
Revenue and operating profit before capital items were generated from the Group’s defined segments as follows:
2013R’m
2012R’m
REVENUEContinuing operationsBranded consumer products 9 206,6 8 280,0 Corporate 11,7 7,1
9 218,3 8 287,1
Discontinued operationsReal Juice 33,6 146,2
Total 9 251,9 8 433,3
The discontinued operation comprises the fresh fruit juice manufacturing business of Real Juice which was disposed of with effect from 1 October 2012.
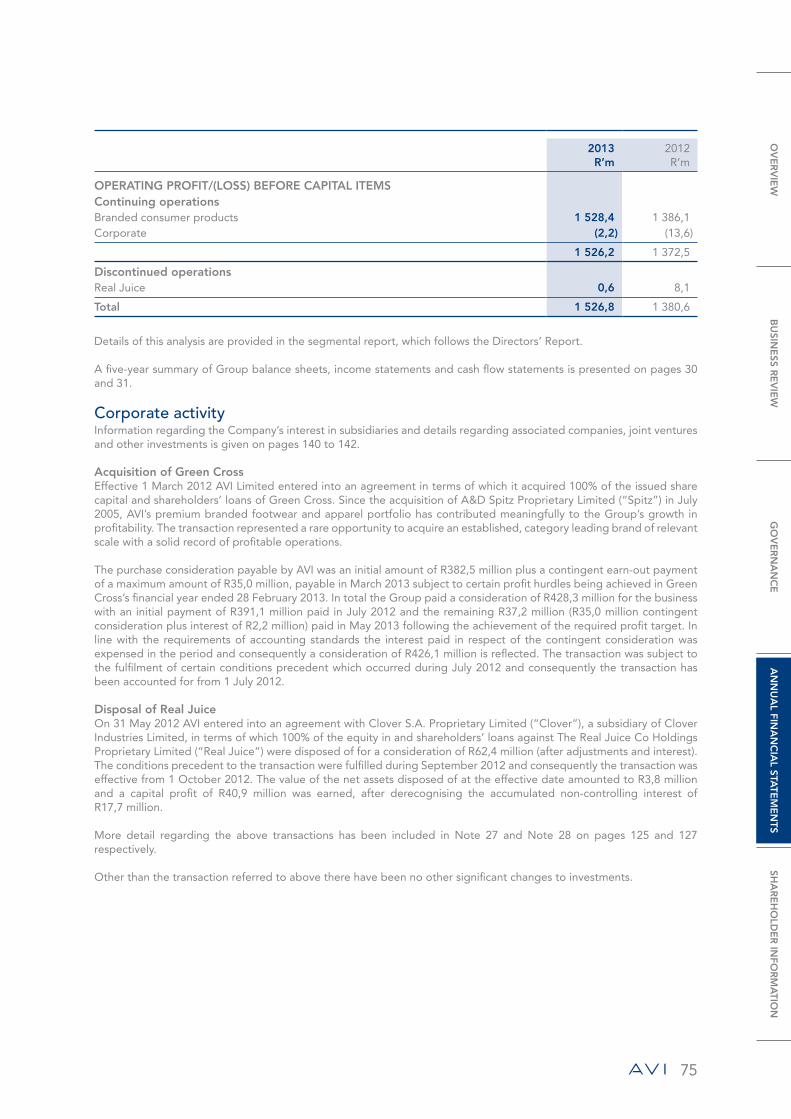
75
2013R’m
2012R’m
OPERATING PROFIT/(LOSS) BEFORE CAPITAL ITEMSContinuing operationsBranded consumer products 1 528,4 1 386,1 Corporate (2,2) (13,6)
1 526,2 1 372,5
Discontinued operationsReal Juice 0,6 8,1
Total 1 526,8 1 380,6
Details of this analysis are provided in the segmental report, which follows the Directors’ Report.
A five-year summary of Group balance sheets, income statements and cash flow statements is presented on pages 30 and 31.
corporate activityInformation regarding the Company’s interest in subsidiaries and details regarding associated companies, joint ventures and other investments is given on pages 140 to 142.
Acquisition of Green CrossEffective 1 March 2012 AVI Limited entered into an agreement in terms of which it acquired 100% of the issued share capital and shareholders’ loans of Green Cross. Since the acquisition of A&D Spitz Proprietary Limited (“Spitz”) in July 2005, AVI’s premium branded footwear and apparel portfolio has contributed meaningfully to the Group’s growth in profitability. The transaction represented a rare opportunity to acquire an established, category leading brand of relevant scale with a solid record of profitable operations.
The purchase consideration payable by AVI was an initial amount of R382,5 million plus a contingent earn-out payment of a maximum amount of R35,0 million, payable in March 2013 subject to certain profit hurdles being achieved in Green Cross’s financial year ended 28 February 2013. In total the Group paid a consideration of R428,3 million for the business with an initial payment of R391,1 million paid in July 2012 and the remaining R37,2 million (R35,0 million contingent consideration plus interest of R2,2 million) paid in May 2013 following the achievement of the required profit target. In line with the requirements of accounting standards the interest paid in respect of the contingent consideration was expensed in the period and consequently a consideration of R426,1 million is reflected. The transaction was subject to the fulfilment of certain conditions precedent which occurred during July 2012 and consequently the transaction has been accounted for from 1 July 2012.
Disposal of Real JuiceOn 31 May 2012 AVI entered into an agreement with Clover S.A. Proprietary Limited (“Clover”), a subsidiary of Clover Industries Limited, in terms of which 100% of the equity in and shareholders’ loans against The Real Juice Co Holdings Proprietary Limited (“Real Juice”) were disposed of for a consideration of R62,4 million (after adjustments and interest). The conditions precedent to the transaction were fulfilled during September 2012 and consequently the transaction was effective from 1 October 2012. The value of the net assets disposed of at the effective date amounted to R3,8 million and a capital profit of R40,9 million was earned, after derecognising the accumulated non-controlling interest of R17,7 million.
More detail regarding the above transactions has been included in Note 27 and Note 28 on pages 125 and 127 respectively.
Other than the transaction referred to above there have been no other significant changes to investments.
OV
ER
VIE
WB
USIN
ESS R
EV
IEW
GO
VE
RN
AN
CE
AN
NU
AL FIN
AN
CIA
L STATE
ME
NTS
SHA
RE
HO
LDE
R IN
FOR
MA
TION

76
dirECTOrS’ report continued
share capitalDetails of the Company’s authorised and issued share capital are given in Note 8 to the annual financial statements on page 115.
issues and redemptions during the yearA summary of the movement in the number of ordinary shares in issue during the year is given in Note 8 to the financial statements on page 115.
General authority for the company to acquire its own sharesThe directors consider that it will be advantageous for the Company to have a general authority to acquire its own shares. Such authority will be utilised if the directors consider that it is in the best interests of the Company and shareholders to effect any such acquisitions having regard to prevailing circumstances and the cash resources of the Company at the appropriate time. Accordingly, shareholders will be asked to approve such general authority at the Annual General Meeting on 30 October 2013.
General authority for the company to provide direct or indirect financial assistance to present or future subsidiariesThe directors consider that a general authority should be put in place to provide direct or indirect financial assistance to present or future subsidiaries and/or any other company or entity that is or becomes related or inter-related to the Company. Such authority will assist the Company, inter alia, in making inter-company loans to subsidiaries as well as granting letters of support and guarantees in appropriate circumstances. The existence of a general authority would avoid the need to refer each instance to members for approval. This general authority would be valid up to and including the 2014 Annual General Meeting of the Company. Accordingly, shareholders will be asked to approve such general authority at the Annual General Meeting on 30 October 2013.
dividendsDividends, paid and proposed, are disclosed in Note 33 to the annual financial statements on page 130.
directorateThere were the following changes to the Board in the year under review. Mr AWB Band and Mr KE Macilwaine resigned on 2 November 2012 and 4 December 2012 respectively.
In terms of the Company’s Memorandum of Incorporation, Messrs A Nühn, AM Thebyane, NP Dongwana and BJK Smith retire at the forthcoming Annual General Meeting. All the retiring directors, being eligible, offer themselves for re-election.
In terms of the Companies Act the appointments of Messrs MJ Bosman (Chairman), JR Hersov and Mrs NP Dongwana to the Audit and Risk Committee need to be approved at the forthcoming Annual General Meeting.
Directors’ service contractsStandard terms and conditions of employment apply to executive directors, which provide for notice of termination of three months. Non-executive directors conclude service contracts with the Company on appointment. Their term of office is governed by the Memorandum of Incorporation which provides that one-third of the aggregate number of directors will retire by rotation at each Annual General Meeting, but may, if eligible, offer themselves for re-election.
share schemesParticulars relating to the Group’s various share incentive schemes are set out in Note 35 on pages 131 to 136 of the annual financial statements.

77
directors’ interestsThe interests of the directors in the issued listed securities of the Company as at 30 June 2013 and 30 June 2012, being ordinary shares of 5 cents each, are as follows:
Directnumber
Beneficialindirectnumber
%of total
At 30 June 2013SL Crutchley 741 543 –OP Cressey – –
Total 741 543 – –
At 30 June 2012AW Band 200 861 – 0,1 SL Crutchley 741 543 – 0,2 OP Cressey 75 000 – –
Total 1 017 404 – 0,3
There has been no change in the directors’ interests reflected above between the date of the financial year-end and the date of approval of the annual financial statements.
material shareholdersThe Company does not have a holding company.
Ordinary sharesThe beneficial holders of 3% or more of the issued ordinary shares of the Company at 30 June 2013, according to the information available to the directors, were:
Numberof ordinary
shares %
Government Employees Pension Fund 52 187 203 15,17 Liberty Group 22 108 405 6,43 AVI Investment Services Proprietary Limited 17 234 352 5,01 AVI Black Staff Empowerment Scheme Trust 14 771 489 4,29 Fidelity International 11 812 744 3,43
OV
ER
VIE
WB
USIN
ESS R
EV
IEW
GO
VE
RN
AN
CE
AN
NU
AL FIN
AN
CIA
L STATE
ME
NTS
SHA
RE
HO
LDE
R IN
FOR
MA
TION

78
dirECTOrS’ report continued
special resolutions passed by the company and registered by the registrar of companiesThe following special resolutions have been passed by the Company since the previous Directors’ Report dated 7 September 2012 to the date of this report:• To approve the fees payable to the current non-executive directors, excluding the Chairman of the Board and the
foreign non-executive director.• To approve the fees payable to the Chairman of the Board.• To approve the fees payable to the foreign non-executive director.• To approve the fees payable to the members of the Remuneration, Nomination and Appointments Committee,
excluding the chairman of the committee.• To approve the fees payable to the members of the Audit and Risk Committee, excluding the chairman of the committee.• To approve the fees payable to the members of the Social and Ethics Committee, excluding the chairman of
the committee.• To approve the fees payable to the chairman of the Remuneration, Nomination and Appointments Committee.• To approve the fees payable to the chairman of the Audit and Risk Committee.• To approve the fees payable to the chairman of the Social and Ethics Committee.• To authorise, by way of a general approval, the Company or any of its subsidiaries to acquire ordinary shares issued by
the Company in terms of the Companies Act and Listings Requirements of the JSE.• To authorise, by way of a general approval, the Company, in terms of section 45 of the Companies Act, to provide
direct or indirect financial assistance by way of loan, guarantee, the provision of security or otherwise to any of its present or future subsidiaries and/or any other company or entity that is or becomes related or inter-related to the Company.
Post-reporting date eventsThere have been no significant events outside the ordinary course of business since the reporting date.

79
dirECTOrS’ remuneration report
share incentive scheme interests
Name Date of grant
Exercise priceper share
R
Instruments1
outstanding at30 June 2012
numberGrantednumber
Exercisednumber
Relinquished2
number
Instruments1
outstanding at30 June 2013
number
ThE AVIExECUTIVE ShAREINCENTIVESChEMESL Crutchley 1 April 2009 15,91 590 823 – (590 823) – –
1 April 2010 23,94 319 705 – – – 319 705 1 April 2011 29,38 285 738 – – – 285 738 1 April 2012 45,49 263 464 – – (56 304) 207 160 1 April 2013 55,88 – 231 299 – – 231 299
OP Cressey 1 October 2009 18,99 146 460 – (146 460) – –1 October 2010 26,33 115 390 – – – 115 390 1 October 2011 32,60 101 084 – – – 101 084 1 October 2012 58,83 – 86 191 – (26 217) 59 974
1 822 664 317 490 (737 283) (82 521) 1 320 350 1 Includes options and unexercised scheme shares.– Unless specifically noted, all options are vested or vest three years after grant date, and lapse on the fourth anniversary (issued before
2011) or on the fifth anniversary (issued after 2011) of the grant date.– None of the non-executive directors have share incentive scheme interests.– The shareholdings of the directors are given in the Directors’ Report.2 The number of relinquished options represents options sacrificed in favour of AVI Out-Performance Scheme options in terms of the rules
of the AVI Out-Performance Scheme.
Name Date of grant
Exercise priceper share
R
Instrumentsoutstanding at30 June 2012
numberGrantednumber
Exercisednumber
Relinquishednumber
Instrumentsoutstanding at30 June 2013
number
ThE AVI FINANCIALSERVICES CASh-SETTLED ShAREAPPRECIATIONRIGhTS PLANSL Crutchley 1 April 2007 19,39 19 381 – (19 381) – –
19 381 – (19 381) – –
The above scheme is a cash-settled scheme in a subsidiary that is accounted for in terms of IFRS 2 – Share-based Payment, since the share appreciation rights are directly linked to the AVI Limited share price. The options are exercisable in their entirety three years after the grant date.
OV
ER
VIE
WB
USIN
ESS R
EV
IEW
GO
VE
RN
AN
CE
AN
NU
AL FIN
AN
CIA
L STATE
ME
NTS
SHA
RE
HO
LDE
R IN
FOR
MA
TION

80
dirECTOrS’ remuneration report continued
Name Date of grant
Grant priceper share
R
Instrumentsoutstanding at30 June 2012
numberGrantednumber
Exercisednumber
Relinquishednumber
Instrumentsoutstanding at30 June 2013
number
ThE AVI OUT-PERFORMANCE SChEMESL Crutchley 1 October 2009 18,61 141 859 – (141 859) – –
1 October 2010 25,41 112 208 – – – 112 208 1 October 2011 32,43 94 357 – – – 94 357 1 October 2012 58,61 – 56 304 – – 56 304
OP Cressey 1 October 2009 18,61 65 560 – (65 560) – –1 October 2010 25,41 52 817 – – – 52 817 1 October 2011 32,43 44 281 – – – 44 281 1 October 2012 58,61 – 26 217 – – 26 217
511 082 82 521 (207 419) – 386 184
All instruments vest three years after grant date. Instruments are converted to shares if the performance requirements are met on the measurement date.
emoluments
2013
SalaryR’000
Bonus andperformance-
relatedpayments
R’000
Pension fundcontributions
R’000
Gains onexercise of
share options*R’000
Other benefitsand allowances
R’000Total
R’0002012
R’000
ExECUTIVE DIRECTORSSL Crutchley 5 056 4 630 393 52 954 51 63 084 35 973 OP Cressey 2 805 2 151 219 18 355 48 23 578 15 167
7 861 6 781 612 71 309 99 86 662 51 140
NON-ExECUTIVE DIRECTORS’ AND COMMITTEE FEESGR Tipper (Chairman) 843 425 AW Band1 113 573 JR Hersov 268 200 KE Macilwaine1 89 200 A Nühn 558 392 M Bosman 362 361 A Kawa 285 265 A Thebyane 254 200 N Dongwana 375 316 B Smith 269 227
3 416 3 159
90 078 54 299 1Resigned 2 November 2012.
Details relating to the Group’s remuneration practices are set out in the Remuneration Report on pages 66 to 70.
* Gains on exercise of share options represent the actual gain received by the director on exercising vested options. The IFRS 2 expense in respect of options granted to directors is as follows:
2013R’000
2012R’000
SL Crutchley 2 566 2 539 OP Cressey 1 072 705
3 638 3 244
81
audiT committee report
The Audit Committee is pleased to present its report for the financial year ended 30 June 2013 in terms of section 94 (7)(f) of the Companies Act, No 71 of 2008, as amended (“the Companies Act”).
The Audit Committee has adopted formal terms of reference, delegated to it by the Board of directors, as its charter. The charter is in line with the Companies Act, the King Code and Report on Governance for South Africa (“King lll”) and the JSE Listings Requirements. The committee has discharged the functions delegated to it in terms of its charter. This process is supported by each operating subsidiary that has an internal review committee which monitors risk management and compliance activities. There is a formal reporting line from the various internal review committees into the Audit Committee via the Company’s Chief Financial Officer.
During the year under review the committee performed the following statutory duties:1. Reviewed and recommended for adoption by the Board such financial information as is publicly disclosed which for
the year included: • the interim results for the six months ended 31 December 2012; and • the annual financial statements for the year ended 30 June 2013.2. Considered and satisfied itself that the external auditors KPMG Inc. are independent.3. Approved the external auditors’ budgeted fees and terms of engagement for the 2013 financial year.4. Determined the non-audit-related services which the external auditors were permitted to provide to AVI and
reviewed the policy for the use of the external auditors for non-audit-related services. All non-audit-related service agreements between the AVI Group and the external auditors were pre-approved.
5. Nominated KPMG Inc. for appointment as the Group auditors for the 2013 financial year.6. Resolved to continue to co-source the internal audit function from Ernst & Young during the financial year.7. Reviewed the Audit Committee charter in line with King lll recommendations.8. Reviewed the internal audit charter in line with King lll recommendations.9. Confirmed the internal audit plan for the 2013 financial year.10. Reviewed the IT governance structure for the AVI Group.11. Confirmed adequate whistle-blowing facilities were in place throughout the AVI Group and reviewed and considered
action taken with regard to incident reports.12. Held separate meetings with management, the external and internal auditors to discuss any problems and
reservations arising from the year-end audit and other matters that they wished to discuss.13. Noted that it had not received any complaints, either from within or outside the Company, relating either to the
accounting practices, the internal audits, the content or auditing of the financial statements, the internal financial controls or any other related matter.
14. Conducted a self-evaluation exercise into the effectiveness of the Audit Committee.15. Recommended to the Board the re-appointment of KPMG Inc. as the Group auditors and Mr G Stanier as the
registered auditor responsible for the audit for the year ending 30 June 2014, which will be considered at the forthcoming Annual General Meeting.
16. Evaluated and satisfied itself as to the appropriateness of the expertise and experience of the Company’s financial director.
17. Satisfied itself as to the expertise, resources and experience of the Company’s finance function.
For further details regarding the Audit Committee, shareholders are referred to the Corporate Governance Report on page 57.
On behalf of the Audit Committee
MJ BosmanAudit Committee Chairman6 September 2013
OV
ER
VIE
WB
USIN
ESS R
EV
IEW
GO
VE
RN
AN
CE
AN
NU
AL FIN
AN
CIA
L STATE
ME
NTS
SHA
RE
HO
LDE
R IN
FOR
MA
TION
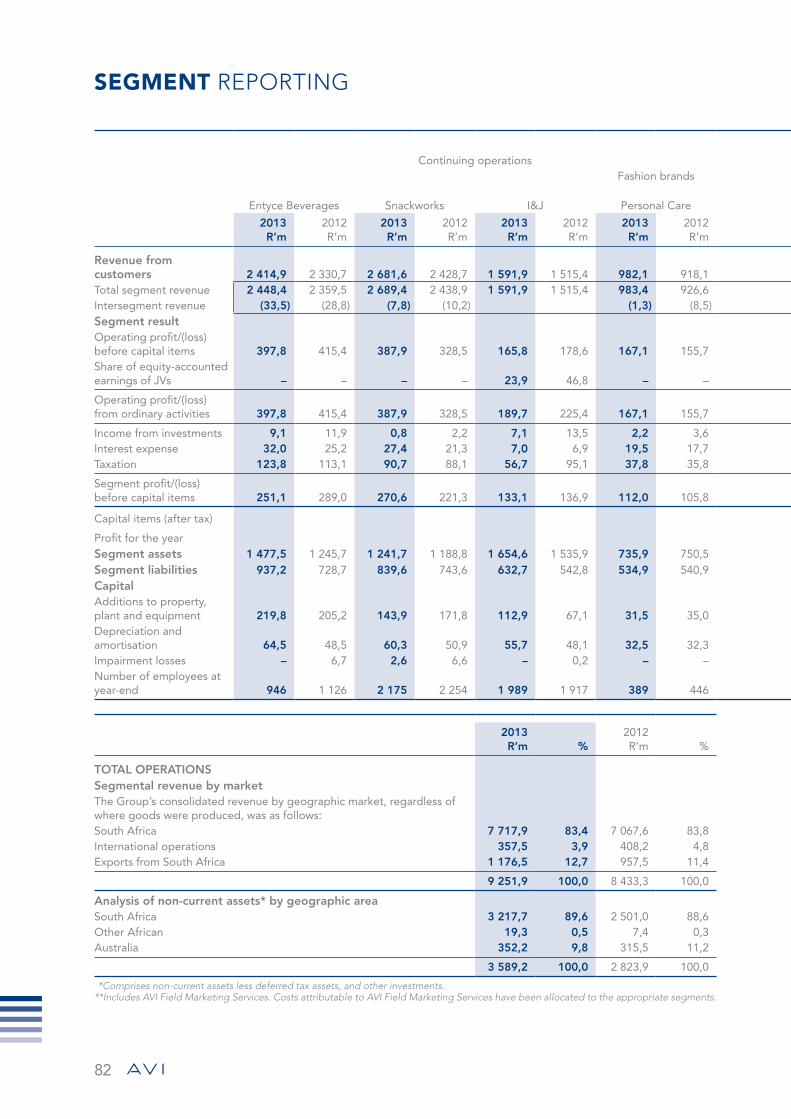
82
SEgmENT reporting
Continuing operationsDiscontinued operations
Fashion brands Fashion brands
Entyce Beverages Snackworks I&J Personal Care Footwear and ApparelCorporate and consolidation Total Denny and Real Juice Total
2013R’m
2012R’m
2013R’m
2012R’m
2013R’m
2012R’m
2013R’m
2012R’m
2013R’m
2012R’m
2013R’m
2012R’m
2013R’m
2012R’m
2013R’m
2012R’m
2013R’m
2012R’m
Revenue from customers 2 414,9 2 330,7 2 681,6 2 428,7 1 591,9 1 515,4 982,1 918,1 1 536,1 1 087,1 11,7 7,1 9 218,3 8 287,1 33,6 146,2 9 251,9 8 433,3 Total segment revenue 2 448,4 2 359,5 2 689,4 2 438,9 1 591,9 1 515,4 983,4 926,6 1 536,1 1 087,1 67,3 66,1 9 316,5 8 393,6 33,6 146,2 9 350,1 8 539,8 Intersegment revenue (33,5) (28,8) (7,8) (10,2) (1,3) (8,5) (55,6) (59,0) (98,2) (106,5) – – (98,2) (106,5)Segment resultOperating profit/(loss) before capital items 397,8 415,4 387,9 328,5 165,8 178,6 167,1 155,7 409,8 307,9 (2,2) (13,6) 1 526,2 1 372,5 0,6 8,1 1 526,8 1 380,6 Share of equity-accounted earnings of JVs – – – – 23,9 46,8 – – – – – – 23,9 46,8 – – 23,9 46,8
Operating profit/(loss) from ordinary activities 397,8 415,4 387,9 328,5 189,7 225,4 167,1 155,7 409,8 307,9 (2,2) (13,6) 1 550,1 1 419,3 0,6 8,1 1 550,7 1 427,4
Income from investments 9,1 11,9 0,8 2,2 7,1 13,5 2,2 3,6 4,1 3,7 (12,9) (21,1) 10,4 13,8 0,5 2,2 10,9 16,0 Interest expense 32,0 25,2 27,4 21,3 7,0 6,9 19,5 17,7 9,6 5,7 (32,4) (48,7) 63,1 28,1 0,6 2,5 63,7 30,6 Taxation 123,8 113,1 90,7 88,1 56,7 95,1 37,8 35,8 113,4 84,7 27,4 30,7 449,8 447,5 – – 449,8 447,5
Segment profit/(loss) before capital items 251,1 289,0 270,6 221,3 133,1 136,9 112,0 105,8 290,9 221,2 (10,1) (16,7) 1 047,6 957,5 0,5 7,8 1 048,1 965,3
Capital items (after tax) (3,4) (9,9) 41,1 17,1 37,7 7,2
Profit for the year 1 044,2 947,6 41,6 24,9 1 085,8 972,5
Segment assets 1 477,5 1 245,7 1 241,7 1 188,8 1 654,6 1 535,9 735,9 750,5 649,5 405,6 809,6 360,0 6 568,8 5 486,5 – 43,4 6 568,8 5 529,9 Segment liabilities 937,2 728,7 839,6 743,6 632,7 542,8 534,9 540,9 507,3 323,8 (560,5) (1 006,1) 2 891,2 1 873,7 – 58,9 2 891,2 1 932,6 CapitalAdditions to property, plant and equipment 219,8 205,2 143,9 171,8 112,9 67,1 31,5 35,0 48,8 50,7 10,0 11,3 566,9 541,1 – – 566,9 541,1 Depreciation and amortisation 64,5 48,5 60,3 50,9 55,7 48,1 32,5 32,3 39,4 33,8 6,6 7,1 259,0 220,7 – 1,4 259,0 222,1 Impairment losses – 6,7 2,6 6,6 – 0,2 – – 1,0 – – – 3,6 13,5 – – 3,6 13,5 Number of employees at year-end 946 1 126 2 175 2 254 1 989 1 917 389 446 1 593 825 3 408 3 091** 10 500 9 659 – 157 10 500 9 816
2013R’m %
2012R’m %
TOTAL OPERATIONSSegmental revenue by marketThe Group’s consolidated revenue by geographic market, regardless of where goods were produced, was as follows:South Africa 7 717,9 83,4 7 067,6 83,8International operations 357,5 3,9 408,2 4,8Exports from South Africa 1 176,5 12,7 957,5 11,4
9 251,9 100,0 8 433,3 100,0
Analysis of non-current assets* by geographic areaSouth Africa 3 217,7 89,6 2 501,0 88,6Other African 19,3 0,5 7,4 0,3Australia 352,2 9,8 315,5 11,2
3 589,2 100,0 2 823,9 100,0
*Comprises non-current assets less deferred tax assets, and other investments.**Includes AVI Field Marketing Services. Costs attributable to AVI Field Marketing Services have been allocated to the appropriate segments.

83
Continuing operationsDiscontinued operations
Fashion brands Fashion brands
Entyce Beverages Snackworks I&J Personal Care Footwear and ApparelCorporate and consolidation Total Denny and Real Juice Total
2013R’m
2012R’m
2013R’m
2012R’m
2013R’m
2012R’m
2013R’m
2012R’m
2013R’m
2012R’m
2013R’m
2012R’m
2013R’m
2012R’m
2013R’m
2012R’m
2013R’m
2012R’m
Revenue from customers 2 414,9 2 330,7 2 681,6 2 428,7 1 591,9 1 515,4 982,1 918,1 1 536,1 1 087,1 11,7 7,1 9 218,3 8 287,1 33,6 146,2 9 251,9 8 433,3 Total segment revenue 2 448,4 2 359,5 2 689,4 2 438,9 1 591,9 1 515,4 983,4 926,6 1 536,1 1 087,1 67,3 66,1 9 316,5 8 393,6 33,6 146,2 9 350,1 8 539,8 Intersegment revenue (33,5) (28,8) (7,8) (10,2) (1,3) (8,5) (55,6) (59,0) (98,2) (106,5) – – (98,2) (106,5)Segment resultOperating profit/(loss) before capital items 397,8 415,4 387,9 328,5 165,8 178,6 167,1 155,7 409,8 307,9 (2,2) (13,6) 1 526,2 1 372,5 0,6 8,1 1 526,8 1 380,6 Share of equity-accounted earnings of JVs – – – – 23,9 46,8 – – – – – – 23,9 46,8 – – 23,9 46,8
Operating profit/(loss) from ordinary activities 397,8 415,4 387,9 328,5 189,7 225,4 167,1 155,7 409,8 307,9 (2,2) (13,6) 1 550,1 1 419,3 0,6 8,1 1 550,7 1 427,4
Income from investments 9,1 11,9 0,8 2,2 7,1 13,5 2,2 3,6 4,1 3,7 (12,9) (21,1) 10,4 13,8 0,5 2,2 10,9 16,0 Interest expense 32,0 25,2 27,4 21,3 7,0 6,9 19,5 17,7 9,6 5,7 (32,4) (48,7) 63,1 28,1 0,6 2,5 63,7 30,6 Taxation 123,8 113,1 90,7 88,1 56,7 95,1 37,8 35,8 113,4 84,7 27,4 30,7 449,8 447,5 – – 449,8 447,5
Segment profit/(loss) before capital items 251,1 289,0 270,6 221,3 133,1 136,9 112,0 105,8 290,9 221,2 (10,1) (16,7) 1 047,6 957,5 0,5 7,8 1 048,1 965,3
Capital items (after tax) (3,4) (9,9) 41,1 17,1 37,7 7,2
Profit for the year 1 044,2 947,6 41,6 24,9 1 085,8 972,5
Segment assets 1 477,5 1 245,7 1 241,7 1 188,8 1 654,6 1 535,9 735,9 750,5 649,5 405,6 809,6 360,0 6 568,8 5 486,5 – 43,4 6 568,8 5 529,9 Segment liabilities 937,2 728,7 839,6 743,6 632,7 542,8 534,9 540,9 507,3 323,8 (560,5) (1 006,1) 2 891,2 1 873,7 – 58,9 2 891,2 1 932,6 CapitalAdditions to property, plant and equipment 219,8 205,2 143,9 171,8 112,9 67,1 31,5 35,0 48,8 50,7 10,0 11,3 566,9 541,1 – – 566,9 541,1 Depreciation and amortisation 64,5 48,5 60,3 50,9 55,7 48,1 32,5 32,3 39,4 33,8 6,6 7,1 259,0 220,7 – 1,4 259,0 222,1 Impairment losses – 6,7 2,6 6,6 – 0,2 – – 1,0 – – – 3,6 13,5 – – 3,6 13,5 Number of employees at year-end 946 1 126 2 175 2 254 1 989 1 917 389 446 1 593 825 3 408 3 091** 10 500 9 659 – 157 10 500 9 816
2013R’m %
2012R’m %
TOTAL OPERATIONSSegmental revenue by marketThe Group’s consolidated revenue by geographic market, regardless of where goods were produced, was as follows:South Africa 7 717,9 83,4 7 067,6 83,8International operations 357,5 3,9 408,2 4,8Exports from South Africa 1 176,5 12,7 957,5 11,4
9 251,9 100,0 8 433,3 100,0
Analysis of non-current assets* by geographic areaSouth Africa 3 217,7 89,6 2 501,0 88,6Other African 19,3 0,5 7,4 0,3Australia 352,2 9,8 315,5 11,2
3 589,2 100,0 2 823,9 100,0
*Comprises non-current assets less deferred tax assets, and other investments.**Includes AVI Field Marketing Services. Costs attributable to AVI Field Marketing Services have been allocated to the appropriate segments.
OV
ER
VIE
WB
USIN
ESS R
EV
IEW
GO
VE
RN
AN
CE
AN
NU
AL FIN
AN
CIA
L STATE
ME
NTS
SHA
RE
HO
LDE
R IN
FOR
MA
TION
84
SEgmENT reporting continued
Basis of segment presentationThe segment information has been prepared in accordance with IFRS 8 – Operating Segments (“IFRS 8”) which defines requirements for the disclosure of financial information of an entity’s operating segments. The standard requires segmentation based on the Group’s internal organisation and reporting of revenue and operating income based upon internal accounting presentation.
identification of reportable segmentsThe Group discloses its reportable segments according to the entity components that management monitors regularly in making decisions about operating matters. The reportable segments comprise various operating segments primarily located in South Africa.
The revenue and operating assets are further disclosed within the geographical areas in which the Group operates. Segment information is prepared in conformity with the basis that is reported to the CEO, who is the chief operating decision maker, in assessing segment performance and allocating resources to segments. These values have been reconciled to the consolidated financial statements. The basis reported by the Group is in accordance with the accounting policies adopted for preparing and presenting the consolidated financial statements.
Segment revenue excludes value added taxation and includes intersegment revenue. Revenue from customers represents segment revenue from which intersegment revenue has been eliminated. Sales between segments are made on a commercial basis.
Segment operating profit before capital items represents segment revenue less segment operating expenses, excluding capital items included in Note 21.
Segment expenses include direct and allocated expenses. Depreciation and amortisation have been allocated to the segments to which they relate.
The segment assets comprise all assets of the different segments that are employed by the segment and that either are directly attributable to the segment, or can be allocated to the segment on a reasonable basis.
reportable segmentsEntyce BeveragesRevenue in this segment is derived from the sale of tea, coffee and creamer, primarily in South Africa.
Ciro Beverage Solutions is the leading South African retail and food services supplier of premium ground coffee and beverage service solutions to the out-of-home consumption market including airports, hotels, caterers, restaurants and corporates.
SnackworksThe principal activity within this segment is the sale of a full range of sweet and savoury biscuits, and baked and fried potato and maize snacks primarily in South Africa.
I&JFollowing the disposal of the fresh, canned and value-added mushroom business conducted by Denny on 1 July 2011 the Chilled and Frozen Convenience brands segment only comprises the I&J business and therefore the segment has been renamed I&J.
I&J processes, markets and distributes premium quality value-added seafood in local and international markets (mainly Europe and Australia).
85
Fashion BrandsFashion brands provides personal care and footwear and apparel offerings.
Personal CareIndigo Brands, which forms the base for the Personal Care segment, creates, manufactures and distributes leading cosmetic and toiletry products that range from mass market to bridge fragrances. Some product is exported.
Footwear and ApparelSpitz, Green Cross and Gant make up the Footwear and Apparel segment and retail a portfolio of owned and licensed footwear and apparel brands in South Africa.
CorporateThe corporate office provides strategic direction, as well as financial, treasury, legal and information technology services to the autonomous subsidiaries. Other entities in this segment comprise the various staff scheme share trusts.
Geographical informationThe Group’s operations are principally located in South Africa. The Australian asset comprises I&J’s interest in the Australian fish processing joint venture with Simplot (Australia) Proprietary Limited.
major customersThe Group’s most significant customers, being two South African retailers, individually contribute to more than 10% of the Group’s revenue (R1 924,1 million in the current year and R1 751,7 million in the previous year) in the Entyce Beverages, Snackworks and I&J segments.
OV
ER
VIE
WB
USIN
ESS R
EV
IEW
GO
VE
RN
AN
CE
AN
NU
AL FIN
AN
CIA
L STATE
ME
NTS
SHA
RE
HO
LDE
R IN
FOR
MA
TION
86
aCCOuNTiNg policies
AVI Limited (the “Company”) is a South African registered company. The consolidated financial statements for the year ended 30 June 2013 comprise the Company and its subsidiaries (together referred to as the “Group”) and the Group’s interest in associates and jointly controlled entities.
statement of complianceThe consolidated financial statements have been prepared in accordance with International Financial Reporting Standards (”IFRS“), in compliance with JSE Listings Requirements, the interpretations adopted by the International Accounting Standards Board (”IASB“), the SAICA Financial Reporting Guides as issued by the Accounting Practices Committee and Financial Reporting Pronouncements as issued by Financial Reporting Standards Council, and the requirements of the Companies Act of South Africa.
Basis of preparationThe financial statements are prepared in millions of South African Rands (“R’m”), which is the Company’s functional currency, on a historical cost basis, except for the following assets and liabilities which are stated at their fair value:• Derivative financial instruments and biological assets;• Liabilities for cash-settled share-based payment arrangements; and• Non-current assets and disposal groups held-for-sale are stated at the lower of carrying amount and fair value less
costs to sell.
The preparation of financial statements in conformity with IFRS requires management to make judgements, estimates and assumptions that may affect the application of accounting policies and reported amounts of assets, liabilities, income and expenses. The estimates and associated assumptions are based on historical experience and various other factors that are believed to be reasonable under the circumstances, the results of which form the basis of making the judgements about carrying values of assets and liabilities that are not readily apparent from other sources. Actual results may differ from these estimates.
The estimates and underlying assumptions are reviewed on an ongoing basis. Revisions to accounting estimates are recognised in the period in which the estimate is revised if the revision only affects that period, or in the period of the revision and future periods if the revision affects both current and future periods.
In particular, information about areas of estimation and critical judgements in applying accounting policies that have the most significant effect on the amounts recognised in the financial statements are described in the following notes:Note 1 – useful lives and residual values of property, plant and equipmentNote 2 – useful lives and impairment tests on intangible assetsNote 3 – utilisation of tax lossesNote 7 – estimated fair value less cost to sell of disposal groupsNote 11 – measurement of defined benefit obligations
The accounting policies set out below have been applied consistently to the periods presented in these financial statements.
Basis of consolidationSubsidiariesThe Group financial statements include the financial statements of the Company and its subsidiaries. Where an investment in a subsidiary is acquired or disposed of during the financial year its results are included from, or to, the date control commences or ceases. Any surplus or deficit arising on the loss of control is recognised in profit or loss.
Subsidiaries are those entities over which the Group has power to, directly or indirectly, exercise control over the financial and operating policies, so as to obtain benefits from their activities. In assessing control, potential voting rights that currently are exercisable are taken into account.
Losses applicable to non-controlling interests in a subsidiary are allocated to the non-controlling interest even if doing so causes the non-controlling interest to have a deficit balance.
Transaction costs that the Group incurs in connection with a business combination are expensed as incurred.
Associated companies and joint venturesAn associated company is an enterprise over whose financial and operating policies the Group has the ability to exercise significant influence, but not control. A joint venture is an enterprise over whose financial and operating policy decisions the Group has the ability to exercise joint control in terms of a contractual arrangement.
The Group’s share of post-acquisition profit or loss and other comprehensive income of associated companies is equity accounted from the date that significant influence commences to the date that significant influence ceases. The Group’s
87
attributable share of post-acquisition profit or loss and other comprehensive income of joint ventures is equity accounted from the date that joint control commences to the date that joint control ceases.
Where the Group’s share of losses of an associated company or joint venture exceeds the carrying amount, the investment is carried at nil. Additional losses are only recognised to the extent that the Group has incurred legal or constructive obligations or made payments on behalf of associates or joint ventures.
Eliminations on consolidationIntra-group balances and transactions, and any unrealised gains or losses arising from intra-group transactions, are eliminated in preparing the consolidated financial statements. Unrealised gains arising from transactions with associated companies and joint ventures are eliminated to the extent of the Group’s interest in these enterprises. Unrealised losses on transactions with associated companies and joint ventures are eliminated in the same way as unrealised gains except that they are only eliminated to the extent that there is no evidence of impairment.
GoodwillAll business combinations taking place prior to 1 July 2009 are accounted for by applying the “purchase method”. Those business combinations taking place from 1 July 2009 are accounted for by applying the “acquisition method”. Goodwill represents amounts arising on the acquisition of subsidiaries, businesses and joint ventures. The Group measures goodwill as the fair value of the consideration transferred including the recognised amount of any non-controlling interest in the acquiree, less the net recognised amount (generally fair value) of the identifiable assets acquired and liabilities assumed, all measured as at the acquisition date.
Consideration transferred includes the fair values of the assets transferred, liabilities incurred by the Group to the previous owners of the acquiree, and equity interests issued by the Group. Consideration transferred also includes the fair value of any contingent consideration and share-based payment awards of the acquiree that are replaced mandatorily in the business combination. If a business combination results in the termination of pre-existing relationships between the Group and the acquiree, then the lower of the termination amount, as contained in the agreement, and the value of the off-market element is deducted from the consideration transferred and recognised in expenses.
The Group measures any non-controlling interest at either fair value or at the non-controlling interest’s proportionate share of the acquiree’s identifiable assets. This election is made on a transaction-by-transaction basis.
Goodwill is stated at cost less accumulated impairment losses. Goodwill is allocated to cash-generating units and is tested annually for impairment. In respect of equity-accounted investees, the carrying amount of goodwill is included in the carrying amount of the investment, and an impairment loss on such an investment is not allocated to any asset, including goodwill, that forms part of the carrying amount of the equity-accounted investee.
A bargain purchase gain arising on an acquisition is recognised directly in profit or loss as a capital item.
Premiums and discounts arising on subsequent purchases from, or sales to, non-controlling interests in subsidiariesFollowing the presentation of non-controlling interests in equity, any increases and decreases in ownership interests in subsidiaries without a change in control are recognised as equity transactions in the consolidated financial statements. Accordingly, any premiums or discounts on subsequent purchases of equity instruments from, or sales of equity instruments to, non-controlling interests are recognised directly in the equity of the parent shareholder.
Business combinations involving entities under common controlBusiness combinations involving entities or businesses under common control comprise business combinations where both entities remain under the ultimate control of the Group before and after the combination, and that control is not transitory. The assets and liabilities in common control transactions within the Group are transferred at existing carrying value.
Black economic empowerment (”BEE“) transactionsBEE transactions involving the disposal or issue of equity interests in subsidiaries are only recognised when the accounting recognition criteria have been met.
Although economic and legal ownership of such instruments may have transferred to the BEE partner, the derecognition of such equity interests sold or recognition of equity instruments issued in the underlying subsidiary by the parent shareholder is postponed until the accounting recognition or derecognition criteria have been satisfied.
A dilution in the earnings attributable to the parent shareholders (in the interim period until accounting recognition criteria have been met) is adjusted for in the diluted earnings per share calculation by an appropriate adjustment to the earnings used in such calculation.
OV
ER
VIE
WB
USIN
ESS R
EV
IEW
GO
VE
RN
AN
CE
AN
NU
AL FIN
AN
CIA
L STATE
ME
NTS
SHA
RE
HO
LDE
R IN
FOR
MA
TION

88
aCCOuNTiNg policies continued
Borrowing costsBorrowing costs that are directly attributable to the acquisition or construction of an asset, that requires a substantial period of time to prepare for its intended use, are capitalised. All other borrowing costs are recognised in profit or loss using the effective interest method.
cash and cash equivalentsFor the purposes of the cash flow statement, cash and cash equivalents comprise cash balances on hand, deposits held on call with banks, net of overdrafts forming part of the Group’s cash management, all of which are available for use by the Group unless otherwise stated. Cash and cash equivalents are measured at amortised cost.
capital itemsCapital items are items of income and expense relating to the acquisition, disposal or impairment of investments, businesses, property, plant and equipment and intangible assets.
discontinued operationsA discontinued operation is a clearly distinguishable component of the Group’s business that is abandoned or disposed of pursuant to a single plan and which represents a separate major line of business or geographical area of operation that can be distinguished physically, operationally and for financial reporting purposes.
Classification as a discontinued operation occurs upon disposal or when the operation meets the criteria to be classified as held-for-sale, if earlier. When an operation is classified as a discontinued operation the comparative profit or loss is restated as if the operation had been discontinued from the start of the previous period.
dividends payableDividends payable and any Secondary Tax on Companies pertaining thereto are recognised in the period in which such dividends are declared.
employee benefitsShort-term employee benefitsThe cost of all short-term employee benefits is recognised during the period in which the employee renders the related service.
The accruals for employee entitlements to salaries, performance bonuses and annual leave represent the amounts which the Group has a present obligation to pay as a result of employees’ services provided to the reporting date. The accruals have been calculated at undiscounted amounts based on current salary levels at the reporting date.
Defined contribution plansThe Group provides defined contribution plans for the benefit of employees, the assets of which are held in separate funds. These funds are funded by payments from employees and the Group. The Group’s contributions to defined contribution plans are charged to profit or loss in the year to which they relate.
Defined benefit obligationsThe Group’s obligation to provide post-retirement medical aid benefits are defined benefit obligations. The projected unit credit method is used to determine the present value of the defined benefit obligations, the related current service cost and, where applicable, the past service cost.
Past service costs are recognised as an expense on a straight-line basis over the average period until the benefits become vested. To the extent that the benefits are already vested, past service costs are recognised immediately.
The Group recognises all actuarial gains and losses in respect of defined benefit obligations directly in other comprehensive income immediately.
Other long-term employee benefitsThe Group’s net obligation in respect of long-term employee benefits other than post-retirement and pension plans is the amount of future benefit that employees have earned in return for their services in the current and prior periods.
That benefit is discounted to determine its present value and the fair value of any related assets is deducted. The calculation of benefits is performed using the projected unit credit method. Any actuarial gains or losses are recognised in profit or loss in the period in which they arise.

89
Share-based payment transactionsGroup share-based payment transactionsTransactions in which a parent grants rights to its own equity instruments directly to the employees of its subsidiaries are classified as equity settled in the financial statements of the parent. The subsidiary classifies these transactions as equity settled in its financial statements where it has no obligation to settle the share-based payment transaction.
The subsidiary recognises the services acquired with the share-based payment as an expense and recognises a corresponding increase in equity as a capital contribution from the parent for those services acquired. The parent recognises in equity the equity-settled share-based payment and recognises a corresponding increase in the investment in subsidiary.
equity-settledThe fair value of share options granted to Group employees is recognised as an employee expense with a corresponding increase in equity. The fair value is measured at grant date and expensed over the period during which the employee becomes unconditionally entitled to the equity instruments. The fair value of the instruments granted is measured using generally accepted valuation techniques, taking into account the terms and conditions upon which the instruments are granted. The amount recognised as an expense is adjusted to reflect the actual number of share options that vest except where forfeiture is only due to market conditions not being met.
cash-settledThe fair value of the amount payable to employees in respect of share appreciation rights, which are settled in cash, is recognised as an expense, with a corresponding increase in liabilities, over the period in which the employee becomes unconditionally entitled to payment. The liability is remeasured at each reporting date and at settlement date. Any changes in the fair value of the liability are recognised in profit or loss.
Black economic empowerment transactionsWhere goods or services are considered to have been received from black economic empowerment partners as consideration for equity instruments of the Group, these transactions are accounted for as share-based payment transactions, even when the entity cannot specifically identify the goods or services received.
Group share scheme recharge arrangementsA recharge arrangement exists whereby the cost to the scheme of acquiring shares issued in accordance with certain share schemes granted by the holding company shall be funded by way of contributions from employer companies in respect of participants who are their employees. The recharge arrangement is accounted for separately from the underlying equity-settled share-based payment upon initial recognition, as follows:• The subsidiary recognises a recharge liability at fair value, determined using generally accepted valuation techniques,
and a corresponding adjustment against equity for the capital contribution recognised in respect of the share-based payment.
• The parent recognises a corresponding recharge asset at fair value and a corresponding adjustment to the carrying amount of the investment in the subsidiary.
Subsequent to initial recognition the recharge arrangement is remeasured at fair value (as an adjustment to the net capital contribution) at each subsequent reporting date until settlement date to the extent vested. Where the recharge amount recognised is greater than the initial capital contribution recognised by the subsidiary in respect of the share-based payment, the excess is recognised as a net capital distribution to the parent in equity. The amount of the recharge in excess of the capital contribution, recognised by the parent as an increase in the investment in subsidiary, is recognised as an adjustment to the net capital contribution through a reduction in the net investment in the subsidiary.
financial instrumentsMeasurementFinancial instruments are recognised initially at fair value plus, for instruments not at fair value through profit or loss, any directly attributable transaction costs when the Group becomes a party to the contractual arrangements. Subsequent to initial recognition these instruments are measured as detailed below:
Financial assetsFinancial assets are recognised when the Group has rights to cash or another financial asset. Such assets consist of cash and cash equivalents, a contractual right to receive cash or another financial asset or a contractual right to exchange financial instruments with another entity on potentially favourable terms.
InvestmentsInvestments held for trading are classified as current assets and are stated at fair value, with any resultant gain or loss recognised in profit or loss.
OV
ER
VIE
WB
USIN
ESS R
EV
IEW
GO
VE
RN
AN
CE
AN
NU
AL FIN
AN
CIA
L STATE
ME
NTS
SHA
RE
HO
LDE
R IN
FOR
MA
TION

90
aCCOuNTiNg policies continued
Other investments held by the Group are classified as being available-for-sale and are stated at fair value, with any resultant gain or loss being recognised directly in other comprehensive income, except for impairment losses and foreign exchange gains or losses, which are recognised in profit or loss. When these investments are disposed of, the cumulative gain or loss previously recognised directly in other comprehensive income is recognised in profit or loss as a capital item. Where these investments are interest-bearing, interest calculated using the effective interest method is recognised in profit or loss.
Trade and other receivablesTrade and other receivables are stated at amortised cost using the effective interest method less impairment losses.
Cash and cash equivalentsCash and cash equivalents initially are measured at fair value. Due to their short-term nature, the amortised cost approximates its fair value.
Financial liabilitiesFinancial liabilities are recognised when there is an obligation to transfer benefits and that obligation is a contractual liability to deliver cash or another financial asset or to exchange financial instruments with another entity on potentially unfavourable terms. Financial liabilities other than derivative instruments are measured at amortised cost using the effective interest method.
Interest-bearing borrowingsSubsequent to initial recognition, interest-bearing borrowings are stated at amortised cost with any difference between cost and redemption value being recognised in profit or loss over the period of the borrowings using the effective interest method.
Trade and other payablesTrade and other payables are stated at amortised cost using the effective interest method.
OffsetFinancial assets and financial liabilities are offset and the net amount reported in the balance sheet when the Group has a legally enforceable right to set off the recognised amounts, and intends either to settle on a net basis, or to realise the asset and settle the liability simultaneously.
Derivative instrumentsThe Group uses derivative financial instruments to manage its exposure to risks arising from operational, financing and investment activities. The Group does not hold or issue derivative financial instruments for trading purposes.
Derivative instruments are measured at fair value. Fair value is determined by comparing the contracted rate to the current rate of an equivalent instrument with the same maturity date.
Gains and losses on subsequent measurementGains and losses arising from a change in the fair value of derivative financial instruments that are not part of a hedging relationship are recognised in profit or loss in the year in which the change arises.
hedgingWhere a derivative financial instrument is designated as a hedge of the variability in cash flows of a recognised asset or liability, or a highly probable forecast transaction, the effective part of any gain or loss on the derivative financial instrument is recognised directly in other comprehensive income and presented in the cash flow hedging reserve in equity.
When the hedged firm commitment or forecast transaction results in the recognition of a non-financial asset or a non-financial liability, the cumulative amount recognised in equity up to the transaction date is adjusted against the initial measurement of the asset or liability.
Where the hedging instrument or hedge relationship is terminated or no longer meets the criteria for hedge accounting but the hedged transaction is still expected to occur, the cumulative unrealised gain or loss at that point remains in equity and is recognised in profit or loss when the underlying transaction occurs. If the hedged transaction is no longer expected to occur, the cumulative unrealised gain or loss is recognised in profit or loss immediately.
Where a derivative financial instrument is used to hedge economically the foreign exchange exposure of a recognised monetary asset or liability, no hedge accounting is applied and any gain or loss on the hedging instrument is recognised in profit or loss.

91
DerecognitionThe Group derecognises a financial asset when the contractual rights to the cash flows from the financial asset expire, or when it transfers the rights to receive the contractual cash flows on the financial asset in a transaction in which substantially all the risks and rewards of ownership of the financial asset are transferred.
The Group derecognises a financial liability when its contractual obligations are discharged or cancelled or expire.
Foreign currenciesforeign currency transactionsTransactions in foreign currencies are translated to South African Rands, being the functional currency of the Company and presentation currency of the Group, at the rates of exchange ruling at the dates of the transactions. Monetary assets and liabilities denominated in foreign currencies at the reporting date are translated to South African Rands at the exchange rates ruling at that date. Gains or losses on translation are recognised in profit or loss.
Non-monetary assets and liabilities that are measured in terms of historical cost in foreign currency are translated using the exchange rate at the date of the transaction.
foreign operationsThe assets and liabilities of all foreign operations, including goodwill and fair value adjustments arising on consolidation, are translated to South African Rands at foreign exchange rates ruling at the reporting date. The revenues and expenses of foreign operations are translated to Rands at approximate foreign exchange rates ruling at the date of the transactions. Foreign exchange differences arising on translation are recognised in other comprehensive income and presented in the foreign currency translation reserve in equity. The foreign currency translation reserve applicable to a foreign operation is released to profit or loss upon disposal of that foreign operation.
impairment of non-financial assetsThe carrying amounts of the Group’s assets other than deferred tax assets, biological assets, inventories and financial assets which are separately assessed and provided against where necessary, are reviewed at each reporting date to determine whether there is any indication of impairment. If there is any indication that an asset may be impaired, its recoverable amount is estimated.
For goodwill and intangible assets that have an indefinite useful life the recoverable amount is estimated at least annually.
The recoverable amount of assets is the greater of their fair value less cost to sell and value in use. In assessing value in use, the estimated future cash flows are discounted to their present value using a pre-tax discount rate that reflects current market assessments of the time value of money and the risks specific to the asset. For an asset that does not generate largely independent cash inflows, the recoverable amount is determined for the cash-generating unit to which the asset belongs. Impairment losses are recognised in profit or loss as a capital item, when the carrying amount exceeds the recoverable amount.
Impairment losses recognised in respect of cash-generating units are allocated first to reduce the carrying amount of any goodwill allocated to cash-generating units and then to reduce the carrying amount of the other assets in the unit on a pro rata basis.
An impairment loss in respect of goodwill is not reversed. In respect of other assets, an impairment loss is reversed if there has been a change in the estimates used to determine the recoverable amount.
An impairment loss is reversed only to the extent that the asset’s carrying amount does not exceed the carrying amount that would have been determined, net of depreciation or amortisation, if no impairment loss had been recognised, and when the indication of impairment no longer exists.
impairment of financial assetsA financial asset is assessed at each reporting date to determine whether there is any objective evidence that it is impaired. A financial asset is considered to be impaired if objective evidence indicates that one or more events have had a negative effect on the estimated future cash flows of that asset.
Individually significant financial assets are tested for impairment on an individual basis. The remaining financial assets are assessed collectively in groups that share similar credit risk characteristics.
An impairment loss in respect of a financial asset measured at amortised cost is calculated as the difference between its carrying amount, and the present value of the estimated future cash flows discounted at the original effective interest rate. An impairment loss in respect of an available-for-sale financial asset is calculated by reference to its fair value.
OV
ER
VIE
WB
USIN
ESS R
EV
IEW
GO
VE
RN
AN
CE
AN
NU
AL FIN
AN
CIA
L STATE
ME
NTS
SHA
RE
HO
LDE
R IN
FOR
MA
TION
92
All impairment losses are recognised in profit or loss. Any cumulative loss in respect of an impaired available-for-sale financial asset recognised previously in equity is transferred to profit or loss.
An impairment loss is reversed if the reversal can be related objectively to an event occurring after the impairment loss was recognised. For financial assets measured at amortised cost and available-for-sale financial assets that are debt securities, the reversal is recognised in profit or loss. For available-for-sale financial assets that are equity securities, the reversal is recognised directly in other comprehensive income.
intangible assetsIntangible assets, excluding goodwill, acquired by the Group are stated at cost less accumulated amortisation and impairment losses. Amortisation is charged to profit or loss on a straight-line basis over the estimated useful lives of intangible assets unless such lives are indefinite. Where the useful life of an intangible asset is assessed as indefinite, the intangible asset is not amortised, but is tested annually for impairment.
Subsequent expenditure on acquired intangible assets is capitalised only when it increases the future economic benefits embodied in the specific asset to which it relates.
Expenditure on research activities, undertaken with the prospect of gaining new scientific or technical knowledge and understanding, and expenditure on internally generated goodwill and brands, is recognised in profit or loss as an expense when incurred.
inventoriesInventories are stated at the lower of cost and net realisable value.
The cost of inventories is based on the first-in-first-out method or a weighted average cost basis, whichever is applicable, and includes expenditure incurred in acquiring the inventories and bringing them to their existing location and condition. In the case of manufactured inventories and work in progress, cost includes an appropriate share of overheads based on normal operating capacity. The cost of items transferred from biological assets is their fair value less point-of-sale costs at the date of transfer.
Net realisable value is the estimated selling price in the ordinary course of business, less the estimated costs of completion and selling expenses.
Biological assetsBiological assets are stated at fair value less estimated costs to sell, with any resultant gain or loss recognised in profit or loss. Costs to sell include all costs that would be necessary to sell the assets, excluding costs necessary to get the assets to market.
investments in subsidiary companiesInvestments in subsidiary companies are stated at cost, less impairment losses.
lease paymentsOperating lease paymentsLeases where the lessor retains the risks and rewards of ownership of the underlying asset are classified as operating leases. Payments made under operating leases with fixed escalation clauses are recognised in profit or loss on a straight-line basis over the term of the lease.
Revenue from operating lease arrangements is recognised in profit or loss on a straight-line basis over the term of the lease.
Finance lease paymentsLeases that transfer substantially all of the risks and rewards of ownership of the underlying asset to the Group are classified as finance leases. Assets acquired in terms of finance leases are capitalised at the lower of fair value and the present value of the minimum lease payments at inception of the lease, and depreciated over the shorter of the estimated useful life of the asset or the lease term if there is no reasonable certainty that the Group will obtain ownership at the end of the lease term.
The capital element of future obligations under the leases is included as a liability in the balance sheet. Lease payments are allocated using the effective interest method to determine the lease finance cost, which is recognised in the profit or loss over the lease period, and the capital repayment, which reduces the liability to the lessor.
aCCOuNTiNg policies continued
93
assets held-for-saleAssets (or disposal groups comprising assets and liabilities) that are expected to be recovered primarily through sale rather than through continuing use are classified as held-for-sale. Immediately before classification as held-for-sale, the assets (or components of a disposal group) are remeasured in accordance with the Group’s accounting policies. Thereafter the assets (or disposal group) are measured at the lower of their carrying amount and fair value less cost to sell. Any impairment loss on a disposal group is first allocated to goodwill, and then to remaining assets and liabilities on a pro rata basis, except that no loss is allocated to inventories, financial assets, deferred tax assets, employee benefit assets, investment property and biological assets, which continue to be measured in accordance with the Group’s accounting policies. Impairment losses on initial classification as held-for-sale and subsequent gains or losses on remeasurement are recognised in profit or loss as capital items. Gains are not recognised in excess of any cumulative impairment loss.
Property, plant and equipmentOwned assetsItems of property, plant and equipment are stated at cost, less accumulated depreciation and impairment losses. The cost of self-constructed assets includes the cost of materials, direct labour and an appropriate proportion of production overheads.
VesselsMajor vessel reconstructions are capitalised where such reconstruction extends the useful life of a vessel. The reconstruction is written off over the remaining expected useful life of the vessel.
Subsequent costsThe Group recognises in the carrying amount of an item of property, plant and equipment the cost of replacing part of such an item when the cost is incurred if it is probable that future economic benefits embodied within the item will flow to the Group and the cost of such item can be measured reliably. All other costs are recognised in profit or loss as an expense when incurred.
DepreciationLand is not depreciated. Freehold buildings, plant and equipment are depreciated on a straight-line basis over their expected useful lives to an estimated residual value. The current estimated useful lives are as follows:• Buildings 40 – 50 years• Plant and machinery 3 – 20 years• Motor vehicles – trucks 3 – 8 years – other 3 – 5 years• Furniture and equipment 3 – 10 years• Vessels – hull 20 years – other components 5 – 10 years
Where parts of an item of property, plant and equipment have different useful lives, they are accounted for as separate items of property, plant and equipment. Residual values, depreciation methods and useful lives of all assets are reassessed annually. In addition, depreciation of an item of property, plant and equipment begins when it is available for use and ceases at the earlier of the date it is classified as held-for-sale or the date that it is derecognised upon disposal.
ProvisionsA provision is recognised in the balance sheet when the Group has a present legal or constructive obligation as a result of a past event and it is probable that an outflow of economic benefits will be required to settle the obligation, and where a reliable estimate can be made of the amount of the obligation. Provisions are determined by discounting the expected future cash flows at a pre-tax rate that reflects current market assessments of the time value of money and, where appropriate, the risks specific to the liability.
Onerous contractsA provision for onerous contracts is recognised when the expected benefits to be derived by the Group from a contract are lower than the unavoidable cost of meeting the obligations under the contract.
RestructuringA provision for restructuring is recognised when the Group has approved a detailed and formal restructuring plan and has either started to implement the plan or announced its main features to those affected by it. Future operating costs are not provided for.
OV
ER
VIE
WB
USIN
ESS R
EV
IEW
GO
VE
RN
AN
CE
AN
NU
AL FIN
AN
CIA
L STATE
ME
NTS
SHA
RE
HO
LDE
R IN
FOR
MA
TION

94
revenue recognitionRevenue is recognised only when it is probable that the economic benefits associated with a transaction will flow to the Group and the amount of revenue can be measured reliably.
Goods and servicesRevenue from the sale of goods is measured at the fair value of the consideration received or receivable, net of returns, allowances, trade discounts and Value Added Tax. Revenue arising from the sale of goods is recognised when the significant risks and rewards of ownership of the goods have passed to the buyer.
Revenue from services, including the distribution of third-party products, is recognised over the period that the services are rendered.
recognition of income from investmentsDividendsDividends are recognised when the right to receive payment is established, with the exception of dividends on cumulative preference share investments which are recognised on a time proportion basis in the period to which they relate.
InterestInterest is recognised on a time proportion basis that takes account of the effective yield on the asset.
share capitalOrdinary sharesOrdinary shares are classified as equity. Incremental costs directly attributable to the issue of ordinary shares are recognised as a deduction from equity, net of any tax effects.
Preference share capitalPreference share capital is classified as equity if it is non-redeemable and any dividends are discretionary, or is redeemable but only at the Company’s option. Dividends on preference share capital classified as equity are recognised as distributions within equity.
Preference share capital is classified as a liability if it is redeemable on a specific date or at the option of the shareholders and if dividend payments are not discretionary. Dividends thereon are recognised in profit or loss as interest expense.
Repurchase of share capitalWhen share capital recognised as equity is repurchased, the amount of the consideration paid, including directly attributable costs, net of any tax effects, is recognised as a change in equity. Repurchased shares held by subsidiaries are classified as treasury shares and presented as a deduction from total equity. Consideration received when own shares held by the Group are re-issued is presented as a change in equity and no profit or loss is recorded.
Where loans advanced by the holding company to a subsidiary to acquire treasury shares are to be repaid principally by the buy-back of such shares, the loan is classified as an equity instrument by the holding company.
taxationTaxation on the profit or loss for the year comprises current and deferred taxation. Taxation is recognised in profit or loss except to the extent that it relates to a business combination or items recognised directly in other comprehensive income or equity.
Current taxationCurrent taxation comprises tax payable calculated on the basis of the estimated taxable income for the year, using the tax rates enacted or substantively enacted at the reporting date, and any adjustment to tax payable for previous years.
Deferred taxationDeferred taxation is provided using the balance sheet method based on temporary differences. Temporary differences are differences between the carrying amounts of assets and liabilities for financial reporting purposes and their tax base. The amount of deferred taxation provided is based on the expected manner of realisation or settlement of the carrying amount of assets and liabilities using tax rates enacted or substantively enacted at the reporting date.
Deferred taxation is charged to profit or loss except to the extent that it relates to a transaction that is recognised directly in other comprehensive income or equity, in which case it is recognised in other comprehensive income or equity, or a business combination that is an acquisition, in which case it is recognised as an adjustment to goodwill. The effect on deferred taxation of any changes in tax rates is recognised in profit or loss, except to the extent that it relates to items previously charged or credited directly to other comprehensive income or equity.
aCCOuNTiNg policies continued
95
A deferred taxation asset is recognised to the extent that it is probable that future taxable profits will be available against which the associated unused tax losses and deductible temporary differences can be utilised. Deferred taxation assets are reduced to the extent that it is no longer probable that the related tax benefit will be realised.
Secondary Taxation on CompaniesSecondary Taxation on Companies (“STC”) is recognised in the year dividends are declared, net of dividends received in respect of dividends declared before 1 April 2012.
Dividend Withholding TaxDividend Withholding Tax is a tax on shareholders receiving dividends and is applicable to all dividends declared on or after 1 April 2012. The Group withholds dividends tax on behalf of its shareholders at a rate of 15% on dividends declared. Amounts withheld are not recognised as part of the Group’s tax charge but rather as part of the dividend paid recognised directly in equity.
Where withholding tax is withheld on dividends received, the dividend is recognised at the gross amount with the related withholding tax recognised as part of the tax expense unless it is otherwise reimbursable, in which case it is recognised as an asset.
earnings per shareThe Group presents basic and diluted earnings per share (“EPS”) data for its ordinary shares. Basic EPS is calculated by dividing the profit or loss attributable to ordinary shareholders of the Company by the weighted average number of ordinary shares outstanding (adjusted for own shares held) during the period. Diluted EPS is determined by adjusting the profit or loss attributable to ordinary shareholders and the weighted average number of ordinary shares outstanding for the effects of all dilutive potential ordinary shares, which comprise convertible redeemable preference shares, share options and equivalent equity instruments granted to employees and BEE transactions that have not yet met the accounting recognition criteria.
new standards and interpretations in issue not yet effectiveA number of new standards, amendments to standards and interpretations are not yet effective for the year ended 30 June 2013. These include the following standards and interpretations and amendments to standards that are applicable to the business of the Group, and have not been applied in preparing these financial statements:
• IAS 19 – Employee Benefits: Defined benefit plansThe amendment to IAS 19 will be effective for the Group for the year ending 30 June 2014. In terms of the amendments, the following key changes will have an impact on the Group:– Actuarial gains and losses are required to be recognised immediately in other comprehensive income. The corridor
method and the recognition of actuarial gains and losses in profit or loss will no longer be permitted.– Past service cost as well as gains and losses on curtailments or settlements are recognised in profit or loss.– Expected returns on plan assets are calculated based on the rates used to discount the defined benefit obligation.– The definitions of short-term and other long-term employee benefits have been amended and the distinction
between the two will depend on when the entity expects the benefit to be settled wholly or in full.
The amendment relating to the recognition of actuarial gains and losses is not expected to impact the Group results. Management has not assessed the full impact of the other revisions in detail but does not expect any significant impact on the financial results.
• IAS 27 (2011) – Separate Financial StatementsIAS 27 (2011) will be effective for the year ending 30 June 2014 and supersedes IAS 27 (2008). IAS 27 (2011) carries forward the existing accounting and disclosure requirements for separate financial statements, with some minor clarifications.
The adoption of IAS 27 (2011) is not expected to have a significant impact on the Company’s separate financial statements.
• IAS 28 (2011) – Investments in Associates and Joint VenturesIAS 28 (2011) will be effective for the year ending 30 June 2014 and supersedes IAS 28 (2008) and carries forward the existing accounting and disclosure requirements with limited amendments. These include:– IFRS 5 is applicable to an investment, or a portion of an investment, in an associate or a joint venture that meets the
criteria to be classified as held-for-sale; and– On cessation of significant influence or joint control, even if an investment in an associate becomes an investment
in a joint venture or vice versa, the company does not re-measure the retained interest.
The adoption of IAS 28 (2011) is not expected to have a significant impact on the Group’s financial results or disclosures.
OV
ER
VIE
WB
USIN
ESS R
EV
IEW
GO
VE
RN
AN
CE
AN
NU
AL FIN
AN
CIA
L STATE
ME
NTS
SHA
RE
HO
LDE
R IN
FOR
MA
TION
96
• Amendments to IAS 32 – Financial Instruments: Presentation: Offsetting Financial Assets and Financial LiabilitiesThe amendment will be effective for the Group’s year ending 30 June 2015 and provides clarity regarding situations resulting in legally enforceable rights to set off financial assets and financial liabilities.
The amendment is not expected to impact the Group’s results significantly.
• Amendments to IAS 36 – Recoverable amount disclosures for non-financial assetsThe amendment will be effective for the Group’s year ending 30 June 2015 and reverses the unintended requirement in IFRS 13 – Fair Value Measurement to disclose the recoverable amount of every cash-generating unit to which significant goodwill or indefinite life intangible assets have been allocated. Under the amendments, the recoverable amount is required to be disclosed only when an impairment loss has been recognised or reversed.
The amendment is not expected to impact the Group’s results significantly.
• Amendments to IFRS 7 – Financial Instruments: Disclosures: Offsetting Financial Assets and Financial LiabilitiesThe amendment will be adopted for the Group for the year ending 30 June 2014 and contains new disclosure requirements for financial assets and financial liabilities that are offset in the balance sheet, or are subject to enforceable master netting arrangements or similar agreements.
The additional disclosure requirement is not expected to impact the Group.
• IFRS 9 – Financial InstrumentsThe revised statement is effective for the Group for the year ending 30 June 2016, with restatement of comparatives required subject to transitional provisions.
IFRS 9 addresses the initial measurement and classification of financial assets and will replace the relevant sections of IAS 39. Under IFRS 9 there are two options in respect of classification of financial assets, namely, financial assets measured at amortised cost or at fair value. Financial assets are measured at amortised cost when the business model is to hold assets in order to collect contractual cash flows and when they give rise to cash flows that are solely payments of principal and interest on the principal outstanding. All other financial assets are measured at fair value.
In addition, IFRS 9 addresses the initial measurement and classification of financial liabilities and will replace the relevant sections of IAS 39. The classification and measurement of financial liabilities are the same as IAS 39 except that fair value changes for financial liabilities designated at fair value through profit or loss, attributable to changes in the credit risk of the liability, will be presented in other comprehensive income and derivative financial liabilities linked to and settled by delivery of unquoted equity instruments whose fair value cannot be reliably measured, are measured at fair value.
The amendment is not expected to impact the Group’s results significantly.
• IFRS 10 – Consolidated Financial StatementsIFRS 10 will be adopted by the Group for the first time for the year ending 30 June 2014. The standard requires retrospective application if there is a change in the control conclusion between IAS 27, SIC 12 and IFRS 10. The standard introduces a single control model to assess whether an investee should be consolidated.
The standard is not expected to impact the Group’s results significantly.
• IFRS 11 – Joint ArrangementsIFRS 11 will be adopted by the Group for the first time for the year ending 30 June 2014. The standard will be applied retrospectively, subject to certain transitional provisions. IFRS 11 establishes that classification of the joint arrangement depends on whether parties have rights to and obligations for the underlying assets and liabilities. In terms of IFRS 11, all joint ventures will have to be equity accounted.
The standard is not expected to impact the Group’s results significantly.
• IFRS 12 – Disclosure of Interests in Other EntitiesIFRS 12 will be adopted by the Group for the first time for the year ending 30 June 2014. The standard combines, in a single standard, the disclosure requirements for subsidiaries, associates and joint arrangements, as well as unconsolidated structured entities. The required disclosures aim to provide information to enable users to evaluate the nature of, and risks associated with, an entity’s interests in other entities and the effects of those interests on the entity’s financial position, performance and cash flows.
The adoption of the new standard is expected to increase the level of disclosure provided for the entity’s interests in subsidiaries and joint arrangements.
aCCOuNTiNg policies continued

97
• Amendments to IFRS 10, IFRS 12 and IAS 27 – Investment activitiesThe amendments will be effective for the Group’s year ending 30 June 2015 and provide clarity that a qualifying investment entity is required to account for investments in controlled entities, as well as investments in associates and joint ventures, at fair value through profit or loss. The mandatory consolidation exemption applies to subsidiaries that are considered an extension of the investment entity’s investment activities.
Management has not assessed the impact of the new standard.
• IFRS 13 – Fair Value MeasurementIFRS 13 will be adopted by the Group for the first time for the year ending 30 June 2014 and will be applied prospectively with the restatement of comparatives not required.
The standard introduces a single source of guidance on fair value measurement for both financial and non-financial assets and liabilities by defining fair value, establishing a framework for measuring fair value and setting out disclosure requirements for fair value measurements. The key principles in IFRS 13 are as follows:– Fair value is an exit price.– Measurement considers characteristics of the asset or liability and not entity-specific characteristics.– Measurement assumes a transaction in the entity’s principal (or most advantageous) market between market
participants.– Price is not adjusted for transaction costs.– Measurement maximises the use of relevant observable inputs and minimises the use of unobservable inputs.– The three-level fair value hierarchy is extended to all fair value measurements.
Management is currently assessing the impact of the new standard.
Non-applicable standards, amendments and interpretationsThe other remaining standards, amendments and interpretations issued but not yet effective have been assessed for applicability to the Group and management has concluded that they are not applicable to the business of the Group and will therefore have no impact on future financial statements.
OV
ER
VIE
WB
USIN
ESS R
EV
IEW
GO
VE
RN
AN
CE
AN
NU
AL FIN
AN
CIA
L STATE
ME
NTS
SHA
RE
HO
LDE
R IN
FOR
MA
TION

98
balaNCE sheets
Group Company
As at 30 June 2013 Notes2013R’m
2012R’m
2013R’m
2012R’m
ASSETS Non-current assets Property, plant and equipment 1 2 088,2 1 756,9 – –Intangible assets and goodwill 2 1 145,6 748,6 – –Investments in subsidiaries 38, 39 – – 1 881,5 1 338,8 Investment in joint venture 40 355,4 318,4 – –Group share scheme recharge receivable 35, 4 – – 8,4 30,1 Other investments and long-term receivables 41 19,7 10,0 191,7 184,4 Deferred taxation 3 45,4 47,2 – –
3 654,3 2 881,1 2 081,6 1 553,3
Current assets Inventories 4 1 205,9 992,1 – –Biological assets 5 64,8 49,9 – –Derivatives 57,3 25,7 – –Current tax assets 35,2 31,6 – –Trade and other receivables 6 1 333,3 1 258,3 548,5 1 009,3 Cash and cash equivalents 212,4 242,1 – 0,4 Assets classified as held-for-sale 7 5,6 49,1 – 57,3
2 914,5 2 648,8 548,5 1 067,0
Total assets 6 568,8 5 529,9 2 630,1 2 620,3
EQUITY AND LIABILITIES Capital and reserves Share capital 8 17,0 17,0 17,1 17,1 Share premium 8 12,5 12,5 185,1 77,1 Treasury shares 8 (538,2) (621,2) – –Treasury share loan to subsidiary – – (149,7) (216,8)Premium on transactions with non-controlling interests (2,7) (2,7) – –Reserves 9 311,7 225,9 140,8 127,4 Retained earnings 3 877,3 3 983,6 2 418,2 2 598,2 Non-controlling interest – (17,8) – –
Total equity 3 677,6 3 597,3 2 611,5 2 603,0
Non-current liabilities Financial liabilities and borrowings 10 – 4,0 – –Employee benefits 11 347,9 349,7 – –Operating lease straight-line liability 12 16,1 11,7 – –Other long-term liabilities 36 – – 15,5 –Deferred taxation 3 240,3 90,9 – –
604,3 456,3 15,5 –
Current liabilities Current borrowings 13 893,5 63,2 – –Other financial liabilities including derivatives 14 38,9 16,0 – –Trade and other payables 15 1 336,8 1 322,7 3,1 17,3 Corporate taxation 17,5 15,3 – –Liabilities classified as held-for-sale 7 0,2 59,1 – –
2 286,9 1 476,3 3,1 17,3
Total equity and liabilities 6 568,8 5 529,9 2 630,1 2 620,3

99
STaTEmENTS of comprehensive income
Group Company
For the year ended 30 June 2013 Notes2013R’m
2012R’m
2013R’m
2012R’m
CONTINUING OPERATIONS Revenue 16 9 218,3 8 287,1 – –Cost of sales 5 110,5 4 524,3 – –
Gross profit 4 107,8 3 762,8 – –Selling and administrative expenses 2 581,6 2 390,3 6,3 10,3
Operating profit/(loss) before capital items 17 1 526,2 1 372,5 (6,3) (10,3)Income from investments 18 10,4 13,8 1 156,9 892,7 Finance costs 19 63,1 28,1 3,0 0,7 Share of equity-accounted profit of joint ventures 20 23,9 46,8 – –Capital items 21 (4,6) (13,8) 13,8 44,4
Profit before taxation 1 492,8 1 391,2 1 161,4 926,1 Taxation 22 448,6 443,6 – 15,7
Profit from continuing operations 1 044,2 947,6 1 161,4 910,4
DISCONTINUED OPERATIONS Revenue 16 33,6 146,2 – –
Operating profit before capital items 0,6 8,1 – –Income from investments 18 0,5 2,2 – –Finance costs 19 0,6 2,5 – –Capital items 21 41,1 27,4 – –
Profit before taxation 41,6 35,2 – –Taxation 22 – 10,3 – –
Profit from discontinued operations 41,6 24,9 – –
Profit for the year 1 085,8 972,5 1 161,4 910,4
Other comprehensive income, net of tax: 53,5 100,9 – –Foreign currency translation differences 48,5 59,7 – –Actuarial gain recognised 6,4 32,7 – –Cash flow hedging reserve 0,7 24,4 – –Income tax on other comprehensive income (2,1) (15,9) – –
Total comprehensive income for the year 1 139,3 1 073,4 1 161,4 910,4
Profit attributable to: Owners of AVI 1 085,7 970,5 Non-controlling interest 0,1 2,0
1 085,8 972,5
Total comprehensive income attributable to: Owners of AVI 1 139,2 1 071,4 Non-controlling interest 0,1 2,0
1 139,3 1 073,4
Basic earnings per share from continuing operations (cents) 32 340,1 316,7
Diluted earnings per share from continuing operations (cents) 32 325,5 302,0
Basic earnings per share from total operations (cents) 32 353,6 324,3
Diluted earnings per share from total operations (cents) 32 338,4 309,3
Details of the headline earnings and dividends declared per ordinary share are given in Notes 32 and 33 to the financial statements on pages 128 to 130.
Discontinued operations comprise the fresh fruit juice manufacturing business of Real Juice which was disposed of with effect from 1 October 2012 and the fresh, canned and value-added mushroom business conducted by Denny, which was disposed of with effect from 1 July 2011.
OV
ER
VIE
WB
USIN
ESS R
EV
IEW
GO
VE
RN
AN
CE
AN
NU
AL FIN
AN
CIA
L STATE
ME
NTS
SHA
RE
HO
LDE
R IN
FOR
MA
TION
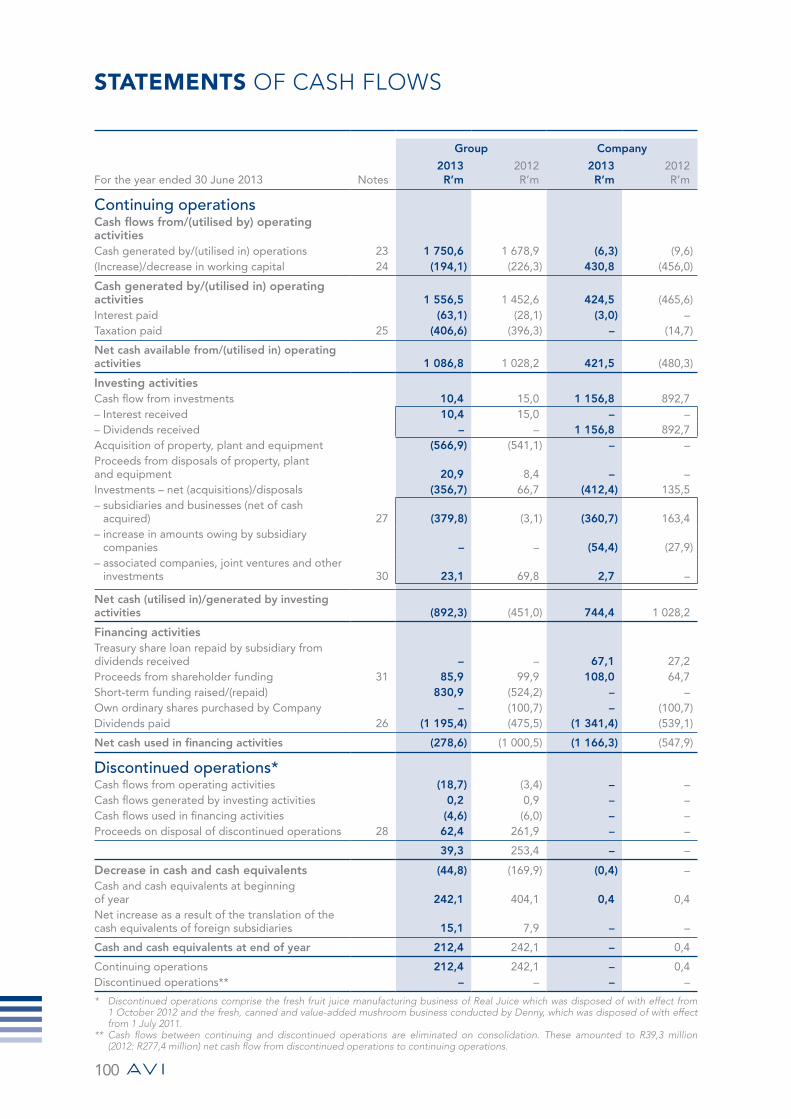
100
STaTEmENTS of cash floWs
Group Company
For the year ended 30 June 2013 Notes2013R’m
2012R’m
2013R’m
2012R’m
continuing operations Cash flows from/(utilised by) operating activities Cash generated by/(utilised in) operations 23 1 750,6 1 678,9 (6,3) (9,6)(Increase)/decrease in working capital 24 (194,1) (226,3) 430,8 (456,0)
Cash generated by/(utilised in) operating activities 1 556,5 1 452,6 424,5 (465,6)Interest paid (63,1) (28,1) (3,0) –Taxation paid 25 (406,6) (396,3) – (14,7)
Net cash available from/(utilised in) operating activities 1 086,8 1 028,2 421,5 (480,3)
Investing activities Cash flow from investments 10,4 15,0 1 156,8 892,7 – Interest received 10,4 15,0 – –– Dividends received – – 1 156,8 892,7 Acquisition of property, plant and equipment (566,9) (541,1) – –Proceeds from disposals of property, plant and equipment 20,9 8,4 – –Investments – net (acquisitions)/disposals (356,7) 66,7 (412,4) 135,5 – subsidiaries and businesses (net of cash
acquired) 27 (379,8) (3,1) (360,7) 163,4 – increase in amounts owing by subsidiary
companies – – (54,4) (27,9)– associated companies, joint ventures and other
investments 30 23,1 69,8 2,7 –
Net cash (utilised in)/generated by investing activities (892,3) (451,0) 744,4 1 028,2
Financing activities Treasury share loan repaid by subsidiary from dividends received – – 67,1 27,2 Proceeds from shareholder funding 31 85,9 99,9 108,0 64,7 Short-term funding raised/(repaid) 830,9 (524,2) – –Own ordinary shares purchased by Company – (100,7) – (100,7)Dividends paid 26 (1 195,4) (475,5) (1 341,4) (539,1)
Net cash used in financing activities (278,6) (1 000,5) (1 166,3) (547,9)
discontinued operations* Cash flows from operating activities (18,7) (3,4) – –Cash flows generated by investing activities 0,2 0,9 – –Cash flows used in financing activities (4,6) (6,0) – –Proceeds on disposal of discontinued operations 28 62,4 261,9 – –
39,3 253,4 – –
Decrease in cash and cash equivalents (44,8) (169,9) (0,4) –Cash and cash equivalents at beginning of year 242,1 404,1 0,4 0,4 Net increase as a result of the translation of the cash equivalents of foreign subsidiaries 15,1 7,9 – –
Cash and cash equivalents at end of year 212,4 242,1 – 0,4
Continuing operations 212,4 242,1 – 0,4 Discontinued operations** – – – –
* Discontinued operations comprise the fresh fruit juice manufacturing business of Real Juice which was disposed of with effect from 1 October 2012 and the fresh, canned and value-added mushroom business conducted by Denny, which was disposed of with effect from 1 July 2011.
** Cash flows between continuing and discontinued operations are eliminated on consolidation. These amounted to R39,3 million (2012: R277,4 million) net cash flow from discontinued operations to continuing operations.

101
STaTEmENTS of changes in eQuity
For the year ended 30 June 2013
Share capital
and premium
R’m
Treasury shares
R’mReserves
R’m
Retained earnings
R’m
Premium on trans-
actions with non-
control-ling
interestR’m
TotalR’m
Non-control-
ling interest
R’m
Total equity
R’m
GROUP Balance at beginning of year 29,5 (621,2) 225,9 3 983,6 (2,7) 3 615,1 (17,8) 3 597,3 total comprehensive income for the year Profit for the year – – – 1 085,7 – 1 085,7 0,1 1 085,8 other comprehensive income Foreign currency translation differences – – 48,5 – – 48,5 – 48,5 Actuarial gains recognised, net of tax – – 4,6 – – 4,6 – 4,6 Cash flow hedging reserve, net of tax – – 0,4 – – 0,4 – 0,4
Total other comprehensive income for the year – – 53,5 – – 53,5 – 53,5
Total comprehensive income for the year – – 53,5 1 085,7 – 1 139,2 0,1 1 139,3
transactions with owners recorded directly in equity Contribution by and distribution to owners Share-based payments – – 13,4 – – 13,4 – 13,4 Group share scheme recharge – – 18,9 – – 18,9 – 18,9 Dividends paid – – – (1 195,4) – (1 195,4) – (1 195,4)Own ordinary shares sold by Company’s share trusts – 83,0 – 3,4 – 86,4 – 86,4
Total contribution by and distribution to owners – 83,0 32,3 (1 192,0) – (1 076,7) – (1 076,7)
changes in ownership interests in subsidiaries Disposal of Real Juice – – – – – – 17,7 17,7
Total transactions with owners – 83,0 32,3 (1 192,0) – (1 076,7) 17,7 (1 059,0)
Balance at end of year 29,5 (538,2) 311,7 3 877,3 (2,7) 3 677,6 – 3 677,6
Share capital
and premium
R’m
Treasury share loan*R’m
ReservesR’m
Retained earnings
R’mTotalR’m
COMPANY Balance at beginning of year 94,2 (216,8) 127,4 2 598,2 2 603,0 total comprehensive income for the year Profit for the year – – – 1 161,4 1 161,4 transactions with owners recorded directly in equity contribution by and distribution to owners Share-based payments – – 13,4 – 13,4 Dividends paid – – – (1 341,4) (1 341,4)Issue of ordinary shares 108,0 – – – 108,0 Amounts repaid by subsidiary from dividends received – 67,1 – – 67,1
Total transactions with owners 108,0 67,1 13,4 (1 341,4) (1 152,9)
Balance at end of year 202,2 (149,7) 140,8 2 418,2 2 611,5
* Loan to subsidiary to acquire treasury shares to be repaid primarily by the delivery of such shares and therefore classified as an equity instrument.
OV
ER
VIE
WB
USIN
ESS R
EV
IEW
GO
VE
RN
AN
CE
AN
NU
AL FIN
AN
CIA
L STATE
ME
NTS
SHA
RE
HO
LDE
R IN
FOR
MA
TION

102
STaTEmENTS of changes in eQuity continued
For the year ended 30 June 2012
Share capital
and premium
R’m
Treasury shares
R’m Reserves
R’m
Retained earnings
R’m
Premium on trans-
actions with non-
control-ling
interest R’m
Total R’m
Non-control-
ling interest
R’m
Total equity
R’m
GROUP Balance at beginning of year 29,5 (707,8) 72,4 3 475,3 (2,7) 2 866,7 (19,8) 2 846,9 total comprehensive income for the year Profit for the year – – – 970,5 – 970,5 2,0 972,5 other comprehensive income –Foreign currency translation differences – – 59,7 – – 59,7 – 59,7 Actuarial gains recognised, net of tax – – 23,6 – – 23,6 – 23,6 Cash flow hedging reserve, net of tax – – 17,6 – – 17,6 – 17,6
Total other comprehensive income for the year – – 100,9 – – 100,9 – 100,9
Total comprehensive income for the year – – 100,9 970,5 – 1 071,4 2,0 1 073,4
transactions with owners recorded directly in equity contribution by and distribution to owners Share-based payments – – 18,1 – – 18,1 – 18,1 Group share scheme recharge – – 34,5 – – 34,5 – 34,5 Dividends paid – – – (475,5) – (475,5) – (475,5)Own ordinary shares sold by Company’s share trusts – 86,6 – 13,3 – 99,9 – 99,9
Total transactions with owners – 86,6 52,6 (462,2) – (323,0) – (323,0)
Balance at end of year 29,5 (621,2) 225,9 3 983,6 (2,7) 3 615,1 (17,8) 3 597,3
Share capital
and premium
R’m
Treasury share loan* R’m
Reserves R’m
Retained earnings
R’m Total R’m
COMPANY Balance at beginning of year 29,5 (244,0) 109,3 2 226,9 2 121,7 total comprehensive income for the year Profit for the year – – – 910,4 910,4 transactions with owners recorded directly in equity contribution by and distribution to owners Share-based payments – – 18,1 – 18,1 Dividends paid – – – (539,1) (539,1)Issue of ordinary shares 64,7 – – – 64,7 Amounts repaid by subsidiary from dividends received – 27,2 – – 27,2
Total transactions with owners 64,7 27,2 18,1 (539,1) (429,1)
Balance at end of year 94,2 (216,8) 127,4 2 598,2 2 603,0
* Loan to subsidiary to acquire treasury shares to be repaid primarily by the delivery of such shares and therefore classified as an equity instrument.

103
NOTES to the annual financial statements
Group 2013
LandR’m
BuildingsR’m
Plant and
machineryR’m
Motor vehicles, furniture
and equip-ment
R’mVessels
R’m
Equip-ment
subject to
finance leases
R’mTotalR’m
1. Property, plant and equipmentCost At beginning of year 79,0 417,3 1 469,4 931,7 444,4 0,4 3 342,2 Additions 8,5 80,1 317,9 128,3 32,1 – 566,9 Disposals (0,9) (9,8) (66,9) (50,7) (31,3) – (159,6)Effect of movement in exchange rates – 0,2 0,5 1,1 – – 1,8 Applicable to business purchased – 28,8 17,6 28,7 – – 75,1 Transfer to assets held-for-sale – – – – – – –
At end of year 86,6 516,6 1 738,5 1 039,1 445,2 0,4 3 826,4
Accumulated depreciation and impairment chargesAt beginning of year – 77,0 726,8 514,9 266,2 0,4 1 585,3 Disposals – (4,9) (61,7) (43,1) (29,2) – (138,9)Effect of movement in exchange rates – 0,1 – 0,8 – – 0,9 Reclassification of assets – 0,2 – (0,2) – – –Applicable to subsidiary sold – – 8,0 23,0 – – 31,0 Depreciation charge for the year – 11,7 96,9 116,2 31,5 – 256,3 Impairment charge for the year – – 2,6 1,0 – – 3,6
At end of year – 84,1 772,6 612,6 268,5 0,4 1 738,2
Net carrying value At beginning of previous year 82,0 293,0 572,3 321,0 190,9 0,3 1 459,5 At end of previous year 79,0 340,3 742,6 416,8 178,2 – 1 756,9
At end of current year 86,6 432,5 965,9 426,5 176,7 – 2 088,2
OV
ER
VIE
WB
USIN
ESS R
EV
IEW
GO
VE
RN
AN
CE
AN
NU
AL FIN
AN
CIA
L STATE
ME
NTS
SHA
RE
HO
LDE
R IN
FOR
MA
TION
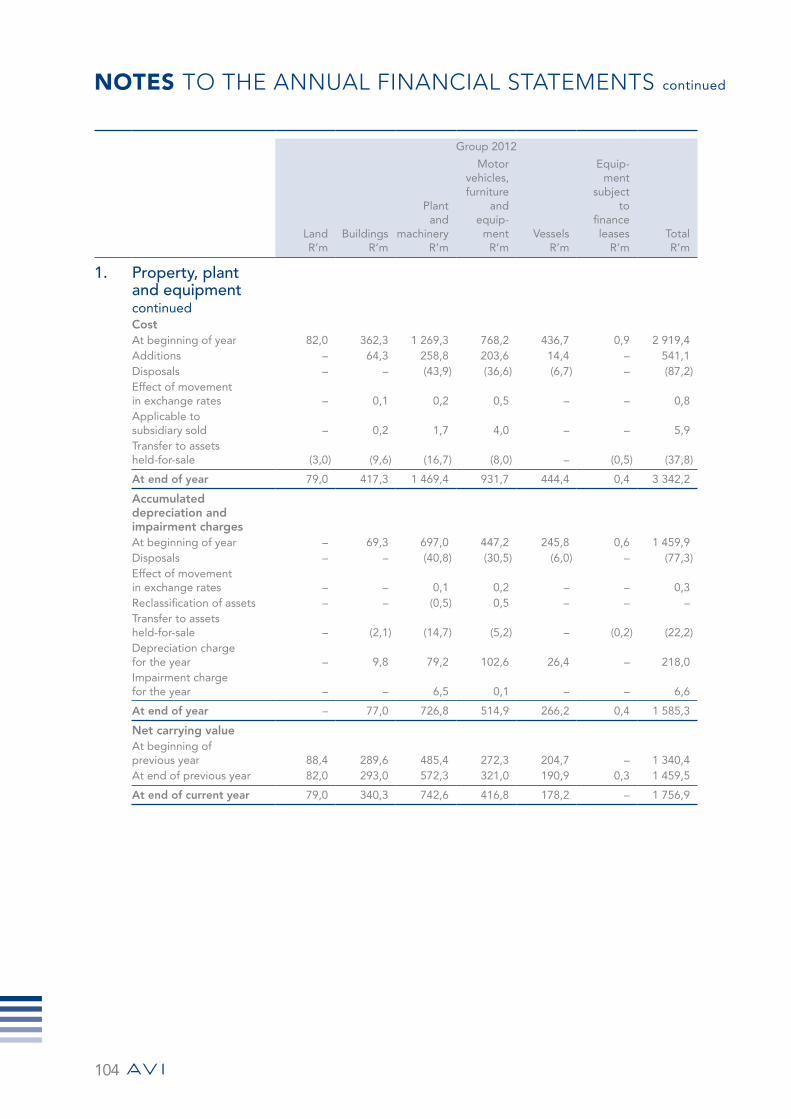
NOTES TO THE ANNUAL FINANCIAL STATEMENTS continued
104
Group 2012
LandR’m
BuildingsR’m
Plant and
machineryR’m
Motor vehicles, furniture
and equip-
mentR’m
VesselsR’m
Equip-ment
subject to
finance leases
R’mTotalR’m
1. Property, plant and equipment continuedCost At beginning of year 82,0 362,3 1 269,3 768,2 436,7 0,9 2 919,4 Additions – 64,3 258,8 203,6 14,4 – 541,1 Disposals – – (43,9) (36,6) (6,7) – (87,2)Effect of movement in exchange rates – 0,1 0,2 0,5 – – 0,8 Applicable to subsidiary sold – 0,2 1,7 4,0 – – 5,9 Transfer to assets held-for-sale (3,0) (9,6) (16,7) (8,0) – (0,5) (37,8)
At end of year 79,0 417,3 1 469,4 931,7 444,4 0,4 3 342,2
Accumulated depreciation and impairment chargesAt beginning of year – 69,3 697,0 447,2 245,8 0,6 1 459,9 Disposals – – (40,8) (30,5) (6,0) – (77,3)Effect of movement in exchange rates – – 0,1 0,2 – – 0,3 Reclassification of assets – – (0,5) 0,5 – – –Transfer to assets held-for-sale – (2,1) (14,7) (5,2) – (0,2) (22,2)Depreciation charge for the year – 9,8 79,2 102,6 26,4 – 218,0 Impairment charge for the year – – 6,5 0,1 – – 6,6
At end of year – 77,0 726,8 514,9 266,2 0,4 1 585,3
Net carrying value At beginning of previous year 88,4 289,6 485,4 272,3 204,7 – 1 340,4 At end of previous year 82,0 293,0 572,3 321,0 190,9 0,3 1 459,5
At end of current year 79,0 340,3 742,6 416,8 178,2 – 1 756,9
105
1. Property, plant and equipment continued
2013 R’m
2012 R’m
Land comprises:
Freehold 86,6 79,0
During the year ended 30 June 2013 the Group’s Footwear and Apparel segment conducted a review of the useful life of furniture and equipment forming part of its Walnut stores. Given the hard-wearing nature of the furniture and equipment, the useful life was extended from six years to seven years. The effect of this change on the depreciation expenses, recognised in selling and administrative expenses, in the current and future periods is as follows:
2013 R’m
2014 R’m
2015 R’m
2016 R’m
2016 and there-after R’m
(Decrease)/increase in depreciation expense (4,1) (1,5) 1,1 1,5 3,0
• The current estimated useful lives of property, plant and equipment are reflected under accounting policies on page 93.
• Expenditure on property, plant and equipment in the course of construction and included above at 30 June 2013 was R243,7 million (2012: R181,2 million).
• The original cost of fully depreciated plant and equipment that was still in use at 30 June 2013 was R754,3 million (2012: R676,5 million).
• Property, plant and equipment, with a carrying value of Rnil million (2012: R24,0 million) has been ceded as security for interest-bearing borrowings.
• Impairment losses during the year arose due to identified obsolescence on, damage to and underperformance of items of plant, machinery and equipment.
• A register containing details of properties is available for inspection by shareholders or their duly authorised agents during business hours at the registered office of the Company.
• The transfer of assets to held-for-sale in the prior year resulted from the reclassification of Real Juice to discontinued operations as a result of the agreement concluded for its disposal. The conditions precedent to the transaction were met in September 2012 and consequently the transaction was effective from 1 October 2012. Included in the prior year depreciation charges above is an amount of R1,4 million in respect of Real Juice which was included in the results of discontinued operations last year.
OV
ER
VIE
WB
USIN
ESS R
EV
IEW
GO
VE
RN
AN
CE
AN
NU
AL FIN
AN
CIA
L STATE
ME
NTS
SHA
RE
HO
LDE
R IN
FOR
MA
TION

NOTES TO THE ANNUAL FINANCIAL STATEMENTS continued
106
Group 2013
GoodwillR’m
Fishing rights
R’m
Trademarks and licence agreements
R’m
Customer relation-
ships and
contractsR’m
TotalR’m
2. intangible assets and goodwillCostAt beginning of year 492,6 4,7 286,9 15,3 799,5 Applicable to subsidiary acquired – – 399,7 – 399,7
At end of year 492,6 4,7 686,6 15,3 1 199,2
Accumulated amortisation and impairment chargesAt beginning of year 15,6 1,6 18,4 15,3 50,9 Amortisation charge for the year – 0,3 2,4 – 2,7
At end of year 15,6 1,9 20,8 15,3 53,6
Net carrying value At beginning of previous year 477,0 3,4 271,5 7,5 759,4 At end of previous year 477,0 3,1 268,5 – 748,6
At end of current year 477,0 2,8 665,8 – 1 145,6
Useful livesThe fishing rights are being amortised over the initial quota allocation period of 15 years.
Trademarks comprise well-established growing brands which are considered to have indefinite useful lives and are not amortised. Customer relationships are amortised over a period of two years. Licence agreements and customer contracts are amortised over a period of 10 years.• Trademarks with a carrying value of R30,0 million (2012: R30,0 million) have been ceded as security for interest-
bearing borrowings.

107
Group 2012
GoodwillR’m
Fishing rights
R’m
Trademarks and licence agreements
R’m
Customer relation-
ships and
contractsR’m
TotalR’m
2. intangible assets and goodwill continuedCostAt beginning of year 513,4 4,7 295,4 15,3 828,8 Transfer to assets held-for-sale* (20,8) – (8,5) – (29,3)
At end of year 492,6 4,7 286,9 15,3 799,5
Accumulated depreciation and impairment chargesAt beginning of year 36,4 1,3 23,9 7,8 69,4 Transfer to assets held-for-sale* (20,8) – (8,5) – (29,3)Reclassification of assets – – 0,6 (0,6) –Impairment charge for the year – – – 6,7 6,7 Amortisation charge for the year – 0,3 2,4 1,4 4,1
At end of year 15,6 1,6 18,4 15,3 50,9
Net carrying value At beginning of previous year 596,0 3,6 314,9 8,9 923,4 At end of previous year 477,0 3,4 271,5 7,5 759,4
At end of current year 477,0 3,1 268,5 – 748,6
* The transfer of assets to held-for-sale in 2012 resulted from the reclassification of Real Juice to discontinued operations. As the trademarks transferred had a net book value of Rnil none of the amortisation charge for the 2012 financial year related to Real Juice assets transferred.
OV
ER
VIE
WB
USIN
ESS R
EV
IEW
GO
VE
RN
AN
CE
AN
NU
AL FIN
AN
CIA
L STATE
ME
NTS
SHA
RE
HO
LDE
R IN
FOR
MA
TION
NOTES TO THE ANNUAL FINANCIAL STATEMENTS continued
108
2. intangible assets and goodwill continuedCash-generating units containing goodwill and trademarksThe following units have significant carrying amounts of goodwill and trademarks net of impairment losses:
Group Goodwill Trademarks Total
2013R’m
2012R’m
2013R’m
2012R’m
2013R’m
2012R’m
A&D Spitz 449,2 449,2 69,5 69,5 518,7 518,7 Carvela – – 71,3 71,3 71,3 71,3 Kurt Geiger – – 15,3 15,3 15,3 15,3 Green Cross – – 399,7 – 399,7 –Yardley – – 28,2 28,2 28,2 28,2 Lentheric – – 37,0 37,0 37,0 37,0 House of Coffees 15,3 15,3 33,6 33,6 48,9 48,9 Baker Street Snacks 12,5 12,5 – – 12,5 12,5 Multiple units without significant balances – – 11,2 13,6 11,2 13,6
477,0 477,0 665,8 268,5 1 142,8 745,5
Goodwill arises on the acquisition of assets that did not meet the criteria for recognition as other intangible assets at the date of acquisition.
Impairment testsThe carrying amounts of goodwill and trademarks with an indefinite useful life are reviewed at least annually on the basis of forecast profits of the cash-generating units and forecast sales of branded products. Management forecasts typically cover a three-year period and thereafter a reasonable rate of growth is applied based on market conditions. Goodwill impairment tests are performed using a discounted cash flow model and trademarks on a relief from royalty method. Discount rates used in the discounted cash flow models are based on a weighted average cost of capital of similar businesses in the same sector and of similar size and range between 11,9% and 16,2% (2012: 11,9% and 16,4%) depending on the business’s risk profile. Perpetuity growth rates were set at 5% (2012: 5%). Royalty rates used are determined with reference to industry benchmarks and profitability of products.
Impairment tests were also conducted on other intangible assets with impairment indicators.
Impairment lossesNo impairment losses have been recognised in the current year. The prior year impairment charge of R6,7 million was recognised in respect of a customer supply agreement on which notice had been served.
109
Group Company
2013R’m
2012R’m
2013R’m
2012R’m
3. deferred taxationBalance at beginning of year, being a net liability/(asset) 36,8 17,9 – (1,0)Charge to profit or loss 56,2 66,9 – 1,0 – current year – temporary differences 56,5 69,7 – –– deferred taxation on STC credits – 1,9 – 1,0 – prior year overprovision (0,3) (4,7) – –Disposal of Real Juice 6,9 – – –Disposal of Denny – (28,1) – –Acquisition of Green Cross 112,2 – – –Effect of movement in exchange rates recognised directly in other comprehensive income (0,4) (1,3) – –Reserve movements in respect of actuarial gains recognised directly in other comprehensive income 1,8 9,1 – –
Reserve movements in respect of cash flow hedging recognised directly in other comprehensive income 0,3 6,8 – –Reserve movements in respect of Group share scheme recharge arrangements (18,9) (34,5) – –
Balance at end of year, being a net liability/(asset) 194,9 36,8 – –– Continuing operations 194,9 43,7 – Discontinued operations – (6,9)Balance at end of year comprises: Accelerated capital allowances 192,1 162,1 – –Intangible assets’ temporary differences 177,7 66,1 – –Provisions and other temporary differences: (153,4) (143,6) – –– post-retirement medical aid (100,0) (100,4) – –– leave pay and bonus accruals (41,5) (45,7) – –– other (deductible)/taxable temporary differences (11,9) 2,5 – –Cash flow hedge reserve 4,5 4,2 – –Group share scheme recharge receivable (21,1) (31,6) – –Unused tax losses (4,9) (13,5) – –
194,9 43,7 – –
Deferred taxation is recognised at the following rates: South African operations – 28% (2012: 28%) 195,1 43,4 – –Foreign operations at average rate – 35% (2012: 35%) (0,2) 0,3 – –
194,9 43,7 – –
Reflected as: Deferred taxation asset 45,4 47,2 – –Deferred taxation liability 240,3 90,9 – –
OV
ER
VIE
WB
USIN
ESS R
EV
IEW
GO
VE
RN
AN
CE
AN
NU
AL FIN
AN
CIA
L STATE
ME
NTS
SHA
RE
HO
LDE
R IN
FOR
MA
TION
NOTES TO THE ANNUAL FINANCIAL STATEMENTS continued
110
3. deferred taxation continuedDeferred tax assets recognised on unused tax losses, except as noted below, were recognised as management considered it probable that future taxable profits will be available against which they can be utilised. The probable utilisation of the losses was based on budgeted and forecast results of subsidiary companies within three to five years depending on the stability of the business. The tax losses do not expire under current tax legislation.
Group (continuing operations)
Group (discontinued operations)
2013R’m
2012R’m
2013R’m
2012R’m
The estimated losses which are available for the reduction of future taxable income are: 77,0 103,3 – 128,5 of which has been taken into account in calculating deferred taxation: 17,5 48,2 – 24,6
Shareholders’ interest in the estimated tax losses not yet recognised is therefore: 59,5 55,1 – 103,9
Deferred tax assets have not been recognised in respect of those losses where it is not probable, under current circumstances, that future taxable income will be available to utilise the benefits in the foreseeable future.
The prior year estimated losses available for the reduction of future taxable income under the Group’s discontinued operations were in respect of Real Juice. At 30 June 2012 the deferred taxation asset of R6,9 million was recognised as part of assets held-for-sale.

111
Group Company
2013R’m
2012R’m
2013R’m
2012R’m
4. inventoriesRaw materials 226,5 258,8 – –Consumable stores 91,7 65,6 – –Work in progress 14,9 14,6 – –Manufactured finished goods 498,3 348,6 – –Merchandise – finished goods purchased for resale 374,5 304,5 – –
1 205,9 992,1 – –
5. Biological assets Balance at beginning of year 49,9 38,3 – –Increase due to purchases 30,1 24,3 – –Transferred for processing and sold (60,8) (47,4) – –Gains arising from change in fair value due to physical change 35,0 27,2 – –Losses arising from change in fair value less estimated costs to sell attributable to price changes 3,9 2,1 – –Effect of movement in exchange rates 6,7 5,4 – –
Balance at end of year 64,8 49,9 – –
Number of animals
Number of animals
Standing volume 10 226 353 9 767 850 Volume harvested/sold in current year 2 228 860 1 912 478
Biological assets comprise abalone which is farmed by I&J.
OV
ER
VIE
WB
USIN
ESS R
EV
IEW
GO
VE
RN
AN
CE
AN
NU
AL FIN
AN
CIA
L STATE
ME
NTS
SHA
RE
HO
LDE
R IN
FOR
MA
TION
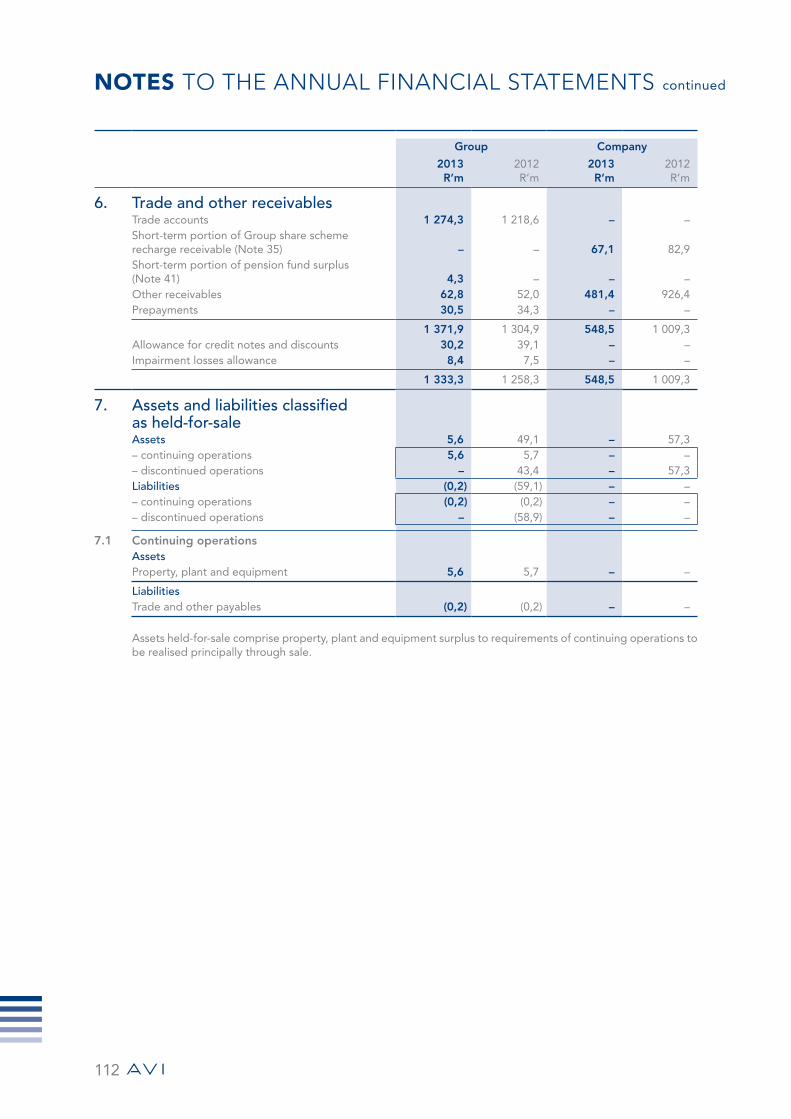
NOTES TO THE ANNUAL FINANCIAL STATEMENTS continued
112
Group Company
2013R’m
2012R’m
2013R’m
2012R’m
6. trade and other receivables Trade accounts 1 274,3 1 218,6 – –Short-term portion of Group share scheme recharge receivable (Note 35) – – 67,1 82,9 Short-term portion of pension fund surplus (Note 41) 4,3 – – –Other receivables 62,8 52,0 481,4 926,4 Prepayments 30,5 34,3 – –
1 371,9 1 304,9 548,5 1 009,3 Allowance for credit notes and discounts 30,2 39,1 – –Impairment losses allowance 8,4 7,5 – –
1 333,3 1 258,3 548,5 1 009,3
7. assets and liabilities classified as held-for-saleassets 5,6 49,1 – 57,3 – continuing operations 5,6 5,7 – –– discontinued operations – 43,4 – 57,3 liabilities (0,2) (59,1) – –– continuing operations (0,2) (0,2) – –– discontinued operations – (58,9) – –
7.1 Continuing operations assets Property, plant and equipment 5,6 5,7 – –
liabilities Trade and other payables (0,2) (0,2) – –
Assets held-for-sale comprise property, plant and equipment surplus to requirements of continuing operations to be realised principally through sale.
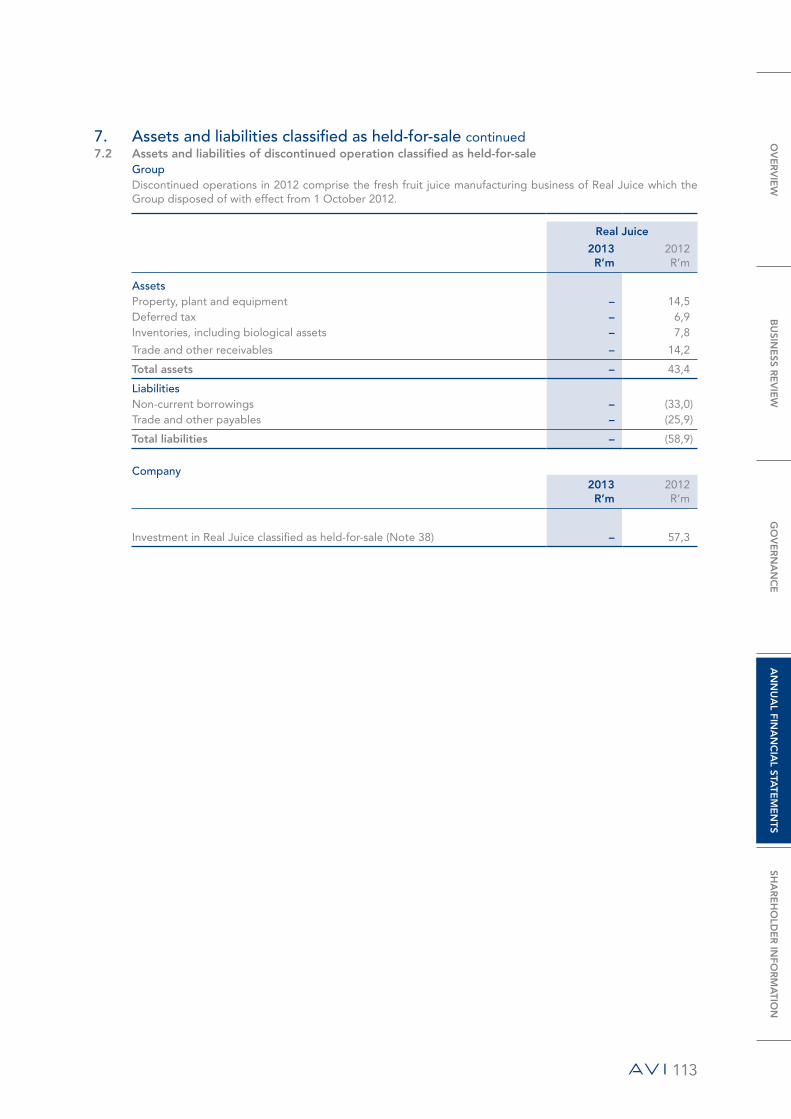
113
7. assets and liabilities classified as held-for-sale continued7.2 Assets and liabilities of discontinued operation classified as held-for-sale
Group Discontinued operations in 2012 comprise the fresh fruit juice manufacturing business of Real Juice which the Group disposed of with effect from 1 October 2012.
Real Juice
2013R’m
2012R’m
assets Property, plant and equipment – 14,5 Deferred tax – 6,9 Inventories, including biological assets – 7,8
Trade and other receivables – 14,2
Total assets – 43,4
liabilities Non-current borrowings – (33,0)Trade and other payables – (25,9)
Total liabilities – (58,9)
company2013R’m
2012R’m
Investment in Real Juice classified as held-for-sale (Note 38) – 57,3
OV
ER
VIE
WB
USIN
ESS R
EV
IEW
GO
VE
RN
AN
CE
AN
NU
AL FIN
AN
CIA
L STATE
ME
NTS
SHA
RE
HO
LDE
R IN
FOR
MA
TION

NOTES TO THE ANNUAL FINANCIAL STATEMENTS continued
114
7. assets and liabilities classified as held-for-sale continued7.3 Results of discontinued operations
The results of the discontinued operations comprise the fresh fruit juice manufacturing business of The Real Juice Co Holdings which the Group disposed of with effect from 1 October 2012 and the fresh, canned and value-added mushroom business conducted by Denny, which was disposed of with effect from 1 July 2011.
30 June 2013 30 June 2012 Real Juice Total Denny Real Juice Total
2013R’m
2013R’m
2012R’m
2012R’m
2012R’m
Revenue 33,6 33,6 – 146,2 146,2 Operating profit before capital items 0,6 0,6 – 8,1 8,1 Income from investments 0,5 0,5 – 2,2 2,2 Finance costs 0,6 0,6 – 2,5 2,5 Capital items 41,1 41,1 27,3 0,1 27,4
Profit before taxation 41,6 41,6 27,3 7,9 35,2 Taxation – – 10,3 – 10,3
Profit from discontinued operations 41,6 41,6 17,0 7,9 24,9
7.4 The Real Juice disposal On 31 May 2012 AVI entered into an agreement with Clover S.A. Proprietary Limited (“Clover”), a subsidiary of Clover Industries Limited, in terms of which 100% of the equity in and shareholders’ loans against The Real Juice Co Holdings Proprietary Limited (“Real Juice”) were disposed of for a consideration of R62,4 million (after adjustments and interest). The conditions precedent to the transaction were fulfilled during September 2012 and consequently the transaction was effective from 1 October 2012. The value of the net assets disposed of at the effective date amounted to R3,8 million and a capital profit of R40,9 million was earned, after derecognising the accumulated non-controlling interest of R17,7 million.
For a detailed analysis of the cash flows pertaining to the disposal of Real Juice refer to Note 28.

115
Group Company
2013R’m
2012R’m
2013R’m
2012R’m
8. share capital and premiumShare capital authorised ordinary share capital 960 000 000 (2012: 960 000 000) ordinary shares of 5 cents each 48,0 48,0 48,0 48,0 Preference share capital 10 000 000 (2012: 10 000 000) convertible redeemable preference shares of 20 cents each 2,0 2,0 2,0 2,0
Total authorised share capital 50,0 50,0 50,0 50,0
issued 343 953 141 (2012: 342 144 990) ordinary shares of 5 cents each 17,0 17,0 17,1 17,1
Total issued share capital 17,0 17,0 17,1 17,1
Share premium Balance at beginning of year 12,5 12,5 77,1 12,5 Premium on issue of ordinary shares – – 108,0 64,6
Balance at end of year 12,5 12,5 185,1 77,1
Total issued share capital and premium 29,5 29,5 202,2 94,2
Share capital and premium recognised at company level 202,2 94,2 Less: Fair value of shares issued to participants of the AVI Out-Performance Scheme during the year* (172,7) (64,7)
Share capital and premium recognised at Group level 29,5 29,5
* The fair value of shares issued to participants is recharged to the respective employer companies on issue but is derecognised at a Group level in order to recognise the fair value of the share issue from a Group perspective.
Group
2013R’m
2012R’m
Treasury shares Balance at beginning of year (621,2) (707,8)Net own ordinary shares sold by the Company’s share trusts and subsidiary during the year 83,0 86,6
Balance at end of year (538,2) (621,2)
Group and Company
2013Number
2012Number
The number of ordinary shares in issue is summarised as follows:
Total issued shares 343 953 141 342 144 990 Less: Shares held by the Company’s share trusts and subsidiary 33 534 744 39 047 108
310 418 397 303 097 882
OV
ER
VIE
WB
USIN
ESS R
EV
IEW
GO
VE
RN
AN
CE
AN
NU
AL FIN
AN
CIA
L STATE
ME
NTS
SHA
RE
HO
LDE
R IN
FOR
MA
TION

NOTES TO THE ANNUAL FINANCIAL STATEMENTS continued
116
Group Company
2013R’m
2012R’m
2013R’m
2012R’m
9. reserves The balance at end of year comprises: Capital redemption reserve fund 3,5 3,5 3,5 3,5 Cash flow hedging reserve 9,9 9,5 – –Actuarial reserve (33,3) (37,9) – –Foreign currency translation reserve 131,0 82,5 – –Share-based payment reserve 200,6 168,3 137,3 123,9
311,7 225,9 140,8 127,4
Capital redemption reserve fundRepresents the fund that was required in terms of the Companies Act, No 61 of 1973, to maintain the capital base of the Company. This was effected by a transfer from retained earnings following the redemption of any preference shares at their par value and has been retained following the release of the Companies Act, No 71 of 2008, as amended.
Cash flow hedging reserveThe reserve represents the Group’s portion of the cumulative net change in the fair value of cash flow hedging instruments relating to hedged transactions falling due in the future.
Actuarial reserveThe reserve comprises the cumulative actuarial gains/losses in respect of the Group’s post-retirement medical aid liability which have been recognised directly in other comprehensive income after taxation. Realisation of this reserve will not be reclassified to profit or loss.
Foreign currency translation reserveThe reserve comprises the cumulative foreign exchange differences arising as a result of the translation of the operations of foreign operations.
Share-based payment reserveThe reserve comprises the fair value of equity instruments granted to Group employees. The fair value of the instrument is measured at grant date using generally accepted valuation techniques after taking into account the terms and conditions upon which the instruments were granted.
Group Company
2013R’m
2012R’m
2013R’m
2012R’m
10. financial liabilities and borrowings Loan secured by cession of rights under an international trademark licensing agreement 4,0 7,5 – –Finance lease liabilities – 4,4 – –
Total secured loans 4,0 11,9 – –Unsecured loans – 33,0 – –
Total borrowings 4,0 44,9 – –Unsecured loans transferred to liabilities classified as held-for-sale (Note 7) – 33,0 – –Amount repayable within one year included in current borrowings (Note 13) 4,0 7,9 – –
– 4,0 – –
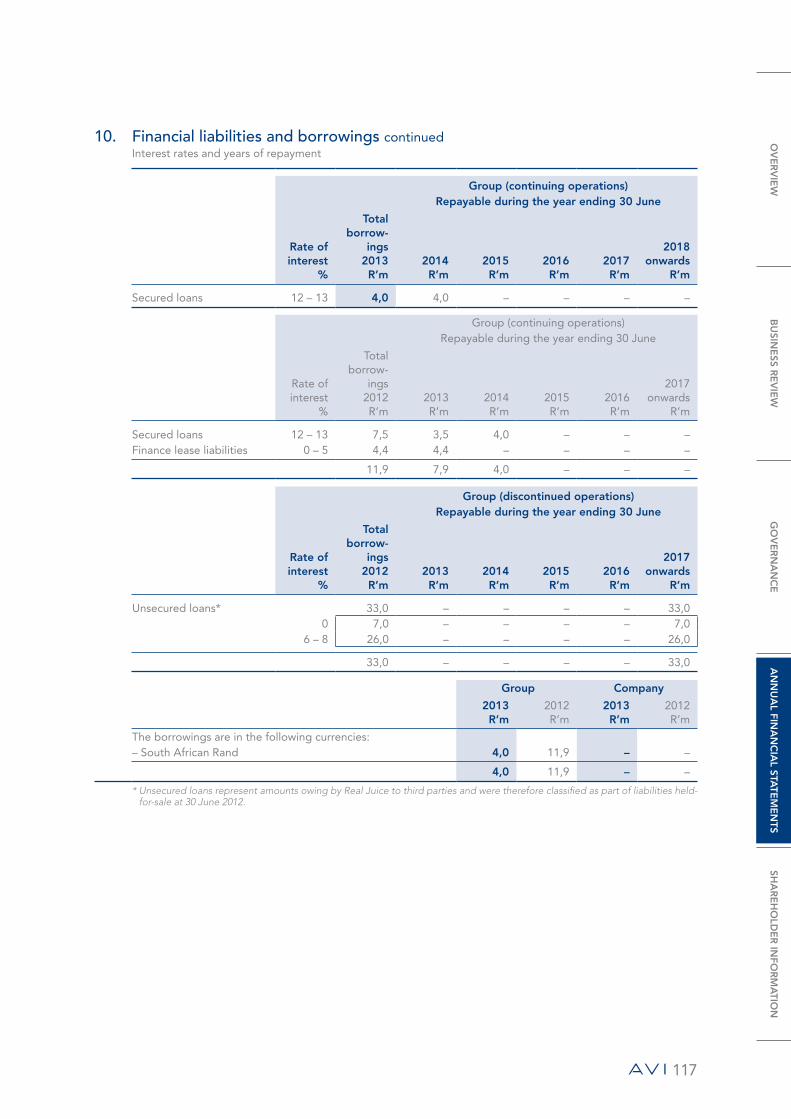
117
10. financial liabilities and borrowings continuedInterest rates and years of repayment
Group (continuing operations) Repayable during the year ending 30 June
Rate of interest
%
Total borrow-
ings 2013R’m
2014 R’m
2015 R’m
2016 R’m
2017 R’m
2018onwards
R’m
Secured loans 12 – 13 4,0 4,0 – – – –
Group (continuing operations) Repayable during the year ending 30 June
Rate of interest
%
Total borrow-
ings 2012R’m
2013 R’m
2014 R’m
2015 R’m
2016 R’m
2017onwards
R’m
Secured loans 12 – 13 7,5 3,5 4,0 – – –Finance lease liabilities 0 – 5 4,4 4,4 – – – –
11,9 7,9 4,0 – – –
Group (discontinued operations) Repayable during the year ending 30 June
Rate of interest
%
Total borrow-
ings 2012R’m
2013 R’m
2014 R’m
2015 R’m
2016 R’m
2017onwards
R’m
Unsecured loans* 33,0 – – – – 33,0 0 7,0 – – – – 7,0
6 – 8 26,0 – – – – 26,0
33,0 – – – – 33,0
Group Company
2013R’m
2012R’m
2013R’m
2012R’m
The borrowings are in the following currencies: – South African Rand 4,0 11,9 – –
4,0 11,9 – –
* Unsecured loans represent amounts owing by Real Juice to third parties and were therefore classified as part of liabilities held-for-sale at 30 June 2012.
OV
ER
VIE
WB
USIN
ESS R
EV
IEW
GO
VE
RN
AN
CE
AN
NU
AL FIN
AN
CIA
L STATE
ME
NTS
SHA
RE
HO
LDE
R IN
FOR
MA
TION
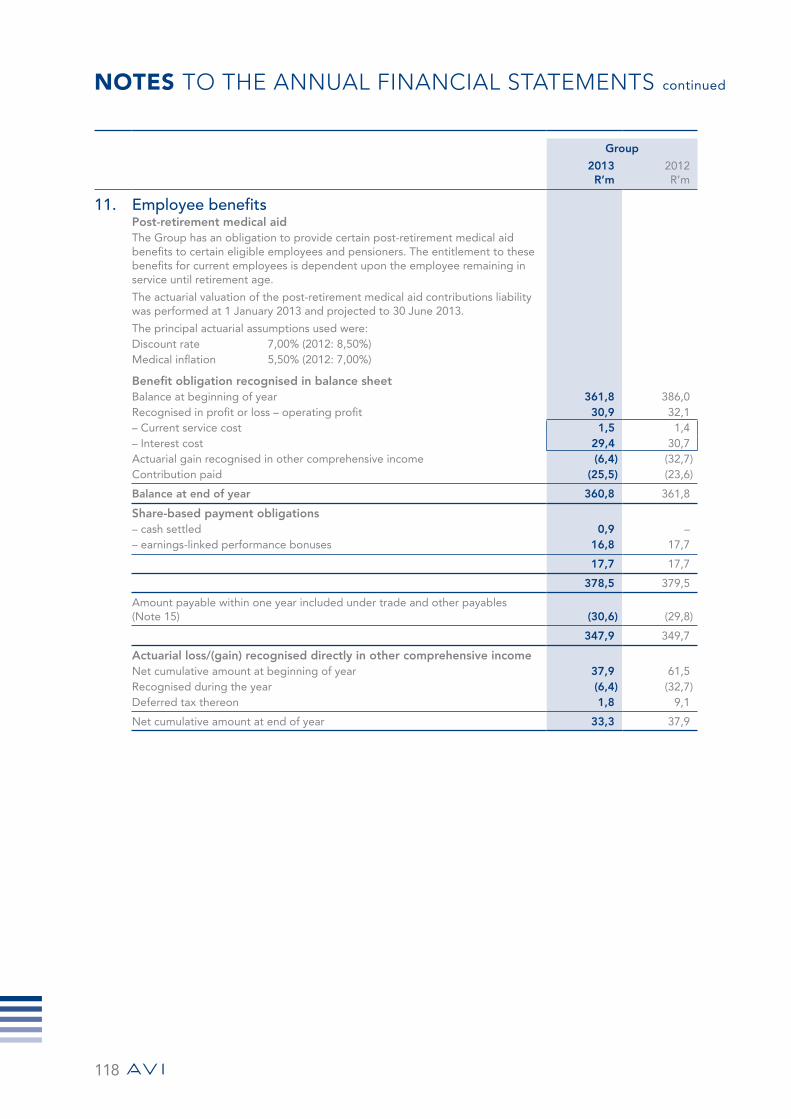
NOTES TO THE ANNUAL FINANCIAL STATEMENTS continued
118
Group
2013R’m
2012R’m
11. employee benefits Post-retirement medical aid The Group has an obligation to provide certain post-retirement medical aid benefits to certain eligible employees and pensioners. The entitlement to these benefits for current employees is dependent upon the employee remaining in service until retirement age.
The actuarial valuation of the post-retirement medical aid contributions liability was performed at 1 January 2013 and projected to 30 June 2013.
The principal actuarial assumptions used were: Discount rate 7,00% (2012: 8,50%) Medical inflation 5,50% (2012: 7,00%)
Benefit obligation recognised in balance sheet Balance at beginning of year 361,8 386,0 Recognised in profit or loss – operating profit 30,9 32,1 – Current service cost 1,5 1,4 – Interest cost 29,4 30,7 Actuarial gain recognised in other comprehensive income (6,4) (32,7)Contribution paid (25,5) (23,6)
Balance at end of year 360,8 361,8
Share-based payment obligations – cash settled 0,9 –– earnings-linked performance bonuses 16,8 17,7
17,7 17,7
378,5 379,5
Amount payable within one year included under trade and other payables (Note 15) (30,6) (29,8)
347,9 349,7
Actuarial loss/(gain) recognised directly in other comprehensive income Net cumulative amount at beginning of year 37,9 61,5 Recognised during the year (6,4) (32,7)Deferred tax thereon 1,8 9,1
Net cumulative amount at end of year 33,3 37,9
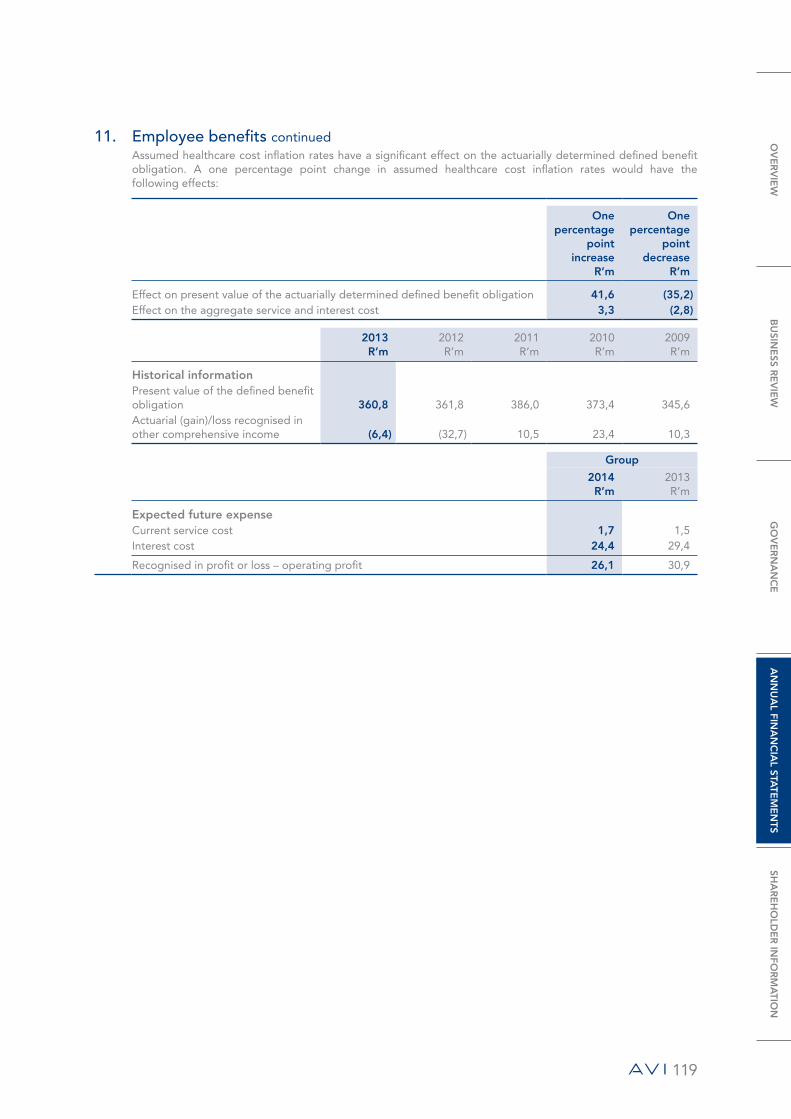
119
11. employee benefits continuedAssumed healthcare cost inflation rates have a significant effect on the actuarially determined defined benefit obligation. A one percentage point change in assumed healthcare cost inflation rates would have the following effects:
One percentage
point increase
R’m
One percentage
point decrease
R’m
Effect on present value of the actuarially determined defined benefit obligation 41,6 (35,2)Effect on the aggregate service and interest cost 3,3 (2,8)
2013 R’m
2012 R’m
2011 R’m
2010 R’m
2009 R’m
historical information Present value of the defined benefit obligation 360,8 361,8 386,0 373,4 345,6 Actuarial (gain)/loss recognised in other comprehensive income (6,4) (32,7) 10,5 23,4 10,3
Group
2014R’m
2013R’m
Expected future expense Current service cost 1,7 1,5 Interest cost 24,4 29,4
Recognised in profit or loss – operating profit 26,1 30,9
OV
ER
VIE
WB
USIN
ESS R
EV
IEW
GO
VE
RN
AN
CE
AN
NU
AL FIN
AN
CIA
L STATE
ME
NTS
SHA
RE
HO
LDE
R IN
FOR
MA
TION
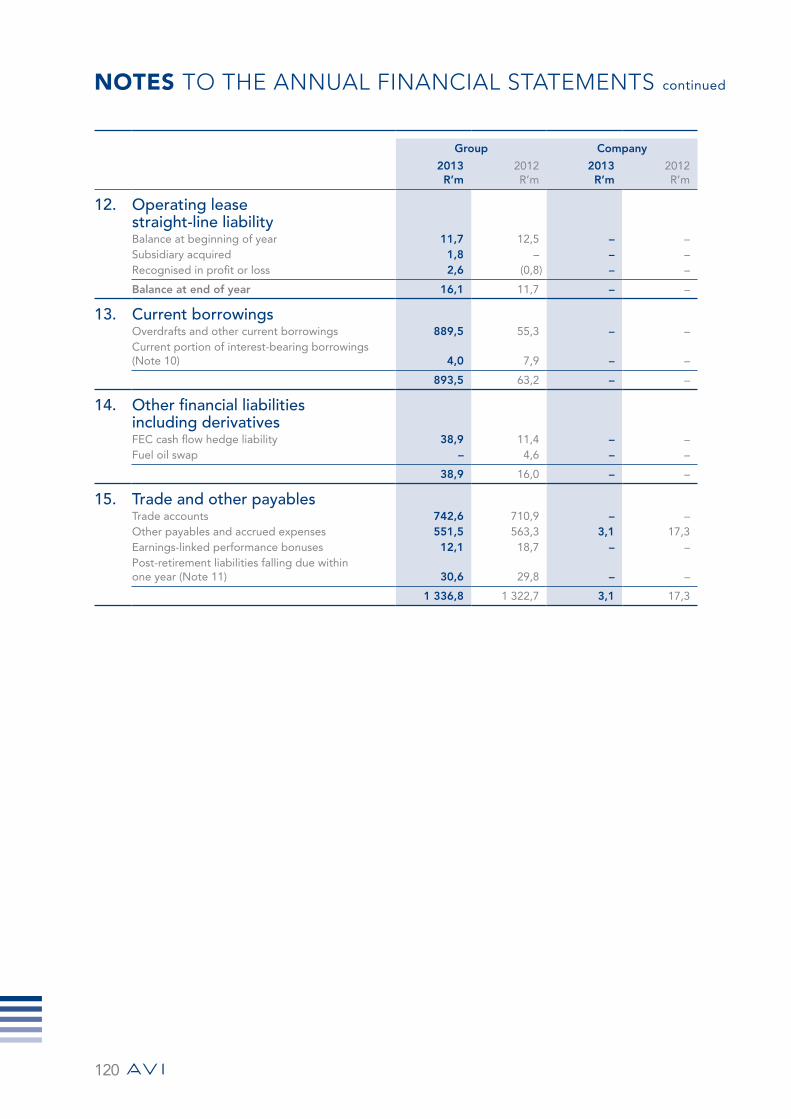
NOTES TO THE ANNUAL FINANCIAL STATEMENTS continued
120
Group Company
2013R’m
2012R’m
2013R’m
2012R’m
12. operating lease straight-line liability Balance at beginning of year 11,7 12,5 – –Subsidiary acquired 1,8 – – –Recognised in profit or loss 2,6 (0,8) – –
Balance at end of year 16,1 11,7 – –
13. current borrowings Overdrafts and other current borrowings 889,5 55,3 – –Current portion of interest-bearing borrowings (Note 10) 4,0 7,9 – –
893,5 63,2 – –
14. other financial liabilities including derivatives FEC cash flow hedge liability 38,9 11,4 – –Fuel oil swap – 4,6 – –
38,9 16,0 – –
15. trade and other payables Trade accounts 742,6 710,9 – –Other payables and accrued expenses 551,5 563,3 3,1 17,3 Earnings-linked performance bonuses 12,1 18,7 – –Post-retirement liabilities falling due within one year (Note 11) 30,6 29,8 – –
1 336,8 1 322,7 3,1 17,3

121
Group
2013R’m
2012R’m
16. revenue Group revenue comprises the following excluding Value Added Tax: – Sale of goods 9 178,4 8 360,1 – Services, fees and royalties 73,5 73,2
9 251,9 8 433,3
9 251,9 8 433,3 Continuing operations 9 218,3 8 287,1 Discontinued operations 33,6 146,2
A segmental and geographical analysis of Group revenue is given on pages 82 and 83 in the segment report.
Group
2013R’m
2012R’m
17. operating profit before capital items – continuing operations In arriving at the operating profit/(loss) before capital items, the following have been taken into account: Amortisation 2,7 4,1 – fishing rights 0,3 0,3 – trademarks 2,4 2,4 – customer relationships – 1,4 Auditors’ remuneration – fees for audit 10,0 9,0 – fees for other services 1,3 1,6 – taxation services and consultations 0,9 1,3 – other 0,4 0,3 Depreciation of property, plant and equipment 256,3 216,6 – buildings 11,7 9,8 – plant, equipment and vehicles 213,1 181,8 – vessels 31,5 26,4 Less: Applicable to discontinued operation – (1,4)Employment costs (Note 35) 1 767,8 1 541,0 Foreign exchange loss/(gain) 7,3 (20,3)Operating lease expenses 161,4 122,2 – property 156,6 116,9 – plant, equipment and vehicles 4,8 5,3 Loss on adjustment of inventory to net realisable value 12,0 4,3 Remuneration for services 45,1 32,6 – administrative, financial, managerial and secretarial fees 24,0 26,6 – technical fees 21,1 6,0 Pension fund surplus income (24,7) –Research and development costs 56,0 50,7
OV
ER
VIE
WB
USIN
ESS R
EV
IEW
GO
VE
RN
AN
CE
AN
NU
AL FIN
AN
CIA
L STATE
ME
NTS
SHA
RE
HO
LDE
R IN
FOR
MA
TION
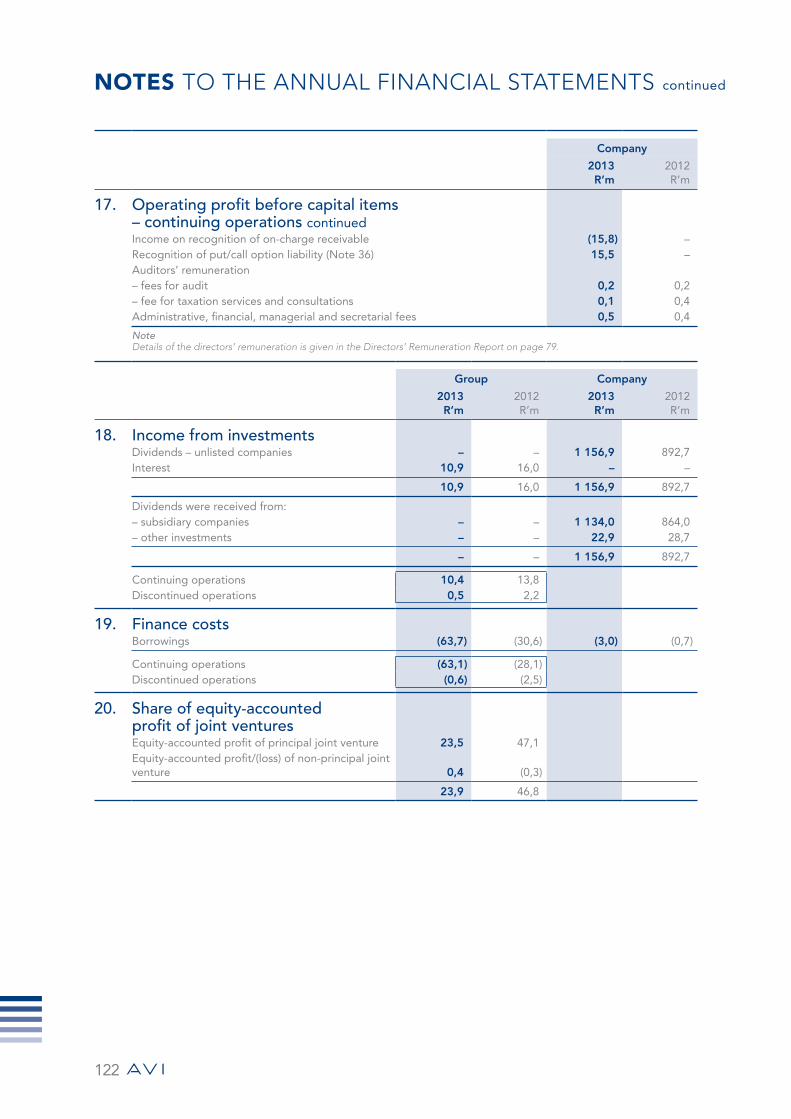
NOTES TO THE ANNUAL FINANCIAL STATEMENTS continued
122
Company
2013R’m
2012R’m
17. operating profit before capital items – continuing operations continuedIncome on recognition of on-charge receivable (15,8) –Recognition of put/call option liability (Note 36) 15,5 –Auditors’ remuneration – fees for audit 0,2 0,2 – fee for taxation services and consultations 0,1 0,4 Administrative, financial, managerial and secretarial fees 0,5 0,4
NoteDetails of the directors’ remuneration is given in the Directors’ Remuneration Report on page 79.
Group Company
2013R’m
2012R’m
2013R’m
2012R’m
18. income from investments Dividends – unlisted companies – – 1 156,9 892,7 Interest 10,9 16,0 – –
10,9 16,0 1 156,9 892,7
Dividends were received from: – subsidiary companies – – 1 134,0 864,0 – other investments – – 22,9 28,7
– – 1 156,9 892,7
Continuing operations 10,4 13,8 Discontinued operations 0,5 2,2
19. finance costsBorrowings (63,7) (30,6) (3,0) (0,7)
Continuing operations (63,1) (28,1)Discontinued operations (0,6) (2,5)
20. share of equity-accounted profit of joint venturesEquity-accounted profit of principal joint venture 23,5 47,1 Equity-accounted profit/(loss) of non-principal joint venture 0,4 (0,3)
23,9 46,8
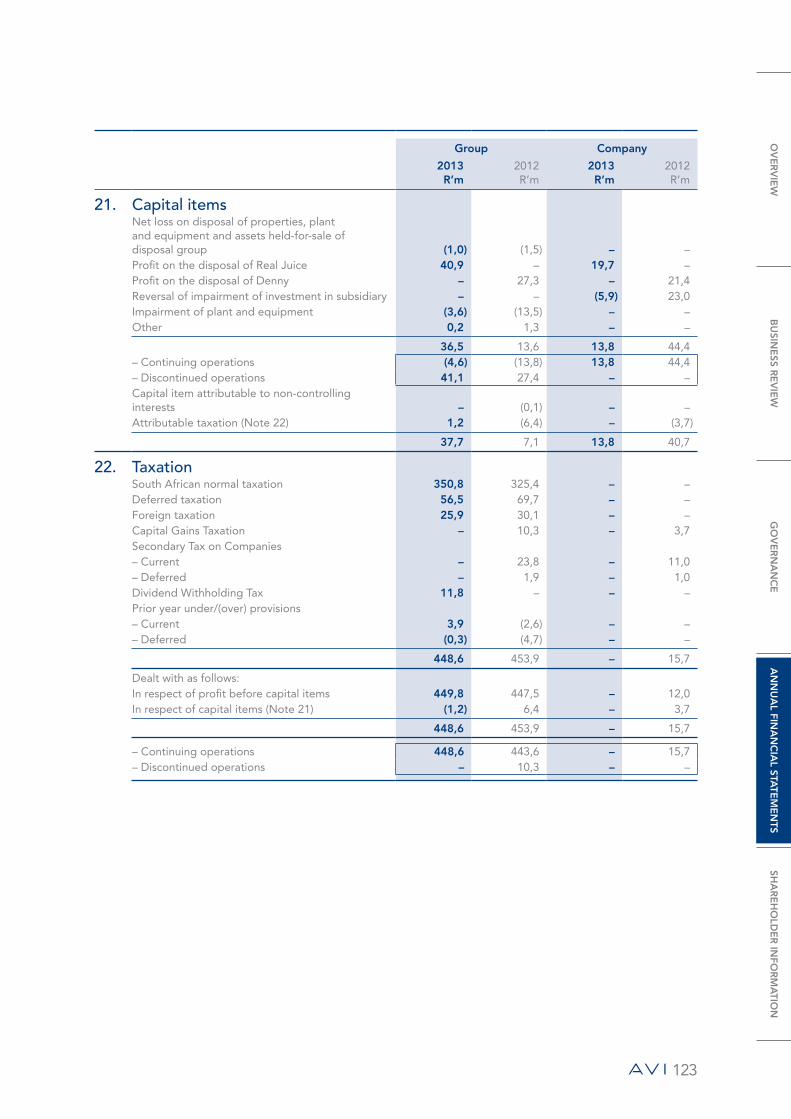
123
Group Company
2013R’m
2012R’m
2013R’m
2012R’m
21. capital items Net loss on disposal of properties, plant and equipment and assets held-for-sale of disposal group (1,0) (1,5) – –Profit on the disposal of Real Juice 40,9 – 19,7 –Profit on the disposal of Denny – 27,3 – 21,4 Reversal of impairment of investment in subsidiary – – (5,9) 23,0 Impairment of plant and equipment (3,6) (13,5) – –Other 0,2 1,3 – –
36,5 13,6 13,8 44,4 – Continuing operations (4,6) (13,8) 13,8 44,4 – Discontinued operations 41,1 27,4 – –Capital item attributable to non-controlling interests – (0,1) – –Attributable taxation (Note 22) 1,2 (6,4) – (3,7)
37,7 7,1 13,8 40,7
22. taxation South African normal taxation 350,8 325,4 – –Deferred taxation 56,5 69,7 – –Foreign taxation 25,9 30,1 – –Capital Gains Taxation – 10,3 – 3,7 Secondary Tax on Companies – Current – 23,8 – 11,0 – Deferred – 1,9 – 1,0 Dividend Withholding Tax 11,8 – – –Prior year under/(over) provisions – Current 3,9 (2,6) – –– Deferred (0,3) (4,7) – –
448,6 453,9 – 15,7
Dealt with as follows: In respect of profit before capital items 449,8 447,5 – 12,0 In respect of capital items (Note 21) (1,2) 6,4 – 3,7
448,6 453,9 – 15,7
– Continuing operations 448,6 443,6 – 15,7 – Discontinued operations – 10,3 – –
OV
ER
VIE
WB
USIN
ESS R
EV
IEW
GO
VE
RN
AN
CE
AN
NU
AL FIN
AN
CIA
L STATE
ME
NTS
SHA
RE
HO
LDE
R IN
FOR
MA
TION
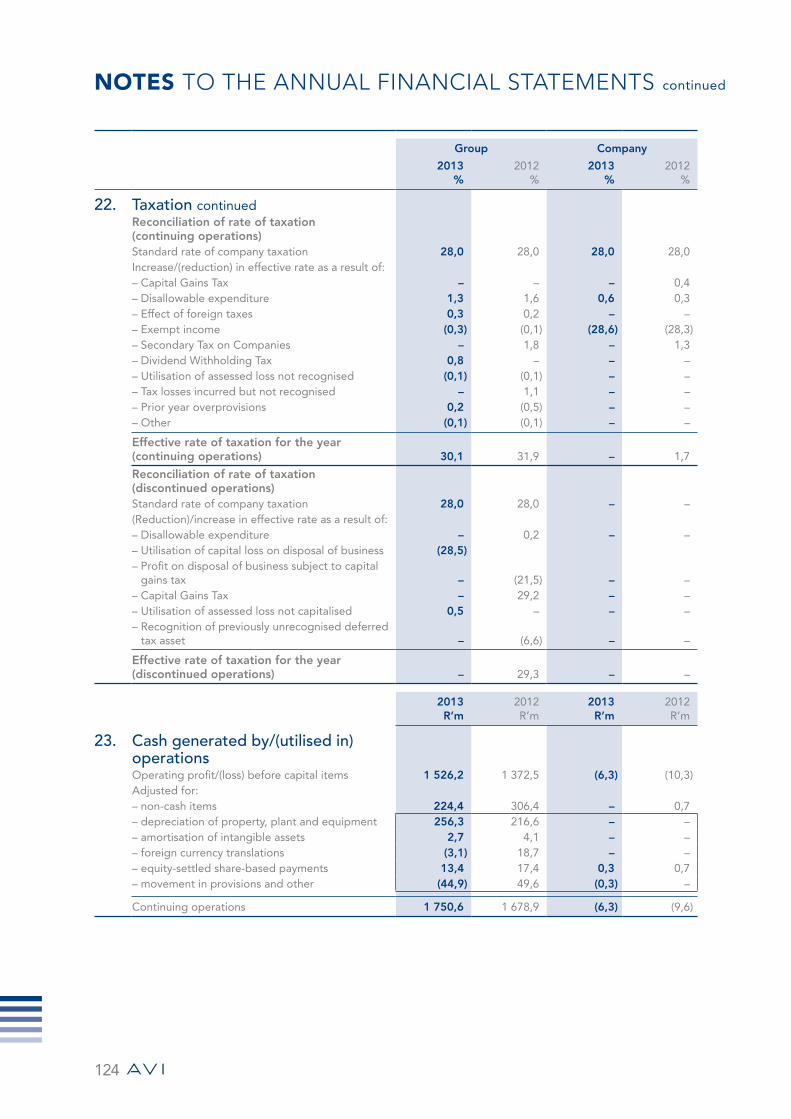
NOTES TO THE ANNUAL FINANCIAL STATEMENTS continued
124
Group Company
2013%
2012%
2013%
2012%
22. taxation continuedReconciliation of rate of taxation (continuing operations) Standard rate of company taxation 28,0 28,0 28,0 28,0 Increase/(reduction) in effective rate as a result of: – Capital Gains Tax – – – 0,4 – Disallowable expenditure 1,3 1,6 0,6 0,3 – Effect of foreign taxes 0,3 0,2 – –– Exempt income (0,3) (0,1) (28,6) (28,3)– Secondary Tax on Companies – 1,8 – 1,3 – Dividend Withholding Tax 0,8 – – –– Utilisation of assessed loss not recognised (0,1) (0,1) – –– Tax losses incurred but not recognised – 1,1 – –– Prior year overprovisions 0,2 (0,5) – –– Other (0,1) (0,1) – –
Effective rate of taxation for the year (continuing operations) 30,1 31,9 – 1,7
Reconciliation of rate of taxation (discontinued operations) Standard rate of company taxation 28,0 28,0 – –(Reduction)/increase in effective rate as a result of: – Disallowable expenditure – 0,2 – –– Utilisation of capital loss on disposal of business (28,5)– Profit on disposal of business subject to capital
gains tax – (21,5) – –– Capital Gains Tax – 29,2 – –– Utilisation of assessed loss not capitalised 0,5 – – –– Recognition of previously unrecognised deferred
tax asset – (6,6) – –
Effective rate of taxation for the year (discontinued operations) – 29,3 – –
2013R’m
2012R’m
2013R’m
2012R’m
23. cash generated by/(utilised in) operations Operating profit/(loss) before capital items 1 526,2 1 372,5 (6,3) (10,3)Adjusted for: – non-cash items 224,4 306,4 – 0,7 – depreciation of property, plant and equipment 256,3 216,6 – –– amortisation of intangible assets 2,7 4,1 – –– foreign currency translations (3,1) 18,7 – –– equity-settled share-based payments 13,4 17,4 0,3 0,7 – movement in provisions and other (44,9) 49,6 (0,3) –
Continuing operations 1 750,6 1 678,9 (6,3) (9,6)
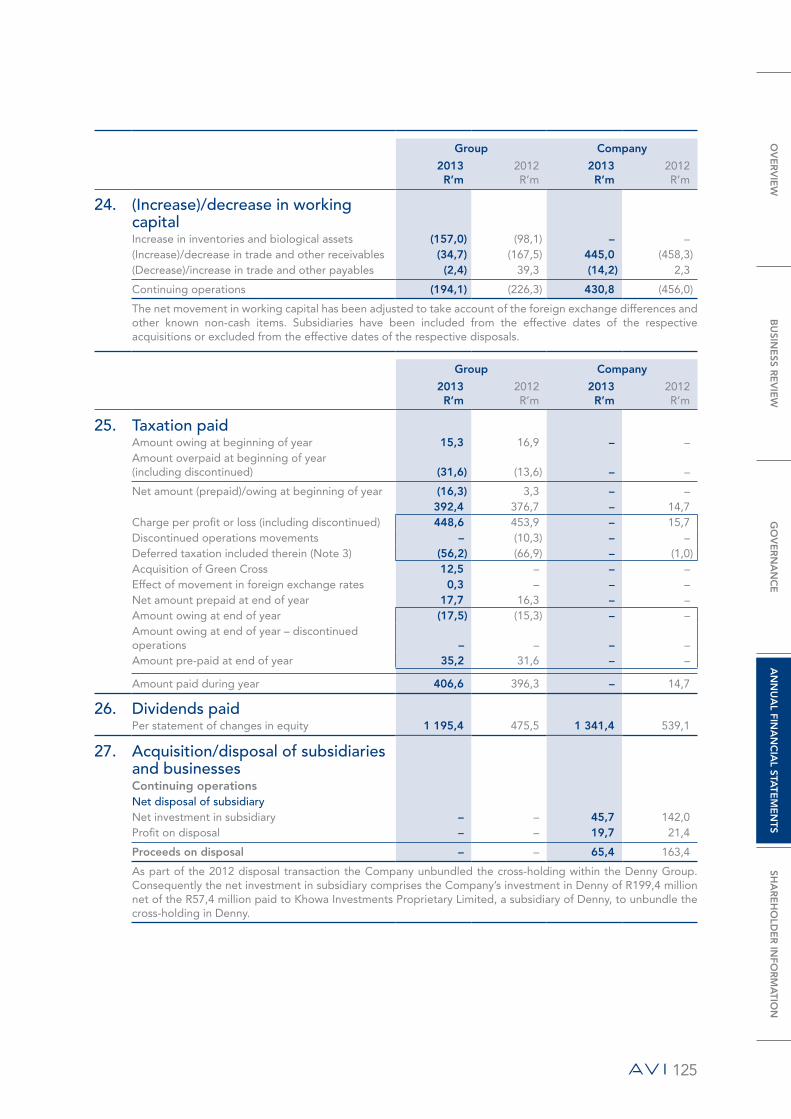
125
Group Company
2013R’m
2012R’m
2013R’m
2012R’m
24. (increase)/decrease in working capital Increase in inventories and biological assets (157,0) (98,1) – –(Increase)/decrease in trade and other receivables (34,7) (167,5) 445,0 (458,3)(Decrease)/increase in trade and other payables (2,4) 39,3 (14,2) 2,3
Continuing operations (194,1) (226,3) 430,8 (456,0)
The net movement in working capital has been adjusted to take account of the foreign exchange differences and other known non-cash items. Subsidiaries have been included from the effective dates of the respective acquisitions or excluded from the effective dates of the respective disposals.
Group Company
2013R’m
2012R’m
2013R’m
2012R’m
25. taxation paid Amount owing at beginning of year 15,3 16,9 – –Amount overpaid at beginning of year (including discontinued) (31,6) (13,6) – –
Net amount (prepaid)/owing at beginning of year (16,3) 3,3 – – 392,4 376,7 – 14,7
Charge per profit or loss (including discontinued) 448,6 453,9 – 15,7 Discontinued operations movements – (10,3) – –Deferred taxation included therein (Note 3) (56,2) (66,9) – (1,0)Acquisition of Green Cross 12,5 – – –Effect of movement in foreign exchange rates 0,3 – – –Net amount prepaid at end of year 17,7 16,3 – –Amount owing at end of year (17,5) (15,3) – –Amount owing at end of year – discontinued operations – – – –Amount pre-paid at end of year 35,2 31,6 – –
Amount paid during year 406,6 396,3 – 14,7
26. dividends paid Per statement of changes in equity 1 195,4 475,5 1 341,4 539,1
27. acquisition/disposal of subsidiaries and businesses Continuing operations net disposal of subsidiary Net investment in subsidiary – – 45,7 142,0 Profit on disposal – – 19,7 21,4
Proceeds on disposal – – 65,4 163,4
As part of the 2012 disposal transaction the Company unbundled the cross-holding within the Denny Group. Consequently the net investment in subsidiary comprises the Company’s investment in Denny of R199,4 million net of the R57,4 million paid to Khowa Investments Proprietary Limited, a subsidiary of Denny, to unbundle the cross-holding in Denny.
OV
ER
VIE
WB
USIN
ESS R
EV
IEW
GO
VE
RN
AN
CE
AN
NU
AL FIN
AN
CIA
L STATE
ME
NTS
SHA
RE
HO
LDE
R IN
FOR
MA
TION
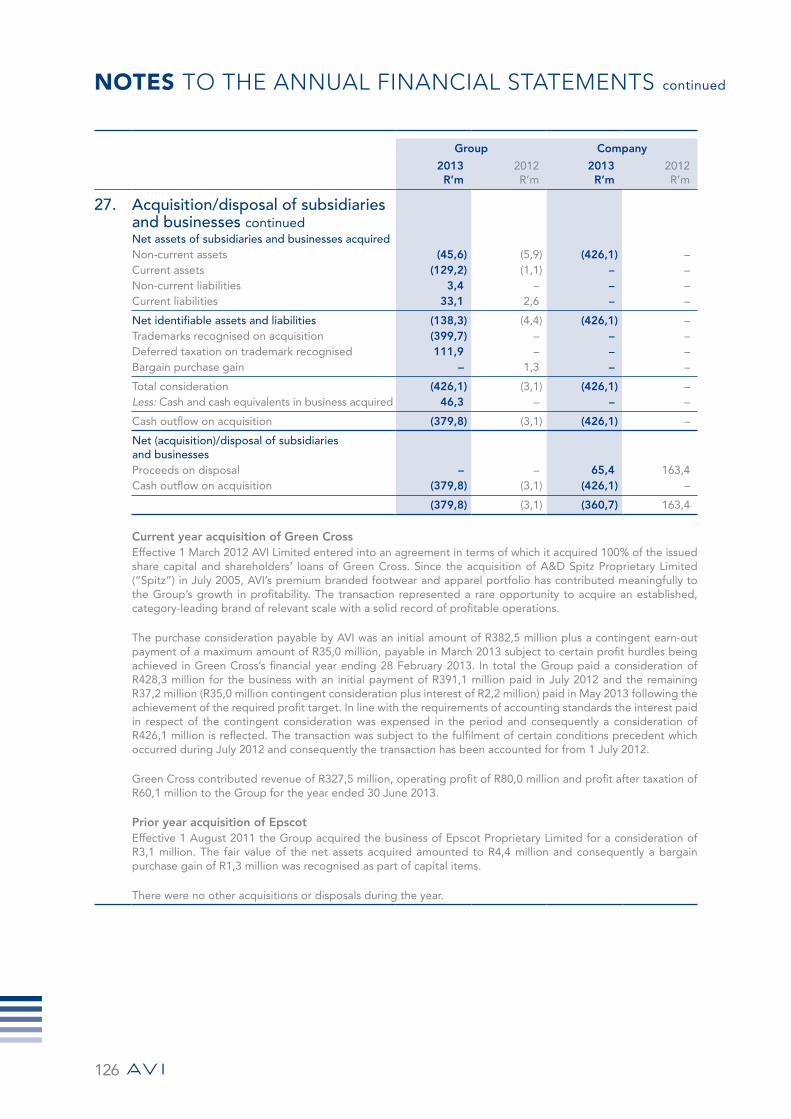
NOTES TO THE ANNUAL FINANCIAL STATEMENTS continued
126
Group Company
2013R’m
2012R’m
2013R’m
2012R’m
27. acquisition/disposal of subsidiaries and businesses continuednet assets of subsidiaries and businesses acquiredNon-current assets (45,6) (5,9) (426,1) –Current assets (129,2) (1,1) – –Non-current liabilities 3,4 – – –Current liabilities 33,1 2,6 – –
net identifiable assets and liabilities (138,3) (4,4) (426,1) –Trademarks recognised on acquisition (399,7) – – –Deferred taxation on trademark recognised 111,9 – – –Bargain purchase gain – 1,3 – –
Total consideration (426,1) (3,1) (426,1) –Less: Cash and cash equivalents in business acquired 46,3 – – –
Cash outflow on acquisition (379,8) (3,1) (426,1) –
net (acquisition)/disposal of subsidiaries and businesses Proceeds on disposal – – 65,4 163,4 Cash outflow on acquisition (379,8) (3,1) (426,1) –
(379,8) (3,1) (360,7) 163,4
Current year acquisition of Green CrossEffective 1 March 2012 AVI Limited entered into an agreement in terms of which it acquired 100% of the issued share capital and shareholders’ loans of Green Cross. Since the acquisition of A&D Spitz Proprietary Limited (“Spitz”) in July 2005, AVI’s premium branded footwear and apparel portfolio has contributed meaningfully to the Group’s growth in profitability. The transaction represented a rare opportunity to acquire an established, category-leading brand of relevant scale with a solid record of profitable operations.
The purchase consideration payable by AVI was an initial amount of R382,5 million plus a contingent earn-out payment of a maximum amount of R35,0 million, payable in March 2013 subject to certain profit hurdles being achieved in Green Cross’s financial year ending 28 February 2013. In total the Group paid a consideration of R428,3 million for the business with an initial payment of R391,1 million paid in July 2012 and the remaining R37,2 million (R35,0 million contingent consideration plus interest of R2,2 million) paid in May 2013 following the achievement of the required profit target. In line with the requirements of accounting standards the interest paid in respect of the contingent consideration was expensed in the period and consequently a consideration of R426,1 million is reflected. The transaction was subject to the fulfilment of certain conditions precedent which occurred during July 2012 and consequently the transaction has been accounted for from 1 July 2012.
Green Cross contributed revenue of R327,5 million, operating profit of R80,0 million and profit after taxation of R60,1 million to the Group for the year ended 30 June 2013.
Prior year acquisition of Epscot Effective 1 August 2011 the Group acquired the business of Epscot Proprietary Limited for a consideration of R3,1 million. The fair value of the net assets acquired amounted to R4,4 million and consequently a bargain purchase gain of R1,3 million was recognised as part of capital items.
There were no other acquisitions or disposals during the year.
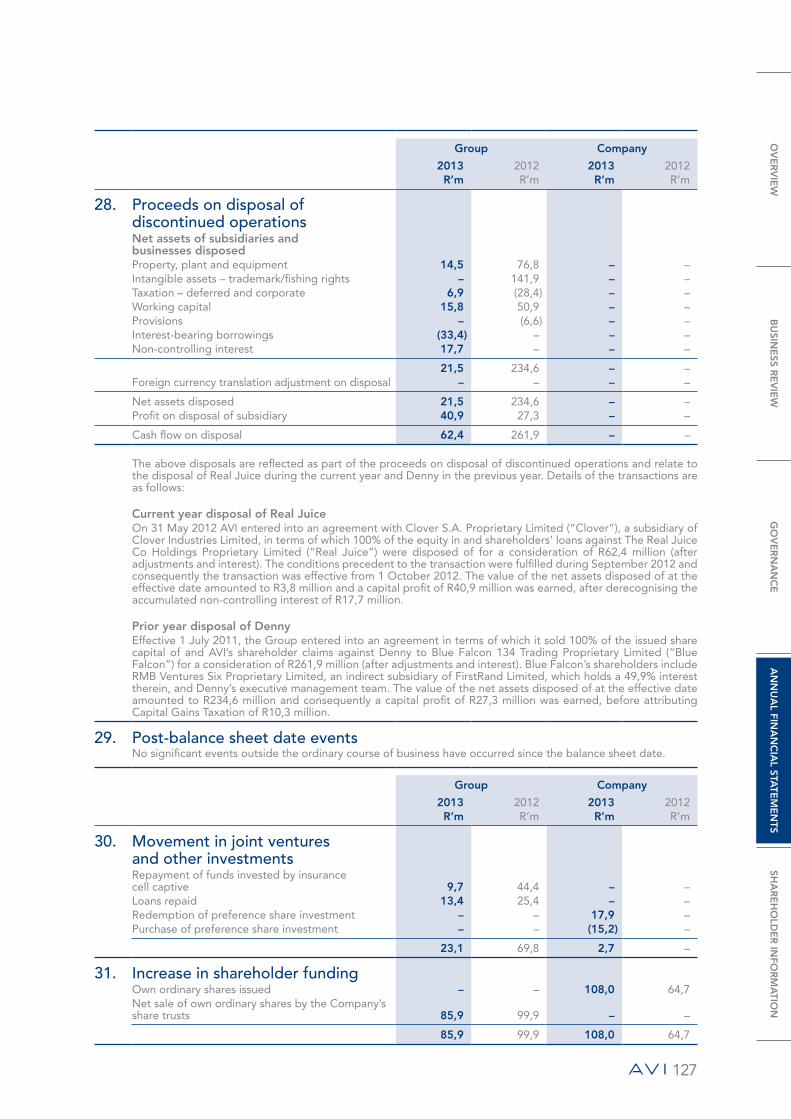
127
Group Company
2013R’m
2012R’m
2013R’m
2012R’m
28. Proceeds on disposal of discontinued operations Net assets of subsidiaries and businesses disposed Property, plant and equipment 14,5 76,8 – –Intangible assets – trademark/fishing rights – 141,9 – –Taxation – deferred and corporate 6,9 (28,4) – –Working capital 15,8 50,9 – –Provisions – (6,6) – –Interest-bearing borrowings (33,4) – – –Non-controlling interest 17,7 – – –
21,5 234,6 – –Foreign currency translation adjustment on disposal – – – –
Net assets disposed 21,5 234,6 – –Profit on disposal of subsidiary 40,9 27,3 – –
Cash flow on disposal 62,4 261,9 – –
The above disposals are reflected as part of the proceeds on disposal of discontinued operations and relate to the disposal of Real Juice during the current year and Denny in the previous year. Details of the transactions are as follows:
Current year disposal of Real Juice On 31 May 2012 AVI entered into an agreement with Clover S.A. Proprietary Limited (“Clover”), a subsidiary of Clover Industries Limited, in terms of which 100% of the equity in and shareholders’ loans against The Real Juice Co Holdings Proprietary Limited (“Real Juice”) were disposed of for a consideration of R62,4 million (after adjustments and interest). The conditions precedent to the transaction were fulfilled during September 2012 and consequently the transaction was effective from 1 October 2012. The value of the net assets disposed of at the effective date amounted to R3,8 million and a capital profit of R40,9 million was earned, after derecognising the accumulated non-controlling interest of R17,7 million.
Prior year disposal of Denny Effective 1 July 2011, the Group entered into an agreement in terms of which it sold 100% of the issued share capital of and AVI’s shareholder claims against Denny to Blue Falcon 134 Trading Proprietary Limited (“Blue Falcon”) for a consideration of R261,9 million (after adjustments and interest). Blue Falcon’s shareholders include RMB Ventures Six Proprietary Limited, an indirect subsidiary of FirstRand Limited, which holds a 49,9% interest therein, and Denny’s executive management team. The value of the net assets disposed of at the effective date amounted to R234,6 million and consequently a capital profit of R27,3 million was earned, before attributing Capital Gains Taxation of R10,3 million.
29. Post-balance sheet date events No significant events outside the ordinary course of business have occurred since the balance sheet date.
Group Company
2013R’m
2012R’m
2013R’m
2012R’m
30. movement in joint ventures and other investments Repayment of funds invested by insurance cell captive 9,7 44,4 – –Loans repaid 13,4 25,4 – –Redemption of preference share investment – – 17,9 –Purchase of preference share investment – – (15,2) –
23,1 69,8 2,7 –
31. increase in shareholder funding Own ordinary shares issued – – 108,0 64,7 Net sale of own ordinary shares by the Company’s share trusts 85,9 99,9 – –
85,9 99,9 108,0 64,7
OV
ER
VIE
WB
USIN
ESS R
EV
IEW
GO
VE
RN
AN
CE
AN
NU
AL FIN
AN
CIA
L STATE
ME
NTS
SHA
RE
HO
LDE
R IN
FOR
MA
TION

NOTES TO THE ANNUAL FINANCIAL STATEMENTS continued
128
Group 2013 2012
Gross R’m
Net of taxand non-
controllinginterests
R’m Gross
R’m
Net of taxand non-
controllinginterests
R’m
32. Earnings and headline earnings The calculations of earnings and headline earnings per ordinary share are based on a weighted average of 306 993 534 (2012: 299 228 661) ordinary shares in issue.
The diluted earnings and headline earnings per share are calculated on 320 859 312 (2012: 313 746 916) ordinary shares.
Determination of headline earnings Earnings 1 085,7 970,5 Attributable to: Continuing operations 1 044,2 947,6 Discontinued operations 41,5 22,9
Adjustment for capital items 36,5 37,7 13,6 7,1 Net loss on disposal of investments, properties, vessels and plant and equipment (1,2) (0,9) (1,8) (1,5)Net profit on disposal of assets held-for-sale of disposal group 0,2 0,2 0,3 0,2 Net loss on disposal of Real Juice 40,9 40,9 – – Net profit on disposal of Denny – – 27,3 17,0 Impairment of plant and equipment (3,6) (2,6) (6,6) (4,8)Impairment of intangible assets – – (6,7) (4,9)Impairment of investment – – (0,2) (0,2)Other 0,2 0,1 1,3 1,3
Headline earnings – 1 048,0 – 963,4
Attributable to: Continuing operations 1 047,5 957,5 Discontinued operations 0,5 5,9
1 048,0 963,4

129
Group
2013Number
2012Number
32. Earnings and headline earnings continued Reconciliation of weighted average number of ordinary shares Issued shares at beginning of year 342 144 990 349 107 644 Effect of own shares held by trusts and subsidiary (39 047 108) (45 001 861)Effect of shares acquired directly in the market* – (8 984 469)Effect of treasury shares sold in July – September 136 720 183 823 Effect of treasury shares sold in October – December 2 230 883 2 025 040 Effect of treasury shares sold in January – March 1 376 728 1 659 416 Effect of treasury shares sold in April – June 151 321 239 069
Weighted average number of ordinary shares 306 993 534 299 228 661
Effect of share options outstanding during the year in incentive scheme trusts 1 451 758 2 087 596 Effect of share options outstanding during the year in the Black Empowerment Scheme Trust 10 926 671 9 560 972 Effect of Out-Performance Scheme instruments outstanding during the year 1 487 349 2 869 687
Weighted average diluted number of ordinary shares 320 859 312 313 746 916
For determining the dilutive effect of these options, the IFRS 2 – Share-based Payment charge not yet expensed is added to the exercise price.* The effect of shares acquired directly in the market in the prior year represents the number of shares repurchased at the end of
the 2011 financial year and deregistered early in the last financial year.
Group
2013Cents
2012Cents
Headline earnings per ordinary share 341,4 322,0 Attributable to: Continuing operations 341,2 320,0 Discontinued operations 0,2 2,0 Diluted headline earnings per ordinary share 326,7 307,1 Attributable to: Continuing operations 326,5 305,2 Discontinued operations 0,2 1,9 Earnings per ordinary share 353,6 324,3 Attributable to: Continuing operations 340,1 316,7 Discontinued operations 13,5 7,6 Diluted earnings per ordinary share 338,4 309,3 Attributable to: Continuing operations 325,5 302,0 Discontinued operations 12,9 7,3
OV
ER
VIE
WB
USIN
ESS R
EV
IEW
GO
VE
RN
AN
CE
AN
NU
AL FIN
AN
CIA
L STATE
ME
NTS
SHA
RE
HO
LDE
R IN
FOR
MA
TION
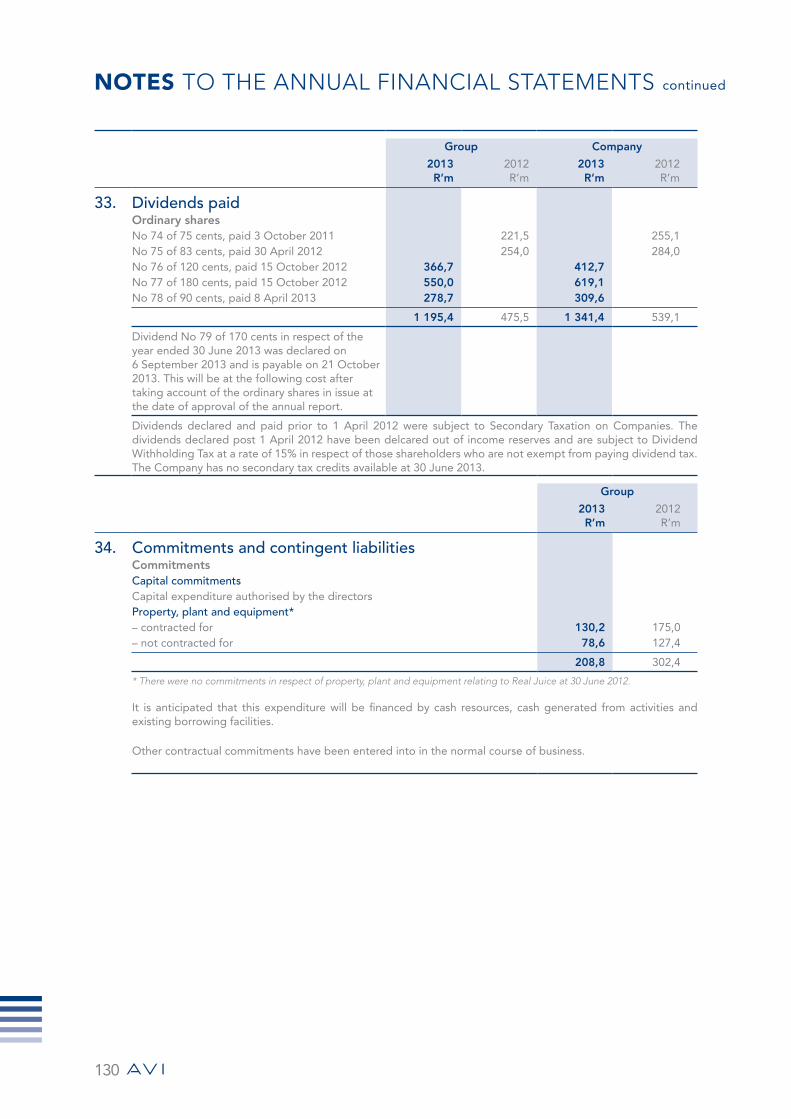
NOTES TO THE ANNUAL FINANCIAL STATEMENTS continued
130
Group Company
2013R’m
2012R’m
2013R’m
2012R’m
33. Dividends paid Ordinary shares No 74 of 75 cents, paid 3 October 2011 221,5 255,1 No 75 of 83 cents, paid 30 April 2012 254,0 284,0 No 76 of 120 cents, paid 15 October 2012 366,7 412,7 No 77 of 180 cents, paid 15 October 2012 550,0 619,1 No 78 of 90 cents, paid 8 April 2013 278,7 309,6
1 195,4 475,5 1 341,4 539,1
Dividend No 79 of 170 cents in respect of the year ended 30 June 2013 was declared on 6 September 2013 and is payable on 21 October 2013. This will be at the following cost after taking account of the ordinary shares in issue at the date of approval of the annual report.
Dividends declared and paid prior to 1 April 2012 were subject to Secondary Taxation on Companies. The dividends declared post 1 April 2012 have been delcared out of income reserves and are subject to Dividend Withholding Tax at a rate of 15% in respect of those shareholders who are not exempt from paying dividend tax. The Company has no secondary tax credits available at 30 June 2013.
Group
2013R’m
2012R’m
34. Commitments and contingent liabilities Commitments Capital commitments Capital expenditure authorised by the directors Property, plant and equipment* – contracted for 130,2 175,0 – not contracted for 78,6 127,4
208,8 302,4
* There were no commitments in respect of property, plant and equipment relating to Real Juice at 30 June 2012.
It is anticipated that this expenditure will be financed by cash resources, cash generated from activities and existing borrowing facilities.
Other contractual commitments have been entered into in the normal course of business.

131
Group
2013R’m
2012R’m
34. Commitments and contingent liabilities continuedOperating leases** Non-cancellable operating lease rentals are payable as follows:Within one year 121,2 87,2 Between two and five years 219,0 159,0 After five years 39,4 48,2
379,6 294,4
** There were no operating lease commitments relating to Real Juice at 30 June 2012.
Contingent liabilities Company The Company has signed a deed of suretyship with Rand Merchant Bank in respect of the performance of the obligations of a subsidiary company, Indigo Brands Proprietary Limited, with regard to the repayment of the secured loan of R4,0 million (2012: R7,5 million) referred to in Note 10. The Company has signed limited guarantees with certain major banks in respect of funding advanced by the banks to some of the Company’s subsidiaries.
Group Company
2013R’m
2012R’m
2013R’m
2012R’m
35. Employee benefits Employment cost 1 771,8 1 557,6 – – Short-term employment benefits 1 589,5 1 390,0 – – Termination benefits 23,4 10,0 – – Share-based payments– equity settled 13,4 18,1 – – – cash settled 0,1 1,0 – – Earnings-linked performance bonuses 23,8 26,5 – – Post-retirement medical aid costs 30,9 32,1 – – Retirement benefits 90,7 79,9 – –
Continuing operations 1 767,8 1 541,0 – – Discontinued operations 4,0 16,6 – –
35.1 Retirement benefits The Group provides retirement benefits for its eligible employees. Of the Group’s 10 500 (2012: 9 816) employees, 7 175 (2012: 6 377) are members of defined contribution Group pension and provident funds or state-administered funds in other jurisdictions. South African funds are governed by the Pension Funds Act, 1956, as amended. Other funds are governed by the respective legislation of the country concerned. The contributions paid by the Group companies for retirement benefits are charged to profit or loss as they are incurred, and amounted to R90,7 million (2012: R79,9 million).
OV
ER
VIE
WB
USIN
ESS R
EV
IEW
GO
VE
RN
AN
CE
AN
NU
AL FIN
AN
CIA
L STATE
ME
NTS
SHA
RE
HO
LDE
R IN
FOR
MA
TION
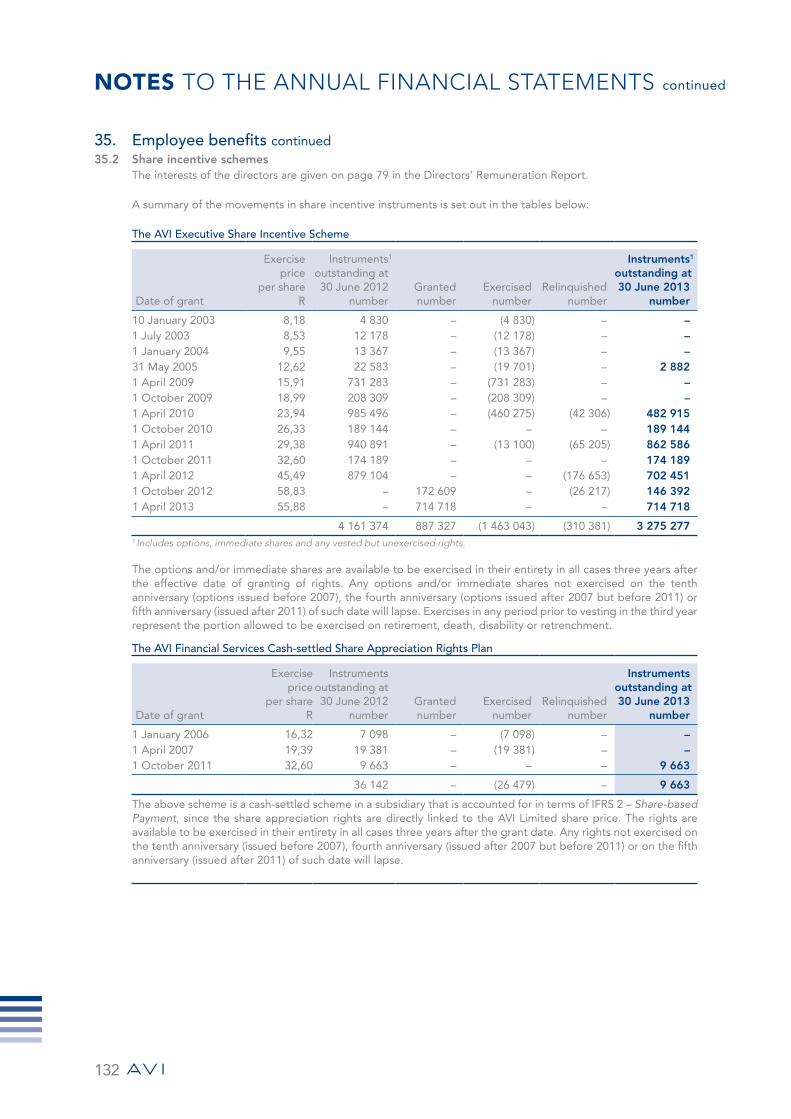
NOTES TO THE ANNUAL FINANCIAL STATEMENTS continued
132
35. Employee benefits continued35.2 Share incentive schemes
The interests of the directors are given on page 79 in the Directors’ Remuneration Report.
A summary of the movements in share incentive instruments is set out in the tables below:
The AVI Executive Share Incentive Scheme
Date of grant
Exercise price
per shareR
Instruments1
outstanding at 30 June 2012
numberGrantednumber
Exercised number
Relinquishednumber
Instruments1
outstanding at 30 June 2013
number
10 January 2003 8,18 4 830 – (4 830) – – 1 July 2003 8,53 12 178 – (12 178) – – 1 January 2004 9,55 13 367 – (13 367) – – 31 May 2005 12,62 22 583 – (19 701) – 2 882 1 April 2009 15,91 731 283 – (731 283) – – 1 October 2009 18,99 208 309 – (208 309) – – 1 April 2010 23,94 985 496 – (460 275) (42 306) 482 915 1 October 2010 26,33 189 144 – – – 189 144 1 April 2011 29,38 940 891 – (13 100) (65 205) 862 586 1 October 2011 32,60 174 189 – – – 174 189 1 April 2012 45,49 879 104 – – (176 653) 702 451 1 October 2012 58,83 – 172 609 – (26 217) 146 392 1 April 2013 55,88 – 714 718 – – 714 718
4 161 374 887 327 (1 463 043) (310 381) 3 275 277 1 Includes options, immediate shares and any vested but unexercised rights.
The options and/or immediate shares are available to be exercised in their entirety in all cases three years after the effective date of granting of rights. Any options and/or immediate shares not exercised on the tenth anniversary (options issued before 2007), the fourth anniversary (options issued after 2007 but before 2011) or fifth anniversary (issued after 2011) of such date will lapse. Exercises in any period prior to vesting in the third year represent the portion allowed to be exercised on retirement, death, disability or retrenchment.
The AVI Financial Services Cash-settled Share Appreciation Rights Plan
Date of grant
Exerciseprice
per shareR
Instrumentsoutstanding at 30 June 2012
numberGranted number
Exercised number
Relinquishednumber
Instruments outstanding at 30 June 2013
number
1 January 2006 16,32 7 098 – (7 098) – – 1 April 2007 19,39 19 381 – (19 381) – – 1 October 2011 32,60 9 663 – – – 9 663
36 142 – (26 479) – 9 663
The above scheme is a cash-settled scheme in a subsidiary that is accounted for in terms of IFRS 2 – Share-based Payment, since the share appreciation rights are directly linked to the AVI Limited share price. The rights are available to be exercised in their entirety in all cases three years after the grant date. Any rights not exercised on the tenth anniversary (issued before 2007), fourth anniversary (issued after 2007 but before 2011) or on the fifth anniversary (issued after 2011) of such date will lapse.
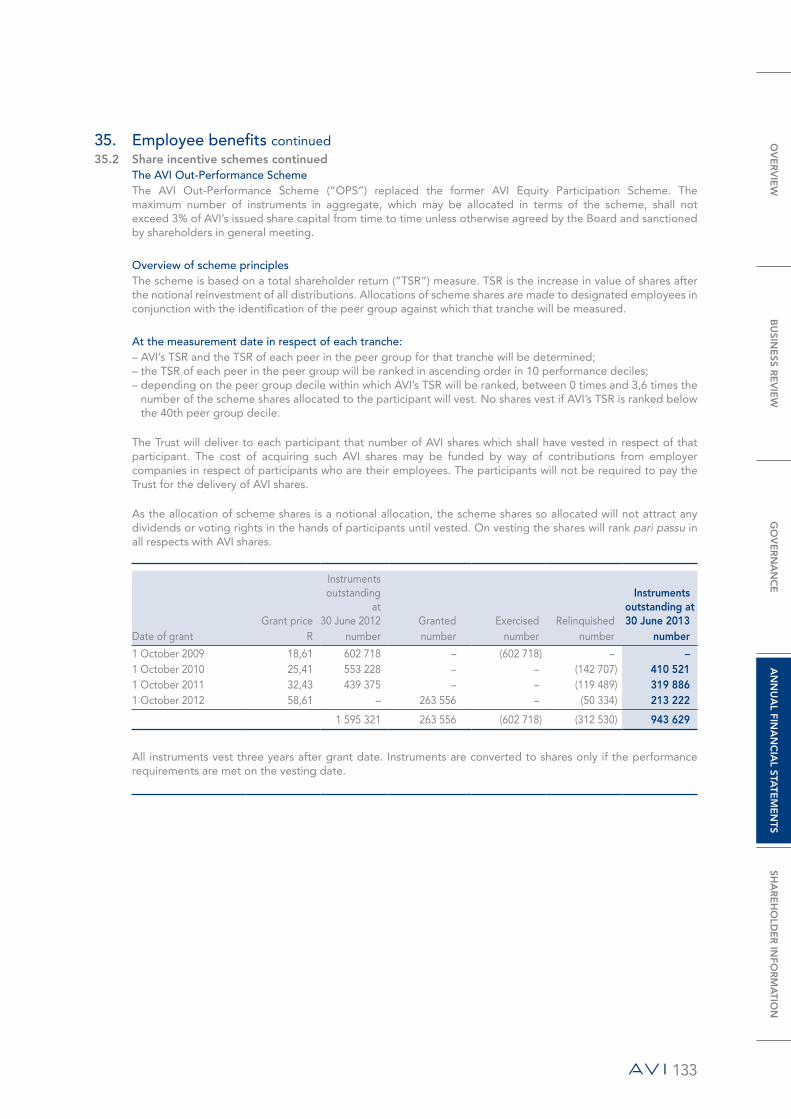
133
35. Employee benefits continued35.2 Share incentive schemes continued
The AVI Out-Performance Scheme The AVI Out-Performance Scheme (“OPS”) replaced the former AVI Equity Participation Scheme. The maximum number of instruments in aggregate, which may be allocated in terms of the scheme, shall not exceed 3% of AVI’s issued share capital from time to time unless otherwise agreed by the Board and sanctioned by shareholders in general meeting.
Overview of scheme principlesThe scheme is based on a total shareholder return (“TSR”) measure. TSR is the increase in value of shares after the notional reinvestment of all distributions. Allocations of scheme shares are made to designated employees in conjunction with the identification of the peer group against which that tranche will be measured.
At the measurement date in respect of each tranche:– AVI’s TSR and the TSR of each peer in the peer group for that tranche will be determined; – the TSR of each peer in the peer group will be ranked in ascending order in 10 performance deciles;– depending on the peer group decile within which AVI’s TSR will be ranked, between 0 times and 3,6 times the
number of the scheme shares allocated to the participant will vest. No shares vest if AVI’s TSR is ranked below the 40th peer group decile.
The Trust will deliver to each participant that number of AVI shares which shall have vested in respect of that participant. The cost of acquiring such AVI shares may be funded by way of contributions from employer companies in respect of participants who are their employees. The participants will not be required to pay the Trust for the delivery of AVI shares.
As the allocation of scheme shares is a notional allocation, the scheme shares so allocated will not attract any dividends or voting rights in the hands of participants until vested. On vesting the shares will rank pari passu in all respects with AVI shares.
Grant price
Instruments outstanding
at30 June 2012 Granted Exercised Relinquished
Instruments outstanding at 30 June 2013
Date of grant R number number number number number
1 October 2009 18,61 602 718 – (602 718) – –1 October 2010 25,41 553 228 – – (142 707) 410 521 1 October 2011 32,43 439 375 – – (119 489) 319 886 1 October 2012 58,61 – 263 556 – (50 334) 213 222
1 595 321 263 556 (602 718) (312 530) 943 629
All instruments vest three years after grant date. Instruments are converted to shares only if the performance requirements are met on the vesting date.
OV
ER
VIE
WB
USIN
ESS R
EV
IEW
GO
VE
RN
AN
CE
AN
NU
AL FIN
AN
CIA
L STATE
ME
NTS
SHA
RE
HO
LDE
R IN
FOR
MA
TION
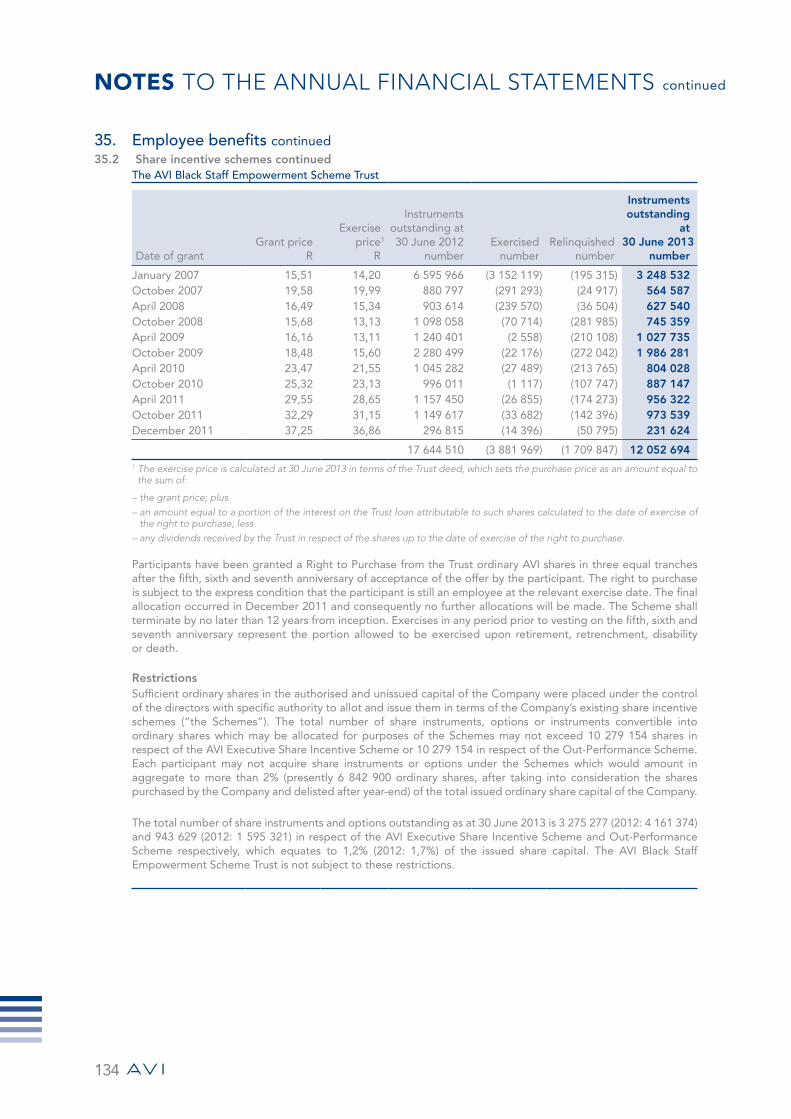
NOTES TO THE ANNUAL FINANCIAL STATEMENTS continued
134
35. Employee benefits continued35.2 Share incentive schemes continued
The AVI Black Staff Empowerment Scheme Trust
Date of grantGrant price
R
Exercise price1
R
Instrumentsoutstanding at 30 June 2012
numberExercised
numberRelinquished
number
Instrumentsoutstanding
at 30 June 2013
number
January 2007 15,51 14,20 6 595 966 (3 152 119) (195 315) 3 248 532 October 2007 19,58 19,99 880 797 (291 293) (24 917) 564 587 April 2008 16,49 15,34 903 614 (239 570) (36 504) 627 540 October 2008 15,68 13,13 1 098 058 (70 714) (281 985) 745 359 April 2009 16,16 13,11 1 240 401 (2 558) (210 108) 1 027 735 October 2009 18,48 15,60 2 280 499 (22 176) (272 042) 1 986 281 April 2010 23,47 21,55 1 045 282 (27 489) (213 765) 804 028 October 2010 25,32 23,13 996 011 (1 117) (107 747) 887 147 April 2011 29,55 28,65 1 157 450 (26 855) (174 273) 956 322 October 2011 32,29 31,15 1 149 617 (33 682) (142 396) 973 539 December 2011 37,25 36,86 296 815 (14 396) (50 795) 231 624
17 644 510 (3 881 969) (1 709 847) 12 052 694 1 The exercise price is calculated at 30 June 2013 in terms of the Trust deed, which sets the purchase price as an amount equal to
the sum of:
– the grant price; plus– an amount equal to a portion of the interest on the Trust loan attributable to such shares calculated to the date of exercise of
the right to purchase; less– any dividends received by the Trust in respect of the shares up to the date of exercise of the right to purchase.
Participants have been granted a Right to Purchase from the Trust ordinary AVI shares in three equal tranches after the fifth, sixth and seventh anniversary of acceptance of the offer by the participant. The right to purchase is subject to the express condition that the participant is still an employee at the relevant exercise date. The final allocation occurred in December 2011 and consequently no further allocations will be made. The Scheme shall terminate by no later than 12 years from inception. Exercises in any period prior to vesting on the fifth, sixth and seventh anniversary represent the portion allowed to be exercised upon retirement, retrenchment, disability or death.
Restrictions Sufficient ordinary shares in the authorised and unissued capital of the Company were placed under the control of the directors with specific authority to allot and issue them in terms of the Company’s existing share incentive schemes (“the Schemes”). The total number of share instruments, options or instruments convertible into ordinary shares which may be allocated for purposes of the Schemes may not exceed 10 279 154 shares in respect of the AVI Executive Share Incentive Scheme or 10 279 154 in respect of the Out-Performance Scheme. Each participant may not acquire share instruments or options under the Schemes which would amount in aggregate to more than 2% (presently 6 842 900 ordinary shares, after taking into consideration the shares purchased by the Company and delisted after year-end) of the total issued ordinary share capital of the Company.
The total number of share instruments and options outstanding as at 30 June 2013 is 3 275 277 (2012: 4 161 374) and 943 629 (2012: 1 595 321) in respect of the AVI Executive Share Incentive Scheme and Out-Performance Scheme respectively, which equates to 1,2% (2012: 1,7%) of the issued share capital. The AVI Black Staff Empowerment Scheme Trust is not subject to these restrictions.
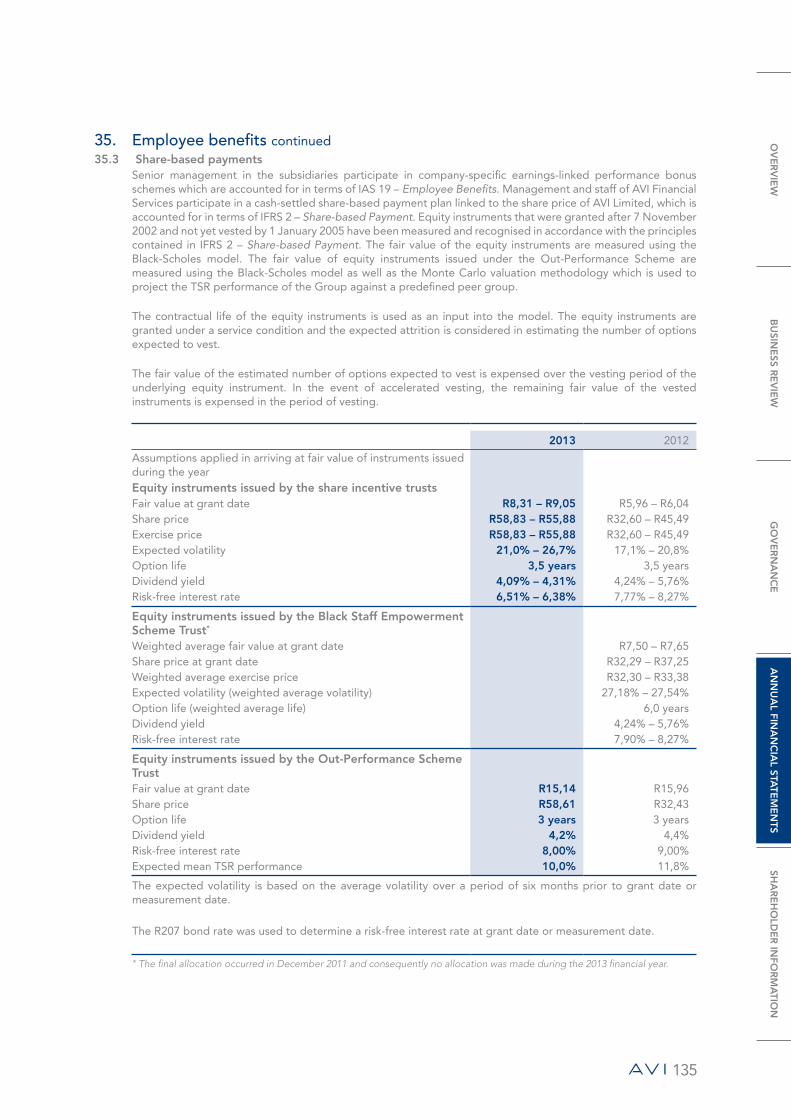
135
35. Employee benefits continued 35.3 Share-based payments
Senior management in the subsidiaries participate in company-specific earnings-linked performance bonus schemes which are accounted for in terms of IAS 19 – Employee Benefits. Management and staff of AVI Financial Services participate in a cash-settled share-based payment plan linked to the share price of AVI Limited, which is accounted for in terms of IFRS 2 – Share-based Payment. Equity instruments that were granted after 7 November 2002 and not yet vested by 1 January 2005 have been measured and recognised in accordance with the principles contained in IFRS 2 – Share-based Payment. The fair value of the equity instruments are measured using the Black-Scholes model. The fair value of equity instruments issued under the Out-Performance Scheme are measured using the Black-Scholes model as well as the Monte Carlo valuation methodology which is used to project the TSR performance of the Group against a predefined peer group.
The contractual life of the equity instruments is used as an input into the model. The equity instruments are granted under a service condition and the expected attrition is considered in estimating the number of options expected to vest.
The fair value of the estimated number of options expected to vest is expensed over the vesting period of the underlying equity instrument. In the event of accelerated vesting, the remaining fair value of the vested instruments is expensed in the period of vesting.
2013 2012
Assumptions applied in arriving at fair value of instruments issued during the year Equity instruments issued by the share incentive trusts Fair value at grant date R8,31 – R9,05 R5,96 – R6,04 Share price R58,83 – R55,88 R32,60 – R45,49 Exercise price R58,83 – R55,88 R32,60 – R45,49 Expected volatility 21,0% – 26,7% 17,1% – 20,8% Option life 3,5 years 3,5 years Dividend yield 4,09% – 4,31% 4,24% – 5,76% Risk-free interest rate 6,51% – 6,38% 7,77% – 8,27%
Equity instruments issued by the Black Staff Empowerment Scheme Trust* Weighted average fair value at grant date R7,50 – R7,65 Share price at grant date R32,29 – R37,25 Weighted average exercise price R32,30 – R33,38 Expected volatility (weighted average volatility) 27,18% – 27,54% Option life (weighted average life) 6,0 years Dividend yield 4,24% – 5,76% Risk-free interest rate 7,90% – 8,27%
Equity instruments issued by the Out-Performance Scheme Trust Fair value at grant date R15,14 R15,96 Share price R58,61 R32,43 Option life 3 years 3 years Dividend yield 4,2% 4,4% Risk-free interest rate 8,00% 9,00% Expected mean TSR performance 10,0% 11,8%
The expected volatility is based on the average volatility over a period of six months prior to grant date or measurement date.
The R207 bond rate was used to determine a risk-free interest rate at grant date or measurement date.
* The final allocation occurred in December 2011 and consequently no allocation was made during the 2013 financial year.
OV
ER
VIE
WB
USIN
ESS R
EV
IEW
GO
VE
RN
AN
CE
AN
NU
AL FIN
AN
CIA
L STATE
ME
NTS
SHA
RE
HO
LDE
R IN
FOR
MA
TION
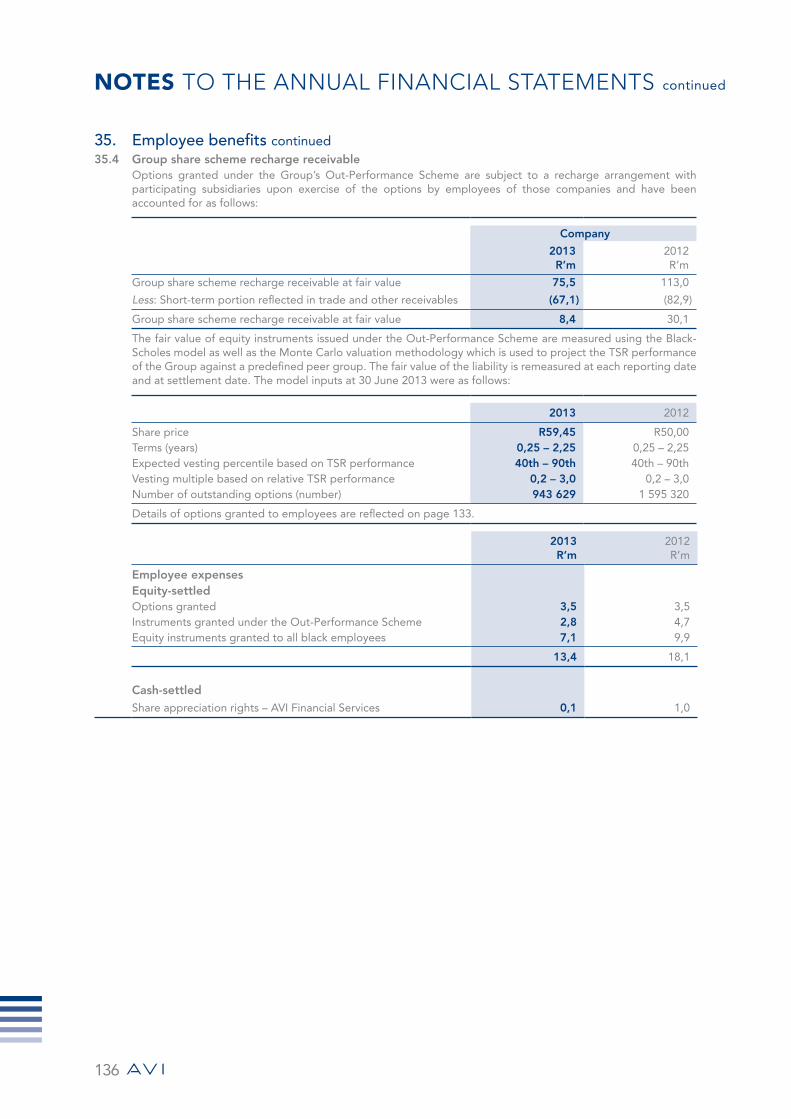
NOTES TO THE ANNUAL FINANCIAL STATEMENTS continued
136
35. Employee benefits continued 35.4 Group share scheme recharge receivable
Options granted under the Group’s Out-Performance Scheme are subject to a recharge arrangement with participating subsidiaries upon exercise of the options by employees of those companies and have been accounted for as follows:
Company
2013R’m
2012R’m
Group share scheme recharge receivable at fair value 75,5 113,0
Less: Short-term portion reflected in trade and other receivables (67,1) (82,9)
Group share scheme recharge receivable at fair value 8,4 30,1
The fair value of equity instruments issued under the Out-Performance Scheme are measured using the Black-Scholes model as well as the Monte Carlo valuation methodology which is used to project the TSR performance of the Group against a predefined peer group. The fair value of the liability is remeasured at each reporting date and at settlement date. The model inputs at 30 June 2013 were as follows:
2013 2012
Share price R59,45 R50,00 Terms (years) 0,25 – 2,25 0,25 – 2,25 Expected vesting percentile based on TSR performance 40th – 90th 40th – 90th Vesting multiple based on relative TSR performance 0,2 – 3,0 0,2 – 3,0 Number of outstanding options (number) 943 629 1 595 320
Details of options granted to employees are reflected on page 133.
2013R’m
2012R’m
Employee expenses Equity-settled Options granted 3,5 3,5 Instruments granted under the Out-Performance Scheme 2,8 4,7 Equity instruments granted to all black employees 7,1 9,9
13,4 18,1
Cash-settled Share appreciation rights – AVI Financial Services 0,1 1,0
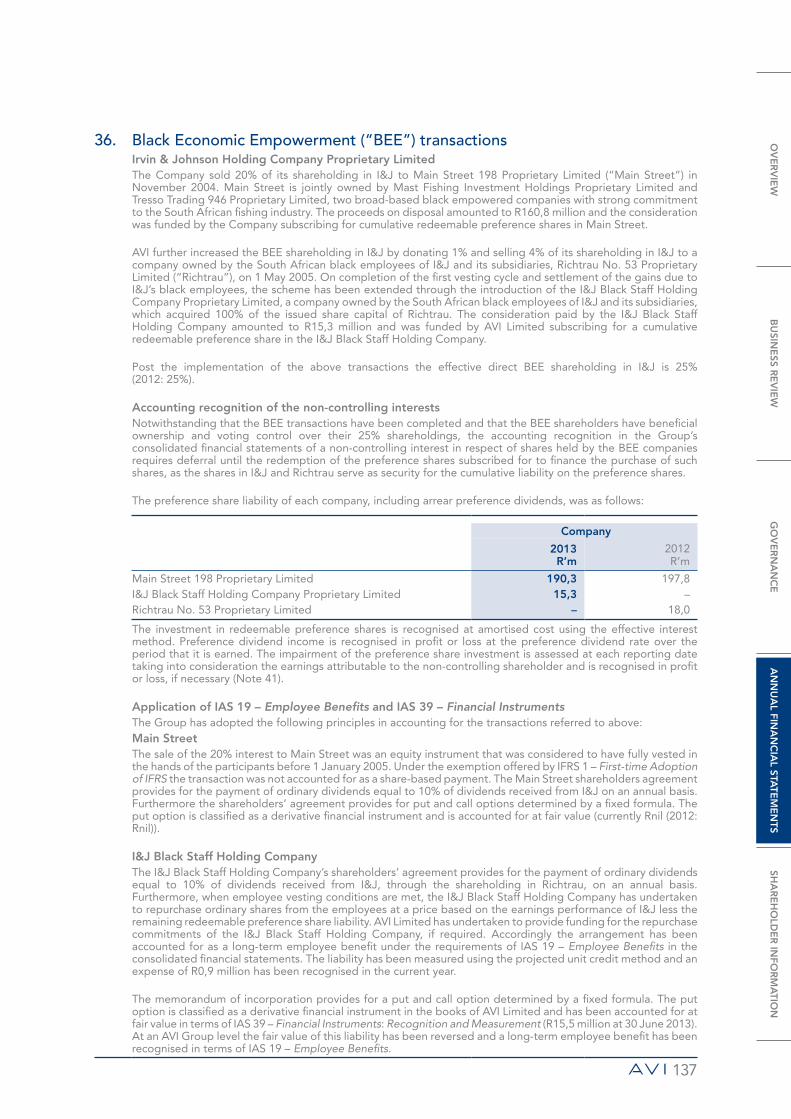
137
36. Black Economic Empowerment (“BEE”) transactions Irvin & Johnson Holding Company Proprietary Limited The Company sold 20% of its shareholding in I&J to Main Street 198 Proprietary Limited (“Main Street”) in November 2004. Main Street is jointly owned by Mast Fishing Investment Holdings Proprietary Limited and Tresso Trading 946 Proprietary Limited, two broad-based black empowered companies with strong commitment to the South African fishing industry. The proceeds on disposal amounted to R160,8 million and the consideration was funded by the Company subscribing for cumulative redeemable preference shares in Main Street.
AVI further increased the BEE shareholding in I&J by donating 1% and selling 4% of its shareholding in I&J to a company owned by the South African black employees of I&J and its subsidiaries, Richtrau No. 53 Proprietary Limited (“Richtrau”), on 1 May 2005. On completion of the first vesting cycle and settlement of the gains due to I&J’s black employees, the scheme has been extended through the introduction of the I&J Black Staff Holding Company Proprietary Limited, a company owned by the South African black employees of I&J and its subsidiaries, which acquired 100% of the issued share capital of Richtrau. The consideration paid by the I&J Black Staff Holding Company amounted to R15,3 million and was funded by AVI Limited subscribing for a cumulative redeemable preference share in the I&J Black Staff Holding Company.
Post the implementation of the above transactions the effective direct BEE shareholding in I&J is 25% (2012: 25%).
Accounting recognition of the non-controlling interests Notwithstanding that the BEE transactions have been completed and that the BEE shareholders have beneficial ownership and voting control over their 25% shareholdings, the accounting recognition in the Group’s consolidated financial statements of a non-controlling interest in respect of shares held by the BEE companies requires deferral until the redemption of the preference shares subscribed for to finance the purchase of such shares, as the shares in I&J and Richtrau serve as security for the cumulative liability on the preference shares.
The preference share liability of each company, including arrear preference dividends, was as follows:
Company
2013R’m
2012R’m
Main Street 198 Proprietary Limited 190,3 197,8 I&J Black Staff Holding Company Proprietary Limited 15,3 – Richtrau No. 53 Proprietary Limited – 18,0
The investment in redeemable preference shares is recognised at amortised cost using the effective interest method. Preference dividend income is recognised in profit or loss at the preference dividend rate over the period that it is earned. The impairment of the preference share investment is assessed at each reporting date taking into consideration the earnings attributable to the non-controlling shareholder and is recognised in profit or loss, if necessary (Note 41).
Application of IAS 19 – Employee Benefits and IAS 39 – Financial Instruments The Group has adopted the following principles in accounting for the transactions referred to above:Main StreetThe sale of the 20% interest to Main Street was an equity instrument that was considered to have fully vested in the hands of the participants before 1 January 2005. Under the exemption offered by IFRS 1 – First-time Adoption of IFRS the transaction was not accounted for as a share-based payment. The Main Street shareholders agreement provides for the payment of ordinary dividends equal to 10% of dividends received from I&J on an annual basis. Furthermore the shareholders’ agreement provides for put and call options determined by a fixed formula. The put option is classified as a derivative financial instrument and is accounted for at fair value (currently Rnil (2012: Rnil)).
I&J Black Staff Holding CompanyThe I&J Black Staff Holding Company’s shareholders’ agreement provides for the payment of ordinary dividends equal to 10% of dividends received from I&J, through the shareholding in Richtrau, on an annual basis. Furthermore, when employee vesting conditions are met, the I&J Black Staff Holding Company has undertaken to repurchase ordinary shares from the employees at a price based on the earnings performance of I&J less the remaining redeemable preference share liability. AVI Limited has undertaken to provide funding for the repurchase commitments of the I&J Black Staff Holding Company, if required. Accordingly the arrangement has been accounted for as a long-term employee benefit under the requirements of IAS 19 – Employee Benefits in the consolidated financial statements. The liability has been measured using the projected unit credit method and an expense of R0,9 million has been recognised in the current year.
The memorandum of incorporation provides for a put and call option determined by a fixed formula. The put option is classified as a derivative financial instrument in the books of AVI Limited and has been accounted for at fair value in terms of IAS 39 – Financial Instruments: Recognition and Measurement (R15,5 million at 30 June 2013). At an AVI Group level the fair value of this liability has been reversed and a long-term employee benefit has been recognised in terms of IAS 19 – Employee Benefits.
OV
ER
VIE
WB
USIN
ESS R
EV
IEW
GO
VE
RN
AN
CE
AN
NU
AL FIN
AN
CIA
L STATE
ME
NTS
SHA
RE
HO
LDE
R IN
FOR
MA
TION
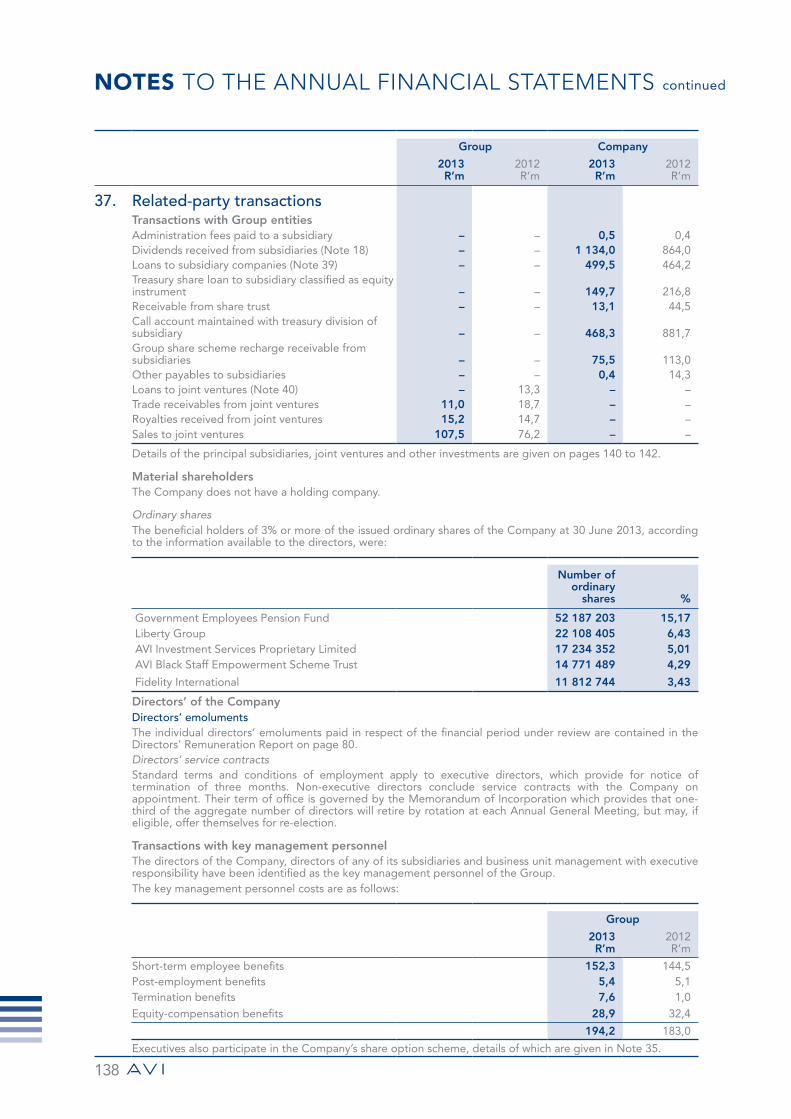
NOTES TO THE ANNUAL FINANCIAL STATEMENTS continued
138
Group Company
2013R’m
2012R’m
2013R’m
2012R’m
37. Related-party transactions Transactions with Group entities Administration fees paid to a subsidiary – – 0,5 0,4 Dividends received from subsidiaries (Note 18) – – 1 134,0 864,0 Loans to subsidiary companies (Note 39) – – 499,5 464,2 Treasury share loan to subsidiary classified as equity instrument – – 149,7 216,8 Receivable from share trust – – 13,1 44,5 Call account maintained with treasury division of subsidiary – – 468,3 881,7 Group share scheme recharge receivable from subsidiaries – – 75,5 113,0 Other payables to subsidiaries – – 0,4 14,3 Loans to joint ventures (Note 40) – 13,3 – – Trade receivables from joint ventures 11,0 18,7 – – Royalties received from joint ventures 15,2 14,7 – – Sales to joint ventures 107,5 76,2 – –
Details of the principal subsidiaries, joint ventures and other investments are given on pages 140 to 142.
Material shareholdersThe Company does not have a holding company.
Ordinary shares The beneficial holders of 3% or more of the issued ordinary shares of the Company at 30 June 2013, according to the information available to the directors, were:
Number ofordinary
shares %
Government Employees Pension Fund 52 187 203 15,17 Liberty Group 22 108 405 6,43 AVI Investment Services Proprietary Limited 17 234 352 5,01 AVI Black Staff Empowerment Scheme Trust 14 771 489 4,29
Fidelity International 11 812 744 3,43
Directors’ of the CompanyDirectors’ emolumentsThe individual directors’ emoluments paid in respect of the financial period under review are contained in the Directors’ Remuneration Report on page 80. Directors’ service contractsStandard terms and conditions of employment apply to executive directors, which provide for notice of termination of three months. Non-executive directors conclude service contracts with the Company on appointment. Their term of office is governed by the Memorandum of Incorporation which provides that one-third of the aggregate number of directors will retire by rotation at each Annual General Meeting, but may, if eligible, offer themselves for re-election.
Transactions with key management personnelThe directors of the Company, directors of any of its subsidiaries and business unit management with executive responsibility have been identified as the key management personnel of the Group.The key management personnel costs are as follows:
Group
2013R’m
2012R’m
Short-term employee benefits 152,3 144,5 Post-employment benefits 5,4 5,1 Termination benefits 7,6 1,0 Equity-compensation benefits 28,9 32,4
194,2 183,0
Executives also participate in the Company’s share option scheme, details of which are given in Note 35.

139
Company
2013R’m
2012R’m
38. Subsidiaries Investment in subsidiaries Unlisted – shares in owned subsidiaries 1 478,8 1 151,6 Borrowings by subsidiary companies 530,6 593,7
2 009,4 1 745,3 Share-based payments capitalised 53,0 5,3 Impairment allowance (31,2) (137,7)Treasury share loan to subsidiary classified as equity (149,7) (216,8)
Total interest in subsidiaries 1 881,5 1 396,1
Reflected as part of: Investment in subsidiaries 1 881,5 1 338,8 Assets classified as held-for-sale – 57,3
OV
ER
VIE
WB
USIN
ESS R
EV
IEW
GO
VE
RN
AN
CE
AN
NU
AL FIN
AN
CIA
L STATE
ME
NTS
SHA
RE
HO
LDE
R IN
FOR
MA
TION

NOTES TO THE ANNUAL FINANCIAL STATEMENTS continued
140
39. Principal subsidiary companiesBook value of
Company’s interest
Issued permanent
capital
Group effective
percentage holding Shares
Indebtedness to the
Company
Name of company and nature of business Class
2013R’m
2012R’m
2013%
2012%
2013R’m
2012R’m
2013R’m
2012R’m
A&D Spitz Proprietary Limited – retailer of branded shoes and fashion
accessories Ord – – 100 100 576,6 576,6 – – AVI Investment Services Proprietary Limited – investment company Ord – – 100 100 – – 284,7 285,8 Green Cross – producer and retailer of branded shoes
and footwear accessories – Green Cross Manufacturers Proprietary Limited Ord – – 100 – 305,0 – 64,3 –Green Cross Retail Holdings Proprietary Limited Ord – – 100 – 8,1 – 20,5 – Green Cross Properties Proprietary Limited Ord – – 100 – 22,2 – 6,0 –Hampton Sportswear Proprietary Limited – retailer of branded apparel Ord – – 100 100 20,7 20,7 – – Irvin & Johnson Holding Company Proprietary Limited – international integrated fishing,
processing and marketing of branded value-added fish and seafood products Ord – – 75 75 319,1 319,1 – –
Indigo Brands Proprietary Limited – manufacturers, marketers and
distributors of cosmetics, fragrances and toiletries Ord – – 100 100 – – 124,0 124,0
National Brands Limited – manufacturers and marketers of
branded food and beverage products Ord 3,5 3,5 100 100 227,1 227,1 – – Nina Roche Shoe Collection Proprietary Limited – retailer of branded shoes and fashion
accessories Ord – – 100 100 – – 31,1 31,1 The Real Juice Co Holdings Proprietary Limited* – manufacturers and distributors of
ready-to-drink beverages Ord – – 75 75 – 8,1 – 152,8
1 478,8 1 151,6 530,6 593,7 Impairment allowance – Real Juice Co – (8,1) – (98,4)– Nina Roche (0,1) (0,1) (31,1) (31,1)
Share-based payments capitalised 53,0 5,3 – –
1 531,7 1 148,7 499,5 464,2
Apart from Nina Roche, the directors’ valuation of each of the investments in subsidiary companies, all of which are unlisted, is not less than their respective carrying values. All companies are incorporated in South Africa. * On 31 May 2012 AVI entered into an agreement with Clover S.A. Proprietary Limited (“Clover”), a subsidiary of Clover Industries
Limited, in terms of which 100% of the equity in and shareholders’ loans against The Real Juice Co Holdings Proprietary Limited (“Real Juice”) were disposed. The conditions precedent to the transaction were fulfilled during September 2012 and consequently the transaction was effective from 1 October 2012.
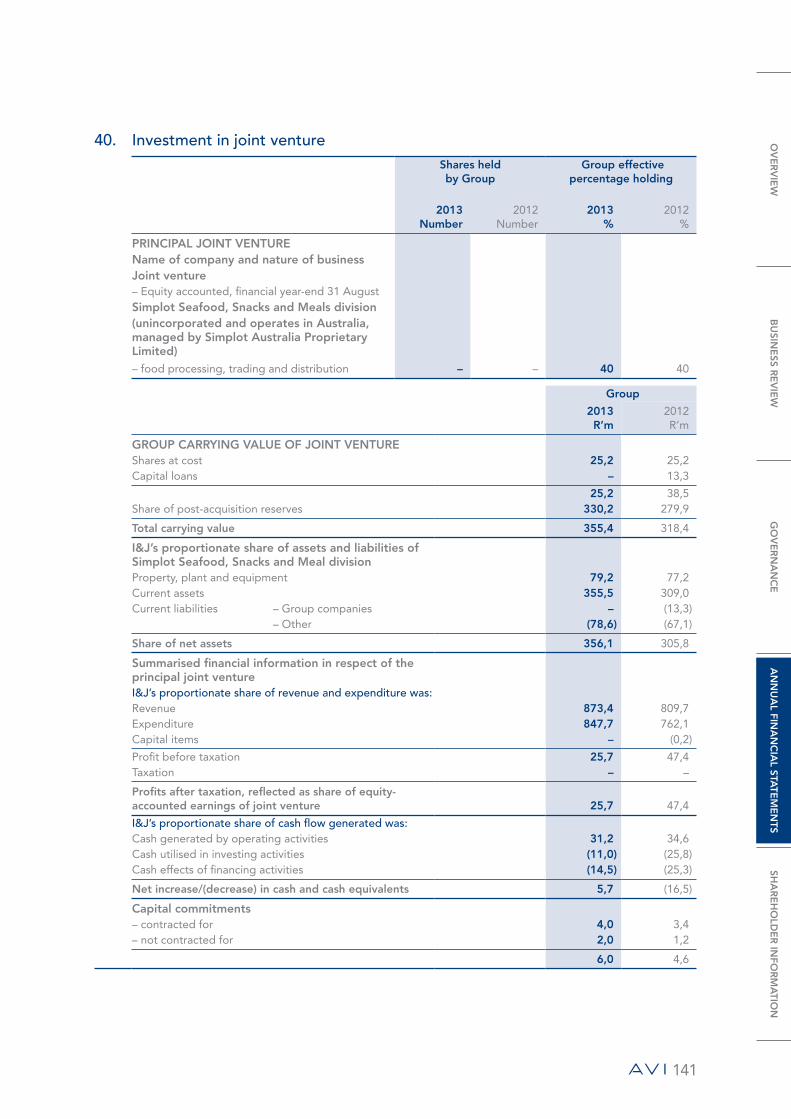
141
40. Investment in joint ventureShares held by Group
Group effective percentage holding
2013Number
2012Number
2013%
2012%
PRINCIPAL JOINT VENTURE Name of company and nature of business Joint venture – Equity accounted, financial year-end 31 August Simplot Seafood, Snacks and Meals division (unincorporated and operates in Australia, managed by Simplot Australia Proprietary Limited) – food processing, trading and distribution – – 40 40
Group
2013R’m
2012R’m
GROUP CARRYING VALUE OF JOINT VENTURE Shares at cost 25,2 25,2 Capital loans – 13,3
25,2 38,5 Share of post-acquisition reserves 330,2 279,9
Total carrying value 355,4 318,4
I&J’s proportionate share of assets and liabilities of Simplot Seafood, Snacks and Meal division Property, plant and equipment 79,2 77,2 Current assets 355,5 309,0 Current liabilities – Group companies – (13,3) – Other (78,6) (67,1)
Share of net assets 356,1 305,8
Summarised financial information in respect of the principal joint venture I&J’s proportionate share of revenue and expenditure was: Revenue 873,4 809,7 Expenditure 847,7 762,1 Capital items – (0,2)
Profit before taxation 25,7 47,4 Taxation – –
Profits after taxation, reflected as share of equity- accounted earnings of joint venture 25,7 47,4
I&J’s proportionate share of cash flow generated was: Cash generated by operating activities 31,2 34,6 Cash utilised in investing activities (11,0) (25,8)Cash effects of financing activities (14,5) (25,3)
Net increase/(decrease) in cash and cash equivalents 5,7 (16,5)
Capital commitments – contracted for 4,0 3,4 – not contracted for 2,0 1,2
6,0 4,6
OV
ER
VIE
WB
USIN
ESS R
EV
IEW
GO
VE
RN
AN
CE
AN
NU
AL FIN
AN
CIA
L STATE
ME
NTS
SHA
RE
HO
LDE
R IN
FOR
MA
TION

NOTES TO THE ANNUAL FINANCIAL STATEMENTS continued
142
41. Other investments and long-term receivables
Shares held Group effective percentage holding Group Company
2013Number
2012Number
2013Number
2012Number
2013%
2012%
PRINCIPAL OTHER INVESTMENTS Name of company and nature of business Main Street 198 Proprietary Limited 800 800 800 800 100 100 – Cumulative redeemable convertible “A”
preference shares* I&J Black Staff Holding Company Proprietary Limited 50 000 – 50 000 – 100 – – Cumulative redeemable preference shares* Richtrau No. 53 Proprietary Limited
– Cumulative redeemable preference shares* – 1 – 1 – 100
R’m R’m R’m R’m
Other investments comprise Preference share investments in the empowerment consortia, including dividends accrued – – 175,9 178,5 Insurance cell captive fund – net bank deposits and investments – 9,7 – 5,9 Pension fund surplus apportionment 22,8 – – – Loan receivable 1,2 0,3 15,8 –
24,0 10,0 191,7 184,4 Less: Short-term portion reflected in trade and other receivables 4,3 – – –
19,7 10,0 191,7 184,4
* The 25% black empowerment shareholding in I&J is held by two investment nominee companies. AVI has subscribed for preference shares in Main Street 198 Proprietary Limited and I&J Black Staff Holding Company Proprietary Limited, the investment nominee companies owned by these empowerment investors, to fund the acquisition of the I&J shares. The net preference share investment represents the original subscription price plus arrear preference dividends, less a capping allowance to limit the recognition of preference dividend income to the equivalent attributable earnings of I&J (Note 36).
None of the investments are listed on a stock exchange.
The directors’ valuation of each of the unlisted investments is not less than their respective carrying values.
A register disclosing full details of all companies in which the Group has investments is available for inspection by shareholders or their duly appointed authorised agents during business hours at the registered office of the Company.
Insurance cell captive fund The Group consolidates its attributable share of an insurance cell captive managed on behalf of the Group by Guardrisk Insurance Company Limited. In November 2012 the Group unwound its interest in the Guardrisk cell captive which resulted in the flow of the remaining funds in the cell to AVI through a dividend.

143
42. Financial risk management 42.1 Overview The Group has exposure to the following risks from its use of financial instruments:
• Credit risk • Liquidity risk• Market risk
This note presents information about the Group’s exposure to each of the above risks, the Group’s objectives, policies and processes for measuring and managing financial risk, and the Group’s management of capital. Further quantitative disclosures are included throughout these consolidated financial statements.
The Board of directors has overall responsibility for the establishment and oversight of the Group’s financial risk management framework. The AVI Group Treasury, together with the relevant business unit executives, is responsible for developing and monitoring the relevant financial risk management policies.
The Group’s financial risk management policies are established to identify and analyse the risks faced by the Group, to set appropriate risk limits and controls, and to monitor risks and adherence to limits. Risk management policies and systems are reviewed regularly to reflect changes in market conditions and the Group’s activities. The Group aims to maintain a disciplined and constructive control environment in which all employees understand their roles and obligations.
The Group Audit Committee oversees management’s monitoring of compliance with the Group’s risk management policies and procedures and reviews the adequacy of the risk management framework in relation to the financial risks faced by the Group. The Group Audit Committee is assisted in its oversight role by internal audit. Internal audit undertakes both regular and ad hoc reviews of risk management controls and procedures, the results of which are reported to the Group Audit Committee.
42.2 Capital management The Board’s policy is to maintain a strong capital base so as to maintain investor, creditor and market confidence
and to sustain future development of the business. The Board of directors monitors the return on average capital employed, which the Group defines as operating profit before capital items from continuing operations after taxation divided by average total shareholders’ equity plus net debt.
The Board seeks to maintain a balance between the higher returns that might be possible with higher levels of borrowings and the advantages and security afforded by a sound capital position. The Group’s target, which is determined by the AVI Board, is to achieve a return on average capital employed at 120% of the weighted average cost of capital, which was estimated at 10,7% (2012: 10,7%). In 2013 the return was 27,4% (2012: 29,4%). In comparison, the weighted average interest expense on interest-bearing borrowings (excluding liabilities with imputed interest) was 6,48% (2012: 6,95%).
From time to time the Group purchases its own shares in the market under general authority granted by shareholders; the timing of these purchases depends on market prices. Primarily the shares are part of a programme to return capital to shareholders, but some may be used for issuing shares under the Group’s share option programmes. Buying decisions are made under specific mandates from the executive directors.
There were no changes in the Group’s approach to capital management during the year.
The AVI Group is subject to and complies with the following capital reporting covenants required by some of the Group’s bankers: • Consolidated net debt to EBITDA less than 3,0.• Consolidated EBITDA to net finance costs greater than 2,5.
Internal debt limits used by executive management on a day-to-day basis are more conservative than the above.
OV
ER
VIE
WB
USIN
ESS R
EV
IEW
GO
VE
RN
AN
CE
AN
NU
AL FIN
AN
CIA
L STATE
ME
NTS
SHA
RE
HO
LDE
R IN
FOR
MA
TION
NOTES TO THE ANNUAL FINANCIAL STATEMENTS continued
144
42.3 Credit risk Credit risk is the risk of financial loss to the Group if a customer or counterparty to a financial instrument fails to
meet its contractual obligations, and arises principally from the Group’s receivables from customers, cash and cash equivalents, and loan receivables and other investments.
Trade and other receivables The Group’s exposure to credit risk is influenced mainly by the individual characteristics of each customer.
Geographically there is concentration of credit risk in the South African market.
The Group has established a credit policy under which each new customer is analysed individually for creditworthiness before payment and delivery terms and conditions are offered. The Group’s review includes external ratings, when available, and in some cases bank references. Purchase limits are established for each customer, which represents the maximum open amount; these limits are reviewed annually or when conditions arise that warrant a review. Customers that fail to meet the Group’s benchmark creditworthiness may transact with the Group only on a prepayment basis.
Most of the Group’s customers have been transacting with the Group for over three years, and losses have occurred infrequently. In monitoring customer credit risk, customers are grouped according to their credit characteristics, including whether they are an individual or legal entity, whether they are a wholesale, retail or end-user customer, geographic location, industry, ageing profile, maturity and existence of previous financial difficulties. Trade and other receivables relate mainly to the Group’s retail and wholesale customers. Customers that are graded as “high risk” are placed on a restricted customer list, and future sales are made on a prepayment basis. Overdue accounts are put on hold until payments are received to return them within limits.
Most goods sold are subject to retention of title clauses, so that in the event of non-payment the Group may have a secured claim. The Group does not require collateral in respect of trade and other receivables.
The Group establishes an allowance for impairment that represents its estimate of incurred losses in respect of trade and other receivables. The main components of this allowance are a specific loss component that relates to individually significant exposures, and a collective loss component established for groups of similar assets in respect of losses that have been incurred but not yet identified. The collective loss allowance is determined based on historical data of payment statistics for similar financial assets.
Cash and cash equivalents, loan receivables and other investments The majority of the Group’s investments are in liquid securities with counterparties that have sound credit ratings.
Where considered necessary, security is sought. Management does not expect any counterparty to fail to meet its obligations.
Guarantees The Group’s policy is to provide limited financial guarantees in respect of banking facilities for wholly owned
subsidiaries. At 30 June 2013 guarantees were in place for AVI Financial Services Proprietary Limited, National Brands Limited, A&D Spitz Proprietary Limited, Green Cross Manufacturers Proprietary Limited and Green Cross Retail Holdings Proprietary Limited. (2012: AVI Financial Services Proprietary Limited, National Brands Limited, Nina Roche Shoe Collection Proprietary Limited and Hampton Sportswear Proprietary Limited.)
In addition, the Group provides limited sureties for outstanding debt under the cash management agreement of Group subsidiary companies that participate in the Group’s cash management agreement.

145
42. Financial risk management continued 42.3 Credit risk continued
Exposure to credit riskThe carrying amount of financial assets represents the maximum credit exposure. The maximum exposure to credit risk at the reporting date was:
Group Company Carrying amount Carrying amount
2013R’m
2012R’m
2013R’m
2012R’m
Other investments 19,7 10,0 191,7 184,4 Other financial assets including derivatives 57,3 25,7 – – Trade and other receivables* 1 302,8 1 224,0 548,5 1 009,3 Cash and cash equivalents 212,4 242,1 – 0,4
Total 1 592,2 1 501,8 740,2 1 194,1
* Excludes prepayments.
Group Carrying amount
2013R’m
2012R’m
The maximum exposure to credit risk for trade receivables for the Group at the reporting date by geographic region was:South Africa 982,8 964,1 Europe 113,4 102,1 Australasia 10,7 10,5
Rest of Africa 137,2 102,8
Total 1 244,1 1 179,5
The maximum exposure to credit risk for trade receivables for the Group at the reporting date by type of customer was: Wholesale customers 387,2 347,6 Retail customers 741,6 714,9 End-user customers and direct sales 115,3 117,0
Total 1 244,1 1 179,5
The Group’s most significant customers, being two South African retailers, accounted for 27,3% of the trade receivables carrying amount at 30 June 2013 (2012: 28,1%).
OV
ER
VIE
WB
USIN
ESS R
EV
IEW
GO
VE
RN
AN
CE
AN
NU
AL FIN
AN
CIA
L STATE
ME
NTS
SHA
RE
HO
LDE
R IN
FOR
MA
TION

NOTES TO THE ANNUAL FINANCIAL STATEMENTS continued
146
42. Financial risk management continued 42.3 Credit risk continued
Impairment lossesThe ageing of trade receivables at the reporting date was:
Gross 2013R’m
Impairment 2013R’m
Gross 2012R’m
Impairment 2012R’m
Not past due 1 119,2 (0,4) 1 050,7 (0,1)Past due 0 – 30 days 82,5 – 78,2 (0,3)Past due 31 – 120 days 22,5 (0,4) 39,7 (0,8)Past due 121 days – 1 year 13,5 (4,2) 7,1 (2,8)Past due more than 1 year 6,4 (3,4) 3,8 (3,5)
Total 1 244,1 (8,4) 1 179,5 (7,5)
Based on historical default rates, the Group believes that a nominal impairment allowance is appropriate in respect of trade receivables not past due.
The movement in the allowance for impairment in respect of trade receivables during the year was as follows:
2013R’m
2012R’m
Balance as at 1 July (7,5) (10,7)Impairment loss recognised in profit or loss (1,8) (0,5)Impairment allowance on discontinued operation – (0,1)Impairment loss reversal 0,5 3,7 Impairment loss utilised 0,5 – Acquisition of Green Cross (0,1) – Transfer of allowance to assets held-for-sale – 0,1
Balance as at 30 June (8,4) (7,5)
The allowance accounts in respect of trade receivables are used to record impairment losses unless the Group is satisfied that no recovery of the amount owing is possible; at that point the amount is considered irrecoverable and is written off against the financial asset directly.

147
42. Financial risk management continued 42.4 Liquidity risk
Liquidity risk is the risk that the Group will not be able to meet its financial obligations as they fall due. The Group’s approach to managing liquidity is to ensure, as far as possible, that it will always have sufficient liquidity to meet its liabilities when due, under both normal and stressed conditions, without incurring unacceptable losses or risking damage to the Group’s reputation.
The Group actively manages short-term funding requirements via the Group Treasury with regular forecasts. Typically the Group ensures that it has sufficient cash on demand to meet expected operational expenses for a period of eight weeks, including the servicing of financial obligations; this excludes the potential impact of extreme circumstances that cannot reasonably be predicted, such as natural disasters. In addition, the Group maintains the following lines of credit: • R1 750 million treasury facilities that can be drawn down to meet short-term financing needs. These facilities
are overnight call borrowings. Interest is payable at the quoted overnight borrowing rate applicable on the date of advance.
• R500 million multi-option facility in National Brands Limited that can be drawn down to meet short-term financing needs. This facility is an overnight call borrowing and interest is payable at the quoted overnight borrowing rate applicable on the date of advance.
• R203,6 million overdraft facilities available to the subsidiaries that are unsecured. Interest is payable at the prime lending rate if the facilities are used.
The following are the contractual maturities of financial liabilities, including estimated interest payments and excluding the impact of netting agreements:
Carrying amount
R’m
Contractual cash flows
R’m
6 months or less
R’m
6 – 12 months
R’m
+1 – 2 years
R’m
+2 – 5 years
R’m
More than
5 yearsR’m
Group30 June 2013Non-derivative financial liabilitiesSecured bank loans 4,0 4,4 2,2 2,2 – – – Trade and other payables** 1 294,1 1 294,1 1 294,1 – – – – Overdraft and current borrowings 889,5 895,5 889,5 6,0 – – –
2 187,6 2 194,0 2 185,8 8,2 – – –
30 June 2012Non-derivative financial liabilitiesSecured bank loans 7,5 8,7 2,2 2,2 4,3 – – Finance lease liabilities 4,4 5,0 4,3 0,7 – – – Unsecured loans* 33,0 33,0 33,0 – – – – Trade and other payables** 1 274,2 1 274,2 1 274,2 – – – – Overdraft and current borrowings 55,3 55,3 55,3 – – – –
1 374,4 1 376,2 1 369,0 2,9 4,3 – –
Company30 June 2013Non-derivative financial liabilitiesTrade and other payables** 3,1 3,1 3,1 – – – –
3,1 3,1 3,1 – – – –
30 June 2012Non-derivative financial liabilitiesTrade and other payables** 17,3 14,3 14,3 – – – –
17,3 14,3 14,3 – – – –
* Unsecured loans were reflected as part of the liabilities classified as held-for-sale at 30 June 2012.
** Excludes performance bonuses, post-retirement liabilities and operating lease straight-line liability.
OV
ER
VIE
WB
USIN
ESS R
EV
IEW
GO
VE
RN
AN
CE
AN
NU
AL FIN
AN
CIA
L STATE
ME
NTS
SHA
RE
HO
LDE
R IN
FOR
MA
TION
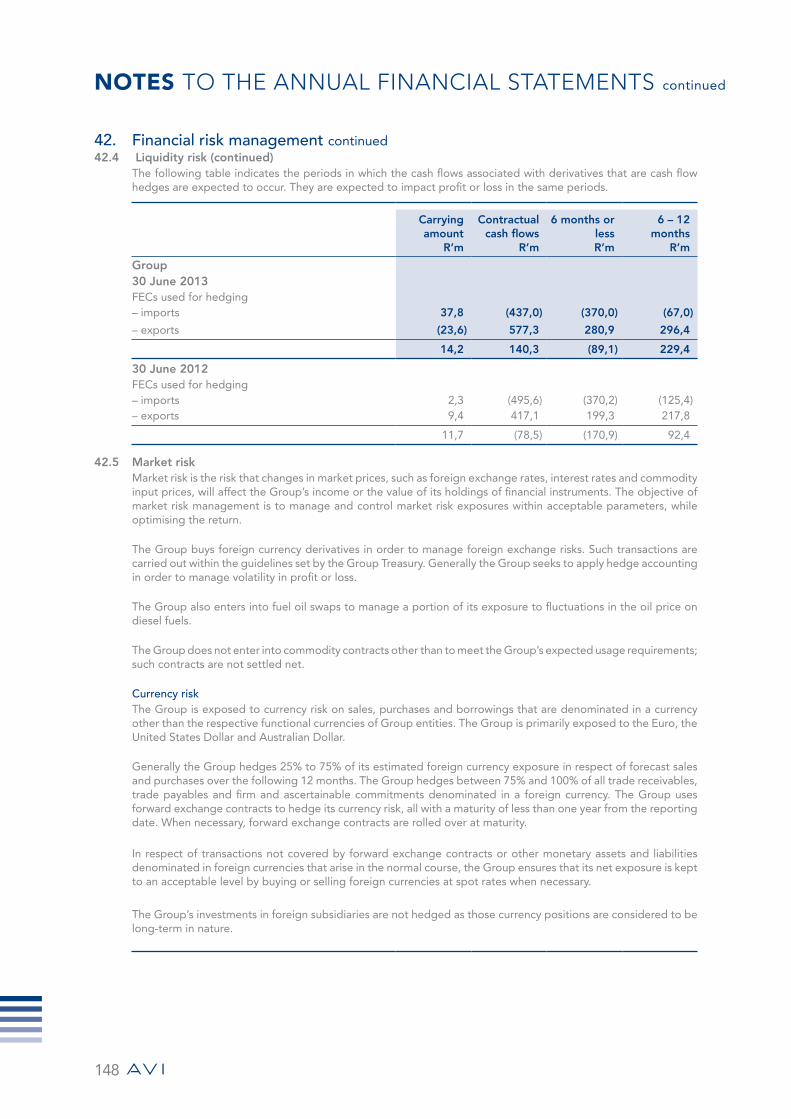
NOTES TO THE ANNUAL FINANCIAL STATEMENTS continued
148
42. Financial risk management continued42.4 Liquidity risk (continued)
The following table indicates the periods in which the cash flows associated with derivatives that are cash flow hedges are expected to occur. They are expected to impact profit or loss in the same periods.
Carrying amount
R’m
Contractual cash flows
R’m
6 months or lessR’m
6 – 12 months
R’m
Group30 June 2013FECs used for hedging– imports 37,8 (437,0) (370,0) (67,0)
– exports (23,6) 577,3 280,9 296,4
14,2 140,3 (89,1) 229,4
30 June 2012FECs used for hedging– imports 2,3 (495,6) (370,2) (125,4)– exports 9,4 417,1 199,3 217,8
11,7 (78,5) (170,9) 92,4
42.5 Market risk Market risk is the risk that changes in market prices, such as foreign exchange rates, interest rates and commodity input prices, will affect the Group’s income or the value of its holdings of financial instruments. The objective of market risk management is to manage and control market risk exposures within acceptable parameters, while optimising the return.
The Group buys foreign currency derivatives in order to manage foreign exchange risks. Such transactions are carried out within the guidelines set by the Group Treasury. Generally the Group seeks to apply hedge accounting in order to manage volatility in profit or loss.
The Group also enters into fuel oil swaps to manage a portion of its exposure to fluctuations in the oil price on diesel fuels.
The Group does not enter into commodity contracts other than to meet the Group’s expected usage requirements; such contracts are not settled net.
Currency risk The Group is exposed to currency risk on sales, purchases and borrowings that are denominated in a currency other than the respective functional currencies of Group entities. The Group is primarily exposed to the Euro, the United States Dollar and Australian Dollar.
Generally the Group hedges 25% to 75% of its estimated foreign currency exposure in respect of forecast sales and purchases over the following 12 months. The Group hedges between 75% and 100% of all trade receivables, trade payables and firm and ascertainable commitments denominated in a foreign currency. The Group uses forward exchange contracts to hedge its currency risk, all with a maturity of less than one year from the reporting date. When necessary, forward exchange contracts are rolled over at maturity.
In respect of transactions not covered by forward exchange contracts or other monetary assets and liabilities denominated in foreign currencies that arise in the normal course, the Group ensures that its net exposure is kept to an acceptable level by buying or selling foreign currencies at spot rates when necessary.
The Group’s investments in foreign subsidiaries are not hedged as those currency positions are considered to be long-term in nature.

149
42. Financial risk management continued42.5 Market risk continued
Exposure to currency risk The Group’s exposure to significant foreign currency risk was as follows based on nominal amounts:
Trade receiva-
blesFC’m
Cash and
cash equiva-
lentsFC’m
Trade paya-
blesFC’m
Balance sheet expo-
sureFC’m
Esti-mated
forecast sales*FC’m
Esti-mated
forecast purchas-
es*FC’m
FECs on sales/
receiva-bles
FC’m
FECs on purchas-
es/ paya-
blesFC’m
Net forecast
FC expo-
sureFC’m
GroupNet exposure as at 30 June 2013Australian Dollar 1,2 1,5 – 2,7 11,0 – (7,2) – 6,5 Botswana Pula 23,1 22,0 (8,6) 36,5 – – – – 36,5 Euro 8,8 6,9 (2,7) 13,0 58,1 (17,9) (33,5) 19,7 39,4 US Dollar 2,1 4,3 (5,9) 0,5 18,7 (62,8) (9,5) 42,1 (11,0)
Zambian Kwacha 10,1 9,3 (2,6) 16,8 – – – – 16,8
Net exposure as at 30 June 2012Australian Dollar 1,2 2,0 (0,1) 3,1 8,6 – (7,3) – 4,4 Botswana Pula 22,5 29,2 (9,9) 41,8 – – – – 41,8 Euro 9,6 4,9 (3,5) 11,0 45,3 (21,3) (31,7) 27,2 30,5 US Dollar 2,7 4,1 (6,2) 0,6 8,1 (61,9) (5,7) 45,6 (13,3)
Zambian Kwacha 9 996,3 5 812,4 (1 312,7) 14 496,0 – – – – 14 496,0
* Estimated forecast sales and purchases reflect anticipated transactions for the 12 months from 30 June.
The following significant exchange rates applied during the year:
Reporting date30 June 2013 30 June 2012
1FC = X ZARClosing
rate
Average for the
yearClosing
rate
Average for the
year
Australian Dollar 9,1158 9,0617 8,3963 8,0220 Botswana Pula 0,8637 0,9051 1,0677 1,0735 Euro 12,9341 11,4606 10,3925 10,3972 US Dollar 9,9463 8,8467 8,1938 7,7732
Zambian Kwacha* 1,8182 1,7502 0,0016 0,0015
* In January 2013 the Zambian Kwacha was rebased and consequently the prior year is not comparable.
OV
ER
VIE
WB
USIN
ESS R
EV
IEW
GO
VE
RN
AN
CE
AN
NU
AL FIN
AN
CIA
L STATE
ME
NTS
SHA
RE
HO
LDE
R IN
FOR
MA
TION
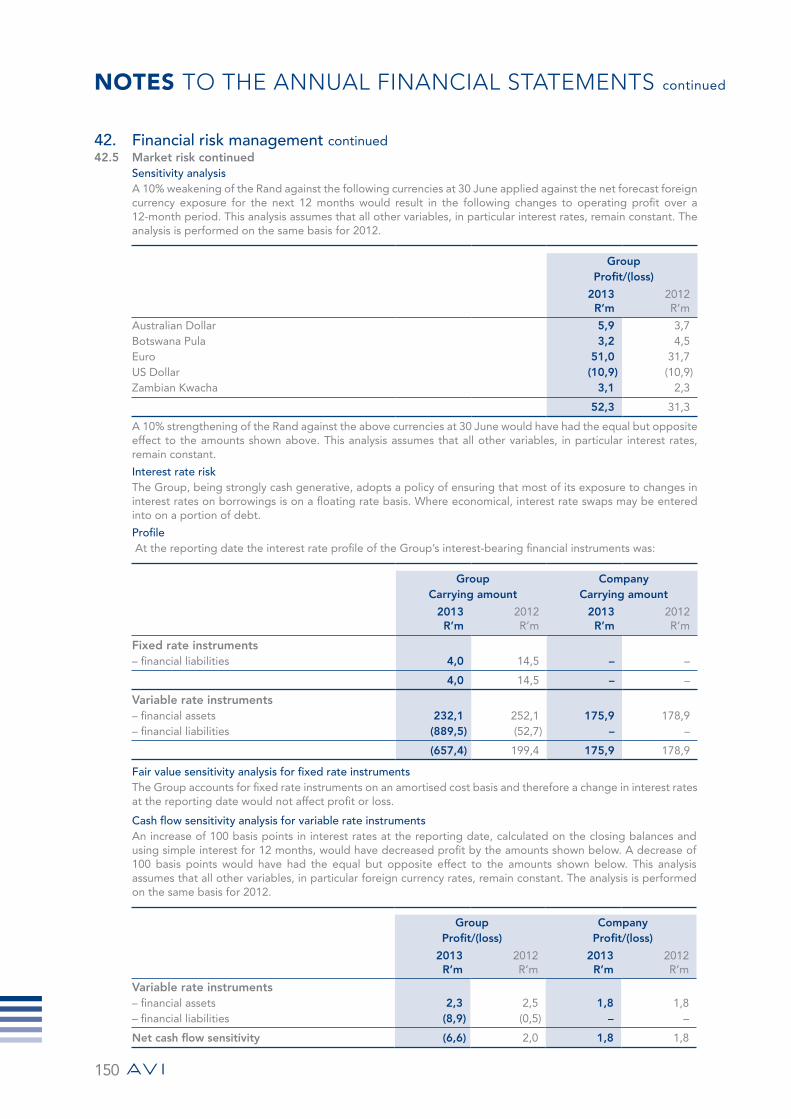
NOTES TO THE ANNUAL FINANCIAL STATEMENTS continued
150
42. Financial risk management continued 42.5 Market risk continued
Sensitivity analysis A 10% weakening of the Rand against the following currencies at 30 June applied against the net forecast foreign currency exposure for the next 12 months would result in the following changes to operating profit over a 12-month period. This analysis assumes that all other variables, in particular interest rates, remain constant. The analysis is performed on the same basis for 2012.
Group Profit/(loss)
2013R’m
2012R’m
Australian Dollar 5,9 3,7 Botswana Pula 3,2 4,5 Euro 51,0 31,7 US Dollar (10,9) (10,9)Zambian Kwacha 3,1 2,3
52,3 31,3
A 10% strengthening of the Rand against the above currencies at 30 June would have had the equal but opposite effect to the amounts shown above. This analysis assumes that all other variables, in particular interest rates, remain constant.
Interest rate risk The Group, being strongly cash generative, adopts a policy of ensuring that most of its exposure to changes in interest rates on borrowings is on a floating rate basis. Where economical, interest rate swaps may be entered into on a portion of debt.
Profile At the reporting date the interest rate profile of the Group’s interest-bearing financial instruments was:
Group Company Carrying amount Carrying amount
2013R’m
2012R’m
2013R’m
2012R’m
Fixed rate instruments– financial liabilities 4,0 14,5 – –
4,0 14,5 – –
Variable rate instruments– financial assets 232,1 252,1 175,9 178,9 – financial liabilities (889,5) (52,7) – –
(657,4) 199,4 175,9 178,9
Fair value sensitivity analysis for fixed rate instruments The Group accounts for fixed rate instruments on an amortised cost basis and therefore a change in interest rates at the reporting date would not affect profit or loss.
Cash flow sensitivity analysis for variable rate instruments An increase of 100 basis points in interest rates at the reporting date, calculated on the closing balances and using simple interest for 12 months, would have decreased profit by the amounts shown below. A decrease of 100 basis points would have had the equal but opposite effect to the amounts shown below. This analysis assumes that all other variables, in particular foreign currency rates, remain constant. The analysis is performed on the same basis for 2012.
Group Company Profit/(loss) Profit/(loss)
2013R’m
2012R’m
2013R’m
2012R’m
Variable rate instruments– financial assets 2,3 2,5 1,8 1,8 – financial liabilities (8,9) (0,5) – –
Net cash flow sensitivity (6,6) 2,0 1,8 1,8

151
Group Company
2013R’m
2012R’m
2013R’m
2012R’m
43. Finance income and expense Recognised in profit or lossFinance incomeInterest income on cash and cash equivalents, loans and receivables and other investments at amortised cost 10,9 16,0 – – Dividend income – – 22,9 28,7
Total 10,9 16,0 22,9 28,7
Finance costsInterest expense on borrowings 63,7 30,6 3,0 0,7
Total 63,7 30,6 3,0 0,7
Recognised in other comprehensive incomeForeign currency translation differences for foreign operations 48,5 59,7 Actuarial gain recognised 6,4 32,7 Changes in fair value of cash flow hedges 0,7 24,4 Income tax on other comprehensive income (2,1) (15,9)
Total 53,5 100,9
Recognised in:Hedging reserve 0,4 17,6 Actuarial reserve 4,6 23,6 Translation reserve 48,5 59,7
53,5 100,9
44. Financial assets and liabilities Accounting classifications and fair values The table below sets out the Group’s classification of each class of financial assets and liabilities, and their fair values:
As at 30 June 2013 As at 30 June 2012
Totalcarryingamount
R’m
Financialassets at fair value
R’m
Loans andreceivables
at amortised
costR’m
Total fair value
R’m
Total carrying amount
R’m
Financial assets at fair value
R’m
Loans and receivables
at amortised
costR’m
Total fair value
R’m
AssetsOther investments– Bank deposits – – – – 9,7 – 9,7 9,7 – Loan receivable 1,2 – 1,2 1,2 0,3 – 0,3 0,3 – Pension fund surplus 22,8 – 22,8 22,8 – – – – Other financial assets– Forward exchange contracts 54,6 54,6 – 54,6 25,7 25,7 – 25,7 – Fuel oil swap 2,7 2,7 – 2,7 – – – – Trade and other receivables– Trade accounts 1 235,7 – 1 235,7 1 235,7 1 172,0 – 1 172,0 1 172,0 – Other receivables 62,8 – 62,8 62,8 52,0 – 52,0 52,0 Cash and cash equivalents 212,4 – 212,4 212,4 242,1 – 242,1 242,1
1 592,2 57,3 1 534,9 1 592,2 1 501,8 25,7 1 476,1 1 501,8
OV
ER
VIE
WB
USIN
ESS R
EV
IEW
GO
VE
RN
AN
CE
AN
NU
AL FIN
AN
CIA
L STATE
ME
NTS
SHA
RE
HO
LDE
R IN
FOR
MA
TION
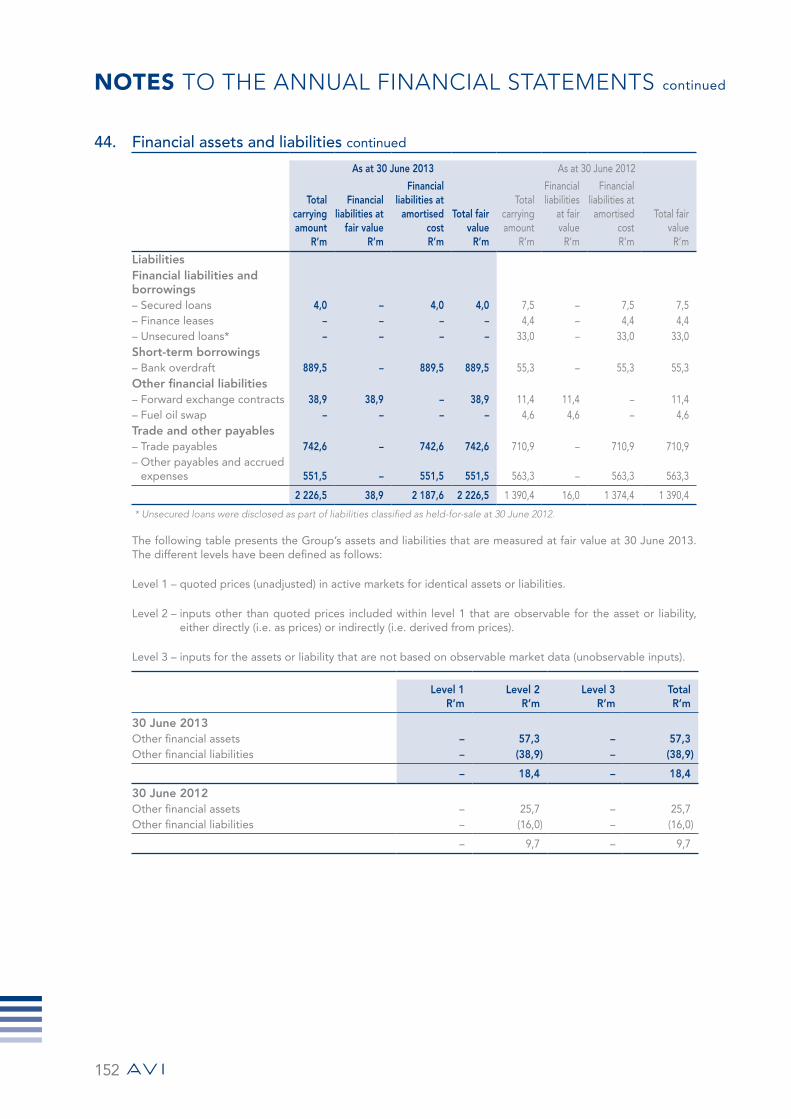
NOTES TO THE ANNUAL FINANCIAL STATEMENTS continued
152
44. Financial assets and liabilities continued
As at 30 June 2013 As at 30 June 2012
Total carrying amount
R’m
Financial liabilities at
fair valueR’m
Financial liabilities at
amortised costR’m
Total fair value
R’m
Total carrying amount
R’m
Financial liabilities
at fair value
R’m
Financial liabilities at amortised
costR’m
Total fair value
R’m
LiabilitiesFinancial liabilities and borrowings– Secured loans 4,0 – 4,0 4,0 7,5 – 7,5 7,5 – Finance leases – – – – 4,4 – 4,4 4,4 – Unsecured loans* – – – – 33,0 – 33,0 33,0 Short-term borrowings– Bank overdraft 889,5 – 889,5 889,5 55,3 – 55,3 55,3 Other financial liabilities– Forward exchange contracts 38,9 38,9 – 38,9 11,4 11,4 – 11,4 – Fuel oil swap – – – – 4,6 4,6 – 4,6 Trade and other payables– Trade payables 742,6 – 742,6 742,6 710,9 – 710,9 710,9 – Other payables and accrued
expenses 551,5 – 551,5 551,5 563,3 – 563,3 563,3
2 226,5 38,9 2 187,6 2 226,5 1 390,4 16,0 1 374,4 1 390,4
* Unsecured loans were disclosed as part of liabilities classified as held-for-sale at 30 June 2012.
The following table presents the Group’s assets and liabilities that are measured at fair value at 30 June 2013. The different levels have been defined as follows:
Level 1 – quoted prices (unadjusted) in active markets for identical assets or liabilities.
Level 2 – inputs other than quoted prices included within level 1 that are observable for the asset or liability, either directly (i.e. as prices) or indirectly (i.e. derived from prices).
Level 3 – inputs for the assets or liability that are not based on observable market data (unobservable inputs).
Level 1 R’m
Level 2 R’m
Level 3 R’m
Total R’m
30 June 2013 Other financial assets – 57,3 – 57,3 Other financial liabilities – (38,9) – (38,9)
– 18,4 – 18,4
30 June 2012 Other financial assets – 25,7 – 25,7 Other financial liabilities – (16,0) – (16,0)
– 9,7 – 9,7
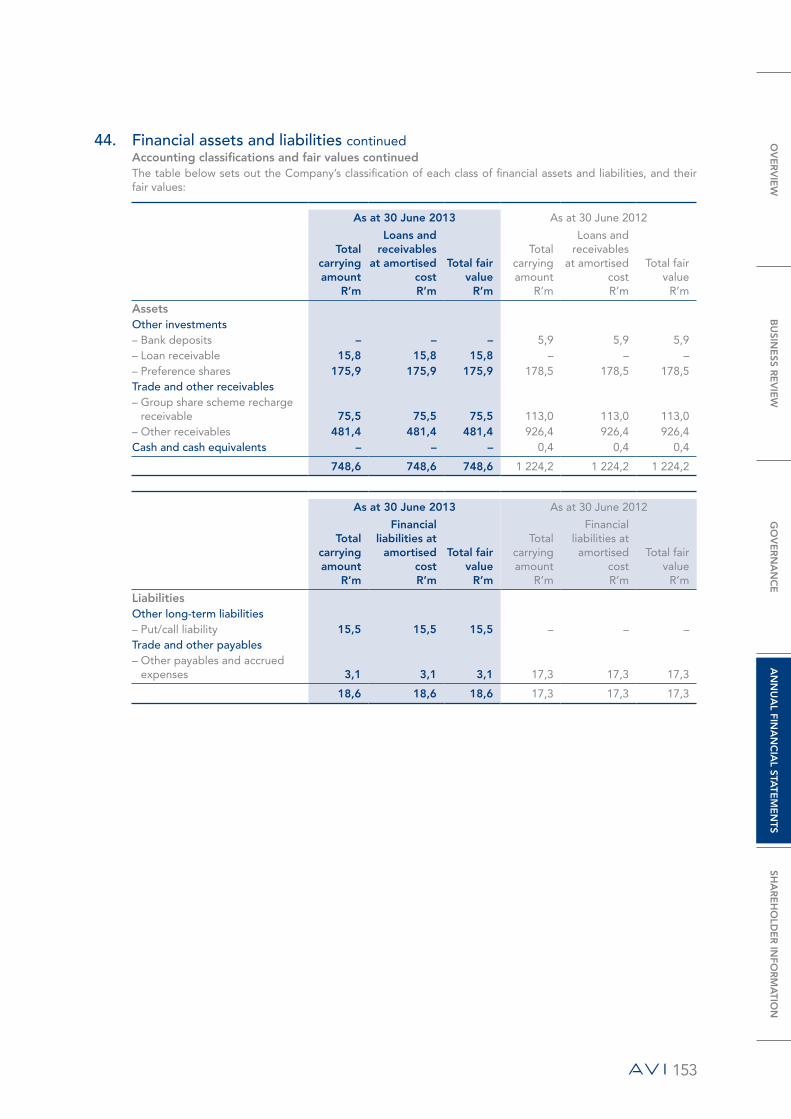
153
44. Financial assets and liabilities continued Accounting classifications and fair values continued The table below sets out the Company’s classification of each class of financial assets and liabilities, and their fair values:
As at 30 June 2013 As at 30 June 2012
Total carrying amount
R’m
Loans and receivables
at amortised costR’m
Total fair value
R’m
Total carrying amount
R’m
Loans and receivables
at amortised costR’m
Total fair value
R’m
AssetsOther investments– Bank deposits – – – 5,9 5,9 5,9 – Loan receivable 15,8 15,8 15,8 – – – – Preference shares 175,9 175,9 175,9 178,5 178,5 178,5 Trade and other receivables– Group share scheme recharge
receivable 75,5 75,5 75,5 113,0 113,0 113,0 – Other receivables 481,4 481,4 481,4 926,4 926,4 926,4 Cash and cash equivalents – – – 0,4 0,4 0,4
748,6 748,6 748,6 1 224,2 1 224,2 1 224,2
As at 30 June 2013 As at 30 June 2012
Total carrying amount
R’m
Financial liabilities at
amortised costR’m
Total fair value
R’m
Total carrying amount
R’m
Financial liabilities at amortised
costR’m
Total fair value
R’m
LiabilitiesOther long-term liabilities– Put/call liability 15,5 15,5 15,5 – – – Trade and other payables– Other payables and accrued
expenses 3,1 3,1 3,1 17,3 17,3 17,3
18,6 18,6 18,6 17,3 17,3 17,3
OV
ER
VIE
WB
USIN
ESS R
EV
IEW
GO
VE
RN
AN
CE
AN
NU
AL FIN
AN
CIA
L STATE
ME
NTS
SHA
RE
HO
LDE
R IN
FOR
MA
TION

NOTES TO THE ANNUAL FINANCIAL STATEMENTS continued
154
44. Financial assets and liabilities continued Determination of fair values A number of the Group’s accounting policies and disclosures require the determination of fair value, for both financial and non-financial assets and liabilities. Fair values have been determined for measurement and/or disclosure purposes based on the following methods. When applicable, further information about the assumptions made in determining fair values is disclosed in the notes specific to that asset or liability.
Cash and cash equivalents The carrying amount approximates fair value because of the short maturity of these instruments.
Trade and other receivables The fair value of trade and other receivables is estimated as the present value of future cash flows, discounted at the market rate of interest at the reporting date.
Derivatives The fair value of forward exchange contracts is marked to market by comparing the contracted forward rate to the present value of the current forward rate of an equivalent contract with the same maturity date.
The fair value of fuel oil swaps is calculated by comparing the contracted fixed rate to the present value of the current floating forward rate for a similar instrument at the measurement date.
The fair value of the Group share scheme recharge receivable is calculated by using the Black-Scholes model as well as the Monte Carlo valuation methodology which is used to project the TSR performance of the Group against a predefined peer group at the reporting and settlement date.
Non-derivative financial liabilities Fair value, which is determined for disclosure purposes, is calculated based on the present value of future principal and interest cash flows, discounted at the market rate of interest at the reporting date. For finance leases the market rate of interest is determined by reference to similar lease agreements.

155
ANALYSIS OF ORDINARY SHAREHOLDERSas at 30 June 2013
Shareholder spreadNumber of
shareholdings% of total
shareholdingsNumber of
shares% of issued
capital
1 – 1000 shares 5 504 47,20 2 926 525 0,851001 – 10 000 shares 5 064 43,42 16 278 215 4,7310 001 – 100 000 shares 823 7,06 24 808 411 7,22100 001 – 1 000 000 shares 216 1,85 69 692 789 20,261 000 001 shares and over 55 0,47 230 247 201 66,94
Total 11 662 100,00 343 953 141 100,00
Distribution of shareholdersCustodians 144 1,23 108 041 189 31,41Retirement benefit funds 239 2,05 76 230 110 22,16Collective investment schemes 191 1,64 50 766 202 14,76Assurance companies 43 0,37 29 120 866 8,47Retail shareholders 8 196 70,27 18 992 516 5,52Treasury 1 0,01 17 234 352 5,01Share schemes 2 0,03 16 328 865 4,75Trusts 2 108 18,08 11 740 603 3,41Scrip lending 22 0,19 3 096 829 0,90Private Companies 256 2,20 3 061 363 0,89Stockbrokers and nominees 37 0,32 2 516 301 0,73Foundations and charitable funds 144 1,23 1 851 407 0,54Hedge funds 18 0,15 1 442 503 0,42Organs of state 2 0,02 826 000 0,24Investment partnerships 74 0,63 614 244 0,18Insurance companies 15 0,13 552 022 0,16Medical aid funds 20 0,17 454 962 0,13Public companies 4 0,03 364 020 0,11Managed funds 17 0,15 323 139 0,10Close corporations 109 0,93 305 482 0,09Public entities 4 0,03 77 587 0,02Unclaimed scrip 16 0,14 12 579 0,00
Total 11 662 100,00 343 953 141 100,00
Shareholder typeNon-public shareholders 12 0,10 86 491 963 25,15Directors and Associates (Excluding employee share schemes) 1 741 543 0,22Government Employees Pension Fund 8 52 187 203 15,17AVI Investment Services Proprietary Limited 1 17 234 352 5,01Employee share schemes 2 16 328 865 4,75Public shareholders 11 650 99,90 257 461 178 74,85
Total 11 662 100,00 343 953 141 100,00
Beneficial shareholders with a holding greater than 3% of the issued shares
Number of shares
% of issued capital
Government Employees Pension Fund 52 187 203 15,17Liberty Group 22 108 405 6,43AVI Investment Services Proprietary Limited 17 234 352 5,01AVI Black Staff Empowerment Scheme Trust 14 771 489 4,29Fidelity International 11 812 744 3,43
Total 118 114 193 34,33
Total number of shareholdings 11 662Total number of shares in issue 343 953 141
Share price performanceOpening price 2 July 2012 R50,00Closing price 28 June 2013 R59,45Closing high for the period (4 October 2012) R61,35Closing low for the period (2 July 2012) R50,74Number of shares in issue 343 953 141Volume traded during period 266 412 531Ratio of volume traded to shares issued 77,46%Rand value traded during the period R15 092 536 895
OV
ER
VIE
WB
USIN
ESS R
EV
IEW
GO
VE
RN
AN
CE
AN
NU
AL FIN
AN
CIA
L STATE
ME
NTS
SHA
RE
HO
LDE
R IN
FOR
MA
TION

156
ShArehoLderS’ DIARY
Reports and profit statements 2013Half-year interim report announcement in press Tuesday, 12 March
Results announcement in press Tuesday, 10 September
Annual financial statements posted Monday, 30 September
Final dividend and special dividend on ordinary sharesDividends declared Friday, 6 September
Details of dividends announcement on SENS Monday, 9 September
Details of dividends announcement in press Tuesday, 10 September
Last day to trade cum dividend on the JSE Limited (“JSE”) Friday, 11 October
First trading day ex dividend on the JSE Monday, 14 October
Record date Friday, 18 October
Payment date Monday, 21 October
In accordance with the requirements of Strate Limited, no share certificates may be dematerialised or rematerialised between Monday, 14 October 2013 and Friday, 18 October 2013, both days inclusive.
Dividends in respect of certificated shareholders will be transferred electronically to shareholders’ bank accounts on payment date. In the absence of specific mandates, dividend cheques will be posted to shareholders. Shareholders who hold dematerialised shares will have their accounts at their Central Securities Depository Participant (“CSDP”) or broker credited on Monday, 21 October 2013.

157
NotIce OF ANNuAL gENERAL mEEtINg
AVI Limited(Incorporated in the Republic of South Africa)(Registration number 1944/017201/06)Share code: AVIISIN: ZAE000049433(“AVI” or “the Company” or “the Group”) NOTICE OF ANNUAL GENERAL MEETINGINCORPORATING A FORM OF PROXY FOR THE USE OF HOLDERS OF CERTIFICATED ORDINARY SHARES AND DEMATERIALISED ORDINARY SHARES WITH “OWN NAME” REGISTRATION ONLY.
Notice is hereby given that the sixty-ninth Annual General Meeting of members of the Company will be held at 2 Harries Road, Illovo, Johannesburg, on Wednesday, 30 October 2013 at 11:00 for the following purposes:
To consider and if deemed fit, to pass with or without modification, ordinary resolutions 1 to 10. In terms of the Companies Act 71 of 2008, as amended (“the Companies Act”), for an ordinary resolution to be adopted, it must be supported by more than 50% of the total number of votes which the shareholders present or represented by proxy at this meeting are entitled to cast.
1. “That the annual financial statements for the year ended 30 June 2013, together with the reports of the directors, the independent auditors, and the Audit and Risk Committee, be and are hereby adopted.”
2. “That KPMG Inc. be and are hereby re-appointed as the external auditors of the Company.”3. “That Mr A Nühn, who will retire by rotation in accordance with the Company’s Memorandum of Incorporation and
who, being eligible, offers himself for re-election, be and is hereby re-elected as a director of the Company.”*4. “That Mr AM Thebyane, who will retire by rotation in accordance with the Company’s Memorandum of Incorporation
and who, being eligible, offers himself for re-election, be and is hereby re-elected as a director of the Company.”*5. “That Mr BJK Smith, who will retire by rotation in accordance with the Company’s Memorandum of Incorporation
and who, being eligible, offers himself for re-election, be and is hereby re-elected as a director of the Company.”*6. “That Mrs NP Dongwana, who will retire by rotation in accordance with the Company’s Memorandum of Incorporation
and who, being eligible, offers herself for re-election, be and is hereby re-elected as a director of the Company.”*7. “That Mr M Koursaris be and is hereby elected as an executive director of the Company.”*8. “That Mr MJ Bosman, be and is hereby elected as a member and the chairman of the Audit and Risk Committee.”*9. “That Mr JR Hersov, be and is hereby elected as a member of the Audit and Risk Committee.”*10. “That Mrs NP Dongwana, be and is hereby elected as a member of the Audit and Risk Committee.”*
*Brief CVs of the directors appear on page 54 of the Integrated Annual Report.
OV
ER
VIE
WB
USIN
ESS R
EV
IEW
GO
VE
RN
AN
CE
AN
NU
AL FIN
AN
CIA
L STATE
ME
NTS
SHA
RE
HO
LDE
R IN
FOR
MA
TION

158
NotIce OF ANNuAL gENERAL mEEtINg continued
To consider and if deemed fit, to pass with or without modification, special resolutions 11 to 21. In terms of the Companies Act for a special resolution to be adopted, it must be supported by at least 75% of the total number of votes which the shareholders present or represented by proxy at this meeting are entitled to cast.
11. “That with effect from 1 July 2013 the fees payable to the current non-executive directors, excluding the Chairman of the Board and the foreign non-executive director, Mr Adriaan Nühn, be increased from R215 000 per year to R230 000 per year.”
12. “That with effect from 1 July 2013 the fees payable to the Chairman of the Board be increased from R632 000 per year to R676 000 per year.”
13. “That with effect from 1 July 2013 the fees payable to the foreign non-executive director, Mr A Nühn, be increased from Euro 38 500 per year to Euro 41 000 per year.”
14. “That with effect from 1 July 2013 the fees payable to the members of the Remuneration, Nomination and Appointments Committee, excluding the Chairman of this committee, be increased from R70 000 per year to R78 500 per year.”
15. “That with effect from 1 July 2013 the fees payable to the members of the Audit and Risk Committee, excluding the Chairman of this committee, be increased from R80 000 per year to R85 500 per year.”
16. “That with effect from 1 July 2013 the fees payable to the members of the Social and Ethics Committee, excluding the Chairman of this committee, be increased from R54 000 per year to R58 000 per year.”
17. “That with effect from 1 July 2013 the fees payable to the Chairman of the Remuneration, Nomination and Appointments Committee be increased from R160 000 per year to R171 000 per year. If the foreign non-executive director, Mr A Nühn, is Chairman of the Remuneration, Nomination and Appointments Committee, the fee will be Euro 13 500 per year with effect from 1 July 2013.”
18. “That with effect from 1 July 2013 the fees payable to the Chairman of the Audit and Risk Committee be increased from R173 000 per year to R185 000 per year.”
19. “That with effect from 1 July 2013 the fees payable to the Chairman of the Social and Ethics Committee, be increased from R80 000 per year to R85 500 per year.”
The increases in non-executive directors’ fees proposed in terms of special resolutions 11 to 19 above are based on a detailed review and comparison of non-executive directors’ fees to market-related benchmarks. Non-executive directors’ fees are paid as a combination of a fixed retainer and for attendance at formally convened meetings.
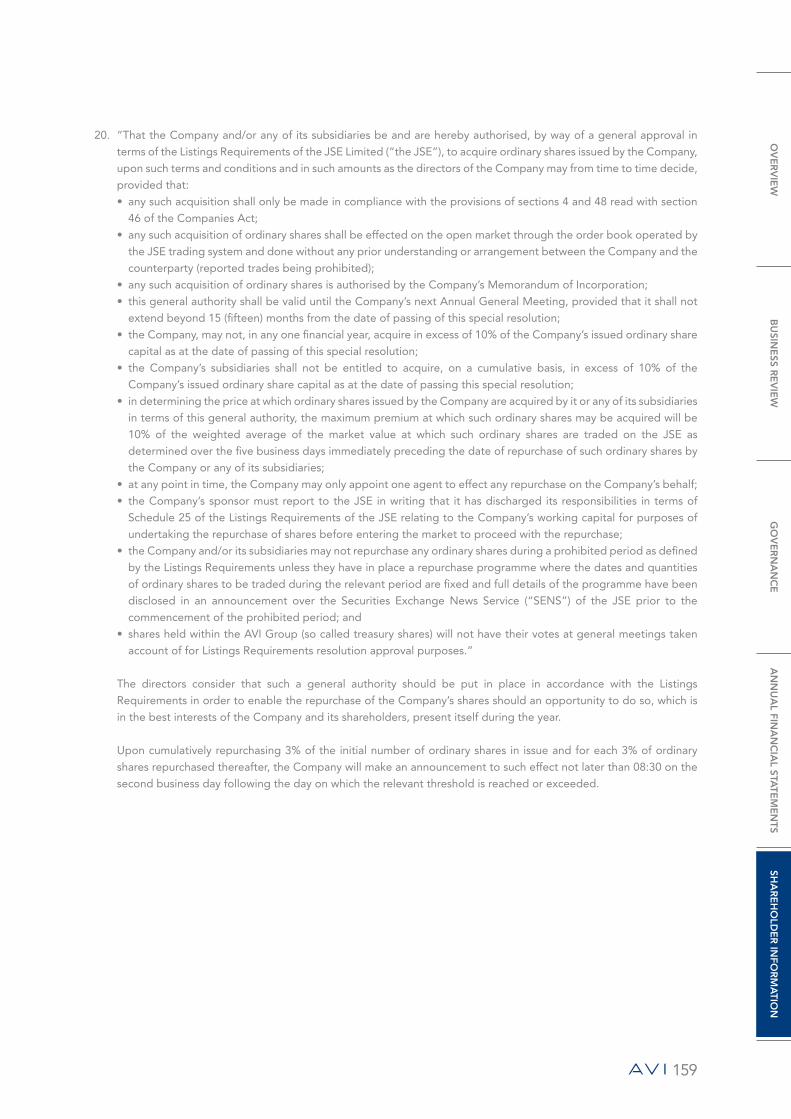
159
20. “That the Company and/or any of its subsidiaries be and are hereby authorised, by way of a general approval in terms of the Listings Requirements of the JSE Limited (“the JSE”), to acquire ordinary shares issued by the Company, upon such terms and conditions and in such amounts as the directors of the Company may from time to time decide, provided that:• any such acquisition shall only be made in compliance with the provisions of sections 4 and 48 read with section
46 of the Companies Act;• any such acquisition of ordinary shares shall be effected on the open market through the order book operated by
the JSE trading system and done without any prior understanding or arrangement between the Company and the counterparty (reported trades being prohibited);
• any such acquisition of ordinary shares is authorised by the Company’s Memorandum of Incorporation;• this general authority shall be valid until the Company’s next Annual General Meeting, provided that it shall not
extend beyond 15 (fifteen) months from the date of passing of this special resolution;• the Company, may not, in any one financial year, acquire in excess of 10% of the Company’s issued ordinary share
capital as at the date of passing of this special resolution;• the Company’s subsidiaries shall not be entitled to acquire, on a cumulative basis, in excess of 10% of the
Company’s issued ordinary share capital as at the date of passing this special resolution; • in determining the price at which ordinary shares issued by the Company are acquired by it or any of its subsidiaries
in terms of this general authority, the maximum premium at which such ordinary shares may be acquired will be 10% of the weighted average of the market value at which such ordinary shares are traded on the JSE as determined over the five business days immediately preceding the date of repurchase of such ordinary shares by the Company or any of its subsidiaries;
• at any point in time, the Company may only appoint one agent to effect any repurchase on the Company’s behalf;• the Company’s sponsor must report to the JSE in writing that it has discharged its responsibilities in terms of
Schedule 25 of the Listings Requirements of the JSE relating to the Company’s working capital for purposes of undertaking the repurchase of shares before entering the market to proceed with the repurchase;
• the Company and/or its subsidiaries may not repurchase any ordinary shares during a prohibited period as defined by the Listings Requirements unless they have in place a repurchase programme where the dates and quantities of ordinary shares to be traded during the relevant period are fixed and full details of the programme have been disclosed in an announcement over the Securities Exchange News Service (“SENS”) of the JSE prior to the commencement of the prohibited period; and
• shares held within the AVI Group (so called treasury shares) will not have their votes at general meetings taken account of for Listings Requirements resolution approval purposes.”
The directors consider that such a general authority should be put in place in accordance with the Listings Requirements in order to enable the repurchase of the Company’s shares should an opportunity to do so, which is in the best interests of the Company and its shareholders, present itself during the year.
Upon cumulatively repurchasing 3% of the initial number of ordinary shares in issue and for each 3% of ordinary shares repurchased thereafter, the Company will make an announcement to such effect not later than 08:30 on the second business day following the day on which the relevant threshold is reached or exceeded.
OV
ER
VIE
WB
USIN
ESS R
EV
IEW
GO
VE
RN
AN
CE
AN
NU
AL FIN
AN
CIA
L STATE
ME
NTS
SHA
RE
HO
LDE
R IN
FOR
MA
TION
160
NotIce OF ANNuAL gENERAL mEEtINg continued
21. “That the Company be and is hereby authorised, in terms of section 45 of the Companies Act, to provide direct or indirect financial assistance by way of loan, guarantee, the provision of security or otherwise to any of its present or future subsidiaries and/or any other company or entity that is or becomes related or inter-related to the Company, for any purpose or in connection with any matter, including but not limited to, the subscription for any option, or any securities issued or to be issued by the Company or a related or inter-related company, or for the purchase of any securities of the Company or a related or inter-related company.”
The directors consider that such a general authority should be put in place in order to assist the Company inter alia to make inter-company loans to subsidiaries as well as to grant letters of support and guarantees in appropriate circumstances. The existence of a general authority would avoid the need to refer each instance to shareholders for approval. This general authority would be valid up to and including the 2014 Annual General Meeting of the Company.
To consider the non-binding ordinary resolution 22.
22. “That, by way of a non-binding advisory ordinary resolution, the Company’s remuneration policy as set out in the Remuneration Report, be and is hereby endorsed.”
King III dealing with boards and directors require companies to table their remuneration policy every year to shareholders by way of a non-binding advisory vote at the Annual General Meeting. This vote enables shareholders to express their views on the remuneration policy adopted.
To consider any other business.
23. To transact such other business as may be transacted at an Annual General Meeting.
Directors’ statementThe directors, having considered the effects of special resolutions 20 and 21 above, consider that for a period of 12 (twelve) months after the date of this notice:
• the Company and the Group will be able, in the ordinary course of business, to pays their debts;• the assets of the Company and the Group, fairly valued in accordance with generally accepted accounting practice,
will exceed the liabilities of the Company and the Group; and• the Company and the Group’s ordinary share capital, reserves and working capital will be adequate for ordinary
business purposes.

161
General informationThe following additional information, some of which may appear elsewhere in the Integrated Annual Report of which this notice forms part, is provided in terms of the Listings Requirements of the JSE for purposes of the general authority to repurchase shares (resolution 20):• directors and management – pages 54 and 55;• major beneficial shareholders – pages 138 and 155;• directors’ interests in securities – page 77;• share capital of the Company page 115;
Litigation statementThe directors, whose names appear on pages 54 to 55 of the Integrated Annual Report, are not aware of any legal or arbitration proceedings that are pending or threatened, that may have or have had in the recent past, being at least the previous 12 (twelve) months, a material effect on the Group’s financial position.
Directors’ responsibility statementThe directors, whose names appear on pages 54 and 55 of the Integrated Annual Report, collectively and individually accept full responsibility for the accuracy of the information pertaining to resolutions 20 and 21 above and certify that, to the best of their knowledge and belief, there are no facts that have been omitted which would make any statement false or misleading, and that all reasonable enquiries to ascertain such facts have been made and that this notice contains all information required by law and the Listings Requirements of the JSE.
Material changesOther than the facts and developments reported on in the Integrated Annual Report, there have been no material changes in the affairs or financial position of the Company and its subsidiaries since the date of signature of the annual report and up to the date of this notice.
Record dateThe directors have determined in accordance with sections 59(1)(a) and (b) that:• the record date for the purposes of receiving notice of the Annual General Meeting shall be the close of business on
Monday, 30 September 2013; and• the record date for the purposes of the Annual General Meeting (being the date on which a shareholder must be
registered in the Company’s share register in order to participate in and vote at the Annual General Meeting) shall be the close of business on Friday, 25 October 2013.
IdentificationIn terms of section 63(1) of the Companies Act, before any person may attend or participate in an Annual General Meeting, that person must present reasonably satisfactory identification and the person presiding at the Annual General Meeting must be reasonably satisfied that the right of the person to participate in and vote at the Annual General Meeting, either as a shareholder, or as a proxy for a shareholder, has been reasonably verified.
OV
ER
VIE
WB
USIN
ESS R
EV
IEW
GO
VE
RN
AN
CE
AN
NU
AL FIN
AN
CIA
L STATE
ME
NTS
SHA
RE
HO
LDE
R IN
FOR
MA
TION

162
NotIce OF ANNuAL gENERAL mEEtINg continued
Voting and proxiesOn a show of hands, every shareholder who is present in person or by proxy at the Annual General Meeting shall have one vote, and on a poll, every shareholder who is present in person or by proxy at the Annual General Meeting or which (being a company or body corporate) is represented, shall have one vote for every ordinary share in the Company of which such shareholder is the holder.
Dematerialised shareholders (who are not “own-name” dematerialised shareholders) who wish to attend the Annual General Meeting or to vote by way of proxy, must contact their Central Securities Depository Participant (“CSDP”) or broker who will furnish them with the necessary authority to attend the Annual General Meeting or they must provide their CSDP or broker with their voting instructions in terms of the relevant custody agreement entered into between them and their CSDP or broker.
Shareholders entitled to attend and vote at the Annual General Meeting may appoint one or more persons as such shareholder’s proxy to attend, speak and vote in its stead. A proxy need not be a shareholder of the Company.
A form of proxy is attached for the convenience of certificated shareholders and “own-name” dematerialised shareholders only, who are unable to attend the Annual General Meeting, but who wish to be represented thereat. In order to be valid, duly completed forms of proxy must be received by the transfer secretaries of the Company, Computershare Investor Services Proprietary Limited, 70 Marshall Street, Johannesburg 2001 (PO Box 61051, Marshalltown, 2107) by not later than 11:00 on Tuesday, 29 October 2013.
By order of the Board
Sureya NaidooCompany Secretary 2 Harries Road, Illovo30 September 2013
163
form OF pROxY
AVI Limited(Incorporated in the Republic of South Africa)(Registration number 1944/017201/06)JSE code: AVI • ISIN: ZAE000049433(“AVI” or “the Company”)
For use only by shareholders holding certificated shares, nominee companies of a Central Securities Depository Participant (“CSDP”), brokers’ nominee companies and shareholders who have dematerialised their shares and who have elected own- name registration at the sixty-ninth Annual General Meeting of the Company, to be held at 2 Harries Road, Illovo, Johannesburg, 2196 at 11:00 on Wednesday, 30 October 2013 (“Annual General Meeting”).
Shareholders who have already dematerialised their shares through a CSDP or broker must not complete this form of proxy but must provide their CSDP or broker with their voting instructions.
Holders of dematerialised shares, other than those with “own-name” registration, who wish to attend the Annual General Meeting must inform their CSDP or broker of such intention and request their CSDP or broker to issue them with the necessary authorisation to attend the meeting.
I/We
of (address)
being the holder/s of ordinary shares in the Company, do hereby appoint:
1. or failing him/her,
2. or failing him/her,
3. the chairman of the Annual General Meeting,as my/our proxy to act for me/us at the Annual General Meeting which will be held for the purpose of considering and, if deemed fit, passing, with or without modification, the resolutions to be proposed thereat and at each adjournment thereof and to vote or abstain from voting on such resolutions in respect of the ordinary shares in the issued capital of the Company registered in my/our name/s in accordance with the following instructions (see note 2):
Resolution number
Number of votes (one vote per share)
In favour of Against Abstain1. Adoption of the financial statements for the year ended 30 June 20132. Re-appointment of KPMG Inc. as the external auditors of the
Company3. Re-election of Mr A Nühn as a director4. Re-election of Mr AM Thebyane as a director5. Re-election of Mr BJK Smith as a director6. Re-election of Mrs NP Dongwana as a director7. Election of Mr M Koursaris as an executive director8. Appointment of Mr MJ Bosman as a member and Chairman of the
Audit and Risk Committee 9. Appointment of Mr JR Hersov as a member of the Audit and Risk
Committee10. Appointment of Mrs NP Dongwana as a member of the Audit and
Risk Committee11. Special resolution (increase in fees payable to non-executive directors,
excluding the Chairman of the Board and the foreign non-executive director)
12. Special resolution (increase in fees payable to the Chairman of the Board)
13. Special resolution (increase in fees payable to the foreign non-executive director)
14. Special resolution (increase in fees payable to members of the Remuneration, Nomination and Appointments Committee)
15. Special resolution (increase in fees payable to members of the Audit and Risk Committee)
16. Special resolution (increase in fees payable to members of the Social and Ethics Committee)
17. Special resolution (increase in fees payable to Chairman of the Remuneration, Nomination and Appointments Committee)
18. Special resolution (increase in fees payable to Chairman of the Audit and Risk Committee)
19. Special resolution (increase in fees payable to Chairman of the Social and Ethics Committee)
20. Special resolution (general authority to buy back shares)21. Special resolution (financial assistance to group entities)22. Ordinary resolution to endorse the remuneration policy (non-binding
advisory vote)Insert an “X” in the relevant space above according to how you wish your votes to be cast, however, if you wish to cast your votes in respect of less than all of the ordinary shares that you own in the Company, insert the number of ordinary shares held in respect of which you desire to vote.
Signed at on 2013
Signature
Assisted by me (where applicable)
Each shareholder is entitled to appoint one or more proxies (none of whom need be a member of the Company) to attend, speak and, on a poll, vote in place of that shareholder at the Annual General Meeting.Please read the notes on the reverse side hereof
OV
ER
VIE
WB
USIN
ESS R
EV
IEW
GO
VE
RN
AN
CE
AN
NU
AL FIN
AN
CIA
L STATE
ME
NTS
SHA
RE
HO
LDE
R IN
FOR
MA
TION
164
NoteS tO FORm OF pROxY
1. A shareholder may insert the name of a proxy or the names of two alternative proxies of the shareholder’s choice in the space/s provided, with or without deleting “the Chairman of the Annual General Meeting”, but any such deletion must be initialled by the shareholder concerned. The person whose name stands first on the form of proxy and who is present at the Annual General Meeting will be entitled to act as proxy to the exclusion of those whose names follow.
2. Please insert an “X” in the relevant spaces according to how you wish your votes to be cast. However, if you wish to cast your votes in respect of a lesser number of shares than you own in the Company, insert the number of ordinary shares held in respect of which you wish to vote. Failure to comply with the above will be deemed to authorise the Chairman of the Annual General Meeting, if he is the proxy, to vote in favour of and any other proxy to vote or to abstain from voting in respect of the resolutions to be considered at the Annual General Meeting as he/she deems fit, in either case, in respect of all the shareholder’s votes exercisable thereat. A shareholder or the proxy is not obliged to exercise all the votes exercisable by the shareholder or by the proxy, but the total of the votes cast and in respect whereof abstention is recorded may not exceed the total of the votes exercisable by the shareholder or by the proxy.
3. Duly completed forms of proxy must be received at the office of the transfer secretaries, Computershare Investor Services Proprietary Limited, Ground Floor, 70 Marshall Street, Johannesburg, 2001 or posted to PO Box 61051, Marshalltown, 2107 to be received by not later than 11:00 on Tuesday, 29 October 2013.
4. The completion and lodging of this form of proxy will not preclude the relevant shareholder from attending the Annual General Meeting and speaking and voting in person thereat to the exclusion of any proxy appointed in terms hereof. The appointment of a proxy or proxies is furthermore revocable, in which case a shareholder may revoke the proxy appointment by cancelling it in writing or making a later inconsistent appointment of a proxy, and delivering a copy of the revocation instrument to the proxy and to the Company.
5. Documentary evidence establishing the authority of a person signing this form of proxy in a representative capacity must be attached to this form of proxy unless previously recorded by the Company’s transfer secretaries or waived by the Chairman of the Annual General Meeting.
6. Any alteration or correction made to this form of proxy must be initialled by the signatory/ies.
7. A minor must be assisted by his/her parent or guardian unless the relevant documents establishing his/her legal capacity are produced or have been registered by the transfer secretaries of the Company.
8. The Chairman of the Annual General Meeting may reject or accept a form of proxy which is completed and/or received other than in accordance with these notes if he is satisfied as to the manner in which the shareholder wishes to vote.
9. If the instrument appointing a proxy or proxies has been delivered to the Company, as long as that appointment remains in effect, any notice that is required by the Companies Act or the Company’s Memorandum of Incorporation to be delivered by the Company to the shareholder must be delivered by the Company to the shareholder, or to the proxy or proxies, if the shareholder has directed the Company to do so in writing and paid any reasonable fee charged by the Company for doing so.
10. The appointment of a proxy or proxies remains valid only until the end of the Annual General Meeting subject to any revocation thereof.

admInIstratIon and PrinciPaL sUbsidiaries
Bastion Graphics
Administration Company registrationAVI Limited (“AVI”)Reg No: 1944/017201/06Share code: AVIISIN: ZAE000049433
Company secretarySureya Naidoo
Group financial managerJustin O’Meara
Business address and registered office2 Harries RoadIllovoJohannesburg 2196South Africa
PO Box 1897Saxonwold 2132South Africa
Telephone: +27 (0)11 502 1300Telefax: +27 (0)11 502 1301Email: [email protected]: www.avi.co.za
AuditorsKPMG Inc.
SponsorThe Standard Bank of South Africa Limited
Commercial bankersStandard BankFirstRand Bank
Transfer secretariesComputershare Investor Services Proprietary Limited70 Marshall StreetMarshalltownJohannesburg 2001South Africa
PO Box 61051Marshalltown 2107South AfricaTelephone: +27 (0)11 370 5000Telefax: +27 (0)11 370 5271
Principal subsidiariesFood and beverage brandsNational Brands LimitedReg No: 1948/029389/06(incorporating Entyce Beverages and Snackworks)
30 Sloane StreetBryanston 2021
PO Box 5159Rivonia 2128Telefax: +27 (0)11 707 7799
Managing DirectorsSarah-Anne Orphanides (Entyce Beverages)Telephone: +27 (0)11 707 7100
Gaynor Poretti (Snackworks)Telephone: +27 (0)11 707 7200
I&JIrvin & Johnson Holding Company Proprietary LimitedReg No: 2004/013127/07
1 Davidson StreetWoodstockCape Town 8001
PO Box 1628Cape Town 8000
Managing DirectorJonty JankovichTelephone: +27 (0)21 402 9200Telefax: +27 (0)21 402 9282
Fashion BrandsPersonal careIndigo Brands Proprietary LimitedReg No: 2003/009934/07
16-20 Evans AvenueEpping 1 7460
PO Box 3460Cape Town 8000
Telephone: +27 (0)21 507 8500Telefax: +27 (0)21 507 8501
Footwear & ApparelDivisional Managing DirectorRobert LuntTelephone: +27 (0)11 707 7300Telefax: +27 (0)11 707 7763
A&D Spitz Proprietary LimitedReg No: 1999/025520/07
29 Eaton Avenue Bryanston 2021
PO Box 782916Sandton 2145
Managing DirectorPaul PresburyTelephone: +27 (0)11 707 7300Telefax: +27 (0)11 707 7763
Green CrossIncorporating the following legal entities:Green Cross Manufacturing Proprietary Limited Reg No: 1994/08549/07Green Cross Properties Proprietary LimitedReg No: 1994/09874/07Green Cross Retail Holdings Proprietary LimitedReg No: 1998/003766/07
26 – 30 Benbow AvenueEpping Industria7460
PO Box 396Epping Industria 7475
Managing DirectorGreg SmithTelephone: +27 (0)21 507 9700Telefax: +27 (0)21 507 9707

aV
i 20
13
int
eg
ra
te
d a
nn
Ua
L r
eP
Or
t