2013 methods-of-payment survey results · 2013 methods-of-payment survey results . by . ... and the...
TRANSCRIPT
Discussion Paper/Document d’analyse 2015-4
2013 Methods-of-Payment Survey Results
by Christopher S. Henry, Kim P. Huynh and Q. Rallye Shen

2
Bank of Canada Discussion Paper 2015-4
April 2015
2013 Methods-of-Payment Survey Results
by
Christopher S. Henry, Kim P. Huynh and Q. Rallye Shen
Currency Department Bank of Canada
Ottawa, Ontario, Canada K1A 0G9 [email protected] [email protected] [email protected]
Bank of Canada discussion papers are completed research studies on a wide variety of technical subjects relevant to central bank policy. The views expressed in this paper are those of the authors.
No responsibility for them should be attributed to the Bank of Canada.
ISSN 1914-0568 © 2015 Bank of Canada
ii
Acknowledgements
We thank our colleagues, notably, Heng Chen, Geoffrey Dunbar, Ben Fung, Brian Peterson, Gerald Stuber, Kyle Vincent, Angelika Welte and Russell Tza-Nga Wong for their comments and suggestions. We thank Maren Hansen for her excellent editorial assistance, as well as Jeff Abbott, Darcy Bowman and Iona Trottier for providing us sage advice throughout the process. We acknowledge Shelley Edwards, Jessica Wu and the Ipsos Reid team for their superb collaboration on this project. Finally, we thank our central bank and research counterparts who provided feedback and advice on the survey: Kevin Foster (Federal Reserve Bank of Boston), Geoffrey Gerdes (Federal Reserve Board), Cathy Haggerty (NORC), Arthur Kennickell (Federal Reserve Board), Tobias Schmidt (Bundesbank), and Helmut Stix (Oesterreichische Nationalbank).

iii
Abstract
As the sole issuer of bank notes, the Bank of Canada conducts methods-of-payment (MOP) surveys to obtain a detailed and representative snapshot of Canadian payment choices, with a focus on cash usage. Overall, cash usage at the point of sale has decreased since 2009, constituting 44 per cent of payment volume and 23 per cent in terms of value, and the median value of a cash transaction is about $9. Respondents’ perceptions and demographic factors are used to interpret survey data: cash is seen as a convenient, low-cost, secure and widely accepted form of payment, and is used most widely among respondents who are age 55 and above, have an income less than $45,000 or have only a high school education. The paper also provides a comprehensive view of payment innovations, such as stored-value cards, contactless credit/debit cards or mobile payments, which are often perceived as substitutes for cash. JEL classification: E4 Bank classification: Bank notes; E-money
Résumé
En tant qu’unique autorité habilitée à émettre des billets de banque au pays, la Banque du Canada réalise des enquêtes sur les modes de paiement. Celles-ci lui fournissent un aperçu détaillé et représentatif des choix de méthodes de paiement des Canadiens, en mettant l’accent sur l’utilisation de l’argent comptant. Dans l’ensemble, le règlement de transactions aux points de vente avec de l’argent liquide, en diminution depuis 2009, représente 44 % du volume des paiements et 23 % de la valeur totale des transactions. La valeur médiane des transactions réglées comptant s’établit à environ 9 $. Les données de l’enquête sont interprétées à la lumière des perceptions des répondants et de facteurs démographiques, et permettent de conclure que l’argent liquide est considéré comme un mode de paiement commode, peu coûteux, sûr et largement accepté; son utilisation est plus répandue chez les répondants âgés de 55 ans ou plus, dont le revenu est inférieur à 45 000 $ et dont le plus haut niveau de scolarité est un diplôme d’études secondaires. L’étude donne également un portrait complet des innovations en matière de paiement – notamment les cartes prépayées, les cartes de crédit et de débit sans contact et les paiements mobiles –, qui sont souvent perçues comme des substituts de l’argent comptant.
Classification JEL : E4 Classification de la Banque : Billets de banque, Monnaie électronique
1 IntroductionAs the sole issuer of bank notes, the Bank of Canada is interested in the evolution of Cana-
dians’ use of cash and how it compares with other payment methods. Cash usage is difficult tomeasure, since cash is an anonymous payment method, but is nevertheless important to trackfor both research and policy reasons. Therefore, the 2013 Methods-of-Payment (MOP) Surveywas undertaken by the Currency Department of the Bank to provide a complete picture of bothcash and non-cash payments. It focuses on the following components: (1) the types of paymentinstruments Canadians are adopting and using, especially innovations that could potentially re-place cash, such as stored-value cards, contactless credit/debit cards or mobile payments; (2) adetailed picture of how consumers manage their cash with respect to withdrawals, cash hold-ings and other uses of cash beyond typical retail purchases; (3) payment patterns in terms ofdemographics and point-of-sale characteristics; and (4) consumers’ perceptions of the variouspayment instruments.
The 2013 MOP Survey is designed with these objectives in mind and consists of two parts:a survey questionnaire (SQ) that collects information on the respondent’s payment methodsand their characteristics, and a diary survey instrument (DSI) that records all cash and non-cash payments over a three-day period. In addition, the DSI collects information on cashwithdrawals (dollar amount, reason and venue) and other cash transactions (being paid in cash,cashing a cheque, etc). The 2013 MOP is a follow-up to, and retains most of the core featuresof, the 2009 MOP Survey (see Arango and Welte (2012)). The 2009 MOP was an innovationin survey design, since it introduced a three-day diary format, intended to serve as a memoryaid to record cash payments and thus minimize recall bias. The diary methodology has beensuccessfully used in six other countries: Austria, Australia, France, Germany, the Netherlandsand the United States; more details are available in Bagnall et al. (2014).
We begin with an overview of the key insights from the 2013 MOP Survey:
1. The average Canadian reports holding about $84 in his/her wallet. Besides cash, 98%have a debit card, while about 82% have a credit card. Canadians have on average threecards: one debit and two credit cards. Increasingly, they report having the contactlessfeature on their debit card (about 21%) and credit card (46%).
2. Cash accounts for about 44% of the volume share and 23% of the value share of pay-ments. Cash is used mostly for small-value transactions, with the median cash trans-action at about $9. Compared with 2009 levels, cash payments have decreased by 10percentage points in terms of volume and increased by 0.4 percentage points in terms ofvalue. Debit volume has decreased by 4 percentage points, while credit card volume hasincreased by 12 percentage points. Contactless credit card payments account for about19.3% of the volume of credit card payments (in 2009 it was 5%).
3. Among demographic groups, cash is used mostly by respondents who are older (age 55and above), have lower incomes (less than $45K) or have only a high school education.However, groups that report low cash usage hold similar amounts of cash as those whofavour paying with cash.
4. The top stated reasons for cash usage are that it is a low-cost, secure, easy to useand widely accepted form of payment relative to debit and credit cards. Cash is used
2

most often to pay for travel/parking (57% of all travel/parking payments) and enter-tainment/meals (56% of all entertainment/meals payments). It constitutes a majority ofperson-to-person payments.
The rest of this paper proceeds as follows. Section 2 discusses what is in consumers’ wal-lets, while Section 3 considers how consumers pay. These patterns are viewed from the lens ofseveral demographic factors such as region, age, income, gender, urban/rural location, educa-tion and home ownership. Section 4 then reviews consumers’ assessments and perceptions ofpayment methods. Finally, Section 5 concludes. Appendices A to D describe the survey designand methodology. Appendix E presents definitions of terms and variables.
2 What’s in Your Wallet?We now turn to the type of payment instruments that respondents have in their possession.These responses are tabulated from the SQ (What’s in Your Wallet, Main Bank Account, MainCredit Card, and Cash sections). We summarize by subsection each payment method as wellas bank and credit card features. For each table, we compute the statistic first for the wholesample, then by region, age, income, gender, urban/rural area, education and home-ownershipstatus.
2.1 Cash, debit and credit cardsRespondents report having on average $84 in cash holdings on hand, that is, in their wallet,
purse or pockets (Table 1). The survey also asks respondents how much cash is held in otherplaces such as their home and/or vehicles. Because of the wide range in estimates, we reporta median amount of $300 cash. Approximately 11% report that they receive cash from theiremployer or business in a typical month, and about 16% from their friends or family members.Respondents aged 55 years and older hold the highest mean amount of cash on hand, at $119;those aged 18-34 carry the lowest, at $61, yet are the most likely to receive cash from anemployer. Those in the Atlantic region report high cash holdings on hand ($93) and in placessuch as their home ($350). They are also more apt to be paid in cash, at 13%, while BritishColumbia respondents have high incidences of receiving cash from family and friends, at about18%.
Table 2 shows the proportion of respondents who reported having different denominationsof coins and notes on hand at the beginning of the diary. These proportions are for respondentswho reported having a positive amount of cash in total. Overall, the $5, $10 and $20 denomi-nations are most popular, with 75.5% of respondents holding fives or tens and 71.3% holdingtwenties. Among respondents who have cash on hand, those who live in the Atlantic region,who are above 55 years of age or who are from rural areas, are more likely to hold high-valuedenominations (hundreds and fifties). Respondents from the Prairies, those above 55 years ofage, and those with high incomes are more likely to hold twenties. Respondents below 34 yearsof age and female respondents are more likely to hold low-value denominations (coins).
Table 3 illustrates cash withdrawals. Respondents withdraw on average $118 per trip tothe automated banking machine (ABM) and make about three ABM withdrawals per month.
3

They also report fewer than one withdrawal per month at a bank teller and via cashback ontheir debit cards. Withdrawals made at a bank teller are typically larger in value, at $236, twicethe value of an ABM withdrawal, while cashback transactions tend to be small in value ($43).Quebec respondents withdraw larger amounts compared with other regions at both the ABM($136) and the bank ($297). Renters tend to make more frequent cash withdrawals via everysource.
Measures of ownership for debit and credit cards are reported in Table 4. Debit card own-ership is nearly universal at about 98% and consistently high across all demographic categoriesconsidered. Canadians hold about 1.1 debit cards on average. Notably, those who are older,with lower incomes, or who are less-educated have a lower proportion or number of debitcards. The level of credit card ownership in Canada is about 82% and respondents report hav-ing on average two credit cards. Low levels of credit card ownership correspond with highercash usage and lower income. The lowest rate of credit card ownership is among (1) 18-34year-olds with 74.1% and 1.4 cards; (2) those earning less than $45K in income with 71.2%and 1.5 cards; (3) those with only high school education with 72.6% and 1.6 cards; and (4)those who rent or live for free, at less than 70% and 1.2 or fewer cards on average. In contrast,respondents with higher incomes tend to have both higher rates of credit card ownership andlower cash usage. Almost 90% of respondents in the highest income category owned creditcards, and they are less likely to receive cash from employers or family/friends than any otherincome category.
2.2 Main bank account and credit card featuresTo understand debit and credit card ownership, we provide information on respondents’
main bank account, main credit card features and main credit card spending in Tables 5-7.
2.2.1 Main bank account
Table 5 shows the features of respondents’ main bank accounts. Overall, half of all Cana-dians have had their main bank account for 15 years or longer, and the average current balanceis about $3,400. Paying account fees is fairly common, with 44% of Canadians paying a fee tomaintain their account in the past month and over one third paying a fee to make a transaction.
The table suggests that Prairies residents keep the highest bank account balances, with amean of $4,374. Quebec has a high proportion of residents who pay account fees and transac-tion fees, have the lowest mean balance, and the highest median number of years owning theaccount. Quebec residents also have a much lower proportion of bank cards with the contact-less feature than the other regions, at only 9.6%. As age, income or education increases, thelikelihood of paying transaction fees decreases. Renters are more likely to pay account andtransaction fees than homeowners or those who live for free.
2.2.2 Main credit card
Table 6 contains statistics regarding features of respondents’ main credit cards. Respon-dents reported using Visa, MasterCard, American Express, retail store credit and gas stationcredit cards as their main cards. Overall, of those who own a credit card, 12% have interest
4

rates below 5%. About 21% of Canadians pay an annual fee on their main credit cards, though73% of them also have some form of rewards program, which may help offset this cost. Indeed,among high-income/high-education respondents, a higher prevalence of fees is associated withan increased prevalence of rewards.
The British Columbia region, with a relatively high prevalence of annual fees at 23%,also has the highest proportion of credit cards with rewards programs, at 78%. While theAtlantic region has the highest prevalence of annual fees at 25%, it has the lowest proportionof respondents with rewards programs. Quebec has the highest proportion of respondents withlow interest rates.
As age increases, respondents are more likely to have a rewards program on their creditcard. In contrast, people in the middle age category are least likely to have interest rates below5%, and they also pay high average annual fees.
The proportion of cards with annual fees and the proportion of cards with rewards bothincrease with respondents’ income and education levels. These variables are also higher formales than for females, and for urban residents than for rural. Meanwhile, the proportion ofpeople with low interest rates decreases as income and education levels increase. With respectto home ownership, those who own their homes are more likely both to pay annual fees and toreceive rewards. Renters are most likely to have an interest rate below 5%.
Table 7 shows that many respondents have high spending limits on their credit cards, with40% enjoying a spending limit above $10,000. However, 17% have spending limits under$2,000. Overall, respondents report the mean and median amounts charged the previous monthto be $1,169 and $608, respectively. The demographic categories with a higher prevalence ofrewards also report higher spending in the previous month. Most respondents paid off the fullbalance; however, 28% may be considered revolvers, i.e., they did not pay off the full balanceand would have been charged interest.
Regionally, Quebec residents have the lowest spending limits, with 24% having limits be-low $2,000 and only 25% with limits above $10,000. In British Columbia, the province withthe highest spending limits, 15% of respondents report limits below $2,000 and 46% limitsabove $10,000. Not surprisingly, Quebec and British Columbia also have the lowest and high-est amounts charged to credit cards, respectively. The Atlantic region has the highest proportionof revolvers, at 39%.
Spending limits are correlated in an expected way with age, income and education: older,higher-income and more-educated respondents have access to more credit. These groups arealso more likely to have a high interest rate on their main credit card, but are less likely to actu-ally pay interest, since the proportion of revolvers is lower. Revolving is most likely for renters,at 43%. A noticeable difference in actual spending is also associated with home ownership.Respondents who own a home spend $1,279 on average, almost twice that of renters.
2.3 Payment innovationsTable 8 shows patterns of ownership for the contactless feature of a debit card, the con-
tactless feature of a credit card, stored-value cards issued by Visa, MasterCard or AmericanExpress (multi-purpose), and store-branded stored-value cards (single-purpose). About 21%of respondents report having a contactless feature on their main debit cards. Respondents inthe Atlantic region, younger people, males, high-income earners or people who live for free
5
are more likely to have this contactless feature. However, Table 9, which shows use in the pastyear of alternative methods of payment, reveals that having the feature is different from usingit. Although more than one-fifth of respondents have this feature, only 9% report having madea contactless debit payment in the past year. Furthermore, almost half of respondents’ maincredit cards (46%) have a contactless feature embedded, and 33% of respondents actually usedit to make a payment in the past year. As with debit cards, penetration of the contactless featureon credit cards is relatively low in Quebec (35%) and high in Ontario (55%) compared withthe other regions of Canada. Penetration of the credit card contactless feature increases withincome and education level, but decreases with age.
Table 8 also shows that one-quarter of Canadians have at least one single-purpose card,which is more than twice the ownership rate of multi-purpose cards, at 11%. Among cardowners, respondents also have slightly more single-purpose cards (2.0) than multi-purpose(1.4). In addition to contactless use, Table 9 shows usage of stored-value cards and otherpayment innovations. The use of single-purpose stored-value cards (SVCs), at 38%, is higherthan that of multi-purpose stored-value cards (SVCm), at 23%. Mobile payment applicationsremained at a low level of adoption in 2013, with only 7% of Canadians having made such apayment. A relatively large proportion of respondents have made online payments, with 41%for online credit card payments, followed by 31% for online payment accounts (e.g., PayPal)and 27% for Interac Online/e-Transfers. Please see Appendix E for definitions of the mobilepayment application, online payment account and other payment methods.
There are variations in use based on demographics. Age appears to be an important factorrelated to the use of alternative payment methods; the proportion of respondents using allmethods listed decreases as age increases. For mobile payment applications in particular, ageis the most prominent factor, since younger respondents (18-34) are 3 and 15 times more likelyto have made a mobile payment in the past year compared with middle-aged (35-54) and olderrespondents (55+), respectively.
Single-purpose stored-value cards are popular in the Prairies region, reflected by high levelsof ownership and particularly by the number of cards per owner. In contrast, respondents fromQuebec have noticeably lower levels of ownership and usage; for example, only 15% reporthaving a single-purpose card, compared with 26% overall. Instead, Quebec residents favouronline debit and credit. Ontarians are big users of contactless features in debit and credit cards,but mobile payment is favoured by British Columbia users.
Finally, there are noticeable differences with respect to income and education for onlinecredit card payments. For example, only 26% of respondents with a high school education havemade such a payment, compared with 55% of those who are university educated, a differenceof close to 30 percentage points. University-educated respondents also tend to have the highestuse of contactless credit cards (CTCC) and SVCs.
The $85K plus income group uses alternative payment methods most frequently, with theexception of contactless debit cards (CTDC), used mainly by those earning $45K-85K. Malesalso use these payment methods more often than females, with the exception of SVCs. Thereis a small rural and urban divide in the use of CTCC and SVCs. Homeowners’ use of CTCCand online credit is higher than renters’, while renters report higher use of SVCm and otheronline payments. Finally, those who live for free use CTDC, mobile and online Interac mostoften.
Users of either CTCC or CTDC are more likely than the general population to use the
6

other. Among users of CTDC, 60% have also used CTCC in the past year, and among usersof CTCC, 16% report using CTDC in the same time frame. Overall, about 5% of respondentsused both CTCC and CTDC in the past year. A detailed discussion of these payment methodsand a comparison with 2009 MOP data can be found in Chen, Shen and Stuber (2014).
3 How Would You Like to Pay?This section describes respondents’ retail payment choices collected from the DSI. Pay-
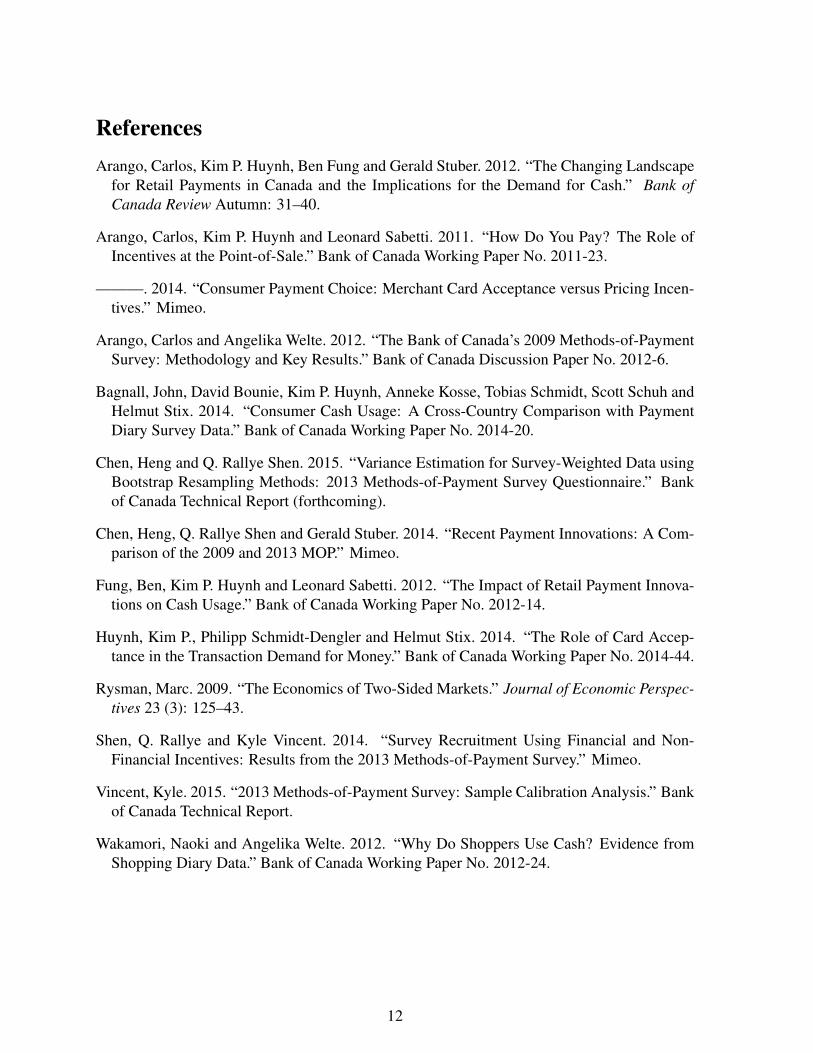
ment data are usually collected using network data as shown in Figure 1. This figure showsthat the use of cash in overall retail payments has decreased during the past 20 years. However,it is incomplete, since new payment innovations have brought about changes to the retail pay-ments landscape (Arango et al. 2012). Furthermore, it may contain inaccuracies, since the cashusage is based on approximations. Therefore, the DSI was designed to include these paymentinnovations and measure cash more accurately by asking respondents to record all cash andnon-cash payments over a three-day period.
In this section, we provide information on transaction characteristics including the demo-graphic characteristics of the respondent, the type of goods purchased and the location of thepurchases. Finally, to understand the evolution of cash, we compare the 2013 volume and valueshares with those from the 2009 MOP Survey.
3.1 Methods of payments at the point of saleTable 10 summarizes the overall payment shares, in terms of volume and value, for both the
2009 and 2013 MOP surveys. Cash remains a dominant payment method in the 2013 survey,with shares of 43.9% and 23.0% in terms of volume and value, respectively. The cash share involume declined by 10% from 2009, compared with an increase of 0.3% in value.
The debit payment share in the 2013 MOP is 21.1% and 25.1% in terms of volume andvalue, respectively. The debit share of volume decreased by about 3.6%, but the reduction inthe debit share of value is more acute at 6.6%. The drop in cash and debit share has transferredlargely to credit cards, with an overall share in 2013 of 30.8% and 45.9% in terms of volumeand value, respectively. This marks an increase of 11.5% in volume and 5.2% in value from2009.
Cash is mostly used for small-value transactions, since the median transaction value isabout $9 in both survey years, increasing from $8 in 2009 to $9 in 2013. In comparison, themedian transaction value of debit decreased from $29 in 2009 to $27 in 2013, and that ofcredit from $40 to $34. Most of the growth in the credit share is attributed to contactless credit(CTCC) payments, since their volume share increased to 19.3% from 5.0%, while the valueshare also saw an increase from 2.9% to 12.1%. Contactless debit (CTDC) or Flash, whichdebuted in 2011, constitutes 2.9% and 1.8%, respectively, of the volume and value share. Notsurprisingly, the median transaction values for CTDC and CTCC are $14 and $20, respectively,lower than the median debit and credit transaction values. These findings are similar to thosefrom Bagnall et al. (2014), who conduct a seven-country comparison of payment methods thatincludes the 2009 MOP Survey results.
7

Stored-value cards—multi-purpose (SVCm) or single-purpose (SVCs)—constitute a smallshare (less than 3%) in both volume and value. These figures are not directly comparable with2009 data, in which these two categories were not distinguished. However, the share of SVCmand SVCs combined more than doubled in both value and volume, rising to 3.3% and 2.5%of volume and value, respectively. The median purchase value of SVCm and SVCs combinedalso increased, to $8. Interestingly, the median SVCm purchase value is $30, which mirrorsthat of credit, while that of SVCs is closer to cash at $4. Finally, cheques constitute only 0.9%volume share of payments. The value share is 3.5%, a decrease from 3.9% in the 2009 survey.The median cheque value in 2013 was $51. Given that SVCs and cheques constitute smallshares, we focus primarily on the three payment choices of cash, debit and credit, and includea discussion of contactless payments. We present the descriptive statistics of the paymentshares by transaction value, demographics, type of good purchased and channel. We includedebit card cashback in the 2013 transaction values for Table 10 to maintain comparability withthe 2009 figures, but exclude cashback in the following discussion.
3.2 Transaction characteristicsTables 11 and 12 show that cash is mostly used for small-value transactions. We compare
these value shares with the nominal transaction values from the 2009 MOP Survey for uni-formity. For those below $15, cash has a share of 64.3% and 58.0% in terms of volume andvalue, respectively. This share decreases as the transaction value increases. At transactionsabove $50, cash constitutes 16.1% and 15.3% in terms of volume and value, respectively. Forboth volume and value, the debit share is higher in the $25-$50 transaction range than in anyother range. Credit is the dominant payment method for transactions above $50, with shares of53.0% and 52.7% in terms of volume and value, respectively. Both contactless payment meth-ods CTDC and CTCC are used more often for transactions of below $15 than for larger-valuetransactions.
3.3 DemographicsTables 13 and 14 show payment usage by demographic profiles in terms of volume and
value. To find these shares, we calculate the shares for each respondent from their DSI, apply-ing the SQ weights. We found that cash has higher shares of volume in the Prairies (45.6%)and Quebec (44.4%), as well as for the 55+ age group (50.7%), for respondents with incomeless than $45K (52.0%), for males (46.1%), for high school graduates (49.5%), and for renters(49.6%). In value terms, however, it is slightly different, since the cash share is higher for theAtlantic region (29.2%).
For debit, the volume share is highest for respondents in Quebec (22.2%), for 18-34 yearolds (27.3%), for those with incomes between $45 and $85K (22.8%), for females (22.7%), forrural respondents (26.4%), for college/technical school graduates (24.1%), and for renters orthose who live for free (about 27%). The only difference for the value share is that high schoolgraduates have the highest share (30.8%).
The credit volume share is the highest in British Columbia (32.6%), and among 35-54year olds (34.1%), those who earn more than $85K (40.3%), urban (32.0%) and university-
8

educated (41.2%) respondents, and those who own their own homes (35.0%). Value shares forcredit follow the same pattern.
In terms of the volume of contactless payments, CTDC and CTCC are similar; the demo-graphic categories using CTDC and CTCC for larger shares of transactions are respondentsin Ontario (5.7% and 24.2% of all debit and credit transactions, respectively) and the Atlanticregion (2.3% and 27.9%, respectively), as well as 18-34 year olds (3.6% and 27.4%, respec-tively) and males (3.5% and 20.3%, respectively). There are differences in terms of income,education, and whether they rent or live for free. The tabulations for value are similar.
3.4 Type of goodsThe transactions for each type of good are broken down by method of payment in Tables
15 and 16. The “Other” category of goods includes charitable donations, pet supplies and lifeinsurance. Table 15, which displays the volume shares of payment methods for each type ofgood, shows that travel/parking and entertainment/meals are the goods for which cash has thelargest volume shares, at 56.8% and 55.8%, respectively. Compared with other types of goods,gas (21.7%) and personal attire (26.4%) receive the smallest proportion of cash purchases. Thesituation for debit is reversed; debit volume shares in these two categories (29.9% and 26.4%,respectively) are the highest among the different goods categories, and the debit volume shareis lowest for travel/parking (6.9%).
Compared with debit, volume shares for credit are relatively high for most categories ofgoods, particularly gas (46.8%), durable goods (45.2%) and health care (43.0%). However, inmany categories, such as entertainment/meals, travel/parking and hobby/sporting goods, cashis used significantly more frequently than credit.
Contactless credit makes up a large share of total credit volume in purchases for gro-ceries/drugs (30.1%) and entertainment/meals (19.7%). The largest volume share of contact-less debit is also its share of entertainment/meals purchases.
With respect to value, cash shares are considerably smaller, since cash is used mostly forlow-value purchases. The categories with the highest cash shares are entertainment/meals(37.4%) and professional services (25.5%). The highest-value share for debit is in groceries/drugs(31.5%). The credit value share is highest for health care (57.7%) and personal attire (56.1%),while the value shares of both contactless credit and contactless debit are higher in groceries/drugsthan in most other categories. This suggests that contactless payment methods are more likelyto be used for higher-value purchases in the groceries/drugs category than in other goods cate-gories.
3.5 ChannelVolume and value shares for different payment methods by channel are shown in Tables 17
and 18. For purchases made in stores, cash has the largest volume share (41.8%) and credit thelargest value share (46.5%). For purchases made online or over the phone, however, credit cardpayments predominate in both value and volume, with 83.6% of all online payments made on acomputer (value 91.9%), 68.1% of all online payments made on a mobile device or tablet (value83.1%), and 84.8% of payments made over the phone (value 84.6%). Online payments havebecome increasingly important, since according to the 2012 Canadian Internet Use Survey,
9

83% of Canadian households had access to the Internet at home in 2012, while only 79% ofCanadian households did in 2010.
We also consider person-to-person and mail payments. In person-to-person transactions,cash is the most frequently used payment method, with a 76.7% volume share and 52.3%value share. Credit is also used for larger person-to-person transactions (for example, throughPayPal), with an 18.4% value share. The shares for cash, debit and credit for payments by mailare all quite low: the payment method most commonly used by mail is the cheque, which isnot shown in the table.
4 Consumer Assessments and PerceptionsThe 2013 MOP Survey contains a section on consumers’ perceptions or assessments. These
consumer perceptions were present in the 2009 MOP Survey and were used to gauge subjectivejudgments of various payment methods on a scale of 1 to 5 with respect to each of the followingfive attributes: ease of use, costliness, security, ease of set-up and level of acceptance. Table E.2provides definitions of these attributes. Figures 2 to 6 show how respondents rated cash, debit,credit and payment innovations such as mobile payment, online payment from bank accountsand credit cards, online payment accounts, stored-value cards, and the contactless feature of acredit or debit card.
Cash is perceived positively with respect to all characteristics considered. It was identifiedas the easiest payment method to use, with roughly 74% of respondents assigning it the toprating of very easy. This proportion is 15 percentage points higher than the percentage ofrespondents giving top ratings to either credit or debit cards. Moreover, cash is viewed by92.5% of Canadians as being almost always accepted. Its most negative ratings among allattributes are for security. Most respondents (54.8%) view cash as being very secure, but 7.2%view it as either risky or very risky. However, cash is still rated as secure to use by morerespondents than either credit or debit cards are.
Table 19 shows the cash share of diary transactions along with relative perceptions of cashfor different demographic profiles. The relative cash perception rating is derived from thescores respondents gave cash, credit and debit in the “perceptions” section of the MOP Survey,and is a measure of the degree to which consumers’ perceptions favour cash over credit anddebit. In the table, all relative perception ratings of cash are above 1.00, which indicates that theaverage respondent views cash more positively than debit or credit with respect to all attributes.In general, the demographic categories with the highest cash shares (respondents aged 55+,with income less than $45K, or with only a high school education) also have more positiveperceptions of cash with respect to ease of use and security.
Debit and credit cards are similarly perceived with respect to most characteristics. Onenoticeable difference relates to cost, which includes all costs associated with using the pay-ment method, such as fees and interest. Over 40% of respondents associate credit cards withhaving a high cost, the highest percentage for any payment method considered. Debit cardsare also considered easier to set up than credit cards. For questions relating to perceptions,no distinction was made between the contactless feature of a credit card and that of a debitcard. Overall, the contactless feature is perceived as one of the most insecure and least widelyaccepted payment methods.
10

Overall, respondents are less certain about how to rank payment innovations compared withcash, debit and credit cards. They choose the middle category more often than when rankingcash, debit or credit. Mobile and contactless payments are perceived similarly, although mobilepayment applications are considered as more difficult to set up, as well as harder to use. Amongonline payments, those involving a bank account or credit card are considered easier to use andmore widely accepted than those using an online payment account. Prepaid cards issued byVisa or MasterCard are viewed as more costly compared with other payment innovations, butare also considered the most widely accepted.
5 ConclusionAs shown in Figure 1, the share of point-of-sale transactions made with cash, estimated
from network and ABM data, has decreased steadily over time. This picture is incomplete,however, since new payment innovations have brought about changes to the retail paymentslandscape (Arango et al. 2012). As a result, a large part of the 2013 MOP Survey is devotedto measuring non-cash payments such as credit card usage, especially contactless payments.In comparison with the 2009 MOP, the 2013 MOP has found that credit card usage has madelarge inroads at the expense of cash and debit card payments. The 2013 MOP Survey revealsthat cash usage has fallen but still constitutes about 44% of the volume of transactions.
Overall, we find that payment choice is correlated with three factors: (1) demographics,(2) pricing incentives such as rewards, and (3) consumers’ perceptions toward payment instru-ments. Cash is used extensively by older, lower-income and high-school-educated respondents.Pricing incentives matter, since 73% of respondents state that they have rewards on their creditcards. These respondents tend to have higher income and education, but have a lower levelof cash usage. Consumers’ perceptions of cash versus debit and credit cards reveal that itis favoured because of its low cost, security, ease of use and wide acceptance as a form ofpayment.
Previous research by Arango, Huynh and Sabetti (2011) demonstrates that all three factorsmentioned above matter for payment choice. Further, Wakamori and Welte (2012) find that,despite rewards and acceptance, consumers still have a preference for using cash, especiallyfor small-value transactions. Fung, Huynh and Sabetti (2012) find that the usage of contactlesscredit and stored-value cards would lower cash usage by 10-14%. It would be worthwhile to in-tegrate this research to further investigate the effect of payment innovations on the substitutionpatterns of cash, debit and credit.
The Bank of Canada is currently undertaking a cost study to address issues regarding themerchant or supply-side views on pricing incentives and the diffusion of card payments. Pre-vious research by Arango, Huynh and Sabetti (2014) and Huynh, Schmidt-Dengler and Stix(2014) have demonstrated the important role that consumers’ perceptions of card acceptanceplay in payment choice and in cash holdings, respectively. The 2013 MOP Survey includes in-formation about the stores at which consumers transact. Therefore, it will be useful input andwill complement the upcoming cost study. Understanding consumers and merchant paymentbehaviour would help to facilitate an investigation of two-sided markets (see Rysman (2009)for information on two-sided markets).
11
ReferencesArango, Carlos, Kim P. Huynh, Ben Fung and Gerald Stuber. 2012. “The Changing Landscape
for Retail Payments in Canada and the Implications for the Demand for Cash.” Bank ofCanada Review Autumn: 31–40.
Arango, Carlos, Kim P. Huynh and Leonard Sabetti. 2011. “How Do You Pay? The Role ofIncentives at the Point-of-Sale.” Bank of Canada Working Paper No. 2011-23.
———. 2014. “Consumer Payment Choice: Merchant Card Acceptance versus Pricing Incen-tives.” Mimeo.
Arango, Carlos and Angelika Welte. 2012. “The Bank of Canada’s 2009 Methods-of-PaymentSurvey: Methodology and Key Results.” Bank of Canada Discussion Paper No. 2012-6.
Bagnall, John, David Bounie, Kim P. Huynh, Anneke Kosse, Tobias Schmidt, Scott Schuh andHelmut Stix. 2014. “Consumer Cash Usage: A Cross-Country Comparison with PaymentDiary Survey Data.” Bank of Canada Working Paper No. 2014-20.
Chen, Heng and Q. Rallye Shen. 2015. “Variance Estimation for Survey-Weighted Data usingBootstrap Resampling Methods: 2013 Methods-of-Payment Survey Questionnaire.” Bankof Canada Technical Report (forthcoming).
Chen, Heng, Q. Rallye Shen and Gerald Stuber. 2014. “Recent Payment Innovations: A Com-parison of the 2009 and 2013 MOP.” Mimeo.
Fung, Ben, Kim P. Huynh and Leonard Sabetti. 2012. “The Impact of Retail Payment Innova-tions on Cash Usage.” Bank of Canada Working Paper No. 2012-14.
Huynh, Kim P., Philipp Schmidt-Dengler and Helmut Stix. 2014. “The Role of Card Accep-tance in the Transaction Demand for Money.” Bank of Canada Working Paper No. 2014-44.
Rysman, Marc. 2009. “The Economics of Two-Sided Markets.” Journal of Economic Perspec-tives 23 (3): 125–43.
Shen, Q. Rallye and Kyle Vincent. 2014. “Survey Recruitment Using Financial and Non-Financial Incentives: Results from the 2013 Methods-of-Payment Survey.” Mimeo.
Vincent, Kyle. 2015. “2013 Methods-of-Payment Survey: Sample Calibration Analysis.” Bankof Canada Technical Report.
Wakamori, Naoki and Angelika Welte. 2012. “Why Do Shoppers Use Cash? Evidence fromShopping Diary Data.” Bank of Canada Working Paper No. 2012-24.
12
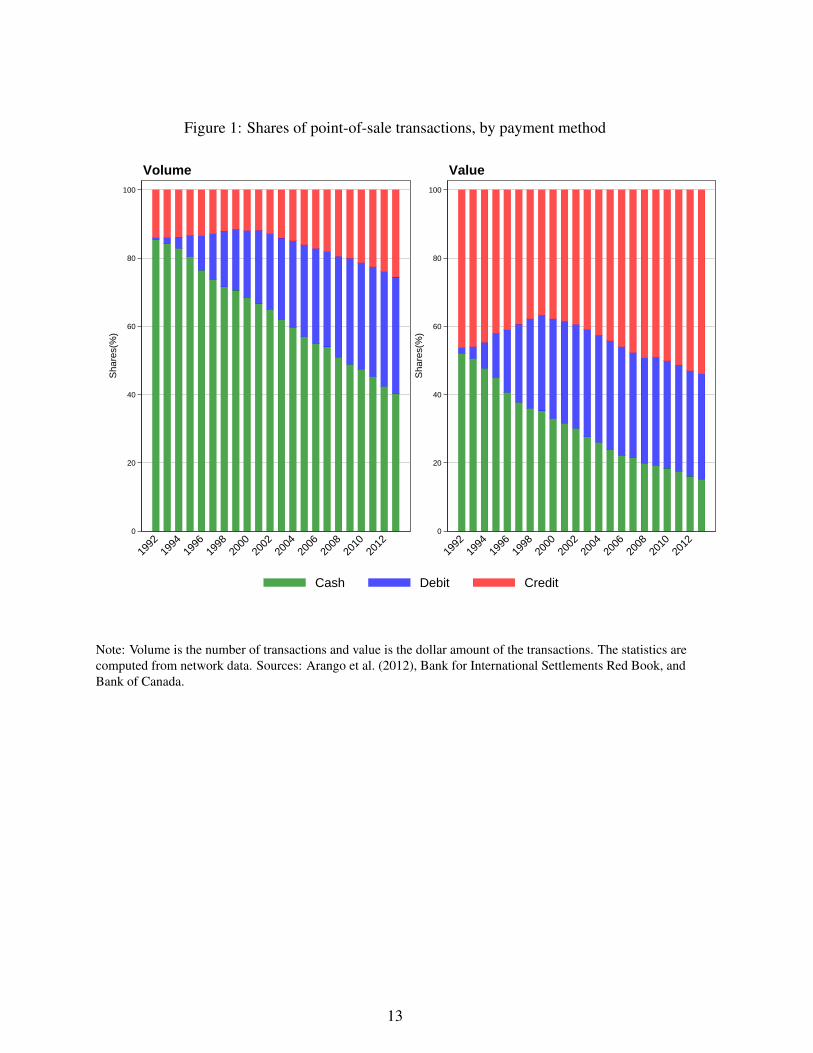
Figure 1: Shares of point-of-sale transactions, by payment method
0
20
40
60
80
100
Sha
res(
%)
1992
19
94
1996
19
98
2000
20
02
2004
20
06
2008
20
10
2012
Volume
0
20
40
60
80
100
Sha
res(
%)
1992
19
94
1996
19
98
2000
20
02
2004
20
06
2008
20
10
2012
Value
Cash Debit Credit
Note: Volume is the number of transactions and value is the dollar amount of the transactions. The statistics arecomputed from network data. Sources: Arango et al. (2012), Bank for International Settlements Red Book, andBank of Canada.
13

Figure 2: Ease
0 20 40 60 80 100Percentage of respondents (%)
TNG
SVCm
NETp
NETa
Mobile
Debit
Credit
Cash
Very hard Hard Neither Easy Very easy
Note: Respondents were asked to rank how easy or hard each method of payment is to use, on a scale of 1 (veryhard) to 5 (very easy). Respondents were encouraged to select the middle category if they were unsure. Thisgraph shows the proportion of responses in each category, by method of payment. NETa: online payment frombank account/credit card, NETp: online payment account (e.g., PayPal), SVCm: stored-value card, TNG:contactless feature of a credit/debit card. Data are from the 2013 MOP SQ (SQ weights used).
14

Figure 3: Cost
0 20 40 60 80 100Percentage of respondents (%)
TNG
SVCm
NETp
NETa
Mobile
Debit
Credit
Cash
Very high cost High cost Neither Low cost Very low cost
Note: Respondents were asked to rank how costly each method of payment is to use, on a scale of 1 (very highcost) to 5 (very low cost). Respondents were encouraged to select the middle category if they were unsure. Thisgraph shows the proportion of responses in each category, by method of payment. NETa: online payment frombank account/credit card, NETp: online payment account (e.g., PayPal), SVCm: stored-value card, TNG:contactless feature of a credit/debit card. Data are from the 2013 MOP SQ (SQ weights used).
15
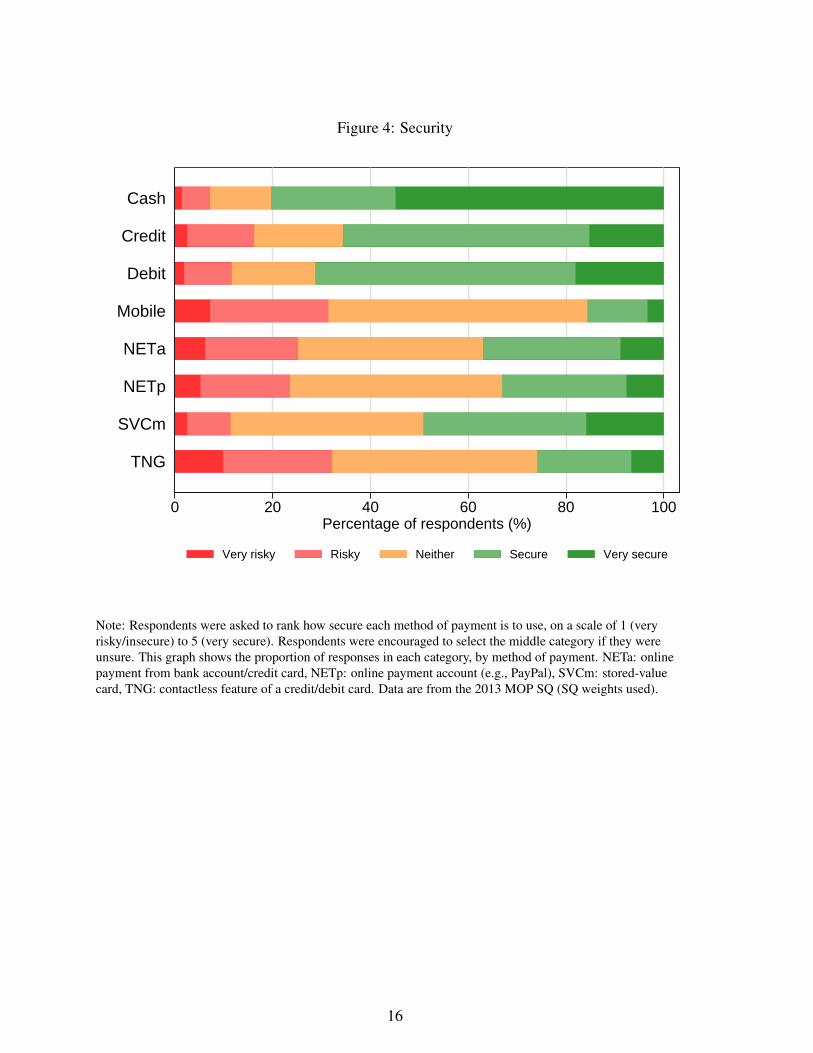
Figure 4: Security
0 20 40 60 80 100Percentage of respondents (%)
TNG
SVCm
NETp
NETa
Mobile
Debit
Credit
Cash
Very risky Risky Neither Secure Very secure
Note: Respondents were asked to rank how secure each method of payment is to use, on a scale of 1 (veryrisky/insecure) to 5 (very secure). Respondents were encouraged to select the middle category if they wereunsure. This graph shows the proportion of responses in each category, by method of payment. NETa: onlinepayment from bank account/credit card, NETp: online payment account (e.g., PayPal), SVCm: stored-valuecard, TNG: contactless feature of a credit/debit card. Data are from the 2013 MOP SQ (SQ weights used).
16
Figure 5: Set-up
0 20 40 60 80 100Percentage of respondents (%)
TNG
SVCm
NETp
NETa
Mobile
Debit
Credit
Cash
Very hard Hard Neither Easy Very easy
Note: Respondents were asked to rank how easy or hard it is to get/set up each method of payment, on a scale of1 (very hard) to 5 (very easy). Respondents were encouraged to select the middle category if they were unsure.This graph shows the proportion of responses in each category, by method of payment. NETa: online paymentfrom bank account/credit card, NETp: online payment account (e.g., PayPal), SVCm: stored-value card, TNG:contactless feature of a credit/debit card. Data are from the 2013 MOP SQ (SQ weights used).
17
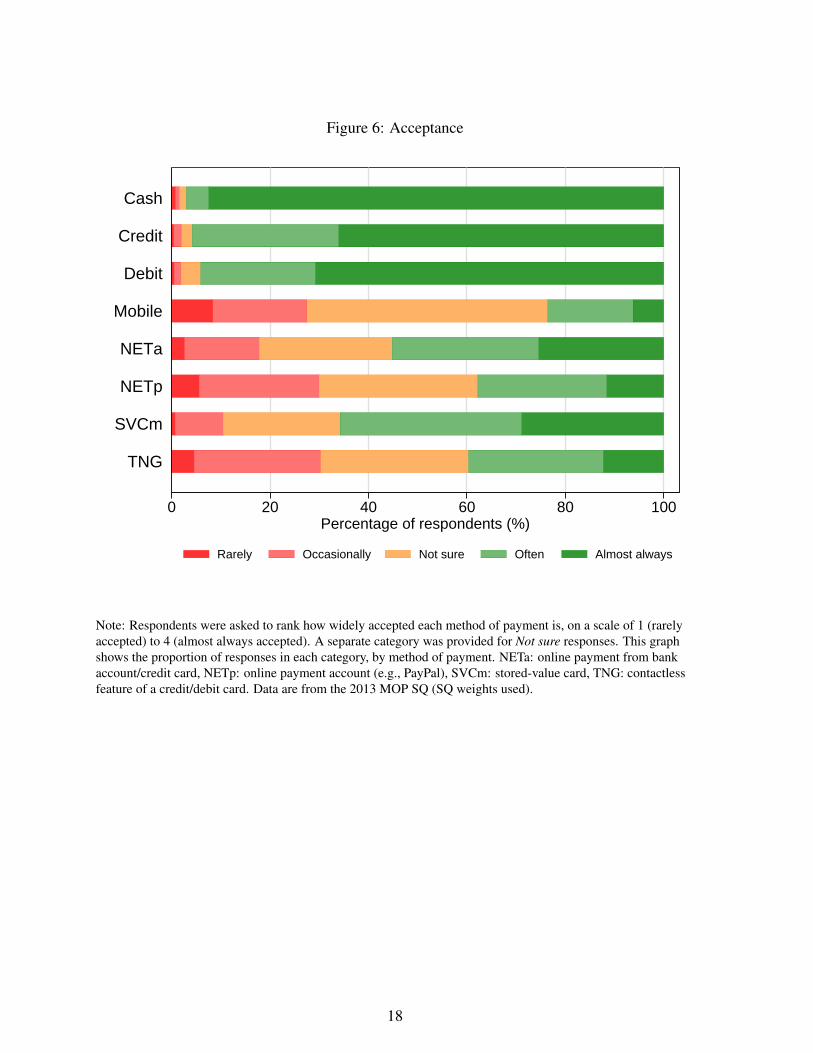
Figure 6: Acceptance
0 20 40 60 80 100Percentage of respondents (%)
TNG
SVCm
NETp
NETa
Mobile
Debit
Credit
Cash
Rarely Occasionally Not sure Often Almost always
Note: Respondents were asked to rank how widely accepted each method of payment is, on a scale of 1 (rarelyaccepted) to 4 (almost always accepted). A separate category was provided for Not sure responses. This graphshows the proportion of responses in each category, by method of payment. NETa: online payment from bankaccount/credit card, NETp: online payment account (e.g., PayPal), SVCm: stored-value card, TNG: contactlessfeature of a credit/debit card. Data are from the 2013 MOP SQ (SQ weights used).
18
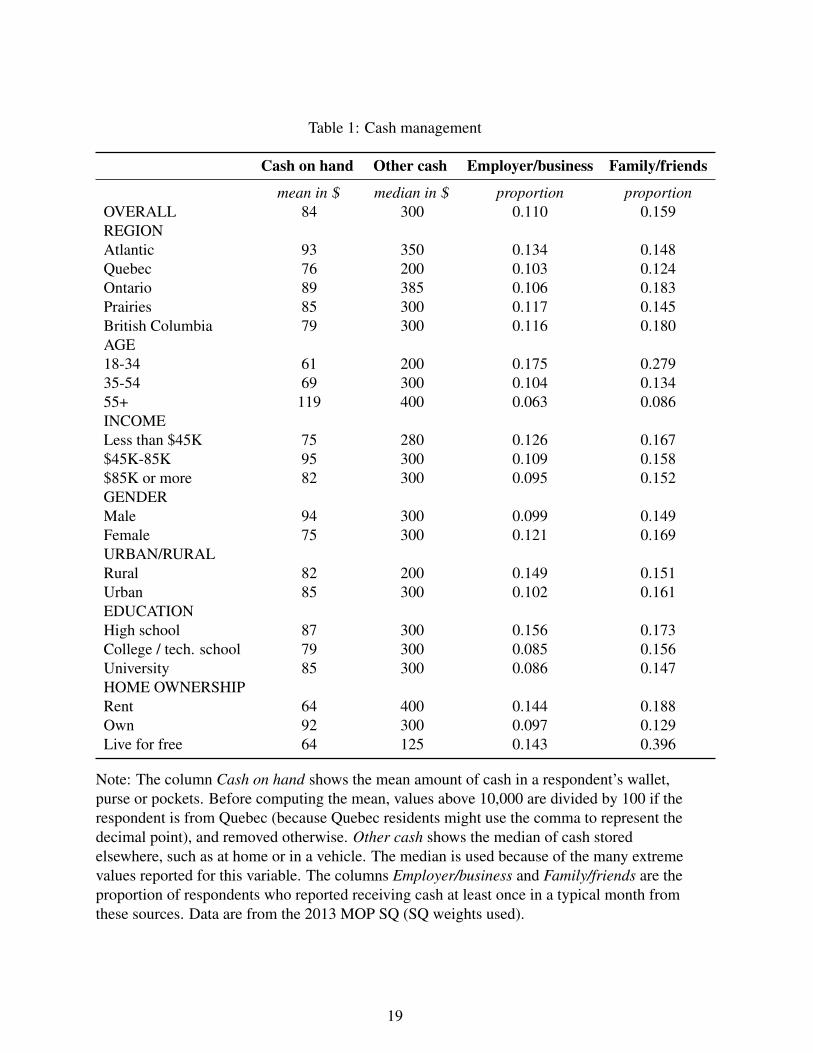
Table 1: Cash management
Cash on hand Other cash Employer/business Family/friends
mean in $ median in $ proportion proportionOVERALL 84 300 0.110 0.159REGIONAtlantic 93 350 0.134 0.148Quebec 76 200 0.103 0.124Ontario 89 385 0.106 0.183Prairies 85 300 0.117 0.145British Columbia 79 300 0.116 0.180AGE18-34 61 200 0.175 0.27935-54 69 300 0.104 0.13455+ 119 400 0.063 0.086INCOMELess than $45K 75 280 0.126 0.167$45K-85K 95 300 0.109 0.158$85K or more 82 300 0.095 0.152GENDERMale 94 300 0.099 0.149Female 75 300 0.121 0.169URBAN/RURALRural 82 200 0.149 0.151Urban 85 300 0.102 0.161EDUCATIONHigh school 87 300 0.156 0.173College / tech. school 79 300 0.085 0.156University 85 300 0.086 0.147HOME OWNERSHIPRent 64 400 0.144 0.188Own 92 300 0.097 0.129Live for free 64 125 0.143 0.396
Note: The column Cash on hand shows the mean amount of cash in a respondent’s wallet,purse or pockets. Before computing the mean, values above 10,000 are divided by 100 if therespondent is from Quebec (because Quebec residents might use the comma to represent thedecimal point), and removed otherwise. Other cash shows the median of cash storedelsewhere, such as at home or in a vehicle. The median is used because of the many extremevalues reported for this variable. The columns Employer/business and Family/friends are theproportion of respondents who reported receiving cash at least once in a typical month fromthese sources. Data are from the 2013 MOP SQ (SQ weights used).
19

Table 2: Cash holdings, by denomination
$100-$50 $20 $10-$5 $2-$1
OVERALL 0.127 0.713 0.755 0.639REGIONAtlantic 0.165 0.709 0.720 0.594Quebec 0.107 0.719 0.745 0.684Ontario 0.117 0.674 0.772 0.615Prairies 0.160 0.790 0.754 0.653British Columbia 0.128 0.711 0.739 0.635AGE18-34 0.110 0.670 0.746 0.66235-54 0.104 0.671 0.712 0.60455+ 0.164 0.790 0.808 0.658INCOMELess than $45K 0.140 0.680 0.759 0.664$45K-85K 0.116 0.711 0.773 0.642$85K or more 0.122 0.741 0.731 0.617GENDERMale 0.149 0.720 0.783 0.588Female 0.107 0.705 0.730 0.687URBAN/RURALRural 0.177 0.699 0.737 0.638Urban 0.116 0.715 0.759 0.639EDUCATIONHigh school 0.123 0.739 0.799 0.629College / tech. school 0.108 0.657 0.721 0.643University 0.134 0.753 0.742 0.650HOME OWNERSHIPRent 0.141 0.677 0.746 0.644Own 0.127 0.726 0.751 0.638Live for free 0.098 0.679 0.831 0.631
Note: This table shows the proportion of respondents holding a particular denomination fromthose who report having a positive amount of cash on hand in the DSI. Data are from the 2013MOP DSI (SQ weights used).
20

Table 3: Cash withdrawals, according to the SQ
ABM Bank teller Cashback ABM Bank teller Cashback
mean # times mean in $OVERALL 2.7 0.7 0.7 118 236 43REGIONAtlantic 2.8 0.6 0.8 126 280 35Quebec 2.9 0.4 1.1 136 297 40Ontario 2.9 0.9 0.7 111 232 46Prairies 2.2 0.7 0.3 121 206 44British Columbia 2.8 0.8 0.7 103 226 39AGE18-34 2.7 0.7 0.6 96 217 3935-54 2.9 0.6 1.0 113 204 4255+ 2.5 0.9 0.6 140 266 47INCOMELess than $45K 2.6 0.8 0.8 117 244 38$45K-85K 3.0 0.7 0.7 118 241 47$85K or more 2.6 0.6 0.7 118 222 42GENDERMale 3.0 0.7 0.6 122 253 44Female 2.5 0.7 0.8 113 221 42URBAN/RURALRural 2.5 0.9 0.8 122 227 41Urban 2.8 0.7 0.7 117 238 43EDUCATIONHigh school 3.0 0.9 0.8 123 230 41College / tech. school 2.7 0.7 0.9 114 248 43University 2.4 0.5 0.5 117 235 45HOME OWNERSHIPRent 3.6 0.8 1.0 118 247 38Own 2.5 0.7 0.7 119 237 45Live for free 2.8 0.6 0.4 95 188 36
Note: The first three columns show the mean number of withdrawals per month for allrespondents who answered the corresponding question. The means are calculated afterreplacing the highest 0.5% of values with the 99.5 percentile. The last three columns show thetypical amount withdrawn per individual for all respondents who answered the correspondingquestion. Cashback values over $1,000 are divided by 100 if the respondent is from Quebec,since some Quebec respondents reported very high values for the typical cashback amountand Quebec residents tend to use commas to represent decimal points. Cashback: cashback bydebit card at a retailer. Data are from the 2013 MOP SQ (SQ weights used).
21

Table 4: Debit and credit card ownership
Debit cards Credit cards
ownership # cards ownership # cardsOVERALL 0.983 1.1 0.820 1.9REGIONAtlantic 0.973 1.1 0.765 1.8Quebec 0.985 1.1 0.808 1.7Ontario 0.990 1.1 0.835 2.0Prairies 0.970 1.1 0.835 1.9British Columbia 0.985 1.1 0.809 1.8AGE18-34 0.990 1.1 0.741 1.435-54 0.985 1.2 0.856 2.055+ 0.976 1.0 0.848 2.1INCOMELess than $45K 0.984 1.0 0.712 1.5$45K-85K 0.986 1.2 0.854 1.9$85K or more 0.980 1.2 0.895 2.1GENDERMale 0.980 1.1 0.812 1.8Female 0.986 1.1 0.827 1.9URBAN/RURALRural 0.990 1.0 0.796 1.7Urban 0.982 1.2 0.825 1.9EDUCATIONHigh school 0.984 1.0 0.726 1.6College / tech. school 0.985 1.2 0.844 1.8University 0.984 1.2 0.917 2.3HOME OWNERSHIPRent 0.985 1.1 0.663 1.2Own 0.983 1.2 0.887 2.1Live for free 0.985 1.1 0.618 1.0
Note: Ownership is the proportion of respondents with at least one credit/debit card. Arespondent is considered to own a debit card if he/she reports having access to a non-zeronumber of debit cards or provides information for a main bank account. The number of cardsis the average number of credit/debit cards. In the calculation of this average, the highest0.5% of values are replaced with the 99.5 percentile. Data are from the 2013 MOP SQ (SQweights used).
22
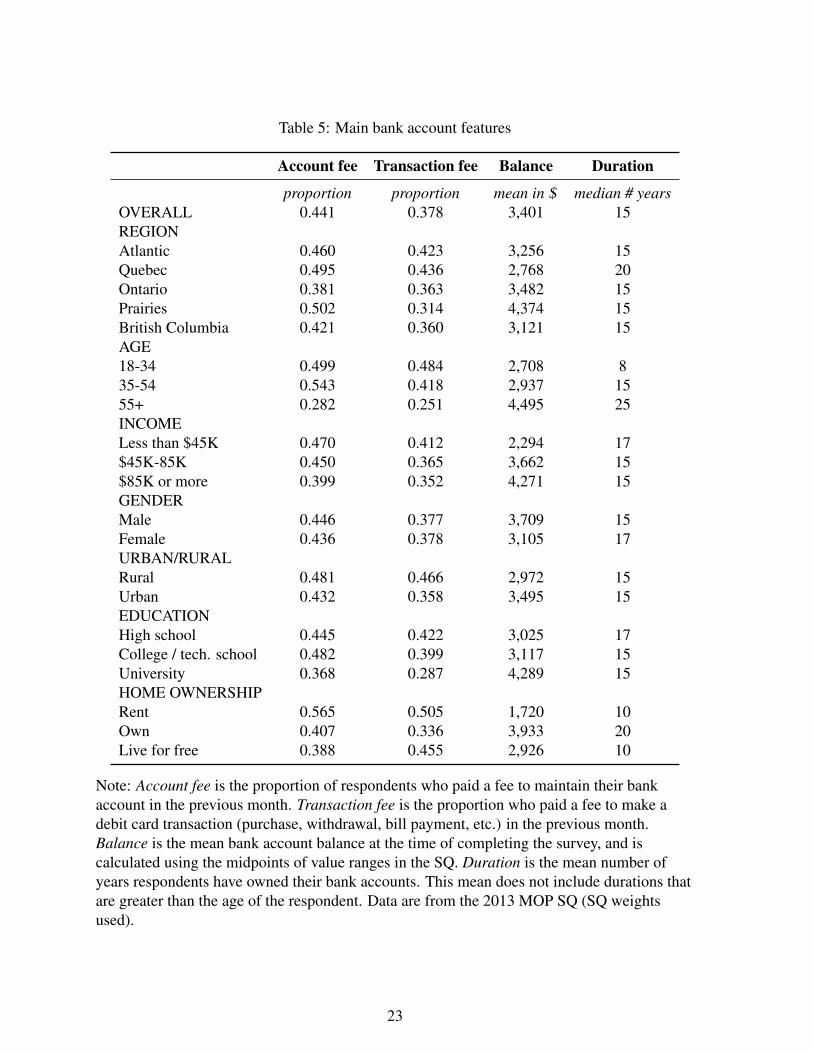
Table 5: Main bank account features
Account fee Transaction fee Balance Duration
proportion proportion mean in $ median # yearsOVERALL 0.441 0.378 3,401 15REGIONAtlantic 0.460 0.423 3,256 15Quebec 0.495 0.436 2,768 20Ontario 0.381 0.363 3,482 15Prairies 0.502 0.314 4,374 15British Columbia 0.421 0.360 3,121 15AGE18-34 0.499 0.484 2,708 835-54 0.543 0.418 2,937 1555+ 0.282 0.251 4,495 25INCOMELess than $45K 0.470 0.412 2,294 17$45K-85K 0.450 0.365 3,662 15$85K or more 0.399 0.352 4,271 15GENDERMale 0.446 0.377 3,709 15Female 0.436 0.378 3,105 17URBAN/RURALRural 0.481 0.466 2,972 15Urban 0.432 0.358 3,495 15EDUCATIONHigh school 0.445 0.422 3,025 17College / tech. school 0.482 0.399 3,117 15University 0.368 0.287 4,289 15HOME OWNERSHIPRent 0.565 0.505 1,720 10Own 0.407 0.336 3,933 20Live for free 0.388 0.455 2,926 10
Note: Account fee is the proportion of respondents who paid a fee to maintain their bankaccount in the previous month. Transaction fee is the proportion who paid a fee to make adebit card transaction (purchase, withdrawal, bill payment, etc.) in the previous month.Balance is the mean bank account balance at the time of completing the survey, and iscalculated using the midpoints of value ranges in the SQ. Duration is the mean number ofyears respondents have owned their bank accounts. This mean does not include durations thatare greater than the age of the respondent. Data are from the 2013 MOP SQ (SQ weightsused).
23
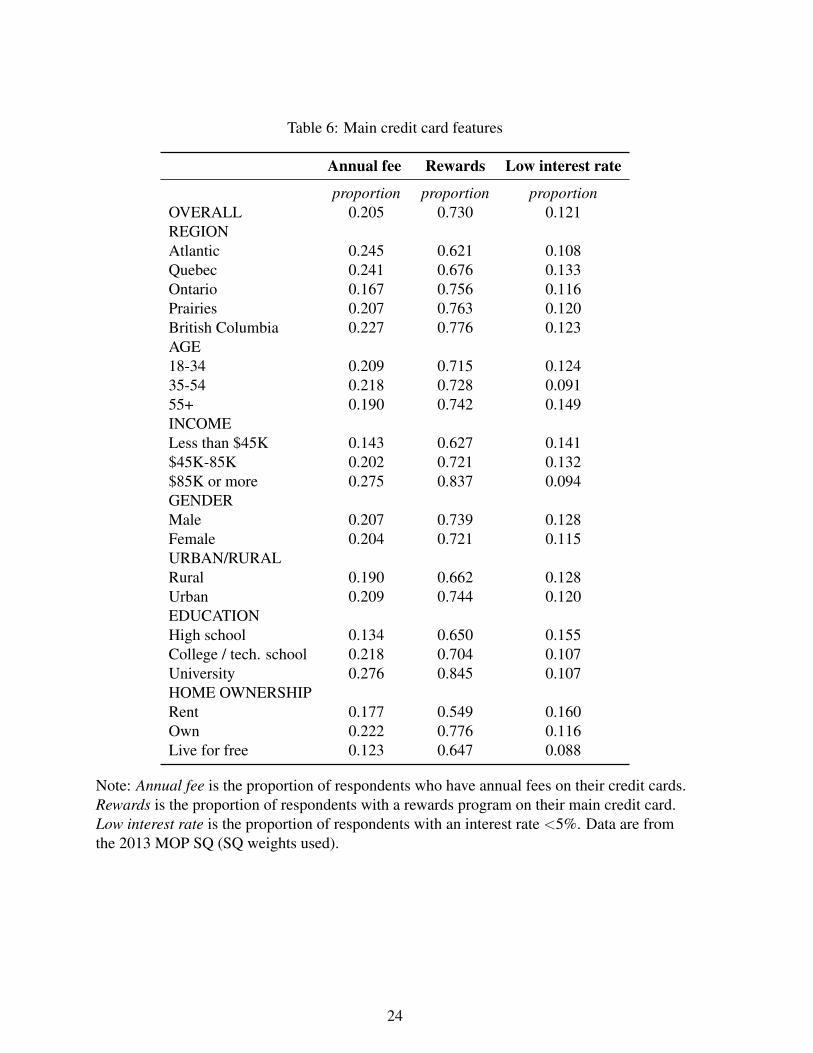
Table 6: Main credit card features
Annual fee Rewards Low interest rate
proportion proportion proportionOVERALL 0.205 0.730 0.121REGIONAtlantic 0.245 0.621 0.108Quebec 0.241 0.676 0.133Ontario 0.167 0.756 0.116Prairies 0.207 0.763 0.120British Columbia 0.227 0.776 0.123AGE18-34 0.209 0.715 0.12435-54 0.218 0.728 0.09155+ 0.190 0.742 0.149INCOMELess than $45K 0.143 0.627 0.141$45K-85K 0.202 0.721 0.132$85K or more 0.275 0.837 0.094GENDERMale 0.207 0.739 0.128Female 0.204 0.721 0.115URBAN/RURALRural 0.190 0.662 0.128Urban 0.209 0.744 0.120EDUCATIONHigh school 0.134 0.650 0.155College / tech. school 0.218 0.704 0.107University 0.276 0.845 0.107HOME OWNERSHIPRent 0.177 0.549 0.160Own 0.222 0.776 0.116Live for free 0.123 0.647 0.088
Note: Annual fee is the proportion of respondents who have annual fees on their credit cards.Rewards is the proportion of respondents with a rewards program on their main credit card.Low interest rate is the proportion of respondents with an interest rate <5%. Data are fromthe 2013 MOP SQ (SQ weights used).
24

Table 7: Main credit card spending
Limit under 2K Limit 10K+ Spending past month Revolver
proportion proportion mean in $ median in $ proportionOVERALL 0.173 0.395 1169 608 0.276REGIONAtlantic 0.172 0.415 1189 700 0.391Quebec 0.244 0.252 1089 500 0.320Ontario 0.143 0.444 1170 616 0.270Prairies 0.161 0.416 1148 698 0.178British Columbia 0.149 0.462 1316 757 0.287AGE18-34 0.302 0.240 1006 500 0.33735-54 0.142 0.431 1244 646 0.33255+ 0.114 0.465 1207 698 0.176INCOMELess than $45K 0.257 0.252 722 364 0.352$45K-85K 0.189 0.354 1064 530 0.261$85K or more 0.088 0.552 1638 1032 0.229GENDERMale 0.158 0.439 1168 565 0.262Female 0.187 0.353 1170 720 0.289URBAN/RURALRural 0.236 0.336 1169 500 0.291Urban 0.159 0.407 1169 655 0.273EDUCATIONHigh school 0.248 0.306 860 421 0.295College / tech. school 0.165 0.373 1179 615 0.339University 0.112 0.508 1480 1000 0.173HOME OWNERSHIPRent 0.344 0.204 695 300 0.426Own 0.126 0.438 1279 750 0.244Live for free 0.368 0.337 1012 485 0.302
Note: The first two columns report the proportion of respondents who indicated a spendinglimit on their main credit card in a certain range. The columns under Spending past monthshow the mean and median amounts charged to respondents’ credit cards in the previousmonth. In the calculation of the mean, the highest 2% of values are replaced with the 98thpercentile. Revolver is the proportion of respondents who did not pay off their full credit cardbalance in the previous month. Data are from the 2013 MOP SQ (SQ weights used).
25

Table 8: Contactless and stored-value card ownership
CTDC CTCC SVCm SVCs
ownership ownership ownership # cards ownership # cardsOVERALL 0.211 0.455 0.113 1.4 0.258 2.0REGIONAtlantic 0.312 0.413 0.160 1.2 0.272 1.5Quebec 0.096 0.350 0.076 1.4 0.149 1.5Ontario 0.280 0.548 0.123 1.3 0.289 1.9Prairies 0.227 0.430 0.111 1.5 0.315 2.5British Columbia 0.176 0.454 0.125 1.4 0.281 2.1AGE18-34 0.266 0.545 0.178 1.3 0.326 2.035-54 0.209 0.464 0.105 1.5 0.283 2.055+ 0.158 0.384 0.066 1.3 0.175 1.9INCOMELess than $45K 0.195 0.371 0.111 1.3 0.166 1.7$45K-85K 0.197 0.444 0.122 1.4 0.291 2.1$85K or more 0.243 0.548 0.104 1.4 0.318 2.0GENDERMale 0.223 0.502 0.128 1.4 0.231 1.9Female 0.199 0.409 0.098 1.4 0.283 2.0URBAN/RURALRural 0.160 0.428 0.120 1.3 0.218 1.7Urban 0.222 0.461 0.111 1.4 0.267 2.0EDUCATIONHigh school 0.194 0.364 0.113 1.4 0.199 1.7College / tech. school 0.220 0.476 0.118 1.3 0.282 1.9University 0.220 0.526 0.106 1.4 0.310 2.3HOME OWNERSHIPRent 0.189 0.446 0.164 1.2 0.229 1.6Own 0.211 0.453 0.097 1.4 0.265 2.0Live for free 0.324 0.590 0.127 1.3 0.266 2.4
Note: CTDC: contactless feature of a debit card; CTCC: contactless feature of a credit card;SVCm: multi-purpose stored-value cards issued by Visa, MasterCard or American Express;SVCs: single-purpose stored-value cards issued by a store. Ownership is the proportion ofrespondents with at least one stored-value card for SVCs and SVCm, and the proportion whoreported having a contactless feature on their main debit cards and credit cards, respectively,for CTDC and CTCC. The number of cards is the average number of stored-value cards heldby owners, that is, respondents who reported having at least one. In the calculation of thisaverage, the highest 0.5% of values are replaced with the 99.5 percentile. Data are from the2013 MOP SQ (SQ weights used).
26
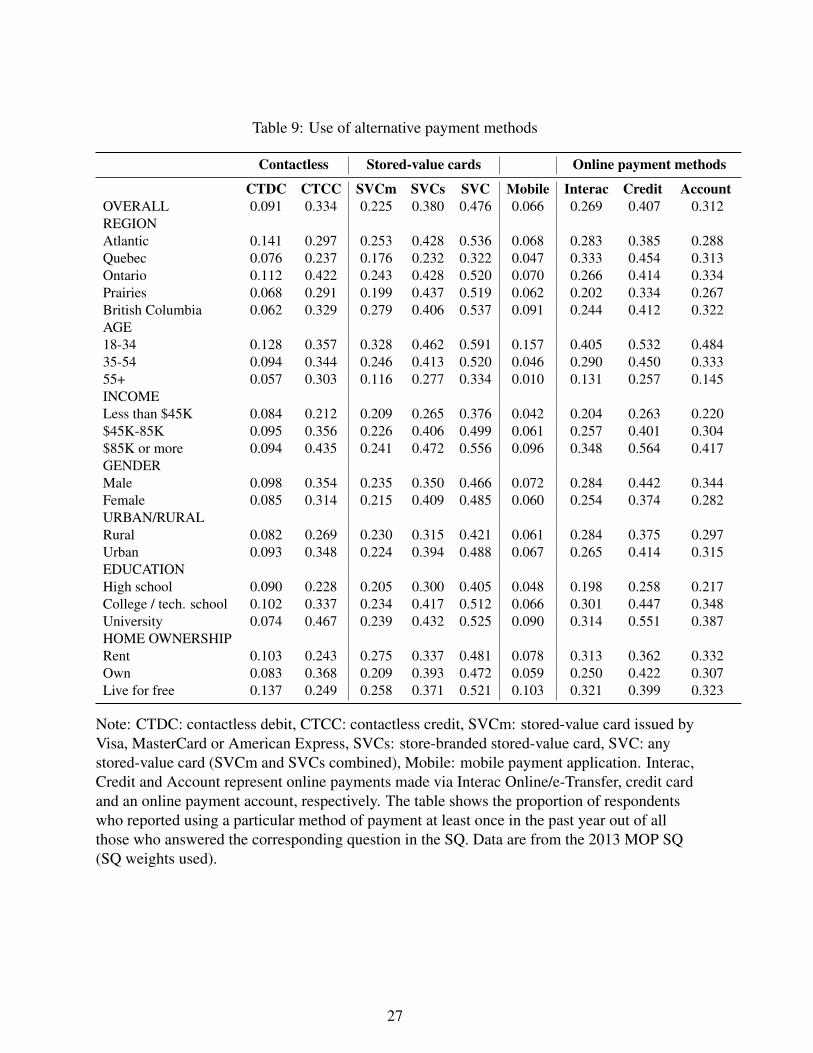
Table 9: Use of alternative payment methods
Contactless Stored-value cards Online payment methods
CTDC CTCC SVCm SVCs SVC Mobile Interac Credit AccountOVERALL 0.091 0.334 0.225 0.380 0.476 0.066 0.269 0.407 0.312REGIONAtlantic 0.141 0.297 0.253 0.428 0.536 0.068 0.283 0.385 0.288Quebec 0.076 0.237 0.176 0.232 0.322 0.047 0.333 0.454 0.313Ontario 0.112 0.422 0.243 0.428 0.520 0.070 0.266 0.414 0.334Prairies 0.068 0.291 0.199 0.437 0.519 0.062 0.202 0.334 0.267British Columbia 0.062 0.329 0.279 0.406 0.537 0.091 0.244 0.412 0.322AGE18-34 0.128 0.357 0.328 0.462 0.591 0.157 0.405 0.532 0.48435-54 0.094 0.344 0.246 0.413 0.520 0.046 0.290 0.450 0.33355+ 0.057 0.303 0.116 0.277 0.334 0.010 0.131 0.257 0.145INCOMELess than $45K 0.084 0.212 0.209 0.265 0.376 0.042 0.204 0.263 0.220$45K-85K 0.095 0.356 0.226 0.406 0.499 0.061 0.257 0.401 0.304$85K or more 0.094 0.435 0.241 0.472 0.556 0.096 0.348 0.564 0.417GENDERMale 0.098 0.354 0.235 0.350 0.466 0.072 0.284 0.442 0.344Female 0.085 0.314 0.215 0.409 0.485 0.060 0.254 0.374 0.282URBAN/RURALRural 0.082 0.269 0.230 0.315 0.421 0.061 0.284 0.375 0.297Urban 0.093 0.348 0.224 0.394 0.488 0.067 0.265 0.414 0.315EDUCATIONHigh school 0.090 0.228 0.205 0.300 0.405 0.048 0.198 0.258 0.217College / tech. school 0.102 0.337 0.234 0.417 0.512 0.066 0.301 0.447 0.348University 0.074 0.467 0.239 0.432 0.525 0.090 0.314 0.551 0.387HOME OWNERSHIPRent 0.103 0.243 0.275 0.337 0.481 0.078 0.313 0.362 0.332Own 0.083 0.368 0.209 0.393 0.472 0.059 0.250 0.422 0.307Live for free 0.137 0.249 0.258 0.371 0.521 0.103 0.321 0.399 0.323
Note: CTDC: contactless debit, CTCC: contactless credit, SVCm: stored-value card issued byVisa, MasterCard or American Express, SVCs: store-branded stored-value card, SVC: anystored-value card (SVCm and SVCs combined), Mobile: mobile payment application. Interac,Credit and Account represent online payments made via Interac Online/e-Transfer, credit cardand an online payment account, respectively. The table shows the proportion of respondentswho reported using a particular method of payment at least once in the past year out of allthose who answered the corresponding question in the SQ. Data are from the 2013 MOP SQ(SQ weights used).
27
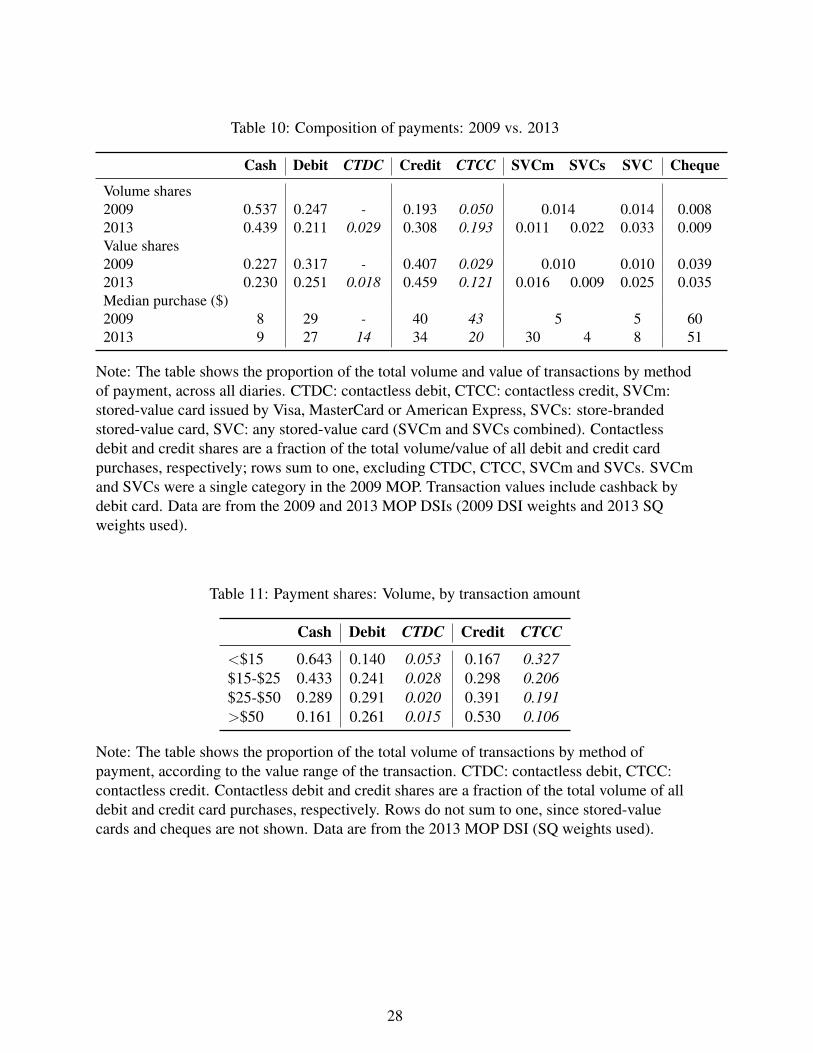
Table 10: Composition of payments: 2009 vs. 2013
Cash Debit CTDC Credit CTCC SVCm SVCs SVC Cheque
Volume shares2009 0.537 0.247 - 0.193 0.050 0.014 0.014 0.0082013 0.439 0.211 0.029 0.308 0.193 0.011 0.022 0.033 0.009Value shares2009 0.227 0.317 - 0.407 0.029 0.010 0.010 0.0392013 0.230 0.251 0.018 0.459 0.121 0.016 0.009 0.025 0.035Median purchase ($)2009 8 29 - 40 43 5 5 602013 9 27 14 34 20 30 4 8 51
Note: The table shows the proportion of the total volume and value of transactions by methodof payment, across all diaries. CTDC: contactless debit, CTCC: contactless credit, SVCm:stored-value card issued by Visa, MasterCard or American Express, SVCs: store-brandedstored-value card, SVC: any stored-value card (SVCm and SVCs combined). Contactlessdebit and credit shares are a fraction of the total volume/value of all debit and credit cardpurchases, respectively; rows sum to one, excluding CTDC, CTCC, SVCm and SVCs. SVCmand SVCs were a single category in the 2009 MOP. Transaction values include cashback bydebit card. Data are from the 2009 and 2013 MOP DSIs (2009 DSI weights and 2013 SQweights used).
Table 11: Payment shares: Volume, by transaction amount
Cash Debit CTDC Credit CTCC
<$15 0.643 0.140 0.053 0.167 0.327$15-$25 0.433 0.241 0.028 0.298 0.206$25-$50 0.289 0.291 0.020 0.391 0.191>$50 0.161 0.261 0.015 0.530 0.106
Note: The table shows the proportion of the total volume of transactions by method ofpayment, according to the value range of the transaction. CTDC: contactless debit, CTCC:contactless credit. Contactless debit and credit shares are a fraction of the total volume of alldebit and credit card purchases, respectively. Rows do not sum to one, since stored-valuecards and cheques are not shown. Data are from the 2013 MOP DSI (SQ weights used).
28
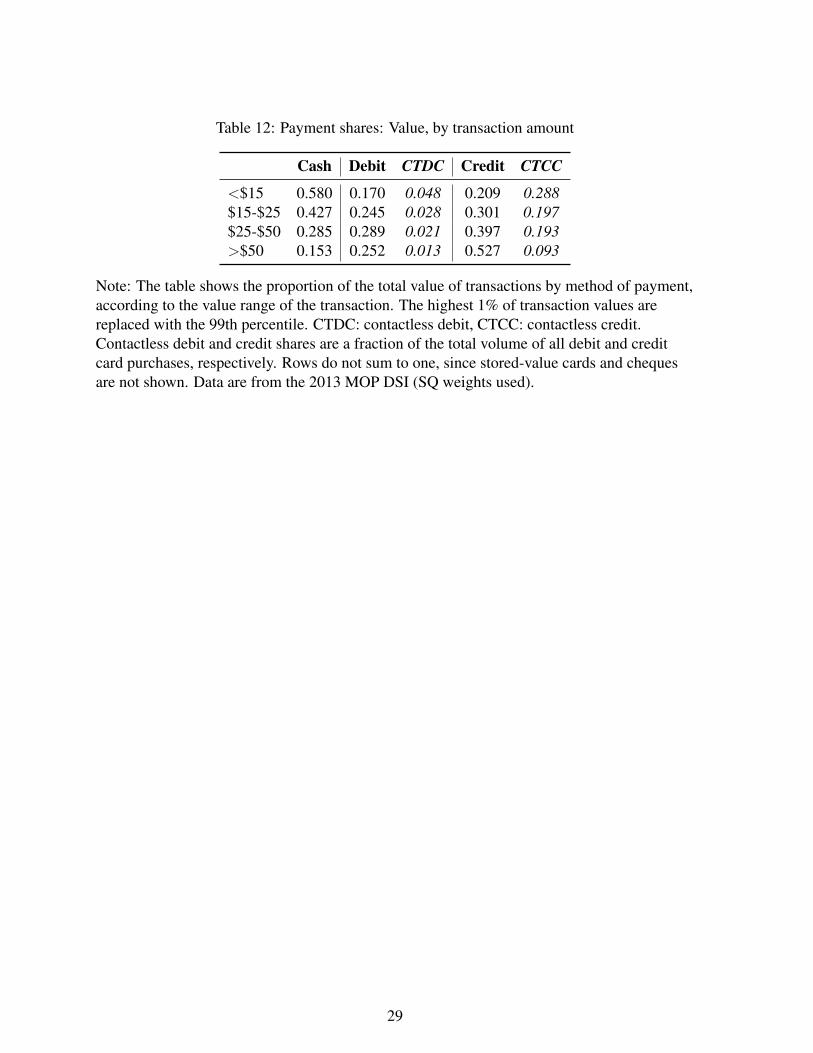
Table 12: Payment shares: Value, by transaction amount
Cash Debit CTDC Credit CTCC
<$15 0.580 0.170 0.048 0.209 0.288$15-$25 0.427 0.245 0.028 0.301 0.197$25-$50 0.285 0.289 0.021 0.397 0.193>$50 0.153 0.252 0.013 0.527 0.093
Note: The table shows the proportion of the total value of transactions by method of payment,according to the value range of the transaction. The highest 1% of transaction values arereplaced with the 99th percentile. CTDC: contactless debit, CTCC: contactless credit.Contactless debit and credit shares are a fraction of the total volume of all debit and creditcard purchases, respectively. Rows do not sum to one, since stored-value cards and chequesare not shown. Data are from the 2013 MOP DSI (SQ weights used).
29

Table 13: Payment shares: Volume, by socio-demographics
Cash Debit CTDC Credit CTCC
OVERALL 0.439 0.211 0.029 0.308 0.193REGIONAtlantic 0.432 0.219 0.023 0.315 0.279Quebec 0.444 0.222 0.007 0.309 0.141Ontario 0.432 0.216 0.057 0.307 0.242Prairies 0.456 0.196 0.007 0.292 0.110British Columbia 0.434 0.196 0.015 0.326 0.182AGE18-34 0.408 0.273 0.036 0.284 0.27435-54 0.401 0.211 0.031 0.341 0.17955+ 0.507 0.160 0.017 0.291 0.148INCOMELess than $45K 0.520 0.220 0.012 0.230 0.193$45K-85K 0.452 0.228 0.041 0.275 0.200$85K or more 0.357 0.190 0.033 0.403 0.190GENDERMale 0.461 0.195 0.035 0.301 0.203Female 0.417 0.227 0.025 0.315 0.184URBAN/RURALRural 0.447 0.264 0.036 0.248 0.186Urban 0.437 0.201 0.028 0.320 0.194EDUCATIONHigh school 0.495 0.236 0.016 0.235 0.185College / tech. school 0.423 0.241 0.024 0.297 0.224University 0.385 0.148 0.063 0.412 0.168HOME OWNERSHIPRent 0.496 0.275 0.023 0.186 0.236Own 0.418 0.189 0.029 0.350 0.191Live for free 0.511 0.270 0.049 0.180 0.125
Note: The table shows the proportion of the total volume of transactions by method ofpayment, according to a respondent’s socio-demographic status. CTDC: contactless debit,CTCC: contactless credit. Contactless debit and credit shares are a fraction of the total volumeof all debit and credit card purchases, respectively. Rows do not sum to one, since stored-valuecards and cheques are not shown. Data are from the 2013 MOP DSI (SQ weights used).
30

Table 14: Payment shares: Value, by socio-demographics
Cash Debit CTDC Credit CTCC
OVERALL 0.231 0.248 0.018 0.461 0.120REGIONAtlantic 0.292 0.244 0.027 0.441 0.228Quebec 0.256 0.261 0.014 0.420 0.085Ontario 0.211 0.252 0.028 0.489 0.152Prairies 0.225 0.244 0.003 0.433 0.061British Columbia 0.227 0.222 0.008 0.498 0.111AGE18-34 0.246 0.289 0.024 0.406 0.19735-54 0.195 0.253 0.017 0.498 0.09055+ 0.262 0.212 0.012 0.458 0.112INCOMELess than $45K 0.318 0.275 0.005 0.363 0.146$45K-85K 0.231 0.292 0.031 0.423 0.138$85K or more 0.167 0.192 0.012 0.563 0.098GENDERMale 0.250 0.223 0.026 0.462 0.119Female 0.213 0.270 0.012 0.461 0.122URBAN/RURALRural 0.274 0.292 0.024 0.351 0.086Urban 0.221 0.238 0.016 0.485 0.126EDUCATIONHigh school 0.308 0.301 0.011 0.349 0.112College / tech. school 0.218 0.284 0.015 0.454 0.158University 0.162 0.153 0.036 0.596 0.090HOME OWNERSHIPRent 0.316 0.354 0.019 0.285 0.134Own 0.209 0.219 0.016 0.509 0.122Live for free 0.273 0.284 0.031 0.363 0.057
Note: The table shows the proportion of the total value of transactions by method of payment,according to a respondent’s socio-demographic status. The highest 1% of transaction valuesare replaced with the 99th percentile. CTDC: contactless debit, CTCC: contactless credit.Contactless debit and credit shares are a fraction of the total volume of all debit and creditcard purchases, respectively. Rows do not sum to one, since stored-value cards and chequesare not shown. Data are from the 2013 MOP DSI (SQ weights used).
31

Table 15: Payment shares: Volume, by type of good
Cash Debit CTDC Credit CTCC Overall
Groceries / drugs 0.392 0.251 0.028 0.330 0.301 0.348Gas 0.217 0.299 0.012 0.468 0.162 0.079Personal attire 0.264 0.264 0.005 0.428 0.082 0.043Health care 0.346 0.181 0.030 0.430 0.115 0.025Hobby / sporting goods 0.439 0.154 0.000 0.357 0.100 0.026Professional services 0.409 0.157 0.064 0.359 0.027 0.019Travel / parking 0.568 0.069 0.033 0.292 0.075 0.022Entertainment / meals 0.558 0.169 0.070 0.216 0.197 0.248Durable goods 0.289 0.212 0.007 0.452 0.056 0.036Other 0.541 0.172 0.007 0.232 0.090 0.154
Note: The table shows the proportion of the total volume of transactions by method ofpayment, according to the type of good purchased. CTDC: contactless debit, CTCC:contactless credit. Contactless debit and credit shares are a fraction of the total volume of alldebit and credit card purchases, respectively. Rows do not sum to one, since stored-valuecards and cheques are not shown. Data are from the 2013 MOP DSI (SQ weights used).
Table 16: Payment shares: Value, by type of good
Cash Debit CTDC Credit CTCC Overall
Groceries / drugs 0.242 0.315 0.027 0.414 0.196 0.314Gas 0.166 0.297 0.005 0.518 0.184 0.089Personal attire 0.134 0.270 0.007 0.561 0.053 0.056Health care 0.159 0.176 0.012 0.577 0.031 0.046Hobby / sporting goods 0.187 0.164 0.000 0.504 0.069 0.045Professional services 0.255 0.126 0.040 0.495 0.003 0.039Travel / parking 0.221 0.121 0.009 0.488 0.024 0.028Entertainment / meals 0.374 0.210 0.025 0.389 0.109 0.107Durable goods 0.174 0.204 0.002 0.528 0.060 0.083Other 0.259 0.210 0.010 0.441 0.086 0.194
Note: The table shows the proportion of the total value of transactions by method of payment,according to the type of good purchased. The highest 1% of transaction values are replacedwith the 99th percentile. CTDC: contactless debit, CTCC: contactless credit. Contactlessdebit and credit shares are a fraction of the total volume of all debit and credit card purchases,respectively. Rows do not sum to one, since stored-value cards and cheques are not shown.Data are from the 2013 MOP DSI (SQ weights used).
32

Table 17: Payment shares: Volume, by channel
Cash Debit CTDC Credit CTCC Overall
Store 0.418 0.227 0.026 0.317 0.201 0.878Online: computer 0.093 0.059 0.000 0.836 0.026 0.013Online: mobile / tablet 0.044 0.116 0.000 0.681 0.295 0.001Phone 0.110 0.008 0.000 0.848 0.240 0.004Person to person 0.767 0.100 0.000 0.071 0.112 0.033Mail 0.114 0.000 0.000 0.009 0.000 0.003Other 0.629 0.100 0.007 0.212 0.148 0.068
Note: The table shows the proportion of the total volume of transactions by method ofpayment, according to the channel. CTDC: contactless debit, CTCC: contactless credit.Contactless debit and credit shares are a fraction of the total volume of all debit and creditcard purchases, respectively. Rows do not sum to one, since stored-value cards and chequesare not shown. Data are from the 2013 MOP DSI (SQ weights used).
Table 18: Payment shares: Value, by channel
Cash Debit CTDC Credit CTCC Overall
Store 0.224 0.275 0.017 0.465 0.121 0.808Online: computer 0.016 0.060 0.000 0.919 0.029 0.033Online: mobile / tablet 0.010 0.053 0.000 0.831 0.683 0.001Phone 0.046 0.015 0.000 0.846 0.176 0.017Person to person 0.523 0.150 0.000 0.184 0.234 0.041Mail 0.041 0.000 0.000 0.002 0.000 0.006Other 0.359 0.176 0.021 0.311 0.128 0.095
Note: The table shows the proportion of the total value of transactions by method of payment,according to channel. The highest 1% of transaction values are replaced with the 99thpercentile. CTDC: contactless debit, CTCC: contactless credit. Contactless debit and creditshares are a fraction of the total volume of all debit and credit card purchases, respectively.Rows do not sum to one, since stored-value cards and cheques are not shown. Data are fromthe 2013 MOP DSI (SQ weights used).
33
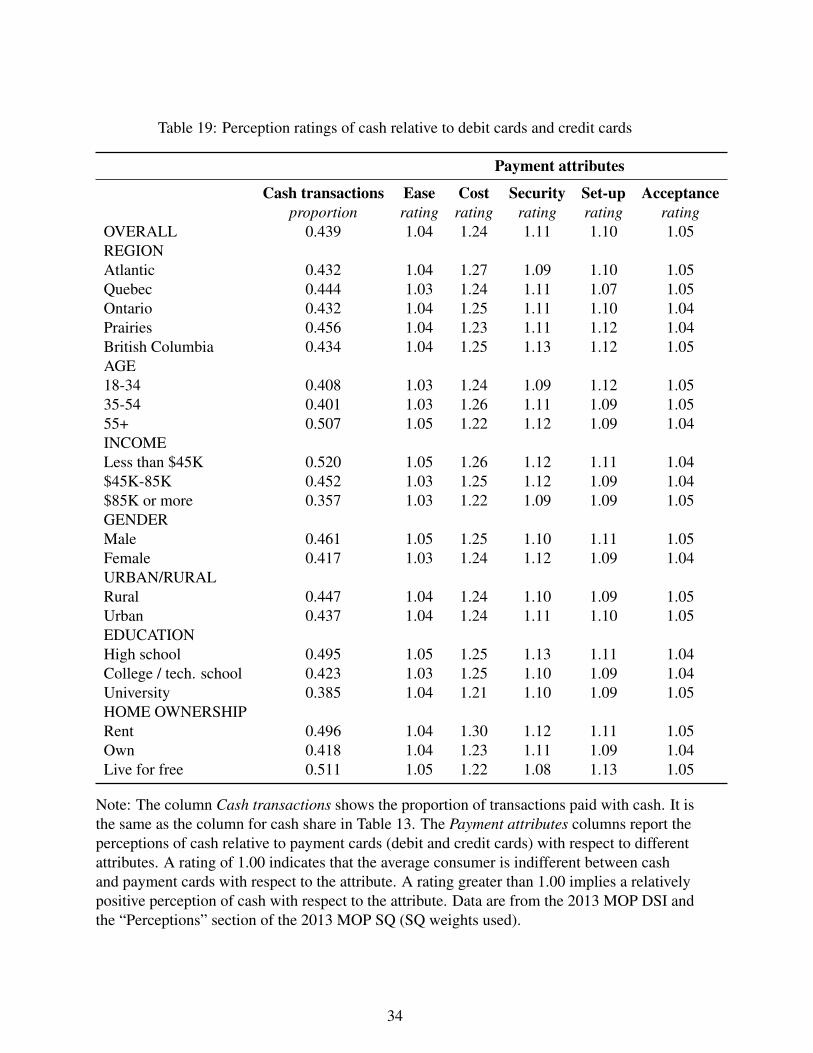
Table 19: Perception ratings of cash relative to debit cards and credit cards
Payment attributes
Cash transactions Ease Cost Security Set-up Acceptanceproportion rating rating rating rating rating
OVERALL 0.439 1.04 1.24 1.11 1.10 1.05REGIONAtlantic 0.432 1.04 1.27 1.09 1.10 1.05Quebec 0.444 1.03 1.24 1.11 1.07 1.05Ontario 0.432 1.04 1.25 1.11 1.10 1.04Prairies 0.456 1.04 1.23 1.11 1.12 1.04British Columbia 0.434 1.04 1.25 1.13 1.12 1.05AGE18-34 0.408 1.03 1.24 1.09 1.12 1.0535-54 0.401 1.03 1.26 1.11 1.09 1.0555+ 0.507 1.05 1.22 1.12 1.09 1.04INCOMELess than $45K 0.520 1.05 1.26 1.12 1.11 1.04$45K-85K 0.452 1.03 1.25 1.12 1.09 1.04$85K or more 0.357 1.03 1.22 1.09 1.09 1.05GENDERMale 0.461 1.05 1.25 1.10 1.11 1.05Female 0.417 1.03 1.24 1.12 1.09 1.04URBAN/RURALRural 0.447 1.04 1.24 1.10 1.09 1.05Urban 0.437 1.04 1.24 1.11 1.10 1.05EDUCATIONHigh school 0.495 1.05 1.25 1.13 1.11 1.04College / tech. school 0.423 1.03 1.25 1.10 1.09 1.04University 0.385 1.04 1.21 1.10 1.09 1.05HOME OWNERSHIPRent 0.496 1.04 1.30 1.12 1.11 1.05Own 0.418 1.04 1.23 1.11 1.09 1.04Live for free 0.511 1.05 1.22 1.08 1.13 1.05
Note: The column Cash transactions shows the proportion of transactions paid with cash. It isthe same as the column for cash share in Table 13. The Payment attributes columns report theperceptions of cash relative to payment cards (debit and credit cards) with respect to differentattributes. A rating of 1.00 indicates that the average consumer is indifferent between cashand payment cards with respect to the attribute. A rating greater than 1.00 implies a relativelypositive perception of cash with respect to the attribute. Data are from the 2013 MOP DSI andthe “Perceptions” section of the 2013 MOP SQ (SQ weights used).
34
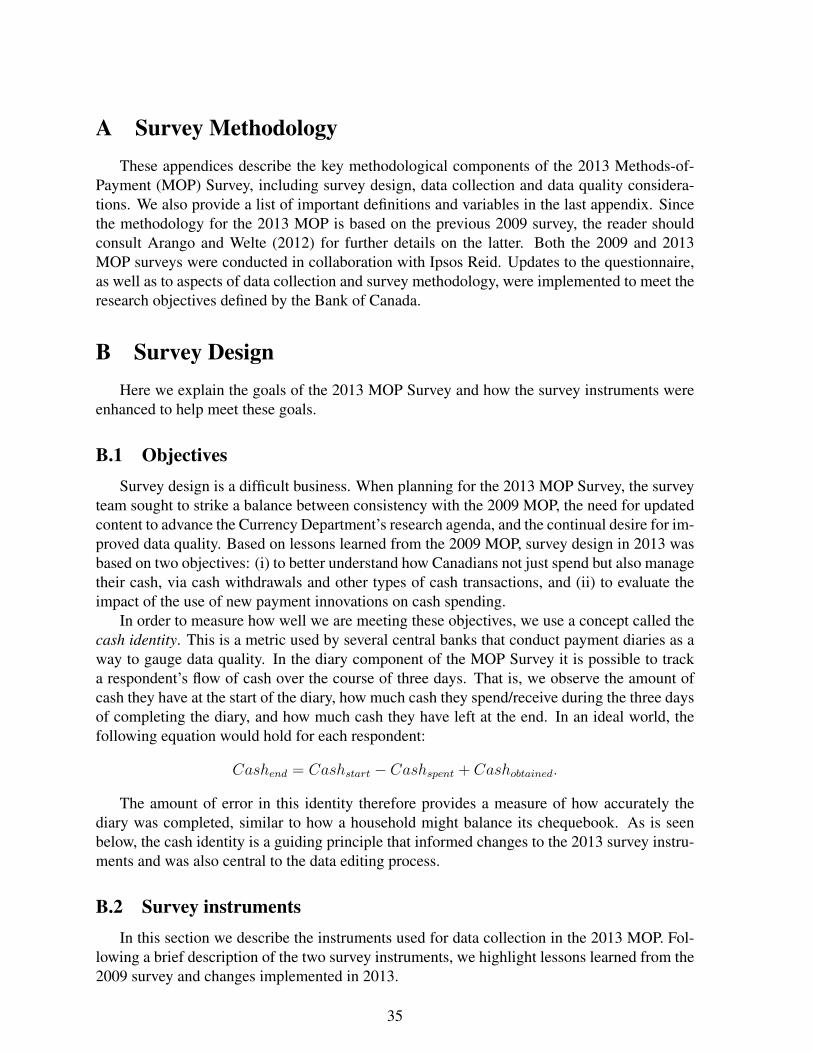
A Survey MethodologyThese appendices describe the key methodological components of the 2013 Methods-of-
Payment (MOP) Survey, including survey design, data collection and data quality considera-tions. We also provide a list of important definitions and variables in the last appendix. Sincethe methodology for the 2013 MOP is based on the previous 2009 survey, the reader shouldconsult Arango and Welte (2012) for further details on the latter. Both the 2009 and 2013MOP surveys were conducted in collaboration with Ipsos Reid. Updates to the questionnaire,as well as to aspects of data collection and survey methodology, were implemented to meet theresearch objectives defined by the Bank of Canada.
B Survey DesignHere we explain the goals of the 2013 MOP Survey and how the survey instruments were
enhanced to help meet these goals.
B.1 ObjectivesSurvey design is a difficult business. When planning for the 2013 MOP Survey, the survey
team sought to strike a balance between consistency with the 2009 MOP, the need for updatedcontent to advance the Currency Department’s research agenda, and the continual desire for im-proved data quality. Based on lessons learned from the 2009 MOP, survey design in 2013 wasbased on two objectives: (i) to better understand how Canadians not just spend but also managetheir cash, via cash withdrawals and other types of cash transactions, and (ii) to evaluate theimpact of the use of new payment innovations on cash spending.
In order to measure how well we are meeting these objectives, we use a concept called thecash identity. This is a metric used by several central banks that conduct payment diaries as away to gauge data quality. In the diary component of the MOP Survey it is possible to tracka respondent’s flow of cash over the course of three days. That is, we observe the amount ofcash they have at the start of the diary, how much cash they spend/receive during the three daysof completing the diary, and how much cash they have left at the end. In an ideal world, thefollowing equation would hold for each respondent:
Cashend = Cashstart − Cashspent + Cashobtained.
The amount of error in this identity therefore provides a measure of how accurately thediary was completed, similar to how a household might balance its chequebook. As is seenbelow, the cash identity is a guiding principle that informed changes to the 2013 survey instru-ments and was also central to the data editing process.
B.2 Survey instrumentsIn this section we describe the instruments used for data collection in the 2013 MOP. Fol-
lowing a brief description of the two survey instruments, we highlight lessons learned from the2009 survey and changes implemented in 2013.
35

B.2.1 SQ and DSI
As in 2009, the 2013 MOP uses two survey instruments: the survey questionnaire (SQ)and the diary survey instrument (DSI). The SQ obtains information on the range of paymentmethods Canadians have available when they go to make a purchase. With respect to cash,the SQ asks about cash holdings and management, for example, the amount of cash Canadianscarry and their typical withdrawal habits. The SQ also asks about important features of therespondent’s main bank account and credit card, since these can affect payment choice. Forexample, respondents who have a rewards program on their credit card are more likely to use itto make purchases. Finally, the SQ asks respondents which attributes—ease of use, costliness,security, set-up and acceptance—are important to them when choosing how to pay, and howthey rank various payment methods with respect to these attributes.
The DSI is meant to complement the SQ and uses the format of a diary to track Canadi-ans’ actual payment choices. Respondents are asked to record transactional details for everypurchase they make over the course of three days, including the payment method they use, thepurchase amount, the type of good and why they choose to pay the way they do. The DSI alsoasks respondents to record any cash withdrawals they make, as well as the amount of cash theyhave on them at the beginning and end of the diary.
B.2.2 Update in 2013
Although portions of the content and layout from the 2009 MOP were kept consistentfor 2013, it was important to identify areas where the instruments could be improved upon.An emphasis on improving data quality meant an inevitable trade-off in terms of being ableto directly compare all aspects of the SQ and DSI across years. However, certain questionsin the SQ were kept consistent so that such a comparison is possible. Further, although thelayout is updated in 2013, all key components of the DSI were kept consistent with respect topurchase/withdrawal details and cash balances. More in-depth analysis to carefully compareresults from the 2009 and 2013 MOP surveys is currently under way. See Chen, Shen andStuber (2014).
Cash management. The most important lesson learned from the 2009 MOP had to do withcollecting data on cash management and withdrawals. In particular, respondents completing apaper-based DSI in 2009 were asked to record withdrawals and purchases on the same line (seeFigure B.1(a)). If they made a withdrawal from an ABM (for example), only the first portionof the line was completed, whereas the second portion of the line was used for recordingpurchases. The respondent would be required to fill in the entire line only for a cashbacktransaction on a debit card.
We found that this layout had an adverse effect on the quality of the DSI as measuredby the cash identity. The cash identity error was twice as large on average for those whorecorded at least one withdrawal in the 2009 DSI. Further analysis, as well as feedback fromrespondents and the survey company, indicated that grouping purchases and withdrawals intoa single “transaction” category was confusing. In addition, the definition of a cash transactionin 2009 was limited; people often manage their cash in ways other than for making purchasesor withdrawals.
36
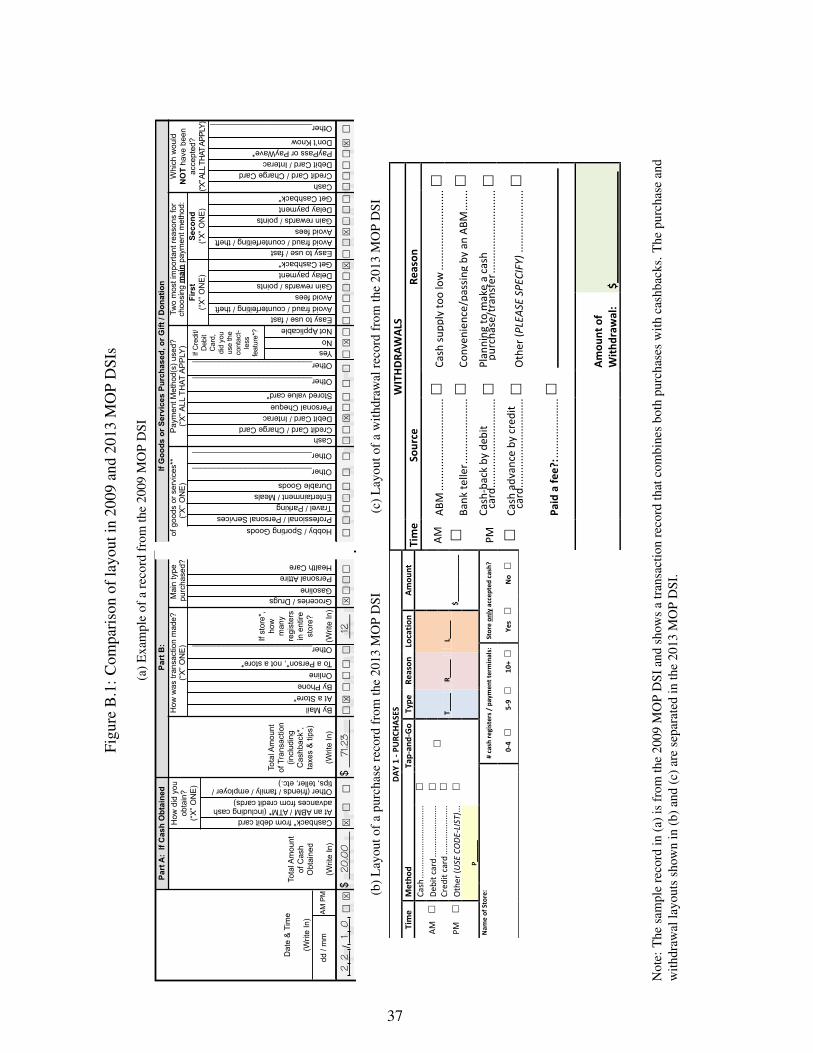
Figu
reB
.1:C
ompa
riso
nof
layo
utin
2009
and
2013
MO
PD
SIs
(a)E
xam
ple
ofa
reco
rdfr
omth
e20
09M
OP
DSI
67
Groceries / DrugsGasolinePersonal AttireHealth Care
E X A
M P L
E
E
X A M
P L E
How
did
you
ob
tain
?(“
X” O
NE
)
Part
A:
If C
ash
Obt
aine
dH
ow w
as tr
ansa
ctio
n m
ade?
(“X
” ON
E)
If st
ore*
, ho
w
man
y re
gist
ers
in e
ntire
st
ore?
(Writ
e In
)
Dat
e &
Tim
e
(Writ
e In
)
Tota
l Am
ount
of C
ash
Obt
aine
d
(Writ
e In
)
Cashback* from debit cardAt an ABM / ATM* (including cash advances from credit cards)Other (friends / family / employer / tips, teller, etc.)
Tota
l Am
ount
of
Tra
nsac
tion
(incl
udin
g C
ashb
ack*
, ta
xes
& ti
ps)
(Writ
e In
)
By MailAt a Store*By PhoneOnlineTo a Person*, not a store*
Other___________________________
dd /
mm
AM
PM
____
____
____
____
____
____
____
____
____
____
____
____
____
____
/ / / / / / / / / / / / / /
$ __
____
__
$ __
____
__
$ __
____
__
$ __
____
__
$ __
____
__
$ __
____
__
$ __
____
__
$ __
____
__
$ __
____
__
$ __
____
__
$ __
____
__
$ __
____
__
$ __
____
__
$ __
____
__
$ __
____
__
$ __
____
__
$ __
____
__
$ __
____
__
$ __
____
__
$ __
____
__
$ __
____
__
$ __
____
__
$ __
____
__
$ __
____
__
$ __
____
__
$ __
____
__
$ __
____
__
$ __
____
__
E X A
M P L
E
E
X A M
P L E
Hobby / Sporting GoodsProfessional / Personal ServicesTravel / ParkingEntertainment / MealsDurable Goods
Other___________________________
Other___________________________
Pay
men
t Met
hod(
s) u
sed?
(“X
” ALL
TH
AT A
PP
LY)
CashCredit Card / Charge CardDebit Card / InteracPersonal ChequeStored value card*
Other___________________________
Other___________________________
If C
redi
t/D
ebit
Car
d,
did
you
use
the
cont
act-
less
fe
atur
e*?
YesNoNot Applicable
Two
mos
t im
porta
nt re
ason
s fo
r ch
oosi
ng m
ain
paym
ent m
etho
d:
Easy to use / fastAvoid fraud / counterfeiting / theftAvoid feesGain rewards / pointsDelay paymentGet Cashback*
Firs
t(“
X” O
NE
)Se
cond
(“X
” ON
E)
Whi
ch w
ould
N
OT
have
bee
n ac
cept
ed?
(“X” A
LL T
HAT
APPL
Y)
CashCredit Card / Charge CardDebit Card / InteracPayPass or PayWave*Don’t Know
Other_______________________
Easy to use / fastAvoid fraud / counterfeiting / theftAvoid feesGain rewards / pointsDelay paymentGet Cashback*
*See
Defi
niti
ons
on P
age
5 **
See
Typ
es o
f Goo
ds o
r Ser
vice
s / E
xam
ples
on
Pag
e 5
Part
B:
If
Goo
ds o
r Ser
vice
s Pu
rcha
sed,
or G
ift /
Don
atio
n
Mai
n ty
pe
purc
hase
d?
2
2
1
0
x
2
0.0
0
x
7
1.23
x
12
x
x
x
x
x
x
2
4
1
0
x
8
6.0
0
x
1
x
x
x
x
x
x
of
goo
ds o
r ser
vice
s**
(
“X” O
NE
)
(b)L
ayou
tofa
purc
hase
reco
rdfr
omth
e20
13M
OP
DSI
DAY
1 - P
URC
HAS
ES
Tim
e M
etho
d Ta
p-an
d-Go
Ty
pe
Reas
on
Loca
tion
Amou
nt
Ca
sh ...
......
......
......
......
....
T___
__
R___
__
L___
__
AM
De
bit c
ard
......
......
......
....
Cred
it ca
rd ...
......
......
......
PM
O
ther
(USE
CO
DE-L
IST)
...
$_
____
____
____
P_
____
_
Nam
e of
Sto
re:
#
cash
regi
ster
s / p
aym
ent t
erm
inal
s:
Stor
e on
ly a
ccep
ted
cash
?
0-
4
5-
9
10
+
Ye
s
N
o
(c)L
ayou
tofa
with
draw
alre
cord
from
the
2013
MO
PD
SID
AY 1
– C
ASH
MAN
AGEM
ENT
WIT
HD
RAW
ALS
Tim
e So
urce
Re
ason
AM
ABM
.....
......
......
......
......
..
Cash
supp
ly to
o lo
w ..
......
......
......
......
.
Bank
telle
r .....
......
......
.....
Conv
enie
nce/
pass
ing
by a
n AB
M ...
....
PM
Cash
-bac
k by
deb
it ca
rd...
......
......
......
......
...
Plan
ning
to m
ake
a ca
sh
purc
hase
/tra
nsfe
r ....
......
......
......
......
Cash
adv
ance
by
cred
it ca
rd...
......
......
......
......
...
Oth
er (P
LEAS
E SP
ECIF
Y) ..
......
......
......
.
Paid
a fe
e?: ..
......
......
......
__
____
____
____
____
____
____
____
____
Amou
nt o
f W
ithdr
awal
: $_
____
____
____
____
__
Not
e:T
hesa
mpl
ere
cord
in(a
)is
from
the
2009
MO
PD
SIan
dsh
ows
atr
ansa
ctio
nre
cord
that
com
bine
sbo
thpu
rcha
ses
with
cash
back
s.T
hepu
rcha
sean
dw
ithdr
awal
layo
uts
show
nin
(b)a
nd(c
)are
sepa
rate
din
the
2013
MO
PD
SI.
37

The layout of the 2013 DSI was therefore altered to separate purchases and withdrawals(see Figure B.1(b) and Figure B.1(c)). In addition, to more accurately track cash managementand improve the cash identity error, questions were added to better understand how cash isused in ways other than making purchases at the point of sale (POS). For example, peoplesometimes withdraw cash and put it away at home for emergencies or as a form of budgetcontrol. Alternatively, people may be paid in cash by their employer, representing a source ofcash income other than a traditional bank/ABM/cashback withdrawal. Both the SQ and DSIincorporate these and other elements to better demonstrate how Canadians manage their cash.
Figure B.2 shows the improvement in measuring cash between the 2009 and 2013 MOPsurveys. The coloured portions represent the percentage of respondents whose cash identityerror fell within a certain range. In 2009, 45% of respondents had an error in their cash identitythat was $5 or less, indicating that we were able to track their cash fairly accurately. Thisproportion increased by almost 10% in 2013 to 54%, signifying a noticeable improvement indata quality.
Figure B.2: Improvements in measuring cash: cash identity errors
0 20 40 60 80 100Per cent
2013
2009
<=$5 $10−$25 $50−$100
$5−$10 $25−$50 >$100
Note: Errors could theoretically be positive or negative; this graph shows the absolute value of the cash identityerror.
Payment innovations. The other important aspect of the survey instruments requiring up-dating was the level of detail concerning alternative methods of payment to cash, debit andcredit. In 2009, both the SQ and DSI incorporated questions about contactless credit cards andstored-value cards. Research using this data conducted by the Bank of Canada has shown thatthese payment innovations are important for understanding the use of cash by Canadians. For
38

example, Fung, Huynh and Sabetti (2012) show that the use of contactless credit cards andstored-value cards leads to a decrease in cash spending, both in terms of the number and valueof cash transactions. One potential explanation for this fact is that these payment methodscompete with the speed and convenience of cash, while offering other benefits, such as rewardsprograms for credit cards (see Arango, Huynh and Sabetti (2011)).
These findings illustrated the need to collect more detailed information on a range of al-ternative payment methods and also exposed some limitations of the 2009 instruments. Forexample, in 2009, the category of stored-value cards included prepaid multi-purpose cards is-sued by Visa, MasterCard and American Express and store-branded gift cards that can onlybe used at the store/chain from which they were issued. Also, although the 2009 SQ askedwhether the respondent had a contactless payment feature on their main credit card, there wasno measure of active adoption; i.e., they may have the feature on their card, but never actuallyuse it for a transaction. Finally, an important component of the 2009 SQ was the questionson perceptions of various payment methods; however, these questions addressed only cash,debit cards, credit cards and stored-value cards, not contactless credit cards or other paymentinnovations.
For the 2013 MOP, questions on alternative methods of payment to cash, debit and creditare extensively integrated into both the SQ and DSI. These include questions on relativelynewer payment innovations such as contactless credit/debit cards, mobile payment applicationsand stored-value cards, as well as on methods used primarily for online payments such asInterac Online or PayPal. Special focus is given to stored-value cards, which are disaggregatedinto two categories to distinguish between multi-purpose cards issued by Visa, MasterCard orAmerican Express and single-purpose, store-branded cards.
In the SQ, the focus of questions concerning alternative methods of payment is to identifywho is adopting them, and to gauge consumer perceptions. In the DSI, a code list is introducedso that respondents can choose these alternative methods when stating how they pay for atransaction. A prominent check box is provided for respondents to indicate when they usethe contactless feature to make a purchase. Finally, we ask how many credit/debit cards thatrespondents are carrying on them have a contactless feature.
C Data CollectionThis section describes the process of recruiting respondents for the 2013 MOP Survey, and
ensuring that the sample is representative of the Canadian population.
C.1 Recruitment and samplingAn innovation in the 2013 MOP Survey is to explicitly test the effectiveness of incentives
offered to recruit potential respondents. Each respondent has a chance to receive one of eightpossible incentive schemes, which differ based on the level and type of incentive. Incentivesrange from $5 to $20; different types of incentives include an advanced letter from the Gover-nor of the Bank of Canada requesting participation and a token $2 coin included in the surveypackage distributed to potential respondents. Randomly assigning the incentive schemes en-ables us to test which incentives (and combinations thereof) are most effective at recruiting
39
survey participants. See Shen and Vincent (2014) for further details.The overall sampling strategy in the 2013 MOP is similar to that of the 2009 survey. Sample
targets are constructed with respect to region, gender and age, and are based on the 2011National Household Survey conducted by Statistics Canada. Recruitment for the survey comesfrom two proprietary access panels maintained by Ipsos Reid: an offline panel accessible viaregular mail and an online panel accessible via email. Stratified random sampling is used toselect the list of potential respondents. Invitations were sent out starting at the end of October,and the final data set consists of responses collected between 28 October and 12 December2013.
In the 2013 MOP, a specific subset of the offline panel, consisting of respondents whohad recently filled out the Canadian Financial Monitor (CFM) survey, is also used for recruit-ment. The CFM is a nationally representative wealth survey of Canadian households that isalso conducted by Ipsos Reid. One of the research goals of the 2013 MOP Survey is to test thelikelihood of obtaining a representative sample from only past CFM respondents. If success-ful, this sampling approach could allow for more timely and cost-effective data on paymentsthrough integration of the MOP and CFM surveys. For details on the outcome of this approachand the representativeness of the CFM subsample, see Chen and Shen (2015).
C.2 Final sampleWe conducted extensive analysis to create sample weights for the 2013 MOP; the technical
report by Vincent (2015) provides a full description of the weighting process. Weights ensurethat the final sample is representative of the target population, and help correct for coverageand non-response bias. For the 2013 MOP, the target population is Canadians aged 18+, andcounts of the population level are obtained from the 2012 Canadian Internet Use Survey (CIUS)conducted by Statistics Canada. The CIUS is demographically representative and providesimportant technological variables related to payments, such as the proportion of Canadianswho have completed an online purchase in the past year. Determining the appropriate setof variables to use for calibrating the sample weights in the 2013 MOP is one of the majorchallenges of the weighting process, and is discussed in detail in the technical report. Thefinal sample is calibrated using the following variables: age, education, marital status, region,gender, income, home ownership, online shopping and mobile phone ownership. See Table C.1for the sample composition by age, gender and income category before and after weighting.
40

Table C.1: Effect of weights on sample composition in 2013 MOP
Unweighted Weighted CIUS
proportionAGE18-34 0.253 0.289 0.31435-54 0.387 0.362 0.35155+ 0.361 0.348 0.335GENDERMale 0.477 0.489 0.492Female 0.523 0.511 0.507INCOMELess than $45K 0.411 0.333 0.310$45K-85K 0.368 0.350 0.329$85K or more 0.221 0.317 0.360
Note: Proportions in the Unweighted and Weighted columns relate to observations from the2013 MOP SQ. The CIUS column shows proportions from the 2012 Canadian Internet UseSurvey, which was used to construct the weights.
The final sample size and other statistics related to the survey can be found in Table C.2.
Table C.2: Summary statistics from the 2013 MOP
Overall Paper based Online
CFM OfflineSQ Number of respondents 3,663 1,372 728 1,563
Response rate 0.073 0.550 0.261 0.035Survey satisfaction 0.916 0.914 0.909 0.922Median completion time 23.0 20.0 27.0 -
DSI Number of respondents 2,596 1,371 726 499Number of purchases 13,196 7,254 4,034 1,905Number of withdrawals 1,078 596 334 148Survey satisfaction 0.904 0.890 0.903 0.942
Note: Online response rates are typically low; offline response rates are typically around 20%for similar surveys conducted by Ipsos Reid. Survey satisfaction is based on the question“Would you be willing to fill out the SQ/DSI again in the future?” Respondents in the CFMsubsample have a lower median completion time because they received a shorter survey, withresponses to the omitted questions imputed from their CFM responses. The total number ofDSIs collected is 2,599, but three were dropped because of poor quality.
In total, we collected 3,663 SQs and 2,599 DSIs; more SQs were collected because some
41

online participants completed the first instrument but did not go on to complete the three-daydiary. Inviting past CFM participants has proven to be a successful recruitment strategy, sincetheir response rate was over 50% and twice as high as that from the offline panel. The DSIcontains a total of roughly 13,000 purchases and over 1,000 cash withdrawals. Participantsshow a high level of satisfaction with the survey, with 90% reporting that they would be happyto fill it out again in the future.
D Data QualityAs in most surveys, the raw data contain some extreme, inconsistent and missing values.
Collaboration with Ipsos Reid and analysis of the cash identity were key to addressing issuesof data quality. This collaboration includes measures to detect issues during data collectionand editing of the raw data.
D.1 Survey completenessPrior to data collection, we established standards regarding what constitutes a complete SQ
and DSI. For the SQ, respondents are required to fill in certain key questions regarding cash,the details of their main bank account and credit card, and their demographics. For the DSI, thecriteria are based on the level of error in the cash identity. Follow-up phone calls were madeto respondents in the offline panel who did not meet these standards of quality, and they didnot receive an incentive if they were unable to fill in key missing data. In the online version ofthe survey, many checks are built into the questionnaire to ensure that missing and inconsistentdata are avoided.
In 2013, an additional check was implemented in the online DSI with respect to the cashidentity. Respondents whose level of error was sufficiently high were presented with the calcu-lation showing their cash at the start of the diary, the amount of cash they obtained/spent, andthe amount of cash they reported having at the end. Follow-up questions asked the respondentwhy they thought their cash identity did not add up, and both open- and closed-ended questionswere used in an attempt to correct the error.
D.2 Error detection/editingOnce the data were collected, editing of the raw data was undertaken in collaboration with
Ipsos Reid. The main tools of data editing were the cash identity and verbatim files. Improv-ing the cash identity error was a general editing rule that was applied to various cases. Forexample, a respondent may withdraw $100.00 in cash but omit a decimal when recording thatwithdrawal, so that it becomes $10000. If replacing that value with $100.00 reduces or correctsthe error in the cash identity, then the edit is made.
Verbatim files contain word-for-word responses written by respondents and come in sev-eral forms. The most important verbatim file contains the store name associated with eachpurchase. For approximately 90% of all transactions, the respondent recorded some informa-tion about the store/vendor where the purchase was made. This provided valuable context forthe data, which helped us make reasonable edits. For example, we observe one purchase of
42
over $25,000, which is a potential case for edit because it is such an extreme value. However,we also observe that the store name is a car dealership, implying that the respondent purchaseda vehicle. This context means that the extreme value makes sense and we do not edit this obser-vation. Other verbatim files include stated reasons for making a cash withdrawal, methods ofspending/receiving cash other than purchases/withdrawals, and general feedback on the survey.
Applying the tools of cash identity and verbatim files, these edits improved the cash identityfor roughly 2% of all respondents, indicating the low level of editing that was required overall.The following aspects of the data were investigated for potential edits; final decisions on editswere made in consultation with Ipsos Reid:
1. Extreme continuous values: For dollar-amount variables—purchase amount, cash onhand, withdrawal amount, etc.—and other continuous variables, extreme values are presentthat can potentially influence estimates. We flag and investigate observations above the98th percentile.
2. Missing withdrawal channel: Respondents were asked to state where they obtainedtheir cash when they made a withdrawal, and this variable contained missing observa-tions. Using the verbatim file where respondents recorded the reason for making a cashwithdrawal, we found that many cases of missing data could be recoded to “other cash”activities.
3. Inconsistencies in logic: An example of an inconsistency in logic would be someonewho recorded having no credit cards, but later in the SQ provided information on theirmain credit card, indicating that they actually have one. There were a small number ofcases of such inconsistencies in the SQ and DSI, and these were handled on a case-by-case basis.
4. Person-to-person transactions: The store name verbatim file indicated that, for 35 pur-chases, the record is actually a person-to-person cash transaction. Using the cash identity,these cases were recoded to the variables for other cash use.
5. Poor quality DSI: For a small number of diaries (three), the cash identity was satisfied,but it was clear that the respondent did not fill out the diary in a serious way. Theserespondents were dropped from the final sample.
D.3 Variance estimationThe final aspect of ensuring data quality is to obtain variance estimates, which tell us the
level of certainty of sample statistics produced from the 2013 MOP that are presented in thispaper. The technical report by Chen and Shen (2015) addresses this issue by providing acomparison of different approaches to calculating variance estimates. Ultimately, they rec-ommend using replicate weights for the 2013 MOP, which are produced using bootstrap re-sampling methods. The benefit of replicate weights over other methods of variance estimationare twofold. First, replicate weights allow for variance calculations without revealing sen-sitive strata information, which protects the privacy of respondents. Second, this approach
43

incorporates the weighting procedure into the variance calculations, which provides more reli-able estimates. For further details on replicate weights in the 2013 MOP, see Chen and Shen(2015).
E Variable List
Table E.1: Definitions of payment instruments (MOP SQ)
Concept Definition
Cash Coins and paper bills.Debit card Card issued by a bank that gives the holder electronic access to
his or her bank account for making payments and for makingwithdrawals from an automated teller machine (ATM).
Credit card Card allowing the holder to purchase goods and services oncredit and pay the credit card company later.
Stored-value cardissued by VISA/MasterCard/American Express
Card that comes loaded with funds at the time of purchase andthat features the Visa/Mastercard/American Express logo. It canbe used to purchase goods and services, both in person andonline.
Store-brandedstored-value card
Card issued by a retailer that can be used only at stores belongingto the retailer. It can usually be reloaded with funds. E.g., TimHorton’s TimCard, Walmart gift card
Contactless (tap andgo)
Feature found on some credit and debit cards. Allows user to payby waving or tapping the card over a terminal without entering aPIN or swiping or inserting the card. E.g., MasterCard PayPass,Visa payWave, Interac Flash
Online paymentaccount
Account not affiliated with any particular bank, but that can beloaded with funds and used to make purchases or transfer moneyon the Internet. It can be loaded using a credit card or by linkingto a bank account. E.g., PayPal
Mobile paymentapplication
Application on a smartphone, such as an iPhone, Blackberry orAndroid phone, that allows the user to make purchases.
Cheque Document directing financial institutions to pay money from abank account.
44

Table E.2: Definitions of payment instrument attributes (MOP SQ)
Concept Definition
Ease How easy or hard it is to use the method of payment in Canada.Cost How costly it is to use the method of payment in Canada, taking fees, interest
payments, etc. into consideration.Security How risky or secure it is to use the method of payment in Canada, in the
respondent’s opinion.Set-up How easy or hard it is to get or set up the method of payment before being able
to use it in Canada.Accep-tance
How widely accepted the method of payment is in Canada.
Table E.3: Definitions of adoption of payment instruments (MOP SQ)
Concept Behaviour that defines adoption
Credit card adoption Reports having access to one or more credit cards (havingaccess means owning the card and being able to make apurchase with it tomorrow).
Debit card adoption Reports having access to one or more debit cards orreports having a bank account.
Stored-value card issued byVisa/ MasterCard/ AmericanExpress adoption
Reports having access to one or more stored-value cardsissued by Visa/MasterCard/American Express.
Store-branded stored-valuecard adoption
Reports having access to one or more store-brandedstored-value cards.
Contactless (tap and go)adoption
Reports having made a purchase with a contactless debitor credit card in the past year.
Table E.4: Definitions of cash-related variables (MOP SQ)
Concept Definition
Cash on hand Amount of cash in the respondent’s purse, wallet or pockets at thetime of the survey.
Other cashholdings/ Cash instore
Amount of cash the respondent’s household keeps in locations otherthan a purse, wallet or pockets, such as at home or in a vehicle.
45

Table E.5: Definitions of transaction types (MOP DSI)
Concept Definition
Purchase Buying something, paying for a service, or making a financial gift ordonation. Does not include pre-authorized payments.
Person-to-personpayment
A transaction between two private individuals.
Onlinepayment
Payment made for a transaction over the Internet.
Table E.6: Examples of types of goods and services purchased (MOP DSI)
Type of purchase Example
Groceries/ drugs Food, alcohol, tobacco, cleaning products, prescriptions.Personal attire Clothing, accessories, cosmetics.Health care Doctor, dentist, hospital bills.Hobby/ sportinggoods
Craft supplies, toys, sports equipment, books, newspapers.
Professional services Lawyer, mechanic, spa services, haircut.Travel/ parking Taxi, plane, train, hotel parking.Entertainment/ meals Movies, restaurants, outings.Durable goods Electronics, furniture, appliances, automobile, household
accessories.
46