2013 nsw registry of births, deaths and marriages customer survey · 2013 nsw registry of births...
TRANSCRIPT
2013 NSW Registry of Births,
Deaths and Marriages
Customer Survey
Monitoring Satisfaction
Prepared by
IRIS Research Ltd
I n s i g h t f o r
B u s i n e s s & G o v e r n m e n t
IRIS Research ABN 16 002 278 793 The University of Wollongong Innovation Campus, Level 1, iC Cental, Squires Way, North Wollongong
Postal address: Northfields Ave, Wollongong. NSW 2522 Telephone: (02) 4285 4446 Fax: (02)4285 4448
Net: http://www.iris.org.au Email: [email protected]
2013 NSW Registry of Births Deaths and Marriages Customer Survey i
TABLE OF CONTENTS
1 INTRODUCTION......................................................................................................1
1.1 BACKGROUND ......................................................................................................................................1
1.2 STUDY OBJECTIVES .................................................................................................................................1
1.3 DATA COLLECTION ................................................................................................................................2
1.4 SURVEY ACCURACY ...............................................................................................................................2
2 CUSTOMER PROFILE ...............................................................................................4
2.1 AGE AND SEX .......................................................................................................................................4
2.2 ABORIGINALITY .....................................................................................................................................1
2.3 LANGUAGE SPOKEN...............................................................................................................................2
2.4 SPECIAL NEEDS ......................................................................................................................................4
2.5 INCOME ...............................................................................................................................................6
2.6 LOCATION ............................................................................................................................................8
3 ENQUIRY CHARACTERISTICS AND STATUS ...........................................................9
3.1 SUBJECT OF ENQUIRY .............................................................................................................................9
3.2 ENQUIRY STATUS ..................................................................................................................................10
4 OPINIONS ON OVERALL REGISTRY SERVICE ......................................................13
4.1 SATISFACTION WITH ENQUIRY RESOLUTION ...............................................................................................13
4.2 SATISFACTION WITH HANDLING ENQUIRY .................................................................................................15
4.3 COMPARING SATISFACTION SCORES ......................................................................................................18
5 OPINIONS ON CUSTOMER SERVICE ...................................................................20
5.1 IMPORTANCE RATINGS..........................................................................................................................20
5.2 SATISFACTION RATINGS FOR CUSTOMER SERVICE REPRESENTATIVES .............................................................24
5.3 OVERALL SATISFACTION........................................................................................................................33
5.4 CUSTOMER PERCEPTIONS OF WAITING TIME .............................................................................................37
5.5 RECOMMEND BDM CALL ....................................................................................................................39
6 REGISTRY OFFICES ...............................................................................................41
7 BIRTHS, DEATHS AND MARRIAGES PHONE NUMBER..........................................42
8 POST OFFICE CERTIFICATE APPLICATIONS.........................................................43
APPENDIX I.................................................................................................................45
APPENDIX 2................................................................................................................53
2013 NSW Registry of Births Deaths and Marriages Customer Survey ii
EXECUTIVE SUMMARY
This report presents the results of the 2013 NSW Registry of Births Deaths & Marriages call centre
(BDM Call) Customer Satisfaction Survey. IRIS Research was commissioned by LawAccess NSW, the
operator of the BDM Call, to conduct a comprehensive telephone-based survey amongst BDM
Call customers. The broad aim of this survey was to evaluate and compare the satisfaction levels
and needs of users with respect to key components of the services provided against previous
year’s results. The results of the survey provide key inputs into management’s performance
monitoring and quality improvement process.
This is the eighth wave of the survey, with the original baseline study conducted in April 2006. In
general customers were surveyed within 48 hours of the initial enquiry to the call centre. Survey
fieldwork was carried out on the IRIS Computer Aided Telephone Interviewing (CATI) system during
the month of May. At the end of the fieldwork period a total of 1004 completed interviews had
been conducted.
The key findings from each section of the report are summarised over the next few pages.
Customer profile
� Results showed an increase in the proportion of female customers over the period from 2012
(68.2%) to 2013 (70.9%), while the number of male customers decreased (31.7% in 2012 to 29.1%
in 2013).
� Persons in the 25-39 years age bracket make up four in every nine (44.6%) callers, which is an
increase from two fifths of callers (39.9%) in 2012.
� 3.3% of the customer base is comprised of Aboriginal persons, while around two in every seven
(28.2%) customers speak a language other than English at home.
Enquiry characteristics and status
� Just below half (48.9%) of enquiries received by the BDM Call relate to births, with marriages
accounting for another fifth of all enquiries (20.9%) and change of name (adults) a further
16.7%.
2013 NSW Registry of Births Deaths and Marriages Customer Survey iii
� Of the customers interviewed in the 2013 survey, 62.5% (n=628) indicated that the matter of their
enquiry had been resolved at the time of the interview. 68.2% stated that the matter was
resolved during their first contact; statistically lower than the 2012 result or 73.5%.
Satisfaction with enquiry handling
� Prior to focusing on overall satisfaction with the call centre experience, customers were
questioned on their level of satisfaction with the handling of their needs by the Registry. This year
90.6% of customers whose enquiry had been resolved at the time of interview were ‘highly
satisfied’ with the outcome they had received from the Registry. The resulting mean score of
8.88 out of 10 was found to have stayed statistically the same since 2012 (8.94).
� Satisfaction amongst customers with unresolved enquires increased from 66.2% providing a high
satisfaction rating in 2012 to 68.9% in 2013.
� When the results of both enquiry groups (resolved and unresolved) are combined, the Registry
achieved a mean satisfaction score of 8.2 (out of a possible 10). This is a slight decrease on the
2012 mean of 8.4.
Overall satisfaction
� The level of customer satisfaction remained statistically unchanged from that achieved in 2012,
with 92.8% of customers providing a ‘high’ satisfaction rating.
� A high mean score 8.97 out of 10 was achieved. Testing found this to be statistically the same
as the overall satisfaction score of 9.18 recorded in 2012.
Prioritising service areas for improvement
In-depth analysis of importance and satisfaction ratings for key service components revealed the
following service attributes as the key areas to maintain (and perhaps even further improve)
overall customer satisfaction:
2013 NSW Registry of Births Deaths and Marriages Customer Survey iv
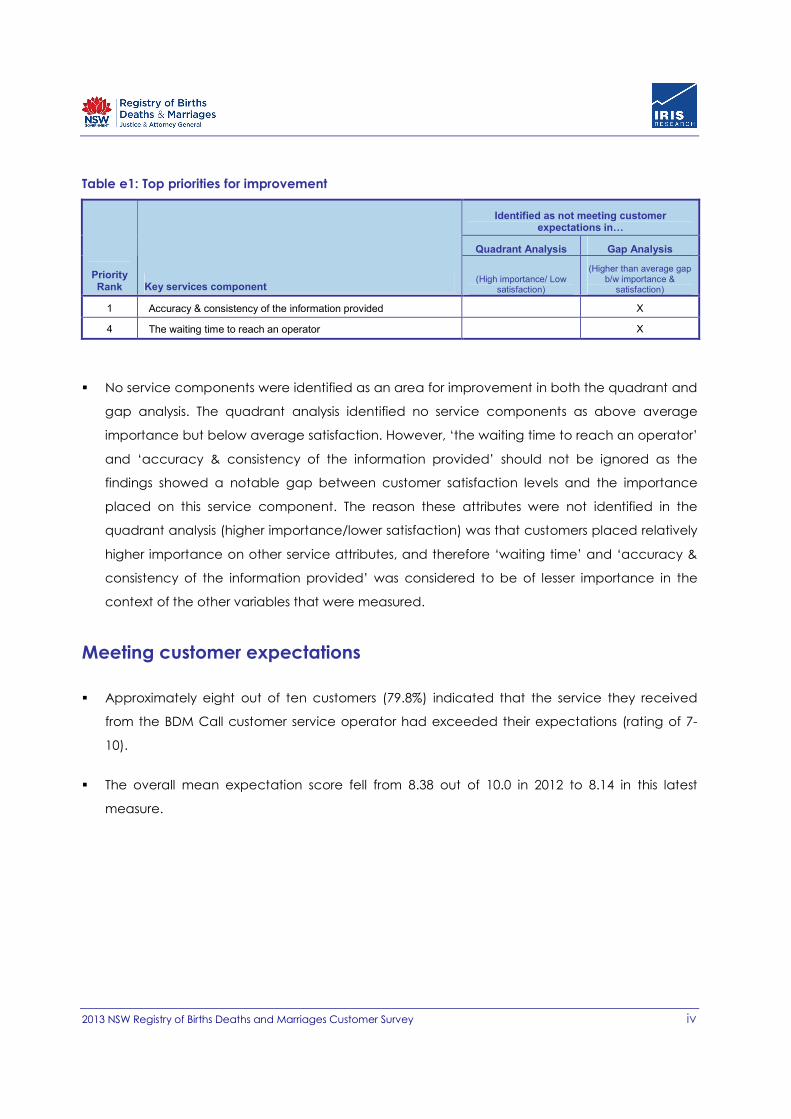
Table e1: Top priorities for improvement
Identified as not meeting customer expectations in�
Quadrant Analysis Gap Analysis
Priority Rank Key services component
(High importance/ Low satisfaction)
(Higher than average gap b/w importance & satisfaction)
1 Accuracy & consistency of the information provided X
4 The waiting time to reach an operator X
� No service components were identified as an area for improvement in both the quadrant and
gap analysis. The quadrant analysis identified no service components as above average
importance but below average satisfaction. However, ‘the waiting time to reach an operator’
and ‘accuracy & consistency of the information provided’ should not be ignored as the
findings showed a notable gap between customer satisfaction levels and the importance
placed on this service component. The reason these attributes were not identified in the
quadrant analysis (higher importance/lower satisfaction) was that customers placed relatively
higher importance on other service attributes, and therefore ‘waiting time’ and ‘accuracy &
consistency of the information provided’ was considered to be of lesser importance in the
context of the other variables that were measured.
Meeting customer expectations
� Approximately eight out of ten customers (79.8%) indicated that the service they received
from the BDM Call customer service operator had exceeded their expectations (rating of 7-
10).
� The overall mean expectation score fell from 8.38 out of 10.0 in 2012 to 8.14 in this latest
measure.
2013 NSW Registry of Births Deaths and Marriages Customer Survey v
Waiting times
� The proportion of BDM Call customers that perceived their waiting time to reach a customer
service representative as being longer than 5 minutes significantly increased from 19.7% to
51.6%; statistically the same as the highest result recorded in 2008.
� At the same time, the proportion of customers that reached a customer service representative
in 30 seconds or less (including no wait) stood at 5.1%; statistically lower from the last measure
(13% recorded in 2012).
Service recommendation
� Nearly all of the customers (93.7%) surveyed in 2013 indicated that they would recommend
BDM Call to others. While this was an exceptionally high proportion, it fell slightly in 2012 and
below the high displayed in 2011 of 97.4%.
2013 NSW Registry of Births Deaths and Marriages Customer Survey 1
1 INTRODUCTION
1.1 BACKGROUND
The NSW Registry of Births Deaths & Marriages (BDM) is responsible for issuing official certificates
such as birth certificates, death certificates, marriage certificates, change of name, family history
checks and single status. The BDM Call deals with most enquiries, providing information and
advice to customers over the phone.
In 2006 LawAccess began the process of developing a strategic initiative to improve customer
service levels in their BDM Call. As part of the process, LawAccess sought to benchmark customer
satisfaction with the delivery of services provided by Customer Service Representatives (CSRs). This
report outlines the results of the sixth follow-up survey, which seeks to measure changes in
customer satisfaction towards the various aspects of service provided by the BDM Call since the
previous study.
IRIS Research completed surveys with 1004 customers during the April 2013 fieldwork period.
Overall the survey aimed to provide BDM Call management with an understanding of the
satisfaction levels and needs of users with respect to key components of the services delivered.
1.2 STUDY OBJECTIVES
The broad objectives for the survey were to:
� To provide a demographic and socio-economic profile of customers;
� To understand how customers are made aware of the service;
� To measure the importance of and satisfaction with key components of customer service
for the delivery of services by customer service representatives;
� To monitor BDM Call's customer satisfaction with benchmark levels;
� To identify areas for improving customer satisfaction;
2013 NSW Registry of Births Deaths and Marriages Customer Survey 2
1.3 DATA COLLECTION
The sample for the survey was collected using the following steps.
� On completion of the enquiry the BDM CSR invited the customer to participate in the survey.
� On agreement the CSR logged the customer’s contact details, which were forwarded in real
time to IRIS’ secure Internet site. These details were automatically transferred to an IRIS
interviewer.
� The customer was then called by an experienced IRIS interviewer and asked whether it was
convenient to conduct the short survey. If the customer was not in a position to conduct the
interview a more convenient time was arranged for the interview.
� In general customers were interviewed within 48 hours of the initial enquiry.
� The survey was implemented under Interviewing Quality Control Australia (IQCA) guidelines.
Interviews were conducted using our computer-aided telephone interviewing (CATI) system.
Continuous interviewer monitoring was used and post interview validations were conducted
within five days of the close of the survey.
� In all, 1004 completed interviews were conducted by telephone during May 2013.
1.4 SURVEY ACCURACY
A sample of over 1000 was chosen to provide accurate survey results that can be applied to the
broader customer population. As is the case with all sample surveys, the results are subject to
sampling variability. When analysing results for the entire sample (1004 responses), the maximum
error rate will be ±3.1% at the 95% confidence level, if a proportional response of 50% was
achieved for any of the survey's questions. That is, we can be confident that if the survey were to
be repeated there are approximately 95 chances in 100 that the new results would be within
±3.1% of the result achieved in this survey.
However, various breakdowns of the survey results by age, gender and circumstance have also
been provided. As these groups are based on smaller samples, a general rule of 10 percentage
points or more should be employed before assuming differences across groups are significant at
the 95% confidence level.
2013 NSW Registry of Births Deaths and Marriages Customer Survey 3
SURVEY RESULTS
2013 NSW Registry of Births Deaths and Marriages Customer Survey 4
2 CUSTOMER PROFILE
This section provides an overview of the client profile for the 2013 survey, as well as a comparison of respondent characteristics
against the six prior surveys.
2.1 AGE AND SEX
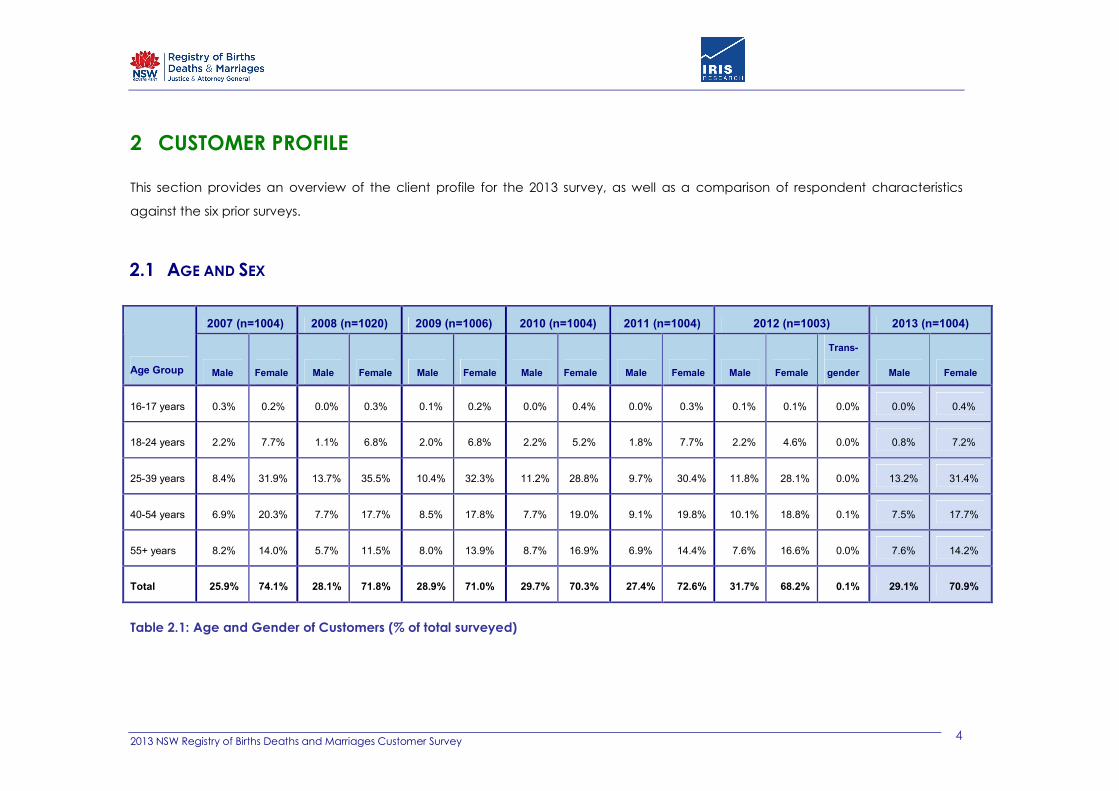
Table 2.1: Age and Gender of Customers (% of total surveyed)
2007 (n=1004) 2008 (n=1020) 2009 (n=1006) 2010 (n=1004) 2011 (n=1004) 2012 (n=1003) 2013 (n=1004)
Age Group Male Female Male Female Male Female Male Female Male Female Male Female
Trans-
gender Male Female
16-17 years 0.3% 0.2% 0.0% 0.3% 0.1% 0.2% 0.0% 0.4% 0.0% 0.3% 0.1% 0.1% 0.0% 0.0% 0.4%
18-24 years 2.2% 7.7% 1.1% 6.8% 2.0% 6.8% 2.2% 5.2% 1.8% 7.7% 2.2% 4.6% 0.0% 0.8% 7.2%
25-39 years 8.4% 31.9% 13.7% 35.5% 10.4% 32.3% 11.2% 28.8% 9.7% 30.4% 11.8% 28.1% 0.0% 13.2% 31.4%
40-54 years 6.9% 20.3% 7.7% 17.7% 8.5% 17.8% 7.7% 19.0% 9.1% 19.8% 10.1% 18.8% 0.1% 7.5% 17.7%
55+ years 8.2% 14.0% 5.7% 11.5% 8.0% 13.9% 8.7% 16.9% 6.9% 14.4% 7.6% 16.6% 0.0% 7.6% 14.2%
Total 25.9% 74.1% 28.1% 71.8% 28.9% 71.0% 29.7% 70.3% 27.4% 72.6% 31.7% 68.2% 0.1% 29.1% 70.9%
2013 NSW Registry of Births Deaths and Marriages Customer Survey 1
Key results:
� There was an increase in the number of female customers during 2013 (70.9%) compared to
2012 (68.2%), while the number of male customers decreased over this same period (31.7%
in 2012 to 29.1% in 2013).
� There was a significant increase in the percentage of customers aged 25-39 from 39.9% in
2012 to 44.6% in 2013.
2.2 ABORIGINALITY
� Customers of Aboriginal or Torres Strait Islander heritage made up 3.3% of the BDM Call
customer base in 2013. This remains statistically unchanged with the 2011 (4.3%) and 2012
(3.8%) results.
2013 NSW Registry of Births Deaths and Marriages Customer Survey 2
2.3 LANGUAGE SPOKEN
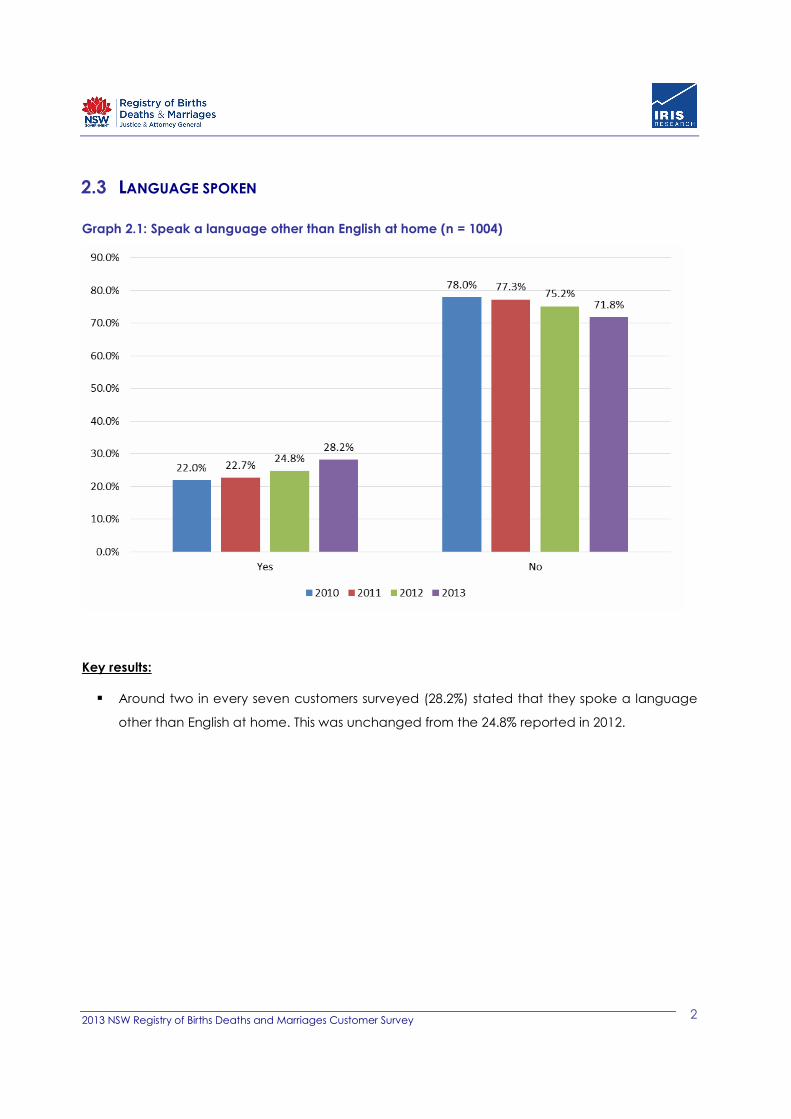
Graph 2.1: Speak a language other than English at home (n = 1004)
Key results:
� Around two in every seven customers surveyed (28.2%) stated that they spoke a language
other than English at home. This was unchanged from the 24.8% reported in 2012.
2013 NSW Registry of Births Deaths and Marriages Customer Survey 3
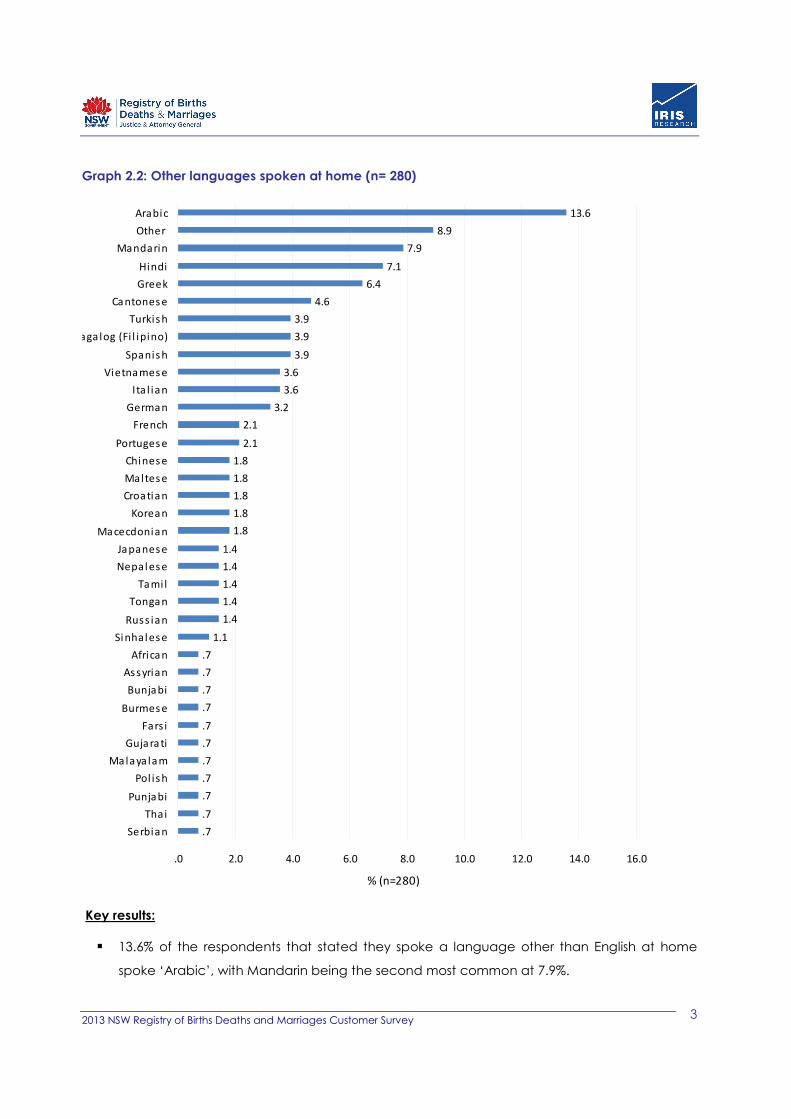
Graph 2.2: Other languages spoken at home (n= 280)
.7
.7
.7
.7
.7
.7
.7
.7
.7
.7
.7
1.1
1.4
1.4
1.4
1.4
1.4
1.8
1.8
1.8
1.8
1.8
2.1
2.1
3.2
3.6
3.6
3.9
3.9
3.9
4.6
6.4
7.1
7.9
8.9
13.6
.0 2.0 4.0 6.0 8.0 10.0 12.0 14.0 16.0
Serbian
Thai
Punjabi
Pol is h
Malaya lam
Gujarati
Fars i
Burmes e
Bunjabi
As syrian
African
Sinhales e
Russ ian
Tongan
Tamil
Nepales e
Japanes e
Macecdonian
Korean
Croatian
Maltes e
Chines e
Portuges e
French
German
Ita l ian
Vietnames e
Spanis h
Taga log (Fi l ipino)
Turkis h
Cantones e
Greek
Hindi
Mandarin
Other
Arabic
% (n=280)
Key results:
� 13.6% of the respondents that stated they spoke a language other than English at home
spoke ‘Arabic’, with Mandarin being the second most common at 7.9%.
2013 NSW Registry of Births Deaths and Marriages Customer Survey 4
2.4 SPECIAL NEEDS
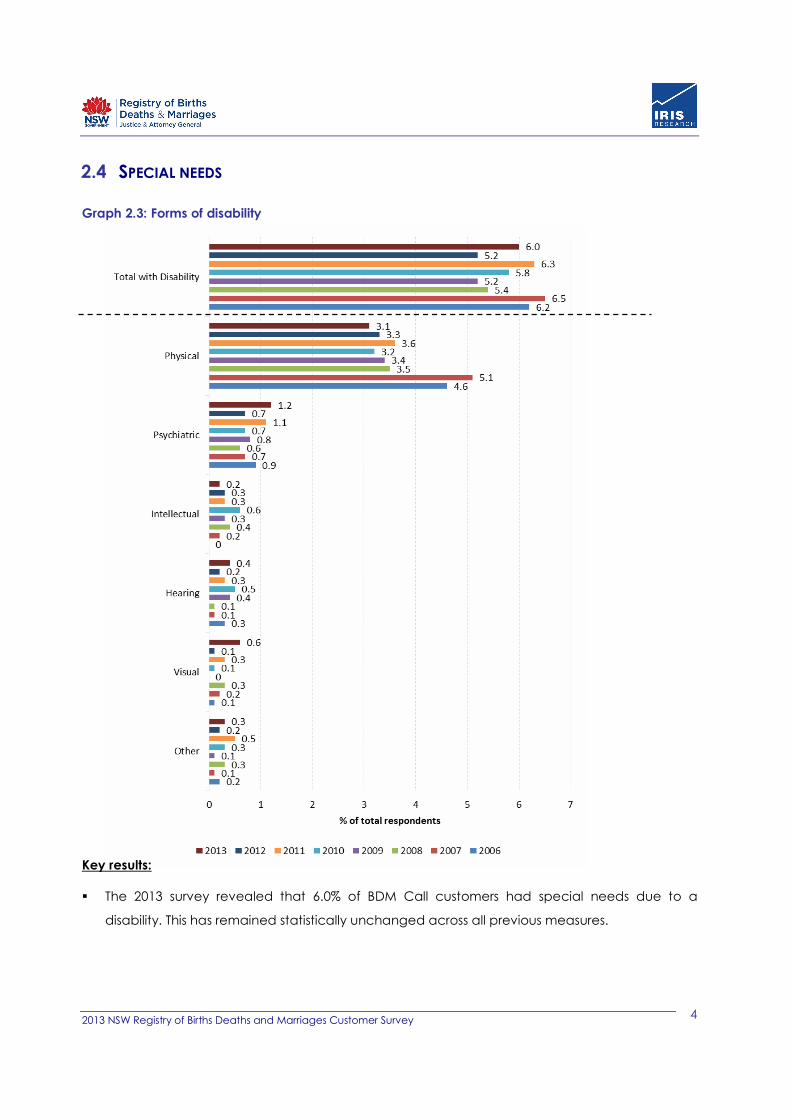
Graph 2.3: Forms of disability
Key results:
� The 2013 survey revealed that 6.0% of BDM Call customers had special needs due to a
disability. This has remained statistically unchanged across all previous measures.
2013 NSW Registry of Births Deaths and Marriages Customer Survey 5
� ‘Physical’ disabilities remain the most prevalent form of disability among customers at 3.1% in
2013.
� The percentage of customers who indicated they had a visual disability increased from 0.1%
to 0.6%.
2013 NSW Registry of Births Deaths and Marriages Customer Survey 6
2.5 INCOME
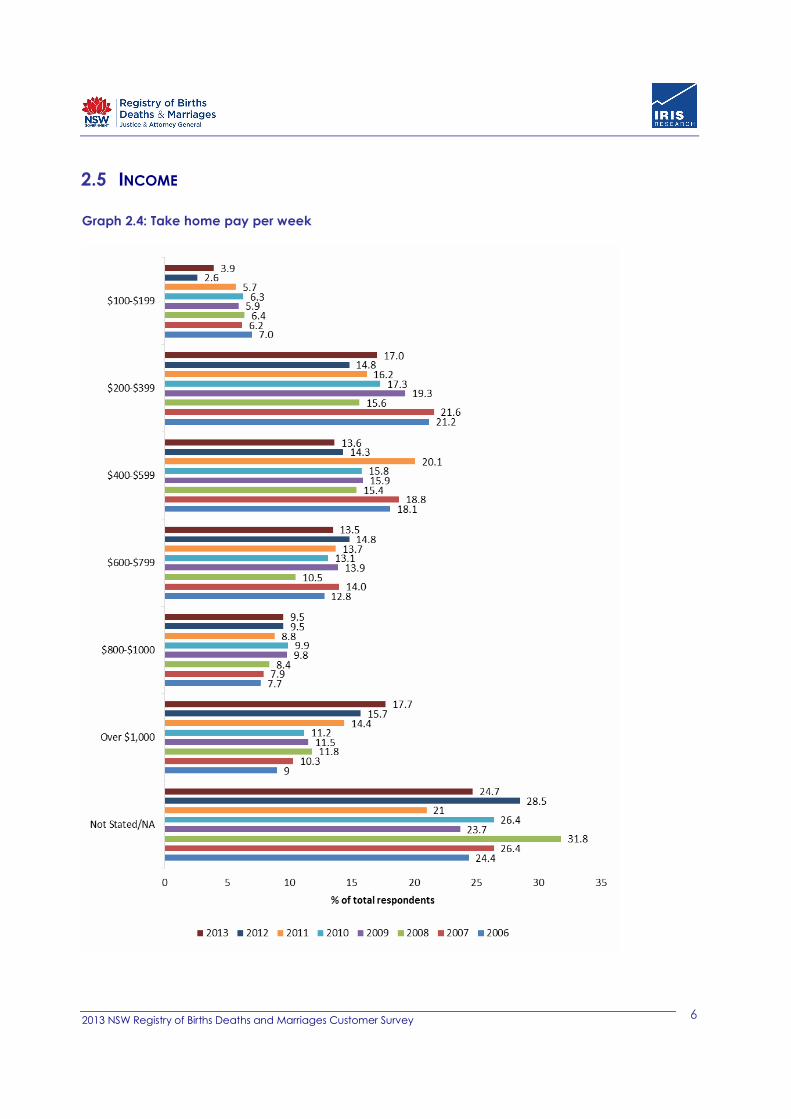
Graph 2.4: Take home pay per week
2013 NSW Registry of Births Deaths and Marriages Customer Survey 7
Key results:
� One in five customers (20.9%) indicated that their weekly take home pay falls in the range of
$100 to $399, with around one quarter (27.1%) bringing home between $400 and $799 per
week.
� In comparison, 17.7% earn more than $1,000 per week. This proportion was statistically the
same as the 15.7% recorded in 2012, although is the highest percentage recorded since 2006.
� 24.7% of respondents either chose not to state what their weekly take home pay per week
was or could not provide an applicable response. Customers earning less than $100 per week
fit into this category.
2013 NSW Registry of Births Deaths and Marriages Customer Survey 8
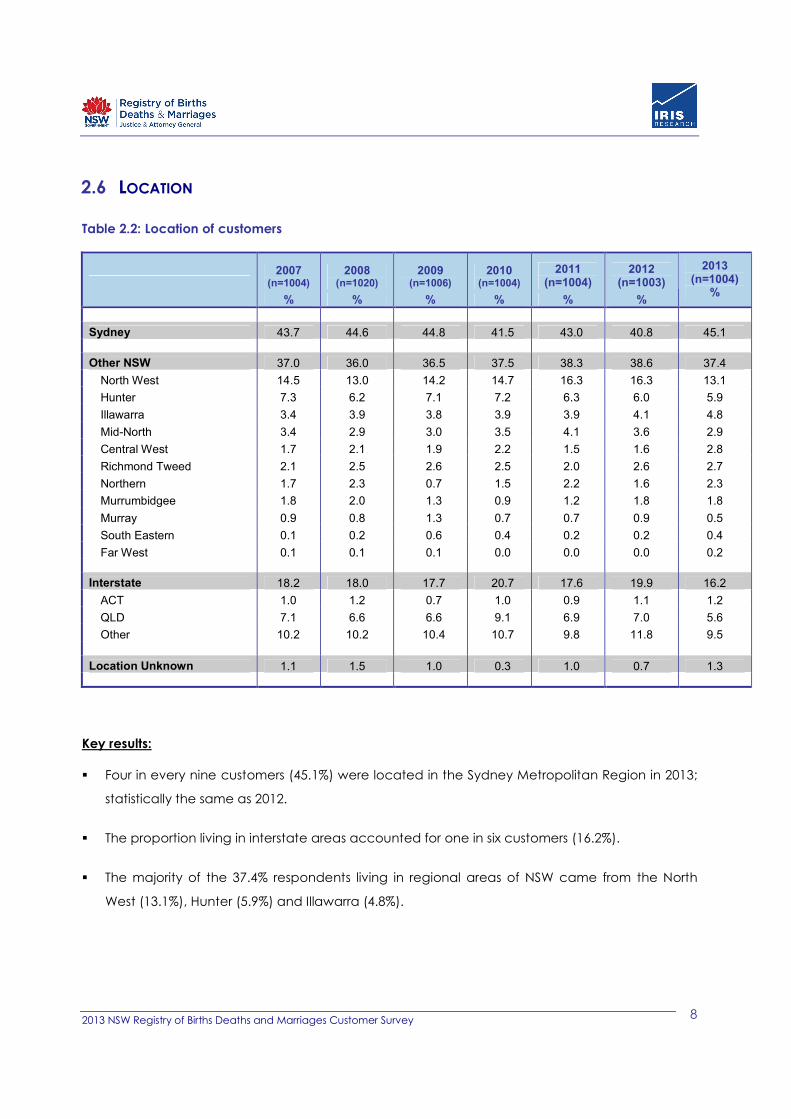
2.6 LOCATION
Table 2.2: Location of customers
2007
(n=1004) 2008
(n=1020) 2009
(n=1006) 2010
(n=1004) 2011
(n=1004) 2012
(n=1003)
% % % % % %
2013 (n=1004)
%
Sydney 43.7 44.6 44.8 41.5 43.0 40.8 45.1
Other NSW 37.0 36.0 36.5 37.5 38.3 38.6 37.4
North West 14.5 13.0 14.2 14.7 16.3 16.3 13.1
Hunter 7.3 6.2 7.1 7.2 6.3 6.0 5.9
Illawarra 3.4 3.9 3.8 3.9 3.9 4.1 4.8
Mid-North 3.4 2.9 3.0 3.5 4.1 3.6 2.9
Central West 1.7 2.1 1.9 2.2 1.5 1.6 2.8
Richmond Tweed 2.1 2.5 2.6 2.5 2.0 2.6 2.7
Northern 1.7 2.3 0.7 1.5 2.2 1.6 2.3
Murrumbidgee 1.8 2.0 1.3 0.9 1.2 1.8 1.8
Murray 0.9 0.8 1.3 0.7 0.7 0.9 0.5
South Eastern 0.1 0.2 0.6 0.4 0.2 0.2 0.4
Far West 0.1 0.1 0.1 0.0 0.0 0.0 0.2
Interstate 18.2 18.0 17.7 20.7 17.6 19.9 16.2
ACT 1.0 1.2 0.7 1.0 0.9 1.1 1.2
QLD 7.1 6.6 6.6 9.1 6.9 7.0 5.6
Other 10.2 10.2 10.4 10.7 9.8 11.8 9.5
Location Unknown 1.1 1.5 1.0 0.3 1.0 0.7 1.3
Key results:
� Four in every nine customers (45.1%) were located in the Sydney Metropolitan Region in 2013;
statistically the same as 2012.
� The proportion living in interstate areas accounted for one in six customers (16.2%).
� The majority of the 37.4% respondents living in regional areas of NSW came from the North
West (13.1%), Hunter (5.9%) and Illawarra (4.8%).
2013 NSW Registry of Births Deaths and Marriages Customer Survey 9
3 ENQUIRY CHARACTERISTICS AND STATUS
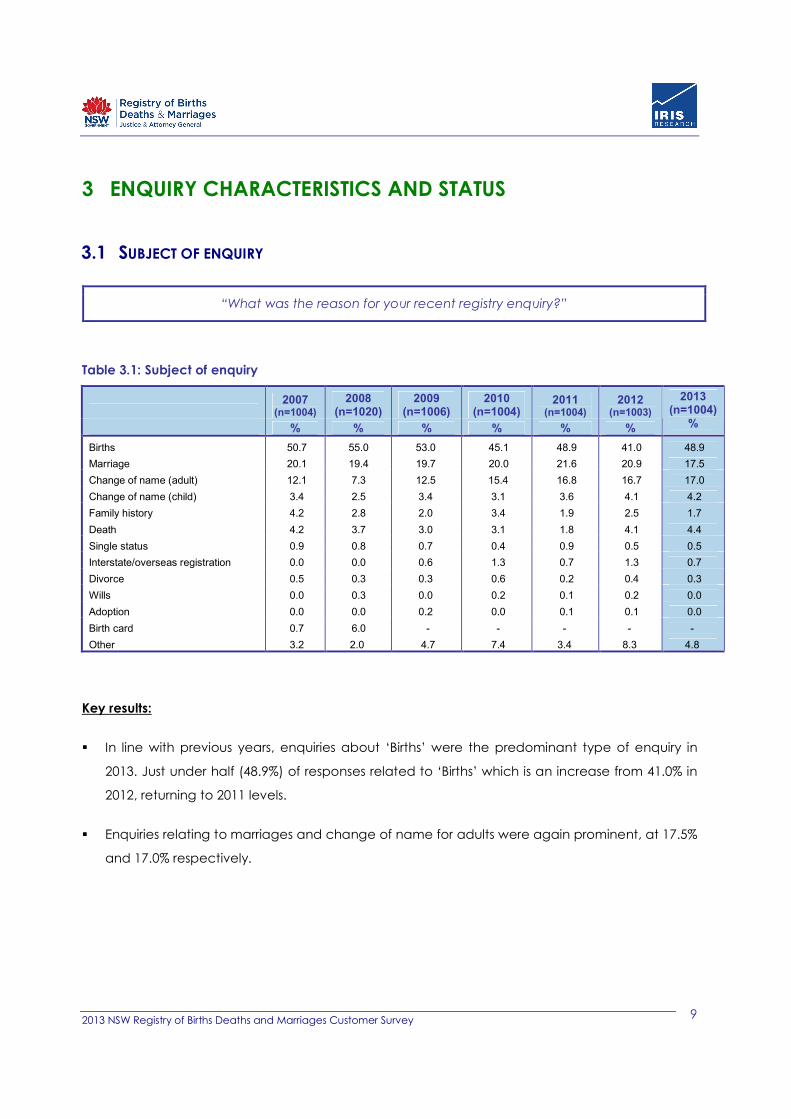
3.1 SUBJECT OF ENQUIRY
“What was the reason for your recent registry enquiry?”
Table 3.1: Subject of enquiry
2007
(n=1004)
2008 (n=1020)
2009 (n=1006)
2010 (n=1004)
2011 (n=1004)
2012 (n=1003)
% % % % % %
2013 (n=1004)
%
Births 50.7 55.0 53.0 45.1 48.9 41.0 48.9
Marriage 20.1 19.4 19.7 20.0 21.6 20.9 17.5
Change of name (adult) 12.1 7.3 12.5 15.4 16.8 16.7 17.0
Change of name (child) 3.4 2.5 3.4 3.1 3.6 4.1 4.2
Family history 4.2 2.8 2.0 3.4 1.9 2.5 1.7
Death 4.2 3.7 3.0 3.1 1.8 4.1 4.4
Single status 0.9 0.8 0.7 0.4 0.9 0.5 0.5
Interstate/overseas registration 0.0 0.0 0.6 1.3 0.7 1.3 0.7
Divorce 0.5 0.3 0.3 0.6 0.2 0.4 0.3
Wills 0.0 0.3 0.0 0.2 0.1 0.2 0.0
Adoption 0.0 0.0 0.2 0.0 0.1 0.1 0.0
Birth card 0.7 6.0 - - - - -
Other 3.2 2.0 4.7 7.4 3.4 8.3 4.8
Key results:
� In line with previous years, enquiries about ‘Births’ were the predominant type of enquiry in
2013. Just under half (48.9%) of responses related to ‘Births’ which is an increase from 41.0% in
2012, returning to 2011 levels.
� Enquiries relating to marriages and change of name for adults were again prominent, at 17.5%
and 17.0% respectively.
2013 NSW Registry of Births Deaths and Marriages Customer Survey 10
3.2 ENQUIRY STATUS
“What is the current status of your enquiry?”
Customers were asked during the survey to indicate whether their enquiry matter had been
resolved.
To aid accurate recall of their experience most customers were interviewed within 48 hours of their
contact with the Registry. However, this may not have been a sufficient time frame to allow for an
enquiry resolution to be reached for many customers.
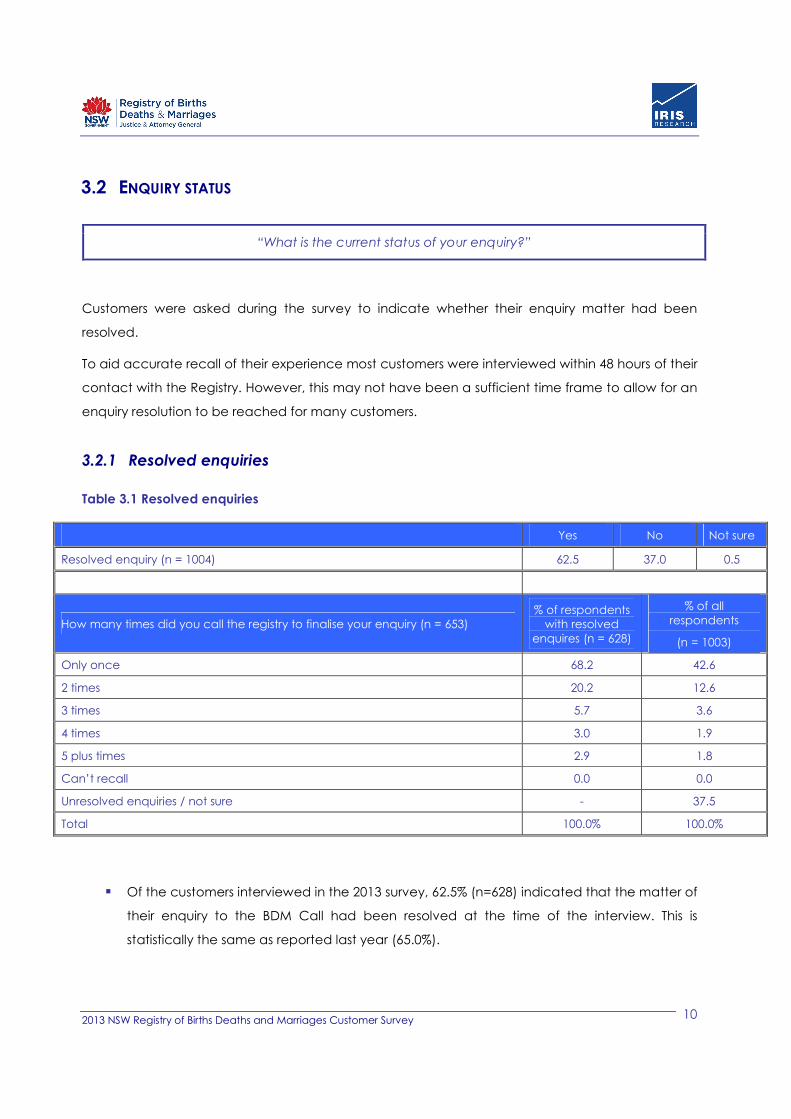
3.2.1 Resolved enquiries
Table 3.1 Resolved enquiries
Yes No Not sure
Resolved enquiry (n = 1004) 62.5 37.0 0.5
How many times did you call the registry to finalise your enquiry (n = 653) % of respondents with resolved
enquires (n = 628)
% of all
respondents
(n = 1003)
Only once 68.2 42.6
2 times 20.2 12.6
3 times 5.7 3.6
4 times 3.0 1.9
5 plus times 2.9 1.8
Can’t recall 0.0 0.0
Unresolved enquiries / not sure - 37.5
Total 100.0% 100.0%
� Of the customers interviewed in the 2013 survey, 62.5% (n=628) indicated that the matter of
their enquiry to the BDM Call had been resolved at the time of the interview. This is
statistically the same as reported last year (65.0%).
2013 NSW Registry of Births Deaths and Marriages Customer Survey 11
� Of the customers that had resolved their enquiry at the time of the survey, two thirds
(68.2%) stated that it was resolved during their first contact; statistically lower than the 2012
result of 73.5%.
� The number of customers requiring 4 or more calls to finalise the matter has also remained
statistically unchanged from 2012 (2.6%) to stand at 2.9%.
3.2.2 Unresolved enquiries
� In this wave of the survey, 37.0% (n=371) of customers indicated that their enquiry matter
had not been resolved, while a further 0.5% (n=5) were unsure.
� This proportion was further prompted to describe the current status of their enquiries. The
responses were coded within several main categories as shown below:
2013 NSW Registry of Births Deaths and Marriages Customer Survey 12
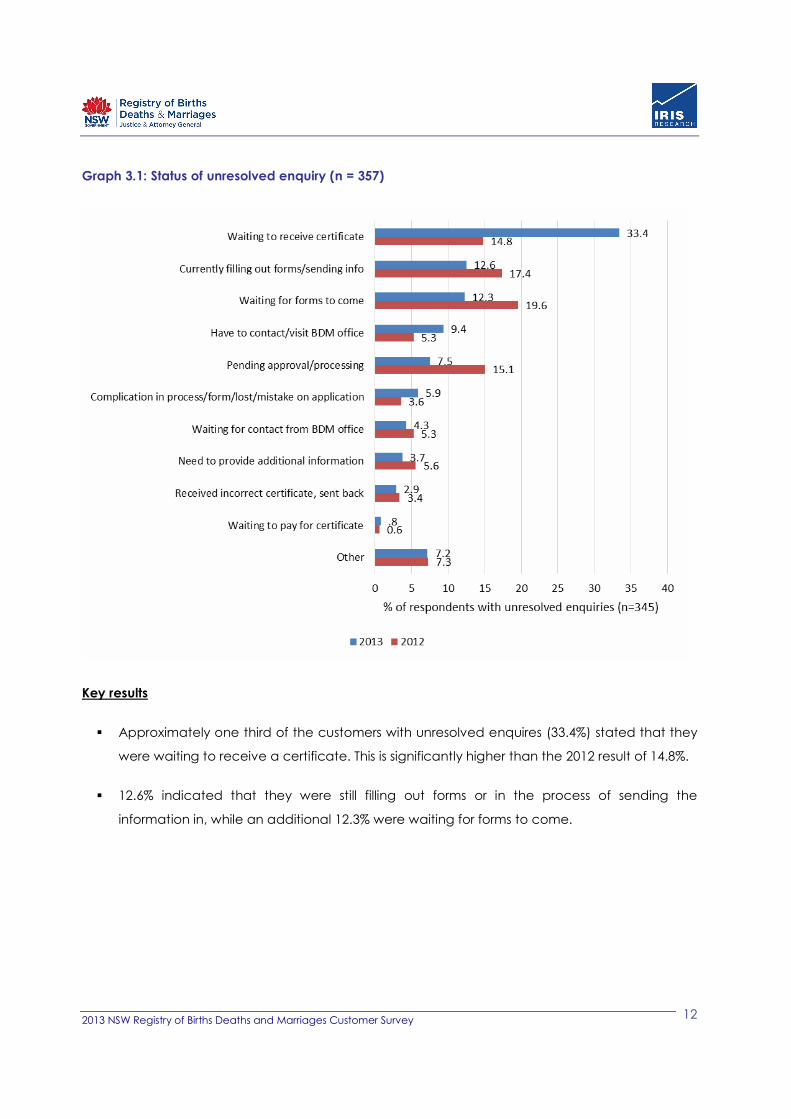
Graph 3.1: Status of unresolved enquiry (n = 357)
Key results
� Approximately one third of the customers with unresolved enquires (33.4%) stated that they
were waiting to receive a certificate. This is significantly higher than the 2012 result of 14.8%.
� 12.6% indicated that they were still filling out forms or in the process of sending the
information in, while an additional 12.3% were waiting for forms to come.
2013 NSW Registry of Births Deaths and Marriages Customer Survey 13
4 OPINIONS ON OVERALL REGISTRY SERVICE
This section presents BDM Call customers’ attitudes and opinions regarding the service offered by
the Registry with regards to either their ‘resolved’ or ‘unresolved’ enquiry. In Sections 4.1 and 4.2
the level of customer satisfaction with the resolution and handling of their enquiry is measured,
with a comparative measure between customer groups demonstrated. The reasons for expressed
dissatisfaction with the registry experience are also explored to help identify any perceived weak
components of the BDM service. Section 4.3 compares the results of these two groups over time.
4.1 SATISFACTION WITH ENQUIRY RESOLUTION
“How satisfied are you with the overall resolution of your enquiry?”
Customers who indicated that their matter with the registry had been resolved at the time of
interview (62.5%), were asked to rate their level of satisfaction with the resolution of their enquiry,
using a satisfaction scale of 0 to 10. Graph 4.1 illustrates a comparison of this level of satisfaction
against that of the five previous survey measures.
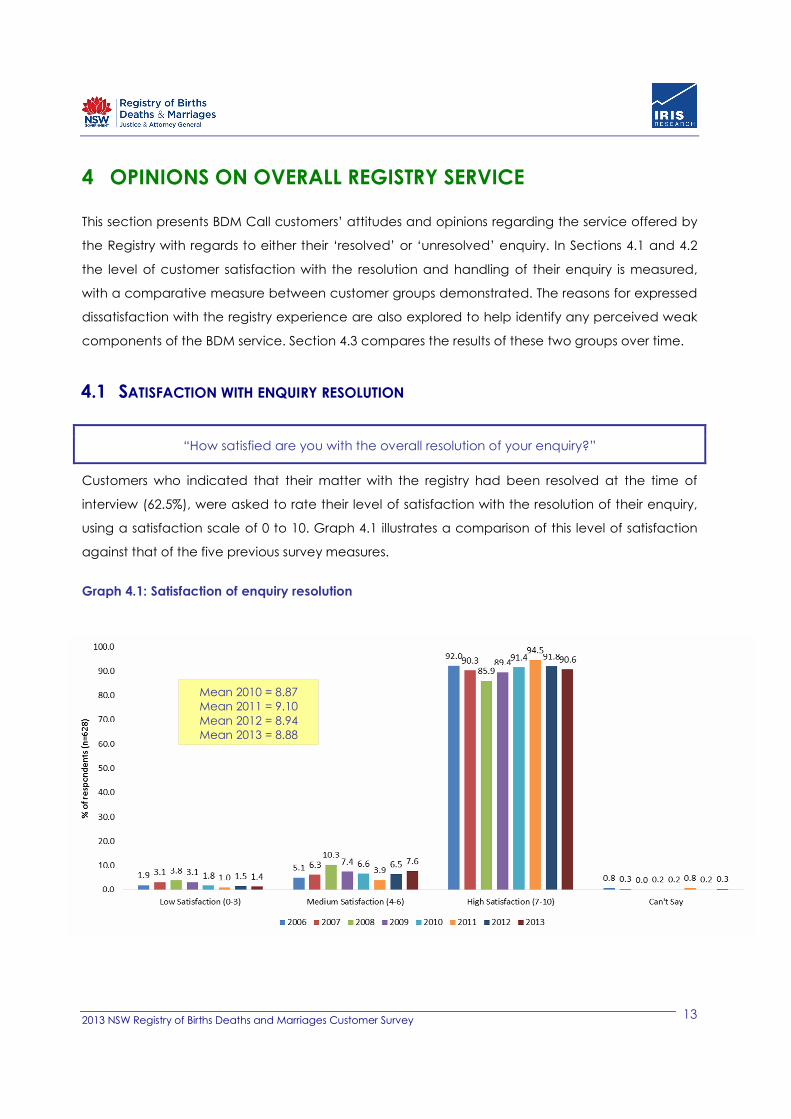
Graph 4.1: Satisfaction of enquiry resolution
Mean 2010 = 8.87 Mean 2011 = 9.10
Mean 2012 = 8.94 Mean 2013 = 8.88
2013 NSW Registry of Births Deaths and Marriages Customer Survey 14
Key results
� 90.6% of customers whose enquiry had been resolved were highly satisfied with the
outcome (that is, a satisfaction rating of 7-10 out of 10).
� The 2013 level of satisfaction, amongst customers with resolved enquiries, was 8.88 which is
statistically the same as the 2012 mean of 8.94.
4.1.1 Reasons for Dissatisfaction with Enquiry Resolution
� Only 1.4% (9 respondents) of the 628 surveyed customers whose enquiry had been
resolved gave a low satisfaction score (0-3) for the resolution of their enquiry. The verbatim
responses are shown below:
- Delay in receiving certificate(s).
- Confusion over payment (e.g. no record of payment received by BDM).
- Poor response times.
- Documents dating back six years only. I would like more.
- Wrong information.
- It took four weeks after the application was sent before it was processed.
2013 NSW Registry of Births Deaths and Marriages Customer Survey 15
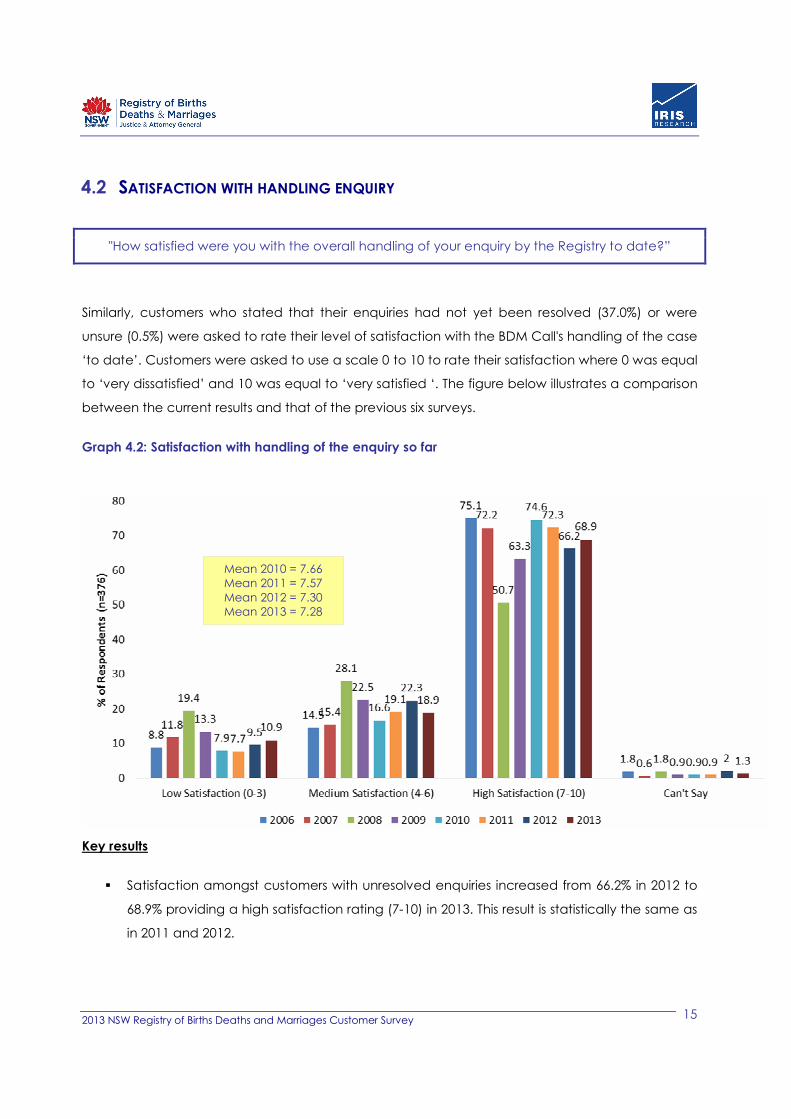
4.2 SATISFACTION WITH HANDLING ENQUIRY
"How satisfied were you with the overall handling of your enquiry by the Registry to date?”
Similarly, customers who stated that their enquiries had not yet been resolved (37.0%) or were
unsure (0.5%) were asked to rate their level of satisfaction with the BDM Call's handling of the case
‘to date’. Customers were asked to use a scale 0 to 10 to rate their satisfaction where 0 was equal
to ‘very dissatisfied’ and 10 was equal to ‘very satisfied ‘. The figure below illustrates a comparison
between the current results and that of the previous six surveys.
Graph 4.2: Satisfaction with handling of the enquiry so far
Key results
� Satisfaction amongst customers with unresolved enquiries increased from 66.2% in 2012 to
68.9% providing a high satisfaction rating (7-10) in 2013. This result is statistically the same as
in 2011 and 2012.
Mean 2010 = 7.66 Mean 2011 = 7.57
Mean 2012 = 7.30 Mean 2013 = 7.28
2013 NSW Registry of Births Deaths and Marriages Customer Survey 16
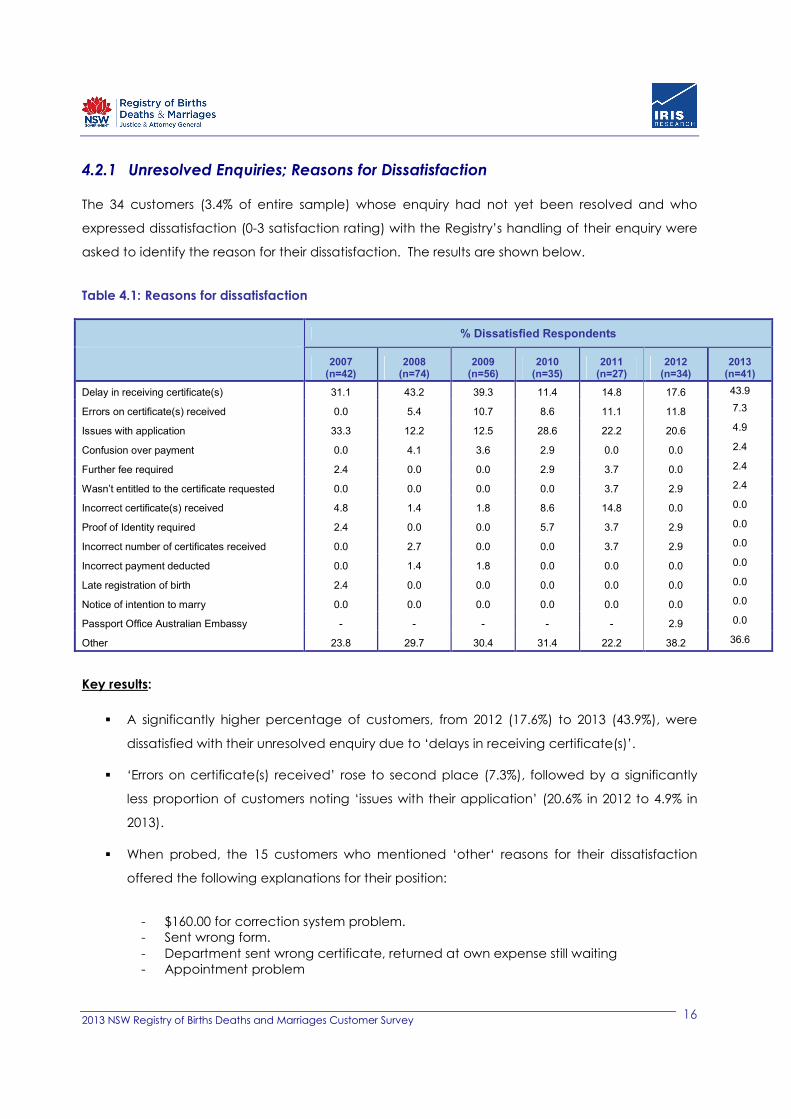
4.2.1 Unresolved Enquiries; Reasons for Dissatisfaction
The 34 customers (3.4% of entire sample) whose enquiry had not yet been resolved and who
expressed dissatisfaction (0-3 satisfaction rating) with the Registry’s handling of their enquiry were
asked to identify the reason for their dissatisfaction. The results are shown below.
Table 4.1: Reasons for dissatisfaction
% Dissatisfied Respondents
2007
(n=42) 2008
(n=74) 2009
(n=56) 2010
(n=35) 2011
(n=27) 2012
(n=34) 2013
(n=41)
Delay in receiving certificate(s) 31.1 43.2 39.3 11.4 14.8 17.6 43.9
Errors on certificate(s) received 0.0 5.4 10.7 8.6 11.1 11.8 7.3
Issues with application 33.3 12.2 12.5 28.6 22.2 20.6 4.9
Confusion over payment 0.0 4.1 3.6 2.9 0.0 0.0 2.4
Further fee required 2.4 0.0 0.0 2.9 3.7 0.0 2.4
Wasn’t entitled to the certificate requested 0.0 0.0 0.0 0.0 3.7 2.9 2.4
Incorrect certificate(s) received 4.8 1.4 1.8 8.6 14.8 0.0 0.0
Proof of Identity required 2.4 0.0 0.0 5.7 3.7 2.9 0.0
Incorrect number of certificates received 0.0 2.7 0.0 0.0 3.7 2.9 0.0
Incorrect payment deducted 0.0 1.4 1.8 0.0 0.0 0.0 0.0
Late registration of birth 2.4 0.0 0.0 0.0 0.0 0.0 0.0
Notice of intention to marry 0.0 0.0 0.0 0.0 0.0 0.0 0.0
Passport Office Australian Embassy - - - - - 2.9 0.0
Other 23.8 29.7 30.4 31.4 22.2 38.2 36.6
Key results:
� A significantly higher percentage of customers, from 2012 (17.6%) to 2013 (43.9%), were
dissatisfied with their unresolved enquiry due to ‘delays in receiving certificate(s)’.
� ‘Errors on certificate(s) received’ rose to second place (7.3%), followed by a significantly
less proportion of customers noting ‘issues with their application’ (20.6% in 2012 to 4.9% in
2013).
� When probed, the 15 customers who mentioned ‘other‘ reasons for their dissatisfaction
offered the following explanations for their position:
- $160.00 for correction system problem.
- Sent wrong form.
- Department sent wrong certificate, returned at own expense still waiting
- Appointment problem
2013 NSW Registry of Births Deaths and Marriages Customer Survey 17
- Incorrect instructions
- Get confused answers from department
- Post office mix-up
- Not getting any answers
- Contradictory information: put out of system: long wait to get back
- Conflicting information from department
- Department rude: took 5 weeks: needed urgent for university identification
- Bad service
- No follow up or communication with customer
- Contradictory information: had to start again: delay of weeks
2013 NSW Registry of Births Deaths and Marriages Customer Survey 18
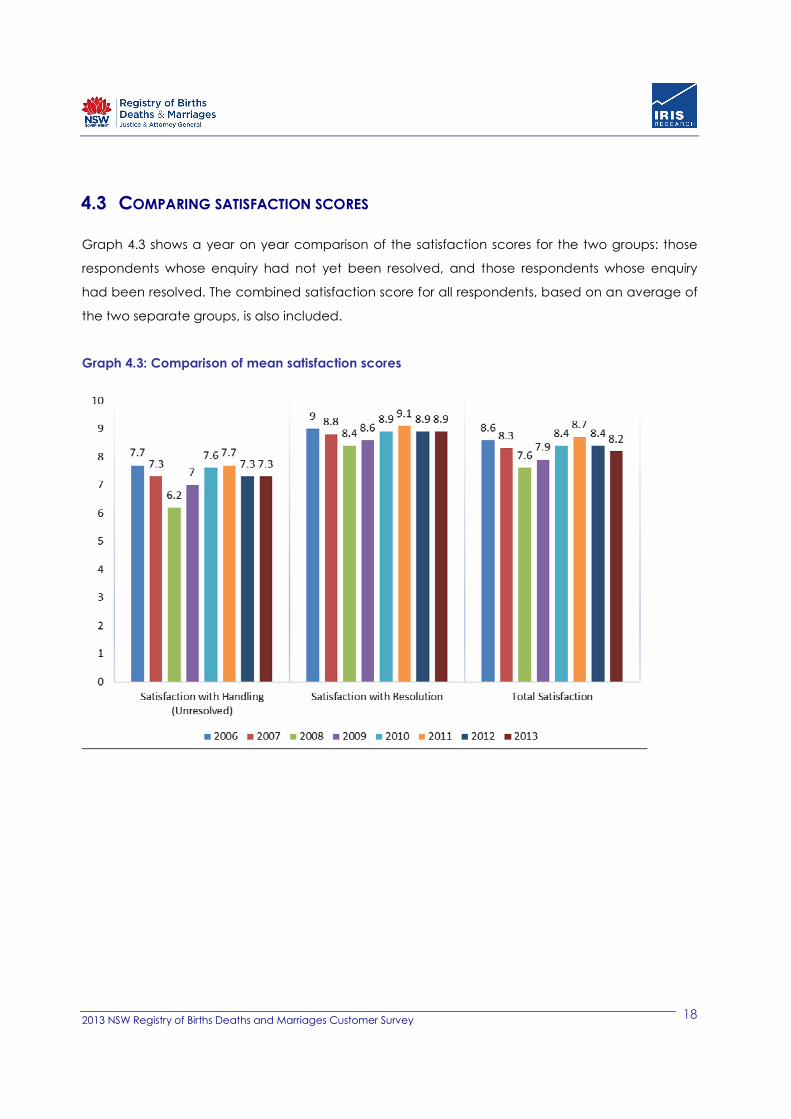
4.3 COMPARING SATISFACTION SCORES
Graph 4.3 shows a year on year comparison of the satisfaction scores for the two groups: those
respondents whose enquiry had not yet been resolved, and those respondents whose enquiry
had been resolved. The combined satisfaction score for all respondents, based on an average of
the two separate groups, is also included.
Graph 4.3: Comparison of mean satisfaction scores
2013 NSW Registry of Births Deaths and Marriages Customer Survey 19
Key results – Resolved enquiry
� Mean satisfaction with the resolution of enquiries (8.9) stayed the same over the past 12
months. The mean satisfaction levels remain quite high.
� No statistical differences were found when analysed by age or sex.
Key results – Unresolved enquiry
� Satisfaction with the handling of unresolved enquiries also was identical to the 2012 result
at 7.3.
Key results – Overall
� Total satisfaction with both unresolved and resolved enquiries fell slightly from the previous
result of 8.4, to stand at 8.2 in 2013.
2013 NSW Registry of Births Deaths and Marriages Customer Survey 20
5 OPINIONS ON CUSTOMER SERVICE
This section presents BDM Call customers’ attitudes and opinions of the services delivered by CSRs.
To understand what customers perceived to be important in the delivery of this type of service,
customers were first asked to rate the importance of key service attributes. To provide these
ratings customers were asked to think about enquiries they had made to large customer service
organisations such as banks and government departments and then to rate the perceived
importance of the components. Using the same attributes customers were then asked to rate their
satisfaction with the most recent enquiry they had made to BDM Call.
In sections 5.1 and 5.2 of this report the importance and satisfaction ratings measured in the 2013
survey are compared to those of the previous five surveys. In section 5.3 they are then combined
to develop a compositional model to determine those components which require most
improvement from the point of improving customer satisfaction with the services delivered by
customer service representatives.
5.1 IMPORTANCE RATINGS
“I would now like you to think about the times you made an enquiry to any large customer
service organisation. Can you tell me how important the following features are to you?”
Respondents to the survey were asked to rate the importance of a range of aspects concerning
enquiries they have made to any service based organisation using a scale of 0 to 10 , where 0 =
‘not important’ and 10 = ‘very important’. The findings have been presented alongside the results
of the previous five surveys in the table below.

2013 NSW Registry of Births Deaths and Marriages Customer Survey 21
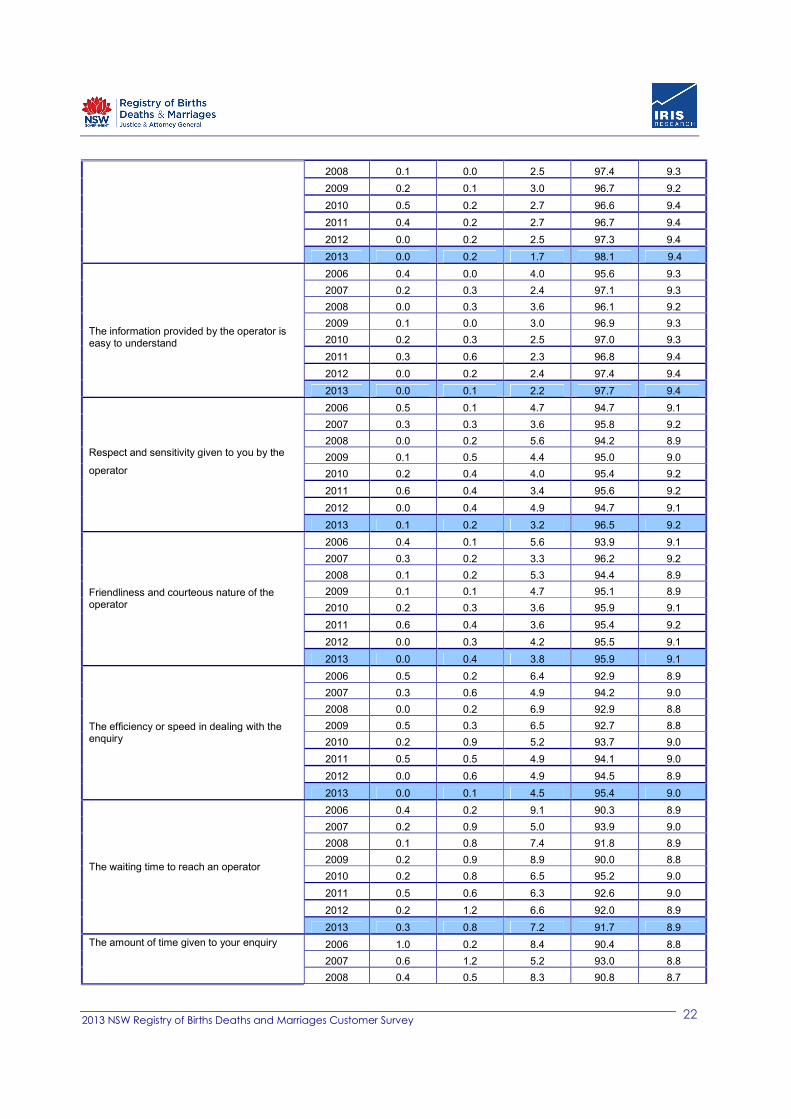
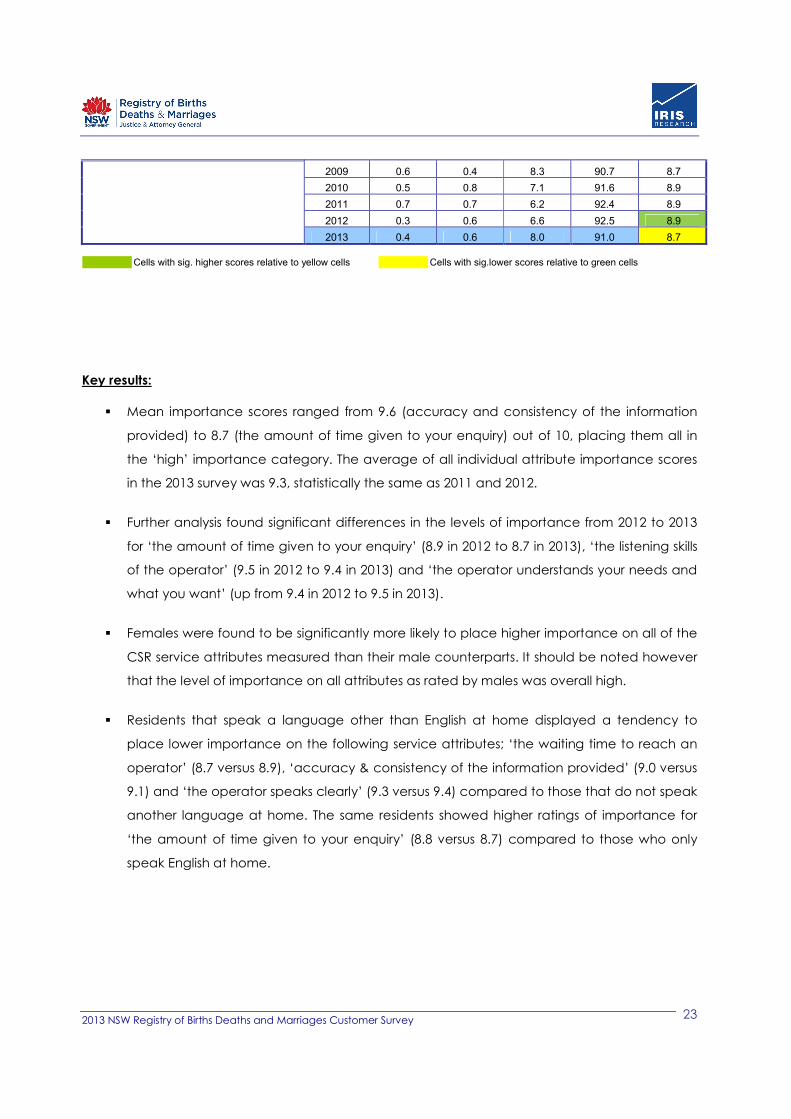
Table 5.1a: Importance scores 2006-2013
Importance rating (%)
Attribute
N/R Low
(0-3)
Medium
(4-6)
High
(7-10)
Mean Score (Ranking)
2006 0.6 0.0 1.7 97.7 9.6
2007 0.2 0.2 1.1 98.4 9.6
2008 0.2 0.0 1.7 98.1 9.5
2009 0.3 0.0 1.8 97.9 9.5
2010 0.2 0.2 1.2 98.4 9.6
2011 0.6 0.2 1.2 98.0 9.5
2012 0.2 0.1 1.3 98.4 9.6
Accuracy & consistency of the information provided
2013 0.0 0.1 1.6 98.3 9.6
2006 0.4 0.0 3.1 96.5 9.4
2007 0.2 0.1 1.5 98.2 9.4
2008 0.2 0.0 2.6 97.3 9.3
2009 0.2 0.1 1.9 97.8 9.4
2010 0.3 0.0 1.5 98.2 9.5
2011 0.4 0.2 1.7 97.7 9.4
2012 0.0 0.2 2.4 97.4 9.4
The operator understands your needs or what you want
2013 0.0 0.1 2.2 97.7 9.5
2009 0.1 0.2 2.1 97.6 9.4
2010 0.2 0.1 1.6 98.1 9.6
2011 0.6 0.5 1.6 97.3 9.5
2012 0.1 0.4 2.4 97.1 9.5
The operator speaks clearly
2013 0.0 0.2 1.1 98.7 9.4
2009 0.2 0.2 1.5 98.1 9.4
2010 0.3 0.0 1.8 97.9 9.5
2011 0.5 0.1 1.6 97.3 9.4
2012 0.2 0.1 2.0 97.7 9.5
The listening skills of the operator
2013 0.0 0.3 2.5 97.2 9.4
2006 0.4 0.0 1.8 97.8 9.4
2007 0.3 0.2 1.9 97.6 9.4
2008 0.1 0.0 2.2 97.7 9.3
2009 0.2 0.1 2.5 97.2 9.3
2010 0.2 0.3 1.7 97.8 9.4
2011 0.6 0.2 1.6 97.6 9.4
2012 0.2 0.1 1.7 98.0 9.4
Understanding of what you need to do next
2013 0.0 0.1 1.9 98.0 9.4
2006 0.4 0.2 4.4 95.0 9.3
2007 0.2 0.0 3.3 96.5 9.4
2008 0.1 0.1 3.5 96.3 9.3
2009 0.1 0.4 2.1 97.4 9.3
2010 0.4 0.3 2.0 97.3 9.4
2011 0.4 0.0 2.2 97.4 9.4
2012 0.0 0.0 2.7 97.3 9.4
Knowledge and competence of the operator
2013 0.0 0.1 1.8 98.1 9.4
2006 0.4 0.0 2.4 97.2 9.4 The helpfulness of the operator
2007 0.2 0.1 2.2 97.5 9.4
2013 NSW Registry of Births Deaths and Marriages Customer Survey 22
2008 0.1 0.0 2.5 97.4 9.3
2009 0.2 0.1 3.0 96.7 9.2
2010 0.5 0.2 2.7 96.6 9.4
2011 0.4 0.2 2.7 96.7 9.4
2012 0.0 0.2 2.5 97.3 9.4
2013 0.0 0.2 1.7 98.1 9.4
2006 0.4 0.0 4.0 95.6 9.3
2007 0.2 0.3 2.4 97.1 9.3
2008 0.0 0.3 3.6 96.1 9.2
2009 0.1 0.0 3.0 96.9 9.3
2010 0.2 0.3 2.5 97.0 9.3
2011 0.3 0.6 2.3 96.8 9.4
2012 0.0 0.2 2.4 97.4 9.4
The information provided by the operator is easy to understand
2013 0.0 0.1 2.2 97.7 9.4
2006 0.5 0.1 4.7 94.7 9.1
2007 0.3 0.3 3.6 95.8 9.2
2008 0.0 0.2 5.6 94.2 8.9
2009 0.1 0.5 4.4 95.0 9.0
2010 0.2 0.4 4.0 95.4 9.2
2011 0.6 0.4 3.4 95.6 9.2
2012 0.0 0.4 4.9 94.7 9.1
Respect and sensitivity given to you by the
operator
2013 0.1 0.2 3.2 96.5 9.2
2006 0.4 0.1 5.6 93.9 9.1
2007 0.3 0.2 3.3 96.2 9.2
2008 0.1 0.2 5.3 94.4 8.9
2009 0.1 0.1 4.7 95.1 8.9
2010 0.2 0.3 3.6 95.9 9.1
2011 0.6 0.4 3.6 95.4 9.2
2012 0.0 0.3 4.2 95.5 9.1
Friendliness and courteous nature of the operator
2013 0.0 0.4 3.8 95.9 9.1
2006 0.5 0.2 6.4 92.9 8.9
2007 0.3 0.6 4.9 94.2 9.0
2008 0.0 0.2 6.9 92.9 8.8
2009 0.5 0.3 6.5 92.7 8.8
2010 0.2 0.9 5.2 93.7 9.0
2011 0.5 0.5 4.9 94.1 9.0
2012 0.0 0.6 4.9 94.5 8.9
The efficiency or speed in dealing with the enquiry
2013 0.0 0.1 4.5 95.4 9.0
2006 0.4 0.2 9.1 90.3 8.9
2007 0.2 0.9 5.0 93.9 9.0
2008 0.1 0.8 7.4 91.8 8.9
2009 0.2 0.9 8.9 90.0 8.8
2010 0.2 0.8 6.5 95.2 9.0
2011 0.5 0.6 6.3 92.6 9.0
2012 0.2 1.2 6.6 92.0 8.9
The waiting time to reach an operator
2013 0.3 0.8 7.2 91.7 8.9
2006 1.0 0.2 8.4 90.4 8.8
2007 0.6 1.2 5.2 93.0 8.8
The amount of time given to your enquiry
2008 0.4 0.5 8.3 90.8 8.7
2013 NSW Registry of Births Deaths and Marriages Customer Survey 23
2009 0.6 0.4 8.3 90.7 8.7
2010 0.5 0.8 7.1 91.6 8.9
2011 0.7 0.7 6.2 92.4 8.9
2012 0.3 0.6 6.6 92.5 8.9
2013 0.4 0.6 8.0 91.0 8.7
Cells with sig. higher scores relative to yellow cells Cells with sig.lower scores relative to green cells
Key results:
� Mean importance scores ranged from 9.6 (accuracy and consistency of the information
provided) to 8.7 (the amount of time given to your enquiry) out of 10, placing them all in
the ‘high’ importance category. The average of all individual attribute importance scores
in the 2013 survey was 9.3, statistically the same as 2011 and 2012.
� Further analysis found significant differences in the levels of importance from 2012 to 2013
for ‘the amount of time given to your enquiry’ (8.9 in 2012 to 8.7 in 2013), ‘the listening skills
of the operator’ (9.5 in 2012 to 9.4 in 2013) and ‘the operator understands your needs and
what you want’ (up from 9.4 in 2012 to 9.5 in 2013).
� Females were found to be significantly more likely to place higher importance on all of the
CSR service attributes measured than their male counterparts. It should be noted however
that the level of importance on all attributes as rated by males was overall high.
� Residents that speak a language other than English at home displayed a tendency to
place lower importance on the following service attributes; ‘the waiting time to reach an
operator’ (8.7 versus 8.9), ‘accuracy & consistency of the information provided’ (9.0 versus
9.1) and ‘the operator speaks clearly’ (9.3 versus 9.4) compared to those that do not speak
another language at home. The same residents showed higher ratings of importance for
‘the amount of time given to your enquiry’ (8.8 versus 8.7) compared to those who only
speak English at home.
2013 NSW Registry of Births Deaths and Marriages Customer Survey 24
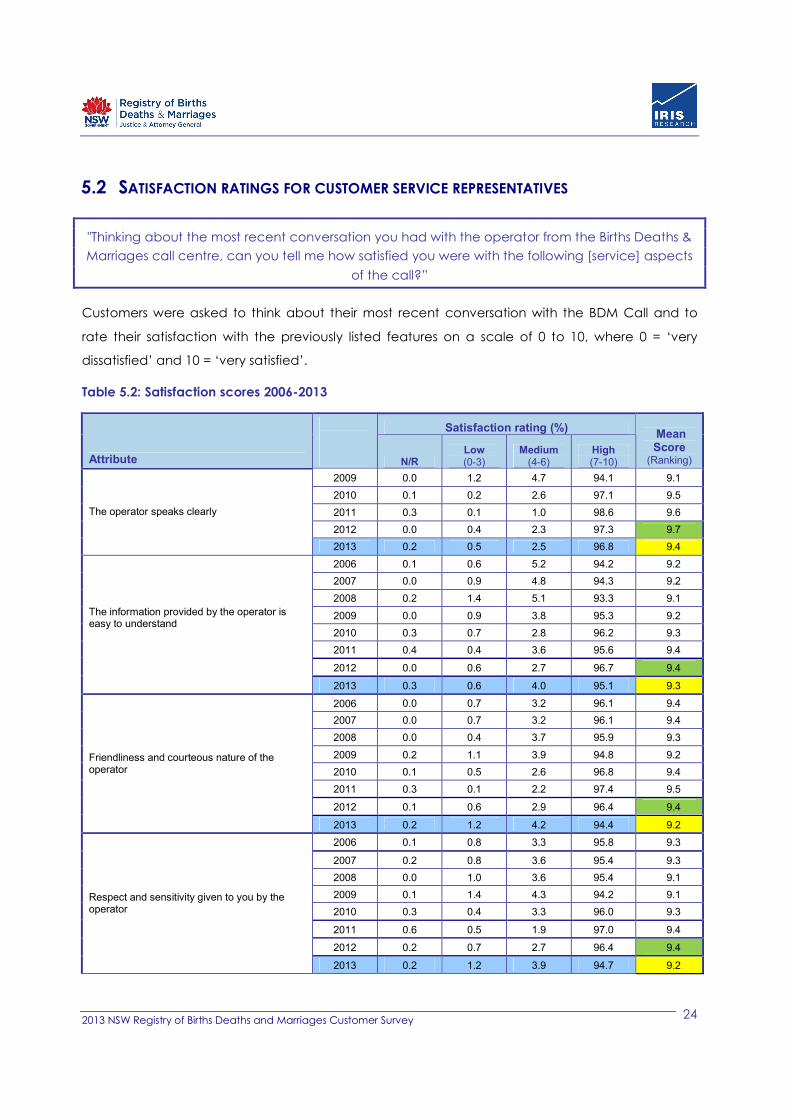
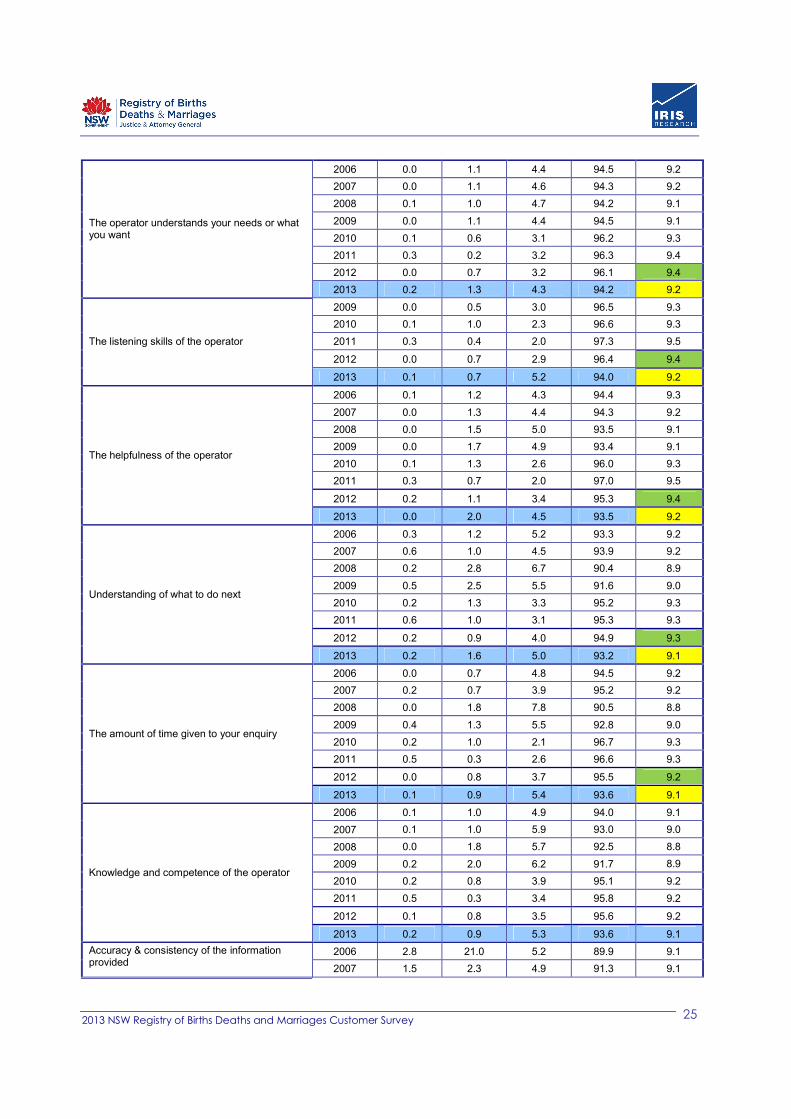
5.2 SATISFACTION RATINGS FOR CUSTOMER SERVICE REPRESENTATIVES
"Thinking about the most recent conversation you had with the operator from the Births Deaths &
Marriages call centre, can you tell me how satisfied you were with the following [service] aspects
of the call?”
Customers were asked to think about their most recent conversation with the BDM Call and to
rate their satisfaction with the previously listed features on a scale of 0 to 10, where 0 = ‘very
dissatisfied’ and 10 = ‘very satisfied’.
Table 5.2: Satisfaction scores 2006-2013
Satisfaction rating (%)
Attribute
N/R Low (0-3)
Medium (4-6)
High (7-10)
Mean Score
(Ranking)
2009 0.0 1.2 4.7 94.1 9.1
2010 0.1 0.2 2.6 97.1 9.5
2011 0.3 0.1 1.0 98.6 9.6
2012 0.0 0.4 2.3 97.3 9.7
The operator speaks clearly
2013 0.2 0.5 2.5 96.8 9.4
2006 0.1 0.6 5.2 94.2 9.2
2007 0.0 0.9 4.8 94.3 9.2
2008 0.2 1.4 5.1 93.3 9.1
2009 0.0 0.9 3.8 95.3 9.2
2010 0.3 0.7 2.8 96.2 9.3
2011 0.4 0.4 3.6 95.6 9.4
2012 0.0 0.6 2.7 96.7 9.4
The information provided by the operator is easy to understand
2013 0.3 0.6 4.0 95.1 9.3
2006 0.0 0.7 3.2 96.1 9.4
2007 0.0 0.7 3.2 96.1 9.4
2008 0.0 0.4 3.7 95.9 9.3
2009 0.2 1.1 3.9 94.8 9.2
2010 0.1 0.5 2.6 96.8 9.4
2011 0.3 0.1 2.2 97.4 9.5
2012 0.1 0.6 2.9 96.4 9.4
Friendliness and courteous nature of the operator
2013 0.2 1.2 4.2 94.4 9.2
2006 0.1 0.8 3.3 95.8 9.3
2007 0.2 0.8 3.6 95.4 9.3
2008 0.0 1.0 3.6 95.4 9.1
2009 0.1 1.4 4.3 94.2 9.1
2010 0.3 0.4 3.3 96.0 9.3
2011 0.6 0.5 1.9 97.0 9.4
2012 0.2 0.7 2.7 96.4 9.4
Respect and sensitivity given to you by the operator
2013 0.2 1.2 3.9 94.7 9.2
2013 NSW Registry of Births Deaths and Marriages Customer Survey 25
2006 0.0 1.1 4.4 94.5 9.2
2007 0.0 1.1 4.6 94.3 9.2
2008 0.1 1.0 4.7 94.2 9.1
2009 0.0 1.1 4.4 94.5 9.1
2010 0.1 0.6 3.1 96.2 9.3
2011 0.3 0.2 3.2 96.3 9.4
2012 0.0 0.7 3.2 96.1 9.4
The operator understands your needs or what you want
2013 0.2 1.3 4.3 94.2 9.2
2009 0.0 0.5 3.0 96.5 9.3
2010 0.1 1.0 2.3 96.6 9.3
2011 0.3 0.4 2.0 97.3 9.5
2012 0.0 0.7 2.9 96.4 9.4
The listening skills of the operator
2013 0.1 0.7 5.2 94.0 9.2
2006 0.1 1.2 4.3 94.4 9.3
2007 0.0 1.3 4.4 94.3 9.2
2008 0.0 1.5 5.0 93.5 9.1
2009 0.0 1.7 4.9 93.4 9.1
2010 0.1 1.3 2.6 96.0 9.3
2011 0.3 0.7 2.0 97.0 9.5
2012 0.2 1.1 3.4 95.3 9.4
The helpfulness of the operator
2013 0.0 2.0 4.5 93.5 9.2
2006 0.3 1.2 5.2 93.3 9.2
2007 0.6 1.0 4.5 93.9 9.2
2008 0.2 2.8 6.7 90.4 8.9
2009 0.5 2.5 5.5 91.6 9.0
2010 0.2 1.3 3.3 95.2 9.3
2011 0.6 1.0 3.1 95.3 9.3
2012 0.2 0.9 4.0 94.9 9.3
Understanding of what to do next
2013 0.2 1.6 5.0 93.2 9.1
2006 0.0 0.7 4.8 94.5 9.2
2007 0.2 0.7 3.9 95.2 9.2
2008 0.0 1.8 7.8 90.5 8.8
2009 0.4 1.3 5.5 92.8 9.0
2010 0.2 1.0 2.1 96.7 9.3
2011 0.5 0.3 2.6 96.6 9.3
2012 0.0 0.8 3.7 95.5 9.2
The amount of time given to your enquiry
2013 0.1 0.9 5.4 93.6 9.1
2006 0.1 1.0 4.9 94.0 9.1
2007 0.1 1.0 5.9 93.0 9.0
2008 0.0 1.8 5.7 92.5 8.8
2009 0.2 2.0 6.2 91.7 8.9
2010 0.2 0.8 3.9 95.1 9.2
2011 0.5 0.3 3.4 95.8 9.2
2012 0.1 0.8 3.5 95.6 9.2
Knowledge and competence of the operator
2013 0.2 0.9 5.3 93.6 9.1
2006 2.8 21.0 5.2 89.9 9.1 Accuracy & consistency of the information provided
2007 1.5 2.3 4.9 91.3 9.1
2013 NSW Registry of Births Deaths and Marriages Customer Survey 26
2008 4.5 3.6 7.8 84.1 8.7
2009 2.7 2.5 6.2 88.7 8.9
2010 1.9 1.6 4.3 92.2 9.2
2011 2.6 1.1 3.9 92.4 9.2
2012 1.2 1.5 4.3 93.0 9.2
2013 0.8 1.6 5.9 91.7 9.1
2006 1.2 1.2 6.8 90.8 9.0
2007 0.5 1.6 5.9 92.0 9.0
2008 0.3 3.7 9.1 86.8 8.6
2009 0.6 2.5 7.1 89.9 8.8
2010 0.3 1.5 3.9 94.3 9.1
2011 0.6 1.0 3.4 95.0 9.3
2012 0.3 2.1 4.2 93.4 9.1
The efficiency or speed in dealing with the enquiry
2013 0.3 2.1 6.3 91.3 8.9
2006 0.4 1.6 14.3 83.7 8.3
2007 1.0 2.7 11.5 84.8 8.4
2008 0.1 20.0 27.9 52.0 6.2
2009 0.6 8.4 24.0 67.0 7.2
2010 0.6 3.3 11.6 84.6 8.3
2011 0.7 2.1 10.4 86.9 8.4
2012 0.3 5.3 14.0 80.5 8.0
The waiting time to reach an operator
2013 0.2 12.2 24.3 63.3 6.9
Cells with sig. higher scores relative to yellow cells Cells with sig.lower scores relative to green cells
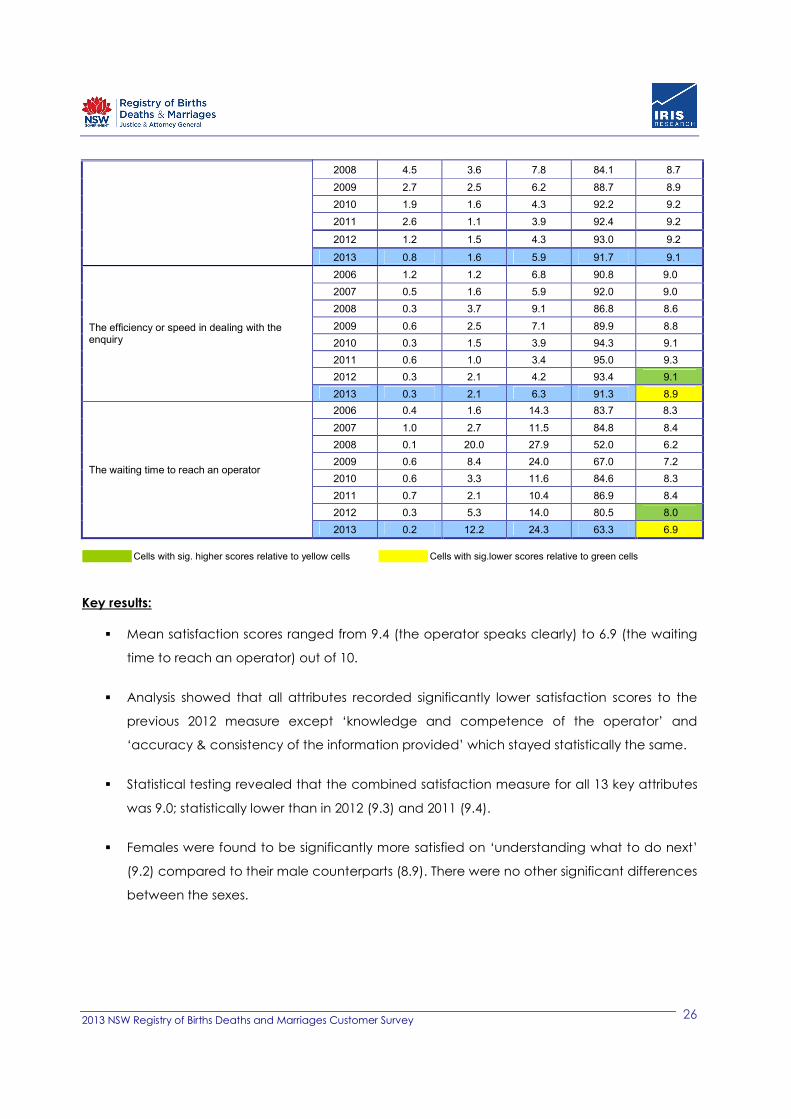
Key results:
� Mean satisfaction scores ranged from 9.4 (the operator speaks clearly) to 6.9 (the waiting
time to reach an operator) out of 10.
� Analysis showed that all attributes recorded significantly lower satisfaction scores to the
previous 2012 measure except ‘knowledge and competence of the operator’ and
‘accuracy & consistency of the information provided’ which stayed statistically the same.
� Statistical testing revealed that the combined satisfaction measure for all 13 key attributes
was 9.0; statistically lower than in 2012 (9.3) and 2011 (9.4).
� Females were found to be significantly more satisfied on ‘understanding what to do next’
(9.2) compared to their male counterparts (8.9). There were no other significant differences
between the sexes.
2013 NSW Registry of Births Deaths and Marriages Customer Survey 27
� Further analysis revealed that customers of Aboriginal or Torres Strait Islander descent were
more satisfied with ‘accuracy & consistency of the information provided’ compared to
those that are not (10.5 versus 9.0).
� 25 to 39 year old respondents were less satisfied than older respondents with the
‘helpfulness of the operator’.

2013 NSW Registry of Births Deaths and Marriages Customer Survey 28
5.2.1 Relationship between performance and expectations (Quadrant analysis)
Quadrant analysis is a useful way of analysing both the level of importance that a service attribute
holds for customers and the satisfaction they have with the provision of that service. To do this,
mean satisfaction scores are plotted against mean importance scores for each service attribute.
In order to form the quadrants (or opportunity matrix) that separate higher and lower level priority
services, combined mean importance and satisfaction scores were calculated for the entire set of
13 attributes. These scores were: Importance = 9.26 & Satisfaction = 8.99. Thus for example, service
attributes with a mean importance score of less than 9.26 (i.e. a score lower than the overall
mean importance score), were classified as having ‘lower’ importance. Conversely, service
attributes with a mean score above 9.26 were classified as having ‘higher’ importance. The results
of the quadrant analysis are displayed in Graph 5.1.
Graph 5.1: Quadrant analysis
Satisfaction
Importance
2013 NSW Registry of Births Deaths and Marriages Customer Survey 29
Key results:
Dividing the figure above into quadrants based on the overall mean scores for importance and
satisfaction allows a specific interpretation:
1) Upper right quadrant (high importance and high satisfaction) represents BDM Call’s current
major strengths in service delivery. In 2013 eight of the thirteen components fell into this
category: ‘the operator speaks clearly’, ‘the listening skills of the operator’, ‘the operator
understood your needs or what you wanted’, ‘understanding of what to do next’, ‘knowledge
and competence of the operator’, ‘accuracy and consistency of the information provided’,
‘the information provided by the operator is easy to understand’, and ‘the helpfulness of the
operator’.
In comparison in 2012 there were five components that fell into this category: ‘the operator
speaks clearly’, ‘the listening skills of the operator’, ‘the operator understood your needs or what
you wanted’, ‘the information provided by the operator is easy to understand’, and ‘the
helpfulness of the operator’.
2) The upper left-hand quadrant (high importance but relatively lower satisfaction) denotes
service components where satisfaction could be improved. In 2013 no components fell into
this category, which is an excellent result.
In comparison in 2012 there were three components that fell into this category: ‘accuracy and
consistency of the information provided’, ‘understanding of what to do next’ and ‘’knowledge
and competence of the operator’.
3) The lower left quadrant (relatively lower importance but relatively lower satisfaction)
represents lower priority areas. Two attributes fell into this quadrant: ‘the efficiency or speed in
dealing with the enquiry’ and ‘the waiting time to reach an operator’.
In comparison in 2012 there were three components that fell into this category: ‘the efficiency or
speed in dealing with the enquiry’, ‘the amount of time given to your enquiry’ and ‘the waiting
time to reach an operator’.
4) The lower right-hand quadrant (relatively lower importance and high satisfaction) is often
interpreted as service components where delivery is exceeding expectations. The 2013 survey
found that three services attributes fell into this quadrant, these were: ‘respect and sensitivity
given to you by the operator’ ‘the amount of time given to your enquiry’ and ‘friendliness and
courteous nature of the operator’.
2013 NSW Registry of Births Deaths and Marriages Customer Survey 30
In comparison in 2012 there were two components that fell into this category: ‘respect and
sensitivity given to you by the operator’ and ‘friendliness and courteous nature of the operator’.
2013 NSW Registry of Births Deaths and Marriages Customer Survey 31
5.2.2 Prioritising Service Components
Despite its usefulness, quadrant analysis is not a complete priority assessment tool. For example, it
does not explicitly identify the gaps between importance and satisfaction. It is possible that a
large gap could exist between importance and satisfaction, even though a service or facility
appeared in the ‘high importance and high satisfaction’ quadrant.
Consequently, gap analysis was used as the second component in analysing the results. Gap
measures were calculated by subtracting the mean satisfaction score from the mean importance
score for each attribute. Generally, the larger the gap between importance and satisfaction, the
larger the gap between the operator’s service performance and client expectations.
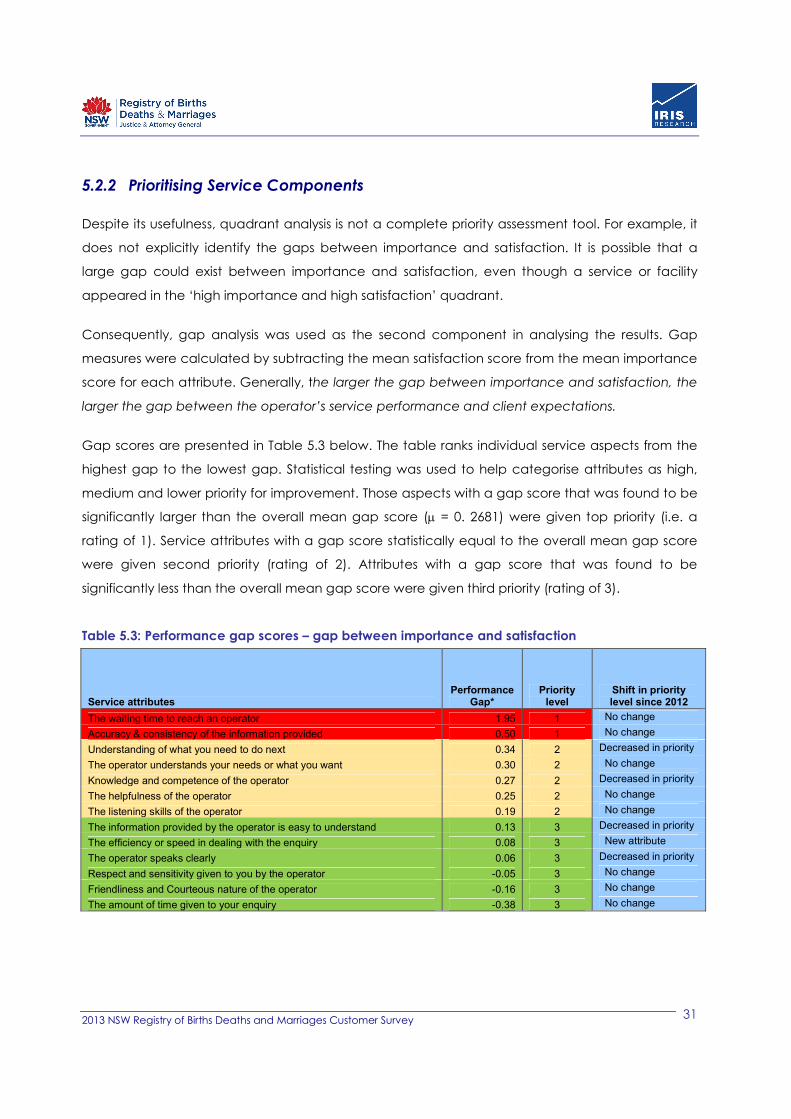
Gap scores are presented in Table 5.3 below. The table ranks individual service aspects from the
highest gap to the lowest gap. Statistical testing was used to help categorise attributes as high,
medium and lower priority for improvement. Those aspects with a gap score that was found to be
significantly larger than the overall mean gap score (µ = 0. 2681) were given top priority (i.e. a
rating of 1). Service attributes with a gap score statistically equal to the overall mean gap score
were given second priority (rating of 2). Attributes with a gap score that was found to be
significantly less than the overall mean gap score were given third priority (rating of 3).
Table 5.3: Performance gap scores – gap between importance and satisfaction
Service attributes Performance
Gap* Priority
level Shift in priority level since 2012
The waiting time to reach an operator 1.95 1 No change
Accuracy & consistency of the information provided 0.50 1 No change
Understanding of what you need to do next 0.34 2 Decreased in priority
The operator understands your needs or what you want 0.30 2 No change
Knowledge and competence of the operator 0.27 2 Decreased in priority
The helpfulness of the operator 0.25 2 No change
The listening skills of the operator 0.19 2 No change
The information provided by the operator is easy to understand 0.13 3 Decreased in priority
The efficiency or speed in dealing with the enquiry 0.08 3 New attribute
The operator speaks clearly 0.06 3 Decreased in priority
Respect and sensitivity given to you by the operator -0.05 3 No change
Friendliness and Courteous nature of the operator -0.16 3 No change
The amount of time given to your enquiry -0.38 3 No change
2013 NSW Registry of Births Deaths and Marriages Customer Survey 32
Key results:
It is important to note that the overall mean gap score has increased from 2012 to 2013 due to the
significant increase in the gap score of ‘the waiting time to reach an operator’ (0.93 to 1.95
retrospectively). This has therefore lowered the priority of all other attributes even though
performance gap scores have generally stayed constant.
� The service attributes of ‘the waiting time to reach an operator’, and ‘the accuracy and
consistency of information provided’ were given priority ratings of 1. A priority rating of 1
indicates an ‘above average’ gap between the importance rating and the satisfaction
rating of these aspects.
- This indicates that ‘the waiting time to reach an operator’ could be improved as it
received a medium mean satisfaction score of 6.9, significantly lower than in 2012.
The BDM call centre did however still achieve high satisfaction scores for ‘the
accuracy and consistency of information provided’ (and therefore a relatively
small expectation gap) it is therefore more imperative that the current standard of
‘the accuracy and consistency of information provided’ at least be maintained.
� Attributes that were given priority level 2 ratings were found to have performance gaps
that were statistically the same as the average gap score of 0.2681. These attributes were:
‘understanding of what you need to do next’, ‘the operator understands your needs or
what you want’, knowledge and competence of the operator’, ‘the helpfulness of the
operator’ and ‘the listening skills of the operator. The two attributes ‘understanding of
what you need to do next’ and ‘knowledge and competence of the operator’ moved
down from priority level 1 to 2 since to 2012.
� Finally service attributes that were given priority level 3 were identified as having gap
scores that were significantly below the average gap score. These service attributes were:
‘the information provided by the operator is easy to understand’, ‘the efficiency or speed
in dealing with the enquiry’, ‘the operator speaks clearly’, ‘respect and sensitivity given to
you by the operator’, ‘friendliness and courteous nature of the operator’ and ‘the amount
of time given to your enquiry’. These all also achieved priority level 3 ratings in 2012, except
‘the information provided by the operator is easy to understand’ and ‘the operator speaks
clearly’ were priority level 2.
2013 NSW Registry of Births Deaths and Marriages Customer Survey 33
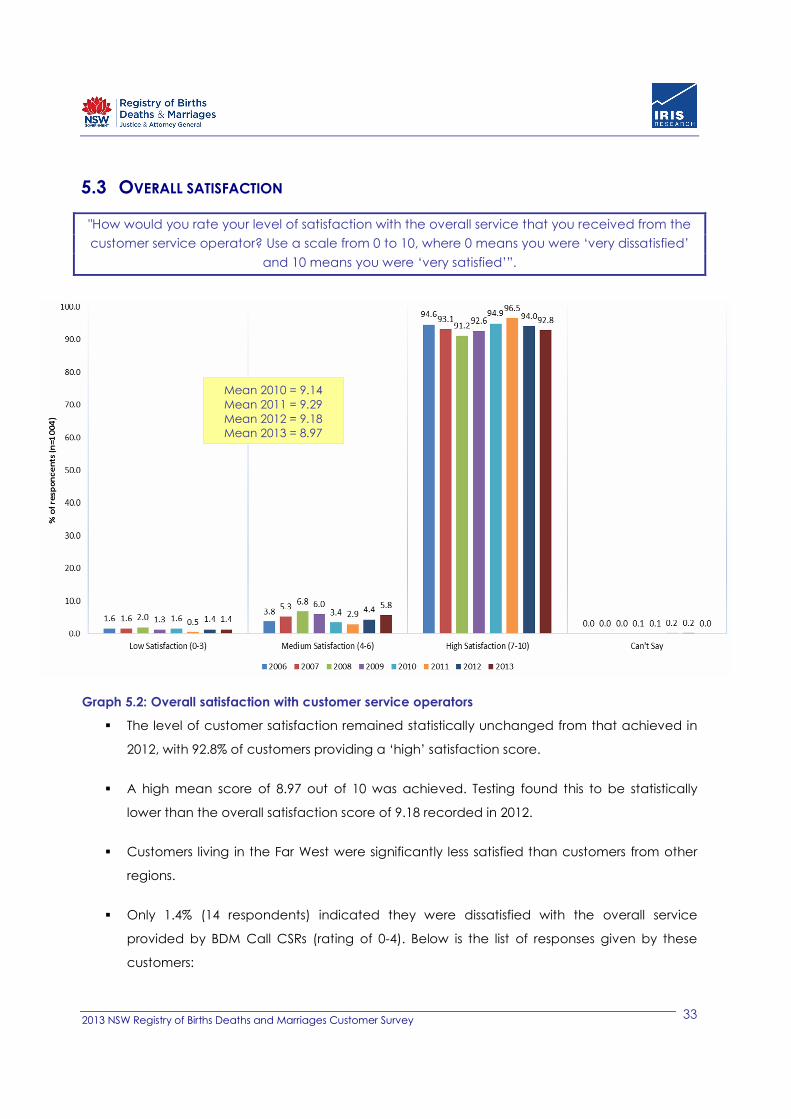
5.3 OVERALL SATISFACTION
"How would you rate your level of satisfaction with the overall service that you received from the
customer service operator? Use a scale from 0 to 10, where 0 means you were ‘very dissatisfied’
and 10 means you were ‘very satisfied’”.
Graph 5.2: Overall satisfaction with customer service operators
� The level of customer satisfaction remained statistically unchanged from that achieved in
2012, with 92.8% of customers providing a ‘high’ satisfaction score.
� A high mean score of 8.97 out of 10 was achieved. Testing found this to be statistically
lower than the overall satisfaction score of 9.18 recorded in 2012.
� Customers living in the Far West were significantly less satisfied than customers from other
regions.
� Only 1.4% (14 respondents) indicated they were dissatisfied with the overall service
provided by BDM Call CSRs (rating of 0-4). Below is the list of responses given by these
customers:
Mean 2010 = 9.14
Mean 2011 = 9.29
Mean 2012 = 9.18 Mean 2013 = 8.97
2013 NSW Registry of Births Deaths and Marriages Customer Survey 34
- Wrong information given.
- They interrupted me during the call and did not attempt to help me.
- Problem with the payment and credit card.
- Operator gave wrong information.
- Documents arrived with mistake with wrong information. They were
sarcastic they said “I don’t care”.
- Rude, not polite or understanding, angry when asked for information,
wanted to end call.
- He didn’t understand my anxiety over getting my certificate in time.
- Waiting too long money has already deducted from account no results.
- Didn’t take any initiative in finding out what I needed help with, off phone
fast.
- Lack of knowledge, not referring to others, poor English.
- Overall service dissatisfied, difficulty getting documents.
- She talked over me, not interested. Long time to get information as hard to
ask question.
- They could not give me information related to VIC or Canberra.
- Information was wrong, no idea when processed, overall 3 operators, 3
different answers.
- The form had incorrect information on it.
- Most of the time I called them they were very unfriendly, felt they were
always angry.
- Just said they’ll send a letter, no information on progress of enquiry.
- Brisk no straight answer on why taking so long, they came up with extra
document demands.
- Friendly but gave tracking number and wasted journey rather than looking
it up.
- Could not understand everything that was being said.
- Some comments made by CSO, general sense of lack of care.
- They were not helpful and didn’t appreciate the urgency and the
problems.
- Rang twice a week for 5 weeks regarding receiving certificate.
- Questions were not answered operator couldn’t understand.
- Taken too long to receive certificates.
2013 NSW Registry of Births Deaths and Marriages Customer Survey 35
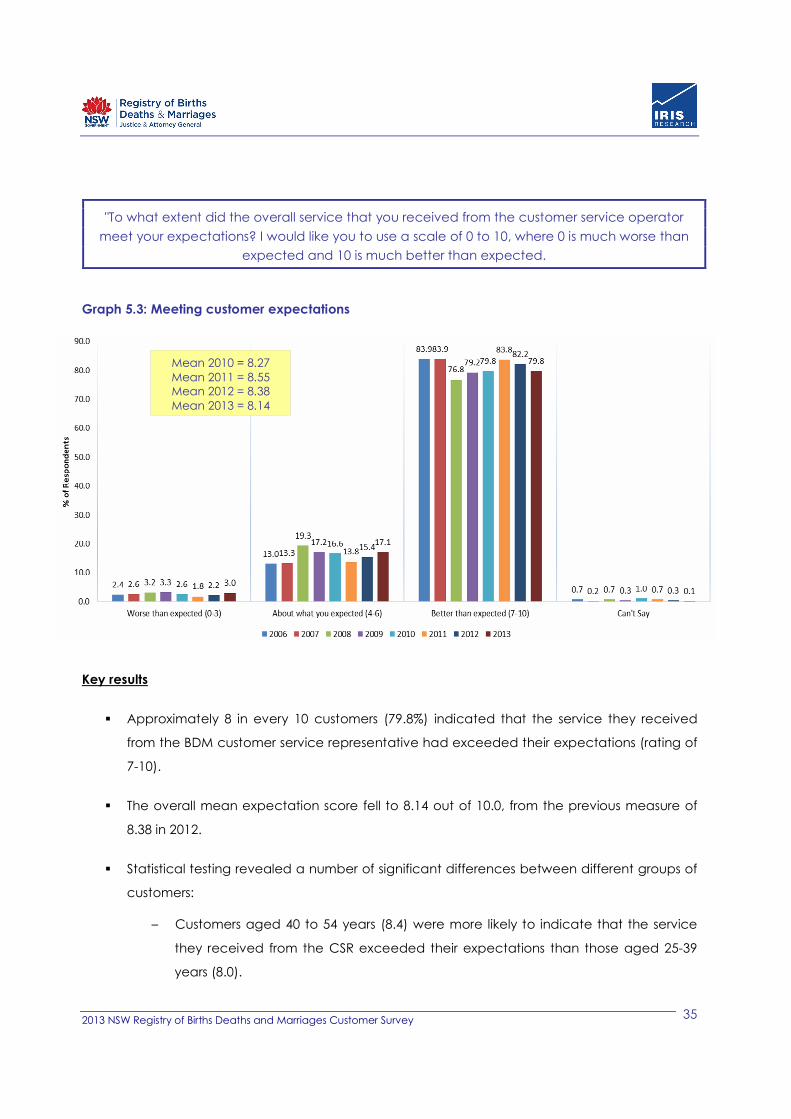
"To what extent did the overall service that you received from the customer service operator
meet your expectations? I would like you to use a scale of 0 to 10, where 0 is much worse than
expected and 10 is much better than expected.
Graph 5.3: Meeting customer expectations
Key results
� Approximately 8 in every 10 customers (79.8%) indicated that the service they received
from the BDM customer service representative had exceeded their expectations (rating of
7-10).
� The overall mean expectation score fell to 8.14 out of 10.0, from the previous measure of
8.38 in 2012.
� Statistical testing revealed a number of significant differences between different groups of
customers:
– Customers aged 40 to 54 years (8.4) were more likely to indicate that the service
they received from the CSR exceeded their expectations than those aged 25-39
years (8.0).
Mean 2010 = 8.27
Mean 2011 = 8.55 Mean 2012 = 8.38
Mean 2013 = 8.14
2013 NSW Registry of Births Deaths and Marriages Customer Survey 36
� The 30 customers who indicated the service delivered by BDM Call CSRs was below their
expectations (0-3 rating), were asked to indicate why. A list of their comments is provided
below:
– Wrong information was given.
– Told different things each time.
– She did not explain what documents I had to produce.
– Sent wrong certificate still haven’t received the right one.
– Rude. I expected more understanding and manners. They should have recognised
the importance of the issue.
– Other operators were good: this one was unhelpful and lacked knowledge.
– Operator was sarcastic, unprofessional, had the wrong information and there was
a 15 minute wait.
– Operator made issue more complicated than it had to be, no previous information
on documents.
– I expected the enquiry to be resolved sooner than this.
– Didn’t realise how difficult the enquiry would be.
– Shortage of staff delayed getting through to a customer Service operator
– Issue wasn’t resolved
– Info on wife: no info on self then no info on wife allowed: 3 calls: paid extra
– Taken long time to sort things out :passport:
– Nothing has been resolved
– I was given inconsistent info: delay in response time
– Expected to have form sent out just told go on internet : print
– Application was submitted 8 weeks prior at went missing
– Unhelpful: gave no info on progress of application: unfriendly
– Time the it will take to get what you need
– Still waiting taking to long
– Rather complex
– Quality of service: unfriendly: unhelpful: very rushed: uninterested
– Operator seemed disinterested in query:
– Not very informative and not interested
– Expected to get more help than was given
– Expected to get more help and direction on website
– Due to lost money order and getting run around
– 2 long waits on one call: long wait for documents: operator was fine
– The operator agreed the form was misleading
2013 NSW Registry of Births Deaths and Marriages Customer Survey 37
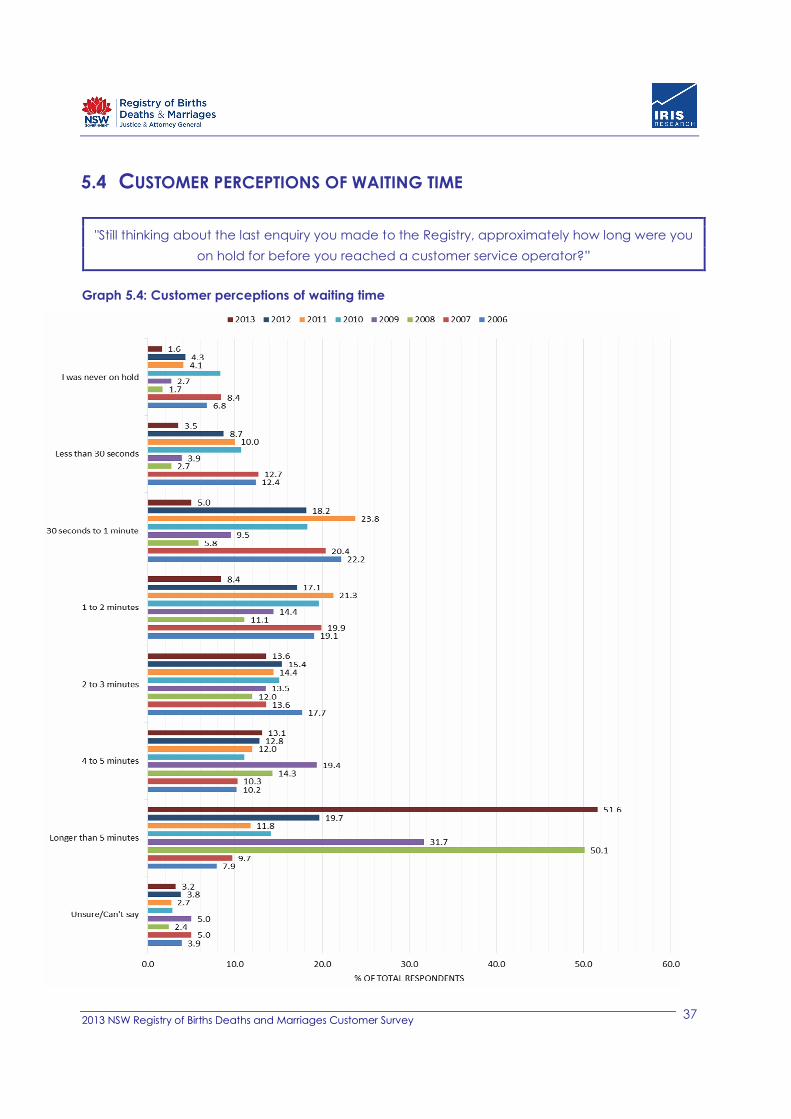
5.4 CUSTOMER PERCEPTIONS OF WAITING TIME
"Still thinking about the last enquiry you made to the Registry, approximately how long were you
on hold for before you reached a customer service operator?”
Graph 5.4: Customer perceptions of waiting time
2013 NSW Registry of Births Deaths and Marriages Customer Survey 38
Key results
� The proportion of BDM Call customers that perceived their waiting time to reach a BDM
Call CSR as being longer than 5 minutes significantly increased from 19.7% to 51.6%;
statistically the same as the highest result recorded in 2008.
� At the same time, the proportion of customers that reached a BDM Call CSR in 30 seconds
or less (including no wait) stood at 5.1%; statistically lower than the last measure (13%
recorded in 2012).
� Generally it is evident that the perceived waiting times of customers has increased in 2013
compared to the previous study in 2012.
� It is important to note that this question is a measure of perceived waiting time and may
be significantly different from actual measured waiting time.
2013 NSW Registry of Births Deaths and Marriages Customer Survey 39
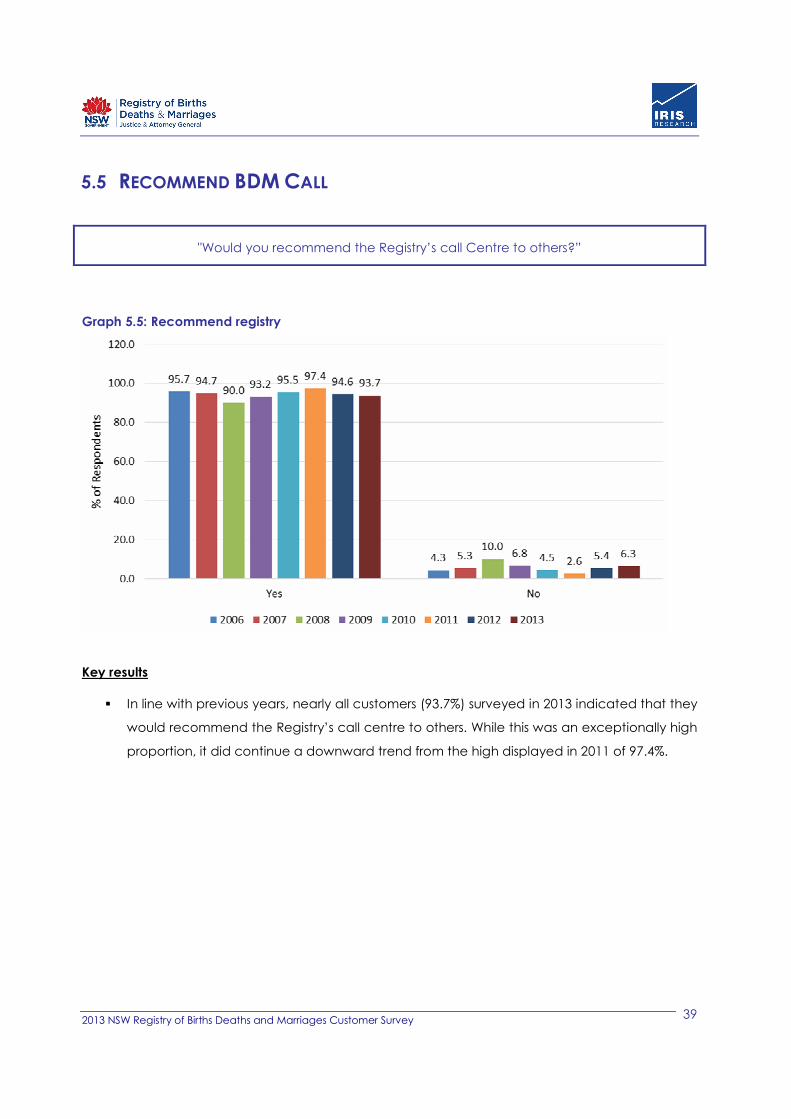
5.5 RECOMMEND BDM CALL
"Would you recommend the Registry’s call Centre to others?”
Graph 5.5: Recommend registry
Key results
� In line with previous years, nearly all customers (93.7%) surveyed in 2013 indicated that they
would recommend the Registry’s call centre to others. While this was an exceptionally high
proportion, it did continue a downward trend from the high displayed in 2011 of 97.4%.
2013 NSW Registry of Births Deaths and Marriages Customer Survey 40
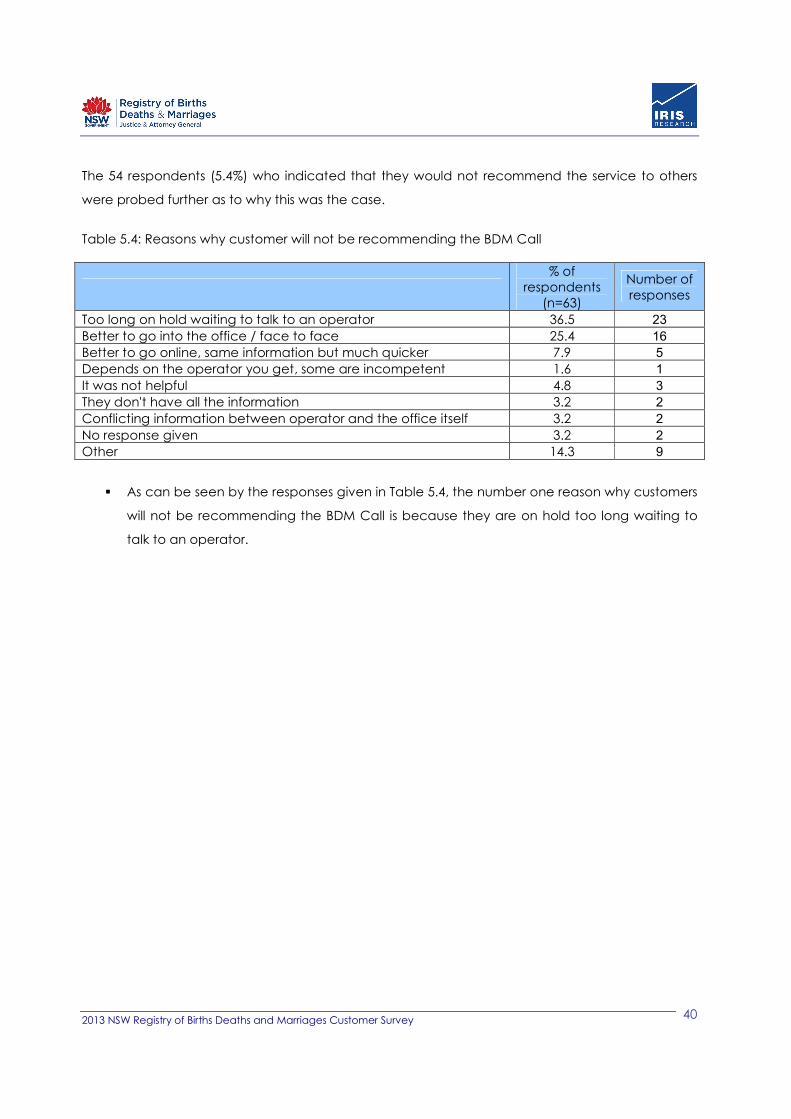
The 54 respondents (5.4%) who indicated that they would not recommend the service to others
were probed further as to why this was the case.
Table 5.4: Reasons why customer will not be recommending the BDM Call
% of
respondents
(n=63)
Number of
responses
Too long on hold waiting to talk to an operator 36.5 23
Better to go into the office / face to face 25.4 16
Better to go online, same information but much quicker 7.9 5
Depends on the operator you get, some are incompetent 1.6 1
It was not helpful 4.8 3
They don't have all the information 3.2 2
Conflicting information between operator and the office itself 3.2 2
No response given 3.2 2
Other 14.3 9
� As can be seen by the responses given in Table 5.4, the number one reason why customers
will not be recommending the BDM Call is because they are on hold too long waiting to
talk to an operator.
2013 NSW Registry of Births Deaths and Marriages Customer Survey 41
6 REGISTRY OFFICES
This section aims to identify whether BDM Call customers are aware of the locations of the
Registry’s three regional offices.
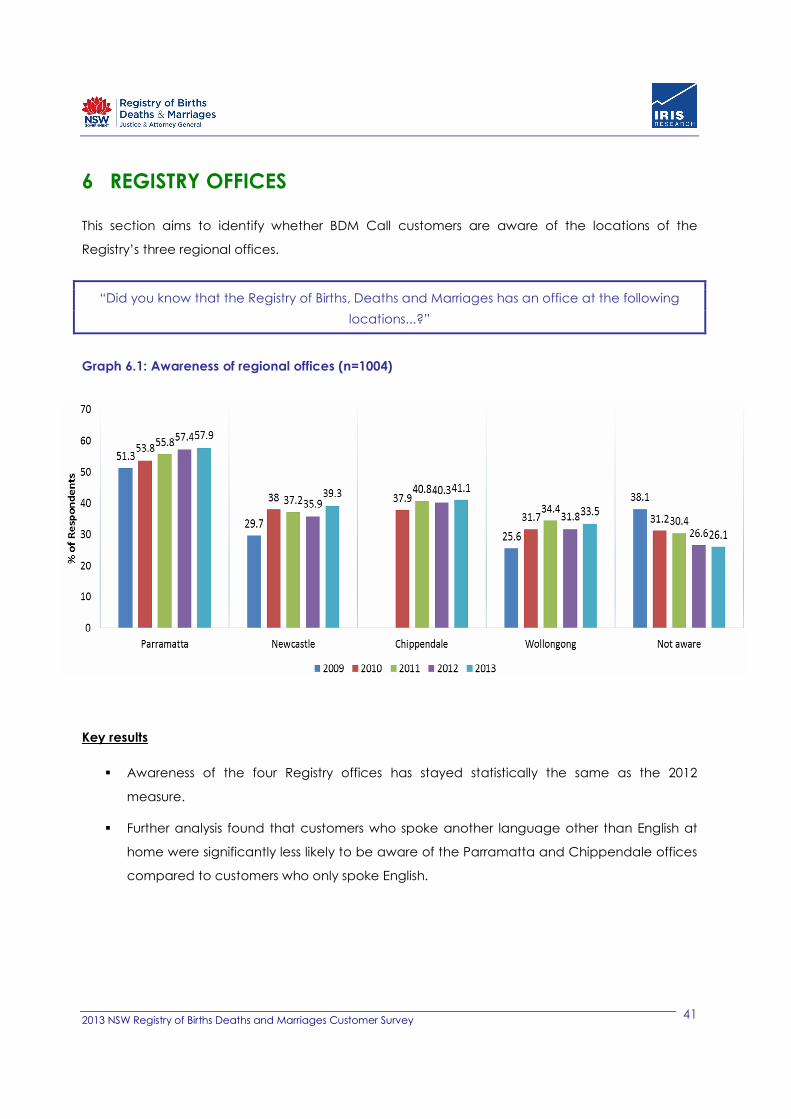
“Did you know that the Registry of Births, Deaths and Marriages has an office at the following
locations...?”
Graph 6.1: Awareness of regional offices (n=1004)
Key results
� Awareness of the four Registry offices has stayed statistically the same as the 2012
measure.
� Further analysis found that customers who spoke another language other than English at
home were significantly less likely to be aware of the Parramatta and Chippendale offices
compared to customers who only spoke English.
2013 NSW Registry of Births Deaths and Marriages Customer Survey 42
7 BIRTHS, DEATHS AND MARRIAGES PHONE NUMBER
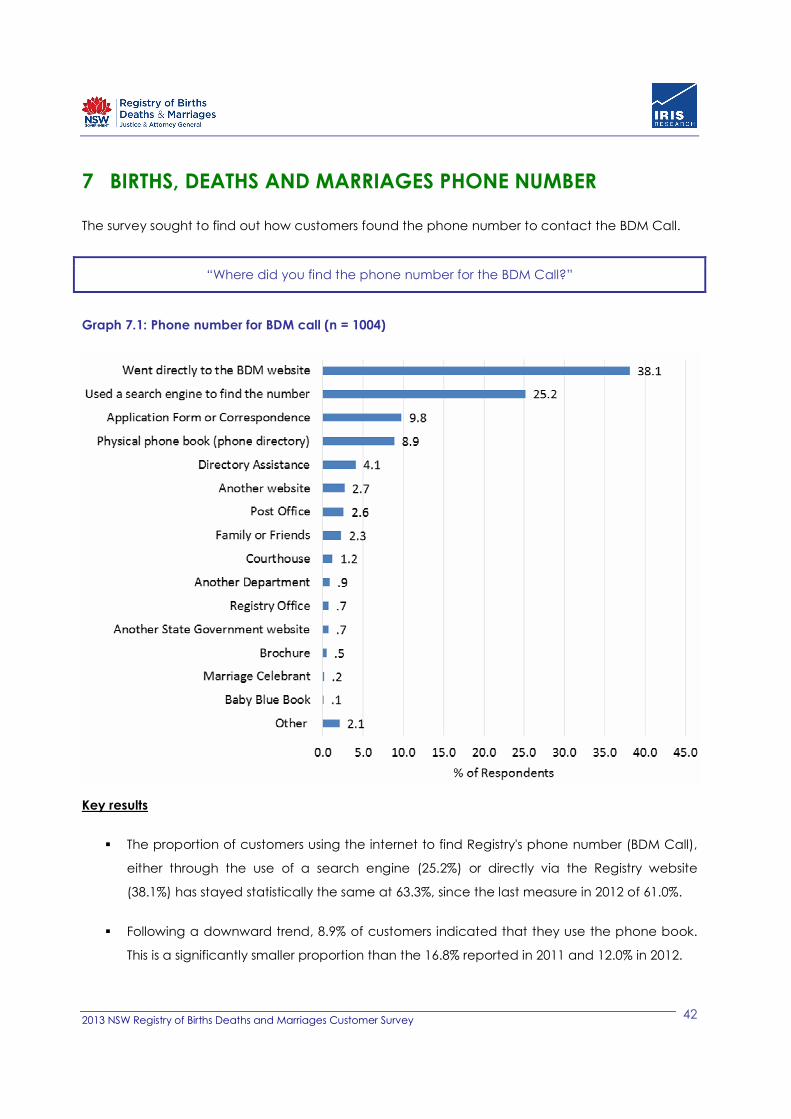
The survey sought to find out how customers found the phone number to contact the BDM Call.
“Where did you find the phone number for the BDM Call?”
Graph 7.1: Phone number for BDM call (n = 1004)
Key results
� The proportion of customers using the internet to find Registry's phone number (BDM Call),
either through the use of a search engine (25.2%) or directly via the Registry website
(38.1%) has stayed statistically the same at 63.3%, since the last measure in 2012 of 61.0%.
� Following a downward trend, 8.9% of customers indicated that they use the phone book.
This is a significantly smaller proportion than the 16.8% reported in 2011 and 12.0% in 2012.
2013 NSW Registry of Births Deaths and Marriages Customer Survey 43
8 POST OFFICE CERTIFICATE APPLICATIONS
The survey lastly asked BDM Call customers about the option of applying for their certificate at
their local Australia Post office.
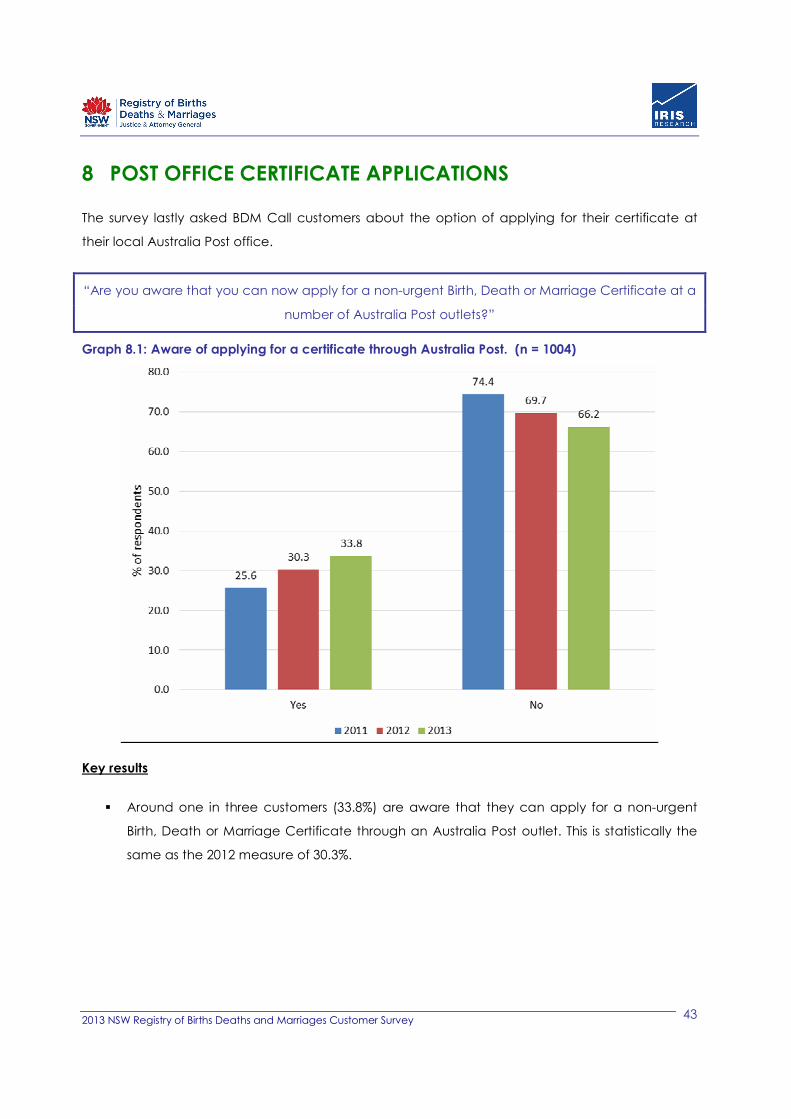
“Are you aware that you can now apply for a non-urgent Birth, Death or Marriage Certificate at a
number of Australia Post outlets?”
Graph 8.1: Aware of applying for a certificate through Australia Post. (n = 1004)
Key results
� Around one in three customers (33.8%) are aware that they can apply for a non-urgent
Birth, Death or Marriage Certificate through an Australia Post outlet. This is statistically the
same as the 2012 measure of 30.3%.
2013 NSW Registry of Births Deaths and Marriages Customer Survey
44
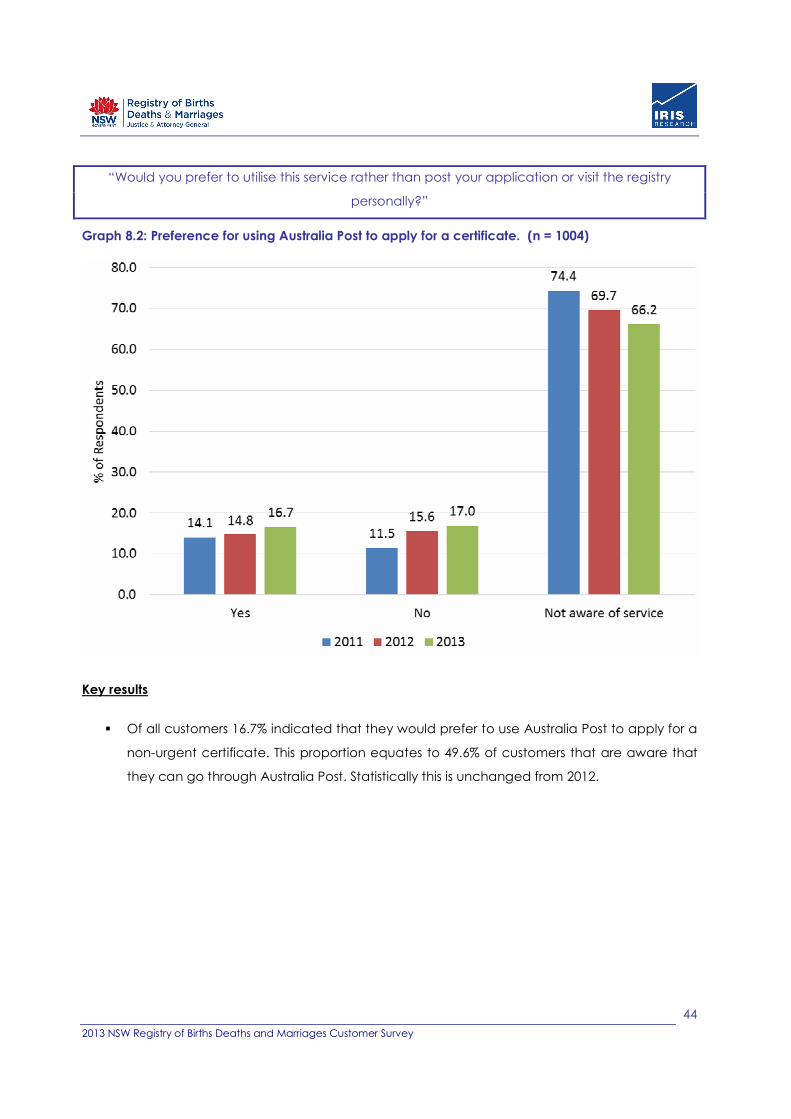
“Would you prefer to utilise this service rather than post your application or visit the registry
personally?”
Graph 8.2: Preference for using Australia Post to apply for a certificate. (n = 1004)
Key results
� Of all customers 16.7% indicated that they would prefer to use Australia Post to apply for a
non-urgent certificate. This proportion equates to 49.6% of customers that are aware that
they can go through Australia Post. Statistically this is unchanged from 2012.
2013 NSW Registry of Births Deaths and Marriages Customer Survey
45
APPENDIX I
Questionnaire
2013 NSW Registry of Births Deaths and Marriages Customer Survey
46
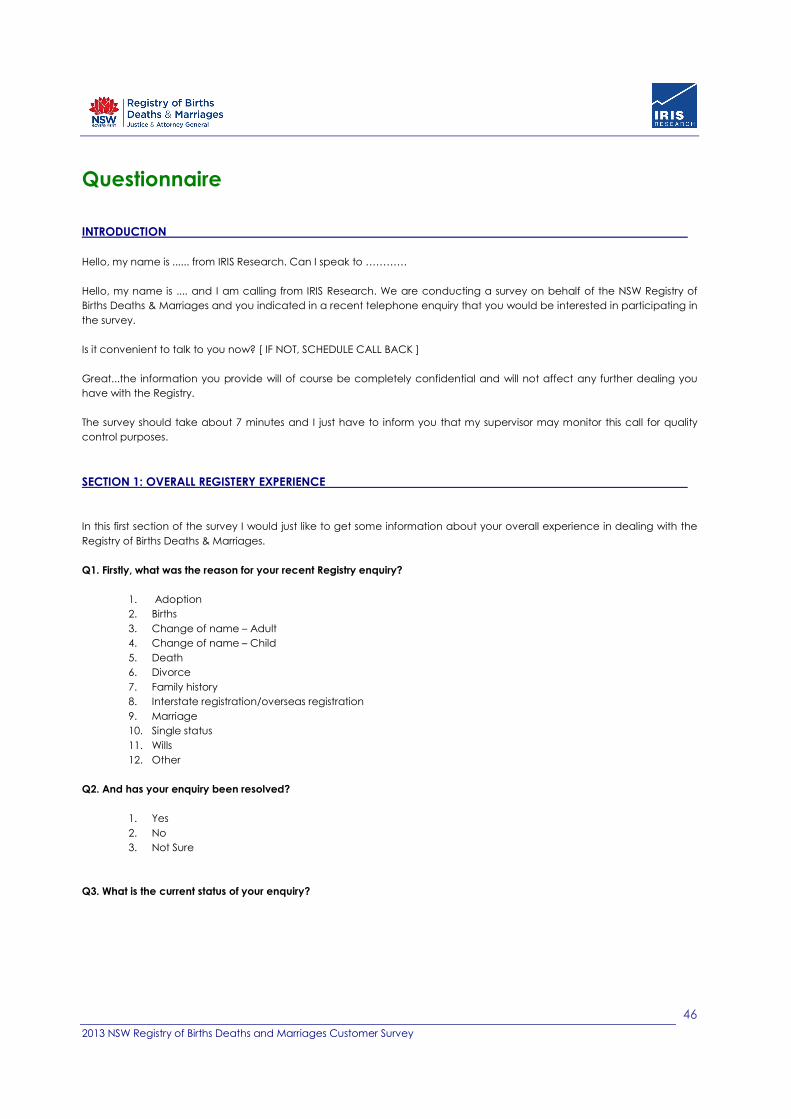
Questionnaire
INTRODUCTION
Hello, my name is ...... from IRIS Research. Can I speak to …………
Hello, my name is .... and I am calling from IRIS Research. We are conducting a survey on behalf of the NSW Registry of
Births Deaths & Marriages and you indicated in a recent telephone enquiry that you would be interested in participating in
the survey.
Is it convenient to talk to you now? [ IF NOT, SCHEDULE CALL BACK ]
Great...the information you provide will of course be completely confidential and will not affect any further dealing you
have with the Registry.
The survey should take about 7 minutes and I just have to inform you that my supervisor may monitor this call for quality
control purposes.
SECTION 1: OVERALL REGISTERY EXPERIENCE
In this first section of the survey I would just like to get some information about your overall experience in dealing with the
Registry of Births Deaths & Marriages.
Q1. Firstly, what was the reason for your recent Registry enquiry?
1. Adoption
2. Births
3. Change of name – Adult
4. Change of name – Child
5. Death
6. Divorce
7. Family history
8. Interstate registration/overseas registration
9. Marriage
10. Single status
11. Wills
12. Other
Q2. And has your enquiry been resolved?
1. Yes
2. No
3. Not Sure
Q3. What is the current status of your enquiry?
2013 NSW Registry of Births Deaths and Marriages Customer Survey
47
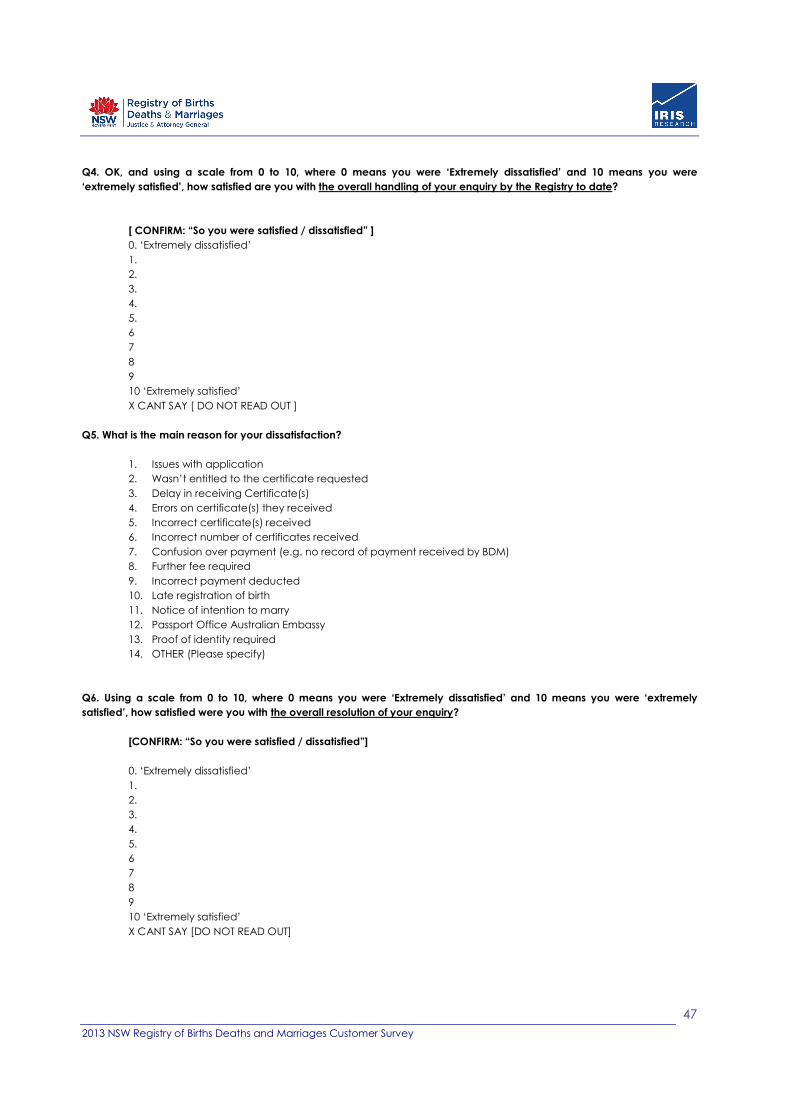
Q4. OK, and using a scale from 0 to 10, where 0 means you were ‘Extremely dissatisfied’ and 10 means you were
‘extremely satisfied’, how satisfied are you with the overall handling of your enquiry by the Registry to date?
[ CONFIRM: “So you were satisfied / dissatisfied” ]
0. ‘Extremely dissatisfied’
1.
2.
3.
4.
5.
6
7
8
9
10 ‘Extremely satisfied’
X CANT SAY [ DO NOT READ OUT ]
Q5. What is the main reason for your dissatisfaction?
1. Issues with application
2. Wasn’t entitled to the certificate requested
3. Delay in receiving Certificate(s)
4. Errors on certificate(s) they received
5. Incorrect certificate(s) received
6. Incorrect number of certificates received
7. Confusion over payment (e.g. no record of payment received by BDM)
8. Further fee required
9. Incorrect payment deducted
10. Late registration of birth
11. Notice of intention to marry
12. Passport Office Australian Embassy
13. Proof of identity required
14. OTHER (Please specify)
Q6. Using a scale from 0 to 10, where 0 means you were ‘Extremely dissatisfied’ and 10 means you were ‘extremely
satisfied’, how satisfied were you with the overall resolution of your enquiry?
[CONFIRM: “So you were satisfied / dissatisfied”]
0. ‘Extremely dissatisfied’
1.
2.
3.
4.
5.
6
7
8
9
10 ‘Extremely satisfied’
X CANT SAY [DO NOT READ OUT]
2013 NSW Registry of Births Deaths and Marriages Customer Survey
48
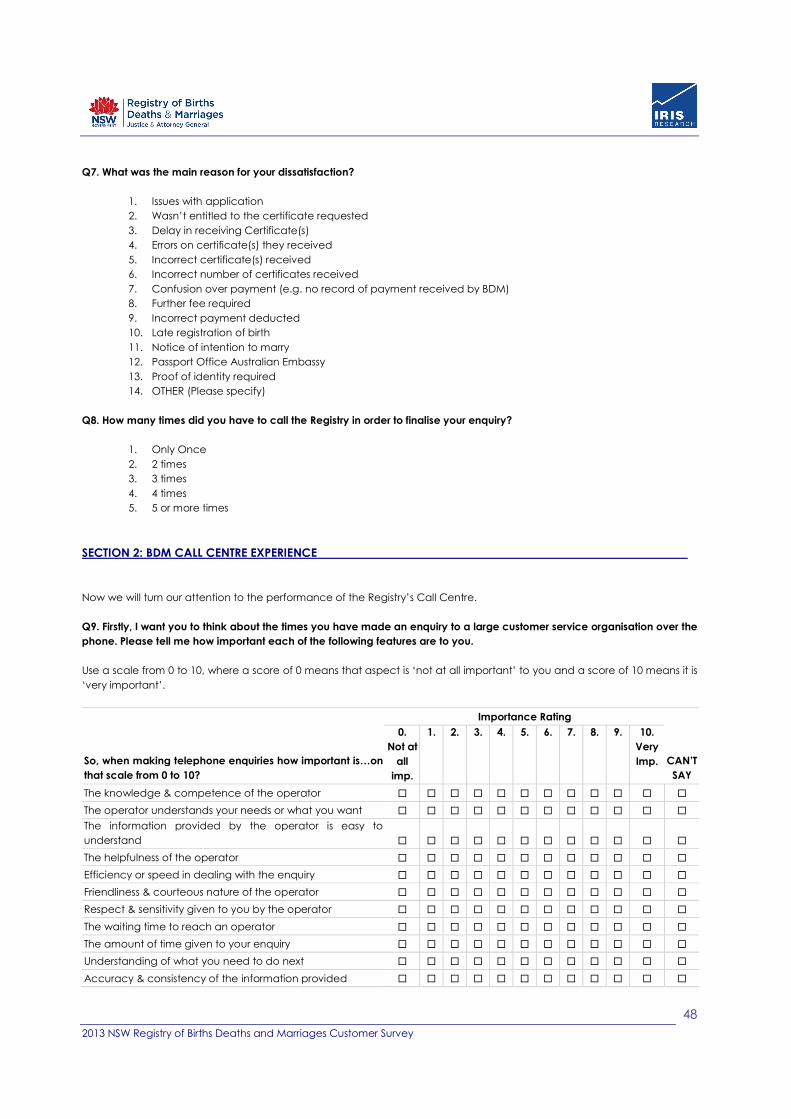
Q7. What was the main reason for your dissatisfaction?
1. Issues with application
2. Wasn’t entitled to the certificate requested
3. Delay in receiving Certificate(s)
4. Errors on certificate(s) they received
5. Incorrect certificate(s) received
6. Incorrect number of certificates received
7. Confusion over payment (e.g. no record of payment received by BDM)
8. Further fee required
9. Incorrect payment deducted
10. Late registration of birth
11. Notice of intention to marry
12. Passport Office Australian Embassy
13. Proof of identity required
14. OTHER (Please specify)
Q8. How many times did you have to call the Registry in order to finalise your enquiry?
1. Only Once
2. 2 times
3. 3 times
4. 4 times
5. 5 or more times
SECTION 2: BDM CALL CENTRE EXPERIENCE
Now we will turn our attention to the performance of the Registry’s Call Centre.
Q9. Firstly, I want you to think about the times you have made an enquiry to a large customer service organisation over the
phone. Please tell me how important each of the following features are to you.
Use a scale from 0 to 10, where a score of 0 means that aspect is ‘not at all important’ to you and a score of 10 means it is
‘very important’.
Importance Rating
So, when making telephone enquiries how important is…on
that scale from 0 to 10?
0.
Not at
all
imp.
1. 2. 3. 4. 5. 6. 7. 8. 9. 10.
Very
Imp. CAN’T
SAY
The knowledge & competence of the operator � � � � � � � � � � � �
The operator understands your needs or what you want � � � � � � � � � � � �
The information provided by the operator is easy to
understand � � � � � � � � � � � �
The helpfulness of the operator � � � � � � � � � � � �
Efficiency or speed in dealing with the enquiry � � � � � � � � � � � �
Friendliness & courteous nature of the operator � � � � � � � � � � � �
Respect & sensitivity given to you by the operator � � � � � � � � � � � �
The waiting time to reach an operator � � � � � � � � � � � �
The amount of time given to your enquiry � � � � � � � � � � � �
Understanding of what you need to do next � � � � � � � � � � � �
Accuracy & consistency of the information provided � � � � � � � � � � � �
2013 NSW Registry of Births Deaths and Marriages Customer Survey
49
PREAMBLE (FOR CUSTOMERS DISSATISFIED WITH OVERALL ENQUIRY OUTCOMES)
In this section of the survey we are interested in your satisfaction with the level of service you received from the operator
you talked to on the phone.
We understand that you may have issues with the registry regarding the resolution of your enquiry, however, we would like
you to put issues related to the outcome of your enquiry aside for the moment and FOCUS ONLY ON THE CUSTOMER
SERVICE YOU RECEIVED FROM THE CALL CENTRE OPERATOR.
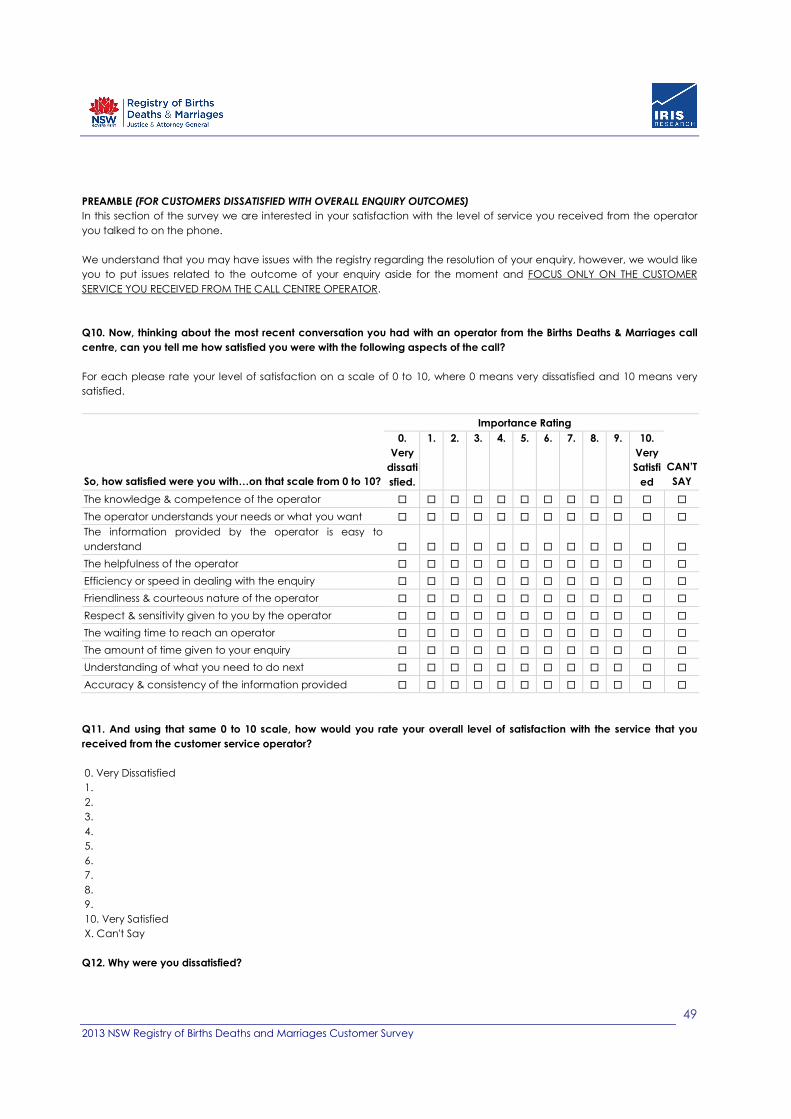
Q10. Now, thinking about the most recent conversation you had with an operator from the Births Deaths & Marriages call
centre, can you tell me how satisfied you were with the following aspects of the call?
For each please rate your level of satisfaction on a scale of 0 to 10, where 0 means very dissatisfied and 10 means very
satisfied.
Importance Rating
So, how satisfied were you with…on that scale from 0 to 10?
0.
Very
dissati
sfied.
1. 2. 3. 4. 5. 6. 7. 8. 9. 10.
Very
Satisfi
ed
CAN’T
SAY
The knowledge & competence of the operator � � � � � � � � � � � �
The operator understands your needs or what you want � � � � � � � � � � � �
The information provided by the operator is easy to
understand � � � � � � � � � � � �
The helpfulness of the operator � � � � � � � � � � � �
Efficiency or speed in dealing with the enquiry � � � � � � � � � � � �
Friendliness & courteous nature of the operator � � � � � � � � � � � �
Respect & sensitivity given to you by the operator � � � � � � � � � � � �
The waiting time to reach an operator � � � � � � � � � � � �
The amount of time given to your enquiry � � � � � � � � � � � �
Understanding of what you need to do next � � � � � � � � � � � �
Accuracy & consistency of the information provided � � � � � � � � � � � �
Q11. And using that same 0 to 10 scale, how would you rate your overall level of satisfaction with the service that you
received from the customer service operator?
0. Very Dissatisfied
1.
2.
3.
4.
5.
6.
7.
8.
9.
10. Very Satisfied
X. Can't Say
Q12. Why were you dissatisfied?
2013 NSW Registry of Births Deaths and Marriages Customer Survey
50
Q13. To what extent did the overall service that you received from the customer service operator meet your expectations?
Use a scale from 0 to 10, where 0 is ‘much worse than you expected’ and 10 is ‘much better than you expected’.
0. Much Worse than expected
1.
2.
3.
4.
5.About what expected
6.
7.
8.
9.
10.Much better than expected
X. CANT SAY
Q14. Why did you provide this rating?
Q15. Still thinking about the last enquiry you made to the Registry call centre, approximately how long were you on hold
for before you reached a customer service operator? [READ OUT OPTIONS]
1. I was never on hold
2. Less than 30 seconds
3. 30 seconds to a minute
4. 1 to 2 minutes
5. 2 to 3 minutes
6. 4 to 5 minutes
7. Longer than 5 minutes
8. Unsure/can't say
Q16. Would you recommend using the Registry’s Call Centre to others?
1. Yes
2. No
Q17. Why do you say that?
Q18. Did you know that the Registry has an office at the following locations?
1. Parramatta (y/n)
2. Wollongong (y/n)
3. Newcastle (y/n)
4. Chippendale (y/n)
5. Not aware of any (y/n)
2013 NSW Registry of Births Deaths and Marriages Customer Survey
51
Q19. Where did you find the phone number of the BDM call centre?
1. Used a search engine to find the number
2. Went directly to the BDM website
3. Another State Government website
4. Another website
5. Physical phone book (phone directory)
6. Other (please specify)
Q20. Are you aware that you can now apply for a non-urgent Birth, Death or Marriage Certificate at a number of Australia
Post Outlets?
1. Yes
2. No
Q21. Would you prefer to utilise this service rather than post your application or visit the registry personally?
1. Yes
2. No
SECTION 3: RESPONDENT CHARACTERISTICS
Q22. Which of following age groups do you fall into? (READ OUT AS NECESSARY)
1. 16 to 17 years
2. 18 to 24 years
3. 25 to 39 years
4. 40 to 54 years
5. 55 years plus
6. Refused
Q23. And from your voice I assume you are………..
1. Male
2. Female
3. Transgender
4. Refused
Q24. Are you Aboriginal or Torres Strait Islander?
1. Yes
2. No
Q25. Do you speak a language other than English at home?
1. Yes
2. No
Q26. Which language do you speak at home?
1. Arabic including Lebanese
2. Cantonese
3. Italian
2013 NSW Registry of Births Deaths and Marriages Customer Survey
52
4. Greek
5. Vietnamese
6. Mandarin
7. Spanish
8. Tagalog (Filipino)
9. Macedonian
10. Korean
11. Hindi
12. Croatian
13. German
14. Serbian
15. Turkish
16. Other (specify)
Q27. Can you provide me with the postcode of your residential address?
Q28. Do you consider yourself to be a person with special needs due to a disability?
1. Yes
2. No
3. Refused
Q29. What form of disability do you have?
1. Hearing
2. Visual
3. Physical
4. Intellectual
5. Psychiatric
6. NOT STATED
7. Other (specify)
Q30. What is your take home pay each week?
1. Between $100 and $200
2. Between $200 and $400
3. Between $400 and $600
4. Between $600 and $800
5. Between $800 and $1000
6. Over $1000
7. NOT STATED
8. NOT APPLICABLE – NO INCOME
CONCLUSION
That completes our interview. As this is social research it is carried out in compliance with the Federal Privacy Act. The
information you provided is confidential and only used for research purposes.
Again my name is ………… and my supervisor’s name is Judy. If you have any questions about the survey, you can call us
on 02- 42854446 between 9 and 5pm weekdays
Thank you for your co-operation.
2013 NSW Registry of Births Deaths and Marriages Customer Survey
53
APPENDIX 2
Margin of Error
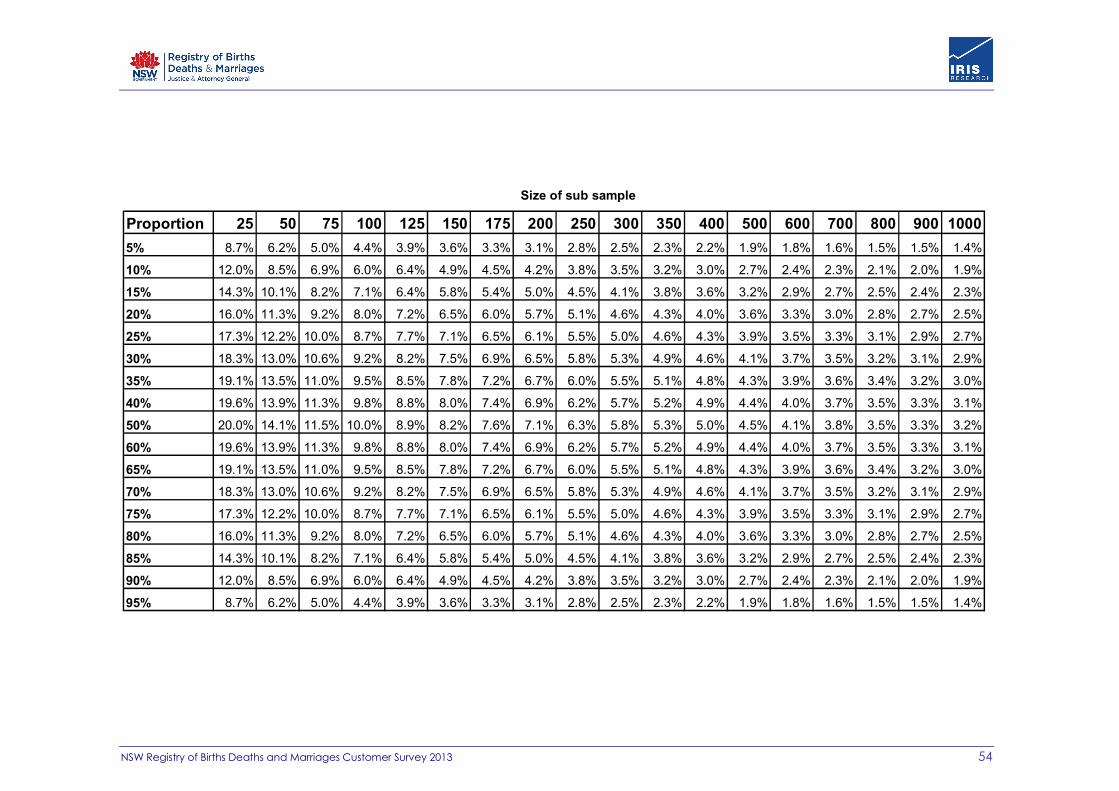
NSW Registry of Births Deaths and Marriages Customer Survey 2013 54
Size of sub sample
Proportion 25 50 75 100 125 150 175 200 250 300 350 400 500 600 700 800 900 1000
5% 8.7% 6.2% 5.0% 4.4% 3.9% 3.6% 3.3% 3.1% 2.8% 2.5% 2.3% 2.2% 1.9% 1.8% 1.6% 1.5% 1.5% 1.4%
10% 12.0% 8.5% 6.9% 6.0% 6.4% 4.9% 4.5% 4.2% 3.8% 3.5% 3.2% 3.0% 2.7% 2.4% 2.3% 2.1% 2.0% 1.9%
15% 14.3% 10.1% 8.2% 7.1% 6.4% 5.8% 5.4% 5.0% 4.5% 4.1% 3.8% 3.6% 3.2% 2.9% 2.7% 2.5% 2.4% 2.3%
20% 16.0% 11.3% 9.2% 8.0% 7.2% 6.5% 6.0% 5.7% 5.1% 4.6% 4.3% 4.0% 3.6% 3.3% 3.0% 2.8% 2.7% 2.5%
25% 17.3% 12.2% 10.0% 8.7% 7.7% 7.1% 6.5% 6.1% 5.5% 5.0% 4.6% 4.3% 3.9% 3.5% 3.3% 3.1% 2.9% 2.7%
30% 18.3% 13.0% 10.6% 9.2% 8.2% 7.5% 6.9% 6.5% 5.8% 5.3% 4.9% 4.6% 4.1% 3.7% 3.5% 3.2% 3.1% 2.9%
35% 19.1% 13.5% 11.0% 9.5% 8.5% 7.8% 7.2% 6.7% 6.0% 5.5% 5.1% 4.8% 4.3% 3.9% 3.6% 3.4% 3.2% 3.0%
40% 19.6% 13.9% 11.3% 9.8% 8.8% 8.0% 7.4% 6.9% 6.2% 5.7% 5.2% 4.9% 4.4% 4.0% 3.7% 3.5% 3.3% 3.1%
50% 20.0% 14.1% 11.5% 10.0% 8.9% 8.2% 7.6% 7.1% 6.3% 5.8% 5.3% 5.0% 4.5% 4.1% 3.8% 3.5% 3.3% 3.2%
60% 19.6% 13.9% 11.3% 9.8% 8.8% 8.0% 7.4% 6.9% 6.2% 5.7% 5.2% 4.9% 4.4% 4.0% 3.7% 3.5% 3.3% 3.1%
65% 19.1% 13.5% 11.0% 9.5% 8.5% 7.8% 7.2% 6.7% 6.0% 5.5% 5.1% 4.8% 4.3% 3.9% 3.6% 3.4% 3.2% 3.0%
70% 18.3% 13.0% 10.6% 9.2% 8.2% 7.5% 6.9% 6.5% 5.8% 5.3% 4.9% 4.6% 4.1% 3.7% 3.5% 3.2% 3.1% 2.9%
75% 17.3% 12.2% 10.0% 8.7% 7.7% 7.1% 6.5% 6.1% 5.5% 5.0% 4.6% 4.3% 3.9% 3.5% 3.3% 3.1% 2.9% 2.7%
80% 16.0% 11.3% 9.2% 8.0% 7.2% 6.5% 6.0% 5.7% 5.1% 4.6% 4.3% 4.0% 3.6% 3.3% 3.0% 2.8% 2.7% 2.5%
85% 14.3% 10.1% 8.2% 7.1% 6.4% 5.8% 5.4% 5.0% 4.5% 4.1% 3.8% 3.6% 3.2% 2.9% 2.7% 2.5% 2.4% 2.3%
90% 12.0% 8.5% 6.9% 6.0% 6.4% 4.9% 4.5% 4.2% 3.8% 3.5% 3.2% 3.0% 2.7% 2.4% 2.3% 2.1% 2.0% 1.9%
95% 8.7% 6.2% 5.0% 4.4% 3.9% 3.6% 3.3% 3.1% 2.8% 2.5% 2.3% 2.2% 1.9% 1.8% 1.6% 1.5% 1.5% 1.4%