2013 scm research journalscm.mit.edu/sites/default/files/2017-07/scm_research_journal_2013.pdf ·...
TRANSCRIPT

M I T C E N T E R F O R T R A N S P O R TAT I O N & LO G I S T I C S
http://scm.mit.edu/research June 2013
2013 SCM RESEARCH JOURNALSummaries of selected research projects by 2013 graduates of the MIT Master of Supply Chain Management ProgramIntroduction .......................................................................................................................................................2
Modeling the Tradeoff between Inventory and Capacity to Optimize Return on Assets ............................3 This research develops an approach to optimize the tradeoff between extra production capacity and pre-built inventory for an agricultural chemical company to meet highly seasonal customers’ demand. We use a multi-period, multi-stage, multi-product mixed integer linear optimization model to determine the combination of capacity and inventory which maximizes the net present value (NPV) of operating assets value add (OAVA) over a 10-year horizon.
Strategic Inventory Management of Externally Sourced Medical Devices ...................................................7This project determines appropriate inventory modeling approaches for externally sourced medical products. Reducing towering inventories in the overly cautious life sciences industry is a conundrum. The authors identify the key drivers of inventory, highlight gaps in the current inventory modeling approach, and recommend inventory targets through the use of a simulation model for slow movers and an appropriate safety stock formula for fast movers.
Calculating Humanitarian Response Capacity ..............................................................................................11This project uses a stochastic linear programming (LP) model to evaluate the capacity of the five United Nations Humanitar-ian Response Depots (UNHRDs) to respond to a single potential disaster: what expected percentage of people affected may receive emergency relief items and in what period of time? The model also recommends how to pre-position relief items throughout the depots to minimize the expected delivery time.
Measuring the Capacity of a Port System: A Case Study on a Southeast Asian Port .................................14By using a Southeast Asian multi-purpose port as a case study, this project enhances the investment decision-making pro-cess for port infrastructure. Two existing methodologies are successfully applied and modified, leading to the development of both an investment tool and a framework for selecting an optimal investment strategy to address capacity constraints within a port system.
A Simplified and Scalable Should-Cost Tool in the Oilfield Services Industry ............................................18This project explores ways to estimate a procured product’s price, or should-cost, to limit conflicts that arise between firms and their suppliers during price negotiations and to ensure a fair price. The procurement manager must maintain a delicate balance between pushing suppliers too much on pricing and maintaining a collaborative supply chain relationship. Most traditional costing techniques are expensive and time consuming. The tool we developed in our thesis uses aggregate industry data from the Census Bureau and our approach allows this simple data to be scaled to quickly estimate the should-cost of numerous products.
Outbound Transportation Collaboration: Do-It-Yourself (DIY) ...................................................................22Outbound transportation collaboration is the act of cross-company consolidation of shipments originated from and des-tined to a common area. It can reduce transportation cost depending on the level of synergies that exist between compa-nies’ supply chains. For companies who are interested in tackling collaboration on their own (DIY), this research outlines a methodology to identify partners, quantify the benefits and implement such collaborations. This methodology was applied to a set of six shippers as a case study.
Ethanol Supply Chain and Industry Overview: More Harm than Good? ....................................................26This research examines key aspects of ethanol, including its material characteristics, supply chain, and government legisla-tion, that affect its market demand and availability. In addition, it discusses the social and environmental impacts of the growing biofuel industry stemming from government mandates. The goal of the project was to investigate existing studies and evaluate the aggregated findings to determine if ethanol provides a net benefit to society.
XD1796_MITctl.indd 1 6/7/13 1:17 PM

- 2 - - 3 - - 2 - - 3 -
Welcome to the 2013 Master of Supply Chain Management (SCM) Research Journal.
The projects included in this journal were selected from the 21 projects submitted by the SCM Class of 2013 at the Massachusetts Institute of Technology. The articles are written as executive summaries of the master’s thesis and are intended for a business rather than an academic audience. The purpose of the executive summaries is to give the reader a sense of the business problems being addressed, the methods used to analyze the problem, the relevant results and insights gained.
The articles included in this publication cover a wide selection of interests, approaches, and industries. These projects were developed in partnership with companies ranging in size from startups to the largest companies in the world. They cover industries as diverse as medical supplies, fresh produce, consumer goods, railroads, and trucking. They also include humanitarian logistics (Zambia) and green supply chain issues (ethanol).
Each project is a joint effort between a sponsoring company, one or two students, and a faculty advisor. Companies who are members of CTL’s Supply Chain Exchange are eligible to submit their ideas for thesis projects in July and August, and then present these proposals to the students in early September. In mid-September, the students select which projects they will work on. From September until early May, the teams conduct research and write up the results. In late May, all of the sponsors, faculty, and students participate in Research Fest, where the thesis projects are presented.
The 10-month SCM program is designed for early- to mid-career professionals who want a more in-depth and focused education in supply chain management, transportation, and logistics. The class size each year is limited to 40 students from around the globe and across all industries. The master’s thesis project gives the students a hands-on opportunity to put into practice the learnings they receive in their coursework.
We hope you enjoy the articles. The rest of the master’s thesis projects are listed at the end of this journal. You can also view all of the executive summaries on the CTL website at: http://ctl.mit.edu/pubs. If you would like to learn more about the SCM Master’s Program or sponsoring a thesis, please contact us directly.
Happy reading!
Dr. Bruce ArntzenExecutive Director, MIT SCM [email protected]
By: Cindy (Hsin-ying) Wu and José Antonio González Duhart Muñoz de Cote
Thesis Advisor: Dr. Bruce Arntzen
Summary: In the agrochemical industry, balancing supply with extremely seasonal demand has been a struggle for most companies due to their capacity constraints. Stocking enough inventory ahead of the peak seasons and increasing the production capacity are two ways of resolving the issue. Our research examines an approach to achieve the optimal mix of production capacity and inventory for a company to meet customers’ demand at the highest net present value (NPV) of operating assets value add (OAVA). We use a multi-period, multi-stage, multi-product mixed integer linear op-timization model to determine the best combination of resources.
Introduction Modeling the Tradeoff between Inventory and Capacity to Optimize Return on Assets
XD1796_MITctl.indd 2 6/7/13 1:17 PM

- 2 - - 3 - - 2 - - 3 -
By: Cindy (Hsin-ying) Wu and José Antonio González Duhart Muñoz de Cote
Thesis Advisor: Dr. Bruce Arntzen
Summary: In the agrochemical industry, balancing supply with extremely seasonal demand has been a struggle for most companies due to their capacity constraints. Stocking enough inventory ahead of the peak seasons and increasing the production capacity are two ways of resolving the issue. Our research examines an approach to achieve the optimal mix of production capacity and inventory for a company to meet customers’ demand at the highest net present value (NPV) of operating assets value add (OAVA). We use a multi-period, multi-stage, multi-product mixed integer linear op-timization model to determine the best combination of resources.
Cindy Wu received an M.B.A in Technology and Innovation Management and a B.S. in Elec-trical Engineering. Prior to the SCM program, she worked as an engineering program manager in the PC industry for 6.5 years and had extensive experiences managing the ODMs in Asia.
José A González Duhart holds over 7 years of experience working with operations and business analytics across the fi-nancial services and consumer goods industries. Prior to the SCM program, José received a Sc.B. in Industrial Engineering and a Minor in Statistics.
Modeling the Tradeoff between Inventory and Capacity to Optimize Return on Assets
KEY INSIGHTS1. When several products compete for the same
production resources, priority should be given to the one with the highest ratio of value to process-ing time.
2. Having enough capacity to meet demand at all times could be financially counterproductive.
3. A capacity increase in a bottleneck resource across the production process might switch the bottleneck status to another resource. Manage-ment must keep an ongoing effort to continuous-ly find out constraints of their production process.
The ProblemWhen faced with an extreme seasonality in demand driv-en by the crops’ growing cycles, companies in the agro-chemical industry might accommodate such fluctuating demand by stocking inventory or increasing capacity. But either alternative comes at a cost. This research seeks to find out the optimal mix of production capacity and in-ventory for the company to meet customers’ demand at the highest net present value (NPV) of operating assets value add (OAVA) over the planning horizon. We aim to improve companies’ financial performance by both fulfill-ing demands in peak seasons and achieving the highest level of return on operating assets in the form of OAVA.
MethodologyWe analyzed the sponsoring company’s production pro-cess to understand the current configuration. Figure 1 shows the conceptual model of the production process.The production facility receives raw materials from dif-ferent vendors, which are initially processed at the pre-mixing and formulation tanks. Afterwards, the chemicals move into storage tanks before they can be packed in ei-ther bottles or drums. Each one of the stages briefly de-scribed has a different processing time and capacity. In order to evaluate the best possible configuration of the
XD1796_MITctl.indd 3 6/7/13 1:17 PM

- 4 - - 5 - - 4 - - 5 -
process, we first defined a metric of success that we could aim to optimize. Such a metric is the OAVA. The logic be-hind selecting the NPV of the OAVA as the ultimate metric of success is to model the return on operating assets in a linear way while still capturing the combined financial effects of revenues, costs, operating assets, and cost of capital. The outputs of the model are the detailed master production schedule as well as a suggested capacity man-agement.
Defining the ModelThe mathematical logic underneath the optimization model is expressed as follows:
Objective FunctionMaximize the NPV of OAVA over the 10-year planning ho-rizon. The OAVA is the revenues minus cost, or gross profit, minus the cost of capital times the average asset value. The components are broken down in the following way:
• Revenue is obtained as a markup of the production cost times the demand.
• Cost includes holding, manufacturing, outsourc-ing, overtime, and depreciation costs.
• Asset value includes capacity and inventory values. These refer to the average value of the equipment and the inventory during the planning horizon.
ConstraintsThe model is subject to the following set of constraints:
• The solution must meet demand for each period, combining resources in the most efficient way.
• Any stage in the production process can only pro-duce as much as is available from the previous stage.
• Each production stage has a specific capacity that cannot extend at regular cost.
• We cannot dispose of capacity once we chose to increase it at any point in time.
• Third-party manufacturers have a minimum and maximum quantity they are willing to outsource.
• Production and inventory can never be negative.• Optionally, we can force all variables to be integers.
Capacity Management Suggested by the ModelAs applicable to our sponsor company’s operations, there are three options to increase capacity: acquiring new as-sets, outsourcing, and overtime (OT).
Acquiring New AssetsPre-Mix & Formulation (PM&F), Storage, and Packaging (PCK) are the three stations that can acquire assets and upgrade capacity limits.
Since the investment in acquiring new assets increases the value of operating assets significantly, and the straight-line depreciation as an operational cost recurring from the first period of the asset acquisition further burdens the op-erating assets value add (OAVA), our model suggests ac-quiring new assets for all three expandable stations only after exhausting other capacity increase options such as outsourcing and overtime resources.
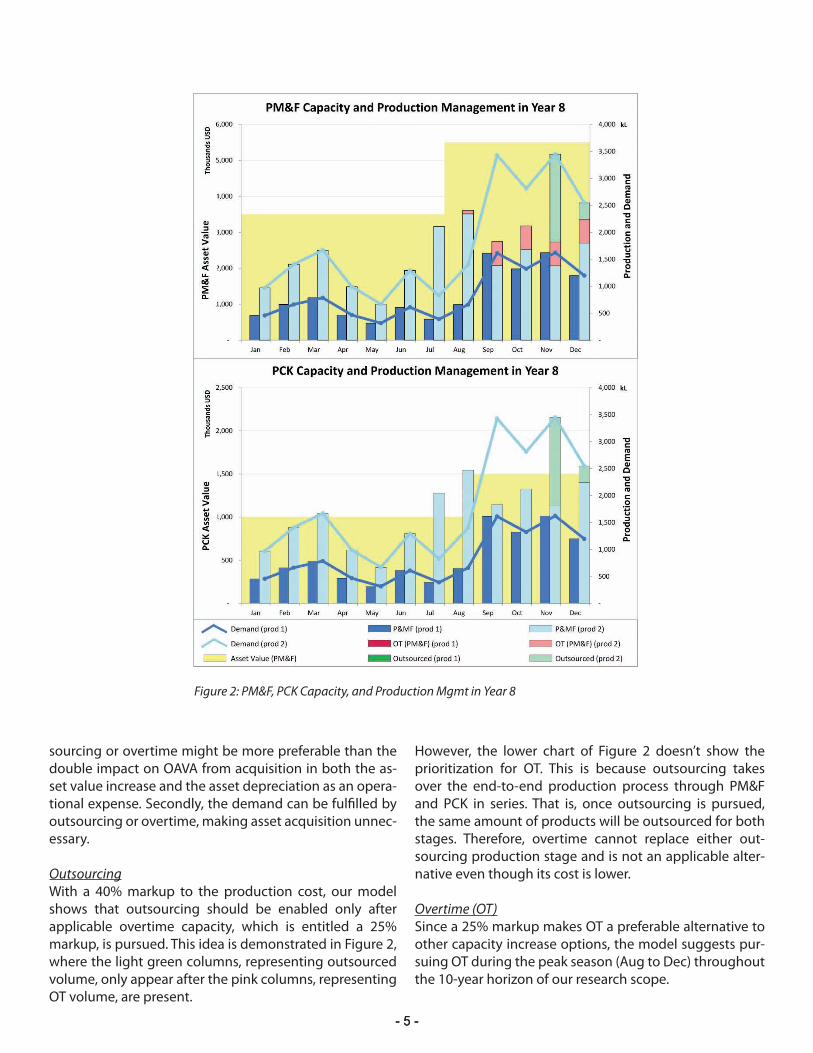
For example, before the first capacity upgrade for PM&F in the fifth year, there were at least five consecutive periods each year where utilization rate reaches 100% from Year 1 to Year 5. Similarly, in each year prior to the second capac-ity upgrade in the eighth year, utilization rate for the peak season reaches 100% and lasts for five consecutive peri-ods as well. The yellow shaded areas in Figure 2 illustrate the capacity upgrade timings in Year 8 for PM&F and PCK, respectively.
The reasons for such postponed asset acquisition might be two-fold. Firstly, the cost calculations from either out-
Figure 1: Conceptual Model of the Production Process
XD1796_MITctl.indd 4 6/7/13 1:17 PM
- 4 - - 5 - - 4 - - 5 -
Figure 2: PM&F, PCK Capacity, and Production Mgmt in Year 8
sourcing or overtime might be more preferable than the double impact on OAVA from acquisition in both the as-set value increase and the asset depreciation as an opera-tional expense. Secondly, the demand can be fulfilled by outsourcing or overtime, making asset acquisition unnec-essary.
OutsourcingWith a 40% markup to the production cost, our model shows that outsourcing should be enabled only after applicable overtime capacity, which is entitled a 25% markup, is pursued. This idea is demonstrated in Figure 2, where the light green columns, representing outsourced volume, only appear after the pink columns, representing OT volume, are present.
However, the lower chart of Figure 2 doesn’t show the prioritization for OT. This is because outsourcing takes over the end-to-end production process through PM&F and PCK in series. That is, once outsourcing is pursued, the same amount of products will be outsourced for both stages. Therefore, overtime cannot replace either out-sourcing production stage and is not an applicable alter-native even though its cost is lower.
Overtime (OT)Since a 25% markup makes OT a preferable alternative to other capacity increase options, the model suggests pur-suing OT during the peak season (Aug to Dec) throughout the 10-year horizon of our research scope.
XD1796_MITctl.indd 5 6/7/13 1:17 PM

- 6 - - 7 -
By Nichole L. Hillstrom and Renato A. Malabanan
Thesis Advisor: Dr. Bruce Arntzen
Summary: This project determines appropriate inventory modeling approaches for externally sourced medical prod-ucts. The authors identify the key drivers of inventory, highlight gaps in the current inventory modeling approach, and recommend inventory targets through the use of simulation or an appropriate safety stock formula.
Figure 3: Optimal Scenario vs. Maximum Utilization
Remarks on Asset UtilizationThe optimal solution did not employ more than 80% utili-zation for any stage of the production process. We devel-oped a second scenario in which the objective function aimed to maximize asset utilization, and constrained the model not to produce beyond the level of demand. Figure 3 summarizes the contrasts between these two approach-es.
In the maximum utilization scenario, the utilization rate is well above the optimal solution, and the total production cost (manufacturing, outsourcing, and overtime costs) islower than in the optimal solution. However, OAVAdrops significantly when compared to the optimalsolution, thus confirming that utilization alone cannotjudge the system’s performance as a whole.
Conclusions and Future ResearchThere are a variety of resource configurations that can help drive the corporate objective based on different demand patterns. Therefore, a strategized combination of these re-sources is critical in accomplishing the optimal net pres-ent value of OAVA. The master production schedule, the resulting inventory levels, and the recommended timings for external resources and asset acquisition serve to com-municate with stakeholders across different functional teams with potentially conflicting interests.
Our optimization model handles a simplified version of reality. Managers should not assume that the outcome of this simulation is a perfect predictor of the future and should further tweak the model to better assess the reality of their environment.
The problem addressed in this research is not restricted to the agrochemical industry. Rather, the insights can be applied across virtually every industry that deals with a similar problem.
XD1796_MITctl.indd 6 6/7/13 1:17 PM

- 6 - - 7 -
By Nichole L. Hillstrom and Renato A. Malabanan
Thesis Advisor: Dr. Bruce Arntzen
Summary: This project determines appropriate inventory modeling approaches for externally sourced medical prod-ucts. The authors identify the key drivers of inventory, highlight gaps in the current inventory modeling approach, and recommend inventory targets through the use of simulation or an appropriate safety stock formula.
KEY INSIGHTS1. Key drivers that influence inventory management
strategies and impact inventory values include product cost, demand, demand variability, lead time, lead time variability, safety factor, and re-view period.
2. Inventory targets for fast-moving products can be set through the use of an appropriate safety stock formula and inventory targets for slow-moving products can be set through the use of simulation models.
3. MedCo can reduce investments in inventory by setting inventory replenishments based on total inventory position rather than using inventory on hand.
4. Inventory levels can be optimized through the alignment of the safety factor and the service metric used to measure customer service perfor-mance.
Nichole L. Hillstrom received her bachelor degree in Indus-trial Engineering and Master of Business Administration from the University of Missouri. Prior to the MIT SCM Program, she worked as a Consultant at De-loitte. Upon graduation, she will return to Deloitte as a Se-nior Consultant.
Renato A. Malabanan received his bachelor degree in Civil En-gineering from the University of the Philippines and Master of Professional Studies in Sup-ply Chain Management from Pennsylvania State University. Prior to the MIT SCM Program, he worked as Planning Man-ager for Stemcell Technologies. Upon graduation, he will join Amazon as Senior Program Manager for Supply Chain Ex-ecution.
Strategic Inventory Management of Externally Sourced Medical Devices
IntroductionMedCo is the subsidiary of a global leader in the medi-cal device industry. They offer a wide range of products related to orthopedics, spinal care, sports medicine, and neuroscience therapies to sales representatives and medi-cal facilities. Due to the critical nature of the products to patient care, MedCo aims to maintain high customer ser-vice levels while keeping inventory investments low. This was the motivation for our research, which determines appropriate inventory management strategies for 137 ex-ternally sourced medical device products. To do this, we identified the key drivers of inventory and determined which of these parameters would enable MedCo to re-duce inventory levels while maintaining satisfactory cus-tomer service levels. During this process we also discov-ered that MedCo’s current inventory modeling approach did not include lead time variability; additional inventory buffers were built into the safety stock formula; target lev-els for inventory on hand included pipeline inventory; and safety stock was set based on one factor while customer service was measured against another.
XD1796_MITctl.indd 7 6/7/13 1:17 PM

- 8 - - 9 -
Analyzing the Inventory DriversTo determine appropriate inventory management strate-gies, an understanding of key inventory drivers is neces-sary. Inventory is composed of two components, cycle stock and safety stock. MedCo uses a periodic review in-ventory system, which means they check inventory levels on a consistent, scheduled basis and that the company places orders during these reviews. As a result, cycle stock is meant to cover the demand that occurs over a single review period and lead time. In addition, MedCo’s current safety stock calculation includes a safety factor, lead time, and demand variability. These variables, as well as others, drive the level of inventory MedCo must hold to achieve customer service targets: demand, demand variability, lead time, lead time variability, safety factor, and review period. Finally, product cost should be taken into account as it dictates the holding cost of inventory. In this research, we also explored the sensitivity of each driver and how it affects the inventory levels.
SKU SegmentationWe selected four inventory drivers to segment the prod-ucts in our scope. These drivers include: demand velocity, lead time, criticality, and cost, as depicted in Figure 1.
Figure 1: Inventory Drivers and Inventory Management Strategies
We determined low/high thresholds for each of these factors in order to segment products into groups. We deemed products with demand less than ten to be slow movers since a normal distribution did not apply to these parts. Conversely, we categorized products with demand greater than ten as fast movers. For slow movers, a simula-tion model was used, whereas the safety stock formula was used for fast movers, to determine target inventory levels. The segmentation also allowed us to identify the inven-tory drivers that could be leveraged to reduce inventories. For example, if a part was characterized as fast moving, then long lead time, low criticality, high cost, and collabo-ration with the supplier to reduce lead time would result in lower inventory levels, given that the supplier maintained the same quality standards. The largest results would be
achieved by identifying and working with the supplier of the most parts within this segment. Throughout this pro-cess, we also took into account substitutes and synergies. Substitutes allow for lower inventory levels and synergies occur when products are ordered together so both must be in stock for an order to be completely fulfilled.
Safety Stock for Fast MoversSafety stock mitigates both the variability in actual de-mand against the expected demand as well as the differ-ence between the observed and projected replenishment times. In a periodic review inventory model, similar to that implemented by MedCo, the safety stock can be calculat-ed using the formula below:
Where k is the safety factor; L represents the expected lead time; R, the review period; D is the expected demand; σD is the standard deviation of demand and σL is the stan-dard deviation of lead time.
Determining the impact of the key inventory drivers in the safety stock formula requires a sensitivity analysis of the parameters of the safety stock formula.
Simulation Model for Slow Moving PartsWe developed a simulation model that represents the characteristics of the inventory system at MedCo for the purpose of testing the effects and relationships of the vari-ous inventory drivers. In the simulation, the values of the probabilistic demand were randomly generated based on pre-determined demand distributions: Normal, Poisson, or user-defined entries. The outputs of the simulation are cycle service level and item fill rate. The controllable inputs are the mean and standard deviation of demand, lead time, safety stock, re-order point, minimum order quantity, and review period.
The inventory simulation model enabled simultaneous experimentation with different drivers. For each control-lable input, a random demand was generated and the re-sulting service levels were calculated. With the simulation model, inventory managers could explore the sensitivity of their decisions with respect to controllable parameter inputs.
In this research, the simulation model was primarily used for slow-moving parts; however, a similar model could be expanded and used for all parts to project the concur-rent effects of the critical drivers of inventory and assign the appropriate level of safety stock to match the target service levels.
XD1796_MITctl.indd 8 6/7/13 1:17 PM

- 8 - - 9 -
Inventory Position vs. Inventory On HandThe decision of whether or not to replenish should be governed by the total inventory position. Total inventory position is the sum of orders in transit and inventory on hand. Typically, companies take ownership of the prod-ucts upon delivery, as in the case of MedCo. Thus, Med-Co.’s average inventory on hand is the midpoint between the safety stock and demand over the review period plus safety stock. Similarly, MedCo’s inventory position is the sum of the inventory on hand and the pipeline inventory. MedCo currently sets a target for inventory position. How-ever, MedCo compares average inventory on hand to the target, resulting in higher inventory levels than necessary. Figure 2 illustrates the difference between inventory posi-tion and inventory on hand in a periodic review inventory model.
Customer Service Level and Item Fill RateMedCo sets safety stock using cycle service level (CSL) and measures customer service through line item fill rate. CSL is the ratio of replenishment cycles without a stockout to the total number of replenishment cycles over a pre-de-fined period. Item fill rate (IFR) is the ratio of satisfied cus-tomer demand to total demand over a pre-defined period. The customer service factor in the safety stock calculation should align with the metric used to measure customer service.
MedCo currently sets safety stock using CSL. This CSL translates into different IFRs since item fill rate is depen-dent on the average demand and standard deviation of the product. For example, one product has a desired CSL of 90% and an IFR of 96.3% and another product has a de-sired CSL of 90% and an IFR of 52%. This shows that for a given safety stock level, the IFR achieved will be higher or lower than the CSL, thus requiring the safety factor in the safety stock formula be aligned with the customer service metric used in the organization.
Figure 2: Inventory Position and Inventory On Hand in a Periodic Review Inventory System
XD1796_MITctl.indd 9 6/7/13 1:17 PM

- 10 - - 11 -
By Jian Wang and Kathryn K. Nishimura
Thesis Advisors: Dr. Jarrod Goentzel and Jason Acimovic
Summary: This project uses a stochastic linear programming (LP) model to evaluate the capacity of the five United Na-tions Humanitarian Response Depots (UNHRDs) to respond to a single potential disaster: what expected percentage of people affected may receive emergency relief items and in what period of time? The model also recommends how to pre-position relief items throughout the depots to minimize the expected delivery time.
Calculating Humanitarian Response Capacity
ConclusionWe identified several gaps in this inventory entitlement model. First, when calculating safety stock levels, lead time variability is not considered. Second, the management of slow-moving items is overly simplified to an arbitrary as-signment of safety stock without taking into account the effects of the lead time. Third, cycle stock is overstated for all products. Fourth, there are several layers of buffers in the safety stock formula which unnecessarily increase safety inventory. These gaps need to be addressed and appropriate inventory drivers analyzed in order to reduce inventory levels. A complete summary of improvement opportunities can be seen in Figure 3.
Figure 3: Summary of Recommendations
MedCo has the ability to set inventory levels more ap-propriately through the recalibration of the use of several supply chain concepts: inventory position against inven-tory on hand, the distinction between CSL and IFR, and the parameters of the safety stock formula. Moreover, MedCo can refine their current inventory entitlement model to address a number of deficiencies in the calcu-lation of safety stock. Furthermore, MedCo can segment the key characteristics of their products and employ a dif-ferent strategy for every identified product segment. In addition, MedCo can look at product substitutes and syn-ergy analysis to complement such segmentation. Finally, MedCo can use simulation models to validate the concur-rent effects of the different parameters to inventory and customer service levels.
XD1796_MITctl.indd 10 6/7/13 1:17 PM

- 10 - - 11 -
By Jian Wang and Kathryn K. Nishimura
Thesis Advisors: Dr. Jarrod Goentzel and Jason Acimovic
Summary: This project uses a stochastic linear programming (LP) model to evaluate the capacity of the five United Na-tions Humanitarian Response Depots (UNHRDs) to respond to a single potential disaster: what expected percentage of people affected may receive emergency relief items and in what period of time? The model also recommends how to pre-position relief items throughout the depots to minimize the expected delivery time.
Jian Wang received his bachelor degree in Tourism Management from Fundan University and his master degree in Business Ad-ministration from China Europe International Business School. Prior to joining the SCM pro-gram, he was the Customer Ser-vice Manager of Greater China in a Chile-based shipping com-pany.
Kathryn K. Nishimura received her bachelor degree in Market-ing and International Business from Georgetown University. Prior to joining the SCM pro-gram, she was a business devel-opment advisor in West Africa. Upon graduation, she will work as a supply chain manager for a large retailer in Texas.
Calculating Humanitarian Response Capacity
KEY INSIGHTS1. The depot in the Middle East is strategic as a pri-
mary warehouse to pre-position inventory, fol-lowed by the depot in Europe.
2. Although there is diminishing marginal returns after pre-positioning inventory to serve one mil-lion people, delivery time has incremental sav-ings until the depots stock 10 million units.
3. Depending on the commodity in the UNHRD net-work, the redistribution of stockpiles could save 8-23% off of delivery time.
IntroductionSince the year 2000, at least 300 disasters have occurred annually worldwide, catching more than 100 million peo-ple unprepared and in need of international assistance every year. In the event of an emergency, the UNHRDs deploy the pre-positioned relief items to meet the initial demand the emergency phrase of disaster response.
The purpose of our research is to assess how emergency relief items are currently stocked throughout the depot network. Partnering with MIT’s Humanitarian Response Lab, we established a humanitarian response measure that may aid the UN in reassessing its inventory strategy for disaster relief stockpiles. The measure calculates ex-pected service coverage and time to respond to a disaster.
Developing the ModelIn order to define this measure, we constructed an LP model with the objective of minimizing the average de-livery time to send pre-positioned relief items from the five UNHRDs to a potential disaster site. To populate the model, we collected the following datasets:
• Demand: EM-DAT is a recognized database that holds statistics on global disasters and people af-fected by them. We pulled information on 852 di-sasters from 2008-2012 as the possible scenarios
MedCo has the ability to set inventory levels more ap-propriately through the recalibration of the use of several supply chain concepts: inventory position against inven-tory on hand, the distinction between CSL and IFR, and the parameters of the safety stock formula. Moreover, MedCo can refine their current inventory entitlement model to address a number of deficiencies in the calcu-lation of safety stock. Furthermore, MedCo can segment the key characteristics of their products and employ a dif-ferent strategy for every identified product segment. In addition, MedCo can look at product substitutes and syn-ergy analysis to complement such segmentation. Finally, MedCo can use simulation models to validate the concur-rent effects of the different parameters to inventory and customer service levels.
XD1796_MITctl.indd 11 6/7/13 1:17 PM

- 12 - - 13 -
for future disasters, assuming that what happened in the recent past is likely to occur in the near fu-ture.
• Delivery Time: Using Google Maps, we identified the as-the-crow-flies geographical distances between each depot and sub-region in which a disaster took place. Assuming chartered planes fly at 500 mph, we converted the 115 distances into hourly times. These times represent each depot’s time to deliver items to a disaster site.
• Supply: From the UNHRD online stock report, we collected data on the inventory of items that were pre-positioned across at least three depots and could fulfill basic needs in emergency appeals. We converted each item’s inventory into the number of beneficiaries it could serve, thus defining the items’ capita inventory (CI), x.
From these inputs, we developed the following objective function:
Formula 1: Stochastic Objective Function
The formula minimizes the total amount of time to deploy x units of CI, given each depot’s initial inventory z, from each depot i to region j, for each of the k disaster scenarios that have a probability p of occurring. The model must send enough CI to meet each scenario’s demand, and each depot cannot send more items than it has pre-positioned. A dummy depot fulfills any unmet demand, albeit with a higher cost of delivery time.
Findings and InsightWe ran the model to assess the UNHRDs’ optimal and cur-rent response capacity, as shown in Figure 1. First, we an-alyzed how initial CI affected the allocation of inventory throughout the five depots.
To minimize delivery times to disasters, the model recom-mended that the depot in Dubai store all CI up to 8,600 units. When CI reaches 8,601 units; 10,348 units; 90,753 units; and 96,020 units, the depots in Brindisi, Subang, Panama, and Accra, respectively, begin to store one unit of CI. After 16 million units of CI are pre-positioned through-out the five depots, the depot in Subang receives any spill-over units.
Figure 1: Optimal Proportional Distribution of Cl
XD1796_MITctl.indd 12 6/7/13 1:17 PM

- 12 - - 13 -
Figure 2: Response Capacity as Cl Increases
Table 1: Response Capacity of 7 UNHRD Pre-Positioned Items
Given that initial CI is optimally placed within the depot network, we calculated what percentage of a disaster’s total affected population’s needs can be met and in what average time frame. Figure 2 shows the optimal response capacity results.
With over 2.5 million units of CI stockpiled, the UNHRDs can expect to serve about 90% of a disaster’s beneficiaries. Our analysis revealed that CI is subject to diminishing mar-ginal returns: as CI increases, its additional benefit—either in terms of reduced delivery time or increased percent of people served—is marginally less. Expected delivery times cannot fall below 3.8 hours.
Then, we calculated the response capacity of seven UNHRD stockpiled items. We calculated the response capacity of the actual (SQ) inventory of seven items as well as the re-sponse capacity if the items were ideally pre-positioned (OPT). We compared the SQ and OPT results in both cases to determine the misallocation of initial supplies, summa-rized in Table 1.
The pre-positioned items can serve between 7% and 41% of a potential disaster’s expected affected population. The proportional distribution of each item throughout the five depots varied because of different initial CI levels. For ex-ample, we recommend storing over 60% of blankets in Subang, while 20% of soap bars should be stored in the same depot. Overall, redistribution of these stockpiles could save the UNHRDs on average 1.2 hours in delivery time.
Moving Forward Humanitarian relief organizations of varying sizes may not want to emulate how the largest organizations pre-position their emergency relief supplies throughout their warehouses worldwide. Rather, organizations should con-
sider the amount of stockpiles and depots they have, and then develop an allocation policy that matches their initial capita inventory.
The goal of humanitarian relief organizations is to serve and satisfy the needs of every beneficiary affected by di-sasters. Preparedness through stockpiling is one facet of disaster response. By prioritizing delivery speed and ex-pected service coverage as the most important measure-ments of response capacity, we hope our research can assist the UNHRDs and other humanitarian relief organiza-tions with their inventory management initiatives.
XD1796_MITctl.indd 13 6/7/13 1:17 PM

- 14 - - 15 - - 14 -
By Jason Salminen
Thesis Advisors: Mr. James B. Rice Jr. and Dr. Ioannis N. Lagoudis
Summary: By using a Southeast Asian multi-purpose port as a case study, this project enhances the investment deci-sion-making process for port infrastructure. Two existing methodologies are successfully applied and modified, leading to the development of both an investment tool and a framework for selecting an optimal investment strategy to ad-dress capacity constraints within a port system.
Jason Salminen received an M.Sc. in Accounting and Finance from the London School of Economics and Political Science. As an undergraduate, he received a B.S. in Engineering Arts and a B.A. in Finance from Michigan State University. Prior to the SCM program, he worked as Assistant Vice President at DNB Bank ASA in the Shipping, Offshore and Logistics department. Upon graduation, he will continue his studies at the University of Oxford.
Measuring the Capacity of a Port System: A Case Study on a Southeast Asian Port
KEY INSIGHTS1. The proposed investment decision-making
framework can be effectively used to determine the optimal investment strategy for addressing a port system’s current and future capacity con-straints.
2. As demonstrated by its application to the multi-purpose case study port, the proposed frame-work for this project can be extended to compo-nents throughout a port system.
3. A flexible option often adds value, particularly the more uncertain a future outcome. However, a flexible investment strategy may not always be the best choice when compared with alternatives.
IntroductionThe global maritime network, consisting of tens of thou-sands of ships circumnavigating the world by sea and stra-tegically located ports across the globe, is an essential part of international trade as “90% of all trade travels by water” (U.S. Port and Inland Waterways Modernization, 2012). Ocean-bound cargo of all kinds originates from a nation for export and must pass through ports prior to reach-ing its destination. A port system (as shown in Figure 1) is a collection of components bridging land and sea that work together to handle the cargo, which arrives sea-side by vessel at anchorage, is transferred land-side to the port terminal at the port’s berths, and is eventually transported by intermodal links to the hinterland.
As economies develop and trade routes change, a port system’s capacity may need to expand to accommodate future cargo volume demand. However, investment in port infrastructure requires large amounts of capital (sometimes USD billions) and these investment decisions must be made when facing various uncertainties impact-ing performance over the long life of these assets.
The objective of this project is to enhance the investment decision-making process for port infrastructure through the application and modification of existing methodolo-gies and the development of both an investment tool and
a framework for selecting an optimal investment strategy to address capacity constraints within a port system. The motivation for this project is to 1) extend the application of the two existing methodologies used in the research, 2) evaluate potential investment strategies under uncer-tainty, and 3) both improve the profitability and increase the capacity of the case study port, which is located in Southeast Asia.
Identify Bottlenecks by Measuring CapacityFirst, the data analysis uses a modification of the existing methodology for the measurement of port capacity, re-cently developed by Dr. Ioannis Lagoudis at the Malaysia Institute for Supply Chain Innovation and Mr. James Rice Jr.
XD1796_MITctl.indd 14 6/7/13 1:17 PM

- 14 - - 15 - - 14 -
Figure 1: A Port System (Lagourdis & Rice, 2011)
a framework for selecting an optimal investment strategy to address capacity constraints within a port system. The motivation for this project is to 1) extend the application of the two existing methodologies used in the research, 2) evaluate potential investment strategies under uncer-tainty, and 3) both improve the profitability and increase the capacity of the case study port, which is located in Southeast Asia.
Identify Bottlenecks by Measuring CapacityFirst, the data analysis uses a modification of the existing methodology for the measurement of port capacity, re-cently developed by Dr. Ioannis Lagoudis at the Malaysia Institute for Supply Chain Innovation and Mr. James Rice Jr.
at the Massachusetts Institute of Technology (MIT). A uni-form approach for measuring capacity is applied at each component throughout the port system using two dimen-sions: static capacity, referring to the capacity at a point in time, and dynamic capacity, referring to capacity over a period of time. After applying the demand data to deter-mine utilization levels, this approach (as shown in Figure 2) allows for the identification of cargo flow bottlenecks at the port and for the implementation of efficiency im-provements, potentially through additional investment. Using this bottom-up screening model, the application of the methodology revealed seven current or potential bottlenecks among the 22 port components at the case study port.
Figure 2: An Example of Capacity Measurement for a Container Terminal
XD1796_MITctl.indd 15 6/7/13 1:17 PM

- 16 - - 17 -
Evaluate Strategies Under UncertaintySecond, the data analayis uses a modification of the ex-isting methodology for the evaluation of investment strategies under uncertainty developed by Dr. Richard de Neufville at MIT and Dr. Stefan Scholtes at the University of Cambridge. The methodology initially identifies three scenarios of uncertainty possibly impacting future per-formance of the case study port. A modified version of a simulation screening model is then developed, running Monte Carlo simulations to forecast the expected profit-ability of each port component under these uncertainties. The results are displayed graphically as cumulative distri-bution curves.
Based on the simulation results, which also confirm the findings under the port capacity measurement method-ology, the warehouse is selected as the constrained port component for which potential investment strategies are evaluated under uncertainty. Three potential investment strategies are selected: the warehouse in its current state, a new multi-level warehouse without flexibility for future expansion, and a new multi-level warehouse with flexibil-ity for future expansion. The profitability metrics highlight that the investment strategy for a new four-level ware-house with a flexible option is the optimal choice when compared with strategies of similar scale (i.e., number of levels). However, when the investment strategy for a four-level warehouse with a flexible option is compared with its best alternatives (i.e., comparable strategies, but not on the same scale), the optimal investment strategy is actu-ally for a non-flexible five-level warehouse, as shown in Table 1.
DiscussionBased on the research, both existing methodologies are successfully modified and applied to determine the op-timal investment strategy. The finding that a non-flexible investment strategy is the best choice does not contra-
Table 1: A Comparison of Investment Strategies
dict de Neufville and Scholtes’s assertion for flexibility in engineering design, as de Neufville and Scholtes indicate that investment strategies with flexible options can often, but not always, increase value compared with non-flexi-ble strategies under uncertainty (de Neufville & Scholtes, 2011). In addition, the results of the data analysis in this thesis are in line with the statement that “flexible designs often cost less than inflexible designs” (de Neufville & Scholtes, 2011).
Finally, a set of investment decision-making steps for port infrastructure are developed. Recommended refinements to the existing methodologies are also proposed.
ConclusionKey findings of the research are presented:
• The existing methodologies, when modified and combined to form an overarching framework as put forward in this thesis, can be successfully ap-plied at a multi-purpose port to develop a set of decision-making steps for identifying optimal port infrastructure investment strategies.
• The existing methodologies can be improved through recommended refinements.
Specific findings related to the case study port:
• The methodology for measuring port capacity re-vealed that seven of the 22 port components are current or potential bottlenecks.
• The simulation screening model narrows the focus on bottlenecks to the warehouse and the liquid bulk terminal. A bottleneck will occur at the liquid bulk terminal with a probability of approximately 40%, while a bottleneck will occur at the warehouse with a probability of over 95%. The warehouse is selected for further study.
XD1796_MITctl.indd 16 6/7/13 1:17 PM

- 16 - - 17 -
• Based on the analysis, the optimal investment strat-egy is the five-level non-flexible warehouse, out-performing a comparable four-level flexible ware-house by an expected net present value of USD 90 mill. and with better 10% and 90% value-at-risk results. However, the investor should also consider other relevant factors before making a final invest-ment decision.
• Based on an analysis of investment strategies built to the same scale initially (i.e., same number of lev-els), the investment strategy with the flexible op-tion is preferable to the investment strategy with-out flexibility. The flexible option is valued at USD 205 mill. with a cost of just USD 24 mill., equal to 5% of the initial capital expenditure. There is a 55% probability that the flexible warehouse strategy will be more profitable than the non-flexible ware-house strategy and a 45% probability that the the two strategies will result in similar profitability (i.e., greater upside and no additional downside risk).
Cited Sources
de Neufville, R., & Scholtes, S. (2011). Flexibility in Engineer-ing Design. Cambridge, Mass.: MIT Press.
Lagoudis, I., & Rice Jr., J. (2011). Revisiting port capacity: A practical method for investment and policy decisions. Un-published manuscript.
XD1796_MITctl.indd 17 6/7/13 1:17 PM

- 18 - - 19 -
By: Clayton M. Mealer and Sung Hwan Park
Thesis Advisor: Dr. Shardul Phadnis
Summary: As the recession and global competition threaten profitability, firms are increasingly turning to their pro-curement function of the supply chain to achieve significant cost reductions and maintain a competitive edge. When procuring unique, highly-engineered components, the price is often negotiated with suppliers. Our project explored ways to estimate a procured product’s price, or should-cost, to limit conflicts that arise between firms and their suppli-ers during price negotiations and to ensure a fair price. The procurement manager must maintain a delicate balance between pushing suppliers too much on pricing and maintaining a collaborative supply chain relationship. Most tra-ditional costing techniques are expensive and time consuming. The tool we developed in our thesis uses aggregate industry data from the Census Bureau and our approach allows this simple data to be scaled to quickly estimate the should-cost of numerous products.
Clayton Mealer came to the SCM program with six years of experience in operations and lo-gistics for the US Army. Follow-ing graduation, he will pursue his MBA at MIT’s Sloan School of Management.
Sung Hwan Park came to the SCM program with six years of work experience in the procure-ment function of an automotive company. Upon graduation, he will join Samsung Electronics in South Korea as a Manager.
A Simplified and Scalable Should-Cost Tool in the Oil-field Services Industry
KEY INSIGHTS1. Procurement professionals can estimate the
should-cost of many products simply by using ag-gregate, industry-wide data from the U.S. Census Bureau and Financial Ratio Benchmarks.
2. Scalability can be introduced by breaking down complex products into smaller and smaller sub parts as well as different manufacturing process-es for which Census Bureau and Financial Ratio information is available.
3. This should-cost process is attractive because other techniques for determining a product’s should-cost, such as manufacturing cost models, require a significant number of people and a tre-mendous amount of time.
IntroductionThird-party spend accounts for a significant amount of a business’s costs and it is often negotiated with suppliers during the procurement process. Due to the limited un-derstanding of the supplier’s true production cost, vari-ous techniques and models for determining how much a procured product should cost have been tried. One such approach is known as “should-cost modeling,” where esti-mates for the cost of a product or service are made based on product architecture and/or a firm’s financials. Both these approaches to should-cost modeling require exten-sive data collection and are time consuming. In our work, we expanded an approach that uses aggregate industry-specific financial data to develop a simple, scalable tool to estimate a product’s should-cost. One major challenge in building this tool was unifying the simple aggregate data available into an estimated price for a complex product. Our approach overcame this obstacle as we simplified a complex product, constructed our model, and created a ready-to-use tool.
MethodologyWe focused on a qualitative interview study to define our problem and develop a solution. Our initial research relied on descriptions from qualitative interviews to guide the development of our should-cost tool. This included iden-tifying the desired parameters for the model, determin-ing the expected output, and understanding the role this tool would play in the company’s procurement process. To build and validate our should-cost tool, we used four crite-ria to select our case product. The first was data availabil-ity – the company representative working directly with us had to be very familiar with this product and could use his expertise to answer our questions while building the tool. The second criterion for selection was representative-ness. The product had to represent common products (i.e. complexity), so it would likely be applicable to the bulk of the company’s purchased products. The third criterion was cost and volume. The product we chose for our case had to be of sufficient purchase volume and cost to be a good candidate. The fourth criterion was to select a case that we could feasibly use to construct a model, refine into a usable tool, and validate in a three-month time frame.
ProcessAfter researching various techniques for should-cost esti-mation, we developed a seven-step should-cost estima-tion process that could be applied to a wide variety of pro-cured products.
1. Identify the Sub Parts: This step is critical and relies on the knowledge and expertise of the procurement pro-fessional. The purchased product, or end item, must be separated into sub parts because the raw material (RM) for each sub part may differ and undergo sepa-rate manufacturing processes. There are generally three methods used for this step: blueprint & bill of materials (BOM) analysis, manufacturing process map investigation, or on-site manufacturing process inves-tigation. See Figure 1.
XD1796_MITctl.indd 18 6/7/13 1:17 PM

- 18 - - 19 -
MethodologyWe focused on a qualitative interview study to define our problem and develop a solution. Our initial research relied on descriptions from qualitative interviews to guide the development of our should-cost tool. This included iden-tifying the desired parameters for the model, determin-ing the expected output, and understanding the role this tool would play in the company’s procurement process. To build and validate our should-cost tool, we used four crite-ria to select our case product. The first was data availabil-ity – the company representative working directly with us had to be very familiar with this product and could use his expertise to answer our questions while building the tool. The second criterion for selection was representative-ness. The product had to represent common products (i.e. complexity), so it would likely be applicable to the bulk of the company’s purchased products. The third criterion was cost and volume. The product we chose for our case had to be of sufficient purchase volume and cost to be a good candidate. The fourth criterion was to select a case that we could feasibly use to construct a model, refine into a usable tool, and validate in a three-month time frame.
ProcessAfter researching various techniques for should-cost esti-mation, we developed a seven-step should-cost estima-tion process that could be applied to a wide variety of pro-cured products.
1. Identify the Sub Parts: This step is critical and relies on the knowledge and expertise of the procurement pro-fessional. The purchased product, or end item, must be separated into sub parts because the raw material (RM) for each sub part may differ and undergo sepa-rate manufacturing processes. There are generally three methods used for this step: blueprint & bill of materials (BOM) analysis, manufacturing process map investigation, or on-site manufacturing process inves-tigation. See Figure 1.
2. Identify the RM and Manufacturing Process(es): For ev-ery sub part, the primary RM and manufacturing pro-cesses must be determined. One of the three methods from the first step is also applied in this step: blueprint & BOM analysis, manufacturing process map investi-gation, or on-site manufacturing process investiga-tion.
3. Allocate NAICS Codes: To use aggregate industry-wide data from the U.S. Census Bureau and Financial Ratio Benchmarks, one must first allocate appropriate North American Industry Classification System (NAICS) codes to each of the major manufacturing processes identified in the second step. The NAICS code index is maintained on the U.S. Census Bureau website. The industry-wide aggregate data and the financial ratios are cataloged by six-digit NAICS code. In this step, it is imperative to assign the appropriate code to each manufacturing process.
4. Estimate Financial Ratios: For each NAICS code, find the aggregate industry-wide information on the U.S. Census Bureau and the Financial Benchmark Ratios (e.g. from a group like the Risk Management Associa-tion). Then estimate the financial ratios between the industry raw material cost and other costs. Other costs include additional material costs, direct labor cost, overhead cost, SG&A cost, and net profit.
5. Calculate RM Cost: For the RM cost calculation, the user must determine the standard material weight, standard material unit price, and material production defect rate information. Current RM price information is available online at sites such as the London Metal Exchange (LME).
RM Cost = (Standard Material Weight) * (Standard Material Unit Price) * (1 + Material Defect Rate)
Figure 1: Sub Part Breakdown
XD1796_MITctl.indd 19 6/7/13 1:18 PM

- 20 - - 21 -
6. Estimate Sub Part Should-Cost: At this point, each sub part’s should-cost can be estimated by using the RM cost and financial ratios from the previous steps. See Figure 2.
7. Calculate the Total Should-Cost: The overall product’s should-cost estimate is computed by simply adding all the sub parts’ should-cost values.
ResultsWe built our tool around a procured product called a fluid end. In conjunction with the procurement specialists from the sponsoring company, we designed the seven-step process and applied it to the fluid end.
The fluid end consisted of one sub part – a fluid end part body. The primary RM was SAE 4330, which is a Nickel-Chromium-Molybdenum alloy. The part undergoes two manufacturing processes to produce the final product: a casting process and a machining process. For the cast-ing process, we applied NAICS code 332111 – Iron & Steel Forging. For the casting process, we applied NAICS code 332710 – Machine Shops. By using the U.S. Census Bureau
data and RMA financial benchmarks for each NAICS code, we determined the appropriate financial ratios for the two NAICS codes.
The Standard Material Unit price was $ 0.8 / kg. In addition, the Standard Material Weight and the Material Defect Rate for the RM were 3,313 kg and 10%. Therefore, according to the equation in step five, the RM cost for the fluid end is estimated at $2,915.
We also introduced an additional factor to our tool to in-crease its flexibility. This factor compensates for costs the procurement team determines are not captured in the aggregate data. In this case, based on interviews with the sponsor company, we included an oversea transportation cost as an Other Relevant Cost since this is an unusual business activity in these NAICS industries. Using the concepts in step six, the sub part should-cost for the fluid end is $63,305. See Figure 3 for additional details. Of note, the should-cost estimate was 91% of the currently negotiated price of $68,000.
Figure 2: Sub Part Should-Cost Estimation
XD1796_MITctl.indd 20 6/7/13 1:18 PM

- 20 - - 21 -
data and RMA financial benchmarks for each NAICS code, we determined the appropriate financial ratios for the two NAICS codes.
The Standard Material Unit price was $ 0.8 / kg. In addition, the Standard Material Weight and the Material Defect Rate for the RM were 3,313 kg and 10%. Therefore, according to the equation in step five, the RM cost for the fluid end is estimated at $2,915.
We also introduced an additional factor to our tool to in-crease its flexibility. This factor compensates for costs the procurement team determines are not captured in the aggregate data. In this case, based on interviews with the sponsor company, we included an oversea transportation cost as an Other Relevant Cost since this is an unusual business activity in these NAICS industries. Using the concepts in step six, the sub part should-cost for the fluid end is $63,305. See Figure 3 for additional details. Of note, the should-cost estimate was 91% of the currently negotiated price of $68,000.
Figure 3: Fluid End Should-Cost Estimate
Conclusion We successfully constructed our should-cost tool using the aggregate, industry-specific financial data available. Breaking the procured end item into smaller and smaller sub parts effectively makes our tool scalable to a wide array of simple to complex products. The tool’s price es-timate for our validation case was within 10% of the ne-gotiated price. When the tool was evaluated by the spon-soring company’s sourcing and procurement team, they noted that the tool “was actually very good, good in the sense that it was usable and when [the Category Manag-er] plugged the numbers into the engine that Clayton and Sung had provided, it was very close to some of the stud-ies that he had done before.”
This tool allows procurement professionals to model prices quoted by suppliers and then assist in price nego-tiations. The should-cost tool, compared to other costing techniques, can decrease the time and effort devoted to should-costing while still achieving similar results. Of even greater potential is using this tool and should-cost con-cepts to create a high-level of trust and understanding between the supplier and purchasing company through a better understanding of the supplier’s production pro-cesses in relation to industry standards. This can serve as the start to a collaborative partnership with strategic goals that result in increased efficiencies and profit for both companies.
XD1796_MITctl.indd 21 6/7/13 1:18 PM

- 22 - - 23 -
By Homayoun Taherian
Thesis Advisor: Dr. Chris Caplice
Summary: Outbound transportation collaboration is the act of cross-company consolidation of shipments originated from and destined to a common area. It can reduce transportation cost depending on the level of synergies that exist between companies’ supply chains. For companies who are interested in tackling collaboration on their own (DIY), this research outlines a methodology to identify partners, quantify the benefits, and implement such collaborations. This methodology was applied to a set of six shippers as a case study.
Homayoun Taherian came to the SCM program with ten years of experience in manufacturing and logistics. In his latest role, he served as a senior supply chain consultant in a global third-party logistics provider (3PL). Following graduation, he will join Coyote Logistics in Chicago.
Outbound Transportation Collaboration: Do-It-Yourself (DIY)
KEY INSIGHTS1. Companies can benefit from outbound transpor-
tation collaboration even if they are in completely different industries.
2. Collaboration savings depend on several factors, two of the most important ones being the mix of shipments (less than truckload [LTL] vs. truckload [TL]) and line haul distances.
3. DIY transportation collaboration is being used with success but it adds overhead on the involved parties and is not scalable. Companies are con-sidering using third parties to facilitate collabo-ration. Third parties can streamline information sharing and removing the overheads involved for the shippers.
IntroductionHistorically, collaboration in the supply chain has gone through various stages. It started from interdepartmental coordination of activities within the company and then it evolved into collaboration with the customers and suppli-ers. Such collaborations always opened up new opportu-nities for efficiency gains that did not exist before. In the recent years, another form of collaboration is becoming popular which is called horizontal collaboration. This type of collaboration is between unrelated companies with the objective of taking advantage of supply chain synergies that may exist between them. Two major changes have motivated this movement: the constant increases in trans-portation costs, and the inefficiencies that exist in over the road (OTR) transportation.
Outbound transportation collaboration is a subset of hori-zontal collaboration, which focuses on consolidation of shipments originating from and destined to the same ar-eas. Larger shipment sizes typically result in lower cost per unit (Figure 1). Transportation collaboration can be done actively (planned) or passively (opportunistic) by the com-panies themselves (DIY) or using a 3PL.
XD1796_MITctl.indd 22 6/7/13 1:18 PM

- 22 - - 23 -
By Homayoun Taherian
Thesis Advisor: Dr. Chris Caplice
Summary: Outbound transportation collaboration is the act of cross-company consolidation of shipments originated from and destined to a common area. It can reduce transportation cost depending on the level of synergies that exist between companies’ supply chains. For companies who are interested in tackling collaboration on their own (DIY), this research outlines a methodology to identify partners, quantify the benefits, and implement such collaborations. This methodology was applied to a set of six shippers as a case study.
Homayoun Taherian came to the SCM program with ten years of experience in manufacturing and logistics. In his latest role, he served as a senior supply chain consultant in a global third-party logistics provider (3PL). Following graduation, he will join Coyote Logistics in Chicago.
Outbound Transportation Collaboration: Do-It-Yourself (DIY)
IntroductionHistorically, collaboration in the supply chain has gone through various stages. It started from interdepartmental coordination of activities within the company and then it evolved into collaboration with the customers and suppli-ers. Such collaborations always opened up new opportu-nities for efficiency gains that did not exist before. In the recent years, another form of collaboration is becoming popular which is called horizontal collaboration. This type of collaboration is between unrelated companies with the objective of taking advantage of supply chain synergies that may exist between them. Two major changes have motivated this movement: the constant increases in trans-portation costs, and the inefficiencies that exist in over the road (OTR) transportation.
Outbound transportation collaboration is a subset of hori-zontal collaboration, which focuses on consolidation of shipments originating from and destined to the same ar-eas. Larger shipment sizes typically result in lower cost per unit (Figure 1). Transportation collaboration can be done actively (planned) or passively (opportunistic) by the com-panies themselves (DIY) or using a 3PL.
final customer locations. In pool point distribution, the costs involved are: origin pickup stop-off charges, TL line haul charges, and destination local delivery charges via LTL. In pool point analysis it is important to consider the impact on service levels due to the potential delays to cre-ate consolidation.
MSTL is combining several large LTLs into a TL or consoli-dating LTLs on existing TLs with available capacity. The costs involved in MSTL are origin pickup stop-off charges, line haul charges, destination stop off charges, and out-of-route-miles charges.
Step 3: ImplementationAssuming companies find savings, they need to take a se-ries of actions in order to materialize those. I performed interviews with eight companies (different group from the thesis partners) who are already engaged in DIY collabora-tion and shared their collaboration models for interested companies who are starting down this path.
Case StudyI applied the above methodology to a group of six com-panies (referred to as companies A through F) located in the Midwest region of the US. The companies’ shipping origins were located in a 10 mile radius area. They manu-facture consumer goods, chemicals, electronics, construc-tion, and agricultural machineries. In the year 2011, the six companies shipped 1.5 trillion lbs (300,000 shipments) originated and destined within the US.
Companies A to D are mainly LTL shippers. Company E is mainly a TL shipper and company F is mainly a small parcel shipper.
Step 1: Collaboration QualificationThere were no hard constraints that would have prevent-ed the companies from collaboration. More specifically, all companies shipped palletized products via regular dry vans through traditional modes of road transportation (small parcel, LTL, and TL).
The companies were evaluated against each other for the soft constraints such as shipment size and frequency, competitive considerations, private vs. common carriers etc. Some of the soft constraints, such as company culture compatibility, required direct conversations between the parties involved and was out of the scope of this thesis.
Figure 2 shows the weight shipped to the destinations for each company. The size of the bubbles represents the weight shipped to the locations. Wherever the points overlap is a sign of opportunity for collaboration.
Figure 1: Unit Transportation Cost vs. Shipment Size
The focus and scope of this research is on the passive DIY collaboration. I have defined a practical three-step ap-proach to first qualify collaboration partners, second to quantify the potential savings of collaboration, and third to implement, if such a relationship makes sense. I applied these steps as a case study for a set of six shippers in the Midwest of the US.
MethodologyThere are three steps in establishing outbound transpor-tation collaboration among companies.
Step 1: Collaboration QualificationBefore spending too much effort in such a relationship, it would be helpful to see if the companies are compatible from various perspectives. There are hard and soft con-straints that should be evaluated before getting too deep into collaboration conversations.
Hard constraints are factors that stop collaboration in its heels such as product compatibility (food vs. chemicals), shipping vehicle commonality (dry van vs. flatbed), etc.
Soft constraints are factors that can be overcome with enough will and investment such as competitive consid-erations, organizational cultural differences, etc.
Step 2: Savings AnalysisThe next step is to quantify the potential savings through collaboration. The savings will occur through shipment consolidation. I used two main forms of consolidation analysis, which were pool point distribution and multi-stop truckload (MSTL) .
Pool point distribution, also known as hub and spoke dis-tribution, involves the consolidation of several LTL ship-ments at the origin on a TL and handing those off to an LTL carrier at the destination region to be delivered to the
XD1796_MITctl.indd 23 6/7/13 1:18 PM

- 24 - - 25 -
Step 2: Savings AnalysisThe savings for the six companies were quantified using two main approaches: pool points and multi-stop truck-loads (MSTL). Both studies were performed on 20 regions with a high density of TL and LTL shipments. Examples were San Francisco (SF), LA, NY, etc. Both analyses revealed that two of the companies (A and F) do not have much synergy with the other four. In fact, the two companies only contributed to less than 10% of the total potential savings.
Pool Point Analysis: The pool point analysis on the 20 re-gions revealed that only three locations (LA, SF, and NY) will result in savings without incurring long shipment delays. The savings were estimated at $250,000 annually, which is equivalent to 8% of the LTL spending for these three locations. For each pool point region, I calculated the TL weight breakeven point at which using the pool point option would result in savings. The average break-even point for the three aforementioned locations was 32,000 lbs on a TL.
In order for pool points to be a practical option, there should be a high frequency of LTL shipments to a dense shipping area. This will enable the creation of highly uti-lized TLs that ship frequently to the pool point region without jeopardizing customer delivery dates.
Companies B, C and D (all LTL shippers) were the main beneficiaries of pool points, accounting for 90% of the savings.
MSTL Analysis: The MSTL analysis on the same 20 regions showed that there is a possibility to save $750,000 annu-ally. The savings were calculated based on the assumption that a maximum of three LTLs can be consolidated on a TL. Contrariwise to pool points, MSTLs don’t have the issue of shipment delays (assuming all pickup and deliveries are performed without any hiccups).
Similar to the pool point scenario, the MSTL savings were allocated to the companies based on their weight of the shipments consolidated on the TLs. In the MSTL scenario, three companies (C, D, and E) will share 90% of the savings. Company E (mainly a TL shipper) is the largest beneficiary with 39% of the savings. Without company E in the com-munity, the MSTL savings would be significantly lower.
The potential collaboration savings from pool points and MSTLs is dependent on several factors such as the mix of shipments in the community, current carrier contracts, etc. One of the factors that is highly correlated with the con-solidation savings is the line haul distance. As we can see in Figure 3, the longer the line hauls, the higher the poten-tial savings through consolidation.
Figure 2: 2011 Weight Shipped to Destination Points
XD1796_MITctl.indd 24 6/7/13 1:18 PM

- 24 - - 25 -
Step 3: ImplementationStep three of the methodology focuses on implementing the DIY transportation collaboration and is being investi-gated by the research participants at this moment.
ConclusionOutbound transportation collaboration is a new area of opportunity that could make paradigmatic changes in the supply chain industry in the next few years. This research highlights that there are savings that could be achieved through collaboration between companies who, from a traditional perspective, have nothing in common.
Transportation collaboration, if successful, should result in shipment consolidation. The size of the opportunities depends heavily on the shipment characteristics of the companies involved and the level of synergies that exist in their supply chains.
Figure 3: Pool Point & MSTL Savings vs. Line Haul Distance
XD1796_MITctl.indd 25 6/7/13 1:18 PM
- 26 - - 27 -
By Sarah L. Bruce
Thesis Advisors: Dr. Edgar Blanco and Dr. Alexis Hickman Bateman
Summary: This research examines key aspects of ethanol including its material characteristics, supply chain, and gov-ernment legislation that affect its market demand and availability. In addition, it discusses the social and environmental impacts of the growing biofuel industry stemming from government mandates. The goal of the project was to inves-tigate existing studies and evaluate the aggregated findings to determine if ethanol provides a net benefit to society.
Sarah Bruce has taken a position as Global Supplier Manager with Schlumberger. Prior to MIT’s SCM Program she was a Peace Corps Volunteer in Queretaro, Mexico and before that a Product Manager in the Outdoor Industry developing water filters. She earned a BS in Mechanical Engineering at the Uni-versity of Washington.
Ethanol Supply Chain and Industry Overview: More Harm than Good?
KEY INSIGHTS1. The environmental impact of ethanol is not al-
ways better than gasoline. The lifecycle analysis of ethanol, which includes feedstocks, land-use im-pacts, and transportation logistics, should all be taken into account before making broad claims because of the significant variability they can have on ethanol’s environmental impact.
2. There remain challenges in the ethanol supply chain that continue to hinder ethanol from be-coming viable on a large scale including trans-port, service stations, and vehicle compatibility.
3. Customer demand is uncertain due to ethanol’s reduction in fuel economy.
4. Tomorrow’s energy solutions will include ethanol, but to minimize its negative impacts, investors and policy makers must take into consideration its global effects.
IntroductionAs the world’s energy industry has evolved rapidly over the last decade and in order to meet existing energy chal-lenges, it has become increasingly important to diversify national energy portfolios. Some of the factors influencing energy evolution are: a global focus on the regulation for the reduction of Greenhouse Gas (GHG) emissions in or-der to help control global climate change; traditional fuel sources becoming more expensive to extract and refine; and instability in regions that currently provide much of the world’s oil. Arguably, an important part of a country’s successful energy strategy includes (or will include) bio-fuels in order to reduce the risk of energy shortages and decrease environmental impacts.
As a result of these issues, the biofuel industry has made significant strides that have demonstrated biofuels can be a viable alternative to fossil fuels. The U.S. Energy In-dependence and Security Act (EISA) of 2007 mandated production of biofuels as a way to decrease our impact on the environment from the production of CO2 and other Greenhouse Gases (GHG) as well in the interest of national security.
XD1796_MITctl.indd 26 6/7/13 1:18 PM
- 26 - - 27 -
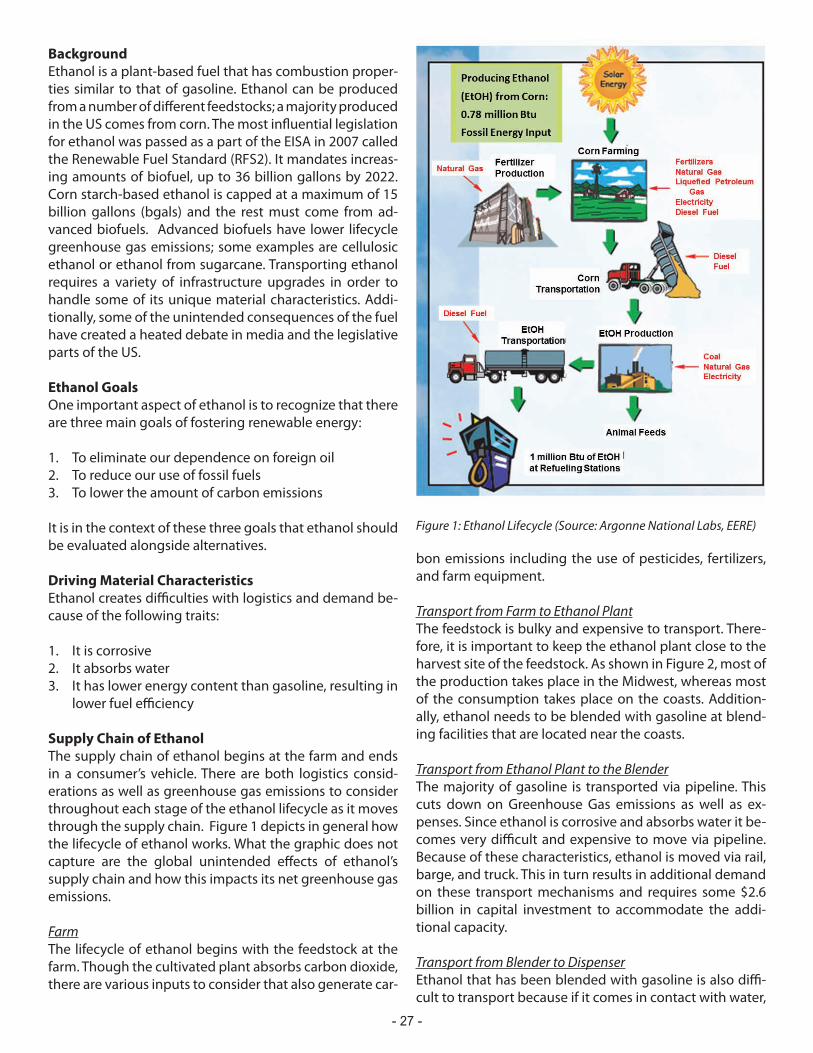
Background Ethanol is a plant-based fuel that has combustion proper-ties similar to that of gasoline. Ethanol can be produced from a number of different feedstocks; a majority produced in the US comes from corn. The most influential legislation for ethanol was passed as a part of the EISA in 2007 called the Renewable Fuel Standard (RFS2). It mandates increas-ing amounts of biofuel, up to 36 billion gallons by 2022. Corn starch-based ethanol is capped at a maximum of 15 billion gallons (bgals) and the rest must come from ad-vanced biofuels. Advanced biofuels have lower lifecycle greenhouse gas emissions; some examples are cellulosic ethanol or ethanol from sugarcane. Transporting ethanol requires a variety of infrastructure upgrades in order to handle some of its unique material characteristics. Addi-tionally, some of the unintended consequences of the fuel have created a heated debate in media and the legislative parts of the US.
Ethanol GoalsOne important aspect of ethanol is to recognize that there are three main goals of fostering renewable energy:
1. To eliminate our dependence on foreign oil 2. To reduce our use of fossil fuels3. To lower the amount of carbon emissions
It is in the context of these three goals that ethanol should be evaluated alongside alternatives.
Driving Material CharacteristicsEthanol creates difficulties with logistics and demand be-cause of the following traits:
1. It is corrosive2. It absorbs water3. It has lower energy content than gasoline, resulting in
lower fuel efficiency
Supply Chain of EthanolThe supply chain of ethanol begins at the farm and ends in a consumer’s vehicle. There are both logistics consid-erations as well as greenhouse gas emissions to consider throughout each stage of the ethanol lifecycle as it moves through the supply chain. Figure 1 depicts in general how the lifecycle of ethanol works. What the graphic does not capture are the global unintended effects of ethanol’s supply chain and how this impacts its net greenhouse gas emissions.
FarmThe lifecycle of ethanol begins with the feedstock at the farm. Though the cultivated plant absorbs carbon dioxide, there are various inputs to consider that also generate car-
bon emissions including the use of pesticides, fertilizers, and farm equipment.
Transport from Farm to Ethanol PlantThe feedstock is bulky and expensive to transport. There-fore, it is important to keep the ethanol plant close to the harvest site of the feedstock. As shown in Figure 2, most of the production takes place in the Midwest, whereas most of the consumption takes place on the coasts. Addition-ally, ethanol needs to be blended with gasoline at blend-ing facilities that are located near the coasts.
Transport from Ethanol Plant to the BlenderThe majority of gasoline is transported via pipeline. This cuts down on Greenhouse Gas emissions as well as ex-penses. Since ethanol is corrosive and absorbs water it be-comes very difficult and expensive to move via pipeline. Because of these characteristics, ethanol is moved via rail, barge, and truck. This in turn results in additional demand on these transport mechanisms and requires some $2.6 billion in capital investment to accommodate the addi-tional capacity.
Transport from Blender to DispenserEthanol that has been blended with gasoline is also diffi-cult to transport because if it comes in contact with water,
Figure 1: Ethanol Lifecycle (Source: Argonne National Labs, EERE)
XD1796_MITctl.indd 27 6/7/13 1:18 PM

- 28 - - 29 -
the ethanol will come out of suspension. So the gasoline-ethanol blends also need to be transported mostly via rail or truck. Refueling stations also need to upgrade their storage and dispensing components to ensure that they are compatible. This is on the order of an additional $1.6 billion USD just to convert 10% of today’s gasoline sta-tions.
ConsumptionThere are 8 million Flex Fuel Vehicles on the road today. Vehicles manufactured after 2001 were approved by the EPA to accept up to E15. The majority of vehicles cannot accept higher blends of ethanol. Additionally, with etha-nol’s lower energy content, which results in reduced fuel economy, ethanol retailers have seen a plateau in demand for E85. It is possible to retrofit non-compatible vehicles for approximately $1300, which can help boost demand if ethanol prices become competitive with gasoline.
Unintended Impacts of Ethanol
Food versus FuelCritics blame ethanol for causing a rise in demand for corn, resulting in a rise in corn prices. Corn for direct human con-sumption is “sweet corn” and only about 10% of the crop. The rest is used for ethanol and feedstock feed. Forty per-
cent of the corn crop in 2012 went to ethanol. A byproduct of ethanol can be used as livestock feed, so 48% of crops goes directly and indirectly to livestock feed. Most studies still indicate that there is some increase in food prices from the demand for biofuels.
Indirect and Direct Land Use ChangeLand use change, an effect of biofuel mandates, is the con-version of more land to cultivation. Because the ethanol feedstock footprint is growing, it leaves less land for con-servation, development, and other purposes. The fear is that land scarcity will start to convert land better suited for carbon sequestration instead used for ethanol. This will offset the benefits from ethanol or other biofuels. How-ever, corn yields have been improving over the decades, as shown in Figure 3.
Increased Economic Activity of Rural AreasIncreases in crop prices actually benefit farmers in rural areas. The US Farm sector grew 27% in 2010 and another 20% in 2011. Farm income has reached the 3rd highest level in 50 years. Supporting rural communities is an im-portant part of domestic security.
Figure 2: Ethanol Production and Distribution Areas (Source: GAO 2011)
ConclusionThe key takeaway is that in order for ethanol to become successful, the full impact of its supply chain must be con-sidered along with its unintended effects. However, when combined with improved energy conservation, continued research, and development to improve ethanol’s carbon footprint, it could provide some help to reduce the envi-ronmental impact of our energy needs. Ethanol also can provide other benefits such as energy independence, re-duced fossil fuel consumptionm, and rural economic stim-ulation. Corn starch-based ethanol can provide a step-ping stone to cellulosic ethanol. However, it can also be mismanaged, and misguided legislation can help create a larger problem if it does not take into account to both industries.
XD1796_MITctl.indd 28 6/7/13 1:18 PM

- 28 - - 29 -
Figure 3: US Corn Yields from 1930 to 2010 (Source: Congressional Research Service 2013)
ConclusionThe key takeaway is that in order for ethanol to become successful, the full impact of its supply chain must be con-sidered along with its unintended effects. However, when combined with improved energy conservation, continued research, and development to improve ethanol’s carbon footprint, it could provide some help to reduce the envi-ronmental impact of our energy needs. Ethanol also can provide other benefits such as energy independence, re-duced fossil fuel consumptionm, and rural economic stim-ulation. Corn starch-based ethanol can provide a step-ping stone to cellulosic ethanol. However, it can also be mismanaged, and misguided legislation can help create a larger problem if it does not take into account to both industries.
XD1796_MITctl.indd 29 6/7/13 1:18 PM

Complete List of 2013 SCM Thesis ProjectsUsing Big Data for Decisions in an Agricultural Supply Chain by Satya Prakash Dhavala and Derik Lafayette SmithThis project explores whether the readily available data in agriculture, published by various sources such as USDA, uni-versities, and weather stations, can be used in conjunction with the manufacturer’s private data to better forecast the demand for agricultural products (chemicals). We analyzed certain variables such as corn price, acres harvested, etc., using three regression models to quantify their significance in predicting demand over various time and geographical horizons. We found out that corn price and fertilizer price are significant in predicting annual demand.
Communicating Optimization Results by William Drake Bailey and Daniel SkemptonThis project explores the dynamic between experts and users of complicated optimization models that are used in plan-ning global supply chains. After conducting a comprehensive literature review on optimization modeling, communi-cation methods, and data visualization, we surveyed a group of solver application users from our sponsor company to determine where best to focus our recommendations. The survey results led us to build our conclusions around ways to improve user training and interface design to improve communication through better understanding of the optimiza-tion tool.
Supply Chain Network Optimization: Low Volume Industrial Chemical Product by Li Jin and Fredrick Omondi DachaThis research project studies the global supply chain network flow of a low-volume, low-margin industrial chemical product. It presents a network optimization model to minimize the total cost-to-serve (C2S). It also includes three sce-narios to compare C2S when supply capacity shifts.
Driving Agile High-Performance Aerospace and Defense Support Supply Chains by Mina Diaa RiwesThis research project analyzes the current state of a typical Aerospace and Defense (A&D) support supply chain and en-visions a desired state with better integration. Finally the research proposes the “+Add Model” as an easy-to-understand and deployable roadmap to bridge the gap. The “+Add” Model stands for Aggregate Dynamic Derivatives. The model identifies a path to improve forecast accuracy, reduce lead times, and maximize aggregation value, which in turn drive higher earnings.
How Should Indicators be Found for Scenario Monitoring by Zheng HeA systematic approach including seven steps to build indicators for scenario monitoring was developed. Factor analysis was used to assign weights to individual indicators. And then individual indicators were aggregated linearly to build a composite indicator. Next, the composite indicators were used to assess the changes in the driving forces so as to infer which scenario was likely to come to pass. A set of four scenarios was analyzed. The result showed that the environment in the selected year is more like a “Collaborative World.”
A Decision Support Model for Staffing Supply Chain Planners: A Case from the CPG Industry by Aura Carolina Castillo and Ethem UcevThis thesis project provides practitioners with a new mathematical model to estimate an appropriate number of pro-duction planners required for the supply chain planning department of a company in the consumer packaged goods in-dustry. Using bivariate correlation and multiple regression analyses, we explored whether a relationship exists between the required number of production planners in the new centralized offices of the company and 13 possible factors that could impact the planners’ workload, and then built a model that predicts the required number of planners.
Absenteeism Prediction & Labor Force Optimization in Rail Dispatcher Scheduling by Taylor Moroni Jen-sen and Qui (Bill) SunScheduling dispatchers in the Rail industry is difficult because of training requirements, unplanned employee absences,
XD1796_MITctl.indd 30 6/7/13 1:18 PM

and the nature of shift work. This project uses past data on absences to build a model to predict unplanned absences. It also uses Monte Carlo simulation to evaluate the tradeoffs among extra staff, the training levels of employees, and required overtime.
Multi-Echelon Inventory Optimization for Fresh Produce by Saran Limvorasak and Zhiheng XuFor fresh produce, product freshness is very critical in satisfying customers and reducing obsolescent cost. While net-work nodes in a supply chain add more “touch” of inventories, they also reduce safety stock through a risk pooling effect. Our project studied relevant factors and created a predictive model to quantify the impact of adding a fulfillment center to the supply chain. We found that products with high demand volatility would stay in the supply chain a shorter time, with a fulfillment center, resulting in better freshness.
Analysis of Truckload Prices and Rejection Rates by Yoo Joon KimThis project explored what factors affect tender rejection, a frequent and consistent problem in the truckload (TL) trans-portation industry. We examined geographical pattern, length of haul, and variability of volume as the key factor. We used ordinary least squares (OLS) regression analysis to quantify the effect of those factors.
Future Scenarios for Green Chemical Supply Chains by Sekhar Putcha and Vibhu AroraThrough our study we have attempted to address the focal issue of sustainability for chemical supply chains. The mean-ing of the word sustainability itself is quite subjective and there is both uncertainty and ambiguity related to how this crucial parameter will impact future business decisions. Currently, there is a dearth of research in the specific intersec-tion area of sustainability and chemical supply chains. We have thus tried to take the initial steps by laying down a think-ing guide for strategy formulation with a forward looking time horizon of 12-15 years.
Assembling the Crystal Ball: Using a Demand Signal Repository to Forecast Demand by Ahmed Fathy Mustafa, Rashad Abdelaal, and Santiago SpraggonThis project explores how we can develop a Demand Signal Repository (DSR) to better predict demand. We devised a methodology, collected and cleansed the data, and built more than 240 models before we arrived at models that could improve forecast accuracy. The models explained 85%+ of weekly demand per customer per region and 60%+ on a daily basis compared to time-series models that remained below 50% on a monthly basis. We applied the model for predict-ing bottled water sales, but a similar approach can be taken with other products. Access to Medicines in the Private Sector in Zambia and Zimbabwe by Brittany G. Johnson and Anand Sudershan BhatiaIn less developed countries, essential medicines are often inaccessible to the local population. This project investigates the impact of different supply chain actors on the availability and pricing of branded pharmaceuticals in the private sector in Zambia and Zimbabwe. Based on information gathered through research and in-country interviews, we de-veloped a value chain of distribution and financial models to represent each business in the network. We used these business models to build a grounded theory regarding the impact a manufacturer can have on patient price by lowering distribution channel costs.
Foreign Trade Zones and Bonded Warehouses for Luxury Goods by Andrew Todd Templeton and Nadya Naydenova PetrovaThis project explores the benefits of establishing and operating Foreign Trade Zones (FTZs) and Bonded Warehouses (BWs) for luxury goods in North America using the case of Ralph Lauren Corporation’s (RLC) distribution network. With over 3 million square feet of warehousing facilities in the U.S., the company wants to explore potential savings from changing the legal titles of four of its existing distribution facilities to either FTZs or BWs while considering the respec-tive complexity and cost of setting up and managing the zones.
Spot-market Rate Indexes: Truckload Transportation by Andrew Douglas BignellThis project reviews indexes from both the trucking and other industries to make recommendations for improving and/or developing spot-market truckload indexes. It was determined that indexes should provide information at different levels of aggregation: corridors, regional, national. An index of spot-market truckload transportation should also specify a lead time (No existing indexes do this).
XD1796_MITctl.indd 31 6/7/13 1:18 PM

MIT Supply Chain Management Program
Massachusetts Institute of Technology
77 Massachusetts Avenue
Building E40-355
Cambridge, MA 02139-4307
Telephone: 617.324.6564
Fax: 617.253.7972
Email: [email protected]
Website: http://scm.mit.edu
©2013 MIT Center for Transportation & Logistics. All rights reserved.
MIT Center for Transportation & Logistics
XD1796_MITctl.indd 32 6/7/13 1:18 PM