2013 wasb spring academy may 4, 2013 a tour of wisconsin’s house of school finance tour guide:...
TRANSCRIPT

2013 WASB Spring Academy
May 4, 2013
A Tour of Wisconsin’sHouse of School Finance
Tour Guide: David CarlsonBuilding Inspector: Bambi StatzHomeowners: School Board Members

School Finance Some think the house is too large; others say it is
too small . The quality of construction varies from room to
room. Some think the house is ugly, others say it is
functional and beautiful in its own unique way. Some believe we should burn the place down;
others believe we need some major remodeling; and some think all it needs is a fresh coat of paint.

• The purpose of this session is to provide a basic overview of Wisconsin’s System of School Funding (The House). Additionally, this presentation will identify some of the concerns and issues that have been raised about the key components (Rooms) of the system.
• Our goal is to empower you with an understanding of the finance house, how it was built, perceived flaws and what if any, modifications you would make if you were to able to make changes.
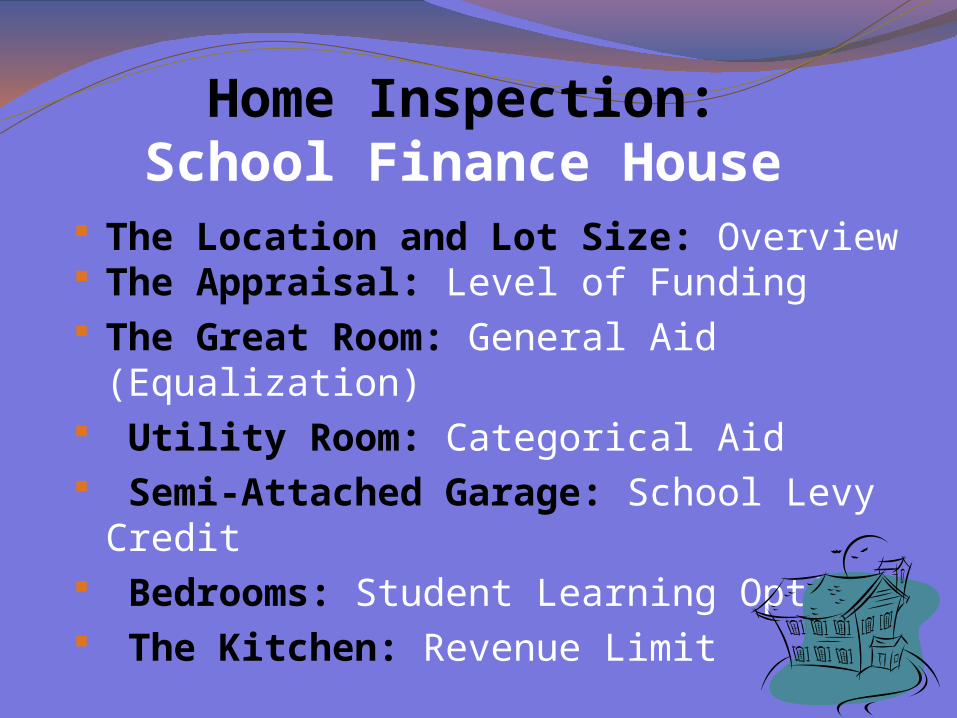
Home Inspection: School Finance House
The Location and Lot Size: Overview The Appraisal: Level of Funding The Great Room: General Aid (Equalization) Utility Room: Categorical Aid Semi-Attached Garage: School Levy Credit Bedrooms: Student Learning Options The Kitchen: Revenue Limit

School Finance Overview (The Location and Lot Size)
Public education is a function of the state School boards are authorized by the
legislature to administer public education within their geographical boundaries (chapters 115-121 Wisconsin Statutes)
Boards levy a local property tax but the state provides additional revenue

School Finance Overview
State aid is intended to reduce the reliance on the local property tax
State aid is also intended to guarantee a basic education opportunity that is available to all students as required by the state Constitution
How does the state assist districts financially? Directly and Indirectly

Humke Elementary School Nekoosa, WI
Dir
ect A
id to
Sch
ools
Property Tax Credits
Property Tax Relief
State Support for K-12
=
General Aids
Categorical Aids

General Aid• 2008 - 09 = $4,811,500,000• 2009 - 10 = $4,671,200,000• 2010 - 11 = $4,671,200,000• 2011 - 12 = $4,285,000,000• 2012 - 13 = $4,310,488,000• 2013 - 14 = $4,353,424,600*
Sources: LFB Paper #26, WISCONSIN ACT 32 and March 2013 LFB 2013-15 Budget Summary
Categorical Aid• 2008 - 09 = $650,900,000• 2009 - 10 = $644,200,000• 2010 - 11 = $653,800,000• 2011 - 12 = $608,500,000• 2012 - 13 = $653,902,300• 2013 - 14 = $612,022,500*
3 Largest
School Levy Credit• 2008 - 09 = $822,400,000 • 2009 - 10 = $892,400,000• 2010 - 11 = $897,400,000• 2011 - 12 = $897,400,000• 2012 - 13 = $897,400,000• 2013 - 15 = $897,400,000*
* = 2013 - 15 Governor’s Budget

State Support for K-12 Education$ in Millions
State Funding
2008-09 2009-10 2010-11 2011-12 2012-13 2013-14Gov Budget
2014-15Gov Budget
General Aids $4,811.5 $4,671.2 $4,671.2 $4,285.0 $4,310.5 $4,336.6 $4,379.9
Categorical Aids 650.9 644.1 653.8 608.5 653.9 612.0 677.9
School Levy/1st Dollar Credits
822.4 892.4 897.4 897.4 897.4 897.4 897.4
State Residential Schools
11.5 11.8 11.8 11.2 11.2 10.8 10.8
Total $6,296.3 $6,219.5 $6,234.2 $5,802.1 $5,873.0 $5,873.6 $5,982.9
Partial School Revenues
$9,574.1 $9,731.9 $9,899.7 $9,398.7
State Share 65.76% 63.91% 62.97% 61.73% 61.9% 61.3% 61.7%
Source: LFB Estimated State Support for School Districts published Oct 11, 2012 and Sept 28, 2011 and March 2013 LFB 2013-15 Budget Summary

School Finance
General Aid (The Great Room) General aid is defined as equalization,
integration, special adjustment Equalization aid is by far the largest state
education annual appropriation of $4.19 billion dollars (2012-2013 school year)
Equalization aid formula has been used to distribute state support since 1949
• General Aid is made up of Equalization, Integration (Chapter 220), Poverty Aid, and Special Adjustment Aids
• Eligibility for Integration (Chapter 220), and Special Adjustment (85% Hold Harmless)Aids are fully paid as first draws from the appropriation and the remainder is distributed as Equalization Aid
• 404 districts are eligible for $4,193.2 million in equalization aid; 18 districts are eligible for Special Adjustment aid only
School Finance Equalization Aid
Tax base equalizing formula Districts that spend at the same level will
tax at the same rate• Example: All districts that spend $11,000
per student will tax 9.8 mills regardless of the differences in property values between districts
• Click on Icon for More Info

School Finance Equalization Aid
Based upon a reimbursement of costs from the prior school year
Factors include: student membership and district property values per student
Does not mandate how much the district spends per student

• Based on 2012-13 October Aid RunBased on 2012-13 October Aid Run
• Between Two Different WI SDs both spending Between Two Different WI SDs both spending $10,005 but with different valued taxbases:$10,005 but with different valued taxbases:- District A has $350,000 in property value/PupilDistrict A has $350,000 in property value/Pupil- District B has $700,000 in property value/PupilDistrict B has $700,000 in property value/Pupil
Comparisons in State Equalization Aid Eligibility Comparisons in State Equalization Aid Eligibility due to state versus local factorsdue to state versus local factors
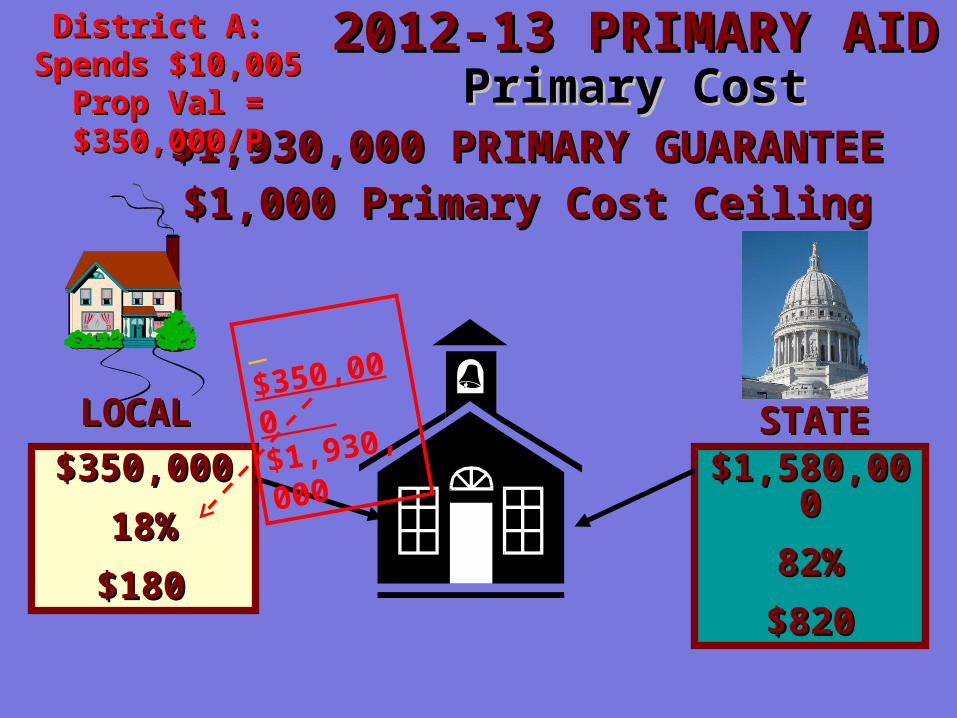
2012-13 PRIMARY AID2012-13 PRIMARY AIDPrimary CostPrimary Cost
LOCALLOCAL STATESTATE$350,000$350,000
18%18%
$180$180
$1,580,000$1,580,000
82%82%
$820$820
$1,930,000 PRIMARY GUARANTEE$1,930,000 PRIMARY GUARANTEE$1,000 Primary Cost Ceiling$1,000 Primary Cost Ceiling
$350,000
$1,930,000
District A: District A: Spends $10,005Spends $10,005
Prop Val = $350,000/PProp Val = $350,000/P

2012-13 SECONDARY AID2012-13 SECONDARY AIDSecondary CostSecondary Cost
LOCALLOCAL STATESTATE$350,000$350,000
32%32%
$2,882$2,882
$ 755,090$ 755,090
68%68%
$6,123$6,123
$ 1,105,090 SECONDARY GUARANTEE$ 1,105,090 SECONDARY GUARANTEE$9,005 - 1,000 = $8,005 Secondary Cost$9,005 - 1,000 = $8,005 Secondary Cost
$350,000
$1,105,090

TERTIARY AIDTERTIARY AIDTertiary CostTertiary Cost
LOCALLOCAL STATESTATE$350,000$350,000
63%63%
$630$630
$ 205,356$ 205,356
37%37%
$370$370
$ 555,356 TERTIARY GUARANTEE$ 555,356 TERTIARY GUARANTEEAny Amt. Over $9,005 Tertiary CostAny Amt. Over $9,005 Tertiary Cost
e.g. $1,000e.g. $1,000
$350,000
$555,356
Primary Aid = 820 or 82%; Secondary Aid = 6,123 or 68%; Tertiary Aid = 370 or 37% For Overall Sharing = $7,313 or 73%
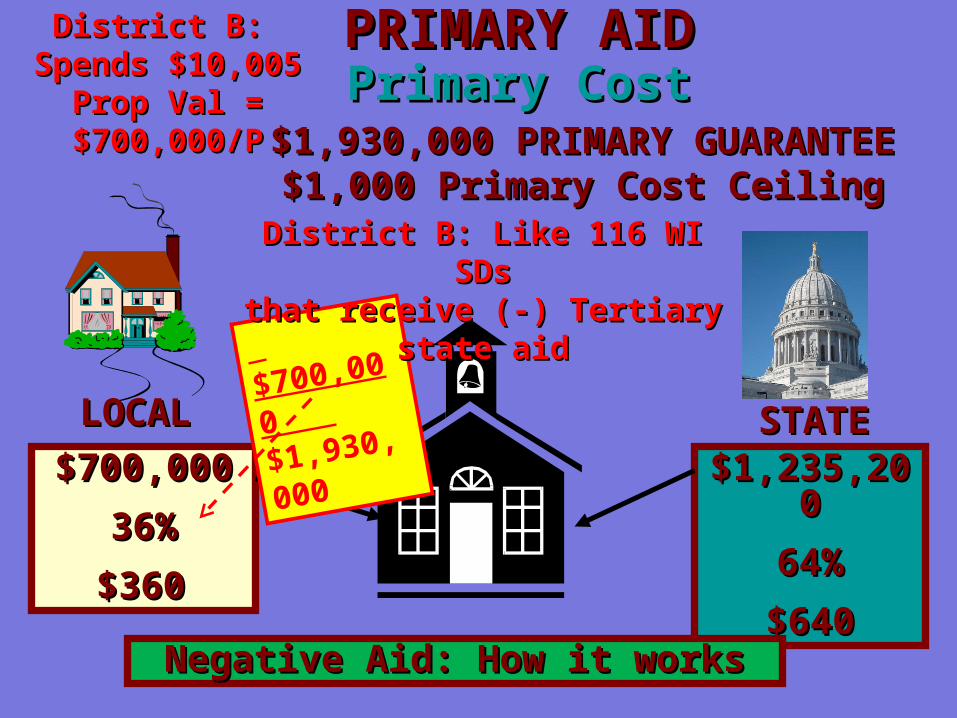
PRIMARY AIDPRIMARY AIDPrimary CostPrimary Cost
LOCALLOCAL STATESTATE$700,000$700,000
36%36%
$360$360
$1,235,200$1,235,200
64%64%
$640$640
$1,930,000 PRIMARY GUARANTEE$1,930,000 PRIMARY GUARANTEE$1,000 Primary Cost Ceiling$1,000 Primary Cost Ceiling
$700,000
$1,930,000
Negative Aid: How it worksNegative Aid: How it works
District B: Like 116 WI SDsDistrict B: Like 116 WI SDsthat receive (-) Tertiary state aidthat receive (-) Tertiary state aid
District B: District B: Spends $10,005Spends $10,005
Prop Val = $700,000/PProp Val = $700,000/P

SECONDARY AIDSECONDARY AIDSecondary CostSecondary Cost
LOCALLOCAL STATESTATE$700,000$700,000
63%63%
$5,043$5,043
$ 405,090$ 405,090
37%37%
$2,962$2,962
$ 1,105,090 SECONDARY GUARANTEE$ 1,105,090 SECONDARY GUARANTEE$9,005 - 1,000 = $8,005 Secondary Cost$9,005 - 1,000 = $8,005 Secondary Cost
$700,000
$1,105,090

TERTIARY AIDTERTIARY AIDTertiary CostTertiary Cost
LOCALLOCAL STATESTATE$700,000$700,000
1.26%1.26%
$1,260$1,260
($ 144,644)($ 144,644)
-26%-26%
-$260-$260
$ 555,356 TERTIARY GUARANTEE$ 555,356 TERTIARY GUARANTEEAny Amt. Over $9,005 Tertiary CostAny Amt. Over $9,005 Tertiary Cost
e.g. $1,000e.g. $1,000
$700,000
$555,356
Primary Aid = 640 or 64%; Secondary Aid = 2,962 or 37%; Tertiary Aid = -260 or -26% For Overall Sharing = $3,342 or 33%

Comparison in State Equalization Aid Eligibility Comparison in State Equalization Aid Eligibility between Two Different WI SDs,
both spending $10,005 $10,005 but with different Property Valuesdifferent Property Values
Equalization Aid District AProp. Val = $350,000/PPositive P, S, and T Aid
(232 SDs)
District BProp. Val = $700,000/P
(-) Tertiary Aid(116 WI SDs)
Primary Aid $820 or 82% $640 or 64%
Secondary Aid $6,123 or 68% $2,962 or 37%
Tertiary Aid $370 or 37% ($260) or -26%
Total State Equal. Aid $7,313 or 73% $2,754 or 33%

The Great Room: General Aids
Reduced by $501M or 10.4% from 2008-09 to 2012-13
• 2008 - 09 = $4,811,500,000• 2009 - 10 = $4,671,200,000• 2010 - 11 = $4,671,200,000• 2011 - 12 = $4,284,984,000• 2012 - 13 = $4,310,488,000• 2013 – 14 = $4,353,424,600 Gov Budget
Distribution within the Equalization Aid Formula is impacted by less money and by modifications to the formula.

2012-13 General Aids actually distributed to schools include:
Equalization Aid = $4.193B Integration Aid = $68.8M Special Adjustment Aid = $31.7M High Poverty Aid = $16.8M
27
Note: 272 or 64% of WI pubic SDs are receiving less school aid for 2012-13 than
they did last year.Source: DPI Oct 15, 2012 State Aid Certification and Press Release (NR 2012-
116)

$ 200,000 $ 600,000 $1,000,000 $1,400,000 $1,800,000
$400,000 $800,000 $1,200,000 $1,600,000 $ 2,000,000
PROPERTY TAX BASE
SECONDARY COST CEILING= $ 9,005
$14,000 $13,000 $12,000 $11,000 $10,000 $9,000 $8,000 $7,000 $6,000 $5,000 $4,000 $3,000 $2,000
$1,000
COSTS
Tertiary Guarantee (TGVM) = $555,356
Secondary Guarantee (SGVM) = $ 1,105,090
2012 – 13 THREE-TIEREQUALIZATION AID FORMULA
State Aid Graph Oct 15 2012-13
PRIMARY COST CEILING = $ 1,000
PRIMARY GUARANTEE(PGVM) = $1,930,000
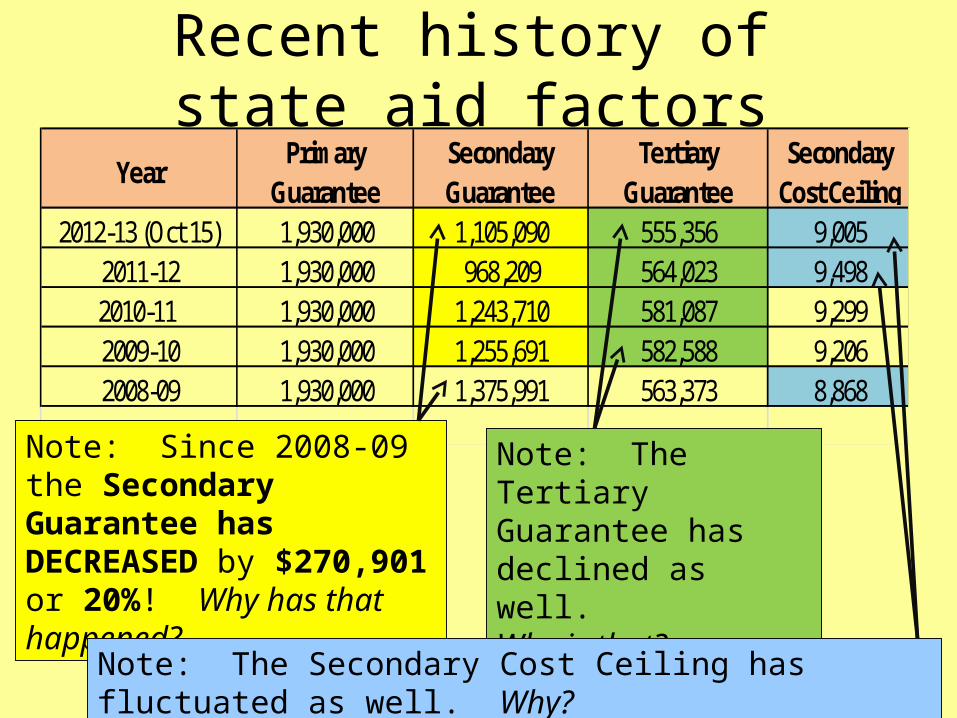
Recent history of state aid factors
YearPrimary
GuaranteeSecondary Guarantee
Tertiary Guarantee
Secondary Cost Ceiling
2012-13 (Oct 15) 1,930,000 1,105,090 555,356 9,0052011-12 1,930,000 968,209 564,023 9,4982010-11 1,930,000 1,243,710 581,087 9,2992009-10 1,930,000 1,255,691 582,588 9,2062008-09 1,930,000 1,375,991 563,373 8,868
Note: Since 2008-09 the Secondary Guarantee has DECREASED by $270,901 or 20%! Why has that happened?
Note: The Tertiary Guarantee has declined as well. Why is that?
Note: The Secondary Cost Ceiling has fluctuated as well. Why?

Formula Factor ChangesFormula Factor Changes
• 1970s (2-Tier) = 105 – 110% of state average• 1990s (94–95) (2-Tier) = 100% of state average (cpi adj)
• 1996-97 (3-Tier) = 90% of state average
• 1990s (94-95) (2-Tier) = 106% of state average• 1996-97 (3-Tier) = 100% of state average
Cost Ceiling
Guarantee
Was meant to be a disincentive for
excessive spending –
AT 90% of AVERAGE?


2012-13 Equalization AidTERTIARY:
Over $9,005 per pupil.
Positive
Aid
Negative Aid
Negative Aid
Negative Aid
SECONDARY:
Above $1,000 up to $9,005 per
pupil.
Positive Aid
Positive
Aid
Positive Aid
Negative Aid
Negative Aid
PRIMARY:
Up to $1,000 per pupil.
Positive Aid
Positive
Aid
Positive Aid
Positive Aid
ZERO AID
Up to
$555,356 per pupil.
Above $555,356
up to $1,105,090 per pupil.
Above $1,105,090
up to $1,930,000 per pupil.
Above $1,930,000 per pupil.
DISTRICT EQUALIZED VALUE PER PUPIL
DIS
TR
ICT
SH
AR
ED
CO
ST
PE
R
PU
PIL
Source: (Oct 15. 2012 DPI Aid Cert.)
20 or 5%23 or 6%31 or 7% 124 or 29%226 or 53%+10 -6
Change in # SDs from 2011-12
-11+8 -1

School Finance
Categorical Aid (The Utility Room) State Supreme Court Decision of Vincent v.
Voight concluded that the state’s system of funding was constitutional; however, it provided a warning that districts were not “fungible”
Fungible means interchangeable

School Finance Categorical Aid
Vincent v. Voight
• “An equal opportunity for a sound basic education acknowledges that students and districts are not fungible and takes into account districts with disproportionate numbers of disabled students, economically disadvantaged students, and students with limited English language skills.”

School Finance Categorical Aid
Many categorical aids are intended to recognize the need for additional resources for these populations (2012-13) school year)
Special Education $ 368.9 million SAGE $ 109.1 million High Cost SE $ 14.9 million Sparsity $ 13.4 million High Poverty $ 16.8 million Bi-lingual/Bi-cultural $ 8.5 million
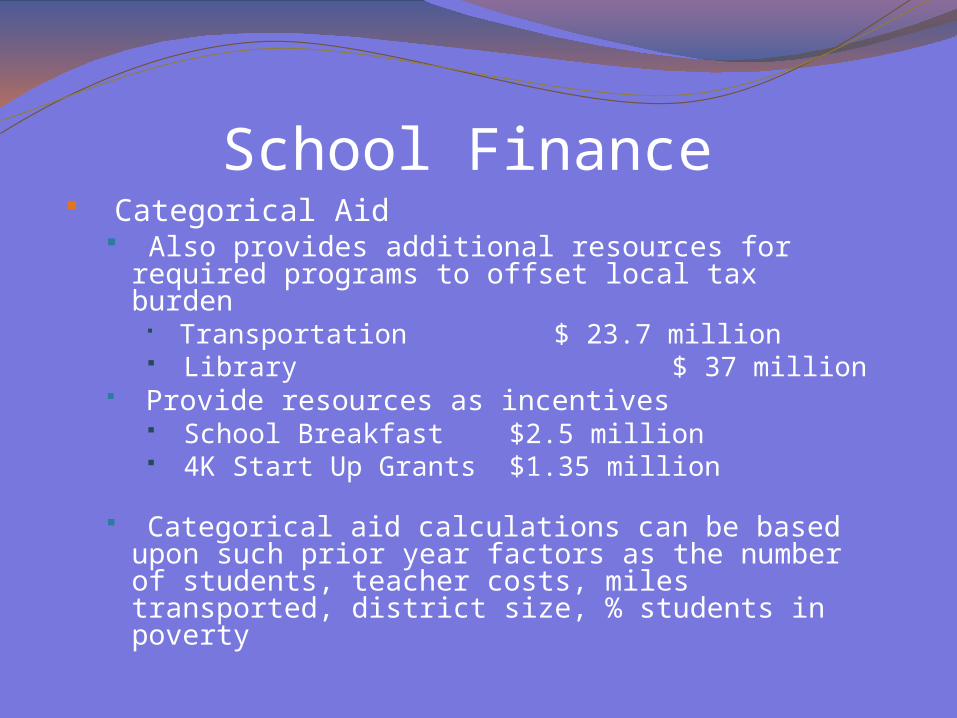
School Finance Categorical Aid
Also provides additional resources for required programs to offset local tax burden
Transportation $ 23.7 million Library $ 37 million
Provide resources as incentives School Breakfast $2.5 million 4K Start Up Grants $1.35 million
Categorical aid calculations can be based upon such prior year factors as the number of students, teacher costs, miles transported, district size, % students in poverty

School Finance Categorical Aids
Susceptible to change Elimination such as Driver’s Education
aid/Children at Risk “Sum certain” rather than “sum sufficient”;
result is often % reimbursement drop; example is special education aid; once 67% now 26%

Utility Room: Categorical Aids
Fluctuates with periodic reductionsAt slightly above 2008-09 level
• 2008 - 09 = $650,900,000• 2009 - 10 = $644,200,000• 2010 - 11 = $653,800,000• 2011 - 12 = $608,500,000 • 2012 - 13 = $653,875,400• 2013 – 14 = $612,022,500 Gov Budget

:
In 2000, the WI State Supreme Court established
an educational standard which provides that:
1. “Wisconsin students have a fundamental right to an equal opportunity to a sound basic education . . . that will equip students for their roles as citizens and enable them to succeed economically and personally.”
2. The Court also required that “. . . districts with disproportionate numbers of disabled students, economically disadvantaged students, and students with limited English language skills . . .” be taken into consideration.
The effect of this decision is to demand that the legislature revise our school finance system to assure that every child has an equal educational opportunity. Is that the case in today’s climate?

State Reimbursement Rates
Categorical Aid
00-01 01-02 02-03 03-04 04-05 05-06 06-07 07-08 08-09 09-10 10-11 11-12
Actual Actual Actual Actual Actual Actual Actual Actual Actual Actual Actual Estimate
Special Education,
SpEd Transp, Psych/SW,
Room & Board
35.79%
33.66% 31.87% 30.45% 29.95% 28.84% 28.70% 28.82% 28.67% 27.85% 28.08% 26.00%
Hospital 100% 100% 100% 100% 100% 100% 100% 100% 100% 100% 100.00% 100.00%
Bilingual/Bicultural
17.95%
16.50% 12.80% 12.74% 11.41% 11.49% 11.59% 11.26% 10.79% 9.68%
Sparsity Aid 45.0% 23.0% 94.0% 80.29%
Source: http://dpi.wi.gov/sfs/speced.html

Eligibility Criteria: SD membership less than 725 Less than 10 members per square mile At least 20% of members qualify for free or reduced
Sparsity Aid
Sample Districts
Proration Factor:
08-09 09-10 10-11 11-12
45.0% 23.0% 94.0% 80.29%
Alma $ 19,190 $ 18,629 $ 76,595 $ 60,216
Athens 36,635 36,983 146,713 127,900
Blair-Taylor 47,236 46,781 186,700 160,657
Cashton 37,104 39,467 159,948 146,205
Gilman 64,949 32,705 131,507 113,689
Port Edwards 31,334 32,636 130,943 110,078
Princeton 26,771 25,805 109,542 95,864
Randolph 33,347 34,085 142,489 123,323
Washburn 39,385 37,949 152,908 126,454
Wauzeka-Steuben 21,873 22,631 96,025 81,653
Wonewoc-Union Center 27,375 28,496 111,795 99,477
Source: DPI Website http://dpi.wi.gov/sfs/sparsity.html

Statewide Special Needs Vouchers
Private Schools•Students are not guaranteed services, and
•Families surrender their legal recourses under IDEA.
Public Schools•119,262 (13.7% ) of all Wisconsin students receive special education services
•State reimbursement has dropped from 44% to 26% in the past two decades.
•Special Ed vouchers are funded by a deduction in general aid.
•Public schools will have to meet maintenance of effort for SwD voucher students.
2013-15 State Budget Proposal
*Note: this budget provides no new special education categorical aid for public schools.
Source: DPI http://news.dpi.wi.gov/news_2013-15-state-budget-information
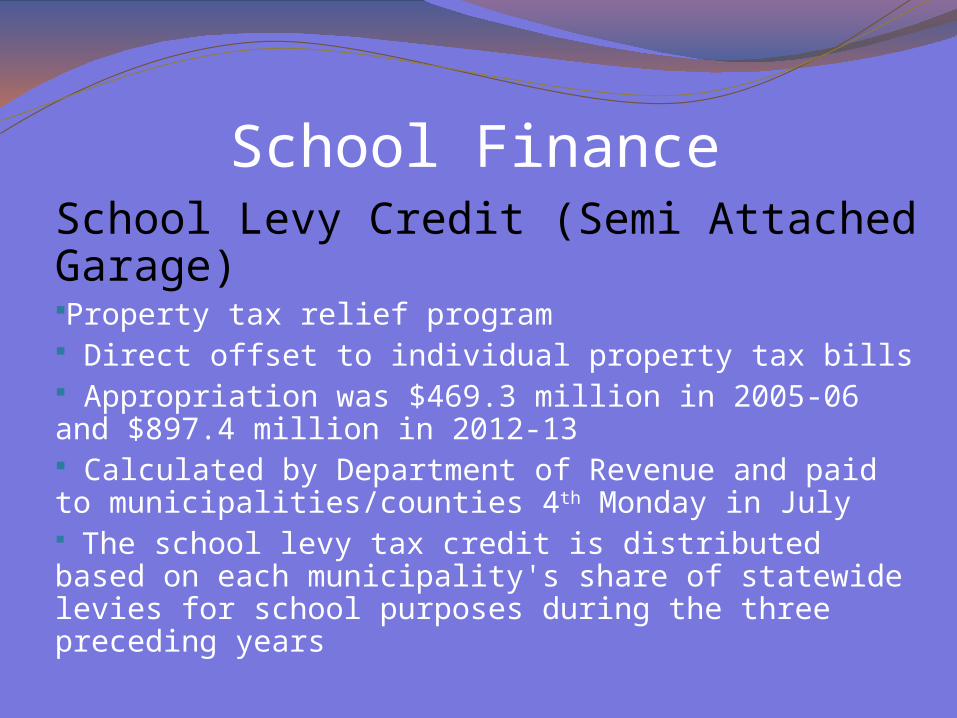
School FinanceSchool Levy Credit (Semi Attached Garage)Property tax relief program Direct offset to individual property tax bills Appropriation was $469.3 million in 2005-06 and $897.4 million in 2012-13 Calculated by Department of Revenue and paid to municipalities/counties 4th Monday in July The school levy tax credit is distributed based on each municipality's share of statewide levies for school purposes during the three preceding years

School Finance
School Levy Tax Credit Statewide, the credit reduced the school portion
of 2010(11) property tax bills by an average of 15.4%
Given the same tax rate, the taxpayer with a higher valued home would receive a proportionally larger school levy credit as compared to a taxpayer with a lower valued home
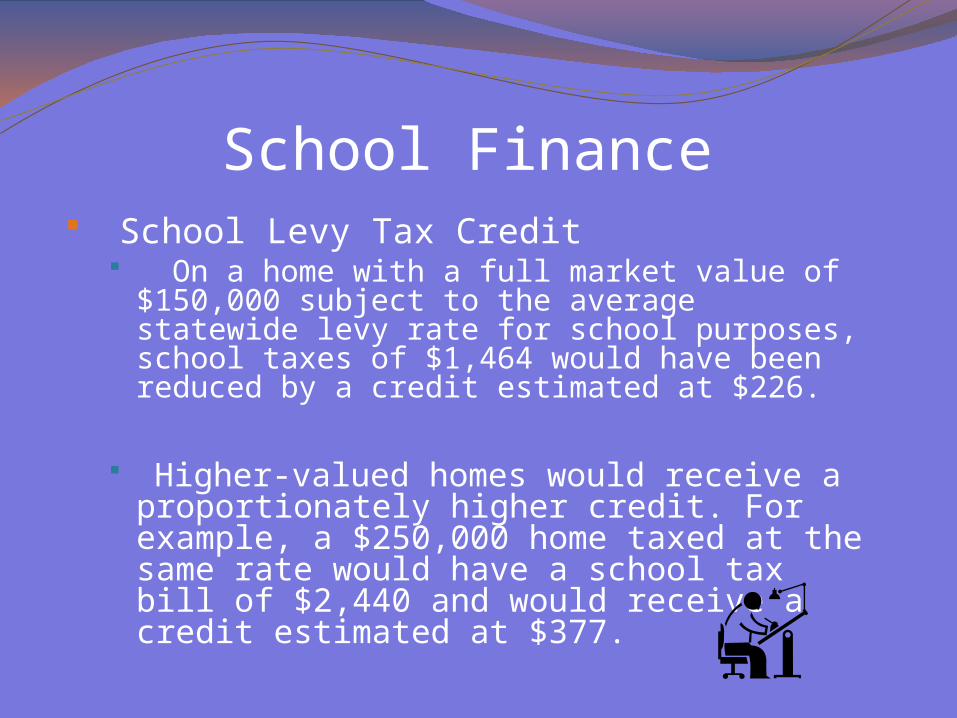
School Finance School Levy Tax Credit
On a home with a full market value of $150,000 subject to the average statewide levy rate for school purposes, school taxes of $1,464 would have been reduced by a credit estimated at $226.
Higher-valued homes would receive a proportionately higher credit. For example, a $250,000 home taxed at the same rate would have a school tax bill of $2,440 and would receive a credit estimated at $377.

Levy Credits
Municipality’s 3-YearAverage School Levies
Statewide 3-YearAverage School Levies
DISTRIBUTIONDistributed based on each municipality’s share
of statewide levies for school purposes during the preceding three years.
Source: LFB Papers #21 & #27, January 2009
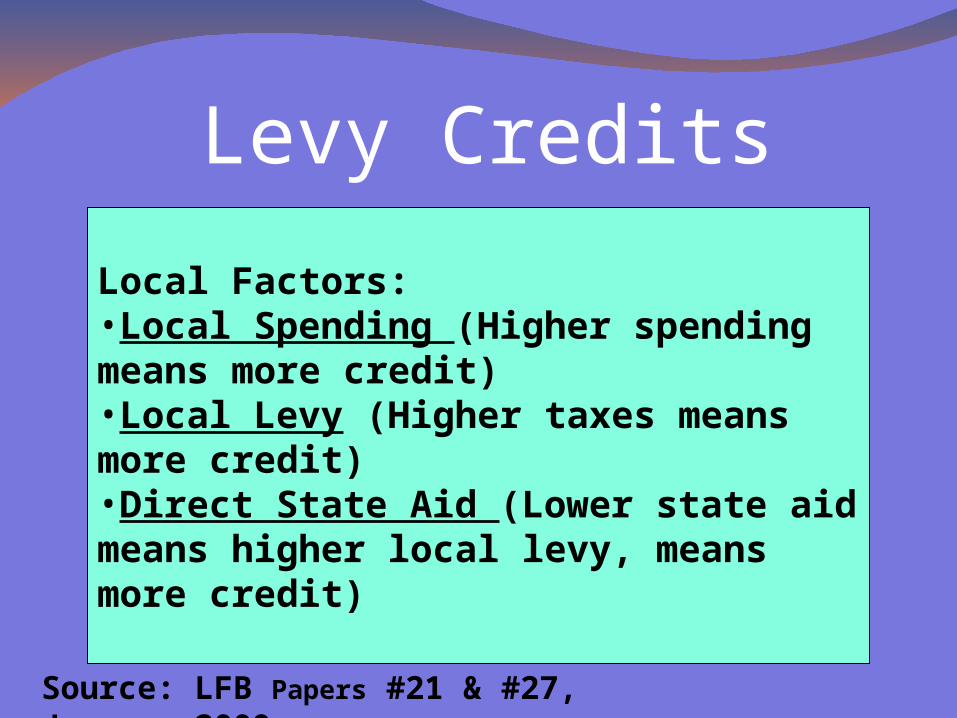
Levy Credits
Source: LFB Papers #21 & #27, January 2009
Local Factors:•Local Spending (Higher spending means more credit)•Local Levy (Higher taxes means more credit)•Direct State Aid (Lower state aid means higher local levy, means more credit)

Semi-Attached GarageSchool Levy Credits
Lack of Transparency Complicates Tax Bills Funding for Levy Credits (School Levy
Credits and First Dollar Credits) has proliferated while direct aid to school districts has diminished.
Distribution – opposite of equalization

GROSS SCHOOL LEVY $1,341.30 Cert. Levy+ 268.78 Schl Levy Cr$1,610.08 Gross Levy
CALCULATE NET SCHOOL LEVY $1,610.08 Gross Levy - 268.78 School Levy Credit
$1,341.30 -72.30 First Dollar Credit
$1,269.00 -82.48 Lottery & Gaming Credit
$1,186.52Net School Levy paid by Taxpayer

SCHOOL LEVY & 1SCHOOL LEVY & 1stst Dollar TAX CREDITS Dollar TAX CREDITS
Prior to 1990, Credits = $169 M and were equalized Prior to 1990, Credits = $169 M and were equalized
1995-961995-96 $ 319m$ 319m1996-971996-97 + 150m+ 150m Nearly a Decade = Nearly a Decade = $ 469m$ 469m 2005-06 2005-06 + 124m+ 124m
$ 593m$ 593m 2007-08 2007-08 + 79.4m+ 79.4m
$ 672.4m$ 672.4m 2008-09 2008-09 + 150m+ 150m
$ 822.4m$ 822.4m 2009-10 2009-10 + 70m+ 70m
$ 892.4m$ 892.4m 2010-11 and after2010-11 and after + 5.0 m+ 5.0 m
$ 897.4m$ 897.4m

Annual Appropriations State Budget
Act 322005-06 to
2012-13
2005-06 06-07 07-08 08-09 09-10 10-11 11-12 12-13 $ Chge
% Chge
General School Aids
$4,613.9 $4,722.7
$4,731.7 $4,811.5
$4,671.2 $4,671.2 $4,285.0 $4,310.5 -$303.4 -6.6%
Categorical Aids
$545.2 $571.1 $608.5 $650.9 $644.2 $653.8 $608.5 $653.9 $108.7 19.9%
School (Property Tax) Credits
$469.3 $593.1 $672.4 $822.4 $892.4 $897.4 $897.4 $897.4 $428.1 91.2%
State Resident Schools
$10.4 $10.4 $11.5 $11.5 $11.8 $11.2 $11.2 $11.2 $.8 7.6%
Total State Funding
$5,638.8 $5,897.9 $6,024.1 $6,296.3 $6,219.5 $6,234.2 $5,802.0 $5,873.0 $234.2 4.2%
State Funding for K-12 Education 2005-06 to 2012-13($ in Millions)
Source: ACT 32 State Budget - LFB
73.3% of Total
81.8%
8.3% 15.2% of Total
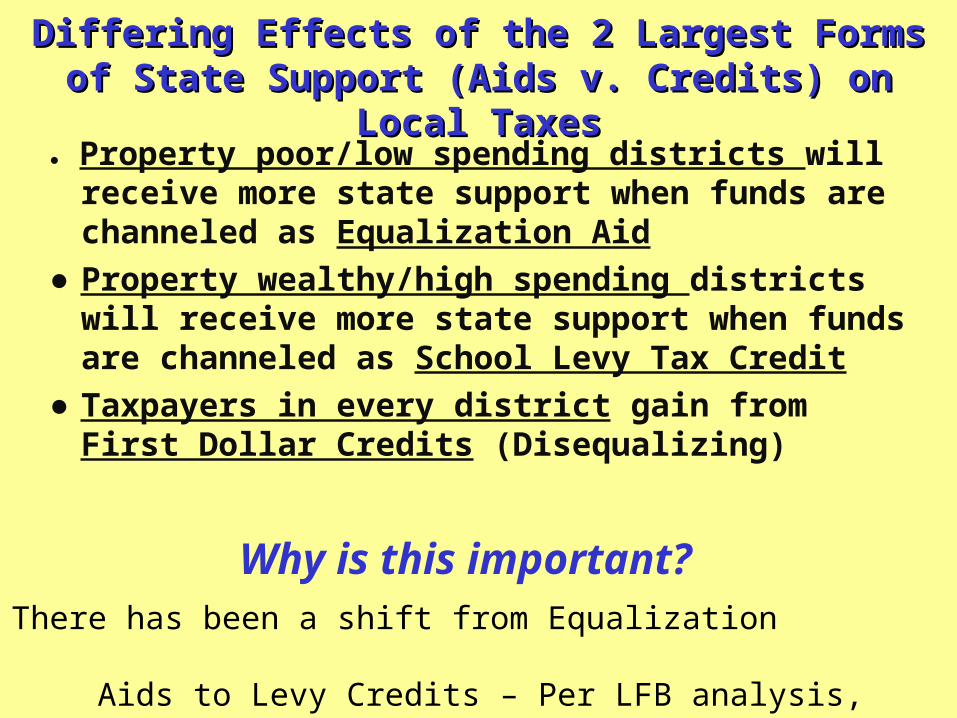
Differing Effects of the 2 Largest Forms of State Support Differing Effects of the 2 Largest Forms of State Support (Aids v. Credits) on Local Taxes(Aids v. Credits) on Local Taxes
● Property poor/low spending districts will receive more state support when funds are channeled as Equalization Aid
● Property wealthy/high spending districts will receive more state support when funds are channeled as School Levy Tax Credit
● Taxpayers in every district gain from First Dollar Credits (Disequalizing)
Why is this important?There has been a shift from Equalization
Aids to Levy Credits – Per LFB analysis, Disadvantages 70% of WI SDs

School District Loss School District GainAppleton +.35 -$2,460,110 Crivitz (1.34) $1,199,074Baraboo +.50 -$812,613 Drummond (.76) $1,020,634Waunakee +.17 -$352,788 Elcho (.99) $806,260Delavan-Darien +.47 -$919,700 Elmbrook
(1.56)$12,132,922
East Troy +.46 -$698,069 Gibraltar (.44) $1,605,973Fond du Lac +.37 -$1,313,439 Green Lake (.98) $1,034,812Hudson +.51 -$1,823,001 Hayward (1.02) $3,194,244Kenosha +.30 -$2,842,143 Mequon-Thiensvl (1.62) $7,487,810Marshfield +.54 -$1,053,006 Northland Pines (1.01) $3,657,577Mosinee +.41 -$418,468 Phelps
(1.30)$550,762
Mukwonago +.41 -$1,355,671 Sevastopol (.90) $1,291,729Oak Crk-Frank +.46 -$1,711,559 Spooner (1.21) $2,117,850Owen-Withee +.44 -$89,065 Three Lakes
(.96)$1,495,773
Racine +.65 -$6,299,947 Webster (.97)
$1,432,684
Waukesha +.31 -$3,031,465 Weyerhaeuser (1.50)
$296,963
Wauwatosa +.46 -$2,475,613 Williams Bay (1.23) $1,429,572West Bend +.59 -$2,784,119 Wisconsin Dells (.89) $2,070,942Total No. of SDs 295 = 70% Total No. of SDs 130 = 30%
LFB Analysis: Shift of $747.4M School Levy Credits vs. Equalization Aid to in 2009-10
Source: LFB Paper dated February 2, 2010

School District
09-10 Equal. Value per
Pupil
09-10 Total
Exps per Pupil
09-10 Tax Rate
09-10 Equal
Aid per Pupil
09-10 Property Tax per
Pupil
09-10 Levy
Credit per Pupil
Sheboygan $ 372,028 $ 13,013 $ 10.58 $ 5,897 $ 4,497 $ 659
Green Lake $ 3,503,363 $ 20,375 $ 4.85 $ 131 $16,977 $2,938Nekoosa $ 840,458 $ 12,100 $ 9.15 $ 3,105 $ 7,693 $1,153Three Lakes $ 2,830,586 $ 15,636 $ 4.99 $ 202 $14,125 $2,579Stevens Point $ 530,206 $ 12,310 $ 9.48 $ 5,574 $ 5,027 $ 763Mequon-Thiensville $ 1,298,892 $ 12,614 $ 8.73 $ 597 $11,340 $2,038Wisconsin Rapids $ 383,030 $ 11,899 $ 8.93 $ 6,679 $ 3,422 $ 563Wisconsin Dells $ 1,374,392 $ 11,970 $ 6.77 $ 461 $ 9,309 $1,600State Average (K-12) $ 560,976 $ 12,366 $9.18 $ 5,373 $ 5,144 $847
School District Comparisons
Sources: School Facts ‘10 by WTA and Feb 2010 LFB analysis
Above Average CreditBelow Average Credit

Who Pays & Who Benefits from Levy Credits?Who Pays & Who Benefits from Levy Credits?• All WI residents contribute to GPR through income and sale taxes.
• Only 51% of the total school levy credit reduces property taxes of WI homeowners on their primary residences.
• 9% of the levy credits go to WI residents who own vacation property
• 26% go to owners of nonresidential property and non-Wisconsinites who own vacation homes in the state
• “Property owners in the poorest school districts (in terms of property wealth) received an average credit equal to $375 per student. The size of the average credit going to taxpayers in school districts with higher levels of property wealth per student increases with district wealth. Property owners in the state’s 21 property-richest districts received average per student credits of $2,596, nearly seven times the average credit going to taxpayers in the poorest school districts.”
Source: Andrew Reschovsky's study of levy credits: http://www.lafollette.wisc.edu/publications/workingpapers/#2010-003
School Finance
Student Learning Options (The Bedrooms) Have provided many unique and individual learning
opportunities for students
Examples: Open Enrollment, Milwaukee Parental Choice Program, Charter Schools including Virtual Charter Schools, Youth Challenge Academy, Youth Options, Youth Apprenticeship, Integration (Chapter 220)

School Finance Student Learning Options
Each option has its own requirements and funding formula
Open Enrollment (chapter 118.51 of statutes)
Open enrollment regular and special needs students; regular student tuition is a set amount ($6,445 est. for 2012-13); special needs is the set amount plus actual additional student associated costs (Doe v. Burmaster, U.S. District Court Eastern District 03-CV-892)
• Note: districts can mutually agree to an OE amount for special education students
–

School Finance Student Learning Options
Charter Schools – Chapter 118.40 of State Statutes
District Charter for district students District counts students for equalization aid and
revenue limit
District Charter for district and OE students District counts students for equalization aid and
revenue limit and receives OE tuition for other districts’ students

School Finance Student Learning Options
Charter Schools District Virtual Charter for district and OE students
District counts resident students for equalization aid and revenue limit and receives OE tuition for other districts’ students
No limit on district resident and non resident students attending district’s virtual charter schools in 2012-2013
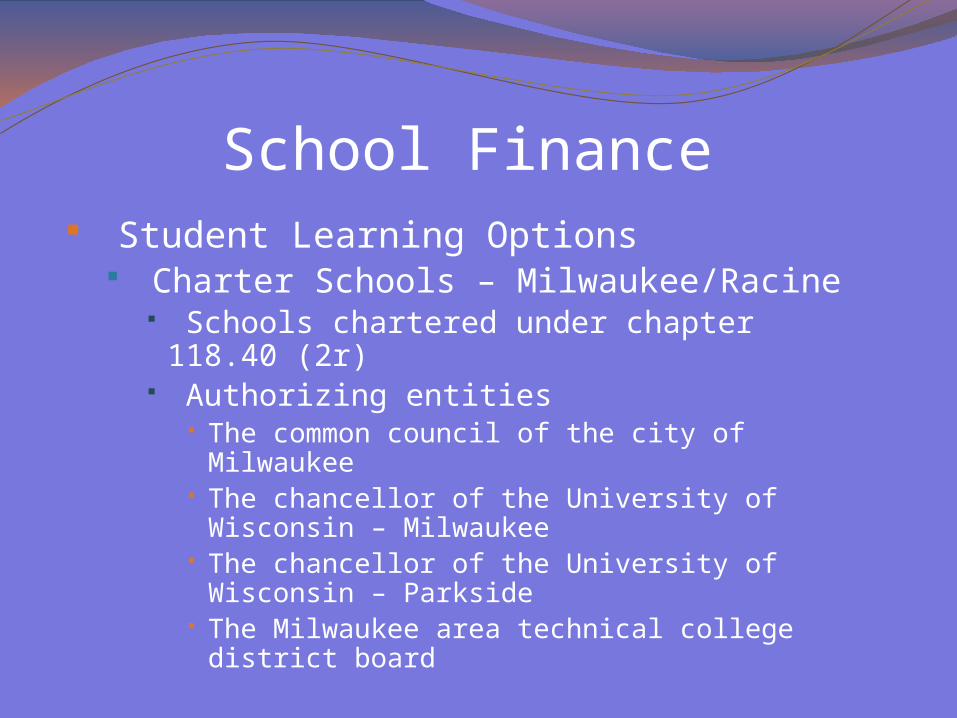
School Finance Student Learning Options
Charter Schools – Milwaukee/Racine Schools chartered under chapter 118.40 (2r) Authorizing entities
The common council of the city of Milwaukee The chancellor of the University of Wisconsin –
Milwaukee The chancellor of the University of Wisconsin –
Parkside The Milwaukee area technical college district
board

School Finance Student Learning Options
Charter Schools (2r) Milwaukee/Racine (2r) charters receive a
payment from the state based upon a prescribed funding formula (est. for 2012-13 of $ 7,775 per student for 7,600 students)
Sum sufficient appropriation of $ 59.8 million for 2012-13 taken from every school district’s general aid eligibility (equalization, special adjustment, integration)

School Finance
Student Learning Options Charter Schools (2r)
1.39% general aid reduction for each district Districts have the authority to levy for the aid
loss due to the charter reduction Complex array of funding formulas/district
costs complicates the accurate counting of students for aid and revenue limit

Bedrooms:Student Learning Options
Choice and Independent Charter Programs impact funding for public
schools
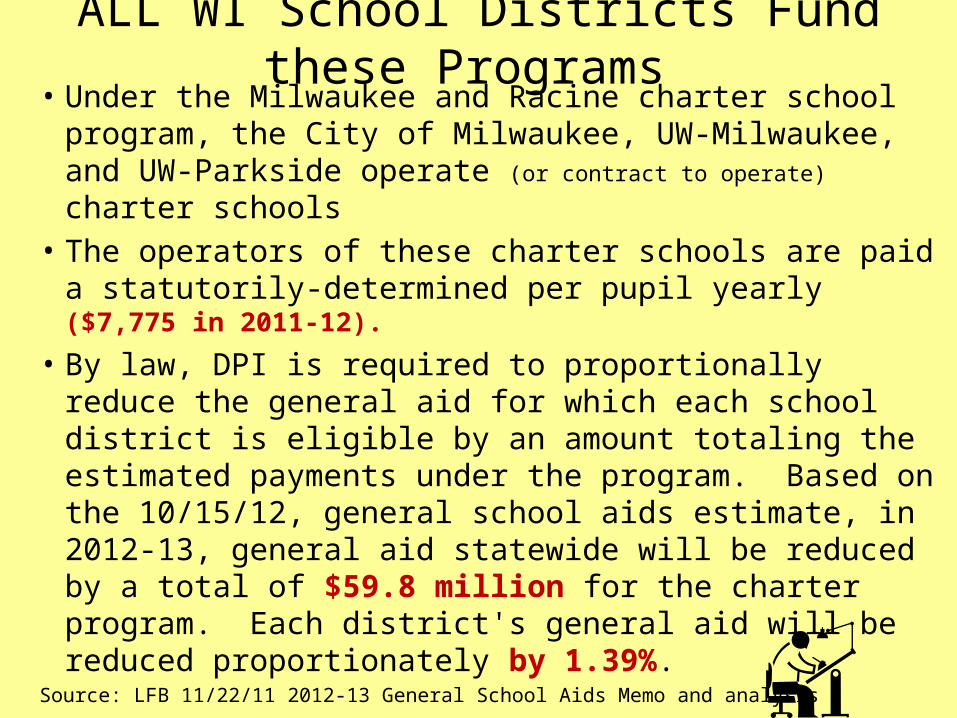
ALL WI School Districts Fund these Programs • Under the Milwaukee and Racine charter school program,
the City of Milwaukee, UW-Milwaukee, and UW-Parkside operate (or contract to operate) charter schools
• The operators of these charter schools are paid a statutorily-determined per pupil yearly ($7,775 in 2011-12).
• By law, DPI is required to proportionally reduce the general aid for which each school district is eligible by an amount totaling the estimated payments under the program. Based on the 10/15/12, general school aids estimate, in 2012-13, general aid statewide will be reduced by a total of $59.8 million for the charter program. Each district's general aid will be reduced proportionately by 1.39%.
Source: LFB 11/22/11 2012-13 General School Aids Memo and analysis

2013-15 Funding Comparison
Public Schools
Independent Charters
Voucher Schools
Enrollment 864,000 10,500+ 2,500 students over 2012-13 school year
30,000+ 5,000 students over 2012-13 school year
Revenue (How much schools can spend)
Per-Pupil Increase $0/student + $156/student + $608/ K-8 student+ $1,414/ 9-12 student
State School Aid (How much the state pays)
Net Increase $39 Million* $23 Million $73 Million
Per-Pupil Increase $45/student $2,190/student $2,433/student
Because the revenue limit is frozen, the increase in general school aids will reduce local property taxes (not increase student spending). There are no revenue limit restrictions for independent charter and voucher schools, so they can spend whatever is allocated.
*Note: All $39 million will go to property tax relief. See DPI’s net state school aid increase calculation. Additionally, only some school districts will be eligible for the $64 million performance funding, which is included in the “net increase” state school aid number.
2013-15 State Budget Proposal
Source: DPI http://news.dpi.wi.gov/news_2013-15-state-budget-information
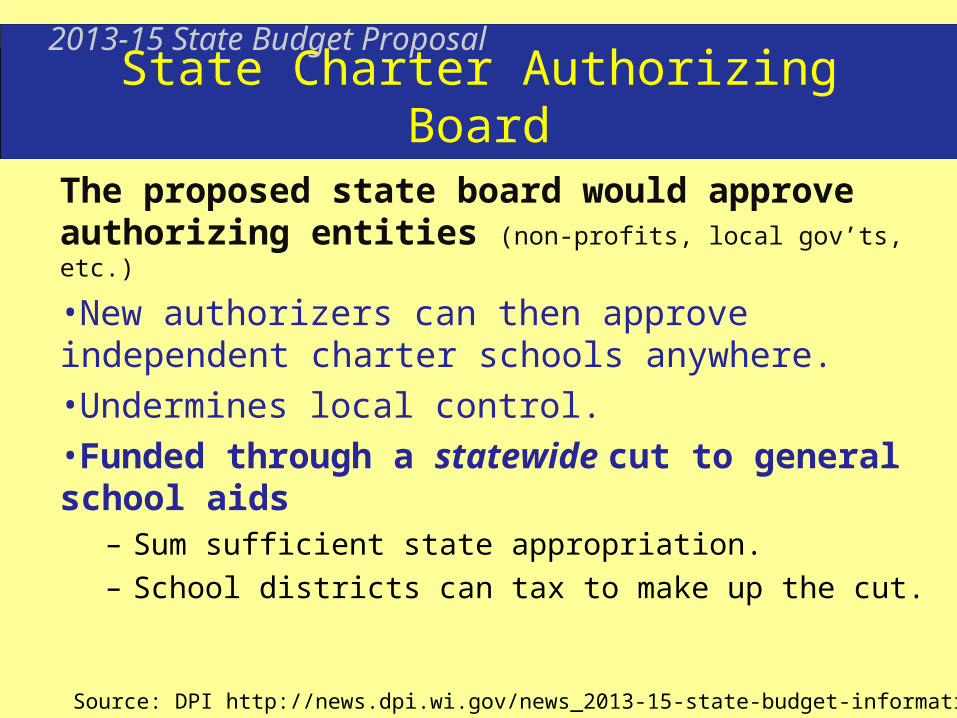
State Charter Authorizing Board
The proposed state board would approve authorizing entities (non-profits, local gov’ts, etc.)
•New authorizers can then approve independent charter schools anywhere.•Undermines local control.•Funded through a statewide cut to general school aids
– Sum sufficient state appropriation.
– School districts can tax to make up the cut.
2013-15 State Budget Proposal
Source: DPI http://news.dpi.wi.gov/news_2013-15-state-budget-information

State Charter Authorizing BoardThe 2012-13 general aid reduction for independent charters was -1.4%* =
Average district cut = -$140,000Not all districts treated the same!
That could be backfilled on the local property tax. This is a local tax increase. Lost Aid and increased taxes!
2012-13 State Aid Reductions due to Independent Charters
2013-15 State Budget Proposal
*Note: the general aid reduction percentage changes annually, depending on the number of students enrolled in independent charters, although DPI projects that this number will increase under te state budget.
Source: DPI http://news.dpi.wi.gov/news_2013-15-state-budget-information
District 2012-13 Aid Cut District 2012-13 Aid Cut
Chippewa Falls $ 383,640 Gibraltar $ .00
Green Bay 1,803,875 Green Lake .00
Madison 818,966 Three Lakes .00
Sheboygan 943,008 Elmbrook 37,046
Stoughton 204,979 Mequon 16,960
Sun Prairie 491,872 Wisconsin Dells 8,512

School Finance
Revenue Limits (The Kitchen) Arose out of the early 1990’s when many tax
levies were increasing at over 10% a year Effective 1993-94 as Chapter 121.90 of state
statutes Revenue limit law controls the levy
authority of school boards both for operations and long term debt
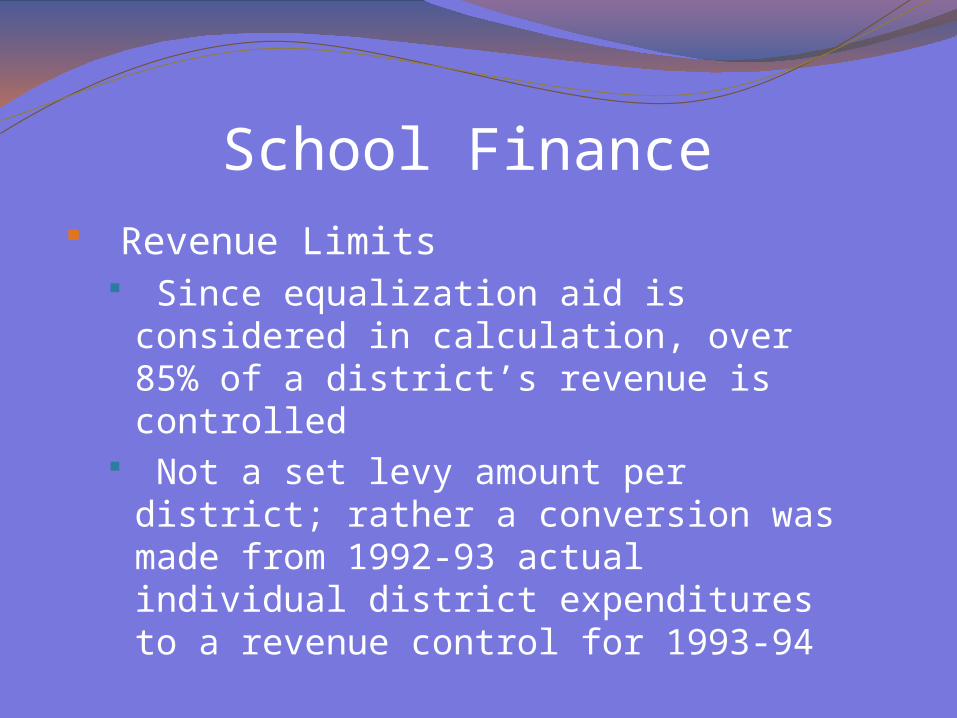
School Finance
Revenue Limits Since equalization aid is considered in
calculation, over 85% of a district’s revenue is controlled
Not a set levy amount per district; rather a conversion was made from 1992-93 actual individual district expenditures to a revenue control for 1993-94

School Finance Revenue Limits
Through the years there has been numerous proposed and enacted changes to this calculation
Examples: declining enrollment, summer school, exempt computer aid, allowable per pupil increase, energy efficiency
It is now the state’s most complex calculation for districts and for the state to administer

School Finance
Revenue Limits Over levies reduce district equalization aid
eligibility and over taxed residents do not get a refund so accuracy is critical
Provides state with significant control over the spending and taxing authority of school districts
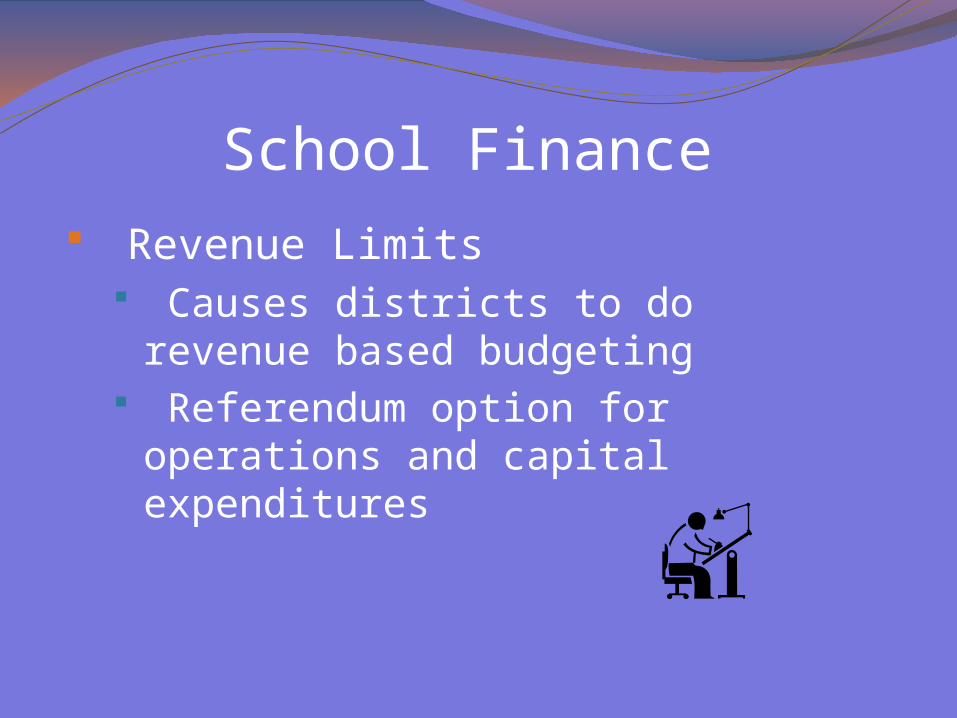
School Finance
Revenue Limits Causes districts to do revenue based
budgeting Referendum option for operations and
capital expenditures

The Kitchen:State-Imposed Revenue
Limits
The Revenue Caps were unfairly implemented resulting in many school
districts and their students being disadvantaged ever since.
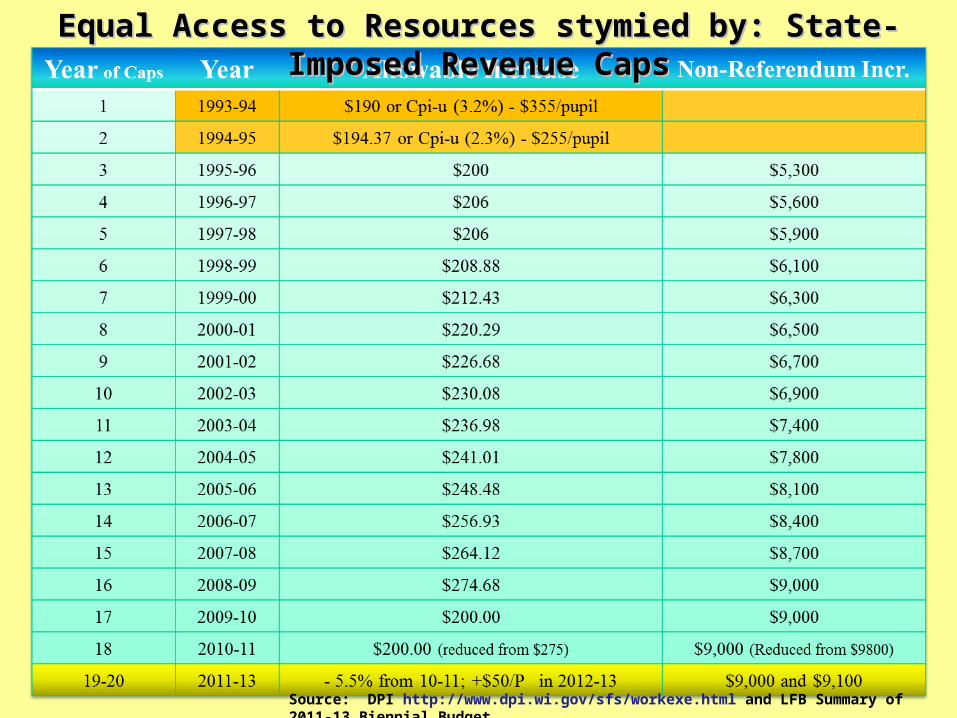
Source: DPI http://www.dpi.wi.gov/sfs/workexe.html and LFB Summary of 2011-13 Biennial Budget
Equal Access to Resources stymied by: State-Imposed Revenue CapsEqual Access to Resources stymied by: State-Imposed Revenue Caps

Change in Revenue Limit Over Time2013-15 State Budget Proposal
A historic decline in revenue limit over the last four years
Source: DPI http://news.dpi.wi.gov/news_2013-15-state-budget-information

Per-Pupil Revenue by School Type2013-15 State Budget Proposal
* For high school students
An issue of fairness: No growth in public school spending
Source: DPI http://news.dpi.wi.gov/news_2013-15-state-budget-information
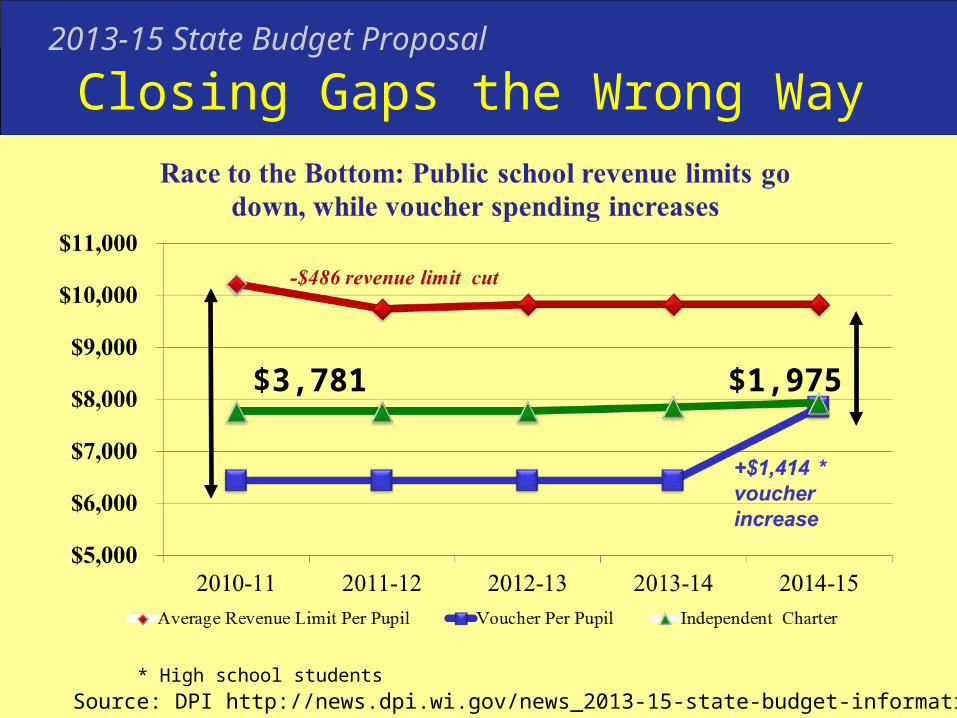
Closing Gaps the Wrong Way2013-15 State Budget Proposal
* High school students
$3,781 $1,975
Source: DPI http://news.dpi.wi.gov/news_2013-15-state-budget-information
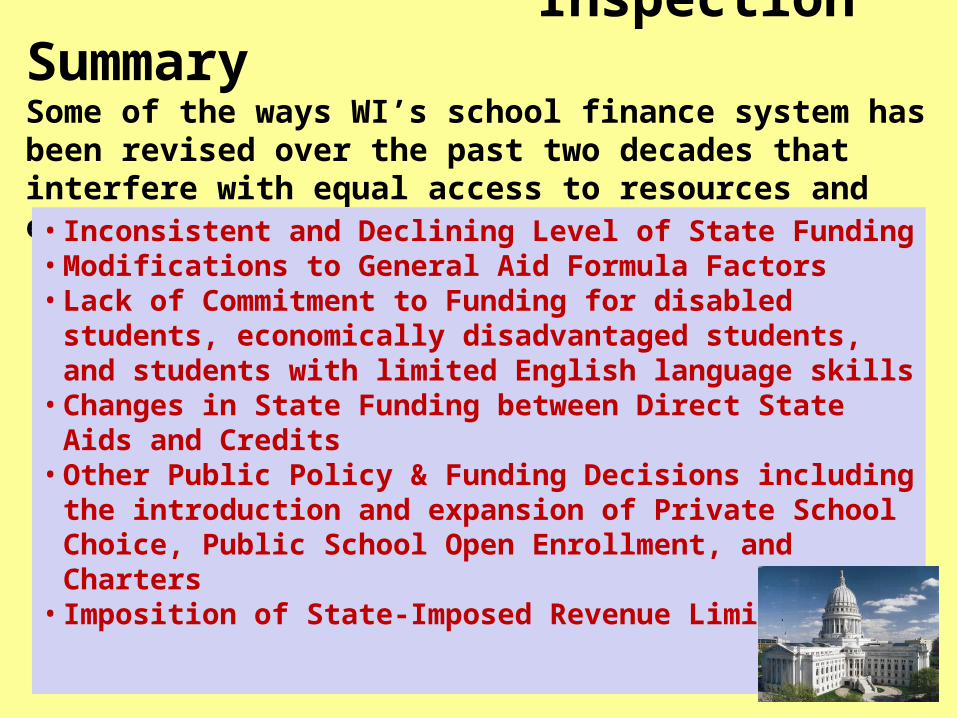
Inspection SummarySome of the ways WI’s school finance system has been revised over the past two decades that interfere with equal access to resources and equal educational opportunities include:
• Inconsistent and Declining Level of State Funding • Modifications to General Aid Formula Factors• Lack of Commitment to Funding for disabled students,
economically disadvantaged students, and students with limited English language skills
• Changes in State Funding between Direct State Aids and Credits
• Other Public Policy & Funding Decisions including the introduction and expansion of Private School Choice, Public School Open Enrollment, and Charters
• Imposition of State-Imposed Revenue Limits

• The purpose of this session was to provide a basic overview of Wisconsin’s System of School Funding (The House). Additionally, this presentation identified some of the concerns and issues that have been raised about the key components (Rooms) of the system.
• Our goal was to empower you with an understanding of the finance house, how it was built, perceived flaws and what if any, modifications you would make if you were to able to make changes. In addition, we have identified resources (Building Materials) that will help you to apply these concepts to your own district (House).
•
Your Home Inspection should ask:
Is the foundation sound?Is the house too big or too small?Should some rooms be demolished?Any new rooms needed?Is the house functional? Appealing? Attractive?
Fundamentals of Wisconsin’s School Funding System
Resources Resources • WASB; The Budget Cycle• Association for Equity in Funding Website; www.waef.net• DPI Finance Team's Learning Center• DPI Finance Team's Basic Facts• Legislative Fiscal Bureau• DPI School Data Warehouse

A Tour of Wisconsin’sHouse of School Finance
Bambi Statz, PhD, Emeritus Professor, UW-Whitewater and Association for Equity in Funding Executive Director
David Carlson, WASB Organization Services Program Consultant