2014 04 17 bioinformatics - cs.unc.edu
TRANSCRIPT
4/17/2014
1
Bioinformatics Visualization
Comp/Phys/APSc 715
4/17/2014 Bioinformatics Comp/Phys/APSc 715 Taylor
Example Videos
• Vis 2013, Schindler
– Lagrangian coherent structures in flow
• Matlab bioinformatics toolbox
– http://www.mathworks.com/videos/bioinformatic
s-toolbox-overview-61196.html
4/17/2014 Bioinformatics Comp/Phys/APSc 715 Taylor
4/17/2014 Bioinformatics Comp/Phys/APSc 715 Taylor
Administrative
• Presentations next week
– Brief data and goal intro
– Describe ideal design
• What perceptual characteristics help user do task?
• Why parameters chosen (color map, viewpoint)?
• Consider second-best approach
– Describe implementation if any (and demo)
– Evaluation plan or report

4/17/2014
2
Administrative
• Final Project Turn-in
– Due 7PM, Tuesday April 29th
– Written report
• Described in link from schedule page
• Example sent out earlier
– Videos and Paraview State Files
– Upload to FTP server
• Or DropBox and tell me where to find
• Demo to me and scientist
– At or before the final turn-in
4/17/2014 Bioinformatics Comp/Phys/APSc 715 Taylor 4
Introduction
• Bioinformatics
– Applying CS algorithms to biological problems
• Examples
– Protein folding
– Gene mapping
• Gigantic data sets
4/17/2014 Bioinformatics 5Comp/Phys/APSc 715 Taylor
What's in this lecture
• IEEE InfoVis special issue on Bioinformatics Visualization
– 2005, volume 4, no. 3
• Other information from recent pubs/web
• Visualization of:
– Microarray data (***)
– Gene sequences
– Taxonomies
– Biological pathways
4/17/2014 Bioinformatics 6Comp/Phys/APSc 715 Taylor
4/17/2014
3
4/17/2014 Bioinformatics Comp/Phys/APSc 715 Taylor
Microarray Data
• Warning: IANAB
– I am not a biologist
• Array of probes (e.g. bits of genes)
• Measure expression level of probes in a sample.
– relative or absolute
• Youtube video
4/17/2014 Bioinformatics Comp/Phys/APSc 715 Taylor
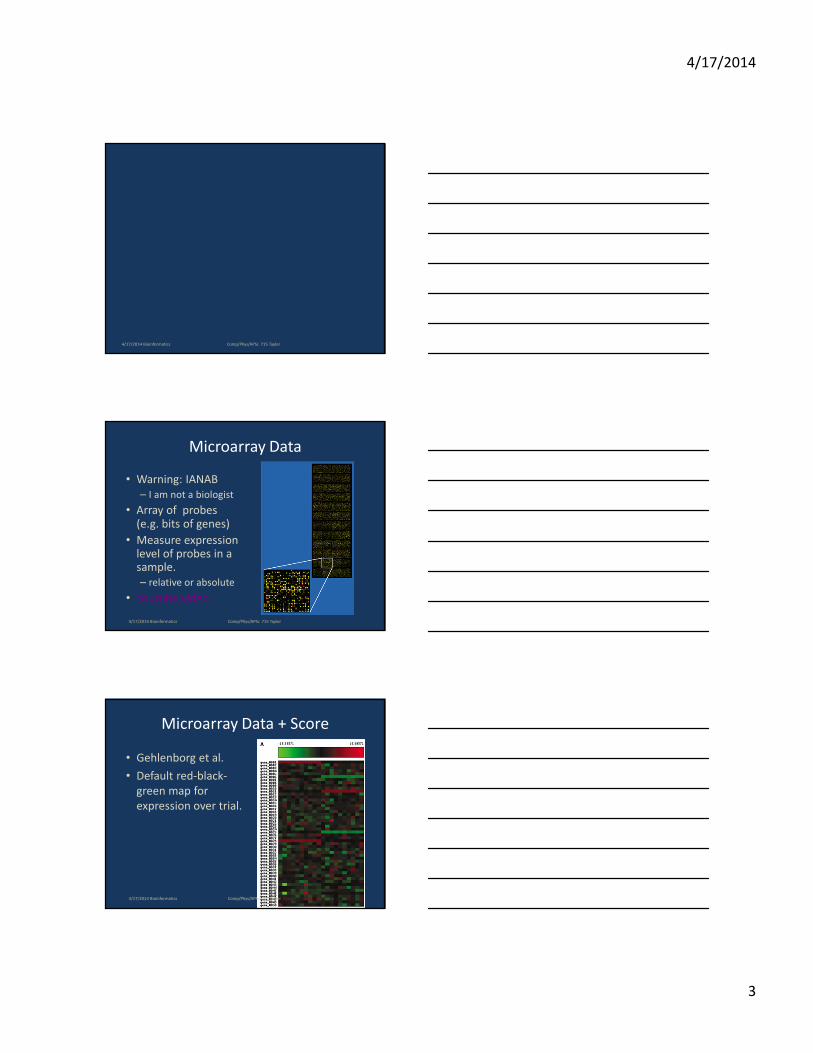
Microarray Data + Score
• Gehlenborg et al.
• Default red-black-
green map for
expression over trial.
4/17/2014 Bioinformatics Comp/Phys/APSc 715 Taylor

4/17/2014
4
Microarray Data + Score
• Gehlenborg et al.
• Default red-black-
green map for
expression over trial.
• Blue channel for
relevance/score
– Uncertainty vis-ish.
4/17/2014 Bioinformatics Comp/Phys/APSc 715 Taylor
Microarray Data + Score
• Gehlenborg et al.
• Default red-black-green map for expression vs. condition.
• Blue channel for relevance/score
– Uncertainty vis-ish.
• Height by gene score.
4/17/2014 Bioinformatics Comp/Phys/APSc 715 Taylor
A) Extra cols.
C) PC plots
D) Height scaling
B) Overview,
color coding
for categorization.
4/17/2014 Bioinformatics Comp/Phys/APSc 715 Taylor
4/17/2014
5
Log scaling
• Most visualizations of microarray data are
log-scaled
– Changes in expression level are smaller for
smaller values
4/17/2014 Bioinformatics 13Comp/Phys/APSc 715 Taylor
4/17/2014 Bioinformatics Comp/Phys/APSc 715 Taylor
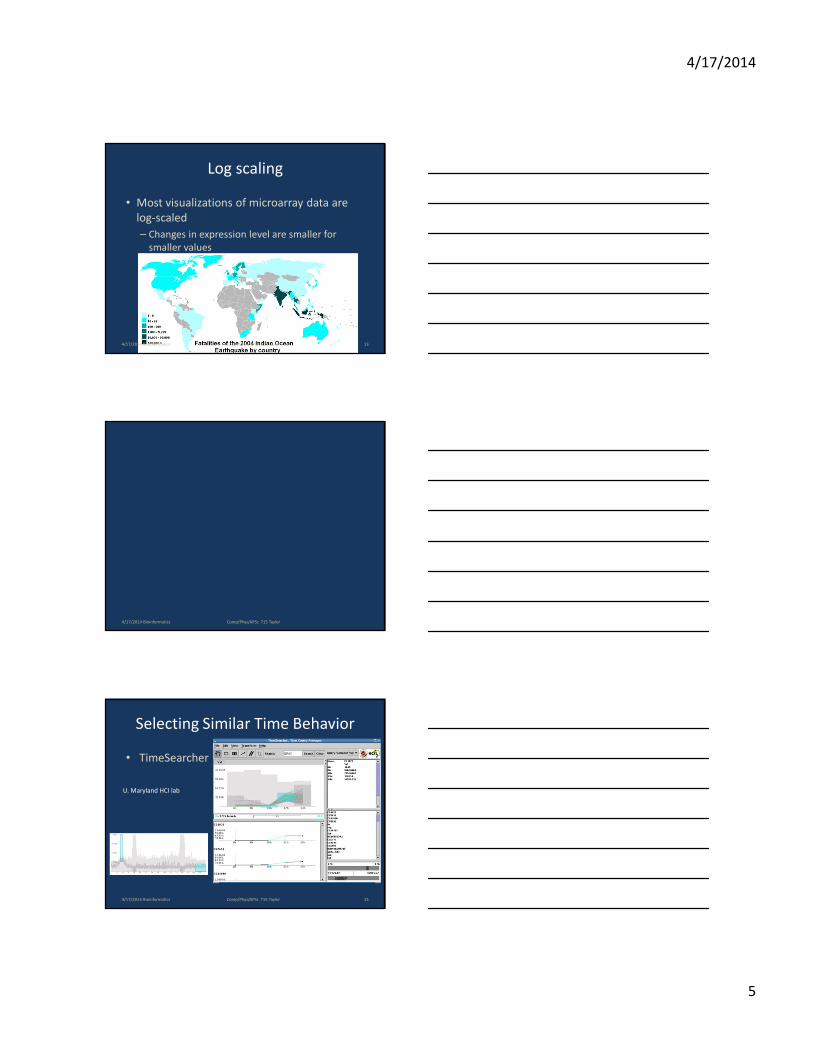
Selecting Similar Time Behavior
• TimeSearcher
4/17/2014 Bioinformatics 15Comp/Phys/APSc 715 Taylor
U. Maryland HCI lab

4/17/2014
6
Animated Scatter Plots(1)
• Parallel Coordinates at one time
4/17/2014 Bioinformatics 16Comp/Phys/APSc 715 Taylor
Animated Scatter Plots(2)
2) Pick a time interval
Scatter plot X and Y derived
4/17/2014 Bioinformatics 17Comp/Phys/APSc 715 Taylor
Animated Scatter Plots(3)
3) Compute derivative scatter plot
4/17/2014 Bioinformatics 18Comp/Phys/APSc 715 Taylor
4/17/2014
7
Animated Scatter Plots(4)
4) Animate (move interval)
4/17/2014 Bioinformatics 19Comp/Phys/APSc 715 Taylor
4/17/2014 Bioinformatics Comp/Phys/APSc 715 Taylor
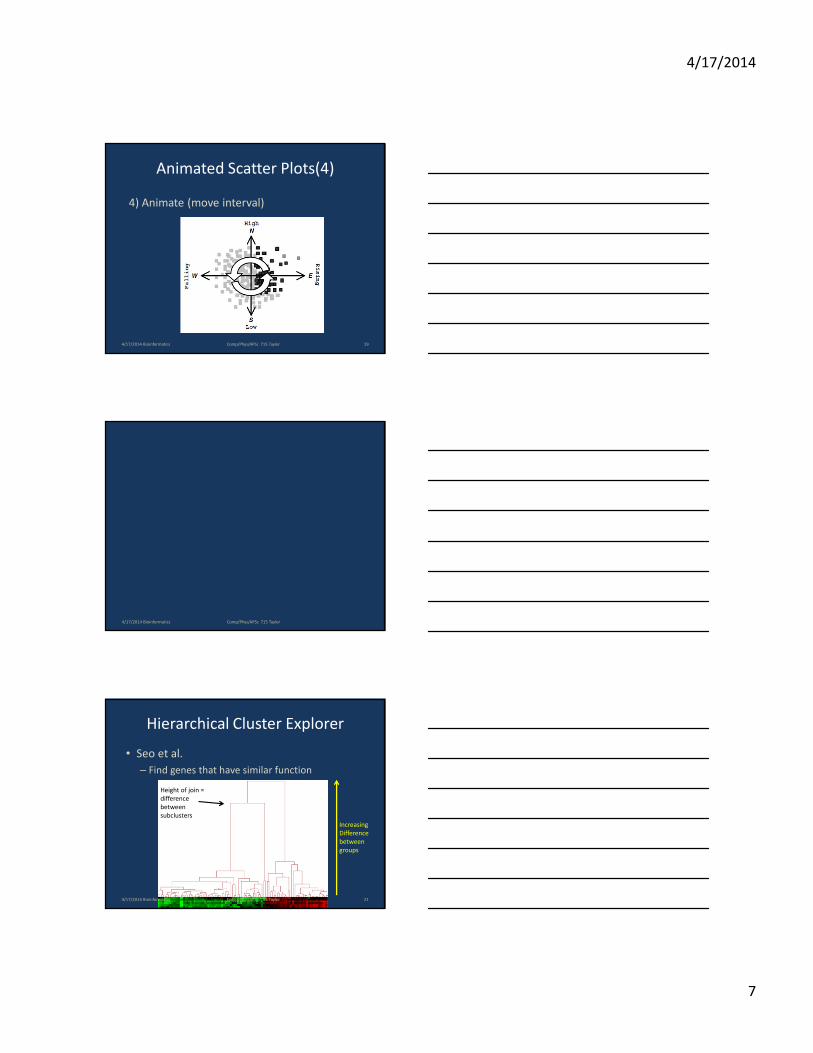
Hierarchical Cluster Explorer
• Seo et al.
– Find genes that have similar function
4/17/2014 Bioinformatics 21Comp/Phys/APSc 715 Taylor
Increasing
Difference
between
groups
Height of join =
difference
between
subclusters
4/17/2014
8
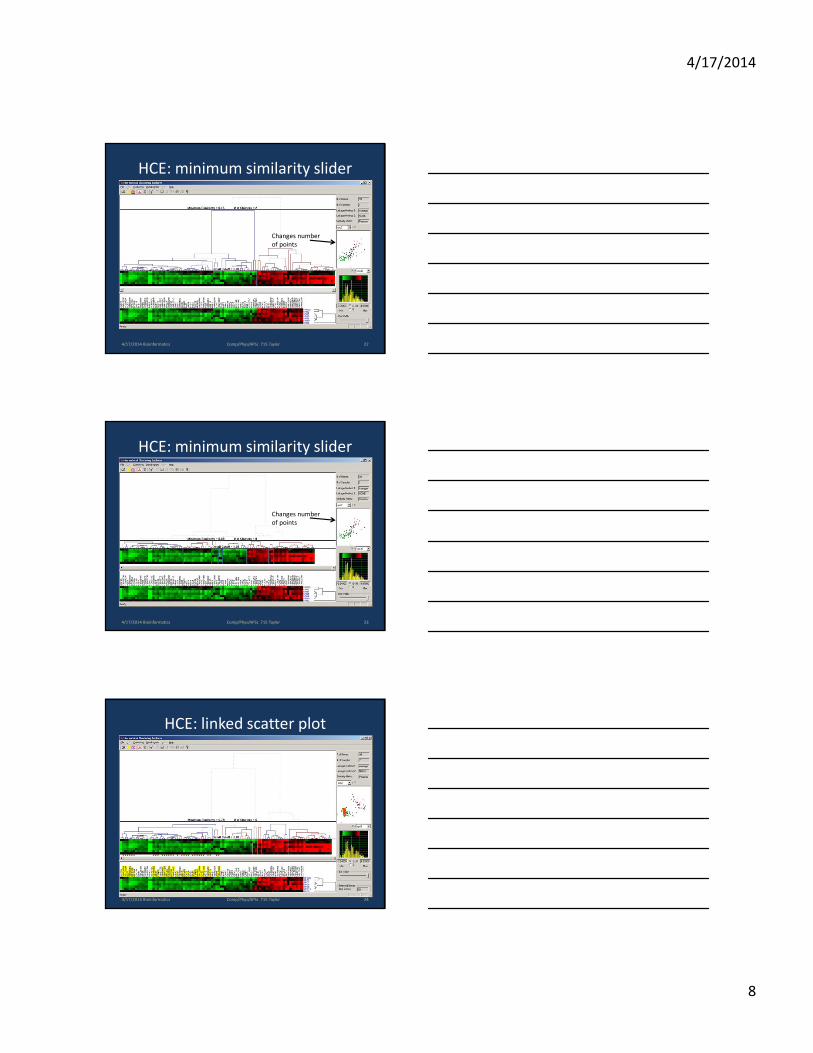
HCE: minimum similarity slider
4/17/2014 Bioinformatics 22Comp/Phys/APSc 715 Taylor
Changes number
of points
HCE: minimum similarity slider
4/17/2014 Bioinformatics 23Comp/Phys/APSc 715 Taylor
Changes number
of points
HCE: linked scatter plot
4/17/2014 Bioinformatics 24Comp/Phys/APSc 715 Taylor
4/17/2014
9
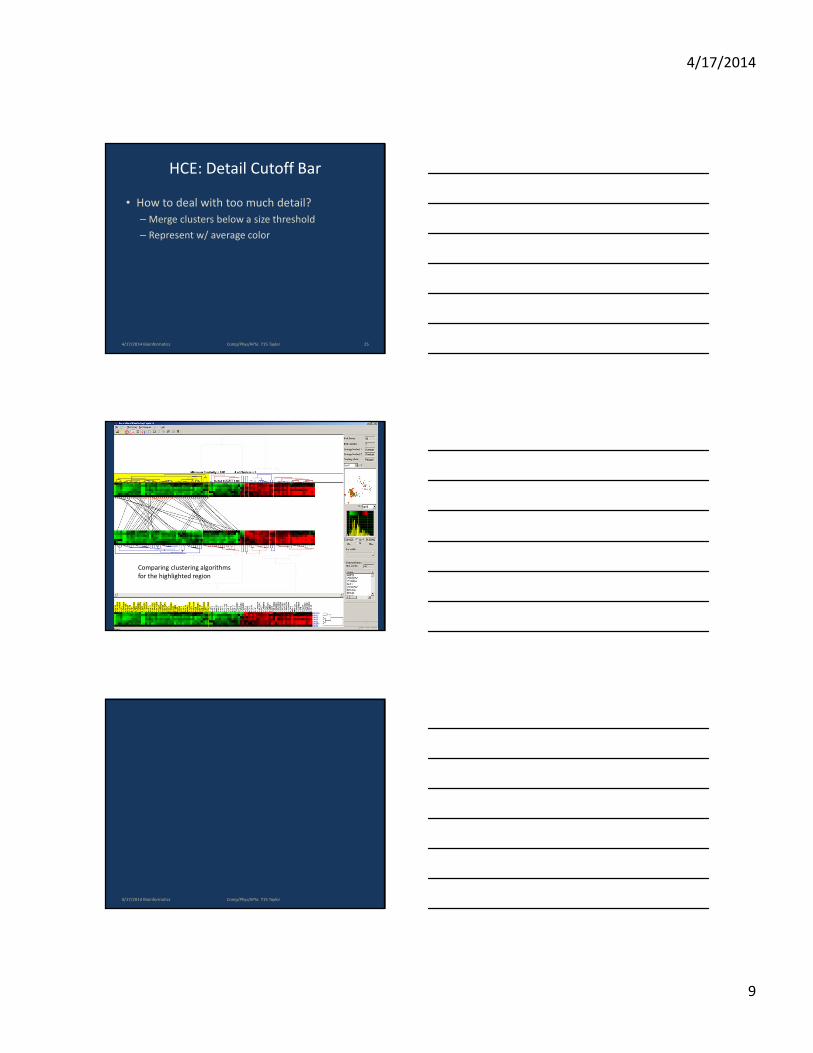
HCE: Detail Cutoff Bar
• How to deal with too much detail?
– Merge clusters below a size threshold
– Represent w/ average color
4/17/2014 Bioinformatics 25Comp/Phys/APSc 715 Taylor
4/17/2014 Bioinformatics Comp/Phys/APSc 715 Taylor
HCE: algorithm comparison
26
Comparing clustering algorithms
for the highlighted region
4/17/2014 Bioinformatics Comp/Phys/APSc 715 Taylor
4/17/2014
10
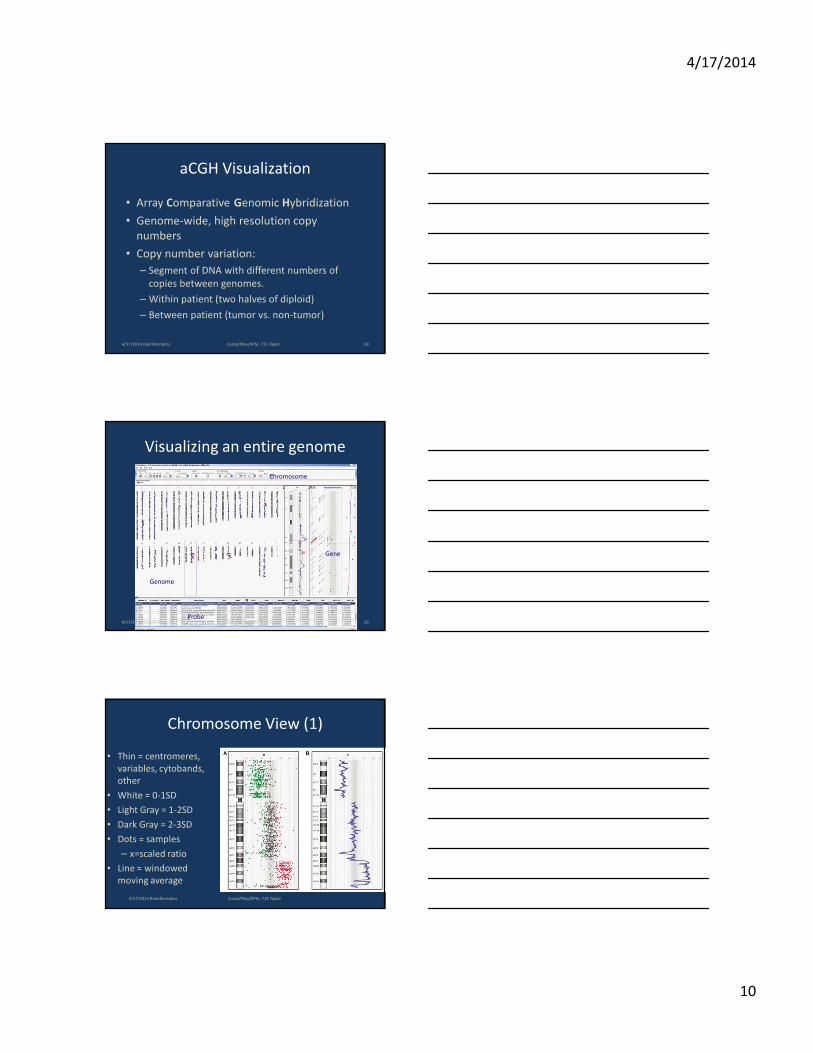
aCGH Visualization
• Array Comparative Genomic Hybridization
• Genome-wide, high resolution copy
numbers
• Copy number variation:
– Segment of DNA with different numbers of
copies between genomes.
– Within patient (two halves of diploid)
– Between patient (tumor vs. non-tumor)
4/17/2014 Bioinformatics 28Comp/Phys/APSc 715 Taylor
Visualizing an entire genome
Genome
Gene
Chromosome
Probe4/17/2014 Bioinformatics 29Comp/Phys/APSc 715 Taylor
Chromosome View (1)
• Thin = centromeres,
variables, cytobands,
other
• White = 0-1SD
• Light Gray = 1-2SD
• Dark Gray = 2-3SD
• Dots = samples
– x=scaled ratio
• Line = windowed
moving average
4/17/2014 Bioinformatics Comp/Phys/APSc 715 Taylor
4/17/2014
11
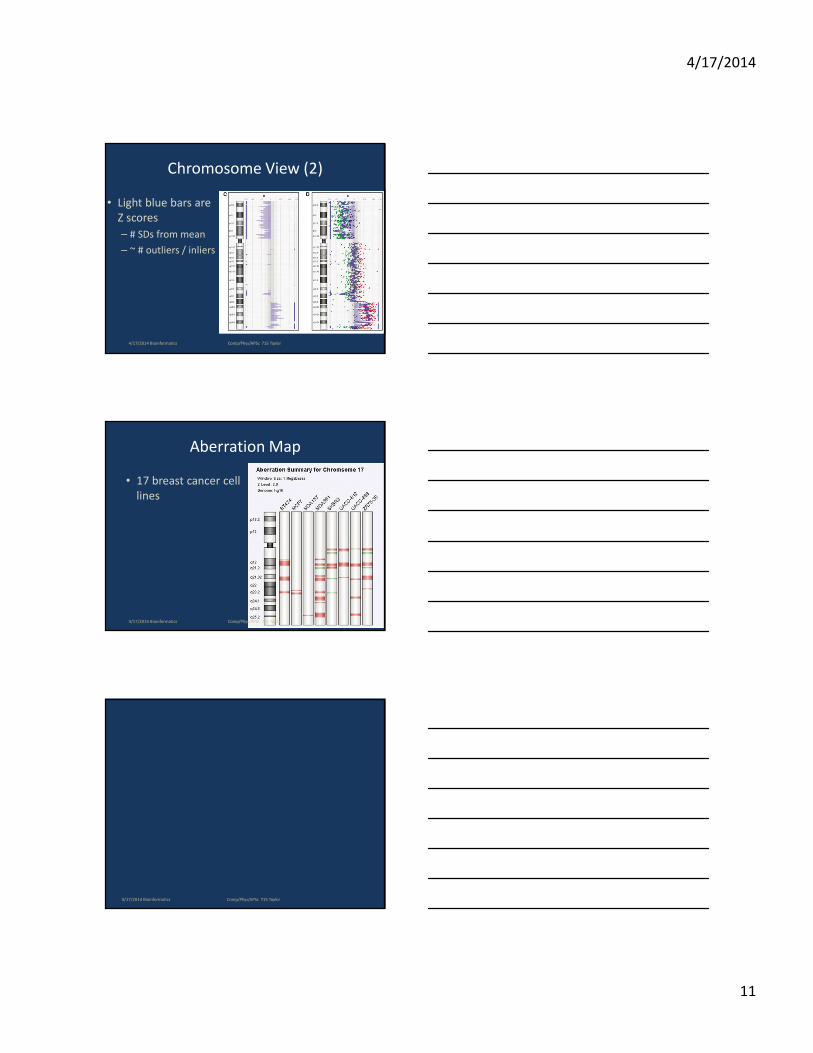
Chromosome View (2)
• Light blue bars are
Z scores
– # SDs from mean
– ~ # outliers / inliers
4/17/2014 Bioinformatics Comp/Phys/APSc 715 Taylor
Aberration Map
• 17 breast cancer cell
lines
4/17/2014 Bioinformatics Comp/Phys/APSc 715 Taylor
4/17/2014 Bioinformatics Comp/Phys/APSc 715 Taylor
4/17/2014
12
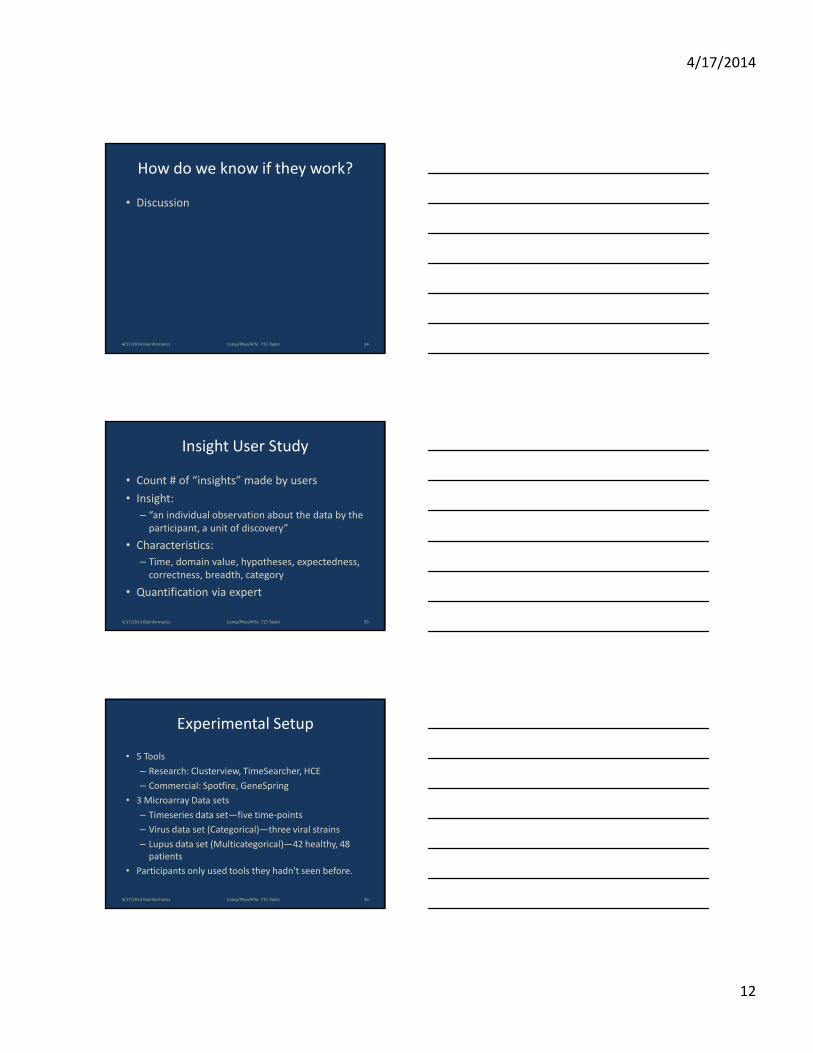
How do we know if they work?
• Discussion
4/17/2014 Bioinformatics 34Comp/Phys/APSc 715 Taylor
Insight User Study
• Count # of “insights” made by users
• Insight:
– “an individual observation about the data by the
participant, a unit of discovery”
• Characteristics:
– Time, domain value, hypotheses, expectedness,
correctness, breadth, category
• Quantification via expert
4/17/2014 Bioinformatics 35Comp/Phys/APSc 715 Taylor
Experimental Setup
• 5 Tools
– Research: Clusterview, TimeSearcher, HCE
– Commercial: Spotfire, GeneSpring
• 3 Microarray Data sets
– Timeseries data set—five time-points
– Virus data set (Categorical)—three viral strains
– Lupus data set (Multicategorical)—42 healthy, 48
patients
• Participants only used tools they hadn't seen before.
4/17/2014 Bioinformatics 36Comp/Phys/APSc 715 Taylor
4/17/2014
13
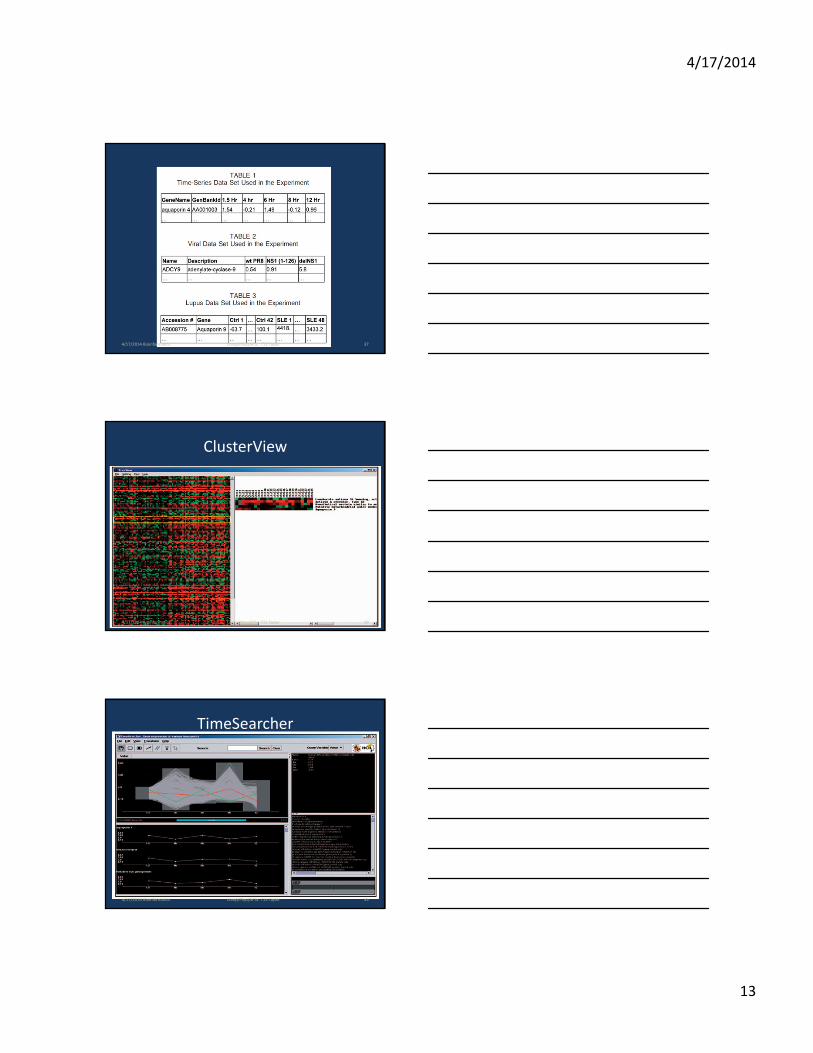
4/17/2014 Bioinformatics 37Comp/Phys/APSc 715 Taylor
ClusterView
4/17/2014 Bioinformatics 38Comp/Phys/APSc 715 Taylor
TimeSearcher
4/17/2014 Bioinformatics 39Comp/Phys/APSc 715 Taylor

4/17/2014
14
(H)ierarchical (C)luster (E)xplorer
4/17/2014 Bioinformatics 40Comp/Phys/APSc 715 Taylor
GeneSpring
4/17/2014 Bioinformatics 41Comp/Phys/APSc 715 Taylor
SpotFire
4/17/2014 Bioinformatics 42Comp/Phys/APSc 715 Taylor

4/17/2014
15
4/17/2014 Bioinformatics Comp/Phys/APSc 715 Taylor
Learning Curves
43
Anecdotal Results
• Winner was specific to data set
– Clusterview – Lupus
– TimeSearcher – time series
– HCE – viral
– SpotFire decent for all
• Specific/free vs. general/commercial
– General == no biological context
– Tying in literature search is good
• Poor usability can break good visualization
• Motivation!
– People learn faster if they care.
4/17/2014 Bioinformatics 44Comp/Phys/APSc 715 Taylor
Where to go from here
• Lit search +++
• Standardization
• High throughput data
– Microarray data needs pathway data for context
• Focus+context
4/17/2014 Bioinformatics 45Comp/Phys/APSc 715 Taylor
4/17/2014
16
4/17/2014 Bioinformatics Comp/Phys/APSc 715 Taylor
Other topics
• Biological pathway visualization
• Sequence visualization
• Taxonomy visualization
4/17/2014 Bioinformatics 47Comp/Phys/APSc 715 Taylor
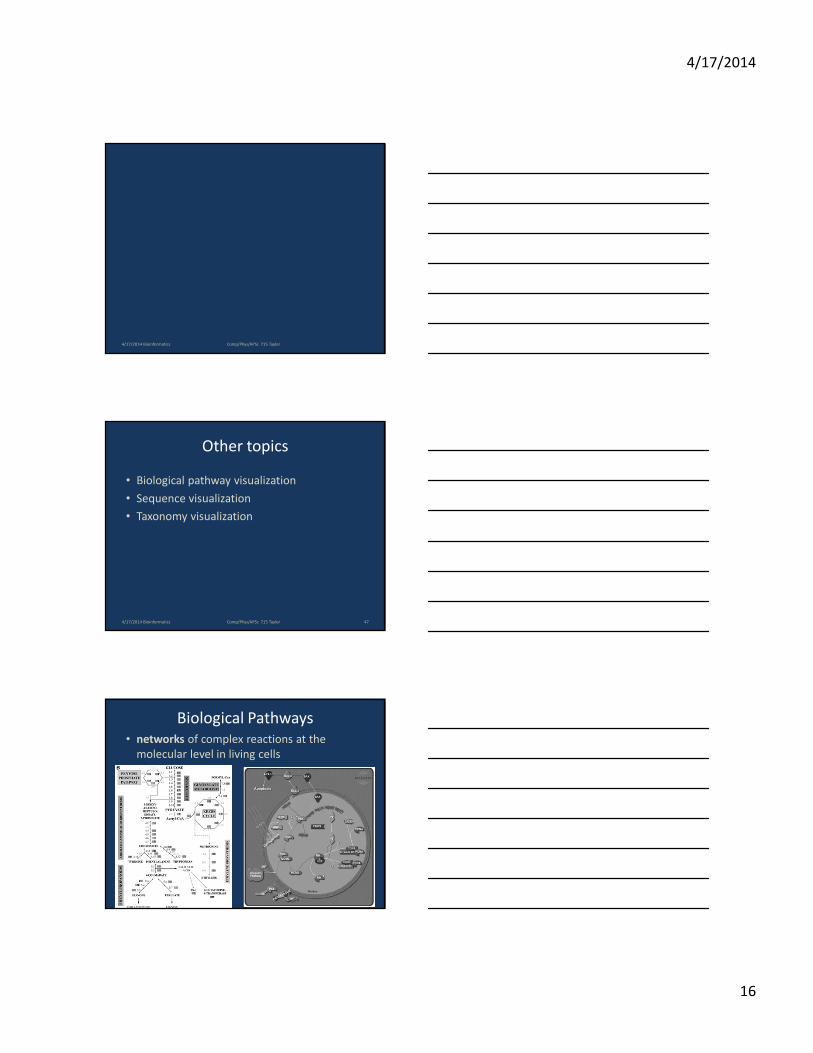
Biological Pathways
• networks of complex reactions at the
molecular level in living cells

4/17/2014
17
Survey of Popular Techniques
• Saraiya et al.
• Requirements analysis
• Anecdotal system evaluations
• Research agenda (future work)
4/17/2014 Bioinformatics 49Comp/Phys/APSc 715 Taylor
General Goals
• recognition of changes between experiment vs
control or between time points
• detection of changes in relationship between
components of a pathway or between entire
pathways
• identification of global patterns across a pathway
• mapping pathway state to phenotype (observable
effects at the physical level in living organisms) or
other biological information
4/17/2014 Bioinformatics 50Comp/Phys/APSc 715 Taylor
Detailed Requirements
• Construct and update
• Context
• Uncertainty
• Collaboration
• Pathway node and
edge info.
• Source
• Spatial information
• Temporal information
• High-throughput data
• Overview
• Interconnectivity
• Multi-scale
• Notebook
4/17/2014 Bioinformatics Comp/Phys/APSc 715 Taylor
4/17/2014
18
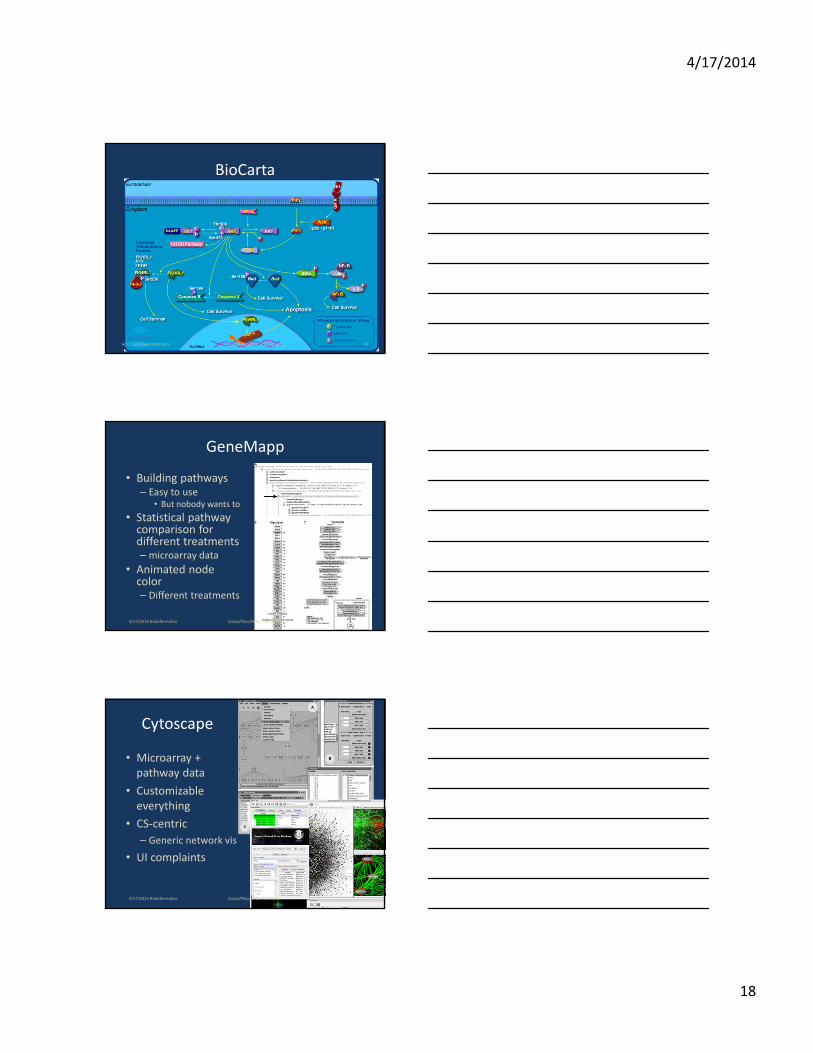
BioCarta
4/17/2014 Bioinformatics 52Comp/Phys/APSc 715 Taylor
GeneMapp
• Building pathways– Easy to use
• But nobody wants to
• Statistical pathway comparison for different treatments– microarray data
• Animated node color– Different treatments
4/17/2014 Bioinformatics Comp/Phys/APSc 715 Taylor
Cytoscape
• Microarray +
pathway data
• Customizable
everything
• CS-centric
– Generic network vis
• UI complaints
4/17/2014 Bioinformatics Comp/Phys/APSc 715 Taylor
4/17/2014
19
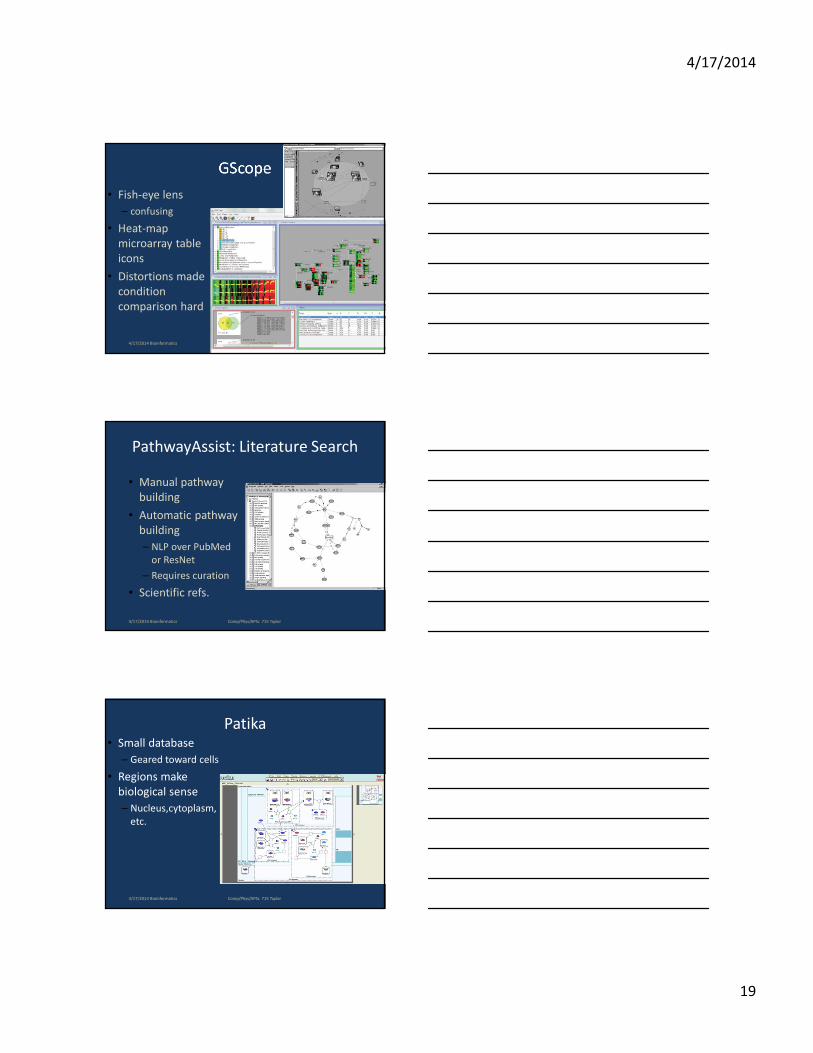
GScope
• Fish-eye lens
– confusing
• Heat-map
microarray table
icons
• Distortions made
condition
comparison hard
4/17/2014 Bioinformatics Comp/Phys/APSc 715 Taylor
PathwayAssist: Literature Search
• Manual pathway
building
• Automatic pathway
building
– NLP over PubMed
or ResNet
– Requires curation
• Scientific refs.
4/17/2014 Bioinformatics Comp/Phys/APSc 715 Taylor
Patika• Small database
– Geared toward cells
• Regions make
biological sense
– Nucleus,cytoplasm,
etc.
4/17/2014 Bioinformatics Comp/Phys/APSc 715 Taylor

4/17/2014
20
GeneSpring
4/17/2014 Bioinformatics 58Comp/Phys/APSc 715 Taylor
Conclusions
• Not enough domain-specific info access
– important for construction (NLP)
• Context in visualization
– cell structures, molecular state
• No standardization
• Better microarray incorporation
4/17/2014 Bioinformatics 59Comp/Phys/APSc 715 Taylor
4/17/2014 Bioinformatics Comp/Phys/APSc 715 Taylor
4/17/2014
21
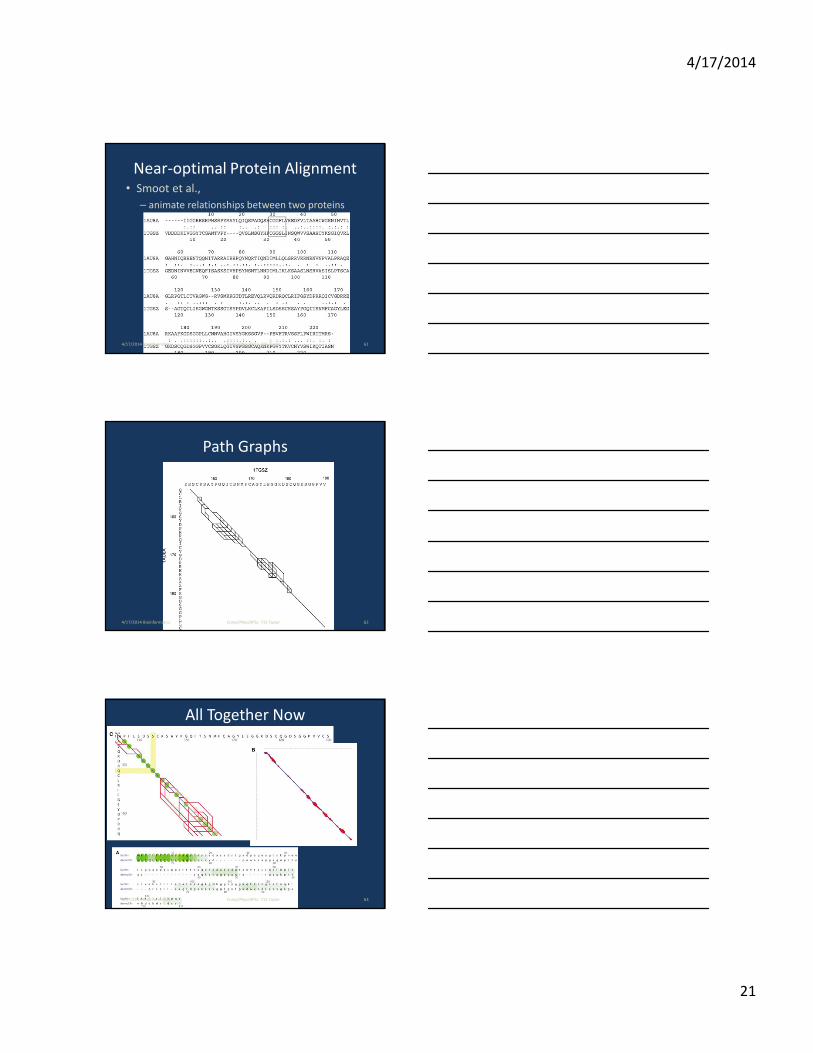
Near-optimal Protein Alignment• Smoot et al.,
– animate relationships between two proteins
4/17/2014 Bioinformatics 61Comp/Phys/APSc 715 Taylor
Path Graphs
4/17/2014 Bioinformatics 62Comp/Phys/APSc 715 Taylor
All Together Now
4/17/2014 Bioinformatics 63Comp/Phys/APSc 715 Taylor
4/17/2014
22
4/17/2014 Bioinformatics Comp/Phys/APSc 715 Taylor
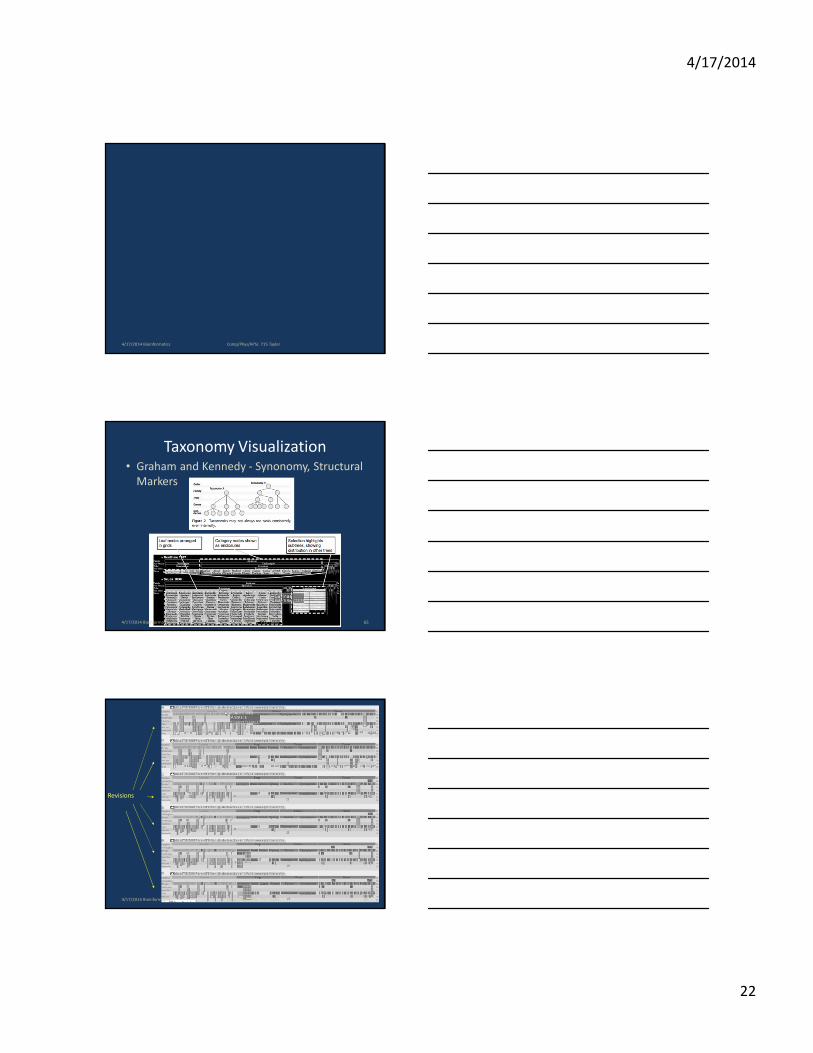
Taxonomy Visualization• Graham and Kennedy - Synonomy, Structural
Markers
4/17/2014 Bioinformatics 65Comp/Phys/APSc 715 Taylor
Revisions
4/17/2014 Bioinformatics 66Comp/Phys/APSc 715 Taylor
4/17/2014
23
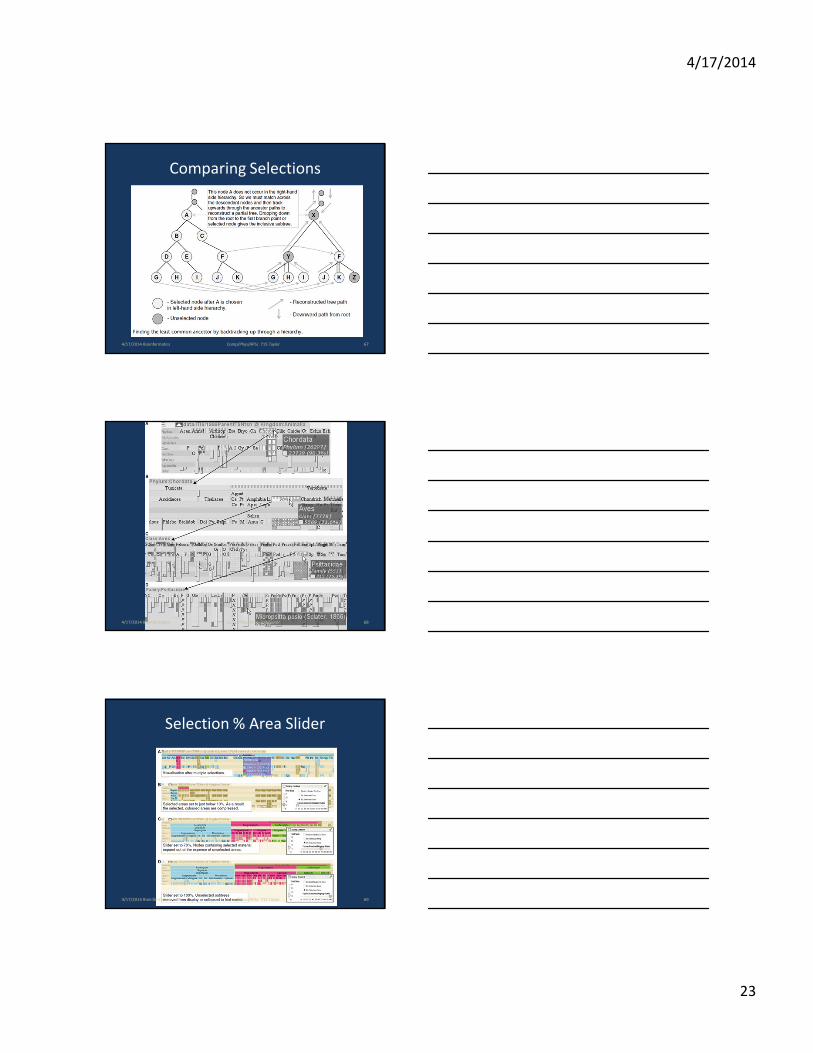
Comparing Selections
4/17/2014 Bioinformatics 67Comp/Phys/APSc 715 Taylor
4/17/2014 Bioinformatics 68Comp/Phys/APSc 715 Taylor
Selection % Area Slider
4/17/2014 Bioinformatics 69Comp/Phys/APSc 715 Taylor
4/17/2014
24
4/17/2014 Bioinformatics Comp/Phys/APSc 715 Taylor 70
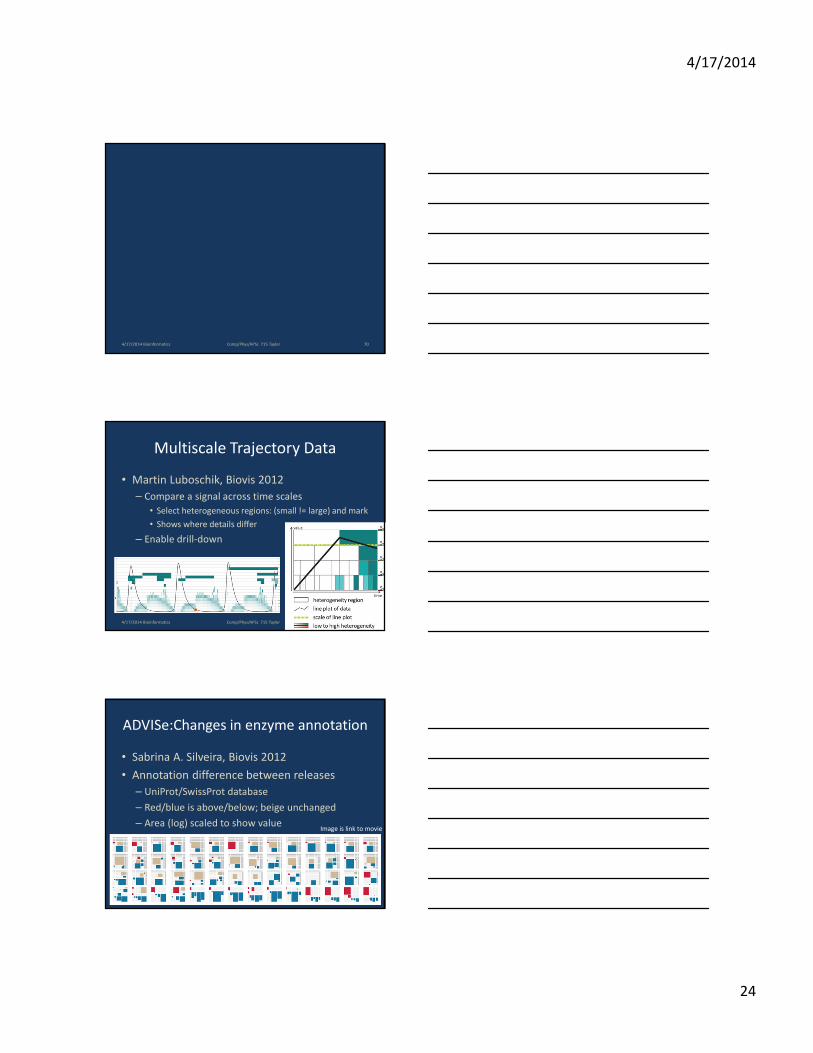
Multiscale Trajectory Data
• Martin Luboschik, Biovis 2012
– Compare a signal across time scales
• Select heterogeneous regions: (small != large) and mark
• Shows where details differ
– Enable drill-down
4/17/2014 Bioinformatics Comp/Phys/APSc 715 Taylor 71
ADVISe:Changes in enzyme annotation
• Sabrina A. Silveira, Biovis 2012
• Annotation difference between releases
– UniProt/SwissProt database
– Red/blue is above/below; beige unchanged
– Area (log) scaled to show value
4/17/2014 Bioinformatics Comp/Phys/APSc 715 Taylor 72
Image is link to movie
4/17/2014
25
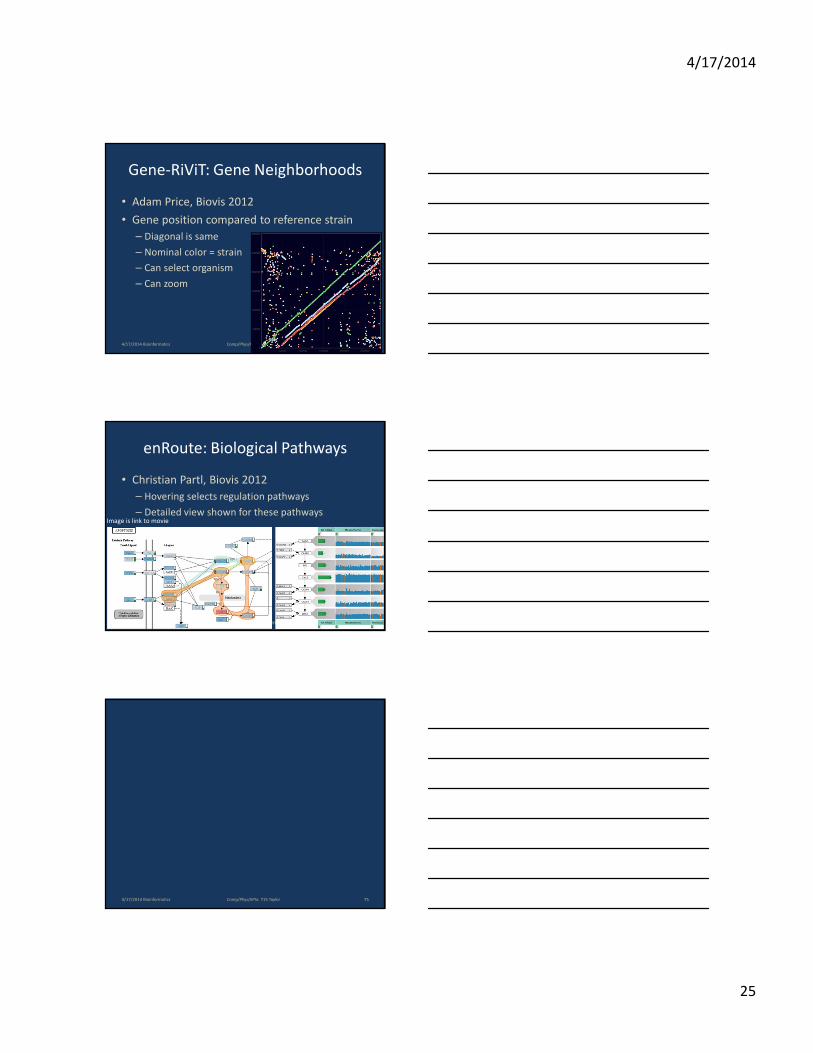
Gene-RiViT: Gene Neighborhoods
• Adam Price, Biovis 2012
• Gene position compared to reference strain
– Diagonal is same
– Nominal color = strain
– Can select organism
– Can zoom
4/17/2014 Bioinformatics Comp/Phys/APSc 715 Taylor 73
enRoute: Biological Pathways
• Christian Partl, Biovis 2012
– Hovering selects regulation pathways
– Detailed view shown for these pathways
4/17/2014 Bioinformatics Comp/Phys/APSc 715 Taylor 74
Image is link to movie
4/17/2014 Bioinformatics Comp/Phys/APSc 715 Taylor 75

4/17/2014
26
This Course: Range of Topics
• Available Visualization Techniques
– 2D scalar, 3D scalar, Vector, Tensor, Multivariate
– InfoVis, BioInformatics
• Visual Perception
– How do you pick from all the options?
• Advanced ParaView Techniques
• Working as a team for a client
– Client feedback, peer feedback, team contracts
4/17/2014 Bioinformatics Comp/Phys/APSc 715 Taylor 76
What You Did (for your CV)
• 10 Designs for real-world data sets
– 5 team designs for homework
– 2 rounds of team design for a client (final project)
– Several in-class designs
• 16 Design critiques
• Formal Evaluation of visualization design
4/17/2014 Bioinformatics Comp/Phys/APSc 715 Taylor 77
How Did I Do?
• Evaluations
– Look for the email with the link soon!
• Which were the most-useful parts?
– Team design exercises? In-depth final projects?
– In-class designs? Particular lectures?
• Which seem to be the least-useful parts?
• Suggestions for improvement
4/17/2014 Bioinformatics Comp/Phys/APSc 715 Taylor 78