2014-15 annual business plan and budget final
TRANSCRIPT
1
+
sustainable
City of Burnside
Annual Business Plan and Budget
2014/15 Adopted at the Council meeting of 24 June 2014
www.burnside.sa.gov.au 401 Greenhill Rd, Tusmore SA 5065 PO Box 9, Glenside SA 5065 Ph: (08) 8366 4200
2
Contents
1. City of Burnside… at a glance .................................................................... 4 2. Message from the Mayor ........................................................................... 5 3. Message from the Chief Executive Officer .................................................. 5 4. Your Council and Elected Members ............................................................ 6 5. Achievement Highlights 2013/14 ............................................................... 8 6. Community Engagement ......................................................................... 11 7. Budget Snapshot ...................................................................................... 13 8. Annual Business Plan Highlights for 2014/15 .......................................... 15 9. Strategic Context ..................................................................................... 18 10. The Community’s Vision – Be the Future of Burnside 2012-2025 ............. 20 11. Strategic Financial Processes .................................................................... 21
11.1 Long Term Financial Plan ................................................................. 21 11.2 Annual Operating Budget and Projects ............................................. 21 11.3 Asset Management ........................................................................... 22 11.4 Financial Sustainability ..................................................................... 22
12. Delivering Our Vision .............................................................................. 23 12.1 Capital projects to deliver our Vision ................................................ 24 11.2 Key projects to deliver our Vision + ................................................... 33 11.3 Services and Programs to deliver our Vision ..................................... 42
12 Measuring Performance ........................................................................... 57 13 Rating Strategy and Policy 2014/15 ......................................................... 57
13.1 Historical Information ......................................................................... 58 13.2 Rate Increase Impact and Rating Structure 2014/15 ......................... 58 13.3 Average Residential Rate .................................................................. 59 13.4 Method Used to Value Land .............................................................. 59 13.5 Valuation Objections ........................................................................ 59 13.6 Trend in Valuations .......................................................................... 60 13.7 Growth .............................................................................................. 62 13.8 General Rates .................................................................................... 62 13.9 Minimum Rate .................................................................................. 62 13.10 Natural Resources Management Levy ............................................... 63 13.11 Remissions (Government Concessions) ............................................. 64 13.12 Rebate of Rates – Under the Local Government Act 1999 ................. 64 13.13 Rebate of Rates – Discretionary ......................................................... 64 13.14 Rebate of Rates – Private Water Suppliers ......................................... 66 13.15 Rate Relief – Residential Maximum Rate Increase/Rate Capping ..... 66 13.17 Hardship Provisions .......................................................................... 68
13.17.1 Remission of Rates – Residential Properties ................................ 68 13.17.2 Guiding Principles of Eligibility for Remission of Rates ............... 68 13.17.3 Application Criteria .................................................................... 68
13.18 Postponement of Rates ...................................................................... 69 13.18.1 Seniors ........................................................................................ 69 13.18.2 Relief from Hardship .................................................................. 69
14 Financial Statements ................................................................................ 70 Appendix B ...................................................................................................................... 73
3
Appendix C ..................................................................................................................... 74 Appendix D ..................................................................................................................... 75 Appendix E ...................................................................................................................... 76
4
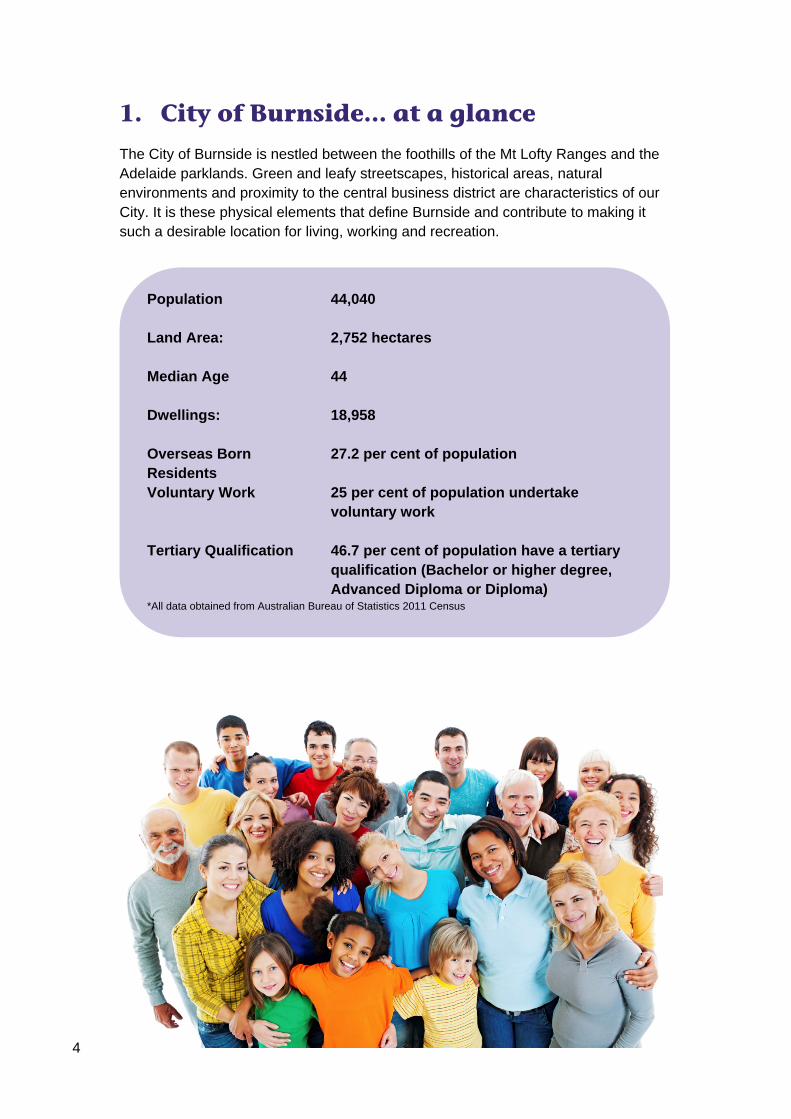
1. City of Burnside… at a glance
The City of Burnside is nestled between the foothills of the Mt Lofty Ranges and the Adelaide parklands. Green and leafy streetscapes, historical areas, natural environments and proximity to the central business district are characteristics of our City. It is these physical elements that define Burnside and contribute to making it such a desirable location for living, working and recreation.
Population 44,040
Land Area: 2,752 hectares
Median Age 44
Dwellings: 18,958
Overseas Born Residents
27.2 per cent of population
Voluntary Work 25 per cent of population undertake voluntary work
Tertiary Qualification 46.7 per cent of population have a tertiary qualification (Bachelor or higher degree, Advanced Diploma or Diploma)
*All data obtained from Australian Bureau of Statistics 2011 Census

5
2. Message from the Mayor
The capital and operating expenditure plans in the 2014/15 Annual Business Plan and Budget are derived from Council’s strategic planning framework of Community and Corporate Plans. These plans set the City of Burnside’s expenditure priorities.
The Annual Business Plan and Budget 2014/15 relies on an average rate increase of 3.9 per cent, the same increase as last year.
The unexpected weather events of February 2014 caused a clean-up bill of more than $840,000 for 2013/14 and an anticipated expense of $530,000 for 2014/15.
This means Council must make decisions on which operational programs and capital expenditure will be undertaken during the next financial year.
We are working hard to manage the storm costs, while delivering a sound budget and not impacting rates.
David Parkin
Mayor
3. Message from the Chief Executive Officer
Council has prepared this Annual Business Plan and Budget 2014/15 which seeks to balance the demand for services and infrastructure with the community’s capacity to pay.
This budget has been framed in the face of increasing external financial pressures on our bottom line. Like you, we are facing significant impacts from increases in electricity and water costs, carbon pricing, Environment Protection Agency (EPA) Waste Levy increases and our costs associated with the maintenance of parks, reserves, property and infrastructure, while at the same time, reductions in federal grants.
The costs incurred from February’s storms were obviously not budgeted for and present some decisions for Council as to how to manage them.
This Annual Business Plan and Budget shows a continued commitment to responsible governance. It demonstrates sound stewardship of the community’s assets while providing value to all ratepayers.
Paul Deb
Chief Executive Officer
6
4. Your Council and Elected Members
Mayor David Parkin
Kensington Park Ward
Kensington Gardens and Magill
Suburbs: Beulah Park, Hazelwood Park,
Kensington Park, Leabrook
Suburbs: Auldana, Kensington Gardens, Magill,
Rosslyn Park, Skye
Cr Leni Palk Cr Jane Davey Cr Grant Piggott Cr Tony Pocock
7
Rose Park and Toorak Gardens
Burnside
Suburbs: Dulwich, Rose Park, Toorak
Gardens, Tusmore
Suburbs: Burnside, Erindale, Stonyfell, Wattle
Park
Cr Peter Cornish Cr Robert Hasenohr Cr Graham Bills Cr Michael Capogreco
Beaumont
Eastwood and Glenunga
Suburbs: Beaumont, Glen Osmond, Leawood
Gardens, Linden Park, Mt Osmond, St
Georges, Waterfall Gully
Suburbs: Eastwood, Frewville, Glen Osmond,
Glenside, Glenunga
Cr Anne Monceaux Cr Mark Osterstock Cr Helga Lemon Cr Di Wilkins

8
5. Achievement Highlights 2013/14
Our Integrated Urban Form and Living Spaces
As part of the Alexandra Avenue and Prescott Terrace War Memorial, the identification plinths, that acknowledge every fallen soldier at each Elm tree, were refurbished or reconstructed and new anodized disks installed. Fourteen War Memorial Trees that form part of the Avenue of Trees were replaced with established and mature Elms. Each new tree planted also has an individual drip irrigation system. Continued replacement of war memorial trees will occur as needed as will ongoing minor irrigation works to individual trees.
The pruning of Sugar Gums in Hazelwood Park as part of the Hazelwood Park Management Plan was undertaken.
A number of Capital Works programs were completed and included:
• 650 metres of new underground drainage installed;
• 5,250 metres of kerb and gutter installed;
• 12 kilometres of footpath renewed, rehabilitated or constructed new;
• 900 meters of road pavement strengthened and resurfaced;
• 9.5 kilometres of road resurfaced;
• 132 metres of guardrail installed; and
• 7 new bush shelters installed.
A flood mitigation options study was completed during the financial year to identify methods of reducing the incidence or severity of flooding in Beulah Park. Works will be programmed in future capital works programs.
The Burnside Adventure Playground was upgraded providing new play elements including a double flying fox, renewed soft-fall and improved landscaping elements adding further interest to this already popular playground. Other playgrounds replaced included at Miller Reserve and Tregenza Reserve with a new ‘mini’ playground installed at the Civic Centre to service families visiting the Toy Library.
Sporting facilities also received upgrades through the year in particular Glenunga’s Webb and Margaret Bond Ovals now have improved lighting, irrigation and drainage systems. New tennis courts have been provided at Kensington Gardens along with a new car park surface to remove the tripping hazards presented by lifting tree roots. At Tusmore Park, a new court surface was installed at the tennis courts and improvements made to the pathways in the Park. New toilet facilities have been constructed at Hazelwood Park.
A number of minor building works were also completed on a range of Council owned buildings including a new roof at Christopher Rawson Penfold Kindergarten and the continuation of the asbestos removal from old electrical switchboards.
Langman Reserve has improved fencing and barriers to reduce the risk to the public from falling down the steep gradients around this popular lookout.

9
Council approved the Sport and Recreation Strategy this year and the Playground Strategy is approved for public consultation. These documents will help set the future direction for the development and investment in our reserves, sport fields and recreational facilities.
Our Protected and Valued Environment
A number of natural areas were highlighted for conservation works during the 2013/14 financial year. This included works to address high priority fire hazard sites in the Hills Face Reserves as well as removal of woody weeds and revegetation works in various reserves.
Waterfall Gully Reserve ‘Caring for our Country’ Grant allowed the continuation of the terrific regeneration work that the Burnside Biodiversity Volunteers Group for the Waterfall Gully Reserve Project have been doing, this also included the design and installation of an interpretive sign.
The Tree Planting Program for this financial year included 90 trees for the 2nd Generation Program and 412 trees for the Inter-planting Program.
Our Diverse, Supportive, Happy and Healthy People
The City of Burnside became part of the state-wide One Library Management System on 13 February 2014. Library staff spent months training for the new system and preparing our data for a successful transfer. Since going live, the Council has taken delivery of more than 1,000 tubs of Library materials for our borrowers and sent out nearly 1,000 to other Libraries.
In 2013/14, the Burnside Library added 3,679 new books, 2,702 periodicals, 1,638 DVDs, 294 CDs and 256 Spoken Word CDs to its collection.
At its meeting on 23 July 2013, Council endorsed the Glenunga Reserve Community Hub Project Plan. All detailed construction documentation has been finalised and Development Approval is anticipated in July 2014. Further to this a tender process to select the builder is almost complete and it is anticipated that construction will commence in September 2014 and is scheduled for completion in late 2015.
All construction documentation was finalised during the year with subsequent Development Approval for the redevelopment of the Burnside Swimming Centre granted in November 2013. Construction commenced in February 2014 and continues in accordance with the agreed schedule. It is anticipated that construction will be completed in late 2014.
Our Leading Inclusive and Connected Council
The second Annual Community Survey was undertaken in March 2014 using a statistically valid random telephone survey of 800 City of Burnside residents. The
10
purpose of the Annual Survey was to provide a measure of the level of community satisfaction and performance with the delivery of services provided by the City of Burnside to its residents.
As part of Council’s ongoing commitment to providing a workplace environment that is healthy and safe, hearing and noise assessments have been undertaken on all affected staff and equipment likely to generate harm levels of noise during the year.
The Digital Design and Development Program empowered the City of Burnside to reduce support and maintenance costs for third party applications. This resulted in cost avoidance for several applications ranging from $20,000 - $100,000 each including a strategic business planning system, Professional Development Review (PDR) system, and Key Performance Indicator (KPI) tracking system across all Council business functions.
The Mobile Workforce and Virtual Private Network (VPN) Upgrade project allowed for the creation of a new application for Burnside Asset Mapping (BAM!). Initially focussing on collecting a tree inventory, tracking tree requests, and doing risk based tree assessments, the BAM! Application was integral in assisting field workers in identifying hazardous trees following the February 2014 storm event. The BAM! Application was a finalist in the national eGovernment awards and is now used for a variety of Council owned assets.
11
6. Community Engagement
Council is engaged with our community on the budget for 2014/15 in compliance with the legislative requirements of Section 123 (4) of the Local Government Act, 1999.
This engagement included:
issuing a Public Notice for the public meeting in the Eastern Courier Messenger on 30 April 2014 – 21 days prior to the Public Meeting
hosting a public Meeting conducted on 21 May 2014 - 21 days from 30 April (closing date of the engagement period)
commencing the community engagement on the Business Plan and Budget 2014/15 on 30 April 2014 and closing on 4 June 2014 – 35 days total
promotion of the community engagement process in the Messenger column on 14 and 28 May 2014
a city-wide distribution of the community engagement flyer, including notification of the Public meeting, to 20,600 properties
the postage of 6,600 copies of the community engagement flyer to all ratepayers that live externally to the City
a web-based campaign including an online survey, a copy of document, an email option to contact Council and the budget allocator feedback tool
a notification email to 998 subscribers who have previously nominated to receive information from Council.
copies of document made available, at no cost and on request, at the customer service counter
promotion on social media via social media forums for opening of engagement, public meeting and last call to action days before the engagement period closed
a council officer, with contact details, made available for further enquiries
promotion of the community engagement in the Winter 2014 Focus magazine distributed City-wide as an insert in the Eastern Courier Messenger.
The results for the 2014/15 Business Plan and Budget community engagement process indicated that the majority of respondents are satisfied with the range and level of services that the City of Burnside provides, and that they would prefer to maintain the rates increase of 3.9 per cent, with a balanced budget.
Strong support for expenditure on footpaths, open space and tree management emerged with other work areas such as roads, kerbs, drainage, traffic, parking, youth services, library purchase of materials, community facilities and council facilities to be maintained at the same level of expenditure.
12
Whilst respondents recommended a reduction in spending on traffic calming, there was support for the allocation of funds for the proposed cat management by-law implementation.
13
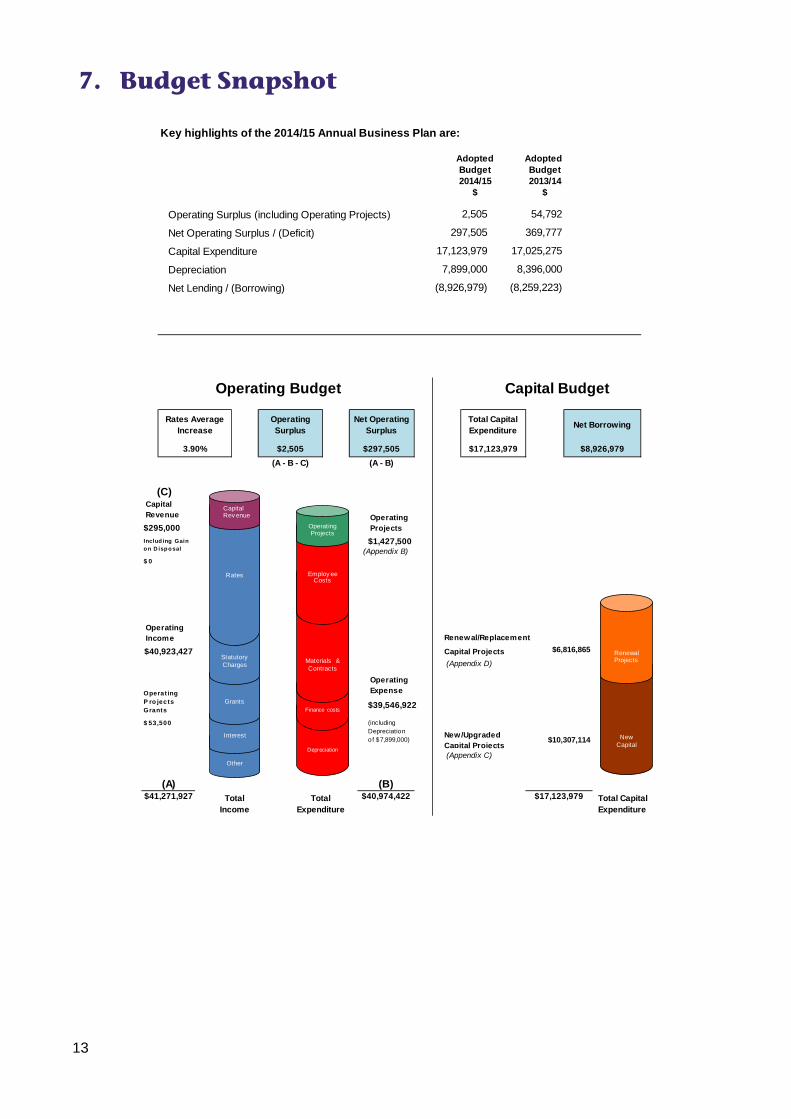
7. Budget Snapshot
Key highlights of the 2014/15 Annual Business Plan are:
Adopted Adopted Budget Budget2014/15 2013/14
$ $
Operating Surplus (including Operating Projects)
Net Operating Surplus / (Deficit)
Capital Expenditure
Depreciation
Net Lending / (Borrowing)
Renewal/Replacement
Capital Projects
Operating Expense
$17,123,979 Total Capital Expenditure
$6,816,865
369,777
17,025,275
8,396,000
(8,259,223)
$10,307,114
Net Borrowing
$ 0
$295,000
$1,427,500
Operating Income
$40,923,427
Includ ing Gain o n D isp o sal
$41,271,927 Total Income
Total Expenditure
$40,974,422
Operat ing P ro jects Grants
$39,546,922
(including Depreciationof $7,899,000)
(A) (B)
$ 53,500
Capital Revenue
$8,926,979
(A - B - C) (A - B)
(C)
7,899,000
(8,926,979)
Rates Average Increase
Operating Surplus
$2,505
(Appendix C)
2,505 54,792
(Appendix B)
Operating Projects
$17,123,979
297,505
17,123,979
(Appendix D)
Capital Budget
Total Capital Expenditure
New/Upgraded Capital Projects
Operating Budget
Net Operating Surplus
$297,5053.90%
Depreciation
Finance costs
Materials & Contracts
Other
Interest
Grants
Statutory Charges
Rates
Capital Rev enue
Employ ee Costs
Operating Projects
New Capital
Renewal Projects
14
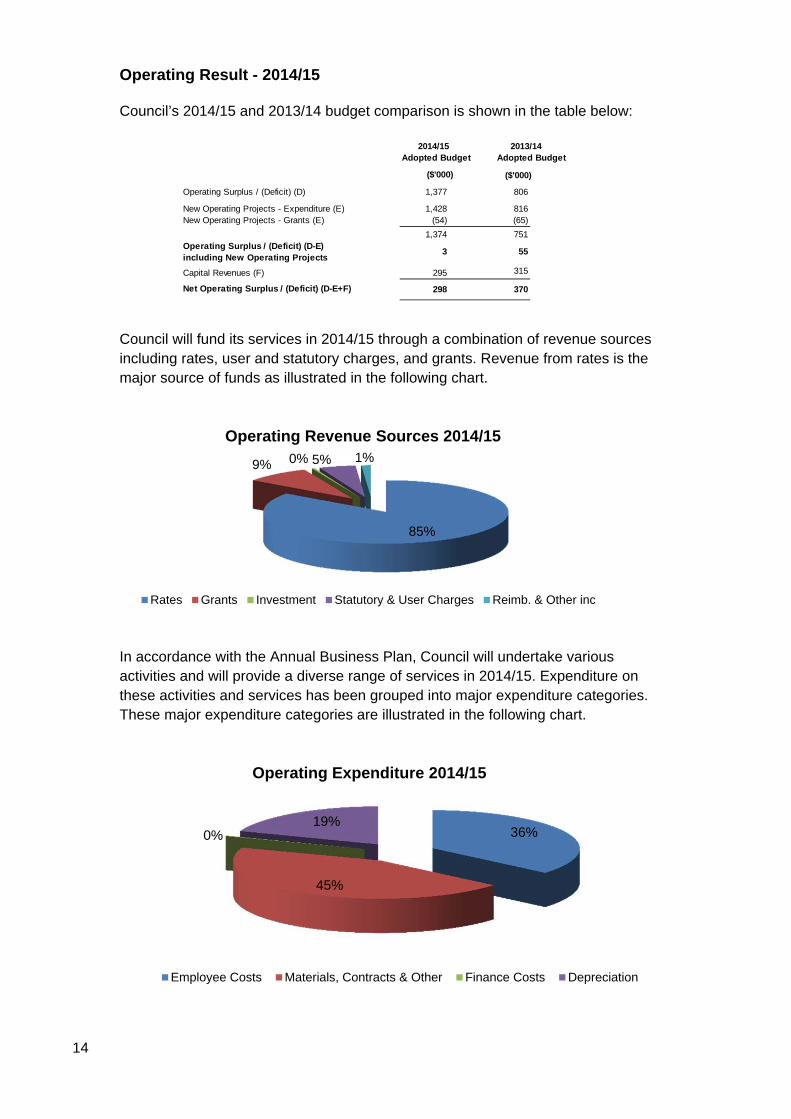
Operating Result - 2014/15
Council’s 2014/15 and 2013/14 budget comparison is shown in the table below:
Council will fund its services in 2014/15 through a combination of revenue sources including rates, user and statutory charges, and grants. Revenue from rates is the major source of funds as illustrated in the following chart.
In accordance with the Annual Business Plan, Council will undertake various activities and will provide a diverse range of services in 2014/15. Expenditure on these activities and services has been grouped into major expenditure categories. These major expenditure categories are illustrated in the following chart.
($'000)
1,377 806
1,428 816(54) (65)
1,374 751
3 55
295 315
298 370Net Operating Surplus / (Deficit) (D-E+F)
2013/14 Adopted Budget
Operating Surplus / (Deficit) (D)
New Operating Projects - Grants (E)
Operating Surplus / (Deficit) (D-E)including New Operating Projects
Capital Revenues (F)
New Operating Projects - Expenditure (E)
2014/15 Adopted Budget
($'000)
85%
9% 0% 5% 1%
Operating Revenue Sources 2014/15
Rates Grants Investment Statutory & User Charges Reimb. & Other inc
36%
45%
0%19%
Operating Expenditure 2014/15
Employee Costs Materials, Contracts & Other Finance Costs Depreciation
15
8. Annual Business Plan Highlights for 2014/15
Over the past year, Council has received many great ideas for our City, including those received in our Annual Community Survey and these have helped us develop this Annual Business Plan and Budget. The Annual Business Plan details the programs that Council will operate and the outcomes it seeks to achieve for the coming financial year. The Plan refers to the continuing services and programs and Strategic Directions within Council’s Strategic Community Plan and Long-Term Financial Plan.
Annual Community Survey
The Annual Community Survey was undertaken in February 2014 using a statistically valid random telephone survey of 800 City of Burnside residents. The purpose of the Annual Community Survey was to provide a measure of the level of community satisfaction and performance with the delivery of services provided by the City of Burnside to its residents. The trends and results that come from these questions will be used to measure the Council’s performance in delivering and achieving the Strategic Community Plan Desired Outcomes. It was also intended to gather information from the community for helping to develop the future of the City, by collecting ideas, opinions and priorities to guide the future planning and budget allocation processes.
Top five respondent suggestions from the Community Survey were:
Footpaths repair and more footpaths
Parking (more policing of parking, greater supply of parking and less restrictions/greater leniency for residents)
Increased road maintenance
Increased tree maintenance
Providing services for younger residents
This Annual Business Plan and Budget recognises these respondent suggestions and has provided funds accordingly.
The Council’s overall priority for 2014/15 is to undertake initiatives which respond to our Vision of the City and to contribute to the outcomes sought for the future of Burnside. The 2014/15 Annual Business Plan and Budget is built around the four key Strategic Directions of our Strategic Community Plan which provide focus areas for:
Our Integrated Urban Form
$25,000 for the War Memorial Tree Replacement Program
$20,000 for the Public Domain Streetscape Strategy
16
Council budgeted $5,000 for the Property Strategy
$10,000 for the Bus Stop Compliance Project
The Roundabout Landscape Renewal Program is allocated $100,000
An Additional Tree Crew is required for 12 months at the cost of $200,000
Council has budgeted $180,000 for two Arboriculture Support Officers to be engaged on a 12 month contract
The Significant Regulated Tree Assistance Scheme is allocated $25,000
$7,000 for the Heritage Awards
$90,000 is allocated in the budget for Arboriculture – Truck Mounted EWP Hire
Council budgeted $65,000 for the Arboriculture – City Wide Council Tree Audit
$25,000 is be allocated to undertake the Hazelwood Park Creek Line Rehabilitation
The new Kensington Gardens Reserve Masterplan will commence and Council allocated $35,000 for this work
$15,000 is budgeted for engineering works to be undertaken on the Tusmore Wading Pool
A Geotechnical Review of Waterfall Gully will be undertaken and $16,000 is allocated to undertake this work
Council will re-establish irrigation to Bushy Park Reserve, Auldana to the value of $8,000
Our Protected and Valued Environment
$59,000 is budgeted for the Brown Hill / Keswick Creek Project
Council budgeted $4,000 for the Environment and Biodiversity Strategy Consultation
A $20,000 Bushfire Prevention Chipping Program will commence
At Harris Reserve, Creek Erosion Management will be undertaken requiring a budget of $35,000
Our Diverse, Supportive, Happy and Healthy People
$100,000 to implement a new Cat Management By-Law
For the Woody Weed Removal Program Council will spend $50,000 on the Hills Face Reserves and $20,000 on the Hills Face Verges
$15,000 is been budgeted for the Urban Woody Weed Tree Removal Program
17
Council will spend $15,000 to undertake a Booking Management System Health Check
Council allocated $12,500 for the establishment of the Friends of Magill Cemetery
$25,000 is allocated to support Land Conservation Volunteers
$5,000 is budgeted by Council to continue the Youth Advisory Committee and National Youth Week activities
Our Leading, Inclusive and Connected Council
Council budgeted $45,000 for the Annual Community Survey 2015
$11,000 is budgeted for the ongoing land Encroachment Program

18
9. Strategic Context
Under section 123 of the Local Government Act, 1999 each Council must have a budget for each financial year. This budget must be considered in conjunction with the Council’s Annual Business Plan (and be consistent with that plan) and must be adopted before 31 August for the financial year.
Council therefore prepares, as part of its budget development process, an Annual Business Plan.
This Annual Business Plan and Budget 2014/15 has been prepared to:
provide a sustainable budget position that reflects our community’s needs and expectations;
avoid reducing services or service standards and the resulting impacts on our community;
continue to meet current commitments, strategies and plans in relation to our projects and capital works;
ensure long-term financial sustainability objectives; and
continue to deliver on the Strategic Community Plan.
In tandem with our Strategic Community Plan, we have developed a rolling 10-year financial plan, which we call our Long-Term Financial Plan, which will ensure we deliver the Desired Outcomes of the Community Plan.
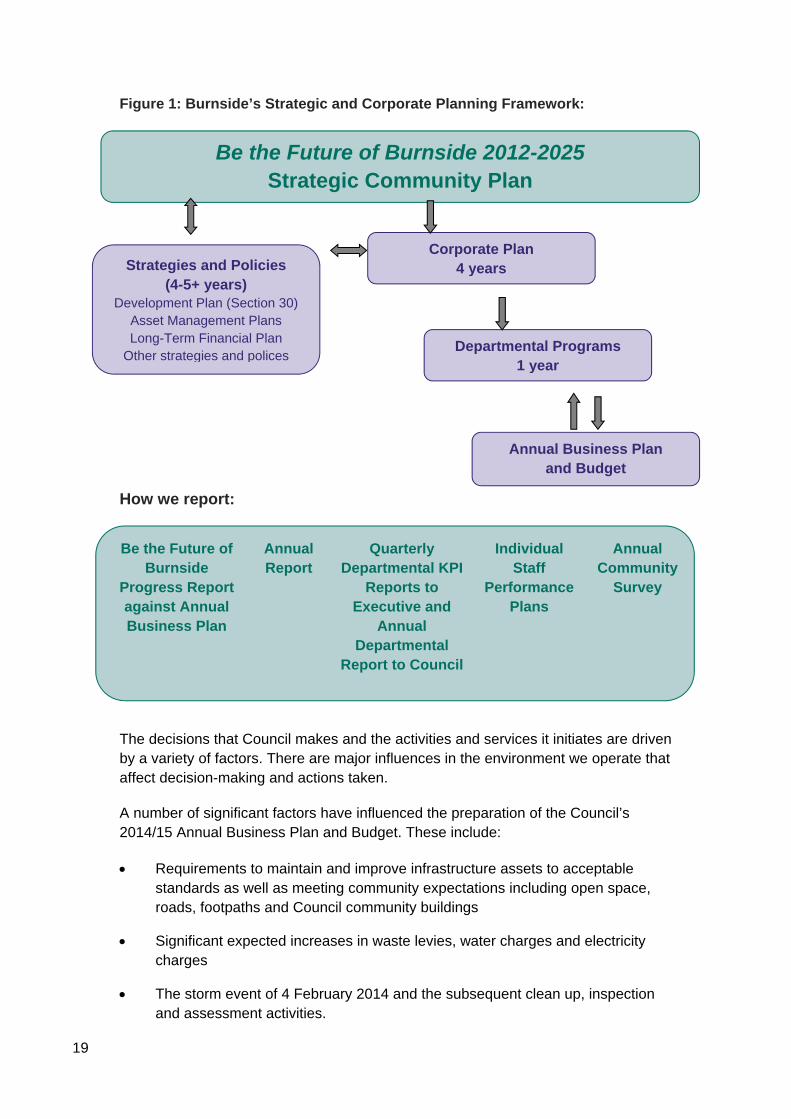
The City of Burnside has a Strategic and Corporate Planning framework that aligns operations, corporate and strategic plans to achieve sustainable improvements for the city and its people. The framework, as shown in Figure 1 below, includes long, medium and short-term plans that set direction for everything we do.
This business plan has been prepared in the context of our Long-Term Financial Plan and flows directly from priorities identified in our Strategic Community Plan. Our departmental programs and budgets complete our planning framework and ensure the timely and appropriate allocation of resources to meet our long-term goals in a staged and responsible fashion.
We will monitor our progress against the Strategic Community Plan and report on our progress annually. The following diagram outlines our organisational planning and reporting.
19
Figure 1: Burnside’s Strategic and Corporate Planning Framework:
How we report:
The decisions that Council makes and the activities and services it initiates are driven by a variety of factors. There are major influences in the environment we operate that affect decision-making and actions taken.
A number of significant factors have influenced the preparation of the Council’s 2014/15 Annual Business Plan and Budget. These include:
Requirements to maintain and improve infrastructure assets to acceptable standards as well as meeting community expectations including open space, roads, footpaths and Council community buildings
Significant expected increases in waste levies, water charges and electricity charges
The storm event of 4 February 2014 and the subsequent clean up, inspection and assessment activities.
Be the Future of Burnside 2012-2025 Strategic Community Plan
Strategies and Policies (4-5+ years)
Development Plan (Section 30) Asset Management Plans Long-Term Financial Plan
Other strategies and polices
Corporate Plan 4 years
Departmental Programs 1 year
Annual Business Plan and Budget
Be the Future of Burnside
Progress Report against Annual Business Plan
Annual Report
Quarterly Departmental KPI
Reports to Executive and
Annual Departmental
Report to Council
Individual Staff
Performance Plans
Annual Community
Survey
20
In addition, external influences are also expected to impact City of Burnside over the next year, including the following:
State Government 30-Year Plan for Greater Adelaide
Metropolitan Growth Development Plan
Legislative change
Global and domestic economic conditions and state government budgetary pressures (less available grant funding)
Changing demographics, including cultural diversity and ageing population
Climate change preparations and carbon pricing
Technological change and digital economy including social media and smart phone applications and communications technology that is more intuitive, reliable, mobile and user-friendly.
In particular the current economic climate continues to be unpredictable and we continue to monitor and identify its impacts on our financial performance and budgeting. We have developed financial planning strategies to take this economic climate into account while ensuring we continue to deliver services to our community. See Section 11: Strategic Financial Processes for more information on this.
10. The Community’s Vision – Be the Future of Burnside 2012-2025
The Annual Business Plan and Budget guide Council’s activities so that we can make the best possible progress towards our community’s vision for the future of Burnside. This is expressed in Burnside’s Strategic Community Plan:
We are renowned for our City’s green and leafy character and unique integrated urban form. We are highly regarded for our sense of community spirit, support for
one another, social diversity and commitment to the environment.
This vision document outlines the projects and services Council will deliver. Development of the Strategic Community Plan involved extensive community engagement. It is these community ideas and submissions which provided the insight for the development of this Annual Business Plan and Budget. Council is developing a Corporate Plan with a focus on strategies that Council uses to shape its internal processes to ensure resources are efficiently and effectively deployed to deliver the outcomes of the Strategic Plan.
Both these Plans establish the context for the 2014/15 Annual Business Plan and Budget, which is the key annual operational and financial planning document of the City of Burnside. It describes what services and projects Council plans to provide in the forthcoming financial year and how it plans to allocate budget.
21
11. Strategic Financial Processes
Our financial planning processes ensure our long-term financial sustainability can be maintained while meeting the needs and expectations of our community and delivering Council’s objectives as specified in Be the Future of Burnside: Strategic Community Plan 2012-2025 and related strategies.
Our strategic financial processes integrate our long-term planning and forecasting with annual business planning and budgeting. It incorporates:
Long-Term Financial Plan
Annual Operating Budget
Operating Projects
Capital Works
Asset Management
Financial Sustainability
This integrated approach assists in meeting the priorities of both our community and the organisation, while also ensuring our long-term sustainability and intergenerational equity.
11.1 Long Term Financial Plan Each year the City of Burnside reviews and updates its Long-Term Financial Plan (LTFP) as part of its financial planning process. In developing the LTFP, we establish financial parameters and forecast our financial performance and position over a 10-year time frame. It is developed using a range of forecast economic indicators and financial assumptions. This provides the basis for allocating funds between ongoing services and Project and Capital Works.
The LTFP informs the 2014/15 Annual Business Plan and Budget and enables Council to effectively and equitably manage service levels, asset management, funding and revenue raising decisions whilst achieving its financial strategy and key financial performance targets.
The Long Term Financial Plan is provided in Appendix A.
11.2 Annual Operating Budget and Projects Considerable effort goes into developing our budget each year to ensure that the mix of services, programs and works meets the needs of residents, businesses and visitors to Burnside. At the same time Council aims to balance the provision of services and facilities to the ability of our community to pay.
We aim to adopt a sustainable budget where total income equals total expenditure.
22
In meeting this objective we constantly face new pressures from increasing costs, reduced levels of grant funding and increasing community expectations. It is therefore important to ensure that our services meet the needs of our residents and are delivered in the most cost-effective way possible.
As a result of this approach a variety of service delivery models are now used to deliver services including the appointment and management of contractors, the development and maintenance of partnering relationships and the involvement of a large network of volunteers. Cost reductions have been targeted through innovation, commercialisation, productivity improvements, savings and the streamlining of processes and services.
This forms part of our overall approach of providing a sustainable budget for 2014/15.
A full list of Council programs and services as part of our Operating Budget is included below.
11.3 Asset Management The City of Burnside is responsible for the management, operation and maintenance of a diverse asset portfolio that provides services and facilities for our community. Asset Management Plans have been developed for major asset categories such as transport, drainage, recreation and buildings to ensure that available resources are allocated to the required maintenance and renewal programs as well as to provide new infrastructure. The development of these Asset Management Plans indicate Council’s ongoing commitment to operate and maintain its asset portfolio efficiently to both meet strategic and legislative requirements and deliver the required levels of service for the community
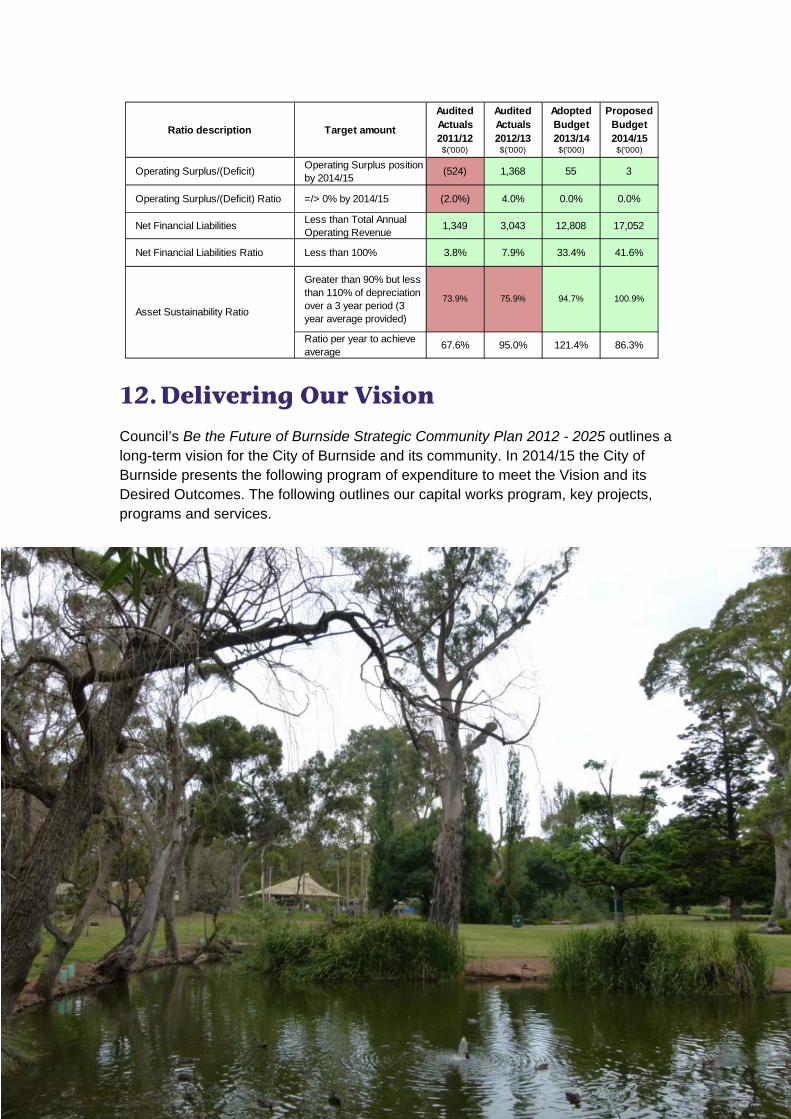
11.4 Financial Sustainability To assist Council in meeting its objectives of financial sustainability we are guided by the Local Government Association and a suite of Key Financial Indicators. These indicators and our performance in relation to them are detailed in the table below. We will ensure that we continue to:
Achieve and maintain an operating surplus over the long term – aim to fully fund the cost of our services, including depreciation of our assets and infrastructure.
Manage our debt prudently.
Employ sound asset management practices – aim to maintain our infrastructure and assets to the required standard to ensure continued delivery of services to agreed standards.
Intergenerational Equity – ensuring a fair sharing of the distribution of resources and financial burden between current and future users of our services and infrastructure.
23
12. Delivering Our Vision
Council’s Be the Future of Burnside Strategic Community Plan 2012 - 2025 outlines a long-term vision for the City of Burnside and its community. In 2014/15 the City of Burnside presents the following program of expenditure to meet the Vision and its Desired Outcomes. The following outlines our capital works program, key projects, programs and services.
Ratio description Target amount
Audited Actuals 2011/12
$('000)
Audited Actuals 2012/13
$('000)
Adopted Budget 2013/14
$('000)
Proposed Budget 2014/15
$('000)
Operating Surplus/(Deficit)Operating Surplus position by 2014/15
(524) 1,368 55 3
Operating Surplus/(Deficit) Ratio =/> 0% by 2014/15 (2.0%) 4.0% 0.0% 0.0%
Net Financial LiabilitiesLess than Total Annual Operating Revenue
1,349 3,043 12,808 17,052
Net Financial Liabilities Ratio Less than 100% 3.8% 7.9% 33.4% 41.6%
Greater than 90% but less than 110% of depreciation over a 3 year period (3 year average provided)
73.9% 75.9% 94.7% 100.9%
Ratio per year to achieve average
67.6% 95.0% 121.4% 86.3%
Asset Sustainability Ratio

24
12.1 Capital projects to deliver our Vision
Capital Projects
New or Upgrade
Strategic Direction: 1 - Our Integrated Urban Form and Living Spaces
Desired Outcome: 1.6 - Fit for purpose and cost-effective infrastructure that meets community needs
Initiative Budget
PR/340 - BHKC Capital contribution
Council's contribution to the implementation of the Brown Hill Keswick Creek Stormwater Management plan
$886,000
PR/699 - New Drainage Program
The program consists of installing underground pipes where the need is identified from either the Stormwater Infrastructure Capacity Study, a database of nuisance flooding, or associated with other capital works.
$300,000
PR/324 - New Footpath Construction Program
Construction of new footpaths where gravel or no footpath at all exists.
$323,800
25
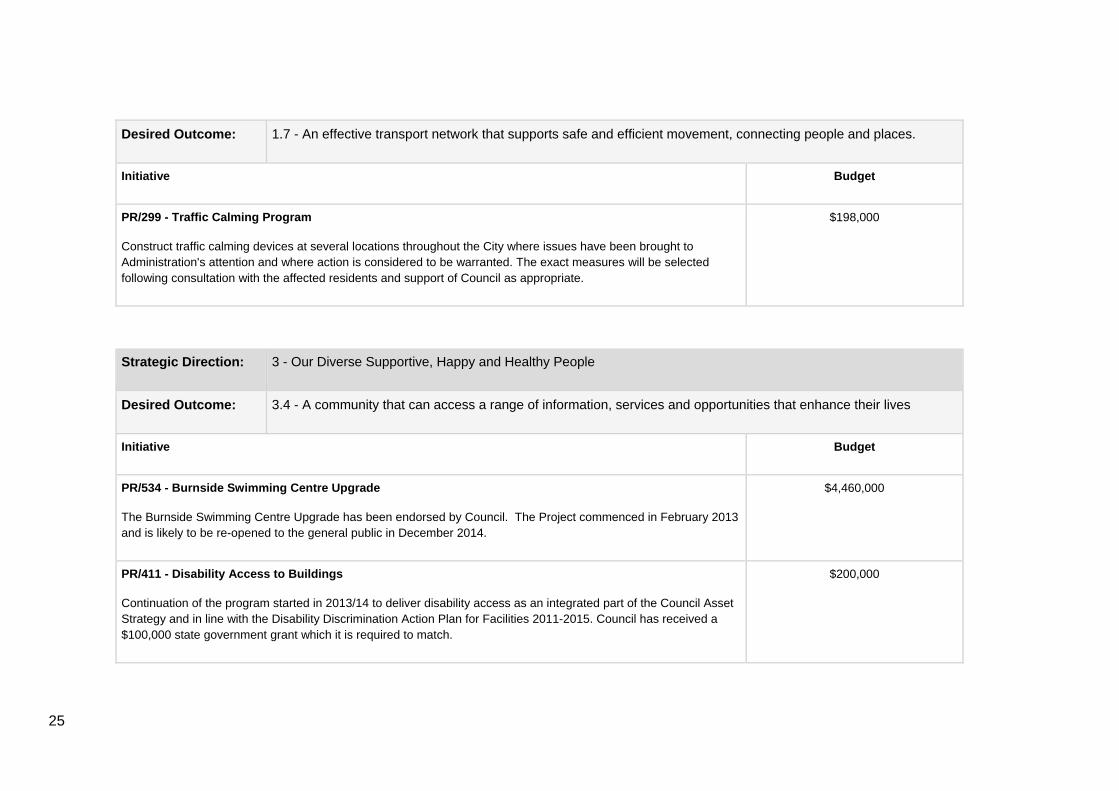
Desired Outcome: 1.7 - An effective transport network that supports safe and efficient movement, connecting people and places.
Initiative Budget
PR/299 - Traffic Calming Program
Construct traffic calming devices at several locations throughout the City where issues have been brought to Administration's attention and where action is considered to be warranted. The exact measures will be selected following consultation with the affected residents and support of Council as appropriate.
$198,000
Strategic Direction: 3 - Our Diverse Supportive, Happy and Healthy People
Desired Outcome: 3.4 - A community that can access a range of information, services and opportunities that enhance their lives
Initiative Budget
PR/534 - Burnside Swimming Centre Upgrade
The Burnside Swimming Centre Upgrade has been endorsed by Council. The Project commenced in February 2013 and is likely to be re-opened to the general public in December 2014.
$4,460,000
PR/411 - Disability Access to Buildings
Continuation of the program started in 2013/14 to deliver disability access as an integrated part of the Council Asset Strategy and in line with the Disability Discrimination Action Plan for Facilities 2011-2015. Council has received a $100,000 state government grant which it is required to match.
$200,000
26
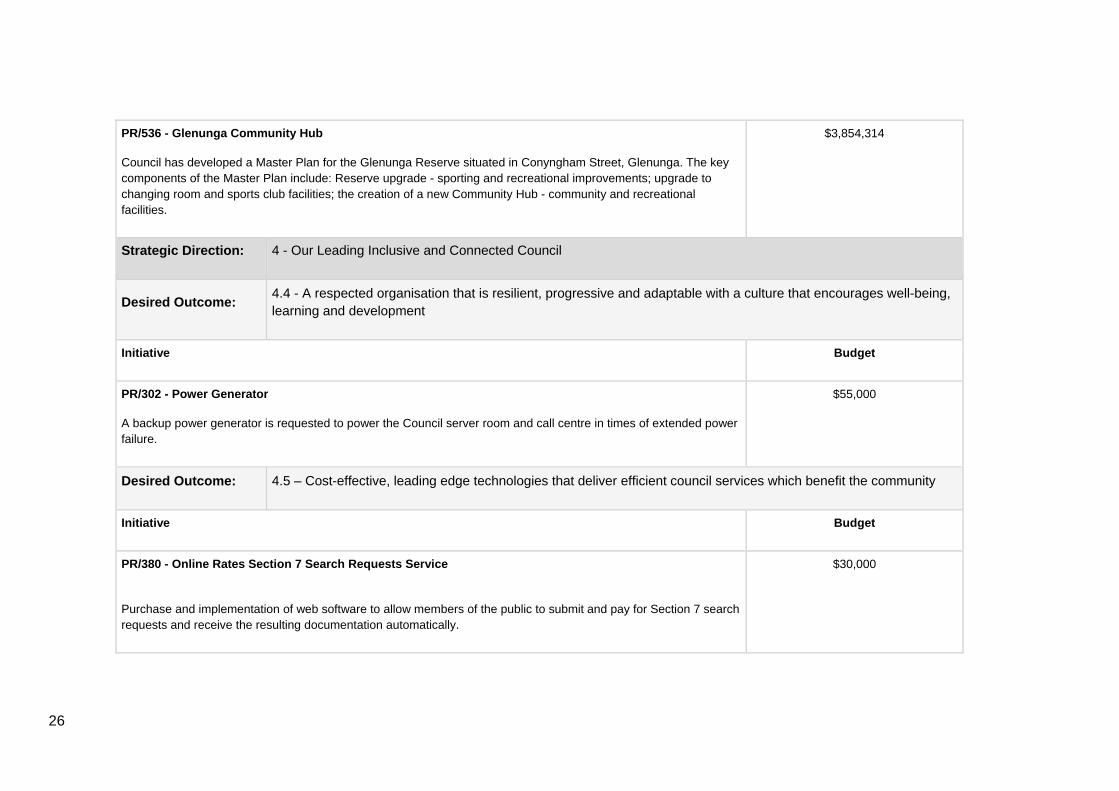
PR/536 - Glenunga Community Hub
Council has developed a Master Plan for the Glenunga Reserve situated in Conyngham Street, Glenunga. The key components of the Master Plan include: Reserve upgrade - sporting and recreational improvements; upgrade to changing room and sports club facilities; the creation of a new Community Hub - community and recreational facilities.
$3,854,314
Strategic Direction: 4 - Our Leading Inclusive and Connected Council
Desired Outcome: 4.4 - A respected organisation that is resilient, progressive and adaptable with a culture that encourages well-being, learning and development
Initiative Budget
PR/302 - Power Generator
A backup power generator is requested to power the Council server room and call centre in times of extended power failure.
$55,000
Desired Outcome: 4.5 – Cost-effective, leading edge technologies that deliver efficient council services which benefit the community
Initiative Budget
PR/380 - Online Rates Section 7 Search Requests Service
Purchase and implementation of web software to allow members of the public to submit and pay for Section 7 search requests and receive the resulting documentation automatically.
$30,000
27
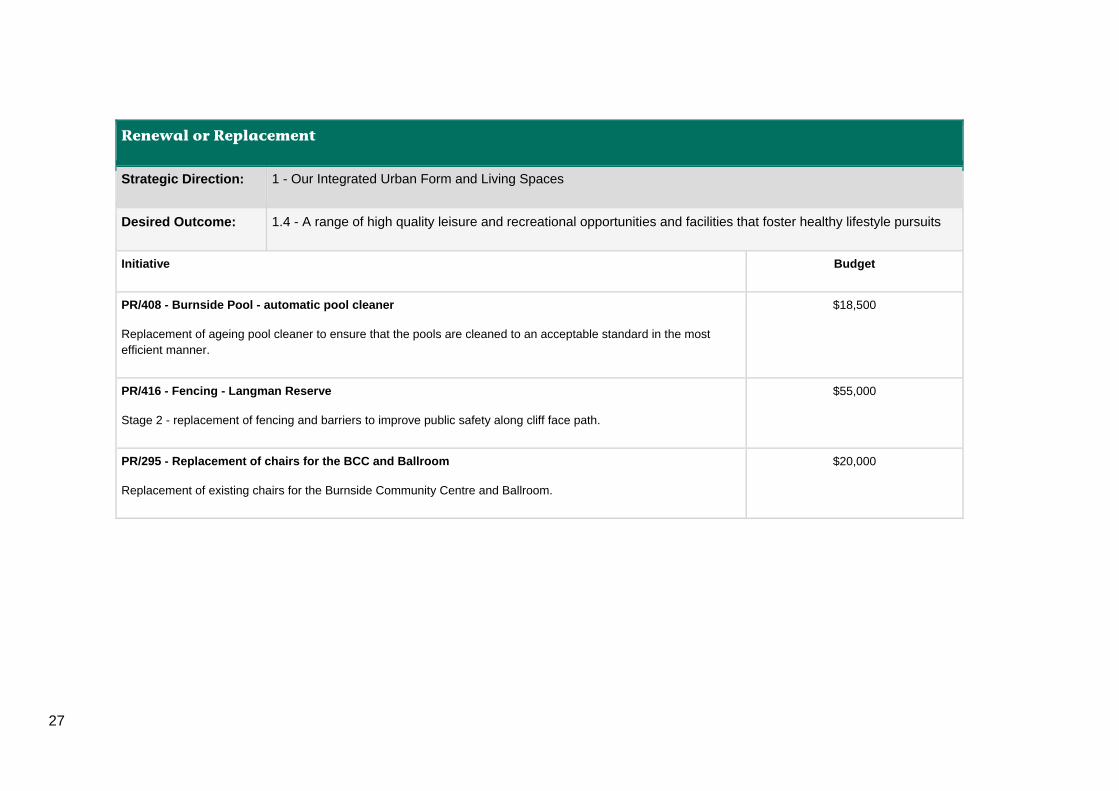
Renewal or Replacement
Strategic Direction: 1 - Our Integrated Urban Form and Living Spaces
Desired Outcome: 1.4 - A range of high quality leisure and recreational opportunities and facilities that foster healthy lifestyle pursuits
Initiative Budget
PR/408 - Burnside Pool - automatic pool cleaner
Replacement of ageing pool cleaner to ensure that the pools are cleaned to an acceptable standard in the most efficient manner.
$18,500
PR/416 - Fencing - Langman Reserve
Stage 2 - replacement of fencing and barriers to improve public safety along cliff face path.
$55,000
PR/295 - Replacement of chairs for the BCC and Ballroom
Replacement of existing chairs for the Burnside Community Centre and Ballroom.
$20,000
28
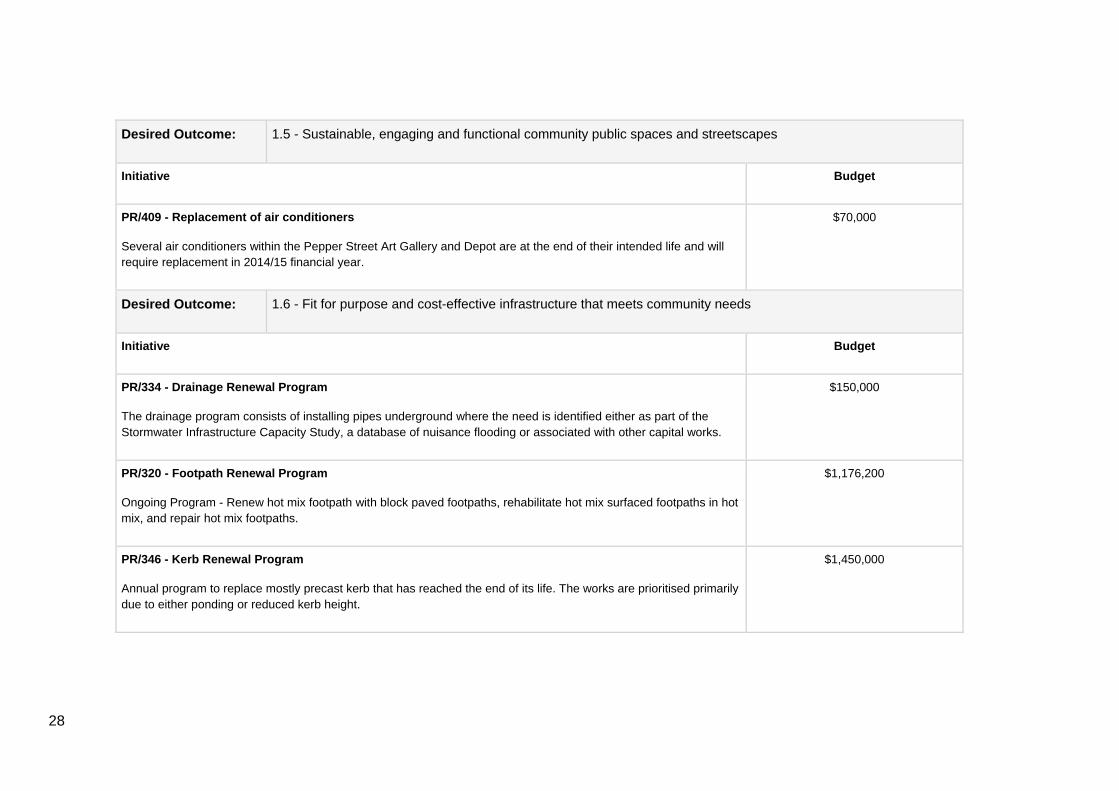
Desired Outcome: 1.5 - Sustainable, engaging and functional community public spaces and streetscapes
Initiative Budget
PR/409 - Replacement of air conditioners
Several air conditioners within the Pepper Street Art Gallery and Depot are at the end of their intended life and will require replacement in 2014/15 financial year.
$70,000
Desired Outcome: 1.6 - Fit for purpose and cost-effective infrastructure that meets community needs
Initiative Budget
PR/334 - Drainage Renewal Program
The drainage program consists of installing pipes underground where the need is identified either as part of the Stormwater Infrastructure Capacity Study, a database of nuisance flooding or associated with other capital works.
$150,000
PR/320 - Footpath Renewal Program
Ongoing Program - Renew hot mix footpath with block paved footpaths, rehabilitate hot mix surfaced footpaths in hot mix, and repair hot mix footpaths.
$1,176,200
PR/346 - Kerb Renewal Program
Annual program to replace mostly precast kerb that has reached the end of its life. The works are prioritised primarily due to either ponding or reduced kerb height.
$1,450,000

29
PR/339 - Minor Infrastructure Program Renewal
Renewal of infrastructure such as footbridges, retaining walls, lighting, and bus stops that is not included in the major programs of Traffic, Drainage, Kerb and Footpath.
$25,000
PR/345 - Pavement Renewal Program
Renew road pavements that are showing serious signs of distress are rehabilitated and resurfaced.
$478,000
PR/385 - Refurbishments of Civic Centre
A number of internal and external refurbishments to the Civic Centre are required to effectively and efficiently manage the asset through the course of its lifecycle.
$266,100
PR/344 - Road Crack Sealing Program
This program applies sealant to cracks on the road to waterproof the road seal and thus protect the pavement.
$44,000
PR/395 - Road Resurfacing Program
Ongoing program to renew road surfaces to protect underlying pavement and provide a smooth and dust free road.
$1,750,000
PR/817 - Roundabout Landscape Renewal Program - Capital component
Renewing landscape component of existing roundabouts across the City. This budget will cover approximately 15 roundabouts for this first year of the Roundabout Landscape Renewal Program for the capital component of the works (concrete work, irrigation and water meters etc.)
$50,000

30
PR/537 - Sports field lighting replacement
Lighting towers on several sporting grounds have reached the end of their useful life and need replacement to ensure continued safe use.
$70,000
Strategic Direction: 2 - Our Protected and Valued Environment
Desired Outcome: 2.1 - Natural environments and watercourses protected and conserved in both the Hills Face and the Plains
Initiative Budget
PR/696 - Hazelwood Park Bore Replacement and associated works
Hazelwood Park Bore Pump delivery pipe replacement due to failing delivery pipe and other associated equipment. Also possible bore replacement including new casing.
$70,000
Desired Outcome: 2.2 - Sustainable use of natural resources, and minimisation of waste to address climate change
Initiative Budget
PR/412 - Phase out of ozone-depleting substances
Council will need to look at retrofitting its existing air conditioner units to use a non-ozone-depleting substitute as Federal Government has ratified the Montreal Protocol, and aims to phase out the use of hydro chlorofluorocarbons (HCFCs) in particular R22, by 2016.
$30,000
31
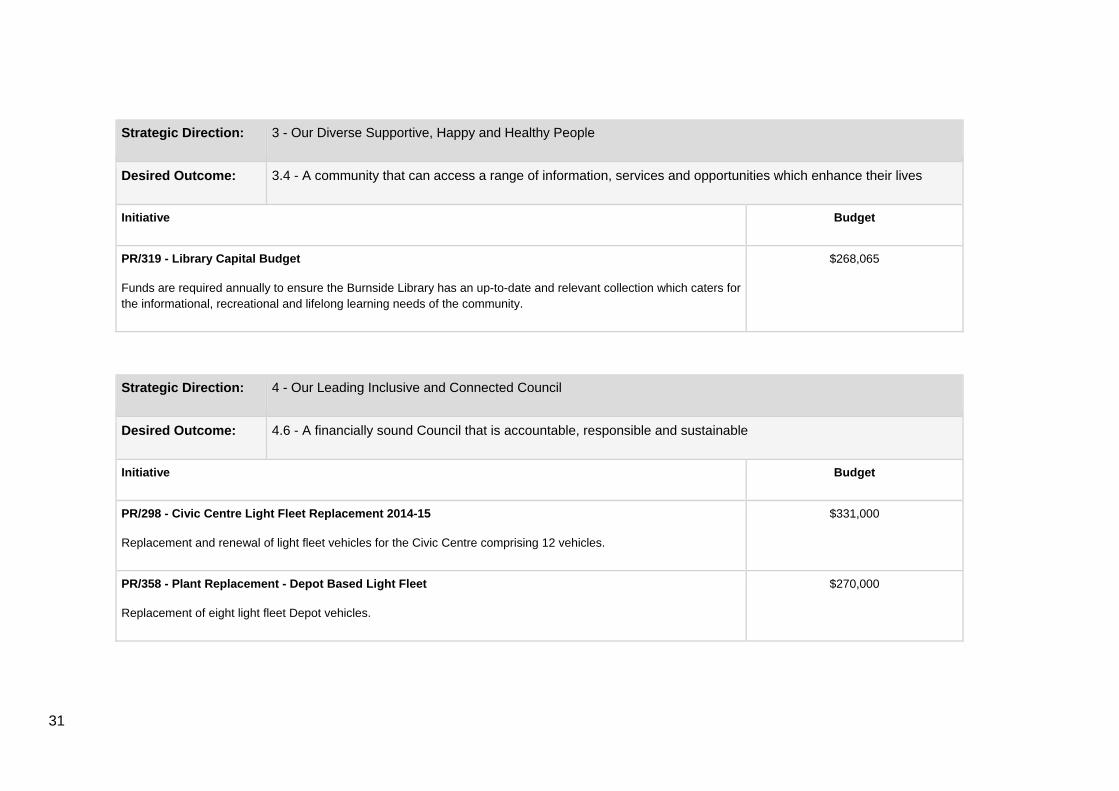
Strategic Direction: 3 - Our Diverse Supportive, Happy and Healthy People
Desired Outcome: 3.4 - A community that can access a range of information, services and opportunities which enhance their lives
Initiative Budget
PR/319 - Library Capital Budget
Funds are required annually to ensure the Burnside Library has an up-to-date and relevant collection which caters for the informational, recreational and lifelong learning needs of the community.
$268,065
Strategic Direction: 4 - Our Leading Inclusive and Connected Council
Desired Outcome: 4.6 - A financially sound Council that is accountable, responsible and sustainable
Initiative Budget
PR/298 - Civic Centre Light Fleet Replacement 2014-15
Replacement and renewal of light fleet vehicles for the Civic Centre comprising 12 vehicles.
$331,000
PR/358 - Plant Replacement - Depot Based Light Fleet
Replacement of eight light fleet Depot vehicles.
$270,000
32
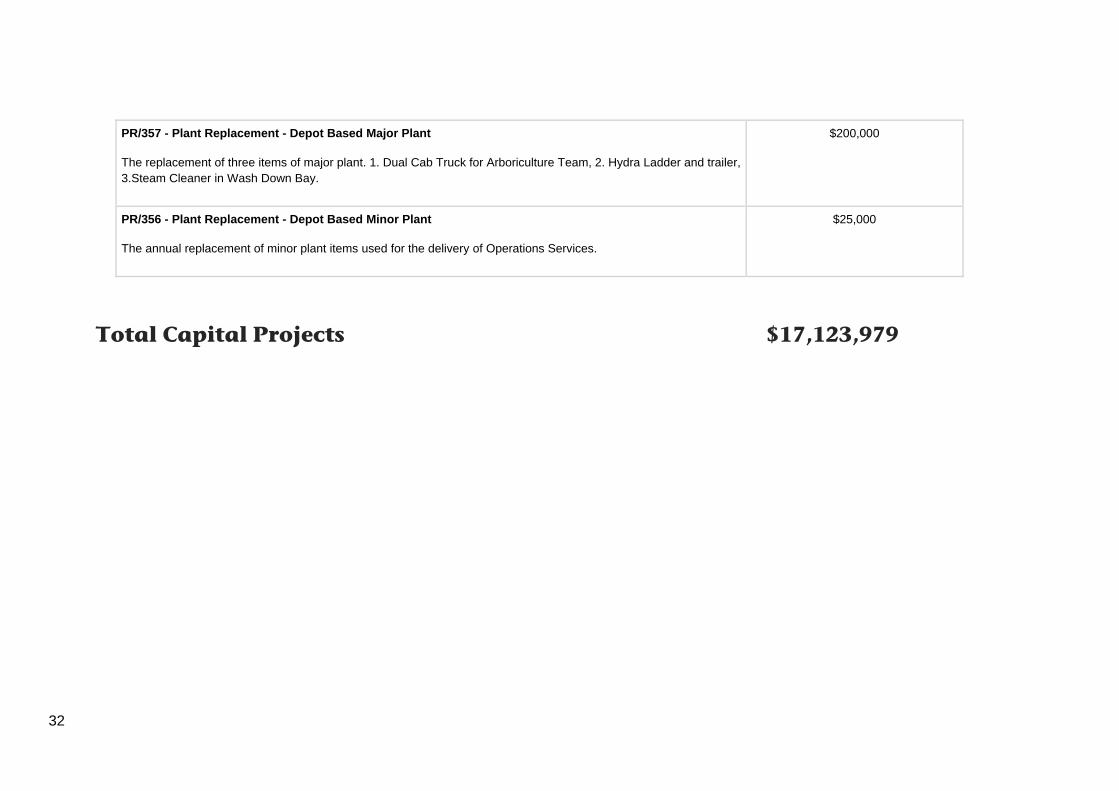
PR/357 - Plant Replacement - Depot Based Major Plant
The replacement of three items of major plant. 1. Dual Cab Truck for Arboriculture Team, 2. Hydra Ladder and trailer, 3.Steam Cleaner in Wash Down Bay.
$200,000
PR/356 - Plant Replacement - Depot Based Minor Plant
The annual replacement of minor plant items used for the delivery of Operations Services.
$25,000
Total Capital Projects $17,123,979
33
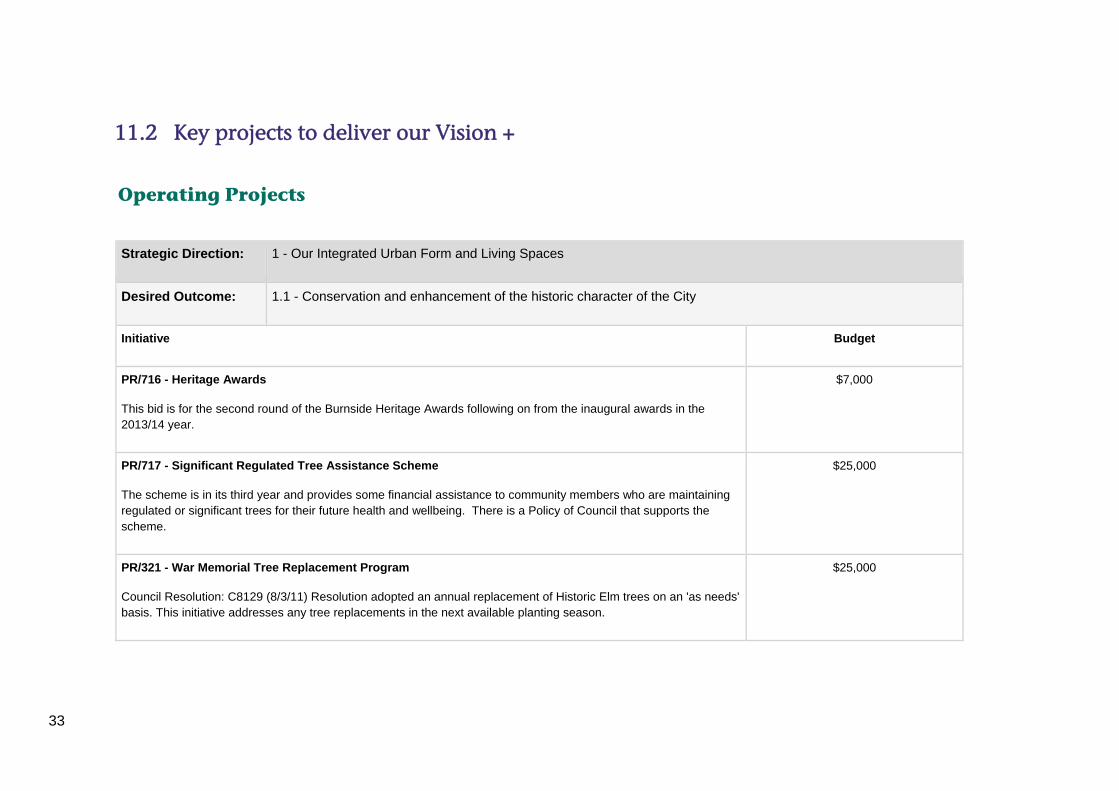
11.2 Key projects to deliver our Vision +
Operating Projects
Strategic Direction: 1 - Our Integrated Urban Form and Living Spaces
Desired Outcome: 1.1 - Conservation and enhancement of the historic character of the City
Initiative Budget
PR/716 - Heritage Awards
This bid is for the second round of the Burnside Heritage Awards following on from the inaugural awards in the 2013/14 year.
$7,000
PR/717 - Significant Regulated Tree Assistance Scheme
The scheme is in its third year and provides some financial assistance to community members who are maintaining regulated or significant trees for their future health and wellbeing. There is a Policy of Council that supports the scheme.
$25,000
PR/321 - War Memorial Tree Replacement Program
Council Resolution: C8129 (8/3/11) Resolution adopted an annual replacement of Historic Elm trees on an 'as needs' basis. This initiative addresses any tree replacements in the next available planting season.
$25,000
34
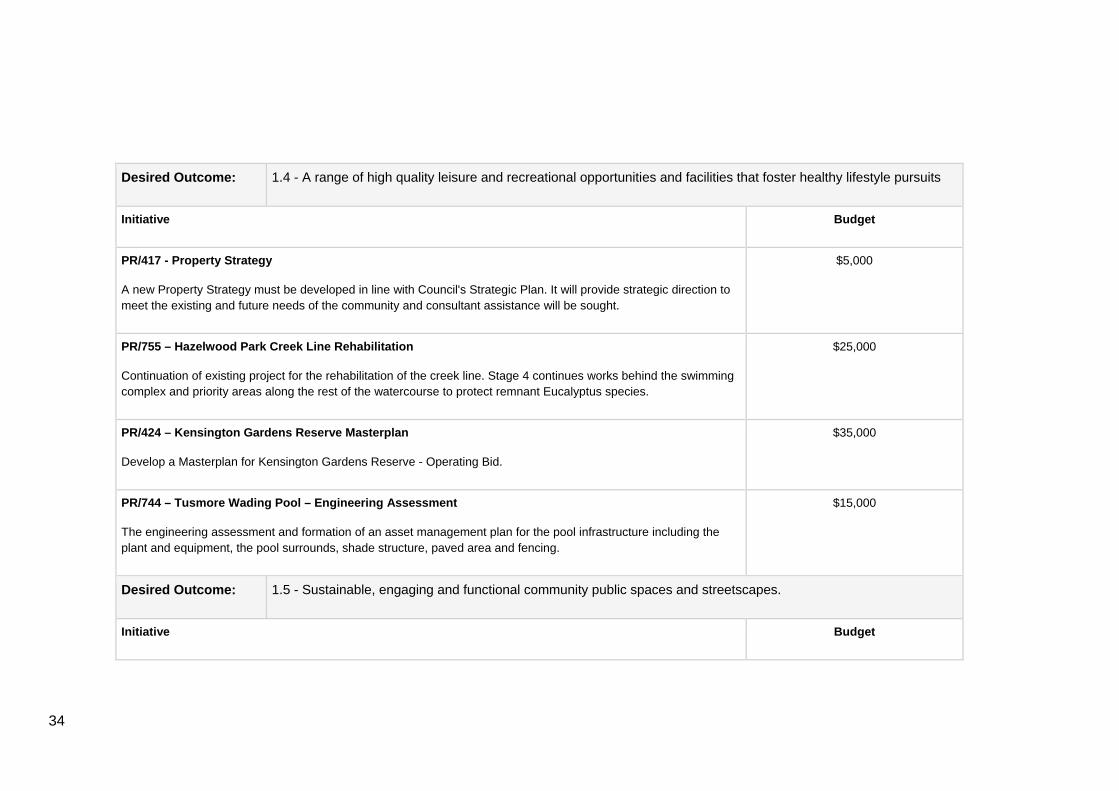
Desired Outcome: 1.4 - A range of high quality leisure and recreational opportunities and facilities that foster healthy lifestyle pursuits
Initiative Budget
PR/417 - Property Strategy
A new Property Strategy must be developed in line with Council's Strategic Plan. It will provide strategic direction to meet the existing and future needs of the community and consultant assistance will be sought.
$5,000
PR/755 – Hazelwood Park Creek Line Rehabilitation
Continuation of existing project for the rehabilitation of the creek line. Stage 4 continues works behind the swimming complex and priority areas along the rest of the watercourse to protect remnant Eucalyptus species.
$25,000
PR/424 – Kensington Gardens Reserve Masterplan
Develop a Masterplan for Kensington Gardens Reserve - Operating Bid.
$35,000
PR/744 – Tusmore Wading Pool – Engineering Assessment
The engineering assessment and formation of an asset management plan for the pool infrastructure including the plant and equipment, the pool surrounds, shade structure, paved area and fencing.
$15,000
Desired Outcome: 1.5 - Sustainable, engaging and functional community public spaces and streetscapes.
Initiative Budget
35
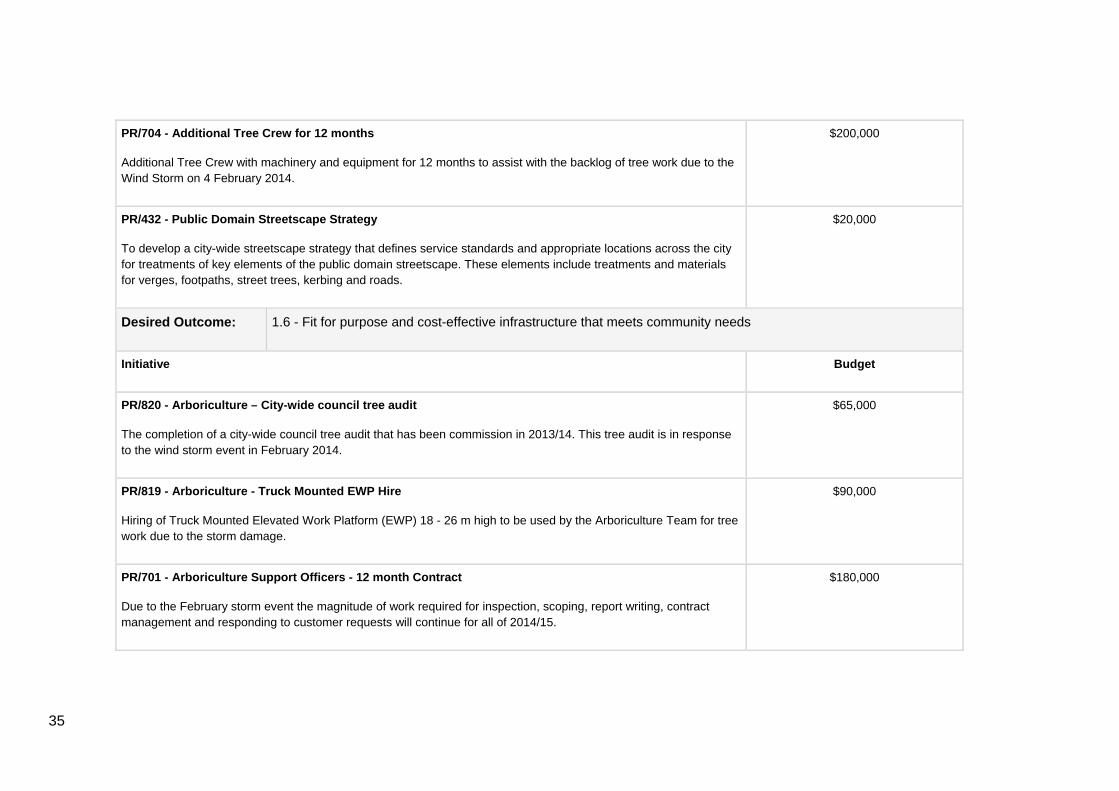
PR/704 - Additional Tree Crew for 12 months
Additional Tree Crew with machinery and equipment for 12 months to assist with the backlog of tree work due to the Wind Storm on 4 February 2014.
$200,000
PR/432 - Public Domain Streetscape Strategy
To develop a city-wide streetscape strategy that defines service standards and appropriate locations across the city for treatments of key elements of the public domain streetscape. These elements include treatments and materials for verges, footpaths, street trees, kerbing and roads.
$20,000
Desired Outcome: 1.6 - Fit for purpose and cost-effective infrastructure that meets community needs
Initiative Budget
PR/820 - Arboriculture – City-wide council tree audit
The completion of a city-wide council tree audit that has been commission in 2013/14. This tree audit is in response to the wind storm event in February 2014.
$65,000
PR/819 - Arboriculture - Truck Mounted EWP Hire
Hiring of Truck Mounted Elevated Work Platform (EWP) 18 - 26 m high to be used by the Arboriculture Team for tree work due to the storm damage.
$90,000
PR/701 - Arboriculture Support Officers - 12 month Contract
Due to the February storm event the magnitude of work required for inspection, scoping, report writing, contract management and responding to customer requests will continue for all of 2014/15.
$180,000
36
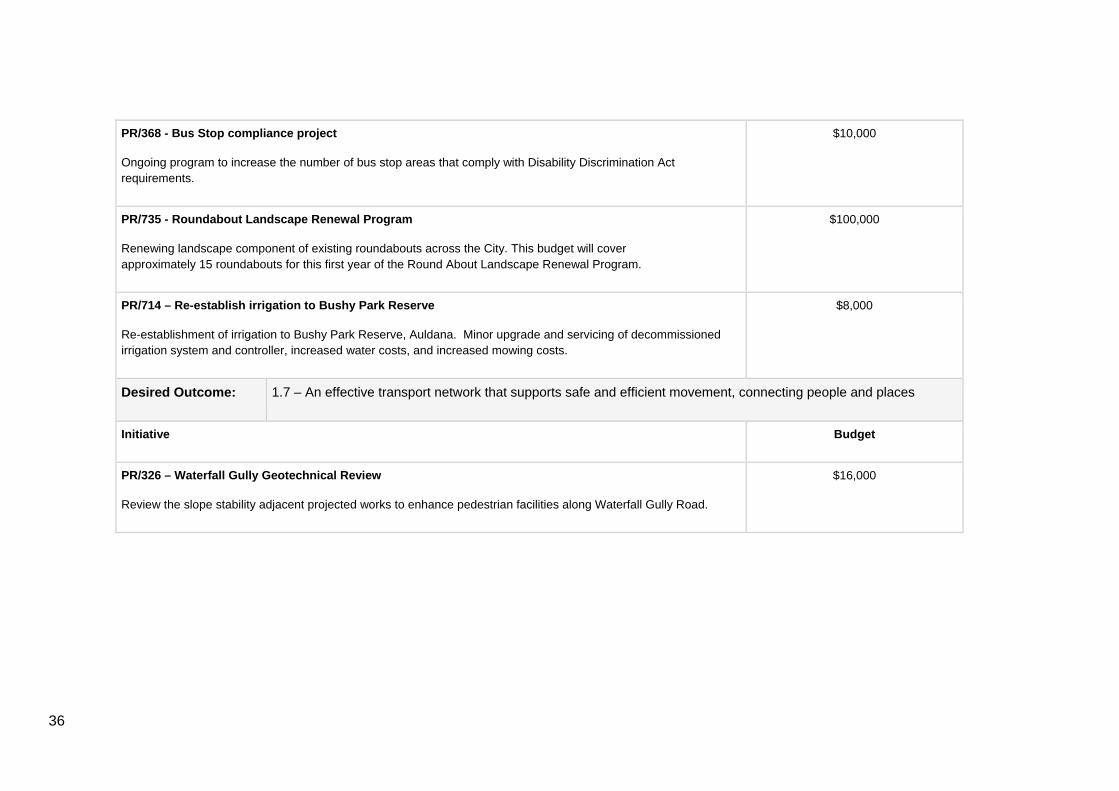
PR/368 - Bus Stop compliance project
Ongoing program to increase the number of bus stop areas that comply with Disability Discrimination Act requirements.
$10,000
PR/735 - Roundabout Landscape Renewal Program
Renewing landscape component of existing roundabouts across the City. This budget will cover approximately 15 roundabouts for this first year of the Round About Landscape Renewal Program.
$100,000
PR/714 – Re-establish irrigation to Bushy Park Reserve
Re-establishment of irrigation to Bushy Park Reserve, Auldana. Minor upgrade and servicing of decommissioned irrigation system and controller, increased water costs, and increased mowing costs.
$8,000
Desired Outcome: 1.7 – An effective transport network that supports safe and efficient movement, connecting people and places
Initiative Budget
PR/326 – Waterfall Gully Geotechnical Review
Review the slope stability adjacent projected works to enhance pedestrian facilities along Waterfall Gully Road.
$16,000
37
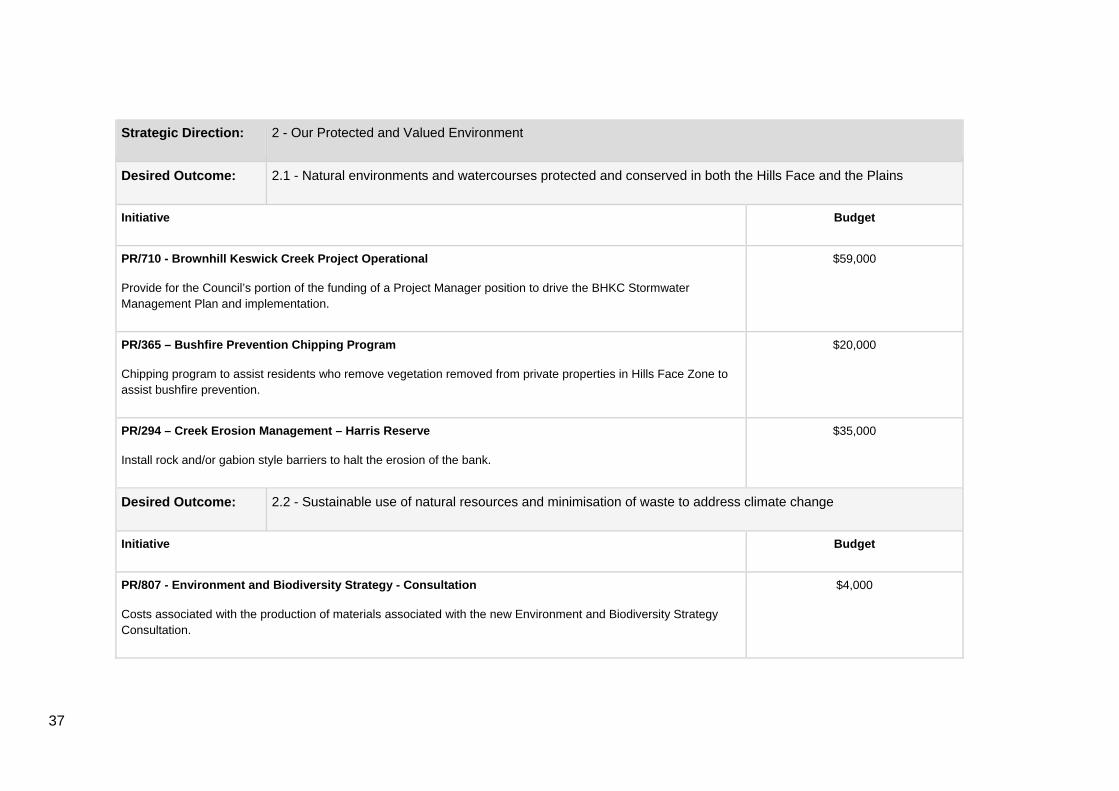
Strategic Direction: 2 - Our Protected and Valued Environment
Desired Outcome: 2.1 - Natural environments and watercourses protected and conserved in both the Hills Face and the Plains
Initiative Budget
PR/710 - Brownhill Keswick Creek Project Operational
Provide for the Council’s portion of the funding of a Project Manager position to drive the BHKC Stormwater Management Plan and implementation.
$59,000
PR/365 – Bushfire Prevention Chipping Program
Chipping program to assist residents who remove vegetation removed from private properties in Hills Face Zone to assist bushfire prevention.
$20,000
PR/294 – Creek Erosion Management – Harris Reserve
Install rock and/or gabion style barriers to halt the erosion of the bank.
$35,000
Desired Outcome: 2.2 - Sustainable use of natural resources and minimisation of waste to address climate change
Initiative Budget
PR/807 - Environment and Biodiversity Strategy - Consultation
Costs associated with the production of materials associated with the new Environment and Biodiversity Strategy Consultation.
$4,000

38
PR/720 - Provision of compostable bags to all residents
Supply and delivery of 23,000 rolls of compostable bags to all eligible properties within the City of Burnside. (Zero Waste Grant of $53,500 will help offset the total cost.)
$185,000
39
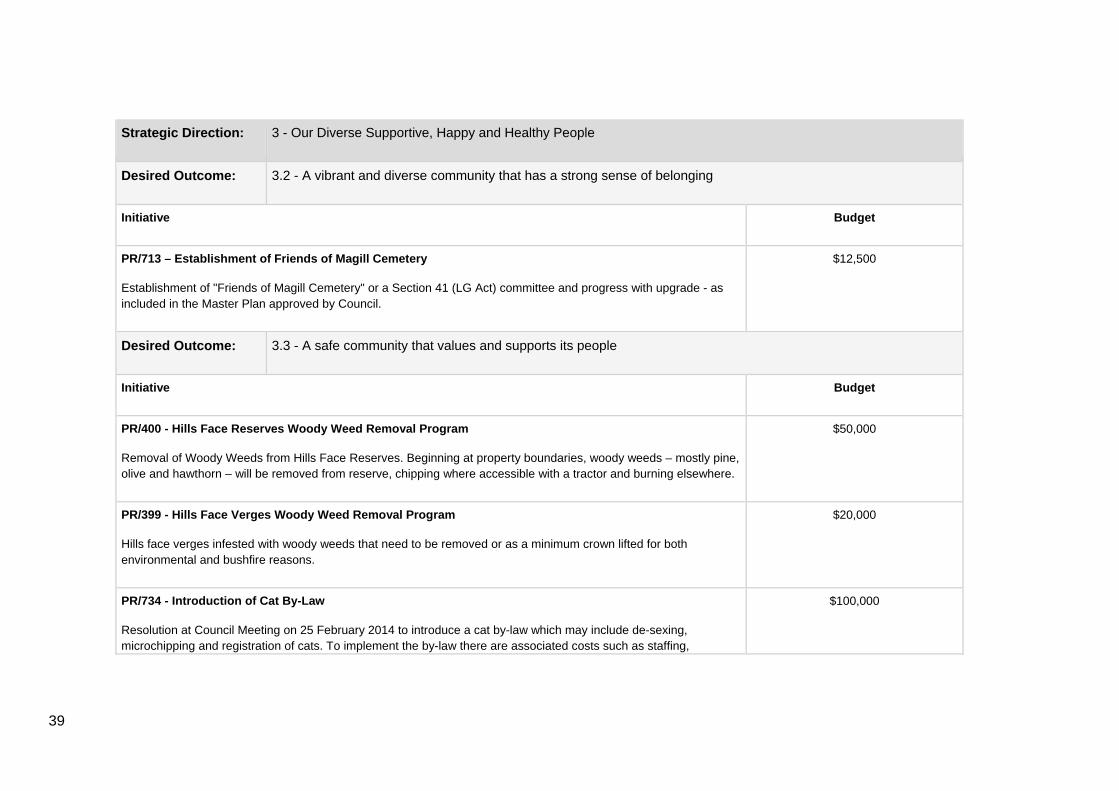
Strategic Direction: 3 - Our Diverse Supportive, Happy and Healthy People
Desired Outcome: 3.2 - A vibrant and diverse community that has a strong sense of belonging
Initiative Budget
PR/713 – Establishment of Friends of Magill Cemetery
Establishment of "Friends of Magill Cemetery" or a Section 41 (LG Act) committee and progress with upgrade - as included in the Master Plan approved by Council.
$12,500
Desired Outcome: 3.3 - A safe community that values and supports its people
Initiative Budget
PR/400 - Hills Face Reserves Woody Weed Removal Program
Removal of Woody Weeds from Hills Face Reserves. Beginning at property boundaries, woody weeds – mostly pine, olive and hawthorn – will be removed from reserve, chipping where accessible with a tractor and burning elsewhere.
$50,000
PR/399 - Hills Face Verges Woody Weed Removal Program
Hills face verges infested with woody weeds that need to be removed or as a minimum crown lifted for both environmental and bushfire reasons.
$20,000
PR/734 - Introduction of Cat By-Law
Resolution at Council Meeting on 25 February 2014 to introduce a cat by-law which may include de-sexing, microchipping and registration of cats. To implement the by-law there are associated costs such as staffing,
$100,000
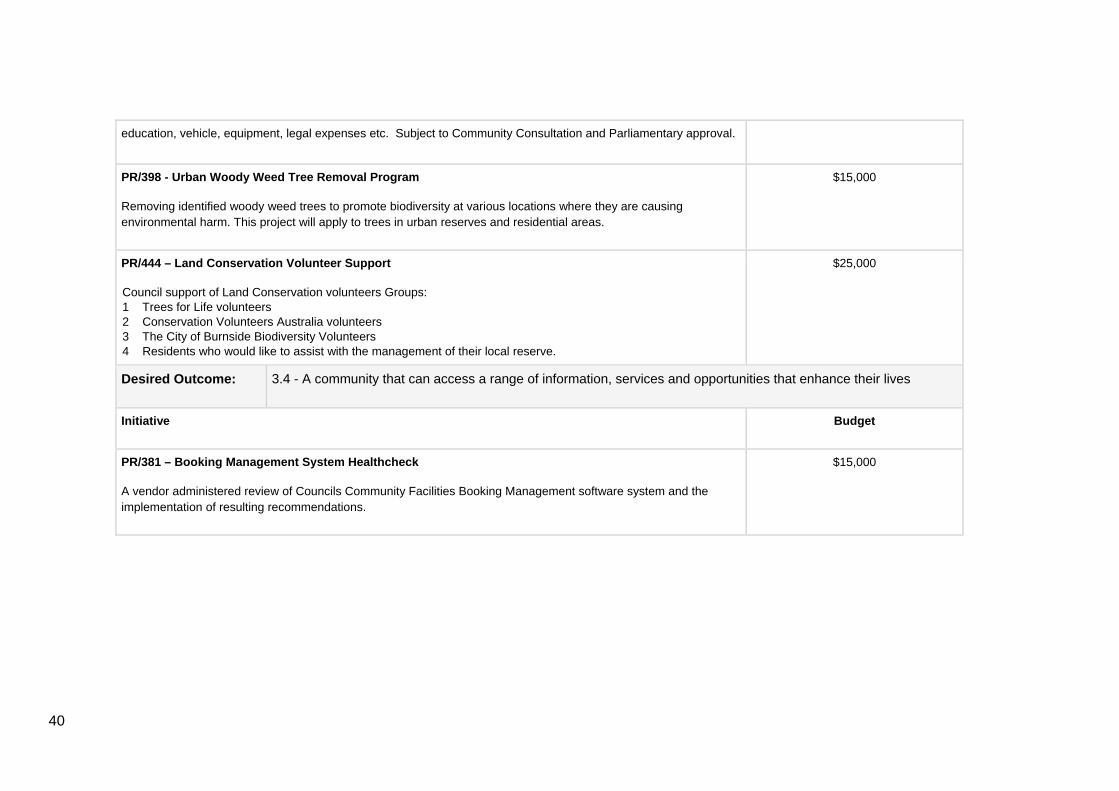
40
education, vehicle, equipment, legal expenses etc. Subject to Community Consultation and Parliamentary approval.
PR/398 - Urban Woody Weed Tree Removal Program
Removing identified woody weed trees to promote biodiversity at various locations where they are causing environmental harm. This project will apply to trees in urban reserves and residential areas.
$15,000
PR/444 – Land Conservation Volunteer Support
Council support of Land Conservation volunteers Groups: 1 Trees for Life volunteers 2 Conservation Volunteers Australia volunteers 3 The City of Burnside Biodiversity Volunteers 4 Residents who would like to assist with the management of their local reserve.
$25,000
Desired Outcome: 3.4 - A community that can access a range of information, services and opportunities that enhance their lives
Initiative Budget
PR/381 – Booking Management System Healthcheck
A vendor administered review of Councils Community Facilities Booking Management software system and the implementation of resulting recommendations.
$15,000
41
Strategic Direction: 4 - Our Leading Inclusive and Connected Council
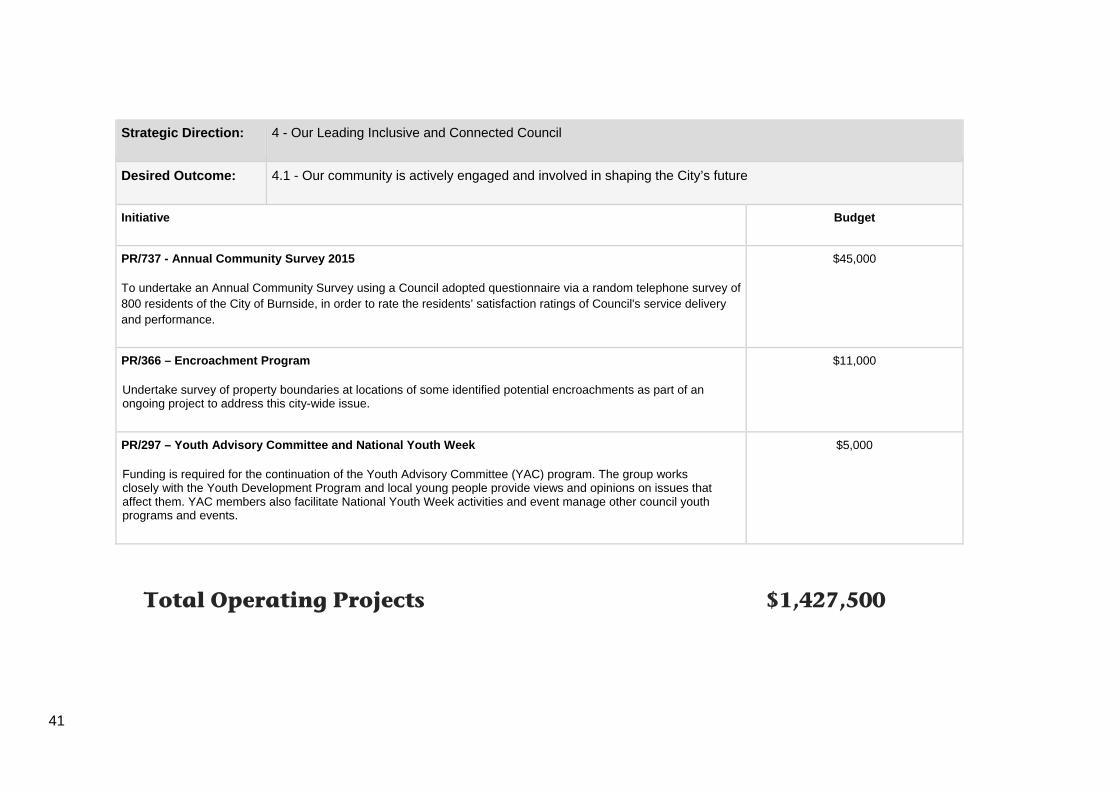
Desired Outcome: 4.1 - Our community is actively engaged and involved in shaping the City’s future
Initiative Budget
PR/737 - Annual Community Survey 2015
To undertake an Annual Community Survey using a Council adopted questionnaire via a random telephone survey of 800 residents of the City of Burnside, in order to rate the residents’ satisfaction ratings of Council's service delivery and performance.
$45,000
PR/366 – Encroachment Program
Undertake survey of property boundaries at locations of some identified potential encroachments as part of an ongoing project to address this city-wide issue.
$11,000
PR/297 – Youth Advisory Committee and National Youth Week
Funding is required for the continuation of the Youth Advisory Committee (YAC) program. The group works closely with the Youth Development Program and local young people provide views and opinions on issues that affect them. YAC members also facilitate National Youth Week activities and event manage other council youth programs and events.
$5,000
Total Operating Projects $1,427,500
42
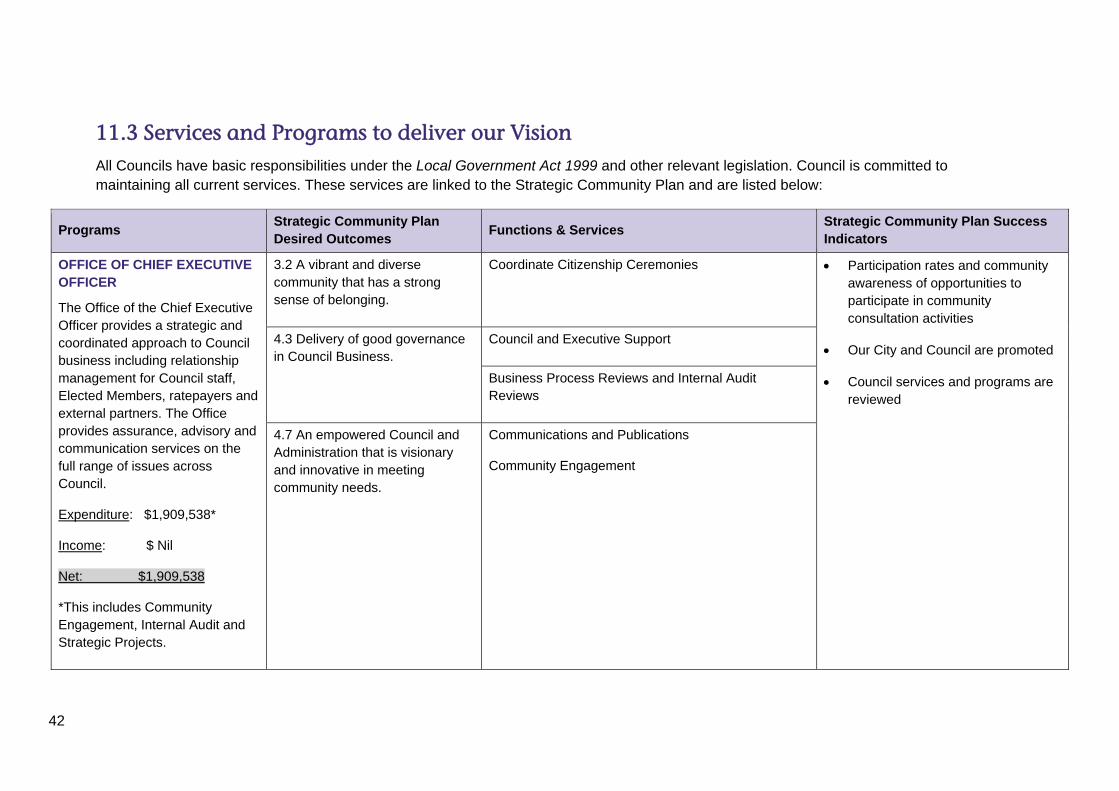
11.3 Services and Programs to deliver our Vision All Councils have basic responsibilities under the Local Government Act 1999 and other relevant legislation. Council is committed to maintaining all current services. These services are linked to the Strategic Community Plan and are listed below:
Programs Strategic Community Plan Desired Outcomes
Functions & Services Strategic Community Plan Success Indicators
OFFICE OF CHIEF EXECUTIVE OFFICER
The Office of the Chief Executive Officer provides a strategic and coordinated approach to Council business including relationship management for Council staff, Elected Members, ratepayers and external partners. The Office provides assurance, advisory and communication services on the full range of issues across Council.
Expenditure: $1,909,538*
Income: $ Nil
Net: $1,909,538
*This includes Community Engagement, Internal Audit and Strategic Projects.
3.2 A vibrant and diverse community that has a strong sense of belonging.
Coordinate Citizenship Ceremonies Participation rates and community awareness of opportunities to participate in community consultation activities
Our City and Council are promoted
Council services and programs are reviewed
4.3 Delivery of good governance in Council Business.
Council and Executive Support
Business Process Reviews and Internal Audit Reviews
4.7 An empowered Council and Administration that is visionary and innovative in meeting community needs.
Communications and Publications
Community Engagement
43
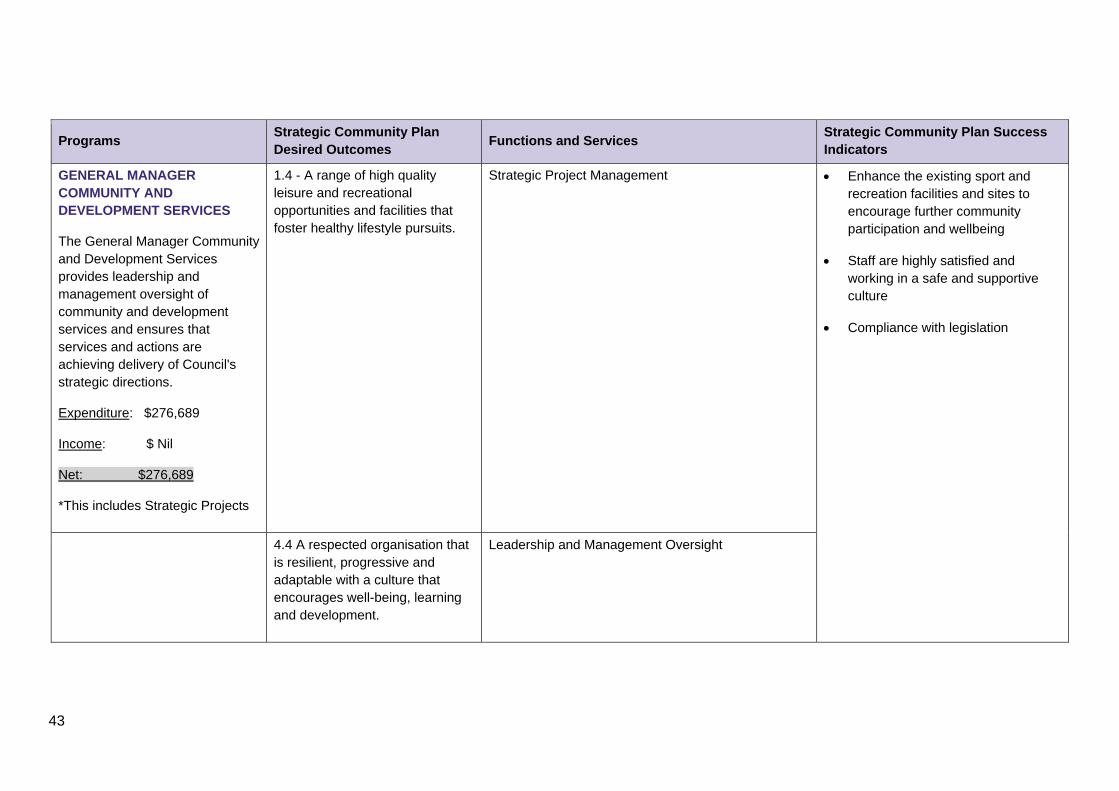
Programs Strategic Community Plan Desired Outcomes
Functions and Services Strategic Community Plan Success Indicators
GENERAL MANAGER COMMUNITY AND DEVELOPMENT SERVICES
The General Manager Community and Development Services provides leadership and management oversight of community and development services and ensures that services and actions are achieving delivery of Council's strategic directions.
Expenditure: $276,689
Income: $ Nil
Net: $276,689
*This includes Strategic Projects
1.4 - A range of high quality leisure and recreational opportunities and facilities that foster healthy lifestyle pursuits.
Strategic Project Management Enhance the existing sport and recreation facilities and sites to encourage further community participation and wellbeing
Staff are highly satisfied and working in a safe and supportive culture
Compliance with legislation
4.4 A respected organisation that is resilient, progressive and adaptable with a culture that encourages well-being, learning and development.
Leadership and Management Oversight
44
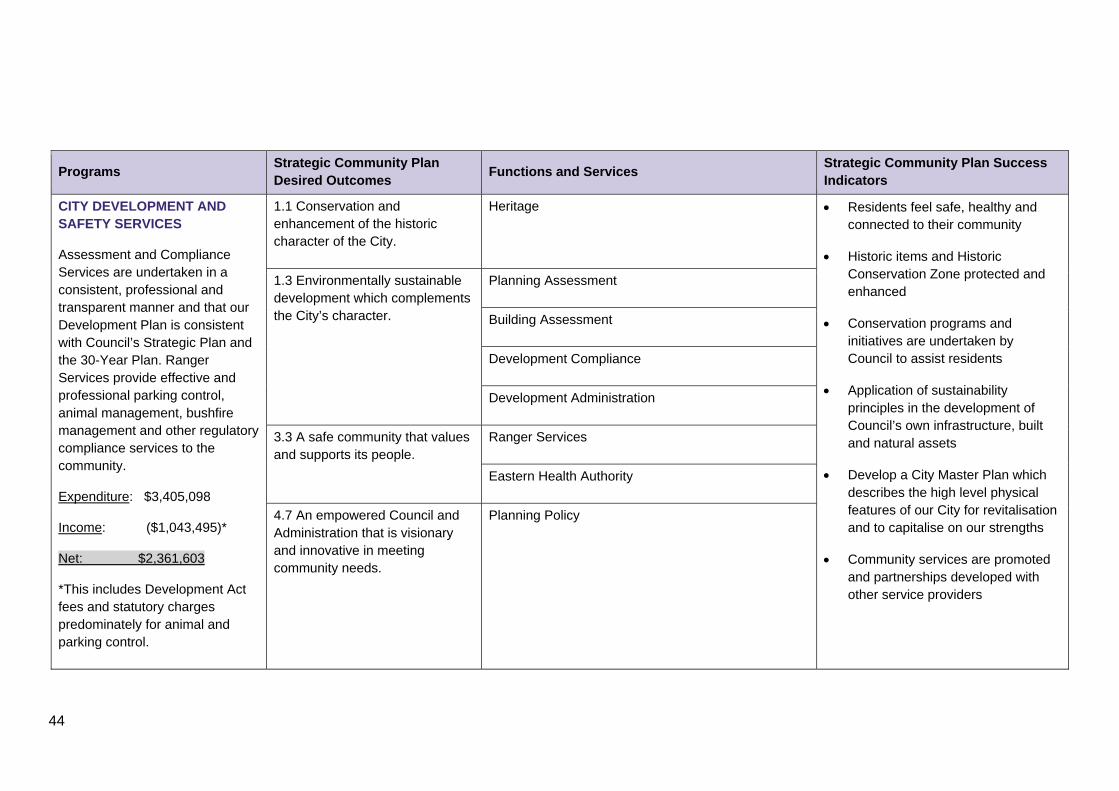
Programs Strategic Community Plan Desired Outcomes
Functions and Services Strategic Community Plan Success Indicators
CITY DEVELOPMENT AND SAFETY SERVICES
Assessment and Compliance Services are undertaken in a consistent, professional and transparent manner and that our Development Plan is consistent with Council’s Strategic Plan and the 30-Year Plan. Ranger Services provide effective and professional parking control, animal management, bushfire management and other regulatory compliance services to the community.
Expenditure: $3,405,098
Income: ($1,043,495)*
Net: $2,361,603
*This includes Development Act fees and statutory charges predominately for animal and parking control.
1.1 Conservation and enhancement of the historic character of the City.
Heritage Residents feel safe, healthy and connected to their community
Historic items and Historic Conservation Zone protected and enhanced
Conservation programs and initiatives are undertaken by Council to assist residents
Application of sustainability principles in the development of Council’s own infrastructure, built and natural assets
Develop a City Master Plan which describes the high level physical features of our City for revitalisation and to capitalise on our strengths
Community services are promoted and partnerships developed with other service providers
1.3 Environmentally sustainable development which complements the City’s character.
Planning Assessment
Building Assessment
Development Compliance
Development Administration
3.3 A safe community that values and supports its people.
Ranger Services
Eastern Health Authority
4.7 An empowered Council and Administration that is visionary and innovative in meeting community needs.
Planning Policy
45
Programs Strategic Community Plan Desired Outcomes
Functions and Services Strategic Community Plan Success Indicators
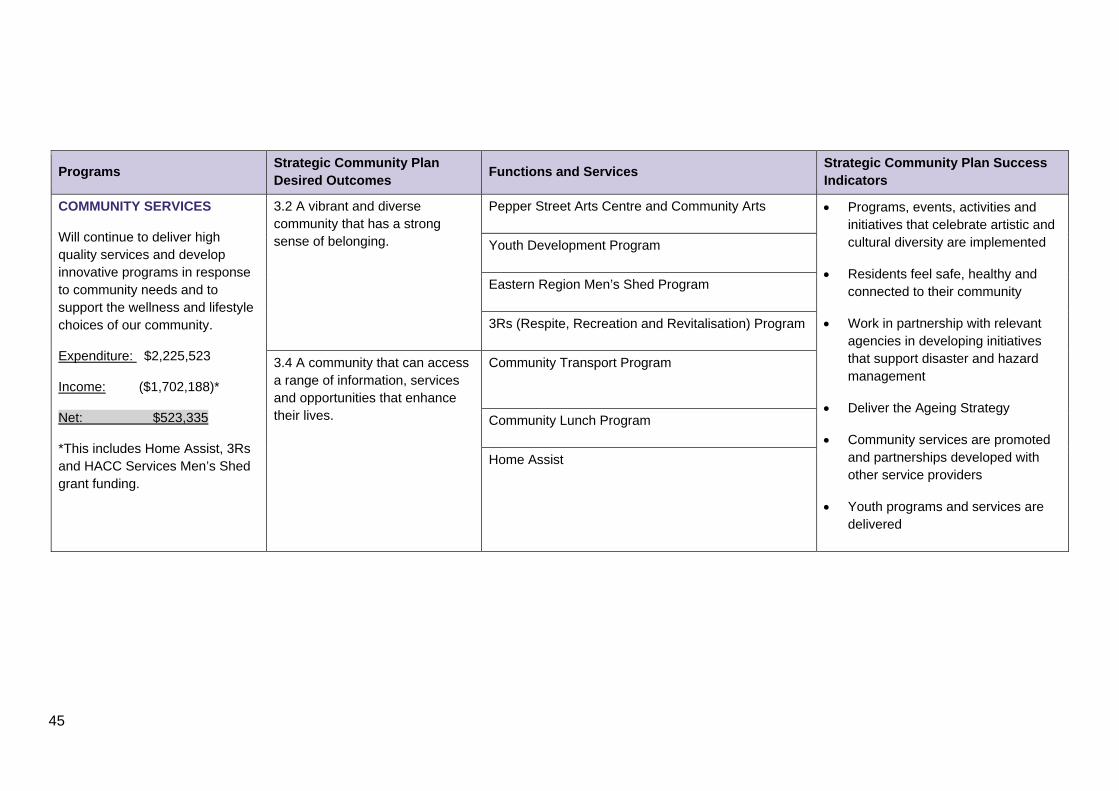
COMMUNITY SERVICES
Will continue to deliver high quality services and develop innovative programs in response to community needs and to support the wellness and lifestyle choices of our community.
Expenditure: $2,225,523
Income: ($1,702,188)*
Net: $523,335
*This includes Home Assist, 3Rs and HACC Services Men’s Shed grant funding.
3.2 A vibrant and diverse community that has a strong sense of belonging.
Pepper Street Arts Centre and Community Arts Programs, events, activities and initiatives that celebrate artistic and cultural diversity are implemented
Residents feel safe, healthy and connected to their community
Work in partnership with relevant agencies in developing initiatives that support disaster and hazard management
Deliver the Ageing Strategy
Community services are promoted and partnerships developed with other service providers
Youth programs and services are delivered
Youth Development Program
Eastern Region Men’s Shed Program
3Rs (Respite, Recreation and Revitalisation) Program
3.4 A community that can access a range of information, services and opportunities that enhance their lives.
Community Transport Program
Community Lunch Program
Home Assist
46
Programs Strategic Community Plan Desired Outcomes
Functions and Services Strategic Community Plan Success Indicators
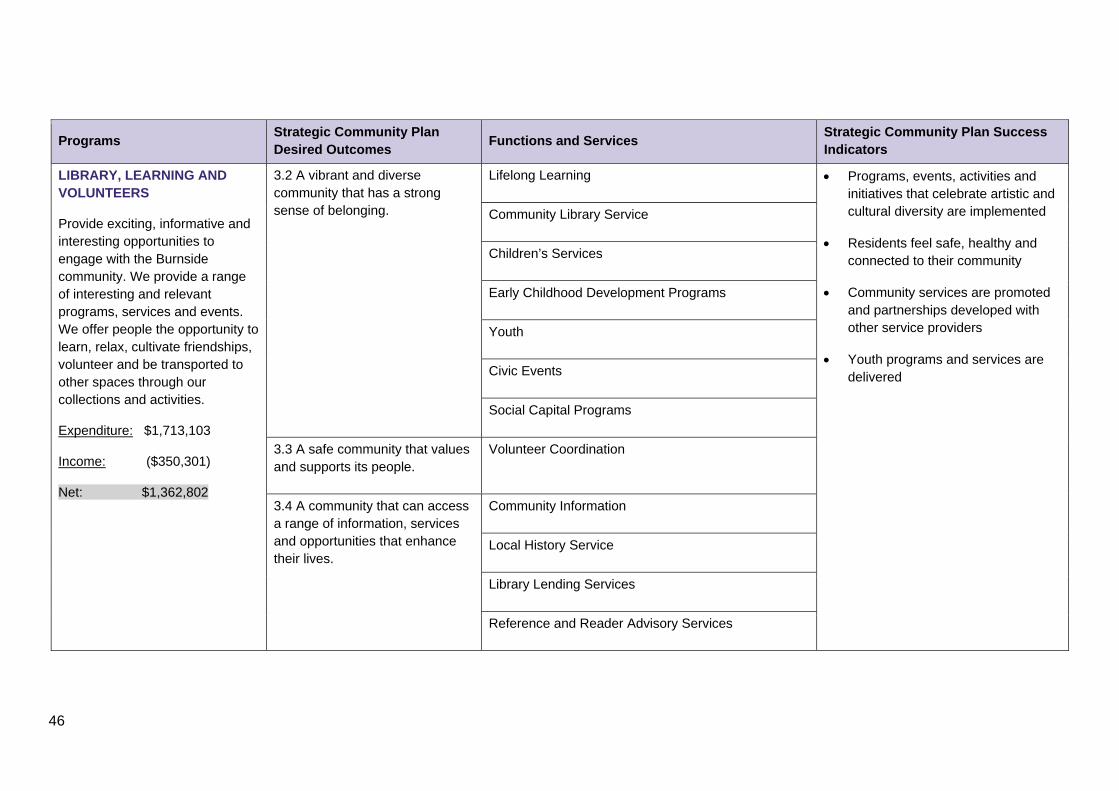
LIBRARY, LEARNING AND VOLUNTEERS
Provide exciting, informative and interesting opportunities to engage with the Burnside community. We provide a range of interesting and relevant programs, services and events. We offer people the opportunity to learn, relax, cultivate friendships, volunteer and be transported to other spaces through our collections and activities.
Expenditure: $1,713,103
Income: ($350,301)
Net: $1,362,802
3.2 A vibrant and diverse community that has a strong sense of belonging.
Lifelong Learning Programs, events, activities and initiatives that celebrate artistic and cultural diversity are implemented
Residents feel safe, healthy and connected to their community
Community services are promoted and partnerships developed with other service providers
Youth programs and services are delivered
Community Library Service
Children’s Services
Early Childhood Development Programs
Youth
Civic Events
Social Capital Programs
3.3 A safe community that values and supports its people.
Volunteer Coordination
3.4 A community that can access a range of information, services and opportunities that enhance their lives.
Community Information
Local History Service
Library Lending Services
Reference and Reader Advisory Services
47
Programs Strategic Community Plan Desired Outcomes
Functions and Services Strategic Community Plan Success Indicators
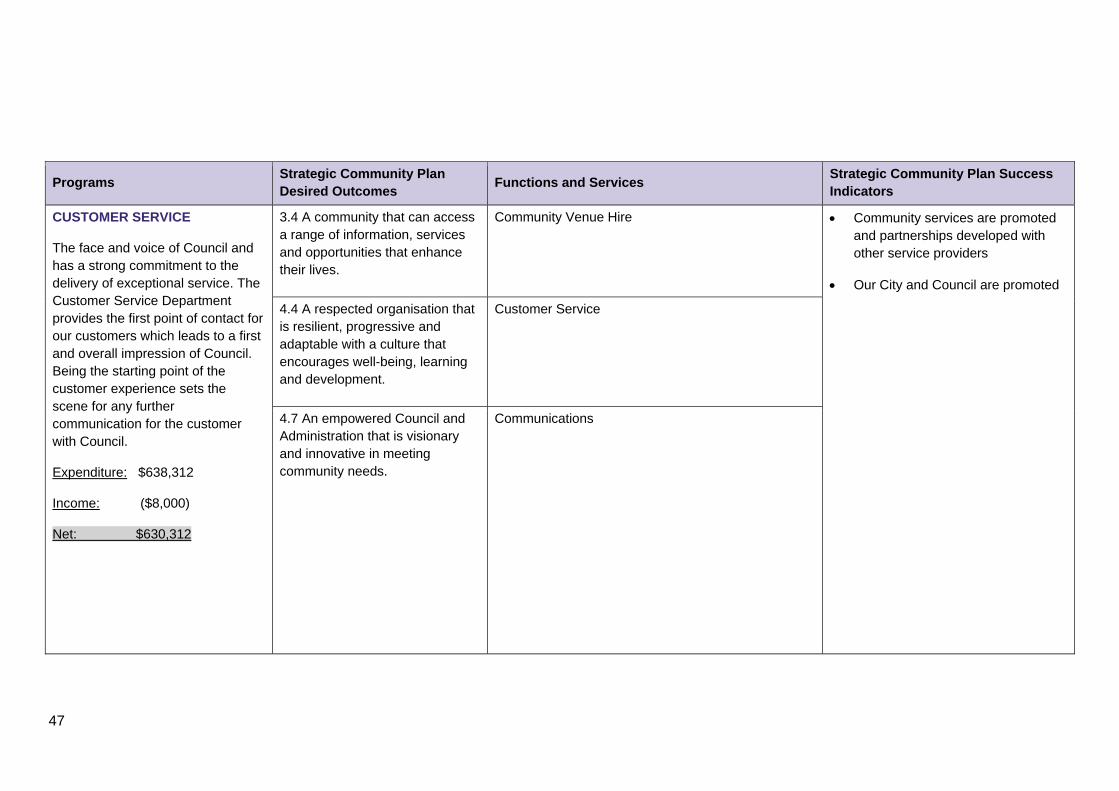
CUSTOMER SERVICE
The face and voice of Council and has a strong commitment to the delivery of exceptional service. The Customer Service Department provides the first point of contact for our customers which leads to a first and overall impression of Council. Being the starting point of the customer experience sets the scene for any further communication for the customer with Council.
Expenditure: $638,312
Income: ($8,000)
Net: $630,312
3.4 A community that can access a range of information, services and opportunities that enhance their lives.
Community Venue Hire Community services are promoted and partnerships developed with other service providers
Our City and Council are promoted
4.4 A respected organisation that is resilient, progressive and adaptable with a culture that encourages well-being, learning and development.
Customer Service
4.7 An empowered Council and Administration that is visionary and innovative in meeting community needs.
Communications
48
Programs Strategic Community Plan Desired Outcomes
Functions and Services Strategic Community Plan Success Indicators
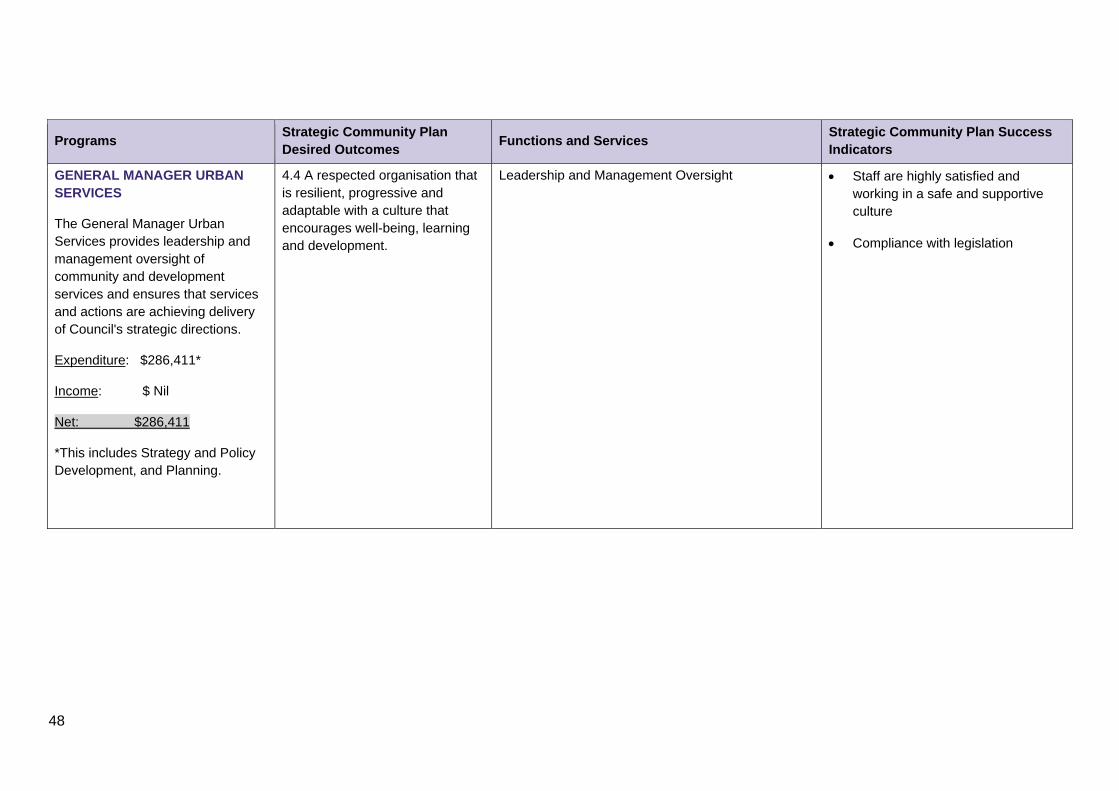
GENERAL MANAGER URBAN SERVICES
The General Manager Urban Services provides leadership and management oversight of community and development services and ensures that services and actions are achieving delivery of Council's strategic directions.
Expenditure: $286,411*
Income: $ Nil
Net: $286,411
*This includes Strategy and Policy Development, and Planning.
4.4 A respected organisation that is resilient, progressive and adaptable with a culture that encourages well-being, learning and development.
Leadership and Management Oversight Staff are highly satisfied and working in a safe and supportive culture
Compliance with legislation

49
Programs Strategic Community Plan Desired Outcomes
Functions and Services Strategic Community Plan Success Indicators
OPERATIONS SERVICES
Ensure that the City’s urban spaces including assets, parks, reserves and roadways, are fit for purpose and appropriately maintained for the use and benefit of the community.
Expenditure: $7,124,437
Income: ($63,100)*
Net: $7,061,337
*This includes verge maintenance revenue.
1.5 Sustainable engaging and functional community public spaces and streetscapes.
Arboriculture Maintenance Programs Street plantings are appropriate to the environment and form part of an overall Urban Tree Strategy
Parks and reserves are well maintained through service plans and programs
Public spaces and streetscapes are upgraded as part of annual works that reflect and enhance the environment to meet community needs
Produce and implement land management plans that promote biodiversity and environmental sustainability
The community has a high regard for customer service provided by the Council
1.7 An effective transport network that supports safe and efficient movement, connecting people and places.
City Safe Maintenance Programs
City Civil Maintenance Programs
2.1 Natural environments and watercourses protected and conserved in both the Hills Face and Plains.
City Clean Programs
Conservation and Land Management Programs
2.2 Sustainable use of natural resources and minimisation of waste to address climate change.
Parks Maintenance Programs
3.3 A safe community that values and supports its people.
Graffiti Removal Program
4.5 Cost-effective, leading edge technologies that deliver efficient council services which benefit the community.
Depot Workshop
4.4 A respected organisation that is resilient, progressive and adaptable with a culture that encourages well-being, learning and development.
Operations Management and Administration
Contract Management Depot
50
Programs Strategic Community Plan Desired Outcomes
Functions and Services Strategic Community Plan Success Indicators
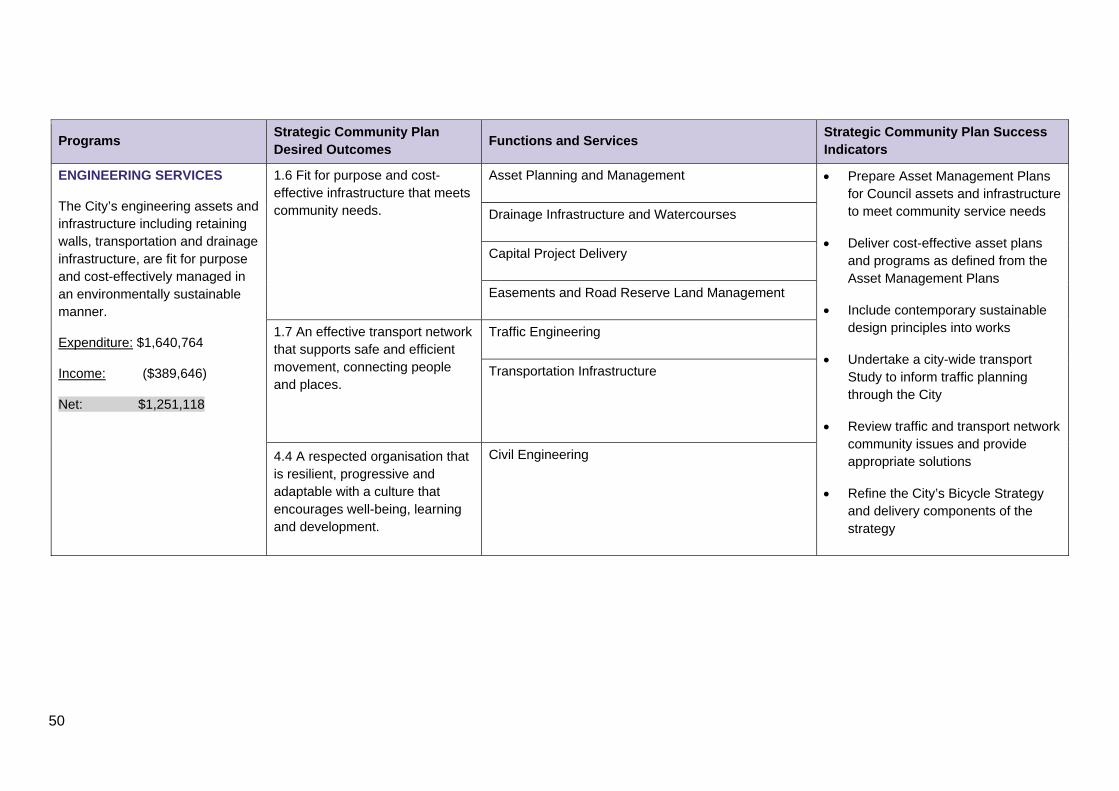
ENGINEERING SERVICES
The City’s engineering assets and infrastructure including retaining walls, transportation and drainage infrastructure, are fit for purpose and cost-effectively managed in an environmentally sustainable manner.
Expenditure: $1,640,764
Income: ($389,646)
Net: $1,251,118
1.6 Fit for purpose and cost-effective infrastructure that meets community needs.
Asset Planning and Management Prepare Asset Management Plans for Council assets and infrastructure to meet community service needs
Deliver cost-effective asset plans and programs as defined from the Asset Management Plans
Include contemporary sustainable design principles into works
Undertake a city-wide transport Study to inform traffic planning through the City
Review traffic and transport network community issues and provide appropriate solutions
Refine the City’s Bicycle Strategy and delivery components of the strategy
Drainage Infrastructure and Watercourses
Capital Project Delivery
Easements and Road Reserve Land Management
1.7 An effective transport network that supports safe and efficient movement, connecting people and places.
Traffic Engineering
Transportation Infrastructure
4.4 A respected organisation that is resilient, progressive and adaptable with a culture that encourages well-being, learning and development.
Civil Engineering
51
Programs Strategic Community Plan Desired Outcomes
Functions and Services Strategic Community Plan Success Indicators
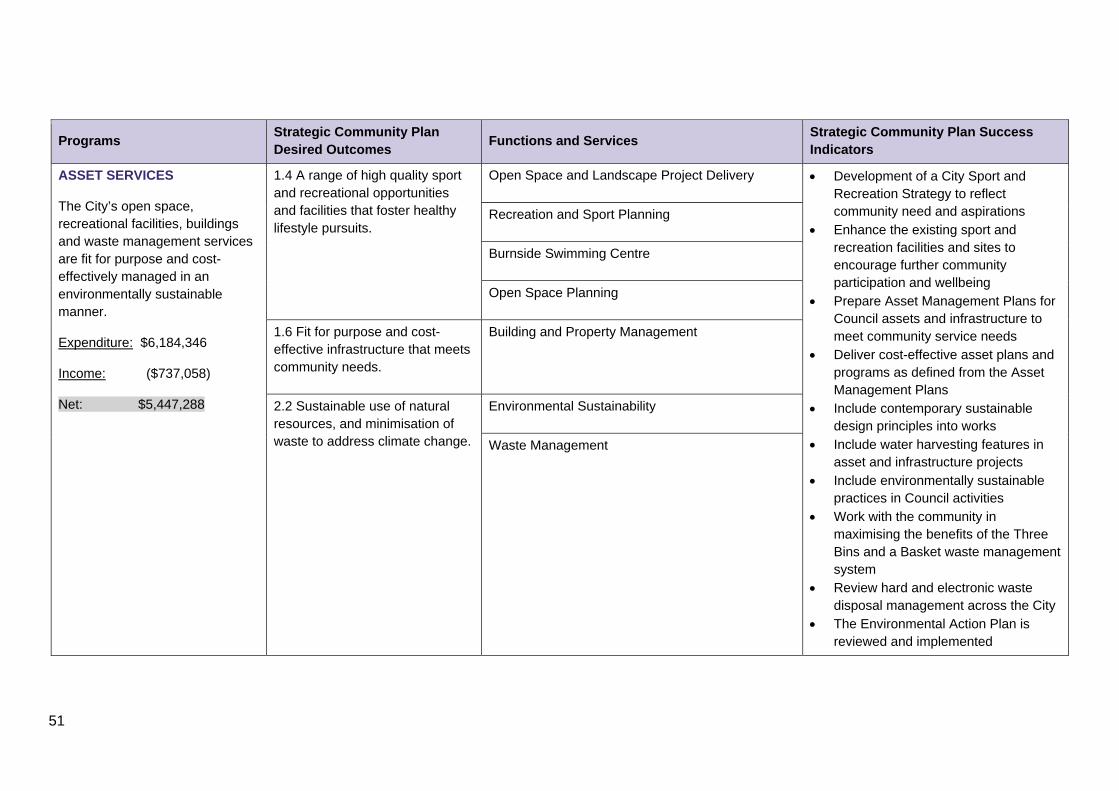
ASSET SERVICES
The City’s open space, recreational facilities, buildings and waste management services are fit for purpose and cost-effectively managed in an environmentally sustainable manner.
Expenditure: $6,184,346
Income: ($737,058)
Net: $5,447,288
1.4 A range of high quality sport and recreational opportunities and facilities that foster healthy lifestyle pursuits.
Open Space and Landscape Project Delivery Development of a City Sport and Recreation Strategy to reflect community need and aspirations
Enhance the existing sport and recreation facilities and sites to encourage further community participation and wellbeing
Prepare Asset Management Plans for Council assets and infrastructure to meet community service needs
Deliver cost-effective asset plans and programs as defined from the Asset Management Plans
Include contemporary sustainable design principles into works
Include water harvesting features in asset and infrastructure projects
Include environmentally sustainable practices in Council activities
Work with the community in maximising the benefits of the Three Bins and a Basket waste management system
Review hard and electronic waste disposal management across the City
The Environmental Action Plan is reviewed and implemented
Recreation and Sport Planning
Burnside Swimming Centre
Open Space Planning
1.6 Fit for purpose and cost-effective infrastructure that meets community needs.
Building and Property Management
2.2 Sustainable use of natural resources, and minimisation of waste to address climate change.
Environmental Sustainability
Waste Management
52
Programs Strategic Community Plan Desired Outcomes
Functions and Services Strategic Community Plan Success Indicators
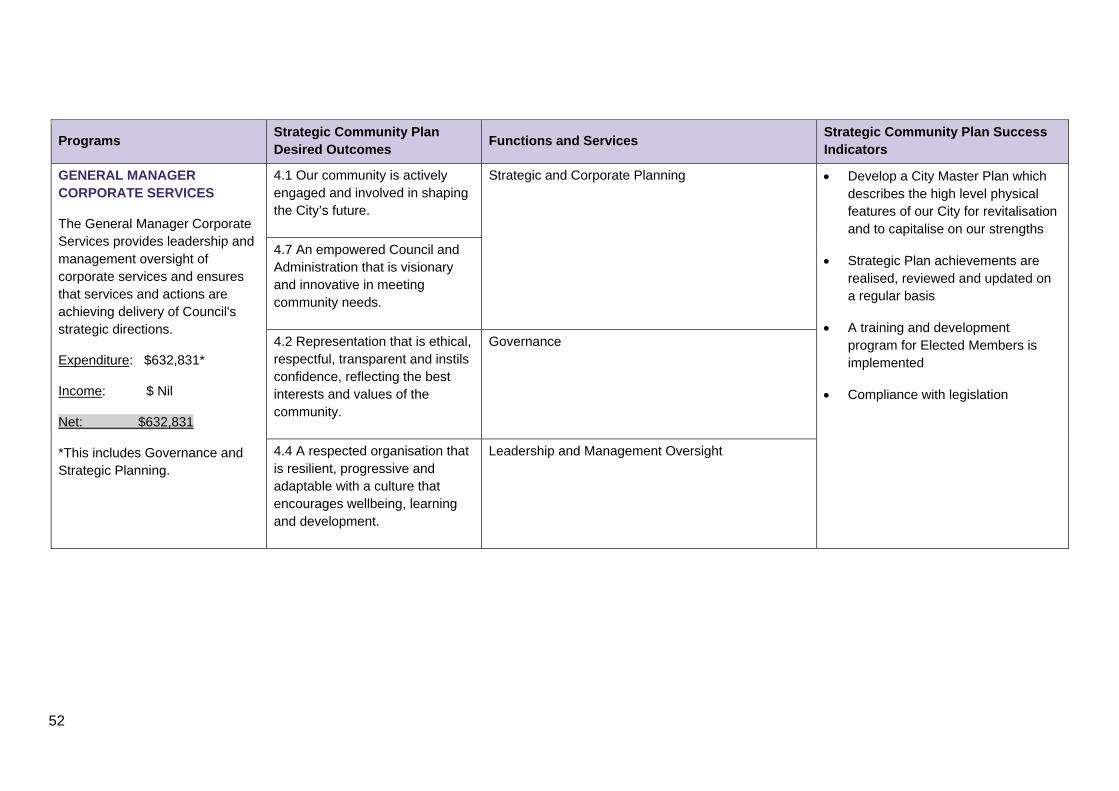
GENERAL MANAGER CORPORATE SERVICES
The General Manager Corporate Services provides leadership and management oversight of corporate services and ensures that services and actions are achieving delivery of Council's strategic directions.
Expenditure: $632,831*
Income: $ Nil
Net: $632,831
*This includes Governance and Strategic Planning.
4.1 Our community is actively engaged and involved in shaping the City’s future.
Strategic and Corporate Planning
Develop a City Master Plan which describes the high level physical features of our City for revitalisation and to capitalise on our strengths
Strategic Plan achievements are realised, reviewed and updated on a regular basis
A training and development program for Elected Members is implemented
Compliance with legislation
4.7 An empowered Council and Administration that is visionary and innovative in meeting community needs.
4.2 Representation that is ethical, respectful, transparent and instils confidence, reflecting the best interests and values of the community.
Governance
4.4 A respected organisation that is resilient, progressive and adaptable with a culture that encourages wellbeing, learning and development.
Leadership and Management Oversight
53
Programs Strategic Community Plan Desired Outcomes
Functions and Services Strategic Community Plan Success Indicators
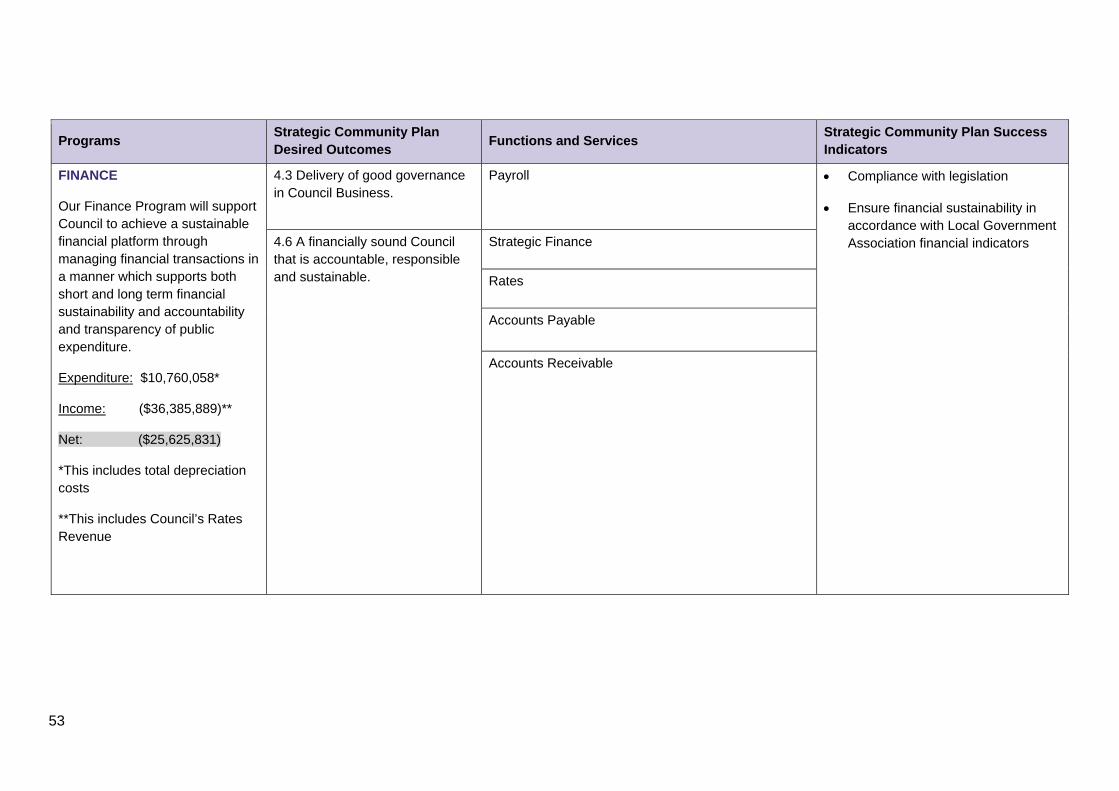
FINANCE
Our Finance Program will support Council to achieve a sustainable financial platform through managing financial transactions in a manner which supports both short and long term financial sustainability and accountability and transparency of public expenditure.
Expenditure: $10,760,058*
Income: ($36,385,889)**
Net: ($25,625,831)
*This includes total depreciation costs
**This includes Council’s Rates Revenue
4.3 Delivery of good governance in Council Business.
Payroll Compliance with legislation
Ensure financial sustainability in accordance with Local Government Association financial indicators 4.6 A financially sound Council
that is accountable, responsible and sustainable.
Strategic Finance
Rates
Accounts Payable
Accounts Receivable
54
Programs Strategic Community Plan Desired Outcomes
Functions and Services Strategic Community Plan Success Indicators
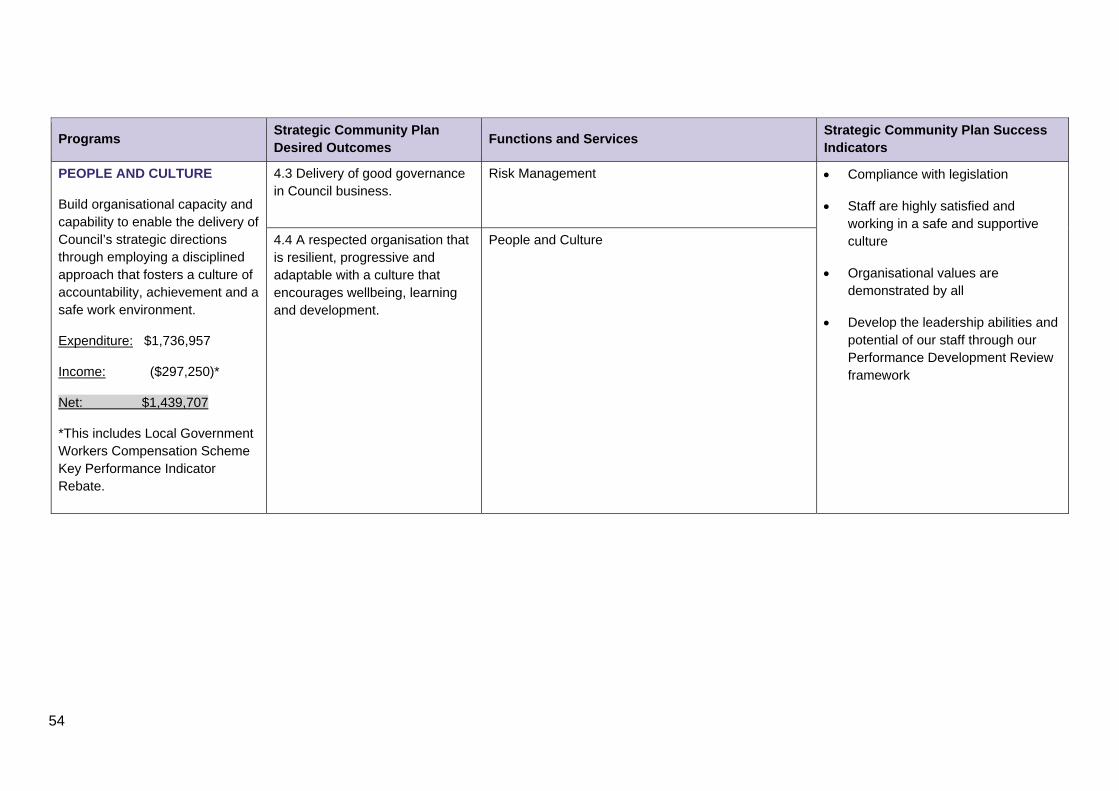
PEOPLE AND CULTURE
Build organisational capacity and capability to enable the delivery of Council’s strategic directions through employing a disciplined approach that fosters a culture of accountability, achievement and a safe work environment.
Expenditure: $1,736,957
Income: ($297,250)*
Net: $1,439,707
*This includes Local Government Workers Compensation Scheme Key Performance Indicator Rebate.
4.3 Delivery of good governance in Council business.
Risk Management Compliance with legislation
Staff are highly satisfied and working in a safe and supportive culture
Organisational values are demonstrated by all
Develop the leadership abilities and potential of our staff through our Performance Development Review framework
4.4 A respected organisation that is resilient, progressive and adaptable with a culture that encourages wellbeing, learning and development.
People and Culture
55
Programs Strategic Community Plan Desired Outcomes
Functions and Services Strategic Community Plan Success Indicators
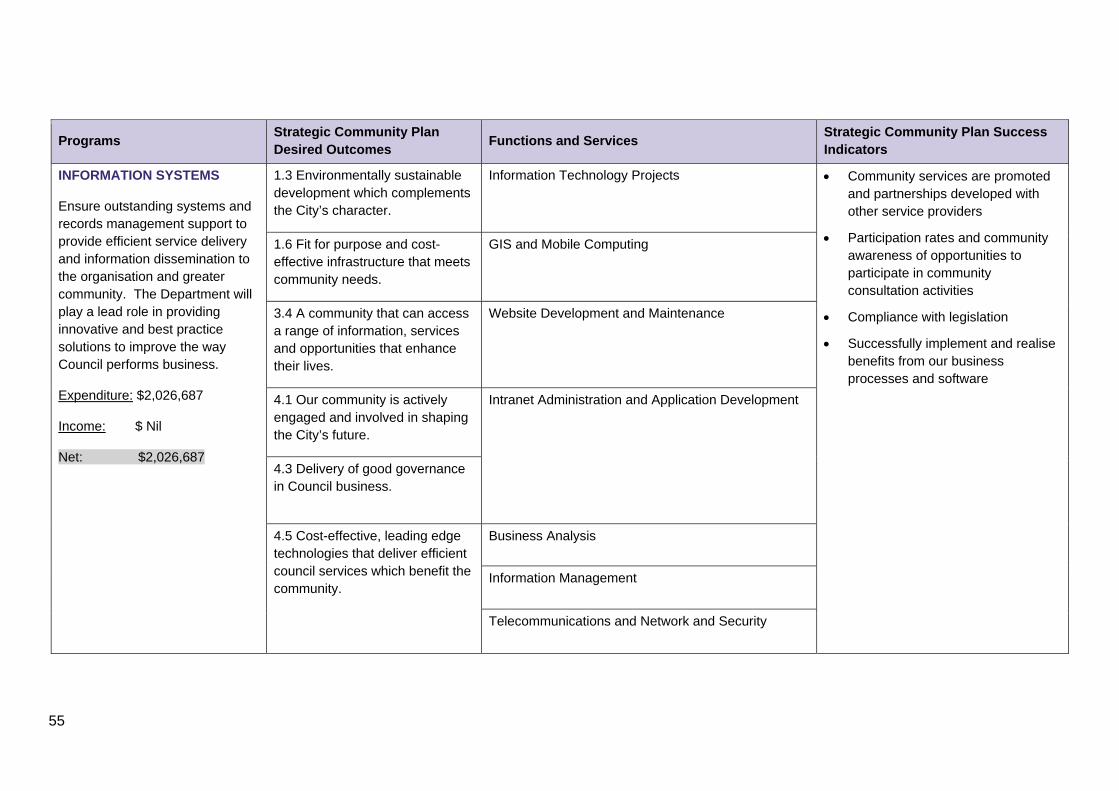
INFORMATION SYSTEMS
Ensure outstanding systems and records management support to provide efficient service delivery and information dissemination to the organisation and greater community. The Department will play a lead role in providing innovative and best practice solutions to improve the way Council performs business.
Expenditure: $2,026,687
Income: $ Nil
Net: $2,026,687
1.3 Environmentally sustainable development which complements the City’s character.
Information Technology Projects
Community services are promoted and partnerships developed with other service providers
Participation rates and community awareness of opportunities to participate in community consultation activities
Compliance with legislation
Successfully implement and realise benefits from our business processes and software
1.6 Fit for purpose and cost-effective infrastructure that meets community needs.
GIS and Mobile Computing
3.4 A community that can access a range of information, services and opportunities that enhance their lives.
Website Development and Maintenance
4.1 Our community is actively engaged and involved in shaping the City’s future.
Intranet Administration and Application Development
4.3 Delivery of good governance in Council business.
4.5 Cost-effective, leading edge technologies that deliver efficient council services which benefit the community.
Business Analysis
Information Management
Telecommunications and Network and Security
56
Programs Strategic Community Plan Desired Outcomes
Functions and Services Strategic Community Plan Success Indicators
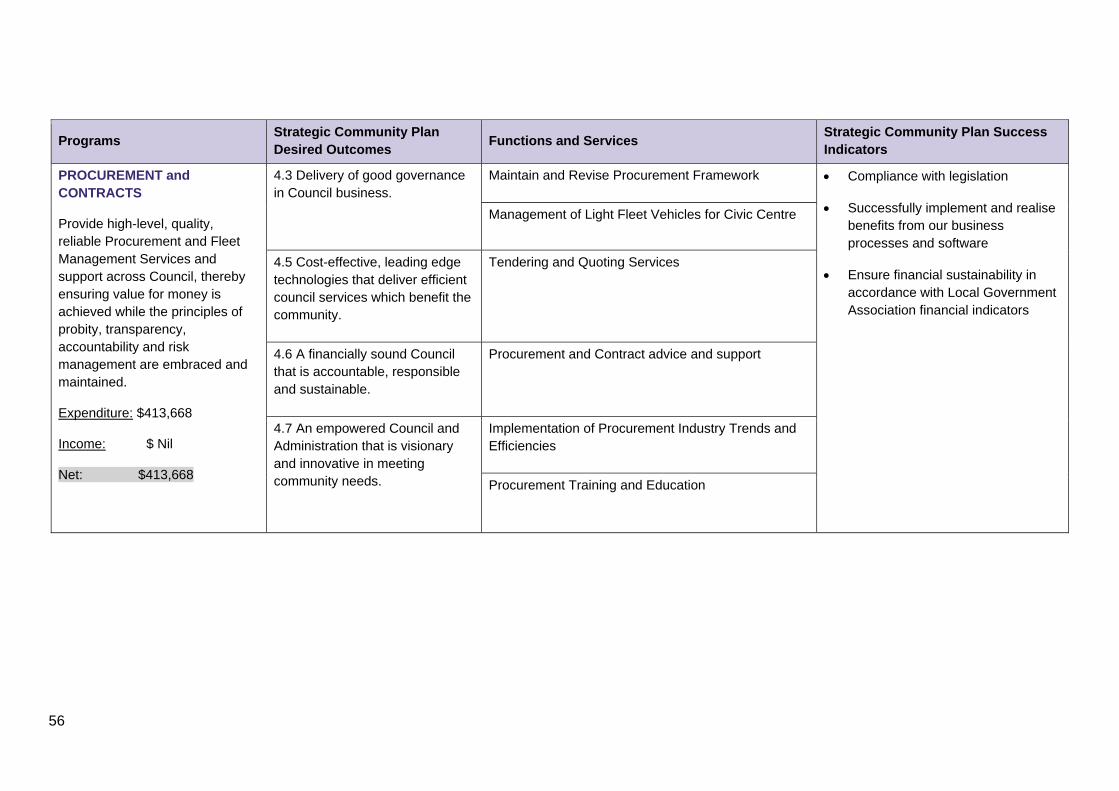
PROCUREMENT and CONTRACTS
Provide high-level, quality, reliable Procurement and Fleet Management Services and support across Council, thereby ensuring value for money is achieved while the principles of probity, transparency, accountability and risk management are embraced and maintained.
Expenditure: $413,668
Income: $ Nil
Net: $413,668
4.3 Delivery of good governance in Council business.
Maintain and Revise Procurement Framework Compliance with legislation
Successfully implement and realise benefits from our business processes and software
Ensure financial sustainability in accordance with Local Government Association financial indicators
Management of Light Fleet Vehicles for Civic Centre
4.5 Cost-effective, leading edge technologies that deliver efficient council services which benefit the community.
Tendering and Quoting Services
4.6 A financially sound Council that is accountable, responsible and sustainable.
Procurement and Contract advice and support
4.7 An empowered Council and Administration that is visionary and innovative in meeting community needs.
Implementation of Procurement Industry Trends and Efficiencies
Procurement Training and Education
57
12 Measuring Performance
Monitoring performance is critical in ensuring that Council is contributing to the achievement of Burnside’s Strategic Community Plan. Council’s Strategic Planning Framework supports Council in measuring the achievements of Council’s Vision as well as monitoring the delivery of services and projects.
Council measures its performance in a number of ways:
Annual Report
Monthly/Quarterly financial reports to Council
Progress reports against Annual Business Plan
Quarterly Key Performance Reports to Executive Team
Annual Program Reports to Council
Individual Staff Performance Plans
Annual Community Survey
Customer request and complaint systems
13 Rating Strategy and Policy 2014/15
In setting rates, Council’s primary consideration is the City of Burnside’s Strategic Community Plan 2012-2025 which has been developed in consultation with ratepayers, residents, special interest groups and other stakeholders. Council considers the current economic climate, incorporating inflation rates and Consumer Price Index (CPI), employment rates, Council’s debt profile, imposed legislative change and the need to manage, maintain and improve the community’s physical infrastructure assets for future generations.
Council, in its deliberations, takes into consideration the effect of rates on all ratepayers and is mindful of maintaining the balance between economic and community development.
In considering the impact, Council assessed those elements of the Council’s Strategic Community Plan relating to business development, the need to manage, maintain and improve the community’s physical infrastructure assets for future generations, and specific infrastructure maintenance issues.
Council’s ability to raise income from rents and lease payments is tempered by its desire to ensure that community groups and sporting bodies, which are the lifeblood of any vibrant community, have sufficient resources to meet their objectives and obligations. As a result, concessional rental and lease arrangements often apply.
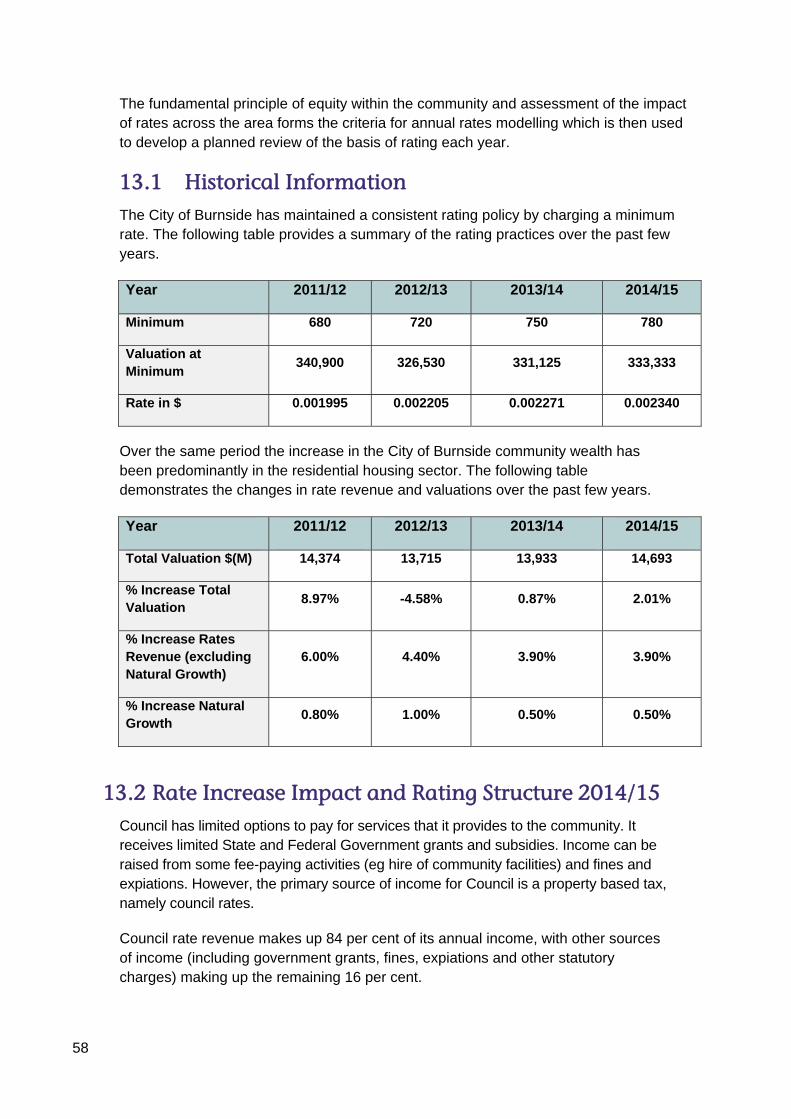
58
The fundamental principle of equity within the community and assessment of the impact of rates across the area forms the criteria for annual rates modelling which is then used to develop a planned review of the basis of rating each year.
13.1 Historical Information The City of Burnside has maintained a consistent rating policy by charging a minimum rate. The following table provides a summary of the rating practices over the past few years.
Year 2011/12 2012/13 2013/14 2014/15
Minimum 680 720 750 780
Valuation at Minimum
340,900 326,530 331,125 333,333
Rate in $ 0.001995 0.002205 0.002271 0.002340
Over the same period the increase in the City of Burnside community wealth has been predominantly in the residential housing sector. The following table demonstrates the changes in rate revenue and valuations over the past few years.
Year 2011/12 2012/13 2013/14 2014/15
Total Valuation $(M) 14,374 13,715 13,933 14,693
% Increase Total Valuation
8.97% -4.58% 0.87% 2.01%
% Increase Rates Revenue (excluding Natural Growth)
6.00% 4.40% 3.90% 3.90%
% Increase Natural Growth
0.80% 1.00% 0.50% 0.50%
13.2 Rate Increase Impact and Rating Structure 2014/15 Council has limited options to pay for services that it provides to the community. It receives limited State and Federal Government grants and subsidies. Income can be raised from some fee-paying activities (eg hire of community facilities) and fines and expiations. However, the primary source of income for Council is a property based tax, namely council rates.
Council rate revenue makes up 84 per cent of its annual income, with other sources of income (including government grants, fines, expiations and other statutory charges) making up the remaining 16 per cent.
59
13.3 Average Residential Rate To provide the community with a level of services similar to other councils (that have a lower dependency on rates) Burnside Council will continue to depend on rates to fund these services.
Council has decided for the 2014/15 rating year to continue with a single rate in the dollar for all ratepayers. This means that the declared rate in the dollar for businesses is the same as the rate in the dollar for all other rateable properties.
Taking into account the residential rate increase of 3.9 per cent for 2014/15, the average residential rates payable for 2014/15 will be $1,600.
13.4 Method Used to Value Land Council has adopted the use of capital value as the basis for valuing land within the Council area. Council considers that this method of valuing land provides the best of the options available to Council as prescribed in the Local Government Act, 1999 and therefore the fairest method of distributing the rate responsibility across all rate payers.
Section 151 of the Local Government Act, 1999 further identifies that the value of land for the purpose of rating is capital value which includes all improvements. The improved value of the land is considered a reasonable indicator of capacity to pay.
Council uses the services of the South Australian Valuer General to establish the value of land within the Council area for rating purposes.
13.5 Valuation Objections Council rates are imposed under the provisions of the Local Government Act, 1999 and within the City of Burnside are based on the Capital Valuation applied for the current financial year. If a ratepayer is dissatisfied with a property valuation then an objection may be made to the State Valuation Office in writing within 60 days of receiving notice of the valuation, explaining the basis for the objection – provided they have not:
Previously received a notice of this valuation, under the Local Government Act, 1999, in which case the objection period is 60 days from the receipt of the first notice, or
previously had an objection to the valuation considered by the State Valuation Office in the current financial year.
It should be noted that under the Valuation of Land Act, 1971 the Valuer General has the discretion to extend the allowable objection period where it can be shown there is reasonable cause.
Objection to valuations should be addressed to:
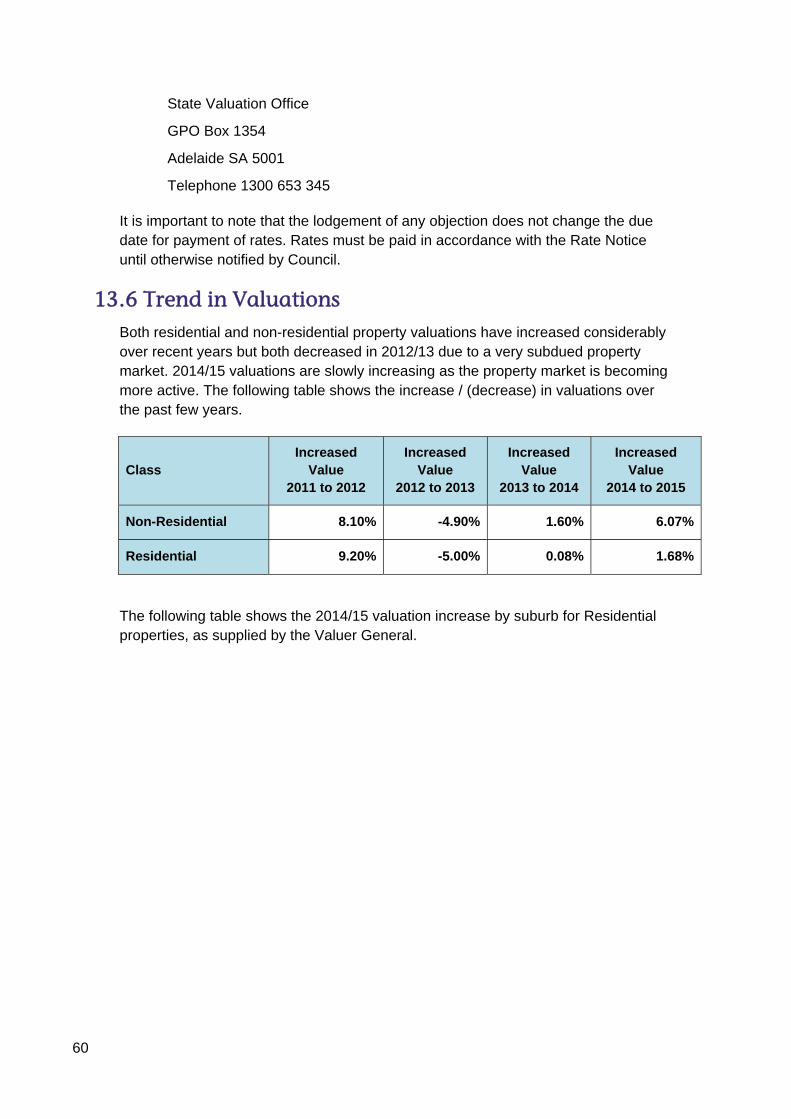
60
State Valuation Office
GPO Box 1354
Adelaide SA 5001
Telephone 1300 653 345
It is important to note that the lodgement of any objection does not change the due date for payment of rates. Rates must be paid in accordance with the Rate Notice until otherwise notified by Council.
13.6 Trend in Valuations Both residential and non-residential property valuations have increased considerably over recent years but both decreased in 2012/13 due to a very subdued property market. 2014/15 valuations are slowly increasing as the property market is becoming more active. The following table shows the increase / (decrease) in valuations over the past few years.
Class Increased
Value 2011 to 2012
Increased Value
2012 to 2013
Increased Value
2013 to 2014
Increased Value
2014 to 2015
Non-Residential 8.10% -4.90% 1.60% 6.07%
Residential 9.20% -5.00% 0.08% 1.68%
The following table shows the 2014/15 valuation increase by suburb for Residential properties, as supplied by the Valuer General.

61
Suburb No. of Residential Properties % Change in Valuation
AULDANA 255 -9.44%
BEAUMONT 1,060 0.92%
BEULAH PARK 783 2.58%
BURNSIDE 1,284 0.99%
DULWICH 827 0.01%
EASTWOOD 596 3.66%
ERINDALE 488 0.45%
FREWVILLE 436 2.40%
GLEN OSMOND 796 -3.26%
GLENSIDE 1,541 1.29%
GLENUNGA 938 1.22%
HAZELWOOD PARK 873 4.13%
KENSINGTON GARDENS 1,205 5.89%
KENSINGTON PARK 1,167 5.80%
LEABROOK 804 0.76%
LEAWOOD GARDENS 12 1.25%
LINDEN PARK 933 1.53%
MAGILL 1,133 3.60%
MOUNT OSMOND 183 6.85%
ROSE PARK 688 -0.63%
ROSSLYN PARK 629 1.30%
SKYE 139 1.96%
ST GEORGES 666 0.81%
STONYFELL 490 0.72%
TOORAK GARDENS 1,179 0.36%
TUSMORE 674 0.09%
WATERFALL GULLY 60 1.90%
WATTLE PARK 767 0.89%
TOTAL 20,606 2.01%
62
13.7 Growth In relation to growth, the City of Burnside determines which properties need to have site visits by Valuation SA in order for revaluations to be performed as a result of:
significant capital improvement having been undertaken on the land
where the predominant land use of the property may have changed (for example from residential to commercial) or
where there has been a change in ownership/occupation during the year, particularly where the sale price is significantly different to property value.
In 2013/14, the change in valuations in the City due to revaluations for the above reasons generated approximately $153,850 additional rate revenue (growth income), being an increase of 0.5 per cent. The growth in terms of valuation in the Burnside area for 2014/15 is 0.5 per cent ($167,838).
13.8 General Rates All land within a Council area, except for land specifically exempt (eg Crown Land, Council occupied land and other land prescribed in the Local Government Act, 1999 – refer Section 147 of the Act), is rateable. The Local Government Act, 1999 provides for a Council to raise revenue for the broad purposes of the Council through a general rate, which applies to all rateable properties. The general rate in the dollar will be set and adopted at the 24 June 2014 meeting of Council.
13.9 Minimum Rate Council has historically decided to impose a minimum amount payable by way of rates in accordance with Section 158 of the Local Government Act, 1999. Council has chosen to impose a minimum rate rather than a fixed charge as it offers simplicity in its administration and the overall effect of each is very similar.
Note: A minimum rate results in lower valued properties paying not less than a flat (minimum) amount determined by Council. No more than 35 per cent of properties are allowed to be on the minimum rate. A fixed charge is the application of a fixed charge (a flat amount) to all ratepayers. This ensures that everyone contributes an equal base amount. The remaining revenue is then collected from all ratepayers based upon the value of the property.
The Council considers it appropriate that all rateable properties make a contribution to the cost of administering Council’s activities and that all rateable properties make a contribution to the cost of creating and maintaining the physical infrastructure that supports each property and the basic services provided for all ratepayers.
Council has determined to increase the minimum rate at the same level as the overall increase in rate income (rounded up to the nearest $10) as the cost of services continues to increase and hence the ‘contribution’ paid by ratepayers on the minimum should also increase. Increasing the minimum rate has some merit on an
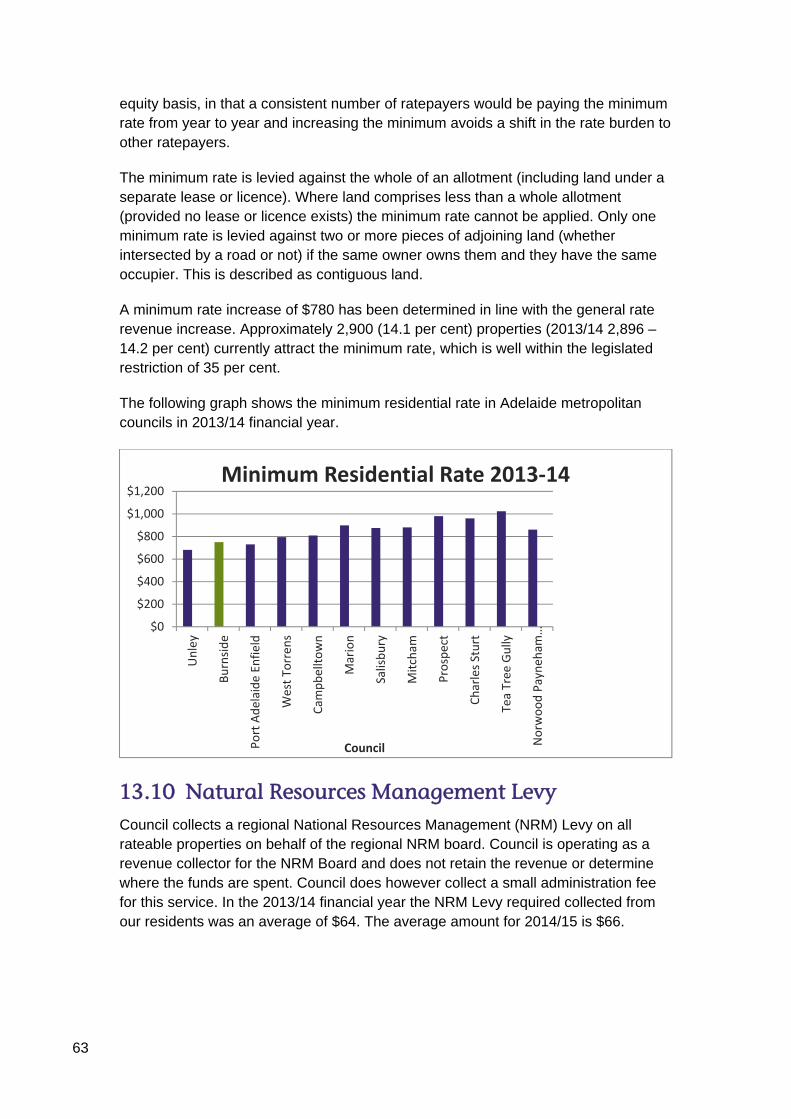
63
equity basis, in that a consistent number of ratepayers would be paying the minimum rate from year to year and increasing the minimum avoids a shift in the rate burden to other ratepayers.
The minimum rate is levied against the whole of an allotment (including land under a separate lease or licence). Where land comprises less than a whole allotment (provided no lease or licence exists) the minimum rate cannot be applied. Only one minimum rate is levied against two or more pieces of adjoining land (whether intersected by a road or not) if the same owner owns them and they have the same occupier. This is described as contiguous land.
A minimum rate increase of $780 has been determined in line with the general rate revenue increase. Approximately 2,900 (14.1 per cent) properties (2013/14 2,896 – 14.2 per cent) currently attract the minimum rate, which is well within the legislated restriction of 35 per cent.
The following graph shows the minimum residential rate in Adelaide metropolitan councils in 2013/14 financial year.
13.10 Natural Resources Management Levy Council collects a regional National Resources Management (NRM) Levy on all rateable properties on behalf of the regional NRM board. Council is operating as a revenue collector for the NRM Board and does not retain the revenue or determine where the funds are spent. Council does however collect a small administration fee for this service. In the 2013/14 financial year the NRM Levy required collected from our residents was an average of $64. The average amount for 2014/15 is $66.
$0
$200
$400
$600
$800
$1,000
$1,200
Unley
Burnside
Port Adelaide Enfield
West Torren
s
Cam
pbelltown
Marion
Salisbury
Mitcham
Prospect
Charles Sturt
Tea Tree
Gully
Norw
ood Payneh
am…
Council
Minimum Residential Rate 2013‐14

64
13.11 Remissions (Government Concessions) Concessions are granted under the Rates and Land Tax Remission Act, 1986 and are only applicable for the principal place of residence.
Pensioner concessions are granted to ratepayers who are holders of a current Commonwealth or State Pensioner concession card, eligible prior to the first instalment date in September in the current financial year, and who are owners, part owners or life tenants of the property.
Seniors concessions are granted to ratepayers who are holders of a current State Seniors Card, eligible prior to the first instalment date in September in the current financial year, and who are owners, part owners or life tenants of the property, and who are not entitled to a concession as a pensioner.
Ratepayers experiencing hardship and holders of a State Government Health Care Card may be entitled to a concession through Families SA.
Our community in 2013/14 included 2,080 self-funded retirees who received a $100 concession from State Government on their council rates and 2,707 pensioners who received a $190 concession. More than 23 per cent of ratepayers will be in receipt of some form of concession in 2014/15.
13.12 Rebate of Rates – Under the Local Government Act 1999
The Local Government Act, 1999 requires Council to grant rebates to specific properties. These include properties that meet the requirements of the Act for land used for religious purposes, educational purposes and community uses as specified in the Act.
Council has determined that rebates of rates will be granted when the applicant satisfies the requirements for mandatory rebates under Section 159 to 165 of the Act. Applications for discretionary rebates lodged under Section 166 of the Act will be considered under Council’s Discretionary Rebates of Rates Policy.
13.13 Rebate of Rates – Discretionary Section 166 of the Local Government Act, 1999 sets out the circumstances in which a Council may grant discretionary rebates of up to 100 per cent. The Council has an absolute discretion to grant a rebate of rates or service charges and to determine the amount of any such rebate.
Persons or bodies that seek a discretionary rebate will be required to submit an application form to the Council and provide to the Council such information as stipulated on the application form and any other information that the Council may reasonably require.
65
The Council will take into account, in accordance with Section 159 (5) of the Act, the following matters:
the nature and extent of Council services provided in respect of the land for which the rebate is sought in comparison to similar services provided elsewhere in the Council’s area
the community need that is being met by activities carried out on the land for which the rebate is sought
the extent to which activities carried out on the land for which the rebate is sought provides assistance or relief to disadvantaged persons
The Council may take into account other matters it considers relevant including, but not limited to, the following:
why there is a need for financial assistance through a rebate
the level of rebate (percentage and dollar amount) being sought and why it is appropriate
the extent of financial assistance, if any, being provided to the applicant and/or in respect of the land by Commonwealth or State agencies
whether the applicant has made or intends to make applications to another Council
whether, and if so to what extent, the applicant is or will be providing a service within the Council area
whether the applicant is a public sector body, a private not for profit body or a private or profit body
whether the applicant is securing a pecuniary profit for the members of the body (or any of them) or is engaging in trade or commerce and therefore has the ability to distribute profit to its members
whether there are any relevant historical considerations that may be relevant for all or any part of the current Council term
consideration of the full financial consequences of the rebate for the Council
the time the application is received
the availability of any community grants to the person or body making the application
whether the applicant is in receipt of a community grant
any other matters and policies of the Council, which the Council considers relevant.
66
All persons or bodies that wish to apply to the Council for a rebate of rates for the current rating period, must do so on or before 1 September 2014. The Council reserves the right to refuse to consider applications received after that date. Applicants that satisfy the criteria for a mandatory rebate will be granted the rebate at any time during the current rating period.
The Council may grant a rebate of rates or charges on such conditions as the Council thinks fit and for proper cause, or determine that an entitlement to a rebate of rates under the Act no longer applies.
Where an entitlement to a rebate of rates ceases or no longer applies during the course of a financial year, the Council is entitled to recover rates, or rates at the increased level (as the case may be), proportionate to the remaining part of the financial year.
Council considers that circumstances where ratepayers provide or maintain infrastructure that might otherwise be provided by the City of Burnside or where profitable organisations receive government funding, should not impact on decisions to grant a rebate of rates. However, Council recognises that it has a requirement to balance the benefits of supporting community organisations with the impact that such rebates have on our overall rating income.
Rates must be paid by the due date and applications for discretionary rebates must be made using the appropriate form.
The Discretionary Rebates of Rates Policy provides the full details regarding rate rebates permissible under the Act.
13.14 Rebate of Rates – Private Water Suppliers Section 166 (1) (j) states “A council may grant a rebate where the land is being used by an organisation which, in the opinion of the council, provides a benefit or service to the local community up to (and including) 100 per cent”.
Council has assessed the specific issue of private water suppliers in the suburb of Skye and considers that charging full rates on parcels of land that are used for providing water provision infrastructure, is not in the interest of the community. Council rates will be charged on a rate in the dollar basis, on the capital value of the property, with no application of a minimum rate.
13.15 Rate Relief – Residential Maximum Rate Increase/Rate Capping
For the purposes of relieving ratepayers from the impact of very large increases in rates resulting from movements in valuations, and addressing the general provisions of Section 153, Council has resolved to provide a rebate which effectively caps increases in rates based on property value above a set limit.
67
A rebate of general rates for the 2014/15 financial year will be granted to the principal ratepayer of an Assessment under Section 153 of the Local Government Act, 1999 where the amount of any increase in rates in respect of that Assessment is greater than 12.5 per cent.
Property rate capping in the form of a rebate will be applied to individual properties and will be subject to application by the registered property owner, being a person or body as specified in Council’s Assessment Record. Rate capping in accordance with this policy will be reviewed annually, the quantum of rate capping will also be considered annually and a maximum determined at the Council meeting when the annual rates and budget is determined.
13.16 Guiding Principles of Eligibility for Rebate – Rate Capping
Council will offer a rebate across all residential properties that experience a percentage increase in rates above the maximum set by Council.
The rebate will be provided to the principal ratepayer of an Assessment through that person making application in the prescribed form.
The rebate will be granted where the amount of any increase in rates in respect of that Assessment is greater than 12.5 per cent.
The amount of the rebate will be the result of applying an amount of 12.5 per cent to the general rates (before any rebates, remissions, concessions) in monetary terms for the previous financial year and then deducting this amount from the general rate in monetary terms for the current financial year (before deducting any pension or other concessions).
The rebate will not apply where property values have increased as a result of the following events:
new building work and/or development activity
changes in land use, wholly or partially
changes in zoning
the ownership of the ratable property has changed since 1 July of the previous year or
the property is no longer the principal place of residence.
68
13.17 Hardship Provisions
13.17.1 Remission of Rates – Residential Properties
Council will provide remission of rates in accordance with Section 182 of the Local Government Act, 1999 to provide flexibility in respect to its rating policy and:
to provide additional relief for people receiving concessions under the Rates and Land Tax Remission Act, 1986 and/or
to provide relief from hardship.
13.17.2 Guiding Principles of Eligibility for Remission of Rates
All applications for remission of rates will be assessed on a case by case basis and are not contingent on the level of increase in rates payable.
All remissions of rates will be subject to the principal ratepayer making application in the prescribed form.
A remission of rates will be available on any residential property where the principal ratepayer satisfies the application criteria.
13.17.3 Application Criteria
A remission of rates will be available where the ratepayer satisfies the following:
the property is the principal residence of the ratepayer and is the only property owned by the ratepayer and
the Council is satisfied that the payment of the rates would cause hardship to the ratepayer.
Where the ratepayer satisfies the application criteria for a rate remission Council will grant a remission up to a maximum of 80 per cent (after deducting pensioner concessions) or up to an amount of $1,000 in the year of application.
Retrospective or continuing annual remissions will not be considered.
Remissions are subject to an application by the principal ratepayer.
Any fines incurred prior to a remission of rates accepted by Council will not be remitted.
All applications for remission of rates must be in writing on the prescribed application form and provide supporting documentation in order to be considered.
69
13.18 Postponement of Rates
13.18.1 Seniors
Section 182A of the Local Government Act, 1999 provides the option for State Senior Card holders to apply to postpone their annual Council rates in excess of $500 on a long-term basis. The deferred amount is subject to a monthly interest charge with the accrued debt being payable on the disposal or sale of the property.
Postponement is similar to a reverse mortgage by relying on the equity in the property. A ratepayer who has a State Seniors Card may apply for a postponement of their Council rates in excess of $500 payable on the property they own if it is their principal place of residence and if no other person other than their spouse has an interest as owner of the property and there is appropriate equity in the property.
13.18.2 Relief from Hardship
Postponement of rates payment, authorised by Section 182 of the Local Government Act 1999, provides a useful approach to relief for some ratepayers. Postponement enables ratepayers to defer payment of rates until such time as the property is sold or their circumstances change.
The amount postponed can be up to 100 per cent of the rates payable for the assessment (after deducting pensioner or other concessions).
All applications for postponement will be assessed on a case by case basis. The individual circumstances will determine whether Council agrees to the postponement of the whole or part of the rates payable and will not exceed rates payable as set by Council annually.
Information relating to rebates, remissions, rate relief and postponement of rates can be obtained by contacting Council’s Rates Section by telephone on 8366 4207. Such enquiries are treated confidentially by Council.
All applications for rebates, remissions, rate relief or postponements must be in writing and addressed to the Chief Executive Officer, City of Burnside, PO Box 9, Glenside SA 5065.
70
14 Financial Statements
Below are the 2014/15 Annual Budget Financial Statements:
Statement of Comprehensive Income
Balance Sheet
Statement of Changes in Equity
Statement of Cash Flows
Uniform Presentation of Finances
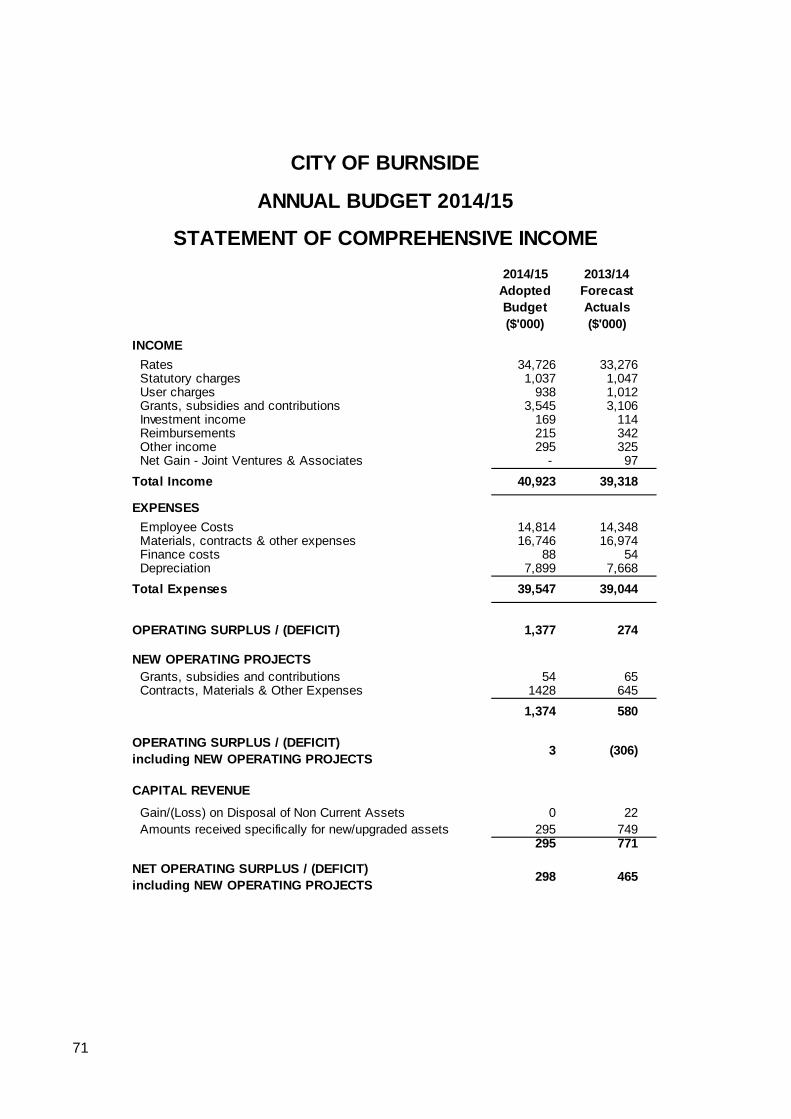
71
2014/15 Adopted Budget($'000)
2013/14 Forecast Actuals($'000)
INCOME
Rates 34,726 33,276 Statutory charges 1,037 1,047 User charges 938 1,012 Grants, subsidies and contributions 3,545 3,106 Investment income 169 114 Reimbursements 215 342 Other income 295 325 Net Gain - Joint Ventures & Associates - 97
Total Income 40,923 39,318
EXPENSES
Employee Costs 14,814 14,348 Materials, contracts & other expenses 16,746 16,974 Finance costs 88 54 Depreciation 7,899 7,668
Total Expenses 39,547 39,044
OPERATING SURPLUS / (DEFICIT) 1,377 274
NEW OPERATING PROJECTS Grants, subsidies and contributions 54 65 Contracts, Materials & Other Expenses 1428 645
1,374 580
OPERATING SURPLUS / (DEFICIT)including NEW OPERATING PROJECTS
3 (306)
CAPITAL REVENUE
Gain/(Loss) on Disposal of Non Current Assets 0 22 Amounts received specifically for new/upgraded assets 295 749
295 771
NET OPERATING SURPLUS / (DEFICIT) including NEW OPERATING PROJECTS
298 465
CITY OF BURNSIDE
ANNUAL BUDGET 2014/15
STATEMENT OF COMPREHENSIVE INCOME
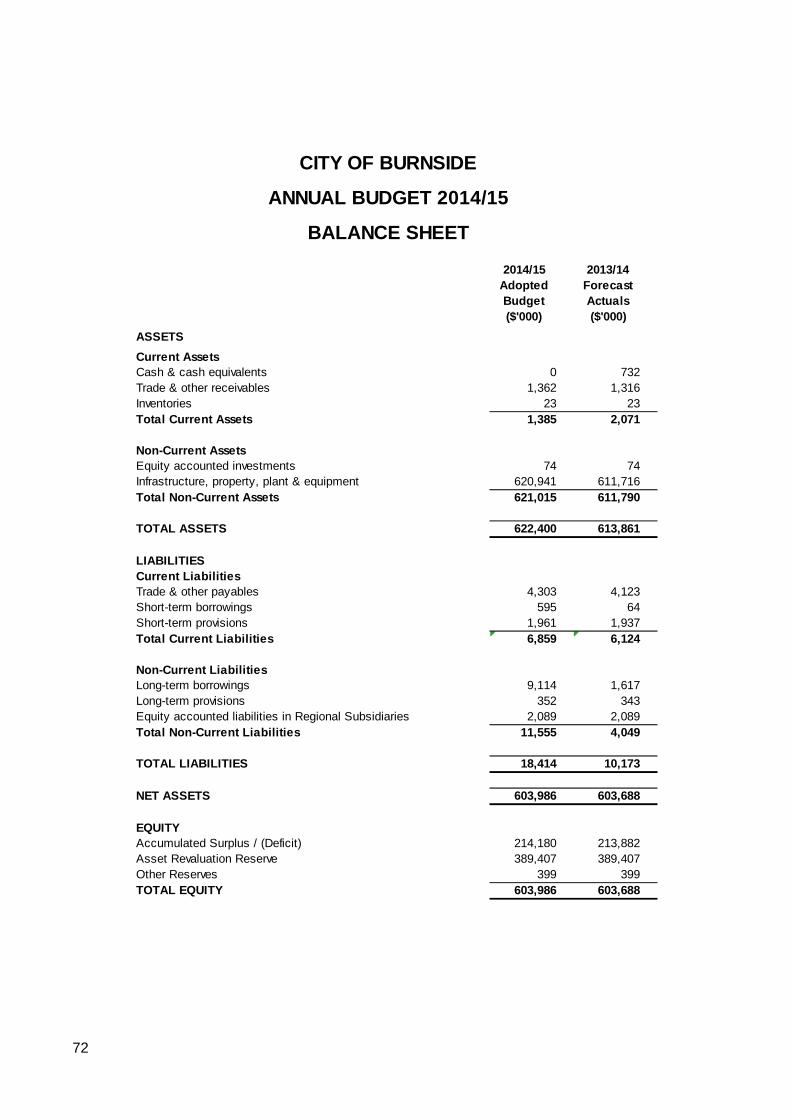
72
2014/15 Adopted Budget($'000)
2013/14 Forecast Actuals($'000)
ASSETS
Current AssetsCash & cash equivalents 0 732Trade & other receivables 1,362 1,316Inventories 23 23Total Current Assets 1,385 2,071
Non-Current AssetsEquity accounted investments 74 74Infrastructure, property, plant & equipment 620,941 611,716Total Non-Current Assets 621,015 611,790
TOTAL ASSETS 622,400 613,861
LIABILITIESCurrent LiabilitiesTrade & other payables 4,303 4,123Short-term borrowings 595 64Short-term provisions 1,961 1,937Total Current Liabilities 6,859 6,124
Non-Current LiabilitiesLong-term borrowings 9,114 1,617Long-term provisions 352 343Equity accounted liabilities in Regional Subsidiaries 2,089 2,089Total Non-Current Liabilities 11,555 4,049
TOTAL LIABILITIES 18,414 10,173
NET ASSETS 603,986 603,688
EQUITYAccumulated Surplus / (Deficit) 214,180 213,882Asset Revaluation Reserve 389,407 389,407Other Reserves 399 399TOTAL EQUITY 603,986 603,688
CITY OF BURNSIDE
ANNUAL BUDGET 2014/15
BALANCE SHEET
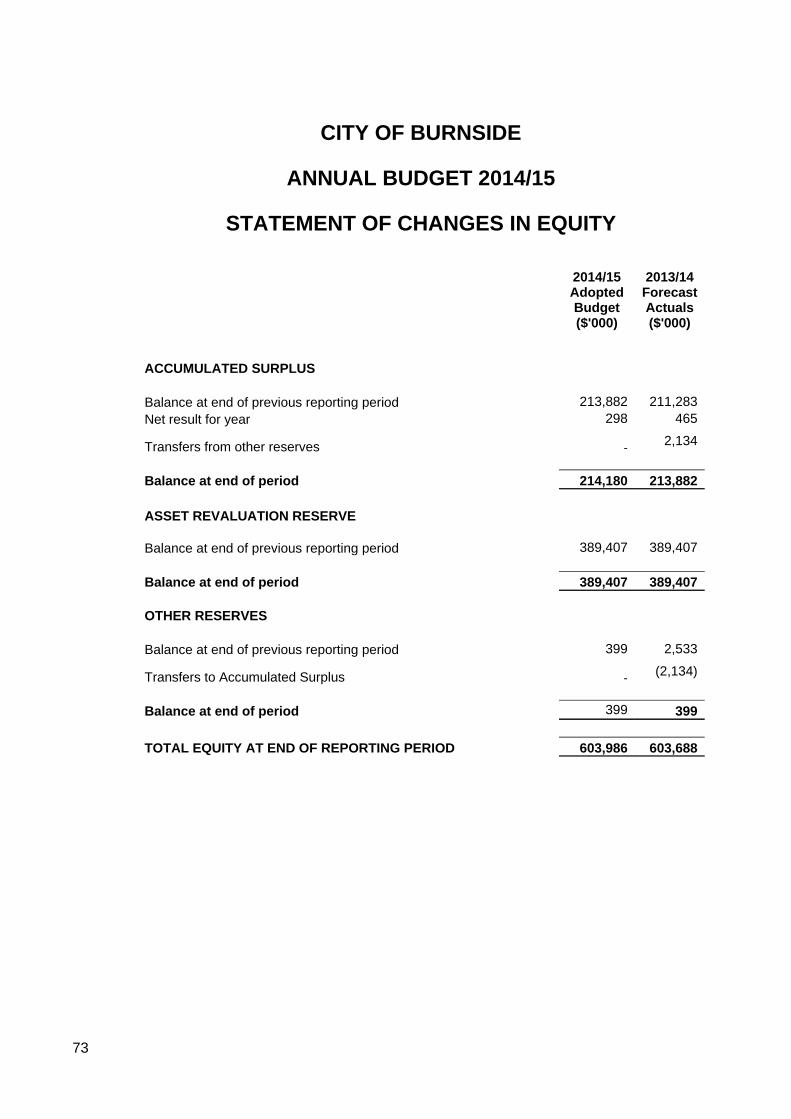
73
CITY OF BURNSIDE
ANNUAL BUDGET 2014/15
STATEMENT OF CHANGES IN EQUITY
2014/15 Adopted Budget ($'000)
2013/14 Forecast Actuals($'000)
ACCUMULATED SURPLUS Balance at end of previous reporting period 213,882 211,283 Net result for year 298 465
Transfers from other reserves
- 2,134
Balance at end of period 214,180 213,882 ASSET REVALUATION RESERVE Balance at end of previous reporting period 389,407 389,407
Balance at end of period 389,407 389,407 OTHER RESERVES Balance at end of previous reporting period 399 2,533
Transfers to Accumulated Surplus
- (2,134)
Balance at end of period 399 399
TOTAL EQUITY AT END OF REPORTING PERIOD 603,986 603,688
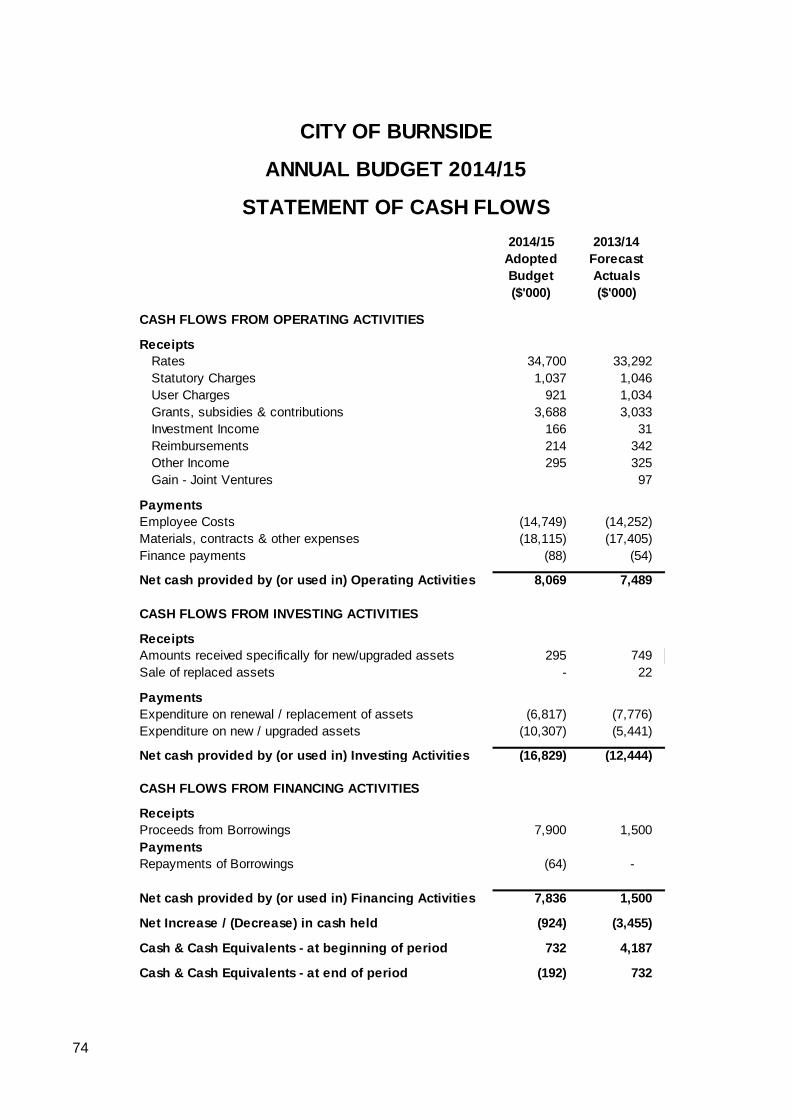
74
2014/15 Adopted Budget($'000)
2013/14 Forecast Actuals($'000)
CASH FLOWS FROM OPERATING ACTIVITIES
ReceiptsRates 34,700 33,292Statutory Charges 1,037 1,046User Charges 921 1,034Grants, subsidies & contributions 3,688 3,033Investment Income 166 31Reimbursements 214 342Other Income 295 325Gain - Joint Ventures 97
PaymentsEmployee Costs (14,749) (14,252) Materials, contracts & other expenses (18,115) (17,405) Finance payments (88) (54)
Net cash provided by (or used in) Operating Activities 8,069 7,489
CASH FLOWS FROM INVESTING ACTIVITIES
ReceiptsAmounts received specifically for new/upgraded assets 295 749Sale of replaced assets - 22
PaymentsExpenditure on renewal / replacement of assets (6,817) (7,776) Expenditure on new / upgraded assets (10,307) (5,441)
Net cash provided by (or used in) Investing Activities (16,829) (12,444)
CASH FLOWS FROM FINANCING ACTIVITIES
ReceiptsProceeds from Borrowings 7,900 1,500PaymentsRepayments of Borrowings (64) -
Net cash provided by (or used in) Financing Activities 7,836 1,500
Net Increase / (Decrease) in cash held (924) (3,455)
Cash & Cash Equivalents - at beginning of period 732 4,187
Cash & Cash Equivalents - at end of period (192) 732
CITY OF BURNSIDE
ANNUAL BUDGET 2014/15
STATEMENT OF CASH FLOWS
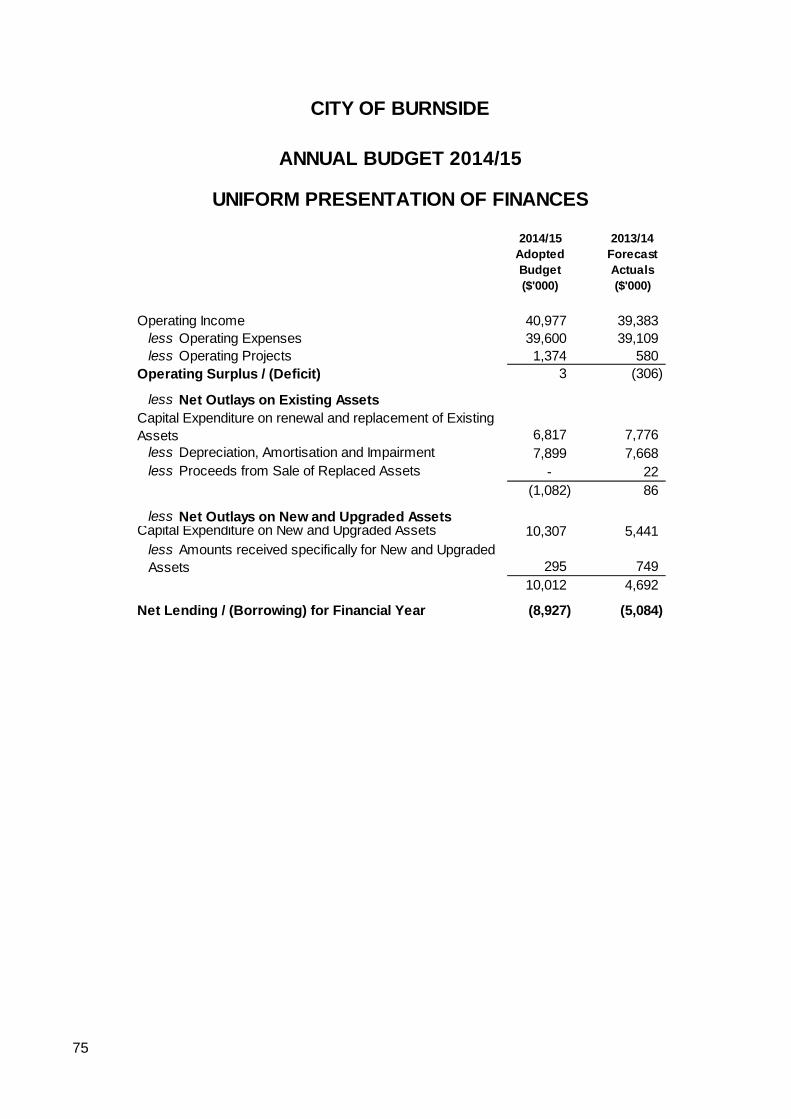
75
2014/15 Adopted Budget($'000)
2013/14 Forecast Actuals($'000)
Operating Income 40,977 39,383 less Operating Expenses 39,600 39,109 less Operating Projects 1,374 580
Operating Surplus / (Deficit) 3 (306)
less Net Outlays on Existing AssetsCapital Expenditure on renewal and replacement of Existing Assets 6,817 7,776
less Depreciation, Amortisation and Impairment 7,899 7,668 less Proceeds from Sale of Replaced Assets - 22
(1,082) 86
less Net Outlays on New and Upgraded AssetsCapital Expenditure on New and Upgraded Assets 10,307 5,441
less Amounts received specifically for New and Upgraded Assets 295 749
10,012 4,692
Net Lending / (Borrowing) for Financial Year (8,927) (5,084)
CITY OF BURNSIDE
ANNUAL BUDGET 2014/15
UNIFORM PRESENTATION OF FINANCES
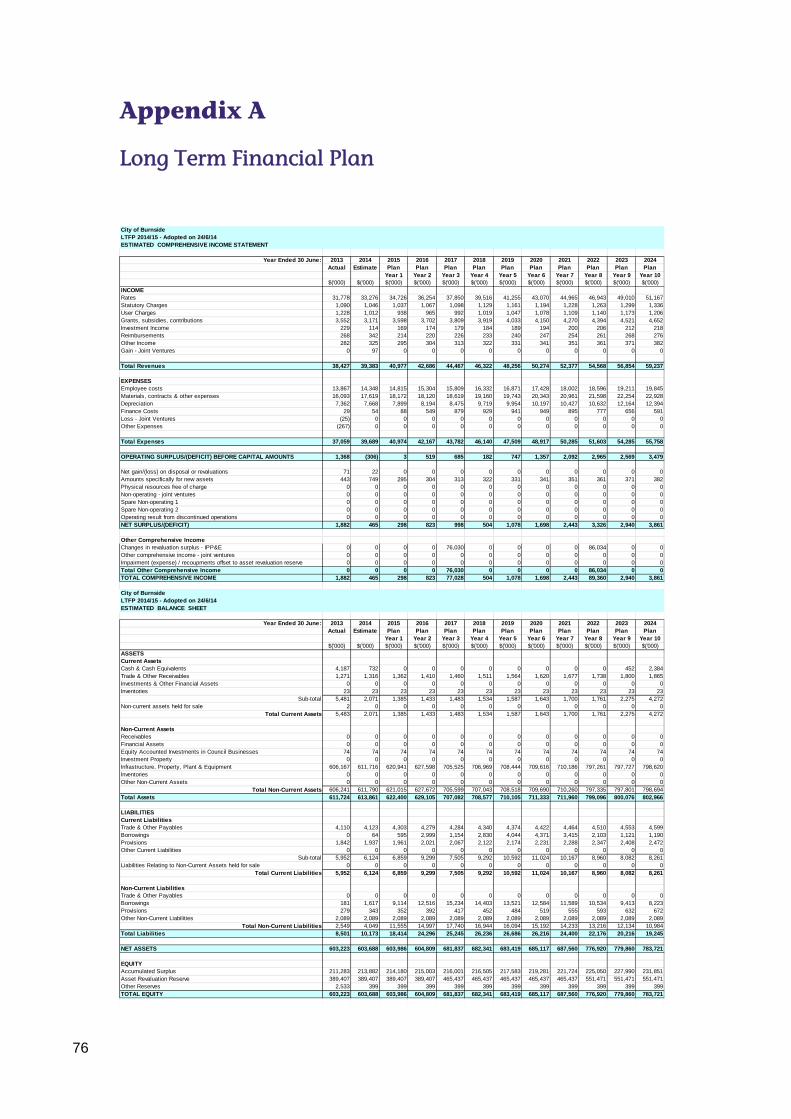
76
Appendix A
Long Term Financial Plan
City of BurnsideLTFP 2014/15 - Adopted on 24/6/14ESTIMATED COMPREHENSIVE INCOME STATEMENT
Year Ended 30 June: 2013 2014 2015 2016 2017 2018 2019 2020 2021 2022 2023 2024Actual Estimate Plan Plan Plan Plan Plan Plan Plan Plan Plan Plan
Year 1 Year 2 Year 3 Year 4 Year 5 Year 6 Year 7 Year 8 Year 9 Year 10$('000) $('000) $('000) $('000) $('000) $('000) $('000) $('000) $('000) $('000) $('000) $('000)
INCOMERates 31,778 33,276 34,726 36,254 37,850 39,516 41,255 43,070 44,965 46,943 49,010 51,167Statutory Charges 1,090 1,046 1,037 1,067 1,098 1,129 1,161 1,194 1,228 1,263 1,299 1,336User Charges 1,228 1,012 938 965 992 1,019 1,047 1,078 1,109 1,140 1,173 1,206Grants, subsidies, contributions 3,552 3,171 3,598 3,702 3,809 3,919 4,033 4,150 4,270 4,394 4,521 4,652Investment Income 229 114 169 174 179 184 189 194 200 206 212 218Reimbursements 268 342 214 220 226 233 240 247 254 261 268 276Other Income 282 325 295 304 313 322 331 341 351 361 371 382Gain - Joint Ventures 0 97 0 0 0 0 0 0 0 0 0 0
Total Revenues 38,427 39,383 40,977 42,686 44,467 46,322 48,256 50,274 52,377 54,568 56,854 59,237
EXPENSESEmployee costs 13,867 14,348 14,815 15,304 15,809 16,332 16,871 17,428 18,002 18,596 19,211 19,845Materials, contracts & other expenses 16,093 17,619 18,172 18,120 18,619 19,160 19,743 20,343 20,961 21,598 22,254 22,928Depreciation 7,362 7,668 7,899 8,194 8,475 9,719 9,954 10,197 10,427 10,632 12,164 12,394Finance Costs 29 54 88 549 879 929 941 949 895 777 656 591Loss - Joint Ventures (25) 0 0 0 0 0 0 0 0 0 0 0Other Expenses (267) 0 0 0 0 0 0 0 0 0 0 0
Total Expenses 37,059 39,689 40,974 42,167 43,782 46,140 47,509 48,917 50,285 51,603 54,285 55,758
OPERATING SURPLUS/(DEFICIT) BEFORE CAPITAL AMOUNTS 1,368 (306) 3 519 685 182 747 1,357 2,092 2,965 2,569 3,479
Net gain/(loss) on disposal or revaluations 71 22 0 0 0 0 0 0 0 0 0 0Amounts specifically for new assets 443 749 295 304 313 322 331 341 351 361 371 382Physical resources free of charge 0 0 0 0 0 0 0 0 0 0 0 0Non-operating - joint ventures 0 0 0 0 0 0 0 0 0 0 0 0Spare Non-operating 1 0 0 0 0 0 0 0 0 0 0 0 0Spare Non-operating 2 0 0 0 0 0 0 0 0 0 0 0 0Operating result from discontinued operations 0 0 0 0 0 0 0 0 0 0 0 0NET SURPLUS/(DEFICIT) 1,882 465 298 823 998 504 1,078 1,698 2,443 3,326 2,940 3,861
Other Comprehensive IncomeChanges in revaluation surplus - IPP&E 0 0 0 0 76,030 0 0 0 0 86,034 0 0Other comprehensive income - joint ventures 0 0 0 0 0 0 0 0 0 0 0 0Impairment (expense) / recoupments offset to asset revaluation reserve 0 0 0 0 0 0 0 0 0 0 0 0Total Other Comprehensive Income 0 0 0 0 76,030 0 0 0 0 86,034 0 0TOTAL COMPREHENSIVE INCOME 1,882 465 298 823 77,028 504 1,078 1,698 2,443 89,360 2,940 3,861
City of BurnsideLTFP 2014/15 - Adopted on 24/6/14ESTIMATED BALANCE SHEET
Year Ended 30 June: 2013 2014 2015 2016 2017 2018 2019 2020 2021 2022 2023 2024Actual Estimate Plan Plan Plan Plan Plan Plan Plan Plan Plan Plan
Year 1 Year 2 Year 3 Year 4 Year 5 Year 6 Year 7 Year 8 Year 9 Year 10$('000) $('000) $('000) $('000) $('000) $('000) $('000) $('000) $('000) $('000) $('000) $('000)
ASSETSCurrent AssetsCash & Cash Equivalents 4,187 732 0 0 0 0 0 0 0 0 452 2,384Trade & Other Receivables 1,271 1,316 1,362 1,410 1,460 1,511 1,564 1,620 1,677 1,738 1,800 1,865Investments & Other Financial Assets 0 0 0 0 0 0 0 0 0 0 0 0Inventories 23 23 23 23 23 23 23 23 23 23 23 23
Sub-total 5,481 2,071 1,385 1,433 1,483 1,534 1,587 1,643 1,700 1,761 2,275 4,272Non-current assets held for sale 2 0 0 0 0 0 0 0 0 0 0 0
Total Current Assets 5,483 2,071 1,385 1,433 1,483 1,534 1,587 1,643 1,700 1,761 2,275 4,272
Non-Current AssetsReceivables 0 0 0 0 0 0 0 0 0 0 0 0Financial Assets 0 0 0 0 0 0 0 0 0 0 0 0Equity Accounted Investments in Council Businesses 74 74 74 74 74 74 74 74 74 74 74 74Investment Property 0 0 0 0 0 0 0 0 0 0 0 0Infrastructure, Property, Plant & Equipment 606,167 611,716 620,941 627,598 705,525 706,969 708,444 709,616 710,186 797,261 797,727 798,620Inventories 0 0 0 0 0 0 0 0 0 0 0 0Other Non-Current Assets 0 0 0 0 0 0 0 0 0 0 0 0
Total Non-Current Assets 606,241 611,790 621,015 627,672 705,599 707,043 708,518 709,690 710,260 797,335 797,801 798,694Total Assets 611,724 613,861 622,400 629,105 707,082 708,577 710,105 711,333 711,960 799,096 800,076 802,966
LIABILITIESCurrent LiabilitiesTrade & Other Payables 4,110 4,123 4,303 4,279 4,284 4,340 4,374 4,422 4,464 4,510 4,553 4,599Borrowings 0 64 595 2,999 1,154 2,830 4,044 4,371 3,415 2,103 1,121 1,190Provisions 1,842 1,937 1,961 2,021 2,067 2,122 2,174 2,231 2,288 2,347 2,408 2,472Other Current Liabilities 0 0 0 0 0 0 0 0 0 0 0 0
Sub-total 5,952 6,124 6,859 9,299 7,505 9,292 10,592 11,024 10,167 8,960 8,082 8,261Liabilities Relating to Non-Current Assets held for sale 0 0 0 0 0 0 0 0 0 0 0 0
Total Current Liabilities 5,952 6,124 6,859 9,299 7,505 9,292 10,592 11,024 10,167 8,960 8,082 8,261
Non-Current LiabilitiesTrade & Other Payables 0 0 0 0 0 0 0 0 0 0 0 0Borrowings 181 1,617 9,114 12,516 15,234 14,403 13,521 12,584 11,589 10,534 9,413 8,223Provisions 279 343 352 392 417 452 484 519 555 593 632 672Other Non-Current Liabilities 2,089 2,089 2,089 2,089 2,089 2,089 2,089 2,089 2,089 2,089 2,089 2,089
Total Non-Current Liabilities 2,549 4,049 11,555 14,997 17,740 16,944 16,094 15,192 14,233 13,216 12,134 10,984Total Liabilities 8,501 10,173 18,414 24,296 25,245 26,236 26,686 26,216 24,400 22,176 20,216 19,245
NET ASSETS 603,223 603,688 603,986 604,809 681,837 682,341 683,419 685,117 687,560 776,920 779,860 783,721
EQUITYAccumulated Surplus 211,283 213,882 214,180 215,003 216,001 216,505 217,583 219,281 221,724 225,050 227,990 231,851Asset Revaluation Reserve 389,407 389,407 389,407 389,407 465,437 465,437 465,437 465,437 465,437 551,471 551,471 551,471Other Reserves 2,533 399 399 399 399 399 399 399 399 399 399 399TOTAL EQUITY 603,223 603,688 603,986 604,809 681,837 682,341 683,419 685,117 687,560 776,920 779,860 783,721
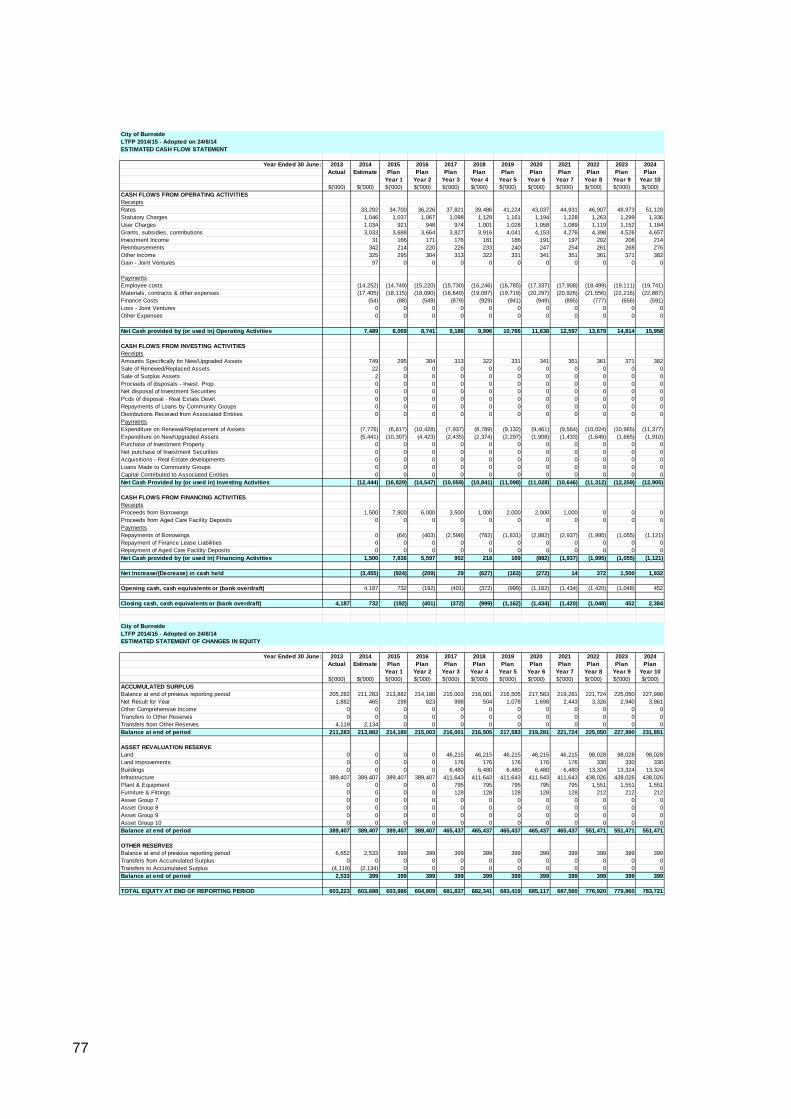
77
City of BurnsideLTFP 2014/15 - Adopted on 24/6/14ESTIMATED CASH FLOW STATEMENT
Year Ended 30 June: 2013 2014 2015 2016 2017 2018 2019 2020 2021 2022 2023 2024Actual Estimate Plan Plan Plan Plan Plan Plan Plan Plan Plan Plan
Year 1 Year 2 Year 3 Year 4 Year 5 Year 6 Year 7 Year 8 Year 9 Year 10$('000) $('000) $('000) $('000) $('000) $('000) $('000) $('000) $('000) $('000) $('000) $('000)
CASH FLOWS FROM OPERATING ACTIVITIESReceiptsRates 33,292 34,700 36,226 37,821 39,486 41,224 43,037 44,931 46,907 48,973 51,128Statutory Charges 1,046 1,037 1,067 1,098 1,129 1,161 1,194 1,228 1,263 1,299 1,336User Charges 1,034 921 948 974 1,001 1,028 1,058 1,089 1,119 1,152 1,184Grants, subsidies, contributions 3,033 3,688 3,664 3,827 3,916 4,041 4,153 4,276 4,398 4,526 4,657Investment Income 31 166 171 176 181 186 191 197 202 208 214Reimbursements 342 214 220 226 233 240 247 254 261 268 276Other Income 325 295 304 313 322 331 341 351 361 371 382Gain - Joint Ventures 97 0 0 0 0 0 0 0 0 0 0
PaymentsEmployee costs (14,252) (14,749) (15,220) (15,730) (16,246) (16,785) (17,337) (17,908) (18,499) (19,111) (19,741)Materials, contracts & other expenses (17,405) (18,115) (18,090) (18,640) (19,097) (19,719) (20,297) (20,926) (21,556) (22,216) (22,887)Finance Costs (54) (88) (549) (879) (929) (941) (949) (895) (777) (656) (591)Loss - Joint Ventures 0 0 0 0 0 0 0 0 0 0 0Other Expenses 0 0 0 0 0 0 0 0 0 0 0
Net Cash provided by (or used in) Operating Activities 7,489 8,069 8,741 9,186 9,996 10,766 11,638 12,597 13,679 14,814 15,958
CASH FLOWS FROM INVESTING ACTIVITIESReceiptsAmounts Specifically for New/Upgraded Assets 749 295 304 313 322 331 341 351 361 371 382Sale of Renewed/Replaced Assets 22 0 0 0 0 0 0 0 0 0 0Sale of Surplus Assets 2 0 0 0 0 0 0 0 0 0 0Proceeds of disposals - Invest. Prop. 0 0 0 0 0 0 0 0 0 0 0Net disposal of Investment Securities 0 0 0 0 0 0 0 0 0 0 0Pcds of disposal - Real Estate Devel. 0 0 0 0 0 0 0 0 0 0 0Repayments of Loans by Community Groups 0 0 0 0 0 0 0 0 0 0 0Distributions Received from Associated Entities 0 0 0 0 0 0 0 0 0 0 0PaymentsExpenditure on Renewal/Replacement of Assets (7,776) (6,817) (10,428) (7,937) (8,789) (9,132) (9,461) (9,564) (10,024) (10,965) (11,377)Expenditure on New/Upgraded Assets (5,441) (10,307) (4,423) (2,435) (2,374) (2,297) (1,908) (1,433) (1,649) (1,665) (1,910)Purchase of Investment Property 0 0 0 0 0 0 0 0 0 0 0Net purchase of Investment Securities 0 0 0 0 0 0 0 0 0 0 0Acquisitions - Real Estate developments 0 0 0 0 0 0 0 0 0 0 0Loans Made to Community Groups 0 0 0 0 0 0 0 0 0 0 0Capital Contributed to Associated Entities 0 0 0 0 0 0 0 0 0 0 0Net Cash Provided by (or used in) Investing Activities (12,444) (16,829) (14,547) (10,059) (10,841) (11,098) (11,028) (10,646) (11,312) (12,259) (12,905)
CASH FLOWS FROM FINANCING ACTIVITIESReceiptsProceeds from Borrowings 1,500 7,900 6,000 3,500 1,000 2,000 2,000 1,000 0 0 0Proceeds from Aged Care Facility Deposits 0 0 0 0 0 0 0 0 0 0 0PaymentsRepayments of Borrowings 0 (64) (403) (2,598) (782) (1,831) (2,882) (2,937) (1,995) (1,055) (1,121)Repayment of Finance Lease Liabilities 0 0 0 0 0 0 0 0 0 0 0Repayment of Aged Care Facility Deposits 0 0 0 0 0 0 0 0 0 0 0Net Cash provided by (or used in) Financing Activities 1,500 7,836 5,597 902 218 169 (882) (1,937) (1,995) (1,055) (1,121)
Net Increase/(Decrease) in cash held (3,455) (924) (209) 29 (627) (163) (272) 14 372 1,500 1,932
Opening cash, cash equivalents or (bank overdraft) 4,187 732 (192) (401) (372) (999) (1,162) (1,434) (1,420) (1,048) 452
Closing cash, cash equivalents or (bank overdraft) 4,187 732 (192) (401) (372) (999) (1,162) (1,434) (1,420) (1,048) 452 2,384
City of BurnsideLTFP 2014/15 - Adopted on 24/6/14ESTIMATED STATEMENT OF CHANGES IN EQUITY
Year Ended 30 June: 2013 2014 2015 2016 2017 2018 2019 2020 2021 2022 2023 2024Actual Estimate Plan Plan Plan Plan Plan Plan Plan Plan Plan Plan
Year 1 Year 2 Year 3 Year 4 Year 5 Year 6 Year 7 Year 8 Year 9 Year 10$('000) $('000) $('000) $('000) $('000) $('000) $('000) $('000) $('000) $('000) $('000) $('000)
ACCUMULATED SURPLUSBalance at end of previous reporting period 205,282 211,283 213,882 214,180 215,003 216,001 216,505 217,583 219,281 221,724 225,050 227,990Net Result for Year 1,882 465 298 823 998 504 1,078 1,698 2,443 3,326 2,940 3,861Other Comprehensive Income 0 0 0 0 0 0 0 0 0 0 0 0Transfers to Other Reserves 0 0 0 0 0 0 0 0 0 0 0 0Transfers from Other Reserves 4,119 2,134 0 0 0 0 0 0 0 0 0 0Balance at end of period 211,283 213,882 214,180 215,003 216,001 216,505 217,583 219,281 221,724 225,050 227,990 231,851
ASSET REVALUATION RESERVELand 0 0 0 0 46,215 46,215 46,215 46,215 46,215 98,028 98,028 98,028Land Improvements 0 0 0 0 176 176 176 176 176 330 330 330Buildings 0 0 0 0 6,480 6,480 6,480 6,480 6,480 13,324 13,324 13,324Infrastructure 389,407 389,407 389,407 389,407 411,643 411,643 411,643 411,643 411,643 438,026 438,026 438,026Plant & Equipment 0 0 0 0 795 795 795 795 795 1,551 1,551 1,551Furniture & Fittings 0 0 0 0 128 128 128 128 128 212 212 212Asset Group 7 0 0 0 0 0 0 0 0 0 0 0 0Asset Group 8 0 0 0 0 0 0 0 0 0 0 0 0Asset Group 9 0 0 0 0 0 0 0 0 0 0 0 0Asset Group 10 0 0 0 0 0 0 0 0 0 0 0 0Balance at end of period 389,407 389,407 389,407 389,407 465,437 465,437 465,437 465,437 465,437 551,471 551,471 551,471
OTHER RESERVESBalance at end of previous reporting period 6,652 2,533 399 399 399 399 399 399 399 399 399 399Transfers from Accumulated Surplus 0 0 0 0 0 0 0 0 0 0 0 0Transfers to Accumulated Surplus (4,119) (2,134) 0 0 0 0 0 0 0 0 0 0Balance at end of period 2,533 399 399 399 399 399 399 399 399 399 399 399
TOTAL EQUITY AT END OF REPORTING PERIOD 603,223 603,688 603,986 604,809 681,837 682,341 683,419 685,117 687,560 776,920 779,860 783,721
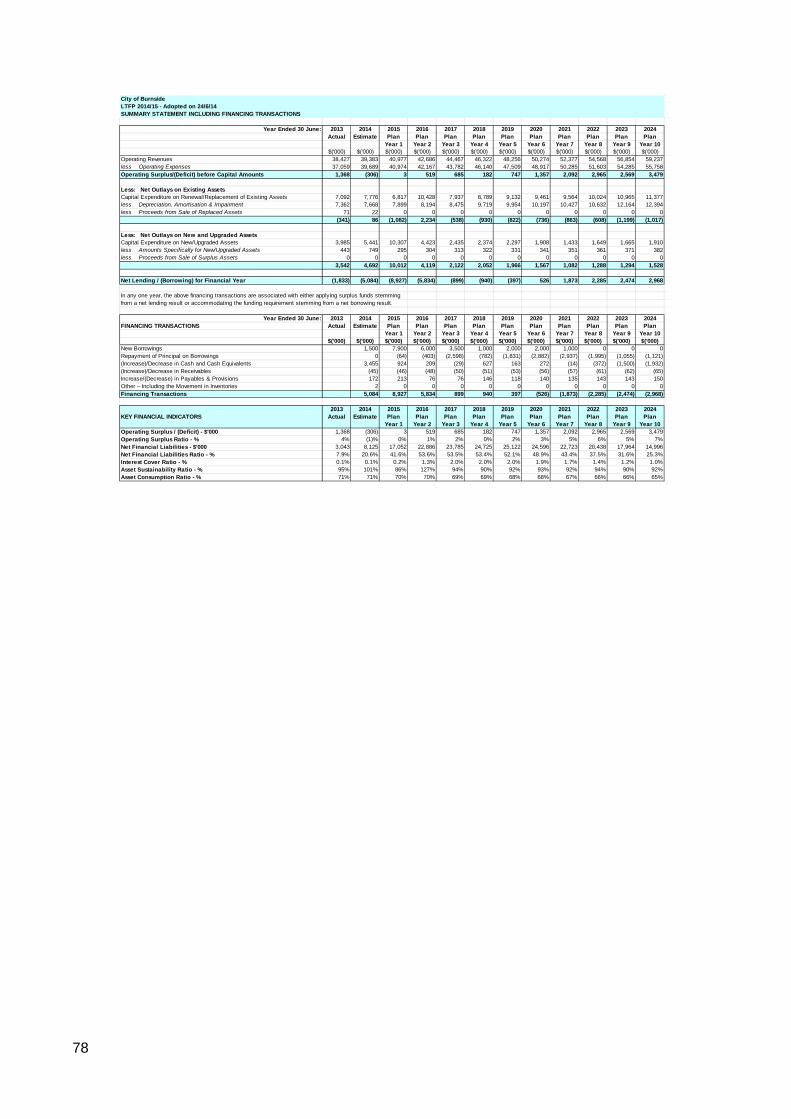
78
City of BurnsideLTFP 2014/15 - Adopted on 24/6/14SUMMARY STATEMENT INCLUDING FINANCING TRANSACTIONS
Year Ended 30 June: 2013 2014 2015 2016 2017 2018 2019 2020 2021 2022 2023 2024Actual Estimate Plan Plan Plan Plan Plan Plan Plan Plan Plan Plan
Year 1 Year 2 Year 3 Year 4 Year 5 Year 6 Year 7 Year 8 Year 9 Year 10$('000) $('000) $('000) $('000) $('000) $('000) $('000) $('000) $('000) $('000) $('000) $('000)
Operating Revenues 38,427 39,383 40,977 42,686 44,467 46,322 48,256 50,274 52,377 54,568 56,854 59,237less Operating Expenses 37,059 39,689 40,974 42,167 43,782 46,140 47,509 48,917 50,285 51,603 54,285 55,758Operating Surplus/(Deficit) before Capital Amounts 1,368 (306) 3 519 685 182 747 1,357 2,092 2,965 2,569 3,479
Less: Net Outlays on Existing AssetsCapital Expenditure on Renewal/Replacement of Existing Assets 7,092 7,776 6,817 10,428 7,937 8,789 9,132 9,461 9,564 10,024 10,965 11,377less Depreciation, Amortisation & Impairment 7,362 7,668 7,899 8,194 8,475 9,719 9,954 10,197 10,427 10,632 12,164 12,394less Proceeds from Sale of Replaced Assets 71 22 0 0 0 0 0 0 0 0 0 0
(341) 86 (1,082) 2,234 (538) (930) (822) (736) (863) (608) (1,199) (1,017)
Less: Net Outlays on New and Upgraded AssetsCapital Expenditure on New/Upgraded Assets 3,985 5,441 10,307 4,423 2,435 2,374 2,297 1,908 1,433 1,649 1,665 1,910less Amounts Specifically for New/Upgraded Assets 443 749 295 304 313 322 331 341 351 361 371 382less Proceeds from Sale of Surplus Assets 0 0 0 0 0 0 0 0 0 0 0 0
3,542 4,692 10,012 4,119 2,122 2,052 1,966 1,567 1,082 1,288 1,294 1,528
Net Lending / (Borrowing) for Financial Year (1,833) (5,084) (8,927) (5,834) (899) (940) (397) 526 1,873 2,285 2,474 2,968
In any one year, the above financing transactions are associated with either applying surplus funds stemming from a net lending result or accommodating the funding requirement stemming from a net borrowing result.
Year Ended 30 June: 2013 2014 2015 2016 2017 2018 2019 2020 2021 2022 2023 2024FINANCING TRANSACTIONS Actual Estimate Plan Plan Plan Plan Plan Plan Plan Plan Plan Plan
Year 1 Year 2 Year 3 Year 4 Year 5 Year 6 Year 7 Year 8 Year 9 Year 10$('000) $('000) $('000) $('000) $('000) $('000) $('000) $('000) $('000) $('000) $('000) $('000)
New Borrowings 1,500 7,900 6,000 3,500 1,000 2,000 2,000 1,000 0 0 0Repayment of Principal on Borrowings 0 (64) (403) (2,598) (782) (1,831) (2,882) (2,937) (1,995) (1,055) (1,121)(Increase)/Decrease in Cash and Cash Equivalents 3,455 924 209 (29) 627 163 272 (14) (372) (1,500) (1,932)(Increase)/Decrease in Receivables (45) (46) (48) (50) (51) (53) (56) (57) (61) (62) (65)Increase/(Decrease) in Payables & Provisions 172 213 76 76 146 118 140 135 143 143 150Other – Including the Movement in Inventories 2 0 0 0 0 0 0 0 0 0 0Financing Transactions 5,084 8,927 5,834 899 940 397 (526) (1,873) (2,285) (2,474) (2,968)
2013 2014 2015 2016 2017 2018 2019 2020 2021 2022 2023 2024KEY FINANCIAL INDICATORS Actual Estimate Plan Plan Plan Plan Plan Plan Plan Plan Plan Plan
Year 1 Year 2 Year 3 Year 4 Year 5 Year 6 Year 7 Year 8 Year 9 Year 10Operating Surplus / (Deficit) - $'000 1,368 (306) 3 519 685 182 747 1,357 2,092 2,965 2,569 3,479Operating Surplus Ratio - % 4% (1)% 0% 1% 2% 0% 2% 3% 5% 6% 5% 7%Net Financial Liabilities - $'000 3,043 8,125 17,052 22,886 23,785 24,725 25,122 24,596 22,723 20,438 17,964 14,996Net Financial Liabilities Ratio - % 7.9% 20.6% 41.6% 53.6% 53.5% 53.4% 52.1% 48.9% 43.4% 37.5% 31.6% 25.3%Interest Cover Ratio - % 0.1% 0.1% 0.2% 1.3% 2.0% 2.0% 2.0% 1.9% 1.7% 1.4% 1.2% 1.0%Asset Sustainability Ratio - % 95% 101% 86% 127% 94% 90% 92% 93% 92% 94% 90% 92%Asset Consumption Ratio - % 71% 71% 70% 70% 69% 69% 68% 68% 67% 66% 66% 65%
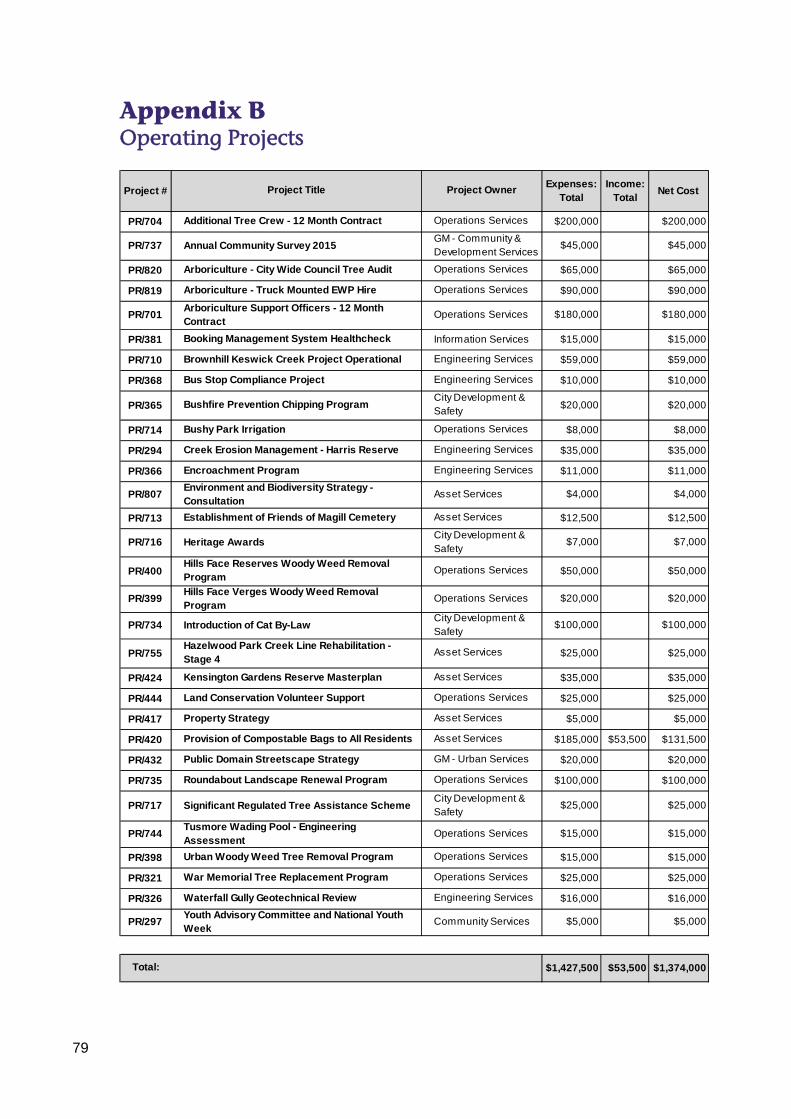
79
Appendix B Operating Projects
Project #Expenses:
TotalIncome:
TotalNet Cost
PR/704 $200,000 $200,000
PR/737 $45,000 $45,000
PR/820 $65,000 $65,000
PR/819 $90,000 $90,000
PR/701 $180,000 $180,000
PR/381 Information Services $15,000 $15,000
PR/710 $59,000 $59,000
PR/368 $10,000 $10,000
PR/365 $20,000 $20,000
PR/714 $8,000 $8,000
PR/294 $35,000 $35,000
PR/366 $11,000 $11,000
PR/807 $4,000 $4,000
PR/713 $12,500 $12,500
PR/716 $7,000 $7,000
PR/400 $50,000 $50,000
PR/399 $20,000 $20,000
PR/734 $100,000 $100,000
PR/755 $25,000 $25,000
PR/424 $35,000 $35,000
PR/444 $25,000 $25,000
PR/417 $5,000 $5,000
PR/420 $185,000 $53,500 $131,500
PR/432 $20,000 $20,000
PR/735 $100,000 $100,000
PR/717 $25,000 $25,000
PR/744 $15,000 $15,000
PR/398 $15,000 $15,000
PR/321 $25,000 $25,000
PR/326 $16,000 $16,000
PR/297 $5,000 $5,000
$1,427,500 $53,500 $1,374,000
Asset Services
War Memorial Tree Replacement Program Operations Services
Total:
Significant Regulated Tree Assistance SchemeCity Development & Safety
Urban Woody Weed Tree Removal Program Operations Services
Bus Stop Compliance Project Engineering Services
Environment and Biodiversity Strategy - Consultation
Asset Services
Arboriculture Support Officers - 12 Month Contract
Operations Services
Brownhill Keswick Creek Project Operational Engineering Services
Booking Management System Healthcheck
Bushy Park Irrigation
Bushfire Prevention Chipping Program
Operations Services
City Development & Safety
Creek Erosion Management - Harris Reserve
Encroachment Program
Engineering Services
Arboriculture - City Wide Council Tree Audit Operations Services
Arboriculture - Truck Mounted EWP Hire Operations Services
Additional Tree Crew - 12 Month Contract Operations Services
Annual Community Survey 2015GM - Community & Development Services
Project Title Project Owner
Youth Advisory Committee and National Youth Week
Community Services
Waterfall Gully Geotechnical Review
Tusmore Wading Pool - Engineering Assessment
Hazelwood Park Creek Line Rehabilitation - Stage 4
Land Conservation Volunteer Support Operations Services
Operations Services
Engineering Services
Public Domain Streetscape Strategy GM - Urban Services
Roundabout Landscape Renewal Program Operations Services
Property Strategy Asset Services
Provision of Compostable Bags to All Residents
Engineering Services
Asset Services
Asset Services
Kensington Gardens Reserve Masterplan Asset Services
Establishment of Friends of Magill Cemetery
Hills Face Verges Woody Weed Removal Program
Operations Services
Introduction of Cat By-LawCity Development & Safety
Heritage AwardsCity Development & Safety
Hills Face Reserves Woody Weed Removal Program
Operations Services
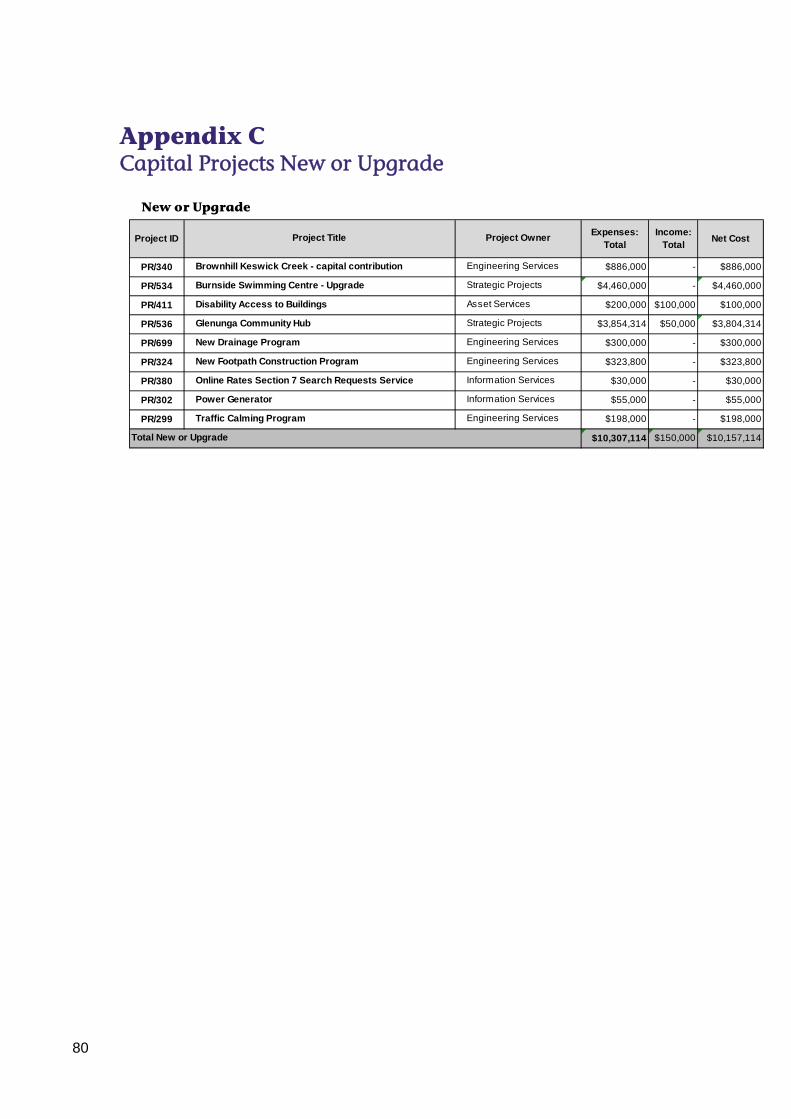
80
Appendix C Capital Projects New or Upgrade
Project IDExpenses:
TotalIncome:
TotalNet Cost
PR/340 $886,000 - $886,000
PR/534 $4,460,000 - $4,460,000
PR/411 $200,000 $100,000 $100,000
PR/536 $3,854,314 $50,000 $3,804,314
PR/699 $300,000 - $300,000
PR/324 $323,800 - $323,800
PR/380 $30,000 - $30,000
PR/302 $55,000 - $55,000
PR/299 $198,000 - $198,000
$10,307,114 $150,000 $10,157,114
Project Title Project Owner
Brownhill Keswick Creek - capital contribution Engineering Services
New or Upgrade
Glenunga Community Hub Strategic Projects
New Drainage Program Engineering Services
Burnside Swimming Centre - Upgrade Strategic Projects
Disability Access to Buildings Asset Services
Power Generator Information Services
Traffic Calming Program Engineering Services
New Footpath Construction Program Engineering Services
Online Rates Section 7 Search Requests Service Information Services
Total New or Upgrade
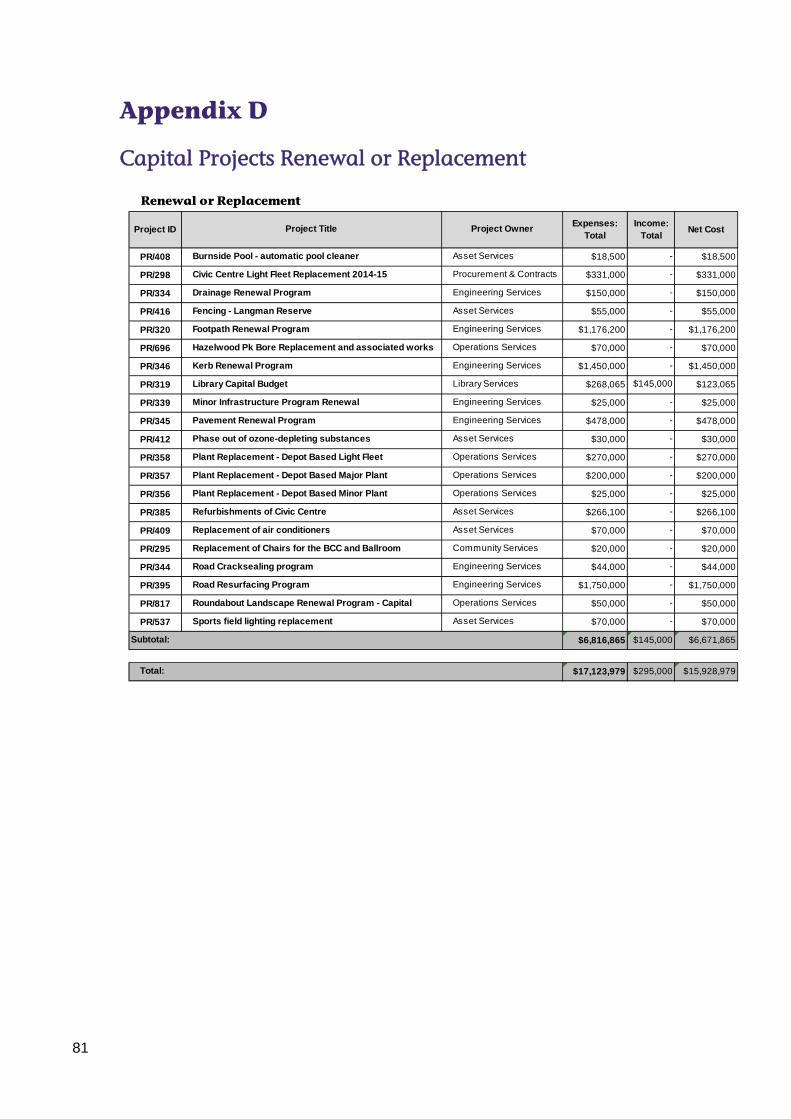
81
Appendix D
Capital Projects Renewal or Replacement
Project IDExpenses:
TotalIncome:
TotalNet Cost
PR/408 $18,500 $18,500
PR/298 $331,000 $331,000
PR/334 $150,000 $150,000
PR/416 $55,000 $55,000
PR/320 $1,176,200 $1,176,200
PR/696 $70,000 $70,000
PR/346 $1,450,000 $1,450,000
PR/319 $268,065 $123,065
PR/339 $25,000 $25,000
PR/345 $478,000 $478,000
PR/412 $30,000 $30,000
PR/358 $270,000 $270,000
PR/357 $200,000 $200,000
PR/356 $25,000 $25,000
PR/385 $266,100 $266,100
PR/409 $70,000 $70,000
PR/295 $20,000 $20,000
PR/344 $44,000 $44,000
PR/395 $1,750,000 $1,750,000
PR/817 $50,000 $50,000
PR/537 $70,000 $70,000
$6,816,865 $145,000 $6,671,865
$17,123,979 $295,000 $15,928,979
Road Resurfacing Program Engineering Services -
Roundabout Landscape Renewal Program - Capital Operations Services -
Total:
Sports field lighting replacement Asset Services -
Subtotal:
Replacement of air conditioners Asset Services -
Replacement of Chairs for the BCC and Ballroom Community Services -
Road Cracksealing program Engineering Services -
Plant Replacement - Depot Based Major Plant Operations Services -
Plant Replacement - Depot Based Minor Plant Operations Services -
Refurbishments of Civic Centre Asset Services -
Pavement Renewal Program Engineering Services -
Phase out of ozone-depleting substances Asset Services -
Plant Replacement - Depot Based Light Fleet Operations Services -
Kerb Renewal Program Engineering Services -
Library Capital Budget Library Services $145,000
Minor Infrastructure Program Renewal Engineering Services -
Fencing - Langman Reserve Asset Services -
Footpath Renewal Program Engineering Services -
Hazelwood Pk Bore Replacement and associated works Operations Services -
Project Title Project Owner
Burnside Pool - automatic pool cleaner Asset Services -
Civic Centre Light Fleet Replacement 2014-15 Procurement & Contracts -
Drainage Renewal Program Engineering Services -
Renewal or Replacement
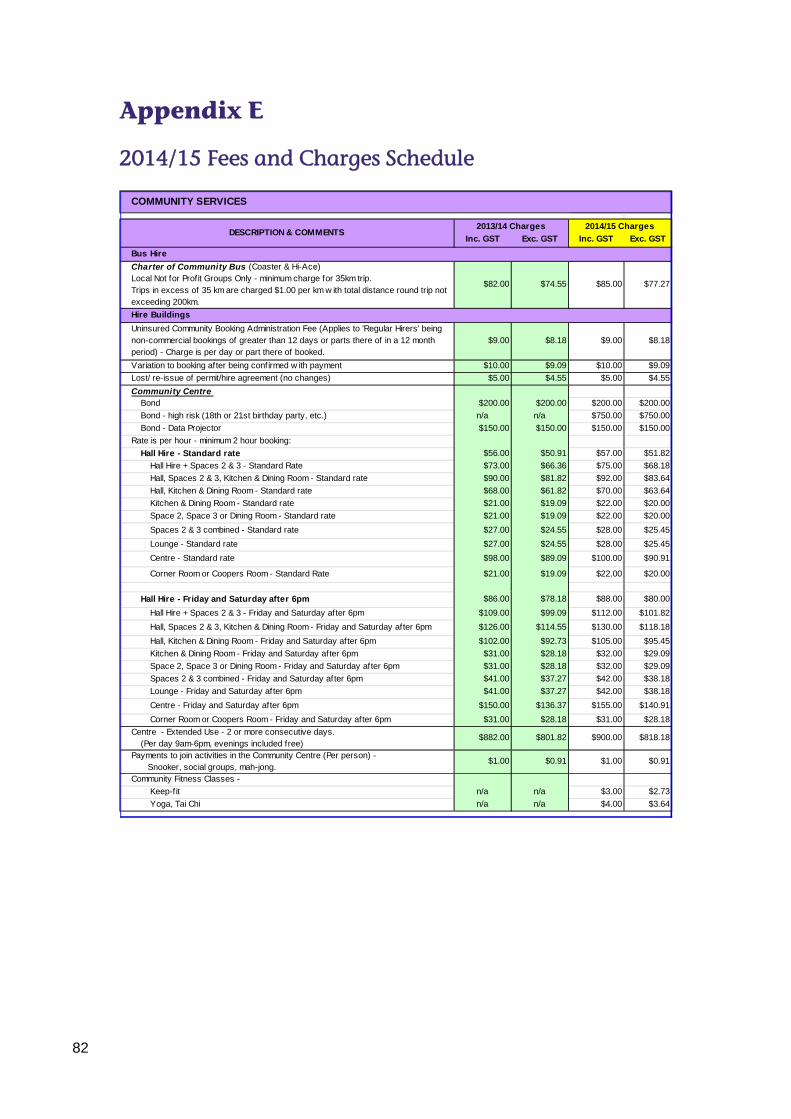
82
Appendix E
2014/15 Fees and Charges Schedule
COMMUNITY SERVICES
Inc. GST Exc. GST Inc. GST Exc. GST
Bus Hire
Charter of Community Bus (Coaster & Hi-Ace)Local Not for Profit Groups Only - minimum charge for 35km trip.Trips in excess of 35 km are charged $1.00 per km w ith total distance round trip not exceeding 200km.
$82.00 $74.55 $85.00 $77.27
Hire Buildings
Uninsured Community Booking Administration Fee (Applies to 'Regular Hirers' being non-commercial bookings of greater than 12 days or parts there of in a 12 month period) - Charge is per day or part there of booked.
$9.00 $8.18 $9.00 $8.18
Variation to booking after being confirmed w ith payment $10.00 $9.09 $10.00 $9.09
Lost/ re-issue of permit/hire agreement (no changes) $5.00 $4.55 $5.00 $4.55
Community Centre Bond $200.00 $200.00 $200.00 $200.00
Bond - high risk (18th or 21st birthday party, etc.) n/a n/a $750.00 $750.00
Bond - Data Projector $150.00 $150.00 $150.00 $150.00
Rate is per hour - minimum 2 hour booking:
Hall Hire - Standard rate $56.00 $50.91 $57.00 $51.82
Hall Hire + Spaces 2 & 3 - Standard Rate $73.00 $66.36 $75.00 $68.18
Hall, Spaces 2 & 3, Kitchen & Dining Room - Standard rate $90.00 $81.82 $92.00 $83.64
Hall, Kitchen & Dining Room - Standard rate $68.00 $61.82 $70.00 $63.64
Kitchen & Dining Room - Standard rate $21.00 $19.09 $22.00 $20.00
Space 2, Space 3 or Dining Room - Standard rate $21.00 $19.09 $22.00 $20.00
Spaces 2 & 3 combined - Standard rate $27.00 $24.55 $28.00 $25.45
Lounge - Standard rate $27.00 $24.55 $28.00 $25.45
Centre - Standard rate $98.00 $89.09 $100.00 $90.91
Corner Room or Coopers Room - Standard Rate $21.00 $19.09 $22.00 $20.00
Hall Hire - Friday and Saturday after 6pm $86.00 $78.18 $88.00 $80.00
Hall Hire + Spaces 2 & 3 - Friday and Saturday after 6pm $109.00 $99.09 $112.00 $101.82
Hall, Spaces 2 & 3, Kitchen & Dining Room - Friday and Saturday after 6pm $126.00 $114.55 $130.00 $118.18
Hall, Kitchen & Dining Room - Friday and Saturday after 6pm $102.00 $92.73 $105.00 $95.45
Kitchen & Dining Room - Friday and Saturday after 6pm $31.00 $28.18 $32.00 $29.09
Space 2, Space 3 or Dining Room - Friday and Saturday after 6pm $31.00 $28.18 $32.00 $29.09
Spaces 2 & 3 combined - Friday and Saturday after 6pm $41.00 $37.27 $42.00 $38.18
Lounge - Friday and Saturday after 6pm $41.00 $37.27 $42.00 $38.18
Centre - Friday and Saturday after 6pm $150.00 $136.37 $155.00 $140.91
Corner Room or Coopers Room - Friday and Saturday after 6pm $31.00 $28.18 $31.00 $28.18
Centre - Extended Use - 2 or more consecutive days. (Per day 9am-6pm, evenings included free)
$882.00 $801.82 $900.00 $818.18
Payments to join activities in the Community Centre (Per person) - Snooker, social groups, mah-jong.
$1.00 $0.91 $1.00 $0.91
Community Fitness Classes -
Keep-fit n/a n/a $3.00 $2.73
Yoga, Tai Chi n/a n/a $4.00 $3.64
DESCRIPTION & COMMENTS2013/14 Charges 2014/15 Charges
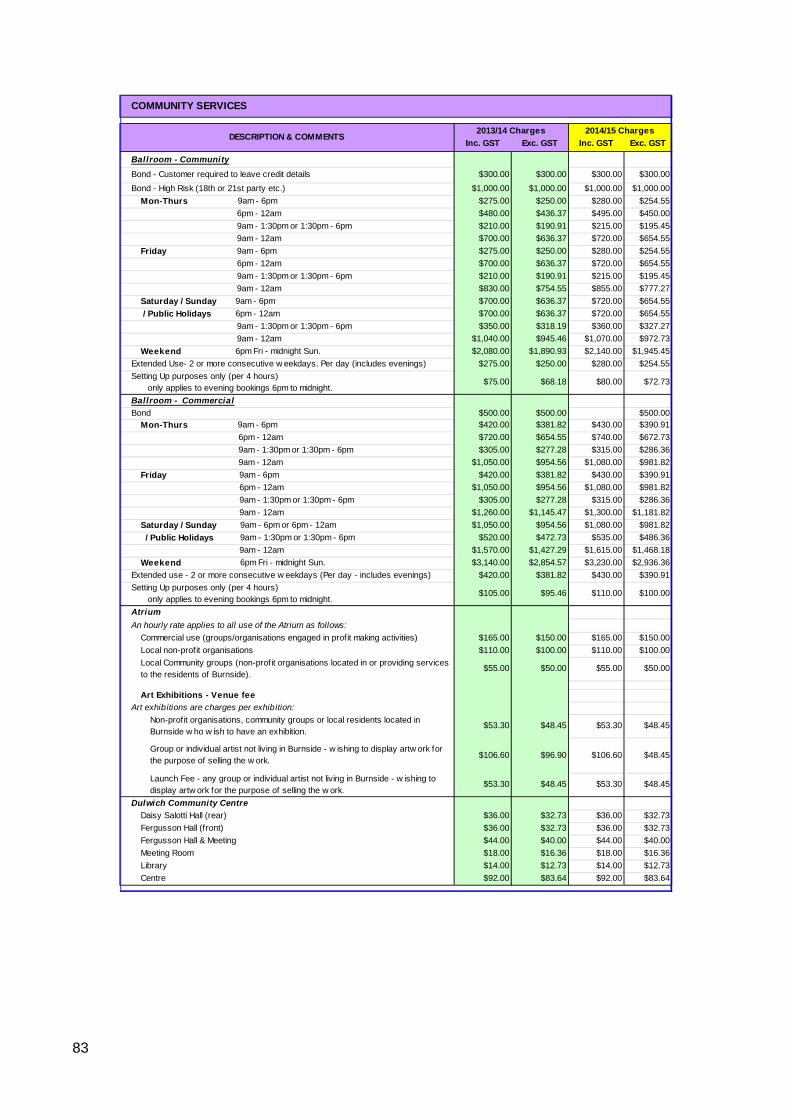
83
COMMUNITY SERVICES
Inc. GST Exc. GST Inc. GST Exc. GST
Ballroom - Community
Bond - Customer required to leave credit details $300.00 $300.00 $300.00 $300.00
Bond - High Risk (18th or 21st party etc.) $1,000.00 $1,000.00 $1,000.00 $1,000.00
Mon-Thurs 9am - 6pm $275.00 $250.00 $280.00 $254.55
6pm - 12am $480.00 $436.37 $495.00 $450.00
9am - 1:30pm or 1:30pm - 6pm $210.00 $190.91 $215.00 $195.45
9am - 12am $700.00 $636.37 $720.00 $654.55
Friday 9am - 6pm $275.00 $250.00 $280.00 $254.55
6pm - 12am $700.00 $636.37 $720.00 $654.55
9am - 1:30pm or 1:30pm - 6pm $210.00 $190.91 $215.00 $195.45
9am - 12am $830.00 $754.55 $855.00 $777.27
Saturday / Sunday 9am - 6pm $700.00 $636.37 $720.00 $654.55
/ Public Holidays 6pm - 12am $700.00 $636.37 $720.00 $654.55
9am - 1:30pm or 1:30pm - 6pm $350.00 $318.19 $360.00 $327.27
9am - 12am $1,040.00 $945.46 $1,070.00 $972.73
Weekend 6pm Fri - midnight Sun. $2,080.00 $1,890.93 $2,140.00 $1,945.45
Extended Use- 2 or more consecutive w eekdays. Per day (includes evenings) $275.00 $250.00 $280.00 $254.55
Setting Up purposes only (per 4 hours) only applies to evening bookings 6pm to midnight.
$75.00 $68.18 $80.00 $72.73
Ballroom - Commercial
Bond $500.00 $500.00 $500.00 Mon-Thurs 9am - 6pm $420.00 $381.82 $430.00 $390.91
6pm - 12am $720.00 $654.55 $740.00 $672.73
9am - 1:30pm or 1:30pm - 6pm $305.00 $277.28 $315.00 $286.36
9am - 12am $1,050.00 $954.56 $1,080.00 $981.82
Friday 9am - 6pm $420.00 $381.82 $430.00 $390.91
6pm - 12am $1,050.00 $954.56 $1,080.00 $981.82
9am - 1:30pm or 1:30pm - 6pm $305.00 $277.28 $315.00 $286.36
9am - 12am $1,260.00 $1,145.47 $1,300.00 $1,181.82
Saturday / Sunday 9am - 6pm or 6pm - 12am $1,050.00 $954.56 $1,080.00 $981.82
/ Public Holidays 9am - 1:30pm or 1:30pm - 6pm $520.00 $472.73 $535.00 $486.36
9am - 12am $1,570.00 $1,427.29 $1,615.00 $1,468.18
Weekend 6pm Fri - midnight Sun. $3,140.00 $2,854.57 $3,230.00 $2,936.36
Extended use - 2 or more consecutive w eekdays (Per day - includes evenings) $420.00 $381.82 $430.00 $390.91
Setting Up purposes only (per 4 hours) only applies to evening bookings 6pm to midnight.
$105.00 $95.46 $110.00 $100.00
Atrium
An hourly rate applies to all use of the Atrium as follows:
Commercial use (groups/organisations engaged in profit making activities) $165.00 $150.00 $165.00 $150.00
Local non-profit organisations $110.00 $100.00 $110.00 $100.00
Local Community groups (non-profit organisations located in or providing services to the residents of Burnside).
$55.00 $50.00 $55.00 $50.00
Art Exhibitions - Venue fee
Art exhibitions are charges per exhibition:
Non-profit organisations, community groups or local residents located in Burnside w ho w ish to have an exhibition.
$53.30 $48.45 $53.30 $48.45
Group or individual artist not living in Burnside - w ishing to display artw ork for the purpose of selling the w ork.
$106.60 $96.90 $106.60 $48.45
Launch Fee - any group or individual artist not living in Burnside - w ishing to display artw ork for the purpose of selling the w ork.
$53.30 $48.45 $53.30 $48.45
Dulwich Community Centre
Daisy Salotti Hall (rear) $36.00 $32.73 $36.00 $32.73
Fergusson Hall (front) $36.00 $32.73 $36.00 $32.73
Fergusson Hall & Meeting $44.00 $40.00 $44.00 $40.00
Meeting Room $18.00 $16.36 $18.00 $16.36
Library $14.00 $12.73 $14.00 $12.73
Centre $92.00 $83.64 $92.00 $83.64
DESCRIPTION & COMMENTS2013/14 Charges 2014/15 Charges
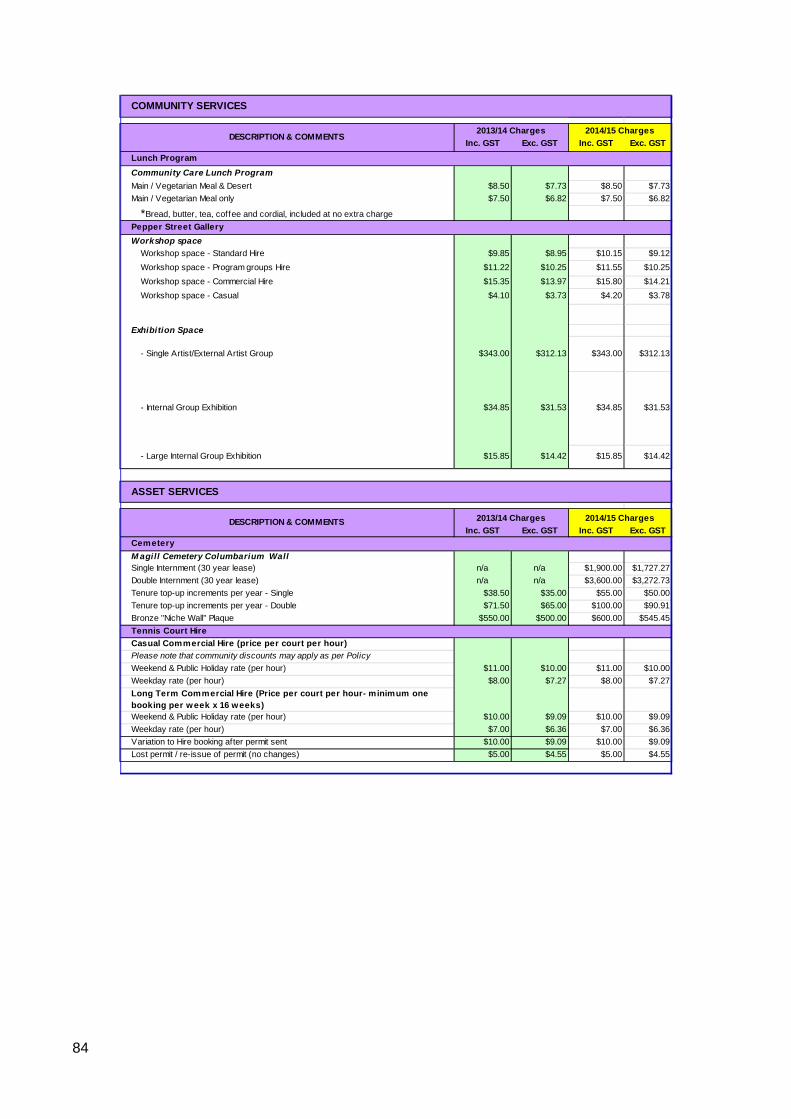
84
COMMUNITY SERVICES
Inc. GST Exc. GST Inc. GST Exc. GST
Lunch Program
Community Care Lunch Program
Main / Vegetarian Meal & Desert $8.50 $7.73 $8.50 $7.73
Main / Vegetarian Meal only $7.50 $6.82 $7.50 $6.82
*Bread, butter, tea, coffee and cordial, included at no extra charge
Pepper Street Gallery
Workshop space
Workshop space - Standard Hire $9.85 $8.95 $10.15 $9.12
Workshop space - Program groups Hire $11.22 $10.25 $11.55 $10.25
Workshop space - Commercial Hire $15.35 $13.97 $15.80 $14.21
Workshop space - Casual $4.10 $3.73 $4.20 $3.78
Exhibition Space
- Single Artist/External Artist Group $343.00 $312.13 $343.00 $312.13
- Internal Group Exhibition $34.85 $31.53 $34.85 $31.53
- Large Internal Group Exhibition $15.85 $14.42 $15.85 $14.42
ASSET SERVICES
Inc. GST Exc. GST Inc. GST Exc. GST
Cemetery
M agill Cemetery Columbarium WallSingle Internment (30 year lease) n/a n/a $1,900.00 $1,727.27
Double Internment (30 year lease) n/a n/a $3,600.00 $3,272.73
Tenure top-up increments per year - Single $38.50 $35.00 $55.00 $50.00
Tenure top-up increments per year - Double $71.50 $65.00 $100.00 $90.91
Bronze "Niche Wall" Plaque $550.00 $500.00 $600.00 $545.45
Tennis Court Hire
Casual Commercial Hire (price per court per hour)
Please note that community discounts may apply as per Policy
Weekend & Public Holiday rate (per hour) $11.00 $10.00 $11.00 $10.00
Weekday rate (per hour) $8.00 $7.27 $8.00 $7.27
Long Term Commercial Hire (Price per court per hour- minimum one booking per week x 16 weeks)Weekend & Public Holiday rate (per hour) $10.00 $9.09 $10.00 $9.09
Weekday rate (per hour) $7.00 $6.36 $7.00 $6.36
Variation to Hire booking after permit sent $10.00 $9.09 $10.00 $9.09
Lost permit / re-issue of permit (no changes) $5.00 $4.55 $5.00 $4.55
DESCRIPTION & COMMENTS 2013/14 Charges 2014/15 Charges
DESCRIPTION & COMMENTS2013/14 Charges 2014/15 Charges

85
ASSET SERVICES
Inc. GST Exc. GST Inc. GST Exc. GSTSwimming Pool Fees
School Concession 1 hr $2.60 $2.34 $2.60 $2.34
School Concession 2 hr $3.10 $2.79 $3.10 $2.79
Pool Hire $205.00 $184.50 $300.00 $272.73
Burnside Senior Sw im Class $9.80 $8.82 $9.80 $8.82
Burnside Senior Sw im 10-visit pass $88.00 $80.00 $88.00 $80.00
General Admission $6.50 $5.85 $6.50 $5.85
Concession, Students & Children 4 & over $5.50 $4.95 $5.50 $4.95
Children under 4 - (accompanied by paying adult) no charge no charge no charge no charge
Spectators $4.80 $4.32 $4.80 $4.32
Family Pass $19.00 $17.10 $19.00 $17.10
Squads $5.50 $4.95 $5.50 $4.95
Spa / Steam Only $5.20 $4.68 $5.20 $4.68
Sw im / Spa / Steam $9.00 $8.10 $9.00 $8.10
Concession Sw im / Spa / Steam $8.00 $7.20 $8.00 $7.20
Season Pass (Adult - includes spa / steam) $330.00 $297.00 $330.00 $297.00
Season Pass (Adult concession - includes spa / steam) $300.00 $270.00 $300.00 $270.00
Season Pass (Child - pool only) $270.00 $243.00 $270.00 $243.00
Adult Multi-pass Book 30 tickets $147.00 $132.30 $147.00 $132.30
Adult Multi-pass Book 10 tickets $57.00 $51.30 $57.00 $51.30
Children/ Concession Multi-pass Book 30 tickets $120.00 $108.00 $120.00 $108.00
Children/Concession Multi-pass Book 10 tickets $48.00 $43.20 $48.00 $43.20
Adult Sw im/ spa/ steam Book 10 tickets $79.00 $71.10 $79.00 $71.10
Adult Spa/ steam only Book 10 tickets $40.00 $36.00 $40.00 $36.00
Lane Hire $17.00 $15.30 $25.00 $22.73
Lane Hire - Regular User Groups $17.00 $15.30 $25.00 $22.73
Lockers $1.00 $0.90 $1.00 $0.90
Function Room Hire (per hour) n/a n/a $42.00 $38.18
Rubbish Collection
The cost of the supply and delivery of a 240 litre green organics or 240 litre reuse/recycle bin over that approved w ithin the Kerbside Waste Policy.
$87.00 $87.00 $87.00 $87.00
The cost of the supply and delivery of a 140 litre general w aste bin over that approved w ithin the Kerbside Waste Policy.
$87.00 $87.00 $118.00 $118.00
The cost of the supply and delivery of an additional 140 litre green organics or reuse/recycle bin over that approved w ithin the Kerbside Waste Policy.
$39.00 $39.00 $39.00 $39.00
The purchase cost of the supply of an additional Kitchen Organics Basket. $8.50 $8.50 $8.50 $8.50
Cost per roll of 150 compostable bin liner bags (over and above annual supply) $12.00 $12.00 $12.00 $12.00
Cost per bin to upgrade/dow ngrade (i.e. sw ap bin size) $17.00 $17.00 $17.00 $17.00
Annual Service Charge (service collection) per bin for additional leased bins $48.00 $48.00 $48.00 $48.00
NB: All other work will be subject to quotation to cover actual costs incurred.
Compost Bins
Compost Bins $35.00 $31.82 $36.00 $32.73
Compost Aerator - Stainless Steel $16.00 $14.55 $16.00 $14.55
Compost Aerator - Pow der coated steel $14.00 $12.73 $14.00 $12.73
Sharps Containers
Sale of needle/sharps containers
1.4 Litre $6.00 $5.45 $6.00 $5.45
5 Litre $10.00 $9.09 $10.00 $9.09
Donating a Memorial Council Bench Seat w ith Plaque
The request by residents for the donation of a bench seat in a reserve with a memorial plaque
$1,611.50 $1,465.00 $1,800.00 $1,636.36
DESCRIPTION & COMMENTS 2013/14 Charges 2014/15 Charges

86
CITY DEVELOPMENT & SAFETY (Statutory fees under the Development Act change on 1 July each year)
Inc. GST Exc. GST Inc. GST Exc. GSTAdvertising in newspaper as required under the Development Act
Category 3 $500.00 $454.55 $500.00 $454.55
Lodgement fees under the Development Act
Under $5,000 $57.00 $57.00 $59.00 $59.00
Over $5,000 $122.00 $122.00 $126.00 $126.00
Building rules fees under the Development Act
Building Work:
Minimum Fee $62.00 $56.36 $64.00 $59.09
Class 1, 2 & 4 $2.76 $2.51 $2.83 $2.57
Class 3, 5 & 6 $3.66 $3.33 $3.75 $3.41
Class 7 & 8 $2.43 $2.21 $2.50 $2.27
Class 9a $4.15 $3.77 $4.26 $3.87
Class 9b $3.65 $3.32 $3.74 $3.40
Class 10, 10a, & 10b $0.82 $0.75 $0.84 $0.76
Demolition:Minimum Fee $62.00 $56.36 $64.00 $59.09Class 1, 2 & 4 $0.55 $0.50 $0.57 $0.51
Class 3, 5 & 6 $0.73 $0.67 $0.75 $0.68
Class 7 & 8 $0.49 $0.44 $0.50 $0.45
Class 9a $0.83 $0.75 $0.85 $0.77
Class 9b $0.73 $0.66 $0.75 $0.68
Class 10, 10a, & 10b $0.16 $0.15 $0.17 $0.15
Development plan assessment feeUnder $10,000 $35.50 $35.50 $36.50 $36.50
$10,000 - $100,000 $98.00 $98.00 $100.75 $100.75
$100,000 + 0.125% 0.125% 0.125% 0.125%
Public Notification Fee (category 2 & 3) under the Development Act $97.50 $97.50 $100.00 $100.00
Referral fees under the Development Act <$1,000,000 $202.50 $202.50 $208.00 $208.00
=>$1,000,000 $340.00 $340.00 $350.00 $350.00
Consent to Development at Variance with Building Rules under the Development Act
$142.00 $129.00 $145.00 $131.81
Non-complying Development Fee under the Development Act $116.00 $116.00 $122.00 $122.00
Application for assignment of, or change in, classification of a building under the Development Act
$62.00 $56.36 $66.00 $60.00
Certificate of Occupancy Fee under the Development Act
Building (2-9) $40.50 $36.82 $42.00 $38.32
Application for issue of Schedule of Essential Safety Provisions under the Development Act
$88.00 $80.00 $90.00 $81.82
Referral to Building Rules Assessment Commission under the Development Act
Standard $286.00 $286.00 $264.00 $264.00
Class 1 & 10 $448.00 $448.00 $481.00 $481.00
Class 2 to 9 $983.00 $983.00 $1,012.00 $1,012.00
Plan Search
Inspection of Approved Works $50.00 $45.45 no charge no charge
Requests for Information
Photocopying A4 $0.55 $0.55 $1.00 $0.91
Photocopying A3 $1.10 $1.10 $2.00 $1.82
Plan Search photocopy fee of $25, includes 10x A4/A3 pages, or 2x A2/A1/A0 pages, thereafter the follow ing charges apply per page:
A4 B&W $1.00 $1.00 $1.00 $0.91
A4 Colour $2.00 $2.00 $2.00 $1.82
A3 B&W $2.00 $2.00 $2.00 $1.82
A3 Colour $4.00 $4.00 $4.00 $3.64
A2/A1/A0 $10.00 $10.00 $10.00 $9.09
Certif icate of Title
Development application lodgement requires a current CT $30.00 $30.00 $30.00 $30.00
Copies of plans during Public Notif ication period in relation to Category 2 & 3 Development Applications
$25.00 $22.73 $25.00 $22.73
DESCRIPTION & COMMENTS2013/14 Charges 2014/15 Charges
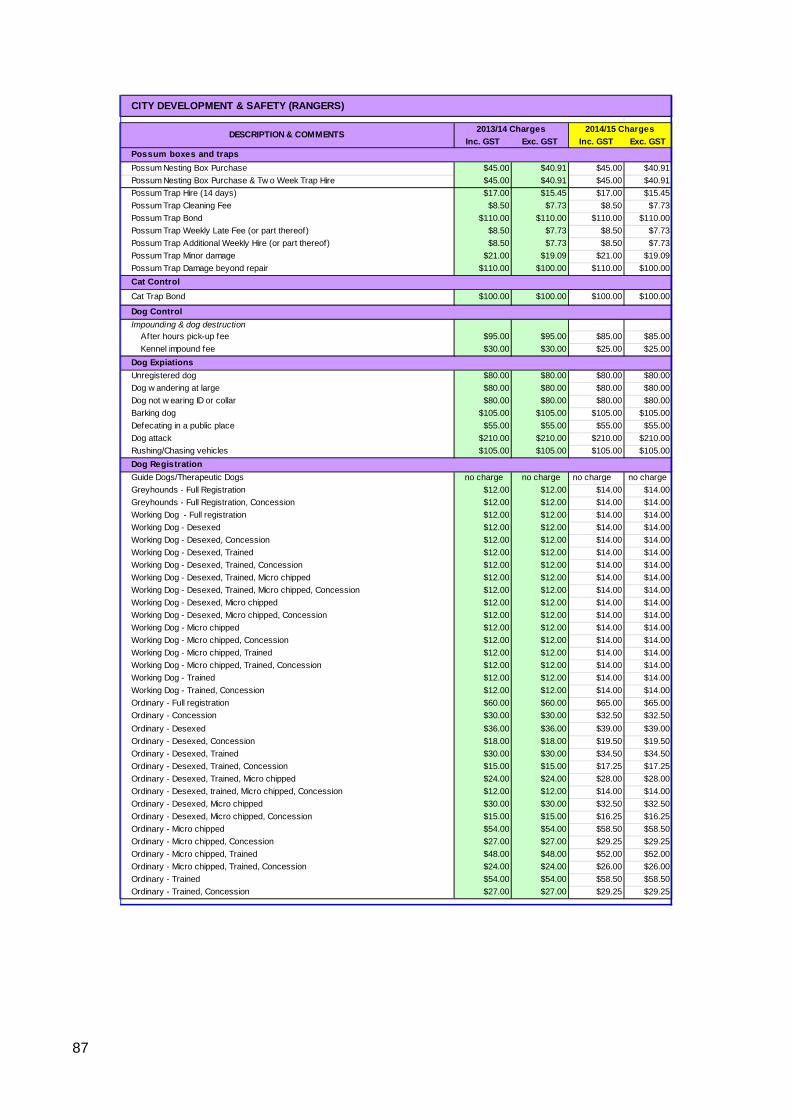
87
CITY DEVELOPMENT & SAFETY (RANGERS)
Inc. GST Exc. GST Inc. GST Exc. GST
Possum boxes and traps
Possum Nesting Box Purchase $45.00 $40.91 $45.00 $40.91
Possum Nesting Box Purchase & Tw o Week Trap Hire $45.00 $40.91 $45.00 $40.91
Possum Trap Hire (14 days) $17.00 $15.45 $17.00 $15.45
Possum Trap Cleaning Fee $8.50 $7.73 $8.50 $7.73
Possum Trap Bond $110.00 $110.00 $110.00 $110.00
Possum Trap Weekly Late Fee (or part thereof) $8.50 $7.73 $8.50 $7.73
Possum Trap Additional Weekly Hire (or part thereof) $8.50 $7.73 $8.50 $7.73
Possum Trap Minor damage $21.00 $19.09 $21.00 $19.09
Possum Trap Damage beyond repair $110.00 $100.00 $110.00 $100.00
Cat Control
Cat Trap Bond $100.00 $100.00 $100.00 $100.00
Dog Control
Impounding & dog destructionAfter hours pick-up fee $95.00 $95.00 $85.00 $85.00
Kennel impound fee $30.00 $30.00 $25.00 $25.00
Dog Expiations
Unregistered dog $80.00 $80.00 $80.00 $80.00
Dog w andering at large $80.00 $80.00 $80.00 $80.00
Dog not w earing ID or collar $80.00 $80.00 $80.00 $80.00
Barking dog $105.00 $105.00 $105.00 $105.00
Defecating in a public place $55.00 $55.00 $55.00 $55.00
Dog attack $210.00 $210.00 $210.00 $210.00
Rushing/Chasing vehicles $105.00 $105.00 $105.00 $105.00
Dog Registration
Guide Dogs/Therapeutic Dogs no charge no charge no charge no charge
Greyhounds - Full Registration $12.00 $12.00 $14.00 $14.00
Greyhounds - Full Registration, Concession $12.00 $12.00 $14.00 $14.00
Working Dog - Full registration $12.00 $12.00 $14.00 $14.00
Working Dog - Desexed $12.00 $12.00 $14.00 $14.00
Working Dog - Desexed, Concession $12.00 $12.00 $14.00 $14.00
Working Dog - Desexed, Trained $12.00 $12.00 $14.00 $14.00
Working Dog - Desexed, Trained, Concession $12.00 $12.00 $14.00 $14.00
Working Dog - Desexed, Trained, Micro chipped $12.00 $12.00 $14.00 $14.00
Working Dog - Desexed, Trained, Micro chipped, Concession $12.00 $12.00 $14.00 $14.00
Working Dog - Desexed, Micro chipped $12.00 $12.00 $14.00 $14.00
Working Dog - Desexed, Micro chipped, Concession $12.00 $12.00 $14.00 $14.00
Working Dog - Micro chipped $12.00 $12.00 $14.00 $14.00
Working Dog - Micro chipped, Concession $12.00 $12.00 $14.00 $14.00
Working Dog - Micro chipped, Trained $12.00 $12.00 $14.00 $14.00
Working Dog - Micro chipped, Trained, Concession $12.00 $12.00 $14.00 $14.00
Working Dog - Trained $12.00 $12.00 $14.00 $14.00
Working Dog - Trained, Concession $12.00 $12.00 $14.00 $14.00
Ordinary - Full registration $60.00 $60.00 $65.00 $65.00
Ordinary - Concession $30.00 $30.00 $32.50 $32.50
Ordinary - Desexed $36.00 $36.00 $39.00 $39.00
Ordinary - Desexed, Concession $18.00 $18.00 $19.50 $19.50
Ordinary - Desexed, Trained $30.00 $30.00 $34.50 $34.50
Ordinary - Desexed, Trained, Concession $15.00 $15.00 $17.25 $17.25
Ordinary - Desexed, Trained, Micro chipped $24.00 $24.00 $28.00 $28.00
Ordinary - Desexed, trained, Micro chipped, Concession $12.00 $12.00 $14.00 $14.00
Ordinary - Desexed, Micro chipped $30.00 $30.00 $32.50 $32.50
Ordinary - Desexed, Micro chipped, Concession $15.00 $15.00 $16.25 $16.25
Ordinary - Micro chipped $54.00 $54.00 $58.50 $58.50
Ordinary - Micro chipped, Concession $27.00 $27.00 $29.25 $29.25
Ordinary - Micro chipped, Trained $48.00 $48.00 $52.00 $52.00
Ordinary - Micro chipped, Trained, Concession $24.00 $24.00 $26.00 $26.00
Ordinary - Trained $54.00 $54.00 $58.50 $58.50
Ordinary - Trained, Concession $27.00 $27.00 $29.25 $29.25
DESCRIPTION & COMMENTS2013/14 Charges 2014/15 Charges

88
CITY DEVELOPMENT & SAFETY (RANGERS)
Inc. GST Exc. GST Inc. GST Exc. GST
Dog Registration
Percentage rebate for Partial Year Registration (New Dogs Registered betw een 1st January and 31st May each year)
n/a n/a 50% 50%
New Dog Promo Fee in June each year n/a n/a $5.50 $5.50
Replacement w ith or w ithout concession $5.50 $5.50 $5.50 $5.50
Transfer w ith or w ithout concession $5.50 $5.50 $5.50 $5.50
Penalty Late Fee (charged if dog is registered after 31st August each year) n/a n/a $10.00 $10.00
Please note : Dog registration fees do not attract GST
Expiations – Littering
Littering $315.00 $315.00 $315.00 $315.00
Expiations – Parking
167 Stopping w here 'no parking' sign applies $83.00 $83.00 $85.00 $85.00
168 (1)Stopping w here 'no parking' sign applies $66.00 $66.00 $68.00 $68.00
169 Stopping on road w ith continuous yellow edge line $83.00 $83.00 $85.00 $85.00
170(1) Stopping in an intersection $83.00 $83.00 $85.00 $85.00
170(2) Stopping w ithin 20 metres of intersection w ith traff ic lights $83.00 $83.00 $85.00 $85.00
170(3) Stopping w ithin 10 metres of intersection w ithout traff ic lights $83.00 $83.00 $85.00 $85.00
171(1) Stopping on or near children's crossing $83.00 $83.00 $85.00 $85.00
172(1) Stopping on or near pedestrian crossing (except at intersection) $83.00 $83.00 $85.00 $85.00
173(1) Stopping on or near marked foot crossing (except at intersection) $83.00 $83.00 $85.00 $85.00
174(1) Stopping at or near bicycle crossing lights (except at intersection) $83.00 $83.00 $85.00 $85.00
175(1) Stopping on or near level crossing $83.00 $83.00 $85.00 $85.00
176(1) Stopping on clearw ay $232.00 $232.00 $239.00 $239.00
177(1) Stopping on freew ay $232.00 $232.00 $239.00 $239.00
178 Stopping in emergency stopping lane $232.00 $232.00 $239.00 $239.00
179(1) Stopping in loading zone $58.00 $58.00 $60.00 $60.00
179(2) Stopping in loading zone - exceeding time in loading zone $58.00 $58.00 $60.00 $60.00
180(1) Stopping in truck zone $58.00 $58.00 $60.00 $60.00
181(1) Stopping in w orks zone $58.00 $58.00 $60.00 $60.00
182(1) Stopping in taxi zone $111.00 $111.00 $114.00 $114.00
183(1) Stopping in bus zone $111.00 $111.00 $114.00 $114.00
184(1) Stopping in minibus zone $83.00 $83.00 $85.00 $85.00
185(1) Stopping in permit zone $58.00 $58.00 $60.00 $60.00
186(1) Stopping in mail zone $58.00 $58.00 $60.00 $60.00
187(1) Stopping in bus lane, transit lane or truck lane $232.00 $232.00 $239.00 $239.00
187(2) Stopping in bicycle lane $232.00 $232.00 $239.00 $239.00
187(3) Stopping in tram lane or on tram tracks $232.00 $232.00 $239.00 $239.00
188 Stopping in shared zone $58.00 $58.00 $60.00 $60.00
189(1) Double parking $83.00 $83.00 $85.00 $85.00
190(1) Stopping in or near safety zone $58.00 $58.00 $60.00 $60.00
191 Stopping near obstruction $101.00 $101.00 $104.00 $104.00
192(1) Stopping on bridge, causew ay, ramp or similar structure $83.00 $83.00 $85.00 $85.00
192(2) Stopping in tunnel or underpass $101.00 $101.00 $104.00 $104.00
193(1) Stopping on crest or curve outside built-up area $101.00 $101.00 $104.00 $104.00
194(1) Stopping near f ire hydrant etc. $66.00 $66.00 $68.00 $68.00
195(1) Stopping at or near bus stop $83.00 $83.00 $85.00 $85.00
196(1)Stopping at or near tram stop $83.00 $83.00 $85.00 $85.00
197(1) Stopping on path, dividing strip or nature strip $83.00 $83.00 $85.00 $85.00
198(1) Obstructing access to and from footpath ramp, etc. $66.00 $66.00 $68.00 $68.00
198(2) Obstructing access to and from drivew ay, etc. $66.00 $66.00 $68.00 $68.00
199(1) Stopping near post-box $83.00 $83.00 $85.00 $85.00
200(1) Stopping heavy or long vehicle on road outside built-up area except on shoulder of road
$101.00 $101.00 $104.00 $104.00
200(2) Stopping heavy or long vehicle on road in built-up area for longer than permitted time
$101.00 $101.00 $104.00 $104.00
201 Stopping on road w ith 'bicycle parking' sign $58.00 $58.00 $60.00 $60.00
202 Stopping on road w ith 'motor bike parking' sign $58.00 $58.00 $60.00 $60.00
20.3(1) Stopping in parking areas for people w ith disabilities $320.00 $320.00 $330.00 $330.00
205(1) Parking for longer than indicated w here 'permissive parking' sign applies $44.00 $44.00 $45.00 $45.00
DESCRIPTION & COMMENTS2013/14 Charges 2014/15 Charges
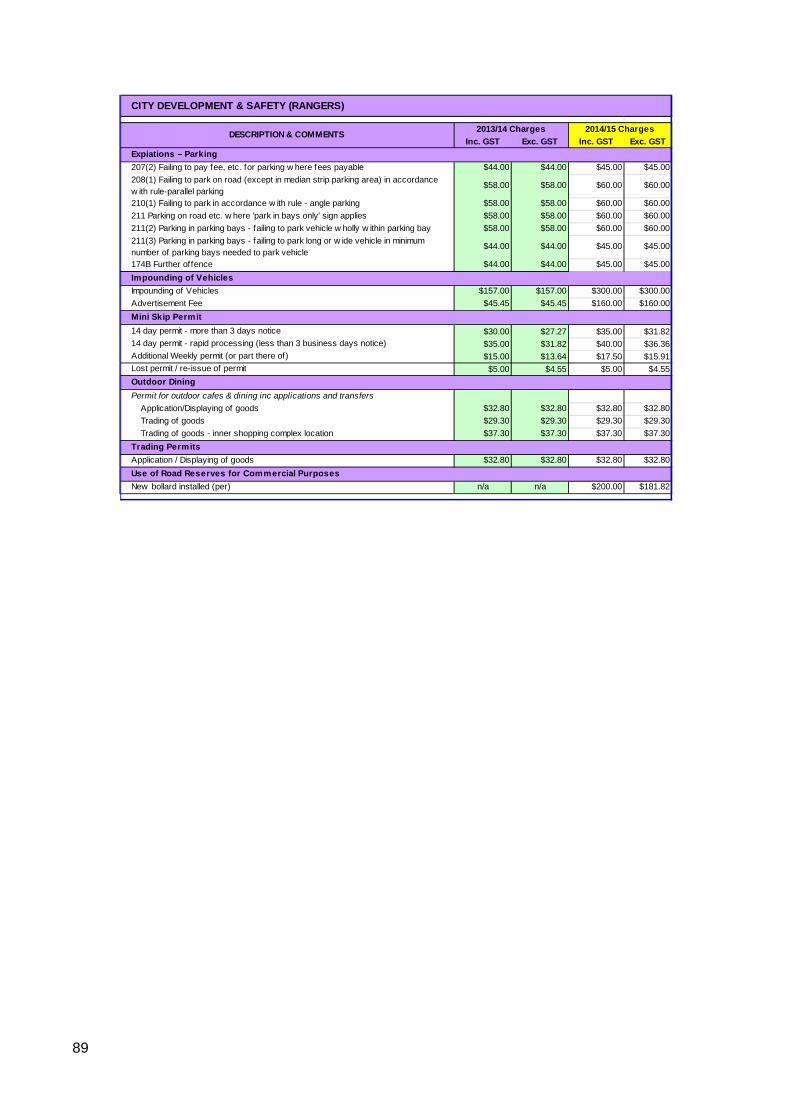
89
CITY DEVELOPMENT & SAFETY (RANGERS)
Inc. GST Exc. GST Inc. GST Exc. GST
Expiations – Parking
207(2) Failing to pay fee, etc. for parking w here fees payable $44.00 $44.00 $45.00 $45.00
208(1) Failing to park on road (except in median strip parking area) in accordance w ith rule-parallel parking
$58.00 $58.00 $60.00 $60.00
210(1) Failing to park in accordance w ith rule - angle parking $58.00 $58.00 $60.00 $60.00
211 Parking on road etc. w here 'park in bays only' sign applies $58.00 $58.00 $60.00 $60.00
211(2) Parking in parking bays - failing to park vehicle w holly w ithin parking bay $58.00 $58.00 $60.00 $60.00
211(3) Parking in parking bays - failing to park long or w ide vehicle in minimum number of parking bays needed to park vehicle
$44.00 $44.00 $45.00 $45.00
174B Further offence $44.00 $44.00 $45.00 $45.00
Impounding of Vehicles
Impounding of Vehicles $157.00 $157.00 $300.00 $300.00
Advertisement Fee $45.45 $45.45 $160.00 $160.00
Mini Skip Permit
14 day permit - more than 3 days notice $30.00 $27.27 $35.00 $31.8214 day permit - rapid processing (less than 3 business days notice) $35.00 $31.82 $40.00 $36.36Additional Weekly permit (or part there of) $15.00 $13.64 $17.50 $15.91Lost permit / re-issue of permit $5.00 $4.55 $5.00 $4.55
Outdoor Dining
Permit for outdoor cafes & dining inc applications and transfers
Application/Displaying of goods $32.80 $32.80 $32.80 $32.80
Trading of goods $29.30 $29.30 $29.30 $29.30
Trading of goods - inner shopping complex location $37.30 $37.30 $37.30 $37.30
Trading Permits
Application / Displaying of goods $32.80 $32.80 $32.80 $32.80
Use of Road Reserves for Commercial Purposes
New bollard installed (per) n/a n/a $200.00 $181.82
DESCRIPTION & COMMENTS2013/14 Charges 2014/15 Charges
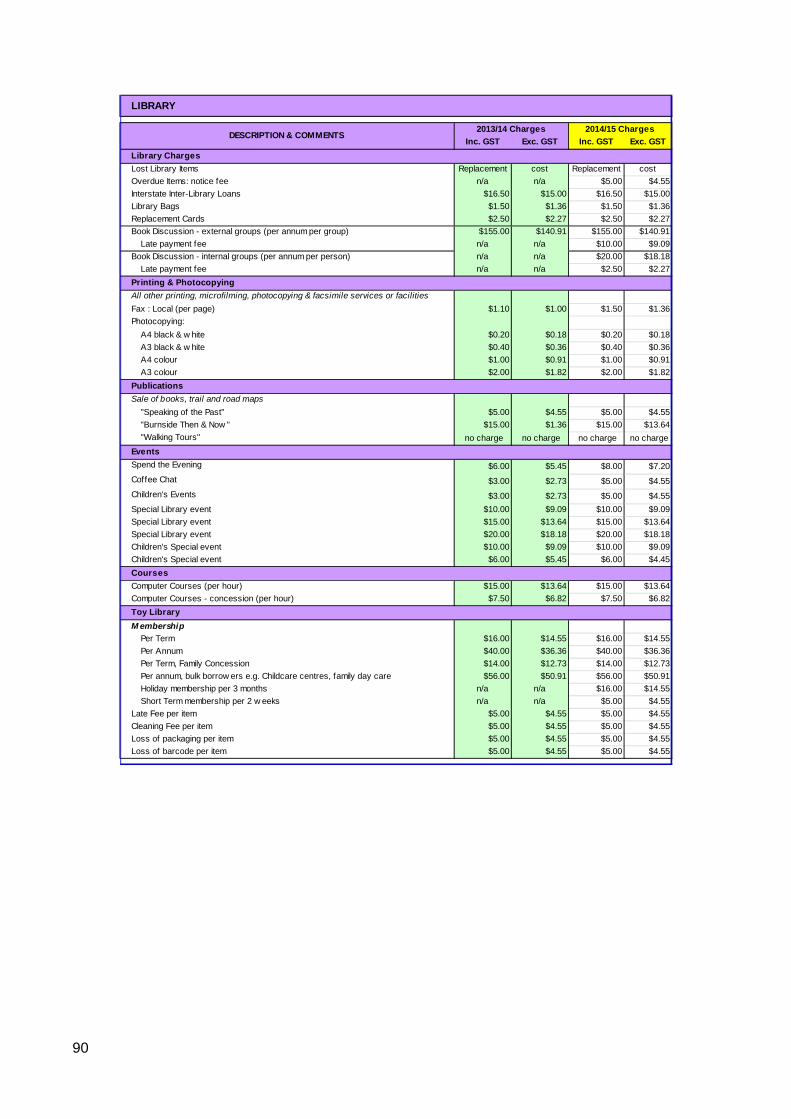
90
LIBRARY
Inc. GST Exc. GST Inc. GST Exc. GST
Library Charges
Lost Library Items Replacement cost Replacement cost
Overdue Items: notice fee n/a n/a $5.00 $4.55
Interstate Inter-Library Loans $16.50 $15.00 $16.50 $15.00
Library Bags $1.50 $1.36 $1.50 $1.36
Replacement Cards $2.50 $2.27 $2.50 $2.27
Book Discussion - external groups (per annum per group) $155.00 $140.91 $155.00 $140.91
Late payment fee n/a n/a $10.00 $9.09
Book Discussion - internal groups (per annum per person) n/a n/a $20.00 $18.18
Late payment fee n/a n/a $2.50 $2.27
Printing & Photocopying
All other printing, microfilming, photocopying & facsimile services or facilities
Fax : Local (per page) $1.10 $1.00 $1.50 $1.36
Photocopying:
A4 black & w hite $0.20 $0.18 $0.20 $0.18
A3 black & w hite $0.40 $0.36 $0.40 $0.36
A4 colour $1.00 $0.91 $1.00 $0.91
A3 colour $2.00 $1.82 $2.00 $1.82
Publications
Sale of books, trail and road maps
"Speaking of the Past" $5.00 $4.55 $5.00 $4.55
"Burnside Then & Now " $15.00 $1.36 $15.00 $13.64
"Walking Tours" no charge no charge no charge no charge
Events
Spend the Evening $6.00 $5.45 $8.00 $7.20
Coffee Chat $3.00 $2.73 $5.00 $4.55
Children's Events $3.00 $2.73 $5.00 $4.55
Special Library event $10.00 $9.09 $10.00 $9.09
Special Library event $15.00 $13.64 $15.00 $13.64
Special Library event $20.00 $18.18 $20.00 $18.18
Children's Special event $10.00 $9.09 $10.00 $9.09
Children's Special event $6.00 $5.45 $6.00 $4.45
Courses
Computer Courses (per hour) $15.00 $13.64 $15.00 $13.64
Computer Courses - concession (per hour) $7.50 $6.82 $7.50 $6.82
Toy Library
M embership
Per Term $16.00 $14.55 $16.00 $14.55
Per Annum $40.00 $36.36 $40.00 $36.36
Per Term, Family Concession $14.00 $12.73 $14.00 $12.73
Per annum, bulk borrow ers e.g. Childcare centres, family day care $56.00 $50.91 $56.00 $50.91
Holiday membership per 3 months n/a n/a $16.00 $14.55
Short Term membership per 2 w eeks n/a n/a $5.00 $4.55
Late Fee per item $5.00 $4.55 $5.00 $4.55
Cleaning Fee per item $5.00 $4.55 $5.00 $4.55
Loss of packaging per item $5.00 $4.55 $5.00 $4.55
Loss of barcode per item $5.00 $4.55 $5.00 $4.55
DESCRIPTION & COMMENTS2013/14 Charges 2014/15 Charges
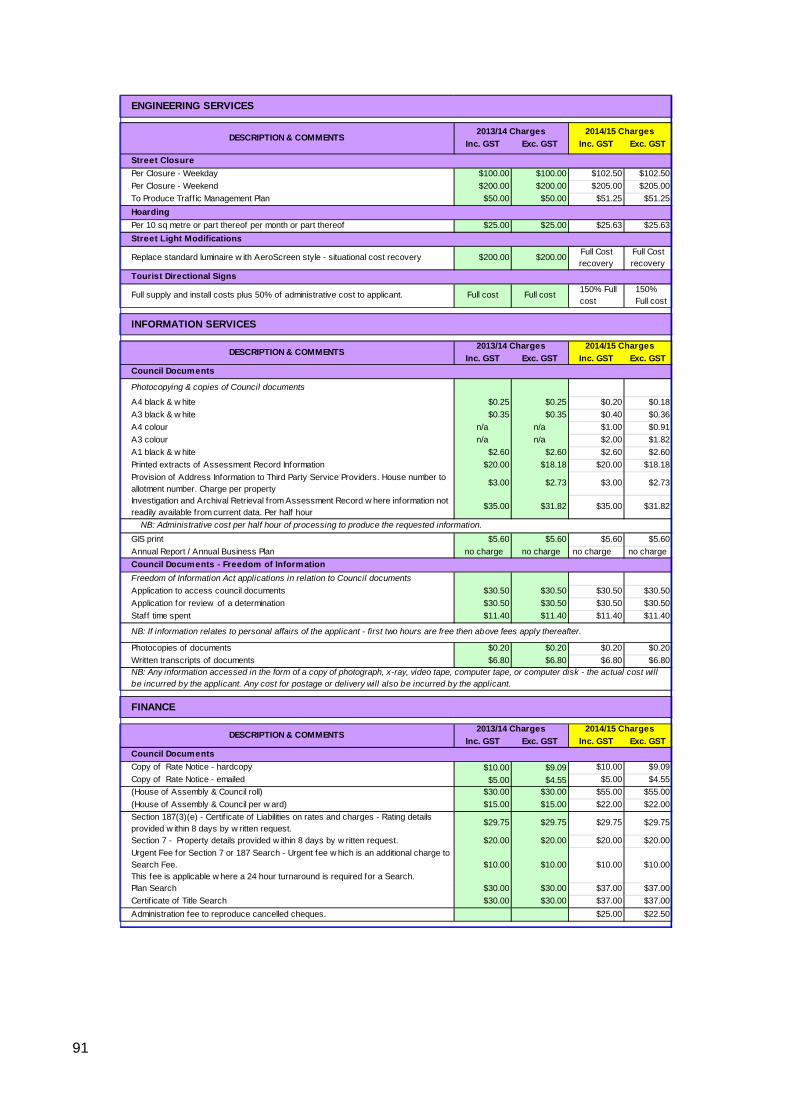
91
ENGINEERING SERVICES
Inc. GST Exc. GST Inc. GST Exc. GST
Street Closure
Per Closure - Weekday $100.00 $100.00 $102.50 $102.50
Per Closure - Weekend $200.00 $200.00 $205.00 $205.00
To Produce Traff ic Management Plan $50.00 $50.00 $51.25 $51.25
Hoarding
Per 10 sq metre or part thereof per month or part thereof $25.00 $25.00 $25.63 $25.63
Street Light Modifications
Replace standard luminaire w ith AeroScreen style - situational cost recovery $200.00 $200.00Full Cost recovery
Full Cost recovery
Tourist Directional Signs
Full supply and install costs plus 50% of administrative cost to applicant. Full cost Full cost150% Full cost
150% Full cost
INFORMATION SERVICES
Inc. GST Exc. GST Inc. GST Exc. GST
Council Documents
Photocopying & copies of Council documents
A4 black & w hite $0.25 $0.25 $0.20 $0.18
A3 black & w hite $0.35 $0.35 $0.40 $0.36
A4 colour n/a n/a $1.00 $0.91
A3 colour n/a n/a $2.00 $1.82
A1 black & w hite $2.60 $2.60 $2.60 $2.60
Printed extracts of Assessment Record Information $20.00 $18.18 $20.00 $18.18
Provision of Address Information to Third Party Service Providers. House number to allotment number. Charge per property
$3.00 $2.73 $3.00 $2.73
Investigation and Archival Retrieval from Assessment Record w here information not readily available from current data. Per half hour
$35.00 $31.82 $35.00 $31.82
GIS print $5.60 $5.60 $5.60 $5.60
Annual Report / Annual Business Plan no charge no charge no charge no charge
Council Documents - Freedom of Information
Freedom of Information Act applications in relation to Council documents
Application to access council documents $30.50 $30.50 $30.50 $30.50
Application for review of a determination $30.50 $30.50 $30.50 $30.50
Staff time spent $11.40 $11.40 $11.40 $11.40
Photocopies of documents $0.20 $0.20 $0.20 $0.20
Written transcripts of documents $6.80 $6.80 $6.80 $6.80
FINANCE
Inc. GST Exc. GST Inc. GST Exc. GST
Council Documents
Copy of Rate Notice - hardcopy $10.00 $9.09 $10.00 $9.09
Copy of Rate Notice - emailed $5.00 $4.55 $5.00 $4.55
(House of Assembly & Council roll) $30.00 $30.00 $55.00 $55.00
(House of Assembly & Council per w ard) $15.00 $15.00 $22.00 $22.00
Section 187(3)(e) - Certif icate of Liabilities on rates and charges - Rating details provided w ithin 8 days by w ritten request.
$29.75 $29.75 $29.75 $29.75
Section 7 - Property details provided w ithin 8 days by w ritten request. $20.00 $20.00 $20.00 $20.00
Urgent Fee for Section 7 or 187 Search - Urgent fee w hich is an additional charge to Search Fee. This fee is applicable w here a 24 hour turnaround is required for a Search.
$10.00 $10.00 $10.00 $10.00
Plan Search $30.00 $30.00 $37.00 $37.00
Certif icate of Title Search $30.00 $30.00 $37.00 $37.00
Administration fee to reproduce cancelled cheques. $25.00 $22.50
NB: If information relates to personal affairs of the applicant - first two hours are free then above fees apply thereafter.
NB: Any information accessed in the form of a copy of photograph, x-ray, video tape, computer tape, or computer disk - the actual cost will be incurred by the applicant. Any cost for postage or delivery will also be incurred by the applicant.
DESCRIPTION & COMMENTS2013/14 Charges 2014/15 Charges
DESCRIPTION & COMMENTS2013/14 Charges 2014/15 Charges
NB: Administrative cost per half hour of processing to produce the requested information.
DESCRIPTION & COMMENTS2013/14 Charges 2014/15 Charges

92
OPERATIONS SERVICES
Inc. GST Exc. GST Inc. GST Exc. GST
Road and Footpath Reinstatements
Reinstatement of roads, footpaths, paved areas & kerbing after work carried out by residents
Application fee $38.78 $35.25 $38.78 $35.25
Reinstatement w orks * *
Tree Removal and Replacement due to development
Tree Removal ** **
Tree Replacement $355.30 $323.00 $400.00 $363.63
In accordance with the Urban Tree Strategy where a proposed development impacts a Council’s street tree and approval has been given by Council (and DAP if a significant or regulated tree) for removal, there is an opportunity for applicants to pay for the removal and replacement (in an alternative location) of the suburb.
**NB: Reinstatement works will be subject to quotation in accordance with the Urban Tree Strategy.
DESCRIPTION & COMMENTS 2013/14 Charges 2014/15 Charges
*NB: Reinstatement works will be subject to quotation to cover actual costs incurred.