2014-15 western australia australia (gdp) 2015-16
TRANSCRIPT
WA Economic Profile – Sep. 2017
1
Economic Profile
September 2017
Western Australia
THE ECONOMY
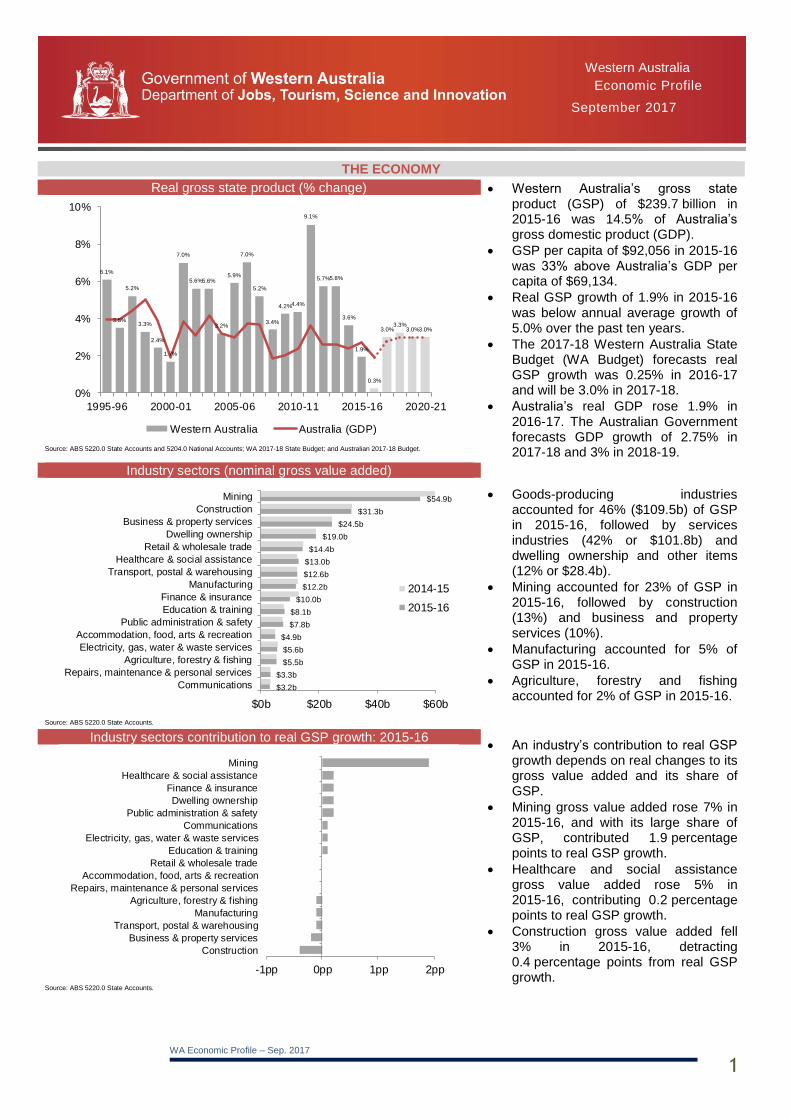
Real gross state product (% change) Western Australia’s gross state product (GSP) of $239.7 billion in 2015-16 was 14.5% of Australia’s gross domestic product (GDP).
GSP per capita of $92,056 in 2015-16 was 33% above Australia’s GDP per capita of $69,134.
Real GSP growth of 1.9% in 2015-16 was below annual average growth of 5.0% over the past ten years.
The 2017-18 Western Australia State Budget (WA Budget) forecasts real GSP growth was 0.25% in 2016-17 and will be 3.0% in 2017-18.
Australia’s real GDP rose 1.9% in 2016-17. The Australian Government forecasts GDP growth of 2.75% in 2017-18 and 3% in 2018-19.
Source: ABS 5220.0 State Accounts and 5204.0 National Accounts; WA 2017-18 State Budget; and Australian 2017-18 Budget.
Industry sectors (nominal gross value added)
Goods-producing industries accounted for 46% ($109.5b) of GSP in 2015-16, followed by services industries (42% or $101.8b) and dwelling ownership and other items (12% or $28.4b).
Mining accounted for 23% of GSP in 2015-16, followed by construction (13%) and business and property services (10%).
Manufacturing accounted for 5% of GSP in 2015-16.
Agriculture, forestry and fishing accounted for 2% of GSP in 2015-16.
Source: ABS 5220.0 State Accounts.
Industry sectors contribution to real GSP growth: 2015-16 An industry’s contribution to real GSP
growth depends on real changes to its gross value added and its share of GSP.
Mining gross value added rose 7% in 2015-16, and with its large share of GSP, contributed 1.9 percentage points to real GSP growth.
Healthcare and social assistance gross value added rose 5% in 2015-16, contributing 0.2 percentage points to real GSP growth.
Construction gross value added fell 3% in 2015-16, detracting 0.4 percentage points from real GSP growth.
Source: ABS 5220.0 State Accounts.
$3.2b
$3.3b
$5.5b
$5.6b
$4.9b
$7.8b
$8.1b
$10.0b
$12.2b
$12.6b
$13.0b
$14.4b
$19.0b
$24.5b
$31.3b
$54.9b
$0b $20b $40b $60b
Communications
Repairs, maintenance & personal services
Agriculture, forestry & fishing
Electricity, gas, water & waste services
Accommodation, food, arts & recreation
Public administration & safety
Education & training
Finance & insurance
Manufacturing
Transport, postal & warehousing
Healthcare & social assistance
Retail & wholesale trade
Dwelling ownership
Business & property services
Construction
Mining
2014-15
2015-16
-1pp 0pp 1pp 2pp
Construction
Business & property services
Transport, postal & warehousing
Manufacturing
Agriculture, forestry & fishing
Repairs, maintenance & personal services
Accommodation, food, arts & recreation
Retail & wholesale trade
Education & training
Electricity, gas, water & waste services
Communications
Public administration & safety
Dwelling ownership
Finance & insurance
Healthcare & social assistance
Mining
6.1%
3.5%
5.2%
3.3%
2.4%
1.7%
7.0%
5.6%5.6%
3.2%
5.9%
7.0%
5.2%
3.4%
4.2%4.4%
9.1%
5.7%5.8%
3.6%
1.9%
0.3%
3.0%3.3%
3.0%3.0%
0%
2%
4%
6%
8%
10%
1995-96 2000-01 2005-06 2010-11 2015-16 2020-21
Western Australia Australia (GDP)

WA Economic Profile – Sep. 2017
2
THE ECONOMY continued
Gross state income and terms of trade (% change)
Changes in export prices relative to import prices (terms of trade) effects gross state income (GSI) and accounts for the difference between changes in GSI and GSP.
Western Australia’s terms of trade fell 14% in 2015-16. This meant that despite growth in real GSP, Western Australia’s GSI fell 5% in 2015-16, compared with annual average growth of 5% over the past ten years.
The Reserve Bank of Australia’s (RBA) $A commodity price index for Australia fell 11% in 2015-16.
Source: ABS 5220.0 State Accounts.
Commodity prices1 and exchange rate (monthly) The RBA’s monthly $A commodity price index rose 1% in August 2017. The annual index rose 22% in 2016-17.
The monthly average price of iron ore2 rose 12% to US$76 a tonne in August 2017. The annual average price of iron ore2 rose 35% to US$70 a tonne in 2016-17 and is forecast by the WA Budget to be US$67 a tonne in 2017-18 and US$61 a tonne in 2018-19.
The monthly average $A exchange rate fell 1% to US79 cents in August 2017. The annual average $A exchange rate rose 4% to US75 cents in 2016-17 and is forecast by the WA Budget to be US79 cents in 2017-18 and 2018-19.
1 Monthly index of commodity prices for Australia, 2015-16 = 100.0. 2 China spot prices in nominal US dollars (cost and freight). Source: Reserve Bank of Australia, Statistical Tables.
Population growth Western Australia’s population of 2.57 million in 2016 was 11% of Australia’s population.
Population growth of 0.7% (16,835) in 2016 was below annual average growth of 2.1% over the past ten years.
Natural increase (20,626) and net overseas migration (up 12,921) offset falling net interstate migration (down 10,824) in 2016.
The WA Budget forecasts annual average population growth of 1.0% in 2017-18 and 1.2% in 2018-19.
The 2015 WA Tomorrow report forecasts a population of 3.27 million by 2026.
Source: ABS 3101.0 Australian Demographic Statistics.
-20%
-10%
0%
10%
20%
30%
1995-96 2000-01 2005-06 2010-11 2015-16
Gross state income Terms of trade
0 index
100 index
200 index
300 index
US0c
US40c
US80c
US120c
Aug-1997 Aug-2002 Aug-2007 Aug-2012 Aug-2017
$A exchange rate (US cents) $US commodity prices (index)
$A commodity prices (index)
-1%
0%
1%
2%
3%
4%
-25,000
-
25,000
50,000
75,000
100,000
1996 2001 2006 2011 2016
Nature increase Net overseas migration
Net interstate migration Population growth (%)
WA Economic Profile – Sep. 2017
3
LABOUR MARKET
Employment (monthly)
Western Australia’s employment fell by 100 to 1.36 million in August 2017.
Full-time employment fell by 5,700 to 936,200 in August 2017.
Part-time employment rose by 5,600 to 427,200 in August 2017.
Total employment rose 2.5% (32,800) through the year to August 2017, with rising full-time employment (up 4% or 36,500) offsetting falling part-time employment (down 1% or 3,700).
The WA Budget forecasts annual average employment growth of 1.5% in 2017-18 and 2018-19.
Source: ABS 6202.0 Monthly Labour Force.
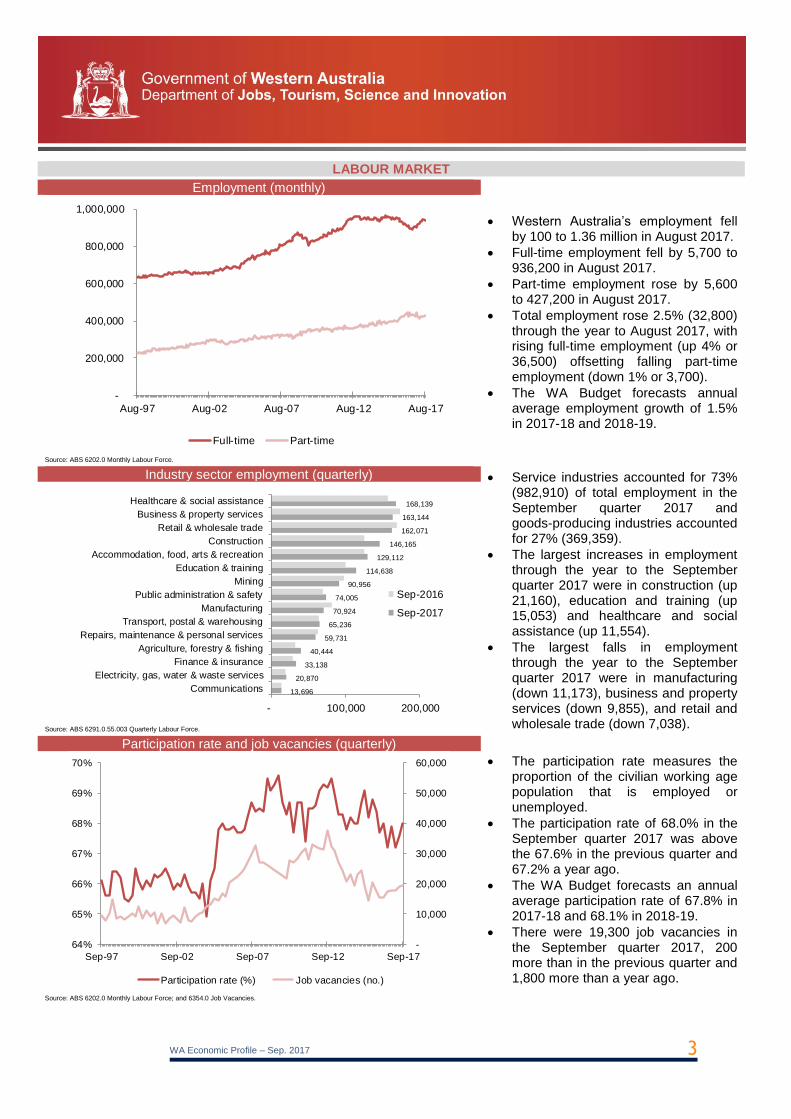
Industry sector employment (quarterly) Service industries accounted for 73% (982,910) of total employment in the September quarter 2017 and goods-producing industries accounted for 27% (369,359).
The largest increases in employment through the year to the September quarter 2017 were in construction (up 21,160), education and training (up 15,053) and healthcare and social assistance (up 11,554).
The largest falls in employment through the year to the September quarter 2017 were in manufacturing (down 11,173), business and property services (down 9,855), and retail and wholesale trade (down 7,038).
Source: ABS 6291.0.55.003 Quarterly Labour Force.
Participation rate and job vacancies (quarterly)
The participation rate measures the proportion of the civilian working age population that is employed or unemployed.
The participation rate of 68.0% in the September quarter 2017 was above the 67.6% in the previous quarter and 67.2% a year ago.
The WA Budget forecasts an annual average participation rate of 67.8% in 2017-18 and 68.1% in 2018-19.
There were 19,300 job vacancies in the September quarter 2017, 200 more than in the previous quarter and 1,800 more than a year ago.
Source: ABS 6202.0 Monthly Labour Force; and 6354.0 Job Vacancies.
-
10,000
20,000
30,000
40,000
50,000
60,000
64%
65%
66%
67%
68%
69%
70%
Sep-97 Sep-02 Sep-07 Sep-12 Sep-17
Participation rate (%) Job vacancies (no.)
-
200,000
400,000
600,000
800,000
1,000,000
Aug-97 Aug-02 Aug-07 Aug-12 Aug-17
Full-time Part-time
13,696
20,870
33,138
40,444
59,731
65,236
70,924
74,005
90,956
114,638
129,112
146,165
162,071
163,144
168,139
- 100,000 200,000
Communications
Electricity, gas, water & waste services
Finance & insurance
Agriculture, forestry & fishing
Repairs, maintenance & personal services
Transport, postal & warehousing
Manufacturing
Public administration & safety
Mining
Education & training
Accommodation, food, arts & recreation
Construction
Retail & wholesale trade
Business & property services
Healthcare & social assistance
Sep-2016
Sep-2017
WA Economic Profile – Sep. 2017
4
LABOUR MARKET continued
Unemployment rate (monthly)
The unemployment rate measures the proportion of the labour force that is unemployed (unemployed people actively looking for work).
Western Australia’s unemployment rate of 5.9% in August 2017 was above the 5.4% in the previous month, but below the 6.3% a year ago.
Australia’s unemployment rate was 5.6% in August 2017.
The WA Budget forecasts an annual average unemployment rate of 6.0% in 2017-18 and 2018-19.
Source: ABS 6202.0 Monthly Labour Force.
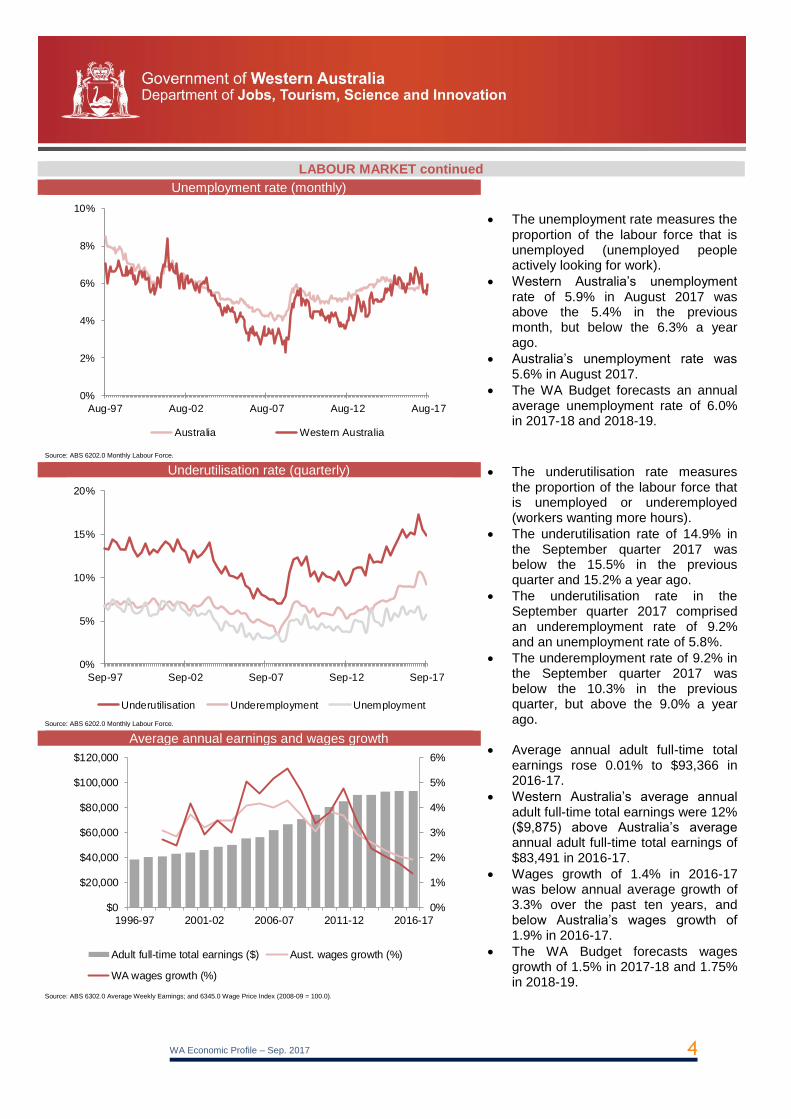
Underutilisation rate (quarterly) The underutilisation rate measures the proportion of the labour force that is unemployed or underemployed (workers wanting more hours).
The underutilisation rate of 14.9% in the September quarter 2017 was below the 15.5% in the previous quarter and 15.2% a year ago.
The underutilisation rate in the September quarter 2017 comprised an underemployment rate of 9.2% and an unemployment rate of 5.8%.
The underemployment rate of 9.2% in the September quarter 2017 was below the 10.3% in the previous quarter, but above the 9.0% a year ago.
Source: ABS 6202.0 Monthly Labour Force.
Average annual earnings and wages growth Average annual adult full-time total
earnings rose 0.01% to $93,366 in 2016-17.
Western Australia’s average annual adult full-time total earnings were 12% ($9,875) above Australia’s average annual adult full-time total earnings of $83,491 in 2016-17.
Wages growth of 1.4% in 2016-17 was below annual average growth of 3.3% over the past ten years, and below Australia’s wages growth of 1.9% in 2016-17.
The WA Budget forecasts wages growth of 1.5% in 2017-18 and 1.75% in 2018-19.
Source: ABS 6302.0 Average Weekly Earnings; and 6345.0 Wage Price Index (2008-09 = 100.0).
0%
1%
2%
3%
4%
5%
6%
$0
$20,000
$40,000
$60,000
$80,000
$100,000
$120,000
1996-97 2001-02 2006-07 2011-12 2016-17
Adult full-time total earnings ($) Aust. wages growth (%)
WA wages growth (%)
0%
2%
4%
6%
8%
10%
Aug-97 Aug-02 Aug-07 Aug-12 Aug-17
Australia Western Australia
0%
5%
10%
15%
20%
Sep-97 Sep-02 Sep-07 Sep-12 Sep-17
Underutilisation Underemployment Unemployment

WA Economic Profile – Sep. 2017
5
CONSUMPTION
Real household consumption (% change)
Western Australia accounted for 10% of Australia’s household consumption in 2016-17.
Household consumption accounted for 43% of GSP in 2015-16 and contributed 0.6 percentage points to real GSP growth.
Real household consumption growth of 1.1% in 2016-17 was below annual average growth of 3.0% over the past ten years.
The WA Budget forecasts real household consumption to rise 1.25% in 2017-18 and 2.25% in 2018-19.
Source: ABS 5220.0 State Accounts; and 5206.0 Quarterly National Accounts.
Household consumption by industry sector (nominal) Nominal household consumption rose
0.6% to $103.8 billion in 2016-17.
The largest increases in household consumption in 2016-17 were in insurance, finance and other (up $701m or 4%), health (up $331m or 5%) and electricity, gas and other fuel (up $211m or 10%).
The largest falls in household consumption in 2016-17 were in rent and other dwelling services (down $551m or 2%), net expenditure interstate (down $356m or 110%) and recreation and culture (down $116m or 1%).
Source: ABS 5220.0 State Accounts; and 5206.0 Quarterly National Accounts.
Gross household disposable income per capita Western Australia’s gross household disposable income per capita of $50,146 in 2015-16 was 6% ($2,877) above Australia’s gross household disposable income per capita of $47,269.
Gross household disposable income per capita fell 4% in 2015-16 (the only fall in 20 years), compared with annual average growth of 5% over the past ten years.
Total gross household disposable income fell by $3.2 billion in 2015-16, due to changes in employee wages (down $2.7 billion), interest and tax on secondary income (up $1.6 billion), self-employed and property income (up $1.0 billion) and social benefits and other secondary income (up $172 million).
Source: ABS 5220.0 State Accounts.
-$20,000
$0
$20,000
$40,000
$60,000
-5%
0%
5%
10%
15%
1995-96 2000-01 2005-06 2010-11 2015-16
Change (%) Level ($)
0%
2%
4%
6%
8%
10%
1996-97 2001-02 2006-07 2011-12 2016-17
$0.0b
$2.3b
$2.3b
$3.1b
$3.4b
$4.5b
$5.1b
$6.4b
$7.4b
$8.5b
$9.6b
$10.9b
$16.5b
$23.8b
-$10b $0b $10b $20b $30b
Net expenditure interstate
Electricity, gas & other fuel
Communications
Clothing & footwear
Alcoholic beverages & tobacco
Furnishings & household equipment
Education services
Hotels, cafes & restaurants
Health
Recreation & culture
Transport
Food
Insurance, finance & other
Rent & other dwelling services
2015-16
2016-17

WA Economic Profile – Sep. 2017
6
INVESTMENT
Investment (nominal) Western Australia accounted for 18% of Australia’s business investment in 2016-17.
Business investment accounted for 22% of GSP in 2015-16, but detracted 4.2 percentage points from real GSP growth.
Real business investment fell 29% in 2016-17 and is forecast by the WA Budget to fall 12% in 2017-18 and 8.5% in 2018-19.
Nominal business investment fell 28% to $37.9 billion in 2016-17.
Nominal dwelling investment fell 24% to $9.7 billion in 2016-17.
Nominal public investment rose 7% to $8.5 billion in 2016-17.
Source: ABS 5220.0 State Accounts; and 5206.0 Quarterly National Accounts.
Private new capital expenditure
Western Australia accounted for 57% of Australia’s mining new capital expenditure in 2016-17.
Mining accounted for 77% of Western Australia’s private new capital expenditure in 2016-17.
Mining new capital expenditure fell 37% to $22.2 billion in 2016-17.
New capital expenditure in other selected industries fell 14% to $6.8 billion in 2016-17.
In March 2017, Western Australia had $100.7 billion of major resource projects under construction or committed and $51.7 billion under consideration.
(a) Excludes agriculture, forestry and fishing; public administration and safety; education and training; healthcare and social assistance; and superannuation funds. Source: ABS 5625.0 Private New Capital Expenditure.
Exploration expenditure
Western Australia accounted for 66% of Australia’s minerals exploration expenditure and 47% of Australia’s petroleum exploration expenditure in 2016-17.
Minerals exploration expenditure rose 18% to $1.0 billion in 2016-17, mainly due to increases in gold exploration.
Petroleum exploration expenditure fell 50% to $651 million in 2016-17.
Source: ABS 8412.0 Mineral and Petroleum Exploration.
$0b
$20b
$40b
$60b
1996-97 2001-02 2006-07 2011-12 2016-17
Mining Other selected industries(a)
$0b
$1b
$2b
$3b
$4b
1996-97 2001-02 2006-07 2011-12 2016-17
Minerals Petroleum
$0b
$20b
$40b
$60b
$80b
1996-97 2001-02 2006-07 2011-12 2016-17
Business Dwelling Public

WA Economic Profile – Sep. 2017
7
PROPERTY MARKET AND CONSTRUCTION ACTIVITY
Median established house prices and rents (quarterly) Perth’s median established house price fell 3% to $500,000 in the June quarter 2017. It fell 5% through the year to the June quarter 2017, compared with annual average growth of 1% over the past ten years.
The rest of Western Australia’s (excluding Perth) median established house price fell 6% to $325,000 in the June quarter 2017. It fell 4% through the year to the June quarter 2017, compared with annual average decline of 1% over the past ten years.
Perth rents fell 2% in the June quarter 2017 and 8% through the year to the June quarter 2017, compared with annual average growth of 3% over the past ten years.
Source: ABS 6416.0 Residential Property Price Indexes; and 6401.0 Consumer Price Index (2011-12 = 100.0).
Building and engineering construction activity Residential building activity fell 20% to
$7.7 billion in 2016, compared with annual average growth of 3% over the past ten years.
Non-residential building activity fell 12% to $4.5 billion in 2016, compared with annual average growth of 7% over the past ten years.
Heavy engineering construction activity fell 35% to $19.2 billion in 2016, compared with annual average growth of 9% over the past ten years.
All other engineering construction activity fell 46% to $6.7 billion in 2016, compared with annual average growth of 1% over the past ten years.
Source: ABS 8752.0 Building Activity; and 8762.0 Engineering Construction Activity.
Building construction activity outlook (quarterly) Western Australia had $6.6 billion of
building activity in the pipeline in the March quarter 2017.
Approvals rose for residential (up 10% to $1.5 billion) and non-residential (up 27% to $1.3 billion) building in the June quarter 2017. Residential building approvals typically lead building activity by one to two quarters.
Housing finance for the construction of new dwellings rose 29% to $1.0 billion in the June quarter 2017. Housing finance typically leads residential building activity by two to three quarters.
Source: ABS 8731.0 Building Approvals; and 5609.0 Housing Finance.
$0b
$20b
$40b
$60b
1996 2001 2006 2011 2016
Residential Non-residential Heavy industry Other engineering
$0b
$1b
$2b
$3b
$4b
Jun-07 Jun-09 Jun-11 Jun-13 Jun-15 Jun-17
Residential approvals Non-residential approvals
House construction finance
60 index
80 index
100 index
120 index
$300,000
$400,000
$500,000
$600,000
Jun-07 Jun-09 Jun-11 Jun-13 Jun-15 Jun-17
Perth ($) Rest of Western Australia ($) Perth rents index
WA Economic Profile – Sep. 2017
8
MERCHANDISE EXPORTS
Merchandise exports (nominal) Western Australia accounted for 42%
of Australia’s merchandise exports in 2016-17.
Merchandise exports accounted for 43% of GSP in 2015-16 and contributed 2.8 percentage points to real GSP growth.
Real merchandise exports growth of 7% in 2016-17 was above annual average of growth of 6% over the past ten years.
The WA Budget forecasts real merchandise exports growth of 7.5% in 2017-18 and 5% in 2018-19.
Nominal merchandise exports rose 21% to $120.8 billion in 2016-17.
Source: ABS 5368.0 International Trade in Goods and Services; 5220.0 State Accounts; and 5206.0 Quarterly National Accounts.
Major export markets (top 10)
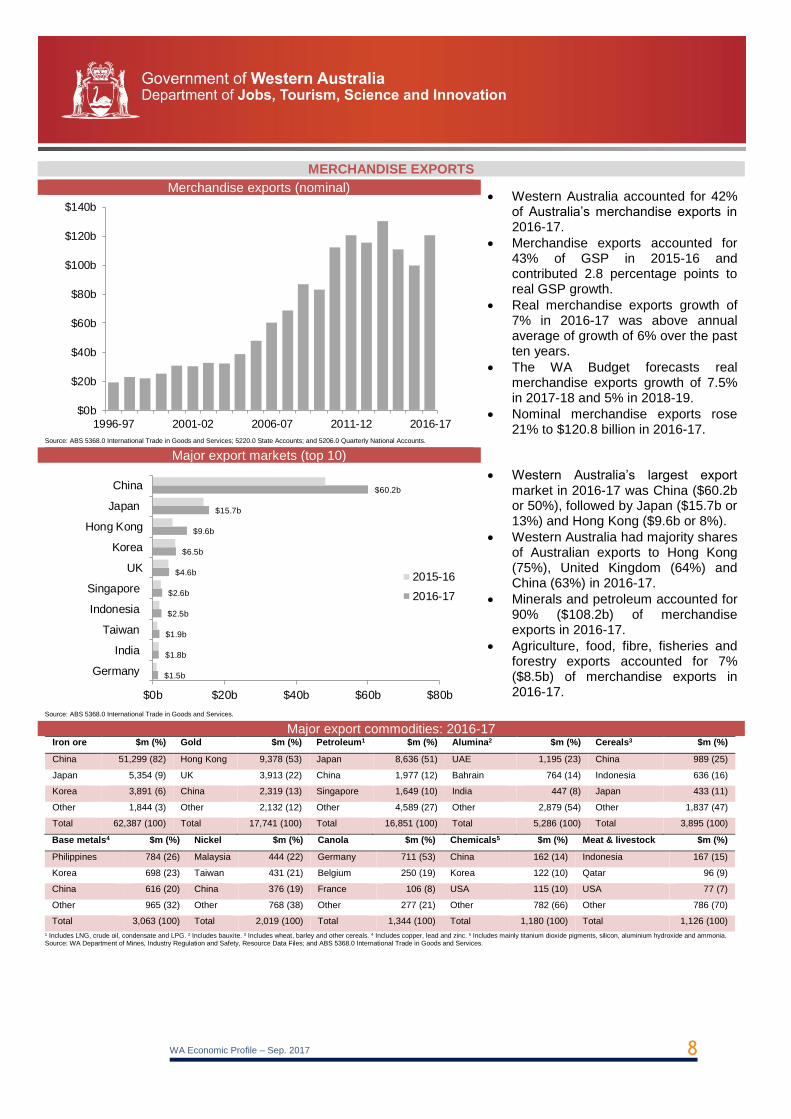
Western Australia’s largest export market in 2016-17 was China ($60.2b or 50%), followed by Japan ($15.7b or 13%) and Hong Kong ($9.6b or 8%).
Western Australia had majority shares of Australian exports to Hong Kong (75%), United Kingdom (64%) and China (63%) in 2016-17.
Minerals and petroleum accounted for 90% ($108.2b) of merchandise exports in 2016-17.
Agriculture, food, fibre, fisheries and forestry exports accounted for 7% ($8.5b) of merchandise exports in 2016-17.
Source: ABS 5368.0 International Trade in Goods and Services.
Major export commodities: 2016-17 Iron ore $m (%) Gold $m (%) Petroleum1 $m (%) Alumina2 $m (%) Cereals3 $m (%)
China 51,299 (82) Hong Kong 9,378 (53) Japan 8,636 (51) UAE 1,195 (23) China 989 (25)
Japan 5,354 (9) UK 3,913 (22) China 1,977 (12) Bahrain 764 (14) Indonesia 636 (16)
Korea 3,891 (6) China 2,319 (13) Singapore 1,649 (10) India 447 (8) Japan 433 (11)
Other 1,844 (3) Other 2,132 (12) Other 4,589 (27) Other 2,879 (54) Other 1,837 (47)
Total 62,387 (100) Total 17,741 (100) Total 16,851 (100) Total 5,286 (100) Total 3,895 (100)
Base metals4 $m (%) Nickel $m (%) Canola $m (%) Chemicals5 $m (%) Meat & livestock $m (%)
Philippines 784 (26) Malaysia 444 (22) Germany 711 (53) China 162 (14) Indonesia 167 (15)
Korea 698 (23) Taiwan 431 (21) Belgium 250 (19) Korea 122 (10) Qatar 96 (9)
China 616 (20) China 376 (19) France 106 (8) USA 115 (10) USA 77 (7)
Other 965 (32) Other 768 (38) Other 277 (21) Other 782 (66) Other 786 (70)
Total 3,063 (100) Total 2,019 (100) Total 1,344 (100) Total 1,180 (100) Total 1,126 (100)
1 Includes LNG, crude oil, condensate and LPG. 2 Includes bauxite. 3 Includes wheat, barley and other cereals. 4 Includes copper, lead and zinc. 5 Includes mainly titanium dioxide pigments, silicon, aluminium hydroxide and ammonia. Source: WA Department of Mines, Industry Regulation and Safety, Resource Data Files; and ABS 5368.0 International Trade in Goods and Services.
$0b
$20b
$40b
$60b
$80b
$100b
$120b
$140b
1996-97 2001-02 2006-07 2011-12 2016-17
$1.5b
$1.8b
$1.9b
$2.5b
$2.6b
$4.6b
$6.5b
$9.6b
$15.7b
$60.2b
$0b $20b $40b $60b $80b
Germany
India
Taiwan
Indonesia
Singapore
UK
Korea
Hong Kong
Japan
China
2015-16
2016-17
WA Economic Profile – Sep. 2017
9
SERVICES EXPORTS
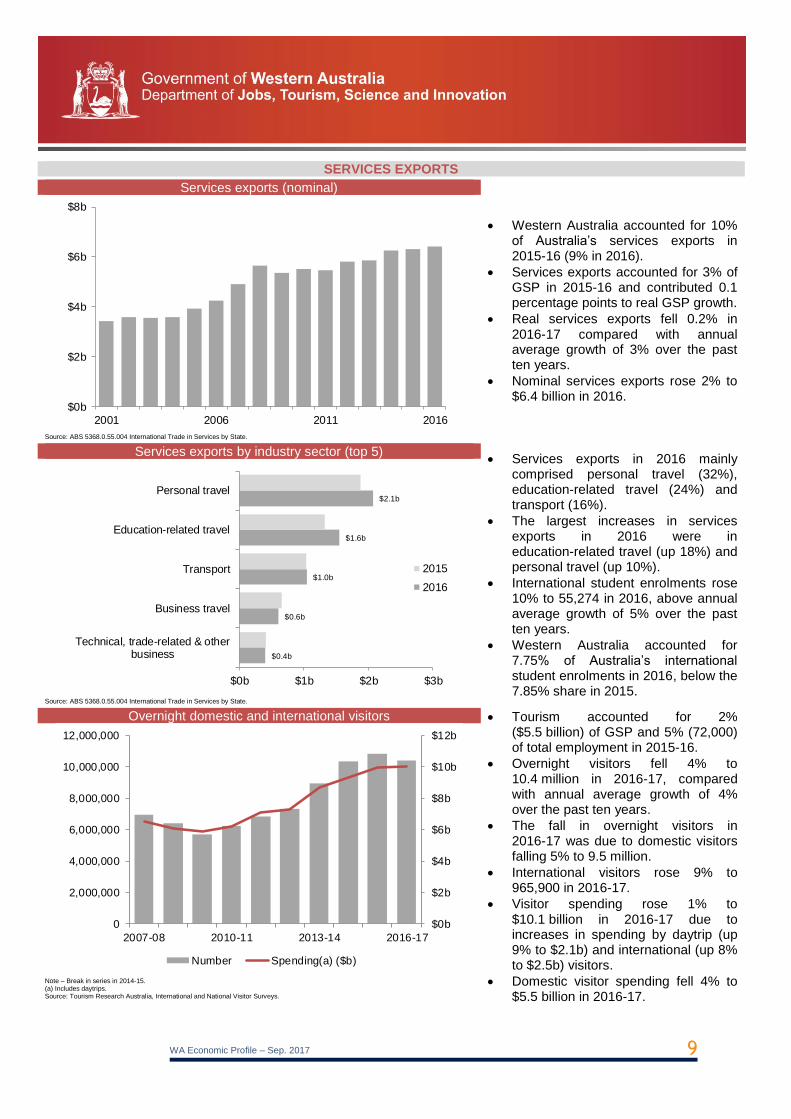
Services exports (nominal)
Western Australia accounted for 10% of Australia’s services exports in 2015-16 (9% in 2016).
Services exports accounted for 3% of GSP in 2015-16 and contributed 0.1 percentage points to real GSP growth.
Real services exports fell 0.2% in 2016-17 compared with annual average growth of 3% over the past ten years.
Nominal services exports rose 2% to $6.4 billion in 2016.
Source: ABS 5368.0.55.004 International Trade in Services by State.
Services exports by industry sector (top 5) Services exports in 2016 mainly
comprised personal travel (32%), education-related travel (24%) and transport (16%).
The largest increases in services exports in 2016 were in education-related travel (up 18%) and personal travel (up 10%).
International student enrolments rose 10% to 55,274 in 2016, above annual average growth of 5% over the past ten years.
Western Australia accounted for 7.75% of Australia’s international student enrolments in 2016, below the 7.85% share in 2015.
Source: ABS 5368.0.55.004 International Trade in Services by State.
Overnight domestic and international visitors Tourism accounted for 2% ($5.5 billion) of GSP and 5% (72,000) of total employment in 2015-16.
Overnight visitors fell 4% to 10.4 million in 2016-17, compared with annual average growth of 4% over the past ten years.
The fall in overnight visitors in 2016-17 was due to domestic visitors falling 5% to 9.5 million.
International visitors rose 9% to 965,900 in 2016-17.
Visitor spending rose 1% to $10.1 billion in 2016-17 due to increases in spending by daytrip (up 9% to $2.1b) and international (up 8% to $2.5b) visitors.
Domestic visitor spending fell 4% to $5.5 billion in 2016-17.
Note – Break in series in 2014-15. (a) Includes daytrips. Source: Tourism Research Australia, International and National Visitor Surveys.
$0b
$2b
$4b
$6b
$8b
2001 2006 2011 2016
$0.4b
$0.6b
$1.0b
$1.6b
$2.1b
$0b $1b $2b $3b
Technical, trade-related & otherbusiness
Business travel
Transport
Education-related travel
Personal travel
2015
2016
$0b
$2b
$4b
$6b
$8b
$10b
$12b
0
2,000,000
4,000,000
6,000,000
8,000,000
10,000,000
12,000,000
2007-08 2010-11 2013-14 2016-17
Number Spending(a) ($b)

WA Economic Profile – Sep. 2017
10
MINING
Western Australia’s share of Australian and world mining production: 2016 Unit World % share Aust. % share WA Australia World
Rutile ‘000 tonnes 41 88 307 350 743 Iron ore million tonnes 38 99 769 781 2,036 Garnet ‘000 tonnes 34 100 575 575 1,700 Rare earths ‘000 tonnes 13 100 17 17 126 Alumina million tonnes 12 67 14 21 115 Illmenite ‘000 tonnes 11 90 648 720 5,860 LNG million tonnes 9 53 24 45 264 Zircon ‘000 tonnes 8 22 123 550 1,460 Diamonds million carats 8 100 10 10 127 Nickel ‘000 tonnes 7 100 166 166 2,250 Gold tonnes 6 68 196 287 3,236
Source: WA Department of Mines, Industry Regulation and Safety, Resource Data Files; International Group of Liquefied Natural Gas Importers, The LNG Industry 2017; and EnergyQuest Quarterly.
Mining gross value added (nominal) Western Australia is the main
minerals and petroleum exporting region of Australia and produces a significant proportion of the world’s minerals and petroleum commodities.
Western Australia accounted for 55% of Australia’s mining gross value added in 2015-16, below its 60% share in 2014-15 and 63% share in 2013-14.
Mining accounted for 23% of GSP in 2015-16, below its 26% share in 2014-15 and 35% share in 2010-11.
Nominal mining gross value added fell 15% to $54.9 billion in 2015-16, compared with annual average growth of 7% over the past ten years.
Source: ABS 5220.0 State Accounts.
Major minerals and petroleum sales
Iron ore accounted for 61% of minerals and petroleum sales in 2016-17, followed by:
LNG (12%)
Gold (10%)
Alumina and bauxite (5%)
Crude oil and condensate (4%)
Nickel (2%)
Base metals (1%)
Mineral sands (1%)
Minerals and petroleum sales rose 19% to $105.0 billion in 2016-17, mainly due to increased sales of iron ore, LNG and gold.
(a) Includes copper, lead and zinc. (b) Includes garnet, illmenite, leucoxene, zircon and rutile. Source: WA Department of Mines, Industry Regulation and Safety, Resource Data Files.
0%
20%
40%
60%
80%
100%
$0b
$20b
$40b
$60b
$80b
$100b
1995-96 2000-01 2005-06 2010-11 2015-16
Gross value added Mining share of GSP (%)
WA share of Aust. mining (%)
$0.6b
$1.4b
$2.1b
$4.3b
$5.1b
$10.8b
$12.7b
$63.7b
$0b $20b $40b $60b $80b
Mineral sands(b)
Base metals(a)
Nickel
Crude oil & condensate
Alumina & bauxite
Gold
LNG
Iron ore
2015-16
2016-17

WA Economic Profile – Sep. 2017
11
MINING continued
Iron ore sales Western Australia accounted for 53%
of world seaborne exports in 2016.
Iron ore sales rose 31% to $63.7 billion in 2016-17, due to rising sales volumes and average prices.
The volume of iron ore sales rose 6% to 790 million tonnes in 2016-17, below annual average growth of 12% over the past ten years.
The annual average $A unit price (free on board) of iron ore sales rose 24% in 2016-17.
The WA Budget forecasts iron ore sales to rise from 795 million tonnes in 2016-17 to 835 million tonnes in 2020-21.
Source: WA Department of Mines, Industry Regulation and Safety, Resource Data Files (2006-07 = 100.0).
LNG sales
Western Australia accounted for 9% of world LNG exports in 2016.
LNG sales rose 18% to $12.7 billion in 2016-17, due to rising sales volumes offsetting falling average prices.
The volume of LNG sales rose 37% to 29 million tonnes in 2016-17, above annual average growth of 9% over the past ten years.
The annual average $A unit price (free on board) of LNG sales fell 14% in 2016-17.
Western Australia’s LNG production capacity will grow to 50 million tonnes a year by 2017-18.
Source: WA Department of Mines, Industry Regulation and Safety, Resource Data Files (2006-07 = 100.0).
Gold sales
Western Australia’s gold sales rose 7% to $10.8 billion in 2016-17, due to rising sales volumes and average prices.
The volume of gold sales rose 4% to 205 tonnes in 2016-17, above annual average growth of 3% over the past ten years.
The annual average $A unit price (free on board) of gold sales rose 3% in 2016-17.
Source: WA Department of Mines, Industry Regulation and Safety, Resource Data Files (2006-07 = 100.0).
0 index
100 index
200 index
300 index
400 index
$0b
$20b
$40b
$60b
$80b
1996-97 2001-02 2006-07 2011-12 2016-17
Value Volume index Price index
0 index
100 index
200 index
300 index
$0b
$5b
$10b
$15b
1996-97 2001-02 2006-07 2011-12 2016-17
Value Volume index Price index
0 index
60 index
120 index
180 index
240 index
$0b
$3b
$6b
$9b
$12b
1996-97 2001-02 2006-07 2011-12 2016-17
Value Volume index Price index
WA Economic Profile – Sep. 2017
12
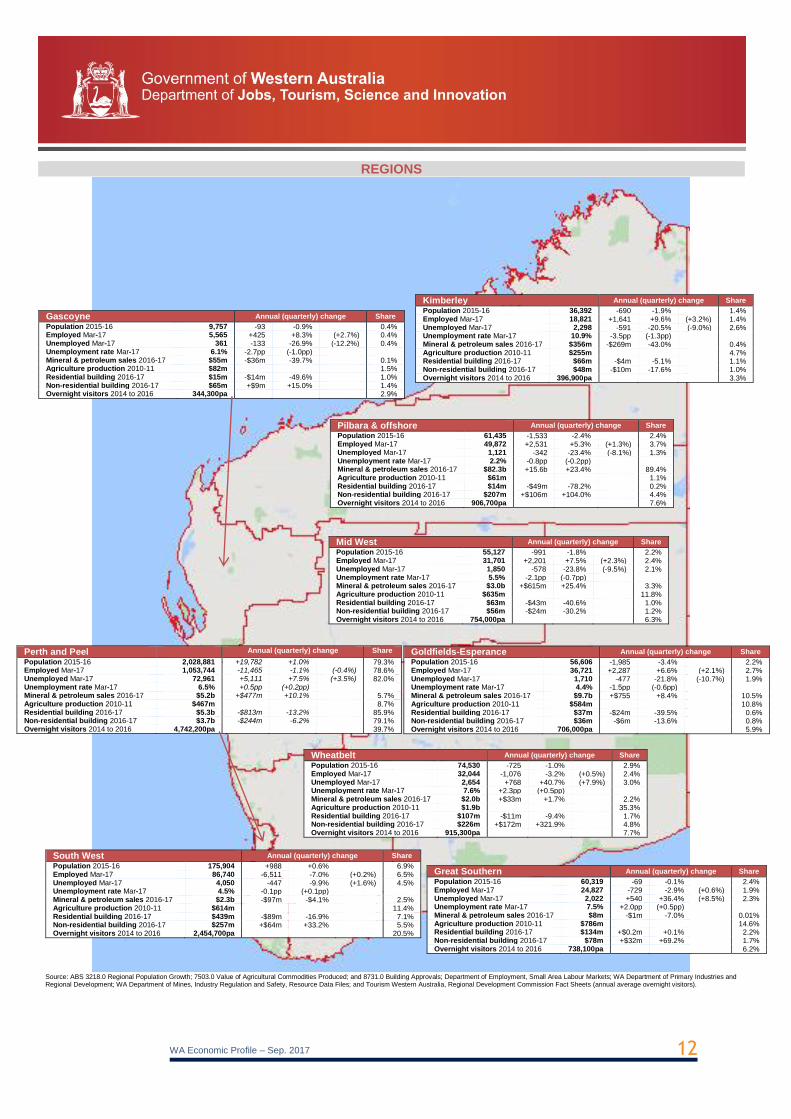
REGIONS
Source: ABS 3218.0 Regional Population Growth; 7503.0 Value of Agricultural Commodities Produced; and 8731.0 Building Approvals; Department of Employment, Small Area Labour Markets; WA Department of Primary Industries and Regional Development; WA Department of Mines, Industry Regulation and Safety, Resource Data Files; and Tourism Western Australia, Regional Development Commission Fact Sheets (annual average overnight visitors).
Kimberley Annual (quarterly) change Share
Population 2015-16 36,392 -690 -1.9% 1.4% Employed Mar-17 18,821 +1,641 +9.6% (+3.2%) 1.4% Unemployed Mar-17 2,298 -591 -20.5% (-9.0%) 2.6% Unemployment rate Mar-17 10.9% -3.5pp (-1.3pp) Mineral & petroleum sales 2016-17 $356m -$269m -43.0% 0.4% Agriculture production 2010-11 $255m 4.7% Residential building 2016-17 $66m -$4m -5.1% 1.1% Non-residential building 2016-17 $48m -$10m -17.6% 1.0% Overnight visitors 2014 to 2016 396,900pa 3.3%
Pilbara & offshore Annual (quarterly) change Share
Population 2015-16 61,435 -1,533 -2.4% 2.4% Employed Mar-17 49,872 +2,531 +5.3% (+1.3%) 3.7% Unemployed Mar-17 1,121 -342 -23.4% (-8.1%) 1.3% Unemployment rate Mar-17 2.2% -0.8pp (-0.2pp) Mineral & petroleum sales 2016-17 $82.3b +15.6b +23.4% 89.4% Agriculture production 2010-11 $61m 1.1% Residential building 2016-17 $14m -$49m -78.2% 0.2% Non-residential building 2016-17 $207m +$106m +104.0% 4.4% Overnight visitors 2014 to 2016 906,700pa 7.6%
Gascoyne Annual (quarterly) change Share
Population 2015-16 9,757 -93 -0.9% 0.4% Employed Mar-17 5,565 +425 +8.3% (+2.7%) 0.4% Unemployed Mar-17 361 -133 -26.9% (-12.2%) 0.4% Unemployment rate Mar-17 6.1% -2.7pp (-1.0pp) Mineral & petroleum sales 2016-17 $55m -$36m -39.7% 0.1% Agriculture production 2010-11 $82m 1.5% Residential building 2016-17 $15m -$14m -49.6% 1.0% Non-residential building 2016-17 $65m +$9m +15.0% 1.4% Overnight visitors 2014 to 2016 344,300pa 2.9%
Mid West Annual (quarterly) change Share
Population 2015-16 55,127 -991 -1.8% 2.2% Employed Mar-17 31,701 +2,201 +7.5% (+2.3%) 2.4% Unemployed Mar-17 1,850 -578 -23.8% (-9.5%) 2.1% Unemployment rate Mar-17 5.5% -2.1pp (-0.7pp) Mineral & petroleum sales 2016-17 $3.0b +$615m +25.4% 3.3% Agriculture production 2010-11 $635m 11.8% Residential building 2016-17 $63m -$43m -40.6% 1.0% Non-residential building 2016-17 $56m -$24m -30.2% 1.2% Overnight visitors 2014 to 2016 754,000pa 6.3%
Goldfields-Esperance Annual (quarterly) change Share
Population 2015-16 56,606 -1,985 -3.4% 2.2% Employed Mar-17 36,721 +2,287 +6.6% (+2.1%) 2.7% Unemployed Mar-17 1,710 -477 -21.8% (-10.7%) 1.9% Unemployment rate Mar-17 4.4% -1.5pp (-0.6pp) Mineral & petroleum sales 2016-17 $9.7b +$755 +8.4% 10.5% Agriculture production 2010-11 $584m 10.8% Residential building 2016-17 $37m -$24m -39.5% 0.6% Non-residential building 2016-17 $36m -$6m -13.6% 0.8% Overnight visitors 2014 to 2016 706,000pa 5.9%
Wheatbelt Annual (quarterly) change Share
Population 2015-16 74,530 -725 -1.0% 2.9% Employed Mar-17 32,044 -1,076 -3.2% (+0.5%) 2.4% Unemployed Mar-17 2,654 +768 +40.7% (+7.9%) 3.0% Unemployment rate Mar-17 7.6% +2.3pp (+0.5pp) Mineral & petroleum sales 2016-17 $2.0b +$33m +1.7% 2.2% Agriculture production 2010-11 $1.9b 35.3% Residential building 2016-17 $107m -$11m -9.4% 1.7% Non-residential building 2016-17 $226m +$172m +321.9% 4.8% Overnight visitors 2014 to 2016 915,300pa 7.7%
South West Annual (quarterly) change Share
Population 2015-16 175,904 +988 +0.6% 6.9% Employed Mar-17 86,740 -6,511 -7.0% (+0.2%) 6.5% Unemployed Mar-17 4,050 -447 -9.9% (+1.6%) 4.5% Unemployment rate Mar-17 4.5% -0.1pp (+0.1pp) Mineral & petroleum sales 2016-17 $2.3b -$97m -$4.1% 2.5% Agriculture production 2010-11 $614m 11.4% Residential building 2016-17 $439m -$89m -16.9% 7.1% Non-residential building 2016-17 $257m +$64m +33.2% 5.5% Overnight visitors 2014 to 2016 2,454,700pa 20.5%
Great Southern Annual (quarterly) change Share
Population 2015-16 60,319 -69 -0.1% 2.4% Employed Mar-17 24,827 -729 -2.9% (+0.6%) 1.9% Unemployed Mar-17 2,022 +540 +36.4% (+8.5%) 2.3% Unemployment rate Mar-17 7.5% +2.0pp (+0.5pp) Mineral & petroleum sales 2016-17 $8m -$1m -7.0% 0.01% Agriculture production 2010-11 $786m 14.6% Residential building 2016-17 $134m +$0.2m +0.1% 2.2% Non-residential building 2016-17 $78m +$32m +69.2% 1.7% Overnight visitors 2014 to 2016 738,100pa 6.2%
Perth and Peel Annual (quarterly) change Share
Population 2015-16 2,028,881 +19,782 +1.0% 79.3% Employed Mar-17 1,053,744 -11,465 -1.1% (-0.4%) 78.6% Unemployed Mar-17 72,961 +5,111 +7.5% (+3.5%) 82.0% Unemployment rate Mar-17 6.5% +0.5pp (+0.2pp) Mineral & petroleum sales 2016-17 $5.2b +$477m +10.1% 5.7% Agriculture production 2010-11 $467m 8.7% Residential building 2016-17 $5.3b -$813m -13.2% 85.9% Non-residential building 2016-17 $3.7b -$244m -6.2% 79.1% Overnight visitors 2014 to 2016 4,742,200pa 39.7%