2014 · 2014 annual utah farm business management ... (grass, oat hay) – owned and cash rented...
TRANSCRIPT

2014
Utah College’s Farm/Ranch
Management
Jay Olsen & Kendra Sagers: Snow College, Ephraim & Richfield Al Dustin & Kathryn Rawson: Bridgerland Applied Technology College, Logan David Gillman: Uintah Basin Applied Technology College, Roosevelt
This report was developed using FINPACK and RANKEM software
developed by the
Center for Farm Financial Management at the University of Minnesota.
Additional farm financial reports can be queried from the Center for Farm
Financial Management FINBIN website.
www.finbin.umn.edu
This Utah report and past years reports can be found online at
www.snow.edu/farm/ click on Annual Reports
2014 Annual Utah Farm Business Management Program Report
Table of Contents
Table of Contents ………………………………………………... 3
Introduction ……………………………………………………… 4
Program Service in State (Figure 1) …………………………….. 5
Prices/Values used in report …………………………………….. 6
Summary of Whole Farm Trends (2002- 2013) ………………… 7-8
Money Spent By the Average Utah Farm ………………………. 9
Whole Farm Report Explanation ……………………………….. 10
Overview of Farm Financial Statements ……..……………….….. 11-12
Farm Income Statement (Income) ……………………………….. 13
Farm Income Statement (Expenses) …….……………………….. 14
Inventory Changes ……………………………………………….. 15
Depreciation …………………………………..……………………. 16
Profitability Measures …………………………………………… 17
Liquidity & Repayment Capacity Measures ……….…………….. 18
Balance Sheet (Cost Values) ….………………………………….. 19
Balance Sheet (Market Values) …..………………………………. 20
Statement of Cash Flows ………………………………………… 21
Crop Production and Marketing Summary ……………………….. 22
Explanation Financial Standards Measures .……………..………... 23-25
Financial Standards Measures ………………………………….…. 26
Operator and Labor Information ……………….…………………. 27
Household and Personal Expenses ………………………………... 28
Non-Farm Summary ……………………………………………… 29
Financial Summary ………………………………………………... 30
Summary Farm Income Statement ……………………………….. 31
Crop Enterprise
Explanation of Individual Crop Enterprise Analysis …………… 32
Barley – Owned ………………….….………….…………………… 33
Corn – Owned & Cash Rented ..…………………………….……... 34-35
Corn Silage – Owned ....…………………....…..…………………… 36
Alfalfa Hay – Owned and Cash Rented …………………….…….. 37-38
Mixed Hay (grass, oat hay) – Owned and Cash Rented …………... 39-40
Pasture (established) – Owned and Rented ……………………… .. 41-42
Livestock Enterprise
Explanation of Individual Livestock Enterprise Analysis …….… 43
Beef, Background Beef, Av. per Cwt & per Head ………………… 44-45
Beef Cow-Calf, Average per Cwt & per Cow ……………………. 46-47
Beef Replacement Heifer, Ave. per Head .....................……………... 48
Dairy – Average per Cwt. of Milk ………………………………… 49
Dairy – Average per Cow …………………………………………. 50
Dairy & Replacement Heifers – Ave. per Cwt. of Milk …………….. 51
Dairy & Replacement Heifers – Ave. per Cow ……………………… 52
Dairy Replacement Heifers – Ave. per Head ……….……………….. 53
3
INTRODUCTION Farm Business Management Education has been a part of Utah’s Adult Agriculture education since 1984
offered through Applied Technology Centers, now Applied Technology Colleges. The purpose of farm
management education is to help farm families achieve their farm business and family goals. This is done
through improved management, organization and efficiency of their farm operations. To accomplish this
purpose farm families enroll in specific year-long farm business management courses. Each course has
specific goals and objectives, courses are offered in sequence. Instruction occurs monthly at the farm
with the farm family using the each farm’s financial and production information to teach farm
management.
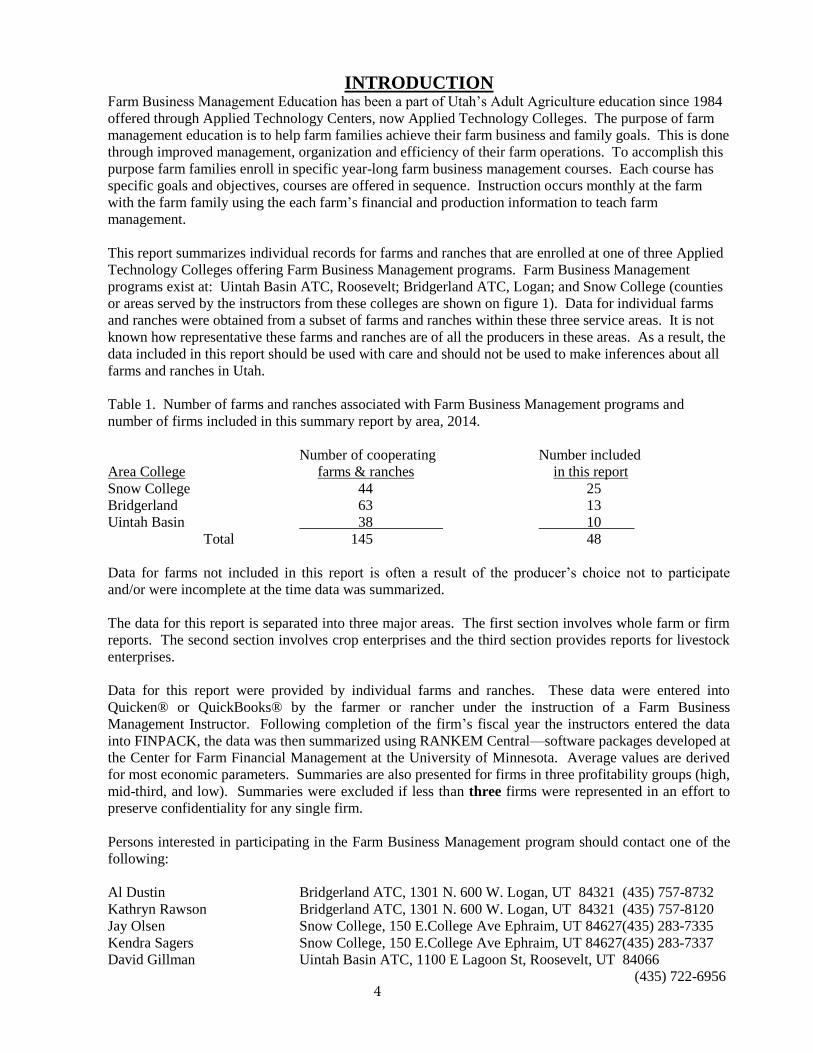
This report summarizes individual records for farms and ranches that are enrolled at one of three Applied
Technology Colleges offering Farm Business Management programs. Farm Business Management
programs exist at: Uintah Basin ATC, Roosevelt; Bridgerland ATC, Logan; and Snow College (counties
or areas served by the instructors from these colleges are shown on figure 1). Data for individual farms
and ranches were obtained from a subset of farms and ranches within these three service areas. It is not
known how representative these farms and ranches are of all the producers in these areas. As a result, the
data included in this report should be used with care and should not be used to make inferences about all
farms and ranches in Utah.
Table 1. Number of farms and ranches associated with Farm Business Management programs and
number of firms included in this summary report by area, 2014.
Number of cooperating Number included
Area College farms & ranches in this report
Snow College 44 25
Bridgerland 63 13
Uintah Basin 38 10
Total 145 48
Data for farms not included in this report is often a result of the producer’s choice not to participate
and/or were incomplete at the time data was summarized.
The data for this report is separated into three major areas. The first section involves whole farm or firm
reports. The second section involves crop enterprises and the third section provides reports for livestock
enterprises.
Data for this report were provided by individual farms and ranches. These data were entered into
Quicken® or QuickBooks® by the farmer or rancher under the instruction of a Farm Business
Management Instructor. Following completion of the firm’s fiscal year the instructors entered the data
into FINPACK, the data was then summarized using RANKEM Central—software packages developed at
the Center for Farm Financial Management at the University of Minnesota. Average values are derived
for most economic parameters. Summaries are also presented for firms in three profitability groups (high,
mid-third, and low). Summaries were excluded if less than three firms were represented in an effort to
preserve confidentiality for any single firm.
Persons interested in participating in the Farm Business Management program should contact one of the
following:
Al Dustin Bridgerland ATC, 1301 N. 600 W. Logan, UT 84321 (435) 757-8732
Kathryn Rawson Bridgerland ATC, 1301 N. 600 W. Logan, UT 84321 (435) 757-8120
Jay Olsen Snow College, 150 E.College Ave Ephraim, UT 84627(435) 283-7335
Kendra Sagers Snow College, 150 E.College Ave Ephraim, UT 84627(435) 283-7337
David Gillman Uintah Basin ATC, 1100 E Lagoon St, Roosevelt, UT 84066
(435) 722-6956 4
Figure 1.
Snow College
Uintah Basin ATC
Bridgerland ATC
5
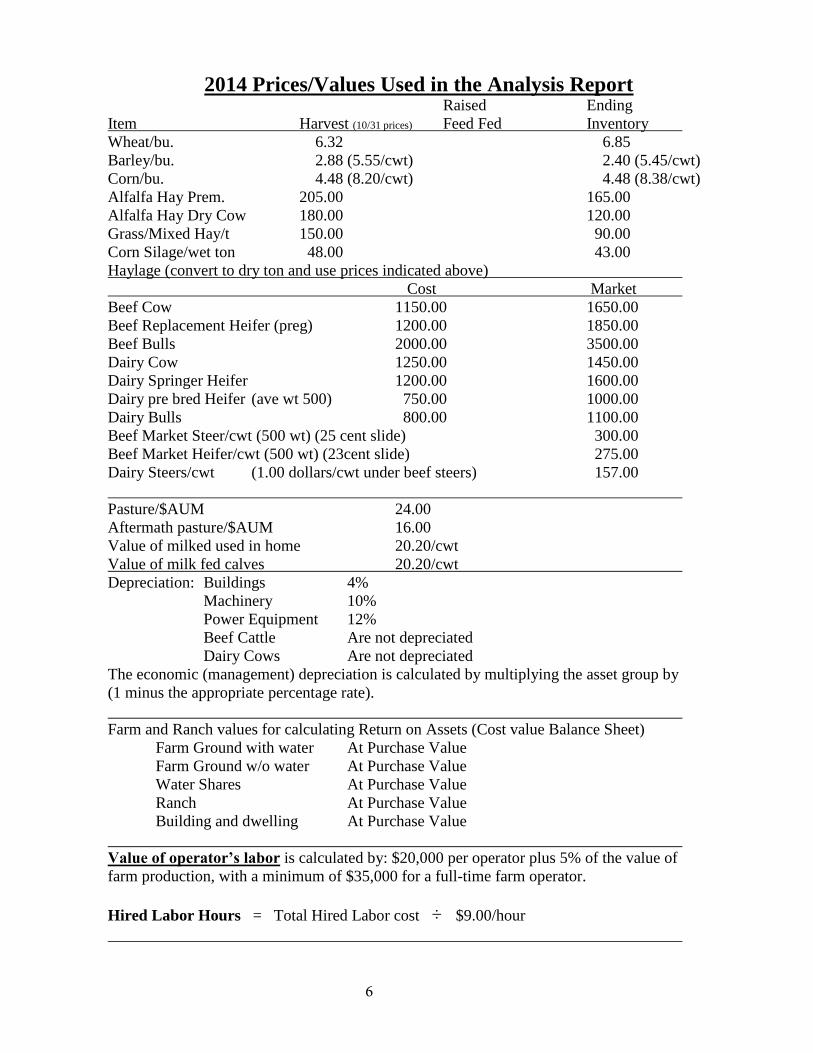
2014 Prices/Values Used in the Analysis Report Raised Ending
Item Harvest (10/31 prices) Feed Fed Inventory
Wheat/bu. 6.32 6.85
Barley/bu. 2.88 (5.55/cwt) 2.40 (5.45/cwt)
Corn/bu. 4.48 (8.20/cwt) 4.48 (8.38/cwt)
Alfalfa Hay Prem. 205.00 165.00
Alfalfa Hay Dry Cow 180.00 120.00
Grass/Mixed Hay/t 150.00 90.00
Corn Silage/wet ton 48.00 43.00
Haylage (convert to dry ton and use prices indicated above)
Cost Market
Beef Cow 1150.00 1650.00
Beef Replacement Heifer (preg) 1200.00 1850.00
Beef Bulls 2000.00 3500.00
Dairy Cow 1250.00 1450.00
Dairy Springer Heifer 1200.00 1600.00
Dairy pre bred Heifer (ave wt 500) 750.00 1000.00
Dairy Bulls 800.00 1100.00
Beef Market Steer/cwt (500 wt) (25 cent slide) 300.00
Beef Market Heifer/cwt (500 wt) (23cent slide) 275.00
Dairy Steers/cwt (1.00 dollars/cwt under beef steers) 157.00
Pasture/$AUM 24.00
Aftermath pasture/$AUM 16.00
Value of milked used in home 20.20/cwt
Value of milk fed calves 20.20/cwt
Depreciation: Buildings 4%
Machinery 10%
Power Equipment 12%
Beef Cattle Are not depreciated
Dairy Cows Are not depreciated
The economic (management) depreciation is calculated by multiplying the asset group by
(1 minus the appropriate percentage rate).
Farm and Ranch values for calculating Return on Assets (Cost value Balance Sheet)
Farm Ground with water At Purchase Value
Farm Ground w/o water At Purchase Value
Water Shares At Purchase Value
Ranch At Purchase Value
Building and dwelling At Purchase Value
Value of operator’s labor is calculated by: $20,000 per operator plus 5% of the value of
farm production, with a minimum of $35,000 for a full-time farm operator.
Hired Labor Hours = Total Hired Labor cost ÷ $9.00/hour
6

Su
mm
ary
of
Wh
ole
Fa
rm A
na
lys
is b
y Y
ea
rs
Uta
h F
arm
Bu
sin
es
s M
an
ag
em
en
t P
rog
ram
Pa
rtic
ipa
nts
20
05
20
06
20
07
20
08
20
09
20
10
20
11
20
12
20
13
20
14
Nu
mb
er
of
Fa
rms
51
40
46
47
41
56
44
49
37
48
Fa
rm I
nc
om
e S
tate
me
nt
Gro
ss C
ash
Fa
rm In
co
me
51
3,3
18
$
50
7,8
74
$
61
2,2
63
$
6
18
,29
2$
53
5,3
68
$
51
8,5
69
$
1
,11
5,2
66
$
1,3
34
,69
4$
1,8
31
,11
0$
1,5
37
,53
4$
To
tal C
ash
Fa
rm E
xp
en
se
45
2,0
46
$
47
3,4
50
$
50
6,3
41
$
5
69
,76
3$
51
8,8
94
$
44
4,5
09
$
9
86
,70
9$
1,2
09
,96
1$
1,7
04
,89
4$
1,2
33
,70
8$
Inve
nto
ry C
ha
ng
e4
8,2
20
$
6,4
46
$
20
,60
8$
10
,09
0$
(35
,05
4)
$
2
1,7
07
$
8
8,1
73
$
2
13
,74
7$
36
,54
7$
2
18
,44
2$
De
pr.
& C
ap
ita
l A
dj.
(37
,27
2)
$
(29
,43
6)
$
1
,08
7$
(24
,01
4)
$
(3
1,1
37
)$
(23
,17
6)
$
(2
7,5
30
)$
(3
5,4
53
)$
7
,74
5$
(5
5,5
38
)$
Ne
t F
arm
In
co
me
(a
ccru
al a
dj.)
72
,22
0$
1
1,4
34
$
12
7,6
16
$
3
5,6
79
$
(4
6,9
95
)$
73
,03
8$
18
9,9
28
$
1
78
,29
4$
16
7,0
74
$
46
7,2
91
$
Pro
fita
bil
ity a
nd
Liq
uid
ity A
na
lys
is (
As
se
ts @
mk
t va
lue
)
R
ate
of
Re
turn
:
Ave
rag
e F
arm
Asse
ts (
%)
5.1
%1
.7%
8.8
%1
.9%
-3.7
%4
.1%
8.3
%5
.6%
4.0
%1
4.2
0%
Ave
rag
e F
arm
Eq
uity (
%)
5.2
%-3
.6%
9.7
%0
.5%
-7.9
%4
.0%
10
.3%
6.1
%4
.1%
19
.80
%
Op
era
tin
g P
rofit
Ma
rgin
(%
)2
7.9
%1
1.2
%4
0.2
%1
0.3
%-2
3.5
%2
2.3
%2
7.2
%2
3.0
%2
0.8
%4
0.3
0%
Asse
t T
urn
ove
r R
ate
(%
)1
8.4
%1
5.3
%2
2.0
%1
8.7
%1
5.5
%1
3.1
%3
0.7
%2
4.4
%1
9.4
%3
5.3
0%
Va
lue
of
Fa
rm P
rod
uctio
n4
14
,98
5$
3
57
,60
0$
4
89
,58
2$
$4
23
,40
53
80
,22
2$
4
59
,24
4$
64
4,0
67
$
7
50
,12
1$
74
5,1
70
$
1,0
55
,58
0$
Fa
rm In
tere
st
Pa
id3
1,1
18
$
46
,52
3$
4
4,1
57
$
$
34
,75
53
1,9
18
$
27
,54
0$
37
,62
8$
41
,56
0$
45
,30
5$
3
4,2
63
$
Co
mp
ara
tive
Fin
an
cia
l S
tate
me
nt
(As
se
ts @
Mk
t V
alu
e)
To
tal E
nd
ing
Asse
ts2
,42
1,5
40
$
2
,50
2,0
92
$
2
,57
2,2
18
$
2
,42
6,4
11
$
2,6
65
,63
9$
2,3
08
,39
1$
2
,79
0,2
18
$
3,3
29
,83
2$
4,0
06
,36
5$
3,8
48
,49
3$
To
tal E
nd
ing
Lia
bili
tie
s6
70
,90
7$
74
9,1
12
$
7
23
,68
1$
6
57
,42
7$
73
8,5
52
$
6
18
,63
2$
79
8,3
47
$
9
85
,46
3$
1
,17
3,3
18
$
1
,02
1,8
81
$
En
d N
et
Wo
rth
(fa
rm &
no
n f
arm
)1
,75
0,6
33
$
1
,75
2,9
80
$
1
,88
7,6
34
$
1
,76
8,9
84
$
1,9
27
,08
7$
1,6
89
,76
0$
2
,11
0,0
52
$
2,3
30
,28
8$
2,8
33
,04
6$
2,8
26
,61
2$
En
d F
arm
Cu
rre
nt
De
bt
to A
sse
t %
29
%3
1%
25
%2
2%
67
%6
6%
55
%6
3%
65
%4
0.0
0%
En
d T
ota
l D
eb
t to
Asse
t %
28
%3
0%
27
%2
7%
28
%2
7%
28
%3
0%
29
%2
7.0
0%
CR
OP
PR
OD
UC
TIO
N
Ac
rea
ge
In
form
ati
on
To
tal A
cre
s O
wn
ed
16
42
15
63
20
73
12
92
15
93
12
16
13
17
12
91
14
69
1,1
33
To
tal C
rop
Acre
s5
02
63
24
59
44
05
35
42
04
07
47
14
90
46
5
Cro
p A
cre
s O
wn
ed
35
64
83
34
73
48
39
72
99
32
03
72
35
03
35
Cro
p A
cre
s C
ash
Re
nte
d1
44
13
51
02
84
12
91
14
80
95
14
01
33
Cro
p A
cre
s S
ha
re R
en
ted
21
49
89
87
50
0
Cro
p Y
ield
s
Alfa
lfa
Ha
y t
on
/pe
r A
cre
4.8
4.7
53
.66
4.5
54
.46
4.3
55
.11
4.4
14
.15
3.6
3
Oth
er
Ha
y t
on
/pe
r A
cre
1.8
2.1
91
.56
2.2
43
.86
2.1
2.1
22
.49
1.1
61
.36
Co
rn S
ilag
e w
et
ton
/pe
r A
cre
20
.61
20
.21
8.2
20
.36
20
.02
20
.68
19
.74
26
.19
21
.43
20
.93
Ba
rle
y P
er
Acre
(cw
t)2
5.2
52
7.9
43
3.1
84
2.6
15
5.4
43
.66
25
.15
25
.99
no r
eport
51
.01
Cro
p P
ric
es
Re
ce
ive
d (
ca
sh
sa
les
)
Alfa
lfa
Ha
y/t
on
85
.48
$
90
.02
$
11
5.5
7$
16
8.0
0$
11
5.0
8$
9
5.6
9$
18
0.9
4$
18
8.1
4$
19
6.1
7$
2
01
.57
$
Oth
er
Ha
y/t
on
65
.59
$
63
.62
$
77
.48
$
1
12
.12
$
7
1.8
8$
7
0.3
9$
11
4.5
8$
95
.25
$
1
43
.45
$
14
0.5
3$
Co
rn S
ilag
e/
we
t to
n2
8.5
1$
2
6.2
0$
2
5.3
1$
46
.37
$
2
9.3
1$
3
0.9
4$
19
.74
$
4
8.8
2$
49
.30
$
57
.21
$
Co
rn/b
ush
el
2.8
1$
2
.90
$
4.2
2$
4.3
8$
4.2
8$
4
.09
$
6
.06
$
7
.80
$
6
.06
$
5.2
2$
7

20
05
20
06
20
07
20
08
20
09
20
10
20
11
20
12
20
13
20
14
Nu
mb
er
of
Fa
rms
51
40
46
47
41
56
44
49
37
48
LIV
ES
TO
CK
PR
OD
UC
TIO
N
Be
ef
Co
w/C
alf
Nu
mb
er
of
Be
ef
Co
w O
pe
ratio
ns
28
23
21
23
20
27
22
21
18
23
Nu
mb
er
of
Be
ef
Co
ws
41
4.5
39
24
02
38
43
54
.00
31
63
41
.43
90
.73
60
33
6
Pre
gn
an
cy R
ate
94
.8%
91
.1%
94
%9
3.7
%9
4.5
%9
5.9
0%
95
.90
%9
3.9
%9
4.9
%9
4.5
%
We
an
ing
%7
9.6
%8
0.6
%8
3.9
%7
8.3
%8
3.6
%8
4.8
0%
86
.40
%8
4.9
%8
6.5
%8
9.0
%
Lb
s w
ea
ne
d P
er
co
w4
32
42
04
26
39
64
19
.00
44
64
66
45
44
18
49
1
Fe
ed
Co
st
pe
r C
ow
17
2.3
4$
1
69
.78
$
16
9.0
1$
22
9.6
3$
13
8.2
2$
1
98
.21
$
3
18
.24
$
3
60
.44
$
3
65
.07
$
40
7.9
7$
Cu
ll C
ow
%9
.4%
14
.7%
13
.3%
15
.6%
10
.5%
11
.6%
11
.1%
10
.5%
14
.4%
13
.5%
Cu
ll C
ow
In
co
me
/pe
r h
ea
d5
8.6
4$
9
9.0
3$
6
5.8
8$
94
.25
$
5
8.5
6$
7
2.6
1$
86
.10
$
8
9.9
4$
14
2.4
6$
1
81
.40
$
Bre
ak E
ve
n (
cw
t) (
dir
ect
& o
vh
d e
xp
.)8
1.7
4$
9
5.4
0$
8
8.8
4$
11
7.8
3$
15
3.7
9$
1
08
.78
$
1
53
.43
$
1
42
.49
$
1
51
.25
$
16
9.7
2$
Sa
les $
/cw
t fo
r w
ea
ne
d c
alf
12
0.0
0$
1
29
.93
$
11
7.6
6$
10
8.6
4$
10
3.8
3$
1
21
.47
$
1
41
.55
$
1
66
.97
$
1
74
.43
$
25
9.5
1$
Ave
rag
e N
et
Re
turn
pe
r B
ee
f C
ow
Da
iry C
ow
s
Nu
mb
er
of
Da
iry O
pe
ratio
ns r
ep
ort
ing
12
69
86
73
86
7
Nu
mb
er
of
Milk
ing
Co
ws
30
8.4
35
1.2
39
4.8
40
54
68
44
31
,53
77
60
1,0
02
86
4
Tu
rno
ve
r R
ate
23
.5%
16
.9%
24
.2%
31
.6%
29
.8%
29
.4%
25
.7%
38
.4%
24
.5%
34
.4%
Cu
ll C
ow
In
co
me
/pe
r h
ea
d1
01
.25
$
90
.84
$
85
.69
$
1
13
.03
$
1
13
.70
$
14
7.9
1$
16
3.7
1$
25
8.1
2$
21
8.8
6$
3
49
.70
$
Lb
s o
f m
ilk/c
ow
(3
65
da
y)
16
,45
1.0
19
,79
6.0
21
,44
2.0
21
,03
6.0
22
,04
1.0
20
,53
22
0,1
77
21
,37
22
0,2
15
23
,37
6
Fe
ed
Co
st/
cw
t o
f m
ilk6
.89
$
7.1
0$
7
.73
$
1
0.2
9$
8.0
0$
6
.79
$
1
0.3
3$
12
.56
$
1
1.6
2$
1
1.5
1$
Bre
ak E
ve
n /
cw
t (d
ire
ct
& o
vh
d e
xp
.)1
2.1
2$
1
2.2
5$
1
3.1
9$
15
.76
$
1
2.4
6$
1
1.4
1$
15
.22
$
1
7.0
5$
16
.86
$
16
.04
$
Milk
Sa
les (
cw
t)1
5.1
1$
1
2.7
1$
1
8.0
3$
18
.08
$
1
2.0
0$
1
6.5
0$
20
.05
$
1
6.9
2$
19
.93
$
23
.45
$
HO
US
EH
OL
D I
NF
OR
MA
TIO
N
No
n F
arm
In
co
me
31
,52
6$
3
9,4
54
$
24
,25
2$
24
,92
9.0
0$
1
9,2
62
$
16
,59
0.0
0$
1
7,9
56
$
1
9,7
37
$
1
3,2
46
.00
$
1
64
38
No
. F
arm
s R
ep
ort
ing
Ho
use
ho
ld In
for.
16
19
16
11
13
87
57
5
Ave
rag
e F
am
ily S
ize
4.3
44
.13
.84
.44
4.6
4.2
3.4
3.4
To
tal F
am
ily L
ivin
g
39
,93
6$
3
7,6
02
$
39
,35
0$
51
,60
0$
52
,02
2$
3
6,7
39
.00
$
53
,94
6$
36
,61
4$
39
,87
7$
4
8,6
49
$
Oth
er
Fa
mily
Exp
.(ta
xes, n
on
farm
Cap
.pur.
, In
v.&
Savin
g)
5,9
60
$
2,6
19
$
13
,77
9$
18
,39
4$
11
,38
0$
8
,38
6.0
0$
13
,26
6$
2,2
06
$
1
5,2
31
$
25
,55
2$
Ttl F
am
ily L
ivin
g,
Inve
st.
& n
on
farm
Cp
tl P
ur.
46
,92
6$
4
0,2
20
$
52
,94
7$
62
,66
7$
63
,03
7$
4
5,1
25
.00
$
67
,21
3$
38
,82
0$
54
,54
5$
7
0,9
36
$
8

AVERAGE MONEY SPENT LOCALLY
BY UTAH FARM OPERATIONS ENROLLED In Farm Business Management -
ANALYIZED IN THIS REPORT
AVERAGE MEDIAN STD/DEV
WITH OTHER FARMERS $16,403 $10,335 $16,020
Custom work & hire
FOR RENTS PAID $29,143 $17,971 $31,267
cash land rent
FOR EXTRA HIRED LABOR $106,461 $45,967 $223,353
FOR UTILITIES $23,532 $6,271 $60,849
WITHIN AGRIBUSINESS COMMUNITY $1,297,546 $224,316 $3,203,089
TAXES County Real Estate $4,416 $3,076 $4,669
Personal Property $1,835 $1,384 $1,934
WITH LENDERS (Interest) $34,788 $13,743 $54,072
WITH PROF & LEGAL $5,695 $2,498 $7,341
WITH INSURANCE $12,733 $9,938 $11,078
CAPTIAL PURCHASES $144,905
FAMILY LIVING $48,649 $41,366 $28,070
Ave. Total Dollars Spent
Locally per Farm $1,726,106
(Seed, fert. chem. supplies, breeding, freight, vet, fuel, repairs, pur. feed, pur.livestock)
9

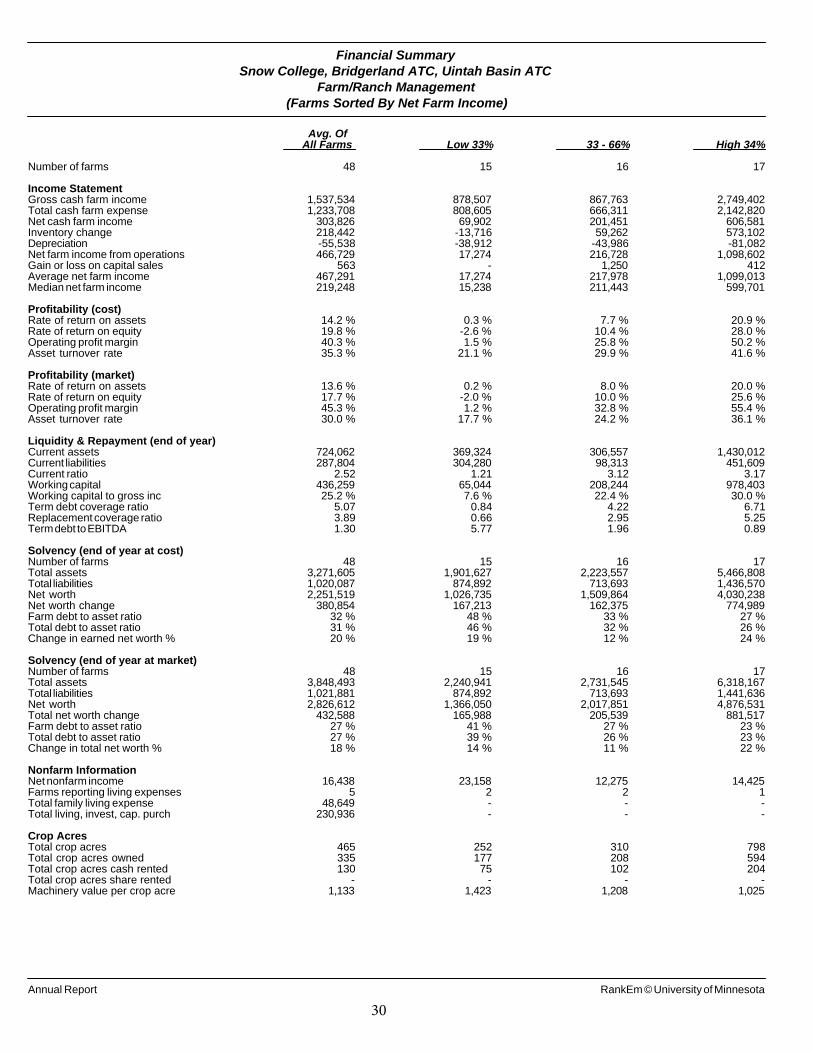
Whole Farm Reports The whole farm report section summarizes the financial performance of the cooperating farms.
Most tables report the average for all the farms as well as the high, low, and mid third when
ranked by profitability. Several measures of financial performance are included in the following
tables. Many of the measures are summarized in the “financial summary” table.
Income Statement
An income statement shows the net returns that were earned by a firm. Most farmers are familiar
with 1040 F income statement that is provided to the Internal Revenue Service each year. Most
farmers file the 1040 F based on a cash accounting system of accounting. They may also use
methods of depreciation (e.g. MARCS) that do not realistically reflect actual depreciation. In
addition, a cash based 1040 F does not account for all changes in inventory. The income
statements in this report depart from a 1040 F from both of these perspectives. As a result, the
net farm income reported in the following tables represents an accrual adjusted income statement
which can not be directly compared to a 1040 F income statement. The data concerning net farm
income shows a significant difference between the high and low profit firms (profits of
$1,099,013 versus a meager $17,274). Most of this difference is associated with enterprise
income and expenses. This suggests that there is a significant difference in the cost of
production (cash expenses as well as inventory changes) incurred by the low versus high profit
farms. The high profit farms also had relatively large increases in inventory which suggests
possible growth of the firm.
Profitability
Several measures are used to reflect the profitability of a farm or ranch. The two most common
measures are return on assets (ROA) and return on equity (ROE). Both are similar to and can be
compared to an interest rate (percent return). ROA reflects the return to all assets including
interest paid to lenders while ROE reflects the return to the owner/operator for funds he/she has
invested in the firm. If the ROE is less than the cost of debt (interest rate on borrowed funds)
lenders are earning more on their money invested in the business than is the owner/operator. As
noted in the tables ROE for the high profit firms is significantly higher than for the low profit
firms. These returns are also closely related to the operating profit margin and the asset turnover
ratio – higher ratios generally lead to higher profits. Profitability based on market values in
2014 showed ROE averaged 19.8% and ROA averaged 14.2%.
Solvency and Liquidity
There is no other measure that reflects the financial success of a firm as does the change in
owner’s equity. This change shows how much more of the farm business is owned by the farm
operator at the end of the year as compared to the beginning of the year. The key to increases in
equity is profitability.
10

OVERVIEW OF FARM FINANCIAL STATEMENTS
Farm Income Statement This is a summary of income, expenses and the resulting profit or loss from operations. The
Farm Income Statement is divided into two parts – Income and Expenses. The Income portion
provides a detailed picture of cash farm income flowing into the business. The Expense portion
of the statement is further divided into three sections, cash expenses, depreciation and capital
adjustments. Inventory changes, depreciation and other capital adjustments are accrual
adjustments to Net Cash Income, which result in Net Farm Income – a more accurate reflection
of actual farm business profitability. Net Farm Income represents the return to the operator’s and
family’s unpaid labor, management, and equity capital investment.
Profitability and Liquidity Measures These reports provide a number of measures of performance. Profitability measures the value
the farm has produced for the resources contributed. Measures reported (net farm income, labor
and management earnings, rate of return on assets, rate of return on equity, operating profit
margin, and the asset turnover rate) are calculated with assets valued at both cost and market
basis.
Liquidity measures the ability of a business to meet its financial obligations in the short run;
including family living, taxes and debt payments. Measures reported (the amount available to
service intermediate debt and the years required to turnover intermediate debt) are provided on
both a cash and accrual basis. Both measures are determined after providing for family living
and taxes and for servicing real estate debt.
Balance Sheets
Two separate Balance Sheet reports are provided, one at cost basis and the other at market basis
for assets. These balance sheets provide a categorical listing of all assets, liabilities and equity.
Solvency measures are also provided on the Balance Sheets. The percentages shown represent
the percent in debt for current assets, current and intermediated assets, long term assets, and the
total assets of the business.
Statement of Cash Flows
This table reports all the sources from which cash was generated, where cash was used, and what
remains at year-end. It starts with the Beginning Cash Balance and concludes with the Ending
Cash Balance. Cash from Operating Activities represents inflow and outflows from ordinary
farming and non-farm activities. The result is a net Cash from Operations. Cash from Investing
Activities reports the cash inflows and outflows from the purchase and sale of farm and non-farm
assets and investments. The result is a net Cash from Investing Activities. Cash from Financing
Activities represents cash inflows from money borrowed and gifts received, and outflows for
principal paid and gifts and dividends given. The result is a Net Cash from Financing Activities.
The Net Change in Cash balances is the sum total of the cash position from each of the three
activities.
11

Crop Production and Marketing Summary
This table contains three sections. The Acreage Summary reports the owned and rented acres in
the farm business. The Average Price Received section reports the average prices received for
crops sold – actual sales only. The Average Yield per Acre section reports the average yields of
the various crops produced. Results are shown only where there was a total of three or more in a
group.
Financial Standards Measures
The Financial Standards Measures are the sixteen financial measures selected by the Farm
Financial Standards Task Force of the American Bankers Association. These ratios are
explained on page 24.
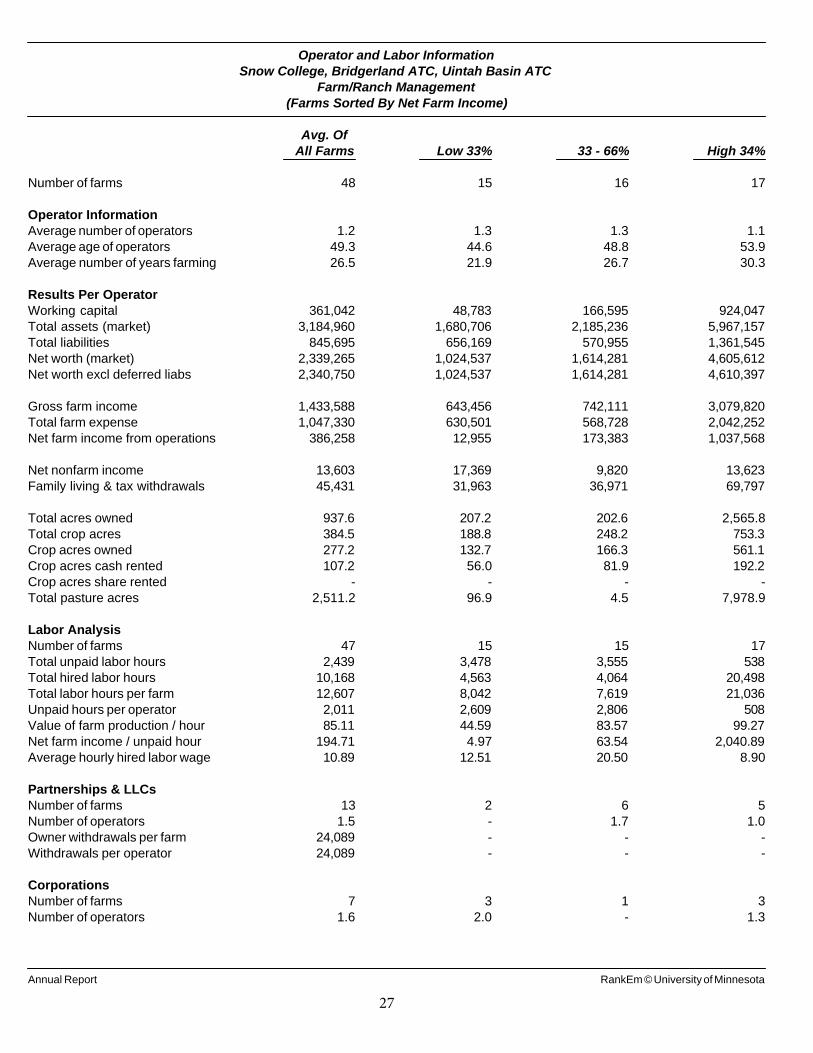
Operator and Labor Information
The Operator and Labor Analysis summarizes the results per operator and the labor utilized in
the operation of the farm business, both paid and unpaid. It also provides a calculated value of
farm production per hour of labor, and net farm income per unpaid hour. These measures could
be considered measures of labor efficiency.
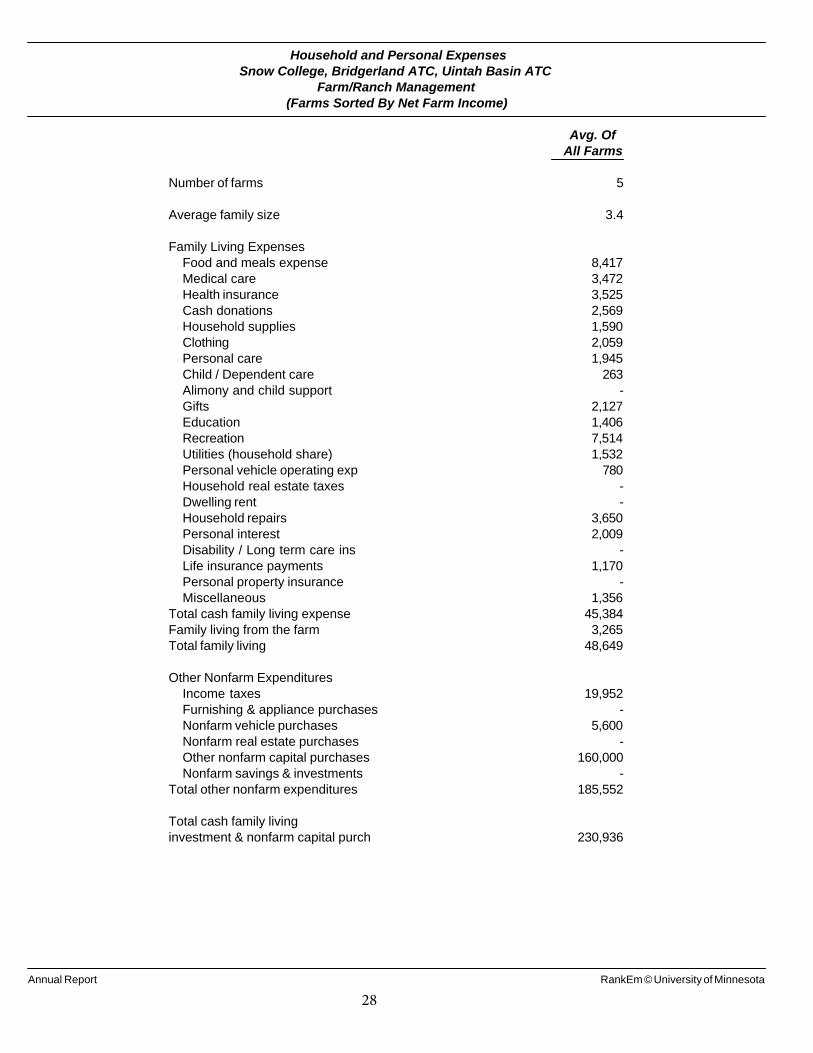
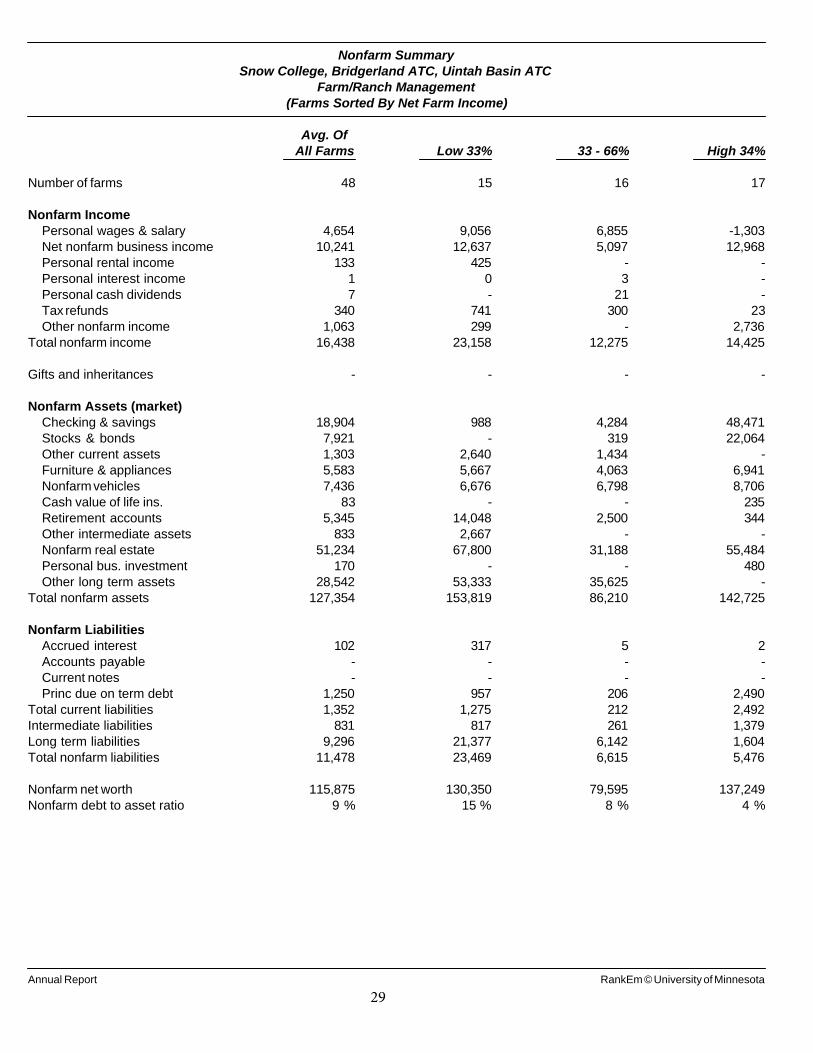
Household and Personal Expenses and Non-Farm Summary
The Household and Personal Expenses is a detailed summary of expenditures by farm
households that maintained a record of their household spending. The Non-Farm Summary is a
report of non-farm income, expenses and liabilities.
12
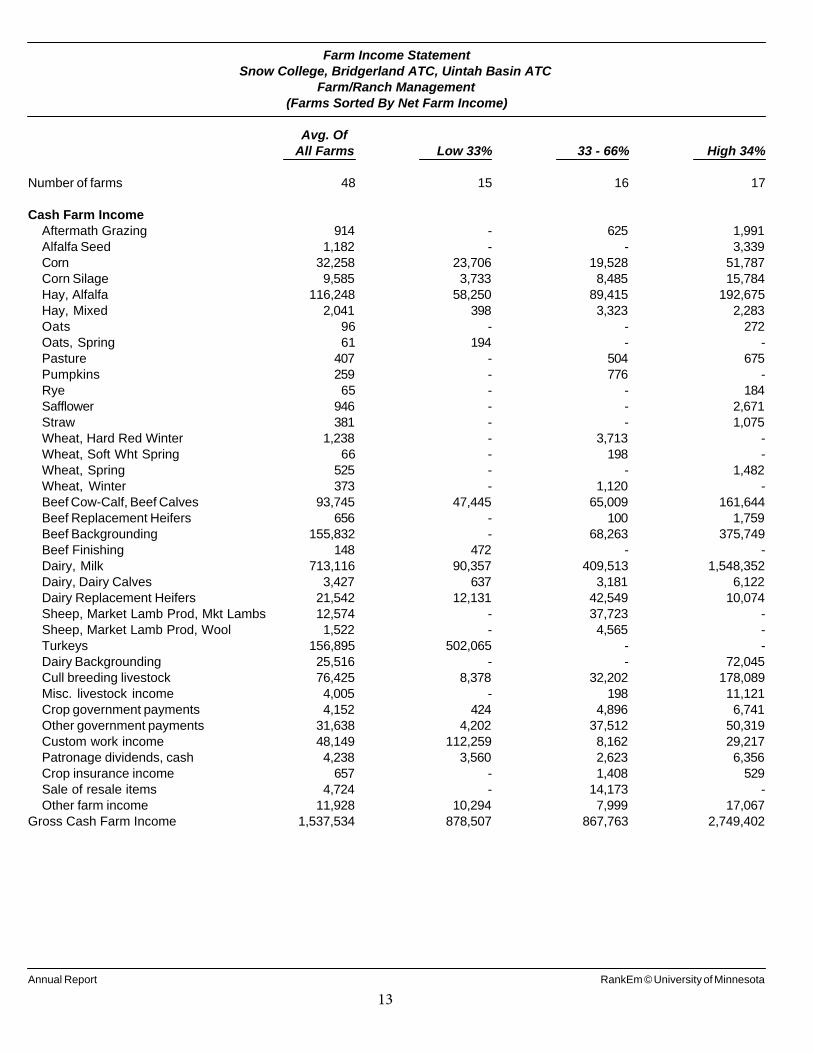
Farm Income StatementSnow College, Bridgerland ATC, Uintah Basin ATC
Farm/Ranch Management(Farms Sorted By Net Farm Income)
Avg. OfAll Farms Low 33% 33 - 66% High 34%
Number of farms 48 15 16 17
Cash Farm Income
Aftermath Grazing 914 - 625 1,991
Alfalfa Seed 1,182 - - 3,339
Corn 32,258 23,706 19,528 51,787
Corn Silage 9,585 3,733 8,485 15,784
Hay, Alfalfa 116,248 58,250 89,415 192,675
Hay, Mixed 2,041 398 3,323 2,283
Oats 96 - - 272
Oats, Spring 61 194 - -
Pasture 407 - 504 675
Pumpkins 259 - 776 -
Rye 65 - - 184
Safflower 946 - - 2,671
Straw 381 - - 1,075
Wheat, Hard Red Winter 1,238 - 3,713 -
Wheat, Soft Wht Spring 66 - 198 -
Wheat, Spring 525 - - 1,482
Wheat, Winter 373 - 1,120 -
Beef Cow-Calf, Beef Calves 93,745 47,445 65,009 161,644
Beef Replacement Heifers 656 - 100 1,759
Beef Backgrounding 155,832 - 68,263 375,749
Beef Finishing 148 472 - -
Dairy, Milk 713,116 90,357 409,513 1,548,352
Dairy, Dairy Calves 3,427 637 3,181 6,122
Dairy Replacement Heifers 21,542 12,131 42,549 10,074
Sheep, Market Lamb Prod, Mkt Lambs 12,574 - 37,723 -
Sheep, Market Lamb Prod, Wool 1,522 - 4,565 -
Turkeys 156,895 502,065 - -
Dairy Backgrounding 25,516 - - 72,045
Cull breeding livestock 76,425 8,378 32,202 178,089
Misc. livestock income 4,005 - 198 11,121
Crop government payments 4,152 424 4,896 6,741
Other government payments 31,638 4,202 37,512 50,319
Custom work income 48,149 112,259 8,162 29,217
Patronage dividends, cash 4,238 3,560 2,623 6,356
Crop insurance income 657 - 1,408 529
Sale of resale items 4,724 - 14,173 -
Other farm income 11,928 10,294 7,999 17,067
Gross Cash Farm Income 1,537,534 878,507 867,763 2,749,402
Annual Report RankEm © University of Minnesota
13
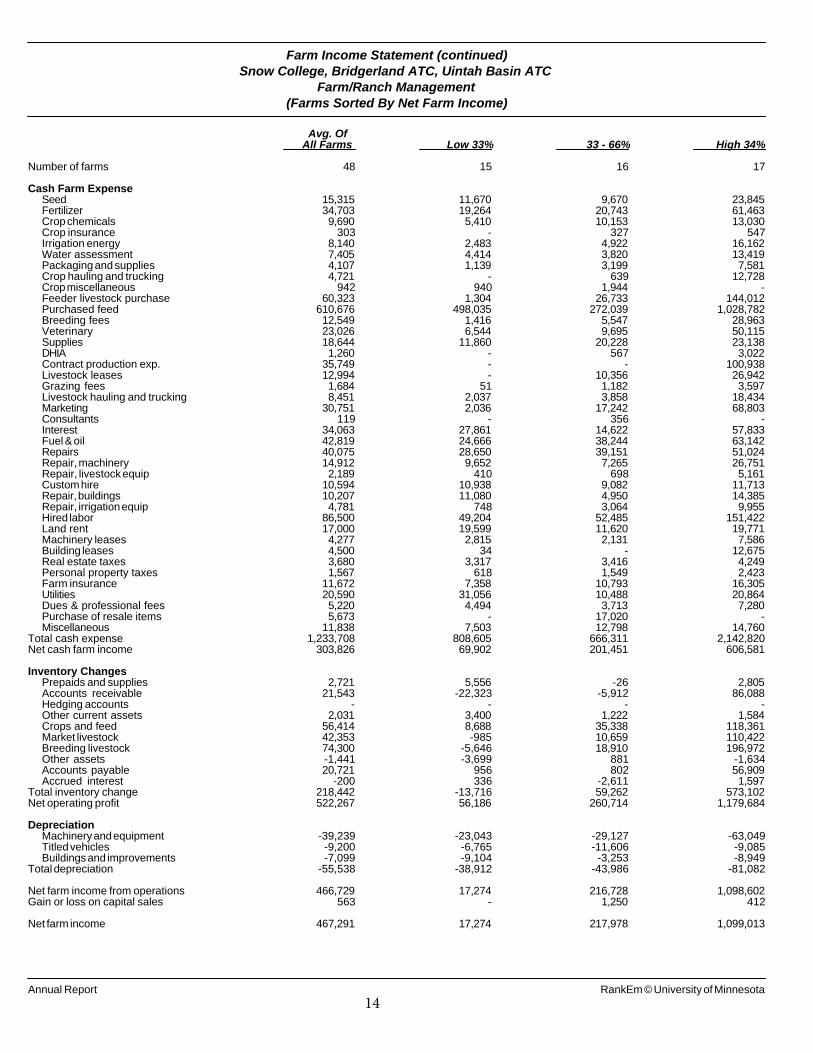
Farm Income Statement (continued)Snow College, Bridgerland ATC, Uintah Basin ATC
Farm/Ranch Management(Farms Sorted By Net Farm Income)
Avg. OfAll Farms Low 33% 33 - 66% High 34%
Number of farms 48 15 16 17
Cash Farm ExpenseSeed 15,315 11,670 9,670 23,845Fertilizer 34,703 19,264 20,743 61,463Crop chemicals 9,690 5,410 10,153 13,030Crop insurance 303 - 327 547Irrigation energy 8,140 2,483 4,922 16,162Water assessment 7,405 4,414 3,820 13,419Packaging and supplies 4,107 1,139 3,199 7,581Crop hauling and trucking 4,721 - 639 12,728Crop miscellaneous 942 940 1,944 -Feeder livestock purchase 60,323 1,304 26,733 144,012Purchased feed 610,676 498,035 272,039 1,028,782Breeding fees 12,549 1,416 5,547 28,963Veterinary 23,026 6,544 9,695 50,115Supplies 18,644 11,860 20,228 23,138DHIA 1,260 - 567 3,022Contract production exp. 35,749 - - 100,938Livestock leases 12,994 - 10,356 26,942Grazing fees 1,684 51 1,182 3,597Livestock hauling and trucking 8,451 2,037 3,858 18,434Marketing 30,751 2,036 17,242 68,803Consultants 119 - 356 -Interest 34,063 27,861 14,622 57,833Fuel & oil 42,819 24,666 38,244 63,142Repairs 40,075 28,650 39,151 51,024Repair, machinery 14,912 9,652 7,265 26,751Repair, livestock equip 2,189 410 698 5,161Custom hire 10,594 10,938 9,082 11,713Repair, buildings 10,207 11,080 4,950 14,385Repair, irrigation equip 4,781 748 3,064 9,955Hired labor 86,500 49,204 52,485 151,422Land rent 17,000 19,599 11,620 19,771Machinery leases 4,277 2,815 2,131 7,586Building leases 4,500 34 - 12,675Real estate taxes 3,680 3,317 3,416 4,249Personal property taxes 1,567 618 1,549 2,423Farm insurance 11,672 7,358 10,793 16,305Utilities 20,590 31,056 10,488 20,864Dues & professional fees 5,220 4,494 3,713 7,280Purchase of resale items 5,673 - 17,020 -Miscellaneous 11,838 7,503 12,798 14,760
Total cash expense 1,233,708 808,605 666,311 2,142,820Net cash farm income 303,826 69,902 201,451 606,581
Inventory ChangesPrepaids and supplies 2,721 5,556 -26 2,805Accounts receivable 21,543 -22,323 -5,912 86,088Hedging accounts - - - -Other current assets 2,031 3,400 1,222 1,584Crops and feed 56,414 8,688 35,338 118,361Market livestock 42,353 -985 10,659 110,422Breeding livestock 74,300 -5,646 18,910 196,972Other assets -1,441 -3,699 881 -1,634Accounts payable 20,721 956 802 56,909Accrued interest -200 336 -2,611 1,597
Total inventory change 218,442 -13,716 59,262 573,102Net operating profit 522,267 56,186 260,714 1,179,684
DepreciationMachinery and equipment -39,239 -23,043 -29,127 -63,049Titled vehicles -9,200 -6,765 -11,606 -9,085Buildings and improvements -7,099 -9,104 -3,253 -8,949
Total depreciation -55,538 -38,912 -43,986 -81,082
Net farm income from operations 466,729 17,274 216,728 1,098,602Gain or loss on capital sales 563 - 1,250 412
Net farm income 467,291 17,274 217,978 1,099,013
Annual Report RankEm © University of Minnesota
14

Inventory ChangesSnow College, Bridgerland ATC, Uintah Basin ATC
Farm/Ranch Management(Farms Sorted By Net Farm Income)
Avg. OfAll Farms Low 33% 33 - 66% High 34%
Number of farms 48 15 16 17
Net cash farm income 303,826 69,902 201,451 606,581
Crops and FeedEnding inventory 252,405 128,535 141,180 466,384Beginning inventory 195,991 119,848 105,841 348,024Inventory change 56,414 8,688 35,338 118,361
Market LivestockEnding inventory 221,798 103,610 93,113 447,196Beginning inventory 179,445 104,595 82,455 336,773Inventory change 42,353 -985 10,659 110,422
Accts ReceivableEnding inventory 75,067 42,959 16,987 158,060Beginning inventory 53,524 65,282 22,899 71,972Inventory change 21,543 -22,323 -5,912 86,088
Prepaid Expenses and SuppliesEnding inventory 16,461 9,288 5,732 32,888Beginning inventory 13,740 3,731 5,758 30,083Inventory change 2,721 5,556 -26 2,805
Hedging ActivitiesEnding inventory - - - -Withdrawals - - - -Beginning inventory - - - -Deposits - - - -Gain or loss - - - -
Other Current AssetsEnding inventory 15,957 4,920 3,848 37,092Beginning inventory 13,926 1,520 2,626 35,509Inventory change 2,031 3,400 1,222 1,584
Breeding LivestockEnding inventory 553,392 101,707 371,751 1,122,894Capital sales 618 1,978 - -Beginning inventory 443,853 101,617 327,676 855,169Capital purchases 35,857 7,713 25,165 70,753Depreciation, capital adjust 74,300 -5,646 18,910 196,972
Other Capital AssetsEnding inventory 166,569 28,998 235,322 223,245Capital sales 296 147 750 -Beginning inventory 164,540 28,832 235,191 217,789Capital purchases 3,765 4,013 - 7,090Depreciation, capital adjust -1,441 -3,699 881 -1,634
Accounts PayableBeginning inventory 40,032 30,321 802 85,523Ending inventory 19,311 29,364 - 28,614Inventory change 20,721 956 802 56,909
Accrued InterestBeginning inventory 7,153 4,825 10,629 5,935Ending inventory 7,353 4,489 13,241 4,338Inventory change -200 336 -2,611 1,597
Total inventory change 218,442 -13,716 59,262 573,102
Net operating profit 522,267 56,186 260,714 1,179,684
Annual Report RankEm © University of Minnesota
15

DepreciationSnow College, Bridgerland ATC, Uintah Basin ATC
Farm/Ranch Management(Farms Sorted By Net Farm Income)
Avg. OfAll Farms Low 33% 33 - 66% High 34%
Number of farms 48 15 16 17
Net operating profit 522,267 56,186 260,714 1,179,684
Machinery and Equipment
Ending inventory 463,890 304,567 370,694 692,182
Capital sales 7,715 4,823 7,761 10,221
Beginning inventory 422,767 304,642 342,650 602,399
Capital purchases 88,077 27,792 64,932 163,053
Depreciation, capital adjust. -39,239 -23,043 -29,127 -63,049
Titled Vehicles
Ending inventory 57,972 29,602 57,598 83,357
Capital sales 27 87 - -
Beginning inventory 56,598 28,850 61,449 76,515
Capital purchases 10,602 7,604 7,755 15,927
Depreciation, capital adjust. -9,200 -6,765 -11,606 -9,085
Buildings and Improvements
Ending inventory 293,321 308,836 169,786 395,900
Capital sales - - - -
Beginning inventory 293,815 307,084 171,613 397,122
Capital purchases 6,604 10,856 1,426 7,727
Depreciation, capital adjust. -7,099 -9,104 -3,253 -8,949
Total depreciation, capital adj. -55,538 -38,912 -43,986 -81,082
Net farm income from operations 466,729 17,274 216,728 1,098,602
Gain or loss on capital sales 563 - 1,250 412
Net farm income 467,291 17,274 217,978 1,099,013
Annual Report RankEm © University of Minnesota
16

Profitability MeasuresSnow College, Bridgerland ATC, Uintah Basin ATC
Farm/Ranch Management(Farms Sorted By Net Farm Income)
Avg. OfAll Farms Low 33% 33 - 66% High 34%
Number of farms 48 15 16 17
Profitability (assets valued at cost)
Net farm income from operations 466,729 17,274 216,728 1,098,602
Rate of return on assets 14.2 % 0.3 % 7.7 % 20.9 %
Rate of return on equity 19.8 % -2.6 % 10.4 % 28.0 %
Operating profit margin 40.3 % 1.5 % 25.8 % 50.2 %
Asset turnover rate 35.3 % 21.1 % 29.9 % 41.6 %
Farm interest expense 34,263 27,525 17,234 56,236
Value of operator lbr and mgmt. 75,163 39,335 75,873 106,108
Return on farm assets 425,829 5,463 158,089 1,048,730
Average farm assets 2,991,115 1,696,384 2,046,726 5,022,360
Return on farm equity 391,566 -22,061 140,856 992,494
Average farm equity 1,977,061 857,725 1,356,798 3,548,488
Value of farm production 1,055,580 358,603 611,846 2,088,192
Avg. OfAll Farms Low 33% 33 - 66% High 34%
Number of farms 48 15 16 17
Profitability (assets valued at market)
Net farm income from operations 518,864 16,048 259,534 1,206,600
Rate of return on assets 13.6 % 0.2 % 8.0 % 20.0 %
Rate of return on equity 17.7 % -2.0 % 10.0 % 25.6 %
Operating profit margin 45.3 % 1.2 % 32.8 % 55.4 %
Asset turnover rate 30.0 % 17.7 % 24.2 % 36.1 %
Farm interest expense 34,263 27,525 17,234 56,236
Value of operator lbr and mgmt. 75,163 39,335 75,873 106,108
Return on farm assets 477,964 4,238 200,896 1,156,728
Average farm assets 3,520,577 2,020,543 2,526,001 5,780,208
Return on farm equity 443,701 -23,287 183,662 1,100,492
Average farm equity 2,505,068 1,181,884 1,836,073 4,302,227
Value of farm production 1,055,580 358,603 611,846 2,088,192
Annual Report RankEm © University of Minnesota
17
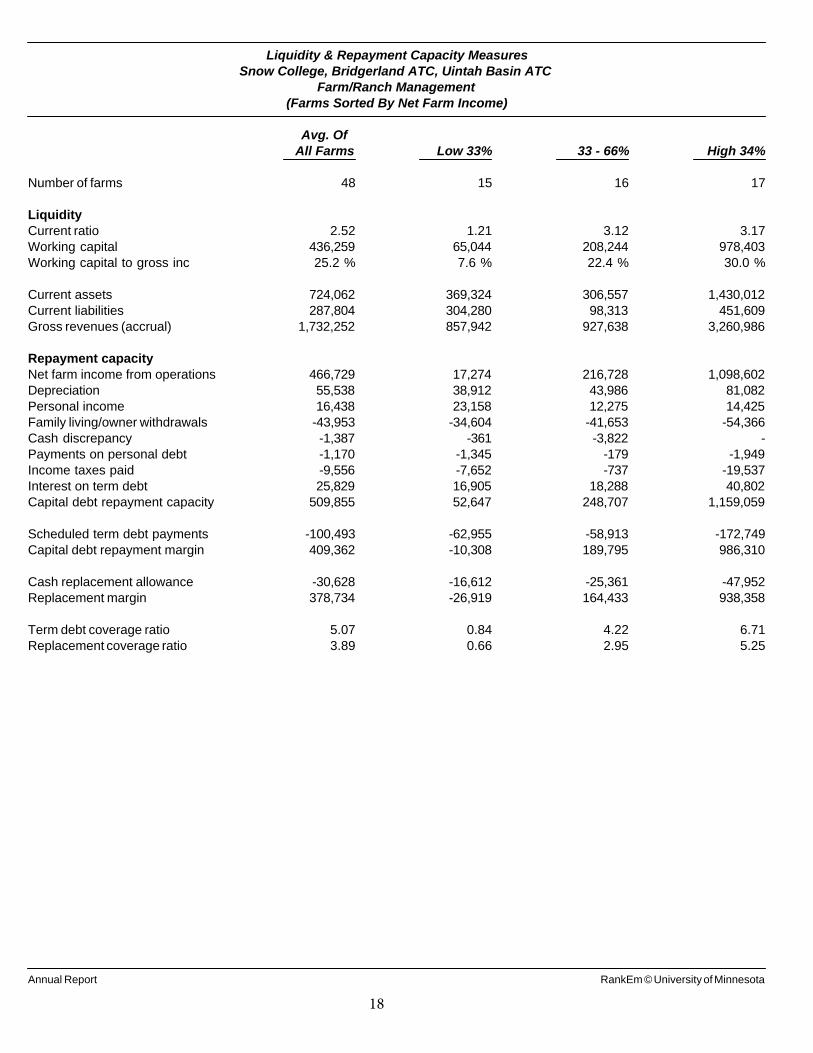
Liquidity & Repayment Capacity MeasuresSnow College, Bridgerland ATC, Uintah Basin ATC
Farm/Ranch Management(Farms Sorted By Net Farm Income)
Avg. OfAll Farms Low 33% 33 - 66% High 34%
Number of farms 48 15 16 17
Liquidity
Current ratio 2.52 1.21 3.12 3.17
Working capital 436,259 65,044 208,244 978,403
Working capital to gross inc 25.2 % 7.6 % 22.4 % 30.0 %
Current assets 724,062 369,324 306,557 1,430,012
Current liabilities 287,804 304,280 98,313 451,609
Gross revenues (accrual) 1,732,252 857,942 927,638 3,260,986
Repayment capacity
Net farm income from operations 466,729 17,274 216,728 1,098,602
Depreciation 55,538 38,912 43,986 81,082
Personal income 16,438 23,158 12,275 14,425
Family living/owner withdrawals -43,953 -34,604 -41,653 -54,366
Cash discrepancy -1,387 -361 -3,822 -
Payments on personal debt -1,170 -1,345 -179 -1,949
Income taxes paid -9,556 -7,652 -737 -19,537
Interest on term debt 25,829 16,905 18,288 40,802
Capital debt repayment capacity 509,855 52,647 248,707 1,159,059
Scheduled term debt payments -100,493 -62,955 -58,913 -172,749
Capital debt repayment margin 409,362 -10,308 189,795 986,310
Cash replacement allowance -30,628 -16,612 -25,361 -47,952
Replacement margin 378,734 -26,919 164,433 938,358
Term debt coverage ratio 5.07 0.84 4.22 6.71
Replacement coverage ratio 3.89 0.66 2.95 5.25
Annual Report RankEm © University of Minnesota
18
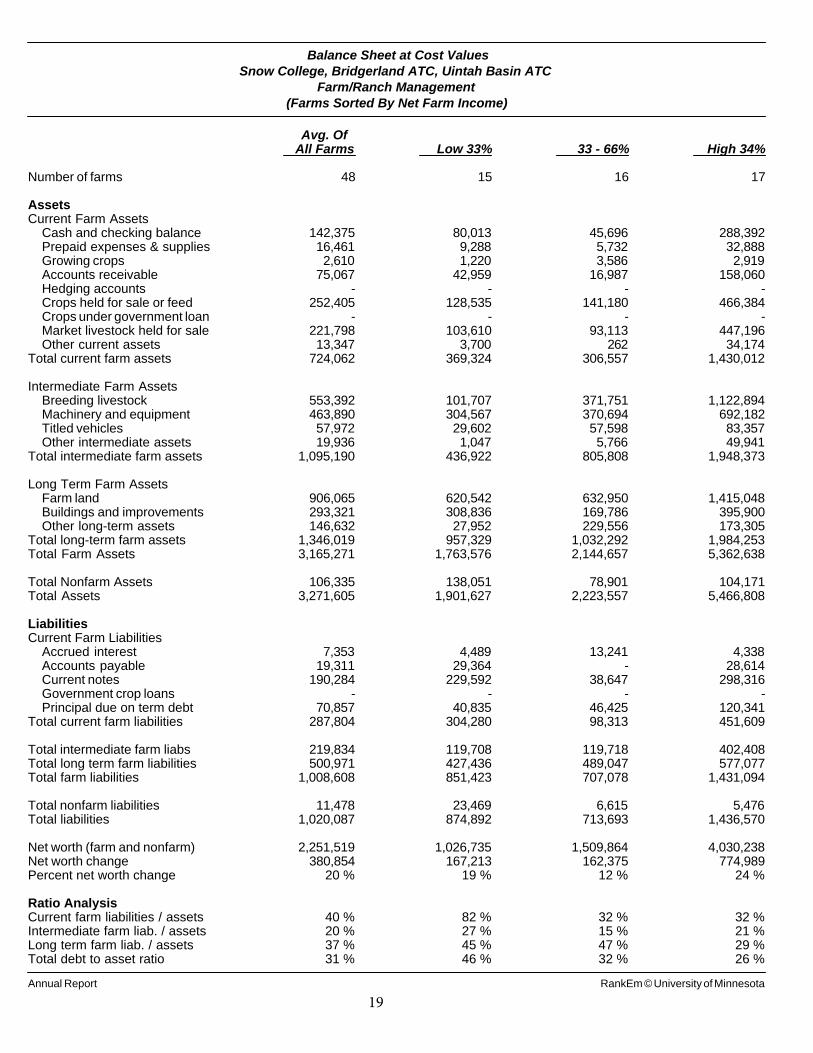
Balance Sheet at Cost ValuesSnow College, Bridgerland ATC, Uintah Basin ATC
Farm/Ranch Management(Farms Sorted By Net Farm Income)
Avg. OfAll Farms Low 33% 33 - 66% High 34%
Number of farms 48 15 16 17
AssetsCurrent Farm Assets
Cash and checking balance 142,375 80,013 45,696 288,392Prepaid expenses & supplies 16,461 9,288 5,732 32,888Growing crops 2,610 1,220 3,586 2,919Accounts receivable 75,067 42,959 16,987 158,060Hedging accounts - - - -Crops held for sale or feed 252,405 128,535 141,180 466,384Crops under government loan - - - -Market livestock held for sale 221,798 103,610 93,113 447,196Other current assets 13,347 3,700 262 34,174
Total current farm assets 724,062 369,324 306,557 1,430,012
Intermediate Farm AssetsBreeding livestock 553,392 101,707 371,751 1,122,894Machinery and equipment 463,890 304,567 370,694 692,182Titled vehicles 57,972 29,602 57,598 83,357Other intermediate assets 19,936 1,047 5,766 49,941
Total intermediate farm assets 1,095,190 436,922 805,808 1,948,373
Long Term Farm AssetsFarm land 906,065 620,542 632,950 1,415,048Buildings and improvements 293,321 308,836 169,786 395,900Other long-term assets 146,632 27,952 229,556 173,305
Total long-term farm assets 1,346,019 957,329 1,032,292 1,984,253Total Farm Assets 3,165,271 1,763,576 2,144,657 5,362,638
Total Nonfarm Assets 106,335 138,051 78,901 104,171Total Assets 3,271,605 1,901,627 2,223,557 5,466,808
LiabilitiesCurrent Farm Liabilities
Accrued interest 7,353 4,489 13,241 4,338Accounts payable 19,311 29,364 - 28,614Current notes 190,284 229,592 38,647 298,316Government crop loans - - - -Principal due on term debt 70,857 40,835 46,425 120,341
Total current farm liabilities 287,804 304,280 98,313 451,609
Total intermediate farm liabs 219,834 119,708 119,718 402,408Total long term farm liabilities 500,971 427,436 489,047 577,077Total farm liabilities 1,008,608 851,423 707,078 1,431,094
Total nonfarm liabilities 11,478 23,469 6,615 5,476Total liabilities 1,020,087 874,892 713,693 1,436,570
Net worth (farm and nonfarm) 2,251,519 1,026,735 1,509,864 4,030,238Net worth change 380,854 167,213 162,375 774,989Percent net worth change 20 % 19 % 12 % 24 %
Ratio AnalysisCurrent farm liabilities / assets 40 % 82 % 32 % 32 %Intermediate farm liab. / assets 20 % 27 % 15 % 21 %Long term farm liab. / assets 37 % 45 % 47 % 29 %Total debt to asset ratio 31 % 46 % 32 % 26 %
Annual Report RankEm © University of Minnesota
19

Balance Sheet at Market ValuesSnow College, Bridgerland ATC, Uintah Basin ATC
Farm/Ranch Management(Farms Sorted By Net Farm Income)
Avg. OfAll Farms Low 33% 33 - 66% High 34%
Number of farms 48 15 16 17
AssetsCurrent Farm Assets
Cash and checking balance 142,375 80,013 45,696 288,392Prepaid expenses & supplies 16,461 9,288 5,732 32,888Growing crops 2,610 1,220 3,586 2,919Accounts receivable 75,067 42,959 16,987 158,060Hedging accounts - - - -Crops held for sale or feed 252,405 128,535 141,180 466,384Crops under government loan - - - -Market livestock held for sale 221,798 103,610 93,113 447,196Other current assets 13,347 3,700 262 34,174
Total current farm assets 724,062 369,324 306,557 1,430,012
Intermediate Farm AssetsBreeding livestock 704,131 137,343 440,751 1,452,125Machinery and equipment 510,772 327,531 418,549 759,253Titled vehicles 65,273 32,087 61,759 97,862Other intermediate assets 39,427 1,413 6,532 103,929
Total intermediate farm assets 1,319,603 498,375 927,591 2,413,168
Long Term Farm AssetsFarm land 1,156,441 869,673 868,783 1,680,207Buildings and improvements 330,671 320,345 226,379 437,938Other long-term assets 190,363 29,405 316,024 214,116
Total long-term farm assets 1,677,475 1,219,423 1,411,186 2,332,262Total Farm Assets 3,721,140 2,087,123 2,645,335 6,175,442
Total Nonfarm Assets 127,354 153,819 86,210 142,725Total Assets 3,848,493 2,240,941 2,731,545 6,318,167
LiabilitiesCurrent Farm Liabilities
Accrued interest 7,353 4,489 13,241 4,338Accounts payable 19,311 29,364 - 28,614Current notes 190,284 229,592 38,647 298,316Government crop loans - - - -Principal due on term debt 70,857 40,835 46,425 120,341
Total current farm liabilities 287,804 304,280 98,313 451,609
Total intermediate farm liabs 219,834 119,708 119,718 402,408Total long term farm liabilities 500,971 427,436 489,047 577,077Total farm liabilities 1,008,608 851,423 707,078 1,431,094
Total nonfarm liabilities 11,478 23,469 6,615 5,476Total liabs excluding deferreds 1,020,087 874,892 713,693 1,436,570Total deferred liabilities 1,794 - - 5,066Total liabilities 1,021,881 874,892 713,693 1,441,636
Retained earnings 2,251,519 1,026,735 1,509,864 4,030,238Market valuation equity 575,094 339,315 507,988 846,292Net worth (farm and nonfarm) 2,826,612 1,366,050 2,017,851 4,876,531Net worth excluding deferreds 2,828,406 1,366,050 2,017,851 4,881,597Net worth change 432,588 165,988 205,539 881,517Percent net worth change 18 % 14 % 11 % 22 %
Ratio AnalysisCurrent farm liabilities / assets 40 % 82 % 32 % 32 %Intermediate farm liab. / assets 17 % 24 % 13 % 17 %Long term farm liab. / assets 30 % 35 % 35 % 25 %Total debt to asset ratio 27 % 39 % 26 % 23 %Debt to assets excl deferreds 27 % 39 % 26 % 23 %
Annual Report RankEm © University of Minnesota
20
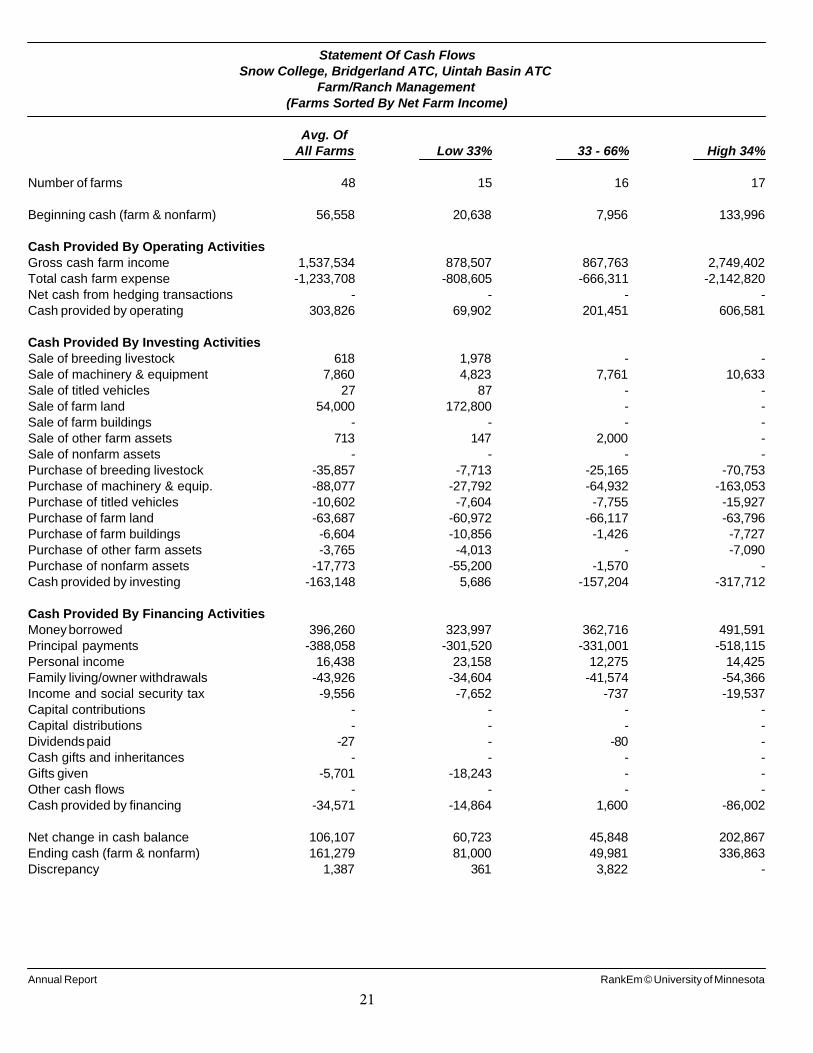
Statement Of Cash FlowsSnow College, Bridgerland ATC, Uintah Basin ATC
Farm/Ranch Management(Farms Sorted By Net Farm Income)
Avg. OfAll Farms Low 33% 33 - 66% High 34%
Number of farms 48 15 16 17
Beginning cash (farm & nonfarm) 56,558 20,638 7,956 133,996
Cash Provided By Operating Activities
Gross cash farm income 1,537,534 878,507 867,763 2,749,402
Total cash farm expense -1,233,708 -808,605 -666,311 -2,142,820
Net cash from hedging transactions - - - -
Cash provided by operating 303,826 69,902 201,451 606,581
Cash Provided By Investing Activities
Sale of breeding livestock 618 1,978 - -
Sale of machinery & equipment 7,860 4,823 7,761 10,633
Sale of titled vehicles 27 87 - -
Sale of farm land 54,000 172,800 - -
Sale of farm buildings - - - -
Sale of other farm assets 713 147 2,000 -
Sale of nonfarm assets - - - -
Purchase of breeding livestock -35,857 -7,713 -25,165 -70,753
Purchase of machinery & equip. -88,077 -27,792 -64,932 -163,053
Purchase of titled vehicles -10,602 -7,604 -7,755 -15,927
Purchase of farm land -63,687 -60,972 -66,117 -63,796
Purchase of farm buildings -6,604 -10,856 -1,426 -7,727
Purchase of other farm assets -3,765 -4,013 - -7,090
Purchase of nonfarm assets -17,773 -55,200 -1,570 -
Cash provided by investing -163,148 5,686 -157,204 -317,712
Cash Provided By Financing Activities
Money borrowed 396,260 323,997 362,716 491,591
Principal payments -388,058 -301,520 -331,001 -518,115
Personal income 16,438 23,158 12,275 14,425
Family living/owner withdrawals -43,926 -34,604 -41,574 -54,366
Income and social security tax -9,556 -7,652 -737 -19,537
Capital contributions - - - -
Capital distributions - - - -
Dividends paid -27 - -80 -
Cash gifts and inheritances - - - -
Gifts given -5,701 -18,243 - -
Other cash flows - - - -
Cash provided by financing -34,571 -14,864 1,600 -86,002
Net change in cash balance 106,107 60,723 45,848 202,867
Ending cash (farm & nonfarm) 161,279 81,000 49,981 336,863
Discrepancy 1,387 361 3,822 -
Annual Report RankEm © University of Minnesota
21

Crop Production and Marketing SummarySnow College, Bridgerland ATC, Uintah Basin ATC
Farm/Ranch Management(Farms Sorted By Net Farm Income)
Avg. OfAll Farms Low 33% 33 - 66% High 34%
Number of farms 48 15 16 17
Acreage Summary
Total acres owned 1,133 276 253 2,717
Total crop acres 465 252 310 798
Crop acres owned 335 177 208 594
Crop acres cash rented 130 75 102 204
Crop acres share rented - - - -
Total pasture acres 3,034 129 6 8,448
Percent crop acres owned 72 % 70 % 67 % 74 %
Mach invest/crop acre cost 1,022 1,326 1,090 912
Mach invest/crop acre market 1,133 1,423 1,208 1,025
Average Price Received (Cash Sales Only)
Hay, Alfalfa per ton 201.57 173.61 195.32 212.89
Corn Silage per ton 57.21 - 47.32 93.33
Corn per bushel 5.22 - - 4.90
Hay, Mixed per ton 53.74 - - 46.45
Pasture per aum 20.51 - - -
Average Yield Per Acre
Pasture (aum) 0.161 - - 0.158
Hay, Alfalfa (ton) 3.63 3.63 - -
Aftermath Grazing (aum) 2.16 - - 2.16
Hay, Mixed (ton) 1.36 - - -
Annual Report RankEm © University of Minnesota
22

Financial Standards Measures
This table contains the Farm Financial Standards Council’s 16 financial measures (ratios) for
evaluating a farm’s financial position and performance.
LIQUIDITY
Current Ratio is calculated by dividing the total current farm assets by the total current farm
liabilities. The higher the ratio, the greater the liquidity
Working Capital is calculated by subtracting current farm liabilities form current farm assets. It
measures the amount of funds available to purchase operating inputs and inventory, after the sale
of current farm assets and the payment of all current farm liabilities. Adequacy must be related
to business size.
SOLVENCY
Farm Debt to Asset Ratio is calculated by dividing the total farm liabilities by the total farm
assets. The higher the ratio, the greater the risk exposure of the business
Farm Equity to Asset Ratio is calculated by dividing farm equity or net worth by the total farm
assets. It measures the proportion of the farm assets financed by the owner’s equity as opposed
to debt. This is opposite of the debt to asset ratio. These two measures always add up to 100%
because they describe how total farm assets are financed. The higher the ratio, the more total
capital supplied by the owner and less by creditors.
Farm Debt to Equity Ratio measures farm debt relative to farm equity. It is calculated by
dividing the total farm liabilities by the total farm net worth. The debt to equity ratio measures
the amount of borrowed capital being employed for every dollar of equity capital. The higher
the ratio, the more capital supplied by creditors and less by the owner.
PROFITABILITY
Rate of Return on Farm Assets can be thought of as the average interest rate being earned on all
investments in the farm or ranch business. If assets are valued at market value, the rate of return
on assets can be looked at as the “opportunity cost” of farming versus alternative investments. If
assets are valued at cost value, the rate of return on assets more closely represents the actual
return on the average dollar invested in the farm. The rate of return on farm assets is calculated
as follows: Rate of Return on Assets = Net Farm Income + Farm Interest – Value of Operator’s
Labor & Management, and Average Farm Investment = (Beginning Total Farm Assets + Ending
Total Farm Assets) ÷2. The higher the value, the more profitable the farming operation
Rate of Return on Farm Equity represents the interest rate being earned on farm net worth. If
assets are valued at market value, this return can be compared to returns available if the assets
were liquidated and invested n alternate investments. If assets are valued at cost value, this more
closely represents the actual return on the funds that have been invested or retained in the
business. The rate of return on farm equity is calculated as follows: Rate of Return on Equity =
Return on Farm Equity ÷ Average Farm Net Worth, where: Return on Farm Equity = Net Farm
Income – Value of Operator’s Labor and Management, and Average Farm Net Worth =
(Beginning Farm Net Worth + Ending Farm Net Worth) ÷ 2. The higher the ratio, the more
profitable the farming operation
23

Operating Profit Margin is a measure of the operating efficiency of the business. It is calculated
as follows: Operating Profit Margin = Return to Farm Assets ÷ Value of Farm Production. If
expenses are held in line relative to the value of output produced, the farm will have a healthy
operating profit margin. A low profit margin may be caused by low prices, high operating
expenses, or inefficient production. The higher the ratio, the more efficient the business
Net Farm Income represents the returns to unpaid labor, management, and equity capital
invested in the business. Net Farm Income = farm revenues - farm expense + plus the gain or
loss on the sale of farm capital assets
REPAYMENT CAPACITY
Term Debt Coverage Ratio measures whether the business generated enough cash to cover term
debt payments. It is calculated by dividing the funds generated by the business for debt
repayment (Net Cash Farm Income + Non farm Income + Interest Expense – Family Living
Expense – Income Taxes) by the total term debt payments (annual scheduled principal and
interest payments on intermediate and long term debt). A ratio less than 100 percent indicates
that the business did not generate sufficient cash to meet the scheduled payments in the past year.
A ratio greater than 100 percent indicates the business generated enough cash to pay all term
debt payments.
Capital Replacement Margin is the amount of money remaining after all operating expenses,
taxes, family living costs, and scheduled debt payments have been made. It is the cash generated
by the farm business that is available for financing capital replacement such as machinery and
equipment. RankEm Central calculates the capital replacement margin by first adding interest
due on intermediate and long term loans to the amount available for principal payments. It then
subtracts scheduled principal and interest payments from this total.
EFFICIENCY
Asset Turnover Rate is a measure of efficiency in using capital. It is calculated as follows;
Asset Turnover Rate = Value of Farm Production ÷ Total Farm Assets. The higher the ratio the
greater the efficiency
The last four ratios reflect the distribution of gross income to cover operating expenses and
generate farm income. The sum of the operating expense ratio, the depreciation expense ratio,
and the interest expense ratio equals the percent of gross income used to pay business expenses.
The amount remaining is net farm income. The gross farm income used to calculate these ratios
is the accrual gross farm income.
Operating Expense Ratio is calculated as (Total Farm Operating Expense – Farm Interest
Expense) ÷ Gross Farm Income. This ratio indicates the percent of the gross farm income that
was used to pay operating expenses. Total farm operating expense is the accrual total operating
expense. The lower the ratio, the more efficient the business.
Depreciation Expense Ratio is calculated as Depreciation ÷ Gross Farm Income. This ratio
indicates the percent of the gross farm income that was used to cover depreciation and other
capital adjustments. The lower the ratio, the more efficient the business
24
Interest Expense Ratio is calculated as Farm Interest Expense ÷ Gross Farm Income. This ratio
indicates the percent of the gross farm income used for farm interest expenses. This is the same
ratio as the accrual interest as a percent of income from the Liquidity table. The lower the ratio,
the more efficient the business
Net Farm Income Ratio is calculated as Net Farm Income ÷ Gross Farm Income. This ratio
indicates the percent of the gross farm income that remained after all expenses. The higher the
ratio, the more efficient the business
25
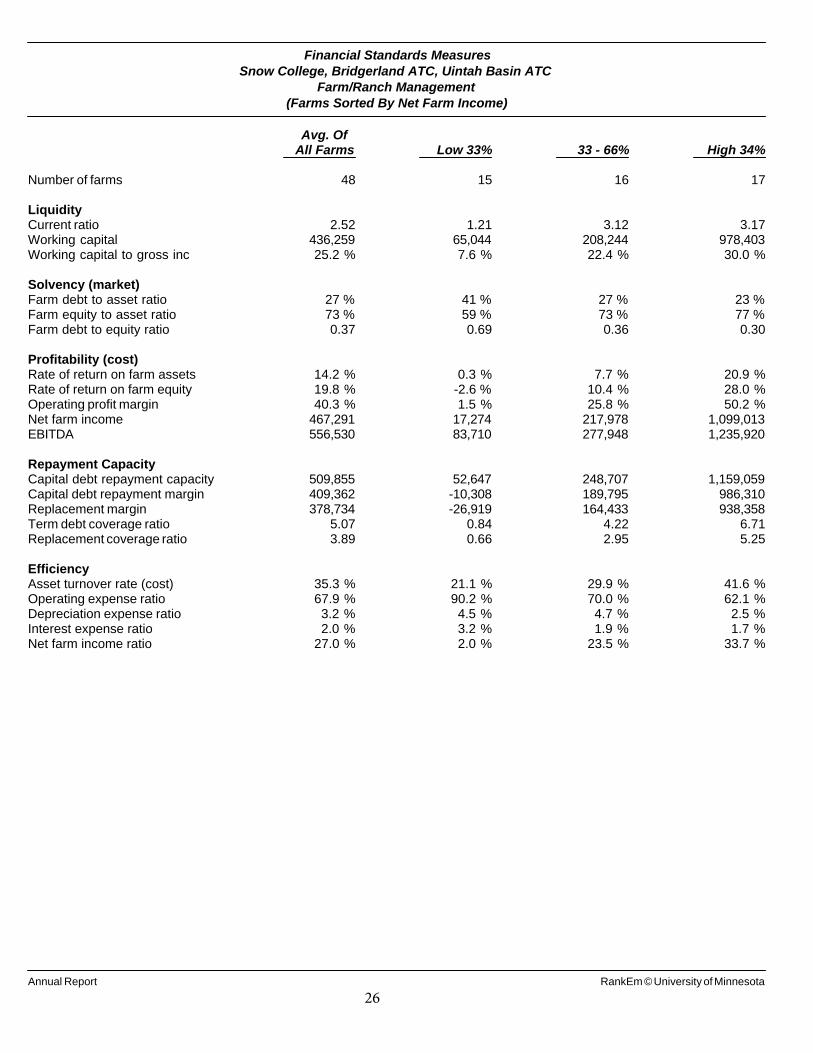
Financial Standards MeasuresSnow College, Bridgerland ATC, Uintah Basin ATC
Farm/Ranch Management(Farms Sorted By Net Farm Income)
Avg. OfAll Farms Low 33% 33 - 66% High 34%
Number of farms 48 15 16 17
LiquidityCurrent ratio 2.52 1.21 3.12 3.17Working capital 436,259 65,044 208,244 978,403Working capital to gross inc 25.2 % 7.6 % 22.4 % 30.0 %
Solvency (market)Farm debt to asset ratio 27 % 41 % 27 % 23 %Farm equity to asset ratio 73 % 59 % 73 % 77 %Farm debt to equity ratio 0.37 0.69 0.36 0.30
Profitability (cost)Rate of return on farm assets 14.2 % 0.3 % 7.7 % 20.9 %Rate of return on farm equity 19.8 % -2.6 % 10.4 % 28.0 %Operating profit margin 40.3 % 1.5 % 25.8 % 50.2 %Net farm income 467,291 17,274 217,978 1,099,013EBITDA 556,530 83,710 277,948 1,235,920
Repayment CapacityCapital debt repayment capacity 509,855 52,647 248,707 1,159,059Capital debt repayment margin 409,362 -10,308 189,795 986,310Replacement margin 378,734 -26,919 164,433 938,358Term debt coverage ratio 5.07 0.84 4.22 6.71Replacement coverage ratio 3.89 0.66 2.95 5.25
EfficiencyAsset turnover rate (cost) 35.3 % 21.1 % 29.9 % 41.6 %Operating expense ratio 67.9 % 90.2 % 70.0 % 62.1 %Depreciation expense ratio 3.2 % 4.5 % 4.7 % 2.5 %Interest expense ratio 2.0 % 3.2 % 1.9 % 1.7 %Net farm income ratio 27.0 % 2.0 % 23.5 % 33.7 %
Annual Report RankEm © University of Minnesota
26
Operator and Labor InformationSnow College, Bridgerland ATC, Uintah Basin ATC
Farm/Ranch Management(Farms Sorted By Net Farm Income)
Avg. OfAll Farms Low 33% 33 - 66% High 34%
Number of farms 48 15 16 17
Operator Information
Average number of operators 1.2 1.3 1.3 1.1
Average age of operators 49.3 44.6 48.8 53.9
Average number of years farming 26.5 21.9 26.7 30.3
Results Per Operator
Working capital 361,042 48,783 166,595 924,047
Total assets (market) 3,184,960 1,680,706 2,185,236 5,967,157
Total liabilities 845,695 656,169 570,955 1,361,545
Net worth (market) 2,339,265 1,024,537 1,614,281 4,605,612
Net worth excl deferred liabs 2,340,750 1,024,537 1,614,281 4,610,397
Gross farm income 1,433,588 643,456 742,111 3,079,820
Total farm expense 1,047,330 630,501 568,728 2,042,252
Net farm income from operations 386,258 12,955 173,383 1,037,568
Net nonfarm income 13,603 17,369 9,820 13,623
Family living & tax withdrawals 45,431 31,963 36,971 69,797
Total acres owned 937.6 207.2 202.6 2,565.8
Total crop acres 384.5 188.8 248.2 753.3
Crop acres owned 277.2 132.7 166.3 561.1
Crop acres cash rented 107.2 56.0 81.9 192.2
Crop acres share rented - - - -
Total pasture acres 2,511.2 96.9 4.5 7,978.9
Labor Analysis
Number of farms 47 15 15 17
Total unpaid labor hours 2,439 3,478 3,555 538
Total hired labor hours 10,168 4,563 4,064 20,498
Total labor hours per farm 12,607 8,042 7,619 21,036
Unpaid hours per operator 2,011 2,609 2,806 508
Value of farm production / hour 85.11 44.59 83.57 99.27
Net farm income / unpaid hour 194.71 4.97 63.54 2,040.89
Average hourly hired labor wage 10.89 12.51 20.50 8.90
Partnerships & LLCs
Number of farms 13 2 6 5
Number of operators 1.5 - 1.7 1.0
Owner withdrawals per farm 24,089 - - -
Withdrawals per operator 24,089 - - -
Corporations
Number of farms 7 3 1 3
Number of operators 1.6 2.0 - 1.3
Annual Report RankEm © University of Minnesota
27
Household and Personal ExpensesSnow College, Bridgerland ATC, Uintah Basin ATC
Farm/Ranch Management(Farms Sorted By Net Farm Income)
Avg. OfAll Farms
Number of farms 5
Average family size 3.4
Family Living Expenses
Food and meals expense 8,417
Medical care 3,472
Health insurance 3,525
Cash donations 2,569
Household supplies 1,590
Clothing 2,059
Personal care 1,945
Child / Dependent care 263
Alimony and child support -
Gifts 2,127
Education 1,406
Recreation 7,514
Utilities (household share) 1,532
Personal vehicle operating exp 780
Household real estate taxes -
Dwelling rent -
Household repairs 3,650
Personal interest 2,009
Disability / Long term care ins -
Life insurance payments 1,170
Personal property insurance -
Miscellaneous 1,356
Total cash family living expense 45,384
Family living from the farm 3,265
Total family living 48,649
Other Nonfarm Expenditures
Income taxes 19,952
Furnishing & appliance purchases -
Nonfarm vehicle purchases 5,600
Nonfarm real estate purchases -
Other nonfarm capital purchases 160,000
Nonfarm savings & investments -
Total other nonfarm expenditures 185,552
Total cash family living
investment & nonfarm capital purch 230,936
Annual Report RankEm © University of Minnesota
28
Nonfarm SummarySnow College, Bridgerland ATC, Uintah Basin ATC
Farm/Ranch Management(Farms Sorted By Net Farm Income)
Avg. OfAll Farms Low 33% 33 - 66% High 34%
Number of farms 48 15 16 17
Nonfarm Income
Personal wages & salary 4,654 9,056 6,855 -1,303
Net nonfarm business income 10,241 12,637 5,097 12,968
Personal rental income 133 425 - -
Personal interest income 1 0 3 -
Personal cash dividends 7 - 21 -
Tax refunds 340 741 300 23
Other nonfarm income 1,063 299 - 2,736
Total nonfarm income 16,438 23,158 12,275 14,425
Gifts and inheritances - - - -
Nonfarm Assets (market)
Checking & savings 18,904 988 4,284 48,471
Stocks & bonds 7,921 - 319 22,064
Other current assets 1,303 2,640 1,434 -
Furniture & appliances 5,583 5,667 4,063 6,941
Nonfarm vehicles 7,436 6,676 6,798 8,706
Cash value of life ins. 83 - - 235
Retirement accounts 5,345 14,048 2,500 344
Other intermediate assets 833 2,667 - -
Nonfarm real estate 51,234 67,800 31,188 55,484
Personal bus. investment 170 - - 480
Other long term assets 28,542 53,333 35,625 -
Total nonfarm assets 127,354 153,819 86,210 142,725
Nonfarm Liabilities
Accrued interest 102 317 5 2
Accounts payable - - - -
Current notes - - - -
Princ due on term debt 1,250 957 206 2,490
Total current liabilities 1,352 1,275 212 2,492
Intermediate liabilities 831 817 261 1,379
Long term liabilities 9,296 21,377 6,142 1,604
Total nonfarm liabilities 11,478 23,469 6,615 5,476
Nonfarm net worth 115,875 130,350 79,595 137,249
Nonfarm debt to asset ratio 9 % 15 % 8 % 4 %
Annual Report RankEm © University of Minnesota
29
Financial SummarySnow College, Bridgerland ATC, Uintah Basin ATC
Farm/Ranch Management(Farms Sorted By Net Farm Income)
Avg. OfAll Farms Low 33% 33 - 66% High 34%
Number of farms 48 15 16 17
Income StatementGross cash farm income 1,537,534 878,507 867,763 2,749,402Total cash farm expense 1,233,708 808,605 666,311 2,142,820Net cash farm income 303,826 69,902 201,451 606,581Inventory change 218,442 -13,716 59,262 573,102Depreciation -55,538 -38,912 -43,986 -81,082Net farm income from operations 466,729 17,274 216,728 1,098,602Gain or loss on capital sales 563 - 1,250 412Average net farm income 467,291 17,274 217,978 1,099,013Median net farm income 219,248 15,238 211,443 599,701
Profitability (cost)Rate of return on assets 14.2 % 0.3 % 7.7 % 20.9 %Rate of return on equity 19.8 % -2.6 % 10.4 % 28.0 %Operating profit margin 40.3 % 1.5 % 25.8 % 50.2 %Asset turnover rate 35.3 % 21.1 % 29.9 % 41.6 %
Profitability (market)Rate of return on assets 13.6 % 0.2 % 8.0 % 20.0 %Rate of return on equity 17.7 % -2.0 % 10.0 % 25.6 %Operating profit margin 45.3 % 1.2 % 32.8 % 55.4 %Asset turnover rate 30.0 % 17.7 % 24.2 % 36.1 %
Liquidity & Repayment (end of year)Current assets 724,062 369,324 306,557 1,430,012Current liabilities 287,804 304,280 98,313 451,609Current ratio 2.52 1.21 3.12 3.17Working capital 436,259 65,044 208,244 978,403Working capital to gross inc 25.2 % 7.6 % 22.4 % 30.0 %Term debt coverage ratio 5.07 0.84 4.22 6.71Replacement coverage ratio 3.89 0.66 2.95 5.25Term debt to EBITDA 1.30 5.77 1.96 0.89
Solvency (end of year at cost)Number of farms 48 15 16 17Total assets 3,271,605 1,901,627 2,223,557 5,466,808Total liabilities 1,020,087 874,892 713,693 1,436,570Net worth 2,251,519 1,026,735 1,509,864 4,030,238Net worth change 380,854 167,213 162,375 774,989Farm debt to asset ratio 32 % 48 % 33 % 27 %Total debt to asset ratio 31 % 46 % 32 % 26 %Change in earned net worth % 20 % 19 % 12 % 24 %
Solvency (end of year at market)Number of farms 48 15 16 17Total assets 3,848,493 2,240,941 2,731,545 6,318,167Total liabilities 1,021,881 874,892 713,693 1,441,636Net worth 2,826,612 1,366,050 2,017,851 4,876,531Total net worth change 432,588 165,988 205,539 881,517Farm debt to asset ratio 27 % 41 % 27 % 23 %Total debt to asset ratio 27 % 39 % 26 % 23 %Change in total net worth % 18 % 14 % 11 % 22 %
Nonfarm InformationNet nonfarm income 16,438 23,158 12,275 14,425Farms reporting living expenses 5 2 2 1Total family living expense 48,649 - - -Total living, invest, cap. purch 230,936 - - -
Crop AcresTotal crop acres 465 252 310 798Total crop acres owned 335 177 208 594Total crop acres cash rented 130 75 102 204Total crop acres share rented - - - -Machinery value per crop acre 1,133 1,423 1,208 1,025
Annual Report RankEm © University of Minnesota
30
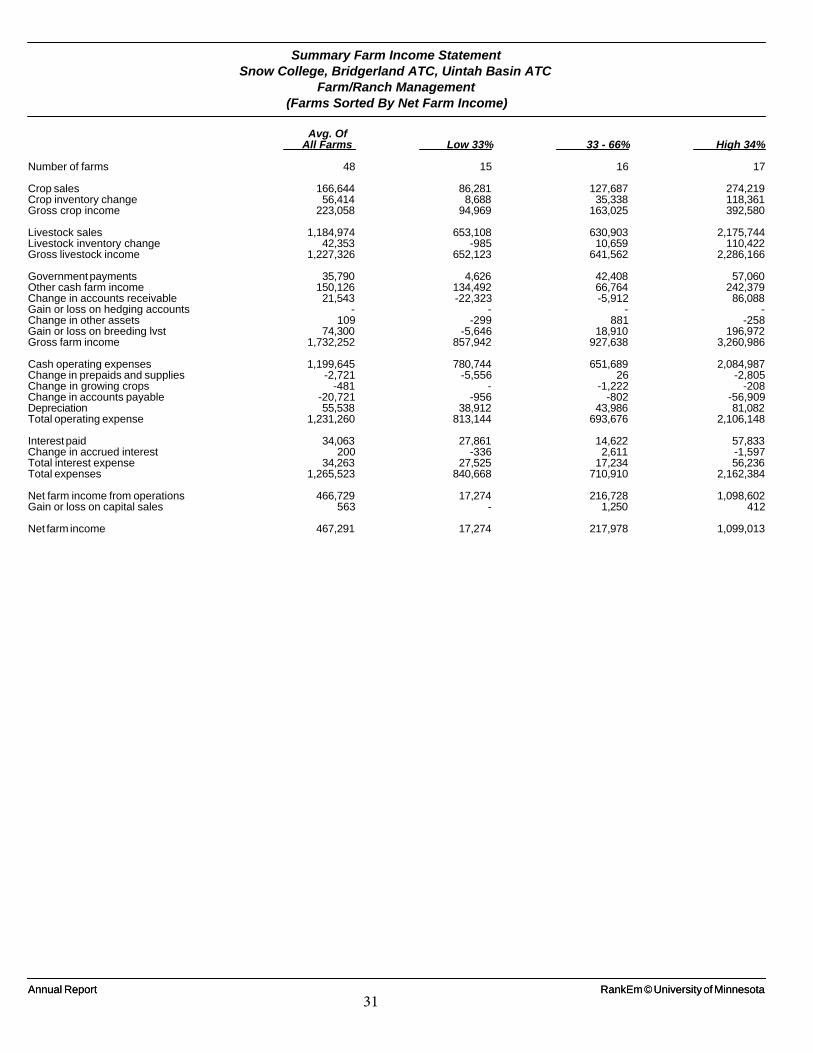
Summary Farm Income StatementSnow College, Bridgerland ATC, Uintah Basin ATC
Farm/Ranch Management(Farms Sorted By Net Farm Income)
Avg. OfAll Farms Low 33% 33 - 66% High 34%
Number of farms 48 15 16 17
Crop sales 166,644 86,281 127,687 274,219Crop inventory change 56,414 8,688 35,338 118,361Gross crop income 223,058 94,969 163,025 392,580
Livestock sales 1,184,974 653,108 630,903 2,175,744Livestock inventory change 42,353 -985 10,659 110,422Gross livestock income 1,227,326 652,123 641,562 2,286,166
Government payments 35,790 4,626 42,408 57,060Other cash farm income 150,126 134,492 66,764 242,379Change in accounts receivable 21,543 -22,323 -5,912 86,088Gain or loss on hedging accounts - - - -Change in other assets 109 -299 881 -258Gain or loss on breeding lvst 74,300 -5,646 18,910 196,972Gross farm income 1,732,252 857,942 927,638 3,260,986
Cash operating expenses 1,199,645 780,744 651,689 2,084,987Change in prepaids and supplies -2,721 -5,556 26 -2,805Change in growing crops -481 - -1,222 -208Change in accounts payable -20,721 -956 -802 -56,909Depreciation 55,538 38,912 43,986 81,082Total operating expense 1,231,260 813,144 693,676 2,106,148
Interest paid 34,063 27,861 14,622 57,833Change in accrued interest 200 -336 2,611 -1,597Total interest expense 34,263 27,525 17,234 56,236Total expenses 1,265,523 840,668 710,910 2,162,384
Net farm income from operations 466,729 17,274 216,728 1,098,602Gain or loss on capital sales 563 - 1,250 412
Net farm income 467,291 17,274 217,978 1,099,013
Annual Report RankEm © University of MinnesotaAnnual Report RankEm © University of Minnesota
31
Crop Reports The crop enterprise analysis tables show the average returns and expenses per acre for crops
grown by participating producers. There are potentially three reports for each crop, owned, cash
rented and share crop rented acres. There may not be enough observations (a minimum of three
is required) for each of these types of farmed acres. There are eight general sections to each
report which are outlined as follows.
1. Number of farms and fields included for each crop.
2. The gross returns section indicates the gross receipts from producing each crop.
The value per unit represents what the crop could have been sold for in the local
market. In many cases these crops were fed to livestock owned by the farm. The
gross returns reflect the value of production if sold not their value as feed fed.
3. Direct expenses represent the costs that were incurred to grow the crop. Most
direct expenses are directly assigned to production of the crop and simply divided
by acres. Some, such as Fuel and Oil and Repairs, which are difficult to assign
directly to specific crops are determined by allocating the total annual expenses
across all enterprises using allocation factors entered for each crop.
4. Overhead expenses represent the portion of the general overhead expenses that
were allocated to this crop. No perfect system exists for allocating these costs,
but these allocations are believed to be representative of the costs for this crop.
5. The net returns section represent the returns to the owner for his labor,
management and equity capital. A return is also allocated for the operators labor
and management which subtracted from net returns to the operator for his equity.
6. The sixth section provides a summary of the costs per unit of production which
can be used to compare the prices that could be potentially received.
7. Machinery cost per acre is the sum of fuel and oil, repairs, custom hire, machinery
lease payments and depreciation, and interest on intermediate debt divided by
acres.
8. Estimated labor hours per acre is calculated by allocating the farmer’s estimate of
total operator and hired labor hours for the year across all enterprises.
There are enough observations for some crops (e.g. alfalfa) to show the amount of variation that
exists in the costs and returns. In these cases, it clearly shows that costs are the primary variable
that affects net returns – production and prices are generally similar for the high, mid and low
profit farms.
32
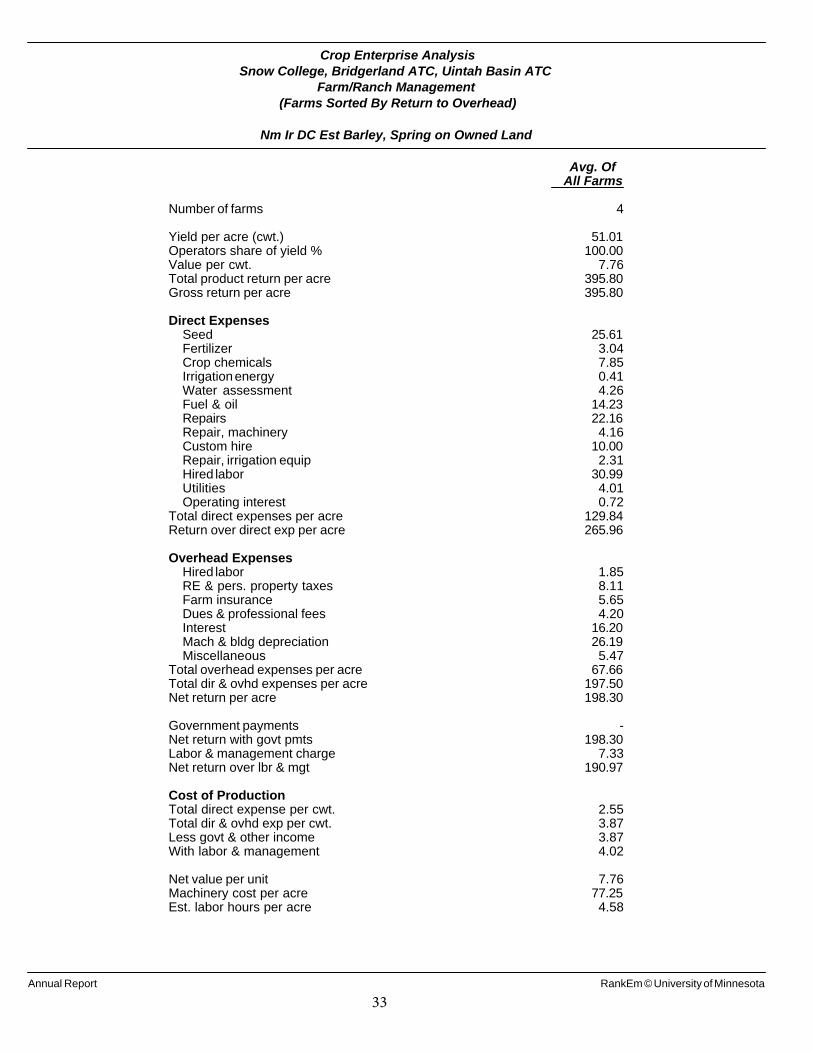
Crop Enterprise AnalysisSnow College, Bridgerland ATC, Uintah Basin ATC
Farm/Ranch Management(Farms Sorted By Return to Overhead)
Nm Ir DC Est Barley, Spring on Owned Land
Avg. OfAll Farms
Number of farms 4
Yield per acre (cwt.) 51.01Operators share of yield % 100.00Value per cwt. 7.76Total product return per acre 395.80Gross return per acre 395.80
Direct ExpensesSeed 25.61Fertilizer 3.04Crop chemicals 7.85Irrigation energy 0.41Water assessment 4.26Fuel & oil 14.23Repairs 22.16Repair, machinery 4.16Custom hire 10.00Repair, irrigation equip 2.31Hired labor 30.99Utilities 4.01Operating interest 0.72
Total direct expenses per acre 129.84Return over direct exp per acre 265.96
Overhead ExpensesHired labor 1.85RE & pers. property taxes 8.11Farm insurance 5.65Dues & professional fees 4.20Interest 16.20Mach & bldg depreciation 26.19Miscellaneous 5.47
Total overhead expenses per acre 67.66Total dir & ovhd expenses per acre 197.50Net return per acre 198.30
Government payments -Net return with govt pmts 198.30Labor & management charge 7.33Net return over lbr & mgt 190.97
Cost of ProductionTotal direct expense per cwt. 2.55Total dir & ovhd exp per cwt. 3.87Less govt & other income 3.87With labor & management 4.02
Net value per unit 7.76Machinery cost per acre 77.25Est. labor hours per acre 4.58
Annual Report RankEm © University of Minnesota
33

Crop Enterprise AnalysisSnow College, Bridgerland ATC, Uintah Basin ATC
Farm/Ranch Management(Farms Sorted By Return to Overhead)
Nm Ir DC Est Corn on Owned Land
Avg. OfAll Farms High 34%
Number of farms 7 3
Yield per acre (bu.) 168.47 181.93Operators share of yield % 100.00 100.00Value per bu. 4.48 4.48Total product return per acre 755.51 815.06Other crop income per acre 4.82 -Gross return per acre 760.33 815.06
Direct ExpensesSeed 92.78 92.48Fertilizer 157.54 163.48Crop chemicals 32.24 25.39Crop insurance 3.31 -Irrigation energy 32.63 12.18Water assessment 16.07 13.18Packaging and supplies 8.77 24.50Fuel & oil 43.81 28.75Repairs 41.65 12.16Repair, machinery 6.84 5.83Custom hire 54.00 15.31Repair, buildings 2.02 0.21Repair, irrigation equip 18.57 5.63Hired labor 6.63 -Utilities 2.13 -Operating interest 7.93 0.62Miscellaneous 6.96 -
Total direct expenses per acre 533.89 399.72Return over direct exp per acre 226.44 415.34
Overhead ExpensesHired labor 13.98 20.90Machinery leases 1.90 0.36RE & pers. property taxes 7.40 5.67Farm insurance 6.61 5.62Utilities 1.47 4.10Dues & professional fees 3.92 1.45Interest 32.29 5.25Mach & bldg depreciation 70.04 29.09Miscellaneous 4.92 4.13
Total overhead expenses per acre 142.53 76.57Total dir & ovhd expenses per acre 676.43 476.29Net return per acre 83.91 338.77
Government payments 15.63 -Net return with govt pmts 99.53 338.77Labor & management charge 84.78 76.31Net return over lbr & mgt 14.75 262.46
Cost of ProductionTotal direct expense per bu. 3.17 2.20Total dir & ovhd exp per bu. 4.02 2.62Less govt & other income 3.89 2.62With labor & management 4.40 3.04
Net value per unit 4.48 4.48Machinery cost per acre 215.32 89.86Est. labor hours per acre 7.22 6.36
Annual Report RankEm © University of Minnesota
34
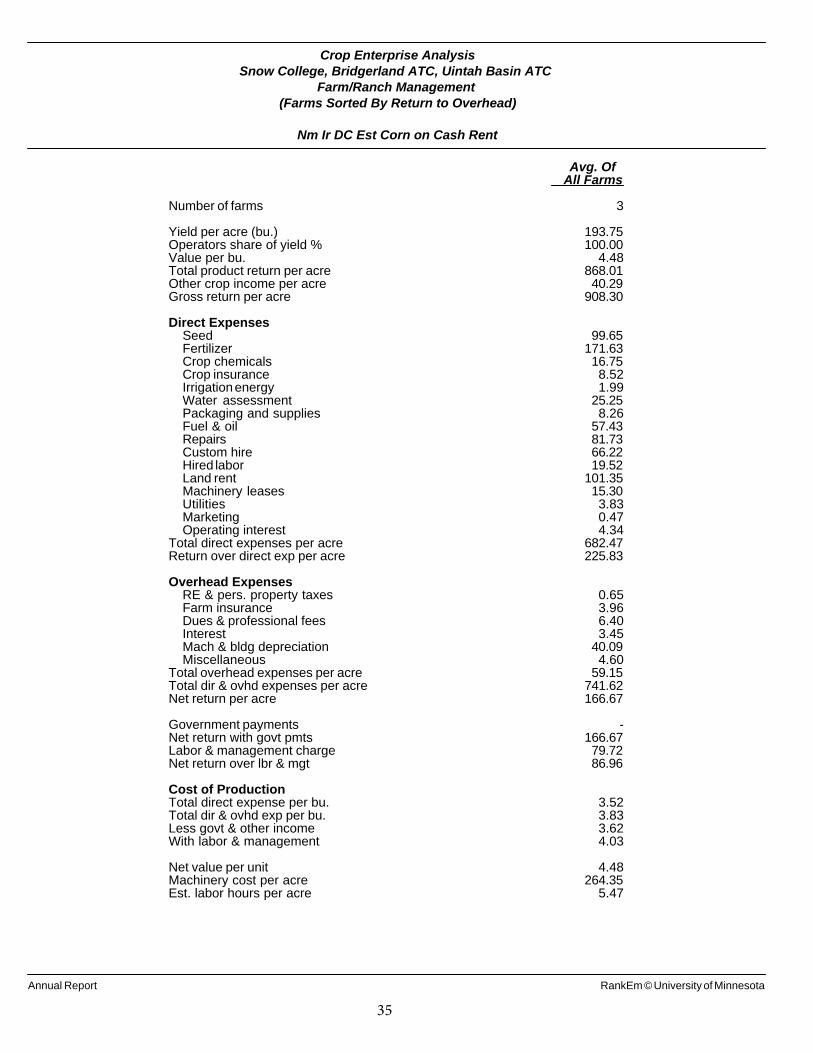
Crop Enterprise AnalysisSnow College, Bridgerland ATC, Uintah Basin ATC
Farm/Ranch Management(Farms Sorted By Return to Overhead)
Nm Ir DC Est Corn on Cash Rent
Avg. OfAll Farms
Number of farms 3
Yield per acre (bu.) 193.75Operators share of yield % 100.00Value per bu. 4.48Total product return per acre 868.01Other crop income per acre 40.29Gross return per acre 908.30
Direct ExpensesSeed 99.65Fertilizer 171.63Crop chemicals 16.75Crop insurance 8.52Irrigation energy 1.99Water assessment 25.25Packaging and supplies 8.26Fuel & oil 57.43Repairs 81.73Custom hire 66.22Hired labor 19.52Land rent 101.35Machinery leases 15.30Utilities 3.83Marketing 0.47Operating interest 4.34
Total direct expenses per acre 682.47Return over direct exp per acre 225.83
Overhead ExpensesRE & pers. property taxes 0.65Farm insurance 3.96Dues & professional fees 6.40Interest 3.45Mach & bldg depreciation 40.09Miscellaneous 4.60
Total overhead expenses per acre 59.15Total dir & ovhd expenses per acre 741.62Net return per acre 166.67
Government payments -Net return with govt pmts 166.67Labor & management charge 79.72Net return over lbr & mgt 86.96
Cost of ProductionTotal direct expense per bu. 3.52Total dir & ovhd exp per bu. 3.83Less govt & other income 3.62With labor & management 4.03
Net value per unit 4.48Machinery cost per acre 264.35Est. labor hours per acre 5.47
Annual Report RankEm © University of Minnesota
35
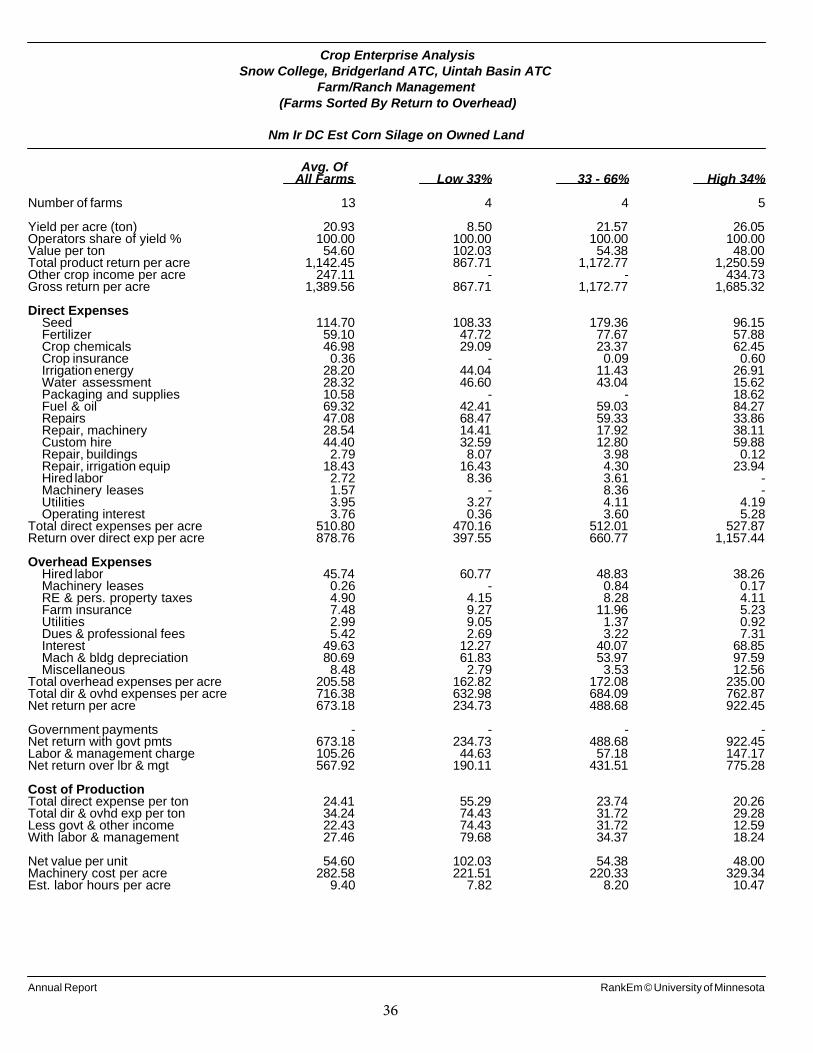
Crop Enterprise AnalysisSnow College, Bridgerland ATC, Uintah Basin ATC
Farm/Ranch Management(Farms Sorted By Return to Overhead)
Nm Ir DC Est Corn Silage on Owned Land
Avg. OfAll Farms Low 33% 33 - 66% High 34%
Number of farms 13 4 4 5
Yield per acre (ton) 20.93 8.50 21.57 26.05Operators share of yield % 100.00 100.00 100.00 100.00Value per ton 54.60 102.03 54.38 48.00Total product return per acre 1,142.45 867.71 1,172.77 1,250.59Other crop income per acre 247.11 - - 434.73Gross return per acre 1,389.56 867.71 1,172.77 1,685.32
Direct ExpensesSeed 114.70 108.33 179.36 96.15Fertilizer 59.10 47.72 77.67 57.88Crop chemicals 46.98 29.09 23.37 62.45Crop insurance 0.36 - 0.09 0.60Irrigation energy 28.20 44.04 11.43 26.91Water assessment 28.32 46.60 43.04 15.62Packaging and supplies 10.58 - - 18.62Fuel & oil 69.32 42.41 59.03 84.27Repairs 47.08 68.47 59.33 33.86Repair, machinery 28.54 14.41 17.92 38.11Custom hire 44.40 32.59 12.80 59.88Repair, buildings 2.79 8.07 3.98 0.12Repair, irrigation equip 18.43 16.43 4.30 23.94Hired labor 2.72 8.36 3.61 -Machinery leases 1.57 - 8.36 -Utilities 3.95 3.27 4.11 4.19Operating interest 3.76 0.36 3.60 5.28
Total direct expenses per acre 510.80 470.16 512.01 527.87Return over direct exp per acre 878.76 397.55 660.77 1,157.44
Overhead ExpensesHired labor 45.74 60.77 48.83 38.26Machinery leases 0.26 - 0.84 0.17RE & pers. property taxes 4.90 4.15 8.28 4.11Farm insurance 7.48 9.27 11.96 5.23Utilities 2.99 9.05 1.37 0.92Dues & professional fees 5.42 2.69 3.22 7.31Interest 49.63 12.27 40.07 68.85Mach & bldg depreciation 80.69 61.83 53.97 97.59Miscellaneous 8.48 2.79 3.53 12.56
Total overhead expenses per acre 205.58 162.82 172.08 235.00Total dir & ovhd expenses per acre 716.38 632.98 684.09 762.87Net return per acre 673.18 234.73 488.68 922.45
Government payments - - - -Net return with govt pmts 673.18 234.73 488.68 922.45Labor & management charge 105.26 44.63 57.18 147.17Net return over lbr & mgt 567.92 190.11 431.51 775.28
Cost of ProductionTotal direct expense per ton 24.41 55.29 23.74 20.26Total dir & ovhd exp per ton 34.24 74.43 31.72 29.28Less govt & other income 22.43 74.43 31.72 12.59With labor & management 27.46 79.68 34.37 18.24
Net value per unit 54.60 102.03 54.38 48.00Machinery cost per acre 282.58 221.51 220.33 329.34Est. labor hours per acre 9.40 7.82 8.20 10.47
Annual Report RankEm © University of Minnesota
36
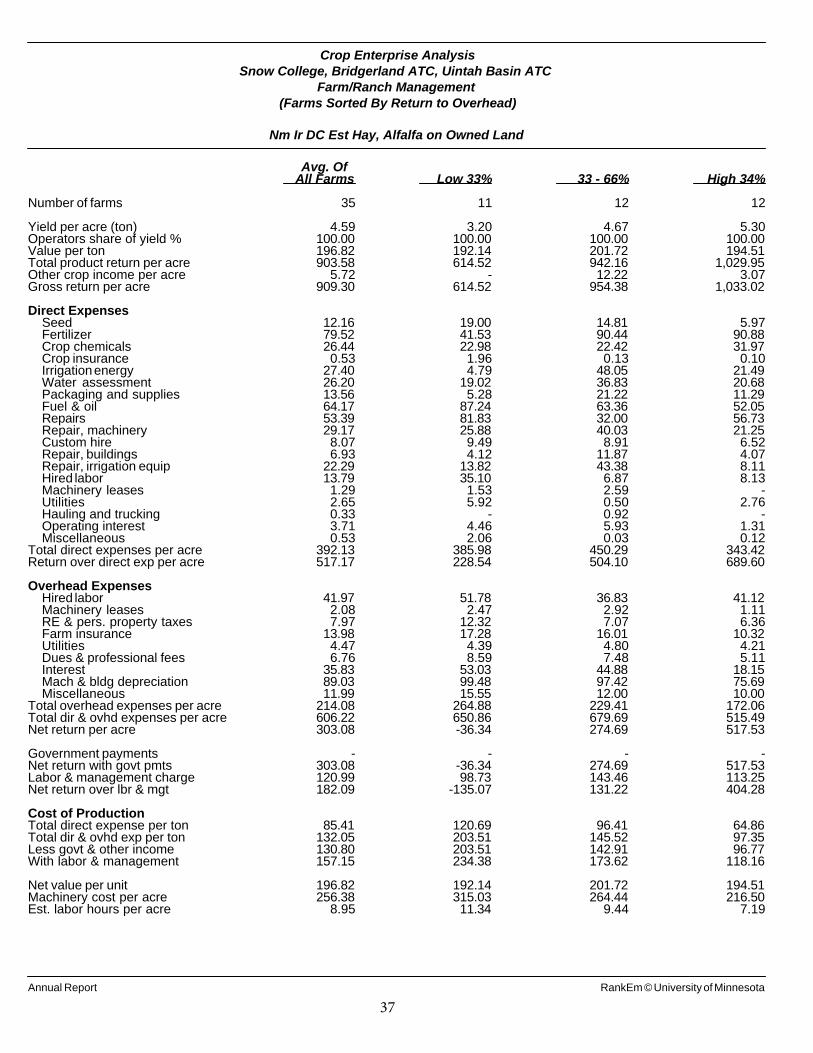
Crop Enterprise AnalysisSnow College, Bridgerland ATC, Uintah Basin ATC
Farm/Ranch Management(Farms Sorted By Return to Overhead)
Nm Ir DC Est Hay, Alfalfa on Owned Land
Avg. OfAll Farms Low 33% 33 - 66% High 34%
Number of farms 35 11 12 12
Yield per acre (ton) 4.59 3.20 4.67 5.30Operators share of yield % 100.00 100.00 100.00 100.00Value per ton 196.82 192.14 201.72 194.51Total product return per acre 903.58 614.52 942.16 1,029.95Other crop income per acre 5.72 - 12.22 3.07Gross return per acre 909.30 614.52 954.38 1,033.02
Direct ExpensesSeed 12.16 19.00 14.81 5.97Fertilizer 79.52 41.53 90.44 90.88Crop chemicals 26.44 22.98 22.42 31.97Crop insurance 0.53 1.96 0.13 0.10Irrigation energy 27.40 4.79 48.05 21.49Water assessment 26.20 19.02 36.83 20.68Packaging and supplies 13.56 5.28 21.22 11.29Fuel & oil 64.17 87.24 63.36 52.05Repairs 53.39 81.83 32.00 56.73Repair, machinery 29.17 25.88 40.03 21.25Custom hire 8.07 9.49 8.91 6.52Repair, buildings 6.93 4.12 11.87 4.07Repair, irrigation equip 22.29 13.82 43.38 8.11Hired labor 13.79 35.10 6.87 8.13Machinery leases 1.29 1.53 2.59 -Utilities 2.65 5.92 0.50 2.76Hauling and trucking 0.33 - 0.92 -Operating interest 3.71 4.46 5.93 1.31Miscellaneous 0.53 2.06 0.03 0.12
Total direct expenses per acre 392.13 385.98 450.29 343.42Return over direct exp per acre 517.17 228.54 504.10 689.60
Overhead ExpensesHired labor 41.97 51.78 36.83 41.12Machinery leases 2.08 2.47 2.92 1.11RE & pers. property taxes 7.97 12.32 7.07 6.36Farm insurance 13.98 17.28 16.01 10.32Utilities 4.47 4.39 4.80 4.21Dues & professional fees 6.76 8.59 7.48 5.11Interest 35.83 53.03 44.88 18.15Mach & bldg depreciation 89.03 99.48 97.42 75.69Miscellaneous 11.99 15.55 12.00 10.00
Total overhead expenses per acre 214.08 264.88 229.41 172.06Total dir & ovhd expenses per acre 606.22 650.86 679.69 515.49Net return per acre 303.08 -36.34 274.69 517.53
Government payments - - - -Net return with govt pmts 303.08 -36.34 274.69 517.53Labor & management charge 120.99 98.73 143.46 113.25Net return over lbr & mgt 182.09 -135.07 131.22 404.28
Cost of ProductionTotal direct expense per ton 85.41 120.69 96.41 64.86Total dir & ovhd exp per ton 132.05 203.51 145.52 97.35Less govt & other income 130.80 203.51 142.91 96.77With labor & management 157.15 234.38 173.62 118.16
Net value per unit 196.82 192.14 201.72 194.51Machinery cost per acre 256.38 315.03 264.44 216.50Est. labor hours per acre 8.95 11.34 9.44 7.19
Annual Report RankEm © University of Minnesota
37
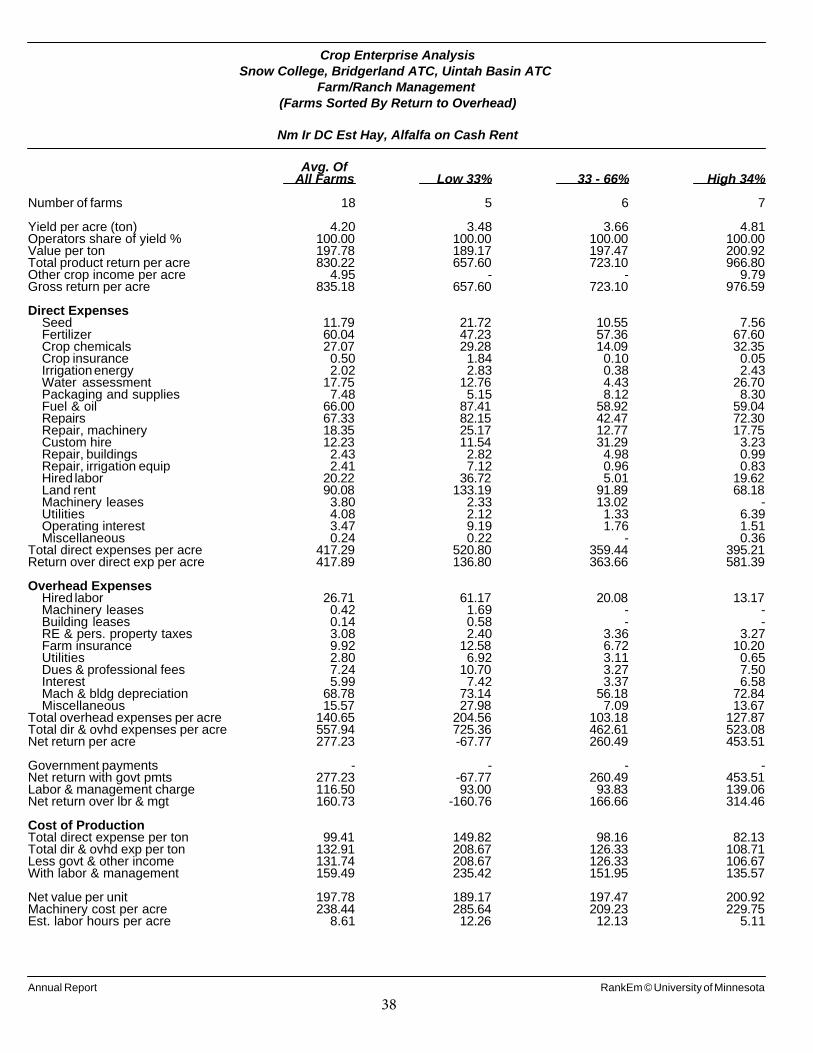
Crop Enterprise AnalysisSnow College, Bridgerland ATC, Uintah Basin ATC
Farm/Ranch Management(Farms Sorted By Return to Overhead)
Nm Ir DC Est Hay, Alfalfa on Cash Rent
Avg. OfAll Farms Low 33% 33 - 66% High 34%
Number of farms 18 5 6 7
Yield per acre (ton) 4.20 3.48 3.66 4.81Operators share of yield % 100.00 100.00 100.00 100.00Value per ton 197.78 189.17 197.47 200.92Total product return per acre 830.22 657.60 723.10 966.80Other crop income per acre 4.95 - - 9.79Gross return per acre 835.18 657.60 723.10 976.59
Direct ExpensesSeed 11.79 21.72 10.55 7.56Fertilizer 60.04 47.23 57.36 67.60Crop chemicals 27.07 29.28 14.09 32.35Crop insurance 0.50 1.84 0.10 0.05Irrigation energy 2.02 2.83 0.38 2.43Water assessment 17.75 12.76 4.43 26.70Packaging and supplies 7.48 5.15 8.12 8.30Fuel & oil 66.00 87.41 58.92 59.04Repairs 67.33 82.15 42.47 72.30Repair, machinery 18.35 25.17 12.77 17.75Custom hire 12.23 11.54 31.29 3.23Repair, buildings 2.43 2.82 4.98 0.99Repair, irrigation equip 2.41 7.12 0.96 0.83Hired labor 20.22 36.72 5.01 19.62Land rent 90.08 133.19 91.89 68.18Machinery leases 3.80 2.33 13.02 -Utilities 4.08 2.12 1.33 6.39Operating interest 3.47 9.19 1.76 1.51Miscellaneous 0.24 0.22 - 0.36
Total direct expenses per acre 417.29 520.80 359.44 395.21Return over direct exp per acre 417.89 136.80 363.66 581.39
Overhead ExpensesHired labor 26.71 61.17 20.08 13.17Machinery leases 0.42 1.69 - -Building leases 0.14 0.58 - -RE & pers. property taxes 3.08 2.40 3.36 3.27Farm insurance 9.92 12.58 6.72 10.20Utilities 2.80 6.92 3.11 0.65Dues & professional fees 7.24 10.70 3.27 7.50Interest 5.99 7.42 3.37 6.58Mach & bldg depreciation 68.78 73.14 56.18 72.84Miscellaneous 15.57 27.98 7.09 13.67
Total overhead expenses per acre 140.65 204.56 103.18 127.87Total dir & ovhd expenses per acre 557.94 725.36 462.61 523.08Net return per acre 277.23 -67.77 260.49 453.51
Government payments - - - -Net return with govt pmts 277.23 -67.77 260.49 453.51Labor & management charge 116.50 93.00 93.83 139.06Net return over lbr & mgt 160.73 -160.76 166.66 314.46
Cost of ProductionTotal direct expense per ton 99.41 149.82 98.16 82.13Total dir & ovhd exp per ton 132.91 208.67 126.33 108.71Less govt & other income 131.74 208.67 126.33 106.67With labor & management 159.49 235.42 151.95 135.57
Net value per unit 197.78 189.17 197.47 200.92Machinery cost per acre 238.44 285.64 209.23 229.75Est. labor hours per acre 8.61 12.26 12.13 5.11
Annual Report RankEm © University of Minnesota
38
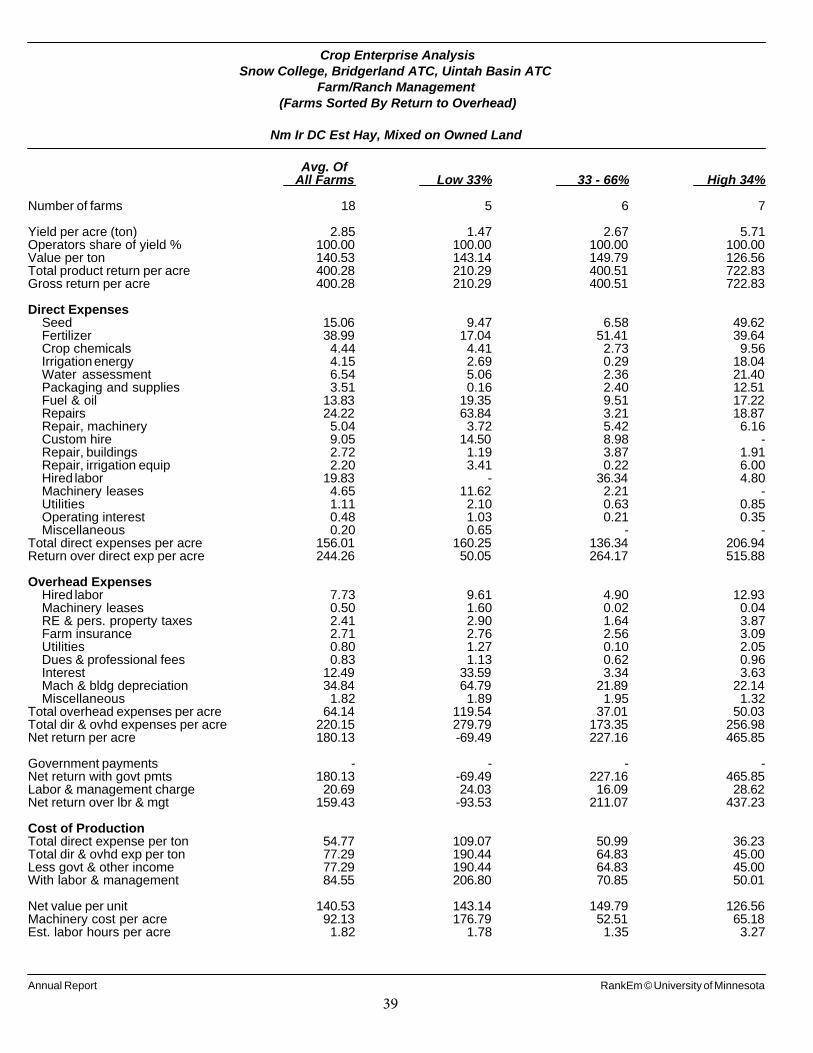
Crop Enterprise AnalysisSnow College, Bridgerland ATC, Uintah Basin ATC
Farm/Ranch Management(Farms Sorted By Return to Overhead)
Nm Ir DC Est Hay, Mixed on Owned Land
Avg. OfAll Farms Low 33% 33 - 66% High 34%
Number of farms 18 5 6 7
Yield per acre (ton) 2.85 1.47 2.67 5.71Operators share of yield % 100.00 100.00 100.00 100.00Value per ton 140.53 143.14 149.79 126.56Total product return per acre 400.28 210.29 400.51 722.83Gross return per acre 400.28 210.29 400.51 722.83
Direct ExpensesSeed 15.06 9.47 6.58 49.62Fertilizer 38.99 17.04 51.41 39.64Crop chemicals 4.44 4.41 2.73 9.56Irrigation energy 4.15 2.69 0.29 18.04Water assessment 6.54 5.06 2.36 21.40Packaging and supplies 3.51 0.16 2.40 12.51Fuel & oil 13.83 19.35 9.51 17.22Repairs 24.22 63.84 3.21 18.87Repair, machinery 5.04 3.72 5.42 6.16Custom hire 9.05 14.50 8.98 -Repair, buildings 2.72 1.19 3.87 1.91Repair, irrigation equip 2.20 3.41 0.22 6.00Hired labor 19.83 - 36.34 4.80Machinery leases 4.65 11.62 2.21 -Utilities 1.11 2.10 0.63 0.85Operating interest 0.48 1.03 0.21 0.35Miscellaneous 0.20 0.65 - -
Total direct expenses per acre 156.01 160.25 136.34 206.94Return over direct exp per acre 244.26 50.05 264.17 515.88
Overhead ExpensesHired labor 7.73 9.61 4.90 12.93Machinery leases 0.50 1.60 0.02 0.04RE & pers. property taxes 2.41 2.90 1.64 3.87Farm insurance 2.71 2.76 2.56 3.09Utilities 0.80 1.27 0.10 2.05Dues & professional fees 0.83 1.13 0.62 0.96Interest 12.49 33.59 3.34 3.63Mach & bldg depreciation 34.84 64.79 21.89 22.14Miscellaneous 1.82 1.89 1.95 1.32
Total overhead expenses per acre 64.14 119.54 37.01 50.03Total dir & ovhd expenses per acre 220.15 279.79 173.35 256.98Net return per acre 180.13 -69.49 227.16 465.85
Government payments - - - -Net return with govt pmts 180.13 -69.49 227.16 465.85Labor & management charge 20.69 24.03 16.09 28.62Net return over lbr & mgt 159.43 -93.53 211.07 437.23
Cost of ProductionTotal direct expense per ton 54.77 109.07 50.99 36.23Total dir & ovhd exp per ton 77.29 190.44 64.83 45.00Less govt & other income 77.29 190.44 64.83 45.00With labor & management 84.55 206.80 70.85 50.01
Net value per unit 140.53 143.14 149.79 126.56Machinery cost per acre 92.13 176.79 52.51 65.18Est. labor hours per acre 1.82 1.78 1.35 3.27
Annual Report RankEm © University of Minnesota
39
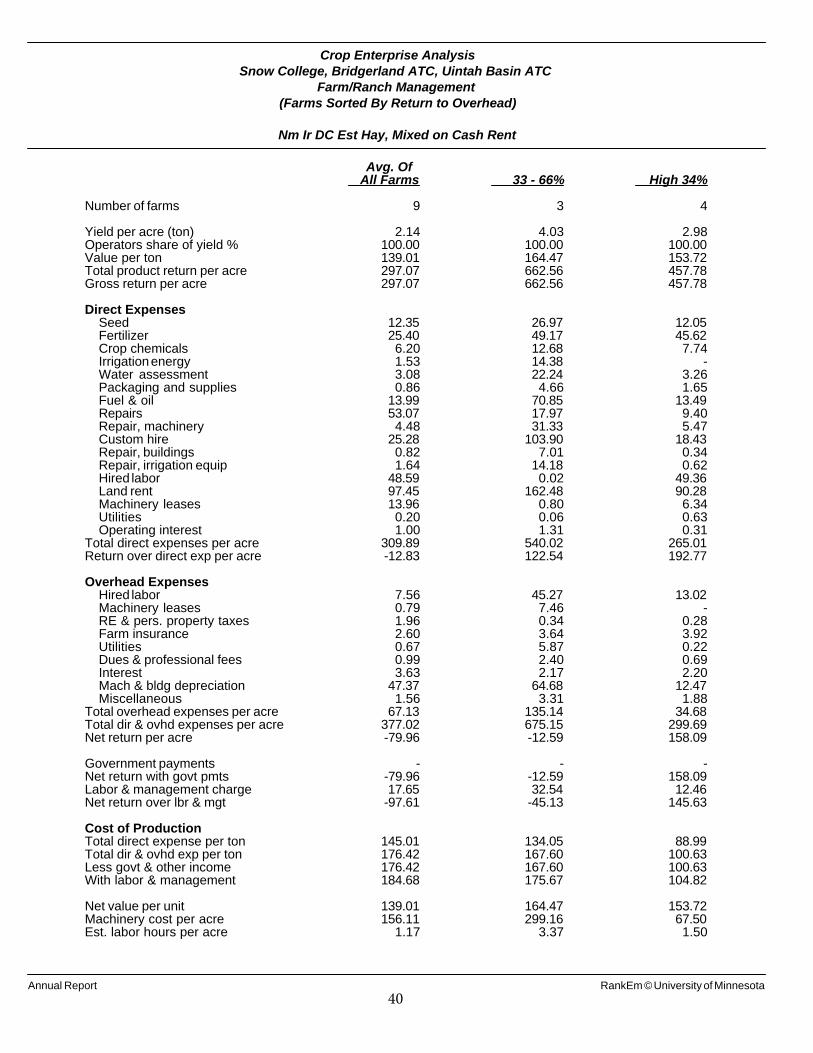
Crop Enterprise AnalysisSnow College, Bridgerland ATC, Uintah Basin ATC
Farm/Ranch Management(Farms Sorted By Return to Overhead)
Nm Ir DC Est Hay, Mixed on Cash Rent
Avg. OfAll Farms 33 - 66% High 34%
Number of farms 9 3 4
Yield per acre (ton) 2.14 4.03 2.98Operators share of yield % 100.00 100.00 100.00Value per ton 139.01 164.47 153.72Total product return per acre 297.07 662.56 457.78Gross return per acre 297.07 662.56 457.78
Direct ExpensesSeed 12.35 26.97 12.05Fertilizer 25.40 49.17 45.62Crop chemicals 6.20 12.68 7.74Irrigation energy 1.53 14.38 -Water assessment 3.08 22.24 3.26Packaging and supplies 0.86 4.66 1.65Fuel & oil 13.99 70.85 13.49Repairs 53.07 17.97 9.40Repair, machinery 4.48 31.33 5.47Custom hire 25.28 103.90 18.43Repair, buildings 0.82 7.01 0.34Repair, irrigation equip 1.64 14.18 0.62Hired labor 48.59 0.02 49.36Land rent 97.45 162.48 90.28Machinery leases 13.96 0.80 6.34Utilities 0.20 0.06 0.63Operating interest 1.00 1.31 0.31
Total direct expenses per acre 309.89 540.02 265.01Return over direct exp per acre -12.83 122.54 192.77
Overhead ExpensesHired labor 7.56 45.27 13.02Machinery leases 0.79 7.46 -RE & pers. property taxes 1.96 0.34 0.28Farm insurance 2.60 3.64 3.92Utilities 0.67 5.87 0.22Dues & professional fees 0.99 2.40 0.69Interest 3.63 2.17 2.20Mach & bldg depreciation 47.37 64.68 12.47Miscellaneous 1.56 3.31 1.88
Total overhead expenses per acre 67.13 135.14 34.68Total dir & ovhd expenses per acre 377.02 675.15 299.69Net return per acre -79.96 -12.59 158.09
Government payments - - -Net return with govt pmts -79.96 -12.59 158.09Labor & management charge 17.65 32.54 12.46Net return over lbr & mgt -97.61 -45.13 145.63
Cost of ProductionTotal direct expense per ton 145.01 134.05 88.99Total dir & ovhd exp per ton 176.42 167.60 100.63Less govt & other income 176.42 167.60 100.63With labor & management 184.68 175.67 104.82
Net value per unit 139.01 164.47 153.72Machinery cost per acre 156.11 299.16 67.50Est. labor hours per acre 1.17 3.37 1.50
Annual Report RankEm © University of Minnesota
40
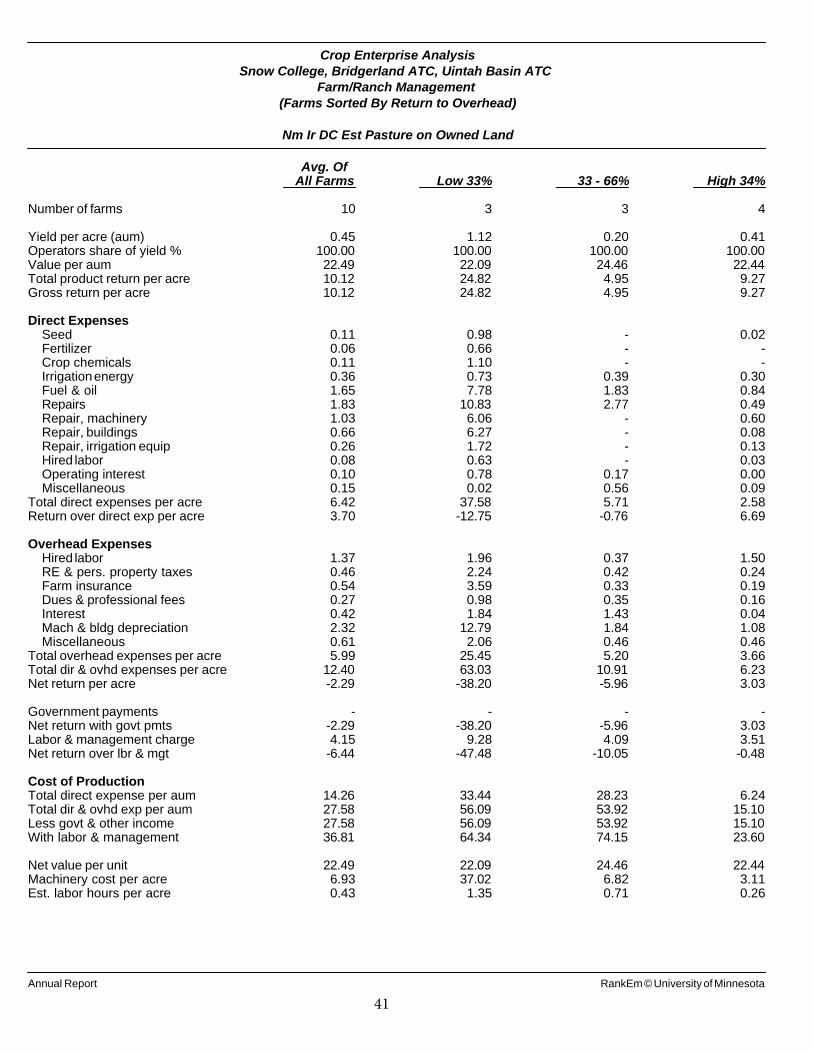
Crop Enterprise AnalysisSnow College, Bridgerland ATC, Uintah Basin ATC
Farm/Ranch Management(Farms Sorted By Return to Overhead)
Nm Ir DC Est Pasture on Owned Land
Avg. OfAll Farms Low 33% 33 - 66% High 34%
Number of farms 10 3 3 4
Yield per acre (aum) 0.45 1.12 0.20 0.41Operators share of yield % 100.00 100.00 100.00 100.00Value per aum 22.49 22.09 24.46 22.44Total product return per acre 10.12 24.82 4.95 9.27Gross return per acre 10.12 24.82 4.95 9.27
Direct ExpensesSeed 0.11 0.98 - 0.02Fertilizer 0.06 0.66 - -Crop chemicals 0.11 1.10 - -Irrigation energy 0.36 0.73 0.39 0.30Fuel & oil 1.65 7.78 1.83 0.84Repairs 1.83 10.83 2.77 0.49Repair, machinery 1.03 6.06 - 0.60Repair, buildings 0.66 6.27 - 0.08Repair, irrigation equip 0.26 1.72 - 0.13Hired labor 0.08 0.63 - 0.03Operating interest 0.10 0.78 0.17 0.00Miscellaneous 0.15 0.02 0.56 0.09
Total direct expenses per acre 6.42 37.58 5.71 2.58Return over direct exp per acre 3.70 -12.75 -0.76 6.69
Overhead ExpensesHired labor 1.37 1.96 0.37 1.50RE & pers. property taxes 0.46 2.24 0.42 0.24Farm insurance 0.54 3.59 0.33 0.19Dues & professional fees 0.27 0.98 0.35 0.16Interest 0.42 1.84 1.43 0.04Mach & bldg depreciation 2.32 12.79 1.84 1.08Miscellaneous 0.61 2.06 0.46 0.46
Total overhead expenses per acre 5.99 25.45 5.20 3.66Total dir & ovhd expenses per acre 12.40 63.03 10.91 6.23Net return per acre -2.29 -38.20 -5.96 3.03
Government payments - - - -Net return with govt pmts -2.29 -38.20 -5.96 3.03Labor & management charge 4.15 9.28 4.09 3.51Net return over lbr & mgt -6.44 -47.48 -10.05 -0.48
Cost of ProductionTotal direct expense per aum 14.26 33.44 28.23 6.24Total dir & ovhd exp per aum 27.58 56.09 53.92 15.10Less govt & other income 27.58 56.09 53.92 15.10With labor & management 36.81 64.34 74.15 23.60
Net value per unit 22.49 22.09 24.46 22.44Machinery cost per acre 6.93 37.02 6.82 3.11Est. labor hours per acre 0.43 1.35 0.71 0.26
Annual Report RankEm © University of Minnesota
41
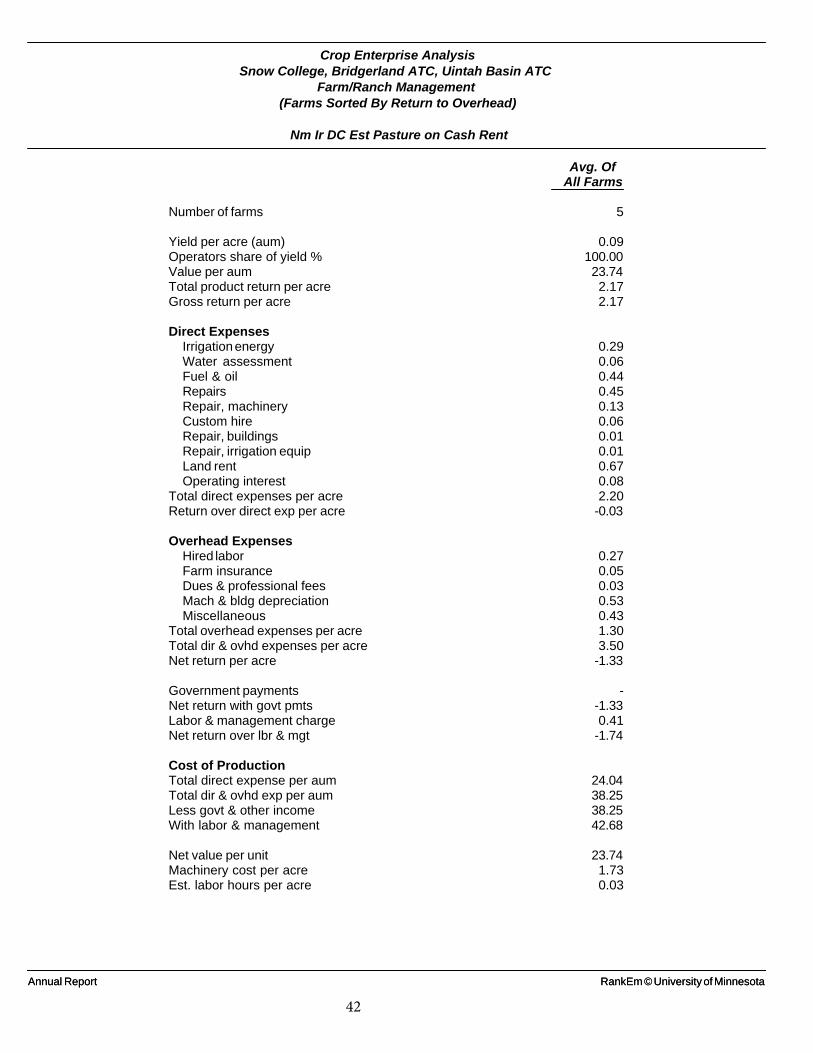
Crop Enterprise AnalysisSnow College, Bridgerland ATC, Uintah Basin ATC
Farm/Ranch Management(Farms Sorted By Return to Overhead)
Nm Ir DC Est Pasture on Cash Rent
Avg. OfAll Farms
Number of farms 5
Yield per acre (aum) 0.09Operators share of yield % 100.00Value per aum 23.74Total product return per acre 2.17Gross return per acre 2.17
Direct ExpensesIrrigation energy 0.29Water assessment 0.06Fuel & oil 0.44Repairs 0.45Repair, machinery 0.13Custom hire 0.06Repair, buildings 0.01Repair, irrigation equip 0.01Land rent 0.67Operating interest 0.08
Total direct expenses per acre 2.20Return over direct exp per acre -0.03
Overhead ExpensesHired labor 0.27Farm insurance 0.05Dues & professional fees 0.03Mach & bldg depreciation 0.53Miscellaneous 0.43
Total overhead expenses per acre 1.30Total dir & ovhd expenses per acre 3.50Net return per acre -1.33
Government payments -Net return with govt pmts -1.33Labor & management charge 0.41Net return over lbr & mgt -1.74
Cost of ProductionTotal direct expense per aum 24.04Total dir & ovhd exp per aum 38.25Less govt & other income 38.25With labor & management 42.68
Net value per unit 23.74Machinery cost per acre 1.73Est. labor hours per acre 0.03
Annual Report RankEm © University of MinnesotaAnnual Report RankEm © University of Minnesota
42
Livestock Reports
The livestock reports show the average physical production, gross returns and costs of producing
the animals or animal products involved. These are generally shown on per unit (pound or cwt) a
per head and basis. Again, all livestock enterprises require a minimum of three observations to
be included in the report.
The table format varies slightly for the different livestock enterprises. Each begins with a
calculation of Gross Return with income generated (product sales, market animal sales, cull
breeding livestock sales, value of butchered animals and products used in the home, and/or
transfers out to other enterprises) minus costs incurred (purchases, transfers in)and adjusted for
inventory changes. The Direct and Overhead Expenses are then applied to arrive at the Net
Return for the enterprise, typically on a per head, or per cwt. Basis.
Costs that are easily charged to a specific livestock enterprise are termed Direct Expenses.
Direct expenses include costs such as feed, veterinary costs, livestock supplies, custom hire, and
marketing.
Other costs are less easily charged directly and are allocated; these costs are termed Overhead
Expenses. Overhead expenses include costs such as: machinery and building repair (not
livestock equipment or livestock buildings and facilities), hired labor, taxes, insurance, utilities,
interest, and depreciation. The allocation of overhead expenses is not an exact science, but the
allocations indicated are believed to represent the portion of the general overhead expenses that
are attributable to each enterprise.
Cost of production is arrived at by dividing the total expenses for each category by the Total
Production. (For grow/finish enterprises, the Purchases and Transfers In are included in direct
expenses.) Cull sales, other offspring sales, and any other miscellaneous income are subtracted
and replacement purchases and transfers in are added to arrive at the cost With other revenue
adjustments. With Labor and Management is the cost with other revenue adjustments plus the
producer’s charge for operator’s labor and management. This is the breakeven price for the
primary product to provide a return for operator labor and management.
Each livestock enterprise analysis includes Other Information that provides both production and
economic efficiency data that indicate the strengths and/or weaknesses of the enterprise. The
calving and weaning percentages are calculated as the number of calves which are calved and
weaned, respectively, divided by the number of cows which are supposed to bear young.
Considerable variation exists between the high and low profit firms. Expenses (direct as well as
overhead) vary widely but so do returns. This suggests that management of the livestock
enterprise(s) is key to higher profitability.
43

Livestock Enterprise AnalysisSnow College, Bridgerland ATC, Uintah Basin ATC
Farm/Ranch Management(Farms Sorted By Return to Overhead)
Beef Backgrounding -- Average Per Cwt. Produced
Avg. OfAll Farms Low 33% 33 - 66% High 34%
Number of farms 11 3 4 4
Quantity Value Quantity Value Quantity Value Quantity ValueBackgnd Beef sold (lb) 351.39 623.31 260.87 408.05 254.90 408.05 464.60 878.15Other income 1.25 12.28 0.62 -Purchased (lb) -131.51 -255.47 - - -51.94 -122.70 -234.59 -433.59Transferred in (lb) -123.30 -310.24 -227.69 -647.53 -92.78 -234.51 -136.40 -329.40Inventory change (lb) 2.72 206.51 60.53 326.45 -10.64 153.72 6.39 239.51Gross margin 265.36 99.23 205.18 354.68
Direct ExpensesComplete Ration (lb.) 129.19 14.78 - - 245.29 27.47 33.61 4.45Corn (bu.) 1.92 8.60 1.05 4.56 0.96 4.32 3.03 13.63Corn Silage (lb.) 933.30 21.62 - - 530.31 12.73 1,500.89 34.33Hay, Alfalfa (lb.) 519.07 48.19 476.16 41.37 507.94 47.81 537.68 49.74Hay, Grass (lb.) 118.81 8.62 155.67 7.69 83.31 6.87 148.49 10.54Oats (bu.) 0.13 0.99 1.66 12.61 - - - -Other feed stuffs (lb) 5.15 1.02 - - 4.85 1.02 6.34 1.20Veterinary 4.69 1.13 3.43 6.57Supplies 1.63 1.98 1.69 1.52Fuel & oil 5.13 2.76 2.73 7.96Repairs 2.14 1.61 0.81 3.58Repair, machinery 1.00 1.07 1.91 0.07Custom hire 0.71 - - 1.55Hired labor 0.96 1.55 0.45 1.37Hauling and trucking 2.30 - 3.58 1.41Marketing 0.87 0.60 0.05 1.75Operating interest 1.74 - 0.01 3.78
Total direct expenses 124.99 76.90 114.89 143.42Return over direct expense 140.37 22.33 90.29 211.25
Overhead ExpensesHired labor 11.88 0.66 7.01 18.73Farm insurance 1.00 0.50 0.43 1.66Utilities 1.24 0.44 0.82 1.81Interest 2.16 0.10 0.52 4.18Mach & bldg depreciation 6.63 2.92 3.64 10.29Miscellaneous 2.45 1.78 2.13 2.88
Total overhead expenses 25.36 6.39 14.54 39.55Total dir & ovhd expenses 150.34 83.29 129.43 182.98Net return 115.01 15.94 75.75 171.70
Labor & management charge 8.40 6.53 6.00 11.16Net return over lbr & mgt 106.61 9.41 69.75 160.54
Cost of Production Per Cwt. ProducedTotal direct expense per unit 137.44 147.86 124.66 143.54Total dir& ovhd expense per unit 144.66 150.31 130.37 152.06With other revenue adjustments 144.66 150.31 130.37 152.06With labor and management 147.05 152.81 132.72 154.46
Est. labor hours per unit 0.94 0.40 0.60 1.37
Other InformationNo. purchased or trans in 492 123 366 895Number sold or trans out 475 105 387 840Percentage death loss 0.5 1.5 0.2 0.5Avg. daily gain (lb.) 2.27 2.49 2.00 2.58Lb. of conc / lb. of gain 2.60 2.25 3.07 2.18Lb. of feed / lb. of gain 12.09 8.56 10.75 14.05Feed cost per cwt. of gain 103.82 66.23 100.23 113.88Feed cost per head 325.60 187.12 305.04 375.81Average purchase weight 502 - 505 501Avg wgt / Backgnd Beef sold 752 726 853 708Avg purch price / cwt. 194.25 - 236.24 184.83Avg sales price / cwt. 177.39 156.42 160.09 189.01
Annual Report RankEm © University of Minnesota
44
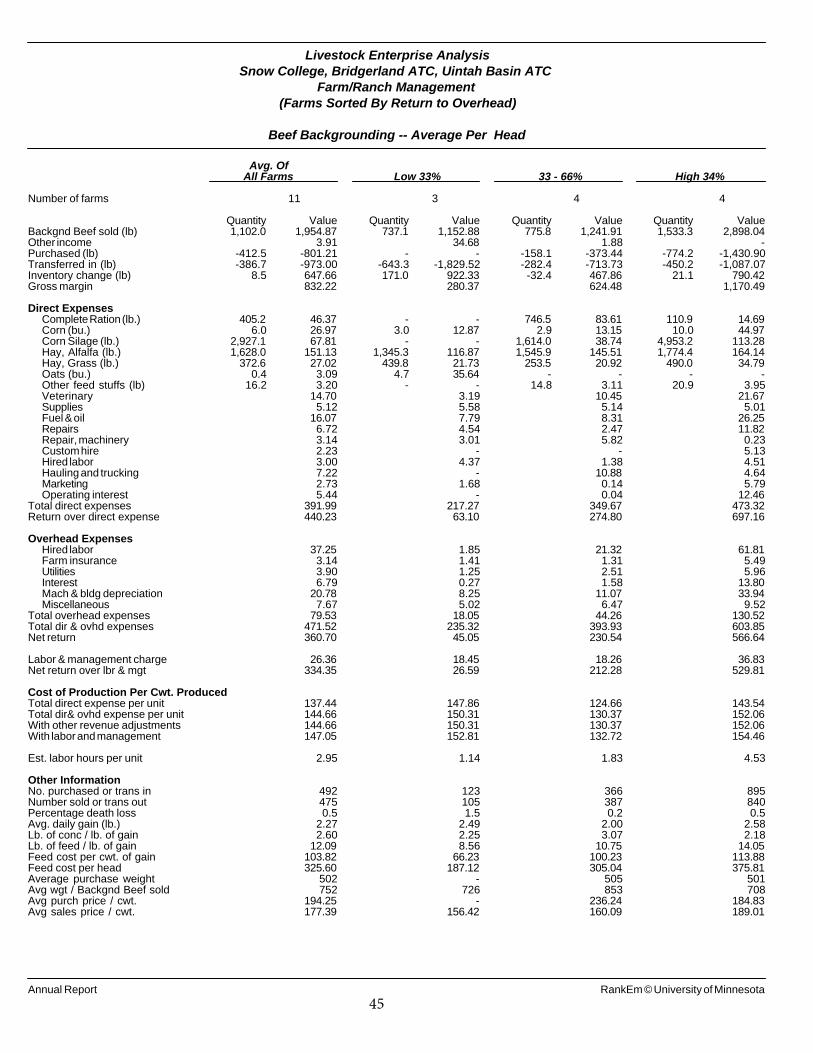
Livestock Enterprise AnalysisSnow College, Bridgerland ATC, Uintah Basin ATC
Farm/Ranch Management(Farms Sorted By Return to Overhead)
Beef Backgrounding -- Average Per Head
Avg. OfAll Farms Low 33% 33 - 66% High 34%
Number of farms 11 3 4 4
Quantity Value Quantity Value Quantity Value Quantity ValueBackgnd Beef sold (lb) 1,102.0 1,954.87 737.1 1,152.88 775.8 1,241.91 1,533.3 2,898.04Other income 3.91 34.68 1.88 -Purchased (lb) -412.5 -801.21 - - -158.1 -373.44 -774.2 -1,430.90Transferred in (lb) -386.7 -973.00 -643.3 -1,829.52 -282.4 -713.73 -450.2 -1,087.07Inventory change (lb) 8.5 647.66 171.0 922.33 -32.4 467.86 21.1 790.42Gross margin 832.22 280.37 624.48 1,170.49
Direct ExpensesComplete Ration (lb.) 405.2 46.37 - - 746.5 83.61 110.9 14.69Corn (bu.) 6.0 26.97 3.0 12.87 2.9 13.15 10.0 44.97Corn Silage (lb.) 2,927.1 67.81 - - 1,614.0 38.74 4,953.2 113.28Hay, Alfalfa (lb.) 1,628.0 151.13 1,345.3 116.87 1,545.9 145.51 1,774.4 164.14Hay, Grass (lb.) 372.6 27.02 439.8 21.73 253.5 20.92 490.0 34.79Oats (bu.) 0.4 3.09 4.7 35.64 - - - -Other feed stuffs (lb) 16.2 3.20 - - 14.8 3.11 20.9 3.95Veterinary 14.70 3.19 10.45 21.67Supplies 5.12 5.58 5.14 5.01Fuel & oil 16.07 7.79 8.31 26.25Repairs 6.72 4.54 2.47 11.82Repair, machinery 3.14 3.01 5.82 0.23Custom hire 2.23 - - 5.13Hired labor 3.00 4.37 1.38 4.51Hauling and trucking 7.22 - 10.88 4.64Marketing 2.73 1.68 0.14 5.79Operating interest 5.44 - 0.04 12.46
Total direct expenses 391.99 217.27 349.67 473.32Return over direct expense 440.23 63.10 274.80 697.16
Overhead ExpensesHired labor 37.25 1.85 21.32 61.81Farm insurance 3.14 1.41 1.31 5.49Utilities 3.90 1.25 2.51 5.96Interest 6.79 0.27 1.58 13.80Mach & bldg depreciation 20.78 8.25 11.07 33.94Miscellaneous 7.67 5.02 6.47 9.52
Total overhead expenses 79.53 18.05 44.26 130.52Total dir & ovhd expenses 471.52 235.32 393.93 603.85Net return 360.70 45.05 230.54 566.64
Labor & management charge 26.36 18.45 18.26 36.83Net return over lbr & mgt 334.35 26.59 212.28 529.81
Cost of Production Per Cwt. ProducedTotal direct expense per unit 137.44 147.86 124.66 143.54Total dir& ovhd expense per unit 144.66 150.31 130.37 152.06With other revenue adjustments 144.66 150.31 130.37 152.06With labor and management 147.05 152.81 132.72 154.46
Est. labor hours per unit 2.95 1.14 1.83 4.53
Other InformationNo. purchased or trans in 492 123 366 895Number sold or trans out 475 105 387 840Percentage death loss 0.5 1.5 0.2 0.5Avg. daily gain (lb.) 2.27 2.49 2.00 2.58Lb. of conc / lb. of gain 2.60 2.25 3.07 2.18Lb. of feed / lb. of gain 12.09 8.56 10.75 14.05Feed cost per cwt. of gain 103.82 66.23 100.23 113.88Feed cost per head 325.60 187.12 305.04 375.81Average purchase weight 502 - 505 501Avg wgt / Backgnd Beef sold 752 726 853 708Avg purch price / cwt. 194.25 - 236.24 184.83Avg sales price / cwt. 177.39 156.42 160.09 189.01
Annual Report RankEm © University of Minnesota
45
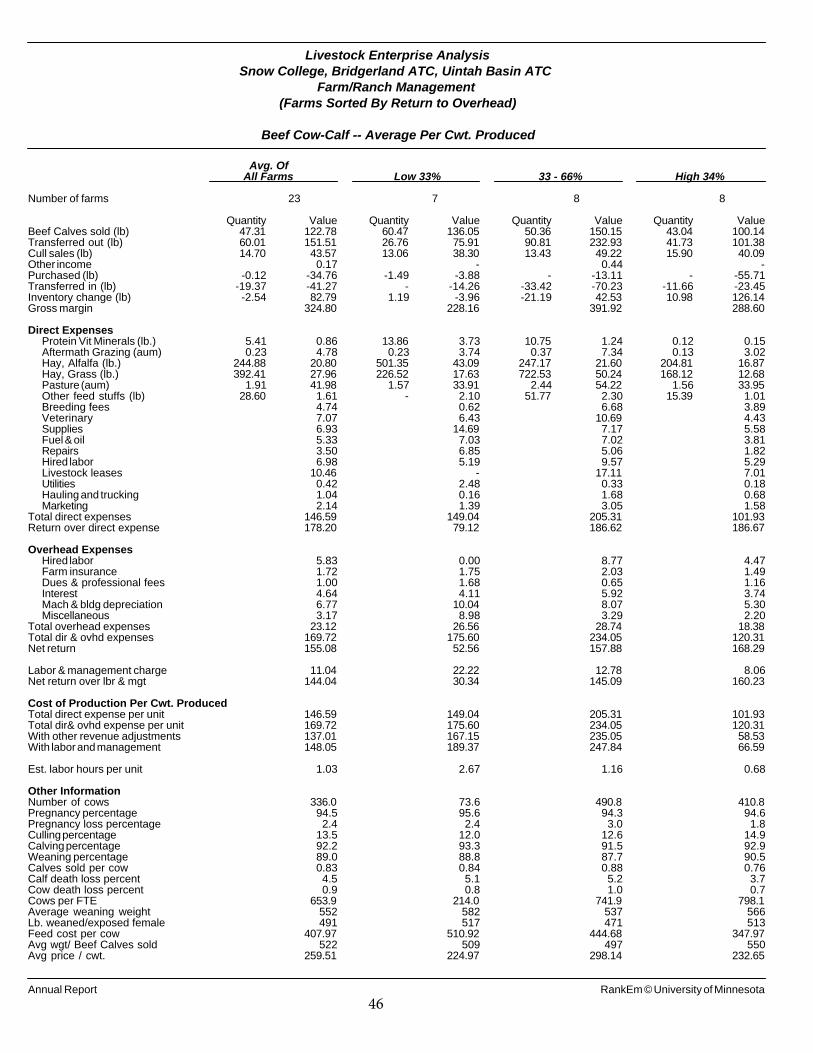
Livestock Enterprise AnalysisSnow College, Bridgerland ATC, Uintah Basin ATC
Farm/Ranch Management(Farms Sorted By Return to Overhead)
Beef Cow-Calf -- Average Per Cwt. Produced
Avg. OfAll Farms Low 33% 33 - 66% High 34%
Number of farms 23 7 8 8
Quantity Value Quantity Value Quantity Value Quantity ValueBeef Calves sold (lb) 47.31 122.78 60.47 136.05 50.36 150.15 43.04 100.14Transferred out (lb) 60.01 151.51 26.76 75.91 90.81 232.93 41.73 101.38Cull sales (lb) 14.70 43.57 13.06 38.30 13.43 49.22 15.90 40.09Other income 0.17 - 0.44 -Purchased (lb) -0.12 -34.76 -1.49 -3.88 - -13.11 - -55.71Transferred in (lb) -19.37 -41.27 - -14.26 -33.42 -70.23 -11.66 -23.45Inventory change (lb) -2.54 82.79 1.19 -3.96 -21.19 42.53 10.98 126.14Gross margin 324.80 228.16 391.92 288.60
Direct ExpensesProtein Vit Minerals (lb.) 5.41 0.86 13.86 3.73 10.75 1.24 0.12 0.15Aftermath Grazing (aum) 0.23 4.78 0.23 3.74 0.37 7.34 0.13 3.02Hay, Alfalfa (lb.) 244.88 20.80 501.35 43.09 247.17 21.60 204.81 16.87Hay, Grass (lb.) 392.41 27.96 226.52 17.63 722.53 50.24 168.12 12.68Pasture (aum) 1.91 41.98 1.57 33.91 2.44 54.22 1.56 33.95Other feed stuffs (lb) 28.60 1.61 - 2.10 51.77 2.30 15.39 1.01Breeding fees 4.74 0.62 6.68 3.89Veterinary 7.07 6.43 10.69 4.43Supplies 6.93 14.69 7.17 5.58Fuel & oil 5.33 7.03 7.02 3.81Repairs 3.50 6.85 5.06 1.82Hired labor 6.98 5.19 9.57 5.29Livestock leases 10.46 - 17.11 7.01Utilities 0.42 2.48 0.33 0.18Hauling and trucking 1.04 0.16 1.68 0.68Marketing 2.14 1.39 3.05 1.58
Total direct expenses 146.59 149.04 205.31 101.93Return over direct expense 178.20 79.12 186.62 186.67
Overhead ExpensesHired labor 5.83 0.00 8.77 4.47Farm insurance 1.72 1.75 2.03 1.49Dues & professional fees 1.00 1.68 0.65 1.16Interest 4.64 4.11 5.92 3.74Mach & bldg depreciation 6.77 10.04 8.07 5.30Miscellaneous 3.17 8.98 3.29 2.20
Total overhead expenses 23.12 26.56 28.74 18.38Total dir & ovhd expenses 169.72 175.60 234.05 120.31Net return 155.08 52.56 157.88 168.29
Labor & management charge 11.04 22.22 12.78 8.06Net return over lbr & mgt 144.04 30.34 145.09 160.23
Cost of Production Per Cwt. ProducedTotal direct expense per unit 146.59 149.04 205.31 101.93Total dir& ovhd expense per unit 169.72 175.60 234.05 120.31With other revenue adjustments 137.01 167.15 235.05 58.53With labor and management 148.05 189.37 247.84 66.59
Est. labor hours per unit 1.03 2.67 1.16 0.68
Other InformationNumber of cows 336.0 73.6 490.8 410.8Pregnancy percentage 94.5 95.6 94.3 94.6Pregnancy loss percentage 2.4 2.4 3.0 1.8Culling percentage 13.5 12.0 12.6 14.9Calving percentage 92.2 93.3 91.5 92.9Weaning percentage 89.0 88.8 87.7 90.5Calves sold per cow 0.83 0.84 0.88 0.76Calf death loss percent 4.5 5.1 5.2 3.7Cow death loss percent 0.9 0.8 1.0 0.7Cows per FTE 653.9 214.0 741.9 798.1Average weaning weight 552 582 537 566Lb. weaned/exposed female 491 517 471 513Feed cost per cow 407.97 510.92 444.68 347.97Avg wgt/ Beef Calves sold 522 509 497 550Avg price / cwt. 259.51 224.97 298.14 232.65
Annual Report RankEm © University of Minnesota
46

Livestock Enterprise AnalysisSnow College, Bridgerland ATC, Uintah Basin ATC
Farm/Ranch Management(Farms Sorted By Return to Overhead)
Beef Cow-Calf -- Average Per Cow
Avg. OfAll Farms Low 33% 33 - 66% High 34%
Number of farms 23 7 8 8
Quantity Value Quantity Value Quantity Value Quantity ValueBeef Calves sold (lb) 197.0 511.15 296.5 667.07 163.5 487.54 221.3 514.91Transferred out (lb) 249.8 630.77 131.2 372.18 294.9 756.34 214.6 521.28Cull sales (lb) 61.2 181.40 64.0 187.80 43.6 159.84 81.8 206.16Other income 0.72 - 1.43 -Purchased (lb) -0.5 -144.71 -7.3 -19.03 - -42.56 - -286.44Transferred in (lb) -80.6 -171.80 - -69.90 -108.5 -228.06 -60.0 -120.56Inventory change (lb) -10.6 344.69 5.8 -19.40 -68.8 138.09 56.5 648.59Gross margin 1,352.23 1,118.72 1,272.61 1,483.95
Direct ExpensesProtein Vit Minerals (lb.) 22.5 3.60 68.0 18.28 34.9 4.04 0.6 0.76Aftermath Grazing (aum) 1.0 19.92 1.1 18.36 1.2 23.82 0.7 15.51Hay, Alfalfa (lb.) 1,019.5 86.61 2,458.3 211.30 802.6 70.15 1,053.1 86.73Hay, Grass (lb.) 1,633.7 116.39 1,110.7 86.43 2,346.2 163.15 864.5 65.21Pasture (aum) 7.9 174.76 7.7 166.28 7.9 176.04 8.0 174.56Other feed stuffs (lb) 119.1 6.69 - 10.28 168.1 7.47 79.1 5.20Breeding fees 19.73 3.06 21.69 20.00Veterinary 29.42 31.51 34.72 22.75Supplies 31.25 65.58 27.89 29.89Fuel & oil 22.20 34.48 22.78 19.59Repairs 14.56 33.60 16.44 9.34Repair, buildings 1.90 7.19 0.87 2.30Hired labor 29.06 25.46 31.08 27.21Livestock leases 43.55 - 55.55 36.04Utilities 1.74 12.15 1.06 0.93Marketing 8.93 6.82 9.89 8.11
Total direct expenses 610.32 730.78 666.65 524.13Return over direct expense 741.91 387.94 605.96 959.82
Overhead ExpensesHired labor 24.26 0.00 28.49 23.00Farm insurance 7.18 8.58 6.60 7.65Dues & professional fees 4.16 8.22 2.12 5.98Interest 19.31 20.15 19.24 19.26Mach & bldg depreciation 28.19 49.23 26.20 27.27Miscellaneous 13.18 44.02 10.69 11.33
Total overhead expenses 96.28 130.21 93.32 94.48Total dir & ovhd expenses 706.59 860.99 759.97 618.61Net return 645.64 257.73 512.64 865.34
Labor & management charge 45.98 108.94 41.51 41.45Net return over lbr & mgt 599.66 148.79 471.13 823.89
Cost of Production Per Cwt. ProducedTotal direct expense per unit 146.59 149.04 205.31 101.93Total dir& ovhd expense per unit 169.72 175.60 234.05 120.31With other revenue adjustments 137.01 167.15 235.05 58.53With labor and management 148.05 189.37 247.84 66.59
Est. labor hours per unit 4.28 13.09 3.77 3.51
Other InformationNumber of cows 336.0 73.6 490.8 410.8Pregnancy percentage 94.5 95.6 94.3 94.6Pregnancy loss percentage 2.4 2.4 3.0 1.8Culling percentage 13.5 12.0 12.6 14.9Calving percentage 92.2 93.3 91.5 92.9Weaning percentage 89.0 88.8 87.7 90.5Calves sold per cow 0.83 0.84 0.88 0.76Calf death loss percent 4.5 5.1 5.2 3.7Cow death loss percent 0.9 0.8 1.0 0.7Cows per FTE 653.9 214.0 741.9 798.1Average weaning weight 552 582 537 566Lb. weaned/exposed female 491 517 471 513Feed cost per cow 407.97 510.92 444.68 347.97Avg wgt/ Beef Calves sold 522 509 497 550Avg price / cwt. 259.51 224.97 298.14 232.65
Annual Report RankEm © University of Minnesota
47
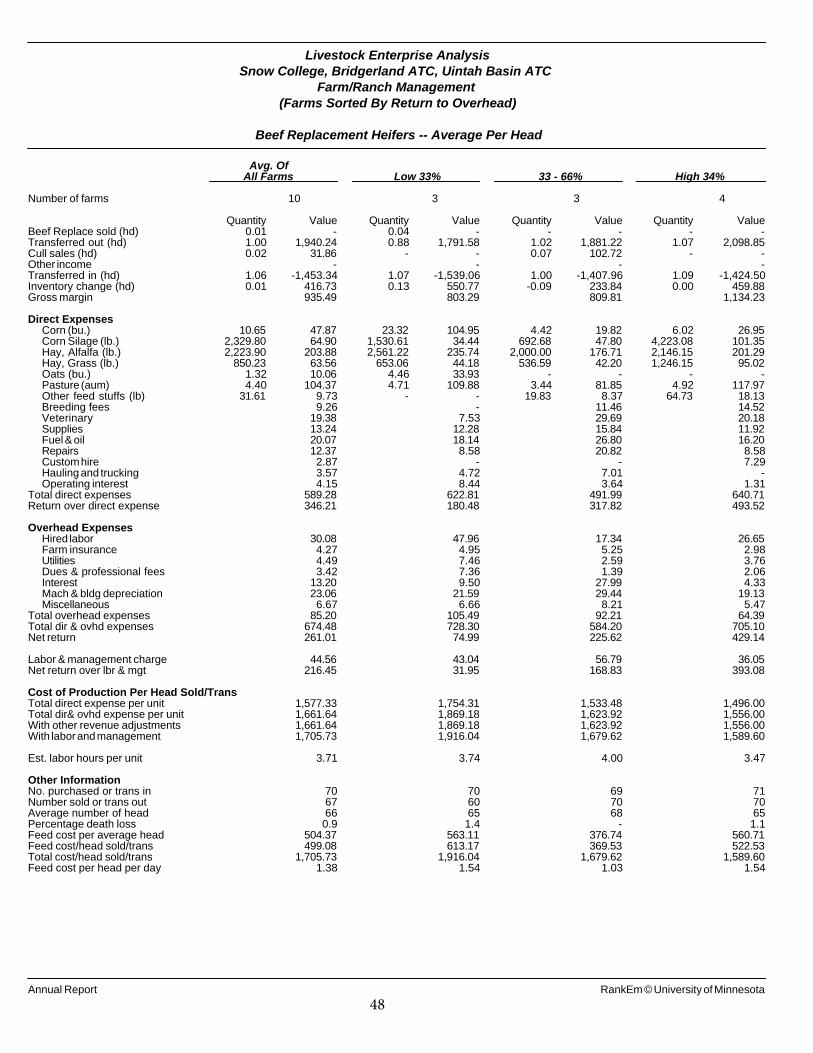
Livestock Enterprise AnalysisSnow College, Bridgerland ATC, Uintah Basin ATC
Farm/Ranch Management(Farms Sorted By Return to Overhead)
Beef Replacement Heifers -- Average Per Head
Avg. OfAll Farms Low 33% 33 - 66% High 34%
Number of farms 10 3 3 4
Quantity Value Quantity Value Quantity Value Quantity ValueBeef Replace sold (hd) 0.01 - 0.04 - - - - -Transferred out (hd) 1.00 1,940.24 0.88 1,791.58 1.02 1,881.22 1.07 2,098.85Cull sales (hd) 0.02 31.86 - - 0.07 102.72 - -Other income - - - -Transferred in (hd) 1.06 -1,453.34 1.07 -1,539.06 1.00 -1,407.96 1.09 -1,424.50Inventory change (hd) 0.01 416.73 0.13 550.77 -0.09 233.84 0.00 459.88Gross margin 935.49 803.29 809.81 1,134.23
Direct ExpensesCorn (bu.) 10.65 47.87 23.32 104.95 4.42 19.82 6.02 26.95Corn Silage (lb.) 2,329.80 64.90 1,530.61 34.44 692.68 47.80 4,223.08 101.35Hay, Alfalfa (lb.) 2,223.90 203.88 2,561.22 235.74 2,000.00 176.71 2,146.15 201.29Hay, Grass (lb.) 850.23 63.56 653.06 44.18 536.59 42.20 1,246.15 95.02Oats (bu.) 1.32 10.06 4.46 33.93 - - - -Pasture (aum) 4.40 104.37 4.71 109.88 3.44 81.85 4.92 117.97Other feed stuffs (lb) 31.61 9.73 - - 19.83 8.37 64.73 18.13Breeding fees 9.26 - 11.46 14.52Veterinary 19.38 7.53 29.69 20.18Supplies 13.24 12.28 15.84 11.92Fuel & oil 20.07 18.14 26.80 16.20Repairs 12.37 8.58 20.82 8.58Custom hire 2.87 - - 7.29Hauling and trucking 3.57 4.72 7.01 -Operating interest 4.15 8.44 3.64 1.31
Total direct expenses 589.28 622.81 491.99 640.71Return over direct expense 346.21 180.48 317.82 493.52
Overhead ExpensesHired labor 30.08 47.96 17.34 26.65Farm insurance 4.27 4.95 5.25 2.98Utilities 4.49 7.46 2.59 3.76Dues & professional fees 3.42 7.36 1.39 2.06Interest 13.20 9.50 27.99 4.33Mach & bldg depreciation 23.06 21.59 29.44 19.13Miscellaneous 6.67 6.66 8.21 5.47
Total overhead expenses 85.20 105.49 92.21 64.39Total dir & ovhd expenses 674.48 728.30 584.20 705.10Net return 261.01 74.99 225.62 429.14
Labor & management charge 44.56 43.04 56.79 36.05Net return over lbr & mgt 216.45 31.95 168.83 393.08
Cost of Production Per Head Sold/TransTotal direct expense per unit 1,577.33 1,754.31 1,533.48 1,496.00Total dir& ovhd expense per unit 1,661.64 1,869.18 1,623.92 1,556.00With other revenue adjustments 1,661.64 1,869.18 1,623.92 1,556.00With labor and management 1,705.73 1,916.04 1,679.62 1,589.60
Est. labor hours per unit 3.71 3.74 4.00 3.47
Other InformationNo. purchased or trans in 70 70 69 71Number sold or trans out 67 60 70 70Average number of head 66 65 68 65Percentage death loss 0.9 1.4 - 1.1Feed cost per average head 504.37 563.11 376.74 560.71Feed cost/head sold/trans 499.08 613.17 369.53 522.53Total cost/head sold/trans 1,705.73 1,916.04 1,679.62 1,589.60Feed cost per head per day 1.38 1.54 1.03 1.54
Annual Report RankEm © University of Minnesota
48
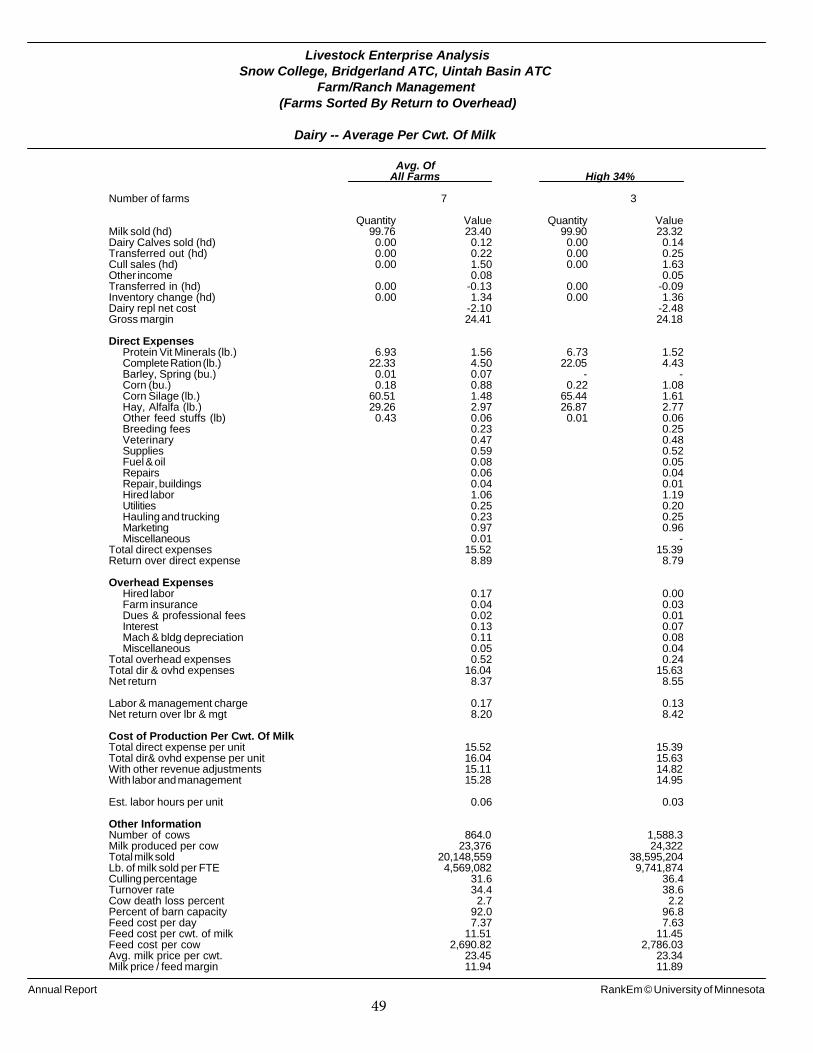
Livestock Enterprise AnalysisSnow College, Bridgerland ATC, Uintah Basin ATC
Farm/Ranch Management(Farms Sorted By Return to Overhead)
Dairy -- Average Per Cwt. Of Milk
Avg. OfAll Farms High 34%
Number of farms 7 3
Quantity Value Quantity ValueMilk sold (hd) 99.76 23.40 99.90 23.32Dairy Calves sold (hd) 0.00 0.12 0.00 0.14Transferred out (hd) 0.00 0.22 0.00 0.25Cull sales (hd) 0.00 1.50 0.00 1.63Other income 0.08 0.05Transferred in (hd) 0.00 -0.13 0.00 -0.09Inventory change (hd) 0.00 1.34 0.00 1.36Dairy repl net cost -2.10 -2.48Gross margin 24.41 24.18
Direct ExpensesProtein Vit Minerals (lb.) 6.93 1.56 6.73 1.52Complete Ration (lb.) 22.33 4.50 22.05 4.43Barley, Spring (bu.) 0.01 0.07 - -Corn (bu.) 0.18 0.88 0.22 1.08Corn Silage (lb.) 60.51 1.48 65.44 1.61Hay, Alfalfa (lb.) 29.26 2.97 26.87 2.77Other feed stuffs (lb) 0.43 0.06 0.01 0.06Breeding fees 0.23 0.25Veterinary 0.47 0.48Supplies 0.59 0.52Fuel & oil 0.08 0.05Repairs 0.06 0.04Repair, buildings 0.04 0.01Hired labor 1.06 1.19Utilities 0.25 0.20Hauling and trucking 0.23 0.25Marketing 0.97 0.96Miscellaneous 0.01 -
Total direct expenses 15.52 15.39Return over direct expense 8.89 8.79
Overhead ExpensesHired labor 0.17 0.00Farm insurance 0.04 0.03Dues & professional fees 0.02 0.01Interest 0.13 0.07Mach & bldg depreciation 0.11 0.08Miscellaneous 0.05 0.04
Total overhead expenses 0.52 0.24Total dir & ovhd expenses 16.04 15.63Net return 8.37 8.55
Labor & management charge 0.17 0.13Net return over lbr & mgt 8.20 8.42
Cost of Production Per Cwt. Of MilkTotal direct expense per unit 15.52 15.39Total dir& ovhd expense per unit 16.04 15.63With other revenue adjustments 15.11 14.82With labor and management 15.28 14.95
Est. labor hours per unit 0.06 0.03
Other InformationNumber of cows 864.0 1,588.3Milk produced per cow 23,376 24,322Total milk sold 20,148,559 38,595,204Lb. of milk sold per FTE 4,569,082 9,741,874Culling percentage 31.6 36.4Turnover rate 34.4 38.6Cow death loss percent 2.7 2.2Percent of barn capacity 92.0 96.8Feed cost per day 7.37 7.63Feed cost per cwt. of milk 11.51 11.45Feed cost per cow 2,690.82 2,786.03Avg. milk price per cwt. 23.45 23.34Milk price / feed margin 11.94 11.89
Annual Report RankEm © University of Minnesota
49

Livestock Enterprise AnalysisSnow College, Bridgerland ATC, Uintah Basin ATC
Farm/Ranch Management(Farms Sorted By Return to Overhead)
Dairy -- Average Per Cow
Avg. OfAll Farms High 34%
Number of farms 7 3
Quantity Value Quantity ValueMilk sold (hd) 23,320.1 5,469.46 24,299.2 5,671.38Dairy Calves sold (hd) 0.1 27.40 0.1 34.77Transferred out (hd) 0.8 51.26 0.8 60.11Cull sales (hd) 0.3 349.70 0.4 396.97Other income 18.40 13.18Transferred in (hd) 0.4 -31.33 0.4 -22.35Inventory change (hd) 0.0 312.26 0.0 330.25Dairy repl net cost -490.63 -603.70Gross margin 5,706.51 5,880.62
Direct ExpensesProtein Vit Minerals (lb.) 1,619.4 363.60 1,637.8 368.58Complete Ration (lb.) 5,218.9 1,051.79 5,364.1 1,077.04Barley, Spring (bu.) 2.2 16.17 - -Corn (bu.) 42.5 206.33 54.0 261.89Corn Silage (lb.) 14,145.8 346.09 15,915.6 391.49Hay, Alfalfa (lb.) 6,839.6 693.58 6,535.6 672.84Other feed stuffs (lb) 101.0 13.26 2.2 14.18Breeding fees 53.85 60.13Veterinary 110.73 115.64Supplies 140.44 125.33Fuel & oil 19.39 12.09Repairs 14.39 8.88Repair, buildings 10.35 2.97Hired labor 248.44 288.63Utilities 57.58 48.94Hauling and trucking 53.96 60.19Marketing 227.64 234.46
Total direct expenses 3,627.58 3,743.29Return over direct expense 2,078.93 2,137.33
Overhead ExpensesHired labor 40.76 0.00Farm insurance 9.51 7.23Interest 30.05 17.20Mach & bldg depreciation 26.71 20.62Miscellaneous 15.58 12.85
Total overhead expenses 122.60 57.91Total dir & ovhd expenses 3,750.18 3,801.20Net return 1,956.32 2,079.42
Labor & management charge 39.97 31.05Net return over lbr & mgt 1,916.35 2,048.37
Cost of Production Per Cwt. Of MilkTotal direct expense per unit 15.52 15.39Total dir& ovhd expense per unit 16.04 15.63With other revenue adjustments 15.11 14.82With labor and management 15.28 14.95
Est. labor hours per unit 14.29 6.98
Other InformationNumber of cows 864.0 1,588.3Milk produced per cow 23,376 24,322Total milk sold 20,148,559 38,595,204Lb. of milk sold per FTE 4,569,082 9,741,874Culling percentage 31.6 36.4Turnover rate 34.4 38.6Cow death loss percent 2.7 2.2Percent of barn capacity 92.0 96.8Feed cost per day 7.37 7.63Feed cost per cwt. of milk 11.51 11.45Feed cost per cow 2,690.82 2,786.03Avg. milk price per cwt. 23.45 23.34Milk price / feed margin 11.94 11.89
Annual Report RankEm © University of Minnesota
50
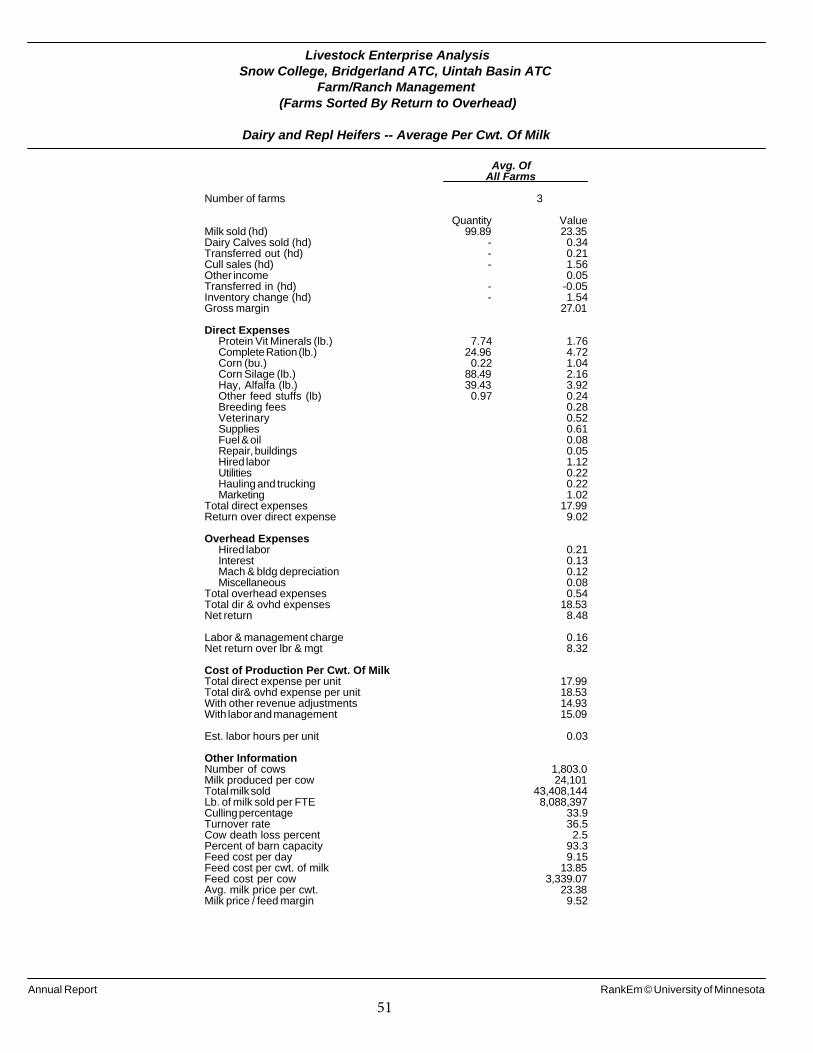
Livestock Enterprise AnalysisSnow College, Bridgerland ATC, Uintah Basin ATC
Farm/Ranch Management(Farms Sorted By Return to Overhead)
Dairy and Repl Heifers -- Average Per Cwt. Of Milk
Avg. OfAll Farms
Number of farms 3
Quantity ValueMilk sold (hd) 99.89 23.35Dairy Calves sold (hd) - 0.34Transferred out (hd) - 0.21Cull sales (hd) - 1.56Other income 0.05Transferred in (hd) - -0.05Inventory change (hd) - 1.54Gross margin 27.01
Direct ExpensesProtein Vit Minerals (lb.) 7.74 1.76Complete Ration (lb.) 24.96 4.72Corn (bu.) 0.22 1.04Corn Silage (lb.) 88.49 2.16Hay, Alfalfa (lb.) 39.43 3.92Other feed stuffs (lb) 0.97 0.24Breeding fees 0.28Veterinary 0.52Supplies 0.61Fuel & oil 0.08Repair, buildings 0.05Hired labor 1.12Utilities 0.22Hauling and trucking 0.22Marketing 1.02
Total direct expenses 17.99Return over direct expense 9.02
Overhead ExpensesHired labor 0.21Interest 0.13Mach & bldg depreciation 0.12Miscellaneous 0.08
Total overhead expenses 0.54Total dir & ovhd expenses 18.53Net return 8.48
Labor & management charge 0.16Net return over lbr & mgt 8.32
Cost of Production Per Cwt. Of MilkTotal direct expense per unit 17.99Total dir& ovhd expense per unit 18.53With other revenue adjustments 14.93With labor and management 15.09
Est. labor hours per unit 0.03
Other InformationNumber of cows 1,803.0Milk produced per cow 24,101Total milk sold 43,408,144Lb. of milk sold per FTE 8,088,397Culling percentage 33.9Turnover rate 36.5Cow death loss percent 2.5Percent of barn capacity 93.3Feed cost per day 9.15Feed cost per cwt. of milk 13.85Feed cost per cow 3,339.07Avg. milk price per cwt. 23.38Milk price / feed margin 9.52
Annual Report RankEm © University of Minnesota
51
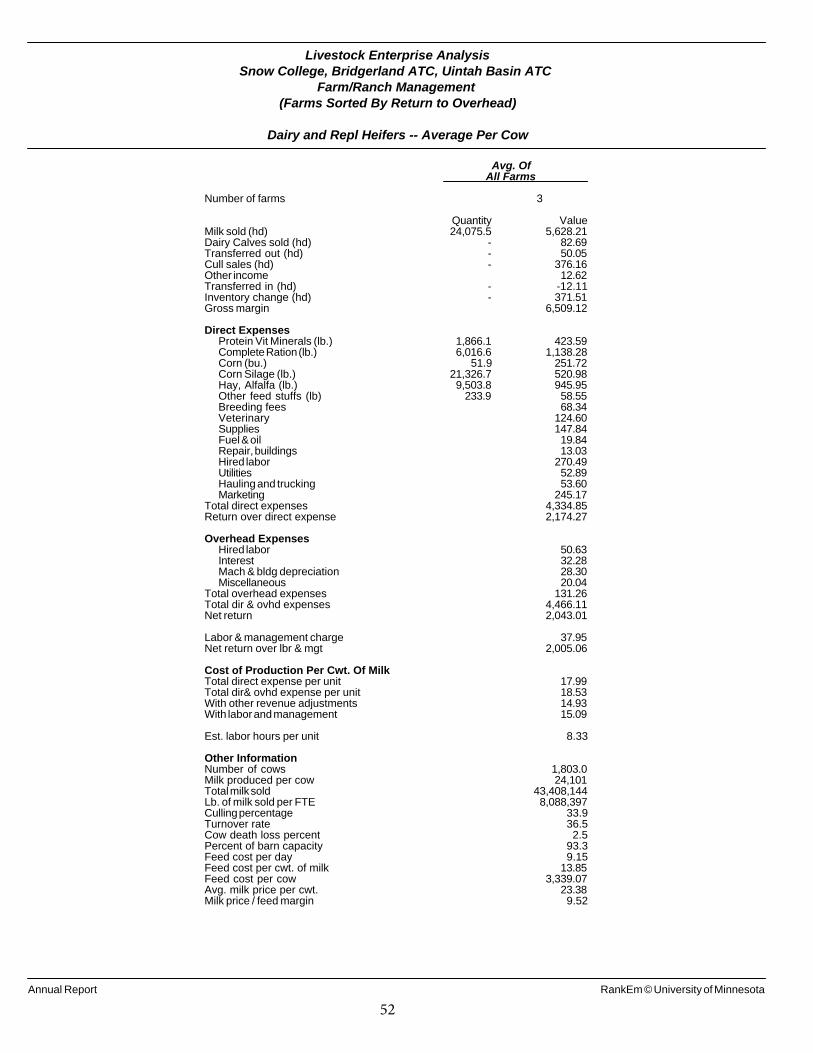
Livestock Enterprise AnalysisSnow College, Bridgerland ATC, Uintah Basin ATC
Farm/Ranch Management(Farms Sorted By Return to Overhead)
Dairy and Repl Heifers -- Average Per Cow
Avg. OfAll Farms
Number of farms 3
Quantity ValueMilk sold (hd) 24,075.5 5,628.21Dairy Calves sold (hd) - 82.69Transferred out (hd) - 50.05Cull sales (hd) - 376.16Other income 12.62Transferred in (hd) - -12.11Inventory change (hd) - 371.51Gross margin 6,509.12
Direct ExpensesProtein Vit Minerals (lb.) 1,866.1 423.59Complete Ration (lb.) 6,016.6 1,138.28Corn (bu.) 51.9 251.72Corn Silage (lb.) 21,326.7 520.98Hay, Alfalfa (lb.) 9,503.8 945.95Other feed stuffs (lb) 233.9 58.55Breeding fees 68.34Veterinary 124.60Supplies 147.84Fuel & oil 19.84Repair, buildings 13.03Hired labor 270.49Utilities 52.89Hauling and trucking 53.60Marketing 245.17
Total direct expenses 4,334.85Return over direct expense 2,174.27
Overhead ExpensesHired labor 50.63Interest 32.28Mach & bldg depreciation 28.30Miscellaneous 20.04
Total overhead expenses 131.26Total dir & ovhd expenses 4,466.11Net return 2,043.01
Labor & management charge 37.95Net return over lbr & mgt 2,005.06
Cost of Production Per Cwt. Of MilkTotal direct expense per unit 17.99Total dir& ovhd expense per unit 18.53With other revenue adjustments 14.93With labor and management 15.09
Est. labor hours per unit 8.33
Other InformationNumber of cows 1,803.0Milk produced per cow 24,101Total milk sold 43,408,144Lb. of milk sold per FTE 8,088,397Culling percentage 33.9Turnover rate 36.5Cow death loss percent 2.5Percent of barn capacity 93.3Feed cost per day 9.15Feed cost per cwt. of milk 13.85Feed cost per cow 3,339.07Avg. milk price per cwt. 23.38Milk price / feed margin 9.52
Annual Report RankEm © University of Minnesota
52

Livestock Enterprise AnalysisSnow College, Bridgerland ATC, Uintah Basin ATC
Farm/Ranch Management(Farms Sorted By Return to Overhead)
Dairy Replacement Heifers -- Average Per Head
Avg. OfAll Farms High 34%
Number of farms 7 3
Quantity Value Quantity ValueReplacements sold (hd) 0.2 185.48 1.0 1,149.33Transferred out (hd) 0.4 700.27 0.5 739.09Cull sales (hd) 0.0 4.63 0.0 5.46Other income 0.33 -Transferred in (hd) 0.7 -147.47 1.3 -266.53Inventory change (hd) 0.0 35.69 -0.4 -159.30Gross margin 778.93 1,468.05
Direct ExpensesProtein Vit Minerals (lb.) 62.1 19.08 81.4 17.71Milk Replacer (lb.) 17.1 46.49 9.8 26.70Milk (lb.) 39.3 7.93 102.5 20.71Complete Ration (lb.) 601.8 85.33 973.9 137.89Corn (bu.) 4.9 23.53 - -Corn Silage (lb.) 7,575.5 181.74 6,530.9 156.77Hay, Alfalfa (lb.) 3,652.9 327.10 2,605.9 219.87Hay, Grass (lb.) 561.2 35.29 846.9 63.52Oatlage (lb.) 118.5 2.49 931.6 19.56Breeding fees 16.25 13.71Veterinary 16.85 12.97Supplies 15.60 16.69Fuel & oil 3.33 11.17Repairs 3.23 8.95Repair, buildings 1.63 8.77Hired labor 34.18 3.26Utilities 3.52 8.31
Total direct expenses 823.57 746.55Return over direct expense -44.64 721.50
Overhead ExpensesHired labor 5.82 45.78RE & pers. property taxes 0.67 0.99Farm insurance 1.73 2.62Dues & professional fees 0.67 1.96Interest 4.84 14.99Mach & bldg depreciation 4.49 13.03Miscellaneous 1.39 1.23
Total overhead expenses 19.62 80.59Total dir & ovhd expenses 843.19 827.14Net return -64.26 640.91
Labor & management charge 8.46 22.28Net return over lbr & mgt -72.72 618.63
Cost of Production Per Head Per DayTotal direct expense per unit 2.55 3.20Total dir& ovhd expense per unit 2.60 3.42With other revenue adjustments 2.60 3.42With labor and management 2.63 3.48
Est. labor hours per unit 3.51 7.49
Other InformationNo. purchased or trans in 493 256Number sold or trans out 444 310Average number of head 690 205Percentage death loss 4.4 4.7Feed cost per average head 728.97 662.73Feed cost/head sold/trans 1,131.54 437.07Total cost/head sold/trans 1,487.77 837.43Feed cost per head per day 2.00 1.82Avg. wgt / Replacements sold 69 105Avg. sales price / head 941.84 1,127.30
Annual Report RankEm © University of MinnesotaAnnual Report RankEm © University of Minnesota
53