2014 - 2015 algebra 1 b mathematics curriculum...
TRANSCRIPT

AAllggeebbrraa 11 bb MATHEMATICS Curriculum Map
2014 - 2015
Florida Standards
Mathematics Department Algebra 1b Curriculum Map Volusia County Schools June 2014
Common Core State Standards Standards for Mathematical Practice
1. Make sense of problems and persevere in solving them. (MAFS.K12.MP.1) Solving a mathematical problem involves making sense of what is known and applying a thoughtful and logical process which sometimes requires perseverance, flexibility, and a bit of ingenuity.
2. Reason abstractly and quantitatively. (MAFS.K12.MP.2) The concrete and the abstract can complement each other in the development of mathematical understanding: representing a concrete situation with symbols can make the solution process more efficient, while reverting to a concrete context can help make sense of abstract symbols.
3. Construct viable arguments and critique the reasoning of others. (MAFS.K12.MP.3) A well-crafted argument/critique requires a thoughtful and logical progression of mathematically sound statements and supporting evidence.
4. Model with mathematics. (MAFS.K12.MP.4) Many everyday problems can be solved by modeling the situation with mathematics.
5. Use appropriate tools strategically. (MAFS.K12.MP.5) Strategic choice and use of tools can increase reliability and precision of results, enhance arguments, and deepen mathematical understanding.
6. Attend to precision. (MAFS.K12.MP.6) Attending to precise detail increases reliability of mathematical results and minimizes miscommunication of mathematical explanations.
7. Look for and make use of structure. (MAFS.K12.MP.7) Recognizing a structure or pattern can be the key to solving a problem or making sense of a mathematical idea.
8. Look for and express regularity in repeated reasoning. (MAFS.K12.MP.8) Recognizing repetition or regularity in the course of solving a problem (or series of similar problems) can lead to results more quickly and efficiently.

Mathematics Department Algebra 1b Curriculum Map Volusia County Schools June 2014
Algebra 1: Florida Standards The fundamental purpose of this course is to formalize and extend the mathematics that students learned in the middle grades. The critical areas, called units, deepen and extend understanding of linear and exponential relationships by contrasting them with each other and by applying linear models to data that exhibit a linear trend, and students engage in methods for analyzing, solving, and using quadratic functions. The Mathematical Practice Standards apply throughout each course and, together with the content standards, prescribe that students experience mathematics as a coherent, useful, and logical subject that makes use of their ability to make sense of problem situations.
Expressions and Equations: In this unit, students build on their knowledge from the unit of Linear and Exponential Relationships, where they extended the laws of exponents to rational exponents. Students apply this new understanding of number and strengthen their ability to see structure in and create quadratic and exponential expressions. They create and solve equations, inequalities, and equations involving quadratic expressions. Quadratic Functions and Modeling: In this unit, students consider quadratic functions, comparing the key characteristics of quadratic functions to those of linear and functions. They select from among these functions to model phenomena. Students learn to anticipate the graph of a quadratic function by interpreting various forms of quadratic expressions. In particular, they identify the real solutions of a quadratic equation as the zeros of a related quadratic function. Students expand their experience with functions to include more specialized functions—absolute value, step, and those that are piecewise-defined. Descriptive Statistics: This unit builds upon students’ prior experiences with data, providing students with more formal means of assessing how a model fits data. Students use regression techniques to describe and approximate linear relationships between quantities. They use graphical representations and knowledge of the context to make judgments about the appropriateness of linear models. With linear models, they look at residuals to analyze the goodness of fit.
Algebra 1b resources for all Units:
Illustrative mathematics: provides the standards with example problems that cover the standard. http://www.illustrativemathematics.org/standards/hs The Math Dude: http://www.montgomeryschoolsmd.org/departments/itv/mathdude/ Algebra Nation- http://www.algebranation.com/

Mathematics Department Algebra 1b Curriculum Map Volusia County Schools June 2014
Algebra 1b: Florida Standards At A Glance
First Quarter Second Quarter Third Quarter Fourth Quarter
DSA Unit 1- Solving Equations/ Inequalities and Functions MAFS.912.A-CED.1.1 MAFS.912.A-CED.1.3 MAFS.912.A-CED.1.4 MAFS.912.A.-REI.1.1 MAFS.912.A-REI.2.3 MAFS.912.F-IF.1.1 MAFS.912.F-IF.1.2
DIA 1
Unit 2: Graphing Linear Equations/ Inequalities MAFS.912.A-CED.1.2 MAFS.912.F-IF.2.4 MAFS.912.F-IF.2.5 MAFS.912.F-IF.2.6 MAFS.912.F-IF.3.7a (linear) MAFS.912.F-LE.2.5 (linear)
Unit 3- Systems of Equations/Inequalities MAFS.912.A-REI. 3.5 MAFS.912.A-REI. 3.6 MAFS.912.A-REI. 3.7 MAFS.912.A-REI.4.10 MAFS.912.A-REI.4.11 MAFS.912.A-REI.4.12
DIA 2
Unit 4- Exponents/ Polynomials MAFS.912.A-SSE.1.1 MAFS.912.A-SSE.1.2 MAFS.912.A-APR.1.1 MAFS.912.N-RN.2.3
SSA
Unit 5-Factoring and Solving Polynomials MAFS.912.A-SSE.1.2 MAFS.912.A-SSE.2.3 (a-b) MAFS.912.F-IF.3.7a (quad) MAFS.912.F-IF.3.8a MAFS.912.A-REI.2.4 MAFS.912.A-APR.2.3
DIA 3 Unit 6- Non –Linear Functions MAFS.912.F-IF.3.7a-e MAFS.912.F-IF.3.8 b MAFS.912.F-IF.3.9 MAFS.912.A-SSE.2.3c MAFS.912.F-BF.1.1 MAFS.912.F-BF.2.3 MAFS.912.A-CED.1.1 MAFS.912.F-LE.1.3 MAFS.912.F-LE.2.5 (exponential)
DIA 4
Unit 7-Interpreting Categorical and Quantitative Data MAFS.912.S-ID.1.1 MAFS.912.S-ID.1.2 MAFS.912.S-ID.1.3 MAFS.912.S-ID.1.4 MAFS.912.S-ID.2.5 MAFS.912.S-ID.2.6 MAFS.912.S-ID.3.7 MAFS.912.S-ID.3.8 MAFS.912.S-ID.3.9
DIA 5
REVIEW FOR EOC ASSESSMENT
MAFS.912.N-RN.2.3- This standard will be covered throughout the entire curriculum
N-RN: Real Number System A-CED: Create Equations that Describe Relationships A-REI: Reasoning with Equations and Inequalities A-APR: Arithmetic with Polynomials & Rational Expressions F-BF: Building Functions F-IF: Interpreting Functions F-LE: Linear, Quadratic and Exponential Models A-SSE: Seeing Structure in Expressions S-ID: Interpreting Data

Mathematics Department Algebra 1b Curriculum Map Volusia County Schools June 2014
Fluency Recommendations A/G- Algebra I students become fluent in solving characteristic problems involving the analytic geometry of lines, such as writing down the equation of a line given a point and a slope. Such fluency can support them in solving less routine mathematical problems involving linearity, as well as in modeling linear phenomena (including modeling using systems of linear inequalities in two variables). A-APR.1- Fluency in adding, subtracting, and multiplying polynomials supports students throughout their work in Algebra, as well as in their symbolic work with functions. Manipulation can be more mindful when it is fluent. A-SSE.1b- Fluency in transforming expressions and chunking (seeing parts of an expression as a single object) is essential in factoring, completing the square, and other mindful algebraic calculations. The following Mathematics and English Language Arts CCSS should be taught throughout the course: MAFS.912.N-Q.1.1: Use units as a way to understand problems and to guide the solution of multi-step problems; choose and interpret units consistently in formulas; choose and interpret the scale and the origin in graphs and data displays. MAFS.912.N-Q.1.2: Define appropriate quantities for the purpose of descriptive modeling. MAFS.912.N-Q.1.3: Choose a level of accuracy appropriate to limitations on measurement when reporting quantities. LAFS.910.RST.1.3: Follow precisely a complex multistep procedure when carrying out experiments, taking measurements or performing tasks, attending to special cases or exceptions defined in the text. LAFS.910.RST.2.4: Determine the meaning of symbols, key terms, and other domain-specific words and phrases as they are used in context and topics. LAFS.910.RST.3.7: Translate quantitative or technical information expressed in words in a text into visual form and translate information expressed visually or mathematically into words. LAFS.910.SL.1.1: Initiate and participate effectively in a range of collaborative discussions with diverse partners. LAFS.910.SL.1.2: Integrate multiple sources of information presented in diverse media or formats evaluating the credibility and accuracy of each source. LAFS.910.SL.1.3: Evaluate a speaker’s point of view, reasoning, and use of evidence and rhetoric, identifying any fallacious reasoning or exaggerated or distorted evidence. LAFS.910.SL.2.4: Present information, findings and supporting evidence clearly, concisely, and logically such that listeners can follow the line of reasoning. LAFS.910.WHST.1.1: Write arguments focused on discipline-specific content. LAFS.910.WHST.2.4: Produce clear and coherent writing in which the development, organization, and style are appropriate to task, purpose, and audience. LAFS.910.WHST.3.9: Draw evidence from informational texts to support analysis, reflection, and research.

Mathematics Department Algebra 1b Curriculum Map Volusia County Schools June 2014
Course: Algebra 1b Unit 1-Solving Equations/Inequalities and Functions
Essential Question(s):
How can algebra describe the relationship between sets of numbers? In what ways can the problem be solved, and why should one method be chosen over another?
Standard The students will:
Learning Goals I can:
Remarks
Resources
MAFS.912A-CED.1.1. Create equations and inequalities in one variable and use them to solve problems. SMP#4
• identify the variables and quantities represented in a real world problem.
• write the equation or inequality that best models the problem.
• solve linear equations and inequalities.
• interpret the solution in the context of the problem.
Students may believe that solving an equation such as 3x + 1 = 7 involves “only removing the 1,” failing to realize that the equation 1 = 1 is being subtracted to produce the next step. Recommendation: Review spirally operations with rational and irrational numbers as you apply solving equations and inequalities
*AlgebraNation.com Mini-Projects/Tasks= http://insidemathematics.org/problems-of-the-month/pom-onbalance.pdf http://insidemathematics.org/common-core-math-tasks/high-school/HS-A-2003%20Number%20Towers.pdf
MAFS.912A.REI.1.1 Explain each step in solving a simple equation as following from the equality of numbers asserted at the previous step, starting from the assumption that the original equation has a solution. Construct a viable argument to justify a solution method. SMP#2, 3
• explain a process to solve equations. • apply order of operations and inverse
operations to solve equations • apply the distributive property when
necessary to solve equations. • construct a viable argument to justify
a solution method.
When using Distributive Property, students often multiply the number (or variable) outside the parentheses by the first term in the parentheses, but neglect to multiply that same number by the other term(s) in the parentheses. Regarding variables on both sides, students often will try to combine the terms as if they are on the same side of the equation rather than eliminating one of the variables.
Mathematics Department Algebra 1b Curriculum Map Volusia County Schools June 2014
Course: Algebra 1b
Unit 1-Solving Equations/ Inequalities and Functions (con’t)
Essential Question(s): How can algebra describe the relationship between sets of numbers?
In what ways can the problem be solved, and why should one method be chosen over another? Standard
The students will: Learning Goals
I can:
Remarks Resources
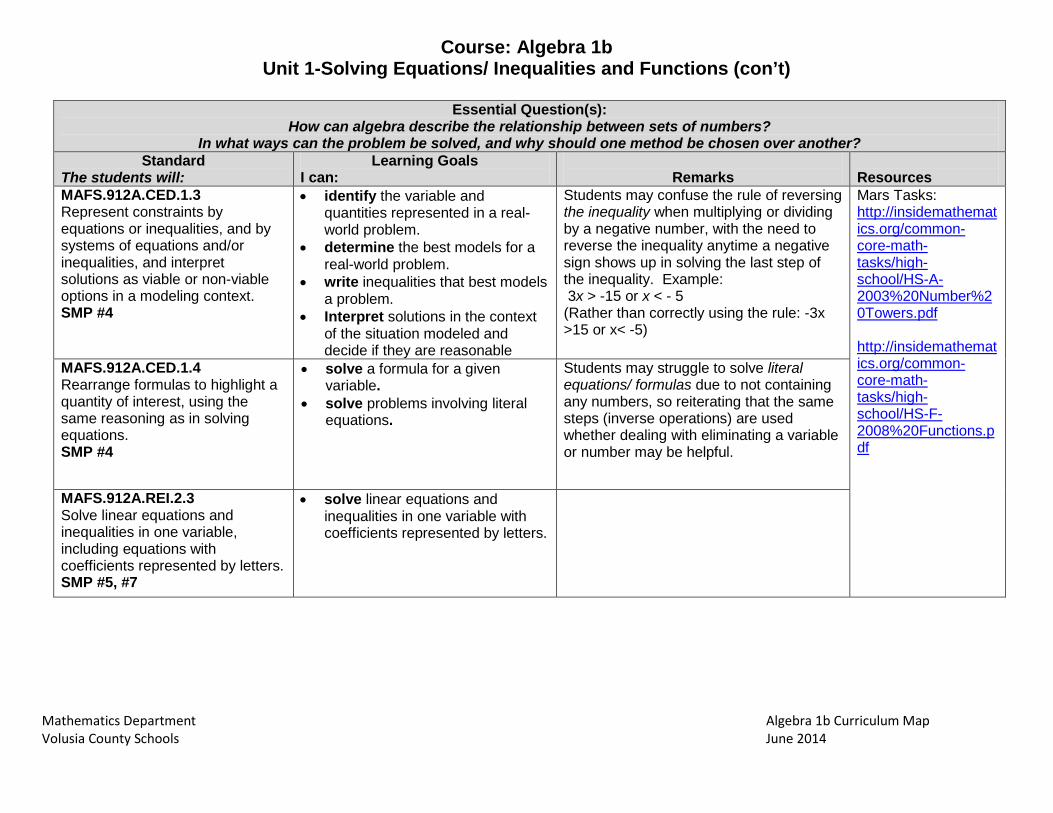
MAFS.912A.CED.1.3 Represent constraints by equations or inequalities, and by systems of equations and/or inequalities, and interpret solutions as viable or non-viable options in a modeling context. SMP #4
• identify the variable and quantities represented in a real-world problem.
• determine the best models for a real-world problem.
• write inequalities that best models a problem.
• Interpret solutions in the context of the situation modeled and decide if they are reasonable
Students may confuse the rule of reversing the inequality when multiplying or dividing by a negative number, with the need to reverse the inequality anytime a negative sign shows up in solving the last step of the inequality. Example: 3x > -15 or x < - 5 (Rather than correctly using the rule: -3x >15 or x< -5)
Mars Tasks: http://insidemathematics.org/common-core-math-tasks/high-school/HS-A-2003%20Number%20Towers.pdf http://insidemathematics.org/common-core-math-tasks/high-school/HS-F-2008%20Functions.pdf
MAFS.912A.CED.1.4 Rearrange formulas to highlight a quantity of interest, using the same reasoning as in solving equations. SMP #4
• solve a formula for a given variable.
• solve problems involving literal equations.
Students may struggle to solve literal equations/ formulas due to not containing any numbers, so reiterating that the same steps (inverse operations) are used whether dealing with eliminating a variable or number may be helpful.
MAFS.912A.REI.2.3 Solve linear equations and inequalities in one variable, including equations with coefficients represented by letters. SMP #5, #7
• solve linear equations and inequalities in one variable with coefficients represented by letters.

Mathematics Department Algebra 1b Curriculum Map Volusia County Schools June 2014
Course: Algebra 1b Unit 1 - Solving Equations/ Inequalities and Functions (cont)
Essential Question(s): How can algebra describe the relationship between sets of numbers?
In what ways can the problem be solved, and why should one method be chosen over another? Standard
The students will: Learning Goals
I can:
Remarks Resources
MAFS. 912.F-IF.1.1 Understand that a function from one set (called the domain) to another set (called the range) assigns to each element of the domain exactly one element of the range. If f is a function and x is an element of its domain, the f(x) denotes the output of f corresponding to the input x. The graph of f is the graph of the equation y=f(x). SMP #6, #7
• define relation, domain and range. • define a function as a relation in which
each input (domain) has exactly one output (range).
• determine if a graph, table or set of ordered pairs represent a function.
• determine if stated rules (both numeric and non-numeric) produce ordered pairs that form a function.
• explain that when ‘x’ is an element of the input of a function f(x) represents the corresponding output.
• explain that the graph of ‘f’ is the graph of the equation y=f(x).
Students may believe that all relationships having an input and an output are functions, and therefore, misuse the function terminology. Students may also believe that the notation f(x) means to multiply some value f times another value x. The notation alone can be confusing and needs careful development. For example, f(2) means the output value of the function f when the input value is 2. Students may believe that it is reasonable to input any x-value into a function, so they will need to examine multiple situations in which there are various limitations to the domains. Other letters can be used for functional notation e.g. g(x), p(x), etc…
Tasks & Mini-Projects http://insidemathematics.org/common-core-math-tasks/high-school/HS-F-2008%20Functions.pdf http://insidemathematics.org/common-core-math-tasks/high-school/HS-F-2004%20Graphs2004.pdf http://insidemathematics.org/common-core-math-tasks/high-school/HS-F-2006%20Printing%20Tickets.pdf

Mathematics Department Algebra 1b Curriculum Map Volusia County Schools June 2014
Course: Algebra 1b Unit 1 - Solving Equations/ Inequalities and Functions (cont)
Essential Question(s): How can algebra describe the relationship between sets of numbers?
In what ways can the problem be solved, and why should one method be chosen over another? Standard
The students will: Learning Goals
I can:
Remarks Resources
MAFS. 912.F-IF.1.2 Use function notation, evaluate functions for inputs in their domains, and interpret statements that use function notation in terms of a context. SMP #7
• decode function notation and explain how the output of a function is matched to its input.
• convert a table, graph, set of ordered pairs or description into function notation by identifying the rule used to turn inputs into outputs and writing the rule.
• use order of operations to evaluate a function for a given domain value.
• identify the numbers that are not in the domain of a function. • choose and analyze inputs (and outputs) that make sense based
on the problem.
f(x)= 2x2 + 4….squares the input, doubles the square and adds four to produce the output
Mathematics Department Algebra 1b Curriculum Map Volusia County Schools June 2014
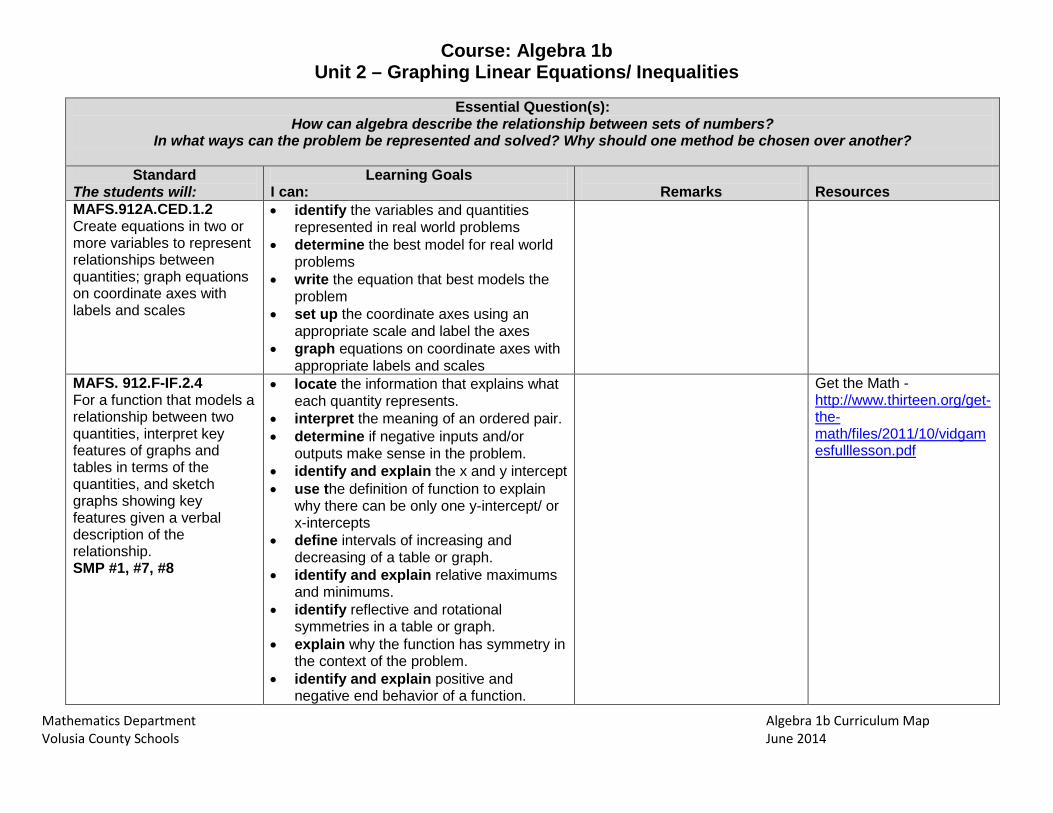
Course: Algebra 1b
Unit 2 – Graphing Linear Equations/ Inequalities
Essential Question(s): How can algebra describe the relationship between sets of numbers?
In what ways can the problem be represented and solved? Why should one method be chosen over another?
Standard The students will:
Learning Goals I can:
Remarks
Resources
MAFS.912A.CED.1.2 Create equations in two or more variables to represent relationships between quantities; graph equations on coordinate axes with labels and scales
• identify the variables and quantities represented in real world problems
• determine the best model for real world problems
• write the equation that best models the problem
• set up the coordinate axes using an appropriate scale and label the axes
• graph equations on coordinate axes with appropriate labels and scales
MAFS. 912.F-IF.2.4 For a function that models a relationship between two quantities, interpret key features of graphs and tables in terms of the quantities, and sketch graphs showing key features given a verbal description of the relationship. SMP #1, #7, #8
• locate the information that explains what each quantity represents.
• interpret the meaning of an ordered pair. • determine if negative inputs and/or
outputs make sense in the problem. • identify and explain the x and y intercept • use the definition of function to explain
why there can be only one y-intercept/ or x-intercepts
• define intervals of increasing and decreasing of a table or graph.
• identify and explain relative maximums and minimums.
• identify reflective and rotational symmetries in a table or graph.
• explain why the function has symmetry in the context of the problem.
• identify and explain positive and negative end behavior of a function.
Get the Math - http://www.thirteen.org/get-the-math/files/2011/10/vidgamesfulllesson.pdf

Mathematics Department Algebra 1b Curriculum Map Volusia County Schools June 2014
• define and identify a periodic function from a table or graph.
• explain why a function is periodic. • Locate the information that explains what
each quantity represents in a word problem
• decide which quantity should be used as input in a word problem
• create a graph that matches the description and indicates all the key features of the function
MAFS. 912.F-IF.2.5 Relate the domain of a function to its graph and, where applicable, to the quantitative relationship it describes. SMP #4
• explain how the domain of a function is represented in its graph.
• state, defend and explain the appropriate domain of a function that represents a problem situation.
Given h(x) = √𝑥 the domain has to be positive numbers
MAFS. 912.F-IF.2.6 Calculate and interpret the average rate of change of a function (presented symbolically or as a table) over a specified interval. Estimate the rate of change from a graph. SMP #4, #5
• define interval, rate of change and average rate of change.
• explain the connection between average rate of change and the slope formula
• calculate the average rate of change of a function, represented either by function notation, a graph or a table over a specific interval.
• compare the rates of change of two or more functions
• interpret the meaning of the average rate of change in the context of the problem.
Students may also believe that the slope of a linear function is merely a number used to sketch the graph of the line. In reality, slopes have real-world meaning, and the idea of a rate of change is fundamental to understanding major concepts from geometry to calculus.
MAFS.912.F-IF.3.7a Graph linear functions by hand and show intercepts, maxima, and minima. SMP #7,#8
• identify that the parent function for lines is the line f(x) = x.
• identify and graph a line in the point-slope form: y-y1=m(x-x1).
• identify and graph a line in slope-intercept form: f(x)=mx+b.
• identify the slope –intercept form of a linear function
• graph a line in slope-intercept form and

Mathematics Department Algebra 1b Curriculum Map Volusia County Schools June 2014
use the graph to show where the y-intercept and the slope are represented in the graph
• identify the standard form of a linear function as Ax + By = C.
• use the definitions of x and y intercepts to find the intercepts of a line in standard form and then graph the line.
• relate the constants A, B, and C to the values of the x and y intercepts and slope.
MAFS.912.F-LE.2.5 Interpret the parameters in a linear function in terms of a context. SMP #2, #4
• identify the names and definitions of the parameters ‘m’ and ‘b’ in a linear function f(x)=mx+b.
• explain the meaning (using appropriate units) of the slope, y-intercept and other points on the line when then line models a real-world relationship.
• compose an original problem situations and construct a linear function to model it.

Mathematics Department Algebra 1b Curriculum Map Volusia County Schools June 2014
Course: Algebra 1b Unit 3- Systems of Equations/Inequalities
Essential Question(s):
In what ways can the problem be represented and solved? Why should one method be chosen over another?
Standard The students will:
Learning Goals I can:
Remarks
Resources
MAFS.912A.REI.3.5 Prove that a given system of two equations in two variables, replacing one equation by the sum of that equation and a multiple of the other produces a system with the same solutions. SMP #3
• Define systems of equations • Solve a system of two equations in two variables by elimination • Demonstrate that replacing one equation with the sum of that
equation and a multiple of the other creates a system with the same solutions as the original system
Include cases where the two equations describe the same line (infinitely many solutions) and cases whete the two equations describe parallel lines(no solution)
MAFS.912A.REI.3.6 Solve systems of equations exactly and approximately( e.g. with graphs), focus on pairs of linear equations in two variables SMP #7
• Define system of a linear equations and solution of a system • Explain why some linear systems have no solutions and identify
linear systems that have no solutions • Explain why some systems have infinitely many solutions and
identify those systems • Solve a system of linear equations algebraically (by substitution
or elimination) to find exact solution. • Graph a linear equation on the coordinate plane • Determine the approximate solution to a system of linear
equations by graphing both equations and estimating points of intersection
Focus on justification of the methods used. Connect with to GPR.5 when is taught in Geometry, which requires students to prove the slope criteria for parallel lines
MAFS.912A.REI.3.7 Solve a simple system consisting of a linear equation and a quadratic equation in two variables algebraically and graphically. SMP #8
• Distinguish between equations that are linear and those that are quadratic
• Use substitution to solve a system of equations in which one equation is linear and one is quadratic
• Graph a linear equation on a coordinate plane • Graph quadratic equations on a coordinate plane • Determine the approximate solution of a system of equations in
which one equation is linear and one equation is quadratic by graphing and estimating the points of intersection.
Include systems that lead to work with fractions.

Mathematics Department Algebra 1b Curriculum Map Volusia County Schools June 2014
MAFS.912.A-REI.4.10. Understand that the graph of an equation in two variables is the set of all its solutions plotted in the coordinate plane, often forming a curve (which could be a line). SMP #2
• explain that every ordered pair on the graph of an equation represents values that make the equation true.
• verify that any point on a graph will result in a true equation when their coordinates are substituted into the equation.
MAFS.912.A-REI.4.11 Explain why the x-coordinate of the points where the graphs of the equations 𝑦 =𝑓(𝑥)𝑎𝑛𝑑 𝑦 = 𝑔(𝑥) intersect are the solutions of the equation 𝑓(𝑥) = 𝑔(𝑥); find the solutions approximately, e.g., using technology to graph the functions, make table of values, or find successive approximations. Include cases where f(x) and/or g(x) are linear, polynomial, rational, absolute value, exponential, and logarithmic functions. SMP #5
• Explain the point of intersection on the graph of a system of equations, y=f(x) and y=g(x), represents a solution for both equations
• Infer that since y=f(x)and y=g(x), f(x) = g(x) by the substitution property.
• Infer that the x-coordinate of the points of intersection for y=f(x)and y=g(x) are also solutions for f(x)= g(x)
• Use graphing calculator to determine the approximate solutions to a system of equations
Focus on cases where f(x) and g(x) are linear or exponential. Finding the solutions approximately is limited to cases where f(x) ang g(x) are polynomial functions.
MAFS.912.A-REI.4.12 Graph the solutions to linear inequality in two variables as a half-plane (excluding the boundary in the case of a strict inequality), and graph the solution set to a system of linear inequalities in two variables as the intersection of the corresponding half-planes. SMP #5
• Define linear inequality, half-plane, and boundary. • Graph a linear inequality on a coordinate plane, resulting in a
boundary line (solid or dashed) and a shaded half-plane. • Graph a system of linear equations/ inequalities on a coordinate
plane. • Explain that the solution set for a system of linear inequalities is
the intersection of the shaded regions of both inequalities • Check points in the intersection of the half-planes to verify that
they represent a solution to the system.

Mathematics Department Algebra 1b Curriculum Map Volusia County Schools June 2014
Course: Algebra 1b
Unit 4 – Exponents/ Polynomials
Essential Question(s): How do you apply properties of the real numbers when working with polynomials and rational expressions?
Standard The students will:
Learning Goals I can:
Remarks
Resources
MAFS.912.A-SSE.1.1: Interpret expressions that represent a quantity in terms of its context.
a) Interpret parts of an expression, such as terms, factors and coefficients.
b) Interpret complicated expressions by viewing one or more of their parts as a single entity.
SMP #7
• define expression, term, factor, and coefficient.
• interpret the real-world meaning of the terms, factors and coefficients of an expression in terms of their units.
• group the parts of an expression differently in order to better interpret their meaning.
Students may believe that an expression cannot be factored because it does not fit into a form they recognize. They need help with reorganizing the terms until structures become evident. Students will often combine terms that are not like terms. For example, 2 + 3x = 5x or 3x + 2y = 5xy. Students sometimes forget the coefficient of 1 when adding like terms. For example, x + 2x + 3x = 5x rather than 6x. Students will change the degree of the variable when adding/subtracting like terms. For example, 2x + 3x = 5x2 rather than 5x. Students will forget to distribute to all terms when multiplying. For example, 6(2x + 1) = 12x + 1 rather than 12x + 6. Students may not follow the Order of Operations when simplifying expressions. For example, 4x2 when x = 3 may be incorrectly evaluated as 4•32 = 122 = 144, rather than 4•9 = 36. Students fail to use the property of exponents correctly when using the distributive property. For example, 3x(2x – 1) = 6x – 3x = 3x instead of simplifying as 3x(2x – 1) = 6x2 – 3x. Students fail to understand the structure of expressions. For example, they will write 4x when x = 3 is 43 instead of 4x = 4•x so when x = 3, 4x = 4•3 = 12. In addition, students commonly misevaluate –32 = 9 rather than –32 = –9. Students routinely see –32 as the same as (–3)2 = 9. Students commonly confuse the properties of exponents, specifically the product of powers property with the power of a power property. Students will incorrectly translate expressions that contain a difference of terms. For example, 8 less than 5 times a number is often incorrectly translated as 8 – 5n rather than 5n – 8.
Tasks & Mini-Projects http://engageny.org/resource/common-core-exemplar-for-high-school-math

Mathematics Department Algebra 1b Curriculum Map Volusia County Schools June 2014
Course: Algebra 1b Unit 4 – Exponents/ Polynomials
Essential Question(s): How do you apply properties of the real numbers when working with polynomials and rational expressions?
Standard The students will:
Learning Goals I can:
Remarks
Resources
MAFS.912.A-SSE.1.2: Use the structure of an expression to identify ways to rewrite it. SMP #7
• Identify identity clues in the structure of the expression in order to rewrite expressions in multiple ways
• Explain why equivalent expressions are equivalent
o multiply and divide polynomials by monomials.
o multiply two binomials using the distributive property.
• apply models for factoring polynomials to rewrite expressions.
For example, see x4- y4 as (x²)² – (y²)², thus recognizing it as a difference of squares that can be factored as (x² – y²)(x² + y²).
MAFS.912.A-APR.1.1: Understand that polynomials form a system analogous to the integers, namely, they are closed under the operations of addition, subtraction, and multiplication; add, subtract, and multiply polynomials. SMP #2, #7
• apply the definition of an integer to explain why adding , subtracting or multiplying two integers always produce an integer
• apply the definition of polynomials to explain why adding , subtracting or multiplying two integers always produce an integer
• add, subtract and multiply polynomials
Students often forget to distribute the subtraction to terms other than the first one. For example, students will write (4x + 3) – (2x + 1) = 4x + 3 – 2x + 1 = 2x + 4 rather than 4x + 3 – 2x – 1 = 2x + 2. Students will change the degree of the variable when adding/subtracting like terms. For example, 2x + 3x = 5x2 rather than 5x. Students may not distribute the multiplication of polynomials correctly and only multiply like terms. For example, they will write (x + 3)(x – 2) = x2 – 6 rather than x2 – 2x + 3x – 6.
Mathematics Department Algebra 1b Curriculum Map Volusia County Schools June 2014
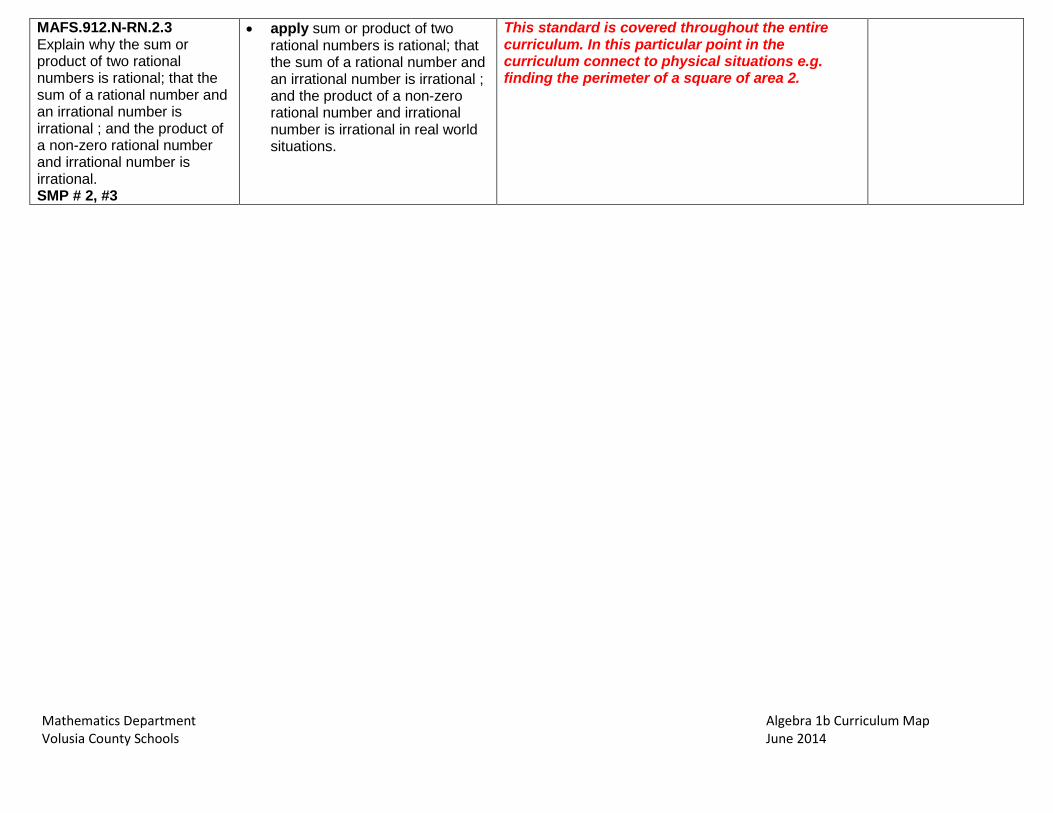
MAFS.912.N-RN.2.3 Explain why the sum or product of two rational numbers is rational; that the sum of a rational number and an irrational number is irrational ; and the product of a non-zero rational number and irrational number is irrational. SMP # 2, #3
• apply sum or product of two rational numbers is rational; that the sum of a rational number and an irrational number is irrational ; and the product of a non-zero rational number and irrational number is irrational in real world situations.
This standard is covered throughout the entire curriculum. In this particular point in the curriculum connect to physical situations e.g. finding the perimeter of a square of area 2.

Mathematics Department Algebra 1b Curriculum Map Volusia County Schools June 2014
Course: Algebra 1b Unit 5 - Factoring and Solving Polynomials
Essential Question(s):
How do you factor and solve a polynomial, Why should one method be chosen over another? Standard
The students will: Learning Goals
I can:
Remarks Resources
MAFS.912.A-SSE.1.2: Use the structure of an expression to identify ways to rewrite it. SMP #7
• apply models for factoring polynomials to rewrite expressions.
Some students may believe that factoring and completing the square are isolated techniques within a unit of quadratic equations. Teachers should help students to see the value of these skills in the context of solving higher degree equations and examining different families of functions. Some students may believe that the minimum of the graph of a quadratic function always occur at the y-intercept.
Tasks & Mini-Projects http://insidemathematics.org/common-core-math-tasks/high-school/HS-A-2006%20Quadratic2006.pdf http://insidemathematics.org/common-core-math-tasks/high-school/HS-A-2007%20Two%20Solutions.pdf
MAFS.912.A-SSE.2.3 a, b Choose and produce an equivalent form of an expression to reveal and explain properties of the quantity represented by the expression.
a) Factor a quadratic expression to reveal the zeros of the function it defines.
b) Complete the square in a quadratic expression to reveal the maximum or minimum value of the function it defines.
SMP #7
• factor a quadratic expression to find the zeroes of the function.
• Identify and factor perfect-square trinomials
• Complete the square to rewrite a quadratic expression from standard form to vertex form.
• predict whether a quadratic will have a minimum or a maximum based on the value of ‘a.
• identify the maximum or minimum of a quadratic written in the form a(x-h)2+k.

Mathematics Department Algebra 1b Curriculum Map Volusia County Schools June 2014
MAFS.912.F-IF.3.7a Graph linear functions by hand and show intercepts, maxima, and minima. SMP #7,#8
• explain that the parent function for quadratic functions is the parabola= 𝑓(𝑥) = 𝑥2.
• Explain that the minimum or maximum of a quadratic is called a vertex
• Identify whether the vertex of a quadratic will be a minimum or maximum by looking at the equation
• Find the y-intercept of a quadratic by substituting 0 for the x and evaluating
• Estimate the vertex of a quadratic by evaluating different values for x
• Use calculated values while looking for a minimum or maximum to decide if a quadratic has x-intercepts
• Estimate the x-intercepts of a quadratic by evaluating different values of x
• Graph a quadratic using evaluated points
• Use technology to graph a quadratic and to find precise values for the x-intercept(s) and the maximum or minimum. .
This standard started in Unit 2 related to Linear Functions and will expand to non-linear function in Unit 6

Mathematics Department Algebra 1b Curriculum Map Volusia County Schools June 2014
MAFS.912.F-IF.3.8a Use the process of factoring and completing the square in a quadratic function to show zeroes, extreme values, and symmetry of the graph, and interpret these terms of a context. SMP #2, #7
• Explain that there are three forms of quadratic functions: Standard, Vertex and Factored forms
• Explain that standard form is 𝑓(𝑥) = 𝑎𝑥2 + 𝑏𝑥 + 𝑐
• Explain that vertex form is 𝑓(𝑥) = 𝑎(𝑥 − ℎ)2 + 𝑘 where the vertex is located at the point (h,k)
• Explain that factored form is 𝒇(𝒙) = 𝒂 (𝒙 − 𝒙𝟏)(𝒙 − 𝒙𝟐) where 𝒙𝟏 and 𝒙𝟐 are the x-intercepts of the function
• Explain that the graph of all forms of a quadratic is a parabola
• Find the x-intercepts of a quadratic written in factored form
• Use the x-intercepts of a quadratic to find the axis of symmetry
• Use the axis of symmetry of a quadratic to find the vertex of a parabola
• Identify the line of symmetry of a quadratic to find the vertex of the parabola.
• Identify the line of symmetry and the vertex of a quadratic written in vertex form
• Sketch a graph of a parabola written in vertex form
• Tell if a quadratic written in vertex form has x-intercepts by looking at the equation
• Find the x-intercepts of a quadratic written in vertex form
• Convert a standard form quadratic to factored form by factoring
• Convert a standard form quadratic to vertex form by completing the square
This standard will continue to expand to exponential functions with integer exponents in Unit 6.

Mathematics Department Algebra 1b Curriculum Map Volusia County Schools June 2014
• Demonstrate that the standard, factored and vertex forms of the same quadratic function produce the same values for the x-intercepts, the y-intercepts, and the vertex.

Mathematics Department Algebra 1b Curriculum Map Volusia County Schools June 2014
Course: Algebra 1b Unit 5 - Factoring and Solving Polynomials (cont)
Essential Question(s):
How do you factor and solve a polynomial, Why should one method be chosen over another? Standard
The students will: Learning Goals
I can:
Remarks Resources
MAFS.912.A-REI.2.4: Solve quadratic equations in one variable.
a) Use the method of completing the square to transform any quadratic equation in x into an equation of the form (x – p)² = q that has the same solutions. Derive the quadratic formula from this form.
b) Solve quadratic equation by inspection (e.g., for x² = 49), taking square roots, completing the square, the quadratic formula and factoring, as appropriate to the initial form of the equation. Recognize when the quadratic formula gives complex solutions and write them as a ± bi for real numbers a and b.
SMP #7, #8
• identify a quadratic expression, ax2 + bx + c.
• identify a perfect-square trinomial by first noticing if a and c are perfect squares and if b = 2ac.
• factor a perfect-square trinomial. • complete the square of ax2 + bx + c to
write the quadratic in form (x-p)2 = q. • derive the quadratic formula by
completing the square of ax2 + bx + c. • determine the best method to solve a
quadratic equation in one variable. • solve quadratic equations by inspection. • solve quadratic equations by finding
square roots. • solve quadratic equations by completing
the square. • solve quadratic equations using the
quadratic formula. • solve quadratic equations by factoring. • explain that complex solutions result when
the radicand is negative in the quadratic formula (b2 – 4ac < 0).
• write complex number solutions for a quadratic equation in the form a + bi by using i = √-1.
Students should learn of the existence of the complex number system but will not solve quadratics with complex solutions until Algebra 2. Students are not required to write solutions for quadratics that have roots with non-zero imaginary parts but they must be able to recognize cases which a quadratic equation has no real solutions.
http://www.purplemath.com/modules/complex3.htm

Mathematics Department Algebra 1b Curriculum Map Volusia County Schools June 2014
Course: Algebra 1b Unit 5 - Factoring and Solving Polynomials (cont)
Essential Question(s):
How do you factor and solve a polynomial? Why should one method be chosen over another? Standard
The students will: Learning Goals
I can:
Remarks Resources
MAFS.912.A-APR.2.3: Identify zeros of polynomials when suitable factorizations are available, and use the zeros to construct a rough graph of the function defined by the polynomial. SMP #1, #8
• identify the zeroes of factored polynomials. • identify the multiplicity of the zeroes of a
factored polynomial. • explain how the multiplicity of zeroes provides a
clue as to how the graph will behave when it approaches and leaves the x-intercept.
• sketch a rough graph using the zeroes of a polynomial and other easily identifiable points such as the y-intercept.
Tasks are limited to quadratic and cubic polynomials in which linear and quadratic factors are available. For example, find the zeros of (x - 2)(x2 - 9).

Mathematics Department Algebra 1b Curriculum Map Volusia County Schools June 2014
Course: Algebra 1b Unit 6 – Non-Linear Functions
Essential Question(s):
How can the relationship between quantities best be represented? When does a function best models a situation? Which model best describes the situation?
Standard The students will:
Learning Goals I can:
Remarks
Resources
MAFS.912.F-IF.3.7b-e Graph function expressed symbolically and show key features of the graph, by hand in simple cases and using technology for more complicated functions. SMP #7, #8
Square Roots Functions • explain that the parent function for square root
functions is f(x)=√𝑥, • sketch a graph of a square root function by hand • use technology to graph a square roots functions Cube Roots Functions • explain that the parent function for quadratic
functions is a parabola 𝑓3(𝑥) = √𝑥, • sketch graph a cube root function by hand • use technology to graph cube root functions and
find intercepts Piecewise Functions • define piecewise functions as functions that have
different rules for evaluation depending on the value of the input
• identify which evaluation rule to use for a specific value of x
• represent a piecewise function with a table or graph by evaluating several values of x.
The expectation is for F.IF.3.7a &3.7e to focus on linear and exponential functions in Algebra I. Include comparisons of two functions presented algebraically. For example, compare the growth of two linear functions, or two exponential functions. In Algebra I for F.IF.3.7b, compare and contrast absolute value, step and piecewise- defined functions with linear, quadratic, and exponential functions. Highlight issues of domain, range, and usefulness when examining piecewise- defined functions.
Forming Quadratics – http://map.mathshell.org/materials/download.php?fileid=700

Mathematics Department Algebra 1b Curriculum Map Volusia County Schools June 2014
Absolute Value
• explain that the parent function for an absolute value functions f(x) = |𝑥|
• explain why absolute value functions are consider composite functions.
• explain that the minimum and maximum of a quadratic is called the .
• identify whether the vertex of a quadratic will be a minimum or maximum by looking at the equation
• find the y-intercept of a quadratic by substituting 0 for ‘x’ and evaluating.
• estimate the vertex of a quadratic by evaluating different values of ‘x’
• estimate the x-intercepts of a quadratic by evaluating different values of x
• graph a quadratic using evaluated points • use technology to graph a quadratic functions
MAFS.912.F-IF.3.8a Write a function defined by an expression in different but equivalent forms to reveal and explain different properties of the function. a. Use the process of factoring and
completing the square in a quadratic function to show zeros, extreme values, and symmetry of the graph, and interpret these in terms of a context.
SMP #2, #7
• find intercepts, maximums and minimums, end behavior, and horizontal asymptotes (by observation) when present.
• explain how the domain of a function is represented in its graph.
Mathematics Department Algebra 1b Curriculum Map Volusia County Schools June 2014
Course: Algebra 1b Unit 6 – Non-Linear Functions (cont)
Essential Question(s): How can the relationship between quantities best be represented?
When does a function best models a situation? Which model best describes the situation? Standard
The students will: Learning Goals
I can:
Remarks Resources
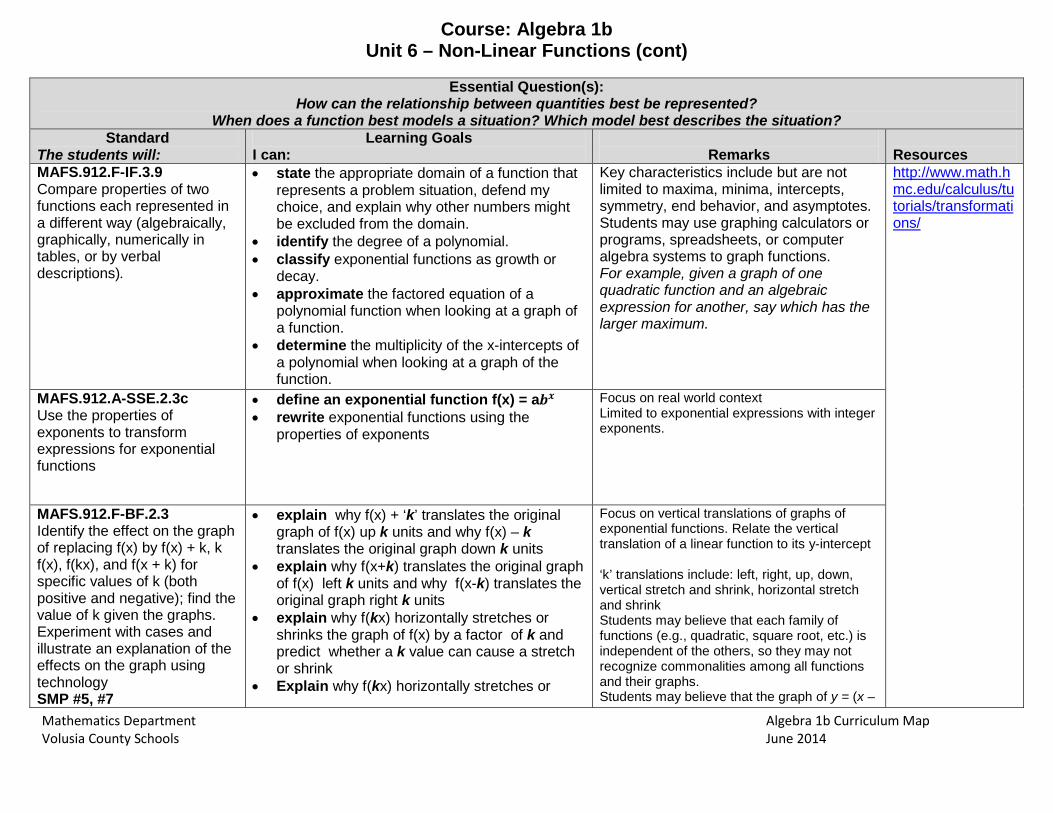
MAFS.912.F-IF.3.9 Compare properties of two functions each represented in a different way (algebraically, graphically, numerically in tables, or by verbal descriptions).
• state the appropriate domain of a function that represents a problem situation, defend my choice, and explain why other numbers might be excluded from the domain.
• identify the degree of a polynomial. • classify exponential functions as growth or
decay. • approximate the factored equation of a
polynomial function when looking at a graph of a function.
• determine the multiplicity of the x-intercepts of a polynomial when looking at a graph of the function.
Key characteristics include but are not limited to maxima, minima, intercepts, symmetry, end behavior, and asymptotes. Students may use graphing calculators or programs, spreadsheets, or computer algebra systems to graph functions. For example, given a graph of one quadratic function and an algebraic expression for another, say which has the larger maximum.
http://www.math.hmc.edu/calculus/tutorials/transformations/
MAFS.912.A-SSE.2.3c Use the properties of exponents to transform expressions for exponential functions
• define an exponential function f(x) = a𝒃𝒙 • rewrite exponential functions using the
properties of exponents
Focus on real world context Limited to exponential expressions with integer exponents.
MAFS.912.F-BF.2.3 Identify the effect on the graph of replacing f(x) by f(x) + k, k f(x), f(kx), and f(x + k) for specific values of k (both positive and negative); find the value of k given the graphs. Experiment with cases and illustrate an explanation of the effects on the graph using technology SMP #5, #7
• explain why f(x) + ‘k’ translates the original graph of f(x) up k units and why f(x) – k translates the original graph down k units
• explain why f(x+k) translates the original graph of f(x) left k units and why f(x-k) translates the original graph right k units
• explain why f(kx) horizontally stretches or shrinks the graph of f(x) by a factor of k and predict whether a k value can cause a stretch or shrink
• Explain why f(kx) horizontally stretches or
Focus on vertical translations of graphs of exponential functions. Relate the vertical translation of a linear function to its y-intercept ‘k’ translations include: left, right, up, down, vertical stretch and shrink, horizontal stretch and shrink Students may believe that each family of functions (e.g., quadratic, square root, etc.) is independent of the others, so they may not recognize commonalities among all functions and their graphs. Students may believe that the graph of y = (x –

Mathematics Department Algebra 1b Curriculum Map Volusia County Schools June 2014
shrinks the graph of f(x) by a factor of 1𝒌 and
predict whether a given value of k will cause a stretch or shrink.
• Describe the transformation that changed a graph of f(x) into a different graph when given pictures of the pre-image and image.
• Determine the value of k given the graph of a transformed function.
• Graph(with and without technology) the transformations 𝑓(𝑥) ± 𝑘, 𝑓(𝑥 ± 𝑘),𝑘𝑓(𝑥)𝑎𝑛𝑑 𝑓(𝑘𝑥)
• Anlyze the similarities and differences between functions with different values
• Recognize form a graph if the function is even or odd
• Explain when a function is even or odd
4)3 is the graph of y = x3 shifted 4 units to the left (due to the subtraction symbol). Examples should be explored by hand and on a graphing calculator to overcome this misconception. Students often confuse the shift of a function with the stretch of a function. .

Mathematics Department Algebra 1b Curriculum Map Volusia County Schools June 2014
Course: Algebra 1b Unit 6 – Non-Linear Functions (cont)
Essential Question(s): How can the relationship between quantities best be represented?
When does a function best models a situation? Which model best describes the situation? Standard
The students will: Learning Goals
I can:
Remarks Resources
MAFS.912.F-BF.1.1 Write a function that describes the relationship between two quantities. SMP #4, #7 MAFS.912A-CED.1.1. Create equations and inequalities in one variable and use them to solve problems. Include equations arising from linear and quadratic functions, and simple rational and exponential functions. SMP#4
• Define explicit and recursive expressions of a function
• identify the quantities being compared in a real-world problem.
• Write an explicit and/or recursive expressions of a function to describe real world situations
• Recall parent functions • Apply transformations to equations of
parent functions • Combine different parent functions (+,-,x,
/) to write a function that describes real world situations
• Compose two or more functions • Explain a multi-step real world problem in
terms of function composition and write an equation to describe the composition
• Compose two or more functions.
• Determine the best model for the real-world problem
Students may believe that the process of rewriting equations into various forms is simply an algebra symbol manipulation exercise, rather than serving a purpose of allowing different features of the function to be exhibited.
http://www.montgomeryschoolsmd.org/departments/itv/mathdude/MD_Algebra1_7-3.shtm Prentice Hall Textbook Section 4.5

Mathematics Department Algebra 1b Curriculum Map Volusia County Schools June 2014
MAFS.912.F-LE.1.3 Observe using graphs and tables that a quantity increasing exponentially eventually exceeds a quantity increasing linearly, quadratically, or (more generally) as a polynomial function. SMP #2, #8
• Use graphs or tables to compare the output values of linear, quadratic, polynomial and exponential functions
• Estimate the intervals for which the output of one function is greater than the output of another function when given a table or graph
• Use technology to find the point at which the graphs of two functions intersect
• Use the points of intersection to precisely list the intervals for which the output of one function is greater than the output of another function
• Use graphs or tables to compare the rates of change of linear, quadratic, polynomials, and exponential functions.
• Explain why exponential functions eventually have greater output values than linear, quadratic or polynomial functions by comparing simple functions of each type.
MAFS.912.F-LE.2.5 Interpret the parameters in a exponential function in terms of a context. SMP #2, #4
• identify the names and definitions of the parameters a,b,and c in the exponential function 𝑓(𝑥) = 𝑎 ∙ 𝑏𝑥 + 𝑐
• explain the meaning (using appropriate units) of the constant a, the y-intercept and other points, constant b and constant c, of an exponential function when that functions models a real-world relationship.
• compose an original problem situations and construct an exponential function to model it.

Mathematics Department Algebra 1b Curriculum Map Volusia County Schools June 2014
Course: Algebra 1b
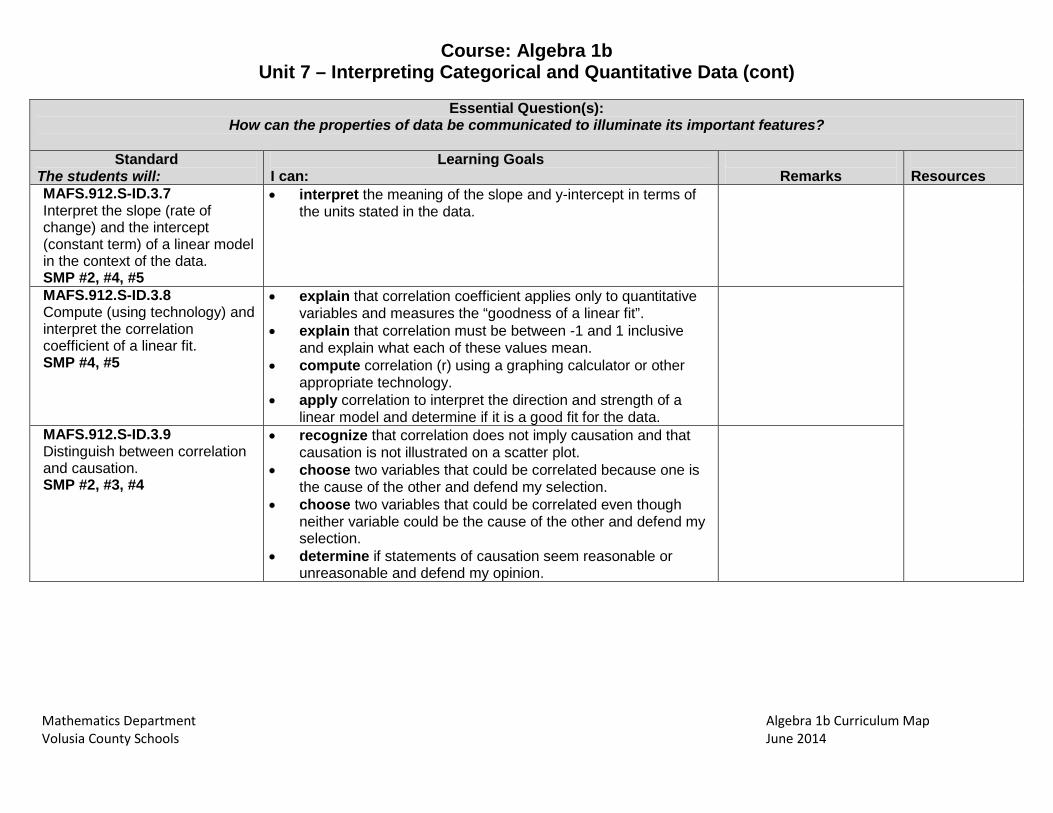
Unit 7 – Interpreting Categorical and Quantitative Data
Essential Question(s): How can the properties of data be communicated to illuminate its important features?
Standard The students will:
Learning Goals I can:
Remarks
Resources
MAFS.912.S-ID.1.1 Represent data with plots on the real number line (dot plots, histograms and box plots). SMP #1, #5
• choose the appropriate scale to represent data on a number line.
• construct a dot plot, histogram and box plot. • calculate the 5-number summary for a set of data.
Interactive – Aligned Resources – lessons for stats http://www.shodor.org/interactivate/standards/organization/objective/2331/ Interpreting Statistics - http://map.mathshell.org/materials/download.php?fileid=686 Representing Data: Using Box Plots http://map.mathshell.org/materials/download.php?fileid=1243 Get the Math – http://www.thirteen.org/get-the-math/files/2012/04/Math-in-Restaurants-Full-Lesson-Final-4.17.12.pdf
MAFS.912.S-ID.1.2 Use statistics appropriate to the shape of the data distribution to compare center (median, mean) and spread (interquartile range, standard deviation) of two or more sets. SMP #1, #5
• describe the center and spread of the data distribution.
• choose histogram with the largest mean and standard deviation.
• choose the box plot with the greatest IQR. • compare two or more data sets by examining their
shapes, center, and spreads.
Mean or Median (not mode) Interquartile Range (IQR) and Standard Deviation
MAFS.912.S-ID.1.3 Interpret differences in shape, center and spread in the context of data sets, accounting for possible effects of extreme data points (outliers). SMP #1, #5
• interpret the differences in shape, center, and spread in the context of the problem.
• identify outliers. • predict the effect an outlier will have on the shape,
center and spread. • decide whether to include the outliers as part of the
data set or to remove them.
Shape included: Skewed Right (positive), Skewed Left (negative), Symmetrical Normal, Symmetrical Non-Normal and Uniform

Mathematics Department Algebra 1b Curriculum Map Volusia County Schools June 2014
Course: Algebra 1b
Unit 7 – Interpreting Categorical and Quantitative Data (cont)
Essential Question(s): How can the properties of data be communicated to illuminate its important features?
Standard
The students will: Learning Goals
I can:
Remarks Resources
MAFS.912.S-ID.1.4 Use the mean and standard deviation of a data set to fit it to a normal distribution and to estimate population percentages. Recognize that there are data sets for which such a procedure is not appropriate. Use calculators, spreadsheets, and tables to estimate areas under the normal curve. SMP #2, #5, #7
• use the mean and standard deviation of a set of data to fit the data to a normal curve
• use the 68-95-99.7 Rule to estimate the percent of a normal population that falls within 1,2 or 3 standard deviations of the mean
• recognize that normal distributions are only appropriate for unimodal and symmetric shapes
• estimate the area under a normal curve using a calculator, table or spreadsheet
The 68-95-99.7 Rule is also known as the Empirical Rule.
MAFS.912.S-ID.2.6 Represent data on two quantitative variables on a scatter plot, and describe how the variables are related.
a) Fit a function to the data; use functions fitted to data to solve problems in the context of the data. Use given functions or choose a function suggested by the context. Emphasize linear, quadratic, and exponential models.
b) Informally assess the fit of a function by plotting and analyzing residuals.
c) Fit a linear function for a scatter plot that suggests a linear association
SMP #2, #4
• explain that scatter plots can only be used to represent quantitative variables.
• identify the independent and dependent variable. • describe the relationship of the variables. • construct a scatter plot and identify any outliers. • determine when linear, quadratic and exponential models
should be used to represent a data set. • determine whether linear and exponential models are
increasing or decreasing. • use technology to find the function of best fit, sketch the
function and use it to make predictions. • compute residuals. • construct and analyze a residual plot to determine
whether the function is an appropriate fit. • sketch a line of best fit on a scatter plot. • write the equation of the line of best fit (y=mx+b) using
technology or by using two points on the best fit line.
Residual = observed value – predicted value A residual plot is a scatter plot of the independent variable and the residuals.
Statistics Education Web (STEW) – lesson plans http://www.amstat.org/education/stew/
Mathematics Department Algebra 1b Curriculum Map Volusia County Schools June 2014
Course: Algebra 1b
Unit 7 – Interpreting Categorical and Quantitative Data (cont)
Essential Question(s): How can the properties of data be communicated to illuminate its important features?
Standard
The students will: Learning Goals
I can:
Remarks Resources
MAFS.912.S-ID.3.7 Interpret the slope (rate of change) and the intercept (constant term) of a linear model in the context of the data. SMP #2, #4, #5
• interpret the meaning of the slope and y-intercept in terms of the units stated in the data.
MAFS.912.S-ID.3.8 Compute (using technology) and interpret the correlation coefficient of a linear fit. SMP #4, #5
• explain that correlation coefficient applies only to quantitative variables and measures the “goodness of a linear fit”.
• explain that correlation must be between -1 and 1 inclusive and explain what each of these values mean.
• compute correlation (r) using a graphing calculator or other appropriate technology.
• apply correlation to interpret the direction and strength of a linear model and determine if it is a good fit for the data.
MAFS.912.S-ID.3.9 Distinguish between correlation and causation. SMP #2, #3, #4
• recognize that correlation does not imply causation and that causation is not illustrated on a scatter plot.
• choose two variables that could be correlated because one is the cause of the other and defend my selection.
• choose two variables that could be correlated even though neither variable could be the cause of the other and defend my selection.
• determine if statements of causation seem reasonable or unreasonable and defend my opinion.

Mathematics Department Algebra 1b Curriculum Map Volusia County Schools June 2014
Course: Algebra 1b Unit 7 – Interpreting Categorical and Quantitative Data (cont)
Essential Question(s): How can the properties of data be communicated to illuminate its important features?
Standard
The students will: Learning Goals
I can:
Remarks Resources
MAFS.912.S-ID.2.5 Summarize categorical data for two categories in two-way frequency tables. Interpret relative frequencies in the context of the data (including joint, marginal, and conditional relative frequencies). Recognize possible associations and trends in the data. SMP #2
• read and interpret data displayed in a two-way frequency table.
• write clear summaries of data displayed in a two-way frequency table.
• calculate percentages using ratios to yield relative frequencies.
• calculate joint, marginal and conditional relative frequencies.
• interpret and explain the meaning of relative frequencies in the context of a problem.
• draw bar charts or pie charts to represent the relative frequencies.
• describe patterns observed in the data recognize the association between two variables
by comparing conditional and marginal percentages.
Representing Data 1: Using Frequency Graphs http://map.mathshell.org/materials/download.php?fileid=1230