2014 9lnnuatreport jiscat9eear —5une yu% 1,2013 · mid-shore(queen ann&stralbotlkent) a...
TRANSCRIPT

Mid-Shore (Queen Ann&stralbotlKent)A Community Partnership
Jiscat9Eear 2014 9LnnuatReportYu% 1,2013 —5une 30,2014
Queen Anne’s Community Partnerships for Children and Families+
Talbot Family Network+
Family & Community Partnerships of Kent County+
Queen Anne’s County Department of Health+
Talbot County Health Department+
Kent County Health Department
July 37, 2014
Healthy Families Mid-ShoreFinal Program Report, fiscal Year 2014
rro
Community Partnerships for Children and FamiliesTalbot Family Network
Family & Community Partnerships of Kent County
July 1, 2013-June 30, 2014
TABLE OF CONTENTSPage
1. Program Overview 4
2. Combined FY14 Highlights and Challenges for Queen Anne’s,Talbot & Kent Counties 5
3. Evaluation Data: Annual Totals 9Target Children’s Immunizations Current 9Target Child (at least 2 months old) with Medical Provider 9Participant’s Medical Provider 9Birth weights over 2500 grams! if enrolled before 3d trimester 10Gestational age 37 weeks+/ if enrolled before 3d trimester 10
4. Other Annual Data Reports 11A. Births in Target Population 11
Screens conducted this year 11B. Participant Demographics 12C. Other Data Elements 13D. Date Services Began 13E. Location 13F. Staffing 13G. Target Population 13H. Overall Demographics 13I. Funding Sources in FY 2013 13I. Enhanced Program Services 14
5. Screens and Outcome Instruments 15A. Maryland Home Safety Checklist 15B. ASQ and ASQ-SE 16
2

TABLE OF CONTENTS CONTINUED
C. Edinburgh Post-Partum Depression Screening 17D. Life Skills Progression 18E. Participant Satisfaction Survey 19
6. Quotes from Participants 21
7. Annual Financial Report (separate) 22
8. Participant Vignette 22
9. Conclusion and Preview of FY 2014 24
Attachments:
A: Prevention of Child Abuse and NeglectC: Queen Anne’s, Talbot, Kent Life Skills ProgressionD: Queen Anne’s, Talbot, Kent Combined Participant Satisfaction SurveyE: Queen Anne’s & Talbot GOC MatrixF: MSDE MatrixG: Annual Summaries
3
Healthy Families Mid-ShoreFinal Program Report, fiscal Year 2014
TOCommunity Partnerships for Children & Families
Talbot Family NetworkFamily & Community Partnerships of Kent County
July 1, 2013 — June 30, 2014
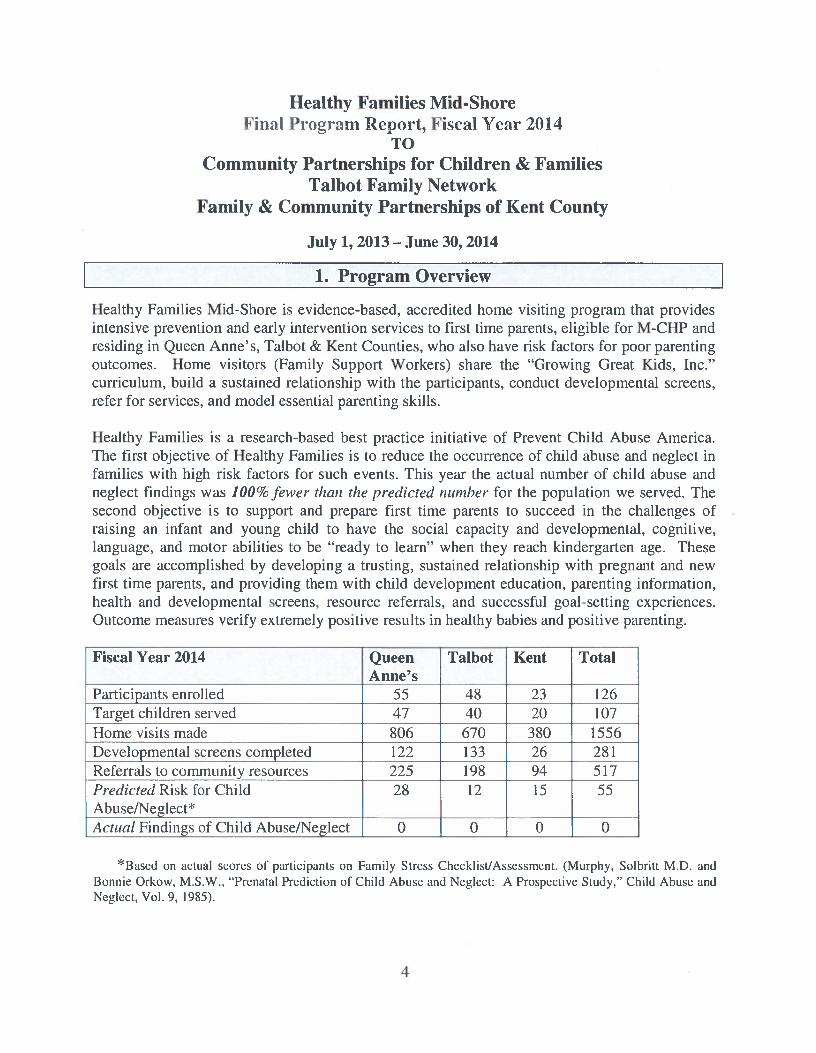
1. Program Overview
Healthy Families Mid-Shore is evidence-based, accredited home visiting program that providesintensive prevention and early intervention services to first time parents, eligible for M-CHP and
residing in Queen Anne’s, Talbot & Kent Counties, who also have risk factors for poor parentingoutcomes. Home visitors (Family Support Workers) share the “Growing Great Kids, Inc.”curriculum, build a sustained relationship with the participants, conduct developmental screens,refer for services, and model essential parenting skills.
Healthy Families is a research-based best practice initiative of Prevent Child Abuse America.
The first objective of Healthy Families is to reduce the occurrence of child abuse and neglect infamilies with high risk factors for such events. This year the actual number of child abuse andneglect findings was 100% fewer thczn the predicted number for the population we served. The
second objective is to support and prepare first time parents to succeed in the challenges ofraising an infant and young child to have the social capacity and developmental, cognitive,language, and motor abilities to be “ready to learn” when they reach kindergarten age. Thesegoals are accomplished by developing a trusting, sustained relationship with pregnant and newfirst time parents, and providing them with child development education, parenting information,health and developmental screens, resource referrals, and successful goal-setting experiences.Outcome measures verify extremely positive results in healthy babies and positive parenting.
Fiscal Year 2014 Queen Talbot Kent TotalAnne’s
Participants enrolled 55 48 23 126Target children served 47 40 20 107
Home visits made $06 670 380 1556
Developmental screens completed 122 133 26 281
Referrals to community resources 225 198 94 517Predicted Risk for Child 28 12 15 55Abuse/Neglect*Actual Findings of Child Abuse/Neglect 0 0 0 0
*Based on actual scores of participants on Family Stress Checklist/Assessment. (Murphy, Solbritt M.D. andBonnie Orkow, M.S.W., “Prenatal Prediction of Child Abuse and Neglect: A Prospective Study,” Child Abuse andNeglect, Vol. 9, 1985).
4

2. FY2014 Highlights and Challenges for Queen Anne’s and Talbot Sites
HIGHLIGHTS
• In each county, we partner with all other agencies and programs serving families withyoung children. Partnering includes linking Board memberships, committeememberships, formal and informal working agreements, and regular communication andinformation sharing. Our partners include QA, Talbot & Kent’s Judy Centers, Infantsand Toddlers, Health Department Programs serving women, infants and children (e.g.,WIC, Family Planning, M-CHP, Maternal and Child Health); Departments of SocialServices ( Child Protective Services, Continuing Services, family Investment Services),Early Head Start (TA), and the Family Center of Queen Anne’s County. In addition, wepartner with the Mid-Shore Council on Domestic Violence, faith-based programs forfamilies, and local businesses.
• We continue to be satisfied with the decision made in 1999 when the program wascreated to hire Family Support Workers in the State merit “Coordinator of SpecialPrograms” classification, so all FSW’s have Bachelors level education. Our staff showsextremely effective service delivery, professionalism, and fidelity to the Healthy Familiesmodel. We had two Family Support Workers with a Bachelor’s Degree, one FamilySupport Worker with a Master’s Degree, one Family Assessment Worker with aBachelor’s Degree, two R.N. Family Assessment Worker’s. Of the Family SupportWorkers, we have one with tenure of 15 years.
• We expanded the program to include Kent County on July 1, 2013. This was madepossible through the funding of the Family and Community Partnerships of Kent County(Kent LMB). Since the program has been in existence and is already accredited,expansion to this county went smoothly. We hired a FAW from the Kent County HealthDepartment, Faye Manley, RN. Ms. Manley has many years of experience in the publichealth field. She worked many years at the local hospital in the Maternity Division whereshe was a certified Obstetric and Gynecological Nurse. She continues to maintain thatcertification inspite of the local hospital closing that unit in 2011. The program hasbenefited from her expertise and ability to form relationships with at risk families easily.The program hired Jenna Edwards as the FSW for Kent County at the end of August2013. From July 1, 2013 until Ms. Edwards was hired, the Queen Anne’s County FSW’senrolled and engaged the Kent County families easily and were able to provide this highquality home visiting services to those at risk families until Ms. Edwards was trained andready to serve families. We feel that because the program has been in existence and thereare policies and procedures related to these incidents, we were able to successfully beginservices into this “new” county with professionalism and ease.
• Shelly Edwards, Program Director, is a member of the Maryland Home Visiting Alliance.This Alliance is comprised of Program Managers and Director’s of various home visitingprograms. The goal is to educate the community the importance of evidence-based homevisiting services. This group meets every month.
5

• The Program Director is a member of the Executive Committee for the Early ChildhoodAdvisory Council for Queen Anne’s County and the Chair of the Strengthening FamiliesSub-Committee. This is a required committee from the Race to the Top- Early LearningChallenge through Maryland State Department of Education. The goal is to ensure that100% of children enter Kindergarten “ready to learn.” In addition, the Program Directoris a member of the Talbot County Early Childhood Advisory Council and Kent CountyEarly Childhood Advisory Council.
• Healthy Families Mid-Shore also continues to benefit from an exceptionally engaged andcommitted Advisory Board, which includes parent participants in the program, agencyrepresentatives, community members and local business persons. With the addition ofKent County, the Board has expanded with many new members and the program hasbenefited from their expertise. The Board meets quarterly.
• Shelly Neal-Edwards, Program Director attended the Healthy Families AmericaLeadership Conference in Jacksonville, Florida from November 5- November 7, 2013.This was an opportunity for Ms. Edwards to receive leadership training for the program.It was a wonderftil training opportunity and we are grateful to be able to have attendedthis training.
• The Holiday Participant Connection was held on 12/06/20 13 at the Queen Anne’s CountyDepartment of Community Services building (Kramer Center) from 11 am- 2 pm. Therewere 40 families, staff and Advisory Board members present. Families shared theirholiday traditions and recipes for the holidays. This was a successful event.
• Shelly Neal-Edwards, Program Director, attended the “Alternative Response: Train theTrainers” on 1/27/20 14 at the Talbot County Department of Social Services. Mrs.Edwards will assist the Queen Anne’s County DSS staff in training the Queen Anne’sCounty agencies and programs about the Alternative Response. Ms. Edwards has beenable to train two other agencies in Alternative Response.
• All of the Healthy Families Mid-Shore completed the “Mothers and Babies Course:Preventing Post-Partum Depression Through Home Visiting” training. This was a two-day training held on 2/10 & 2/11/2014 at the Queen Anne’s County Department ofHealth. Darius Tandon from Northwestern University, the creator of this evidence-basedcurriculum, trained the staff. Healthy families Mid-Shore was chosen to participate inthe pilot pi-ogram of the research based program. The course is 15 weeks and there arecriteria that mothers have to meet in order to receive the service. However, most of thefamilies that participate in the Healthy Families Mid-Shore program qualify and willreceive the services. There will be a national evaluation of the results of this curriculumused in this program. This is a wonderful opportunity for the program to be a part of thisnational research program.
• Program staff attended the training “CPS Reporting Requirements for Professionals”through Queen Anne’s County Dept. of Social Services on 4/22/20 14
6

• Staff attended the “What’s Going On” summit held at the Queen Anne’s CountyDepartment of Health on 5/14/2014. The speakers were Lance Richardson, State’sAttorney and Sheriff Gary Hoffman who discussed street drug problem on the EasternShore. Other speakers included Dr. Martha Clark who discussed Substance ExposedNewborns and Steve Berry who talked about CPS referrals and Alternative Response.This was a very successful training opportunity.
• Staff attended the “Upper Shore Diversity Summit” in Kent County on 4/24/20 N.. Thiswas a very informative training opportunity. There were several break-out sessions forworking with diverse populations. This training enhanced all staff’s skills in homevisiting with high risk families.
• Three staff members had the privilege of attending the Healthy Families AmericaConference in Jacksonville, Florida from 5/18/2014-5/21/2014. This was an extremelyinformative and successful conference. Staff were able to network with other HealthyFamilies programs across the country as well as enhance their skills for families servedby the program.
• Thanks to the funding provided by Community Partnerships for Families and Children,Talbot Family Network and Family and Community Partnerships of Kent County, thestaff were able to attend several trainings that will enhance their skills as home visitors aswell as educational supplies that meet each family’s diverse needs in service delivery.We are extremely thankful for the support.
CHALLENGES
• The program continues to be level funded by the core grant from MSDE to serve QueenAnne’s and Talbot Counties. This has been level funded for 15 years. With the fiscalassistance and support of both counties Local Management Boards, Queen Anne’s andTalbot counties have been able to continue to provide home visiting services to “at risk”families. With the uncertainty of the economy, the program is not sure of what FY 14will bring. The Patient Protection and Affordable Care Act signed by the President onMarch 23, 2010 included a new state grant program for Maternal, Infant, and EarlyChildhood Home Visiting Programs. However, when the State of Maryland, DHMH,Maternal and Child Health Division completed the levels of the needs assessment, it wasdeemed that Queen Anne’s, Talbot and Kent Counties needs were not as great as theother jurisdictions were and the all jtirisdictions were put into tiers 1 being the most inneed to 4 being the least in need. All three counties are in the 4th tier which may result inthese counties not ever being eligible for additional funds through this grant. However,the Program Director will continue to be a part of the committees to look for additionalfunding sources as they become available. We are extremely grateful to have theopportunity to have expanded to Kent County. This allows for all three counties to sharethe “over head” costs which is helpful since the program has been level funded for somany years.
7

• As of the end of this fiscal year, one Queen Anne’s County home visitor resigned fromher posilion. Her last day of employment was July II, 2014. We arc recruiting for thatvacant position and hope to fill it as soon as possible. In the meantime, the other homevisitors will be assisting with maintaining the families engaged and enrolled in theprogram. Accreditation Standards are very specific of home many families 1 full-timeemployee can have in his/her caseload. However, the families have been assigned to theother FSW’s, FAW’s, Clinical Supervisor and Program Director temporarily until thevacancy is filled with a qualified candidate. The ultimate goal is to keep the familiesengaged and enrolled in the program. This can be very challenging when families getbonded to a certain FSW and then he/she leaves. We try to ensure that all families knowother staff members in case these types of scenarios occur but that is not alwayssuccessful.
8

3. Evaluation Data: Annual Totals
Immunizations Current This Fiscal Year:
Queen Anne’s 47/47 100%Talbot 40/40 100%Kent 20/20 100%Total 107/107 100%
Note: These reflect children currently receiving services and children current on immunizationsat the time of termination if their services from the program have ended. Immunizations orderedskipped by the target child’s doctor are counted as current. Doctors order “skip” for individualmedical reasons and occasionally when vaccine is in short supply.
Target Child (at least 2 months old) with Medical Provider:
Queen Anne’s 47/47 100%Talbot 40/40 100%Kent 20/20 100%Total 107/107 100%
Participant’s Medical Provider:
M-CHP eligibility for mothers ends 60 days post-partum, so some participants (mothers) have nohealth insurance after that time except for family planning services. Beginning on July 1, 2008,some parents of target children on MCHP became eligible for FAC, the new Family andChildren’s health insurance coverage. However, the income eligibility for this coverage isextremely low. The annual income limit is about $21,200 for a family of three. Staffencouraged Healthy Families participants to apply and assisted with applications when needed.Some families did qualify for FAC and now have health insurance. All participants are alsoinformed of the lower-cost medical resources such as Choptank Community Health, especiallyimportant for undocumented persons. We have also assisted several participants to obtain lowcost dental services.
9
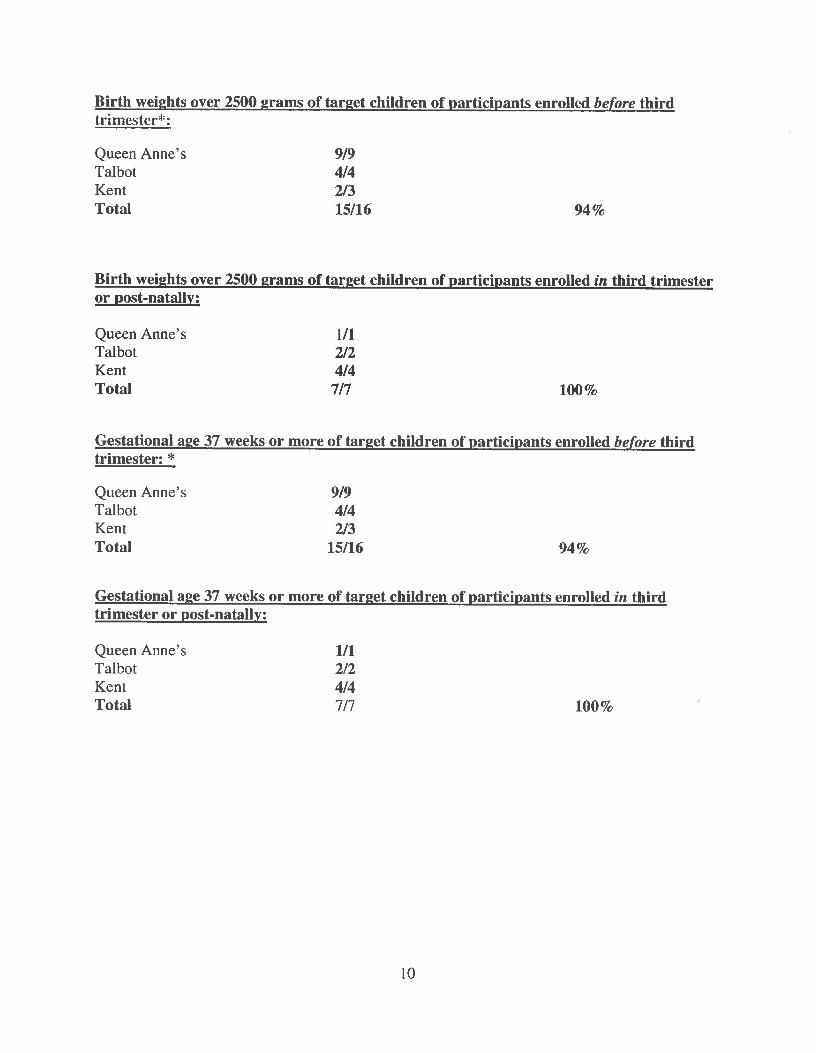
Birth weights over 2500 grams of target children of participants enrolled before thirdtrimestcr:
Queen Anne’s 9/9Talbot 4/4Kent 2/3Total 15/16 94%
Birth weights over 2500 grams of target children of participants enrolled in third trimesteror post-natally:
Queen Anne’s 1/1Talbot 2/2Kent 4/4Total 7/7 100%
Gestational age 37 weeks or more of target children of participants enrolled before thirdtrimester: *
Queen Anne’s 9/9Talbot 4/4Kent 2/3Total 15/16 94%
Gestational age 37 weeks or more of target children of participants enrolled in thirdtrimester or post-natal]y:
Queen Anne’s 1/1Talbot 2/2Kent 4/4Total 7/7 100%
10

L 4. Other Annual Data Reports
A. Estimated Births in Target Population
Queen Anne’s 50Talbot 60Kent 65Total 175
Screens conducted FY 2014
Queen Anne’s 109 (90 = 83% prenatal)Talbot 84 (73 = 87% prenatal)Kent 72 (54= 75% prenatalTotal 265* (217 = 82% prenatal)
*N.B. We always screen a higher number than the actual births in the target population dueto miscarriages, abortions, adoptions and moves out of county.
11

B. Dentographtcs from Pill/IS Report “Jiitcike Chctrcicteristics o/ Mothers” ActiveBetween 7/1/13 and 6/30/14
VARIABLE QUEEN ANNE’S TALBOT KENT TOTAL PERCENTAGEN=55 N=48 N=23 N=126
Age:
<18 13 10 3 26 20%18-19 8 9 3 20 16%20-30 30 27 16 73 58%>30 4 2 1 7 6%
Race/Ethnicity:
African-Amer.Caucasian-Amer.
HispanicMulti-Racial
161120
33%41%23%3%
Marital Status:
SingleLiving Together
MarriedOther
69%27%4%0
Education:
<7th grade
8th1 2th gradeHS Diploma
GEDAny College
Unknown
322105150
1514
170
87430
5453110350
4%36%25%8%
27%
Employment
Employed FT $ 5 4 17 14%Employed PT 8 9 5 22 18%
Student FT 6 10 3 19 15%Looking 12 5 5 22 17%
Not Looking 18 18 6 42 33%Other/Disability 3 1 0 4 3%
192772
614,,
4152294
381430
3017
0
193
0
873450
12

Repeat Teen Pregnancy (less than 1 8 years old): 0Child 1rotective Services reports of which HF is aware: 3 (none made by HF Staft)Child Protective Services findings indicated of which HF is aware: 0Children placed outside the home this year: 0Infant Mortality: 0Child Injuries: 0Deaths to children: 0
C. Other Data Elements Site fully credentialed by Healthy Families America:March 2013- March 2017
D. Date services began: January 1, 2000 for QA & T Counties, July 1, 2013 for Kent Co.
E. Location: Queen Anne’s, Talbot & Kent Counties
F. Staffing:Program Director: 1 FTEClinical Supervisor: .8 FTEFamily Assessment Workers: QA: .3 FTE, Tathot: .2 FTE, Kent: .4 FTEFamily Support Workers:4.75 FIE FSW’s (2.0 FTE QA, 1.75 FTE Talbot & 1.0 FTE Kent)Data and Clerical: 1 @ .5 FIE.
G. Target Population: First time parents, pregnant or with a baby up to three months ofage at enrollment, applied for or receiving M-CHP, residing in QA, Talbot and KentCounties.
H. Overall Demographics: The counties are rural, with small town population centers.Recently Queen Anne’s County has experienced considerable growth in the Kent Islandarea from exurban expansion of Annapolis, Baltimore and Washington, D.C. Now moredevelopment is moving further North in Queen Anne’s County and further South inTalbot County. Kent County is very similar however it is the smallest county in theState. Kent County has a large population of low income families. Incomes range fromvery high to very low in these counties. HF participants are very low to low and lower-middle income families eligible for MCHP.
I. Funding Sources used in fY 2014: Via QACPCF: MSDE Funding ($ 296,372) for basictwo-county program, including one .2 FFE FAW and one full time FSW in each county,.95 program director, clerical and data support. Via TFN: CPA Funding($ 82,424) for .75 FTE additional FSW in Talbot, .33 FTE Clinical Supervisor, andsupport costs. Via QACPCF: CPA Funding ($57,616) for .50 FTE additional FSW inQA, .25 FTE Family Assessment Worker, .33 FTE Clinical Supervisor and support costs.Via QACDSS: Promoting Safe & Stable Families ($64,182) for .50 FTE FSW in QA, .10FTE Family Assessment Worker, .20 FTE Clinical Supervisor and support costs.
13

Since adding Kent County the funding from FCPKC through MSDE and CPA supports,.33 FTE C]inical Supervisor, I .t) FTE Family Support Worker, .4 FTE FamilyAssessment Worker, .05 FTE Program Director, & .1 FTh Data Entry Worker.
J. Enhanced Program Services
1. In Talbot County, we have continued to work closely with the Early Head Startprogram to coordinate services to those families who are eligible to receive bothservices. For example, Healthy Families provides the home visiting/GGK curriculumportion of services, while EHS provides the center-based services. We also coordinatewith the Talbot Cotinty Judy Center early childhood activities, and on familiesreceiving multiple services. There are several HF families that participate in theseprograms. The families participate in the adult education in order to receive theirGED and ESL classes.
2. In QA County, we refer participants who can benefit from the additional support,parenting education, adult education and socialization to the family Center of QAC, aprogram of the Judy Center Partnership. The Family Center is located in Sudlersvilleand this will continue to allow families in the northern part of the county toparticipate more actively. We will continue to work collaboratively with this agency.
3. The Program Director sits on the QA Multi-Disciplinary Committee and is a memberof the Talbot County Multi-Disciplinary Committee where child abuse and neglectcases, the drug affected newborn policy, child fatality review committee, and otherimportant trainings related to county drug abuse and prevention, gang activities, andcomputer-related crimes against children are discussed monthly.
4. We continue to recognize participants who remain with Healthy Families for long-term services, as the program model intends. After one year of Healthy Familiesparticipation, mothers receive a charm bracelet to which a charm is added each yearon their anniversary of participation. Participating fathers will receive a “dog tag” towear around their neck. The bracelets and “dog tags” are popular features andconvey respect and recognition to our participants, many of whom have had few or noexperiences of recognized success in their lives. We honored 5 graduates for FY2013.
5. The program successfully expanded Healthy Families home visiting services to KentCounty in Fiscal Year 2014. Since the program was already established, accreditedand operating, the staff of Queen Anne’s and Talbot Counties assisted in engagingand enrolling families in the program until the Kent County staff were fully trainedand able to complete home visits. This occurred with no disruption of services forKent County families.
14
Screens and outcome instruments administered this year per protocol
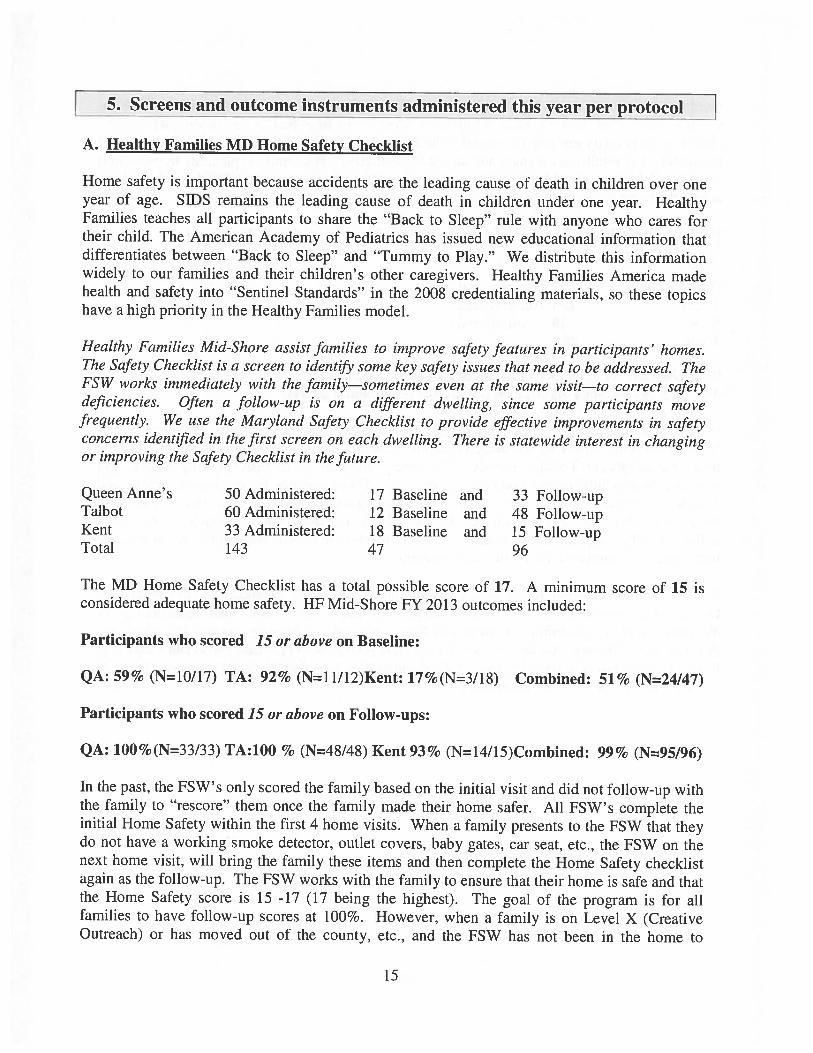
A. Healthy Families MD Home Safety Checklist
Home safety is important because accidents are the leading cause of death in children over oneyear of age. SIDS remains the leading cause of death in children under one year. HealthyFamilies teaches all participants to share the “Back to Sleep” rule with anyone who cares fortheir child. The American Academy of Pediatrics has issued new educational information thatdifferentiates between “Back to Sleep” and “Tummy to Play.” We distribute this informationwidely to our families and their children’s other caregivers. Healthy Families America madehealth and safety into “Sentinel Standards” in the 2008 credentialing materials, so these topicshave a high priority in the Healthy Families model.
Healthy Families Mid-Shore assist families to improve safety features in participants’ homes.The Safety Checklist is a screen to iclenttfy some key safety issues that need to be addressed. TheFSW works immediately with the family—sometimes even at the same visit—to correct safetydeficiencies. Often a follow-up is on a thfferent dwelling, since some participants movefrequently. We use the Maryland Safety Checklist to provide effective improvements in safetyconcerns ideizttfiecl in the first screen on each c/welling. There is statewide interest in changingor improving the Safety Checklist in the fttture.
Queen Anne’s 50 Administered: 17 Baseline and 33 Follow-upTalbot 60 Administered: 12 Baseline and 4$ Follow-upKent 33 Administered: 1$ Baseline and 15 Follow-upTotal 143 47 96
The MD Home Safety Checklist has a total possible score of 17. A minimum score of 15 isconsidered adequate home safety. Hf Mid-Shore FY 2013 outcomes included:
Participants who scored 15 or above on Baseline:
QA: 59% (N=l0/17) TA: 92% (N=ll/12)Kent: 17%(N=3/18) Combined: 51% (N24I47)
Participants who scored 15 or above on Follow-ups:
QA: 100%(N=33/33) TA:100 % (N=48/48) Kent 93% (N=14/15)Combined: 99% (N=95196)
In the past, the fSW’s only scored the family based on the initial visit and did not follow-up withthe family to “rescore” them once the family made their home safer. All FSW’s complete theinitial Home Safety within the first 4 home visits. When a family presents to the FSW that theydo not have a working smoke detector, outlet covers, baby gates, car seat, etc., the FSW on thenext home visit, will bring the family these items and then complete the Home Safety checklistagain as the follow-up. The FSW works with the family to ensure that their home is safe and thatthe Home Safety score is 15 -17 (17 being the highest). The goal of the program is for allfamilies to have follow-up scores at 100%. However, when a family is on Level X (CreativeOutreach) or has moved out of the county, etc., and the FSW has not been in the home to
15

complete a home visit, it is not possible to complete a follow-up score. In the case of the KentCounty family that does not have a follow-up score of 15 or higher is due to the fact that thefamily is temporarily residing in a motel. The FSW was unable to accurately assess the safety ofthe motel. The mother is pregnant and due in the Fall 2014. The family is planning to move intoa trailer of their own in the next few months before the baby is born. The FSW will be able toassess the home for safety at that time.
B. ASO and ASO-SE (Ages and Stages Questionnaire and ASQ Social-EmotionalQuestionnaire)
Queen Anne’s 122 AdministeredTalbot 133 AdministeredKent 26 AdministeredTotal 281
96% (269/281) of screens scored developmentally on target.4% (12/281) screens highlighted possible developmental delays.
Of the children (2 in QA, 3 in Talbot, 0 in Kent) that were suspected of delays, one child is of aSpanish-speaking family with a delay in commtinication. This family after much convincing isreceiving Infants and Toddlers services. The other 4 families are English speaking families andwere referred to Infants and Toddlers for services. Those families have accepted Infants andToddlers services as well. The home visitors assigned to each family, tracks the earlyintervention services and participates in the family meetings when possible. We workcollaboratively with Infants and Toddlers to assist the child in the developmental area of concernwith activities to improve the child’s development.
Early detection of developmental delays is important because early diagnosis and treatment havethe greatest possibility of successfully addressing the child’s needs and minimizing—oravoiding—lifelong disabilities in gross and fine motor, vision, hearing, speech and emotionaldevelopment. Healthy families’ model of early intervention with pre-natal participants may alsohave a positive effect in reducing overall developmental delays, but this would require a larger Nand a control group study to investigate.
16

C. Edinburgh (Depression Screen)
Administered Risk for Depression Percen lage
QueenAnne’s: 51 11 22%Tathot: 61 8 13%Kent 24 3 13%Total 136 22 16%
Administration of the Edinburgh is done when services begin, post-partttm, and annually. Thefigures above represent oil Edinburgh’s given this year. Approximately 16% of the Edinburghscores reflect the participant at risk for depression with a score of 10 or above. All participantsscoring 10 or above were given information about depression, post-partum depression andmental health services referral information.
Maternal depression is significant because it has been associated with poor parent-child bonding,child neglect, and impaired development of social-emotional responses in the child which canaffect lifetime mental health. Maternal depression also adversely affects family economicstability and parent goal achievement. Depression can be limited to the perinatal period, or canbe a chronic condition. Family Support Workers encouraged participants to apply for theMaryland FAC program (Family and Children’s Medical Care via MCHP) which also supportsmental heath services for eligible parents.
For the Queen Anne’s County participants that scored “at risk for depression,” 1 is Spanish-speaking (who’s score was elevated last year) who continues to remain in a very unhealthyrelationship with the FOB (father of the baby). The FSW’s have continuous encouraged MOB toseek Mid-Shore Council on Family Violence however she has refused. The FOB does not wantMOB to be on birth control (this is their culture) and MOB has had two premature babies and ispregnant with her third child. The FSW provides as much education to this family aboutprematurity and the risks on MOB’s health. The other 10 participants consist of Caucasian andAfrican America families. Most of the families have a history of depression prior to thepregnancies and have been in counseling in medication in the past. Three of them are currentlyin counseling. When the tool was re-administered, the scored went down significantly. TheFSW’s will continue to encourage all families with elevated scores to seek counseling fordepression.
For the Talbot County participants that scored “at risk for depression,” 3 are Spanish-speakingand the FSW’s have encouraged them to seek counseling however, due to the language barrierand lack of health insurance, this tends to not happen. The FSW will continue to encourage themother to consider counseling. In partnership with Talbot County Department of Social Servicesand “Evolution Mental Health Services”, we have begun a new program called “fACEs.” Thisprogram was developed to refer families that have experienced child hood trauma related tosexual or severe physical abuse. We have referred 10 families to this program. Of those 14families, 10 are enrolled and receiving mental health services in the home. “Evolution MentalHealth Services” have therapists that go to the home of the families to provide trauma informedtherapy. The goal is to “break the cycle of abuse” by providing early intervention, traumainformed intensive therapy to families that are the most at-risk in Talbot County. This has been a
17

great addition to the Healthy Families Mid-Shore program. This allows families to accessmental health treatment in their home so that they can build a trusting relationship with thetherapists and make life style changes for themselves and their families.
For Kent County, there were 3 families deemed to have depressive symptoms. All 3 of thefamilies have experienced trauma as a child. One family has moved several times in the countyand has recently exited from a domestic violent relationship. She was seeing a therapist on aregular basis but she has not followed through since she does not have transportation. The FSWhas been working with the mother to assist in getting her the treatment she needs. The other 2families are currently receiving mental health treatment and the FSW is supporting them inensuring that they get to their appointments and follow through with their treatment plans.
D. Life Skills Progression (Developed by Linda Wollesen, MA, RN, LMFT and Karen Peifer,PH.D, MPH, RN) A validated and reliable tool.
Talbot 152 Administered.Queen Anne’s 135 Administered.Total 287 Administered
This is the fourth year of data captured for the Life Skills Progression (LSP). All families aremeasured at initial start of services then every six months but data is only captured at baseline,12 month, 24 month and 36 months. The creators of LSP ate working on expanding this data to48 and 60 months of service.
Some of the areas that the LMB’s concentrate on are: “Family Relationships and Use ofCommunity Resources.” In Queen Anne’s County out of those families evaluated in FamilyRelationships, 86% of families were in the target range at 12 months of service which is animprovement since last year. For Talbot County, 88% of families were in the target range at 12months of service. At the end of 48 months of service, 100% of families were in the target rangefor this area.
In regards to Community Resources for Queen Anne’s County, families when they enter into theprogram, 71% of families were in the target range and by 48 months of services, 100% offamilies were in the target range. For Talbot County families, when they entered into theprogram, 77% were in target range. By 48 months of services, 100% of families were in thetarget range. Encouraging families to build healthy relationships with other family membersand to utilize community resources, are just two of many life skills families need to work on inorder to be more successful in life. When looking at the results, in most categories the familiesimproved their “scores” by 12 months of service. Discipline is another very important area ofconcentration. Garrett County Healthy Families have been utilizing this tool for over 5 years.The staff report that one area of trouble for most families is “Discipline.” The initial score tendto be higher and as the child ages, the score will decrease. This is related to behavioral concernsthat the family will encounter as the child gets older, as they reach toddler hood and will havemore tantrums, etc. The parents become increasingly frustrated and will look to other familymembers that have “experience” to give them information on how to discipline a toddler. TheFSW’s spend a significant amount of time giving the families information on discipline in hopesthat the family will utilize the information given and to reduce the risk of child abuse. For
1$

Queen Anne’s County, at the 12 month evaluation, 70% were in the target range. At 24months, 100% were in the target range. At 36 months, 100% were in the target range. forTalbot County, at the 12, 24 and 36 month evaluations, 100% were in the target range. Thisdemonstrates the effectiveness of the home visiting services for families served.
Another area of concentration is prenatal care. For Queen Anne’s County, at the 12 monthevaluation, 71% were in the target ranges. At 24 months, 87% were in the target range. TalbotCounty, at the 12 month evaluation, 85% were in the target range for prenatal care and at 24months, 90% were in the target range. Both counties had an increase from the initial evaluationto the 12 month evaluation. This is extremely important for healthy birth outcomes.
Mental illness of one or both parents, can contribute to the insecure attachment between theparent and child. For Queen Anne’s County, at the 12 month evaluation, 91% were in the targetrange and 96 % were in the target range for Talbot County participants. At 24 months, 100% ofQueen Anne’s County families were in the target range and 94% of Talbot County families werein the target range. At 36 months of service, both Queen Anne’s and Talbot County familieswere 100% in the target range. Most of the families served are eligible for Families andChildren MCHP. Most mental health services are covered by MCHP and the FSW’s encouragethe families with mental illnesses to seek counseling and psychiatric services for medication.The full report for both counties are located in the Attachments section of this document.
All staff has been trained in utilizing this tool, either informally or formally. The ClinicalSupervisor meets with all FSW’s to review the tool at each interval for all families served toensure objectivity.
F. Participant Satisfaction Survey, 2014
On June 1, 2014 copies of the most recent version of our participant satisfaction survey weregiven to all FSW’s to be delivered by hand with an envelope to return it, or by mail with postagepaid and pre-addressed return envelopes. We began receiving the surveys back immediately andthe data was analyzed July 11, 2014. During home visits, each Family Support Worker (FSW)presented and explained the purpose of the survey. The FSW offered to read the survey for theparticipant when necessary. The FSW requested the participants to complete the survey on theirown, not to share the results with her and then mail using the stamped envelope provided. TheFSW’s verbally reminded the participants to complete and return the survey. The satisfactionsurveys are available in English and Spanish.
In addition, in the Healthy Families Policy & Procedures manual, the staff send the survey to allfamilies that have closed from Level X (have not had contact with the family for at least 3months) and when the participant has graduated only if the last survey was completed more than6 months prior. The FSW sent notes to the last known addresses of participants closedrequesting them to complete the survey and return it in a stamped self-addressed envelope whichwas enclosed. Approximately ninety-five surveys were distributed (throughout the entire year)and a total of 63 were returned (QA 19, TA 31, K 13). In summary, our participants continue toexpress approval of Healthy Families Services: 93% are “Very Satisfied” and 7% are“Satisfied.”
19
Participants also responded that their lives had improved in certain areas since beginning theprogram. For example:
“Our understanding of child development and parenting” 6$ %“Taking care of our children” 68%“The health care of our children” 65%“Our happiness” 67%
Participants also responded to the question asking if the first person who came to talk to you(FAW) about the program speak your language. 100% stated yes they did. The program uses anInterpreter/Translator to assist with communication in Spanish.
100% of respondents said they would “definitely” recommend our services to others. 0% ofrespondents said they could “probably not” recommend our services to others. All questionsand both site-specific and combined responses are included in the Attachments. A sampling ofquotes from participant surveys about the program are included in Section 6, below.
20

6. Sample Quotes from Participants. (Front Participant Satift’ctiwi Sttr’ep, FY 2014)
What do you like most about the program?“The support”“The friendly support & new advice”“I like everything it’s helped me to become a better parent”“The information we receive about what to expect and my son enjoys the activities”“The home visitor answers all of my questions”“Educational Videos”“Helpful resources/info, activities to do with your child”“Books, survey on child development, things to help teach my child”Spanish translation:“I’m a first time mom and like to learn good this is for my baby”“They give me information on my child and help me resolve doubts”“timely and necessary information”
What do you like least about the program?“I love everything about the program”“My work schedule conflicts with certain things”“nothing”“She’s leaving Healthy Families”
Spanish Translation:“I like it all”“It’s only once a week and can’t attend meetings because of my job”“They visit me every two weeks”
How could the program be improved?“field trips- farms, strawberry picking”“No need for any improvement!”“I like it the way it is”“I wouldn’t change anything”Spanish translation:“to me all is good”“for the government to give more economic support so they can reach out to more families”“helping more people”
21
7. FY 2014 Annual Financial Reports:From QACHI) and TCHD under sepwate cover.
8. Participant Vignette for Fiscal Year 2014 (Names changed for privacy)
Annual Vignette
Tatum is a 20 year old female who enroll in the program in December 2012. When Tiffanyenrolled she was only 14 weeks pregnant and was living with her boyfriend, Fred. This wasTatum’s and Fred’s first child. Tiffany and Fred were together for two years but have knowneach other since high school.
As a child Tiffany was raised by her mother until the age of 7 when her mother passed away in amotor vehicle accident. As a result Tatum was placed with her maternal grandmother alongwith her 2 brothers because their father was “unfit to care for the children due to his heroinaddiction.” As Tatum was growing up, she experienced much trauma in her life. She wassexually assaulted by a family member. This incident was reported to the police and Departmentof Social Services. It was investigated and the family member served time in prison for hisactions. Tatum continued to have a tough childhood. She stated that her grandmother whoraised her was addicted to pain medication and often put Tatum down by calling her hurtfulnames which affected her self-esteem. This is something that Tatum has struggled with herwhole life.
When the home visitor met Tatum, it was obvious she had been through many traumatic eventsin her life. Tiffany had extremely low self-esteem, always crying, and appeared to struggle withdepression. Within the first few home visits, the home visitor completed a depression screeningwith Tatum and it confirmed that Tatum suffers from depression. The home visitor discussed thescreening tool with Tatum. The home visitor discussed the importance of professional help andthat she could really benefit from counseling. After several home visits and discussions, Tatumagreed to go to therapy. The home visitor referred Tatum to a “Trauma-Informed Therapist”where the therapist specialized in trauma treatment. Tatum has been attending her therapysessions on a hi-weekly basis. Tatum made it her goal to complete 10 therapy sessions by thetime the baby was born and she has successfully made it through all her sessions. Tatum hasteported to the home visitor that therapy has really been helping Tatum cope with life stressorsand how to deal with her past.
Since being enrolled in the Healthy Families Program and therapy, there is an obvious change inTatum’s behaviors. She is more confident and willing to start making decisions to better hermental health and overall well-being. In the recent months, Tatum has gained full-timeemployment. She has reported to the home visitor that she loves working and it is” nice to getout of the house and make my own money.” Tatum recently gave birth to a healthy baby a girl,Alexis. Tatum has bonded with Alexis and it is apparent that she loves her very much. Tatummade it a goal to breastfeed Alexis for as long as she can. She informed the home visitor thatbreastfeeding “reduces the risk of postpartum depression in addition to many other things.”
22
Although Tatum and Fred are not together, Fred has expressed interest in visiting with Alexisoften. Fred works full—time and pays child support to Tatum. He has stated that he is “nervouswith Alexis since she is so young and little.” Fred is not always comfortable feeding, bathingand diapering Alexis. He often relies on Tatum to do this while he is visiting. The FSW hasprovided support to Fred about how to care for the baby. Since Fred works full-time and doesnot reside in the home of Tatum and Alexis, the FSW does not always get to discuss these topicswith Fred. When Fred is not available to participate in the home visits, the FSW will leavehandouts and DVD’s on these topics so that Fred can view them at his convenience. Tatum hasinformed the FSW that Fred does read the hand-outs and view the DVD’s.
Tatum has expressed interest in returning to school one day in the near future. She feels thathigher education would be a benefit to her and her family. In addition, Tatum is saving moneyso that she can purchase a car since she has to rely on others for transportation. She is becomingmore self-reliant and more confident in her parenting. Tatum has reported that it is because ofthe Healthy Families Mid-Shore program that she has been able to change her life. She was notreceptive to therapy and other resources that she was given until she was able to form a trustingand healthy relationship with the FSW. Tatum plans to continue in the program for as long asshe can so that she can be the best parent she can be to Alexis.
23
10._Conclusion and_Preview of FY 2014
Healthy Families will celebrate 15 years of service to families in Queen Anne’s and TalbotCounties in January, 2014. The Program has nearly 900 families since it began in January, 2000.
This past year, staff turnover has not occurred. The program was able to have a full year of usein the evidence-based curriculum called “Growing Great Kid.” This curriculum wasimplemented in May 2013. This curriculum is endorsed by Healthy Families America. HFAfeels that this curriculum is aligned with Healthy Families mission and vision and is an effectivecurriculum to produce outcomes.
Healthy Families expanded services to Kent County. This was a smooth transition. The staff inQueen Anne’s County provided the home visits to the families of Kent County until a full-timehome visitor was hired. We were able to partner with Kent County Health Department to deliverhigh quality home visiting services to Kent County residents. By six months of hire, the F$Wwas completely full and serving the maximum number of families. She has been very successfulin maintaining those families in the program.
The Federal Government deemed Healthy Families America as an evidence-based model.Having this status is important as it relates to funders. For Maryland, although Queen Anne’sand Talbot Counties are not eligible for the new Federal Home Visiting grant, our sister sites inother jurisdictions that were deemed “in need” will be able to receive additional funding. Wehope that in the future, all of 3 counties will be eligible to receive additional funds to support thecontinuation of staff. We hope that the program would be able to receive additional funding tocontinue services. With these hard economic times, the future of Healthy Families Mid-Shore isuncertain. Staff prefer stability and would like to be offered benefits, etc however, the majorityof our staff are contractual (no benefits) which may result in future staff turn-over.
Last, the statewide budget challenges continues to put Healthy Families Mid-Shore at risk forenhanced funding from the Governor’s Office for Children and with the “Core Funding” beingleveled funded for 14 years that serves Queen Anne’s and Talbot Counties. The Kent Countyportion of the program receives funding from MSDE which is level funded as well. Furtherbudget reductions would affect our capacity to serve the number of families in these 3 counties.The Program Director diligently seeks additional funding sources so that the program can“maintain” its current caseload. The program does not serve 100% of the target population. Ifadditional funds become available, the program could expand to serve more families in the targetpopulation. At this time, that is not possible.
24


PREVENTION Of CHILD ABUSE AND NEGLECTHealthy Families Mid-Shore fiscal Year 2014
Based on
Kemp family SurveyRisk Predictor of Child Abuse and Neglect’
Medium Risk High RiskAssessment scores: 25-35 40-100 Total
Number of Participants 56 44 100Post-natal as of 6/30/13 [TA 18 + QA 25 + K 13 1 [TA 6 + QA 25 + K 13] [TA 24 + QA 50 + K 26]
Predicted Risk ofChild Abuse or Neglect (37%) 21 (76%) 34 55
[TA7+QA9+K5] [TA5+QAI9+K10J [TAI2+QA28+K15]
Known Reports ofChild Abuse or Neglect 0 3 3’
Indicated Findings ofChild Abuse and Neglect 0 0 0
Children Placed 0 0 0Outside The Home
Murphy, Solbritt M.D. and Bonnie Orkow, M.S.W., “Prenatal Prediction of Child Abuse and Neglect: AProspective Study,” Child Abuse and Neglect, Vol. 9, 1985.
FSC CAN Mild Total Children Impacted by CAN NONEScore Neglect0-20 3% 17% 20% 80%
25-35 5% 32% 37% 63%
40+ 52% 24% 76% 24%
NOTE: Families in all groups were provided no support or intervention services.
1. There were 3 reports of neglect were made this year by a community member. All 3 reports were ruled out. There were0 reports made by the F5W’s.

ci
Healthy Families Mid-Shore
Participant Satisfaction Survey
FY2014


Analysis of Participant Satisfaction SurveyQueen Anne’s 2014
Zip Code Ratio Percentage21607-BARCLAY 1/19 5%
21617-CENTREVILLE 5/19 26%21619-CHESTER 1/19 5%
21620-CHESTERTOWN 4/19 21%2163$-GRASONVILLE 0/19 0%
21644-INGLESIDE 1/19 5%21651-MILLINGTON 3/19 16%
21658-QUEENSTOWN 1/19 5%21666-STEVENSVILLE 3/19 16%
21668-SUDLERSVILLE 0/19 0%21623- CHURCH HILL 1/19 5%
Last Home Visit Ratio PercentageWithin the past week 1 3/19 68%Within the past 2 weeks 3/19 16%Within the past month 3/19 16%A month ago 0/19 0%Several months ago 0/19 0%N/A, I left the program/ OR DID NOT ANSWER 0/19 0%
Did the first person who came to talk to you about the program...Ratio Percentage
Speak your language?• Yes 19/19 100%• No 0/19 0%. N/A 0/19 0%
Greet you respectfully?. Yes 19/19 100%. No 0/19 0%. N/A 0/19 0%
Make you feel comfortable when discussing personal issues?. Very Comfortable 17/19 89%. Comfortable 2/19 1 1%. Uncomfortable 0/19 0%. Very Uncomfortable 0/19 0%. N/A 0/19 0%
My home visitor provides positive feedback and support: Ratio PercentageStrongly Agree 18/19
___________
Agree 1/19 J 5%Disagree 0/19 0%Strongly Disagree 0/19 0%

Does your home visitor communicate with you in your primarylanguage or through an interpreter in a way that is easy for you to
understand?
Have you been satisfied with the information received on childdevelopment and parenting skills?
Very SatisfiedSatisfiedDissatisfiedVery Dissatisfied
Do you generally feel understood when talking with your home visitorL. and feel you communicate well with each other?
AlwaysUsually
Ratio19/190/190/190/190/19
SometimesNeverN/A
Percentaae100%
nO!J /0
no!U /0
no,U /0
no,U /0
Have you been satisfied with the Healthy Families groups, familygatherings and parties?
Very SatisfiedSatisfiedDissatisfied
Ratio15/193/190/190/191/19
Very DissatisfiedNo resronse
Percentage79%I 0/
I U /0
no,U /0
noiU /0
5%
How often do you attend Healthy Families gatherings?Always or almost alwaysSometimesNever
Ratio5/196/198/190/19
Percentage26%32%42%no,U /0No Response
What do you like about them?FoodEducational ProgramSeeing Other FamiliesNo Response
Ratio0/191/192/199/19
Percentageno,U /0
‘o,J /0
I •t 0/I I /0
47%More than one answer on the above question
7/19 37%
Ratio
Always 19/19 100%
p_jy__________ -__
Sometimes 0/19 0%Never 0/19 0%N/A 0/19 0%
Percentage
Ratio Percentage18/191/19
95%
0/19..J /0
0/19
no,U /0
no,U /0
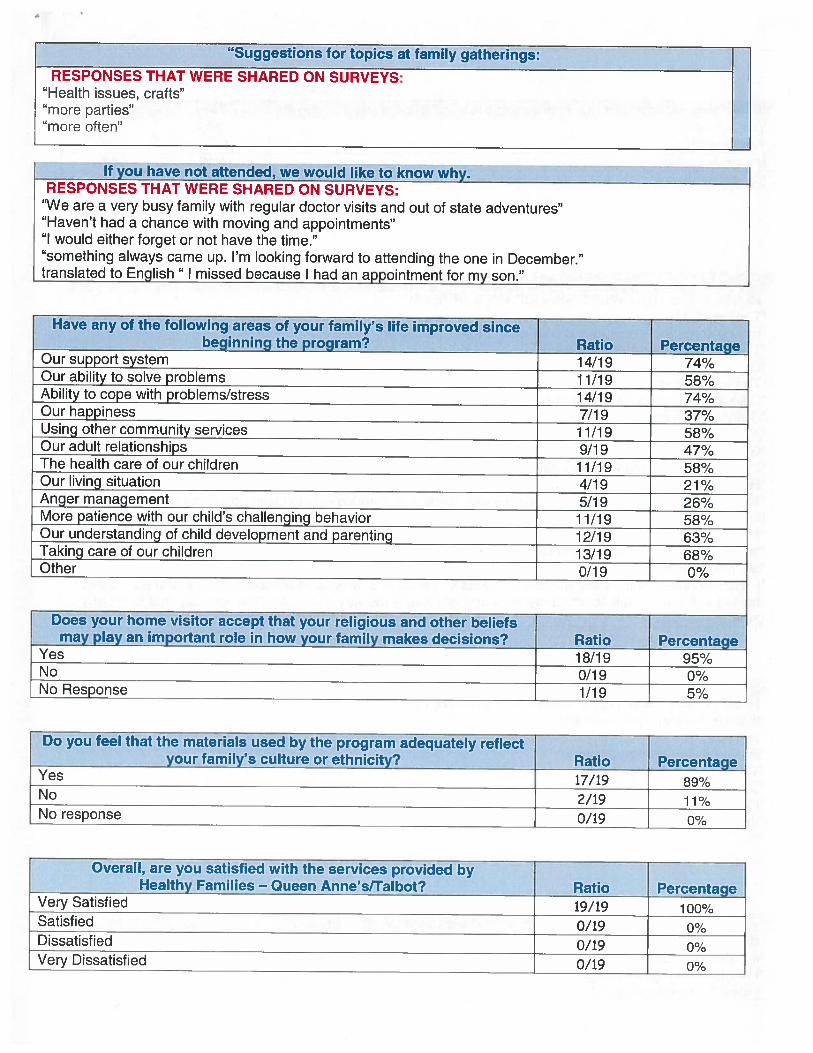
“Suggestions for topics at family gatherings: —
RESPONSES THAT WERE SHARED ON SURVEYS:“Health issues, crafts”“more parties”‘more often”
If you have not attended, we would like to know why.RESPONSES THAT WERE SHARED ON SURVEYS:
“We are a very busy family with regular doctor visits and out of state adventures”“Haven’t had a chance with moving and appointments”“I would either forget or not have the time.”“something always came up. I’m looking forward to attending the one in December.”translated to English “ I missed because I had an appointment for my son.”
Have any of the following areas of your family’s life improved sincebeginning the program? Ratio Percentage
Our support system 14/19 74%Our ability to solve problems 11/19 58%Ability to cope with problems/stress 14/19 74%Our happiness 7/19 37%Using other community services 11/19 58%Our adult relationships 9/19 47%The health care of our children 11/19 58%Our living situation 4/19 21%Anger management 5/19 26%More patience with our child’s challenging behavior 11/19 58%Our understanding of child development and parenting 12/19 63%Taking care of our children 13/19 68%Other 0/19 0%
Does your home visitor accept that your religious and other beliefsmay play an important role in how your family makes decisions?
YesNoNo Resronse
Ratio18/190/191/19
Percentage95%r’oi‘.J /0
0/‘.J /0
Do you feel that the materials used by the program adequately reflectyour family’s culture or ethnicity?
YesNo
Ratio17/192/190/19No response
Percentage89%.4 -4 0/
I /0
0%
Overall, are you satisfied with the services provided byHealthy Families — Queen Anne’s/Talbot? Ratio Percentage
Very Satisfied 19/19 100%Satisfied 0/19 0%Dissatisfied 0/19 0%Very Dissatisfied 0/19 0%

Would you recommend our services to others if they needed support? Ratio PercentageYes, Uefintely 19/19 100%Yes, probably 0/19 0%No, probably not 0/19 0%No, definitely not 0/19 0%
What do you like mostbout the program?RESPONSES THAT WERE SHARED ON SURVEYS:
“The support”“having someone to talk to and help when I have questions”“The friendly support & new advice”“Our worker, Ms. Nikki”“The information that is given to better understand your child”“I like everything it’s help me to become a better parent”“Getting information”
I like’’“Gives a lot of information and what I should expect each month”“Interaction with others for my baby girl”“How nice everyone is”“My son is learning more activities shapes and colors and learning how to clean up behind himself. He alsolearning numbers with his caseworker and from tv also.”“N/A” x 1“learning activities to do with my child to support her development.”“our home visitor”“I love the relationship I have with my home visitor because of how good we communicate with each other.”“having someone to talk to about my baby and why she is the way she is. And the activities that help babygrow.”
What do you like least about the program?RESPONSES THAT WERE SHARED ON SURVEYS:
“there is nothing that I don’t like”“N/A” x 7“She’s leaving Healthy Families”“There’s nothing I don’t like”“Just more parties so the kids can enjoy more time with other kids and have fun.”‘‘I like it’’they don’t work other children you have to see how they developing”
How could the program be improved
RESPONSES THAT WERE SHARED ON SURVEYS:“it’s already great”“I wouldn’t change anything”“I think it’s doing just great”

4 ,*
“N/A” x 5“Do more gatherings”“work with other kids that you have while in the program”

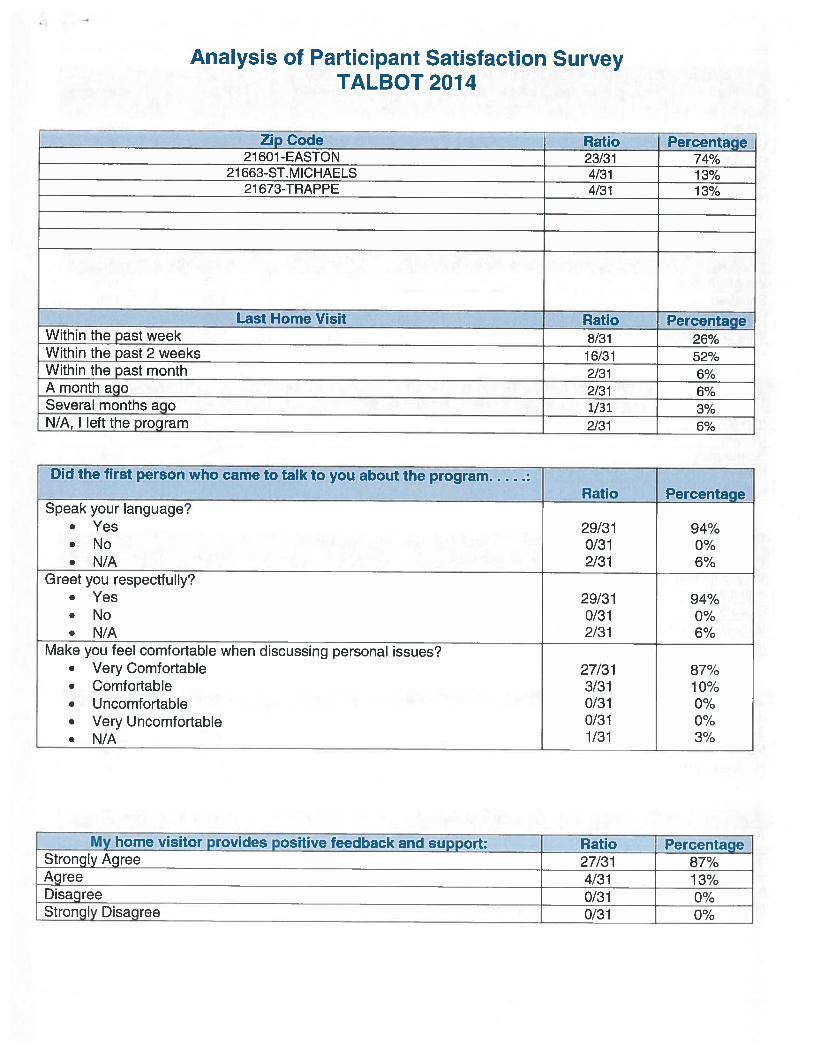
Analysis of Participant Satisfaction SurveyTALBOT 2014
Zip Code Rtio Percentage21601-EASTON 23/31 74%
21663-ST.MICHAELS 4/31 13%21673-TRAPPE 4/31 13%
Last Home VisitWithin the past weekWithin the past 2 weeksWithin the past monthA month agoSeveral months agoN/A. I left the orogram
Ratio8/3116/312/312/311/31
2/31
Percentage26%52%0/U /0
0/U /0
‘)O/) /0
c0,U /0
Did the first person who came to talk to you about the program
Speak your language?. Yes. No. N/A
Greet you respectfully?. Yes. No. N/A
Ratio
29/310/312/31
29/310/312/31
Percentage
94%“0/U /0
0fU /0
94%g,0/U /0
c 0/U /0
Make you feel comfortable when discussing personal issues?• Very Comfortable• Comfortable. Uncomfortable. Very Uncomfortable. N/A
27/313/310/310/311/31
87%I I0/
I U /0
r0/U /0
“0,U /0
‘D 0/
My home visitor provides positive feedback and support: Ratio PercentageStrongly Agree 27/31 87%Agree 4/31 13%Disagree 0/31 0%Strongly Disagree 0/31 0%

Does your home visitor communicate with you in your primarylanguage or through an interpreter in a way that is easy for you to Ratio Percentage
: understand?Always 30/31 97%Usually 0/31 0%Sometimes 0/31 0%Never 1/31 3%N/A 0/31 0%
Have you been satisfied with the information received on childdevelopment and parenting skills?
Very SatisfiedSatisfiedDissatisfied
Ratio29/312/310/310/31Very Dissatisfied
Percentage94%
0/U /0
r0/U /0
co/U /0
Do you generally feel understood when talking with your home visitorand feel you communicate well with each other?
AlwaysUsually
Ratio31/310/310/310/310/31
Percentage100%
C0/U /0
ro,U /0
(0/U /0
t0/U /0
SometimesNeverN/A
Have you been satisfied with the Healthy Families groups, familygatherings and parties?
Very SatisfiedSatisfiedDissatisfied
Ratio22/314/310/310/31
5/31
Percentage71%13%g0/U /0
Very DissatisfiedNo response
0%I 0/
I U /0
How often do you attend Healthy Families aathétiflas?Always or almost alwaysSometimesNever
Ratio9/318/31
No Response12/312/31
Percentage29%26%39%co/U /0
What do you like about them?FoodEducational ProgramSeeing Other FamiliesNo Response
Ratio2/318/313/31
More than one answer on the above ouestion14/31
4/31
Percentage0/U /0
26%10%45%13%

Suggestions for topics at family gathfti:.—
RESPONSES SHARED ON SURVEYS:translated to English “would like more renunions”
If you have not attended, we would like to know why.RESPONSES SHARED ON SURVEYS:“Because I get sidetracked and forget all about the parties.”“I don’t have much time because of school and work”“My work schedule conflicts with parties”translated to English I work all week for my child, and I can’t make it!”“my daughter is young”
Have any of the following areas of your family’s life improved sincebeginning the program? Ratio Percentage
Our support system 22/31 71%Our ability to solve problems 16/31 52%Ability to cope with problems/stress 1 8/31 58%Our happiness 16/31 52%Using other community services 17/31 55%Our adult relationships 1 1/31 35%The health care of our children 25/31 81%Our living situation 10/31 32%Anger management 10/31 32%More patience with our child’s challenging behavior 14/31 45%Our understanding of child development and parenting 25/31 81%Taking care of our children 25/31 81%Other 1/31 3%
Does your home visitor accept that your religious and other beliefsmay play an important role in how your family makes decisions? Ratio
29/310/312/31
YesNoNo Response
Percentage94%I0/J /0
t: 0/1..) /0
Do you feel that the materials used by the program adequately reflectyour family’s culture or ethnicity?
YesNo
Ratio29/312/310/31No response
Percentaae94%6%
Overall, are you satisfied with the services provided byHealthy Families — Queen Anne’slTalbot? Ratio Percentage
Very Satisfied 29/31 94%Satisfied 2/31 6%Dissatisfied 0/31Very Dissatisfied 0/31
_____________

Wouldyou recommend our services to others if they needed support? R__ taeYes, definitely 31/31 100%Yes, probably 0/31No, probably not 0/31No, definitely not 0/31
What do you Eike most about the program?RESPONSES SHARED ON SURVEYS:“Information about baby.”“I love the way my home visitor does things for me to understand”“The information we receive about what to expect and my son enjoys the activities©”“The reassurance that we are parenting ok”“That I have a way to make sure my son is on the right track”“The educational activities”translated to English “I’m a first time mom and like to learn good this for my baby.”translated to English “timely and necessary information”translated to English “the information that we receive”translated to English “the topics we talk about”translated to English “they give information on my child, and help me resolve doubts”translated to English “the advice they give the help they provide to the families”translated to English “all”translated to English “the communication and the confidence I have or if I have doubts over my child”translated to English “the talks they offer”translated to English “They provide me with good ideas for my child and on how to best care for him andattention for my baby”translated to English “Advise on how to treat babies, what they should have and not and how to play withthem.”“Communicating with the home visitor and the information she provided”“support and friendly home visitors”“the information and the activities are very helpful. My child loves her home visitor and we enjoy the visits”“Different families coming together”“I love the support that I receive”“My home visitor is the best and is so helpful and understanding”“the talks, how I have help with parenting skills”“open communication paper on certain information”“there activity help a lot”“my home visitor answers all my questions”“understandinq child support”
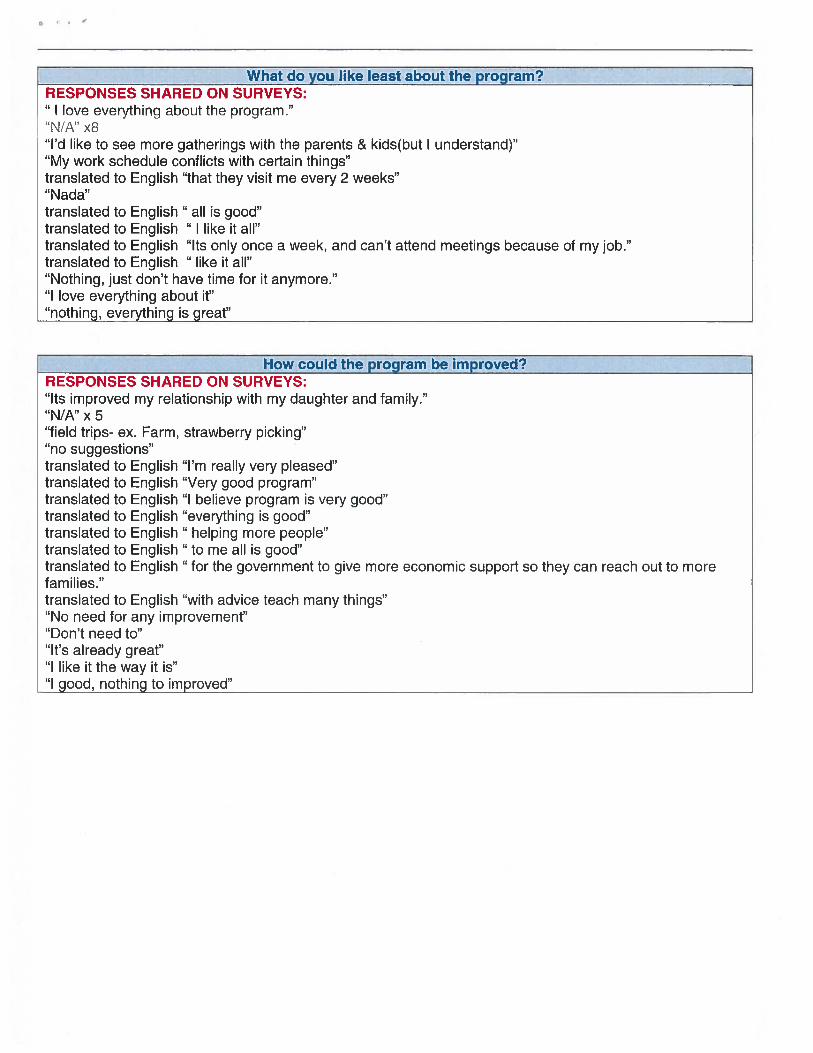
b
RESPONSES SHARED ON SURVEYS:“I love everything about the program.”“N/A” x8“I’d like to see more gatherings with the parents & kids(but I understand)”“My work schedule conflicts with certain things”translated to English “that they visit me every 2 weeks”“Nada”translated to English “allis good”translated to English “ I like it all”translated to English “Its only once a week, and can’t attend meetings because of my job.”translated to English “like it all”“Nothing, just don’t have time for it anymore.”“I love everything about it”“nothing, everything is great”
How could the program be improved?RESPONSES SHARED ON SURVEYS:“Its improved my relationship with my daughter and family.”“N/A” x 5“field trips- ex. Farm, strawberry picking”“no suggestions”translated to English “I’m really very pleased”translated to English “Very good program”translated to English “I believe program is very good”translated to English “everything is good”translated to English “helping more people”translated to English “to me all is good”translated to English “for the government to give more economic support so they can reach out to morefamilies.”translated to English “with advice teach many things”“No need for any improvement”“Don’t need to”“It’s already great”“I like it the way it is”“I qood, nothinq to improved”
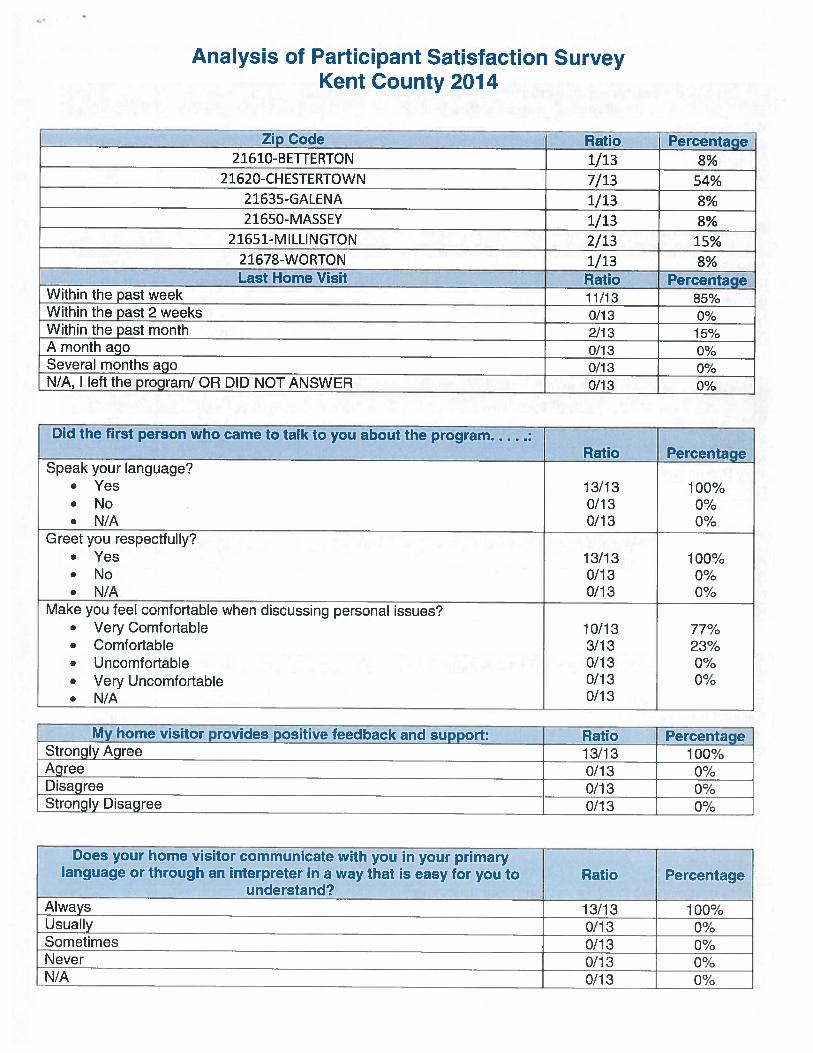
Analysis of Participant Satisfaction SurveyKent County 2014
Zip Code Ratio Percentaqe
My home visitor provides positive feedback and support:Strongly AgreeAgreeDisagree
Ratio13/130/130/130/13
Percentage1 öO%i0/.) /0
r0/‘J /0
10//0Strongly Disagree
Does your home visitor communicate with you in your primarylanguage or through an interpreter in a way that is easy for you to Ratio Percentage
understand?Always 13/13 100%Usually 0/13 0%Sometimes 0/13 0%Never 0/13 0%N/A 0/13 0%
21610-BEHERTON 1/13 8% —
21620-CHESTERTOWN 7/13 54%21635-GALENA 1/13 8%21650-MASSEY 1/13 8%
21651-MILLINGION 2/13 15%21678-WORTON 1/13 8%Last Home Visit Ratio Percentage
Within the past week 11/13 85%Within the past 2 weeks 0/13 0%Within the past month 2/13 15%A month ago 0/13 0%Several months ago 0/13 0%N/A, I left the program/ OR DID NOT ANSWER 0/13 0%
Did the first person who came to talk to you about the programRatio Percentage
Speak your language?. Yes 13/13 100%. No 0/13 0%. N/A 0/13 0%
Greet you respectfully?. Yes 13/13 100%. No 0/13 0%. N/A 0/13 0%
Make you feel comfortable when discussing personal issues?. Very Comfortable 10/13 77%. Comfortable 3/13 23%. Uncomfortable 0/13 0%. Very Uncomfortable 0/13 0%. N/A 0/13
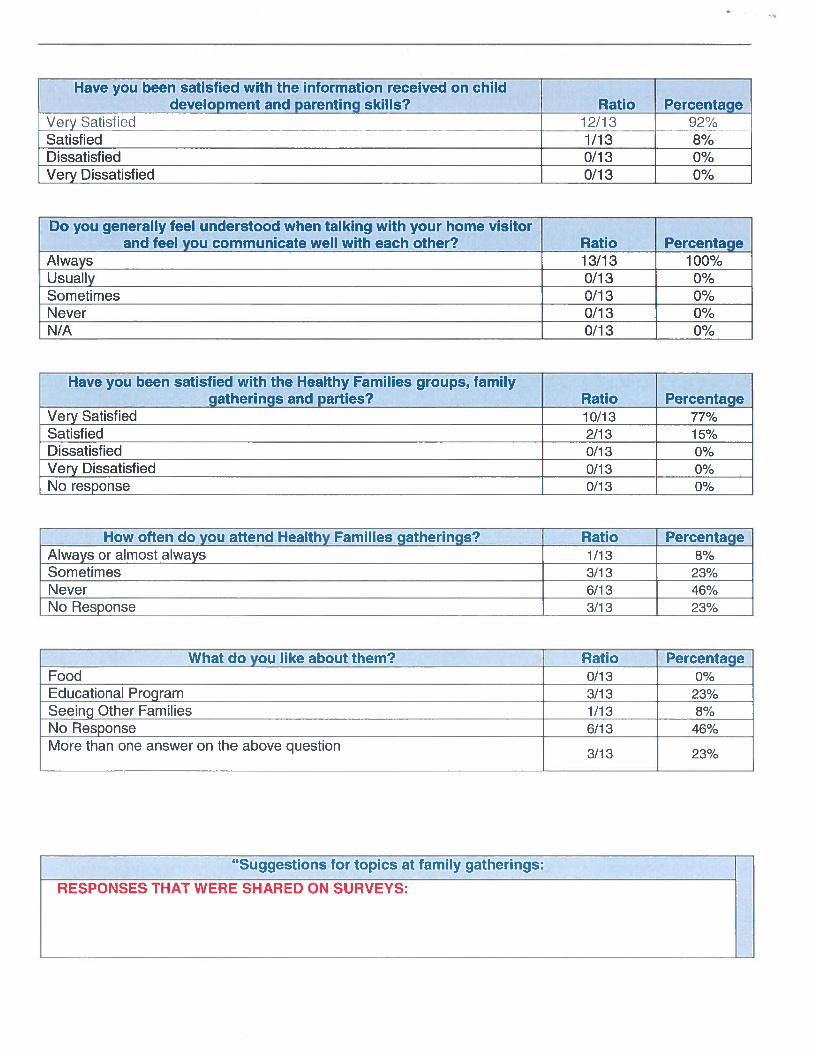
Have you been satisfied with the information received on childdevelopment and parenting skills? Ratio Percentage
Very Satisfied____ 12/13 92%Satisfied 1/13 8%Dissatisfied 0/13 0%Very Dissatisfied 0/13 0%
Do you generally feel understood when talking with your home visitorand feel you communicate well with each other?
AlwaysUsually
Ratio13/130/130/130/130/13
SometimesNeverN/A
Percentage100%
noiU 10
rio,U /0
noiU /0
no’U /0
Have you been satisfied with the Healthy Families groups, familygatherings and parties?
Very SatisfiedSatisfiedDissatisfied
Ratio10/132/130/130/130/13
Percentage77%15%0%noiU /0
0%Very DissatisfiedNo response
How often do you attend Healthy Families gathéflflq?Always or almost alwaysSometimes
Ratio1/133/136/133/13
Percentage00/U /0
23%46%23%
NeverNo Response
‘%; What do you like about them?FoodEducational ProgramSeeing Other FamiliesNo Response
Ratio0/133/131/136/13
3/13More than one answer on the above question
PercentagenoiU /0
23%00/U /0
46%
23%
“Suggestions for topics at family gatherings:
RESPONSES THAT WERE SHARED ON SURVEYS:
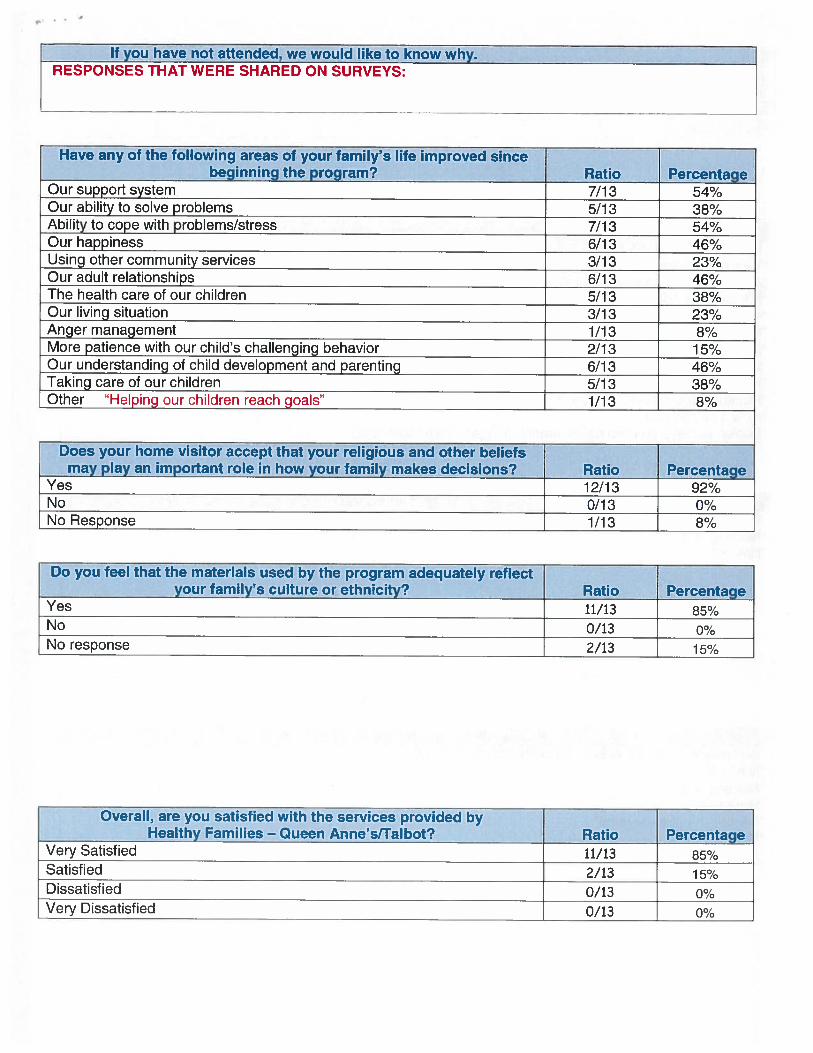
if you have not attended, we would like to know why.RESPONSES THAT WERE SHARED ON SURVEYS:
Have any of the following areas of your family’s life improved sincebeginning the program? Ratio Percentage
Our support system 7/13 54%Our ability to solve problems 5/13 38%Ability to cope with problems/stress 7/13 54%Our happiness 6/13 46%Using other community services 3/13 23%Our adult relationships 6/13 46%The health care of our children 5/13 38%Our living situation 3/13 23%Anger management 1/13 8%More patience with our child’s challenging behavior 2/13 15%Our understanding of child development and parenting 6/13 46%Taking care of our children 5/13 38%Other “Helping our children reach goals” 1/13 8%
Does your home visitor accept that your religious and other beliefsmay play an important role in how your family makes decisions?
YesNoNo Response
Ratio12/130/131/13
Percentage92%rio,J /0
00/0 /0
Do you feel that the materials used by the program adequately reflectfamily’s culture or ethnicity?
YesNo
Ratio11/130/132/13No response
Percentaae85%f’0/
10
-I 0/I J /0
Overall, are you satisfied with the services provided byHealthy Families — Queen Anne’srralbot? Ratio Percentage
Very Satisfied 11/13 85%Satisfied 2/13 15%Dissatisfied 0/13 0%Very Dissatisfied 0/13 0%
a
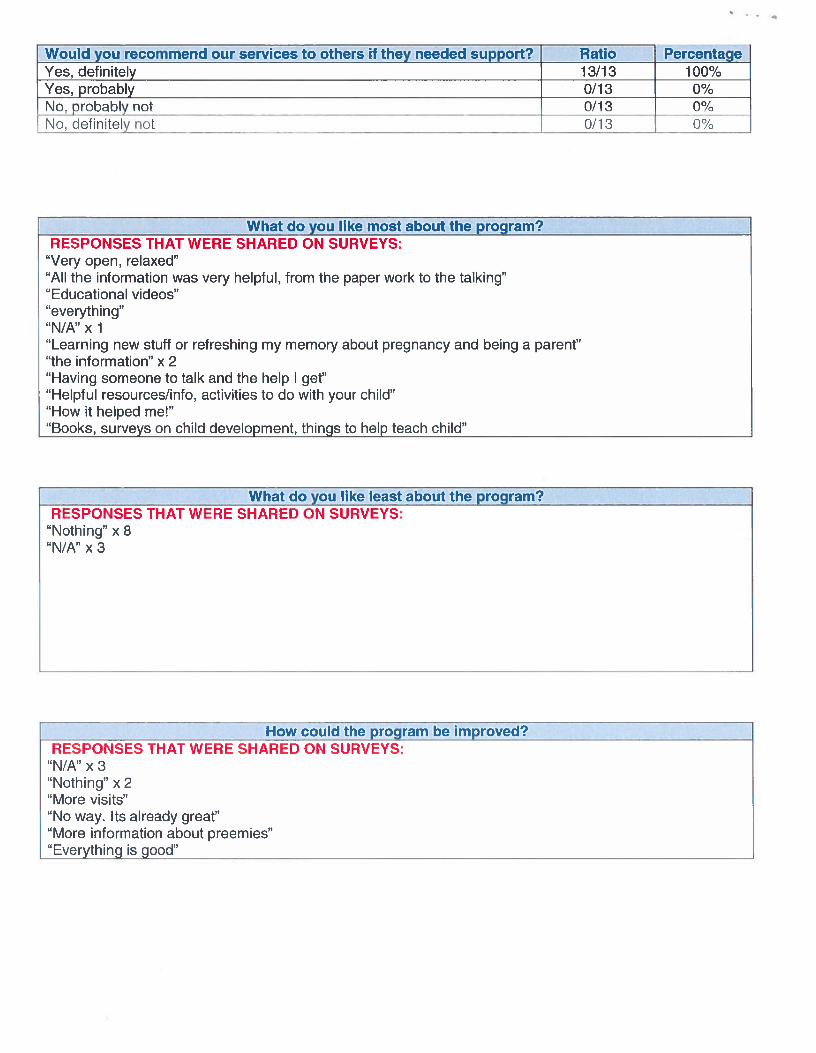
Would you recommend our services to others if they needed support? Ratio Percentag!
Yes, definitely 13/13 100%Yes, probably 0/13 0%No, probably not 0/13 0%No, definitely not 0/13 —— 0%
What do you like most about the program?RESPONSES THAT WERE SHARED ON SURVEYS:
“Very open, relaxed”“All the information was very helpful, from the paper work to the talking”“Educational videos”“everything”“N/A” x 1“Learning new stuff or refreshing my memory about pregnancy and being a parent”“the information” x 2“Having someone to talk and the help I get”“Helpful resources/info, activities to do with your child”“How it helped me!”“Books, surveys on child development, things to help teach child”
What do you like least about the program?RESPONSES THAT WERE SHARED ON SURVEYS:
“Nothing” x 8“N/A” x 3
How could the program be improved’RESPONSES THAT WERE SHARED ON SURVEYS:
“N/A” x 3“Nothing” x 2“More visits”“No way. Its already great”“More information about preemies”“Everything is good”

Analysis of Participant Satisfaction Survey
MID SHORE (Queen Anne’s, Talbot & Kent) 2014
Last Home VisitWithin the past weekWithin the past 2 weeksWithin the past monthA month agoSeveral months agoN/A, I left the program
Ratio32/6319/637/632/631/63
0/63
Percentage51%30%-1 -l 0/
I /0
Zip Code Ratio Percentage21607-BARCLAY 1/63 2%
21617-CENTREVILLE 5/63 8%21619-CHESTER 1/63 2%
21620-CHESTERTOWN 4/63 6%21638-GRASONVILLE 0/63 0%
21644-INGLESIDE 1/63 2%21651-MILLINGTON 3/63 5%
21658-QUEENSTOWN 1/63 2%21666- STEVENSVILLE 3/63 5%21668- SUDLERSVILLE 0/63 0%21623-CHURCH HILL 1/63 2%
21601-EASTON 23/63 37%21663-ST.MICHAELS 4/63 6%
21673-TRAPPE 4/63 6%21610-BEHERTON 1/63 2%
21620-CHESTERTOWN 7/63 1 1%21635-GALENA 1/63 2%21650-MASSEY 1/63 2%
21651-MILLINGTON 2/63 3%21678-WORTON 1/63 2%
Did the first person who came to talk to you about the programRatio Percentage
Speak your language?. Yes 61/63 97%. No 0/63 0%. N/A 2/63 3%
Greet you respectfully?• Yes 61/63 97%. No 0/63 0%• N/A 2/63 3%
Make you feel comfortable when discussing personal issues?. Very Comfortable 54/63 86%. Comfortable 8/63 13%. Uncomfortable 0/63 0%. Very Uncomfortable 0/63 0%. N/A 1/63 2%
3%2%CI0/U /0

Does your home visitor communicate with you in your primarylanguage or through an interpreter in a way that is easy for you to
understand?AlwaysUsually
Ratio
61/630/630/630/631/63
Percentage
97%no,.J /0
no!LI /0
no’/0
no,/0
My home visitor provides positive feedback and support: Ratio PercentageStrongly Age 58/63 92%Agree 5/63 8%Disagree 0/63 0%Strongly Disagree 0/63 0%
SometimesNeverN/A
Have you been satisfied with the information received on childdevelopment and parenting skills?
Very SatisfiedSatisfiedDissatisfiedVery Dissatisfied
Ratio59/634/630/630/63
Percentage94%
0/LI /0
no,U /0
no,U /0
Do you generally feel understood when talking with your home visitorand feel you communicate well with each other?
AlwaysUsuallySometimesNeverN/A
Ratio63/630/630/630/630/63
Percentage100%
no!V /0
no!V /0
no,V /0
no!V /0
Have you been satisfied with the Healthy Families groups, familygatherings and parties?
Very SatisfiedSatisfiedDissatisfied
Ratio47/639/630/630/636/63
Percentage75%14%noiU /0
noiV /0
10%Very DissatisfiedNo response
How often do you attend Healthy Families gatherings?Always or almost alwaysSometimesNeverNo Response
Ratio15/6317/6326/635/63
Percentage24%27%A I 0/t I /0
8%
a
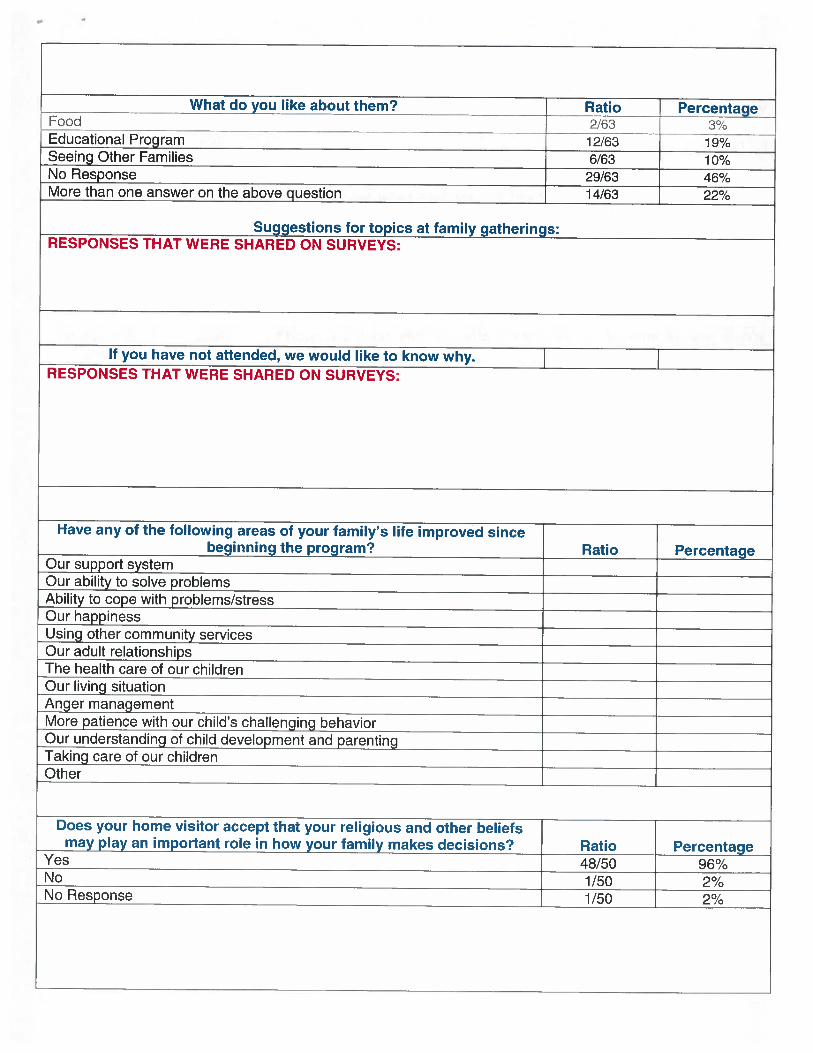
What do you like about them? Ratio PercentageFood 2/63 3%Educational Program 12163 19%Seeing Other Families 6/63 10%No Response 29/63 46%More than one answer on the above question 14/63 22%
Suggestions for topics at family gatherings:RESPONSES THAT WERE SHARED ON SURVEYS:
If you have not attended, we would like to know why. I IRESPONSES THAT WERE SHARED ON SURVEYS:
Ratio Percentage
Does your home visitor accept that your religious and other beliefsmay play an important role in how your family makes decisions?
YesNo
Ratio48/501/501/50
Percentage96%‘) 0/. /0
‘ 0//0
No Response
Our support system
Have any of the following areas of your family’s life improved sincebeginning the program?
Our ability to solve problemsAbility to cope with problems/stressOur happinessUsina other community servicesOur adult relationshirsThe health care of our childrenOur living situationAnger managementMore patience with our child’s challenging behavior
OtherTakin care of our childrenOur understandhig of child devekpment and parenting

Do you feel that the materials used by the program adequately reflectyour family’s culture or ethnicity? Ratio Percentage
Yes__________________________________________________________________ 43/50 86%No 4/50 8%
No response 3/50 6%
Overall, are you satisfied with the services provided byHealthy Families — Queen Anne’s/Talbot? Ratio Percentage
Very Satisfied 48/50 96%Satisfied 2/50 4%Dissatisfied 0/50 0%Very Dissatisfied 0/50 0%
Would you recommend our services to others if they needed support? Ratio PercentageYes, definitely 48/50 96%Yes, probably 2/50 4%No, probably not 0/50 0%No, definitely not 0/50 0%

What do you like most about the program?RESPONSES THAT WERE SHARED ON SURVEYS:“The information & support & help provided”“My worker, Nicole Chase-Powell. She has been a great help to myself and my son. If we ever have questionsshe has always got the answers we need.”“My child is learning to do more things like holding his bottle and trying to sit up, but still working on it.”“Easy”“The help”“The support system”“N/A”“Everything”“All the activities and flexability to work with your schedule.”“Everything”“The support I’ve received from the program”“All of the helpful development information.”“Everything I have no complaints”“We like getting along with Ms. Melissa, because she is very nice.”“the support & education materials”“My program teacher”“Friendly and very supportive.”“Informational, helpful, preparing me for my baby.”“The activities”“I like everything about the program.”“The genuine friendliness, parenting help.”“Everybody is very friendly and helpful.”“Estoy my satisfecha en verda me gusto todo”“Que ayudan a entender el crecimiento de los ninos y lidiar con Ia conducta”“Dy mucha comunicacion”“Que a aprendo cosas buenas para mi salud”“Getting feed back on parenting and education my kids are getting”“Help out a lot, very nice, teach me how to be a better patent.”“It help me understand child development.”“El apoyo y los consejos”“Que le ensinan a como educar a los ninos”“La informacion que se nos proporciona, las actividades con los ninos”“Que me explicaron los comportamientos de cada etapa de mi bebe”“Que estan pendientes de nuestra necesidad y desarollo de los ninos”“El apoyo con el desarrollo de mi bebe las opciones que medan para set una major mama”“The information and support”“Having a lot of support from them”“My visiter understand very well”“They help learn more about parenting”“Learning more about child development & parenting”“When my home visitor brings games & activities for my child to help her learn & see what she can do.”“Not stressful and someone I can go to when I have questions about my child”“They give me lots of good information”“The unbiased support & educational resource”“Looking at the different movies she bring for me to watch.”“In-home, focuses on many aspects of child health”“Talking to someone outside of family”“That my son has a good relationship with our home visitor”“That the rocjram teaches you how to cope with children when stressed out”

What do you like least about the program?RESPONSES THAT WERE SHARED ON SURVEYS:“N/A” x 9 times“I think there should be more family interaction among the families.”“Nothing everything fine.”“Nothing” x 10 times“We like everything”“There’s nothen”“Their nothing I don’t like”“Que es Una vez al mes y es poco tiempo”“El programa esta muy bien”“Todo me gusta” x 2“Me gusta todo”“Nada”“The program is great”“I can’t make it to the partys cause I work”“Nothing, everythings great”“I didn’t get to go to any of the parties”“Events hard to attend for working families”
How could the program be improved?
RESPONSES THAT WERE SHARED ON SURVEYS:“Not sure”“Again, I feel maybe during the parties since we live in an isolated area some activities could be done tointroduce families maybe bring some together for children to play with more regularly.”“Nothing needs improved everything is fine.”“N/A” x 6 times“Nothing”
“I think it is good the way it is”“More hands-on activities”“Include Kent County©”“Nothing everything is good I wouldn’t change a thing.”“Its already improved”“I love everything!!”“I can’t think of anything.”“Activities to improve relationship between parent & child”“I think it’s just fine.”“tener mucho comuncacion con las personas que estan en el programa”
“Just stay the lovely people that yall are, thanks for everything!”“Ayundando a mas familias”“It’s great theirs no need to improve”“N/A” x3“No improvement, its great.”“None needed”“Show more items you can get when in the hospital”“Enjoy everything”

—.


Life
Skills
Progression
Results
Queen
Anne’s
County/K
entC
ountyN
=109
Healthy
Families
with
LSP
atintake
to60
Months
Families
servedfrom
7/1/2013-6/30/2014
..
24M
onths36
Months
48M
onths60
Months
PA
RE
NT
SC
AL
ES
Initial12
Months
..
.
..
.I
•.
%in
Target
Range
%in
Target
Range
%in
Target
Range
%in
Target
Range
Life
Skills
Pro
gressio
nItem
%in
Target
Range
%in
Target
Range
(N=count
ofresponses)(N
=countofresponses)(N
=counofresponses)
(N=countof
(Target
Range)
(N=countof
responses)(N
=countof responses)responses)
RE
LA
IIO
NS
HIP
S,..
1.F
amily
(4-5)84%
(37)79%
(23)80%
(12)93%
(14)100%
(3)33%
(1)
2.B
oyfriend,F
atherof
Baby,
or64%
(28)69%
(20)60%
(9)53%
(8)67%
(2)100%
(3)
spouse(4-5)
3.F
riends/peers(4-5)
45%(20)
45%(13)
67%(10)
80%(12)
100%(3)
100%(3)
4.A
ttitudesto
pregnancy(4-5)
7%(3)
3%(1)
N/A
N/A
0%(0)
0%(0)
5.N
urturing(4-5)
32%(14)
52%(15)
80%(12)
100%(15)
100%(3)
0%(0)
6.D
iscipline(4-5)
7%(3)
41%(12)
73%(11)
100%(15)
100%(3)
100%(3)
7.D
evelopment
(4-5)14%
(6)48%
(14)67%
(10)80%
(12)100%
(3)100%
(3)
8.S
afety(4-5)
25%(11)
62%(18)
93%(14)
93%(14)
100%(3)
100%(3)
9.H
ome
visitor(4-5)
80%(35)
90%(26)
100%(15)
100%(15)
100%(3)
100%(3)
10.U
seof
information
(4-5)68%
(30)90%
(26)93%
(14)87%
(13)100%
(3)100%
(3)
11.U
seof
resources(4-5)
73%(32)
93%(27)
93%(14)
87%(13)
100%(3)
100%(3)
trrcr1ON
--
—12.
Language
(3-5)16%
(7)7%
(2)7%
(1)0%
(0)0%
(0)0%
(0)
13.<
12yrs.
Education
(3-5)18%
(8)17%
(5)7%
(1)7%
(1)0%
(0)0%
(0)
14.E
ducation(2-5)
68%(30)
69%(20)
87%(13)
73%(1
1)2/3
100%(3)
15.E
mploym
ent(2-5)
43%(19)
31%(9)
27%(4)
60%(9)
100%(3)
0%(0)
16.Im
migration
(2-5)5%
(2)10%
(3)7%
(1)N
/AN
/AN
/A
HE
AL
TH
/ME
D1C
AL
CA
RE
-
17.P
renatalcare
(4-5)68%
(30)48%
(21)N
/AN
/AN
/AN
/A
18.P
arentsick
care(4-5)
57%(25)
76%(22)
93%(14)
80%(12)
100%(3)
100%(3)
19.F
amily
planning(4-5)
9%(4)
38%(11)
40%(6)
60%(9)
100%(3)
100%(3)
20.C
hildw
ellcare
(4-5)27%
(12)70%
(19)100%
(15)100%
(15)100%
(3)100%
(3)
21.C
hildsick
care(4-5)
27%(12)
59%(17)
100%(15)
100%(15)
100%(3)
100%(3)
22.C
hilddental
care(4-5)
5%(2)
7%(2)
20%(3)
87%(13)
100%(3)
67%(2)
23.C
hildim
munizations
(4-5)27%
(12)62%
(18)100%
(15)100%
(15)100%
(3)100%
(3)
LifeSkills
Pi-o
gressio
nT
M(L
SP):A
nO
utcome
andIntervention
Planning
Instriunentfor
Use
with
Fam
iliesat
Risk,
byL.
Wollesen
andK
.Pelter.
Copyright
©2006
PaulH
.B
rookesPublishing
Co.,
Inc.A
llrights
reserved.
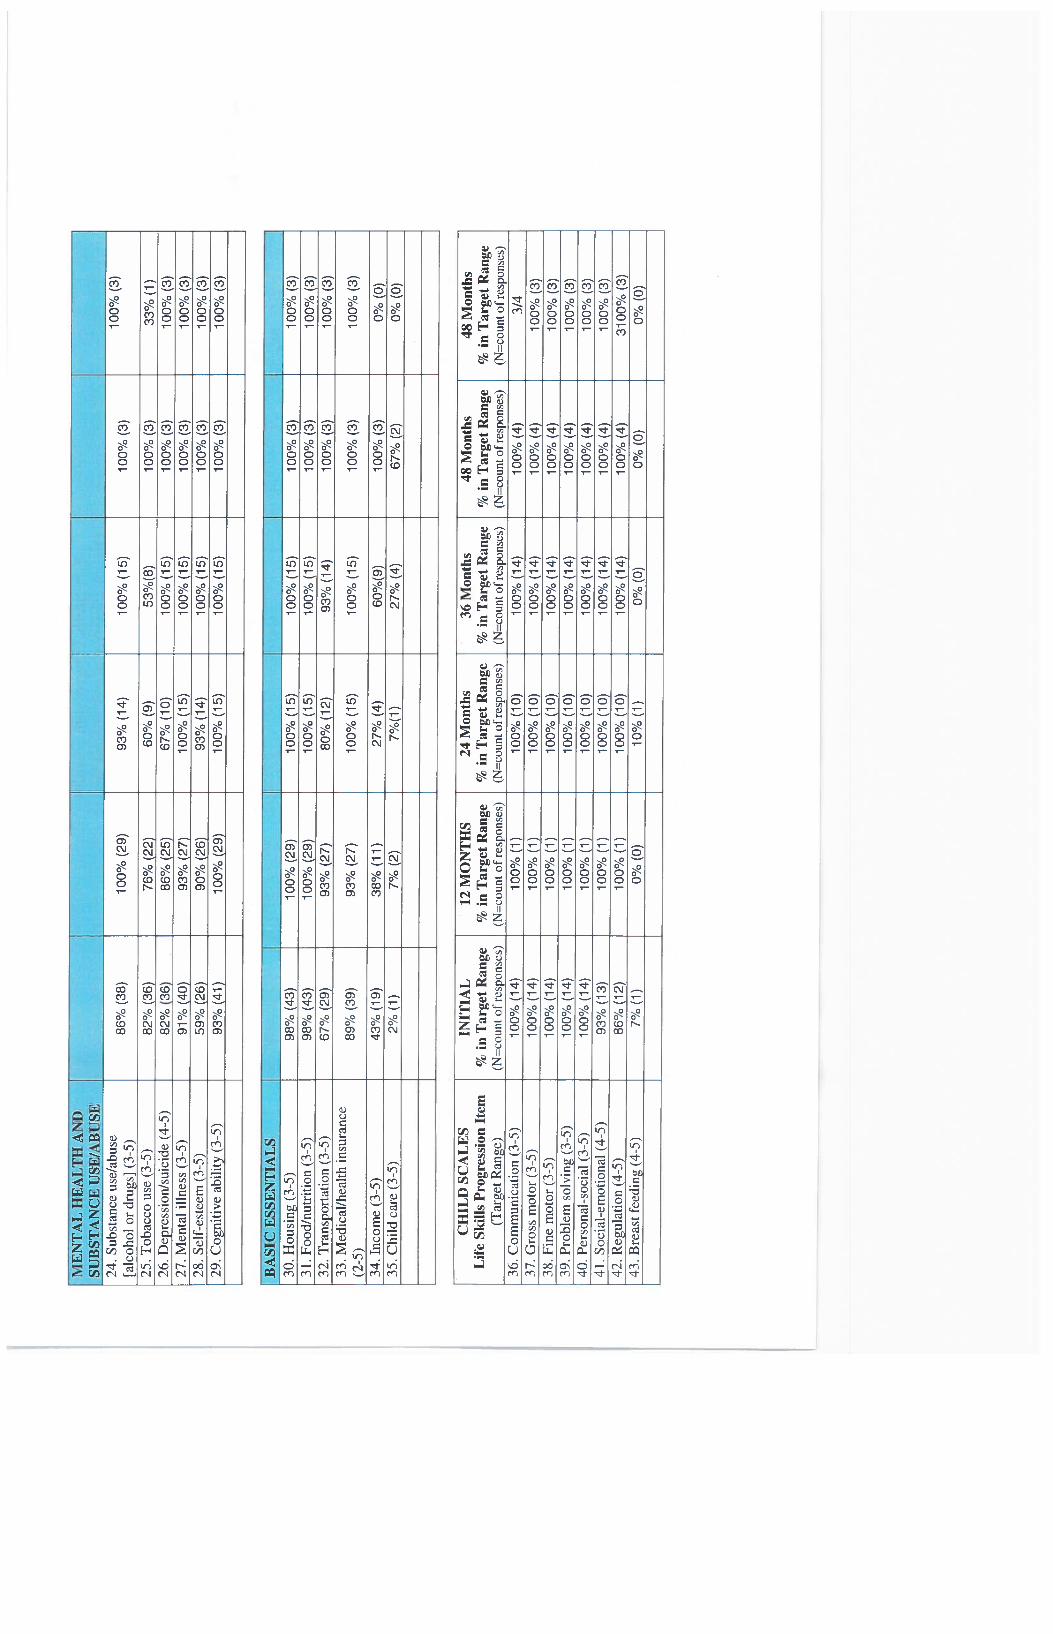
HE
AL
TH
AN
D
SU
BN
CL
US
E/A
BU
SE
.‘.
24.
Sub
stan
ceus
e/ab
use
86%
(38)
100%
(29)
93%
(14)
100%
(15)
100%
(3)
100%
(3)
[alc
ohol
ordr
ugs]
(3-5
)25
.T
obac
cous
e(3
-5)
82%
(36)
76%
(22)
60%
(9)
53%
(8)
100%
(3)
33%
(1)
26.
Dep
ress
ion/
suic
ide
(4-5
)82
%(3
6)86
%(2
5)67
%(1
0)10
0%(1
5)10
0%(3
)10
0%(3
)27
.M
enta
lil
lnes
s(3
-5)
91%
(40)
93%
(27)
100%
(15)
100%
(15)
100%
(3)
100%
(3)
2$.
Sel
f-es
teem
(3-5
)59
%(2
6)90
%(2
6)93
%(1
4)10
0%(1
5)10
0%(3
)10
0%(3
)29
.C
ognit
ive
abil
ity
(3-5
)93
%(4
1)10
0%(2
9)10
0%(1
5)10
0%(1
5)10
0%(3
)10
0%(3
)
100%
(29)
100%
(29)
93%
(27)
93%
(27)
38%
(11 )
7%(2
)
100%
(15)
100%
(15)
80%
(12)
100%
(15)
27%
(4)
7%(1
)
100%
(15)
100%
(15)
93%
(14)
100%
(15)
60%
(9)
27%
(4)
100%
(3)
100%
(3)
100%
(3)
100%
(3)
0%(0
)0%
(0)
40..
Per
sona
l-so
cial
(3-5
)
36.
Com
mun
icat
ion
(3-5
)37
.G
ross
mot
or(3
-5)
38.
Fin
em
otor
(3-5
)39
.P
roble
mso
lvin
g(3
-5)
41.
Soc
ial-
emot
iona
l(4
-5)
42.
Reg
ulat
ion
(4-5
)43
.B
reas
tfe
edin
g(4
-5)
100%
(14)
100%
(14)
100%
(14)
100%
(14)
100%
(14)
93%
(13)
86%
(12)
7%
(1)
100%
(1)
100%
(1)
100%
(1)
100%
(1)
100%
(1)
100%
(1)
100%
(1)
0%(0
)
100%
(10)
100%
(10)
100%
(10)
100%
(10)
100%
(10)
100%
(10)
100%
(10)
10%
(1)
100%
(14)
100%
(14)
100%
(14)
100%
(14)
100%
(14)
100%
(14)
100%
(14)
0%(0
)
100%
(4)
100%
(4)
100%
(4)
100%
(4)
100%
(4)
100%
(4)
0%(0
)
CH
ILD
SC
AL
ES
INIT
IAL
12
MO
NT
HS
24
Month
s36
Mo
nth
s4
8M
on
ths
48
Month
sL
ife
Skil
lsP
rogre
ssio
nIt
em
%in
‘I’a
rget
Range
%in
Targ
et
Range
%in
Targ
et
Ran
ge
%in
Targ
et
Range
inT
arg
et
Ran
ge
%in
Targ
et
Range
(Tar
get
Ran
ge)
(N=
cu
un
tof
resp
onse
s)(N
=co
unt
ofre
spon
ses)
(N=c
ount
ofre
spon
ses)
(N=c
ount
ofre
spon
ses)
(N=c
ount
ofre
spon
ses)
(N=c
ount
ofre
spon
ses)
100%
(4)
100%
(3)
3/4
100%
(3)
100%
(3)
100%
(3)
100%
(3)
3100
%(3
)0%
(0)
BA
SIC
ES
SE
NT
IAL
S
30.
Housi
ng
(3-5
)31
.fo
od
/nu
trit
ion
(3-5
)32
.T
rans
port
atio
n(3
-5)
98%
(43)
33.
Med
ical
/hea
lth
insu
ranc
e(2
-5)
98%
(43)
34.
Inco
me
(3-5
)
67%
(29)
35.
Chil
dca
re(3
-5)
89%
(39)
43%
(19)
2%
(1)
•.
100%
(3)
100%
(3)
100%
(3)
100%
(3)
100%
(3)
67%
(2)

Life
Skills
Progression
Results
Talbot
County
N=
78H
ealthyFam
iliesw
ithL
SPat
intaketo
60M
onthsFam
iliesserved
from7/1/2013-6/30/2014
..
24M
onths36
Months
48M
onths60
Months
PA
RE
NT
SC
AL
ES
Initial12
Months
..
.
..
.I
•.
%in
Target
Range
%in
Target
Range
%in
Target
Range
%in
Target
Range
Life
SkillsP
rogressionItem
%in
Target
Range
%in
Target
Range
(N=count
ofresponses)(N
=countofresponses)(N
=countofresponses)(N
=countof(T
argetR
ange)(N
=count ofresponses)(N
=countof
responses)responses)
RE
LA
TIO
NS
HIP
S-
1.F
amily
(4-5)81%
(17)77%
(10)86%
(12)93%
(14)88%
7/871%
(5)
2.B
oyfriend,F
atherof
Baby,
or27%
(4)38%
(3)57%
(4)spouse
(4-5)52%
(11)
62%(8)
71%(10)
3.F
riends/peers(4-5)
48%(10)
46%(6)
43%(6)
87%(13)
100%(8)
100%(7)
4.A
ttitudesto
pregnancy(4-5)
5%(1)
0%(0)
0%(0)
0%(0)
0%(0)
0%(0)
5.N
urturing(4-5)
29%(6)
85%(1
1)93%
(13)93%
(14)100%
(8)100%
(7)
6.D
iscipline(4-5)
29%(6)
86%(12)
100%(14)
87%(13)
100%(8)
100%(7)
7.D
evelopment
(4-5)29%
(6)85%
(11)
86%(12)
100%(15)
100%(8)
100%(7)
8.S
afety(4-5)
29%(6)
86%(12)
93%(13)
100%(15)
100%(8)
100%(7)
9.H
ome
visitor(4-5)
100%(21)
100%(13)
100%(14)
100%(15)
100%(8)
100%(7)
10.U
seof
information
(4-5)100%
(21)100%
(13)
93%(13)
100%(15)
100%(8)
100%(7)
11.
Use
of
resources(4-5)
95%(20)
100%(13)
93%(13)
100%(15)
100%(8)
100%(7)
ED
UC
AT
ION
-‘
t--
12.L
anguage(3-5)
29%(6)
31%(4)
14%(2)
7%(1)
0%(0)
0%(0)
13.<
12yrs.
Education
(3-5)5%
(1)31%
(4)21%
(3)13%
(2)0%
(0)0%
(0)14.
Education
(2-5)77
%(1
5)54%
(7)36%
(5)80%
(12)75%
(6)100%
(7)
15.E
mploym
ent(2-5)
43%(9)
46%(6)
43%(6)
67%(10)
100%(8)
100%(7)
16.Im
migration
(2-5)43%
(9)23%
(3)29%
(4)13%
(2)25%
(2)
HE
AL
TH
/ME
DIC
AL
CA
RE
1-
17.P
renatalcare
(4-5)100%
(21)62%
(8)7%
(1)0%
(0)13%
(1)0%
(0)18.
Parent
sickcare
(4-5)90%
(19)77%
(10)64%
(9)93%
(14)75%
(6)100%
(7)19.
Fam
ilyplanning
(4-5)14%
(3)46%
(6)43%
(6)73%
(11)100%
(8)100%
(7)20.
Child
well
care(4-5)
33%(7)
86%(12)
100%(14)
100%(15)
100%(8)
100%(7)
21.C
hildsick
care(4-5)
29%(6)
86%(12)
100%(14)
100%(15)
100%(8)
100%(7)
22.C
hilddental
care(4-5)
N/A
15%(2)
21%(3)
87%(13)
88%(7)
100%(7)
23.C
hildim
munizations
(4-5)29%
(6)86%
(12)100%
(14)100%
(15)100%
(8)100%
(7)
LifeSkills
ProgressionTM
(LSP):A
nO
utcome
andIntervention
Planning
Instrumentfo
rU
sew
ithF
amilies
atR
isk,by
L.
Wollesen
andK
.P
eifer.C
opyright©
2006Paul
H.
Brookes
PublishingC
o.,Inc.
All
rightsreserved.

ME
NT
AL
HE
AL
TH
AN
I)r.
SU
BS
TA
NC
EU
SE/A
BU
SE24
.S
ubst
ance
use/
abus
e10
%(2
)10
0%(1
3)70
0%(1
4)10
0%(1
5)10
0%(8
)70
0%(7
)
[alc
ohol
ordr
ugs]
(3-5
)25
.T
obac
cous
e(3
-5)
10%
(2)
100%
(13)
100%
(14)
100%
(15)
88%
(7)
86%
(6)
26.
Dep
ress
ion/s
uic
ide
(4-5
)90
%(1
9)85
%(7
1)86
%(1
2)93
%(1
4)10
0%(8
)10
0%(7
)
27.
Men
tal
illn
ess
(3-5
)10
%(2
)10
0%(1
3)10
0%(1
4)10
0%(1
5)10
0%(8
)10
0%(7
)28
.S
elf-
este
em(3
-5)
100%
(21)
100%
(13)
100%
(14)
100%
(15)
100%
(8)
100%
(7)
29.
Cognit
ive
abil
ity
(3-5
)10
%(2
)10
0%(1
3)10
0%(1
4)10
0%(1
5)10
0%(8
)10
0%(7
)
BA
SIC
ES
SE
NT
IAL
S30
.H
ousi
ng(3
-5)
31.
Foo
d/nu
trit
ion
(3-5
)32
.T
rans
port
atio
n(3
-5)
33.
Med
ical
/hea
lth
insu
ranc
e(2
-5)
34.
Inco
me
(3-5
)35
.C
hild
care
(3-5
)
95%
(20)
100%
(21)
100%
(21)
95%
(20)
33%
(7)
10%
(2)
100%
(13)
100%
(13)
100% 69%
39%
39%
(13)
(9)
(5)
(5)
100%
(14)
100%
(14)
100%
(14)
57%
(8)
50%
(7)
57%
(8)
100%
(15)
100%
(15)
93%
93%
80%
(14)
(14)
(12)
93%
(14)
/.
100%
(8)
100%
(8)
100%
(8)
75%
(6)
100%
100%
(8)
(8)
100%
100%
100%
(7)
(7)
(7)
86%
(6)
100%
(7)
86%
(6)
CH
ILD
SC
AL
ES
INIT
IAL
12M
ON
TH
S24
Mon
ths
36M
onth
s48
Mon
ths
60M
onth
sL
ife
Ski
lls
Pro
gres
sion
Item
%in
Tar
get
Ran
ge%
inT
arget
Ran
ge%
inT
arget
Ran
ge%
inT
arget
Ran
ge%
inT
arg
etR
ange
%in
Tar
get
Ran
ge(T
arge
tR
ange
)(N
=eo
unt
ofre
spon
ses)
(N=c
ount
ofre
spon
ses)
(N=c
ount
ofre
spon
ses)
(N=c
ount
ofre
spon
ses)
(Nco
unt
ofre
spon
ses)
(N=c
ount
ofre
spon
ses)
36.
Com
mun
icat
ion
(3-5
)75
%(3
)80
%(4
)10
0%(1
2)10
0%(1
5)10
0%(8
)10
0%(7
)37
.G
ross
mot
or(3
-5)
75%
(3)
80%
(4)
100%
(12)
100%
(15)
100%
(8)
100%
(7)
38.
Fin
em
otor
(3-5
)75
%(3
)80
%(4
)10
0%(1
2)10
0%(1
5)10
0%(8
)10
0%(7
)39
.P
robl
emso
lvin
g(3
-5)
75%
(3)
80%
(4)
100%
(12)
100%
(15)
100%
(8)
100%
(7)
40.
Per
sona
l-so
cial
(3-5
)75
%(3
)80
%(4
)10
0%(1
2)10
0%(1
5)10
0%(8
)10
0%(7
)41
.S
ocia
l-em
otio
nal
(4-5
)75
%(3
)80
%(4
)10
0%(1
2)10
0%(1
5)10
0%(8
)10
0%(7
)42
.R
egul
atio
n(4
-5)
75%
(3)
80%
(4)
100%
(12)
100%
(15)
100%
(8)
100%
(7)
43.
Bre
ast
feed
ing
(4-5
)0%
(0)
20%
(1)
67%
(8)
13%
(2)
0%(0
)14
%(1
)

Life
Skills
Progression
Results
Com
binedN
=187
Healthy
families
with
LSP
atintake-
60M
onthsJuly
1,2013-June
30,2014
..
24M
onths36
Months
48M
onths60
Months
PA
RE
NT
SC
AL
ES
Initial12
Months
..
.
..
.I
•.
%in
Target
Range
%in
Target
Range
%in
Target
Range
%in
Target
Range
Life
Skills
Pro
gressio
nItem
%in
Target
Range
%in
Target
Range
..
..
(N=countofresponses)
(N=countol responses)
(N=count of
responses)(N
=countof(T
argetR
ange)(N
=countofresponses)
(N=countof
responses)responses)
JAT
4ON
$IJ3PS
-—
-
1.F
amily
(4-5)83%
(54)79%
(33)83%
(24)93%
(28)91%
(10)60%
(6)
2.B
oyfriend,F
atherof
Baby,
or60%
(39)67%
(28)66%
(19)40%
(12)45%
(5)70%
(7)
spouse(4-5)
3.F
riends/peers(4-5)
46%(30)
45%(19)
55%(16)
83%(25)
100%(11)
10
0%
(10)
4.A
ttitudesto
pregnancy(4-5)
6%(4)
2%(1)
0%(0)
0%(0)
0%(0)
0%(0)
5.N
urturing(4-5)
31%(20)
62%(26)
86%(25)
97%(29)
100%(1
1)70%
(7)
6.D
iscipline(4-5)
14%(9)
57%(24)
86%(25)
93%(28)
100%(11)
100%
(10)
7.D
evelopment
(4-5)19%
(12)60%
(25)76%
(22)90%
(27)100%
(11)1
00%
(10)
8.S
afety(4-5)
26%(17)
71%(30)
93%(27)
97%(29)
100%(11)
10
0%
(10)
9.H
ome
visitor(4-5)
51%(33)
93%(39)
100%(29)
67%(20)
100%(11)
100%
(10)
10.U
seof
information
(4-5)78%
(51)93%
(39)93%
(27)100%
(30)100%
(11)
100%
(10)
11.
Use
of
resources(4-5)
80%(52)
95%(40)
93%(27)
93%(28)
100%(1
1)100
%(10)
ED
UC
AT
ION
12.L
anguage(3-5)
22%(14)
14%
(6)10%
(3)3%
(1)0%
(0)0%
(0)
13.<
12yrs.
Education
(3-5)14%
(9)21%
(9)14%
(4)10%
(3)0%
(0)0%
(0)
14.E
ducation(2-5)
69%(45)
64%(27)
62%(18)
77%(23)
73%(8)
100¾
(10)
15.E
mploym
ent(2-5)
43%(28)
36%(15)
35%(10)
63%(19)
100%(11)
70%(7)
16.Im
;riigration(2-5)
17%(11)
14%(6)
17%(5)
7%(2)
27%(3)
0%(0)
HE
AL
TH
IME
DIC
AL
CA
RE
17.P
renatalcare
(4-5)78%
(51)69%
(29)3%
(1)0%
(0)9%
(1)0%
(0)
18.P
arentsick
care(4-5)
68%(44)
76%(32)
79%(23)
87%(26)
82%(9)
10
0%
(10)
19.F
amily
planning(4-5)
11%(7)
40%(17)
41%(12)
20/30100%
(11)10
0%
(10)
20.C
hildw
ellcare
(4-5)29%
(19)74%
(31)100%
(29)100%
(30)100%
(11)10
0%
(10)
21.C
hildsick
care(4-5)
28%(18)
69%(29)
100%(29)
100%(30)
100%(11)
10
0%
(10)
22.C
hilddental
care(4-5)
3%(2)
13%(4)
21%(6)
87%(26)
91%(10)
90%(9)
23.C
hildim
munizations
(4-5)28%
(18)71%
(30)100%
(29)100%
(30)100%
(11)100
%(10)
Life
SkillsProgressionT
M(L
SP):A
nO
utcome
andlnteri’ention
Planning
Instrumentfo
rU
sew
ithF
amilies
atR
isk,by
L.
Wollesen
andK
.P
eifer.C
opyright©
2006Paul
H.
Brookes
Publishing
Co.,
Inc.A
llrights
reserved.

ME
NT
AL
hEA
LT
HA
NI)
SU
BS
TA
NC
EU
SE
/AB
US
E24
.S
ubst
ance
use/
abus
e[a
lcoh
olor
drug
s](3
-5)
97%
(28)
62%
(40)
100%
(42)
100%
(30)
100%
(11)
100%
(10)
25.
To
bac
cous
e(3
-5)
59%
(38)
100%
(42)
100%
(29)
100%
(30)
100%
(11)
70%
(7)
26.
Dep
ress
ion/s
uic
ide
(4-5
)85
%(5
5)86
%(3
6)76
%(2
2)10
0%(3
0)10
0%(1
1)10
0%
(10)
27.
Men
tal
illn
ess
(3-5
)65
%(4
2)95
%(4
0)10
0%(2
9)10
0%(3
0)10
0%(1
1)10
0%
(10)
28.
Sel
f-es
teem
(3-5
)72
%(4
7)93
%(3
9)97
%(2
8)10
0%(3
0)10
0%(1
1)10
0%
(10)
29.
Cognit
ive
abil
ity
(3-5
)66
%(4
3)10
0%(4
2)10
0%(2
9)10
0%(3
0)10
0%(1
1)10
0%
(10)
BA
SIC
ES
SE
NT
IAL
S..1
30.
Ho
usi
ng
(3-5
)97
%(6
3)10
0%(4
2)10
0%(2
9)10
0%(3
0)10
0%(1
1)10
0%
(10)
31.
Food/n
utr
itio
n(3
-5)
99%
(64)
100%
(42)
100%
(29)
100%
(30)
100%
(11)
100
%(1
0)32
.T
ransp
ort
atio
n(3
-5)
77%
(50)
95%
(40)
90%
(26)
93%
(28)
100%
(11)
100
%(1
0)33
.M
edic
al/h
ealt
hin
suta
nce
91%
(59)
86%
(36)
79%
(23)
97%
(29)
82%
(9)
90%
(9)
34.
Inco
me
(3-5
)-
40%
(26)
38%
(16)
38%
(11)
70%
(21)
100%
(11)
70%
(7)
35.
Chi
ldca
re(3
-5)
5%(3
)17
%(7
)31
%(9
)93
%(2
8)91
%(1
0)60
%(6
)
CH
ILD
SC
AL
ISIN
ITIA
L12
MO
NT
HS
24M
onth
s36
Mon
ths
48M
onth
s60
Mon
ths
Lif
eS
kill
sP
rogr
essi
onIt
em%
inR
ange
%in
Tar
get
Ran
ge¾
inT
arget
Ran
ge%
inT
arg
etR
ange
%in
Tar
get
Ran
ge%
inT
arget
Ran
ge(T
arge
tR
ange
)(N
=eo
uni
ofre
spon
ses)
(N=
coun
ofre
spon
ses)
(N=c
ount
ofre
spon
ses)
(N=c
ount
ofre
spon
ses)
(N=c
ount
ofre
spon
ses)
(N=c
ount
ofre
spon
ses)
36.
Com
mun
icat
ion
(3-5
)94
%(1
7)83
%(5
)10
0%(2
2)10
0%(2
9)10
0%(1
3)100%
(10)
37.
Gro
ssm
otor
(3-5
)94
%(1
7)83
%(5
)10
0%(2
2)10
0%(2
9)10
0%(1
3)10
0%
(10)
38.
Fin
em
otor
(3-5
)94
%(1
7)83
%(5
)10
0%(2
2)10
0%(2
9)10
0%(1
3)10
0%
(10)
39.
Pro
ble
mso
lvin
g(3
-5)
94%
(17)
83%
(5)
100%
(22)
100%
(29)
100%
(13)
100%
(10)
40.
Per
sona
l-so
cial
(3-5
)94
%(1
7)83
%(5
)10
0%(2
2)10
0%(2
9)10
0%(1
3)1
00
%(1
0)41
.S
ocia
l-em
otio
nal
(4-5
)89
%(1
6)83
%(5
)10
0%(2
2)10
0%(2
9)10
0%(1
3)10
0%
(10)
42.
Reg
ula
tion
(4-5
)83
%(1
5)83
%(5
)10
0%(2
2)10
0%(2
9)10
0%(1
3)1
00
%(1
0)43
.B
reas
tfe
edin
g(4
-5)
6%(1
)17
%(1
)41
%(9
)7%
(2)
0%(0
)10
%(1
)

Healthy Families Mid-Shore
GOC Matrix
FY2014

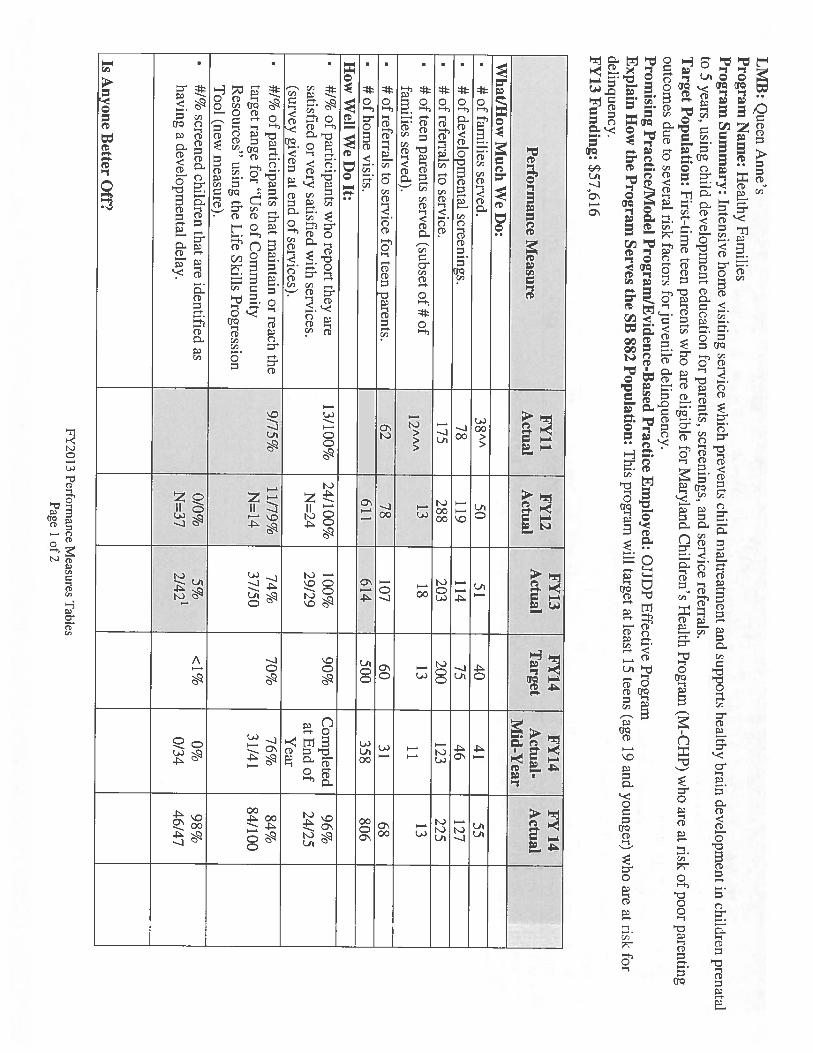
LM
B:
Queen
Anne’s
Pro
gram
Nam
e:H
ealthyfam
iliesP
rogram
Sum
mary:
Intensivehom
evisiting
servicew
hichprevents
childm
altreatment
andsupports
healthybrain
development
inchildren
prenatalto
5years,
usingchild
development
educationfor
parents,screenings,
andservice
referrals.T
argetP
opulation:first-tim
eteen
parentsw
hoare
eligiblefor
Maryland
Children’s
Health
Program
(M-C
HP
)w
hoare
atrisk
ofpoor
parentingoutcom
esdue
toseveral
riskfactors
forjuveniledelinquency.
Prom
isingP
ractice/Model
Program
/Evidence-B
asedP
racticeE
mployed:
OJJD
PE
ffectiveP
rogramE
xplainH
owthe
Pro
gram
Serves
theSB
$82P
opulation:T
hisprogram
will
targetat
least15
teens(age
19and
younger)w
hoare
atrisk
fordelinquency.F
Y13
Funding:
$57,616
FY
11F
Y12
FY
13F
Y14
FY
14F
Y1
4P
erformance
Measure
Actual
Actual
Actual
Target
Actual-
Actual
Mid-Y
earW
hat/How
Much
We
Do:
#offam
iliesserved.
38”
5051
4041
55•
#of
developmental
screenings.78
119114
7546
127•
#of
referralsto
service.175
288203
200123
225•
#of
teenparents
served(subset
of#
of13
1813
13fam
ilies_served).•
#of
referralsto
servicefor
teenparents.
6278
10760
3168
•#ofh
om
evisits.
611614
500358
806H
owW
ellW
eD
oIt:
•#1%
ofparticipants
who
reportthey
are13/100%
24/100%100%
90%C
ompleted
96%satisfied
orvery
satisfiedw
ithservices.
N=
2429/29
atE
ndof
24/25(survey
givenat
endof
services).Y
ear•
#1%of
participantsthat
maintain
orreach
the9/75%
11/79%74%
70%76%
84%targ
etrange
for“U
seof
Com
munity
N=
1437/50
31/41
84/100R
esources”using
theL
ifeS
killsP
rogressionT
ool_(new_m
easure).-
#1%screened
childrenthat
areidentified
as0/0%
5%<
1%0%
98%having
adevelopm
entaldelay.
N=
372/421
0/3446/47
IsA
nyoneB
etterO
ff?
FY
2013P
erformance
Measures
Tables
Page1
of2
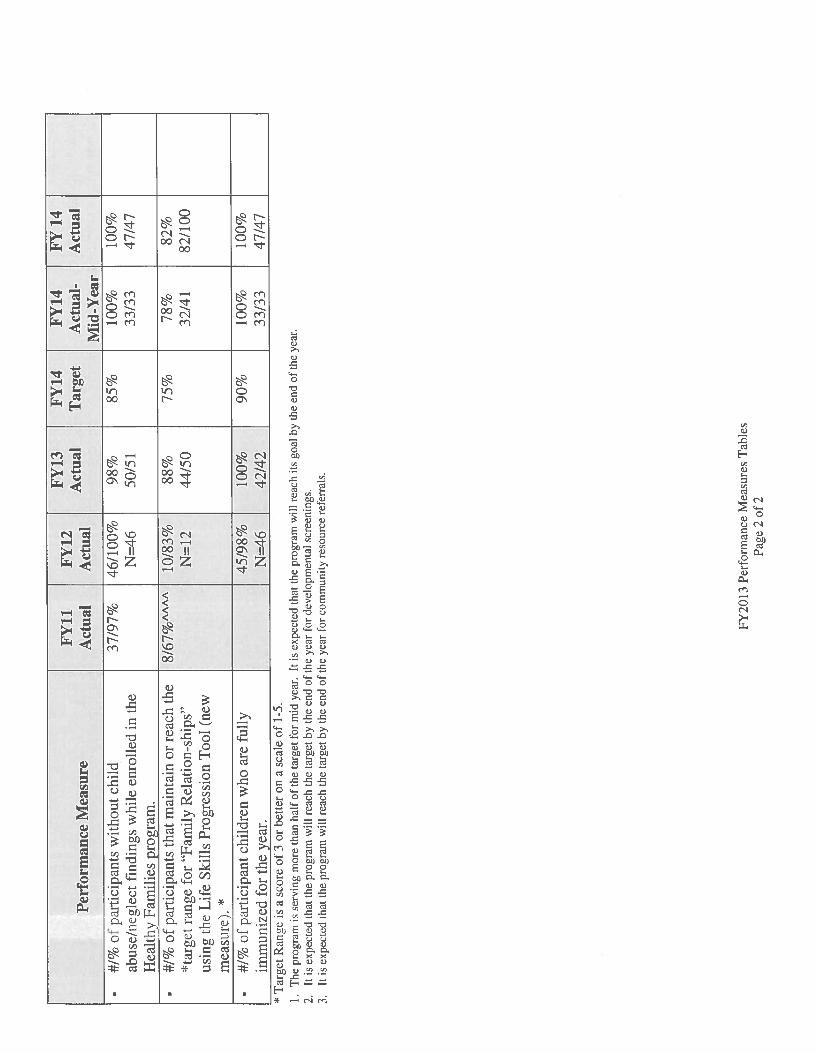
FY11
FY
12FY
13FY
14FY
14F
Y1
4
Per
form
ance
Mea
sure
Act
ual
Act
ual
Act
ual
Tar
get
Act
ual-
Act
ual
Mid
-Yea
r•
#1%
ofpa
rtic
ipan
tsw
itho
utch
ild
37/9
7%46
/100
%98
%85
%10
0%10
0%ab
use/
negl
ect
find
ings
whi
leen
roll
edin
the
N=
4650
/51
33/3
347
/47
Hea
lthy_
Fam
ilies
_pro
gram
.•
#/%
ofpa
rtic
ipan
tsth
atm
aint
ain
orre
ach
the
8/6
7%
’10
/83%
88%
75%
78%
82%
*tar
get
rang
efo
r“F
amil
yR
elat
ion-
ship
s”N
=12
44/5
032
/41
82/1
00us
ing
the
Lif
eSk
ills
Pro
gres
sion
Too
l(n
ewm
easu
re).
*
•#1
%of
part
icip
ant
chil
dren
who
are
full
y45
/98%
100%
90%
100%
100%
imm
uniz
edfo
rth
eye
ar.
N=
4642
/42
33/3
347
/47
Tar
get
Ran
ge
sa
score
of
3or
bet
ter
ona
scal
eof
1-5.
1.T
hepr
ogra
mis
serv
ing
mor
eth
anha
lfof
the
targ
etfo
rm
idye
ar.
Itis
expe
cted
that
the
prog
ram
will
reac
hits
goal
byth
een
dof
the
year
.2.
Itis
expe
cted
hat
the
prog
ram
will
reac
hth
eta
rget
byth
een
dof
the
year
for
deve
lopm
enta
lsc
reen
ings
.3.
Itis
expe
cted
hat
the
prog
ram
will
reac
hth
eta
rget
byth
een
dof
the
year
for
com
mun
ity
reso
urce
refe
rral
s.
FY
20
13P
erfo
rman
ceM
easu
res
Tab
les
Pag
e2
of
2

LM
E:
Talbot
County
Pro
gram
Nam
e:H
ealthyF
amilies
(HF)
Mid-S
hore(P
rogramserves
two
counties,data
isfor
Talbot
County
only)P
rogram
Sum
mary:
Healthy
Fam
iliesM
id-Shore
providesintensive
preventionand
earlyintervention
servicesto
firsttim
eparents,
eligiblefor
MC
HP
andresiding
inT
albotC
ounty,w
hoalso
haverisk
factorsfor
poorparenting
outcomes.
Hom
evisitors
(Fam
ilyS
upportW
orkers)share
theG
rowing
Great
Kids
childdevelopm
entcurriculum
,build
asustained
relationshipw
iththe
participants,conduct
developmental
screens,refer
forservices,
andm
odelessential
parentingskills.
Target
Population:
First
time
parents,pregnant
orw
itha
babyup
tothree
months
ofage
atenrollm
ent,receiving
M-C
HP
oruninsured,
residingin
Talbot
(orQ
A)
County
who
areat
riskof
poorparenting
outcomes.
Prom
isingP
ractice!M
odelP
rogram!
Evidence-B
asedP
racticeE
mployed:
Healthy
Fam
iliesA
merica
Explain
How
theP
rogram
Serves
theSB
882P
opulation:N
/AF
Y14
Funding:
$82,424
FY
10FY
11F
Y12
FY13
FY
14F
Y14
FY
14F
Y14
FY
14F
Y14
Actual
Actual
Actual
Actual
Target
Actual
Actual
Actual
Actual
Actual
Perform
anceM
easure1st
2fld3rd
4th
Quarter
Quarter
Quarter
Quarter
What/H
owM
uchW
eD
o:.
#participants
(Talbot
families)
4840
5246
4232
3340
4148
served.•
#developm
entalscreenings
$172
120127
10030
3033
41134
completed.
•#
ofreferrals
toother
services.168
246444
202150
6146
5140
198H
owW
ellW
eD
oIt:
•%
ofparticipants
who
report100%
94%100%
100%90%
Com
pletedC
ompleted
Com
pletedC
ompleted
100%they
aresatisfied
orvery
(N=
14)(17/18)
(24/24)21/21
atE
ndof
atE
ndof
atE
ndof
atE
nd
of31/31
satisfiedw
ithservices.
Yr
Yr
Yr
Yr
•%
offam
iliesenrolled
prenatal.94%
88%75%
81%80%
80%66%
83%100%
83%(N
=15/16)
(15/17)(12/24)
13/164/5
2/35/6
4/415/18
New
lyenrolled
•%
ofparticipating
children100%
100%100%
100%100%
100%100%
100%fully
imm
unized.(47/47)
40/4029/29
29/2938/38
32/32(5
families
servedare
pre
natal)

FY
10FY
11FY
12FY
13F
Y14
FY14
FY
14F
Y14
FY
14F
Y14
Act
ual
Act
uat
Act
ual
Act
ual
Tar
get
Act
ual
Act
ual
Act
ual
Act
ual
Act
ual
Per
form
ance
Mea
sure
1st
2n
d3r
d4
th
Quar
ter
Quar
ter
Quar
ter
Qu
arte
r
IsA
nyon
eB
ette
rO
ff?
%of
part
icip
ants
wit
hout
100%
98%
98%
100%
90%
100%
100%
100%
100%
100%
“ind
icat
ed”
chil
dab
use/
negl
ect
(N=
48)
(39/
40)
(46/
47)
46/4
629
/29
29/2
938
/38
32/3
240
/40
find
ings
whi
leen
roll
edin
the
HF
prog
ram
.•
#an
d%
ofpa
rtic
ipan
tsw
ho91
%93
%91
%85
%95
%91
%10
0%95
%95
%m
aint
ain
orre
ach
the
targ
et(1
0/11
)(1
4/15
)53
/58
21/2
210
/11
23/2
320
/21
39/4
1ra
nge°
for
“Use
ofC
omm
unit
yR
esou
rces
”us
ing
the
Lif
eSk
ills_
Prog
ress
ion_
Too
l.•
#an
d%
ofpa
rtic
ipan
tsth
at91
%87
%83
%80
%77
%82
%78
%90
%90
%m
ain
orre
ach
the
targ
etra
nge*
(10/
11)
(13/
15)
48/5
817
/22
9/11
18/2
319
/21
37/4
1fo
r“F
amil
yR
elat
ions
hips
”us
ing
the
Lif
eSk
ills
Prog
ress
ion_
Too
l.*T
arget
rang
eof
4or
bet
ter
ona
scal
eof
1-5.
1.It
isex
pect
edth
atth
epr
ogra
mw
illre
ach
itsgo
alby
the
end
ofth
eye
ar.
2.A
t3rd
Qua
rter
.th
epr
ogra
mha
sal
mos
tre
ache
dits
goal
.It
isex
pect
edth
atth
epr
ogra
mw
illre
ach
the
targ
etby
the
end
ofth
eye
arfo
rde
velo
pmen
tal
scre
enin
gs.
3.A
t3rd
Qua
rter
.th
epr
ogra
mha
sre
ache
dits
goal
.15
$to
tal
refe
rral
sha
vebe
enco
mpl
eted
.4.
The
5fa
mil
ies
that
did
not
reac
hth
eta
rget
rang
ein
this
area
wer
eba
seli
nem
easu
rem
ents
.W
ean
tici
pate
that
asth
ose
fam
ilies
stay
inth
epr
ogra
m,
this
area
will
impr
ove
thro
ugh
the
know
ledg
e
and
info
rmat
ion
the
fam
ily
gain
sfr
omth
epr
ogra
m.

Healthy Families Mid-Shore
MSDE Matrix
FY2014


Mar
ylan
dS
tate
Dep
artm
ent
ofE
duca
tion
Div
isio
nof
Spec
ial
Ed
uca
tio
n/E
arly
Inte
rven
tion
Ser
vic
esFY
74H
ome
Vis
itin
g/H
ealt
hy
Fam
ilie
sF
inal
-Annual
Rep
ort
ing
Mat
rix
Type
ofP
rogra
m:
Hom
eV
isiti
ngP
rog
ram
Ven
dor:
Quee
nA
nne’
sC
ount
yC
omm
unit
yP
artn
ersh
ips
or
Chi
ldre
n&
Fam
ilie
s
Pro
gra
mN
ame:
Hea
lthy
Fam
ilie
sQ
uee
nA
nne’
s/T
albo
t
Tar
get
Po
pu
lati
on
(to
be
serv
edby
pro
gra
m):
Fir
stti
me
par
ents
,re
siden
tsof
Quee
nA
nne’
sor
Tal
bot
Cou
nty,
MD
,el
igib
lefo
rM
aryl
and
Chi
ldre
n’s
Hea
lth
Insu
ranc
eP
rogr
am(M
CH
P),
who
are
scre
ened
for
risk
fact
ors,
asse
ssed
atri
skfo
rch
ildab
use
and
negl
ect,
and
part
icip
ate
volu
ntar
ily
inin
tens
ive
hom
evi
siti
ngse
rvic
es.
FY
74F
undin
gL
evel
:H
ealt
hy
Fam
ilie
s:$
296,
372
Oth
erH
ome
Vis
itin
g:
Res
ult
Are
a(s)
Sta
teIn
dic
ato
r(s)
asso
ciat
edw
ith
Res
ult
Bas
elin
efo
rS
tate
Indic
ator(
s)B
abie
sB
orn
Hea
lthy
Infa
ntM
orta
lity
Rat
eof
dea
ths
occu
rrin
gto
infa
nts
under
7y
ear
ofT
obe
dete
rmin
edfo
rF
Y14
age
Low
Bir
thW
eigh
tT
heper
centa
ge
ofbab
ies
born
atlo
wbi
rth
wei
ght,
wei
ghti
ngle
ssth
an2500
gra
ms
(5.5
pounds)
Hea
lthy
Chi
ldre
nIm
mun
izat
ion
The
per
centa
ge
ofch
ildr
enfu
llyim
mun
ized
byag
etw
o
Chi
ldre
nE
nter
Sch
ool
Rea
dy
toL
earn
Kin
derg
arte
nA
sses
smen
tT
heper
centa
ge
ofki
nder
gart
enst
ud
ents
who
hav
ere
ached
one
ofth
ree
leve
lsof
read
ines
son
the
Wor
kS
ampl
ing
Sys
tem
Kin
derg
arte
nA
sses
smen
t
Chi
ldre
nS
afe
inT
heir
Fam
ilie
san
dC
omm
unit
ies
Chi
ldA
buse
and
Neg
lect
The
rate
ofin
vest
igat
ions
ofch
ild
abu
seor
neg
lect
rule
das
indic
ated
orunsu
bst
anti
ated
All
LM
B’s
mus
tco
mpl
ete
colu
mns
1-3
and
5.C
olum
ns4
and
6m
ust
beco
mpl
eted
asa
part
ofth
eL
MB
’sse
mi-
annu
alan
dan
nual
prog
ram
repo
rt.
Pag
e_1
of_
1_
Rev
ised
04.1
3.09
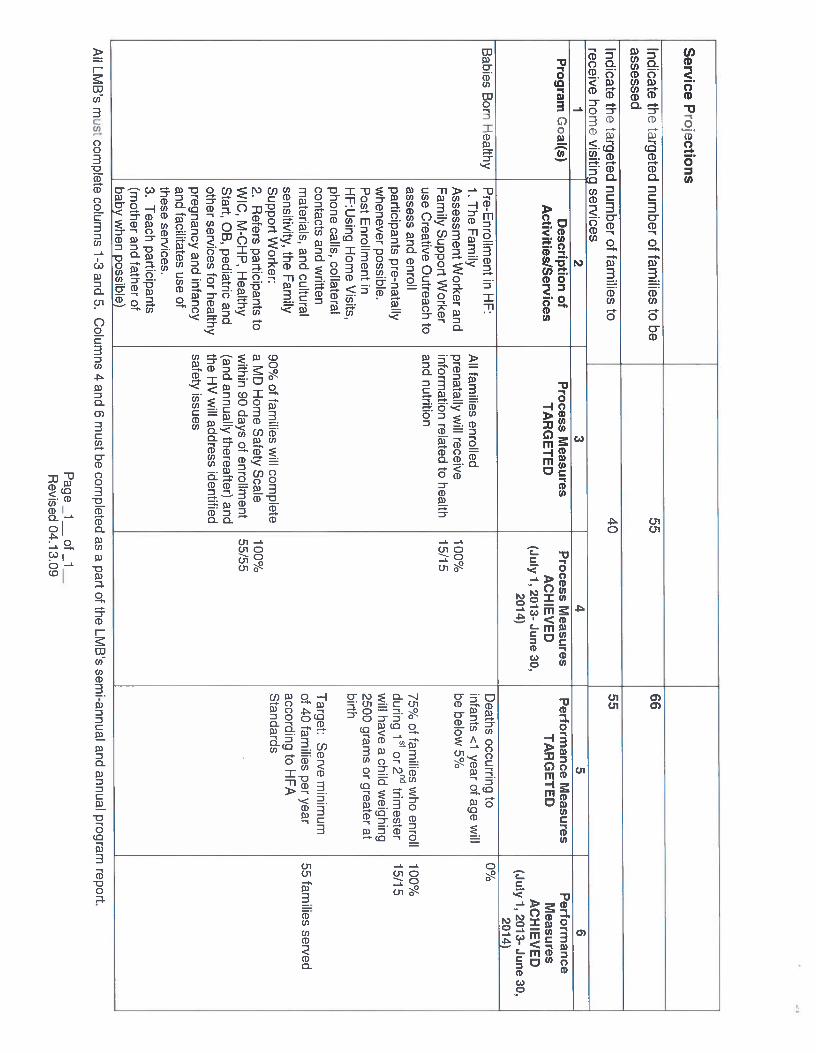
Serv
ice
Pro
jectio
ns
Indicate
the
targ
ete
dnum
ber
offam
iliesto
be
55
66
asse
ssed
Indicate
the
targ
ete
dnum
ber
offam
iliesto
40
55
receive
hom
evisitin
qse
rvic
es
—
23
45
6
Pro
gram
Go
al(s)D
escriptio
nof
Pro
cessM
easures
Pro
cessM
easures
Perfo
rman
ceM
easures
Perfo
rman
ce
Activ
ities/Serv
icesT
AR
GE
TE
DA
CH
IEV
ED
TA
RG
ET
ED
Measu
res(July
1,2013-
June
30,A
CH
IEV
ED
2014)(July
1, 2013-Ju
ne
30,2074)
Bab
iesB
ornH
ealthy
Pre-E
nro
limen
tin
HF:
Death
soccurring
to0%
1.T
he
Fam
ilyA
llfam
iliesenrolled
infants<1
year
ofag
ew
ill
Assessm
ent
Work
eran
dpren
atallyw
illreceiv
e100%
bebelow
5%F
amily
Support
Work
erinform
ationrelated
tohealth
15/15u
seC
reative
Outreach
toan
dnutrition
asse
ssan
denroll
75%of
families
who
enroll100%
particip
ants
pre-n
atallyduring
1stor
2’
trimester
15/15
wh
enev
erpossib
le.w
illh
ave
achild
weighing
Post
Enrollm
entin
2500
gram
sor
greater
at
HF
:Using
Hom
eV
isits,birth
phone
calls,collateral
contacts
and
written
Targ
et:S
erve
minim
um
materials,
and
culturalof
40fam
iliesper
year
55fam
iliesserv
ed
sensitivity,th
eF
amily
accord
ing
toH
FA
Support
Worker:
90%of
families
will
com
plete
Stan
dard
s
2.R
efersp
articipan
tsto
aM
DH
ome
Safety
Scale
100%W
IC,
M-C
HP
,H
ealthyw
ithin90
day
sof
enro
llmen
t55/55
-
Start,
OB
,ped
iatrican
d(and
annually
thereafter)
and
oth
erserv
icesfor
health
yth
eH
Vw
illad
dress
identifiedpreg
nan
cyan
dinfancy
safetyissu
esan
dfacilitates
use
ofth
eseserv
ices.3.
Teach
particip
ants
(mo
ther
and
father
ofb
aby
when
po
ssible)
All
LM
B’s
mu
stco
mplete
colu
mn
s1-3
and
5.C
olu
mns
4an
d6
must
beco
mp
letedas
apart
ofth
eL
MB
’ssem
i-ann
ual
and
ann
ual
pro
gram
report.
Pag
e1
of_
1_
Rev
ised04.1
3.0
9

Gro
win
QG
reat
Kki
s(G
GK
)an
dsu
pp
lem
enta
rycu
rric
ula
onpr
e-na
tal
heal
th,
nutr
ition
and
wel
l-be
ing
for
mot
her
and
baby
,e.
g.bre
astf
eedin
gan
dot
her
topi
cs.
4.T
each
part
icip
ants
GG
Kan
dsu
pp
lem
enta
rycu
rric
ula
onba
byca
rean
dsa
fepa
rent
ing
prac
tice
s,e.
g.pr
even
tion
ofS
hak
enB
aby
Syn
drom
eby
help
ing
par
ent
mak
ea
plan
for
“whe
nba
bycr
ies.
”5.
Ass
ist
part
icip
ants
inac
quir
ing
and
prop
eru
seof
item
sn
eed
edfo
rsa
teba
byca
re,
e.g.
infa
ntca
rse
at.
1.U
sing
GG
Kan
dsu
pp
lem
enta
rycu
rric
ula,
teac
hpa
rtic
ipan
tsab
out
com
plet
ese
ries
ofch
ildh
ood
imm
uniz
atio
nsan
dth
eir
impo
rtan
ceto
child
heal
th.
2.F
acil
itat
evi
sits
toch
ild’s
doct
orto
obta
inim
mun
izat
ions
assc
hed
ule
d.
3.U
sing
prop
erly
signed
rele
ase
ofin
form
atio
n(H
IPP
Aco
mpl
iant
)ob
tain
veri
fica
tion
ofim
m’s
from
Dr.
90%
ofta
rget
chil
dren
will
have
anid
enti
fied
prim
ary
care
prov
ider
bytw
om
onth
sof
age
700%
ofta
rget
chil
dren
wit
hout
heal
thin
sura
nce
will
bere
ferr
edto
MC
HP
10
0%
47/4
7
700%
47/4
7
90%
ofta
rget
chil
dren
will
becu
rren
tw
ithim
mun
izat
ions
thro
ugh
age
two
All
LM
B’s
mus
tco
mpl
ete
colu
mns
1-3
and
5.C
olum
ns4
and
6m
ust
beco
mpl
eted
asa
part
ofth
eL
MB
’sse
mi-
annu
alan
dan
nual
prog
ram
repo
rt.
Pag
e_
1_
of_
1_
Rev
ised
04.1
3.09
Hea
lthy
Chi
ldre
n70
0%47
/47

4.E
nco
urag
eparticipants
tokeep
imm
unizationrecord.
5.H
elpparticipants
maintain
MC
HP
eligibilityfor
costof
child’sm
edicalcare.1.
Adm
inisterA
SQ
andA
SQ
-SE
to100%
oftarg
etchildren
accordingto
programsch
edu
le(at
leastsem
i-annuallythrough
age
2and
annuallythereafter)
andfollow
ingguidelines
foradm
inisteringtools.
2.A
llstaff
administering
AS
Qand
AS
Q-S
Eare
trainedin
use
oftool
beforeusing
with
families.
3.Involve
thep
arents
inrecognition
ofchild’s
development.
4.P
rovideparen
tw
ithadditional
activitiesto
promote
development
andschool
readin
ess.B
asedon
past
experience,estim
atethat
90%of
childrenw
illdev.
ontarget.
5.100%of
paten
tsw
hosechild
issu
spected
ofa
developmental
delayw
illbe
informed
ofthe
availabilityof
MIT
Por
Child
Find.6.
Fam
ilyS
upportW
orkerw
illrefer
childto
%of
childrenw
ithsu
spected
developmental
delayw
how
erereferred
toM
ITP
orC
hildFind
¾of
families
accessing
information
andactivities
desig
ned
toprom
otechild
development
skills
100%2/2
100%55/55
100%of
target
childrenw
illbe
screened
fordevelopm
entaldelays
semi-annually
throughag
e2
andannually
thereafter
¾of
childrendeveloping
ontarg
et
¾of
childrenw
ithsu
spected
developmental
delayw
how
erereferred
toM
ITP
orC
hildFind
%of
families
accessing
information
andactivities
desig
ned
toprom
otepositive
parent-childinteraction
andchild
development
skills
100%47/47
96%45/47
100%2/2
100%5
5/55
All
LM
B’s
must
complete
columns
1-3and
5.C
olumns
4and
6m
ustbe
completed
asa
partof
theL
MB
’ssem
i-annualand
annualprogram
report.
Pag
e_1_
of_1_
Revised
04.13.09
Children
Enter
School
Ready
toL
earn
¾of
childrendeveloping
on96%
target45/47

MIT
Por
Chi
ldFi
ndw
ithpa
rent
’spe
rmis
sion
.7.
Fam
ily
Sup
port
Wor
ker
enco
ura
ges
pare
ntto
dis
cuss
find
ings
orco
nce
rns
abou
tde
velo
pmen
tal
dela
yw
ithch
ild’s
doct
or.
8.F
amil
yS
uppo
rtW
orke
ris
avai
labl
eto
faci
lita
tepa
rent
’spa
rtic
ipat
ion
with
MIT
Por
Chi
ldF
ind.
9.10
0%of
fam
ilie
sw
hoha
ve8
visi
tsor
mor
ew
illre
ceiv
ein
form
atio
non
thes
eto
pics
.10
.F
amil
yS
uppo
rtW
orke
rsof
fer
GG
K,
sup
ple
men
tary
curr
icul
a,R
eady
atF
ive
Act
ivity
Box
esan
dot
her
info
rmat
ion
topr
omot
epo
siti
vepa
rent
-chi
ldin
tera
ctio
nan
dch
ildde
velo
pmen
tsk
ills
.11
.A
tH
ome
Vis
its,
Fam
ily
Sup
port
Wor
kers
mod
elpo
siti
vepa
rent
-ch
ildin
tera
ctio
nan
ddem
onst
rate
acti
viti
es.
12.
100%
ofpa
rtic
ipan
tsar
ein
vite
dto
HF
seas
onal
gat
her
ings
whe
repa
rent
-chi
ldso
cial
izat
ion
and
acti
vity
are
feat
ured
.13
.10
0%of
fam
ilie
sar
egi
ven
atle
ast
one
book
All
LM
B’s
mus
tco
mpl
ete
colu
mns
1-3
and
5.C
olum
ns4
and
6m
ust
beco
mpl
eted
asa
part
ofth
eL
MB
’sse
mi-
annu
alan
dan
nual
prog
ram
repo
rt.
Pag
e_
1o
f_1
_R
evis
ed04
.13.
09

Children
Safe
ntheir
Fam
iliesand
Com
munities
peryear
toencourage
readingw
ithtarget
child.14.
100%of
families
areinform
edof
availabilityof
othercom
munity
resourcesfor
childdevelopm
ent,e.g.,
JudyC
enter,Fam
ilyS
upportC
enter,etc.
15.Fam
ilyS
upportW
orkersencourage
parentinvolvem
entw
itheducational
opportunitiesfor
targetchild
andfacilitate
referral,enrollm
entand
ongoingparticipation
ine.g.
Early
Head
Start,
Head
Start,etc.
1.Fam
ilyS
upportW
orkersoffer
GG
Kand
supplementary
curriculathat
provideinform
ationand
promote
positiveparenting
behaviorto
fosterchild’s
healthand
safety.2.
Family
Support
Worker
with
assistance
fromC
linicalS
upervisorw
illreport
suspectedchild
abu
seand
neglectto
DSS.
3.Fam
ilyS
upportW
orkersadm
inisterM
arylandH
ome
Safety
Checklist
accordingto
¾of
families
accessinginform
ationand
activitiesdesigned
toprom
otepositive
parent-childinteraction
andhealth
andsafety
practices
100%55/55
¾of
families
accessing
information
andactivities
designedto
promote
positivehealth
andsafety
practices
__
__
__
__
__
__
__
__
__
_
policyand
procedure.
___________________________
__
__
__
__
__
__
__
__
__
__
_________________________
__
__
__
_
AllLM
B’s
must
complete
columns
1-3and
5.C
olumns
4and
6m
ustbe
completed
asa
partof
theLM
B’s
semi-annual
andannual
programreport.
Pag
e_1_
of_1_
Revised
04.13.09
100%55/55
100%47/47
90%of
participantsw
ithout“indicated”
childabuse/neglect
findingw
hileenrolled
inH
Fprogram
.

4.F
amil
yS
uppo
rtW
orke
rshe
lpfa
mil
ies
bec
om
eco
mpl
iant
with
Hom
eS
afet
yw
hen
poss
ible
,e.
g.pr
ovid
eP
oiso
nC
ontr
olin
form
atio
n,g
ates
,sm
oke
alar
ms,
gun
lock
set
c.5.
Fam
ily
Sup
port
Wor
kers
com
plet
e“L
ifeSk
ills
Pro
gres
sion
”pe
r
_______
_____________
prot
ocol
__
__
__
__
__
__
__
__
__
__
__
__
__
__
__
__
__
__
__
__
__
__
__
__
___
____
____
____
____
____
___
__
__
__
All
LM
B’s
mus
tco
mpl
ete
colu
mns
1-3
and
5.C
olum
ns4
and
6m
ust
beco
mpl
eted
asa
part
ofth
eL
MB
’sse
mi-
annu
alan
dan
nual
prog
ram
repo
rt.
Pag
e_1
of_1
Rev
ised
04.1
3.09

Healthy Families Mid-Shore
Annual Summaries
FY2014


Queen Anne’s Co. Dept. of Health Talbot County Health Department Kent County Health Department
Annual Report to the Community-Queen Anne’s CountyJuly 7, 2073 — June 30, 2074
Target Population and Objectives
Healthy Families Mid-Shore is an evidence-based program that provides intensive prevention and early interventionservices to first-time parents, residing in Queen Anne’s, Talbot or Kent Counties, eligible for Maryland Children’sHealth Program (MCHP) and at risk because of their own history of abuse as a child, current or past mental illness,substance abuse, anger control problems, inadequate support, high stress, limited knowledge about childdevelopment and other risk factors.
The first objective of Healthy Families is to reduce the occurrence of child abuse and neglect in families at risk. Thesecond objective is to build the capacity of first time parents to raise a young child who will have the social,emotional, language and learning skills to be “ready for school” when they reach kindergarten age. Braindevelopment in the early years affects learning for a lifetime.
Proçram Summary
Families’ risk factors are assessed during an interview that follows a research-based set of questions. Eligiblefamilies are offered Healthy Families and voluntarily engage in an intensive, strength-based home visiting servicethat begins prenatally and continues until the target child starts school. Extensively trained home visitors (FamilySupport Workers) utilize the “Growing Great Kids” evidence-based curriculum, build a trusting, sustained relationshipwith the participants, conduct health and developmental screens, refer to other needed services, help familiesdevelop and achieve goals, and model positive parenting skills.
What and How Much We Did in Fiscal Year 2014
• Served 55 first time parents who requested extra support during their children’s early years.
49% were Caucasian 35% were African American 96 % were unmarried13% were Spanish speaking 4% was Multi-Racial 45 % did not graduate from high school
22 ¾ had symptoms of depression
• Served 47 target infants and children under 5.• Made 806 home visits and shared exciting information about how children’s brains develop.• Conducted 122 developmental screens to make sure child development is on target.• Made 225 referrals to other community services including follow-ups for developmental delays.
Families and Children Are Better Off
• As of June 30, 2014, 100% of the children in the program were current on their immunizations.• Healthy Families parents report that they know more about children’s brain development—and 11
other parenting areas-- now than they did before Healthy Families.
Thanks to: Queen Anne’s County Community Partnerships for Families and Children ,Talbot Family Network, Family & CommunityPartnerships of Kent County & Governor’s Oftice for Children
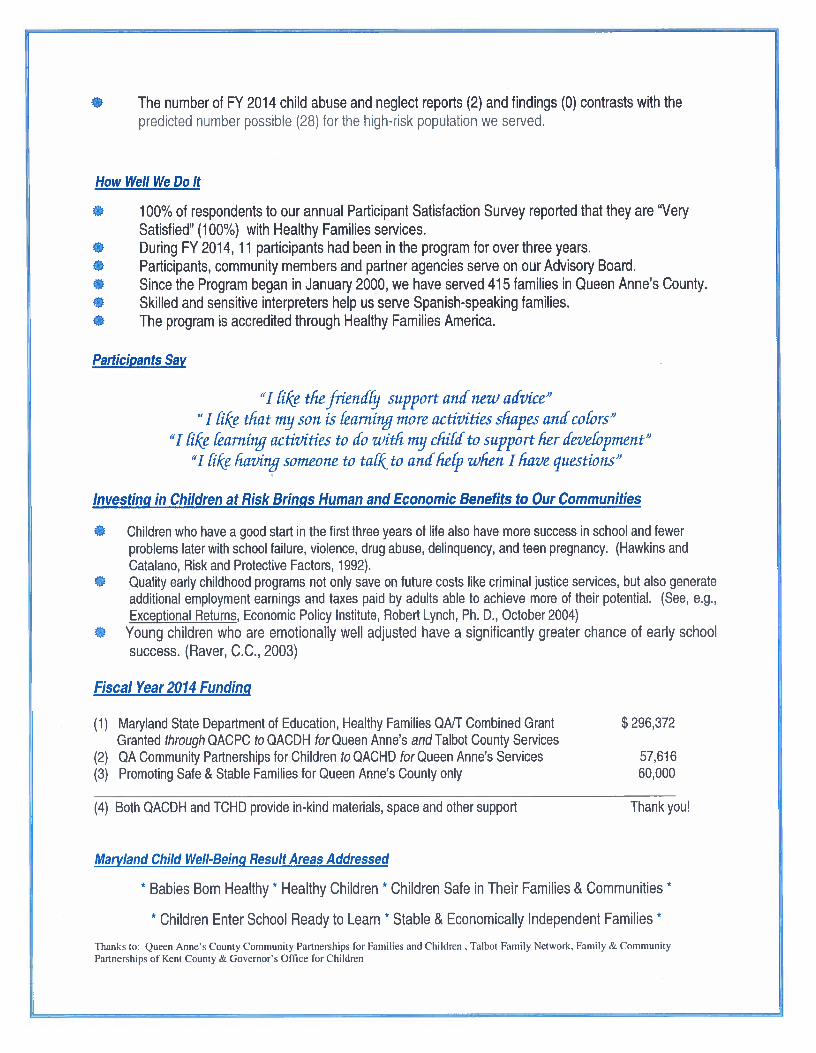
• The number of FY 2014 child abuse and neglect reports (2) and findings (0) contrasts with thepredicted number possible (28) for the high-risk population we served.
How Well We Do It
• 100% of respondents to our annual Participant Satisfaction Survey reported that they are “VerySatisfied” (100%) with Healthy Families services.
• During FY 2014, 11 participants had been in the program for over three years.• Participants, community members and partner agencies serve on our Advisory Board.• Since the Program began in January 2000, we have served 415 families in Queen Anne’s County.• Skilled and sensitive interpreters help us serve Spanish-speaking families.• The program is accredited through Healthy Families America.
Participants Say
aj hf?..e tltefriendfg support ané new aévice”
I liIe that my son is learning more activities shapes anécothrs”
“I li/e learning activities to 6o with mq chile to support her éevethpment”‘7 like having someone to taUt to anéhelp when I have questions”
Investing in Children at Risk Brings Human and Economic Benefits to Our Communities
• Children who have a good start in the first three years of life also have more success in school and fewerproblems later with school failure, violence, drug abuse, delinquency, and teen pregnancy. (Hawkins andCatalano, Risk and Protective Factors, 1992).
• Quality early childhood programs not only save on future costs like criminal justice services, but also generateadditional employment earnings and taxes paid by adults able to achieve more of their potential. (See, e.g.,Exceptional Returns, Economic Policy Institute, Robert Lynch, Ph. D., October 2004)
• Young children who are emotionally well adjusted have a significantly greater chance of early schoolsuccess. (Raver, C.C., 2003)
Fiscal Year 2074 Funding
(1) Maryland State Department of Education, Healthy Families QA/T Combined Grant $296,372Granted through QACPC to QACDH for Queen Anne’s and Talbot County Services
(2) QA Community Partnerships for Children to QACHD for Queen Anne’s Services 57,616(3) Promoting Safe & Stable Families for Queen Anne’s County only 60,000
(4) Both QACDH and TCHD provide in-kind materials, space and other support Thank you!
Maryland Child Well-Being Result Areas Addressed
* Babies Born Healthy * Healthy Children * Children Safe in Their Families & Communities *
* Children Enter School Ready to Learn * Stable & Economically Independent Families *
Thanks to: Queen Anne’s County Community Partnerships for Families and Children ,Talbot Family Network, Family & CommunityPartnerships of Kent County & Governor’s Office for Children

Queen Anne’s Co. Dept. of Health Talbot County Health Department Kent County Health Departmentç id?J)
Annual Report to the Community-Talbot CountyJuly 1, 2013 — June 30, 2014
Target Population and Oblectives
Healthy Families Mid-Shore is an evidence based program that provides intensive prevention and early interventionservices to first-time parents, residing in Queen Anne’s, Talbot or Kent Counties, eligible for Maryland Children’sHealth Program fMCHP) and at risk because of their own history of abuse as a child, current or past mental illness,substance abuse, anger control problems, inadequate support, high stress, limited knowledge about childdevelopment and other risk factors.
The first objective of Healthy Families is to reduce the occurrence of child abuse and neglect in families at risk. Thesecond objective is to build the capacity of first time parents to raise a young child who will have the social,emotional, language and learning skills to be “ready for school” when they reach kindergarten age. Braindevelopment in the early years affects learning for a lifetime.
Program Summary
Families’ risk factors are assessed during an interview that follows a research-based set of questions. Eligiblefamilies are offered Healthy Families and voluntarily engage in an intensive, strength-based home visiting servicethat begins prenatally and continues until the target child starts school. Extensively trained home visitors (FamilySupport Workers) utilize the “Growing Great Kids” evidence-based curriculum, build a trusting, sustained relationshipwith the participants, conduct health and developmental screens, refer to other needed services, help familiesdevelop and achieve goals, and model positive parenting skills.
What and How Much We Did in Fiscal Year 2014
• Served 48 first time parents who requested extra support during their children’s early years.
23% were Caucasian 13% were African American 98% were unmarried42% were Spanish speaking 2% was Multi-Racial 33 % did not graduate from high school
13 % had symptoms of depression• Served 40 target infants and children under 5.• Made 670 home visits and shared exciting information about how children’s brains develop.• Conducted 133 developmental screens to make sure child development is on target.• Made 198 referrals to other community services including two for developmental delays.
Families and Children Are Better Off
• As of June 30, 2014, 100% of the children in the program were current on their immunizations.
Thanks to: Queen Anne’s County Community Partnerships for Families and Children . Talbot family Network, Family & CommunityPartnerships of Kent County & Governor’s Office for Children

• Healthy Families parents report that they know more about children’s brain development—and 11other patenting areas-- now than they did before Healthy Families.
• The number of FY 2014 child abuse and neglect reports (0) and tindings (0) contrasts with thepredicted number possible (12) for the high-risk population we served.
How Well We Do it
• 100% of respondents to our annual Participant Satisfaction Survey reported that they are VerySatisfied” (97%) or “Satisfied” (3%) with Healthy Families services.
• During FY 2014, 8 participants had been in the program for over three years.• Participants, community members and partner agencies serve on our Advisory Board.• Since the Program began in January 2000, we have served 373 families in Talbot County.• An Interpreter/Translator for the 3 counties help us serve Spanish-speaking families.• The program is accredited through Healthy Families America.
Participants Say
I liIe the way my home vLcitorgives me information that I undistan&’‘1 likç the eéucationalactivitiesfor my chu[é’
“‘I life when thfferentfamilies come togetherforgroups”“I liIc that my home visitor answers allofmy questions”
Investing in Children at Risk Brings Human and Economic Benefits to Our Communities
• Children who have a good start in the first three years of life also have more success in school and fewerproblems later with school failure, violence, drug abuse, delinquency, and teen pregnancy. (Hawkins andCatalano, Risk and Protective Factors, 1992).
• Quality early childhood programs not only save on future costs like criminal justice services, but also generateadditional employment earnings and taxes paid by adults able to achieve more of their potential. (See, e.g.,Exceptional Returns, Economic Policy Institute, Robert Lynch, Ph. D., October 2004)
• Young children who are emotionally well adjusted have a significantly greater chance of early schoolsuccess. (Raver, C.C., 2003)
Fiscal Year2OJ4 Funding(1) Maryland State Department of Education, Healthy Families QNT Combined Grant $ 296,372
Granted through QACPC to QACDH for Queen Anne’s and Talbot County Services(2) Talbot Family Network t0TCHD forTalbot County Services 82,424
(3) Both QACDH and TCHD provide in-kind materials, space and other support Thank youl
Maryland Child Well-Being Result Areas Addressed
* Babies Born Healthy * Healthy Children * Children Safe in Their Families & Communities *
* Children Enter School Ready to Learn * Stable & Economically Independent Families *
Thanks to: Queen Anne’s County Community Partnerships for Families and Children ,Talbot Family Network, Family & CommunityPartnerships of Kent Cotinty & Governor’s Oftice for Children

Queen Anne’s Co. Dept. of Health Talbot County Health Department Kent County Health Department\] Fa,,,
Annual Report to the Community-Kent CountyJuly 7, 2073 — June 30, 2074
Target Population and Oblectives
Healthy Families Mid-Shore is an evidence based program that provides intensive prevention and early interventionservices to first-time parents, residing in Queen Anne’s, Talbot or Kent Counties, eligible for Maryland Children’sHealth Program (MCHP) and at risk because of their own history of abuse as a child, current or past mental illness,substance abuse, anger control problems, inadequate support, high stress, limited knowledge about childdevelopment and other risk factors.
The first objective of Healthy Families is to reduce the occurrence of child abuse and neglect in families at risk. Thesecond objective is to build the capacity of first time parents to raise a young child who will have the social,emotional, language and learning skills to be “ready for school” when they reach kindergarten age. Braindevelopment in the early years affects learning for a lifetime.
Program Summary
Families’ risk factors are assessed during an interview that follows a research-based set of questions. Eligiblefamilies are offered Healthy Families and voluntarily engage in an intensive, strength-based home visiting servicethat begins prenatally and continues until the target child starts school. Extensively trained home visitors (FamilySupport Workers) utilize the “Growing Great Kids” evidence-based curriculum, build a trusting, sustained relationshipwith the participants, conduct health and developmental screens, refer to other needed services, help familiesdevelop and achieve goals, and model positive parenting skills. This program expanded to Kent County on July 1,2013. This is the program’s first full year of data below.
What and How Much We Did in Fiscal Year 2074
* Served 28 first time parents who requested extra support during their children’s early years.
45% were Caucasian 36% were African American 96% were unmarried14 % were Spanish speaking 5% was Multi-Racial 46% did not graduate from high school
13 % had symptoms of depression• Served 20 target infants and children under 5.• Made 390 home visits and shared exciting information about how children’s brains develop.• Conducted 26 developmental screens to make sure child development is on target.* Made 94 referrals to other community services including two for developmental delays.
Thanks to: Queen Anne’s County Community Partnerships for Families and Children ,Talbot Family Network, Family & CommunityPartnerships of Kent County & Governor’s Office for Children

Families and Children Are Better Oft
• As of June 30, 2014, 100% of the children in the program were current on their immunizations.• The number of FY 2014 child abuse and neglect reports (0) and findings (0) contrasts with the
predicted number possible (15) for the high-risk population we served.
How Well We Do It
• 100% of respondents to our annual Participant Satisfaction Survey reported that they are “VerySatisfied” (85%) or “Satisfied” (15%) with Healthy Families services.
• Participants, community members and partner agencies serve on our Advisory Board.• Since the Program began on July 1, 2013, we have served 28 families in Kent County.• An Interpreter/Translator for the 3 counties help us serve Spanish-speaking families.
Participants Say
“I lilç allof the information antftlw eéucationalvitleos”“I like having someone to talk to ané the help Iget”
“I (ikç the helpful resources/info, anétlie activities to éo with your chil&’‘I tiI,e the books, surveys on chi[d’development, things to hetp teach my thil&’
Investing in Children at Risk Brings Human and Economic Benefits to Our Communities
• Children who have a good start in the first three years of life also have more success in school and fewerproblems later with school failure, violence, drug abuse, delinquency, and teen pregnancy. (Hawkins andCatalano, Risk and Protective Factors, 1992).
• Quality early childhood programs not only save on future costs like criminal justice services, but also generateadditional employment earnings and taxes paid by adults able to achieve more of their potential. (See, e.g.,Exceptional Returns, Economic Policy Institute, Robert Lynch, Ph. D., October 2004)
• Young children who are emotionally well adjusted have a significantly greater chance of early schoolsuccess. (Raver, C.C., 2003)
Fiscal Year 2014 Funding(1) Maryland State Department of Education, Healthy Families Kent County 60,824(2) Family & Community Partnerships of Kent County- LMB 93,291
(3) QACDOH & KCHD provide in-kind materials, space and other support Thank you!
Maryland Child Well-Being Result Areas Addressed
* Babies Born Healthy * Healthy Children * Children Safe in Their Families & Communities *
* Children Enter School Ready to Learn * Stable & Economically Independent Families *
Thanks to: Queen Anne’s County Community Partnerships for Families and Children Talbot Family Network, Family & CommunityPar nerships of Kent County & Governor’s Office for Children

Queen Anne’s Co. Dept. of Health Talbot County Health Department Kent County Health Department
Annual Report to the Community- Mid-ShoreJuly 7, 2073— June 30, 2014
Target Population and Oblectives
Healthy Families Mid-Shore is an evidence-based program that provides intensive prevention and early interventionservices to first-time parents, residing in Queen Anne’s, Talbot or Kent Counties, eligible for Maryland Children’sHealth Program (MCHP) and at risk because of their own history of abuse as a child, current or past mental illness,substance abuse, anger control problems, inadequate support, high stress, limited knowledge about childdevelopment and other risk factors.
The first objective of Healthy Families is to reduce the occurrence of child abuse and neglect in families at risk. Thesecond objective is to build the capacity of first time patents to raise a young child who will have the social,emotional, language and learning skills to be ‘ready for school” when they reach kindergarten age. Braindevelopment in the early years affects learning for a lifetime.
Program Summary
Families’ risk factors are assessed during an interview that follows a research-based set of questions. Eligiblefamilies are offered Healthy Families and voluntarily engage in an intensive, strength-based home visiting servicethat begins prenatally and continues until the target child starts school. Extensively trained home visitors (FamilySupport Workers) utilize the “Growing Great Kids” evidence-based curriculum, build a trusting, sustained relationshipwith the participants, conduct health and developmental screens, refer to other needed services, help familiesdevelop and achieve goals, and model positive patenting skills.
What and How Much We Did in Fiscal Year 2074
• Served 126 first time parents who requested extra support during their children’s early years.41% were Caucasian 32% were African American 96 % were unmarried23% were Spanish speaking 3% was Multi-Racial 47 ¾ did not graduate from high school
16 % had symptoms of depression• Served a total of 107 infants and children under 5.• Made 1556 home visits and shared exciting information about how children’s brains develop.• Conducted 281 developmental screens to make sure child development is on target.• Made 517 referrals to other community services including two for developmental delays.
Families and Children Are Better Off
• As of June 30, 2014, 100% of the children in the program were current on their immunizations.• Healthy Families parents report that they know more about children’s brain development—and 11
other parenting areas-- now than they did before Healthy Families.• The number of FY 2014 child abuse and neglect reports (3) and findings (0) contrasts with the
predicted number possible (55) for the high-risk population we served.Thanks to: Queen Anne’s County Community Partnerships for Families and Children . Talbot Family Network. Family & CommunityPartnerships of Kent County & Governor’s Office for Children

Healthy Families Mid-Shore
How Well We Do It
• 100% of respondents to our annual Participant Satisfaction Survey reported that they are Very
Satisfied” ( 96%) or “Satisfied” (4%) with Healthy Families services.• During FY 2014, 19 participants had been in the program for over three years.• Participants, community members and partner agencies serve on our Advisory Board.• Since the Program began in January 2000, we have served nearly 850 families.• A bi-lingual home visitor and interpreters help us serve Spanish-speaking families.• We continue to be a credentialed site through Healthy Families America.
Participants SayI ¶çç the InfonnaHon am!support Iget”
“‘I liIe evenjthing about the program”“it helps me unéerstané about thi1! 6evethpmente
“I lilçç the unbiaseésupport and educational resources”I li1e that itfocuses on many aspects ofchilehealth”
Investing in Children at Risk Brings Human and Economic Benefits to Our CommunitiesPAYNOWOR PAYLATER
• Children who have a good start in the first three years of life also have more success in school and fewerproblems later with school failure, violence, drug abuse, delinquency, and teen pregnancy. (Hawkins andCatalano, Risk and Protective Factors, 1992).
• Quality early childhood programs not only save on future costs like criminal justice services, but also generateadditional employment earnings and taxes paid by adults able to achieve more of their potential. (See, e.g.,Exceptional Returns, Economic Policy Institute, Robert Lynch, Ph. D., October 2004)
• Research has demonstrated that supporting healthy early childhood development from birth through age 5produces substantial educational, social and financial benefits for children and their communities.
• Young children who are emotionally well adjusted have a significantly greater chance of early schoolsuccess. (Raver, C.C., 2003)
Fiscal Year 2074 Funding
(1) Maryland State Department of Education, Healthy Families QA/T Combined Grant $296,372Granted through QACPC to QACDH for Queen Anne’s and Talbot County Services
(2) QA Community Partnerships for Children to QACHD forQueen Anne’s Services $57,616(3) Talbot Family Network to TCHD for Talbot County Services $82,424(4) Promoting Safe & Stable Families for Queen Anne’s County only $60,000(5) Maryland State Department of Education for Kent County $60,824(6) Family & Community Partnerships of Kent County for Kent County $93,291
(5) QACDH, TCHD. KCHD provide in-kind materials, space and other support Thank you!
Maryland Child Well-Being Result Areas AddressedThanks tO: Queen Anne’s County Community Partnerships for Families and Children , Talbot Family Network, Family & CommunityPartnerships of Kent County & Governor’s Office for Children