2014 – 2015 evaluation of the boys & girls clubs of metro ... · 2014 – 2015 evaluation of...
TRANSCRIPT

2014 – 2015 Evaluation of the Boys & Girls Clubs of Metro Denver

2014 – 2015 Evaluation of the Boys & Girls Clubs of Metro Denver
For more information, please contact:
Jean Denious, PhD
303/839-9422 Ext. 121
For General Inquiries/Questions
p. 303-839-9422
f. 303-839-9420
OMNI Institute
899 Logan Street, Suite 600
Denver, CO 80203
www.omni.org

Table of Contents Introduction ....................................................................................................................................................... 3
Data Sources ................................................................................................................................................. 4
BGCMD Club Attendance and Demographic Data .......................................................................... 4
NYOI Survey Data ................................................................................................................................... 4
DPS School Data ...................................................................................................................................... 4
SAYO Data ................................................................................................................................................ 4
Sexual Health Program Participation Data ......................................................................................... 5
Analytical Approach .................................................................................................................................... 5
Control Variables ..................................................................................................................................... 6
Statistical Significance ............................................................................................................................ 6
Results Section 1: Analysis of 2014-15 Outcomes for the Core Sample ............................................. 8
Description of the Core Sample ................................................................................................................ 8
Description of Analyses .............................................................................................................................. 9
Outcomes for the Core Sample by Club Attendance Frequency....................................................... 9
NYOI Survey Outcomes by Club Attendance .................................................................................. 10
SAYO Outcomes for the Core Sample by Club Attendance ......................................................... 11
DPS School Outcomes for the Core Sample by Club Attendance .............................................. 11
DPS School Outcomes for the Core Sample by Club Attendance and Grade Level .................... 14
Relationship between DPS School Outcomes and NYOI Survey Outcomes for the Core Sample
....................................................................................................................................................................... 16
Results Section 2: Analysis of 2014-15 Outcomes by Sexual Health Program Participation ........ 17
Description of Sample ............................................................................................................................... 17
Description of Analyses ............................................................................................................................ 18
Outcomes by Sexual Health Program Participation ........................................................................... 18
NYOI Survey Outcomes by Sexual Health Program Participation .............................................. 18
SAYO Survey Outcomes by Sexual Health Program Participation ............................................. 19
DPS School Outcomes by Sexual Health Program Participation ................................................. 20
Results Section 3: 2015 DPS School Outcomes for Club vs. Comparison Youth ............................. 22
Description of the Sample ........................................................................................................................ 22
Description of Analyses ............................................................................................................................ 22
Results Section 4: Change in Outcomes 2014 – 2015 .......................................................................... 24
Description of the Sample ........................................................................................................................ 24
Description of Analyses ............................................................................................................................ 24
Change in NYOI Survey Outcomes .................................................................................................... 24
Change in DPS School Outcomes ...................................................................................................... 25
Results Section 5: Change in Outcomes 2013-2015.............................................................................. 26
Description of the Sample ........................................................................................................................ 26

Prepared by OMNI Institute ii
Description of Analyses ............................................................................................................................ 26
Change in DPS School Outcomes ...................................................................................................... 26
Conclusions and Next Steps ........................................................................................................................ 28
Summary of Key Findings ........................................................................................................................ 28
Limitations ................................................................................................................................................... 28
Recommendations ..................................................................................................................................... 29
Appendix I: NYOI Survey Scales and Items ........................................................................................... XXX
Appendix II: SAYO Scales and Items ......................................................................................................... XLI
Program Experiences Scales ............................................................................................................... XLI
Sense of Competence Scales ............................................................................................................ XLII
Future Planning and Expectations Scales (Grades 6-12 only) .................................................. XLIV
Appendix III: Detailed Data Tables .......................................................................................................... XLV

Prepared by OMNI Institute iii
Figures Figure 1: Survey Outcomes for the Core Sample that Differ by 2015 Club Attendance Frequency
........................................................................................................................................................................... 11
Figure 2: Average School Attendance by Club Attendance Frequency ............................................. 12
Figure 3: Suspensions by Club Attendance Frequency .......................................................................... 13
Figure 4: Behavior Incidents by Club Attendance Frequency .............................................................. 13
Figure 5: PARCC Math Proficiency by Club Attendance Frequency .................................................. 14
Figure 6: NYOI Survey Outcomes that Differ by 2015 Sexual Health Participation ....................... 19
Figure 7: SAYO Survey Outcomes by 2015 Sexual Health Participation ........................................... 20
Figure 8: Average School Attendance by Sexual Health Program Participation ............................... 21
Figure 9: School Outcomes by Club Participation................................................................................... 23
Figure 10: Change in School Attendance Rate, 2014 to 2015 ............................................................. 25
Figure 11: Change in School Attendance Rate, 2012-13 to 2014-15 ................................................ 27
Prepared by OMNI Institute
1
Tables Table 1: Club Representation for the Core Sample .................................................................................. 8
Table 2: Club Member Gender by Grade Level for the Core Sample .................................................... 9
Table 3: Club Member Race/Ethnicity by Grade Level for the Core Sample ...................................... 9
Table 4: Summary of NYOI Survey Outcomes for the Core Sample by Club Attendance
Frequency ........................................................................................................................................................ 10
Table 5: Summary of SAYO Survey Results by Club Attendance Frequency .................................... 11
Table 6: Summary of DPS Survey Results by Club Attendance Frequency ....................................... 12
Table 7: Average School Attendance by Club Attendance Frequency and Grade Level ................ 14
Table 8: Proportion of Club Members Proficient on the PARCC English Test, by Club Attendance
Frequency and Grade Level ......................................................................................................................... 15
Table 9: Proportion of Club Members Proficient on the PARCC Math Test, by Club Attendance
Frequency and Grade Level ......................................................................................................................... 15
Table 10: Correlations between 2015 School and NYOI Survey Outcomes ..................................... 16
Table 11: Club Member Gender by Grade Level for Sexual Health Program Participants ............. 17
Table 12: Club Member Race/Ethnicity by Grade Level for Sexual Health Program Participants 17
Table 13: Club Representation for Sexual Health Program Participants ............................................ 18
Table 14: Summary of NYOI Survey Results by Sexual Health Participation .................................... 18
Table 15: Summary of SAYO Survey Results by Sexual Health Program Participation .................. 19
........................................................................................................................................................................... 20
Table 16: Summary of Survey Results by Sexual Health Program Participation .............................. 20
........................................................................................................................................................................... 21
Table 17: Summary of School Outcomes by Club Participation (Members vs. Nonmembers) ...... 22
Table 18: Change in NYOI Survey Outcomes, 2014 to 2015 ............................................................... 24
Table 19: Change in School Outcomes, 2014 to 2015 .......................................................................... 25
Table 20: Change in School Outcomes, 2012 to 2015 .......................................................................... 27
Table 21: 2015 Survey Outcomes by Club Attendance Frequency ................................................. XLV
Table 22: 2015 School Outcomes by Club Attendance Frequency ................................................. XLV
Table 23: 2015 Survey Outcomes by Sexual Health Participation ................................................. XLVI
Table 24: 2015 School Outcomes by Sexual Health Participation ................................................. XLVI
Table 25: Differences between Club Members and Nonmembers in 2015 School Outcomes XLVII
Table 26: Two-Year Change in Survey Outcomes, 2014 to 2015 ................................................. XLVII
Prepared by OMNI Institute 2
Table 27: Two-Year Change in School Outcomes, 2014 to 2015 .................................................. XLVII
Table 28: Three-Year Change in School Outcomes, 2012-13 to 2014-15 .................................. XLVIII
Table 29: Correlations between 2015 Survey Outcomes and 2014-15 School Outcomes ..... XLVIII

Prepared by OMNI Institute 3
Introduction Since 2005, the Boys & Girls Clubs of Metro Denver (BGCMD) have partnered with OMNI
Institute (OMNI) to conduct longitudinal and cross-sectional evaluation efforts that are
systematic and examine overall Club impact on a broad range of desired outcomes. BGCMD
targets high-risk youth who are exposed to numerous risk factors, including substance use and
abuse, gang activity, delinquency, crime, and low graduation rates. To counter these risk factors,
the Clubs regularly offer programs related to academic achievement, leadership, self-esteem
building, and healthy living. The Clubs also strive to offer a safe and supporting monitored
environment as an alternative to youth being unsupervised at home or when out with friends.
In 2015, the Boys & Girls Clubs of America (BGCA) partnered with local Clubs to administer the
National Youth Outcomes Initiative (NYOI) survey to Club members across the United States.
BGCMD was funded to participate in the national evaluation, and therefore utilized the NYOI
survey for their local evaluation. BGCMD also partnered with Denver Public Schools (DPS) to
obtain academic outcome data for a subset of Club members and a group of comparison
students who did not attend the Clubs. The goal of the BGCMD evaluation is to answer these
primary questions:
1. Do youth who attend the Club frequently have better school and NYOI socio-
emotional outcomes than youth who attend less frequently?
2. Do Club members who participate in Sexual Health programming have better school
and NYOI socio-emotional outcomes than members who do not participate?
3. How do school outcomes for Club members compare to similar youth who did not
attend the Clubs?
To allow for a deeper understanding of outcomes for youth who attend the Club, this year’s
evaluation investigated the following additional questions:
1. Are there grade-level differences in school outcomes for Club members, and how do
they compare to grade-level differences for similar youth who did not attend the
Clubs?
2. How do outcomes change over time for Club members with consecutive years of data?
Outcomes of interest reflect the Boys & Girls Clubs’ goals of fostering academic success,
promoting good character and citizenship, and promoting healthy lifestyles. Several data sources
were utilized to answer the evaluation questions; each source is described below.
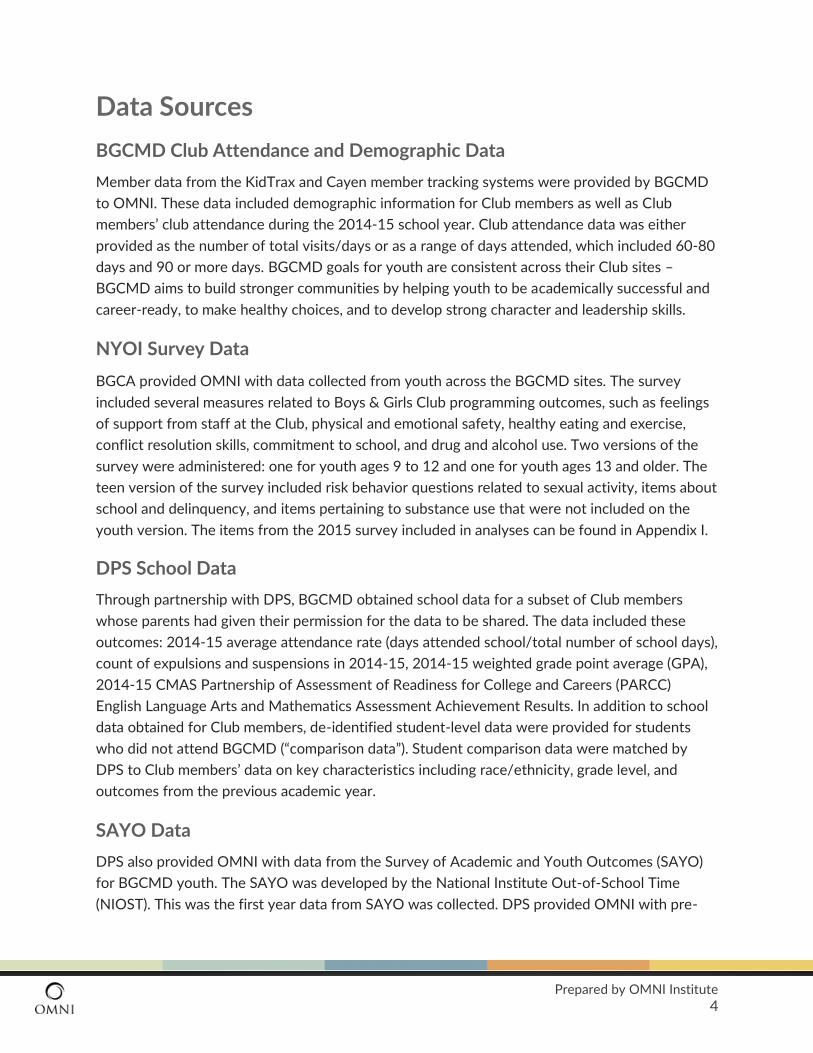
Prepared by OMNI Institute 4
Data Sources
BGCMD Club Attendance and Demographic Data
Member data from the KidTrax and Cayen member tracking systems were provided by BGCMD
to OMNI. These data included demographic information for Club members as well as Club
members’ club attendance during the 2014-15 school year. Club attendance data was either
provided as the number of total visits/days or as a range of days attended, which included 60-80
days and 90 or more days. BGCMD goals for youth are consistent across their Club sites –
BGCMD aims to build stronger communities by helping youth to be academically successful and
career-ready, to make healthy choices, and to develop strong character and leadership skills.
NYOI Survey Data
BGCA provided OMNI with data collected from youth across the BGCMD sites. The survey
included several measures related to Boys & Girls Club programming outcomes, such as feelings
of support from staff at the Club, physical and emotional safety, healthy eating and exercise,
conflict resolution skills, commitment to school, and drug and alcohol use. Two versions of the
survey were administered: one for youth ages 9 to 12 and one for youth ages 13 and older. The
teen version of the survey included risk behavior questions related to sexual activity, items about
school and delinquency, and items pertaining to substance use that were not included on the
youth version. The items from the 2015 survey included in analyses can be found in Appendix I.
DPS School Data
Through partnership with DPS, BGCMD obtained school data for a subset of Club members
whose parents had given their permission for the data to be shared. The data included these
outcomes: 2014-15 average attendance rate (days attended school/total number of school days),
count of expulsions and suspensions in 2014-15, 2014-15 weighted grade point average (GPA),
2014-15 CMAS Partnership of Assessment of Readiness for College and Careers (PARCC)
English Language Arts and Mathematics Assessment Achievement Results. In addition to school
data obtained for Club members, de-identified student-level data were provided for students
who did not attend BGCMD (“comparison data”). Student comparison data were matched by
DPS to Club members’ data on key characteristics including race/ethnicity, grade level, and
outcomes from the previous academic year.
SAYO Data
DPS also provided OMNI with data from the Survey of Academic and Youth Outcomes (SAYO)
for BGCMD youth. The SAYO was developed by the National Institute Out-of-School Time
(NIOST). This was the first year data from SAYO was collected. DPS provided OMNI with pre-

Prepared by OMNI Institute 5
test and post-test scores for eight SAYO scales. These scales and the items that comprise each
scale can be found in Appendix II. Scale scores range from 1-4, with 4 being the highest and most
desirable rating.
Sexual Health Program Participation Data
In addition to Club attendance data, BGCMD provided OMNI with Sexual Health program
participation rosters. These rosters indicated youth who participated in one or more Sexual
Health activities/programs. Sexual Health program participation was analyzed based on whether
or not Club members had participated in Sexual Health programming (Participation in Sexual
Health programming vs. No Participation in Sexual Health programming).
Analytical Approach Previous BGCMD evaluation efforts have determined that analyses based on length of Club
membership were not beneficial over and above analyses based on number of days spent at the
Club. That is, membership length alone has not been shown to distinguish youth outcomes, likely
due to the fact that participation levels vary greatly across youth regardless of how long they
have been members. It is also important to note that past evaluations have taken a broader
approach by including data from as many youth as possible across multiple school districts.
These approaches had several limitations, including large amounts of missing data, inability to
compare school outcomes across school districts due to dissimilar matching processes, and
inability to link school data to survey data.
Starting in 2014, the evaluation approach was consequently streamlined by focusing primarily on
a targeted group of youth, those with at least 60 days of attendance and DPS school data, in
order to enable a more sound examination of relationships of Club engagement and school and
socio-emotional outcomes. Specifically, Club members were included in the evaluation only if
they attended the Club 60 days or more and had DPS school data, with the exception of Section
2: Analysis of 2014-15 Outcomes by Sexual Health Program Participation. Section 2 does not
have the additional criteria of having DPS school data since the majority of youth who
participated in Sexual Health programming were in non-DPS BGCMD program sites1.
Some analyses also examined differences in outcomes among members who attended the Club
moderately frequently (60 – 89 days) or frequently (90+ days). The groups were created based
on cut off points of interest to BGCMD.
1 BGCMD sites that provided data for Sexual Health Program Participation included Denver Broncos, William E. Cope, J. Churchill Owen, George M. Wifley, Suncore (previously Commerce City), Jack A. Vickers, Robert M. Shopneck, and Jefferson County.

Prepared by OMNI Institute 6
Using Club IDs and DPS Student IDs, data were merged across the data sources noted above as
well as with previous years of data in order to create a final file for analysis. Resulting sample
sizes for analyses are included at the beginning of each reporting section.
Analyses were conducted on level of Club participation, as measured by the number of days
members attended the Club during the 2014-15 school year.
Club Attendance and Demographic Data: BGCMD provided Club attendance and demographic
data for youth who attended the Club 60 days or more (N = 1744).
DPS School Data: DPS school data were matched to BGCMD Club attendance and demographic
data which resulted in 591 matched records. This group of youth is considered the “core sample”
and comprises the primary group of youth included in the evaluation.
NYOI Survey Data: The core sample (i.e., youth with Club attendance and school data) was
merged with 1,528 NYOI survey respondents which resulted in 447 matched records. Analyses
focusing on NYOI outcomes included the 447 youth from this sample.
SAYO Data: Analyses focusing on SAYO outcomes in section 1 included participants in the “core
sample” who also completed the SAYO survey consisting of 276 matched records. Analyses
examining SAYO outcomes in Section 2 included participants who reported 60 or more days of
Club attendance, participated in the Sexual Health programming, and completed the SAYO
survey (431 matched records).
Sexual Health Program Data: Sexual Health Program rosters were matched to Club Membership
and Attendance, which resulted in 211 matched records.
Control Variables
Some variables were related to most of the survey and school outcomes. To increase the
likelihood that any outcome differences observed were due to the variables of interest and not
other variables, it was important to control statistically for other variables’ influence. The grade
of the Club members was statistically controlled for in analyses of the 2015 survey data and the
school data, except for analyses that were specifically assessing grade level differences. These
analytic precautions were taken because preliminary analyses indicated that youth differed on
outcomes based on their grade regardless of their attendance at the Club.
Statistical Significance
Statistical tests, such as ANOVA, linear regression and chi-square, are tests of statistical
significance. Statistical significance is a way of representing the probability that differences
between observed group means are real differences. Tests of statistical significance calculate the
probability (p-value) that a difference in scores is due to chance.
Prepared by OMNI Institute 7
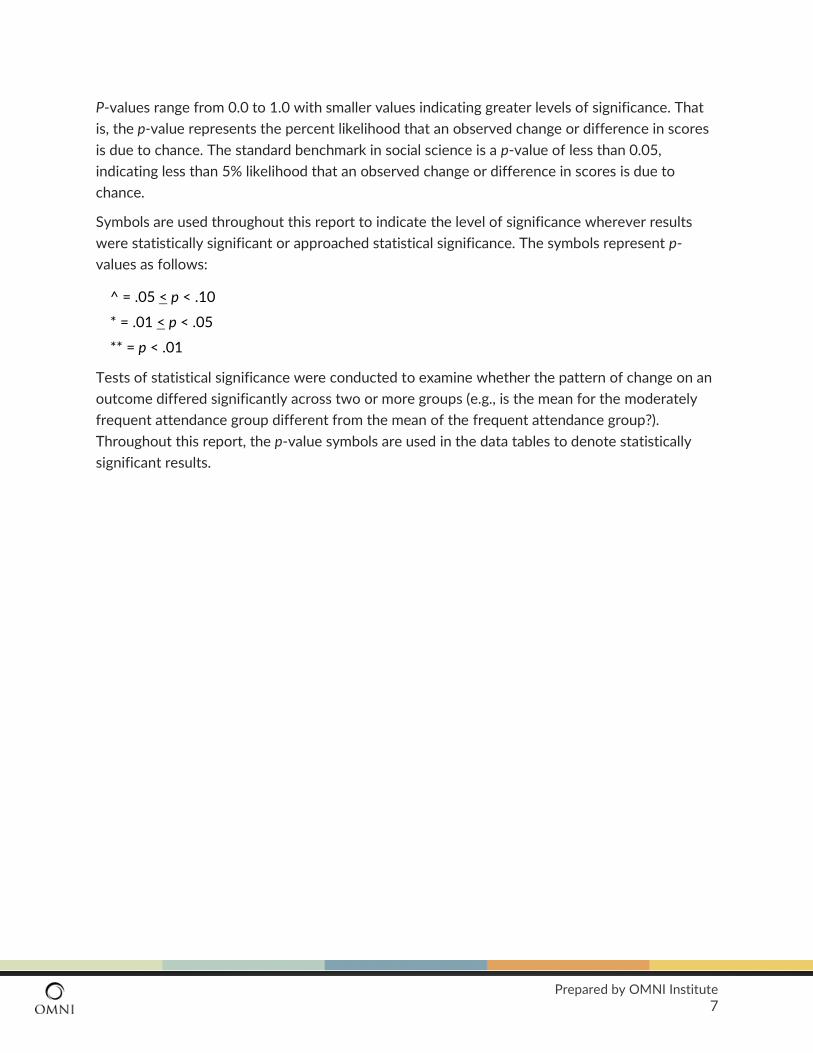
P-values range from 0.0 to 1.0 with smaller values indicating greater levels of significance. That
is, the p-value represents the percent likelihood that an observed change or difference in scores
is due to chance. The standard benchmark in social science is a p-value of less than 0.05,
indicating less than 5% likelihood that an observed change or difference in scores is due to
chance.
Symbols are used throughout this report to indicate the level of significance wherever results
were statistically significant or approached statistical significance. The symbols represent p-
values as follows:
^ = .05 < p < .10
* = .01 < p < .05
** = p < .01
Tests of statistical significance were conducted to examine whether the pattern of change on an
outcome differed significantly across two or more groups (e.g., is the mean for the moderately
frequent attendance group different from the mean of the frequent attendance group?).
Throughout this report, the p-value symbols are used in the data tables to denote statistically
significant results.

Prepared by OMNI Institute 8
Results Section 1: Analysis of 2014-15 Outcomes for the Core Sample
Description of the Core Sample More than 10,000 youth attend the Boys & Girls Clubs of Metro Denver annually. As described
above, the majority of this year’s evaluation focused on Club members who attended a Club for
60 days or more in 2014-15 and were in the 2014-15 DPS school dataset. These youth are
considered to be the ‘core sample’ of youth for 2014-15 analyses (N = 591).
Club members from 11 sites were included in the ‘core sample’ evaluation. Club members who
attend the Boettcher, Suncor (previously named Commerce City), Jefferson County, and
Shopneck sites do not attend DPS and therefore do not have DPS Academic data and were not
included in the ‘core sample’ analyses.
Table 1: Club Representation for the Core Sample
N % of Sample
Denver 71 12.0%
Cope 63 10.7%
Johnson 59 10.0%
Owen 83 14.0%
Wilfley 51 8.6%
Force - Beacon 45 7.6%
Cole - Beacon 53 9.0%
Place - Beacon 45 7.6%
Johnson - Beacon 42 7.1%
Noel-Beacon 41 6.9%
Vickers 38 6.4%
Total 591 100%
The demographic characteristics of the ‘core sample’ of Club members included in this section of
the evaluation are presented below. Demographic information includes gender and
race/ethnicity. Club members’ gender and race/ethnicity are reported in Tables 2 and 3 below.
Slightly more males than females were included in the evaluation and the predominant
ethnic/racial group in the sample was Hispanic/Latino. Age was available for only 59.1% of the
core sample. The average age for the 349 youth with Age information was 12.7 years.

Prepared by OMNI Institute 9
Table 2: Club Member Gender by Grade Level for the Core Sample
Elem. (3 - 5)
MS (6 - 8)
HS (9 - 12)
Total
Female Count 111 87 70 268
% within Grade level 43.4% 45.8% 49.0% 45.5%
Male Count 145 103 73 321
% within Grade level 56.6% 54.2% 51.0% 54.5%
All Count 256 190 143 589
% within Grade level 100.0% 100.0% 100.0% 100.0%
Table 3: Club Member Race/Ethnicity by Grade Level for the Core Sample
Elem. (3 - 5)
MS (6 - 8)
HS (9 - 12)
Total
Hispanic or Latino Count 165 85 72 322
% within Grade level 64.5% 44.7% 50.3% 54.7%
African-American/Black Count 50 71 49 170
% within Grade level 19.5% 37.4% 34.3% 28.9%
White Count 12 10 6 28
% within Grade level 4.7% 5.3% 4.2% 4.8%
Multi-Racial or Other Count 12 12 11 35 % within Grade level 4.7% 6.3% 7.7% 5.9% Asian Count 5 6 2 13
% within Grade level 2.0% 3.2% 1.4% 2.2%
Am. Indian or Alaska Native Count 5 5 3 13
% within Grade level 2.0% 2.6% 2.1% 2.2%
All Count 256 190 143 589
% within Grade level 100.0% 100.0% 100.0% 100.0%
Description of Analyses Analyses of covariance (ANCOVAs) were conducted to analyze 2015 survey and mean-level
school outcomes by Club attendance frequency group controlling for grade. Chi-square analyses
were conducted to determine if the percentage of students who had proficient PARCC tests
differed by Club attendance or grade level. Lastly, correlation analyses were conducted to
analyze associations between school and survey outcomes.
Outcomes for the Core Sample by Club Attendance Frequency Club members were split into two groups based on their attendance at the Club during the
2014-15 school year. Moderately frequent attenders were at the Club between 60 and 89 days;
frequent attenders were defined as those who attended the Club at least 90 days during this
Prepared by OMNI Institute 10
time period 2. It is an important caveat that all of the analyses in this section are correlational in
nature. That is, statistically significant results indicate that school or survey outcomes are related
to Club attendance frequency but cannot be interpreted as Club attendance having caused the
outcomes.
NYOI Survey Outcomes by Club Attendance
General Linear Models (GLMs) analyses were conducted to test if outcomes on the NYOI survey
differed based on the two levels of Club attendance. All of these analyses controlled for grade.
There was one finding that trended towards significance, as delineated in Table 4 below. This
finding is further illustrated in Figure 1.
Table 4: Summary of NYOI Survey Outcomes for the Core Sample by Club Attendance Frequency
Difference by Club Attendance Frequency No Difference by Club Attendance Frequency
Leadership skills Club support
Club belonging
Emotional safety at the Club
Physical safety at the Club
Number of Club areas avoided
Fun at the Club
Validation/recognition
Expectations from adults
Conflict resolution skills
Community service at the Club (Youth)
Community service at the Club (Teen)
Community service at the school (Teen)
Importance of school
Healthy eating
Unhealthy eating
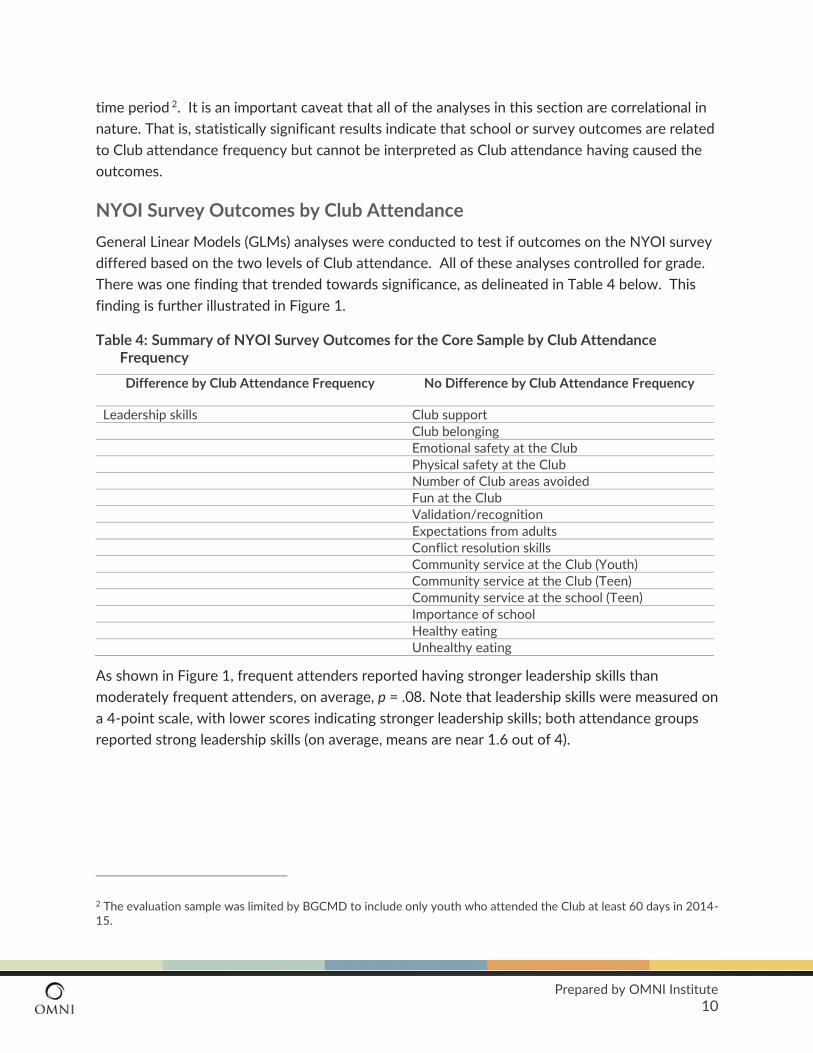
As shown in Figure 1, frequent attenders reported having stronger leadership skills than
moderately frequent attenders, on average, p = .08. Note that leadership skills were measured on
a 4-point scale, with lower scores indicating stronger leadership skills; both attendance groups
reported strong leadership skills (on average, means are near 1.6 out of 4).
2 The evaluation sample was limited by BGCMD to include only youth who attended the Club at least 60 days in 2014-15.
Prepared by OMNI Institute 11
Figure 1: Survey Outcomes for the Core Sample that Differ by 2015 Club Attendance Frequency
SAYO Outcomes for the Core Sample by Club Attendance
GLM analyses were conducted to evaluate whether SAYO outcomes differed by Club
attendance frequency controlling for grade. As shown in Table 5, no SAYO outcomes varied as a
function of Club attendance.
Table 5: Summary of SAYO Survey Results by Club Attendance Frequency
Difference by Club Attendance Frequency No Difference by Club Attendance Frequency
Challenge
Supportive adults
Choice/autonomy
Sense of competency as a learner
Sense of competency as a reader
Sense of social competency
Future planning
Future expectations
Youth believed program helped academic skills
Youth believed program helped social skills
DPS School Outcomes for the Core Sample by Club Attendance
Similar analyses were conducted to evaluate whether school academic outcomes differed by
Club attendance frequency. As shown in Table 6, four outcomes varied as a function of Club
attendance: school attendance, suspensions, behavior incidents, and math proficiency. All of
these findings favored frequent attenders; the results are displayed in Figures 2-5 to illustrate
the pattern of results.
1.681.57
1.0
2.0
3.0
4.0
Leadership skills
Moderately frequent attenders Frequent attenders

Prepared by OMNI Institute 12
Table 6: Summary of DPS Survey Results by Club Attendance Frequency
Difference by Club Attendance Frequency No Difference by Club Attendance Frequency
Average school attendance GPA
Suspensions English proficiency
Behavior incidents
Math proficiency
As shown in Figure 2, BGCMD members who came to the Club at least 90 days had higher
average school attendance than members who came to the Club between 60 and 89 days, p <
.05. As a reminder, it would be inappropriate to conclude that attendance in either school or the
Club caused more frequent attendance at the other location. These results could simply indicate
that some youth are more likely to show up both at school and at the Club.
Figure 2: Average School Attendance by Club Attendance Frequency
As shown in Figure 3, BGCMD members who came to the Club at least 90 days had fewer
suspensions than members who came to the Club between 60 and 89 days, p < .05.
0.92 0.93
0.5
0.6
0.7
0.8
0.9
1.0
School attendance
Moderately frequent attenders Frequent attenders

Prepared by OMNI Institute 13
Figure 3: Suspensions by Club Attendance Frequency
As shown in Figure 4, BGCMD members who came to the Club at least 90 days also had fewer
behavior incidents than members who came to the Club between 60 and 89 days, p = .09.
Figure 4: Behavior Incidents by Club Attendance Frequency
As shown in Figure 5, BGCMD members who came to the Club at least 90 days had higher
PARCC math proficiency scores than members who came to the Club between 60 and 89 days,
p = .06.
2.11
1.39
0.0
1.0
2.0
3.0
Suspensions
Moderately frequent attenders Frequent attenders
0.14
0.07
0.0
0.1
0.2
0.3
0.4
0.5
Behavior incidents
Moderately frequent attenders Frequent attenders

Prepared by OMNI Institute 14
Figure 5: PARCC Math Proficiency by Club Attendance Frequency
DPS School Outcomes for the Core Sample by Club Attendance and Grade Level A series of analyses were conducted to evaluate if there were significant interactions between
Club attendance frequency and grade level on school outcomes. A significant interaction would
indicate that the impact of Club attendance frequency differs for BGCMD members based on
whether they are in elementary, middle, or high school.
Although average school attendance differed by Club attendance (higher average school
attendance among frequent Club attenders, p = .03) and by grade level (lower average school
attendance for higher grade levels, p < .01), the interaction between the two was not statistically
significant. In other words, the pattern by grade level did not differ between the two Club
attendance groups; see Table 7.
Table 7: Average School Attendance by Club Attendance Frequency and Grade Level
Club Attendance Frequency
Moderately Frequent Frequent
Grade Level
Elem. 0.94 0.95
MS 0.92 0.93
HS 0.90 0.91
GPA and behavior incidents did not differ significantly by Club attendance, grade level, or the
interaction between Club attendance and grade level. Although suspensions differed by Club
2.16 2.18
0.0
1.0
2.0
3.0
Math proficiency
Moderately frequent attenders Frequent attenders

Prepared by OMNI Institute 15
attendance (greater number of suspensions among moderately frequent Club attenders, p = .04),
they did not differ by grade level, and the interaction between Club attendance and grade level
was not significant.
For each PARCC subject test (English and math), Club youth were put into a “not proficient”
group if they scored unsatisfactory or partially proficient, or into a “proficient” group if they
scored proficient or advanced. Then analyses were conducted to evaluate if the proportion of
members with proficient scores differed by grade level, Club attendance level, and by the
interaction of those two factors. English proficiency differed significantly by grade level, but did
not differ by Club attendance or the interaction between Club attendance and grade level.
Regardless of Club attendance frequency, members in higher grade levels had a lower proportion
of proficient scores on the English test than elementary students (p < .01; see Table 8 below).
Table 8: Proportion of Club Members Proficient on the PARCC English Test, by Club Attendance Frequency and Grade Level
Club Attendance Frequency
Moderately
Frequent
Frequent Total
Grade Level
Elem. 20% 19% 19%
MS 15% 5% 8%
HS 27% 16% 18%
Total 19% 14% 15%
There was a marginally statistically significant effect of grade level for the PARCC math test, p =
.052. Regardless of Club attendance frequency, members in higher grade levels had a lower
proportion of proficient scores on the math test than elementary students; see Table 9 below.
Table 9: Proportion of Club Members Proficient on the PARCC Math Test, by Club Attendance Frequency and Grade Level
Club Attendance Frequency
Moderately
Frequent
Frequent Total
Grade Level
Elem. 6% 14% 12%
MS 15% 10% 11%
HS 15% 7% 9%
Total 11% 11% 11%

Prepared by OMNI Institute 16
Relationship between DPS School Outcomes and NYOI Survey Outcomes for the Core Sample Correlation analyses were conducted to test for significant relationships between the 2014-15
school outcomes and 2015 NYOI outcomes. Although there were a few scattered correlations
between several of the outcomes (see Table 29 in Appendix II for the full set of correlation
results), there was a clear pattern for two of the survey outcomes. As shown in Table 10, one
survey outcome (conflict resolution skills) was positively related to school outcomes. BGCMD
members who had more conflict resolution skills tended to perform better in school. Conversely,
youth who engaged in unhealthy eating (soda and fried foods) tended to not perform as well in
school.
In Table 10 a plus sign (+) indicates that higher values on one outcome are significantly related to
higher values on the other outcome. A negative sign (-) indicates that higher values on one
outcome are significantly related to lower values on the other outcome.
Table 10: Correlations between 2015 School and NYOI Survey Outcomes
Conflict Resolution Skills Unhealthy Eating
Attendance + —
GPA + —
Math Proficiency + —
English Proficiency + —
Note: + = positive correlation, - = negative correlation.
For these correlational analyses, it is not possible to tell whether there is a causal relationship.
In other words, these results cannot indicate whether doing better in school led to more conflict
resolution skills, or whether youth with strong skills in turn perform better in school. However,
these relationships are still important because they suggest areas for BGCMD to target with
programming (e.g., teach healthy eating and conflict resolution skills) and then measure over time
to look for a causal relationship.

Prepared by OMNI Institute 17
Results Section 2: Analysis of 2014-15 Outcomes by Sexual Health Program Participation
Description of Sample The demographic characteristics of the Club members who had at least 60 days of Club
attendance and participated in Sexual Health programming are presented below. Demographic
information includes gender, race/ethnicity, and Club representation. These characteristics are
reported in Tables 11-13 below. Slightly more females than males were included in the
evaluation and the predominant ethnic/racial group in the sample was Hispanic/Latino. The
majority of youth (78%) who participated in a Sexual Health program had attended the Club at
least 90 days during the 2014-15 school year.
Table 11: Club Member Gender by Grade Level for Sexual Health Program Participants
Elem. (3 - 5)
MS (6 - 8)
HS (9 - 12)
Total
Males Count 18 29 46 93
% within Grade level 51.4% 30.2% 58.2% 44.3%
Females Count 17 67 33 117
% within Grade level 48.6% 69.8% 41.8% 55.7%
All Count 35 96 79 210
% within Grade level 100.0% 100.0% 100.0% 100.0%
Table 12: Club Member Race/Ethnicity by Grade Level for Sexual Health Program Participants
Elem. (3 - 5)
MS (6 - 8)
HS (9 - 12)
Total
Hispanic or Latino Count 16 53 46 115
% within Grade level 45.7% 55.2% 58.2% 54.8%
African-American/Black Count 14 26 18 58
% within Grade level 40.0% 27.1% 22.8% 27.6%
White Count 2 10 6 18
% within Grade level 5.7% 10.4% 7.6% 8.6%
Multi-Racial or Other Count 3 6 6 15
% within Grade level 8.6% 6.3% 7.6% 7.1%
Asian Count 0 1 2 3
% within Grade level 0.0% 1.0% 2.5% 1.4%
American Indian or Alaska Native
Count 0 0 1 1
% within Grade level 0.0% 0.0% 1.3% 0.5%
All Count 35 96 79 210
% within Grade level 100.0% 100.0% 100.0% 100.0%

Prepared by OMNI Institute 18
Table 13: Club Representation for Sexual Health Program Participants
60-89 days Count 47
% 22.3%
90 or more days Count 164
% 77.7%
All Count 211
% 100.0%
Description of Analyses ANCOVAs were conducted to compare survey outcomes for Club members who participated in
Sexual Health programming versus those who did not participate in Sexual Health programming,
controlling for grade of the students.
Outcomes by Sexual Health Program Participation
NYOI Survey Outcomes by Sexual Health Program Participation
Some of the NYOI survey outcomes differed by Sexual Health program participation, but most
did not; see Table 14.
Table 14: Summary of NYOI Survey Results by Sexual Health Participation
Difference by Sexual Health Participation No Difference by Sexual Health Participation
Club belonging Club support
Emotional safety at the Club Physical safety at the Club
Healthy eating Fun at the Club
Volunteering at the Club (youth) Validation/recognition
Expectations from adults
Conflict resolution skills
Leadership skills
Unhealthy eating
Community service at the school (teen)
Volunteering at the Club (teen)
Importance of school
Number of Club areas avoided
The results that reached at least marginal statistical significance are presented in Figure 6.
Sexual Health youth participants reported that they volunteered more frequently at the Club
than non-Sexual Health youth participants, p = .009. The other findings favored non-Sexual
Health participants, such that:
On average, non-Sexual Health participants reported that they ate healthy foods more
frequently than Sexual Health participants, p = .07.

Prepared by OMNI Institute 19
Non-Sexual Health participants reported feeling a greater sense of Club belonging than
Sexual Health participants, p = .02.
Non-Sexual Health participants reported feeling more emotionally safe at the Club than
Sexual Health participants, p < .001.
Figure 6: NYOI Survey Outcomes that Differ by 2015 Sexual Health Participation
SAYO Survey Outcomes by Sexual Health Program Participation
As shown in Table 15, only one SAYO outcome varied as a function of Sexual Health
participation.
Table 15: Summary of SAYO Survey Results by Sexual Health Program Participation
Difference by Sexual Health Participation No Difference by Sexual Health Participation
Choice/autonomy Challenge
Supportive adults
Sense of competency as a learner
Sense of competency as a reader
Sense of social competency
Future planning
Future expectations
Youth believed program helped academic skills
Youth believed program helped social skills
As shown in Figure 7, Sexual Health participants reported feeling greater choice/autonomy than
non-Sexual Health participants, p = .04.
3.013.23 3.32
2.79
3.50
3.14 3.12
2.52
1.0
2.0
3.0
4.0
5.0
Club volunteering (Y) Club belonging Emotional safety at theClub
Healthy eating
No Sexual Health participation Sexual Health participation

Prepared by OMNI Institute 20
Figure 7: SAYO Survey Outcomes by 2015 Sexual Health Participation
DPS School Outcomes by Sexual Health Program Participation
Analyses were conducted to compare school outcomes for Club members who had participated
in Sexual Health programs versus members who had not participated. These results are
summarized in Table 16.
Table 16: Summary of Survey Results by Sexual Health Program Participation
Difference by Sexual Health Participation No Difference by Sexual Health Participation
School attendance GPA
Behavior incidents
Suspensions
Math proficiency
English proficiency
The significant finding was in favor of those who did not participate in the Sexual Health
program. As shown in Figure 8 below, non-Sexual Health participants had higher average school
attendance in 2015 than Sexual Health participants, p = .004, although both groups had high
attendance rates (94% and 91%, respectively).
3.17
3.47
1.0
2.0
3.0
4.0
Choice/autonomy
No Sexual Health participation Sexual Health participation

Prepared by OMNI Institute 21
Figure 8: Average School Attendance by Sexual Health Program Participation
0.940.91
0.0
0.2
0.4
0.6
0.8
1.0
Average school attendance
No Sexual Health participation Sexual Health participation

Prepared by OMNI Institute 22
Results Section 3: 2015 DPS School Outcomes for Club vs. Comparison Youth
Description of the Sample Section 3 of the report focuses on the relationship between participation at the Club (Club
members vs. nonmembers) and school outcomes. Denver Public Schools (DPS) provided
comparison data for this year’s evaluation. Club members were matched to nonmembers on the
following characteristics: free or reduced lunch eligibility, ethnicity, school, English Language
Learner status, grade, prior year’s TCAP reading proficiency, and the previous year’s misconduct
count (N = 1325). DPS school outcomes for these youth are compared to the ‘core sample’ of
youth for 2014-15 analyses (N = 591). It should be noted that the comparison group youths’
grade levels were not included in the data provided to OMNI, thus grade could not be controlled
for in these analyses.
Description of Analyses Several t-tests were conducted to assess the relationships between Club participation and school
attendance, misconduct and GPA. Club members’ 2015 school outcomes were compared to
outcomes for similar nonmembers.
There were three statistically significant differences in school outcomes between Club members
and nonmembers (see Table 17 below).
Table 17: Summary of School Outcomes by Club Participation (Members vs. Nonmembers)
Difference by Club Participation No Difference by Club Participation
School attendance Behavior incidents
English proficiency Suspensions
Math proficiency GPA
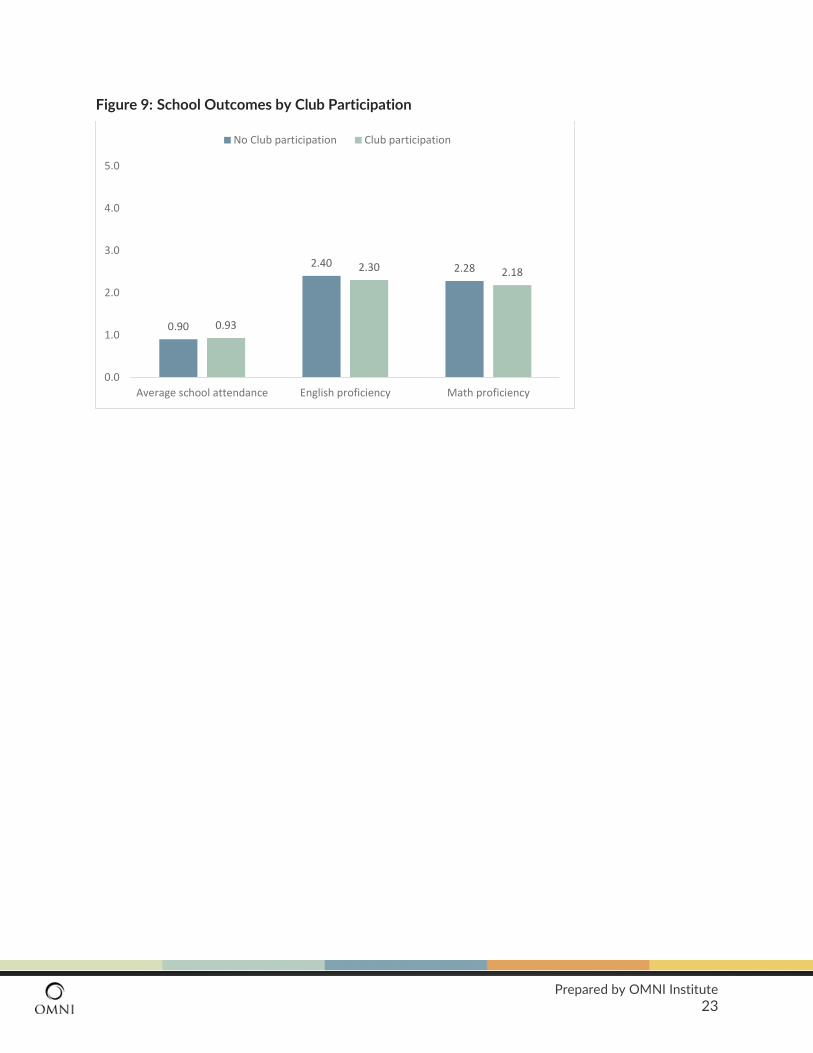
As shown in Figure 9 below, Club members had significantly higher levels of school attendance
than nonmembers, p < .001. The other two findings were in favor of nonmembers. Nonmembers
had significantly higher PARCC math proficiency scores (p = .048) and marginally significantly
higher PARCC English proficiency scores (p = .08).
Prepared by OMNI Institute 23
Figure 9: School Outcomes by Club Participation
0.90
2.40 2.28
0.93
2.30 2.18
0.0
1.0
2.0
3.0
4.0
5.0
Average school attendance English proficiency Math proficiency
No Club participation Club participation

Prepared by OMNI Institute 24
Results Section 4: Change in Outcomes 2014 – 2015
Description of the Sample Section 4 of the report focuses on analyzing change in outcomes between 2013-14 and 2014-
15. The ‘core sample’ of youth included in 2014-15 analyses were matched to the ‘core sample’
of youth included in 2013-14 analyses (i.e., Club members with at least 60 days of attendance in
2013-14 and 2014-15 and who had DPS data available in 2013-14 and 2014-15 (N=135). Of
those 135 Club members, 66 took the NYOI survey both years. Although these results are not
generalizable to all Club members, they may be reasonably representative of youth who attend
the Clubs frequently each year and attend DPS.
Description of Analyses Because the SAYO was not administered in previous years and PARCC and TCAP scores are not
comparable, change in outcomes for these measurements could not be assessed.
Paired-sample t-tests were conducted to evaluate how NYOI survey and DPS school outcomes
changed over time for Club youth who had data in 2014 and 2015. The survey analyses were
conducted for all Club members with available longitudinal data and who attended BGCMD at
least 60 or more days. A summary of the NYOI survey outcome changes is in Table 18; there
were no changes from 2014 to 2015.
Change in NYOI Survey Outcomes
Table 18: Change in NYOI Survey Outcomes, 2014 to 2015
Changed over Two Years Did Not Change over Two Years
Club support
Club areas avoided
Club belonging
Emotional safety at the Club
Physical safety at the Club
Fun at the Club
Validation/respect
Expectations from adults
Conflict resolution skills
Healthy eating
Unhealthy eating
Teen volunteering in school/community
Teen volunteering at the Club
Youth volunteering at the Club
Leadership skills

Prepared by OMNI Institute 25
Change in DPS School Outcomes
Changes in school outcomes were analyzed between 2014 and 2015. A list of these outcomes is
included in Table 19. The sample was too small to test for change in expulsions (Number of
expulsions in 2014 = 1; number of expulsions in 2015 = 0).
Table 19: Change in School Outcomes, 2014 to 2015
Changed over Two Years Did Not Change over Two Years
School attendance Suspensions
GPA
The school attendance rate significantly declined for the entire sample (93.7% in 2014 to 91.3%
in 2015, p < .001); see Figure 10. Despite these declines, it is important to note that while there
was a statistically significant difference, the attendance rates were very good overall in both
years and not necessarily meaningfully different.
Figure 10: Change in School Attendance Rate, 2014 to 2015
93.7% 91.3%
0%
20%
40%
60%
80%
100%
School attendance
2014 2015
Prepared by OMNI Institute 26
Results Section 5: Change in Outcomes 2013-2015
Description of the Sample Section 6 of the report focuses on analyzing change in outcomes for 2012-13, 2013-14, and
2014-15. Analyses were conducted for Club members with at least 60 days of attendance in
2012-13, 2013-14, and 2014-15 and who had DPS data available in 2012-13, 2013-14, and
2014-15 (N=135).
The N of students with data of the NYOI survey for all three years was too small to be able to
calculate change in the NYOI survey outcomes from 2013-2015 (N=9).
It is very important to note that only 25 Club members included in the evaluation had DPS
School Outcomes in 2013, 2014, and 2015. Therefore, care must be taken in drawing any
conclusions about BGCMD youth based on the results in this section. These results may be
generalizable to youth who attend the Club very frequently year after year, but likely do not
represent most BGCMD youth.
Description of Analyses A General Linear Models (GLM) was conducted to look at change in school attendance over
three years of data. The sample size was too small to conduct analyses of changes for the other
school outcomes (i.e., expulsions, suspensions, behavioral incidents and GPA).
Change in DPS School Outcomes
School attendance significantly decreased over time (see Table 20; Figure 11). Post hoc Tukey
tests indicated attendance rates for 2014-15 were significantly lower than 2012-13 and 2013-
14. As noted in the above section, this pattern was also observed for the larger sample of youth
with two years of data. Attendance rates did not differ between 2012-13 and 2013-2014.

Prepared by OMNI Institute 27
Table 20: Change in School Outcomes, 2012 to 2015
Changed over Three Years Did Not Change over Three Years School attendance
Figure 11: Change in School Attendance Rate, 2012-13 to 2014-15
94.3% 94.0%89.8%
0%
20%
40%
60%
80%
100%
2012-13 2013-14 2014-15

Prepared by OMNI Institute 28
Conclusions and Next Steps
Summary of Key Findings Findings from BGCMD’s 2014-15 evaluation were mixed, but indicate several positive outcomes
that are associated with more frequent attendance at the Clubs. Notable outcomes include
higher rates of school attendance, fewer behavior incidents and suspensions for Club members
who attended the Clubs 90 days or more as compared to Club members who attended the Club
for 60 – 89 days in 2014-15. Club members who attended the Club 90 days or more also
reported stronger leadership skills and higher scores on math proficiency tests.
Longitudinal analyses that examined NYOI outcomes among moderate and frequent Club
attendees across two years found no changes. This indicates that these outcomes remained
stable across time with no significant increases or decreases observed. An examination of school
attendance of Club members across three years found a significant decrease in attendance rates
in 2014-2015 compared to the previous two years. However, a relatively high attendance rate
was still observed.
Finally, analyses that examined differences between members who participated in a sexual
health program to those who did not indicated members who participated in the program at
BGCMD reported greater choice/autonomy and more frequent volunteering at the Club.
However, findings for participants were somewhat mixed considering they reported feeling less
emotionally safe at the Club, and a lower sense of belonging at the Club compared to those who
did not participate in the sexual health program.
Limitations There are several limitations to BGCMD’s current evaluation design, which leads to limited ability
to examine relationships across data sources (for example, relationships between school and
survey outcomes) and across years. This year’s evaluation aimed to focus on a group of Club
members who attend the Clubs most frequently and who had data available from multiple
sources. Despite efforts to streamline the evaluation approach, sample size across data sources
and across years remained too small to examine many potentially interesting and informative
outcomes. BGCMD should work to focus their evaluation approach so that relationships
between outcomes and over time can be analyzed for a more representative sample of Club
youth.
Additionally, BGCMD obtained data from a comparison sample of youth from Denver Public
Schools who were similar to BGCMD youth on several demographic characteristics but who did
not attend the Clubs. Comparison data for this year’s evaluation did not allow for a one-to-one
match between comparison students and Club members over multiple years, limiting the types of
Prepared by OMNI Institute 29
comparisons that could be made between the BGCMD and nonmember group. In addition, a
significant portion of the main outcome variables changed across years (e.g. TCAP scores were
replaced with PARCC scores, NYOI survey items changed), which restricted the longitudinal
analyses that could be conducted.
Recommendations As in years past, OMNI continues to recommend a more systematic, controlled examination of
Club members. Specifically, rather than deriving the analytic sample(s) from those with available
data (a non-randomized sample), we strongly recommend that BGCMD implement a study design
whereby a randomly selected or representative subset of Club members is identified, then
recruited by BGCMD staff to participate in the evaluation. A sufficiently large number of
members should be targeted to allow for attrition and refusals, and efforts should be focused on
ensuring data is collected and obtained for these particular youth across sources. This approach
helps minimize the bias inherent in a sample that can only include those youth who participated
in the Club frequently enough to be present for survey administrations (especially across years).
That is, it better ensures that the sample is representative of the population of youth who attend
the Clubs with varying frequency.
It is very possible that with a randomized sample, more positive, significant and interpretable
relationships of Club engagement to outcomes would be observed, especially given the wider
variance in Club attendance that could be captured in a random sample. A greater number of
longitudinal analyses would also be possible to conduct, with sample sizes that can allow for
more confidence in changes observed over time for Club members.
Finally, this approach would better ensure that investment of resources and time yields useful
information for BGCMD. While the effort to track a group of members over time can be
intensive, other efficiencies may be realized, with net time and costs roughly equivalent to the
present approach. For example, this would allow BGCMD to focus its internal data collection
efforts on the randomized (and much smaller) sample versus all Club members, and allow for
more advanced planning with DPS and others responsible for pulling member and comparison
data. And, significantly fewer resources and time would be needed for the evaluator to clean,
merge, and prepare data for analysis.
Prepared by OMNI Institute
XXX
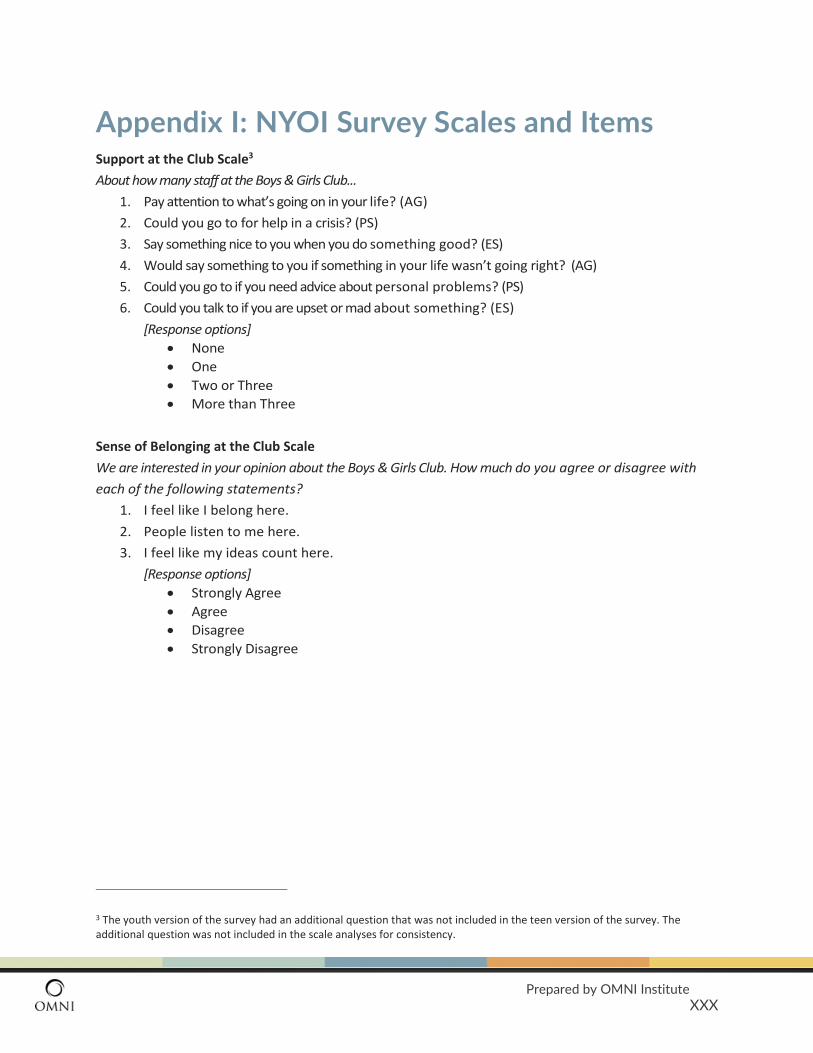
Appendix I: NYOI Survey Scales and Items Support at the Club Scale3
About how many staff at the Boys & Girls Club...
1. Pay attention to what’s going on in your life? (AG)
2. Could you go to for help in a crisis? (PS)
3. Say something nice to you when you do something good? (ES)
4. Would say something to you if something in your life wasn’t going right? (AG)
5. Could you go to if you need advice about personal problems? (PS)
6. Could you talk to if you are upset or mad about something? (ES)
[Response options]
None
One
Two or Three
More than Three
Sense of Belonging at the Club Scale
We are interested in your opinion about the Boys & Girls Club. How much do you agree or disagree with
each of the following statements?
1. I feel like I belong here.
2. People listen to me here.
3. I feel like my ideas count here.
[Response options]
Strongly Agree
Agree
Disagree
Strongly Disagree
3 The youth version of the survey had an additional question that was not included in the teen version of the survey. The additional question was not included in the scale analyses for consistency.

Prepared by OMNI Institute XXXI
Emotional Safety at the Club Scale
We are interested in your opinion about the Boys & Girls Club. How much do you agree or disagree with
each of the following statements?
1. This Boys & Girls Club has rules for how people are supposed to treat each other.
2. I feel respected by staff at the Boys & Girls Club.
3. I feel respected by other kids at the Boys & Girls Club.
4. People make sure rules about how we treat each other are followed.
[Response options]
Strongly Agree
Agree
Disagree
Strongly Disagree
Fun at the Club Scale
Think about your experiences at the Boys & Girls Club. How true are the following statements?
1. At the club, I have a good time.
2. I enjoy coming to the Boys & Girls Club.
3. I have more fun at the Boys & Girls Club than other places I spend time.
[Response options]
Very true
Sort of true
Not very true
Not at all true
Recognition Scale
Think about the relationships you have with the staff at the Boys & Girls Club. The following questions are
about these relationships and how you are treated by staff. How true is each statement? At the club...
1. Staff reward me when I do a good job.
2. Staff notice when I try hard.
3. Staff let others know when I do a good job.
[Response options]
Very true
Sort of true
Not very true
Not at all true

Prepared by OMNI Institute XXXII
Staff Expectations Scale
Think about the relationships you have with the staff at the Boys & Girls Club. The following questions are
about these relationships and how you are treated by staff. How true is each statement?
At the club...
1. There is an adult who always wants me to do my best.
2. There is an adult who believes that I will be a success.
3. There is an adult who expects me to follow the rules.
[Response options]
Very true
Sort of true
Not very true
Not at all true
Physical Safety at the Club Scale
How often do these things happen at the Boys & Girls Club?
1. I feel safe when I am at the Boys & Girls Club.
2. If someone wanted to hurt me or beat me up here, someone at the Boys & Girls Club would stop
them.
[Response options]
All of the time
Most of the time
Sometimes
Never
Compared to when you are hanging out somewhere else, how safe do you feel when you are at the
Boys & Girls Club?
[Response options]
A lot more safe compared to hanging out somewhere else
A little more safe compared to hanging out somewhere else
Just as safe as hanging out somewhere else
A little less safe compared to hanging out somewhere else
A lot less safe compared to hanging out somewhere else
Prepared by OMNI Institute XXXIII
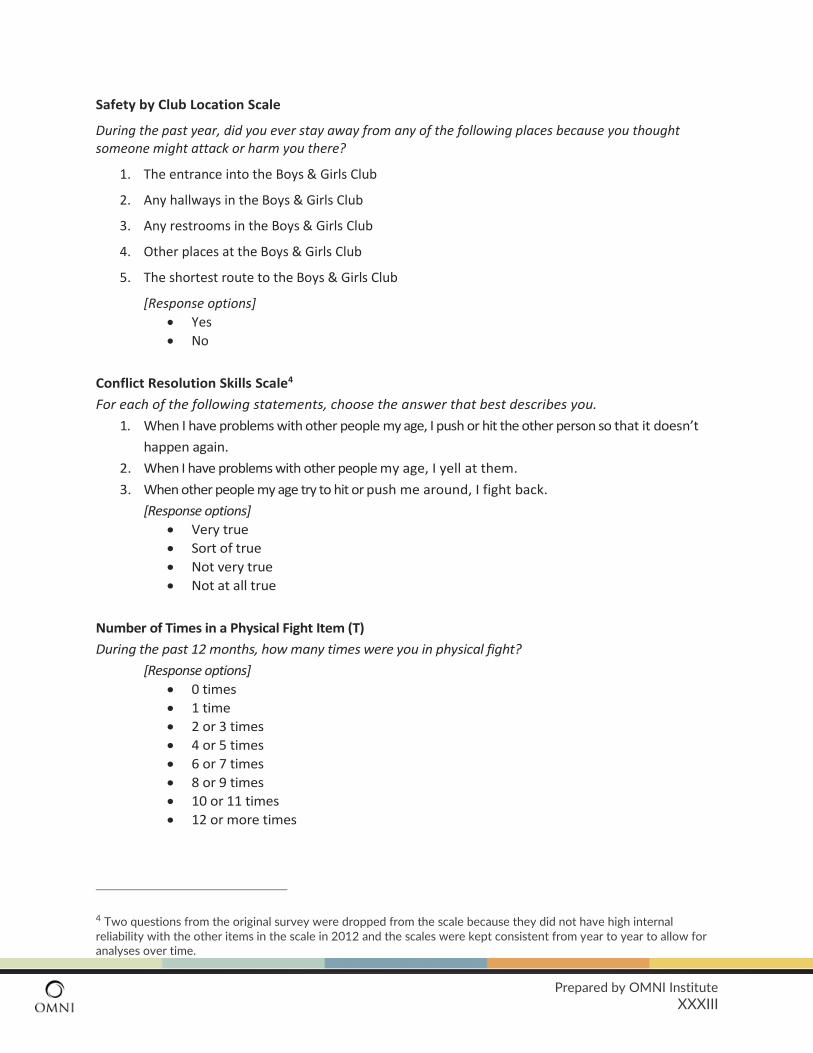
Safety by Club Location Scale
During the past year, did you ever stay away from any of the following places because you thought someone might attack or harm you there?
1. The entrance into the Boys & Girls Club
2. Any hallways in the Boys & Girls Club
3. Any restrooms in the Boys & Girls Club
4. Other places at the Boys & Girls Club
5. The shortest route to the Boys & Girls Club
[Response options]
Yes
No
Conflict Resolution Skills Scale4
For each of the following statements, choose the answer that best describes you.
1. When I have problems with other people my age, I push or hit the other person so that it doesn’t
happen again.
2. When I have problems with other people my age, I yell at them.
3. When other people my age try to hit or push me around, I fight back.
[Response options]
Very true
Sort of true
Not very true
Not at all true
Number of Times in a Physical Fight Item (T)
During the past 12 months, how many times were you in physical fight?
[Response options]
0 times
1 time
2 or 3 times
4 or 5 times
6 or 7 times
8 or 9 times
10 or 11 times
12 or more times
4 Two questions from the original survey were dropped from the scale because they did not have high internal reliability with the other items in the scale in 2012 and the scales were kept consistent from year to year to allow for analyses over time.

Prepared by OMNI Institute XXXIV
Number of Arrests Item (T)
How many times, if any, have you been arrested in the past 12 months?
[Response options]
None
One
Two or more times
Leadership Skills Scale
The next few questions are about working with other people your age. How much do you agree or
disagree with each of the following statements?
1. Once I know what needs to be done, I am good at planning how to do it.
2. I am pretty good at organizing a team of kids to do a project.
3. If I’m the leader of a group, I make sure that everyone in the group feels important.
4. I feel like I can stand up for what I think is right, even if my friends disagree.
[Response options]
Strongly Agree
Agree
Disagree
Strongly Disagree
Civic Responsibility-Concern for Others Scale
How much do you agree or disagree with each of the following statements?
1. I try to help when I see people in need.
2. When I make a decision, I try to think about how other people will be affected.
3. I want to help when I see someone having a problem.
[Response options]
Strongly Agree
Agree
Disagree
Strongly Disagree
Civic Responsibility- Concern for Community Scale
Please choose one answer for each of the following statements.
1. I spend time on projects with other people to help the community.
2. I believe that I can make a difference in my community.
3. I have done things to help people in my community.
[Response options]
Strongly Agree
Agree
Disagree
Strongly Disagree
Prepared by OMNI Institute XXXV
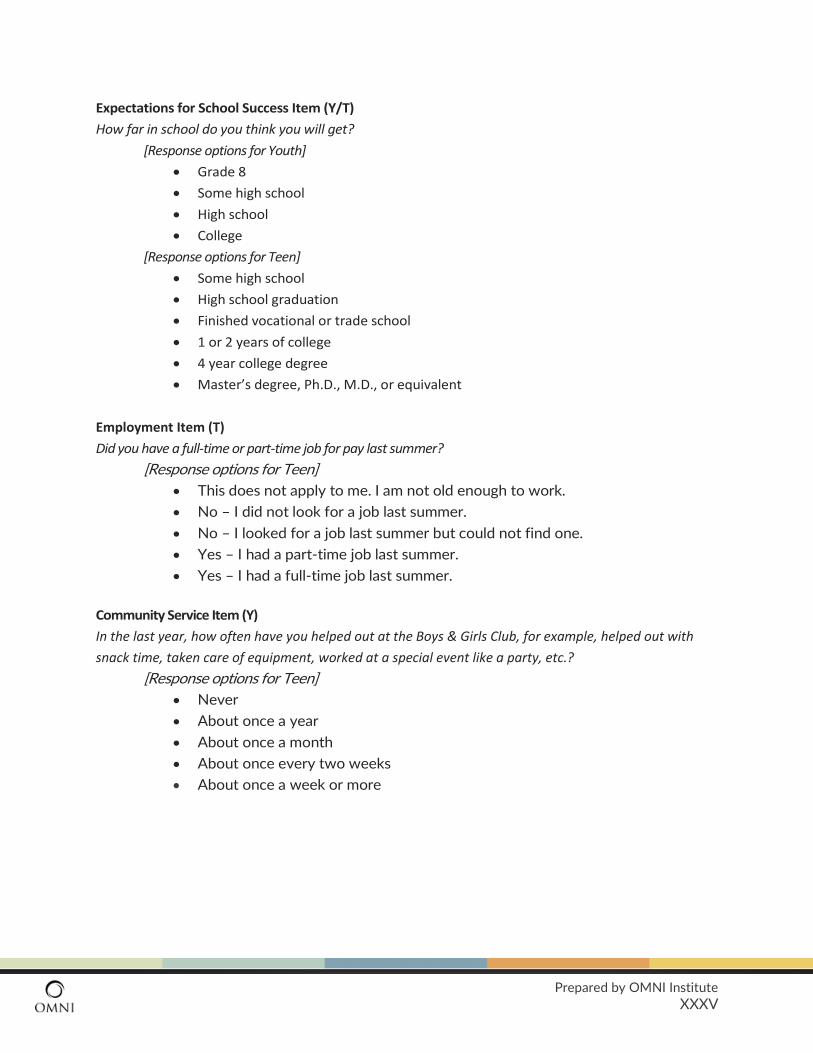
Expectations for School Success Item (Y/T)
How far in school do you think you will get?
[Response options for Youth]
Grade 8
Some high school
High school
College
[Response options for Teen]
Some high school
High school graduation
Finished vocational or trade school
1 or 2 years of college
4 year college degree
Master’s degree, Ph.D., M.D., or equivalent
Employment Item (T)
Did you have a full-time or part-time job for pay last summer?
[Response options for Teen]
This does not apply to me. I am not old enough to work.
No – I did not look for a job last summer.
No – I looked for a job last summer but could not find one.
Yes – I had a part-time job last summer.
Yes – I had a full-time job last summer.
Community Service Item (Y)
In the last year, how often have you helped out at the Boys & Girls Club, for example, helped out with
snack time, taken care of equipment, worked at a special event like a party, etc.?
[Response options for Teen]
Never
About once a year
About once a month
About once every two weeks
About once a week or more

Prepared by OMNI Institute XXXVI
Community Service (T)
In the last year, how often have you...
1. Volunteered in your school, neighborhood, or out in the community?
2. Helped out at the Boys & Girls Club, for example, tutoring younger members, leading activities,
planning events at the Club, etc.
[Response options]
Never
About once a year
About once a month
About once every two weeks
About once a week or more
Exercise (Y)
In the past 7 days (week), on how many days did you exercise, dance, or play sports for at least an hour?
[Response options]
0 days
1 day
2 days
3 days
4 days
5 days
6 days
7 days
Exercise (T)
During the past 7 days, on how many days were you physically active for a total of at least 60 minutes per
day? (Add up all the time you spend in any kind of physical activity that increases your heart rate and
makes you breathe hard some of the time.)
[Response options]
0 days
1 day
2 days
3 days
4 days
5 days
6 days
7 days

Prepared by OMNI Institute XXXVII
Healthy eating
During the past 24 hours (yesterday) how many times did you...?
1. Drink milk or eat yogurt? (In any form, including in cereal)
2. Drink 100% fruit juices, such as orange, apple or grape? (Do not count punch, Kool-Aid, sports
drinks, and fruit-flavored drinks)
3. Eat fruits? (Do not count fruit juice)
4. Eat vegetables? (Include salads and non-fried potatoes)
5. Drink water? (Such as from a glass, bottle or fountain)5
[Response options]
0 times
1 time
2 times
3 times
4 times
5 or more times
Unhealthy eating
During the past 24 hours (yesterday) how many times did you...?
1. Drink soda pop?
2. Eat French fries, potato chips, or other fried potatoes?
[Response options]
0 times
1 time
2 times
3 times
4 times
5 or more times
5 This question was added to the 2014 survey but was not included in the scale to allow for consistency across years.

Prepared by OMNI Institute XXXVIII
Tobacco Use (T)
1. Have you ever tried cigarette smoking, even one or two puffs?
[Response options]
No
Yes
2. During the past 30 days, on how many days did you smoke cigarettes?
[Response options]
0 days
1 or 2 days
3 to 5 days
6 to 9 days
10 to 19 days
20 to 29 days
All 30 days
Alcohol Use (T)
1. During your life, on how many days have you had at least one drink of alcohol?
[Response options]
0 days
1 or 2 days
3 to 9 days
10 to 19 days
20 to 39 days
40 to 99 days
100 or more days
2. During the past 30 days, on how many days did you have at least one drink of alcohol?
[Response options]
0 days
1 or 2 days
3 to 5 days
6 to 9 days
10 to 19 days
20 to 29 days
All 30 days

Prepared by OMNI Institute XXXIX
Marijuana Use (T)
1. During your life, how many times have you used marijuana?
[Response options]
0 times
1 or 2 times
3 to 9 times
10 to 19 times
20 to 39 times
40 to 99 times
100 or more times
2. During the past 30 days, how many times have you used marijuana?
[Response options]
0 times
1 or 2 times
3 to 9 times
10 to 19 times
20 to 39 times
40 or more times
Sexual Activity (T)
1. Have you ever had sexual intercourse?
[Response options]
No
Yes
2. How old were you when you had sexual intercourse for the first time?
[Response options]
I have never had sexual intercourse.
11 years old or younger
12 years old
13 years old
14 years old
15 years old
16 years old
17 years old or older

Prepared by OMNI Institute XL
3. The last time you had sexual intercourse, did you or your partner use a condom?6
[Response options]
I have never had sexual intercourse.
No
Yes
6 This item was only administered to a subset of survey respondents in 2014 as part of a separate module, unlike in previous years.
Prepared by OMNI Institute XLI
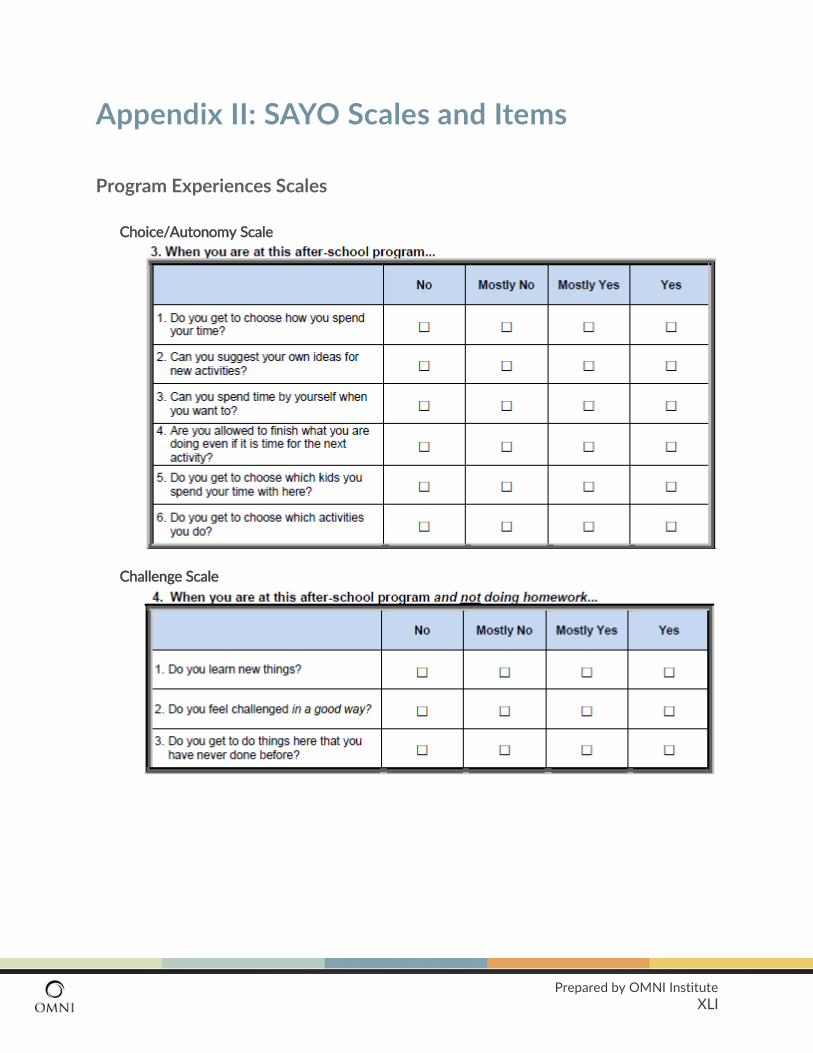
Appendix II: SAYO Scales and Items
Program Experiences Scales
Choice/Autonomy Scale
Challenge Scale

Prepared by OMNI Institute XLII
Supportive Adult Scale
Sense of Competence Scales
Sense of Competency as a Learner Scale

Prepared by OMNI Institute XLIII
Sense of Competency as a Reader Scale
Sense of Competence Socially Scale

Prepared by OMNI Institute XLIV
Future Planning and Expectations Scales (Grades 6-12 only)
Future Planning - My Actions Scale
Future Expectations Scale

Prepared by OMNI Institute XLV
Appendix III: Detailed Data Tables Table 21: 2015 Survey Outcomes by Club Attendance Frequency
Survey Item(s) (Youth/Teen Only) Range of Responses
N Moderately Frequent
Attenders N
Frequent Attenders
Sig.
Support at the Club 1-4 92 3.14 344 3.19 p=.55
Feeling of Belonging at the Club 1-4 94 3.22 347 3.25 p=.69
Feeling Emotionally Safe at the Club 1-4 94 3.29 346 3.31 p=.83
Feeling Physically Safe at the Club 1-4.5 95 3.61 352 3.71 p=.20
Number of Club Areas Avoided 0-5 95 0.91 352 1.21 p=.13
Fun at the Club 1-4 94 3.41 349 3.46 p=.51
Validation and Recognition 1-4 93 3.28 347 3.39 p=.22
Expectations from Adults for Success 1-4 94 3.63 347 3.70 p=.26
Conflict Resolution Skills 1-4 94 2.64 342 2.59 p=.69
Leadership Skills† 1-4 93 1.68 340 1.57 p=.08^
Community Service at the Club (Y) 1-5 61 3.05 230 3.20 p=.45
Community Service at the Club (T) 1-5 31 2.87 115 3.17 p=.87
Community Service at the School (T) 1-5 32 2.50 116 2.69 p=.81
Importance of School 1-5 95 1.53 347 1.48 p=.64
Healthy Eating 0-5 94 2.73 345 2.87 p=.33
Unhealthy Eating
0-5 90 1.77 334 1.62 p=.38
**p < .01, *p < .05, ˄p < .10; † Lower scores indicate stronger leadership skills.
Table 22: 2015 School Outcomes by Club Attendance Frequency
Range of Responses
N Moderately
Frequent Attenders N
Frequent Attenders
Sig.
Average School Attendance 0.54-1.00 161 0.92 430 0.93 p=.03*
Behavior Incidents 0-4 161 0.14 430 0.07 p=.09^
Suspensions 1-11 27 2.11 54 1.39 p=.04*
Weighted GPA 0-4.91 54 2.42 122 2.41 p=.92
English Proficiency 1-5 145 2.30 412 2.30 p=.96
Math Proficiency kPProficiency†Proficiency†
1-5 143 2.16 407 2.18 p=.06^
**p < .01, *p < .05, ˄p < .10.

Prepared by OMNI Institute XLVI
Table 23: 2015 Survey Outcomes by Sexual Health Participation
Survey Item(s) (Youth/Teen Only) Range of Responses N
Non-Sexual Health
N Sexual Health
Sig.
Support at the Club 1-4 794 3.08 160 3.07 p=.39
Feeling of Belonging at the Club 1-4 811 3.23 163 3.14 p=.02*
Feeling Emotionally Safe at the Club 1-4 805 3.32 163 3.12 p<.001**
Feeling Physically Safe at the Club 1-4.50 835 3.66 167 3.63 p=.13 Number of Club Areas Avoided 0-5 836 1.17 167 0.90 p=.86
Fun at the Club 1-4 815 3.45 165 3.41 p=.22
Validation and Recognition 1-4 814 3.30 164 3.29 p=.68
Expectations from Adults for Success 1-4 814 3.68 164 3.67 p=.72 Conflict Resolution Skills 1-4 804 2.70 162 2.69 p=.84
Leadership Skills† 1-4 804 1.63 163 1.64 p=.86
Importance of School 1-5 822 1.47 165 1.60 p=.83
Community Service at the Club (Y) 1-5 584 3.01 96 3.50 p=.01** Community Service at the Club (T) 1-5 228 3.04 71 3.48 p=.14
Community Service at the School (T) 1-5 234 2.67 70 2.87 p=.49
Healthy Eating 0-5 804 2.79 161 2.52 p=.07^
Unhealthy Eating 0-5 776 1.50 155 1.48 p=.74 **p < .01, *p < .05, ˄p < .10; † Lower scores indicate stronger leadership skills.
Table 24: 2015 School Outcomes by Sexual Health Participation
Range of Responses N
Non-Sexual Health
N Sexual Health
Sig.
Average School Attendance 0.54-1 504 0.94 87 0.91 p=.004**
Behavior Incidents 0-4 504 0.08 87 0.13 p=.56
Suspensions 1-11 70 1.61 11 1.73 p=.90
Weighted GPA 0-4.91 130 2.48 46 2.22 p=.11
English Proficiency 1-5 477 2.31 80 2.25 p=.97
Math Proficiency kPProficiency†Proficiency†
1-5 472 2.20 78 2.05 p=.49
**p < .01, *p < .05, ˄p < .10.

Prepared by OMNI Institute XLVII
Table 25: Differences between Club Members and Nonmembers in 2015 School Outcomes
Range of Responses N Non-members N Club members Sig.
Average School Attendance 0-1 1210 0.90 591 0.93 p<.001**
Behavior Incidents 0-5 1325 0.10 591 0.09 p=.72
Suspensions 1-11 137 1.77 81 1.63 p=.50
Weighted GPA 0-5.06 384 2.35 176 2.41 p=.48
English Proficiency 1-5 1007 2.40 557 2.30 p=.08^
Math Proficiency 1-5 1002 2.28 550 2.18 p=.048*
**p < .01, *p < .05, ˄p < .10.
Table 26: Two-Year Change in Survey Outcomes, 2014 to 2015
Statistical Significance of Two-Year Change in Survey Outcomes
Survey Item(s) (Youth/Teen Only) Range of Responses
N 2014 2015 Sig.
Support at the Club 1-4 62 3.17 3.20 p=.82
Feeling of Belonging at the Club 1-4 63 3.31 3.19 p=.35
Feeling Emotionally Safe at the Club 1-4 62 3.23 3.26 p=.80
Feeling Physically Safe at the Club 1.33-4.50 66 3.70 3.69 p=.96
Number of Club Areas Avoided 0-5 66 0.74 0.79 p=.85
Fun at the Club 1.33-4 63 3.50 3.53 p=.71
Validation and Recognition 1-4 65 3.35 3.36 p=.88
Expectations from Adults for Success 1.67-4 64 3.78 3.76 p=.74 Conflict Resolution Skills 1-4 63 2.75 2.56 p=.12
Leadership Skills† 1-3.25 61 1.62 1.58 p=.59
Community Service at the Club (Y) 1-5 33 3.18 3.45 p=.20
Community Service at the Club (T) 1-5 21 3.90 3.48 p=.17
Community Service at the School (T) 1-5 21 2.95 2.81 p=.65
Healthy Eating 0-5 64 2.82 2.63 p=.30
Unhealthy Eating 0-5 61 1.66 1.57 p=.67
**p < .01, *p < .05, ˄p < .10; † Lower scores indicate stronger leadership skills.
Table 27: Two-Year Change in School Outcomes, 2014 to 2015
Range of Responses N 2014 2015 Sig.
Weighted GPA 0.51-4.91 18 2.33 2.44 p=.58
Average Attendance 0.66-1.00 66 0.94 0.93 p=.03*
Behavior Incidents 0-1 66 0.05 0.05 N/A
Suspensions 0-5 2 3.50 2.50 p=.80
**p < .01, *p < .05, ˄p < .10.
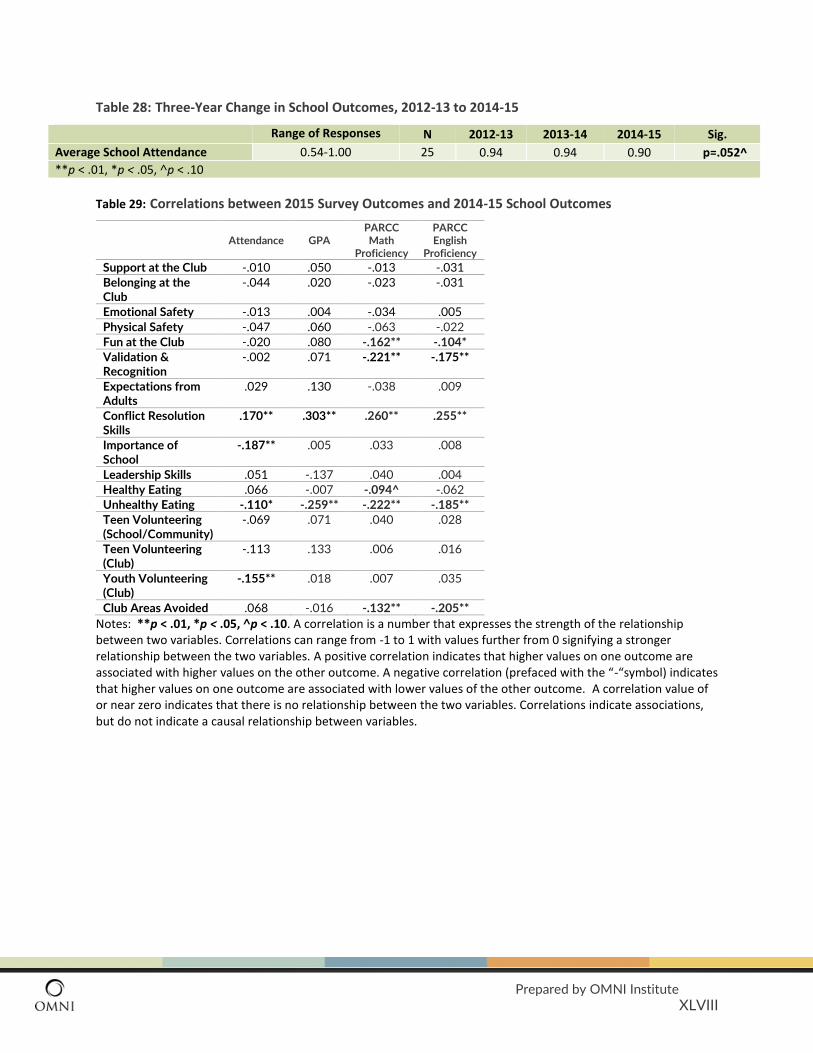
Prepared by OMNI Institute
XLVIII
Table 28: Three-Year Change in School Outcomes, 2012-13 to 2014-15
Range of Responses N 2012-13 2013-14 2014-15 Sig.
Average School Attendance 0.54-1.00 25 0.94 0.94 0.90 p=.052^
**p < .01, *p < .05, ˄p < .10
Table 29: Correlations between 2015 Survey Outcomes and 2014-15 School Outcomes
Attendance GPA
PARCC Math
Proficiency
PARCC English
Proficiency
Support at the Club -.010 .050 -.013 -.031
Belonging at the Club
-.044 .020 -.023 -.031
Emotional Safety -.013 .004 -.034 .005
Physical Safety -.047 .060 -.063 -.022
Fun at the Club -.020 .080 -.162** -.104*
Validation & Recognition
-.002 .071 -.221** -.175**
Expectations from Adults
.029 .130 -.038 .009
Conflict Resolution Skills
.170** .303** .260** .255**
Importance of School
-.187** .005 .033 .008
Leadership Skills .051 -.137 .040 .004
Healthy Eating .066 -.007 -.094^ -.062
Unhealthy Eating -.110* -.259** -.222** -.185**
Teen Volunteering (School/Community)
-.069 .071 .040 .028
Teen Volunteering (Club)
-.113 .133 .006 .016
Youth Volunteering (Club)
-.155** .018 .007 .035
Club Areas Avoided .068 -.016 -.132** -.205**
Notes: **p < .01, *p < .05, ˄p < .10. A correlation is a number that expresses the strength of the relationship between two variables. Correlations can range from -1 to 1 with values further from 0 signifying a stronger relationship between the two variables. A positive correlation indicates that higher values on one outcome are associated with higher values on the other outcome. A negative correlation (prefaced with the “-“symbol) indicates that higher values on one outcome are associated with lower values of the other outcome. A correlation value of or near zero indicates that there is no relationship between the two variables. Correlations indicate associations, but do not indicate a causal relationship between variables.