2014 analyst day
TRANSCRIPT

1
2014 Analyst DayWaldorf Astoria - New York
June 5, 2014
Assisted Living Property – Chatham, NJ (92 units)Operated by Juniper Communities, LLC

2
This supplemental information contains forward‐looking statements within the meaning of Section 27A of the Securities Act of 1933, as amended, and Section 21E of the Securities Exchange Act of 1934, as amended, adopted pursuant to the Private Securities Litigation Reform Act of 1995. Statements that are not purely historical may be forward‐looking. You can identify some of the forward‐looking statements by their use of forward‐looking words, such as ‘‘believes,’’ ‘‘expects,’’ ‘‘may,’’ ‘‘will,’’ ‘‘should,’’ ‘‘seeks,’’ ‘‘approximately,’’ ‘‘intends,’’ ‘‘plans,’’ ‘‘estimates’’ or ‘‘anticipates,’’ or the negative of those words or similar words. Forward‐ looking statements involve inherent risks and uncertainties regarding events, conditions and financial trends that may affect our future plans of operation, business strategy, results of operations and financial position. A number of important factors could cause actual results to differ materially from those included within or contemplated by such forward‐looking statements, including, but not limited to, the status of the economy, the status of capital markets (including prevailing interest rates), and our access to capital; the income and returns available from investments in health care related real estate, the ability of our borrowers and lessees to meet their obligations to us, our reliance on a few major operators; competition faced by our borrowers and lessees within the health care industry, regulation of the health care industry by federal, state and localgovernments, (including as a result of the Patient Protection and Affordable Care Act of 2010 and the Health Care and Education Reconciliation Act of 2010), changes in Medicare and Medicaid reimbursement amounts (including due to federal and state budget constraints), compliance with and changes to regulations and payment policies within the health care industry, debt that we may incur and changes in financing terms, our ability to continue to qualify as a real estate investment trust, the relative illiquidity of our real estate investments, potential limitations on our remedies when mortgage loans default, and risks and liabilities in connection with properties owned through limited liability companies and partnerships. For a discussion of theseand other factors that could cause actual results to differ from those contemplated in the forward‐looking statements, please see the discussion under ‘‘Risk Factors’’ and other information contained in our Annual Report on Form 10‐K for the fiscal year ended December 31, 2013 and in our publicly available filings with the Securities and Exchange Commission. We do not undertake any responsibility to update or revise any of these factors or to announce publicly any revisions to forward‐looking statements, whether as a result of new information, future events or otherwise.
Safe Harbor

3
Welcome
Wendy Simpson
Chairman, Chief Executive Officer, and President
CEO and President since March 2007
Chief Financial Officer July 2000 – March 2007
Board Member since 1995

4
Investment StrategyClint Malin, EVP and Chief Investment Officer
Marketing StrategyMark Hemingway, VP of Marketing
Portfolio ManagementBrent Chappell, VP Investment & Portfolio Management
Financial OverviewPam Kessler, EVP, CFO and Secretary
Management Q&A SessionFireside Chat with Industry Experts
Lynne Katzmann, Founder, President and CEO of Juniper Communities, LLCRick Grimes, CEO of ALFA
Guest Speaker Q&A SessionCommunity Tour
Agenda

5
Portfolio Diversification Approach
Diversification
Property Type Geography Operator
MitigatesSingle‐Tenant Concentration
Mitigates Government
Reimbursement Exposure
MitigatesSingle‐State
Risk

6
57.3% 37.3%
4.0%1.4%
Skilled Nursing (SNF)101 PropertiesRevenue $66.2M
Assisted Living (ALF)106 Properties Revenue $43.1M
Other2 PropertiesRevenue $1.6M
Total Revenue $115.5M
Range of Care9 Properties
Revenue $4.6M
Diversification – Property Type
Pro Forma Trailing Twelve Months Ended March 31, 2014
7
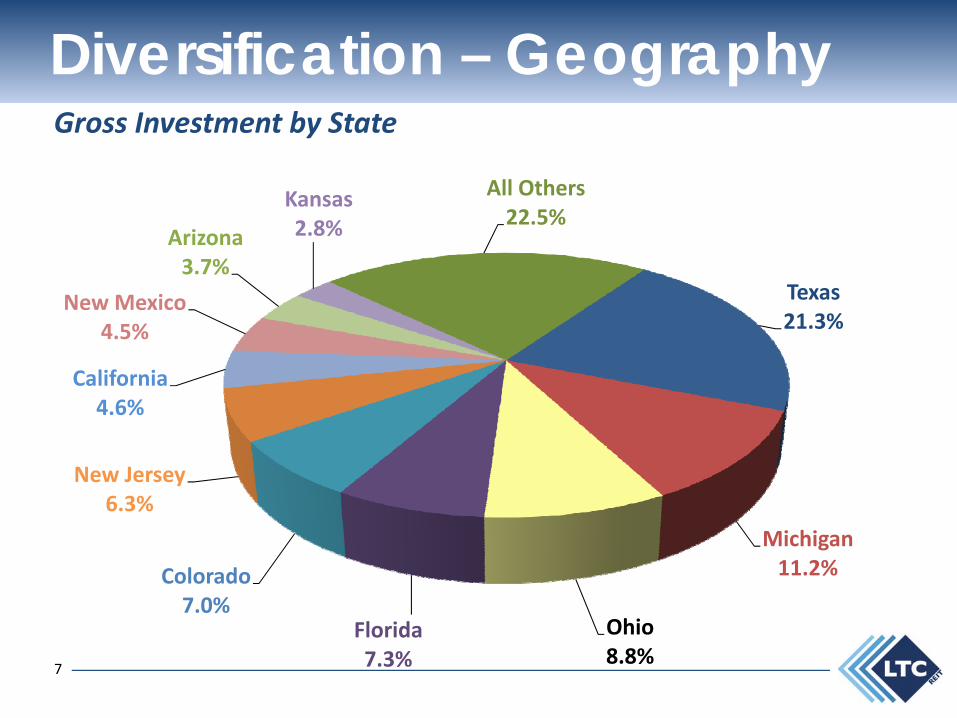
Texas21.3%
Michigan11.2%
Ohio8.8%
Florida7.3%
Colorado7.0%
New Jersey6.3%
California4.6%
New Mexico4.5%
Arizona3.7%
Kansas2.8%
All Others22.5%
Diversification – GeographyGross Investment by State

8
Prestige Healthcare12.3%
Senior Care Centers10.2%
Brookdale8.1%
Extendicare/ Enlivant7.9%
Juniper7.8%Preferred Care
7.5%
Carespring5.9%
Traditions Sr. Mgmt.5.6%
Fundamental4.0%
Skilled Healthcare3.6%
All Others27.1%
Diversification – OperatorGross Investment by Operator

9
$13
$94 $100
$245
$185
$0
$50
$100
$150
$200
$250
2009 2010 2011 2012 2013
Millions
Execution of Growth Strategy$637 Million in Investments Since 2008

10
Evolution
* Net of Asset Sales and Loan Payoffs
2008 TodayGross Investments* $581 Million $1.1 BillionAverage Portfolio Age ‐ SNF 25 years 17 yearsAverage Portfolio Age ‐ ALF 11 years 14 yearsTop 3 Tenants % of Annualized Revenue 47.2% 31.5%Debt + Preferred to Enterprise Value 30.2% 19.5%WACC 8.9% 6.0%

11
Expand Existing
Relationships
Build New Relationships
Consummate New Deals
Well Positioned for Growth

12
Investment Strategy

13
Clint Malin
Executive Vice President and Chief Investment Officer
Executive Vice President since June 2012
SVP and CIO since December 2010
VP and CIO May 2004 – December 2010
VP of Corporate Real Estate, Sun Healthcare Group
Investment Strategy

14
Sound Investment StrategyRegionally‐focused operators
Build on existing relationships
Marketing platform
Newer modernized properties
Off‐market transactions
Transaction size $10 ‐ $100 million
Diversity of property type (SNF, ALF, MC)
Strategic de novo development

15
Strong Lease-Up Results
79%
100%
57%
38%
0%
10%
20%
30%
40%
50%
60%
70%
80%
90%
100%
Amarillo, TX Littleton, CO Wichita, KS Slinger, WI
7/10/2013 7/9/2013 10/31/2013 2/14/2014
120‐beds SNF 60‐units MC 77‐units ALF/MC 106‐beds SNF
Development Lease‐Up

16
SNF45%
ALF/MC33%
MC22%
9.4%
7.8%8.4%
0%
2%
4%
6%
8%
10%
Development Expansion Renovation
WA Cash Yield
Development ActivityDevelopment, Expansion and Renovation
Commitments by Property TypeInvestment Commitment – $92.8M
Remaining Commitment
$56.3M61%
Funded to Date$36.5M39%

17
Re-Leasing Initiative

18
A Platform for Growth
Growth
Existing Relationships
Marketing Platform
Competitive Cost of Capital
Development Program
Proactive Portfolio Management
Proven Execution of Strategy

19
Marketing Strategy

20
Mark Hemingway
Vice President of Marketing since June 2013
VP Investment & Asset Management January 2011 –June 2013
Asset Management Consultant for LTC October 2002 – January 2011
VP Operations CLC Healthcare
Director of the Office of Long Term Care for the State of Arkansas
Marketing Strategy

21
Selling The Seven C’s of Success
Selling the
Seven C’s
CommitmentCustomer Success
ConsultativeApproach
CandorContact and Continuity
Communication
Competition

22
Candor
Customer Success
Consultative Approach
Commitment
Communication
Contact/Continuity
Competition
Selling The Seven C’s of SuccessSenior housing industryOperating partners
LTC’s long term success depends on customers/operating partners’ success
A trusted resourceRelationship focus
Transparent processPeople like doing business with people they know, like and trust
Frequent touch points with senior managementTenureRelationships that transcend business
SpeakingAdvertisingWeb – Rebranding initiative
AwarenessDifferentiation
23
Portfolio Management

24
Brent Chappell
VP, Investment and Portfolio Management
Joined LTC Properties –June 2013
VP, Portfolio Management, Nationwide Health Properties, Inc.March 2006 – February 2012
Director, Asset Management, Pacific Life Insurance Co.
Portfolio Manager, Catellus Development Corporation
Portfolio Management

25
Master Lease• Of our owned portfolio, 91% of the properties are subject to a master lease – with 91%
of our rent derived from these master leased properties (as of 3/31/14)
Triple‐Net (NNN) Structure• Taxes, insurance, assessments, maintenance and repair (including capital
expenditures), and all other operating costs are paid by lessee
Credit Enhancements• Guaranties• Security deposit – letter of credit• Escrow and reserve accounts• Minimum rent coverage / tangible net worth requirements
Property Inspections• Physical assessment of each facility once every two years
Financial Reporting• Facility level reporting required at least quarterly
Protective Lease TermsPortfolio of leased properties protectively structured

26
Same Property Portfolio Stats TTMOwned
PropertiesOccupancy Normalized
EBITDARM Coverage
NormalizedEBITDARCoverage
4Q13 3Q13 4Q13 3Q13 4Q13 3Q13
Assisted Living (1) 87.7% 87.4% 1.65 1.63 1.39 1.38
Skilled Nursing 79.7% 79.1% 2.28 2.34 1.68 1.73
Range of Care 86.7% 86.2% 1.85 1.80 1.39 1.34
(1) Excludes Extendicare/Enlivant

27
Coverage Relative to Select Peer Group
Note: As referenced for NHI, “EBITDARM Coverage ‐ Skilled” excludes NHC
1.90
2.17
1.71
2.28
1.90
1.661.70 1.70
1.00
1.20
1.40
1.60
1.80
2.00
2.20
EBITDARM Coverage ‐ Skilled
1.30 1.31 1.32
1.65
1.41
1.30 1.28
1.00
1.10
1.20
1.30
1.40
1.50
1.60
1.70
EBITDARM Coverage ‐ Seniors Housing

28
44.9%Pop: 19.8M ‐ 2.0M
18.2%Pop: 1.9M – 0.5M
17.2%Pop: 0.5M – 50K 15.6%
Pop: 218K– 13K
4.1%Pop: < 100K
0.0%
10.0%
20.0%
30.0%
40.0%
50.0%
MSAs 1‐31 MSAs 32‐100 MSAs > 100 Cities in Micro‐SA Cities not in an MSA or Micro‐SA
Over 60% in Top 100 MSAs
Gross Portfolio by MSAWeighted toward major metropolitan areas

29
Aggregate Government Reimbursement Exposure Less than 45%
Prepared for Reimbursement Uncertainty“Same Property Portfolio” Quality Mix
57% 16%
27%
Private Pay Medicare Medicaid

30
3.4%8.3%
2.5%8.9%
52.7%
1.0% 0.8% 0.1% 0.0%
12.0%
0%
10%
20%
30%
40%
50%
60%
2015‐2017 2018 2019 2020 Thereafter
Leases Loans
Investment Portfolio MaturitiesLease and Mortgage Loan Receivable Maturity(as a % of total gross owned investment and mortgage loans outstanding)

31
Financial Overview

32
Pam Kessler
Executive Vice President and CFO since December 2010
Senior Vice President and CFO March 2007 – December 2010
Vice President and Controller July 2000 – March 2007
The Ezralow Company (commercial real estate investment company)
Irvine Apartment Communities (multi‐family REIT)
Ernst & Young LLP
Financial Overview

33
Capital Structure Activities
WACC = 8.9% WACC = 6.0%
• $348 Million in Common Equity• $256 Million in Senior Unsecured Notes
$604 Million of New Capital Raised 2009‐2014
Redeemed Preferred Stock and Funded New Investments
Debt5%
Preferred Stock
Common Stock
2008
70%
25%
DebtPreferred Stock2%
Common Stock
Today
81%
17%

34
At 3/31/14 Capitalization
Debt
Bank borrowings – LIBOR +1.25% $41,000
Senior unsecured notes – weighted avg. rate 4.84% $251,633
Mortgage loans payable ‐‐
Bonds payable – weight avg. rate 3.27% $1,400
Total debt $294,033 17%
No. of Shares 5/30/14 Closing Price
Equity
Preferred stock – Series C $38,500 2%
Common stock 34,817,385 $39.74 $1,383,643 81%
Total equity $1,422,143 83%
Total Market Value $1,716,176 100%
Less: Cash and cash equivalents $(7,542)
Enterprise Value $1,708,634
Investment Grade Balance SheetNAIC‐2 Rated

35
Investment Grade Balance SheetNAIC‐2 Rated
LTC HC REIT AverageDebt to Enterprise Value 17.2% 30.3%Debt & Preferred to Enterprise Value 19.5% 31.2%Secured Debt to Total Debt 0.5% 20.1%Debt to Normalized TTM EBITDA 3.0x 5.7xNormalized TTM EBITDA/TTM Fixed Charges 6.7x 4.2x

36
$41.0M
$29.2M $26.7M$26.2M
$28.2M$25.7M
$32.2M $32.2M
$51.5M
$1.4M
$0
$5
$10
$15
$20
$25
$30
$35
$40
$45
$50
$55
2015 2016 2017 2018 2019 2020 2021 Thereafter
LOC Sr. Unsecured Bonds Payable
Debt Maturity
86% of debt is fixed long‐term with a weighted average interest rate of 4.8%14% of debt is short‐term floating rate debt under unsecured line of credit with pricing at LIBOR +125 at March 31, 2014
Millions

37
Investments Carry Attractive YieldsGAAP Yield Lease vs. WACC
10.4%10.8% 10.5%
9.1%9.6%
7.1% 7.1%6.6% 6.2% 6.3% 6.0%
0%
2%
4%
6%
8%
10%
12%
2009 2010 2011 2012 2013 Today
GAAP Lease Yield WACC
5‐Yr Average GAAP Lease Yield
9.9%
5‐Yr AverageWACC6.7%

38
• $199 million available under unsecured credit agreement • $30 million available under private shelf agreement
Additional $229 Million in Committed Debt Financing
Even Assuming full usage, leverage would remain modest
Ample Flexibility To Pursue Further Investments
Committed Financing to Fund Future Growth

39
$0.00
$0.22
$0.45
$0.68
$0.91
$1.13
$1.36
$1.59
$1.81
$2.04
2003 2004 2005 2006 2007 2008 2009 2010 2011 2012 2013 2014
Since 2003, LTC has grown its annual dividend to $2.04 per share from $0.65.LTC currently pays a monthly dividend of $0.17 per share.
Safe and Growing Dividend

40
0%
10%
20%
30%
40%
50%
60%
70%
80%
90%
100%
2004 2005 2006 2007 2008 2009 2010 2011 2012 2013 2014 YTD
Target Payout 80%
Strong Dividend CoverageDiluted Normalized FAD Dividend Payout Ratio

41
Management Q&A

42
Fireside Chat
Lynne KatzmannFounder, President and CEO
Rick GrimesCEO

43
Juniper CommunitiesLynne KatzmannFounder, President and CEO
Founded: 1988
Communities: 18Assisted Living, Memory Care, Skilled Nursing
Annual Revenues: $65 million
Resident Capacity: 1,251
Geography: Colorado, Florida, New Jersey, Pennsylvania
LTC Relationship: Operator

44
Assisted Living Federation of America (ALFA)
Rick Grimes
CEO
Membership: Operators and managers of senior living communities; allied companies that serve with senior living operators
Mission: Members exemplify the principles of choice, dignity, and independence for seniors
Advocacy: Educates federal and state policymakers about the assisted living philosophy and advocates for public policy that advances quality of life for seniors
45
Guest Speakers Q&A