2014 annual reports1.q4cdn.com/579586326/files/doc_financials/final-2014-annual-repo… · 2014...
TRANSCRIPT

30JAN201416052574
2014 Annual Report
Contents
Fairfax Corporate Performance . . . . . . . . . . . . . 1
Corporate Profile . . . . . . . . . . . . . . . . . . . . . . 2
Chairman’s Letter to Shareholders . . . . . . . . . . 4
Management’s Responsibility for the FinancialStatements and Management’s Report onInternal Control over Financial Reporting . . . 25
Independent Auditor’s Report to theShareholders . . . . . . . . . . . . . . . . . . . . . . . . 26
Fairfax Consolidated Financial Statements . . . . . 28
Notes to Consolidated Financial Statements . . . 35
Management’s Discussion and Analysis ofFinancial Condition and Results of Operations 114
Appendix – Fairfax Guiding Principles . . . . . . . . 208
Corporate Information . . . . . . . . . . . . . . . . . . 209
30JAN201416052574
2014 Annual Report
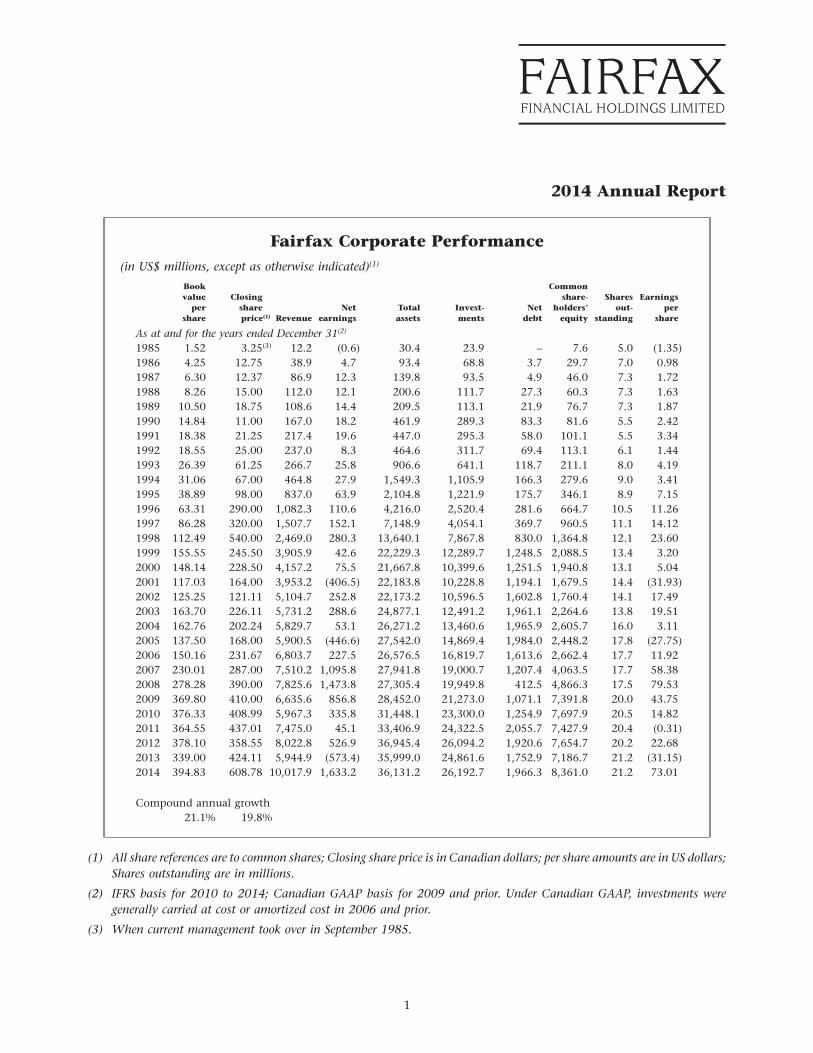
Fairfax Corporate Performance(in US$ millions, except as otherwise indicated)(1)
Book Commonvalue Closing share- Shares Earnings
per share Net Total Invest- Net holders’ out- pershare price(1) Revenue earnings assets ments debt equity standing share
As at and for the years ended December 31(2)
1985 1.52 3.25(3) 12.2 (0.6) 30.4 23.9 – 7.6 5.0 (1.35)1986 4.25 12.75 38.9 4.7 93.4 68.8 3.7 29.7 7.0 0.981987 6.30 12.37 86.9 12.3 139.8 93.5 4.9 46.0 7.3 1.721988 8.26 15.00 112.0 12.1 200.6 111.7 27.3 60.3 7.3 1.631989 10.50 18.75 108.6 14.4 209.5 113.1 21.9 76.7 7.3 1.871990 14.84 11.00 167.0 18.2 461.9 289.3 83.3 81.6 5.5 2.421991 18.38 21.25 217.4 19.6 447.0 295.3 58.0 101.1 5.5 3.341992 18.55 25.00 237.0 8.3 464.6 311.7 69.4 113.1 6.1 1.441993 26.39 61.25 266.7 25.8 906.6 641.1 118.7 211.1 8.0 4.191994 31.06 67.00 464.8 27.9 1,549.3 1,105.9 166.3 279.6 9.0 3.411995 38.89 98.00 837.0 63.9 2,104.8 1,221.9 175.7 346.1 8.9 7.151996 63.31 290.00 1,082.3 110.6 4,216.0 2,520.4 281.6 664.7 10.5 11.261997 86.28 320.00 1,507.7 152.1 7,148.9 4,054.1 369.7 960.5 11.1 14.121998 112.49 540.00 2,469.0 280.3 13,640.1 7,867.8 830.0 1,364.8 12.1 23.601999 155.55 245.50 3,905.9 42.6 22,229.3 12,289.7 1,248.5 2,088.5 13.4 3.202000 148.14 228.50 4,157.2 75.5 21,667.8 10,399.6 1,251.5 1,940.8 13.1 5.042001 117.03 164.00 3,953.2 (406.5) 22,183.8 10,228.8 1,194.1 1,679.5 14.4 (31.93)2002 125.25 121.11 5,104.7 252.8 22,173.2 10,596.5 1,602.8 1,760.4 14.1 17.492003 163.70 226.11 5,731.2 288.6 24,877.1 12,491.2 1,961.1 2,264.6 13.8 19.512004 162.76 202.24 5,829.7 53.1 26,271.2 13,460.6 1,965.9 2,605.7 16.0 3.112005 137.50 168.00 5,900.5 (446.6) 27,542.0 14,869.4 1,984.0 2,448.2 17.8 (27.75)2006 150.16 231.67 6,803.7 227.5 26,576.5 16,819.7 1,613.6 2,662.4 17.7 11.922007 230.01 287.00 7,510.2 1,095.8 27,941.8 19,000.7 1,207.4 4,063.5 17.7 58.382008 278.28 390.00 7,825.6 1,473.8 27,305.4 19,949.8 412.5 4,866.3 17.5 79.532009 369.80 410.00 6,635.6 856.8 28,452.0 21,273.0 1,071.1 7,391.8 20.0 43.752010 376.33 408.99 5,967.3 335.8 31,448.1 23,300.0 1,254.9 7,697.9 20.5 14.822011 364.55 437.01 7,475.0 45.1 33,406.9 24,322.5 2,055.7 7,427.9 20.4 (0.31)2012 378.10 358.55 8,022.8 526.9 36,945.4 26,094.2 1,920.6 7,654.7 20.2 22.682013 339.00 424.11 5,944.9 (573.4) 35,999.0 24,861.6 1,752.9 7,186.7 21.2 (31.15)2014 394.83 608.78 10,017.9 1,633.2 36,131.2 26,192.7 1,966.3 8,361.0 21.2 73.01
Compound annual growth21.1% 19.8%
(1) All share references are to common shares; Closing share price is in Canadian dollars; per share amounts are in US dollars;Shares outstanding are in millions.
(2) IFRS basis for 2010 to 2014; Canadian GAAP basis for 2009 and prior. Under Canadian GAAP, investments weregenerally carried at cost or amortized cost in 2006 and prior.
(3) When current management took over in September 1985.
1
Corporate Profile
Fairfax Financial Holdings Limited is a holding company whose corporate objective is to build long termshareholder value by achieving a high rate of compound growth in book value per share over the long term. Thecompany has been under present management since September 1985.
Canadian insurance
Northbridge Financial, based in Toronto, provides property and casualty insurance products in the Canadianmarket through its Northbridge Insurance and Federated subsidiaries. It is one of the largest commercial propertyand casualty insurers in Canada based on gross premiums written. In 2014, Northbridge’s net premiums written wereCdn$1,067.7 million. At year-end, the company had statutory equity of Cdn$1,407.4 million and there were1,452 employees.
U.S. insurance
Crum & Forster (C&F), based in Morristown, New Jersey, is a national commercial property and casualty insurancecompany in the United States writing a broad range of commercial coverages. Its subsidiary Seneca Insuranceprovides property and casualty insurance to small businesses and certain specialty coverages. C&F’s other specialtyniche property and casualty business and its accident and health insurance business are carried on through itsFairmont Specialty division. In February 2011, C&F acquired First Mercury, which offers insurance products andservices primarily related to specialty commercial insurance markets, focusing on niche and underserved segments.In July 2013, C&F acquired Hartville, which provides pet insurance through C&F’s Fairmont Specialty division. In2014, C&F’s net premiums written were US$1,346.3 million. At year-end, the company had statutory surplus ofUS$1,231.4 million and there were 1,797 employees.
Zenith National, based in Woodland Hills, California, is primarily engaged in the workers’ compensationinsurance business in the United States. In 2014, Zenith National’s net premiums written were US$720.9 million. Atyear-end, the company had statutory surplus of US$564.5 million and there were 1,476 employees.
Asian insurance
First Capital, based in Singapore, writes property and casualty insurance primarily in Singapore markets. In 2014,First Capital’s net premiums written were SGD 206.4 million (approximately SGD 1.3 = US$1). At year-end, thecompany had shareholders’ equity of SGD 538.9 million and there were 155 employees.
Falcon Insurance, based in Hong Kong, writes property and casualty insurance in niche markets in Hong Kong. In2014, Falcon’s net premiums written were HK$532.3 million (approximately HK$7.8 = US$1). At year-end, thecompany had shareholders’ equity of HK$509.7 million and there were 66 employees.
Pacific Insurance, based in Malaysia, writes all classes of general insurance and medical insurance in Malaysia. In2014, Pacific Insurance’s net premiums written were MYR 153.5 million (approximately MYR 3.3 = US$1). Atyear-end, the company had shareholders’ equity of MYR 263.6 million and there were 235 employees.
Fairfax Indonesia, based in Indonesia, writes all classes of general insurance, specializing in automobile coveragein Indonesia. In 2014, Fairfax Indonesia’s net premiums written were IDR 18.6 billion (approximately IDR 11,848.3 =US$1). At year-end, the company had shareholders’ equity of IDR 312.7 billion and there were 40 employees.
Other insurance
Fairfax Brasil, based in Sao Paulo, commenced writing insurance in March 2010 in all lines of business in Brazil. In2014, Fairfax Brasil’s net premiums written were BRL130.7 million (approximately BRL 2.3 = US$1). At year-end, thecompany had shareholders’ equity of BRL 53.5 million and there were 81 employees.
Pethealth, based in Toronto with 290 employees, provides pet medical insurance, management software andpet-related database management services in North America and the United Kingdom. In 2014, Pethealth producedgross premiums written of Cdn$72 million.
2
FAIRFAX FINANCIAL HOLDINGS LIMITED
Reinsurance
OdysseyRe, based in Stamford, Connecticut, underwrites treaty and facultative reinsurance as well as specialtyinsurance, with principal locations in the United States, Toronto, London, Paris, Singapore and Latin America. In2014, OdysseyRe’s net premiums written were US$2,393.8 million. At year-end, the company had shareholders’equity of US$4,012.6 million and there were 924 employees.
Advent, based in the U.K., is a reinsurance and insurance company, operating through Syndicate 780 at Lloyd’s,focused on specialty property reinsurance and insurance risks. In 2014, Advent’s net premiums written wereUS$153.6 million. At year-end, the company had shareholders’ equity of US$174.5 million and there were102 employees.
Polish Re, based in Warsaw, Poland, writes reinsurance in the Central and Eastern European regions. In 2014, PolishRe’s net premiums written were PLN 129.7 million (approximately PLN 3.1 = US$1). At year-end, the company hadshareholders’ equity of PLN 284.6 million and there were 44 employees.
Group Re primarily constitutes the participation by CRC Re and Wentworth (both based in Barbados) in thereinsurance of Fairfax’s subsidiaries by quota share or through participation in those subsidiaries’ third partyreinsurance programs on the same terms and pricing as the third party reinsurers. Group Re also writes third partybusiness. In 2014, Group Re’s net premiums written were US$163.4 million. At year-end, the Group Re companieshad combined shareholders’ equity of US$540.1 million.
Runoff
The runoff business comprises the U.S. and the European runoff groups. At year-end, the runoff group had combinedshareholders’ equity of US$2,064.7 million.
The Resolution Group (TRG) and the RiverStone Group (run by TRG management) manage runoff under theRiverStone name. At year-end, TRG/RiverStone had 265 employees in the U.S., located primarily in Manchester,New Hampshire, and 118 employees in its offices in the United Kingdom.
Other
Hamblin Watsa Investment Counsel, founded in 1984 and based in Toronto, provides investment managementto the insurance, reinsurance and runoff subsidiaries of Fairfax.
Notes:
(1) All of the above companies are wholly owned (except for 98%-owned First Capital and 80%-owned Fairfax Indonesia).
(2) The foregoing lists all of Fairfax’s operating subsidiaries (many of which operate through their own wholly-ownedoperating subsidiaries). The Fairfax corporate structure also includes a 41.4% interest in Gulf Insurance (a Kuwaitcompany with property and casualty insurance operations in the MENA region), a 26.0% interest in ICICI Lombard(an Indian property and casualty insurance company), a 15.0% interest in Alltrust (a Chinese property and casualtyinsurance company), a 30.0% interest in Thai Re Public Company Limited, a 27.3% interest in Singapore Re, and a40.5% interest in Falcon (Thailand) (a Thai property and casualty insurance company), as well as investments in anumber of non-insurance-related companies. The other companies in the Fairfax corporate structure, which include anumber of intermediate holding companies, have no insurance, reinsurance, runoff or other operations.
3
FAIRFAX FINANCIAL HOLDINGS LIMITED
To Our Shareholders:
Our results in 2014 were the best in our 29-year history, with record underwriting profit of $552 million(1) and recordnet earnings of $1.6 billion. Our combined ratio of 90.8% was the lowest in our history, with all our major insurancecompanies having combined ratios less than 100%. Book value per share increased 19.5% (adjusted for the $10 pershare dividend paid) to $395 per share and our stock price increased 44% to Cdn$609. We had a good year – and itwas about time! Since we began in 1985, our book value per share has compounded at 21.1% annually while ourcommon stock price has compounded at 19.8% annually.
Here’s how our insurance companies performed in 2014:
Combined UnderwritingRatio Profit
Northbridge 95.5% 43Crum & Forster 99.8% 2Zenith 87.5% 90OdysseyRe 84.7% 360Fairfax Asia 86.7% 36Other Insurance and Reinsurance 94.7% 21
Consolidated 90.8% 552
As you can see in the table, all our major insurance operations had a combined ratio less than 100%, with OdysseyRecontributing 65% of our record underwriting profit and Zenith 16%. OdysseyRe had another outstanding year underBrian Young’s leadership while Zenith, under Jack Miller’s leadership, had the best year since we bought it in 2010.Fairfax Asia, under Mr. Athappan’s leadership, continued its outstanding performance while Northbridge, underSilvy Wright, and Crum & Forster, under Doug Libby, performed very well.
2014 was a year in which a number of management successions took place in our insurance subsidiaries, all in theFairfax style – smoothly, with an internal successor. Doug Libby, after 15 years of outstanding performance at Senecaand Crum & Forster, decided to retire. Doug celebrated 25 years with Seneca in 2014 – and what a wonderful recordhe has had there. He took a virtually bankrupt company in 1989, made it profitable in three years and then had anaverage combined ratio of 88.3% for the next 22 years, with average annual reserve redundancies of 6.8% per year.Since we purchased Seneca in 2000, it has had an average combined ratio of 87.0%, generated cumulativeunderwriting profits of $230 million and increased its net premiums written from $41 million to $242 million.Including investment income, Seneca has earned cumulative after-tax profits of $308 million, versus our purchaseprice of $65 million. Doug moved Crum & Forster, which he took over in 2008, to a specialty line focus to better serveits clients. Specialty lines now account for over 80% of Crum & Forster’s business, versus 5% when we purchased it,and Doug was able to achieve a combined ratio below 100% in 2014. With much gratitude, we wish Doug, Miani andfamily a happy retirement.
Doug passed the baton to Marc Adee, who has been with us since 2000 when he joined TIG Insurance in Dallas asChief Actuary. Marc then ran Fairmont (the good insurance business segments from our TIG and Rangeracquisitions) from 2004 with an average combined ratio of 93.0% over the past 11 years while increasing its grosspremiums written by over 300% from $206 million to $636 million. Recently, Marc took over the running of FirstMercury. We are excited about Crum & Forster’s prospects under Marc’s leadership.
Late in 2014, Jack Miller decided to pass the role of CEO at Zenith to Kari Van Gundy while retaining the role ofChairman. Jack has done an outstanding job over the past 17 years at Zenith, being Stanley Zax’s right hand man forthe first 14 years and then taking over as CEO in 2012 when Stanley retired. Jack has been instrumental in buildingZenith’s team culture and providing outstanding customer service to its clients and brokers. It is fitting that Jackdecided to step down as CEO after the year that Zenith generated the lowest combined ratio (87.5%), with excellentreserving, since we acquired it in 2010. Given Jack’s long experience at Zenith, he will help Andy Barnard and all ofour Presidents enhance the focus on customer service excellence at Fairfax.
(1) Amounts in this letter are in U.S. dollars unless specified otherwise. Numbers in the tables in this letter are in U.S. dollars and $ millionsexcept as otherwise indicated.
4
Kari has been with Zenith for 23 years, first as Chief Financial Officer of a subsidiary, then as Chief Financial Officerof Zenith and later as Chief Operating Officer of Zenith. Over the years, Kari has been intimately involved in thedevelopment of the company’s culture and track record of underwriting profitability. Going forward, she will beassisted by Davidson Pattiz who will be Zenith’s Chief Operating Officer. Davidson has run the Claims Department atZenith for nine years. We are excited about Zenith’s prospects under Kari’s and Davidson’s leadership.
Finally, at Fairfax Brasil, as planned, Jacques Bergman passed the role of CEO to Bruno Camargo while retaining therole of Chairman. Jacques and Bruno were the key reasons we began our Brazilian operations from scratch inSao Paulo. We have attained critical mass in Brazil with $158 million in gross premiums written and approximately80 employees but have not attained underwriting profitability yet. Together with Jean Cloutier at Fairfax, Jacqueswill help us develop our operations in Latin America while Bruno will take the company forward. Jacques and Brunohave worked together for the past 17 years, the last five within Fairfax. We continue to be excited about our prospectsin Brazil under Bruno’s leadership.
Andy Barnard continues to do an outstanding job overseeing all our insurance operations as the President of FairfaxInsurance Group. It has been approximately four years since he moved from being the CEO of OdysseyRe to beingresponsible for our insurance and reinsurance operations – first only in the U.S., and now worldwide. The results areobvious for everyone to see! Even apart from benefitting from reduced catastrophes, our underwriting results havebeen outstanding – and should continue to be so! Andy has helped mold our team-oriented Fairfax culture, fosterstrict underwriting discipline with good reserving and develop our talent across all our companies, includingencouraging executive transfers within the group. One of the key reasons for our success over the years is ourdecentralized structure where each President is responsible for the success of his or her operations. There is no betterway to empower people. Andy has developed this structure further by developing profit centres in each of ourcompanies. We now have over 100 profit centres in our worldwide operations. The leaders of our profit centres, ineffect, are presidents of their own operations and are responsible for providing outstanding customer service, lookingafter their employees and providing an underwriting profit with good reserving. This is a very important,empowering structure for our company, and we are excited about its possibilities. The Executive Leadership Council(ELC), under Andy, consists of the heads of our major company groupings, plus Paul Rivett, Peter Clarke and JeanCloutier of Fairfax. The ELC facilitates the coordination of our diversified insurance and reinsurance operations. Ourworking groups – all our claims officers, all our chief actuaries, etc. – continue to explore best practices and takeadvantage of our companies’ individual expertise. The Talent and Culture Development working group is deepeningthe practice of our ‘‘fair and friendly’’ culture, with a special focus on outstanding customer service. Our specialculture – nurtured and preserved over our 29 years and expressed in our Guiding Principles, which again arereproduced as an Appendix to this Annual Report – will be the major reason for our long term success.
Our Fairfax Leadership Workshop, which brings together about 25 of our most promising managers from across theglobe for a week of training and networking in Toronto, is working exceptionally well. After this year’s workshop,there will be approximately 100 of our managers from across the world who will have participated in this program. Ina decentralized operation, this is a great way to spread our culture and knowledge of our operations and to connectkey leaders across our companies. As I have said before, the future of Fairfax is in terrific hands.
During 2014, we continued to expand our insurance operations worldwide. At Fairfax Asia, under Mr. Athappan, wedid several transactions. We became partners with the Bintoro family in Indonesia, acquiring an 80% interest in PTBatavia Mitratama Insurance, run by Arun Nanwani. We agreed to purchase MCIS Insurance Berhad in Malaysiawhich, combined with Pacific Berhad, will have approximately $84 million of net premiums written in that country.Gobi Athappan will run our Malaysian operations, while Falcon Hong Kong will be run by Cody Hui. In Sri Lanka, webecame partners with the John Keells Group, one of the most reputable companies in that country, by agreeing topurchase from them 78% of Union Insurance PLC. We welcome all the employees of these companies to the Fairfaxfamily. While these companies are small, I should remind you that when we acquired First Capital in 2002, it had$10 million (SGD$20 million) in gross premiums written and $32 million (SGD$50 million) in capital – 13 yearslater, Mr. Athappan has grown it to be the largest insurance company in Singapore, with $420 million in grosspremiums written, $400 million in capital – with no new capital injected – and an average combined ratio of 73.3%.
Last year we discussed our Hartville acquisition which brought us into the pet insurance business in the U.S. In 2014,we acquired Pethealth, based in Toronto, which has been in the pet insurance and ancillary businesses since 1998. Inthe past 17 years, Pethealth has grown to become the dominant provider of software and services, pet microchipsand, most importantly, insurance to pets adopted from animal shelters in the United States, Canada and theUnited Kingdom. With 165,000 insured pets in North America (230,000 globally), the company is one of the top pet
5
FAIRFAX FINANCIAL HOLDINGS LIMITED
insurers in North America. Pethealth’s adoption software is the leader in the animal shelter market in theUnited States and it is installed exclusively in over 2,000 animal shelters (these shelters represent more than 50% ofall new cat and dog adoptions in North America). Pethealth is the number one distributor of pet microchips in theworld. Microchip sales through the company’s animal shelter network have grown rapidly over the last five years andare now at 1.5 million annually (in total, the company’s microchips are embedded in approximately 9 million pets inNorth America – this highly accurate database is owned exclusively by Pethealth). The company’s proprietarydatabase (from shelter adoption and microchip management software) contains industry data on over 20 millionanimals, and the company is leveraging its distribution channels to generate increased revenue through the sale ofadditional products, including pet pharmaceuticals and pet food, in order to help adopters better look after theirpets.
We were very pleased that Sean Smith joined us to lead Pethealth. Pethealth has had an average combined ratio of94.7% in the last five years, with revenue of Cdn$52 million and gross premiums written of Cdn$72 million in 2014.Including underwriting profit and investment income from the insurance operations, our purchase price ofCdn$100 million for Pethealth was approximately 10 times free cash flow. With Hartville and Pethealth, each runseparately, Fairfax has become one of the largest pet insurers in North America.
Late in the year, we agreed to acquire the insurance operations of QBE in Hungary, the Czech Republic and Slovakia.These operations are well established in their respective countries with average combined ratios in the last ten yearsof 97.7%. In total, these operations had net premiums written of $44 million in 2014. We like the long term potentialfor the underpenetrated insurance markets in Eastern Europe and consider this an excellent platform to build on. Wewere excited to have Peter Csakvari join us after a 17-year stint at AIG, mainly in the markets of Eastern Europe. Webought these operations, which now become Fairfax Eastern Europe, for A9.75 million (the purchase includes anoffice building in Budapest). In 2014, these operations earned A5 million pre-tax. Early in 2015, we agreed to acquireQBE’s Ukrainian operations, which will be a part of Fairfax Eastern Europe, for about A5 million. Working with ourhead office, Bijan Khosrowshahi was key in these Eastern European acquisitions. As a result of these acquisitions, wewelcome some 200 people to the Fairfax family.
On February 16, 2015, we agreed to make an offer to buy 100% of Brit PLC (listed on the London Stock Exchange) fora total price of 305 pence per share, consisting of 280 pence in cash to be paid by us and Brit’s announced 2014 finaland special dividend payments of 25 pence. This total price values Brit at £1.22 billion, representing at December 31,2014 a price to net tangible assets multiple of 1.58 times, and is approximately nine times Brit’s 2014 earnings. Thetwo private equity owners of Brit, Apollo and CVC, and the directors of Brit, who own 74% of the shares outstanding,have irrevocably committed to accept our offer, which we expect to close by the third quarter of 2015.
Brit’s position as a market-leading global specialty insurer and reinsurer, its major presence in Lloyd’s and itsdisciplined approach to underwriting make it an attractive choice to join Fairfax’s expanding worldwide specialtyoperations. It is one of the largest syndicates at Lloyd’s and one of the leading Lloyd’s market operations, and itbenefits from the strong financial strength ratings assigned to Lloyd’s. Brit’s growing U.S. and international reach arehighly complementary to Fairfax’s existing worldwide operations, and the acquisition further diversifies Fairfax’sgroup risk portfolio. In addition, Brit will be able to leverage Fairfax’s expertise in the U.S. and internationalinsurance and reinsurance markets, thus enhancing Brit’s global product offering and providing it with expandedunderwriting opportunities and support.
Brit writes a diverse mix of specialty insurance and reinsurance business with a focus on direct insurance, where itsexperienced underwriting teams provide specialist, complex products and support to clients globally. In 2014, directinsurance accounted for 81% of Brit’s gross premiums written, with the remainder composed of an attractive book ofproperty and casualty reinsurance. Brit’s business is also diversified geographically, and since 2009 Brit has expandedits distribution reach internationally with the development of a local service company footprint which has generatedefficient and profitable growth across the Americas, Bermuda and Asia.
Brit is led by Mark Cloutier, Chief Executive Officer, and Matthew Wilson, Deputy CEO and Chief UnderwritingOfficer, and the company will continue to be run independently under Mark’s leadership post-acquisition. In 2014,Brit had net premiums written of £1.0 billion (US$1.7 billion) and earnings of £139 million (US$229 million). Thecompany’s investment portfolio is approximately £2.6 billion (US$4 billion). Brit’s average combined ratio for thelast ten years has been 94% (with reserve redundancies averaging 6% each year).
This acquisition will fit well within Fairfax as it will significantly raise our profile within the attractive Lloyd’smarketplace. As well, Brit is a leader in areas where other companies in the Fairfax group have more limited activity.
6
Both Advent and Newline will continue to be run independently of Brit. With Brit as part of our organization, theFairfax group will have a significant top five position in the Lloyd’s market and will continue to write business withthe Lloyd’s A+ rating.
We have known Mark Cloutier for decades and have established a relationship of mutual trust on the deals we havedone with him, most recently our acquisition of Brit’s runoff business in October 2012.
We quickly raised $1.1 billion of the $1.7 billion (after the 25 pence per share dividend) purchase cost of Brit throughbought deals with Bank of Montreal, Royal Bank of Canada and Bank of Nova Scotia for 1.15 million subordinatevoting shares of Fairfax (including the green shoe), Cdn$230 million of preferred shares (including the green shoe)with a dividend rate of 4.75% per annum, and Cdn$350 million of 10-year bonds with a coupon of 4.95% perannum. With respect to the 1.15 million shares we issued, Brit’s 2014 gross premiums written constitute $1,866 perFairfax share (versus $349 per existing Fairfax share currently) and Brit’s investment portfolio at the end of 2014constitutes investments of $3,510 per Fairfax share (versus $1,237 per existing Fairfax share currently).
We are very excited about the purchase of Brit PLC because of its exceptional underwriting record, and we lookforward to welcoming Mark Cloutier and the 465 Brit employees to the Fairfax family.
In May 2014, India’s political climate changed dramatically for the better with the election of Prime MinisterNarendra Modi with a resounding majority. For the first time in 67 years, India has an unabashedly business friendlygovernment. The ineffectiveness of India’s previous governments is seen by the fact that Canada’s economy atapproximately $2 trillion with 35 million people is about the same size as India’s economy with 1.2 billion people.Mr. Modi has had great success in Gujarat, a state with 65 million people which he governed as Chief Minister for13 years (elected three times). Gujarat had real economic growth of over 10% per year during this period whilebringing water and electricity and providing child education to virtually every household. We think Mr. Modi cantransform India, particularly if he gets re-elected for two more terms, as we think he will. He has an excellent trackrecord, is incorruptible and is business friendly. We expect Mr. Modi to be the Lee Kuan Yew of India!
Mr. Modi’s election led us to rethink the investment opportunities in India and our ability to fund them. While wehave $26 billion in investments at Fairfax, regulatory constraints limit our ability to invest significant amounts inIndia. Given our excellent long term track record investing in India, our very significant on the ground resourceswith Harsha Raghavan at Fairbridge, Madhavan Menon at Thomas Cook India, Ajit Isaac at Quess (the new name forIKYA), Ramesh Ramanathan at Sterling Resorts and also S. Gopalakrishnan, the long serving head of investments atICICI Lombard, we felt it was appropriate to create a new public company, Fairfax India, to invest in India. In early2015, Fairfax India went public, raising $1.1 billion and listing on the Toronto Stock Exchange. Fairfax provided$300 million of that capital by purchasing multiple voting shares, giving it 28% of the equity and 95% of the votes. Anumber of institutional investors, almost all existing long term Fairfax shareholders, invested approximately 90% ofthe remaining $800 million raised. We are very excited about the long term prospects for Fairfax India under theleadership of Chandran Ratnaswami as CEO and John Varnell as CFO.
Besides benefitting as a shareholder from its $300 million investment, Fairfax will receive fees from Fairfax India. Aswe wanted the fees to be very fair for the long term investors in Fairfax India, we structured them after negotiationswith Fidelity, the largest cornerstone investor. The fees are as follows: (i) an administration and advisory fee of 1⁄2% ofundeployed capital and 11⁄2% of capital invested in India. Fairfax will bear the full compensation costs of FairfaxIndia’s senior employees; and (ii) a performance fee, calculated over three-year periods, equal to 20% of any return,calculated from inception, above a 5% annual hurdle, payable in shares of Fairfax India (if the shares are trading atmore than two times their net asset value, Fairfax has the option of taking the fee in cash).
Last year we said that Thomas Cook India would be our vehicle for further expansion in India. For the reasonsmentioned above, we have now added Fairfax India as an investment vehicle in India. Thomas Cook India’sresources may constrain the size of deals it can do, although we expect that deals in its area of expertise will continueto be done in that company. In determining the appropriate vehicle for any investment, we will consider all of therelevant circumstances and we will be fair, as always, in order not to disadvantage one of these vehicles.
Also last year, I mentioned how excited I was about our investment in Thomas Cook India, and through it in IKYAHuman Resources (now rechristened as Quess Human Resources) and Sterling Resorts. These wonderful businesses
7
FAIRFAX FINANCIAL HOLDINGS LIMITED
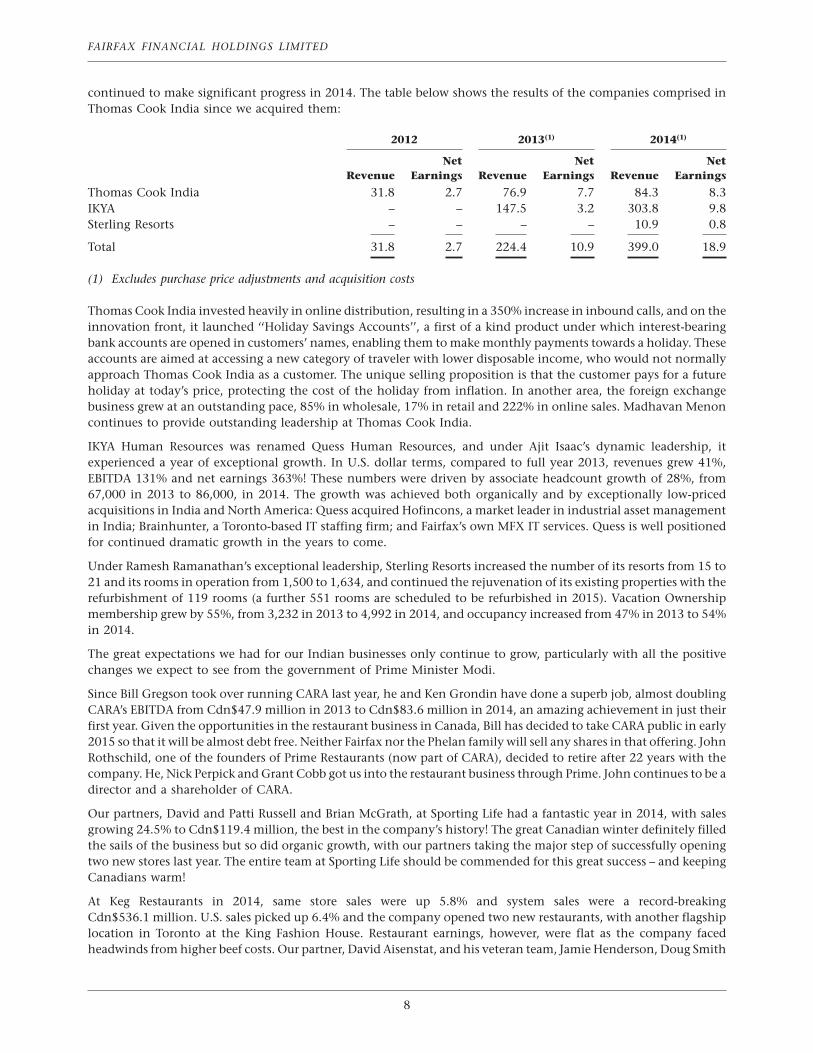
continued to make significant progress in 2014. The table below shows the results of the companies comprised inThomas Cook India since we acquired them:
2012 2013(1) 2014(1)
Net Net NetRevenue Earnings Revenue Earnings Revenue Earnings
Thomas Cook India 31.8 2.7 76.9 7.7 84.3 8.3IKYA – – 147.5 3.2 303.8 9.8Sterling Resorts – – – – 10.9 0.8
Total 31.8 2.7 224.4 10.9 399.0 18.9
(1) Excludes purchase price adjustments and acquisition costs
Thomas Cook India invested heavily in online distribution, resulting in a 350% increase in inbound calls, and on theinnovation front, it launched ‘‘Holiday Savings Accounts’’, a first of a kind product under which interest-bearingbank accounts are opened in customers’ names, enabling them to make monthly payments towards a holiday. Theseaccounts are aimed at accessing a new category of traveler with lower disposable income, who would not normallyapproach Thomas Cook India as a customer. The unique selling proposition is that the customer pays for a futureholiday at today’s price, protecting the cost of the holiday from inflation. In another area, the foreign exchangebusiness grew at an outstanding pace, 85% in wholesale, 17% in retail and 222% in online sales. Madhavan Menoncontinues to provide outstanding leadership at Thomas Cook India.
IKYA Human Resources was renamed Quess Human Resources, and under Ajit Isaac’s dynamic leadership, itexperienced a year of exceptional growth. In U.S. dollar terms, compared to full year 2013, revenues grew 41%,EBITDA 131% and net earnings 363%! These numbers were driven by associate headcount growth of 28%, from67,000 in 2013 to 86,000, in 2014. The growth was achieved both organically and by exceptionally low-pricedacquisitions in India and North America: Quess acquired Hofincons, a market leader in industrial asset managementin India; Brainhunter, a Toronto-based IT staffing firm; and Fairfax’s own MFX IT services. Quess is well positionedfor continued dramatic growth in the years to come.
Under Ramesh Ramanathan’s exceptional leadership, Sterling Resorts increased the number of its resorts from 15 to21 and its rooms in operation from 1,500 to 1,634, and continued the rejuvenation of its existing properties with therefurbishment of 119 rooms (a further 551 rooms are scheduled to be refurbished in 2015). Vacation Ownershipmembership grew by 55%, from 3,232 in 2013 to 4,992 in 2014, and occupancy increased from 47% in 2013 to 54%in 2014.
The great expectations we had for our Indian businesses only continue to grow, particularly with all the positivechanges we expect to see from the government of Prime Minister Modi.
Since Bill Gregson took over running CARA last year, he and Ken Grondin have done a superb job, almost doublingCARA’s EBITDA from Cdn$47.9 million in 2013 to Cdn$83.6 million in 2014, an amazing achievement in just theirfirst year. Given the opportunities in the restaurant business in Canada, Bill has decided to take CARA public in early2015 so that it will be almost debt free. Neither Fairfax nor the Phelan family will sell any shares in that offering. JohnRothschild, one of the founders of Prime Restaurants (now part of CARA), decided to retire after 22 years with thecompany. He, Nick Perpick and Grant Cobb got us into the restaurant business through Prime. John continues to be adirector and a shareholder of CARA.
Our partners, David and Patti Russell and Brian McGrath, at Sporting Life had a fantastic year in 2014, with salesgrowing 24.5% to Cdn$119.4 million, the best in the company’s history! The great Canadian winter definitely filledthe sails of the business but so did organic growth, with our partners taking the major step of successfully openingtwo new stores last year. The entire team at Sporting Life should be commended for this great success – and keepingCanadians warm!
At Keg Restaurants in 2014, same store sales were up 5.8% and system sales were a record-breakingCdn$536.1 million. U.S. sales picked up 6.4% and the company opened two new restaurants, with another flagshiplocation in Toronto at the King Fashion House. Restaurant earnings, however, were flat as the company facedheadwinds from higher beef costs. Our partner, David Aisenstat, and his veteran team, Jamie Henderson, Doug Smith
8
and Neil Maclean, continue to build on the ‘‘Kegger’’ commitment to be the best and most consistent high-enddining experience in the country. The brand has never been better and we owe their success to Keggers everywhere.
The tableware and kitchenware spaces continue to be extremely competitive and challenged by the lower Canadiandollar. Mark Halpern and his team at Kitchen Stuff Plus have worked tremendously hard to grow the business,opening one new store and increasing revenue 9.1% to Cdn$43.1 million. Despite the challenges to margins,operations continued to be profitable and the company remains on its growth trajectory in the greater Toronto area.William Ashley also faced these competitive headwinds in addition to moving the location of its iconic holiday sale.After 38 years in one location, with much fanfare the entire holiday sale was moved to a new permanent locationnorth of Toronto and the company’s loyal customers followed with an increase in sales at the new location of 4.3% toCdn$8.5 million. Jackie Chiesa and Carole Sovran and the entire team at William Ashley should be applauded fortheir tremendous effort during this transition year.
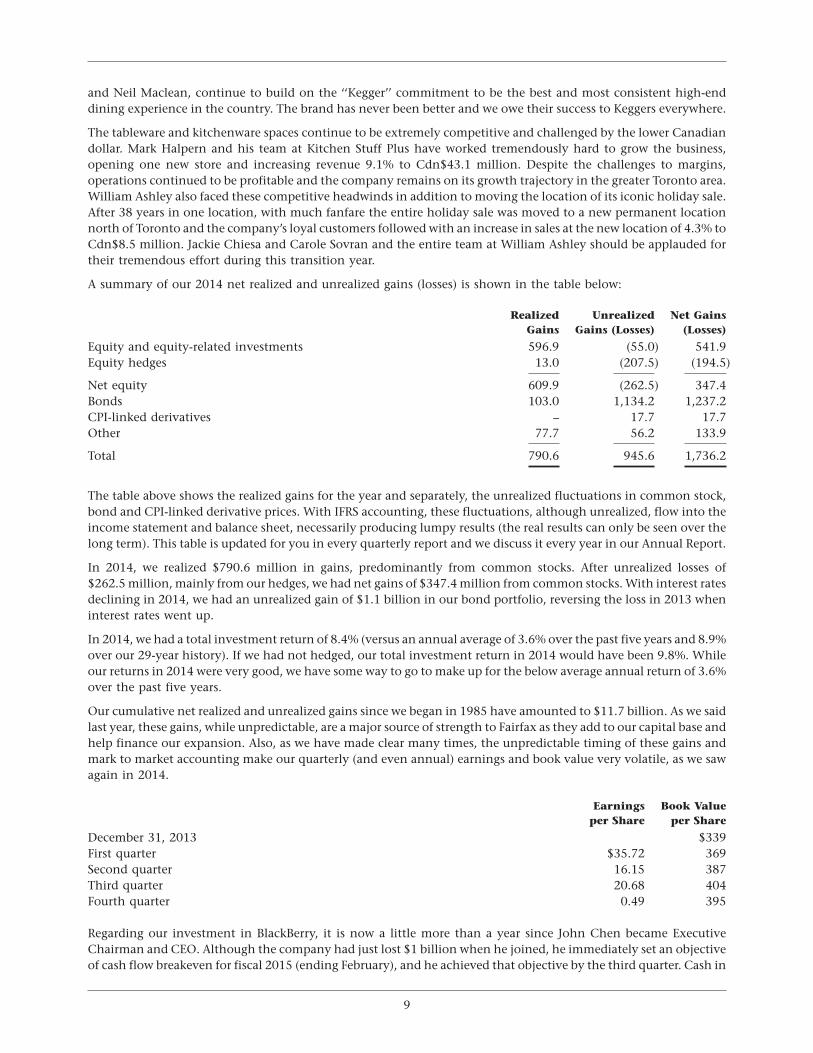
A summary of our 2014 net realized and unrealized gains (losses) is shown in the table below:
Realized Unrealized Net GainsGains Gains (Losses) (Losses)
Equity and equity-related investments 596.9 (55.0) 541.9Equity hedges 13.0 (207.5) (194.5)
Net equity 609.9 (262.5) 347.4Bonds 103.0 1,134.2 1,237.2CPI-linked derivatives – 17.7 17.7Other 77.7 56.2 133.9
Total 790.6 945.6 1,736.2
The table above shows the realized gains for the year and separately, the unrealized fluctuations in common stock,bond and CPI-linked derivative prices. With IFRS accounting, these fluctuations, although unrealized, flow into theincome statement and balance sheet, necessarily producing lumpy results (the real results can only be seen over thelong term). This table is updated for you in every quarterly report and we discuss it every year in our Annual Report.
In 2014, we realized $790.6 million in gains, predominantly from common stocks. After unrealized losses of$262.5 million, mainly from our hedges, we had net gains of $347.4 million from common stocks. With interest ratesdeclining in 2014, we had an unrealized gain of $1.1 billion in our bond portfolio, reversing the loss in 2013 wheninterest rates went up.
In 2014, we had a total investment return of 8.4% (versus an annual average of 3.6% over the past five years and 8.9%over our 29-year history). If we had not hedged, our total investment return in 2014 would have been 9.8%. Whileour returns in 2014 were very good, we have some way to go to make up for the below average annual return of 3.6%over the past five years.
Our cumulative net realized and unrealized gains since we began in 1985 have amounted to $11.7 billion. As we saidlast year, these gains, while unpredictable, are a major source of strength to Fairfax as they add to our capital base andhelp finance our expansion. Also, as we have made clear many times, the unpredictable timing of these gains andmark to market accounting make our quarterly (and even annual) earnings and book value very volatile, as we sawagain in 2014.
Earnings Book Valueper Share per Share
December 31, 2013 $339First quarter $35.72 369Second quarter 16.15 387Third quarter 20.68 404Fourth quarter 0.49 395
Regarding our investment in BlackBerry, it is now a little more than a year since John Chen became ExecutiveChairman and CEO. Although the company had just lost $1 billion when he joined, he immediately set an objectiveof cash flow breakeven for fiscal 2015 (ending February), and he achieved that objective by the third quarter. Cash in
9
FAIRFAX FINANCIAL HOLDINGS LIMITED
the holding company exceeds $3 billion as he monetized real estate assets and tax loss carry forwards. He hasflawlessly introduced two magnificent new products, the Passport, which I use, and the BlackBerry Classic, but he hassaid the future of BlackBerry would be in the Internet of Things. The Internet of Things is a system that connects datagenerators (devices that could monitor useful information) with people who want to track the data (data consumers).BlackBerry’s QNX subsidiary, which dominates automobile infotainment systems, plans to play a major role in thedevelopment of the Internet of Things.
Having achieved cash flow breakeven, John is now focused on building the revenue and profits of BlackBerryorganically and through acquisitions and we have no doubt he will be successful. His outstanding 15-year record atSybase precedes him.
I have learned that the tech world is very difficult to predict and things change very quickly. Yesterday’s hit can betoday’s dog, but with the right leadership, things can also change very quickly for the positive. We continue to beexcited to be long term shareholders of BlackBerry and have no intention of supporting a takeover of BlackBerry.
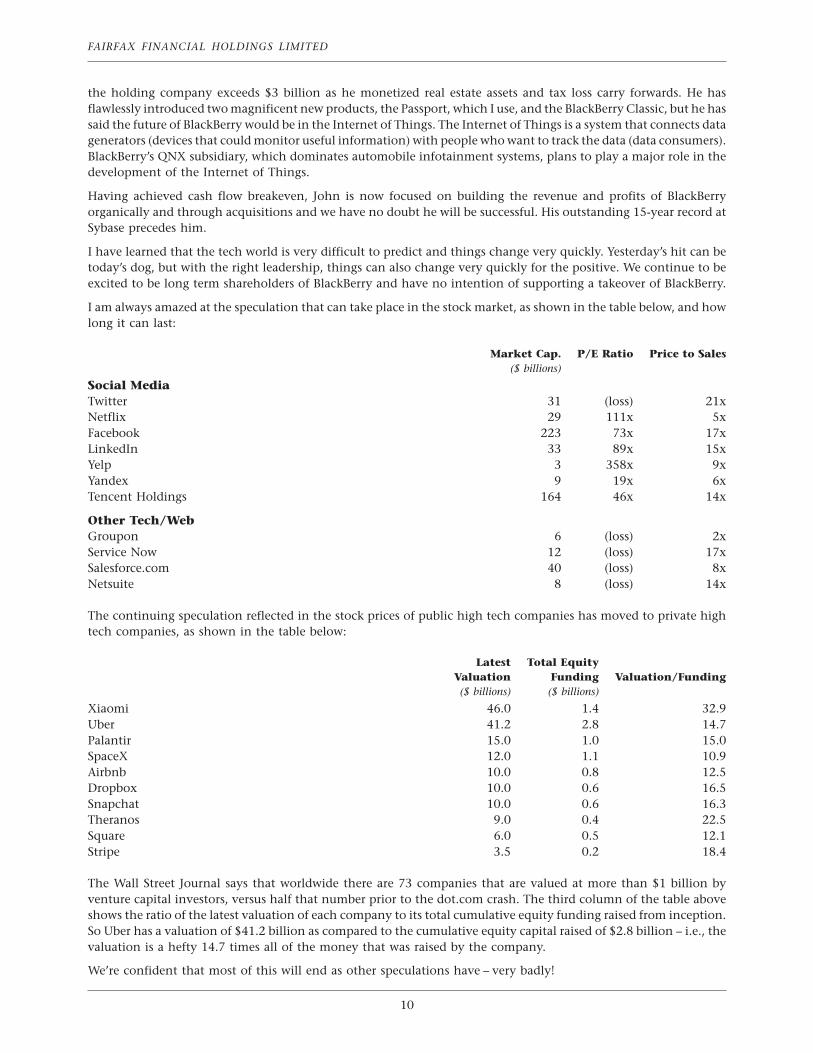
I am always amazed at the speculation that can take place in the stock market, as shown in the table below, and howlong it can last:
Market Cap. P/E Ratio Price to Sales($ billions)
Social MediaTwitter 31 (loss) 21xNetflix 29 111x 5xFacebook 223 73x 17xLinkedIn 33 89x 15xYelp 3 358x 9xYandex 9 19x 6xTencent Holdings 164 46x 14x
Other Tech/WebGroupon 6 (loss) 2xService Now 12 (loss) 17xSalesforce.com 40 (loss) 8xNetsuite 8 (loss) 14x
The continuing speculation reflected in the stock prices of public high tech companies has moved to private hightech companies, as shown in the table below:
Latest Total EquityValuation Funding Valuation/Funding($ billions) ($ billions)
Xiaomi 46.0 1.4 32.9Uber 41.2 2.8 14.7Palantir 15.0 1.0 15.0SpaceX 12.0 1.1 10.9Airbnb 10.0 0.8 12.5Dropbox 10.0 0.6 16.5Snapchat 10.0 0.6 16.3Theranos 9.0 0.4 22.5Square 6.0 0.5 12.1Stripe 3.5 0.2 18.4
The Wall Street Journal says that worldwide there are 73 companies that are valued at more than $1 billion byventure capital investors, versus half that number prior to the dot.com crash. The third column of the table aboveshows the ratio of the latest valuation of each company to its total cumulative equity funding raised from inception.So Uber has a valuation of $41.2 billion as compared to the cumulative equity capital raised of $2.8 billion – i.e., thevaluation is a hefty 14.7 times all of the money that was raised by the company.
We’re confident that most of this will end as other speculations have – very badly!
10
Richie Boucher, at the Bank of Ireland, had an outstanding year in 2014 as the Bank earned A921 million with alltrading divisions profitable – an improvement of A1.5 billion over 2013. The Bank of Ireland made A10 billion of newloans – an increase of over 50% from 2013 – and was the largest lender to the Irish economy during 2014. The Bankpassed the ECB stress test with substantial capital buffers. Impairment charges were reduced by A1.2 billion reflectingimprovements in asset quality and Irish mortgage writebacks of A280 million. House prices and commercial realestate prices have begun trending up. Ireland had the highest growth in the Eurozone in 2014 at 5.0% and recentlyIrish 10-year bond rates hit 0.9% – a far cry from the 14.1% in 2011 when we invested in the Bank of Ireland. We arevery grateful to Richie and his team at the Bank of Ireland.
We began our Greece odyssey in 2012 when our Wade Burton made his first trip to Athens. In Greece, if a financialinstitution had bought the bonds with the highest credit rating in the country, Greek government bonds, it wentbankrupt as the government gave investors a 50% haircut. Every Greek bank, trying to play it safe by buying Greekgovernment bonds, went bust. Greek government bond rates went to very high levels in 2012 and market valueswere pummelled. In this environment and shortly thereafter, with the election of a pro-business government, wetook major positions in some of the leading Greek companies. We purchased the following:
1. Europroperties, now called Grivalia
We own 40.6% of the total shares outstanding of the country’s world class REIT, Grivalia. Grivalia ownssome of the finest commercial buildings in Athens, fully leased to AAA tenants, and is run by an outstandingCEO, George Chryssikos. With rental rates down 50% and property values down commensurately, at ourcost, Grivalia is yielding 7.5%, and the price we paid was 37% below replacement cost. We own 41 millionshares at A5.37 per share versus a market price of A8.59 per share currently. George took Grivalia into thecrash in Greece totally liquid (net cash, in fact) and waited patiently before buying commercial and retailbuildings at a fraction of what they sold for a few years ago. He continues to be active and is verywell financed.
2. Praktiker Greece
Through an introduction by George Chryssikos, and led by Wade Burton, we purchased the leading‘‘Do-it-Yourself’’ retailer in Greece. The company is run extremely well by Ioannis Selalmalzidis. In spite ofsales dropping by 45%, Praktiker, under Ioannis and his team, continues to make money. We purchased thecompany for A21 million and have received 31% of our purchase price back in cash distributions, and thecompany still owns real estate with a current value in excess of our purchase price.
3. Mytilineos
Evangelos Mytilineos and his brother Yannis have done an outstanding job creating shareholder value overthe past ten years in aluminum, power generation and construction. We purchased 7 million shares or 5.9%of the company for A4.80 per share, which was about 65% of book value and about eight times earnings. Themarket price of these shares is currently A6.20 per share.
4. Eurobank
Finally, in April 2014, we led a group of investors, including Wilbur Ross of WL Ross & Co. LLC, CapitalGroup, Fidelity Investments and Mackenzie Cundill Value Fund, in a A1.33 billion purchase of shares ofEurobank, enabling Eurobank to sell in total A2.9 billion in shares, thus reducing the government’s stake init to 35%, the lowest among Greece’s four major banks. Fairfax’s investment was A400 million – all at 31 eurocents per share versus a book value of 37 euro cents per share. These shares currently trade at 13 euro centsper share.
Greece’s banking system has contracted from some 20 banks to only four similar size ones – of whichEurobank has always had and still has the most private ownership. After helping Eurobank successfully raiseA2.9 billion, purchase two banks and successfully pass the ECB stress test, Christos Megalou moved toToronto to work with us while Fokion Karavias took over as CEO and Nikos Karamouzis as ExecutiveChairman. We continue to be excited to be shareholders of the bank.
11
FAIRFAX FINANCIAL HOLDINGS LIMITED
While Greece has significant government debt, its private sector is relatively unleveraged. Prior to the recentelections, Greece was expected to have one of the best growth rates in Europe – of course, after suffering a very majoreconomic decline. We have met with the new government and they have assured us that they like private investmentand will be supportive of the bank. Only time will tell!
Wade Burton represents us on the Boards of Grivalia, Mytilineos and, with Brad Martin, Eurobank.
While our total Greek investments are below cost today, we expect them to do well over the long term.
We have invested $629 million in real estate investments with Kennedy Wilson over the last five years. Throughrefinancings, sale of some loan portfolios and gains on hedging contracts on Japanese yen, we have receiveddistributions of $465 million. Our total net cash investment in real estate investments with Kennedy Wilson istherefore now $164 million, and that investment is probably worth about $350 million. We have yet to sell though,while our cash flow return of 11.2% is very acceptable. Also, we continue to own 10.7% of Kennedy Wilson(11.5 million shares): our cost was $11.90 per share, and the shares are currently trading at $26.19.
We acquired 70% of Ridley at Cdn$8.50 per share in November 2008 when its parent company wanted to divest it.Since our purchase, Ridley has paid Cdn$5.50 per share in dividends and the stock currently sells at about Cdn$33per share. It had record free cash flow in 2014 and is almost debt free. Brad Martin, as Chairman, and ChandranRatnaswami are directors of Ridley, where Steve VanRoekel, as CEO, has done a magnificent job since we madeour investment.
Arbor Memorial was taken private in November 2012 by the Scanlan family in a transaction which we helped financeby investing Cdn$55.5 million in preferred shares and Cdn$49.6 million in common equity. Last year, Arborredeemed the preferred shares, and the common shares are currently valued at about 1.8 times our cost. BrianSnowden, the CEO of Arbor Memorial, continues to do an excellent job.
12
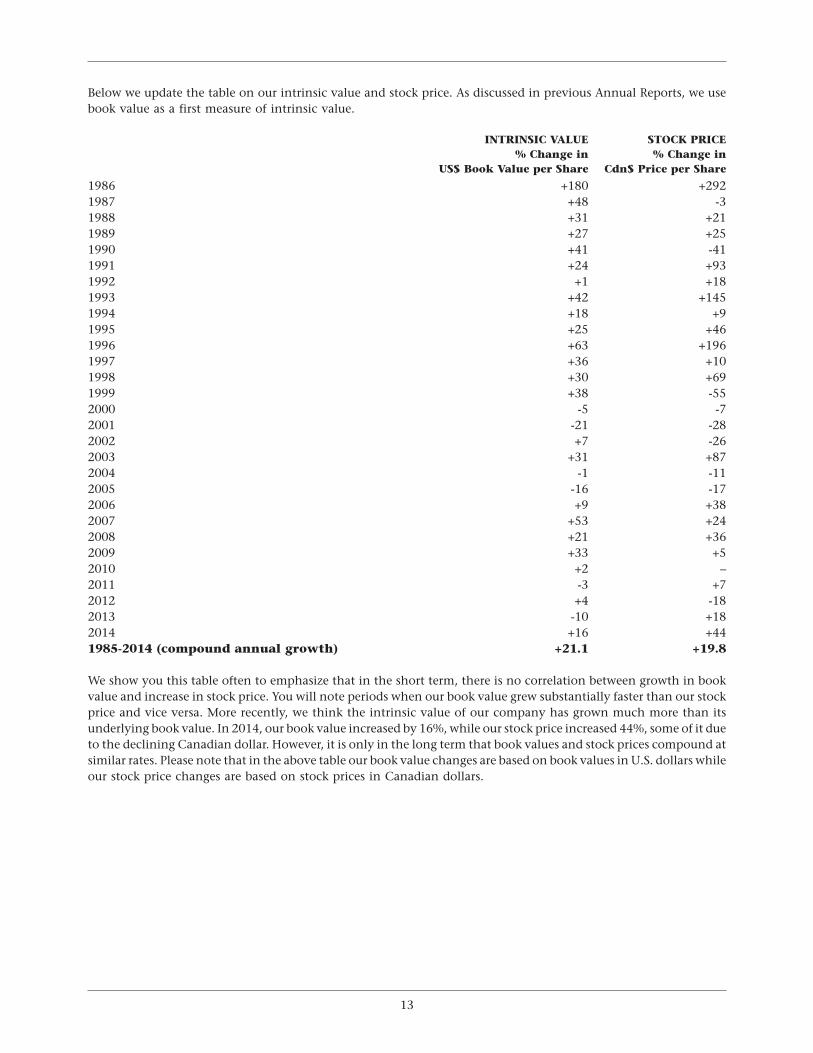
Below we update the table on our intrinsic value and stock price. As discussed in previous Annual Reports, we usebook value as a first measure of intrinsic value.
INTRINSIC VALUE STOCK PRICE% Change in % Change in
US$ Book Value per Share Cdn$ Price per Share
1986 +180 +2921987 +48 -31988 +31 +211989 +27 +251990 +41 -411991 +24 +931992 +1 +181993 +42 +1451994 +18 +91995 +25 +461996 +63 +1961997 +36 +101998 +30 +691999 +38 -552000 -5 -72001 -21 -282002 +7 -262003 +31 +872004 -1 -112005 -16 -172006 +9 +382007 +53 +242008 +21 +362009 +33 +52010 +2 –2011 -3 +72012 +4 -182013 -10 +182014 +16 +441985-2014 (compound annual growth) +21.1 +19.8
We show you this table often to emphasize that in the short term, there is no correlation between growth in bookvalue and increase in stock price. You will note periods when our book value grew substantially faster than our stockprice and vice versa. More recently, we think the intrinsic value of our company has grown much more than itsunderlying book value. In 2014, our book value increased by 16%, while our stock price increased 44%, some of it dueto the declining Canadian dollar. However, it is only in the long term that book values and stock prices compound atsimilar rates. Please note that in the above table our book value changes are based on book values in U.S. dollars whileour stock price changes are based on stock prices in Canadian dollars.
13
FAIRFAX FINANCIAL HOLDINGS LIMITED
Insurance and Reinsurance Operations
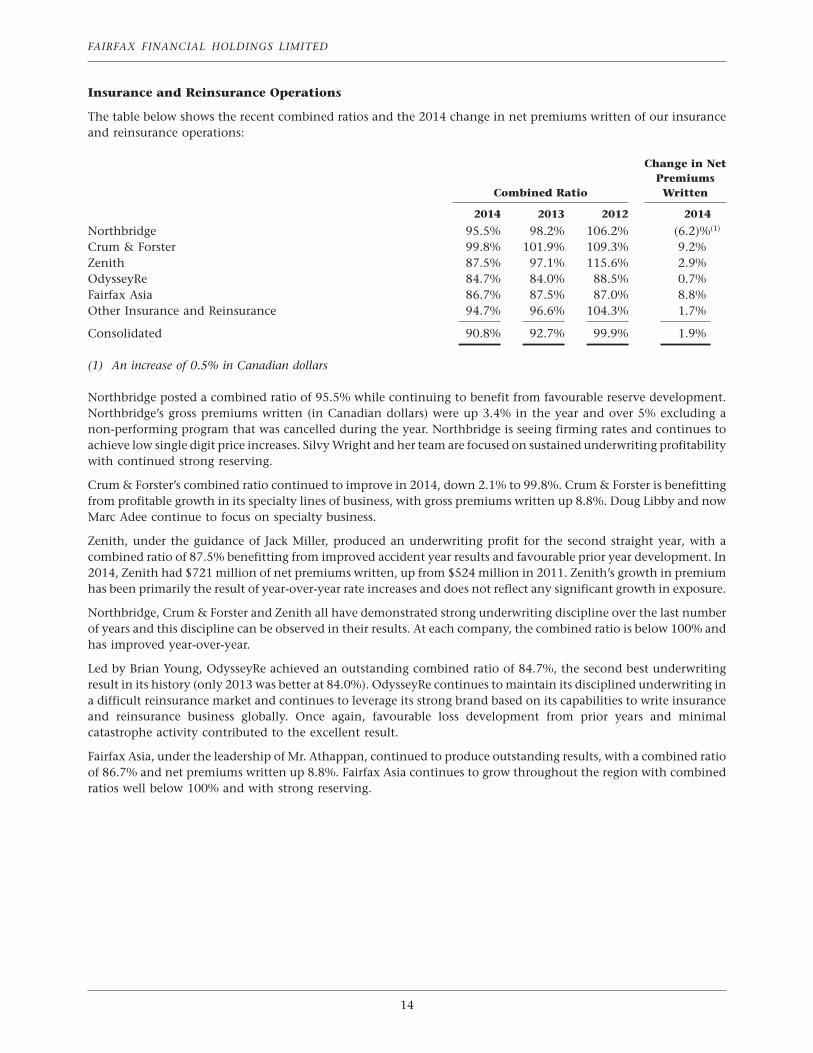
The table below shows the recent combined ratios and the 2014 change in net premiums written of our insuranceand reinsurance operations:
Change in NetPremiums
Combined Ratio Written
2014 2013 2012 2014
Northbridge 95.5% 98.2% 106.2% (6.2)%(1)
Crum & Forster 99.8% 101.9% 109.3% 9.2%Zenith 87.5% 97.1% 115.6% 2.9%OdysseyRe 84.7% 84.0% 88.5% 0.7%Fairfax Asia 86.7% 87.5% 87.0% 8.8%Other Insurance and Reinsurance 94.7% 96.6% 104.3% 1.7%
Consolidated 90.8% 92.7% 99.9% 1.9%
(1) An increase of 0.5% in Canadian dollars
Northbridge posted a combined ratio of 95.5% while continuing to benefit from favourable reserve development.Northbridge’s gross premiums written (in Canadian dollars) were up 3.4% in the year and over 5% excluding anon-performing program that was cancelled during the year. Northbridge is seeing firming rates and continues toachieve low single digit price increases. Silvy Wright and her team are focused on sustained underwriting profitabilitywith continued strong reserving.
Crum & Forster’s combined ratio continued to improve in 2014, down 2.1% to 99.8%. Crum & Forster is benefittingfrom profitable growth in its specialty lines of business, with gross premiums written up 8.8%. Doug Libby and nowMarc Adee continue to focus on specialty business.
Zenith, under the guidance of Jack Miller, produced an underwriting profit for the second straight year, with acombined ratio of 87.5% benefitting from improved accident year results and favourable prior year development. In2014, Zenith had $721 million of net premiums written, up from $524 million in 2011. Zenith’s growth in premiumhas been primarily the result of year-over-year rate increases and does not reflect any significant growth in exposure.
Northbridge, Crum & Forster and Zenith all have demonstrated strong underwriting discipline over the last numberof years and this discipline can be observed in their results. At each company, the combined ratio is below 100% andhas improved year-over-year.
Led by Brian Young, OdysseyRe achieved an outstanding combined ratio of 84.7%, the second best underwritingresult in its history (only 2013 was better at 84.0%). OdysseyRe continues to maintain its disciplined underwriting ina difficult reinsurance market and continues to leverage its strong brand based on its capabilities to write insuranceand reinsurance business globally. Once again, favourable loss development from prior years and minimalcatastrophe activity contributed to the excellent result.
Fairfax Asia, under the leadership of Mr. Athappan, continued to produce outstanding results, with a combined ratioof 86.7% and net premiums written up 8.8%. Fairfax Asia continues to grow throughout the region with combinedratios well below 100% and with strong reserving.
14
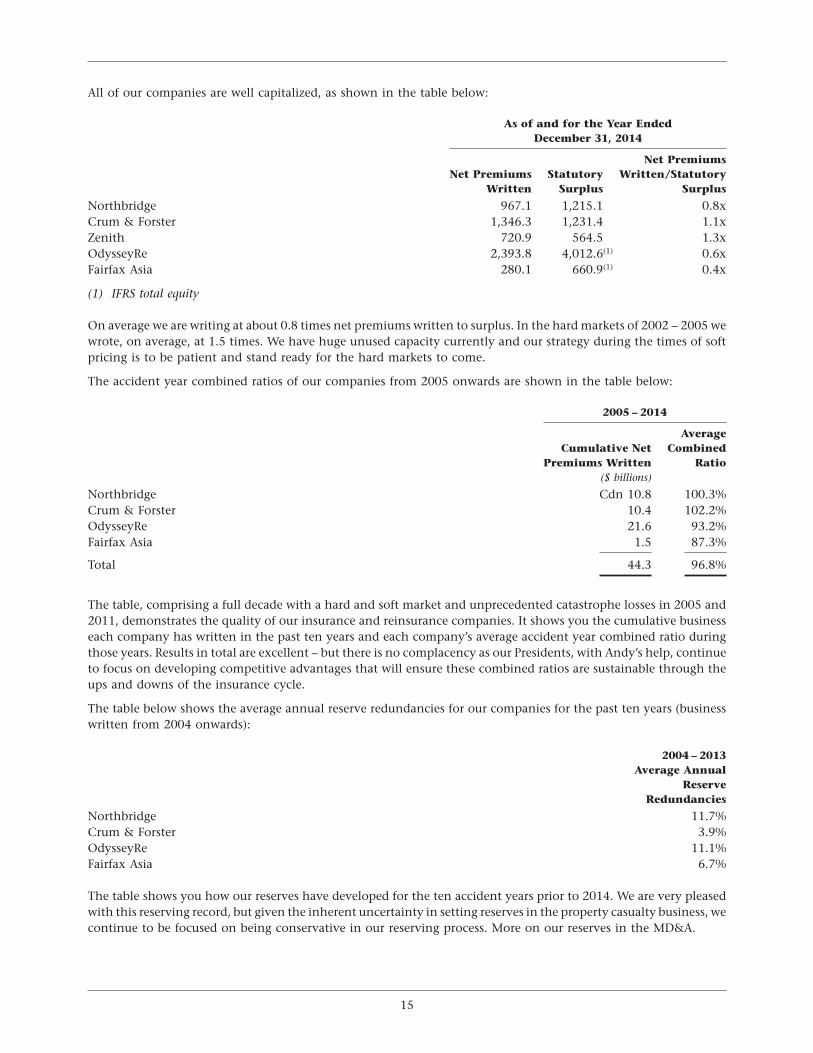
All of our companies are well capitalized, as shown in the table below:
As of and for the Year EndedDecember 31, 2014
Net PremiumsNet Premiums Statutory Written/Statutory
Written Surplus Surplus
Northbridge 967.1 1,215.1 0.8xCrum & Forster 1,346.3 1,231.4 1.1xZenith 720.9 564.5 1.3xOdysseyRe 2,393.8 4,012.6(1) 0.6xFairfax Asia 280.1 660.9(1) 0.4x
(1) IFRS total equity
On average we are writing at about 0.8 times net premiums written to surplus. In the hard markets of 2002 – 2005 wewrote, on average, at 1.5 times. We have huge unused capacity currently and our strategy during the times of softpricing is to be patient and stand ready for the hard markets to come.
The accident year combined ratios of our companies from 2005 onwards are shown in the table below:
2005 – 2014
AverageCumulative Net Combined
Premiums Written Ratio($ billions)
Northbridge Cdn 10.8 100.3%Crum & Forster 10.4 102.2%OdysseyRe 21.6 93.2%Fairfax Asia 1.5 87.3%
Total 44.3 96.8%
The table, comprising a full decade with a hard and soft market and unprecedented catastrophe losses in 2005 and2011, demonstrates the quality of our insurance and reinsurance companies. It shows you the cumulative businesseach company has written in the past ten years and each company’s average accident year combined ratio duringthose years. Results in total are excellent – but there is no complacency as our Presidents, with Andy’s help, continueto focus on developing competitive advantages that will ensure these combined ratios are sustainable through theups and downs of the insurance cycle.
The table below shows the average annual reserve redundancies for our companies for the past ten years (businesswritten from 2004 onwards):
2004 – 2013Average Annual
ReserveRedundancies
Northbridge 11.7%Crum & Forster 3.9%OdysseyRe 11.1%Fairfax Asia 6.7%
The table shows you how our reserves have developed for the ten accident years prior to 2014. We are very pleasedwith this reserving record, but given the inherent uncertainty in setting reserves in the property casualty business, wecontinue to be focused on being conservative in our reserving process. More on our reserves in the MD&A.
15
FAIRFAX FINANCIAL HOLDINGS LIMITED
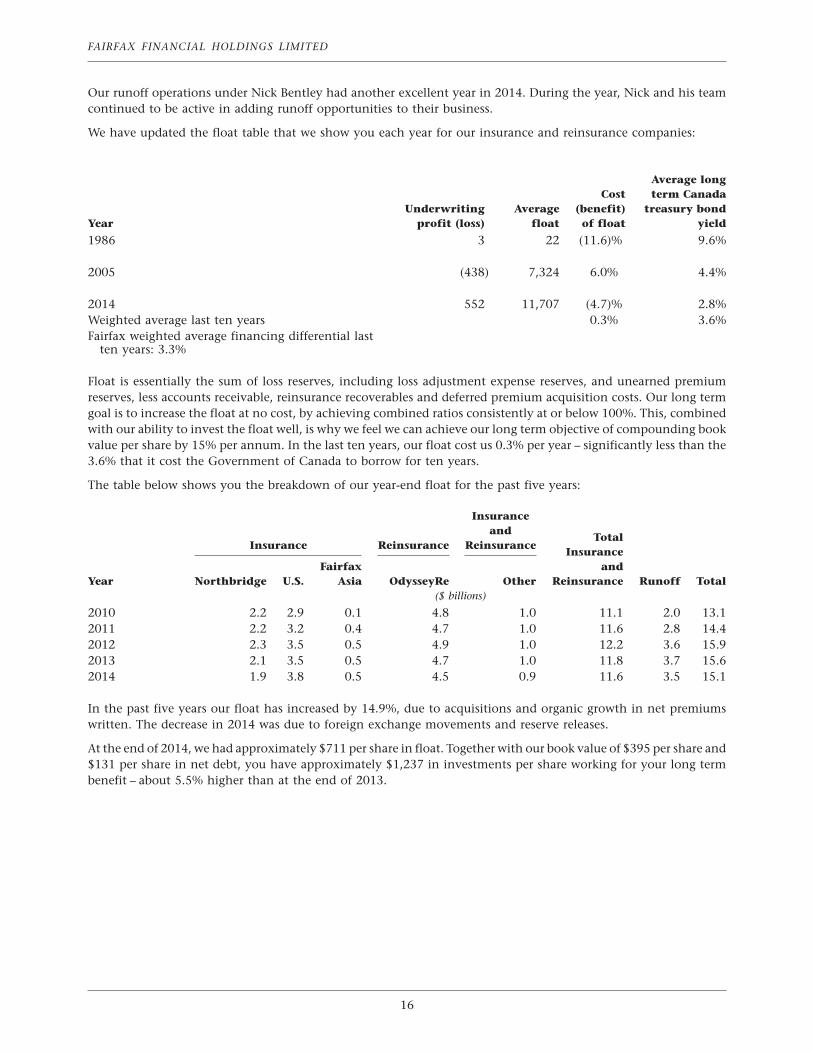
Our runoff operations under Nick Bentley had another excellent year in 2014. During the year, Nick and his teamcontinued to be active in adding runoff opportunities to their business.
We have updated the float table that we show you each year for our insurance and reinsurance companies:
Average longCost term Canada
Underwriting Average (benefit) treasury bondYear profit (loss) float of float yield
1986 3 22 (11.6)% 9.6%
2005 (438) 7,324 6.0% 4.4%
2014 552 11,707 (4.7)% 2.8%Weighted average last ten years 0.3% 3.6%Fairfax weighted average financing differential last
ten years: 3.3%
Float is essentially the sum of loss reserves, including loss adjustment expense reserves, and unearned premiumreserves, less accounts receivable, reinsurance recoverables and deferred premium acquisition costs. Our long termgoal is to increase the float at no cost, by achieving combined ratios consistently at or below 100%. This, combinedwith our ability to invest the float well, is why we feel we can achieve our long term objective of compounding bookvalue per share by 15% per annum. In the last ten years, our float cost us 0.3% per year – significantly less than the3.6% that it cost the Government of Canada to borrow for ten years.
The table below shows you the breakdown of our year-end float for the past five years:
Insuranceand
TotalInsurance Reinsurance Reinsurance
InsuranceFairfax and
Year Northbridge U.S. Asia OdysseyRe Other Reinsurance Runoff Total($ billions)
2010 2.2 2.9 0.1 4.8 1.0 11.1 2.0 13.12011 2.2 3.2 0.4 4.7 1.0 11.6 2.8 14.42012 2.3 3.5 0.5 4.9 1.0 12.2 3.6 15.92013 2.1 3.5 0.5 4.7 1.0 11.8 3.7 15.62014 1.9 3.8 0.5 4.5 0.9 11.6 3.5 15.1
In the past five years our float has increased by 14.9%, due to acquisitions and organic growth in net premiumswritten. The decrease in 2014 was due to foreign exchange movements and reserve releases.
At the end of 2014, we had approximately $711 per share in float. Together with our book value of $395 per share and$131 per share in net debt, you have approximately $1,237 in investments per share working for your long termbenefit – about 5.5% higher than at the end of 2013.
16
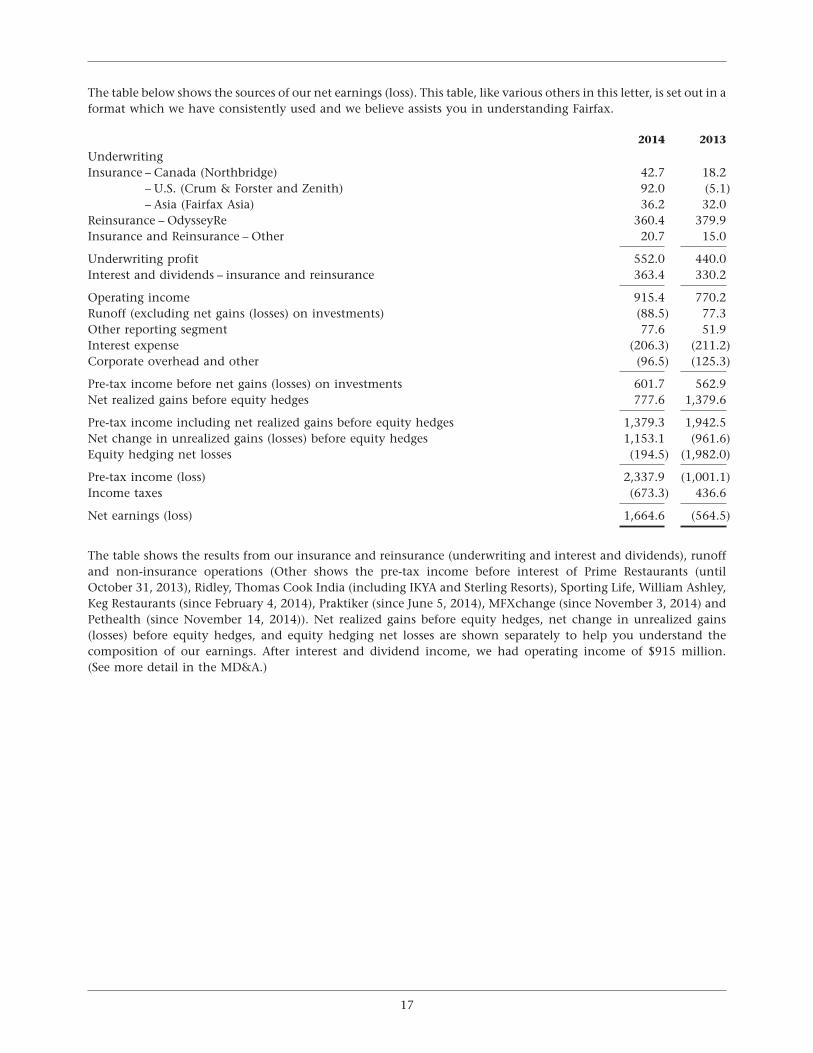
The table below shows the sources of our net earnings (loss). This table, like various others in this letter, is set out in aformat which we have consistently used and we believe assists you in understanding Fairfax.
2014 2013
UnderwritingInsurance – Canada (Northbridge) 42.7 18.2
– U.S. (Crum & Forster and Zenith) 92.0 (5.1)– Asia (Fairfax Asia) 36.2 32.0
Reinsurance – OdysseyRe 360.4 379.9Insurance and Reinsurance – Other 20.7 15.0
Underwriting profit 552.0 440.0Interest and dividends – insurance and reinsurance 363.4 330.2
Operating income 915.4 770.2Runoff (excluding net gains (losses) on investments) (88.5) 77.3Other reporting segment 77.6 51.9Interest expense (206.3) (211.2)Corporate overhead and other (96.5) (125.3)
Pre-tax income before net gains (losses) on investments 601.7 562.9Net realized gains before equity hedges 777.6 1,379.6
Pre-tax income including net realized gains before equity hedges 1,379.3 1,942.5Net change in unrealized gains (losses) before equity hedges 1,153.1 (961.6)Equity hedging net losses (194.5) (1,982.0)
Pre-tax income (loss) 2,337.9 (1,001.1)Income taxes (673.3) 436.6
Net earnings (loss) 1,664.6 (564.5)
The table shows the results from our insurance and reinsurance (underwriting and interest and dividends), runoffand non-insurance operations (Other shows the pre-tax income before interest of Prime Restaurants (untilOctober 31, 2013), Ridley, Thomas Cook India (including IKYA and Sterling Resorts), Sporting Life, William Ashley,Keg Restaurants (since February 4, 2014), Praktiker (since June 5, 2014), MFXchange (since November 3, 2014) andPethealth (since November 14, 2014)). Net realized gains before equity hedges, net change in unrealized gains(losses) before equity hedges, and equity hedging net losses are shown separately to help you understand thecomposition of our earnings. After interest and dividend income, we had operating income of $915 million.(See more detail in the MD&A.)
17
FAIRFAX FINANCIAL HOLDINGS LIMITED
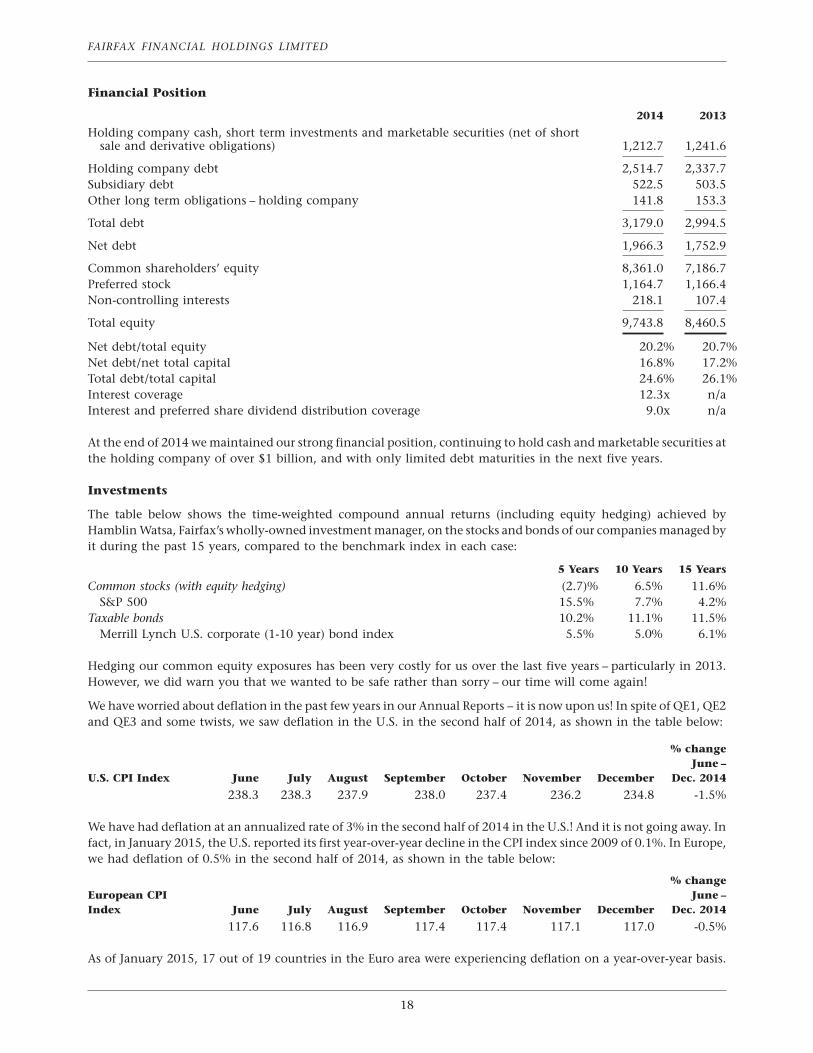
Financial Position
2014 2013
Holding company cash, short term investments and marketable securities (net of shortsale and derivative obligations) 1,212.7 1,241.6
Holding company debt 2,514.7 2,337.7Subsidiary debt 522.5 503.5Other long term obligations – holding company 141.8 153.3
Total debt 3,179.0 2,994.5
Net debt 1,966.3 1,752.9
Common shareholders’ equity 8,361.0 7,186.7Preferred stock 1,164.7 1,166.4Non-controlling interests 218.1 107.4
Total equity 9,743.8 8,460.5
Net debt/total equity 20.2% 20.7%Net debt/net total capital 16.8% 17.2%Total debt/total capital 24.6% 26.1%Interest coverage 12.3x n/aInterest and preferred share dividend distribution coverage 9.0x n/a
At the end of 2014 we maintained our strong financial position, continuing to hold cash and marketable securities atthe holding company of over $1 billion, and with only limited debt maturities in the next five years.
Investments
The table below shows the time-weighted compound annual returns (including equity hedging) achieved byHamblin Watsa, Fairfax’s wholly-owned investment manager, on the stocks and bonds of our companies managed byit during the past 15 years, compared to the benchmark index in each case:
5 Years 10 Years 15 Years
Common stocks (with equity hedging) (2.7)% 6.5% 11.6%S&P 500 15.5% 7.7% 4.2%
Taxable bonds 10.2% 11.1% 11.5%Merrill Lynch U.S. corporate (1-10 year) bond index 5.5% 5.0% 6.1%
Hedging our common equity exposures has been very costly for us over the last five years – particularly in 2013.However, we did warn you that we wanted to be safe rather than sorry – our time will come again!
We have worried about deflation in the past few years in our Annual Reports – it is now upon us! In spite of QE1, QE2and QE3 and some twists, we saw deflation in the U.S. in the second half of 2014, as shown in the table below:
% changeJune –
U.S. CPI Index June July August September October November December Dec. 2014
238.3 238.3 237.9 238.0 237.4 236.2 234.8 -1.5%
We have had deflation at an annualized rate of 3% in the second half of 2014 in the U.S.! And it is not going away. Infact, in January 2015, the U.S. reported its first year-over-year decline in the CPI index since 2009 of 0.1%. In Europe,we had deflation of 0.5% in the second half of 2014, as shown in the table below:
% changeEuropean CPI June –Index June July August September October November December Dec. 2014
117.6 116.8 116.9 117.4 117.4 117.1 117.0 -0.5%
As of January 2015, 17 out of 19 countries in the Euro area were experiencing deflation on a year-over-year basis.
18
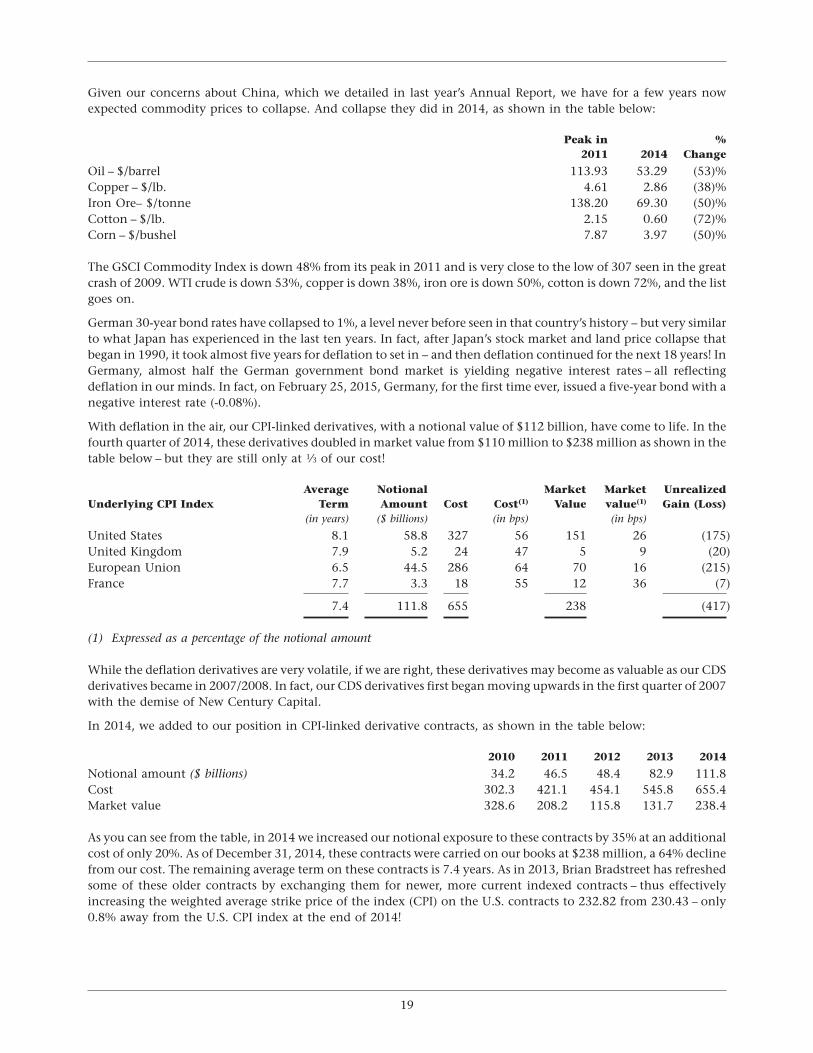
Given our concerns about China, which we detailed in last year’s Annual Report, we have for a few years nowexpected commodity prices to collapse. And collapse they did in 2014, as shown in the table below:
Peak in %2011 2014 Change
Oil – $/barrel 113.93 53.29 (53)%Copper – $/lb. 4.61 2.86 (38)%Iron Ore– $/tonne 138.20 69.30 (50)%Cotton – $/lb. 2.15 0.60 (72)%Corn – $/bushel 7.87 3.97 (50)%
The GSCI Commodity Index is down 48% from its peak in 2011 and is very close to the low of 307 seen in the greatcrash of 2009. WTI crude is down 53%, copper is down 38%, iron ore is down 50%, cotton is down 72%, and the listgoes on.
German 30-year bond rates have collapsed to 1%, a level never before seen in that country’s history – but very similarto what Japan has experienced in the last ten years. In fact, after Japan’s stock market and land price collapse thatbegan in 1990, it took almost five years for deflation to set in – and then deflation continued for the next 18 years! InGermany, almost half the German government bond market is yielding negative interest rates – all reflectingdeflation in our minds. In fact, on February 25, 2015, Germany, for the first time ever, issued a five-year bond with anegative interest rate (-0.08%).
With deflation in the air, our CPI-linked derivatives, with a notional value of $112 billion, have come to life. In thefourth quarter of 2014, these derivatives doubled in market value from $110 million to $238 million as shown in thetable below – but they are still only at 1⁄3 of our cost!
Average Notional Market Market UnrealizedUnderlying CPI Index Term Amount Cost Cost(1) Value value(1) Gain (Loss)
(in years) ($ billions) (in bps) (in bps)
United States 8.1 58.8 327 56 151 26 (175)United Kingdom 7.9 5.2 24 47 5 9 (20)European Union 6.5 44.5 286 64 70 16 (215)France 7.7 3.3 18 55 12 36 (7)
7.4 111.8 655 238 (417)
(1) Expressed as a percentage of the notional amount
While the deflation derivatives are very volatile, if we are right, these derivatives may become as valuable as our CDSderivatives became in 2007/2008. In fact, our CDS derivatives first began moving upwards in the first quarter of 2007with the demise of New Century Capital.
In 2014, we added to our position in CPI-linked derivative contracts, as shown in the table below:
2010 2011 2012 2013 2014
Notional amount ($ billions) 34.2 46.5 48.4 82.9 111.8Cost 302.3 421.1 454.1 545.8 655.4Market value 328.6 208.2 115.8 131.7 238.4
As you can see from the table, in 2014 we increased our notional exposure to these contracts by 35% at an additionalcost of only 20%. As of December 31, 2014, these contracts were carried on our books at $238 million, a 64% declinefrom our cost. The remaining average term on these contracts is 7.4 years. As in 2013, Brian Bradstreet has refreshedsome of these older contracts by exchanging them for newer, more current indexed contracts – thus effectivelyincreasing the weighted average strike price of the index (CPI) on the U.S. contracts to 232.82 from 230.43 – only0.8% away from the U.S. CPI index at the end of 2014!
19
FAIRFAX FINANCIAL HOLDINGS LIMITED
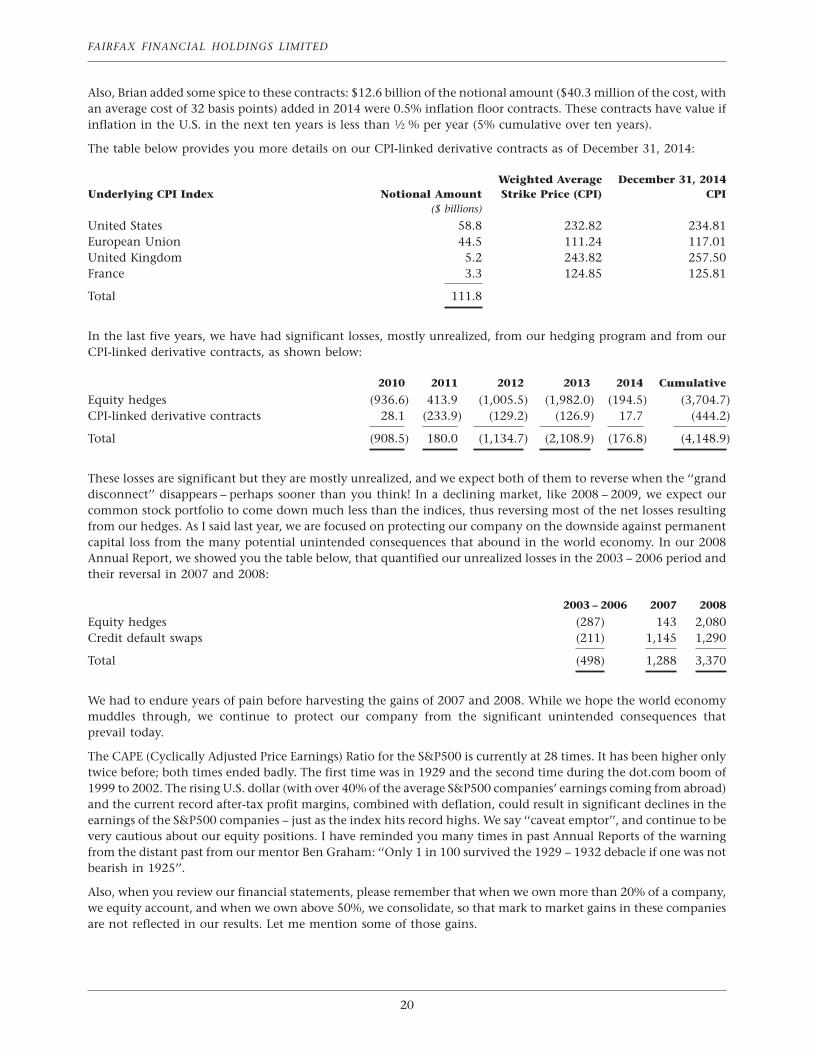
Also, Brian added some spice to these contracts: $12.6 billion of the notional amount ($40.3 million of the cost, withan average cost of 32 basis points) added in 2014 were 0.5% inflation floor contracts. These contracts have value ifinflation in the U.S. in the next ten years is less than 1⁄2 % per year (5% cumulative over ten years).
The table below provides you more details on our CPI-linked derivative contracts as of December 31, 2014:
Weighted Average December 31, 2014Underlying CPI Index Notional Amount Strike Price (CPI) CPI
($ billions)
United States 58.8 232.82 234.81European Union 44.5 111.24 117.01United Kingdom 5.2 243.82 257.50France 3.3 124.85 125.81
Total 111.8
In the last five years, we have had significant losses, mostly unrealized, from our hedging program and from ourCPI-linked derivative contracts, as shown below:
2010 2011 2012 2013 2014 Cumulative
Equity hedges (936.6) 413.9 (1,005.5) (1,982.0) (194.5) (3,704.7)CPI-linked derivative contracts 28.1 (233.9) (129.2) (126.9) 17.7 (444.2)
Total (908.5) 180.0 (1,134.7) (2,108.9) (176.8) (4,148.9)
These losses are significant but they are mostly unrealized, and we expect both of them to reverse when the ‘‘granddisconnect’’ disappears – perhaps sooner than you think! In a declining market, like 2008 – 2009, we expect ourcommon stock portfolio to come down much less than the indices, thus reversing most of the net losses resultingfrom our hedges. As I said last year, we are focused on protecting our company on the downside against permanentcapital loss from the many potential unintended consequences that abound in the world economy. In our 2008Annual Report, we showed you the table below, that quantified our unrealized losses in the 2003 – 2006 period andtheir reversal in 2007 and 2008:
2003 – 2006 2007 2008
Equity hedges (287) 143 2,080Credit default swaps (211) 1,145 1,290
Total (498) 1,288 3,370
We had to endure years of pain before harvesting the gains of 2007 and 2008. While we hope the world economymuddles through, we continue to protect our company from the significant unintended consequences thatprevail today.
The CAPE (Cyclically Adjusted Price Earnings) Ratio for the S&P500 is currently at 28 times. It has been higher onlytwice before; both times ended badly. The first time was in 1929 and the second time during the dot.com boom of1999 to 2002. The rising U.S. dollar (with over 40% of the average S&P500 companies’ earnings coming from abroad)and the current record after-tax profit margins, combined with deflation, could result in significant declines in theearnings of the S&P500 companies – just as the index hits record highs. We say ‘‘caveat emptor’’, and continue to bevery cautious about our equity positions. I have reminded you many times in past Annual Reports of the warningfrom the distant past from our mentor Ben Graham: ‘‘Only 1 in 100 survived the 1929 – 1932 debacle if one was notbearish in 1925’’.
Also, when you review our financial statements, please remember that when we own more than 20% of a company,we equity account, and when we own above 50%, we consolidate, so that mark to market gains in these companiesare not reflected in our results. Let me mention some of those gains.
20
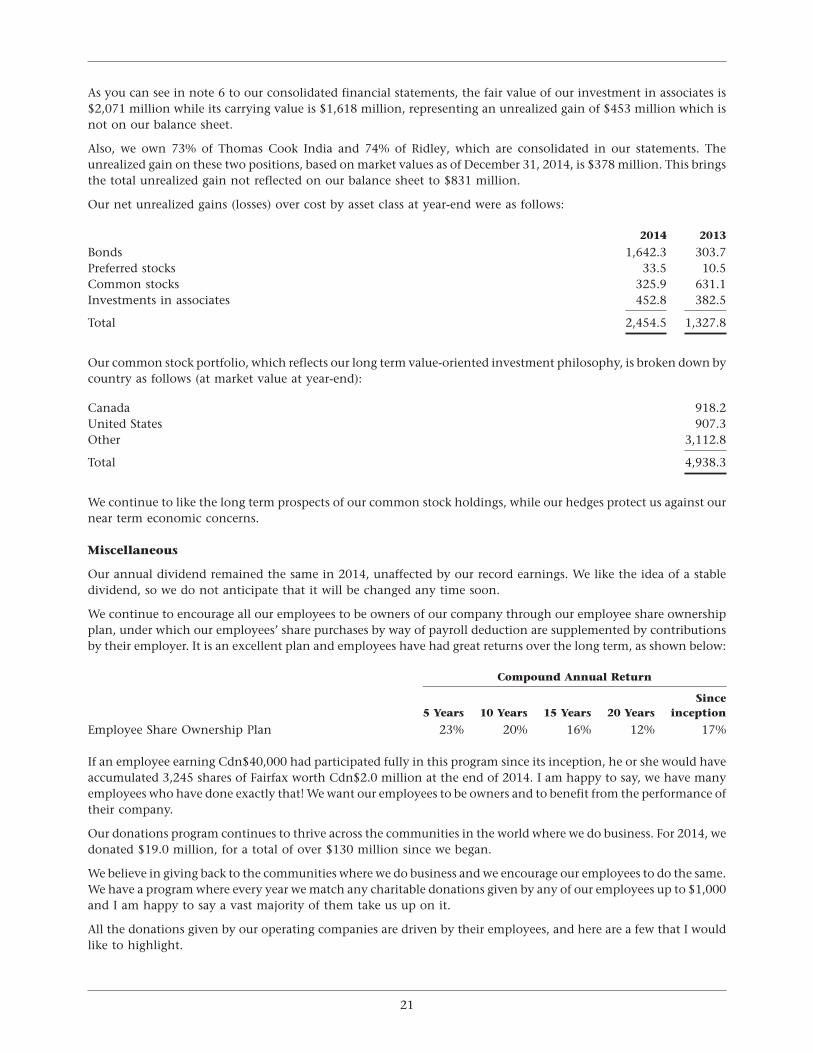
As you can see in note 6 to our consolidated financial statements, the fair value of our investment in associates is$2,071 million while its carrying value is $1,618 million, representing an unrealized gain of $453 million which isnot on our balance sheet.
Also, we own 73% of Thomas Cook India and 74% of Ridley, which are consolidated in our statements. Theunrealized gain on these two positions, based on market values as of December 31, 2014, is $378 million. This bringsthe total unrealized gain not reflected on our balance sheet to $831 million.
Our net unrealized gains (losses) over cost by asset class at year-end were as follows:
2014 2013
Bonds 1,642.3 303.7Preferred stocks 33.5 10.5Common stocks 325.9 631.1Investments in associates 452.8 382.5
Total 2,454.5 1,327.8
Our common stock portfolio, which reflects our long term value-oriented investment philosophy, is broken down bycountry as follows (at market value at year-end):
Canada 918.2United States 907.3Other 3,112.8
Total 4,938.3
We continue to like the long term prospects of our common stock holdings, while our hedges protect us against ournear term economic concerns.
Miscellaneous
Our annual dividend remained the same in 2014, unaffected by our record earnings. We like the idea of a stabledividend, so we do not anticipate that it will be changed any time soon.
We continue to encourage all our employees to be owners of our company through our employee share ownershipplan, under which our employees’ share purchases by way of payroll deduction are supplemented by contributionsby their employer. It is an excellent plan and employees have had great returns over the long term, as shown below:
Compound Annual Return
Since5 Years 10 Years 15 Years 20 Years inception
Employee Share Ownership Plan 23% 20% 16% 12% 17%
If an employee earning Cdn$40,000 had participated fully in this program since its inception, he or she would haveaccumulated 3,245 shares of Fairfax worth Cdn$2.0 million at the end of 2014. I am happy to say, we have manyemployees who have done exactly that! We want our employees to be owners and to benefit from the performance oftheir company.
Our donations program continues to thrive across the communities in the world where we do business. For 2014, wedonated $19.0 million, for a total of over $130 million since we began.
We believe in giving back to the communities where we do business and we encourage our employees to do the same.We have a program where every year we match any charitable donations given by any of our employees up to $1,000and I am happy to say a vast majority of them take us up on it.
All the donations given by our operating companies are driven by their employees, and here are a few that I wouldlike to highlight.
21
FAIRFAX FINANCIAL HOLDINGS LIMITED
In tragedy there is always hope, and when one of our employee’s ten-year-old daughter lost a valiant battle withcancer, the Odyssey and Fairfax family made a donation for the treatment and research for Merkel Cell Carcinoma.Andy Dickson and his wife Raquel will be leading this initiative in honor of their beloved daughter Kelsey, whoselegacy will endure through our efforts to find a cure so others won’t have to suffer what she and her parents wentthrough.
Crum & Forster is a major supporter of New York Cares and Jersey Cares, organizations that bring volunteers togetherto help at the local level. Through these organizations, the employees of Crum & Forster have donated their time andeffort to help rebuild schools damaged by natural disasters and to restore parks and playgrounds, and they havedonated funds to help high school students go on to college.
Northbridge focuses on helping youth, offering support for children’s health, education and well-being through fivecharitable partners – Pathways to Education, SickKids, DAREarts, United Way and Tree Canada. In addition, itsannual employee fundraising campaign raised over Cdn$140,000 for these five charitable partners.
RiverStone made a difference in the lives of many by donating to the New Hampshire Food Bank, as inNew Hampshire one individual in nine is food insecure and one child in five goes hungry: last year RiverStoneemployees personally contributed $29,000, and the company added a further $136,000, resulting in the provision ofwell over 300,000 meals in the community. With a high degree of participation, RiverStone employees used manyinnovative ways to raise the money.
Zenith’s charitable giving focuses on health and education. One of Zenith’s significant donations in 2014 was to acustomer which it has supported for many years in addition to providing workers compensation coverage to its980 employees. This customer, The Help Group, was founded 40 years ago and continues to be visionary in providinga broad range of services in the Los Angeles area to more than 6,000 children with special needs and their familieseach year, including pre-kindergarten through high school programs for more than 1,550 students.
I have highlighted just a few examples for you – there are many more stories from our companies around the worldand other causes that each of the companies mentioned gives to and supports. I just wanted to give you a sense ofwhat our culture instills in our employees and how when our business does well, we can and must help others lessfortunate by doing good and improving lives in the communities where we operate. What can be more rewardingthan that?
I remind you often that you will not get a takeover premium for Fairfax as I and my family have the votes, and thatwill continue even after my death, so that Fairfax can continue uninterrupted in building long term value for you,our shareholders, by treating our customers, employees and the communities in which we operate in a fair andfriendly way! Perhaps I am biased, but the fact that Fairfax is not for sale and that Fairfax will not sell any of itsinsurance companies or its permanent non-insurance acquisitions is a major plus for those companies and all of theiremployees.
My and my family’s focusing on the long term necessarily requires the next generation’s involvement and familiaritywith the management of Fairfax, so this year we have nominated my son Ben (a successful portfolio manager in hisown right) as a director. None of my children are officers or employees of Fairfax, but involvement at the Board levelwill ensure the continuation of Fairfax’s ‘‘fair and friendly’’ culture which is such an important factor in thecompany’s success over the long term.
We are looking forward to seeing you at our annual meeting in Toronto at 9:30 a.m. (Toronto time) on April 16, 2015at Roy Thomson Hall. As in the past few years, we will have booths which provide information on our insurancecompanies such as OdysseyRe, Northbridge, Crum & Forster, Zenith, Fairfax Asia, ICICI Lombard, the Gulf InsuranceGroup (our partners in the Middle East), and this year, for all you pet lovers, Pethealth – Sean Smith and his team willbe on hand to help you insure your favourite pet. In addition, showcased will also be some of our non-insurancecompany investments – William Ashley, Sporting Life, CARA, Keg Restaurants, Kitchen Stuff Plus, Arbor Memorialand Quess (formerly called IKYA) – and BlackBerry will also be there. I am sure that I will be able to convince JohnChen to give away a BlackBerry Classic and, my personal favourite, a Passport at the BlackBerry booth. We will haveZoomer Media and Thomas Cook India present as well. Madhavan Menon from Thomas Cook India has promised ashareholder’s discount to take your bookings for a trip of a lifetime to India, in case you were not among the manywho took advantage of this opportunity last year. So come early and visit all our booths – it is a great opportunity foryou to learn more about our companies as well as to get some discounts for shopping at William Ashley and SportingLife and dining at CARA and The Keg. Bill Gregson and David Aisenstat will have their chefs on hand to prepare a fewof the signature items sold at their restaurants for you to sample at their booths in the foyer after our meeting ends.
22
30JAN201416030432
They would also encourage you, after our meeting, to use your discount cards at their restaurants that are withinwalking distance from Roy Thomson Hall. We will also have booths for The Hospital for Sick Children, Americaresand the Royal Ontario Museum, so that you can see firsthand how we reinvest into the communities where we dobusiness. Doing good by doing well! Hopefully in the spirt of giving, you will be inclined to make an additionalcontribution. As in the past, there will be booths highlighting two excellent programs that we support: the BenGraham Centre for Value Investing with George Athanassakos at the Ivey School of Business, and the ActuarialProgram at the University of Waterloo – both among the best in North America! This year the University of Waterloobooth will be staffed by co-op students working at our companies, and I encourage you to speak with them. I assureyou that you will be impressed and will want to hire a few at your own companies: the University will have someoneon hand to let you know how you can go about doing so. George will also have many of his MBA students there, soplease speak with them also – you may want to hire them as well. This will be the fourth year that George runs a ValueInvesting Conference the day before our meeting. In case you have not attended, ask him for details: I highlyrecommend it as well worth your time to attend.
Please also stop by and say hello to Scott Phillips and Lauren Templeton who will be there signing their books andtaking orders for any of Sir John Templeton’s books on investing and spirituality, which I would highly recommend.
So as we have done for the last 30 years, we look forward to meeting you, our shareholders, and answering all yourquestions, as well as getting you to meet our directors and the fine men and women who work at and run Fairfax andall of our companies – they are the ones who create our success. Our small holding company team, with greatintegrity, team spirit and no egos, keeps the whole company going forward. I personally am inspired every time that Imeet all of you, and when I hear your stories I want to work twice as hard to make a return for you in the long term.We are truly blessed to have such fine loyal shareholders.
March 6, 2015
V. Prem WatsaChairman and Chief Executive Officer
23

(This page intentionally left blank)
24
FAIRFAX FINANCIAL HOLDINGS LIMITED
30JAN201416030432 30JAN201416020159
Management’s Responsibility for the Financial Statements
The preparation and presentation of the accompanying consolidated financial statements, Management’sDiscussion and Analysis (‘‘MD&A’’) and all financial information are the responsibility of management and havebeen approved by the Board of Directors.
The consolidated financial statements have been prepared in accordance with International Financial ReportingStandards as issued by the International Accounting Standards Board. Financial statements, by nature, are not precisesince they include certain amounts based upon estimates and judgments. When alternative methods exist,management has chosen those it deems to be the most appropriate in the circumstances.
We, as Fairfax’s Chief Executive Officer and Chief Financial Officer, have certified Fairfax’s annual disclosuredocuments filed with the Canadian Securities Administrators and the Securities and Exchange Commission(Form 40-F) in accordance with Canadian securities legislation and the United States Sarbanes-Oxley Act of 2002respectively.
The Board of Directors is responsible for ensuring that management fulfills its responsibilities for financial reportingand is ultimately responsible for reviewing and approving the consolidated financial statements and MD&A. TheBoard carries out this responsibility principally through its Audit Committee which is independent frommanagement.
The Audit Committee is appointed by the Board of Directors and reviews the consolidated financial statements andMD&A; considers the report of the external auditors; assesses the adequacy of the internal controls of the company,including management’s assessment described below; examines the fees and expenses for audit services; andrecommends to the Board the independent auditors for appointment by the shareholders. The independent auditorshave full and free access to the Audit Committee and meet with it to discuss their audit work, Fairfax’s internalcontrol over financial reporting and financial reporting matters. The Audit Committee reports its findings to theBoard for consideration when approving the consolidated financial statements for issuance to the shareholders andmanagement’s assessment of the internal control over financial reporting.
Management’s Report on Internal Control over Financial Reporting
Management is responsible for establishing and maintaining adequate internal control over financial reporting.
Management has assessed the effectiveness of the company’s internal control over financial reporting as ofDecember 31, 2014 using criteria established in Internal Control – Integrated Framework (2013) issued by theCommittee of Sponsoring Organizations of the Treadway Commission (‘‘COSO’’). Based on this assessment,management concluded that the company’s internal control over financial reporting was effective as ofDecember 31, 2014.
The effectiveness of the company’s internal control over financial reporting as of December 31, 2014 has beenaudited by PricewaterhouseCoopers LLP, an independent auditor, as stated in its report which appears herein.
March 6, 2015
V. Prem Watsa David BonhamChairman and Chief Executive Officer Vice President and Chief Financial Officer
25
FAIRFAX FINANCIAL HOLDINGS LIMITED
Independent Auditor’s Report
To the Shareholders of Fairfax Financial Holdings Limited
We have completed integrated audits of Fairfax Financial Holdings Limited (the Company) and its subsidiaries’ 2014and 2013 consolidated financial statements and their internal control over financial reporting as at December 31,2014. Our opinions, based on our audits are presented below.
Report on the consolidated financial statements
We have audited the accompanying consolidated financial statements of the Company and its subsidiaries, whichcomprise the consolidated balance sheets as at December 31, 2014 and December 31, 2013 and the consolidatedstatements of earnings, comprehensive income, changes in equity and cash flows for each of the two years in theperiod ended December 31, 2014, and the related notes, which comprise a summary of significant accountingpolicies and other explanatory information.
Management’s responsibility for the consolidated financial statementsManagement is responsible for the preparation and fair presentation of these consolidated financial statements inaccordance with International Financial Reporting Standards (IFRS) as issued by the International AccountingStandards Board (IASB) and for such internal control as management determines is necessary to enable thepreparation of consolidated financial statements that are free from material misstatement, whether due to fraudor error.
Auditor’s responsibilityOur responsibility is to express an opinion on these consolidated financial statements based on our audits. Weconducted our audits in accordance with Canadian generally accepted auditing standards and the standards of thePublic Company Accounting Oversight Board (United States). Those standards require that we plan and perform theaudit to obtain reasonable assurance about whether the consolidated financial statements are free from materialmisstatement. Canadian generally accepted auditing standards also require that we comply with ethicalrequirements.
An audit involves performing procedures to obtain audit evidence, on a test basis, about the amounts and disclosuresin the consolidated financial statements. The procedures selected depend on the auditor’s judgment, including theassessment of the risks of material misstatement of the consolidated financial statements, whether due to fraud orerror. In making those risk assessments, the auditor considers internal control relevant to the company’s preparationand fair presentation of the consolidated financial statements in order to design audit procedures that areappropriate in the circumstances. An audit also includes evaluating the appropriateness of accounting principles andpolicies used and the reasonableness of accounting estimates made by management, as well as evaluating the overallpresentation of the consolidated financial statements.
We believe that the audit evidence we have obtained in our audits is sufficient and appropriate to provide a basis forour audit opinion on the consolidated financial statements.
OpinionIn our opinion, the consolidated financial statements present fairly, in all material respects, the financial position ofthe Company and its subsidiaries as at December 31, 2014 and 2013 and their financial performance and their cashflows for each of the two years in the period ended December 31, 2014 in accordance with IFRS as issued by the IASB.
Report on internal control over financial reporting
We have also audited the Company’s internal control over financial reporting as at December 31, 2014, based oncriteria established in Internal Control – Integrated Framework (2013), issued by the Committee of SponsoringOrganizations of the Treadway Commission (COSO).
Management’s responsibility for internal control over financial reportingManagement is responsible for maintaining effective internal control over financial reporting and for its assessmentof the effectiveness of internal control over financial reporting included in Management’s Report on InternalControl over Financial Reporting on page 25.
26
25JUN200907511992
Auditor’s responsibilityOur responsibility is to express an opinion on the company’s internal control over financial reporting based on ouraudit. We conducted our audit of internal control over financial reporting in accordance with the standards of thePublic Company Accounting Oversight Board (United States). Those standards require that we plan and perform theaudit to obtain reasonable assurance about whether effective internal control over financial reporting wasmaintained in all material respects.
An audit of internal control over financial reporting includes obtaining an understanding of internal control overfinancial reporting, assessing the risk that a material weakness exists, testing and evaluating the design and operatingeffectiveness of internal control, based on the assessed risk, and performing such other procedures as we considernecessary in the circumstances.
We believe that our audit provides a reasonable basis for our audit opinion on the company’s internal control overfinancial reporting.
Definition of internal control over financial reportingA company’s internal control over financial reporting is a process designed to provide reasonable assurance regardingthe reliability of financial reporting and the preparation of financial statements for external purposes in accordancewith generally accepted accounting principles. A company’s internal control over financial reporting includes thosepolicies and procedures that: (i) pertain to the maintenance of records that, in reasonable detail, accurately and fairlyreflect the transactions and dispositions of the assets of the company; (ii) provide reasonable assurance thattransactions are recorded as necessary to permit preparation of financial statements in accordance with generallyaccepted accounting principles, and that receipts and expenditures of the company are being made only inaccordance with authorizations of management and directors of the company; and (iii) provide reasonable assuranceregarding prevention or timely detection of unauthorized acquisition, use, or disposition of the company’s assetsthat could have a material effect on the financial statements.
Inherent limitationsBecause of its inherent limitations, internal control over financial reporting may not prevent or detectmisstatements. Also, projections of any evaluation of effectiveness to future periods are subject to the risk thatcontrols may become inadequate because of changes in conditions or that the degree of compliance with the policiesor procedures may deteriorate.
OpinionIn our opinion, the Company maintained, in all material respects, effective internal control over financial reportingas at December 31, 2014, based on criteria established in Internal Control – Integrated Framework (2013) issuedby COSO.
Chartered Professional Accountants, Licensed Public AccountantsToronto, Ontario
March 6, 2015
27
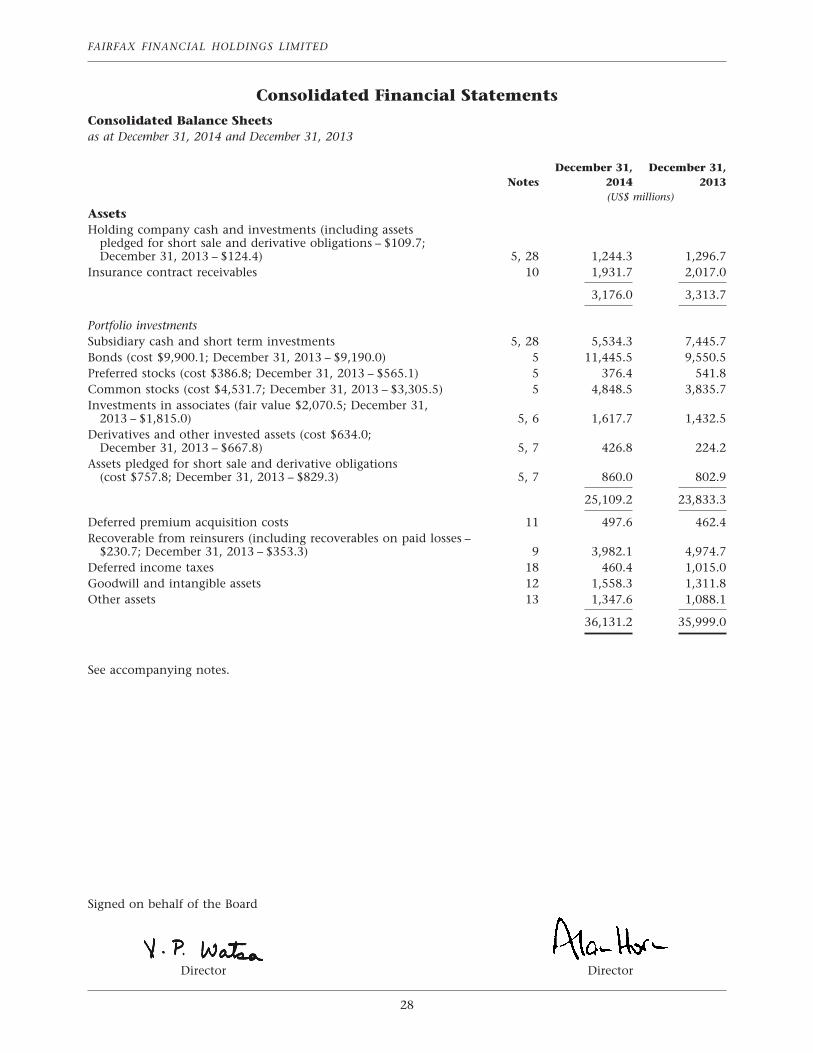
30JAN201416030432 30JAN201416010341
FAIRFAX FINANCIAL HOLDINGS LIMITED
Consolidated Financial StatementsConsolidated Balance Sheetsas at December 31, 2014 and December 31, 2013
December 31, December 31,Notes 2014 2013
(US$ millions)
AssetsHolding company cash and investments (including assets
pledged for short sale and derivative obligations – $109.7;December 31, 2013 – $124.4) 5, 28 1,244.3 1,296.7
Insurance contract receivables 10 1,931.7 2,017.0
3,176.0 3,313.7
Portfolio investmentsSubsidiary cash and short term investments 5, 28 5,534.3 7,445.7Bonds (cost $9,900.1; December 31, 2013 – $9,190.0) 5 11,445.5 9,550.5Preferred stocks (cost $386.8; December 31, 2013 – $565.1) 5 376.4 541.8Common stocks (cost $4,531.7; December 31, 2013 – $3,305.5) 5 4,848.5 3,835.7Investments in associates (fair value $2,070.5; December 31,
2013 – $1,815.0) 5, 6 1,617.7 1,432.5Derivatives and other invested assets (cost $634.0;
December 31, 2013 – $667.8) 5, 7 426.8 224.2Assets pledged for short sale and derivative obligations
(cost $757.8; December 31, 2013 – $829.3) 5, 7 860.0 802.9
25,109.2 23,833.3
Deferred premium acquisition costs 11 497.6 462.4Recoverable from reinsurers (including recoverables on paid losses –
$230.7; December 31, 2013 – $353.3) 9 3,982.1 4,974.7Deferred income taxes 18 460.4 1,015.0Goodwill and intangible assets 12 1,558.3 1,311.8Other assets 13 1,347.6 1,088.1
36,131.2 35,999.0
See accompanying notes.
Signed on behalf of the Board
Director Director
28
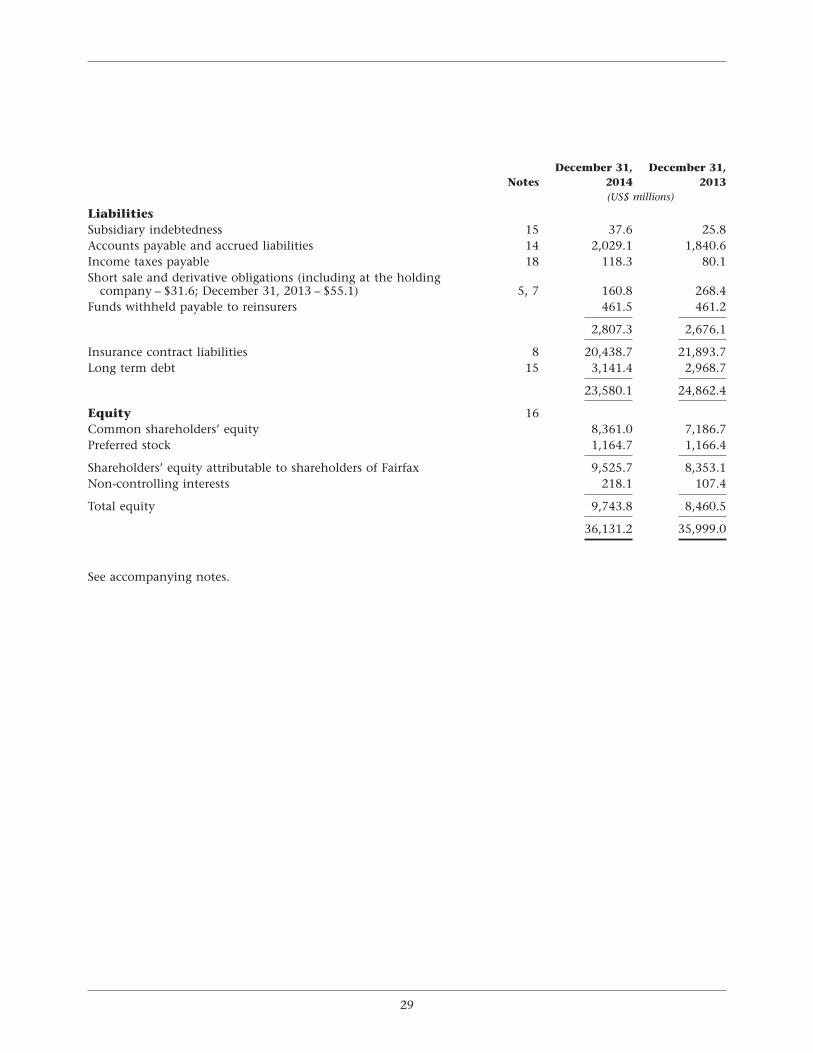
December 31, December 31,Notes 2014 2013
(US$ millions)
LiabilitiesSubsidiary indebtedness 15 37.6 25.8Accounts payable and accrued liabilities 14 2,029.1 1,840.6Income taxes payable 18 118.3 80.1Short sale and derivative obligations (including at the holding
company – $31.6; December 31, 2013 – $55.1) 5, 7 160.8 268.4Funds withheld payable to reinsurers 461.5 461.2
2,807.3 2,676.1
Insurance contract liabilities 8 20,438.7 21,893.7Long term debt 15 3,141.4 2,968.7
23,580.1 24,862.4
Equity 16Common shareholders’ equity 8,361.0 7,186.7Preferred stock 1,164.7 1,166.4
Shareholders’ equity attributable to shareholders of Fairfax 9,525.7 8,353.1Non-controlling interests 218.1 107.4
Total equity 9,743.8 8,460.5
36,131.2 35,999.0
See accompanying notes.
29
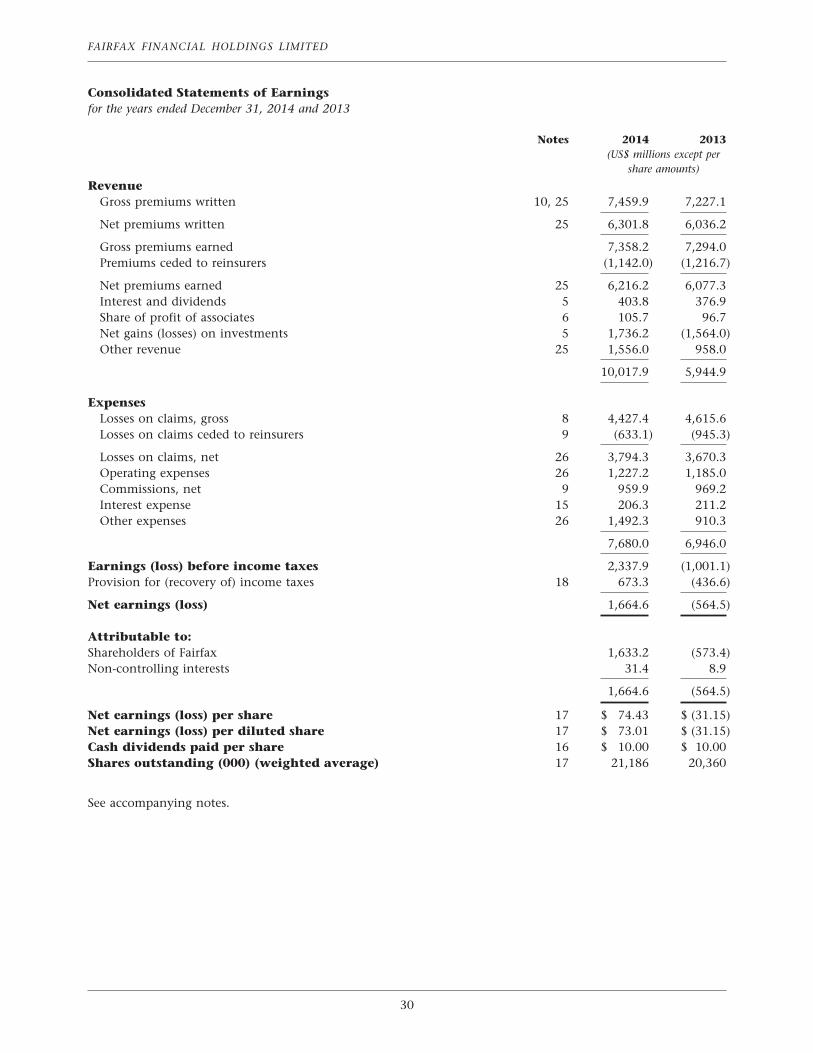
FAIRFAX FINANCIAL HOLDINGS LIMITED
Consolidated Statements of Earningsfor the years ended December 31, 2014 and 2013
Notes 2014 2013(US$ millions except per
share amounts)
RevenueGross premiums written 10, 25 7,459.9 7,227.1
Net premiums written 25 6,301.8 6,036.2
Gross premiums earned 7,358.2 7,294.0Premiums ceded to reinsurers (1,142.0) (1,216.7)
Net premiums earned 25 6,216.2 6,077.3Interest and dividends 5 403.8 376.9Share of profit of associates 6 105.7 96.7Net gains (losses) on investments 5 1,736.2 (1,564.0)Other revenue 25 1,556.0 958.0
10,017.9 5,944.9
ExpensesLosses on claims, gross 8 4,427.4 4,615.6Losses on claims ceded to reinsurers 9 (633.1) (945.3)
Losses on claims, net 26 3,794.3 3,670.3Operating expenses 26 1,227.2 1,185.0Commissions, net 9 959.9 969.2Interest expense 15 206.3 211.2Other expenses 26 1,492.3 910.3
7,680.0 6,946.0
Earnings (loss) before income taxes 2,337.9 (1,001.1)Provision for (recovery of) income taxes 18 673.3 (436.6)
Net earnings (loss) 1,664.6 (564.5)
Attributable to:Shareholders of Fairfax 1,633.2 (573.4)Non-controlling interests 31.4 8.9
1,664.6 (564.5)
Net earnings (loss) per share 17 $ 74.43 $ (31.15)Net earnings (loss) per diluted share 17 $ 73.01 $ (31.15)Cash dividends paid per share 16 $ 10.00 $ 10.00Shares outstanding (000) (weighted average) 17 21,186 20,360
See accompanying notes.
30
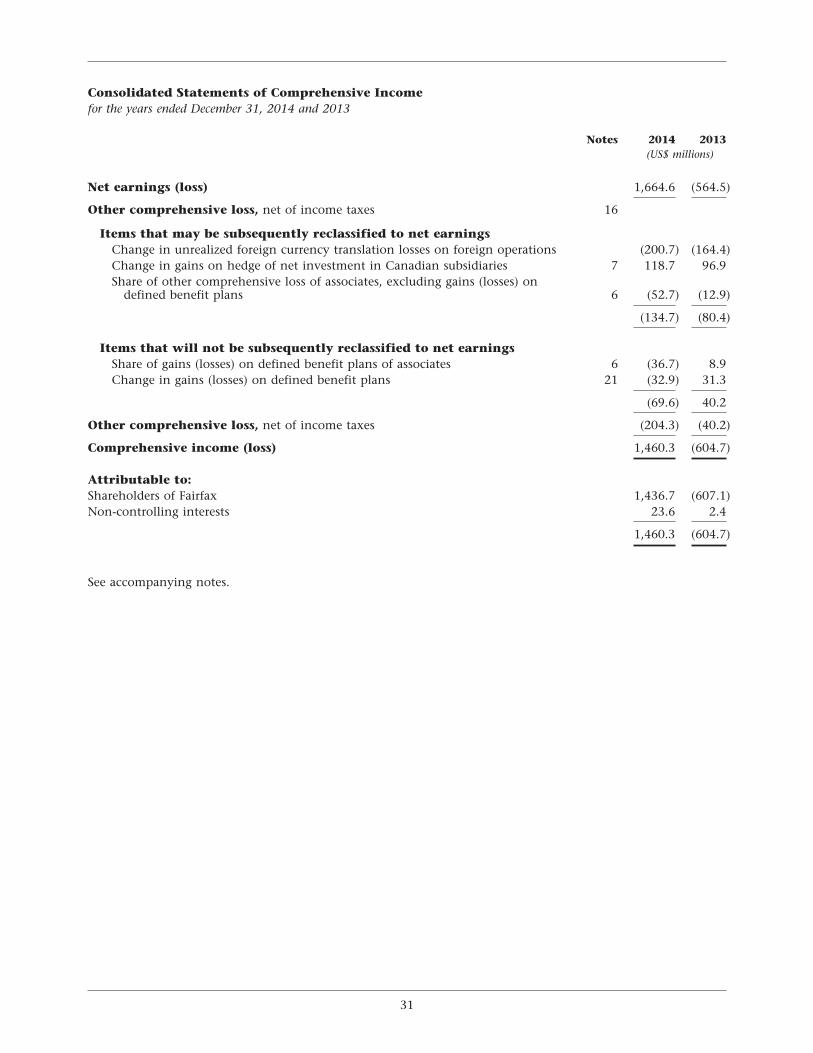
Consolidated Statements of Comprehensive Incomefor the years ended December 31, 2014 and 2013
Notes 2014 2013(US$ millions)
Net earnings (loss) 1,664.6 (564.5)
Other comprehensive loss, net of income taxes 16
Items that may be subsequently reclassified to net earningsChange in unrealized foreign currency translation losses on foreign operations (200.7) (164.4)Change in gains on hedge of net investment in Canadian subsidiaries 7 118.7 96.9Share of other comprehensive loss of associates, excluding gains (losses) on
defined benefit plans 6 (52.7) (12.9)
(134.7) (80.4)
Items that will not be subsequently reclassified to net earningsShare of gains (losses) on defined benefit plans of associates 6 (36.7) 8.9Change in gains (losses) on defined benefit plans 21 (32.9) 31.3
(69.6) 40.2
Other comprehensive loss, net of income taxes (204.3) (40.2)
Comprehensive income (loss) 1,460.3 (604.7)
Attributable to:Shareholders of Fairfax 1,436.7 (607.1)Non-controlling interests 23.6 2.4
1,460.3 (604.7)
See accompanying notes.
31
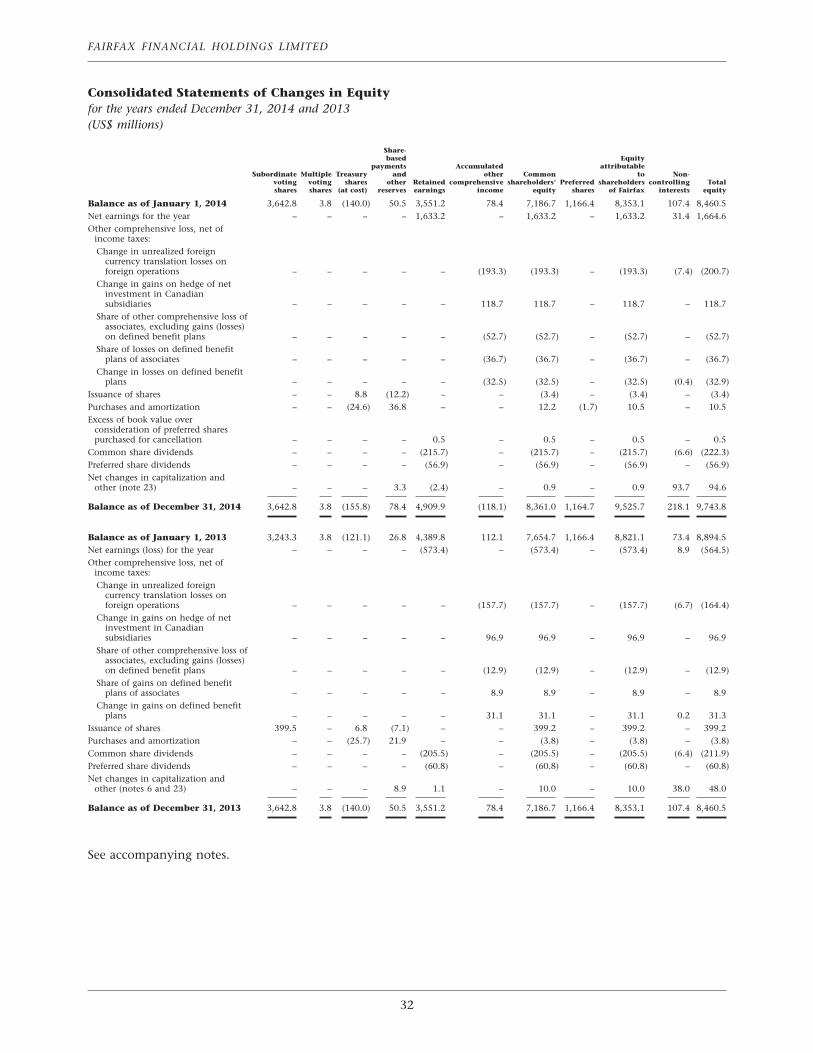
FAIRFAX FINANCIAL HOLDINGS LIMITED
Consolidated Statements of Changes in Equityfor the years ended December 31, 2014 and 2013(US$ millions)
Share-based Equity
payments Accumulated attributableSubordinate Multiple Treasury and other Common to Non-
voting voting shares other Retained comprehensive shareholders’ Preferred shareholders controlling Totalshares shares (at cost) reserves earnings income equity shares of Fairfax interests equity
Balance as of January 1, 2014 3,642.8 3.8 (140.0) 50.5 3,551.2 78.4 7,186.7 1,166.4 8,353.1 107.4 8,460.5Net earnings for the year – – – – 1,633.2 – 1,633.2 – 1,633.2 31.4 1,664.6Other comprehensive loss, net of
income taxes:Change in unrealized foreign
currency translation losses onforeign operations – – – – – (193.3) (193.3) – (193.3) (7.4) (200.7)
Change in gains on hedge of netinvestment in Canadiansubsidiaries – – – – – 118.7 118.7 – 118.7 – 118.7
Share of other comprehensive loss ofassociates, excluding gains (losses)on defined benefit plans – – – – – (52.7) (52.7) – (52.7) – (52.7)
Share of losses on defined benefitplans of associates – – – – – (36.7) (36.7) – (36.7) – (36.7)
Change in losses on defined benefitplans – – – – – (32.5) (32.5) – (32.5) (0.4) (32.9)
Issuance of shares – – 8.8 (12.2) – – (3.4) – (3.4) – (3.4)Purchases and amortization – – (24.6) 36.8 – – 12.2 (1.7) 10.5 – 10.5Excess of book value over
consideration of preferred sharespurchased for cancellation – – – – 0.5 – 0.5 – 0.5 – 0.5
Common share dividends – – – – (215.7) – (215.7) – (215.7) (6.6) (222.3)Preferred share dividends – – – – (56.9) – (56.9) – (56.9) – (56.9)Net changes in capitalization and
other (note 23) – – – 3.3 (2.4) – 0.9 – 0.9 93.7 94.6
Balance as of December 31, 2014 3,642.8 3.8 (155.8) 78.4 4,909.9 (118.1) 8,361.0 1,164.7 9,525.7 218.1 9,743.8
Balance as of January 1, 2013 3,243.3 3.8 (121.1) 26.8 4,389.8 112.1 7,654.7 1,166.4 8,821.1 73.4 8,894.5Net earnings (loss) for the year – – – – (573.4) – (573.4) – (573.4) 8.9 (564.5)Other comprehensive loss, net of
income taxes:Change in unrealized foreign
currency translation losses onforeign operations – – – – – (157.7) (157.7) – (157.7) (6.7) (164.4)
Change in gains on hedge of netinvestment in Canadiansubsidiaries – – – – – 96.9 96.9 – 96.9 – 96.9
Share of other comprehensive loss ofassociates, excluding gains (losses)on defined benefit plans – – – – – (12.9) (12.9) – (12.9) – (12.9)
Share of gains on defined benefitplans of associates – – – – – 8.9 8.9 – 8.9 – 8.9
Change in gains on defined benefitplans – – – – – 31.1 31.1 – 31.1 0.2 31.3
Issuance of shares 399.5 – 6.8 (7.1) – – 399.2 – 399.2 – 399.2Purchases and amortization – – (25.7) 21.9 – – (3.8) – (3.8) – (3.8)Common share dividends – – – – (205.5) – (205.5) – (205.5) (6.4) (211.9)Preferred share dividends – – – – (60.8) – (60.8) – (60.8) – (60.8)Net changes in capitalization and
other (notes 6 and 23) – – – 8.9 1.1 – 10.0 – 10.0 38.0 48.0
Balance as of December 31, 2013 3,642.8 3.8 (140.0) 50.5 3,551.2 78.4 7,186.7 1,166.4 8,353.1 107.4 8,460.5
See accompanying notes.
32
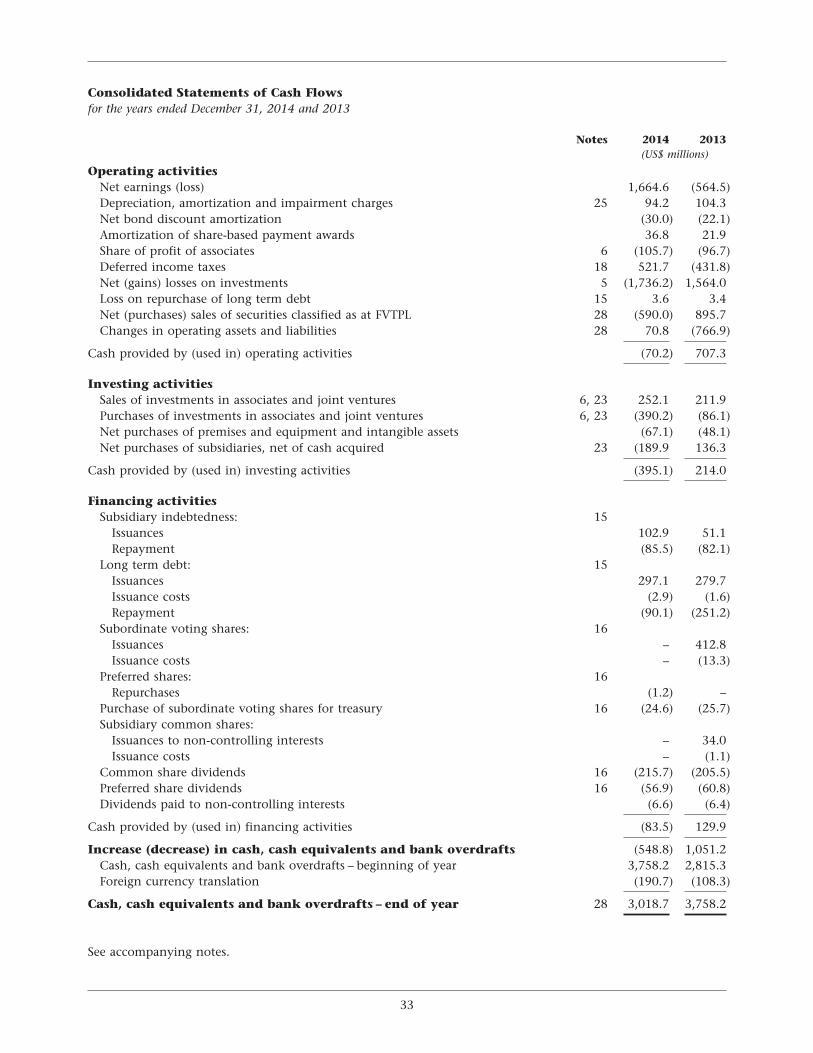
Consolidated Statements of Cash Flowsfor the years ended December 31, 2014 and 2013
Notes 2014 2013(US$ millions)
Operating activitiesNet earnings (loss) 1,664.6 (564.5)Depreciation, amortization and impairment charges 25 94.2 104.3Net bond discount amortization (30.0) (22.1)Amortization of share-based payment awards 36.8 21.9Share of profit of associates 6 (105.7) (96.7)Deferred income taxes 18 521.7 (431.8)Net (gains) losses on investments 5 (1,736.2) 1,564.0Loss on repurchase of long term debt 15 3.6 3.4Net (purchases) sales of securities classified as at FVTPL 28 (590.0) 895.7Changes in operating assets and liabilities 28 70.8 (766.9)
Cash provided by (used in) operating activities (70.2) 707.3
Investing activitiesSales of investments in associates and joint ventures 6, 23 252.1 211.9Purchases of investments in associates and joint ventures 6, 23 (390.2) (86.1)Net purchases of premises and equipment and intangible assets (67.1) (48.1)Net purchases of subsidiaries, net of cash acquired 23 (189.9 136.3
Cash provided by (used in) investing activities (395.1) 214.0
Financing activitiesSubsidiary indebtedness: 15
Issuances 102.9 51.1Repayment (85.5) (82.1)
Long term debt: 15Issuances 297.1 279.7Issuance costs (2.9) (1.6)Repayment (90.1) (251.2)
Subordinate voting shares: 16Issuances – 412.8Issuance costs – (13.3)
Preferred shares: 16Repurchases (1.2) –
Purchase of subordinate voting shares for treasury 16 (24.6) (25.7)Subsidiary common shares:
Issuances to non-controlling interests – 34.0Issuance costs – (1.1)
Common share dividends 16 (215.7) (205.5)Preferred share dividends 16 (56.9) (60.8)Dividends paid to non-controlling interests (6.6) (6.4)
Cash provided by (used in) financing activities (83.5) 129.9
Increase (decrease) in cash, cash equivalents and bank overdrafts (548.8) 1,051.2Cash, cash equivalents and bank overdrafts – beginning of year 3,758.2 2,815.3Foreign currency translation (190.7) (108.3)
Cash, cash equivalents and bank overdrafts – end of year 28 3,018.7 3,758.2
See accompanying notes.
33
FAIRFAX FINANCIAL HOLDINGS LIMITED
Index to Notes to Consolidated Financial Statements
1. Business Operations . . . . . . . . . . . . . . . . . . . . . . . . . . . . . . . . . . . . . . . . . . . . . . . . . . . . . . . . . 35
2. Basis of Presentation . . . . . . . . . . . . . . . . . . . . . . . . . . . . . . . . . . . . . . . . . . . . . . . . . . . . . . . . 35
3. Summary of Significant Accounting Policies . . . . . . . . . . . . . . . . . . . . . . . . . . . . . . . . . . . . . . . . 35
4. Critical Accounting Estimates and Judgments . . . . . . . . . . . . . . . . . . . . . . . . . . . . . . . . . . . . . . . 50
5. Cash and Investments . . . . . . . . . . . . . . . . . . . . . . . . . . . . . . . . . . . . . . . . . . . . . . . . . . . . . . . 52
6. Investments in Associates . . . . . . . . . . . . . . . . . . . . . . . . . . . . . . . . . . . . . . . . . . . . . . . . . . . . . 57
7. Short Sales and Derivatives . . . . . . . . . . . . . . . . . . . . . . . . . . . . . . . . . . . . . . . . . . . . . . . . . . . . 59
8. Insurance Contract Liabilities . . . . . . . . . . . . . . . . . . . . . . . . . . . . . . . . . . . . . . . . . . . . . . . . . . 61
9. Reinsurance . . . . . . . . . . . . . . . . . . . . . . . . . . . . . . . . . . . . . . . . . . . . . . . . . . . . . . . . . . . . . . 64
10. Insurance Contract Receivables . . . . . . . . . . . . . . . . . . . . . . . . . . . . . . . . . . . . . . . . . . . . . . . . . 66
11. Deferred Premium Acquisition Costs . . . . . . . . . . . . . . . . . . . . . . . . . . . . . . . . . . . . . . . . . . . . . 66
12. Goodwill and Intangible Assets . . . . . . . . . . . . . . . . . . . . . . . . . . . . . . . . . . . . . . . . . . . . . . . . . 67
13. Other Assets . . . . . . . . . . . . . . . . . . . . . . . . . . . . . . . . . . . . . . . . . . . . . . . . . . . . . . . . . . . . . . 69
14. Accounts Payable and Accrued Liabilities . . . . . . . . . . . . . . . . . . . . . . . . . . . . . . . . . . . . . . . . . . 69
15. Subsidiary Indebtedness, Long Term Debt and Credit Facilities . . . . . . . . . . . . . . . . . . . . . . . . . . . 70
16. Total Equity . . . . . . . . . . . . . . . . . . . . . . . . . . . . . . . . . . . . . . . . . . . . . . . . . . . . . . . . . . . . . . 73
17. Earnings per Share . . . . . . . . . . . . . . . . . . . . . . . . . . . . . . . . . . . . . . . . . . . . . . . . . . . . . . . . . . 77
18. Income Taxes . . . . . . . . . . . . . . . . . . . . . . . . . . . . . . . . . . . . . . . . . . . . . . . . . . . . . . . . . . . . . 77
19. Statutory Requirements . . . . . . . . . . . . . . . . . . . . . . . . . . . . . . . . . . . . . . . . . . . . . . . . . . . . . . 80
20. Contingencies and Commitments . . . . . . . . . . . . . . . . . . . . . . . . . . . . . . . . . . . . . . . . . . . . . . . 80
21. Pensions and Post Retirement Benefits . . . . . . . . . . . . . . . . . . . . . . . . . . . . . . . . . . . . . . . . . . . . 81
22. Operating Leases . . . . . . . . . . . . . . . . . . . . . . . . . . . . . . . . . . . . . . . . . . . . . . . . . . . . . . . . . . . 83
23. Acquisitions and Divestitures . . . . . . . . . . . . . . . . . . . . . . . . . . . . . . . . . . . . . . . . . . . . . . . . . . 84
24. Financial Risk Management . . . . . . . . . . . . . . . . . . . . . . . . . . . . . . . . . . . . . . . . . . . . . . . . . . . 88
25. Segmented Information . . . . . . . . . . . . . . . . . . . . . . . . . . . . . . . . . . . . . . . . . . . . . . . . . . . . . . 105
26. Expenses . . . . . . . . . . . . . . . . . . . . . . . . . . . . . . . . . . . . . . . . . . . . . . . . . . . . . . . . . . . . . . . . 110
27. Salaries and Employee Benefits Expense . . . . . . . . . . . . . . . . . . . . . . . . . . . . . . . . . . . . . . . . . . . 111
28. Supplementary Cash Flow Information . . . . . . . . . . . . . . . . . . . . . . . . . . . . . . . . . . . . . . . . . . . 111
29. Related Party Transactions . . . . . . . . . . . . . . . . . . . . . . . . . . . . . . . . . . . . . . . . . . . . . . . . . . . . 112
34
Notes to Consolidated Financial Statementsfor the years ended December 31, 2014 and 2013(in US$ and $ millions except per share amounts and as otherwise indicated)
1. Business Operations
Fairfax Financial Holdings Limited (‘‘the company’’ or ‘‘Fairfax’’) is a holding company which, through itssubsidiaries, is principally engaged in property and casualty insurance and reinsurance and the associatedinvestment management. The holding company is federally incorporated and domiciled in Ontario, Canada.
2. Basis of Presentation
The consolidated financial statements of the company for the year ended December 31, 2014 are prepared inaccordance with International Financial Reporting Standards (‘‘IFRS’’) as issued by the International AccountingStandards Board (‘‘IASB’’). The accounting policies used to prepare the consolidated financial statements complywith IFRS effective as at December 31, 2014 (except IFRS 9 (2010) Financial Instruments which was early adopted).Where IFRS does not contain clear guidance governing the accounting treatment of certain transactions includingthose that are specific to insurance products, IFRS requires judgment in developing and applying an accountingpolicy, which may include reference to another comprehensive body of accounting principles. In these cases, thecompany considers the hierarchy of guidance in International Accounting Standard 8 Accounting Policies, Changes inAccounting Estimates and Errors. The consolidated financial statements have been prepared on a historical cost basis,except for derivative financial instruments and as at fair value through profit and loss (‘‘FVTPL’’) financial assets andliabilities that have been measured at fair value.
The preparation of the company’s consolidated financial statements requires management to make estimates andassumptions that affect the reported amounts of assets and liabilities at the date of the consolidated financialstatements, the reported amounts of revenue and expenses during the reporting periods covered by the consolidatedfinancial statements and the related disclosures. Critical accounting estimates and judgments are described in note 4.
The consolidated balance sheets of the company are presented on a non-classified basis. Assets expected to berealized and liabilities expected to be settled within the company’s normal operating cycle of one year wouldtypically be considered as current, including the following balances: cash, short term investments, insurancecontract receivables, deferred premium acquisition costs, subsidiary indebtedness, income taxes payable, and shortsale and derivative obligations.
The following balances are generally considered as non-current: deferred income taxes and goodwill and intangibleassets.
The following balances are generally comprised of current and non-current amounts: bonds, preferred and commonstocks, derivatives and other invested assets, recoverable from reinsurers, other assets, accounts payable and accruedliabilities, funds withheld payable to reinsurers, insurance contract liabilities and long term debt.
These consolidated financial statements were approved for issue by the company’s Board of Directors onMarch 6, 2015.
3. Summary of Significant Accounting Policies
The principal accounting policies applied to the presentation of these consolidated financial statements and themethods of computation have been consistently applied to all periods presented unless otherwise stated, and are asset out below.
Principles of consolidationSubsidiaries – The company’s consolidated financial statements include the assets, liabilities, equity, revenue,expenses and cash flows of the holding company and its subsidiaries. A subsidiary is an entity over which thecompany has control. The company controls an entity when the company has power over the entity, is exposed to,or has rights to, variable returns from its involvement with the entity and has the ability to affect those returnsthrough its power over the entity. Assessment of control is based on the substance of the relationship between thecompany and the entity and includes consideration of both existing voting rights and, if applicable, potential votingrights that are currently exercisable and convertible. The operating results of subsidiaries acquired are included in the
35
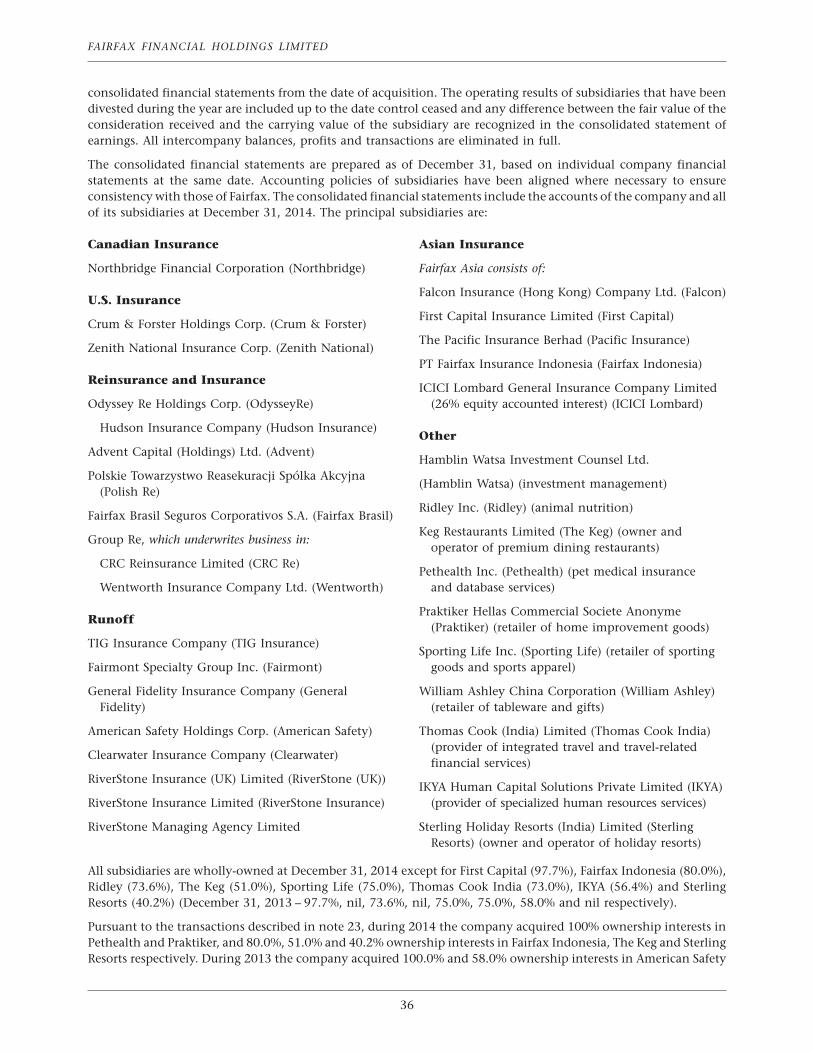
FAIRFAX FINANCIAL HOLDINGS LIMITED
consolidated financial statements from the date of acquisition. The operating results of subsidiaries that have beendivested during the year are included up to the date control ceased and any difference between the fair value of theconsideration received and the carrying value of the subsidiary are recognized in the consolidated statement ofearnings. All intercompany balances, profits and transactions are eliminated in full.
The consolidated financial statements are prepared as of December 31, based on individual company financialstatements at the same date. Accounting policies of subsidiaries have been aligned where necessary to ensureconsistency with those of Fairfax. The consolidated financial statements include the accounts of the company and allof its subsidiaries at December 31, 2014. The principal subsidiaries are:
Canadian Insurance Asian Insurance
Northbridge Financial Corporation (Northbridge) Fairfax Asia consists of:
Falcon Insurance (Hong Kong) Company Ltd. (Falcon)U.S. Insurance
First Capital Insurance Limited (First Capital)Crum & Forster Holdings Corp. (Crum & Forster)
The Pacific Insurance Berhad (Pacific Insurance)Zenith National Insurance Corp. (Zenith National)
PT Fairfax Insurance Indonesia (Fairfax Indonesia)Reinsurance and Insurance
ICICI Lombard General Insurance Company LimitedOdyssey Re Holdings Corp. (OdysseyRe) (26% equity accounted interest) (ICICI Lombard)
Hudson Insurance Company (Hudson Insurance)Other
Advent Capital (Holdings) Ltd. (Advent)Hamblin Watsa Investment Counsel Ltd.
Polskie Towarzystwo Reasekuracji Spolka Akcyjna(Hamblin Watsa) (investment management)
(Polish Re)Ridley Inc. (Ridley) (animal nutrition)
Fairfax Brasil Seguros Corporativos S.A. (Fairfax Brasil)Keg Restaurants Limited (The Keg) (owner and
Group Re, which underwrites business in:operator of premium dining restaurants)
CRC Reinsurance Limited (CRC Re)Pethealth Inc. (Pethealth) (pet medical insurance
Wentworth Insurance Company Ltd. (Wentworth) and database services)
Praktiker Hellas Commercial Societe AnonymeRunoff
(Praktiker) (retailer of home improvement goods)TIG Insurance Company (TIG Insurance)
Sporting Life Inc. (Sporting Life) (retailer of sportingFairmont Specialty Group Inc. (Fairmont) goods and sports apparel)
General Fidelity Insurance Company (General William Ashley China Corporation (William Ashley)Fidelity) (retailer of tableware and gifts)
American Safety Holdings Corp. (American Safety) Thomas Cook (India) Limited (Thomas Cook India)(provider of integrated travel and travel-related
Clearwater Insurance Company (Clearwater)financial services)
RiverStone Insurance (UK) Limited (RiverStone (UK))IKYA Human Capital Solutions Private Limited (IKYA)
RiverStone Insurance Limited (RiverStone Insurance) (provider of specialized human resources services)
RiverStone Managing Agency Limited Sterling Holiday Resorts (India) Limited (SterlingResorts) (owner and operator of holiday resorts)
All subsidiaries are wholly-owned at December 31, 2014 except for First Capital (97.7%), Fairfax Indonesia (80.0%),Ridley (73.6%), The Keg (51.0%), Sporting Life (75.0%), Thomas Cook India (73.0%), IKYA (56.4%) and SterlingResorts (40.2%) (December 31, 2013 – 97.7%, nil, 73.6%, nil, 75.0%, 75.0%, 58.0% and nil respectively).
Pursuant to the transactions described in note 23, during 2014 the company acquired 100% ownership interests inPethealth and Praktiker, and 80.0%, 51.0% and 40.2% ownership interests in Fairfax Indonesia, The Keg and SterlingResorts respectively. During 2013 the company acquired 100.0% and 58.0% ownership interests in American Safety
36
and IKYA respectively, and divested its 81.7% ownership interest in Prime Restaurants Inc. The company has anumber of wholly-owned subsidiaries not presented in the table above, that are intermediate holding companies ofinvestments in subsidiaries and intercompany balances, all of which are eliminated on consolidation.
The holding company has significant liquid resources that are generally not restricted by insurance regulators. Theoperating subsidiaries are primarily insurers and reinsurers that are often subject to a wide variety of insurance andother laws and regulations that vary by jurisdiction and are intended to protect policyholders rather than investors.These laws and regulations may limit the ability of operating subsidiaries to pay dividends or make distributions toparent companies. The company’s consolidated balance sheet and consolidated statement of cash flows thereforemake a distinction in classification between the holding company and the operating subsidiaries for cash and shortterm investments to provide additional insight into the company’s liquidity, financial leverage and capital structure.
Non-controlling interests – A non-controlling interest is initially recognized as the proportionate share of theidentifiable net assets of the subsidiary on the date of its acquisition and is subsequently adjusted for thenon-controlling interest’s share in changes of the acquired subsidiary’s earnings and capital. Effects of transactionswith non-controlling interests are recorded in equity if there is no change in control.
Investments in associates – Investments in associates are accounted for using the equity method and arecomprised of investments in corporations, limited partnerships and trusts where the company has the ability toexercise significant influence but not control. Significant influence is generally presumed to exist when the companyowns, directly or indirectly, between 20% and 50% of the outstanding voting rights of the investee. Assessment ofsignificant influence is based on the substance of the relationship between the company and the investee andincludes consideration of existing voting rights, potential voting rights that are currently exercisable and convertible(if applicable), voting power of other shareholders, corporate governance arrangements and participation in policy-making processes. These investments are reported in investments in associates on the consolidated balance sheet,with the company’s share of profit (loss) and other comprehensive income (loss) of the associate reported in thecorresponding line in the consolidated statement of earnings and consolidated statement of comprehensive income,respectively. Foreign associates are translated in the same manner as foreign subsidiaries. When the company’s shareof losses in an associate equals or exceeds its investment in the associate, the company does not record further lossesunless it has incurred obligations on behalf of the associate.
Under the equity method of accounting, an investment in associate is initially recognized at cost and adjustedthereafter for the post-acquisition change in the company’s share of net assets of the associate. Any excess of the costof acquisition over the net fair value of the company’s share of the identifiable assets, liabilities and contingentliabilities at the date of acquisition is recognized as goodwill, and is included in the carrying value of the associate. Tothe extent that the cost of acquisition is less than the fair value of the company’s share of the associate’s identifiablenet assets, the excess is recognized in the consolidated statement of earnings. Any pre-existing interest in an associateis re-measured to fair value at the date significant influence is obtained and any resulting gain or loss is recognized inthe consolidated statement of earnings. In such instances the cost of the associate is measured as the sum of the fairvalue of the pre-existing interest and any additional consideration transferred at that date.
In determining the fair value of the company’s share of an associate’s identifiable net assets at the acquisition date,considerable judgment may be required in interpreting market data used to develop such estimates. The companymakes assumptions primarily based on market conditions and applies valuation techniques such as discounted cashflow analysis, market capitalization and comparable company multiples and other methods commonly used bymarket participants to determine fair value. Where the company is only able to identify the principal factorsresulting in divergence between the fair value and reported carrying value of an associate’s net assets, the use ofdifferent assumptions and/or valuation methodologies by the company may have a significant effect on theestimated fair value. At each reporting date, the fair value of associates is estimated and disclosed using valuationtechniques consistent with those applied to the company’s other investments in equity instruments. See‘Determination of fair value’ under the heading of ‘Investments’ for further details.
At each balance sheet date, and more frequently when conditions warrant, management assesses investments inassociates for potential impairment. If management’s assessment indicates that there is objective evidence ofimpairment, the associate is written down to its recoverable amount, which is determined as the higher of its fairvalue less costs of disposal and its value in use. Previously recognized impairment losses are reversed when there isevidence that there has been a change in the estimates used to determine the associate’s recoverable amount sincethe recognition of the last impairment loss. The reversal is recognized in the consolidated statement of earnings tothe extent that the carrying value of the associate after reversal does not exceed the carrying value that would have
37
FAIRFAX FINANCIAL HOLDINGS LIMITED
been determined had no impairment loss been recognized in previous periods. Gains and losses realized ondispositions, impairment losses and reversal of impairments are recognized in net gains (losses) on investments inthe consolidated statement of earnings.
The most recent available financial statements of associates are used in applying the equity method. The differencebetween the end of the reporting period of the associates and that of the company is no more than three months.Adjustments are made for the effects of significant transactions or events that occur between the dates of theassociates’ financial statements and the date of the company’s financial statements.
Business combinationsBusiness combinations are accounted for using the acquisition method of accounting whereby the considerationtransferred is measured at fair value at the date of acquisition. This consideration includes any cash paid plus the fairvalue at the date of exchange of assets given, liabilities incurred and equity instruments issued by the company or itssubsidiaries. The consideration transferred also includes contingent consideration arrangements recorded at fairvalue. Directly attributable acquisition-related costs are expensed in the current period and reported withinoperating expenses. At the date of acquisition, the company recognizes the identifiable assets acquired, the liabilitiesassumed and any non-controlling interest in the acquired business. The identifiable assets acquired and liabilitiesassumed are initially recognized at fair value. To the extent that the consideration transferred is less than the fairvalue of identifiable net assets acquired, the excess is recognized in the consolidated statement of earnings.
Any pre-existing equity interest in an acquiree is re-measured to fair value at the date of the business combinationand any resulting gain or loss is recognized in the consolidated statement of earnings.
Goodwill and intangible assetsGoodwill – Goodwill is recorded as the excess of consideration transferred over the fair value of the identifiable netassets acquired in a business combination, less accumulated impairment charges, and is allocated to thecash-generating units expected to benefit from the acquisition for the purpose of impairment testing. Thesecash-generating units represent the lowest level at which goodwill is monitored for internal management purposes.On an annual basis or more frequently if there are potential indicators of impairment, the carrying value of acash-generating unit, including its allocated goodwill, is compared to its recoverable amount, which is the higher ofits fair value less costs of disposal and its value in use. Goodwill impairment is measured as the excess of the carryingamount over the recoverable amount of a cash-generating unit, and is charged to operating expenses in theconsolidated statement of earnings. Impairment charges cannot be reversed for subsequent increases in acash-generating unit’s recoverable amount. The estimated recoverable amounts are sensitive to the assumptions usedin the valuations.
Goodwill is derecognized on disposal of a cash-generating unit to which goodwill was previously allocated, with thedifference between the proceeds and carrying value of the cash-generating unit (inclusive of goodwill and unrealizedbalances recorded in accumulated other comprehensive income) recorded in the consolidated statement of earnings.
Intangible assets – Intangible assets are comprised primarily of customer and broker relationships, brand names,computer software (including enterprise systems) and other acquired identifiable non-monetary assets withoutphysical form.
Intangible assets are initially recognized at cost (fair value when acquired through a business combination) and aresubsequently measured at cost less accumulated amortization and impairment, where amortization is calculatedusing the straight-line method based on the estimated useful life of those intangible assets with a finite life. Theintended use, expected life and economic benefit to be derived from intangible assets with a finite life arere-evaluated by the company when there are potential indicators of impairment. Indefinite-lived intangible assetsare not subject to amortization but are assessed for impairment on an annual basis or more frequently if there arepotential indicators of impairment. If events or changes in circumstances indicate that a previously recognizedimpairment loss has decreased or no longer exists, a reversal is recognized in the consolidated statement of earningsto the extent that the carrying amount of the intangible asset after reversal does not exceed the carrying amount thatwould have been had no impairment taken place.
38
The estimated useful lives of the company’s intangible assets are as follows:
Customer and broker relationships 8 to 20 yearsBrand names IndefiniteComputer software 3 to 15 years
Brand names are considered to be indefinite-lived based on their strength, history and expected future use.
Foreign currency translationFunctional and presentation currency – The consolidated financial statements are presented in U.S. dollarswhich is the holding company’s functional currency and the presentation currency of the consolidated group.
Transactions and items on the consolidated balance sheet in foreign currencies – Foreign currencytransactions are translated into the functional currencies of the holding company and its subsidiaries using theexchange rates prevailing at the dates of the transactions. Foreign exchange gains and losses resulting from thesettlement of such transactions and from the translation at year-end exchange rates of monetary assets and liabilitiesdenominated in foreign currencies are recognized in the consolidated statement of earnings. Non-monetary itemscarried at cost are translated using the exchange rate at the date of the transaction. Non-monetary items carried atfair value are translated at the date the fair value is determined.
Translation of foreign subsidiaries – The functional currencies of some of the company’s subsidiaries(principally in Canada, the United Kingdom and Asia) differ from the consolidated group U.S. dollar presentationcurrency. As a result, the assets and liabilities of these subsidiaries are translated on consolidation at the rates ofexchange prevailing at the balance sheet date. Revenue and expenses are translated at the average rate of exchangefor the period. The net unrealized gain or loss resulting from this translation is recognized in accumulated othercomprehensive income.
On consolidation, translation gains and losses arising from the translation of a monetary item that forms part of thenet investment in a foreign subsidiary are recognized in accumulated other comprehensive income. Upon disposal ofan investment in a foreign subsidiary, the related net translation gain or loss is reclassified from accumulated othercomprehensive income to the consolidated statement of earnings as a component of the net gain or losson disposition.
Goodwill and fair value adjustments arising on the acquisition of a foreign subsidiary are treated as assets andliabilities of that foreign subsidiary and translated at the rates of exchange prevailing at the balance sheet date andtranslation gains and losses are recognized in accumulated other comprehensive income.
Net investment hedge – In a net investment hedging relationship, the gains and losses relating to the effectiveportion of the hedge are recorded in other comprehensive income. The gains and losses relating to the ineffectiveportion of the hedge are recorded in net gains (losses) on investments in the consolidated statement of earnings.Gains and losses in accumulated other comprehensive income are recognized in net earnings when the hedged netinvestment in a foreign subsidiary is reduced.
Comprehensive income (loss)Comprehensive income (loss) consists of net earnings (loss) and other comprehensive income (loss) and includes allchanges in total equity during a period, except for those resulting from investments by owners and distributions toowners. Unrealized foreign currency translation amounts arising from foreign subsidiaries and associates that do nothave U.S. dollar functional currencies and changes in the fair value of the effective portion of cash flow hedginginstruments on hedges of net investments in foreign subsidiaries are recognized in other comprehensive income(loss) and included in accumulated other comprehensive income (loss) until recycled to the consolidated statementof earnings in the future. Actuarial gains and losses and changes in asset limitation amounts on defined benefitpension and post retirement plans are recorded in other comprehensive income (loss) and subsequently included inaccumulated other comprehensive income (loss) without recycling. Upon settlement of the defined benefit plan ordisposal of the related associate or subsidiary those amounts are reclassified directly to retained earnings.Accumulated other comprehensive income (loss) (net of income taxes) is included on the consolidated balance sheetas a component of common shareholders’ equity.
39
FAIRFAX FINANCIAL HOLDINGS LIMITED
Consolidated statement of cash flowsThe company’s consolidated statements of cash flows are prepared in accordance with the indirect method,classifying cash flows as cash flows from operating, investing and financing activities.
Cash and cash equivalents – Cash and cash equivalents consist of holding company and subsidiary cash andshort term highly liquid investments that are readily convertible into cash and have maturities of three months orless when purchased and exclude cash and short term highly liquid investments that are restricted. Cash and cashequivalents includes cash on hand, demand deposits with banks and other short term highly liquid investmentswith maturities of three months or less when purchased. The carrying value of cash and cash equivalentsapproximates fair value.
InvestmentsInvestments include cash and cash equivalents, short term investments, non-derivative financial assets, derivatives,real estate held for investment and investments in associates. Management determines the appropriateclassifications of investments in fixed income and equity securities at their acquisition date.
Classification of non-derivative financial assets – Investments in equity instruments and those debtinstruments that do not meet the criteria for amortized cost (see below) are classified as at fair value through profit orloss (‘‘FVTPL’’). Financial assets classified as at FVTPL are carried at fair value on the consolidated balance sheet withrealized and unrealized gains and losses recorded in net gains (losses) on investments in the consolidated statementof earnings and as an operating activity in the consolidated statement of cash flows. Dividends and interest earned,net of interest incurred are included in the consolidated statement of earnings in interest and dividends and as anoperating activity in the consolidated statement of cash flows.
A debt instrument is measured at amortized cost if (i) the objective of the company’s business model is to hold theinstrument in order to collect contractual cash flows and (ii) the contractual terms of the instrument give rise onspecified dates to cash flows that are solely payments of principal and interest on the principal amount outstanding.Alternatively, debt instruments that meet the criteria for amortized cost may be designated as at FVTPL on initialrecognition if doing so eliminates or significantly reduces an accounting mismatch. The company’s business modelcurrently does not permit any of its investments in debt instruments to be measured at amortized cost.
Investments in equity instruments that are not held for trading may be irrevocably designated at fair value throughother comprehensive income (‘‘FVTOCI’’) on initial recognition. The company has not designated any of its equityinstruments at FVTOCI.
Recognition and measurement of non-derivative financial assets – The company recognizes purchasesand sales of financial assets on the trade date, which is the date on which the company commits to purchase or sellthe asset. Transactions pending settlement are reflected on the consolidated balance sheet in other assets or inaccounts payable and accrued liabilities.
Transaction costs related to financial assets classified or designated as at FVTPL are expensed as incurred.
A financial asset is derecognized when the rights to receive cash flows from the investment have expired or have beentransferred and when the company has transferred substantially the risks and rewards of ownership of the asset.
Determination of fair value – Fair values for substantially all of the company’s financial instruments aremeasured using market or income approaches. Considerable judgment may be required in interpreting market dataused to develop estimates of fair value. Accordingly, actual values realized in future market transactions may differfrom the estimates presented in these consolidated financial statements. The use of different market assumptionsand/or valuation methodologies may have a material effect on the estimated fair values. The fair values of financialinstruments are based on bid prices for financial assets and ask prices for financial liabilities. The companycategorizes its fair value measurements according to a three level hierarchy described below:
Level 1 – Inputs represent unadjusted quoted prices for identical instruments exchanged in active markets. Thefair values of the majority of the company’s common stocks, equity call options and certain warrants are basedon published quotes in active markets.
Level 2 – Inputs include directly or indirectly observable inputs (other than Level 1 inputs) such as quoted pricesfor similar financial instruments exchanged in active markets, quoted prices for identical or similar financialinstruments exchanged in inactive markets and other market observable inputs. The fair value of the vastmajority of the company’s investments in bonds are priced by independent pricing service providers while much
40
of the remainder, along with most derivative contracts (total return swaps) and certain warrants are basedprimarily on non-binding third party broker-dealer quotes that are prepared using Level 2 inputs. Where thirdparty broker-dealer quotes are used, typically one quote is obtained from a broker-dealer with particularexpertise in the instrument being priced. Preferred stocks are priced using a combination of independent pricingservice providers and internal valuation models that rely on directly or indirectly observable inputs.
The fair values of investments in certain limited partnerships classified as common stocks on the consolidatedbalance sheet are based on the net asset values received from the general partner, adjusted for liquidity asrequired and are classified as Level 2 when they may be liquidated or redeemed within three months or less ofproviding notice to the general partner. Otherwise, such investments in limited partnerships are classified asLevel 3.
Level 3 – Inputs include unobservable inputs used in the measurement of financial instruments. Management isrequired to use its own assumptions regarding unobservable inputs as there is little, if any, market activity inthese instruments or related observable inputs that can be corroborated at the measurement date. Investmentsin consumer price indexes (‘‘CPI’’) linked derivatives are classified as Level 3.
Transfers between fair value hierarchy categories are considered effective from the beginning of the reporting periodin which the transfer is identified.
Valuation techniques used by the company’s independent pricing service providers and third party broker-dealersinclude comparisons with similar instruments where observable market prices exist, discounted cash flow analysis,option pricing models, and other valuation techniques commonly used by market participants. The companyassesses the reasonableness of pricing received from these third party sources by comparing the fair values received torecent transaction prices for similar assets where available, to industry accepted discounted cash flow models (thatincorporate estimates of the amount and timing of future cash flows and market observable inputs such as creditspreads and discount rates) and to option pricing models (that incorporate market observable inputs including thequoted price, volatility and dividend yield of the underlying security and the risk free rate).
The company employs dedicated personnel responsible for the valuation of its investment portfolio. Detailedvaluations are performed for those financial instruments that are priced internally, while external pricing receivedfrom independent pricing service providers and third party broker-dealers are evaluated by the company forreasonableness. The company’s Chief Financial Officer oversees the valuation function and regularly reviewsvaluation processes and results, including at each quarterly reporting period. Significant valuation matters,particularly those requiring extensive judgment, are communicated to the company’s Audit Committee.
Short term investments – Short term investments are investments with maturity dates between three monthsand twelve months when purchased. Short term investments are classified as at FVTPL and their carrying valuesapproximate fair value.
Accounts receivable and accounts payableAccounts receivable and accounts payable are recognized initially at fair value. Due to their short-term nature,carrying value is considered to approximate fair value.
Securities sold short and derivative financial instrumentsSecurities sold short – Securities sold short (‘‘short sales’’) represent obligations to deliver securities which werenot owned at the time of the sale. These obligations are carried at fair value with changes in fair value recorded in netgains (losses) on investments where fair value is determined based on Level 1 inputs (described above).
Derivative financial instruments – Derivative financial instruments may include interest rate, credit default,currency and total return swaps, CPI-linked, futures, forwards, warrants and option contracts all of which derivetheir value mainly from changes in underlying interest rates, foreign exchange rates, credit ratings, commodityvalues, inflation indexes or equity instruments. A derivative contract may be traded on an exchange orover-the-counter (‘‘OTC’’). Exchange-traded derivatives are standardized and include futures and certain warrantsand option contracts. OTC derivative contracts are individually negotiated between contracting parties and mayinclude the company’s forwards, CPI-linked derivatives and total return swaps.
The company uses derivatives principally to mitigate financial risks arising from its investment holdings andreinsurance recoverables. Derivatives that are not specifically designated or that do not meet the requirements forhedge accounting are carried at fair value on the consolidated balance sheet with changes in fair value recorded in
41
FAIRFAX FINANCIAL HOLDINGS LIMITED
net gains (losses) on investments in the consolidated statement of earnings and as an operating activity in theconsolidated statement of cash flows. Derivatives are monitored by the company for effectiveness in achieving theirrisk management objectives. The fair value of the company’s derivative financial instruments where quoted marketprices in active markets are unavailable is determined in the same manner as other investments described above. Thecompany has not designated any financial assets or liabilities (including derivatives) as accounting hedges except forthe hedge of its net investment in Canadian subsidiaries as described in note 7.
The fair value of derivatives in a gain position is presented on the consolidated balance sheet in derivatives and otherinvested assets in portfolio investments and in cash and investments of the holding company. The fair value ofderivatives in a loss position and obligations to purchase securities sold short, if any, are presented on theconsolidated balance sheet in short sale and derivative obligations. The initial premium paid for a derivativecontract, if any, would be recorded as a derivative asset and subsequently adjusted for changes in the market value ofthe contract at each balance sheet date. Changes in the market value of a contract are recorded as net gains (losses) oninvestments in the consolidated statement of earnings at each balance sheet date, with a corresponding adjustmentto the carrying value of the derivative asset or liability.
The fair value of the majority of the company’s equity call options and certain warrants are based on publishedquotes in an active market considered to be Level 1 inputs. The fair value of the majority of the company’s derivativecontracts and certain warrants are based on third party broker-dealer quotes considered to be Level 2 inputs. Includedin Level 3 are investments in CPI-linked derivatives that are valued using broker-dealer quotes which managementhas determined utilize market observable inputs except for the inflation volatility input which is not marketobservable.
Cash collateral received from or paid to counterparties as security for derivative contract assets or liabilitiesrespectively is included in liabilities or assets on the consolidated balance sheet. Securities received fromcounterparties as collateral are not recorded as assets. Securities delivered to counterparties as collateral continue tobe reflected as assets on the consolidated balance sheet as assets pledged for short sale and derivative obligations.
Equity contracts – The company’s long equity total return swaps allow the company to receive the total return ona notional amount of an equity index or individual equity security (including dividends and capital gains or losses)in exchange for the payment of a floating rate of interest on the notional amount. Conversely, short equity totalreturn swaps allow the company to pay the total return on a notional amount of an equity index or individual equitysecurity in exchange for the receipt of a floating rate of interest on the notional amount. The company classifiesdividends and interest paid or received related to its long and short equity and equity index total return swaps on anet basis as derivatives and other within interest and dividends in the consolidated statement of earnings. Thecompany’s equity and equity index total return swaps contain contractual reset provisions requiring counterpartiesto cash-settle on a monthly or quarterly basis any market value movements arising subsequent to the priorsettlement. Any cash amounts paid to settle unfavourable market value changes and, conversely, any cash amountsreceived in settlement of favourable market value changes, are recorded as net gains (losses) on investments in theconsolidated statement of earnings. To the extent that a contractual reset date of a contract does not correspond tothe balance sheet date, the company records net gains (losses) on investments in the consolidated statement ofearnings to adjust the carrying value of the derivative asset or liability associated with each total return swap contractto reflect its fair value at the balance sheet date. Final cash settlements of total return swaps are recognized as netgains (losses) on investments net of any previously recorded unrealized market value changes since the last quarterlyreset date. Total return swaps require no initial net investment, and at inception, their fair value is zero.
Credit contracts – The initial premium paid for a credit contract is recorded as a derivative asset. Subsequentchanges in the unrealized fair value of a contract is recorded as net gains (losses) on investments in the consolidatedstatement of earnings at each balance sheet date, with a corresponding adjustment to the carrying value of thederivative asset. As the average remaining life of a contract declines, the fair value of the contract (excluding theimpact of credit spreads) will generally decline.
CPI-linked derivative contracts – The initial premium paid for a CPI-linked derivative contract is recorded as aderivative asset. Subsequent changes in the unrealized fair value of a contract is recorded as net gains (losses) oninvestments in the consolidated statement of earnings at each balance sheet date, with a corresponding adjustmentto the carrying value of the derivative asset. As the average remaining life of a contract declines, the fair value of thecontract (excluding the impact of changes in the underlying CPI) will generally decline. The reasonableness of thefair values of CPI-linked derivative contracts are assessed by comparing the fair values received from third partybroker-dealers to recent market transactions where available and values determined using third party pricing
42
software based on the Black-Scholes option pricing model for European-style options that incorporates marketobservable and unobservable inputs such as the current value of the relevant CPI underlying the derivative, theinflation swap rate, nominal swap rate and inflation volatility. The fair values of CPI-linked derivative contracts aresensitive to assumptions such as market expectations of future rates of inflation and related inflation volatilities.
Insurance contractsInsurance contracts are those contracts that have significant insurance risk at the inception of the contract.Insurance risk arises when the company agrees to compensate a policyholder if a specified uncertain future eventadversely affects the policyholder. It is defined as the possibility of paying (including variability in timing ofpayments) significantly more in a scenario where the insured event occurs than when it does not occur. Scenariosconsidered include only those which have commercial substance. Any contracts not meeting the definition of aninsurance contract under IFRS are classified as investment contracts, derivative contracts or service contracts,as appropriate.
Revenue recognition – Premiums written are deferred as unearned premiums and recognized as revenue, net ofpremiums ceded, on a pro rata basis over the terms of the underlying policies. Net premiums earned are reportedgross of premium taxes which are included in operating expenses as the related premiums are earned. Certainreinsurance premiums are estimated at the individual contract level, based on historical patterns and experiencefrom the ceding companies for contracts where reports from ceding companies for the period are not contractuallydue until after the balance sheet date. The cost of reinsurance purchased by the company (premiums ceded) isincluded in recoverable from reinsurers and is amortized over the contract period in proportion to the amount ofinsurance protection provided. Unearned premium represents the portion of the premiums written relating toperiods of insurance and reinsurance coverage subsequent to the balance sheet date. Impairment losses on insurancepremiums receivable are included in operating expenses in the consolidated statement of earnings.
Deferred premium acquisition costs – Certain costs of acquiring insurance contracts, consisting of brokers’commissions and premium taxes are deferred and charged to earnings as the related premiums are earned. Deferredpremium acquisition costs are limited to their estimated realizable value based on the related unearned premium,which considers anticipated losses and loss adjustment expenses and estimated remaining costs of servicing thebusiness based on historical experience. The ultimate recoverability of deferred premium acquisition costs isdetermined without regard to investment income. Impairment losses on deferred premium acquisition costs areincluded in operating expenses in the consolidated statement of earnings.
Provision for losses and loss adjustment expenses – The company is required by applicable insurance laws,regulations and Canadian accepted actuarial practice to establish reserves for payment of losses and loss adjustmentexpenses that arise from the company’s general insurance and reinsurance products and its runoff operations. Thesereserves represent the expected ultimate cost to settle claims occurring prior to, but still outstanding as of, thebalance sheet date. The company establishes its reserves by product line, type and extent of coverage and year ofoccurrence. Loss reserves fall into two categories: reserves for reported losses (case reserves) and reserves for incurredbut not yet reported (‘‘IBNR’’) losses. Additionally, reserves are held for loss adjustment expenses, which include theestimated legal and other expenses expected to be incurred to finalize the settlement of the losses. Losses and lossadjustment expenses are charged to earnings as incurred.
The company’s reserves for reported losses and loss adjustment expenses are based on estimates of future paymentsto settle reported general insurance and reinsurance claims and claims from its runoff operations. The companybases case reserve estimates on the facts available at the time the reserves are established and for reinsurance, basedon reports and individual case reserve estimates received from ceding companies. The company establishes thesereserves on an undiscounted basis to recognize the estimated costs of bringing pending claims to final settlement,taking into account inflation, as well as other factors that can influence the amount of reserves required, some ofwhich are subjective and some of which are dependent on future events. In determining the level of reserves, thecompany considers historical trends and patterns of loss payments, pending levels of unpaid claims and types ofcoverage. In addition, court decisions, economic conditions and public attitudes may affect the ultimate cost ofsettlement and, as a result, the company’s estimation of reserves. Between the reporting and final settlement of aclaim, circumstances may change, which would result in changes to established reserves. Items such as changes inlaw and interpretations of relevant case law, results of litigation, changes in medical costs, as well as costs of vehicleand building repair materials and labour rates can substantially impact ultimate settlement costs. Accordingly, thecompany reviews and re-evaluates case reserves on a regular basis. Any resulting adjustments are included in the
43
FAIRFAX FINANCIAL HOLDINGS LIMITED
consolidated statement of earnings in the period the adjustment is made. Amounts ultimately paid for losses and lossadjustment expenses can vary significantly from the level of reserves originally set or currently recorded.
The company also establishes reserves for IBNR claims on an undiscounted basis to recognize the estimated cost tobring losses for events which have already occurred but which have not yet been reported to final settlement. Asthese losses have not yet been reported, the company relies upon historical information and statistical models, basedon product line, type and extent of coverage, to estimate its IBNR reserves. The company also uses reported claimtrends, claim severities, exposure growth, and other factors in estimating its IBNR reserves. The company revises itsestimates of IBNR reserves as additional information becomes available and as claims are actually reported.
The time required to learn of and settle claims is often referred to as the ‘‘tail’’ and is an important consideration inestablishing the company’s reserves. Short-tail claims are those for which losses are normally reported soon after theincident and are generally settled within months following the reported incident. This would include, for example,most property, automobile and marine and aerospace damage. Long-tail claims are considered by the company to bethose that often take three years or more to develop and settle, such as asbestos, workers’ compensation and productliability. In the extreme cases of long tail claims like those involving asbestos, it may take upwards of 40 years tosettle. In addition, information concerning the loss event and ultimate cost of a long-tail claim may not be readilyavailable. Accordingly, the reserving analysis of long-tail lines of business is generally more difficult and subject togreater uncertainties than for short-tail lines of business.
Since the company does not establish reserves for catastrophes in advance of the occurrence of such events, theseevents may cause volatility in the levels of incurred losses and reserves, subject to the effects of reinsurancerecoveries. This volatility may also be contingent upon political and legal developments after the occurrence ofthe event.
Estimation techniques – Provisions for losses and loss adjustment expense and provisions for unearnedpremiums are determined based upon previous claims experience, knowledge of events, the terms and conditions ofthe relevant policies and on interpretation of circumstances. Particularly relevant is experience with similar cases andhistorical claims payment trends. The approach also includes consideration of the development of loss paymenttrends, the potential longer term significance of large events, the levels of unpaid claims, legislative changes, judicialdecisions and economic and political conditions.
Where possible the company applies multiple techniques in estimating required provisions. This gives greaterunderstanding of the trends inherent in the data being projected. The company’s estimates of losses and lossadjustment expenses are reached after a review of several commonly accepted actuarial projection methodologiesand a number of different bases to determine these provisions. These include methods based upon the following:
• the development of previously settled claims, where payments to date are extrapolated for each prior year;
• estimates based upon a projection of numbers of claims and average cost;
• notified claims development, where notified claims to date for each year are extrapolated based upon observeddevelopment of earlier years; and,
• expected loss ratios.
In addition, the company uses other techniques such as aggregate benchmarking methods for specialist classes ofbusiness. In selecting its best estimate, the company considers the appropriateness of the methods and bases to theindividual circumstances of the line of business and underwriting year. The process is designed to select the mostappropriate best estimate.
Large claims impacting each relevant line of business are generally assessed separately, being measured either at theface value of the loss adjusters’ estimates or projected separately in order to allow for the future development oflarge claims.
Provisions are calculated gross of any reinsurance recoveries. A separate estimate is made of the amounts that will berecoverable from reinsurers based upon the gross provisions and having due regard to collectability.
The provisions for losses and loss adjustment expenses are subject to review at the subsidiary level, the corporatelevel by the company’s Chief Risk Officer and by independent third party actuaries. In addition, for major classeswhere the risks and uncertainties inherent in the provisions are greatest, ad hoc detailed reviews are undertaken byinternal and external advisers who are able to draw upon their specialist expertise and a broader knowledge of
44
current industry trends in claims development. The results of these reviews are considered when establishing theappropriate levels of provisions for losses and loss adjustment expenses and unexpired risks.
Uncertainties – The uncertainty arising under insurance contracts may be characterized under a number of specificheadings, such as uncertainty relating to:
• whether an event has occurred which would give rise to a policyholder suffering an insured loss;
• the extent of policy coverage and limits applicable;
• the amount of insured loss suffered by a policyholder as a result of the event occurring; and,
• the timing of a settlement to a policyholder for a loss suffered.
The degree of uncertainty will vary by line of business according to the characteristics of the insured risks and thecost of a claim will be determined by the actual loss suffered by the policyholder.
There may be significant reporting lags, particularly for long-tail lines of business, between the occurrence of aninsured event and the time it is actually reported to the company. Following the identification and notification of aninsured loss, there may still be uncertainty as to the magnitude and timing of the settlement of the claim. There aremany factors that will determine the level of uncertainty such as inflation, inconsistent judicial interpretations andcourt judgments that broaden policy coverage beyond the intent of the original insurance, legislative changes andclaims handling procedures.
The establishment of provisions for losses and loss adjustment expenses is an inherently uncertain process and, as aconsequence of this uncertainty, the eventual cost of settlement of outstanding claims and unexpired risks can varysubstantially from the initial estimates in the short term, particularly for the company’s long-tail lines of business.Provisioning considerations include: uncertainty around loss trends, claims inflation and underlying economicconditions; the inherent risk in estimating loss development patterns based on historical data that may not berepresentative of future loss payment patterns; assumptions built on industry loss ratios or industry benchmarkdevelopment patterns that may not reflect actual experience; and the intrinsic risk as to the homogeneity of theunderlying data used in carrying out the reserve analyses. Long tail claims are more susceptible to these uncertaintiesgiven the length of time between the issuance of the original policy and ultimate settlement of any claims. Thecompany seeks to set appropriate levels of provisions for losses and loss adjustment expenses and provisions forunexpired risks taking the known facts and experience into account.
The company has exposures to risks in each line of business that may develop adversely and that could have amaterial impact upon the company’s financial position. The insurance risk diversity within the company’s portfolioof issued policies makes it difficult to predict whether material development will occur and, if it does occur, thelocation and the timing of such an occurrence. The estimation of insurance and reinsurance liabilities involves theuse of judgments and assumptions that are specific to the risks within each territory and the particular type of riskcovered. The diversity of the risks results in it being difficult to identify individual judgments and assumptions thatare more likely than others to have a material impact on the future development of the insurance and reinsuranceliabilities.
Asbestos and environmental claims are examples of specific long-tail risks which may develop materially. Theestimation of the provisions for the ultimate cost of claims for asbestos and environmental pollution is subject to arange of uncertainties that is generally greater than those encountered for other classes of business. As a result, it isnot possible to determine the future development of asbestos and environmental claims with the same degree ofreliability as with other types of claims, particularly in periods when theories of law are in flux. Consequently,traditional techniques for estimating provisions for losses and loss adjustment expenses cannot be wholly reliedupon and the company employs specialized techniques to determine such provisions using the extensive knowledgeof both internal and external asbestos and environmental pollution experts and legal advisors.
Factors contributing to this higher degree of uncertainty include:
• long delays in reporting claims from the date of exposure (for example, cases of mesothelioma can have alatent period of up to 40 years) making estimation of the ultimate number of claims expected to be receivedparticularly difficult;
• issues of allocation of responsibility among potentially responsible parties and insurers;
• emerging court decisions increasing or decreasing insurer liability;
45
FAIRFAX FINANCIAL HOLDINGS LIMITED
• tendencies for social trends and factors to influence court awards;
• developments pertaining to the company’s ability to recover reinsurance for claims of this nature; and,
• developments in the tactics of plaintiff lawyers and court decisions and awards.
ReinsuranceReinsurance does not relieve the originating insurer of its liability and is reflected on the consolidated balance sheeton a gross basis to indicate the extent of credit risk related to reinsurance and the obligations of the insurer to itspolicyholders. Reinsurance assets include balances due from reinsurance companies for paid and unpaid losses andloss adjustment expenses and ceded unearned premiums. Amounts recoverable from reinsurers are estimated in amanner consistent with the claim liability associated with the reinsured policy. Reinsurance is recorded gross on theconsolidated balance sheet unless a legal right to offset against a liability owing to the same reinsurer exists.
Ceded premiums and losses are recorded in the consolidated statement of earnings in premiums ceded to reinsurersand losses on claims ceded to reinsurers respectively and in recoverable from reinsurers on the consolidated balancesheet. Unearned premiums are reported before reduction for premiums ceded to reinsurers and the reinsurers’portion is classified with recoverable from reinsurers on the consolidated balance sheet along with the estimates ofthe reinsurers’ shares of provision for claims determined on a basis consistent with the related claims liabilities.
In order to protect capital and control the company’s exposure to loss from adverse development of reserves orreinsurance recoverables on pre-acquisition reserves of companies acquired or from future adverse development onlong-tail latent or other potentially volatile claims, the company has for certain acquisitions obtained vendorindemnities or purchased excess of loss reinsurance protection from reinsurers.
Impairment – Reinsurance assets are assessed on a regular basis for any events that may trigger impairment.Triggering events may include legal disputes with third parties, changes in capital, surplus levels and in credit ratingsof a counterparty, and historic experience regarding collectability from specific reinsurers.
If there is objective evidence that a reinsurance asset is impaired, the carrying amount of the asset is reduced to itsrecoverable amount. Impairment is considered to have taken place if it is probable that the company will not be ableto collect the amounts due from reinsurers. The carrying amount of a reinsurance asset is reduced through the use ofan allowance account. Provisions for previously impaired reinsurance assets may be reversed in subsequent financialreporting periods, provided there is objective evidence that the conditions leading to the initial impairment havechanged or no longer exist. On reversal of any such provisions, the carrying value of the reinsurance asset may notexceed its previously reported carrying value.
Provisions for uncollectible reinsurance are recorded in the consolidated statement of earnings in the period inwhich the company determines that it is unlikely that the full amount or disputed amounts due from reinsurers willbe collectible. When the probability of collection is remote either through liquidation of the reinsurer or settlementof the reinsurance balance, the uncollectible balance is written off from the provision account against thereinsurance balance.
Risk transfer – Reinsurance contracts are assessed to ensure that insurance risk is transferred by the ceding orassuming company to the reinsurer. Those contracts that do not transfer insurance risk are accounted for using thedeposit method whereby a deposit asset or liability is recognized based on the consideration paid or received less anyexplicitly identified premiums or fees to be retained by the ceding company.
Premiums – Premiums payable in respect of reinsurance ceded are recognized on the consolidated balance sheet inthe period in which the reinsurance contract is entered into and include estimates for contracts in force which havenot yet been finalized. Premiums ceded are recognized in the consolidated statement of earnings over the period ofthe reinsurance contract.
Uncertainties – The company is exposed to disputes on, and defects in, contracts with its reinsurers and thepossibility of default by its reinsurers. The company is also exposed to the credit risk assumed in frontingarrangements and to potential reinsurance capacity constraints.
The company’s credit risk on reinsurance recoverables is analyzed by its reinsurance security department which isresponsible for setting appropriate provisions for reinsurers suffering financial difficulties. The process fordetermining the provision involves quantitative and qualitative assessments using current and historical creditinformation and current market information. The process inherently requires the use of certain assumptions and
46
judgments including: (i) assessing the probability of impairment; (ii) estimating ultimate recovery rates of impairedreinsurers; and (iii) determining the effects from potential offsets or collateral arrangements. Changes to theseassumptions or using other reasonable judgments can materially affect the provision level and the company’snet earnings.
Income taxesThe provision for income taxes for the period comprises current and deferred income tax. Income taxes arerecognized in the consolidated statement of earnings, except to the extent that they relate to items recognized inother comprehensive income or directly in equity. In those cases, the related taxes are also recognized in othercomprehensive income or directly in equity, respectively.
Current income tax is calculated on the basis of the tax laws enacted or substantively enacted at the end of thereporting period in the countries where the company’s subsidiaries and associates operate and generatetaxable income.
Deferred income tax is calculated under the liability method whereby deferred income tax assets and liabilities arerecognized for temporary differences between the financial statement carrying amounts of assets and liabilities andtheir respective income tax bases at the current substantively enacted tax rates. With the exception of initialrecognition of deferred income tax arising from business combinations, changes in deferred income tax associatedwith components of other comprehensive income are recognized directly in other comprehensive income while allother changes in deferred income tax are included in the provision for income taxes in the consolidated statementof earnings.
Deferred income tax assets are recognized to the extent that it is probable that future taxable profit will be availableagainst which the temporary differences can be utilized. Carry forwards of unused losses or unused tax credits are taxeffected and recognized as deferred tax assets when it is probable that future taxable profits will be available againstwhich these losses or tax credits can be utilized.
Deferred income tax is not recognized on unremitted subsidiary earnings where the company has determined it isnot probable those earnings will be repatriated in the foreseeable future.
Current and deferred income tax assets and liabilities are offset when the income taxes are levied by the sametaxation authority and there is a legally enforceable right of offset.
Other assetsOther assets consist of premises and equipment, inventories and receivables of subsidiaries included in the Otherreporting segment, accrued interest and dividends, income taxes refundable, receivables for securities sold, pensionassets, deferred compensation assets, prepaid expenses and other miscellaneous receivables.
Premises and equipment – Premises and equipment is recorded at historical cost less accumulated amortizationand any accumulated impairment losses. Historical cost includes expenditures that are directly attributable to theacquisition of the asset. The company reviews premises and equipment for impairment when events or changes incircumstances indicate that the carrying value may not be recoverable. The recoverable amount is determined as thehigher of an asset’s fair value less costs of disposal and value in use. If an asset is impaired, the carrying amount isreduced to the asset’s recoverable amount with an offsetting charge recorded in the consolidated statement ofearnings. The cost of premises and equipment is depreciated on a straight-line basis over the asset’s estimated usefullife. If events or changes in circumstances indicate that a previously recognized impairment loss has decreased or nolonger exists, the reversal is recognized in the consolidated statement of earnings to the extent that the carryingamount of the asset after reversal does not exceed the carrying amount that would have been had no impairmenttaken place.
Depreciation expense is recorded in operating expenses within the consolidated statement of earnings. All repairsand maintenance costs are charged to operating expenses in the period incurred. The cost of a major renovation isincluded in the carrying amount of the asset when it is probable that future economic benefits will flow to thecompany, and is depreciated over the remaining useful life of the asset.
Other – Revenue from the sale of animal nutrition, hospitality, travel and other non-insurance products andservices are recognized when the price is fixed or determinable, collection is reasonably assured and the product orservice has been delivered to the customer. The revenue and related cost of inventories sold or services provided arerecorded in other revenue and other expenses respectively, in the consolidated statement of earnings.
47
FAIRFAX FINANCIAL HOLDINGS LIMITED
The consolidated balance sheet includes inventories of the Other reporting segment recorded in other assets whichare measured at the lower of cost or net realizable value on a first-in, first-out basis. Inventories are written down tonet realizable value when its cost is estimated to be greater than its anticipated selling price less applicableselling costs.
Long term debtBorrowings (debt issued) are recognized initially at fair value, net of transaction costs incurred, and subsequentlycarried at amortized cost; any difference between the initial carrying value and the redemption value is recognized inthe consolidated statement of earnings over the period of the borrowings using the effective interest rate method.
Interest expense on borrowings is recognized in the consolidated statement of earnings using the effective interestrate method.
Contingencies and commitmentsA provision is recognized for a contingent liability, commitment or financial guarantee when the company has apresent legal or constructive obligation as a result of a past event, it is probable that an outflow of resourcesembodying economic benefits will be required to settle the obligation and a reliable estimate can be made of theamount of the obligation. Provisions are discounted when the effect of the time value of money is consideredsignificant.
EquityCommon stock issued by the company is classified as equity when there is no contractual obligation to transfer cashor other financial assets to the holder of the shares. Incremental costs directly attributable to the issue or repurchasefor cancellation of equity instruments are recognized in equity, net of tax.
Treasury shares are equity instruments reacquired by the company which have not been cancelled and are deductedfrom equity on the consolidated balance sheet, regardless of the objective of the transaction. The company acquiresits own subordinate voting shares on the open market for its share-based payment awards. No gain or loss isrecognized in the consolidated statement of earnings on the purchase, sale, issue or cancellation of treasury shares.Consideration paid or received is recognized directly in equity.
Dividends and other distributions to holders of the company’s equity instruments are recognized directly in equity.
Share-based paymentsThe company has restricted share plans or equivalent for management of the holding company and its subsidiarieswith vesting periods of up to ten years from the date of grant. The fair value of restricted share awards is estimated onthe date of grant based on the market price of the company’s stock and is amortized to compensation expense overthe related vesting period, with a corresponding increase in the share-based payments equity reserve. When arestricted share award vests in instalments over the vesting period (graded vesting), each instalment is accounted foras a separate award and amortized to compensation expense accordingly. At each balance sheet date, the companyreviews its estimates of the number of restricted share awards expected to vest.
Net earnings per share attributable to shareholders of FairfaxNet earnings (loss) per share – Basic net earnings (loss) per share is calculated by dividing the net earnings (loss)attributable to shareholders of Fairfax, after the deduction of preferred share dividends declared and the excess overstated value of preferred shares purchased for cancellation, by the weighted average number of subordinate andmultiple voting shares issued and outstanding during the period, excluding subordinate voting shares purchased bythe company and held as treasury shares.
Net earnings (loss) per diluted share – Diluted earnings (loss) per share is calculated by adjusting the weightedaverage number of subordinate and multiple voting shares outstanding during the period for the dilutive effect ofshare-based payments.
48
Pensions and post retirement benefitsThe company’s subsidiaries have a number of arrangements in Canada, the United States and the United Kingdomthat provide pension and post retirement benefits to retired and current employees. The holding company has nosuch arrangements or plans. Pension arrangements of the subsidiaries include defined benefit statutory pensionplans, as well as supplemental arrangements that provide pension benefits in excess of statutory limits. These plansare a combination of defined benefit plans and defined contribution plans. The assets of these plans are heldseparately from the company’s general assets in separate pension funds.
Defined contribution plan – A defined contribution plan is a pension plan under which the company pays fixedcontributions. Contributions to defined contribution pension plans are charged to operating expenses in the periodin which the employment services qualifying for the benefit are provided. The company has no further paymentobligations once the contributions have been paid.
Defined benefit plan – A defined benefit plan is a plan that defines an amount of pension or other post retirementbenefit that an employee will receive on retirement, usually dependent on one or more factors such as age, years ofservice and salary. The company’s policies for its defined benefit plans are described below:
(i) Defined benefit obligations, net of the fair value of plan assets, and adjusted for pension asset limitations,if any, are accrued on the consolidated balance sheet in accounts payable and accrued liabilities (note 14).Plans in a net asset position are recognized in other assets (note 13).
(ii) Actuarial valuations of benefit liabilities for the majority of pension and post retirement benefit plans areperformed each year using the projected benefit method prorated on service, based on management’sassumptions of the discount rate, rate of compensation increase, retirement age, mortality and the trend inthe health care cost rate. The discount rate is determined by management with reference to marketconditions at year end. Other assumptions are determined with reference to long-term expectations.
(iii) Defined benefit expense includes the net interest on the net defined benefit liability (asset) calculatedusing a discount rate based on market yields on high quality bonds, and is recognized in the consolidatedstatement of earnings.
(iv) Defined benefit plans in a surplus position recognize an asset, subject to meeting any minimum fundingrequirements. Asset limitations due to minimum funding requirements are recorded in othercomprehensive income.
(v) Remeasurements, consisting of actuarial gains and losses, the actual return on plan assets (excluding thenet interest component) and any change in asset limitation amounts, are recognized in othercomprehensive income. All remeasurements recognized in other comprehensive income are subsequentlyincluded in accumulated other comprehensive income and cannot be recycled to the consolidatedstatement of earnings in the future, but are reclassified to retained earnings upon settlement of the plan ordisposal of the related subsidiary.
(vi) Past service costs arising from plan amendments or curtailments are recognized in the consolidatedstatement of earnings when incurred.
(vii) Gains or losses on the settlement of a defined benefit plan are recognized in the consolidated statement ofearnings when the settlement occurs.
Certain of the company’s post retirement benefit plans covering medical care and life insurance are internallyfunded.
Operating leasesThe company and its subsidiaries are lessees under various operating leases relating to premises, automobiles andequipment. The leased assets are not recognized on the consolidated balance sheet. Payments made under operatingleases (net of any incentives received from the lessor) are recorded in operating expenses on a straight-line basis overthe period of the lease, unless another systematic basis is representative of the time pattern of the leased item’sbenefit even if the payments are not on that basis.
49
FAIRFAX FINANCIAL HOLDINGS LIMITED
New accounting pronouncements adopted in 2014The company adopted the following new and revised standards, along with any consequential amendments,effective January 1, 2014. These changes were retrospectively adopted in accordance with the applicable transitionalprovisions of each new or revised standard, and did not have a significant impact on the consolidated financialstatements.
IFRIC 21 Levies (‘‘IFRIC 21’’)IFRIC 21 provides guidance on when to recognize a liability for a levy imposed by a government.
IAS 32 Financial Instruments: Presentation (‘‘IAS 32’’)The IASB amended IAS 32 to clarify the meaning of when an entity has a current legally enforceable right to offset afinancial asset and a financial liability in its consolidated balance sheet.
IAS 36 Impairment of Assets (‘‘IAS 36’’)The IASB amended IAS 36 to clarify the disclosure requirements when an impairment loss is recognized or reversed inrespect of an asset or cash-generating unit.
New accounting pronouncements issued but not yet effectiveThe following new standards have been issued by the IASB and were not yet effective for the fiscal year beginningJanuary 1, 2014.
IFRS 9 Financial Instruments (‘‘IFRS 9’’)In July 2014 the IASB published the complete version of IFRS 9 which supersedes the 2010 version of IFRS 9 currentlyapplied by the company. This complete version is effective for annual periods beginning on or after January 1, 2018,with retrospective application, and includes: requirements on the classification and measurement of financial assetsand liabilities; an expected credit loss model that replaces the existing incurred loss impairment model; and newhedge accounting guidance. The company is currently evaluating the impact of the complete version of IFRS 9 on itsconsolidated financial statements.
IFRS 15 Revenue from Contracts with Customers (‘‘IFRS 15’’)In May 2014 the IASB published IFRS 15 which introduces a single model for recognizing revenue from contractswith customers. IFRS 15 excludes insurance contracts from its scope and is primarily applicable to the company’snon-insurance entities. The standard is effective for annual periods beginning on or after January 1, 2017, withretrospective application. The company is currently evaluating the impact of IFRS 15 on its consolidated financialstatements.
4. Critical Accounting Estimates and Judgments
In the preparation of the company’s consolidated financial statements, management has made a number ofestimates and judgments, the more critical of which are discussed below, with the exception of the determination offair value for financial instruments and associates, fair value disclosures, and contingencies, which are discussed innotes 3, 5 and 20 respectively. Estimates and judgments are continually evaluated and are based on historicalexperience and other factors, including expectations of future events that are believed to be reasonable under thecircumstances.
Provision for losses and loss adjustment expensesProvisions for losses and loss adjustment expenses are valued based on Canadian accepted actuarial practices, whichare designed to ensure the company establishes an appropriate reserve on the consolidated balance sheet to coverinsured losses with respect to reported and unreported claims incurred as of the end of each accounting period andrelated claims expenses. The assumptions underlying the valuation of provisions for losses and loss adjustmentexpenses are reviewed and updated by the company on an ongoing basis to reflect recent and emerging trends inexperience and changes in risk profile of the business. The estimation techniques employed by the company indetermining provisions for losses and loss adjustment expenses and the inherent uncertainties associated withinsurance contracts are described in the ‘‘Insurance Contracts’’ section of note 3 and the ‘‘Underwriting Risk’’ sectionof note 24.
50
Provision for uncollectible reinsurance recoverablesThe company establishes provisions for uncollectible reinsurance recoverables centrally based on a detailed review ofthe credit risk of each underlying reinsurer. Considerations involved in establishing these provisions include thebalance sheet strength of the reinsurer, its liquidity (or ability to pay), its desire to pay (based on prior history),financial strength ratings as determined by external rating agencies and specific disputed amounts based on contractinterpretations which occur from time to time. The company monitors these provisions and reassesses them on aquarterly basis, or more frequently if necessary, updating them as new information becomes available. Uncertaintiesassociated with the company’s reinsurance recoverables are discussed further in the ‘‘Reinsurance’’ section of note 3.
Recoverability of deferred income tax assetsIn determining the recoverability of deferred income tax assets, the company primarily considers current andexpected profitability of applicable operating companies and their ability to utilize any recorded tax assets. Thecompany reviews its deferred income tax assets on a quarterly basis, taking into consideration the availability ofsufficient current and projected taxable profits, reversals of taxable temporary differences and tax planningstrategies.
Assessment of goodwill for potential impairmentGoodwill is assessed annually for impairment or more frequently if there are potential indicators of impairment.Management estimates the recoverable amount of each of the company’s cash-generating units using one or moregenerally accepted valuation techniques, which requires the making of a number of assumptions, includingassumptions about future revenue, net earnings, corporate overhead costs, capital expenditures, cost of capital, andthe growth rate of the various operations. The recoverable amount of each cash-generating unit to which goodwillhas been assigned is compared to its carrying value (inclusive of assigned goodwill). If the recoverable amount of acash-generating unit is determined to be less than its carrying value, the excess is recognized as a goodwillimpairment loss. Given the variability of future-oriented financial information, goodwill impairment tests aresubjected to sensitivity analysis.
Determination of subsidiaries, associates and joint venturesThere could be significant judgment involved in assessing whether control, significant influence, or joint controlexists in accordance with the requirements of IFRS 10, IAS 28 and IFRS 11 respectively, particularly where the factsand circumstances include indicators that could reasonably point to more than one potential outcome. In situationswhere voting rights alone are not sufficient to clearly assess control, significant influence or joint control, additionalfactors that may be considered include potential voting rights that are currently exercisable or convertible,contractual arrangements, relative shareholdings and the allocation of decision-making rights. An initial assessmentof control, significant influence or joint control is reconsidered at a later date if warranted by changes in facts andcircumstances, particularly in situations where the company acquires additional interests or reduces its existinginterest.
51
FAIRFAX FINANCIAL HOLDINGS LIMITED
5. Cash and Investments
Holding company cash and investments, portfolio investments and short sale and derivative obligations areclassified as at FVTPL, except for investments in associates and other invested assets which are classified as other, andare shown in the table below:
December 31, December 31,2014 2013
Holding company:Cash and cash equivalents (note 28) 317.7 214.4Short term investments 121.6 185.9Short term investments pledged for short sale and derivative obligations 92.0 107.8Bonds 323.8 240.4Bonds pledged for short sale and derivative obligations 17.7 16.6Preferred stocks 144.2 223.0Common stocks 89.8 264.9Derivatives (note 7) 137.5 43.7
1,244.3 1,296.7Short sale and derivative obligations (note 7) (31.6) (55.1)
1,212.7 1,241.6
Portfolio investments:Cash and cash equivalents (note 28) 3,034.5 3,878.4Short term investments 2,499.8 3,567.3Bonds 11,445.5 9,550.5Preferred stocks 376.4 541.8Common stocks 4,848.5 3,835.7Investments in associates (note 6) 1,617.7 1,432.5Derivatives (note 7) 412.6 193.1Other invested assets 14.2 31.1
24,249.2 23,030.4
Assets pledged for short sale and derivative obligations:Cash and cash equivalents (note 28) – 11.8Short term investments 227.7 45.8Bonds 632.3 745.3
860.0 802.9
25,109.2 23,833.3Short sale and derivative obligations (note 7) (129.2) (213.3)
24,980.0 23,620.0
Common stocks included investments in limited partnerships with a carrying value of $1,004.4 at December 31,2014 (December 31, 2013 – $816.4).
Restricted cash and cash equivalents at December 31, 2014 of $333.5 (December 31, 2013 – $340.4) were comprisedprimarily of amounts required to be maintained on deposit with various regulatory authorities to support thesubsidiaries’ insurance and reinsurance operations. Restricted cash and cash equivalents are included on theconsolidated balance sheet in holding company cash and investments, or in subsidiary cash and short terminvestments and assets pledged for short sale and derivative obligations in portfolio investments.
52
The company’s subsidiaries have pledged cash and investments, inclusive of trust funds and regulatory deposits, assecurity for their own obligations to pay claims or make premium payments (these pledges are either direct or tosupport letters of credit). In order to write insurance business in certain jurisdictions (primarily U.S. states) thecompany’s subsidiaries must deposit funds with local insurance regulatory authorities to provide security for futureclaims payments as ultimate protection for the policyholder. Additionally, some of the company’s subsidiariesprovide reinsurance to primary insurers, for which funds must be posted as security for losses that have been incurredbut not yet paid. These pledges are in the normal course of business and are generally released when the paymentobligation is fulfilled.
The table that follows summarizes pledged assets (excluding assets pledged in favour of Lloyd’s (note 20) and assetspledged for short sale and derivative obligations) by the nature of the pledge requirement. Pledged assets primarilyconsist of bonds within portfolio investments on the consolidated balance sheet.
December 31, December 31,2014 2013
Regulatory deposits 2,717.0 2,182.1Security for reinsurance and other 903.8 543.8
3,620.8 2,725.9
Fixed Income Maturity ProfileBonds are summarized by the earliest contractual maturity date in the table below. Actual maturities may differ frommaturities shown below due to the existence of call and put features. At December 31, 2014 bonds containing calland put features represented approximately $6,880.2 and $56.4 respectively (December 31, 2013 – $5,990.1 and$60.3 respectively) of the total fair value of bonds.
December 31, 2014 December 31, 2013
Amortized Fair Amortized Faircost value cost value
Due in 1 year or less 653.9 664.2 962.7 998.2Due after 1 year through 5 years 4,714.1 5,708.3 4,565.7 5,081.4Due after 5 years through 10 years 341.6 355.0 518.2 527.3Due after 10 years 5,067.4 5,691.8 4,203.1 3,945.9
10,777.0 12,419.3 10,249.7 10,552.8
Effective interest rate 5.0% 4.6%
The calculation of the effective interest rate of 5.0% (December 31, 2013 – 4.6%) is on a pre-tax basis and does notgive effect to the favourable tax treatment which the company expects to receive with respect to its tax advantagedbond investments of approximately $5.2 billion (December 31, 2013 – $4.8 billion) included in U.S. states andmunicipalities.
53
FAIRFAX FINANCIAL HOLDINGS LIMITED
Fair Value DisclosuresThe company’s use of quoted market prices (Level 1), valuation models using observable market information asinputs (Level 2) and valuation models without observable market information as inputs (Level 3) in the valuation ofsecurities and derivative contracts by type of issuer was as follows:
December 31, 2014 December 31, 2013
Significant SignificantTotal fair other Significant Total fair other Significant
value Quoted observable unobservable value Quoted observable unobservableasset prices inputs inputs asset prices inputs inputs
(liability) (Level 1) (Level 2) (Level 3) (liability) (Level 1) (Level 2) (Level 3)
Cash and cash equivalents 3,352.2 3,352.2 – – 4,104.6 4,104.6 – –
Short term investments:
Canadian provincials 334.0 334.0 – – 405.0 405.0 – –
U.S. treasury 2,170.7 2,170.7 – – 3,147.6 3,147.6 – –
Other government 361.1 312.8 48.3 – 281.6 281.6 – –
Corporate and other 75.3 – 75.3 – 72.6 – 72.6 –
2,941.1 2,817.5 123.6 – 3,906.8 3,834.2 72.6 –
Bonds:
Canadian government 16.0 – 16.0 – 18.3 – 18.3 –
Canadian provincials 217.1 – 217.1 – 164.7 – 164.7 –
U.S. treasury 2,094.2 – 2,094.2 – 1,669.6 – 1,669.6 –
U.S. states and municipalities 6,998.2 – 6,998.2 – 6,227.7 – 6,227.7 –
Other government 1,559.0 – 1,559.0 – 1,067.3 – 1,067.3 –
Corporate and other 1,534.8 – 701.8 833.0 1,405.2 – 967.6 437.6
12,419.3 – 11,586.3 833.0 10,552.8 – 10,115.2 437.6
Preferred stocks:
Canadian 173.9 – 16.7 157.2 242.3 – 78.9 163.4
U.S. 322.4 – 321.6 0.8 490.7 – 471.1 19.6
Other 24.3 – 24.3 – 31.8 – 31.8 –
520.6 – 362.6 158.0 764.8 – 581.8 183.0
Common stocks:
Canadian 918.2 786.7 109.7 21.8 678.1 643.7 7.2 27.2
U.S. 907.3 478.0 29.4 399.9 814.6 402.1 28.2 384.3
Other 3,112.8 1,922.1 563.3 627.4 2,607.9 1,672.2 370.6 565.1
4,938.3 3,186.8 702.4 1,049.1 4,100.6 2,718.0 406.0 976.6
Derivatives and other investedassets(1) 558.1 – 285.0 273.1 244.8 1.7 96.6 146.5
Short sale and derivative obligations (160.8) – (160.8) – (268.4) – (268.4) –
Holding company cash andinvestments and portfolioinvestments measured at fair value 24,568.8 9,356.5 12,899.1 2,313.2 23,406.0 10,658.5 11,003.8 1,743.7
100.0% 38.1% 52.5% 9.4% 100.0% 45.5% 47.0% 7.5%
Investments in associates (note 6)(2) 2,070.5 1,046.4 35.5 988.6 1,815.0 806.5 35.2 973.3
(1) Excluded from these totals are certain real estate investments of $6.2 (December 31, 2013 – $23.1) which are carried atcost less any accumulated amortization and impairment.
(2) The carrying value of investments in associates is determined under the equity method of accounting and the related fairvalue is presented separately in the table above.
54
Transfers between fair value hierarchy levels are considered effective from the beginning of the reporting period inwhich the transfer is identified. During 2014 and 2013 there were no significant transfers of financial instrumentsbetween Level 1 and Level 2 and there were no transfers of financial instruments in or out of Level 3 as a result ofchanges in the observability of valuation inputs.
Included in Level 3 are investments in CPI-linked derivatives, certain private placement debt securities and equitywarrants, and common and preferred shares of private companies. CPI-linked derivatives are classified withinholding company cash and investments, or in derivatives and other invested assets in portfolio investments on theconsolidated balance sheet and are valued using broker-dealer quotes which management has determined utilizemarket observable inputs except for the inflation volatility input which is not market observable. Private placementdebt securities are classified within holding company cash and investments and bonds on the consolidated balancesheet and are valued using industry accepted discounted cash flow models that incorporate the credit spreads of theissuers, an input which is not market observable. Limited partnerships, private equity funds and private companycommon shares are classified within holding company cash and investments and common stocks on theconsolidated balance sheet. These investments are primarily valued using net asset value statements provided by therespective third party fund managers and general partners. The fair values in those statements are determined usingquoted prices of the underlying assets, and to a lesser extent, observable inputs where available and unobservableinputs, in conjunction with industry accepted valuation models, where required. In some instances, private equityfunds and limited partnerships are classified as Level 3 because they may require at least three months of notice toliquidate. Reasonably possible changes in the value of unobservable inputs for any of these individual investmentswould not significantly change the fair value of investments classified as Level 3 in the fair value hierarchy.
A summary of changes in the fair values of Level 3 financial assets measured at fair value on a recurring basis for theyears ended December 31 follows:
2014
Private Private CPI-linkedPrivate company Private company derivatives
placement preferred Limited equity common anddebt securities shares partnerships funds shares Warrants Total
Balance – January 1 437.6 183.0 692.7 112.2 171.7 146.5 1,743.7
Total net realized and unrealized gains (losses)included in net gains (losses) on investments 151.7 (35.1) 27.2 15.5 (21.1) 5.5 143.7
Purchases 249.2 4.1 112.9 26.2 5.6 121.1 519.1
Transfer into category due to change inaccounting treatment – 6.0 – – – – 6.0
Sales (5.5) – (57.5) (36.3) – – (99.3)
Balance – December 31 833.0 158.0 775.3 117.6 156.2 273.1 2,313.2
2013
Private Private CPI-linkedPrivate company Private company derivatives
placement preferred Limited equity common anddebt securities shares partnerships funds shares Warrants Total
Balance – January 1 119.1 90.0 314.7 122.1 175.3 115.8 937.0
Total net realized and unrealized gains (losses)included in net gains (losses) on investments 4.0 (23.2) 37.1 25.2 (5.3) (108.3) (70.5)
Purchases 356.2 116.2 358.9 22.7 8.9 139.0 1,001.9
Sales (41.7) – (18.0) (57.8) (7.2) – (124.7)
Balance – December 31 437.6 183.0 692.7 112.2 171.7 146.5 1,743.7
55
FAIRFAX FINANCIAL HOLDINGS LIMITED
Investment IncomeAn analysis of investment income for the years ended December 31 follows:
Interest and dividends and share of profit of associates
2014 2013
Interest income:Cash and short term investments 27.8 33.2Bonds 474.1 435.1Derivatives and other (151.6) (161.5)
350.3 306.8
Dividends:Preferred stocks 38.1 39.6Common stocks 42.1 55.7
80.2 95.3
Investment expenses (26.7) (25.2)
Interest and dividends 403.8 376.9
Share of profit of associates (note 6) 105.7 96.7
Net gains (losses) on investments
2014 2013
Net Net change Net Net changerealized in unreal- Net gains realized in unreal- Net gains
gains ized gains (losses) on gains ized gains (losses) on(losses) (losses) investments (losses) (losses) investments
Net gains (losses) on investments:Bonds 139.7 1,300.9 1,440.6 219.5 (1,151.1) (931.6)Preferred stocks (161.8)(1) 20.0 (141.8) (1.2) 46.9 45.7Common stocks 483.5 (216.6) 266.9 684.1 257.1 941.2
461.4 1,104.3 1,565.7 902.4 (847.1) 55.3
Derivatives:Common stock and equity index short positions (377.9)(2) 183.4 (194.5) (1,956.2)(2) (25.8) (1,982.0)Common stock and equity index long positions 70.3(2) (23.8) 46.5 273.0(2) 20.9 293.9Credit default swaps (8.5) 8.4 (0.1) (30.3) 28.7 (1.6)Equity warrants and call options 66.6 19.2 85.8 32.4(5) (14.7) 17.7CPI-linked derivatives – 17.7 17.7 – (126.9) (126.9)Other 21.0 (10.7) 10.3 32.4 (37.8) (5.4)
(228.5) 194.2 (34.3) (1,648.7) (155.6) (1,804.3)
Foreign currency gains (losses) on:Investing activities (55.8) (98.7) (154.5) (5.7) 75.0 69.3Underwriting activities 53.5 – 53.5 15.8 – 15.8Foreign currency contracts 61.3 143.1 204.4 (13.8) (8.9) (22.7)
59.0 44.4 103.4 (3.7) 66.1 62.4
Gain on disposition of associates 54.0(3) 41.2(4) 95.2 130.2(5) – 130.2
Other 6.1 0.1 6.2 (7.7) 0.1 (7.6)
Net gains (losses) on investments 352.0 1,384.2 1,736.2 (627.5) (936.5) (1,564.0)
(1) During the fourth quarter of 2014, a preferred stock investment of the company was, pursuant to its terms, automaticallyconverted into common shares of the issuer, resulting in a net realized loss on investment of $161.5 (the difference betweenthe share price of the underlying common stock at the date of conversion and the exercise price of the preferred stock).
56
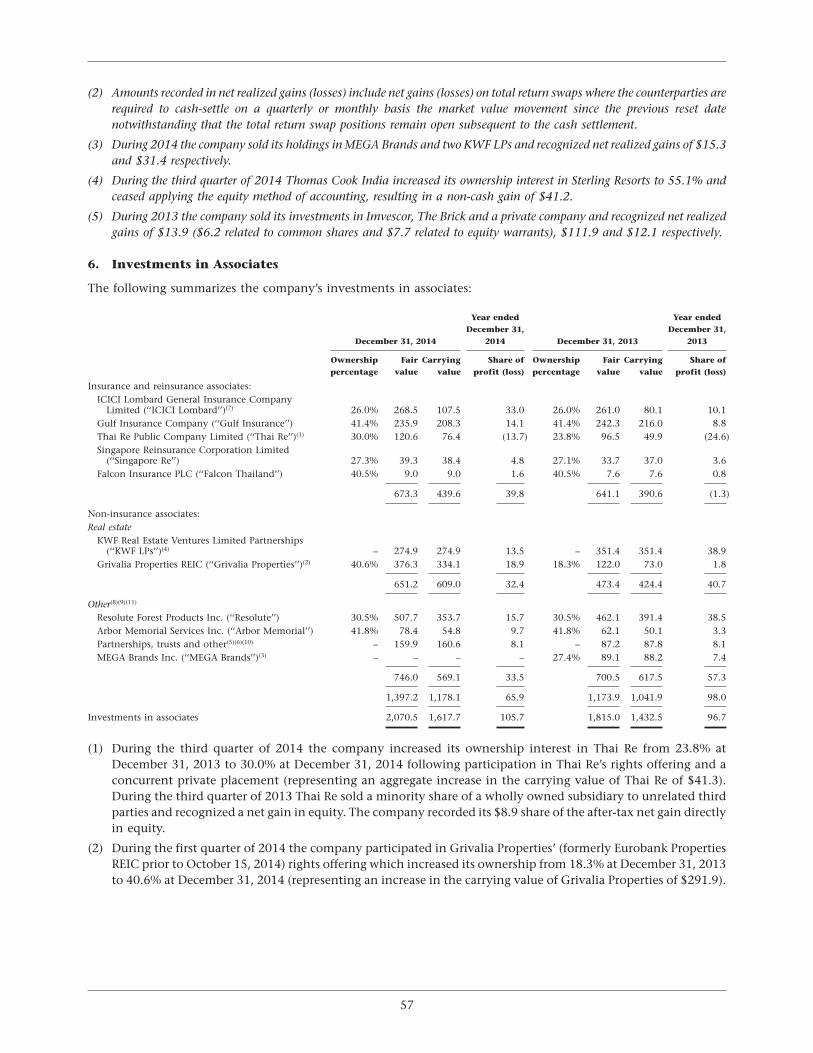
(2) Amounts recorded in net realized gains (losses) include net gains (losses) on total return swaps where the counterparties arerequired to cash-settle on a quarterly or monthly basis the market value movement since the previous reset datenotwithstanding that the total return swap positions remain open subsequent to the cash settlement.
(3) During 2014 the company sold its holdings in MEGA Brands and two KWF LPs and recognized net realized gains of $15.3and $31.4 respectively.
(4) During the third quarter of 2014 Thomas Cook India increased its ownership interest in Sterling Resorts to 55.1% andceased applying the equity method of accounting, resulting in a non-cash gain of $41.2.
(5) During 2013 the company sold its investments in Imvescor, The Brick and a private company and recognized net realizedgains of $13.9 ($6.2 related to common shares and $7.7 related to equity warrants), $111.9 and $12.1 respectively.
6. Investments in Associates
The following summarizes the company’s investments in associates:
Year ended Year endedDecember 31, December 31,
December 31, 2014 2014 December 31, 2013 2013
Ownership Fair Carrying Share of Ownership Fair Carrying Share ofpercentage value value profit (loss) percentage value value profit (loss)
Insurance and reinsurance associates:ICICI Lombard General Insurance Company
Limited (‘‘ICICI Lombard’’)(7) 26.0% 268.5 107.5 33.0 26.0% 261.0 80.1 10.1Gulf Insurance Company (‘‘Gulf Insurance’’) 41.4% 235.9 208.3 14.1 41.4% 242.3 216.0 8.8Thai Re Public Company Limited (‘‘Thai Re’’)(1) 30.0% 120.6 76.4 (13.7) 23.8% 96.5 49.9 (24.6)Singapore Reinsurance Corporation Limited
(‘‘Singapore Re’’) 27.3% 39.3 38.4 4.8 27.1% 33.7 37.0 3.6Falcon Insurance PLC (‘‘Falcon Thailand’’) 40.5% 9.0 9.0 1.6 40.5% 7.6 7.6 0.8
673.3 439.6 39.8 641.1 390.6 (1.3)
Non-insurance associates:Real estate
KWF Real Estate Ventures Limited Partnerships(‘‘KWF LPs’’)(4) – 274.9 274.9 13.5 – 351.4 351.4 38.9
Grivalia Properties REIC (‘‘Grivalia Properties’’)(2) 40.6% 376.3 334.1 18.9 18.3% 122.0 73.0 1.8
651.2 609.0 32.4 473.4 424.4 40.7
Other(8)(9)(11)
Resolute Forest Products Inc. (‘‘Resolute’’) 30.5% 507.7 353.7 15.7 30.5% 462.1 391.4 38.5Arbor Memorial Services Inc. (‘‘Arbor Memorial’’) 41.8% 78.4 54.8 9.7 41.8% 62.1 50.1 3.3Partnerships, trusts and other(5)(6)(10) – 159.9 160.6 8.1 – 87.2 87.8 8.1MEGA Brands Inc. (‘‘MEGA Brands’’)(3) – – – – 27.4% 89.1 88.2 7.4
746.0 569.1 33.5 700.5 617.5 57.3
1,397.2 1,178.1 65.9 1,173.9 1,041.9 98.0
Investments in associates 2,070.5 1,617.7 105.7 1,815.0 1,432.5 96.7
(1) During the third quarter of 2014 the company increased its ownership interest in Thai Re from 23.8% atDecember 31, 2013 to 30.0% at December 31, 2014 following participation in Thai Re’s rights offering and aconcurrent private placement (representing an aggregate increase in the carrying value of Thai Re of $41.3).During the third quarter of 2013 Thai Re sold a minority share of a wholly owned subsidiary to unrelated thirdparties and recognized a net gain in equity. The company recorded its $8.9 share of the after-tax net gain directlyin equity.
(2) During the first quarter of 2014 the company participated in Grivalia Properties’ (formerly Eurobank PropertiesREIC prior to October 15, 2014) rights offering which increased its ownership from 18.3% at December 31, 2013to 40.6% at December 31, 2014 (representing an increase in the carrying value of Grivalia Properties of $291.9).
57
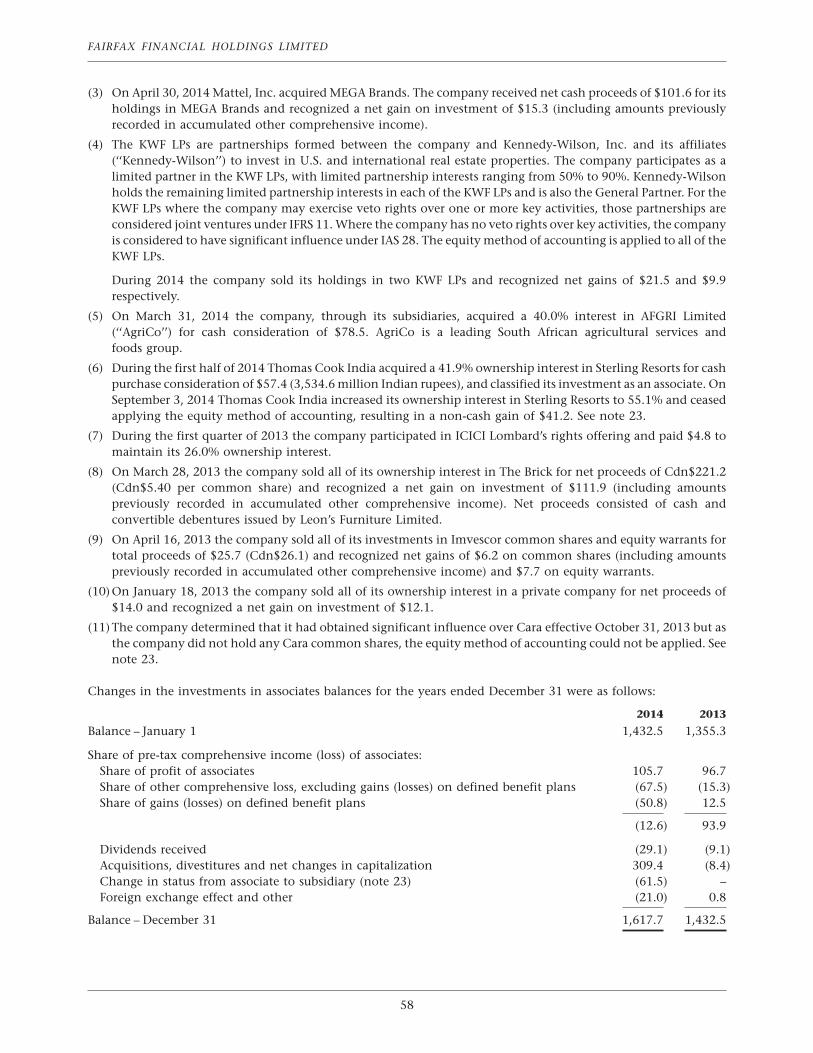
FAIRFAX FINANCIAL HOLDINGS LIMITED
(3) On April 30, 2014 Mattel, Inc. acquired MEGA Brands. The company received net cash proceeds of $101.6 for itsholdings in MEGA Brands and recognized a net gain on investment of $15.3 (including amounts previouslyrecorded in accumulated other comprehensive income).
(4) The KWF LPs are partnerships formed between the company and Kennedy-Wilson, Inc. and its affiliates(‘‘Kennedy-Wilson’’) to invest in U.S. and international real estate properties. The company participates as alimited partner in the KWF LPs, with limited partnership interests ranging from 50% to 90%. Kennedy-Wilsonholds the remaining limited partnership interests in each of the KWF LPs and is also the General Partner. For theKWF LPs where the company may exercise veto rights over one or more key activities, those partnerships areconsidered joint ventures under IFRS 11. Where the company has no veto rights over key activities, the companyis considered to have significant influence under IAS 28. The equity method of accounting is applied to all of theKWF LPs.
During 2014 the company sold its holdings in two KWF LPs and recognized net gains of $21.5 and $9.9respectively.
(5) On March 31, 2014 the company, through its subsidiaries, acquired a 40.0% interest in AFGRI Limited(‘‘AgriCo’’) for cash consideration of $78.5. AgriCo is a leading South African agricultural services andfoods group.
(6) During the first half of 2014 Thomas Cook India acquired a 41.9% ownership interest in Sterling Resorts for cashpurchase consideration of $57.4 (3,534.6 million Indian rupees), and classified its investment as an associate. OnSeptember 3, 2014 Thomas Cook India increased its ownership interest in Sterling Resorts to 55.1% and ceasedapplying the equity method of accounting, resulting in a non-cash gain of $41.2. See note 23.
(7) During the first quarter of 2013 the company participated in ICICI Lombard’s rights offering and paid $4.8 tomaintain its 26.0% ownership interest.
(8) On March 28, 2013 the company sold all of its ownership interest in The Brick for net proceeds of Cdn$221.2(Cdn$5.40 per common share) and recognized a net gain on investment of $111.9 (including amountspreviously recorded in accumulated other comprehensive income). Net proceeds consisted of cash andconvertible debentures issued by Leon’s Furniture Limited.
(9) On April 16, 2013 the company sold all of its investments in Imvescor common shares and equity warrants fortotal proceeds of $25.7 (Cdn$26.1) and recognized net gains of $6.2 on common shares (including amountspreviously recorded in accumulated other comprehensive income) and $7.7 on equity warrants.
(10) On January 18, 2013 the company sold all of its ownership interest in a private company for net proceeds of$14.0 and recognized a net gain on investment of $12.1.
(11) The company determined that it had obtained significant influence over Cara effective October 31, 2013 but asthe company did not hold any Cara common shares, the equity method of accounting could not be applied. Seenote 23.
Changes in the investments in associates balances for the years ended December 31 were as follows:
2014 2013
Balance – January 1 1,432.5 1,355.3
Share of pre-tax comprehensive income (loss) of associates:Share of profit of associates 105.7 96.7Share of other comprehensive loss, excluding gains (losses) on defined benefit plans (67.5) (15.3)Share of gains (losses) on defined benefit plans (50.8) 12.5
(12.6) 93.9
Dividends received (29.1) (9.1)Acquisitions, divestitures and net changes in capitalization 309.4 (8.4)Change in status from associate to subsidiary (note 23) (61.5) –Foreign exchange effect and other (21.0) 0.8
Balance – December 31 1,617.7 1,432.5
58
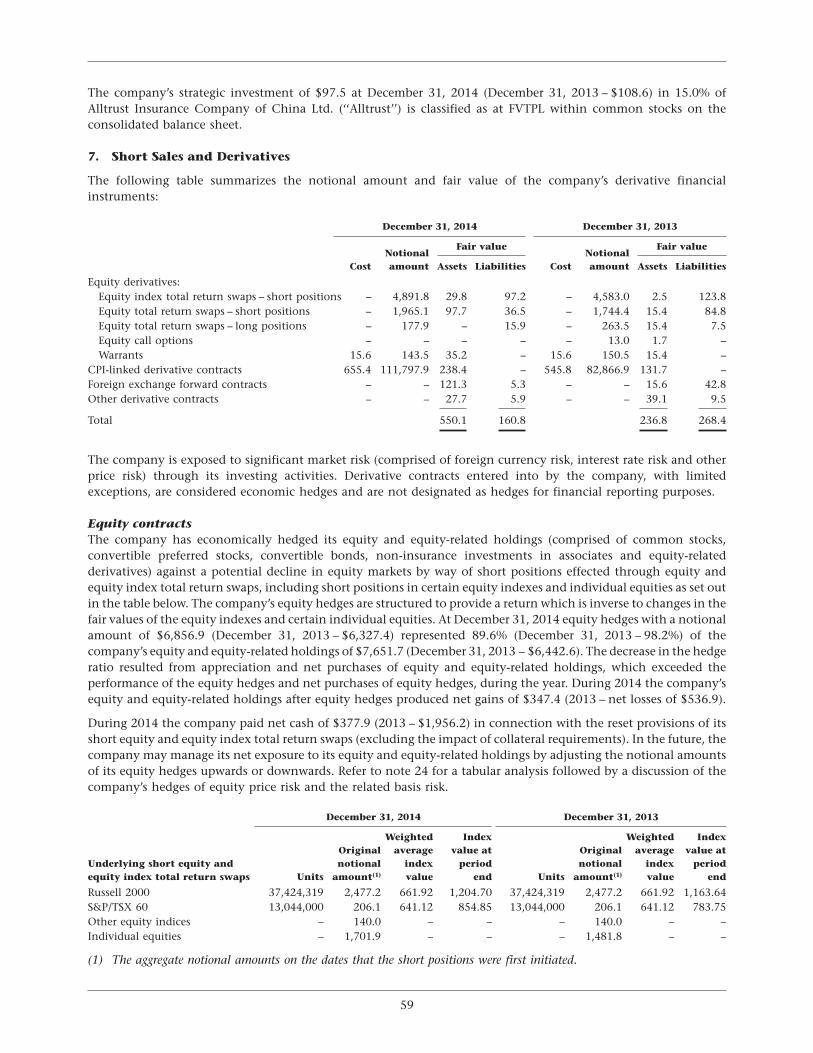
The company’s strategic investment of $97.5 at December 31, 2014 (December 31, 2013 – $108.6) in 15.0% ofAlltrust Insurance Company of China Ltd. (‘‘Alltrust’’) is classified as at FVTPL within common stocks on theconsolidated balance sheet.
7. Short Sales and Derivatives
The following table summarizes the notional amount and fair value of the company’s derivative financialinstruments:
December 31, 2014 December 31, 2013
Fair value Fair valueNotional Notional
Cost amount Assets Liabilities Cost amount Assets Liabilities
Equity derivatives:Equity index total return swaps – short positions – 4,891.8 29.8 97.2 – 4,583.0 2.5 123.8Equity total return swaps – short positions – 1,965.1 97.7 36.5 – 1,744.4 15.4 84.8Equity total return swaps – long positions – 177.9 – 15.9 – 263.5 15.4 7.5Equity call options – – – – – 13.0 1.7 –Warrants 15.6 143.5 35.2 – 15.6 150.5 15.4 –
CPI-linked derivative contracts 655.4 111,797.9 238.4 – 545.8 82,866.9 131.7 –Foreign exchange forward contracts – – 121.3 5.3 – – 15.6 42.8Other derivative contracts – – 27.7 5.9 – – 39.1 9.5
Total 550.1 160.8 236.8 268.4
The company is exposed to significant market risk (comprised of foreign currency risk, interest rate risk and otherprice risk) through its investing activities. Derivative contracts entered into by the company, with limitedexceptions, are considered economic hedges and are not designated as hedges for financial reporting purposes.
Equity contractsThe company has economically hedged its equity and equity-related holdings (comprised of common stocks,convertible preferred stocks, convertible bonds, non-insurance investments in associates and equity-relatedderivatives) against a potential decline in equity markets by way of short positions effected through equity andequity index total return swaps, including short positions in certain equity indexes and individual equities as set outin the table below. The company’s equity hedges are structured to provide a return which is inverse to changes in thefair values of the equity indexes and certain individual equities. At December 31, 2014 equity hedges with a notionalamount of $6,856.9 (December 31, 2013 – $6,327.4) represented 89.6% (December 31, 2013 – 98.2%) of thecompany’s equity and equity-related holdings of $7,651.7 (December 31, 2013 – $6,442.6). The decrease in the hedgeratio resulted from appreciation and net purchases of equity and equity-related holdings, which exceeded theperformance of the equity hedges and net purchases of equity hedges, during the year. During 2014 the company’sequity and equity-related holdings after equity hedges produced net gains of $347.4 (2013 – net losses of $536.9).
During 2014 the company paid net cash of $377.9 (2013 – $1,956.2) in connection with the reset provisions of itsshort equity and equity index total return swaps (excluding the impact of collateral requirements). In the future, thecompany may manage its net exposure to its equity and equity-related holdings by adjusting the notional amountsof its equity hedges upwards or downwards. Refer to note 24 for a tabular analysis followed by a discussion of thecompany’s hedges of equity price risk and the related basis risk.
December 31, 2014 December 31, 2013
Weighted Index Weighted IndexOriginal average value at Original average value at
Underlying short equity and notional index period notional index periodequity index total return swaps Units amount(1) value end Units amount(1) value end
Russell 2000 37,424,319 2,477.2 661.92 1,204.70 37,424,319 2,477.2 661.92 1,163.64S&P/TSX 60 13,044,000 206.1 641.12 854.85 13,044,000 206.1 641.12 783.75Other equity indices – 140.0 – – – 140.0 – –Individual equities – 1,701.9 – – – 1,481.8 – –
(1) The aggregate notional amounts on the dates that the short positions were first initiated.
59
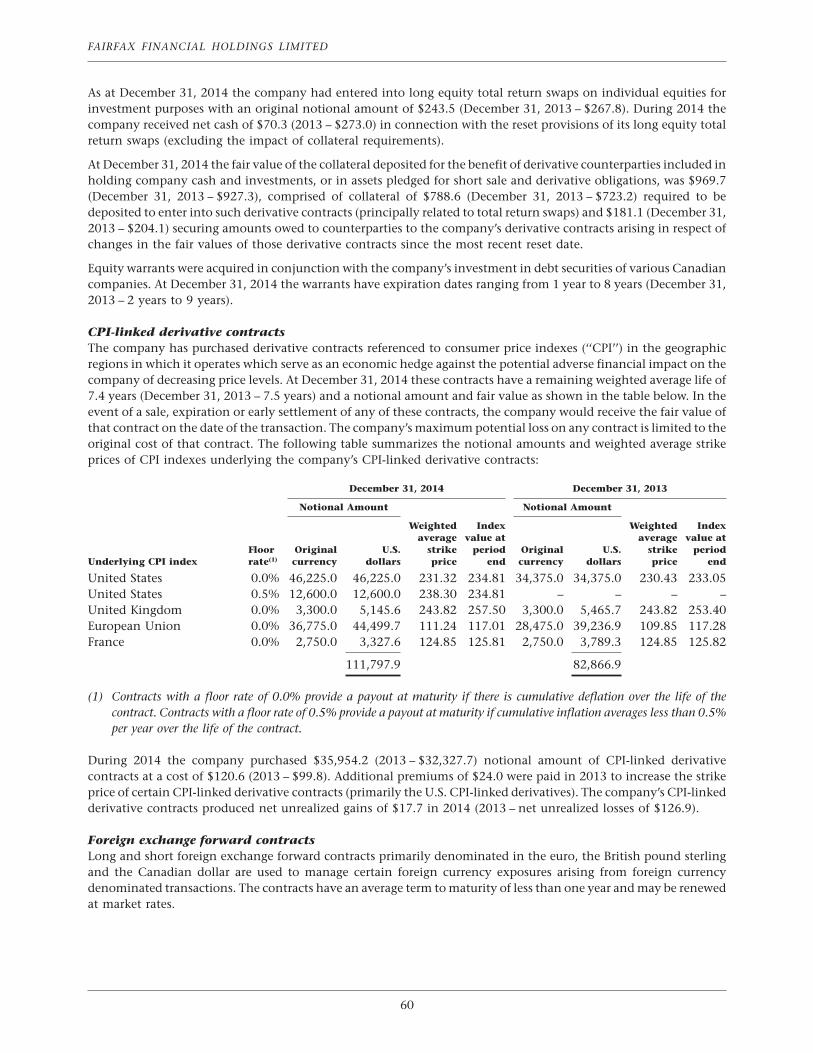
FAIRFAX FINANCIAL HOLDINGS LIMITED
As at December 31, 2014 the company had entered into long equity total return swaps on individual equities forinvestment purposes with an original notional amount of $243.5 (December 31, 2013 – $267.8). During 2014 thecompany received net cash of $70.3 (2013 – $273.0) in connection with the reset provisions of its long equity totalreturn swaps (excluding the impact of collateral requirements).
At December 31, 2014 the fair value of the collateral deposited for the benefit of derivative counterparties included inholding company cash and investments, or in assets pledged for short sale and derivative obligations, was $969.7(December 31, 2013 – $927.3), comprised of collateral of $788.6 (December 31, 2013 – $723.2) required to bedeposited to enter into such derivative contracts (principally related to total return swaps) and $181.1 (December 31,2013 – $204.1) securing amounts owed to counterparties to the company’s derivative contracts arising in respect ofchanges in the fair values of those derivative contracts since the most recent reset date.
Equity warrants were acquired in conjunction with the company’s investment in debt securities of various Canadiancompanies. At December 31, 2014 the warrants have expiration dates ranging from 1 year to 8 years (December 31,2013 – 2 years to 9 years).
CPI-linked derivative contractsThe company has purchased derivative contracts referenced to consumer price indexes (‘‘CPI’’) in the geographicregions in which it operates which serve as an economic hedge against the potential adverse financial impact on thecompany of decreasing price levels. At December 31, 2014 these contracts have a remaining weighted average life of7.4 years (December 31, 2013 – 7.5 years) and a notional amount and fair value as shown in the table below. In theevent of a sale, expiration or early settlement of any of these contracts, the company would receive the fair value ofthat contract on the date of the transaction. The company’s maximum potential loss on any contract is limited to theoriginal cost of that contract. The following table summarizes the notional amounts and weighted average strikeprices of CPI indexes underlying the company’s CPI-linked derivative contracts:
December 31, 2014 December 31, 2013
Notional Amount Notional Amount
Weighted Index Weighted Indexaverage value at average value at
Floor Original U.S. strike period Original U.S. strike periodUnderlying CPI index rate(1) currency dollars price end currency dollars price end
United States 0.0% 46,225.0 46,225.0 231.32 234.81 34,375.0 34,375.0 230.43 233.05United States 0.5% 12,600.0 12,600.0 238.30 234.81 – – – –United Kingdom 0.0% 3,300.0 5,145.6 243.82 257.50 3,300.0 5,465.7 243.82 253.40European Union 0.0% 36,775.0 44,499.7 111.24 117.01 28,475.0 39,236.9 109.85 117.28France 0.0% 2,750.0 3,327.6 124.85 125.81 2,750.0 3,789.3 124.85 125.82
111,797.9 82,866.9
(1) Contracts with a floor rate of 0.0% provide a payout at maturity if there is cumulative deflation over the life of thecontract. Contracts with a floor rate of 0.5% provide a payout at maturity if cumulative inflation averages less than 0.5%per year over the life of the contract.
During 2014 the company purchased $35,954.2 (2013 – $32,327.7) notional amount of CPI-linked derivativecontracts at a cost of $120.6 (2013 – $99.8). Additional premiums of $24.0 were paid in 2013 to increase the strikeprice of certain CPI-linked derivative contracts (primarily the U.S. CPI-linked derivatives). The company’s CPI-linkedderivative contracts produced net unrealized gains of $17.7 in 2014 (2013 – net unrealized losses of $126.9).
Foreign exchange forward contractsLong and short foreign exchange forward contracts primarily denominated in the euro, the British pound sterlingand the Canadian dollar are used to manage certain foreign currency exposures arising from foreign currencydenominated transactions. The contracts have an average term to maturity of less than one year and may be renewedat market rates.
60
Counterparty riskThe company endeavours to limit counterparty risk through the terms of agreements negotiated with thecounterparties to its derivative contracts. The fair value of the collateral deposited for the benefit of the company atDecember 31, 2014 consisted of cash of $27.8 and government securities of $164.5 (December 31, 2013 – $25.3 and$25.1 respectively). The company has recognized the cash collateral within subsidiary cash and short terminvestments and recognized a corresponding liability within accounts payable and accrued liabilities. The companyhad not exercised its right to sell or repledge collateral at December 31, 2014. The company’s exposure tocounterparty risk and the manner in which the company manages counterparty risk are discussed further in note 24.
Hedge of net investment in Canadian subsidiariesThe company has designated the carrying value of Cdn$1,525.0 principal amount of its Canadian dollardenominated unsecured senior notes with a fair value of $1,488.7 (December 31, 2013 – principal amount ofCdn$1,525.0 with a fair value of $1,544.4) as a hedge of its net investment in its Canadian subsidiaries for financialreporting purposes. In 2014 the company recognized pre-tax gains of $118.7 (2013 – $96.9) related to foreigncurrency movements on the unsecured senior notes in change in gains on hedge of net investment in Canadiansubsidiaries in the consolidated statement of comprehensive income.
8. Insurance Contract Liabilities
December 31, 2014 December 31, 2013
Gross Ceded Net Gross Ceded Net
Provision for unearned premiums 2,689.6 395.7 2,293.9 2,680.9 408.1 2,272.8Provision for losses and loss adjustment expenses 17,749.1 3,355.7 14,393.4 19,212.8 4,213.3 14,999.5
Total insurance contract liabilities 20,438.7 3,751.4 16,687.3 21,893.7 4,621.4 17,272.3
Current 6,985.2 1,894.0 5,091.2 7,327.6 2,002.5 5,325.1Non-current 13,453.5 1,857.4 11,596.1 14,566.1 2,618.9 11,947.2
20,438.7 3,751.4 16,687.3 21,893.7 4,621.4 17,272.3
At December 31, 2014 the company’s net loss reserves of $14,393.4 (December 31, 2013 – $14,999.5) were comprisedof case reserves of $7,285.0 and IBNR of $7,108.4 respectively (December 31, 2013 – $7,811.3 and $7,188.2respectively).
Provision for unearned premiumsChanges in the provision for unearned premiums for the years ended December 31 were as follows:
2014 2013
Provision for unearned premiums – January 1 2,680.9 2,727.4Gross premiums written 7,459.9 7,227.1Less: premiums earned (7,358.2) (7,294.0)
Acquisitions of subsidiaries 2.6 83.2Foreign exchange effect and other (95.6) (62.8)
Provision for unearned premiums – December 31 2,689.6 2,680.9
61
FAIRFAX FINANCIAL HOLDINGS LIMITED
Provision for losses and loss adjustment expensesChanges in the provision for losses and loss adjustment expenses for the years ended December 31 were as follows:
2014 2013
Provision for losses and loss adjustment expenses – January 1 19,212.8 19,648.8Decrease in estimated losses and expenses for claims occurring in the prior years (473.9) (470.3)Losses and expenses for claims occurring in the current year 4,901.3 5,085.9Paid on claims occurring during:
the current year (1,201.4) (1,212.8)the prior years (4,081.0) (4,358.7)
Acquisitions of subsidiaries 0.4 690.3Foreign exchange effect and other (609.1) (170.4)
Provision for losses and loss adjustment expenses – December 31 17,749.1 19,212.8
Development of insurance losses, grossThe development of insurance liabilities provides a measure of the company’s ability to estimate the ultimate valueof claims. The loss development table which follows shows the provision for losses and loss adjustment expenses atthe end of each calendar year, the cumulative payments made in respect of those reserves in subsequent years and there-estimated amount of each calendar years’ provision for losses and loss adjustment expenses as atDecember 31, 2014.
Calendar year
2007 2008 2009 2010 2011 2012 2013 2014
Provision for losses and lossadjustment expenses 14,843.2 14,467.2 14,504.8 16,049.3 17,232.2 19,648.8 19,212.8 17,749.1
Less: CTR Life(1) 21.5 34.9 27.6 25.3 24.2 20.6 17.9 15.2
14,821.7 14,432.3 14,477.2 16,024.0 17,208.0 19,628.2 19,194.9 17,733.9Cumulative payments as of:One year later 3,167.8 3,136.0 3,126.6 3,355.9 3,627.6 4,323.5 4,081.1Two years later 5,130.8 5,336.4 5,307.6 5,441.4 6,076.7 7,153.1Three years later 6,784.9 7,070.7 6,846.3 7,063.1 7,920.3Four years later 8,124.6 8,318.7 7,932.7 8,333.3Five years later 9,079.0 9,189.1 8,936.9Six years later 9,730.6 10,039.4Seven years later 10,458.1
Reserves re-estimated as of:One year later 14,420.4 14,746.0 14,616.0 15,893.8 17,316.4 19,021.2 18,375.6Two years later 14,493.8 14,844.4 14,726.6 15,959.7 17,013.6 18,529.4Three years later 14,579.9 14,912.4 14,921.6 15,705.6 16,721.0Four years later 14,679.5 15,127.5 14,828.9 15,430.4Five years later 14,908.6 15,091.0 14,663.1Six years later 14,947.2 15,011.7Seven years later 14,964.2
Favourable (unfavourable) development (142.5) (579.4) (185.9) 593.6 487.0 1,098.8 819.3Comprised of – favourable (unfavourable):
Effect of foreign currency translation 208.8 (348.4) 44.1 231.3 221.9 446.0 345.4Loss reserve development (351.3) (231.0) (230.0) 362.3 265.1 652.8 473.9
(142.5) (579.4) (185.9) 593.6 487.0 1,098.8 819.3
(1) Guaranteed minimum death benefit retrocessional business written by Compagnie Transcontinentale de Reassurance(‘‘CTR Life’’), a wholly owned subsidiary of the company that was transferred to Wentworth and placed into runoffin 2002.
62
The effect of foreign currency translation in the table above primarily arose on translation to U.S. dollars of the lossreserves of subsidiaries with functional currencies other than the U.S. dollar. The company’s exposure to foreigncurrency risk and the manner in which the company manages foreign currency risk is discussed further in note 24.
Loss reserve development in the table above excludes the loss reserve development of a subsidiary in the year it isacquired whereas the consolidated statement of earnings includes the loss reserve development of a subsidiary fromits acquisition date.
Favourable loss reserve development in calendar year 2014 of $473.9 in the table preceding this paragraph wasprincipally comprised of favourable loss emergence on the more recent accident years, partially offset by adversedevelopment primarily relating to asbestos and other latent reserves.
Development of losses and loss adjustment expenses for asbestosA number of the company’s subsidiaries wrote general insurance policies and reinsurance prior to their acquisitionby the company under which policyholders continue to present asbestos-related injury claims. The vast majority ofthese claims are presented under policies written many years ago and reside primarily within the runoff group.
There is a great deal of uncertainty surrounding these types of claims, which impacts the ability of insurers andreinsurers to estimate the ultimate amount of unpaid claims and related settlement expenses. The majority of theseclaims differ from most other types of claims because there is inconsistent precedent, if any at all, to determine what,if any, coverage exists or which, if any, policy years and insurers/reinsurers may be liable. These uncertainties areexacerbated by judicial and legislative interpretations of coverage that in some cases have eroded the clear andexpress intent of the parties to the insurance contracts, and in others have expanded theories of liability.
The following is an analysis of the changes which have occurred in the company’s provision for losses and lossadjustment expenses related to asbestos exposure on a gross and net basis for the years ended December 31:
2014 2013
Gross Net Gross Net(1)
AsbestosBalance – beginning of year 1,353.1 981.8 1,426.4 953.7
Losses and loss adjustment expenses incurred 49.3 36.4 77.2 18.6Losses and loss adjustment expenses paid (178.1) (121.5) (150.5) 9.5
Balance – end of year 1,224.3 896.7 1,353.1 981.8
(1) Includes the effect of a commutation of a recoverable from reinsurer at Runoff which reduced the losses and lossadjustment expenses incurred and paid by $33.1 and $118.5 respectively.
Fair Value
The fair value of insurance and reinsurance contracts is estimated as follows:
December 31, 2014 December 31, 2013
Fair Carrying Fair Carryingvalue value value value
Insurance contracts 20,383.6 20,438.7 21,276.4 21,893.7Ceded reinsurance contracts 3,641.4 3,751.4 4,386.7 4,621.4
The fair value of insurance contracts is comprised of the fair value of unpaid claim liabilities and the fair value of theunearned premiums. The fair value of ceded reinsurance contracts is comprised of the fair value of reinsurers’ share ofunpaid claim liabilities and the unearned premium. Both reflect the time value of money whereas the carrying values(including the reinsurers’ share thereof) do not reflect discounting. The calculation of the fair value of the unearnedpremium includes acquisition expenses to reflect the deferral of these expenses at the inception of the insurancecontract. The estimated value of insurance and ceded reinsurance contracts is determined by projecting the expectedfuture cash flows of the contracts, selecting the appropriate interest rates, and applying the resulting discount factorsto expected future cash flows. The difference between the sum of the undiscounted expected future cash flows anddiscounted future cash flows represent the time value of money. A margin for risk and uncertainty is added to the
63
FAIRFAX FINANCIAL HOLDINGS LIMITED
discounted cash flows to reflect the volatility of the lines of business written, quantity of reinsurance purchased,credit quality of reinsurers and a risk margin for future changes in interest rates.
The table that follows shows the potential impact of interest rate fluctuations on the fair value of insurance andreinsurance contracts:
December 31, 2014 December 31, 2013
Fair value of Fair value of Fair value of Fair value ofinsurance reinsurance insurance reinsurance
Change in Interest Rates contracts contracts contracts contracts
100 basis point rise 19,808.9 3,552.6 20,677.0 4,275.0100 basis point decline 21,004.5 3,737.0 21,924.3 4,506.7
9. Reinsurance
Reinsurers’ share of insurance contract liabilities is comprised as follows:
December 31, 2014 December 31, 2013
Gross Grossrecoverable Provision for Recoverable recoverable Provision for Recoverable
from uncollectible from from uncollectible fromreinsurers reinsurance reinsurers reinsurers reinsurance reinsurers
Provision for losses and loss adjustment expenses 3,410.0 (54.3) 3,355.7 4,276.8 (63.5) 4,213.3Reinsurers’ share of paid losses 380.7 (150.0) 230.7 518.6 (165.3) 353.3Provision for unearned premiums 395.7 – 395.7 408.1 – 408.1
4,186.4 (204.3) 3,982.1 5,203.5 (228.8) 4,974.7
Current 2,070.6 2,292.3Non-current 1,911.5 2,682.4
3,982.1 4,974.7
The company follows the policy of underwriting and reinsuring contracts of insurance and reinsurance which,depending on the type of contract, generally limits the liability of the individual insurance and reinsurancesubsidiaries on any policy to a maximum amount on any one loss. Reinsurance decisions are made by thesubsidiaries to reduce and spread the risk of loss on insurance and reinsurance written, to limit multiple claimsarising from a single occurrence and to protect capital resources. The amount of reinsurance purchased can varyamong subsidiaries depending on the lines of business written, their respective capital resources and prevailing orexpected market conditions. Reinsurance is generally placed on an excess of loss basis and written in several layers,the purpose of which is to limit the amount of one risk to a maximum amount acceptable to the company and toprotect from losses on multiple risks arising from a single occurrence. This type of reinsurance includes what isgenerally referred to as catastrophe reinsurance. The company’s reinsurance does not, however, relieve the companyof its primary obligation to the policyholder.
The majority of reinsurance contracts purchased by the company provide coverage for a one year term and arenegotiated annually. The ability of the company to obtain reinsurance on terms and prices consistent with historicalresults reflects, among other factors, recent loss experience of the company and of the industry in general. Currentlythere exists excess capital within the reinsurance market due to favourable operating results of reinsurers andalternative forms of reinsurance capacity entering the market. As a result, the market has become very competitivewith pricing remaining flat and in some cases decreasing. Further compounding these effects has been the relativelybenign level of catastrophe losses for reinsurers in the United States over the last number of years. The company willremain opportunistic in its use of reinsurance, balancing capital requirements and the cost of reinsurance.
The company has guidelines and a review process in place to assess the creditworthiness of the reinsurers to which itcedes. Note 24 discusses the company’s management of credit risk associated with reinsurance recoverables.
The company makes specific provisions against reinsurance recoverables from reinsurers considered to be infinancial difficulty. In addition, the company records an allowance based upon its analysis of historical recoveries,the level of allowance already in place and management’s judgment on future collectability.
64
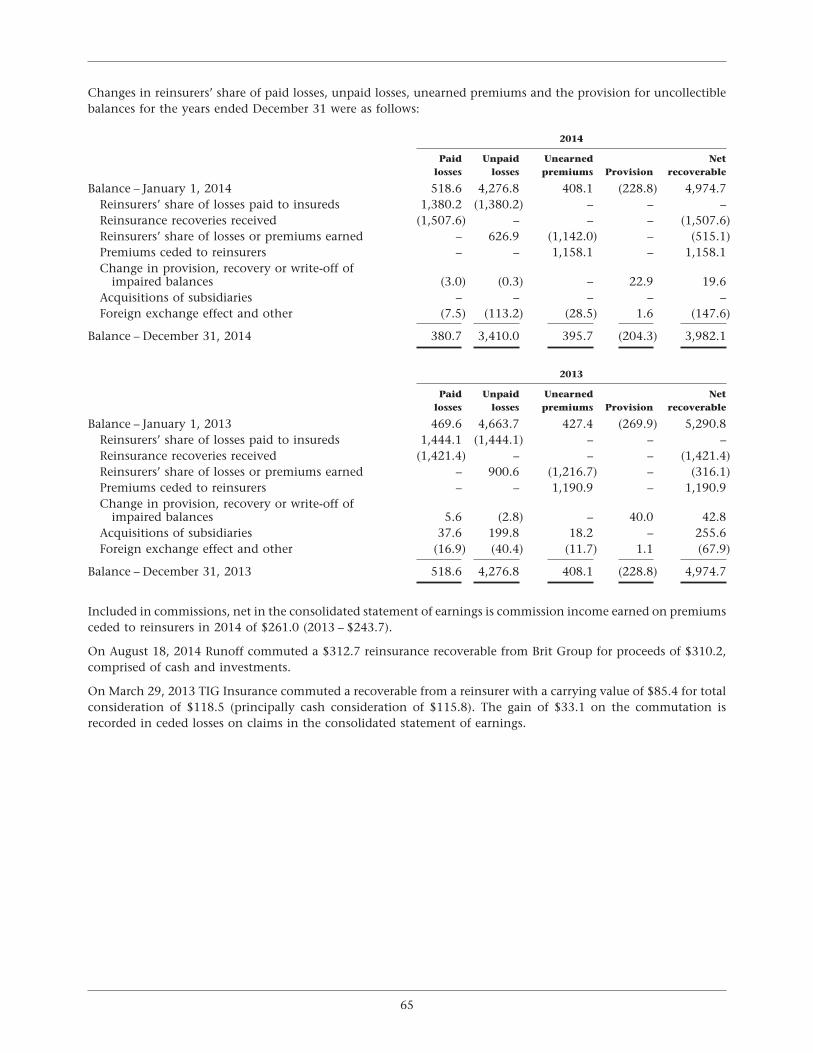
Changes in reinsurers’ share of paid losses, unpaid losses, unearned premiums and the provision for uncollectiblebalances for the years ended December 31 were as follows:
2014
Paid Unpaid Unearned Netlosses losses premiums Provision recoverable
Balance – January 1, 2014 518.6 4,276.8 408.1 (228.8) 4,974.7Reinsurers’ share of losses paid to insureds 1,380.2 (1,380.2) – – –Reinsurance recoveries received (1,507.6) – – – (1,507.6)Reinsurers’ share of losses or premiums earned – 626.9 (1,142.0) – (515.1)Premiums ceded to reinsurers – – 1,158.1 – 1,158.1Change in provision, recovery or write-off of
impaired balances (3.0) (0.3) – 22.9 19.6Acquisitions of subsidiaries – – – – –Foreign exchange effect and other (7.5) (113.2) (28.5) 1.6 (147.6)
Balance – December 31, 2014 380.7 3,410.0 395.7 (204.3) 3,982.1
2013
Paid Unpaid Unearned Netlosses losses premiums Provision recoverable
Balance – January 1, 2013 469.6 4,663.7 427.4 (269.9) 5,290.8Reinsurers’ share of losses paid to insureds 1,444.1 (1,444.1) – – –Reinsurance recoveries received (1,421.4) – – – (1,421.4)Reinsurers’ share of losses or premiums earned – 900.6 (1,216.7) – (316.1)Premiums ceded to reinsurers – – 1,190.9 – 1,190.9Change in provision, recovery or write-off of
impaired balances 5.6 (2.8) – 40.0 42.8Acquisitions of subsidiaries 37.6 199.8 18.2 – 255.6Foreign exchange effect and other (16.9) (40.4) (11.7) 1.1 (67.9)
Balance – December 31, 2013 518.6 4,276.8 408.1 (228.8) 4,974.7
Included in commissions, net in the consolidated statement of earnings is commission income earned on premiumsceded to reinsurers in 2014 of $261.0 (2013 – $243.7).
On August 18, 2014 Runoff commuted a $312.7 reinsurance recoverable from Brit Group for proceeds of $310.2,comprised of cash and investments.
On March 29, 2013 TIG Insurance commuted a recoverable from a reinsurer with a carrying value of $85.4 for totalconsideration of $118.5 (principally cash consideration of $115.8). The gain of $33.1 on the commutation isrecorded in ceded losses on claims in the consolidated statement of earnings.
65
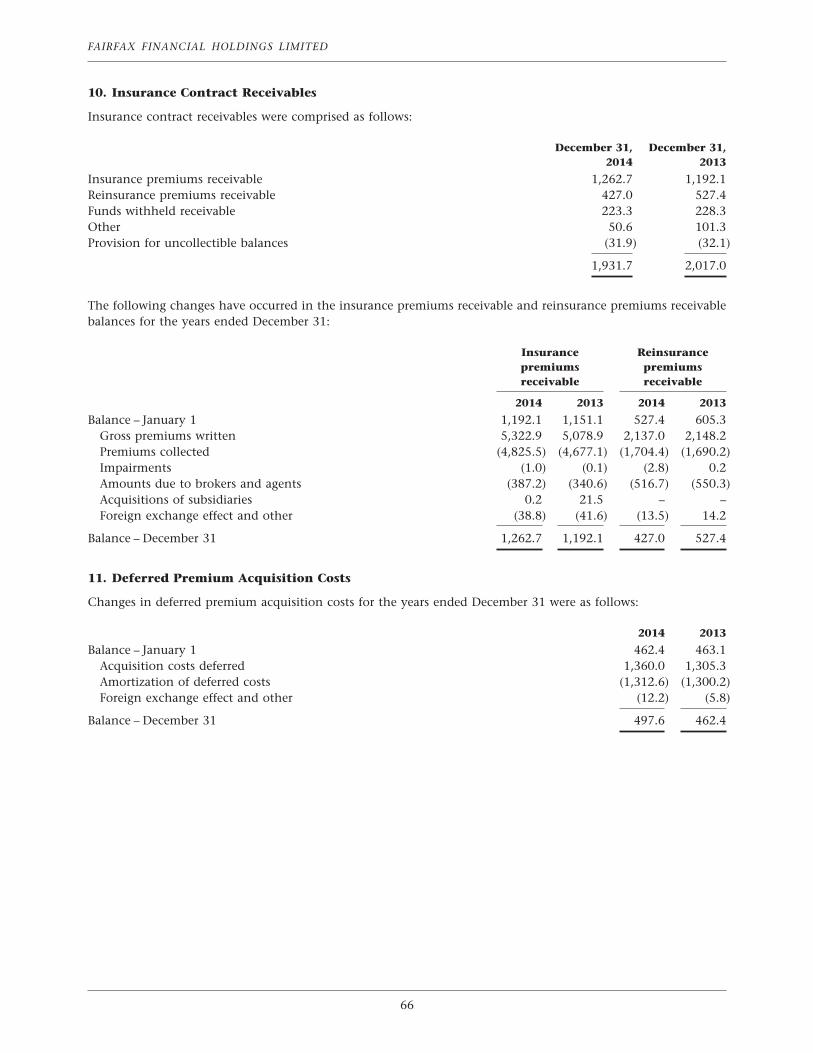
FAIRFAX FINANCIAL HOLDINGS LIMITED
10. Insurance Contract Receivables
Insurance contract receivables were comprised as follows:
December 31, December 31,2014 2013
Insurance premiums receivable 1,262.7 1,192.1Reinsurance premiums receivable 427.0 527.4Funds withheld receivable 223.3 228.3Other 50.6 101.3Provision for uncollectible balances (31.9) (32.1)
1,931.7 2,017.0
The following changes have occurred in the insurance premiums receivable and reinsurance premiums receivablebalances for the years ended December 31:
Insurance Reinsurancepremiums premiumsreceivable receivable
2014 2013 2014 2013
Balance – January 1 1,192.1 1,151.1 527.4 605.3Gross premiums written 5,322.9 5,078.9 2,137.0 2,148.2Premiums collected (4,825.5) (4,677.1) (1,704.4) (1,690.2)Impairments (1.0) (0.1) (2.8) 0.2Amounts due to brokers and agents (387.2) (340.6) (516.7) (550.3)Acquisitions of subsidiaries 0.2 21.5 – –Foreign exchange effect and other (38.8) (41.6) (13.5) 14.2
Balance – December 31 1,262.7 1,192.1 427.0 527.4
11. Deferred Premium Acquisition Costs
Changes in deferred premium acquisition costs for the years ended December 31 were as follows:
2014 2013
Balance – January 1 462.4 463.1Acquisition costs deferred 1,360.0 1,305.3Amortization of deferred costs (1,312.6) (1,300.2)Foreign exchange effect and other (12.2) (5.8)
Balance – December 31 497.6 462.4
66
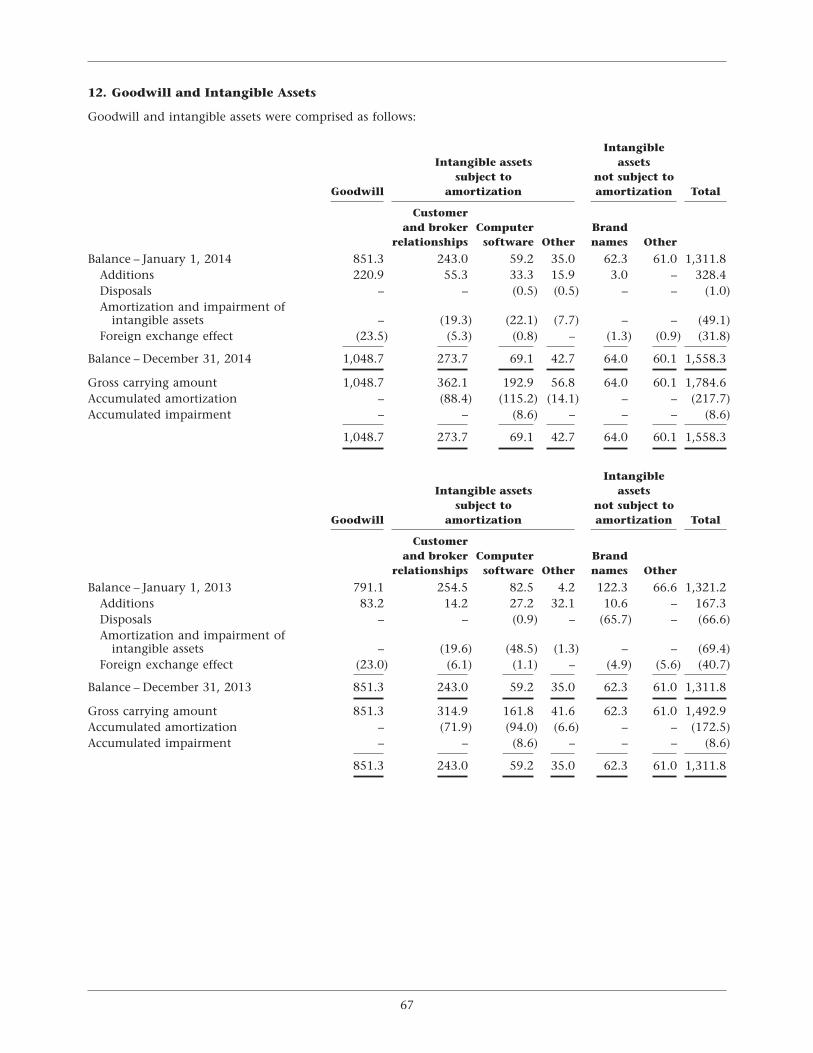
12. Goodwill and Intangible Assets
Goodwill and intangible assets were comprised as follows:
IntangibleIntangible assets assets
subject to not subject toGoodwill amortization amortization Total
Customerand broker Computer Brand
relationships software Other names Other
Balance – January 1, 2014 851.3 243.0 59.2 35.0 62.3 61.0 1,311.8Additions 220.9 55.3 33.3 15.9 3.0 – 328.4Disposals – – (0.5) (0.5) – – (1.0)Amortization and impairment of
intangible assets – (19.3) (22.1) (7.7) – – (49.1)Foreign exchange effect (23.5) (5.3) (0.8) – (1.3) (0.9) (31.8)
Balance – December 31, 2014 1,048.7 273.7 69.1 42.7 64.0 60.1 1,558.3
Gross carrying amount 1,048.7 362.1 192.9 56.8 64.0 60.1 1,784.6Accumulated amortization – (88.4) (115.2) (14.1) – – (217.7)Accumulated impairment – – (8.6) – – – (8.6)
1,048.7 273.7 69.1 42.7 64.0 60.1 1,558.3
IntangibleIntangible assets assets
subject to not subject toGoodwill amortization amortization Total
Customerand broker Computer Brand
relationships software Other names Other
Balance – January 1, 2013 791.1 254.5 82.5 4.2 122.3 66.6 1,321.2Additions 83.2 14.2 27.2 32.1 10.6 – 167.3Disposals – – (0.9) – (65.7) – (66.6)Amortization and impairment of
intangible assets – (19.6) (48.5) (1.3) – – (69.4)Foreign exchange effect (23.0) (6.1) (1.1) – (4.9) (5.6) (40.7)
Balance – December 31, 2013 851.3 243.0 59.2 35.0 62.3 61.0 1,311.8
Gross carrying amount 851.3 314.9 161.8 41.6 62.3 61.0 1,492.9Accumulated amortization – (71.9) (94.0) (6.6) – – (172.5)Accumulated impairment – – (8.6) – – – (8.6)
851.3 243.0 59.2 35.0 62.3 61.0 1,311.8
67
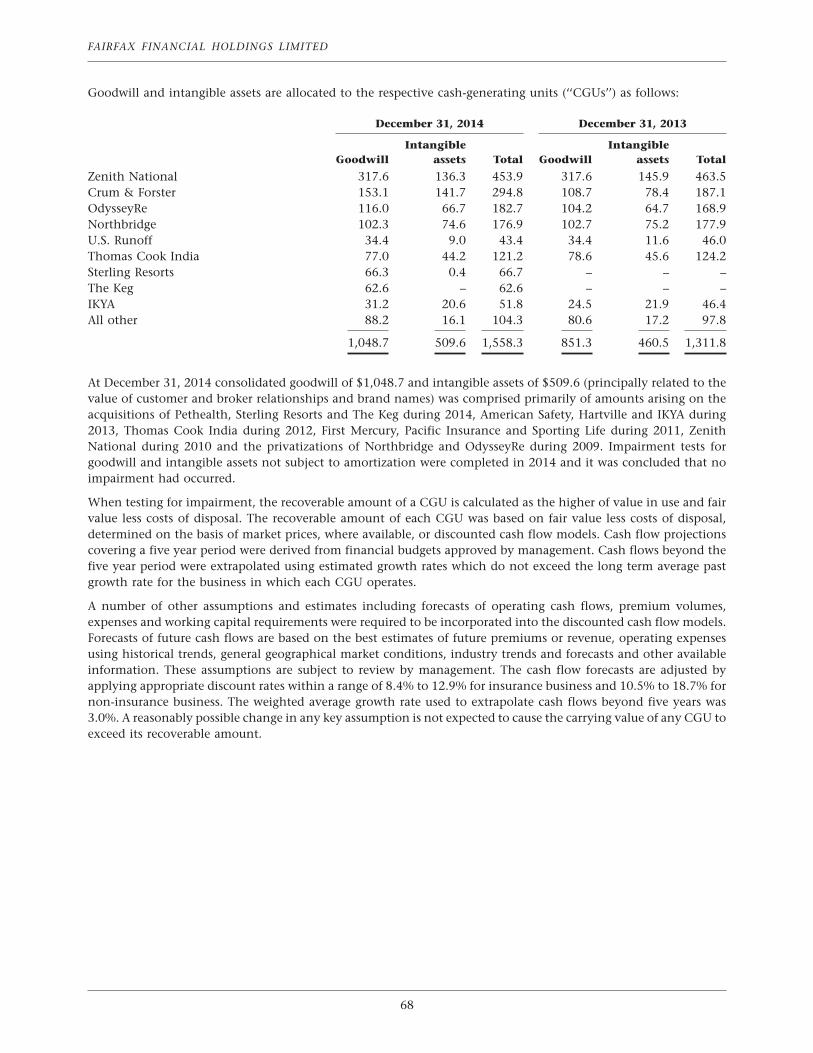
FAIRFAX FINANCIAL HOLDINGS LIMITED
Goodwill and intangible assets are allocated to the respective cash-generating units (‘‘CGUs’’) as follows:
December 31, 2014 December 31, 2013
Intangible IntangibleGoodwill assets Total Goodwill assets Total
Zenith National 317.6 136.3 453.9 317.6 145.9 463.5Crum & Forster 153.1 141.7 294.8 108.7 78.4 187.1OdysseyRe 116.0 66.7 182.7 104.2 64.7 168.9Northbridge 102.3 74.6 176.9 102.7 75.2 177.9U.S. Runoff 34.4 9.0 43.4 34.4 11.6 46.0Thomas Cook India 77.0 44.2 121.2 78.6 45.6 124.2Sterling Resorts 66.3 0.4 66.7 – – –The Keg 62.6 – 62.6 – – –IKYA 31.2 20.6 51.8 24.5 21.9 46.4All other 88.2 16.1 104.3 80.6 17.2 97.8
1,048.7 509.6 1,558.3 851.3 460.5 1,311.8
At December 31, 2014 consolidated goodwill of $1,048.7 and intangible assets of $509.6 (principally related to thevalue of customer and broker relationships and brand names) was comprised primarily of amounts arising on theacquisitions of Pethealth, Sterling Resorts and The Keg during 2014, American Safety, Hartville and IKYA during2013, Thomas Cook India during 2012, First Mercury, Pacific Insurance and Sporting Life during 2011, ZenithNational during 2010 and the privatizations of Northbridge and OdysseyRe during 2009. Impairment tests forgoodwill and intangible assets not subject to amortization were completed in 2014 and it was concluded that noimpairment had occurred.
When testing for impairment, the recoverable amount of a CGU is calculated as the higher of value in use and fairvalue less costs of disposal. The recoverable amount of each CGU was based on fair value less costs of disposal,determined on the basis of market prices, where available, or discounted cash flow models. Cash flow projectionscovering a five year period were derived from financial budgets approved by management. Cash flows beyond thefive year period were extrapolated using estimated growth rates which do not exceed the long term average pastgrowth rate for the business in which each CGU operates.
A number of other assumptions and estimates including forecasts of operating cash flows, premium volumes,expenses and working capital requirements were required to be incorporated into the discounted cash flow models.Forecasts of future cash flows are based on the best estimates of future premiums or revenue, operating expensesusing historical trends, general geographical market conditions, industry trends and forecasts and other availableinformation. These assumptions are subject to review by management. The cash flow forecasts are adjusted byapplying appropriate discount rates within a range of 8.4% to 12.9% for insurance business and 10.5% to 18.7% fornon-insurance business. The weighted average growth rate used to extrapolate cash flows beyond five years was3.0%. A reasonably possible change in any key assumption is not expected to cause the carrying value of any CGU toexceed its recoverable amount.
68
13. Other Assets
Other assets were comprised as follows:
December 31, 2014 December 31, 2013
Insurance and Non- Insurance and Non-reinsurance insurance reinsurance insurance
companies companies Total companies companies Total
Premises and equipment 123.7 327.9 451.6 133.4 107.8 241.2Accrued interest and dividends 128.5 0.1 128.6 136.7 – 136.7Income taxes refundable 40.7 10.4 51.1 103.3 10.8 114.1Receivables for securities sold but not
yet settled 16.9 – 16.9 56.5 – 56.5Deferred compensation plans 48.4 – 48.4 49.1 – 49.1Pension assets (note 21) 33.1 – 33.1 45.2 – 45.2Prepaid expenses 37.9 10.2 48.1 38.3 6.7 45.0Other reporting segment sales receivables – 185.5 185.5 – 101.1 101.1Other reporting segment inventories – 129.0 129.0 – 79.2 79.2Other 172.0 83.3 255.3 161.1 58.9 220.0
601.2 746.4 1,347.6 723.6 364.5 1,088.1
Current 330.6 379.0 709.6 409.0 202.2 611.2Non-current 270.6 367.4 638.0 314.6 162.3 476.9
601.2 746.4 1,347.6 723.6 364.5 1,088.1
14. Accounts Payable and Accrued Liabilities
Accounts payable and accrued liabilities were comprised as follows:
December 31, 2014 December 31, 2013
Insurance and Non- Insurance and Non-reinsurance insurance reinsurance insurance
companies companies Total companies companies Total
Payable to reinsurers 391.6 – 391.6 480.5 – 480.5Salaries and employee benefit liabilities 173.0 31.4 204.4 209.4 8.9 218.3Pension and post retirement liabilities
(note 21) 175.2 23.4 198.6 148.5 18.4 166.9Amounts withheld and accrued taxes 87.5 38.2 125.7 67.0 32.2 99.2Ceded deferred premium acquisition costs 91.3 – 91.3 79.7 – 79.7Accrued commissions 69.0 0.3 69.3 67.6 0.4 68.0Accrued premium taxes 55.9 – 55.9 62.6 – 62.6Amounts payable to agents and brokers 16.7 – 16.7 61.8 – 61.8Accrued interest expense 40.6 0.7 41.3 36.4 0.1 36.5Accrued legal and professional fees 24.3 3.0 27.3 25.4 0.6 26.0Accounts payable for securities
purchased but not yet settled 14.8 – 14.8 22.4 – 22.4Deferred gift card revenue – 64.0 64.0 – – –Other reporting segment payables
related to cost of sales – 177.0 177.0 – 87.3 87.3Administrative and other 409.7 141.5 551.2 367.6 63.8 431.4
1,549.6 479.5 2,029.1 1,628.9 211.7 1,840.6
Current 969.9 347.4 1,317.3 1,026.1 160.1 1,186.2Non-current 579.7 132.1 711.8 602.8 51.6 654.4
1,549.6 479.5 2,029.1 1,628.9 211.7 1,840.6
69
FAIRFAX FINANCIAL HOLDINGS LIMITED
15. Subsidiary Indebtedness, Long Term Debt and Credit Facilities
December 31, 2014 December 31, 2013
Carrying Fair Carrying FairPrincipal value(a) value(b) Principal value(a) value(b)
Subsidiary indebtedness – non-insurance companies(c)
Ridley secured revolving facility at floating rate 2.4 2.4 2.4 4.8 4.8 4.8Thomas Cook India short term loans and bank overdraft
primarily at fixed rates 4.6 4.6 4.6 6.0 6.0 6.0IKYA credit facilities and bank overdraft at floating rates 27.6 27.6 27.6 10.3 10.3 10.3Other loans and bank overdraft primarily at floating rates 3.0 3.0 3.0 4.7 4.7 4.7
37.6 37.6 37.6 25.8 25.8 25.8
Long term debt – non-insurance companies(c)
The Keg Cdn$57.0 million note at 7.5% due May 31, 2042(1) 49.2 49.2 49.2 – – –The Keg term loan at floating rate due July 1, 2016(1) 31.1 30.7 30.7 – – –Thomas Cook India debentures (INR 1.0 billion) at 10.52% due
April 15, 2018(2) 15.8 15.8 16.5 16.2 16.1 16.1Other loans 3.3 3.3 3.3 2.2 2.8 2.8
99.4 99.0 99.7 18.4 18.9 18.9
Long term debt – holding company borrowingsFairfax unsecured notes:
8.25% due October 1, 2015(3) 82.4 82.4 86.4 82.4 82.3 91.37.375% due April 15, 2018(3) 144.2 144.1 163.7 144.2 144.0 161.77.50% due August 19, 2019 (Cdn$400.0)(4) 345.3 343.2 402.1 376.5 373.8 426.27.25% due June 22, 2020 (Cdn$275.0)(4) 237.4 236.1 275.5 258.8 257.2 290.05.80% due May 15, 2021(5) 500.0 496.1 522.4 500.0 495.5 507.06.40% due May 25, 2021 (Cdn$400.0)(4) 345.3 342.7 388.2 376.5 373.5 400.95.84% due October 14, 2022 (Cdn$450.0)(2)(4) 388.5 394.0 422.9 423.5 429.7 427.34.875% due August 13, 2024(1) 300.0 294.4 296.7 – – –8.30% due April 15, 2026(3) 91.8 91.5 115.7 91.8 91.5 107.47.75% due July 15, 2037(3) 91.3 90.2 107.2 91.3 90.2 93.9
Trust preferred securities of subsidiaries(1)(6) 2.1 2.1 2.1 9.1 9.1 9.2Purchase consideration payable(7) 139.7 139.7 139.7 144.2 144.2 144.2
2,668.0 2,656.5 2,922.6 2,498.3 2,491.0 2,659.1
Long term debt – insurance and reinsurance companiesOdysseyRe unsecured senior notes:
6.875% due May 1, 2015(8) 125.0 124.9 127.2 125.0 124.5 134.7Series A, floating rate due March 15, 2021(9) 50.0 49.8 50.2 50.0 49.9 47.3Series B, floating rate due March 15, 2016(1)(9) – – – 50.0 49.9 50.6Series C, floating rate due December 15, 2021(10) 40.0 39.9 41.0 40.0 39.9 38.5
First Mercury floating rate trust preferred securities due2036 and 2037 41.4 41.4 41.4 41.4 41.4 41.4
Zenith National 8.55% redeemable debentures dueAugust 1, 2028 38.4 38.1 38.1 38.4 38.1 38.1
Advent floating rate subordinated notes due June 3, 2035 48.5 47.1 43.8 50.5 49.0 45.5Advent floating rate unsecured senior notes due 2026 46.0 44.7 46.0 46.0 44.6 46.0American Safety floating rate trust preferred securities due
December 15, 2035(1)(2) – – – 25.0 21.5 21.5
389.3 385.9 387.7 466.3 458.8 463.6
Long term debt 3,156.7 3,141.4 3,410.0 2,983.0 2,968.7 3,141.6
Current 216.7 5.4Non-current 2,940.0 2,977.6
3,156.7 2,983.0
(a) Principal net of unamortized issue costs and discounts.
(b) Based principally on quoted market prices with the remainder based on discounted cash flow models using marketobservable inputs (Levels 1 and 2 respectively in the fair value hierarchy).
(c) These borrowings are non-recourse to the holding company.
70
(1) During 2014 the company and its subsidiaries completed the following debt transactions:
(a) On December 15, 2014 Runoff redeemed $25.0 principal amount (carrying value of $21.5) of AmericanSafety’s floating rate trust preferred securities due 2035 for cash consideration of $25.0 and recorded a losson repurchase of long term debt of $3.5 in other expenses in the consolidated statement of earnings.
(b) On December 15, 2014 OdysseyRe redeemed $50.0 principal amount of its Series B unsecured senior notesdue 2016 for cash consideration of $50.0.
(c) On August 13, 2014 the company through its wholly-owned subsidiary, Fairfax (US) Inc., completed aprivate debt offering of $300.0 principal amount of 4.875% senior notes due August 13, 2024 at an issueprice of 99.026 for net proceeds after discount, commissions and expenses of $294.2. Commissions andexpenses of $2.9 were included as part of the carrying value of the debt. These senior notes are guaranteed byFairfax and redeemable at the issuer’s option, in whole at any time or in part from time to time, at a priceequal to the greater of (a) 100% of the principal amount to be redeemed or (b) the sum of the present valuesof the remaining scheduled payments of principal and interest thereon (exclusive of interest accrued to thedate of redemption) discounted to the redemption date on a semi-annual basis at the treasury rate plus37.5 basis points together, in each case, with accrued interest thereon to the date of redemption.
(d) The company repurchased $7.0 principal amount of trust preferred securities due 2027 for cashconsideration of $7.1 and recorded a loss on repurchase of long term debt of $0.1 in other expenses in theconsolidated statement of earnings.
(e) On February 4, 2014 the company assumed $86.1 of long term debt of The Keg pursuant to the transactiondescribed in note 23. At that date the long term debt was comprised of a note payable with a principalamount of $51.4 (Cdn$57.0) bearing interest at 7.50% per annum due May 31, 2042 and term loans with aprincipal amount of $34.7 (Cdn$38.4) bearing interest at a floating rate due July 1, 2016.
(2) During 2013 the company and its subsidiaries completed the following debt transactions:
(a) On November 1, 2013 OdysseyRe repaid the $182.9 principal amount of its unsecured senior notesupon maturity.
(b) On October 3, 2013 pursuant to the acquisition of American Safety described in note 23, the companyassumed the $35.5 carrying value of trust preferred securities issued by American Safety Capital Trust I, II,and III (statutory business trust subsidiaries of American Safety). On November 25, 2013 and December 31,2013 American Safety redeemed all $8.0 and $5.0 principal amounts of its outstanding Trust I and Trust IIpreferred securities for cash consideration of $8.2 and $5.2 respectively.
(c) On April 15, 2013 Thomas Cook India issued $18.3 (1.0 billion Indian rupees) principal amount of 10.52%debentures due 2018 at par value for net proceeds after commissions and expenses of $18.2 (993.1 millionIndian rupees). Commissions and expenses of $0.1 (6.9 million Indian rupees) were included as part of thecarrying value of the debt. The debentures are repayable in equal annual instalments of $6.1 (333.3 millionIndian rupees) in each of 2016, 2017 and 2018.
(d) On January 22, 2013 the company repurchased $12.2 principal amount of its unsecured senior notes due2017 for cash consideration of $12.6. On March 11, 2013 the company redeemed the remaining $36.2principal amount outstanding of its unsecured senior notes due 2017 for cash consideration of $37.7 andrecorded a loss on repurchase of long term debt of $3.4 (inclusive of $1.5 of unamortized issue costs). Theloss is reflected in other expenses in the consolidated statement of earnings.
(e) On January 21, 2013 the company completed a public debt offering of Cdn$250.0 principal amount of are-opening of unsecured senior notes due 2022 at an issue price of $103.854 (an effective yield of 5.33%) fornet proceeds after commissions and expenses of $259.9 (Cdn$258.1). Commissions and expenses of $1.5(Cdn$1.5) were included as part of the carrying value of the debt. Subsequent to this offering, an aggregateprincipal amount of Cdn$450.0 of Fairfax unsecured senior notes due 2022 was outstanding. The companyhas designated these senior notes as a hedge of a portion of its net investment in its Canadian subsidiaries.
71
FAIRFAX FINANCIAL HOLDINGS LIMITED
(3) This debt has no provision for redemption prior to the contractual maturity date. During 2002 the companyclosed out the swaps for this debt and deferred the resulting gain which is amortized to earnings over theremaining term to maturity. The unamortized balance at December 31, 2014 was $20.9 (December 31, 2013 –$22.8).
(4) Redeemable at the company’s option, in whole or in part, at any time at the greater of (a) a specified redemptionprice based upon the then current yield of a Government of Canada bond with an equal term to maturity or(b) par.
(5) Redeemable at the company’s option, in whole or in part, at any time at a price equal to the greater of (a) 100% ofthe principal amount to be redeemed or (b) the sum of the present values of the remaining scheduled paymentsof principal and interest thereon (exclusive of interest accrued to the date of redemption) discounted to theredemption date on a semi-annual basis at the treasury rate plus 50 basis points together, in each case, withaccrued interest thereon to the date of redemption.
(6) TIG Holdings had issued 8.597% junior subordinated debentures to TIG Capital Trust (a statutory business trustsubsidiary of TIG Holdings) which, in turn, issued 8.597% mandatory redeemable capital securities, maturingin 2027.
(7) On December 16, 2002 the company acquired Xerox’s 72.5% economic interest in TRG, the holding company ofInternational Insurance Company (‘‘IIC’’), in exchange for payments over the next 15 years of $424.4 ($203.9 atDecember 16, 2002 using a discount rate of 9.0% per annum), payable approximately $5.0 a quarter from 2003to 2017 and approximately $128.2 on December 16, 2017.
(8) Redeemable at OdysseyRe’s option at any time at a price equal to the greater of (a) 100% of the principal amountto be redeemed or (b) the sum of the present values of the remaining scheduled payments of principal andinterest thereon (exclusive of interest accrued to the date of redemption) discounted to the redemption date on asemi-annual basis at the treasury rate plus 40 basis points together, in each case, with accrued interest thereon tothe date of redemption.
(9) The Series A and Series B notes are callable by OdysseyRe on any interest payment date at their par value plusaccrued and unpaid interest. The interest rate on each series of debenture is equal to three month LIBOR, whichis calculated on a quarterly basis, plus 2.20%.
(10) The Series C notes are callable by OdysseyRe on any interest payment date at their par value plus accrued andunpaid interest. The interest rate is equal to three month LIBOR plus 2.50% and is reset after every payment date.
Consolidated interest expense in 2014 of $206.3 (2013 – $211.2) was comprised of interest on long term debt andsubsidiary indebtedness of $201.2 and $5.1 respectively (2013 – $207.9 and $3.3 respectively).
Principal repayments on long term debt are due as follows:
2015 216.72016 41.12017 134.12018 149.42019 345.3Thereafter 2,270.1
Subsequent to December 31, 2014
On March 3, 2015 the company completed an underwritten public offering of Cdn$350.0 principal amount of 4.95%unsecured senior notes due March 3, 2025 at an issue price of 99.114 for net proceeds after discount, commissionsand expenses of $275.7 (Cdn$343.3). Commissions and expenses of $2.9 (Cdn$3.6) will be included as part of thecarrying value of the debt. The notes are redeemable at the company’s option, in whole or in part, at any time at thegreater of (a) a specified redemption price based upon the then current yield of a Government of Canada bond withan equal term to maturity or (b) par. The net proceeds from this offering will form part of the financing for the BritOffer described in note 23.
On February 16, 2015, a Canadian chartered bank provided the company with a £1.2 billion commitment for the fullamount of the consideration payable pursuant to the Brit Offer as described in note 23.
72
Credit Facilities
On December 18, 2012 Fairfax extended the term of its $300.0 unsecured revolving credit facility (the ‘‘creditfacility’’) with a syndicate of lenders to December 31, 2016. As at December 31, 2014 no amounts had been drawn onthe credit facility.
16. Total Equity
Equity attributable to shareholders of Fairfax
Authorized capital
The authorized share capital of the company consists of an unlimited number of preferred shares issuable in series, anunlimited number of multiple voting shares carrying ten votes per share and an unlimited number of subordinatevoting shares carrying one vote per share.
Issued capital
Issued capital at December 31, 2014 included 1,548,000 (December 31, 2013 – 1,548,000) multiple voting shares and20,865,645 (December 31, 2013 – 20,865,653) subordinate voting shares without par value prior to deducting438,247 (December 31, 2013 – 414,421) subordinate voting shares reserved in treasury for share-based paymentawards. The multiple voting shares are not publicly traded.
Subsequent to December 31, 2014
On March 3, 2015 the company completed an underwritten public offering of 1.15 million subordinate voting sharesat a price of Cdn$650.00 per share, resulting in net proceeds of $575.9 (Cdn$717.1) after commissions and expensesof $24.4 (Cdn$30.4).
On March 3, 2015 the company completed an underwritten public offering of 9,200,000 cumulative five-year resetpreferred shares, Series M for Cdn$25.00 per share, resulting in net proceeds of $179.0 (Cdn$222.9) aftercommissions and expenses of $5.7 (Cdn$7.1). Series M preferred shares are redeemable by the company on March 31,2020 and on each subsequent five-year anniversary date at Cdn$25.00 per share. Holders of the unredeemed Series Mpreferred shares will have the right, at their option, to convert their shares into floating rate cumulative preferredshares Series N on March 31, 2020 and on each subsequent five-year anniversary date. The Series N preferred shares(of which none are currently issued) will have a dividend rate, calculated quarterly, equal to the three-monthGovernment of Canada treasury bill yield plus 3.98%.
The net proceeds from the above offerings will form part of the financing for the Brit Offer described in note 23.
Common stock
The number of shares outstanding was as follows:2014 2013
Subordinate voting shares – January 1 20,451,232 19,496,641Issuances during the year – 1,000,000Purchases for cancellation (8) (36)Net treasury shares acquired (23,826) (45,373)
Subordinate voting shares – December 31 20,427,398 20,451,232Multiple voting shares – beginning and end of year 1,548,000 1,548,000Interest in shares held through ownership interest in shareholder – beginning and
end of year (799,230) (799,230)
Common stock effectively outstanding – December 31 21,176,168 21,200,002
During 2014 and 2013 the company did not repurchase for cancellation any subordinate voting shares under theterms of normal course issuer bids. During 2014 the company repurchased 8 shares (2013 – 36) for cancellation fromformer employees. The company also acquires its own subordinate voting shares on the open market for itsshare-based payment awards. During 2014 the company repurchased for treasury 23,826 subordinate voting shares(2013 – 45,373) for use in its share-based payment awards.
73
FAIRFAX FINANCIAL HOLDINGS LIMITED
On November 15, 2013 the company issued 1 million subordinate voting shares at a price of Cdn$431.00 per share,resulting in net proceeds of $399.5 (Cdn$417.1) after commissions and expenses of $13.3 (Cdn$13.9).
Dividends paid by the company on its outstanding multiple voting and subordinate voting shares were as follows:
Dividend Total cashDate of declaration Date of record Date of payment per share payment
January 5, 2015 January 20, 2015 January 27, 2015 $10.00 $216.1January 3, 2014 January 21, 2014 January 28, 2014 $10.00 $215.7January 4, 2013 January 22, 2013 January 29, 2013 $10.00 $205.5
Preferred Stock
The number of preferred shares outstanding was as follows:
Series C Series D Series E Series G Series I Series K Total
Balance – January 1and December 31, 2013 10,000,000 – 8,000,000 10,000,000 12,000,000 9,500,000 49,500,000Repurchases – – (75,326) – – – (75,326)Conversions (3,983,616) 3,983,616 – – – – –
Balance – December 31, 2014 6,016,384 3,983,616 7,924,674 10,000,000 12,000,000 9,500,000 49,424,674
The carrying value of preferred shares outstanding was as follows:
Series C Series D Series E Series G Series I Series K Total
Balance – January 1and December 31, 2013 227.2 – 183.1 235.9 288.5 231.7 1,166.4Repurchases – – (1.7) – – – (1.7)Conversions (90.5) 90.5 – – – – –
Balance – December 31, 2014 136.7 90.5 181.4 235.9 288.5 231.7 1,164.7
On December 31, 2014 holders of Series C preferred shares converted 3,983,616 shares into Series D preferred shares.
During 2014, under the terms of its normal course issuer bid, the company repurchased for cancellation75,326 Series E preferred shares (2013 – nil) with a carrying value of $1.7 for a net cost of $1.2.
74
The terms of the company’s cumulative five-year rate reset preferred shares are as follows:
Number of Liquidation FixedNext shares preference dividend rate
redemption date outstanding Stated capital per share per annum
Series C(1) December 31, 2019 6,016,384 Cdn $150.4 Cdn $25.00 4.58%Series D(1)(3) December 31, 2019 3,983,616 Cdn $99.6 Cdn $25.00 –Series E(2) March 31, 2015 7,924,674 Cdn $198.1 Cdn $25.00 4.75%Series G(2) September 30, 2015 10,000,000 Cdn $250.0 Cdn $25.00 5.00%Series I(2) December 31, 2015 12,000,000 Cdn $300.0 Cdn $25.00 5.00%Series K(2) March 31, 2017 9,500,000 Cdn $237.5 Cdn $25.00 5.00%
(1) Fixed rate cumulative Series C and floating rate cumulative Series D preferred shares are redeemable by thecompany on the date specified in the table above and on each subsequent five-year anniversary date atCdn$25.00 per share. Holders of unredeemed Series C and Series D preferred shares will have the right, at theiroption, to convert their shares from Series C to Series D, or vice versa, on December 31, 2019, and on eachsubsequent five-year anniversary date.
(2) Series E, Series G, Series I and Series K preferred shares are redeemable by the company on the dates specified inthe table above and on each subsequent five-year anniversary date at Cdn$25.00 per share. Holders ofunredeemed Series E, Series G, Series I and Series K preferred shares will have the right, at their option, to converttheir shares into floating rate cumulative preferred shares Series F (on March 31, 2015), Series H(on September 30, 2015), Series J (on December 31, 2015) and Series L (on March 31, 2017) respectively and oneach subsequent five-year anniversary date. The Series F, Series H, Series J and Series L preferred shares (of whichnone are currently issued) will have a dividend rate equal to the three-month Government of Canada treasurybill yield current on March 31, 2015, September 30, 2015, December 31, 2015 and March 31, 2017, or anysubsequent five-year anniversary plus 2.16%, 2.56%, 2.85% and 3.51% respectively.
(3) Series D preferred shares have a dividend rate equal to the three-month Government of Canada treasury billyield plus 3.15%, with rate resets at the end of each calendar quarter.
Accumulated other comprehensive income (loss)
The amounts related to each component of accumulated other comprehensive income (loss) attributable toshareholders of Fairfax were as follows:
December 31, 2014 December 31, 2013
Income tax Income taxPre-tax (expense) After-tax Pre-tax (expense) After-tax
amount recovery amount amount recovery amount
Items that may be subsequently reclassified to netearnings:Currency translation account 5.5 (21.3) (15.8) 66.0 (7.2) 58.8Share of accumulated other comprehensive income
(loss) of associates, excluding gains (losses) ondefined benefit plans (83.3) 12.9 (70.4) (15.8) (1.9) (17.7)
(77.8) (8.4) (86.2) 50.2 (9.1) 41.1
Items that will not be subsequently reclassified tonet earnings:Share of gains (losses) on defined benefit plans
of associates (38.3) 10.5 (27.8) 12.5 (3.6) 8.9Gains (losses) on defined benefit plans (7.8) 3.7 (4.1) 36.2 (7.8) 28.4
(46.1) 14.2 (31.9) 48.7 (11.4) 37.3
Accumulated other comprehensive income (loss)attributable to shareholders of Fairfax (123.9) 5.8 (118.1) 98.9 (20.5) 78.4
75
FAIRFAX FINANCIAL HOLDINGS LIMITED
Other comprehensive income (loss)
The amounts related to each component of consolidated other comprehensive income (loss) for the years endedDecember 31 were as follows:
2014 2013
Income tax Income taxPre-tax (expense) After-tax Pre-tax (expense) After-tax
amount recovery amount amount recovery amount
Items that may be subsequently reclassified tonet earnings:Change in unrealized foreign currency translation
gains (losses) on foreign operations (186.6) (14.1) (200.7) (174.2) 9.8 (164.4)Change in gains on hedge of net investment in
Canadian subsidiaries 118.7 – 118.7 96.9 – 96.9Share of other comprehensive income (loss) of
associates, excluding gains (losses) on definedbenefit plans (67.5) 14.8 (52.7) (15.3) 2.4 (12.9)
(135.4) 0.7 (134.7) (92.6) 12.2 (80.4)
Items that will not be subsequently reclassified tonet earnings:Share of gains (losses) on defined benefit plans of
associates (50.8) 14.1 (36.7) 12.5 (3.6) 8.9Change in gains (losses) on defined benefit plans (44.6) 11.7 (32.9) 45.8 (14.5) 31.3
(95.4) 25.8 (69.6) 58.3 (18.1) 40.2
Other comprehensive income (loss) (230.8) 26.5 (204.3) (34.3) (5.9) (40.2)
Non-controlling interests
Year ended December 31, 2014
On September 3, 2014 Thomas Cook India increased its ownership interest in Sterling Resorts from 41.9% to 55.1%,pursuant to the transaction described in note 23, and recorded non-controlling interests of $74.1 on its consolidatedbalance sheet.
On May 21, 2014 Fairfax Asia acquired an 80.0% interest in Fairfax Indonesia, pursuant to the transaction describedin note 23, and recorded non-controlling interests of $1.0 on its consolidated balance sheet.
On February 4, 2014 the company acquired a 51.0% interest in The Keg, pursuant to the transaction described innote 23, and recorded non-controlling interests of $10.8 on its consolidated balance sheet.
Year ended December 31, 2013
In October 2013 the company contributed its 81.7% interest in Prime Restaurants to Cara Operations Limited,pursuant to the transaction described in note 23, and derecognized non-controlling interests in Prime Restaurants of$13.4 from its consolidated balance sheet.
In May 2013 the company acquired a 58.0% economic interest in IKYA, pursuant to the transaction described innote 23, and recorded non-controlling interests of $13.9 on its consolidated balance sheet.
In May 2013 Thomas Cook India completed a private placement of newly issued common shares to qualifiedinstitutional buyers (other than existing shareholders of Thomas Cook India), pursuant to the transaction describedin note 23, which reduced the company’s ownership of Thomas Cook India from 87.1% at December 31, 2012 to75.0% at December 31, 2013. The company recorded additional non-controlling interests in Thomas Cook India of$31.9 on its consolidated balance sheet as a result of the 12.1% change in the company’s ownership.
76
17. Earnings per Share
Net earnings (loss) per share is calculated in the following table based upon the weighted average common sharesoutstanding:
2014 2013
Net earnings (loss) attributable to shareholders of Fairfax 1,633.2 (573.4)Preferred share dividends (56.9) (60.8)Excess of book value over consideration of preferred shares purchased for
cancellation 0.5 –
Net earnings (loss) attributable to common shareholders – basic and diluted 1,576.8 (634.2)
Weighted average common shares outstanding – basic 21,186,325 20,360,251Share-based payment awards(1) 411,814 –
Weighted average common shares outstanding – diluted 21,598,139 20,360,251
Net earnings (loss) per common share – basic $ 74.43 $ (31.15)Net earnings (loss) per common share – diluted $ 73.01 $ (31.15)
(1) Anti-dilutive share-based payment awards of 313,898 were excluded from the calculation of net loss per diluted commonshare in 2013.
18. Income Taxes
The company’s provision for (recovery of) income taxes for the years ended December 31 was as follows:
2014 2013
Current income taxCurrent year expense 184.8 30.2Adjustments to prior years’ income taxes (33.2) (35.0)
151.6 (4.8)
Deferred income taxOrigination and reversal of temporary differences 514.2 (512.4)Adjustments to prior years’ deferred income taxes 8.8 77.2Other (1.3) 3.4
521.7 (431.8)
Provision for (recovery of) income taxes 673.3 (436.6)
A significant portion of the company’s earnings (loss) before income taxes is incurred outside of Canada. Thestatutory income tax rates for jurisdictions outside of Canada generally differs from the Canadian statutory incometax rate (and may be significantly higher or lower). The company’s earnings (loss) before income taxes by jurisdictionand the associated provision for (recovery of) income taxes for the years ended December 31, 2014 and 2013 aresummarized in the following table:
2014 2013
Canada U.S.(1) Other Total Canada U.S.(1) Other Total
Earnings (loss) before incometaxes 133.1 1,755.7 449.1 2,337.9 (114.6) (1,061.5) 175.0 (1,001.1)
Provision for (recovery of)income taxes 48.7 570.1 54.5 673.3 (8.7) (464.3) 36.4 (436.6)
Net earnings (loss) 84.4 1,185.6 394.6 1,664.6 (105.9) (597.2) 138.6 (564.5)
(1) Principally comprised of the U.S. Insurance and Reinsurance reporting segments (notwithstanding that certain operationsof OdysseyRe conduct business outside of the U.S.), U.S. Runoff and other associated holding company results.
77
FAIRFAX FINANCIAL HOLDINGS LIMITED
The increase in pre-tax profitability in the Canada, U.S. and Other in 2014 compared to 2013, primarily reflectedrealized and unrealized net investment gains and an improvement in underwriting results.
Reconciliations of the provision for (recovery of) income taxes calculated at the Canadian statutory income tax rateto the provision for (recovery of) income taxes at the effective tax rate in the consolidated financial statements forthe years ended December 31, 2014 and 2013 are summarized in the following table:
2014 2013
Canadian statutory income tax rate 26.5% 26.5%
Provision for (recovery of) income taxes at the Canadian statutory income tax rate 619.5 (265.3)Non-taxable investment income (109.2) (166.4)Tax rate differential on income and losses incurred outside Canada 121.8 (125.0)Recovery relating to prior years (17.4) (25.2)Change in unrecorded tax benefit of losses and temporary differences 24.4 107.7Foreign exchange 22.7 18.9Change in tax rate for deferred income taxes (10.9) 2.6Other including permanent differences 22.4 16.1
Provision for (recovery of) income taxes 673.3 (436.6)
Non-taxable investment income is principally comprised of dividend income, non-taxable interest income and the50% of net capital gains which are not taxable in Canada. In 2014 it also included a provision for income taxes of$38.0 following an internal reorganization of the U.S. shareholders of OdysseyRe (see note 25) that triggered therelease of taxable gains on intercompany transactions within the U.S. consolidated tax group that had been deferredin prior years.
The tax rate differential on income and losses incurred outside Canada of $121.8 in 2014 principally reflectedsignificant pre-tax net unrealized investment gains, combined with improved underwriting results in the U.S. Thetax rate differential on income and losses incurred outside Canada of $125.0 in 2013 principally reflected significantpre-tax net unrealized investment losses on bonds and equity hedges in the U.S. The statutory income tax rate in theU.S. is significantly higher than the Canadian statutory income tax rate.
The recovery relating to prior years of $17.4 in 2014 and $25.2 in 2013 was primarily due to the release of provisionsfollowing the completion of prior year income tax audits.
The change in unrecorded tax benefit of losses and temporary differences in 2014 was primarily comprised ofdeferred tax assets in Canada of $28.1 (2013 – $45.8) that were not recorded by the company because the relatedpre-tax losses did not meet the applicable recognition criteria under IFRS, and the de-recognition of $9.0 (2013 –$50.0) of U.S. foreign tax credits which had been recorded as deferred tax assets in prior years after determining thatit was no longer probable that those tax credits could be utilized prior to expiration.
Income taxes refundable and payable were as follows:
December 31, December 31,2014 2013
Income taxes refundable 51.1 114.1Income taxes payable (118.3) (80.1)
Net income taxes (payable) refundable (67.2) 34.0
78
Changes in net income taxes (payable) refundable during the years ended December 31 were as follows:
2014 2013
Balance – January 1 34.0 39.4Amounts recorded in the consolidated statements of earnings (151.6) 4.8Payments made (refunds received) during the year 52.3 (19.9)Acquisition of subsidiaries (5.1) 10.3Foreign exchange effect and other 3.2 (0.6)
Balance – December 31 (67.2) 34.0
The following table presents the gross movement in the net deferred income tax asset during the years endedDecember 31:
2014
ProvisionOperating for losses Provision Deferred
and and loss for premiumcapital adjustment unearned acquisition Intan- Invest- Tax
losses expenses premiums costs gibles ments credits Other Total
Balance – January 1, 2014 690.9 334.9 94.9 (82.1) (131.8) (42.3) 105.5 45.0 1,015.0Amounts recorded in the
consolidated statement ofearnings (213.3) (39.5) (5.3) (12.8) (1.3) (272.2) 8.2 14.5 (521.7)
Amounts recorded in totalequity – – – – – 0.8 (1.4) 25.8 25.2
Acquisition of subsidiary(note 23) 9.8 – 0.1 – (24.1) (25.0) – (10.2) (49.4)
Foreign exchange effect andother (7.7) (2.4) 0.1 (0.6) 1.9 (0.6) – 0.6 (8.7)
Balance – December 31, 2014 479.7 293.0 89.8 (95.5) (155.3) (339.3) 112.3 75.7 460.4
2013
ProvisionOperating for losses Provision Deferred
and and loss for premiumcapital adjustment unearned acquisition Intan- Invest- Tax
losses expenses premiums costs gibles ments credits Other Total
Balance – January 1, 2013 397.2 344.1 82.8 (68.5) (137.9) (239.8) 158.6 71.1 607.6Amounts recorded in the
consolidated statement ofearnings 304.9 (14.6) 7.3 (12.9) 17.0 193.1 (53.1) (9.9) 431.8
Amounts recorded in total equity – – – – – 8.0 – (18.0) (10.0)Acquisition of subsidiary
(note 23) 1.2 7.2 4.6 – (19.1) – – (0.4) (6.5)Foreign exchange effect and
other (12.4) (1.8) 0.2 (0.7) 8.2 (3.6) – 2.2 (7.9)
Balance – December 31, 2013 690.9 334.9 94.9 (82.1) (131.8) (42.3) 105.5 45.0 1,015.0
Management expects that the recorded deferred income tax asset will be realized in the normal course of operations.The most significant temporary differences included in the deferred income tax asset at December 31, 2014 related tooperating and capital losses and provision for losses and loss adjustment expenses. The provision for losses and lossadjustment expenses is recorded on an undiscounted basis in these consolidated financial statements but is recordedon a discounted basis in certain jurisdictions for tax purposes.
Management reviews the recoverability of the deferred income tax asset on an ongoing basis and adjusts, asnecessary, to reflect its anticipated realization. As at December 31, 2014 management has not recorded deferredincome tax assets of $464.8 (December 31, 2013 – $449.5) related primarily to operating and capital losses and
79
FAIRFAX FINANCIAL HOLDINGS LIMITED
U.S. foreign tax credits. The losses for which deferred income tax assets have not been recorded are comprised of$933.6 of losses in Canada (December 31, 2013 – $741.7), $412.6 of losses in Europe (December 31, 2013 – $485.9),$58.2 of losses in the U.S. (December 31, 2013 – $100.9), and $59.0 of foreign tax credits in the U.S. (December 31,2013 – $50.0). The losses in Canada expire between 2015 and 2034. The losses and foreign tax credits in theU.S. expire between 2020 and 2033. The losses in Europe do not have an expiry date.
Deferred income tax has not been recognized for the withholding tax and other taxes that could be payable on theunremitted earnings of certain subsidiaries. Unremitted earnings amounted to approximately $3.0 billion atDecember 31, 2014 (December 31, 2013 – $1.1 billion) and are not likely to be repatriated in the foreseeable future.
19. Statutory Requirements
The retained earnings of the company are largely represented by retained earnings at the insurance and reinsurancesubsidiaries. The insurance and reinsurance subsidiaries are subject to certain requirements and restrictions undertheir respective insurance company Acts including minimum capital requirements and dividend restrictions. Thecompany’s capital requirements and management thereof are discussed in note 24. The company’s share ofdividends paid in 2014 by the subsidiaries, comprised of cash and marketable securities, which are eliminated onconsolidation was $605.8 (2013 – $361.4), inclusive of $250.0 of dividends received in connection with theOdysseyRe reorganization described in note 25. Based on the surplus and net income of the subsidiaries atDecember 31, 2014 the company has access to dividend capacity for dividend payment during 2015 at each of itsprimary operating companies as follows:
December 31,2014
Northbridge(1) 191.3Crum & Forster 68.3Zenith National 110.7OdysseyRe 324.9
695.2
(1) Subject to prior regulatory approval.
20. Contingencies and Commitments
Lawsuits
On July 26, 2006 Fairfax filed a lawsuit seeking $6 billion in damages from a number of defendants who, thecomplaint (as subsequently amended) alleges, participated in a stock market manipulation scheme involving Fairfaxshares. The complaint, filed in Superior Court, Morris County, New Jersey, alleges violations of various state laws,including the New Jersey Racketeer Influenced and Corrupt Organizations Act, pursuant to which treble damagesmay be available. On September 12, 2012, before trial, and consequently without having heard or made anydetermination on the facts, the Court dismissed the lawsuit on legal grounds. In October 2012 Fairfax filed an appealof this dismissal, as it believes that the legal basis for the dismissal is incorrect. By the end of 2013, the briefs of allparties in connection with this appeal had been filed. The ultimate outcome of any litigation is uncertain. Thefinancial effects, if any, of this lawsuit cannot be practicably determined at this time, and the company’sconsolidated financial statements include no anticipated recovery from the lawsuit.
Other
The Autorite des marches financiers, the securities regulatory authority in the Province of Quebec (the ‘‘AMF’’), isconducting an investigation of Fairfax, its CEO, Prem Watsa, and its President, Paul Rivett. The investigationconcerns the possibility of illegal insider trading and/or tipping (not involving any personal trading by theindividuals) in connection with a Quebec transaction. Further details concerning the investigation are, by law, notpermitted to be disclosed. Fairfax and these officers are fully cooperating with the investigation and they are notaware of any reasonable basis for any legal proceedings against them. However, if the AMF commences legalproceedings, no assurance can be given at this time by Fairfax as to the outcome.
80
Subsidiaries of the company are defendants in several damage suits and have been named as third party in othersuits. The uninsured exposure to the company is not considered to be material to the company’s financial position,financial performance or cash flows.
OdysseyRe, Advent and RiverStone (UK) (‘‘the Lloyd’s participants’’) participate in Lloyd’s through their 100%ownership of certain Lloyd’s syndicates. The Lloyd’s participants have pledged securities and cash, with a fair value of$591.9 and $10.7 respectively as at December 31, 2014, in deposit trust accounts in favour of Lloyd’s based on certainminimum amounts required to support the liabilities of the syndicates as determined under the risk-based capitalmodels and on approval by Lloyd’s. Pledged securities and restricted cash consist primarily of bonds and subsidiarycash and short term investments respectively, included within portfolio investments on the consolidated balancesheet. The Lloyd’s participants have the ability to substitute other securities for these securities subject to certainadmissibility criteria. These pledged assets effectively secure the contingent obligations of the Lloyd’s syndicatesshould they not meet their obligations. The Lloyd’s participants’ contingent liability to Lloyd’s is limited to theaggregate amount of the pledged assets and their obligation to support these liabilities will continue until suchliabilities are settled or are reinsured by a third party approved by Lloyd’s. The company believes that the syndicatesfor which the Lloyd’s participants are capital providers maintain sufficient liquidity and financial resources tosupport their ultimate liabilities and does not anticipate that the pledged assets will be utilized.
The company’s maximum capital commitments for potential investments in common stocks, limited partnershipsand associates at December 31, 2014 totaled $474.3.
21. Pensions and Post Retirement Benefits
The company’s subsidiaries have a number of arrangements primarily in Canada, the United States, and theUnited Kingdom that provide pension and post retirement benefits to retired and current employees. The holdingcompany has no such arrangements or plans. Pension arrangements of the subsidiaries include defined benefitstatutory pension plans, as well as supplemental arrangements that provide pension benefits in excess of statutorylimits. These plans are a combination of defined benefit plans and defined contribution plans.
In addition to actuarial valuations for accounting purposes, subsidiaries of the company are required to preparefunding valuations to determine the amount of their pension contributions. All of the defined benefit pension planshave had funding valuations performed within the past two years.
The investment policy for the defined benefit pension plans is to invest prudently in order to preserve theinvestment asset value of the plans while seeking to maximize the return on those invested assets. The plans’ assets asof December 31, 2014 and 2013 were invested principally in high quality fixed income securities and cash and shortterm investments.
Defined benefit pension plan assets at December 31, and the company’s use of Level 1, Level 2 and Level 3 inputs(as described in note 3) in the valuation of those assets, were as follows:
December 31, 2014 December 31, 2013
Total Significant Total Significantfair other Significant fair other Significant
value Quoted observable unobservable value Quoted observable unobservableof plan prices inputs inputs of plan prices inputs inputs
assets (Level 1) (Level 2) (Level 3) assets (Level 1) (Level 2) (Level 3)
Equity instruments 198.5 183.2 15.3 – 218.3 215.0 3.3 –Fixed income securities 246.1 97.8 135.5 12.8 172.9 85.2 87.7 –Cash and short term investments 122.2 122.2 – – 143.8 143.8 – –
566.8 403.2 150.8 12.8 535.0 444.0 91.0 –
81
FAIRFAX FINANCIAL HOLDINGS LIMITED
The following tables set forth the funded status of the company’s benefit plans along with amounts recognized in thecompany’s consolidated financial statements for both defined benefit pension plans and post retirement benefitplans as at and for the years ended December 31.
Defined benefit Post retirementpension plans benefit plans
2014 2013 2014 2013
Change in benefit obligationBalance – January 1 579.4 580.0 76.0 79.3
Cost of benefits earned in the year 18.2 21.3 4.8 5.4Interest cost on benefit obligation 25.7 23.2 3.4 3.1Actuarial (gain) loss – participant experience 1.3 11.8 (1.9) (7.5)Actuarial loss – change in demographic assumptions 18.6 9.7 5.5 0.8Actuarial (gain) loss – change in financial assumptions 49.9 (33.0) 4.1 (3.2)Benefits paid (21.6) (18.7) (4.8) (2.8)Plan amendments 0.2 0.1 (0.2) –Curtailment – – 0.9 2.1Business acquisition – – 4.5 –Change in foreign currency exchange rates (31.7) (15.0) (1.4) (1.2)
Balance – December 31 640.0 579.4 90.9 76.0
Change in fair value of plan assetsBalance – January 1 535.0 502.4 – –
Interest income on plan assets 24.1 20.3 – –Actuarial gain 33.0 25.7 – –Plan administration expense (0.7) (0.6) – –Company contributions 29.4 20.7 4.7 2.7Plan participant contributions – – 0.1 0.1Benefits paid (21.6) (18.7) (4.8) (2.8)Change in foreign currency exchange rates (32.4) (14.8) – –
Balance – December 31 566.8 535.0 – –
Funded status of plans – deficit (73.2) (44.4) (90.9) (76.0)Impact of asset ceiling (1.4) (1.3) – –
Net accrued liability (74.6) (45.7) (90.9) (76.0)
Amounts recognized in the consolidated balance sheet atDecember 31
Other assets 33.1 45.2 – –Accounts payable and accrued liabilities (107.7) (90.9) (90.9) (76.0)
Net accrued liability (74.6) (45.7) (90.9) (76.0)
Weighted average assumptions used to determine benefitobligations
Discount rate 4.1% 4.6% 4.2% 4.5%Rate of compensation increase 3.5% 3.6% 3.7% 4.0%Assumed overall health care cost trend – – 7.2% 7.6%
82
The company’s pension and post retirement expense for the years ended December 31 is comprised of the following:
Defined benefit Post retirementpension plans benefit plans
2014 2013 2014 2013
Defined benefit pension and post retirement expense:Cost of benefits earned in the year, net of employee contributions 18.2 21.3 4.7 5.3Net interest expense 1.6 2.9 3.4 3.1Plan administration expense 0.7 0.6 – –Plan amendments 0.2 0.1 (0.2) –Curtailment and settlement – – 0.9 2.1
Total benefit expense recognized in the consolidated statement ofearnings 20.7 24.9 8.8 10.5
Defined contribution benefit expense 24.1 21.9 – –
44.8 46.8 8.8 10.5
The sensitivity of the defined benefit obligations to changes in key assumptions at December 31, 2014 are presentedbelow on a weighted average basis. This analysis was performed on each individual defined benefit plan using thesame methodology that was applied to determine the benefit obligation recognized in the consolidated balancesheet, while holding all other assumptions constant.
Impact on accumulatedbenefit obligationincrease (decrease)
2014 2013
Change in Increase in Decrease in Increase in Decrease inassumption assumption assumption assumption assumption
Defined benefit pension plansDiscount rate 0.5% (55.2) 61.9 (48.5) 53.8Rate of compensation increase 0.5% 11.4 (11.0) 9.7 (9.3)
Post retirement benefit plansDiscount rate 0.5% (6.8) 7.7 (5.3) 5.9Health care cost trend rate 1.0% 14.9 (11.9) 9.7 (7.9)
The assumed annual rate of increase in the per capita cost of covered benefits (i.e. health care cost trend rate) is 7.2%in 2015, decreasing to 4.6% by 2025 calculated on a weighted average basis.
During 2014 the company contributed $34.1 (2013 – $23.4) to its defined benefit pension and post retirementbenefit plans. Based on the company’s current expectations, the 2015 contributions to its defined benefit pensionplans and post retirement benefit plans will be approximately $22.9 and $2.9 respectively.
22. Operating Leases
Aggregate future minimum commitments at December 31, 2014 under operating leases relating to premises,automobiles and equipment for various terms up to ten years were as follows:
2015 98.62016 86.82017 75.72018 69.22019 62.8Thereafter 195.0
83
FAIRFAX FINANCIAL HOLDINGS LIMITED
23. Acquisitions and Divestitures
Subsequent to December 31, 2014
Acquisition of Brit PLC
On February 16, 2015 the company announced that it had reached an agreement with the board of directors ofBrit PLC (‘‘Brit’’) regarding the terms of a recommended cash offer to acquire all of the outstanding shares of Brit(the ‘‘Brit Offer’’) for a total price of 305 pence per share, comprising 280 pence in cash to be paid by the companyand Brit’s announced 2014 final and special dividends of 25 pence (the ‘‘Brit Offer Price’’). The aggregate purchaseprice for the Brit Offer is approximately $1.88 billion (£1.22 billion). The Brit Offer is subject to customary closingconditions, including customary competition and merger conditions and other regulatory approvals as required. Britis a market-leading global Lloyd’s of London specialty insurer and reinsurer.
The net proceeds from underwritten public offerings (described in more detail in notes 15 and 16) of 1.15 millionsubordinate voting shares ($575.9), 9.2 million Series M preferred shares ($179.0) and Cdn$350.0 of 4.95% Fairfaxsenior notes due 2025 ($275.7), all of which closed on March 3, 2015, will be used to finance the Brit Offer.
Investment in Fairfax India Holdings Corporation
On January 30, 2015 the company, through subsidiaries, acquired 30,000,000 multiple voting shares of Fairfax IndiaHoldings Corporation (‘‘Fairfax India’’) for $300.0 through a private placement. These multiple voting sharesrepresented approximately 95.2% of the voting rights and 28.3% of the equity interest in Fairfax India upon theclosing of its offerings (inclusive of the over-allotment of subordinate voting shares that closed on February 10,2015). Fairfax India was established, with the support of Fairfax, to invest in public and private equity securities anddebt instruments in India and Indian businesses or other businesses primarily conducted in or dependent on India.Hamblin Watsa is the portfolio advisor to Fairfax India and its subsidiaries. Fairfax India will be included in thecompany’s consolidated financial reporting commencing in the first quarter of 2015.
Acquisition of Union Assurance General Limited
On January 1, 2015 the company acquired 78% of Union Assurance General Limited (‘‘Union Assurance’’) for cashconsideration of $26.8 (3.5 billion Sri Lankan rupees). Union Assurance is headquartered in Colombo, Sri Lanka andunderwrites general insurance in Sri Lanka, specializing in automobile and personal accident lines of business andwriting approximately $41 of gross premiums written in 2013.
Acquisition of Eastern European Insurers
On December 16, 2014 the company entered into an agreement with QBE Insurance (Europe) Limited (‘‘QBE’’) toacquire QBE’s insurance operations in the Czech Republic, Hungary and Slovakia. The existing businesses andrenewal rights of QBE’s operations in the Czech Republic, Hungary and Slovakia are expected to be transferred toFairfax by the third quarter of 2015, subject to customary closing conditions, including various regulatory approvals.In QBE’s most recent fiscal year, its operations in the Czech Republic, Hungary and Slovakia generated over $40 ingross premiums written across a range of general insurance classes, including property, travel, general liability andproduct protection. On February 3, 2015 the company also entered into an agreement to acquire QBE’s generalinsurance operations in Ukraine, which generated over $5 of gross premiums written in 2014.
Acquisition of MCIS Insurance Berhad
On December 1, 2014 the company entered into an agreement to acquire the general insurance business of MCISInsurance Berhad (formerly known as MCIS Zurich Insurance Berhad) (‘‘MCIS’’) through its wholly-ownedsubsidiary Pacific Insurance. The transaction is subject to customary closing conditions, including Malaysian courtapproval, and is expected to close in the first quarter of 2015. MCIS is an established general insurer in Malaysia withover $55 of gross premiums written in 2013 in its general insurance business.
84
Year ended December 31, 2014
Acquisition of Pethealth Inc.
On November 14, 2014 the company acquired all of the outstanding common shares, preferred shares and employeeshare options of Pethealth Inc. (‘‘Pethealth’’) for cash consideration of $88.7 (Cdn$100.4). The goodwill andintangible assets associated with Pethealth’s marketing of pet medical insurance were allocated to the Crum & Forster($90.9, comprised of $39.4 of goodwill, $47.3 of customer relationships and $4.2 of computer software) andNorthbridge ($17.3, comprised of $8.3 of goodwill, $8.0 of customer relationships and $1.0 of computer software)reporting segments since Crum & Forster and Northbridge were to become Pethealth’s ongoing insurance carriers.Pethealth’s residual assets and liabilities and results of operations were consolidated in the Other reporting segment.Pethealth is headquartered in Canada and provides pet medical insurance, related management software andpet-related database management services in North America and the United Kingdom.
Acquisition of Sterling Holiday Resorts (India) Limited
During the first half of 2014 Thomas Cook India acquired a 41.9% ownership interest in Sterling Holiday Resorts(India) Limited (‘‘Sterling Resorts’’) for cash purchase consideration of $57.4 (3,534.6 million Indian rupees), andclassified its investment as an associate. On September 3, 2014 Thomas Cook India increased its ownership interest to55.1% by acquiring additional common shares of Sterling Resorts for cash consideration of $19.2 (1,162.6 millionIndian rupees). Having obtained control, Thomas Cook India was required to re-measure its existing ownershipinterest in Sterling Resorts at fair value as of September 3, 2014, resulting in the recognition of a one-time non-cashgain of $41.2 in net gains on investments in the consolidated statement of earnings, representing the differencebetween the fair value of the previously held interest in Sterling Resorts and its carrying value under the equitymethod of accounting. The acquisition of Sterling Resorts was financed internally by subsidiaries of Fairfax. Theassets and liabilities and results of operations of Sterling Resorts were consolidated within the Other reportingsegment. Goodwill and intangible assets was comprised of $69.2 of goodwill and $0.4 of computer software. SterlingResorts is engaged in vacation ownership and leisure hospitality and operates a network of resorts in India. Fairfax’seconomic interest in Sterling Resorts at December 31, 2014 was 40.2% since that interest is held through 73.0%-owned Thomas Cook India.
Acquisition of Praktiker Hellas Commercial Societe Anonyme
On June 5, 2014 Fairfax completed the acquisition of a 100% interest in Praktiker Hellas Commercial SocieteAnonyme (‘‘Praktiker’’) for cash purchase consideration of $28.6 (A21.0 million). The assets and liabilities and resultsof operations of Praktiker were consolidated in the Other reporting segment. Praktiker is one of the largest homeimprovement and do-it-yourself goods retailers in Greece, operating 14 stores.
Acquisition of PT Batavia Mitratama Insurance
On May 21, 2014 Fairfax Asia completed the acquisition of an 80.0% interest in PT Batavia Mitratama Insurance(subsequently renamed PT Fairfax Insurance Indonesia (‘‘Fairfax Indonesia’’)) for cash purchase consideration of$8.5 (98.2 billion Indonesian rupees). Subsequent to the acquisition, Fairfax Asia contributed an additional $12.9 toFairfax Indonesia (maintaining its 80.0% interest) to support business expansion. The assets and liabilities andresults of operations of Fairfax Indonesia were consolidated in the Insurance – Fairfax Asia reporting segment. FairfaxIndonesia is headquartered in Jakarta, Indonesia and underwrites general insurance, specializing in automobilecoverage in Indonesia.
Acquisition of Keg Restaurants Limited
On February 4, 2014 the company completed the acquisition of 51.0% of the outstanding common shares of KegRestaurants Limited (‘‘The Keg’’) for cash purchase consideration of $76.7 (Cdn$85.0). The assets and liabilities andresults of operations of The Keg were consolidated in the Other reporting segment. Goodwill and intangible assetswas comprised of $65.4 of goodwill and $0.1 of computer software The Keg franchises, owns and operates a networkof premium dining restaurants across Canada and in select locations in the United States.
85
FAIRFAX FINANCIAL HOLDINGS LIMITED
The identifiable assets acquired and liabilities assumed in connection with the significant acquisitions describedabove are summarized in the table below.
Pethealth Sterling Resorts The Keg
Acquisition date November 14, 2014 September 3, 2014 February 4, 2014Percentage of common shares acquired 100.0% 40.2%(3) 51.0%Assets:
Portfolio investments(1) 10.7 19.1 126.0Goodwill and intangible assets 108.2(2) 69.6(4) 65.5Other assets 7.7 176.3 78.9
126.6 265.0 270.4
Liabilities:Accounts payable and accrued liabilities 19.9 52.8 76.7Deferred income taxes 18.0(2) 17.0 20.1Long term debt – 2.1 86.1
37.9 71.9 182.9Non-controlling interests – 74.1 10.8Purchase consideration 88.7 119.0 76.7
126.6 265.0 270.4
(1) Included in the carrying value of the acquired portfolio investments of Pethealth, Sterling Resorts and The Keg were $10.7,$0.5 and $24.8 respectively of subsidiary cash and cash equivalents.
(2) For segment reporting, goodwill and intangible assets, and the related deferred income taxes, associated with Pethealthhave been allocated to Crum & Forster ($90.9 and $18.0 respectively) and Northbridge ($17.3 and $2.4 respectively).
(3) Fairfax’s 40.2% economic interest in Sterling Resorts as a result of acquiring a 55.1% interest in Sterling Resorts through73.0%-owned Thomas Cook India.
(4) Preliminary goodwill on the acquisition of Sterling Resorts was partially comprised of additional non-cash purchaseconsideration of $41.2 arising on the re-measurement to fair value of the previously held equity accounted interest.
The determination of the fair value of assets and liabilities of the acquired subsidiaries described in the paragraphsabove are preliminary and may be revised when estimates and assumptions and the valuations of assets and liabilitiesare finalized within twelve months of the respective acquisition dates.
Year ended December 31, 2013
Disposition of Prime Restaurants Inc.
On October 31, 2013 the company contributed its 81.7% interest in Prime Restaurants Inc. (‘‘Prime Restaurants’’) toCara Operations Limited (‘‘Cara’’) in exchange for Cara preferred shares and equity warrants with a combined fairvalue of $54.5 (Cdn$56.9). Subsequently, the company determined that it no longer controlled Prime Restaurantsand de-consolidated Prime Restaurants from its consolidated financial reporting effective October 31, 2013, resultingin the recognition of a loss on disposition of $4.2 (Cdn$4.4) in 2013. In addition, the company made a cashcontribution of $95.9 (Cdn$100.0) to Cara in exchange for Cara preferred shares, subordinated debt and equitywarrants. The company’s investment in Cara equity warrants represents potential voting interests of approximately39.4% (equity warrants currently exercisable) and 48.5% (inclusive of equity warrants exercisable in two years)assuming all holders of Cara convertible securities (including those owned by the company) exercised their optionsto convert. The company determined that it had obtained significant influence over Cara effective October 31, 2013but as the company did not hold any Cara common shares, the equity method of accounting could not be applied.The Cara preferred shares, subordinated debt and equity warrants are recorded as at FVTPL investments in holdingcompany cash and investments and portfolio investments on the consolidated balance sheet.
86
Acquisition of American Safety Insurance Holdings, Ltd.
On October 3, 2013 the company acquired all of the outstanding common shares of American Safety InsuranceHoldings, Ltd. (‘‘American Safety’’) for $30.25 per share in cash, representing aggregate purchase consideration of$317.1. On October 8, 2013 the company sold American Safety’s Bermuda-based reinsurance subsidiary (‘‘AS Re’’) toan unrelated third party for net proceeds of $52.5. The renewal rights to certain lines of business formerly written byAmerican Safety were assumed by Crum & Forster and Hudson Insurance representing estimated annual grosspremiums written of $103. The remainder of American Safety’s lines of business which did not meet Fairfax’sunderwriting criteria were placed into runoff under the supervision of the RiverStone group. The purchaseconsideration for this acquisition was financed internally by the company’s runoff subsidiaries, Crum & Forster andHudson Insurance and was partially defrayed by the proceeds received on the sale of AS Re ($52.5) and the receipt of apost-acquisition dividend of excess capital paid by American Safety ($123.7). Goodwill and intangible assets wascomprised of $34.4 of goodwill and $24.5 of renewal rights. American Safety, a Bermuda-based holding company,underwrote specialty risks through its U.S.-based program administrator, American Safety Insurance Services, Inc.,and its U.S. insurance and Bermuda reinsurance companies.
Acquisition of Hartville Group, Inc.
On July 3, 2013 Crum & Forster acquired a 100% interest in Hartville Group, Inc. (‘‘Hartville’’) for cash purchaseconsideration of $34.0. The assets and liabilities and results of operations of Hartville were consolidated in theU.S. Insurance reporting segment. Goodwill and intangible assets was comprised of $21.2 of goodwill and $7.0related to an operating license. Hartville markets and administers pet health insurance plans (including enrollment,claims, billing and customer service) and produces approximately $40 of gross premiums written annually.
Acquisition of IKYA Human Capital Solutions Private Limited
On May 14, 2013 Thomas Cook India acquired a 77.3% interest in IKYA Human Capital Solutions Private Limited(‘‘IKYA’’) for purchase consideration of $46.8 (2,563.2 million Indian rupees). The assets and liabilities and results ofoperations of IKYA were consolidated in the Other reporting segment. Goodwill and intangible assets was comprisedof $27.6 of goodwill, $14.2 of customer relationships, $10.6 of brand names and $0.2 of computer software. Theidentifiable assets acquired and liabilities assumed represented Fairfax’s 58.0% economic interest in IKYA as a resultof acquiring IKYA through 75.0%-owned Thomas Cook India. IKYA provides specialized human resources services toleading corporate clients in India.
Private Placement of Thomas Cook India Common Shares
On May 7, 2013 Thomas Cook India completed a private placement of 34,379,606 newly issued common shares at53.50 Indian rupees per share to qualified institutional buyers (other than existing shareholders of Thomas CookIndia) and received net proceeds of $32.9 (1,780.5 million Indian rupees) after expenses. The proceeds were used topartially finance the acquisition of IKYA as described in the preceding paragraph. This transaction reduced thecompany’s ownership of Thomas Cook India from 87.1% at December 31, 2012 to 75.0%, thereby satisfyingsecurities regulations in India stipulating that the company reduce its ownership interest in Thomas Cook India to75.0% or less by August 2013.
87
FAIRFAX FINANCIAL HOLDINGS LIMITED
The identifiable assets acquired and liabilities assumed in connection with the acquisitions described above aresummarized in the table below.
American Safety Hartville IKYA
Acquisition date October 3, 2013 July 3, 2013 May 14, 2013Percentage of common shares acquired 100.0% 100.0% 58.0%(1)
Assets:Insurance contract receivables 21.5 11.9 –Portfolio investments(2) 765.9 4.9 2.1Recoverable from reinsurers 220.0 – –Deferred income taxes 3.8 – –Goodwill and intangible assets 58.9 28.2 52.6Asset held for sale(3) 52.5 – –Other assets 10.8 0.9 52.5
1,133.4 45.9 107.2
Liabilities:Subsidiary indebtedness – – 8.0Accounts payable and accrued liabilities 69.7 3.8 31.0Deferred income taxes – – 7.5Funds withheld payable to reinsurers 58.9 – –Insurance contract liabilities 652.2 8.1 –Long term debt(4) 35.5 – –
816.3 11.9 46.5Non-controlling interests – – 13.9Purchase consideration 317.1 34.0 46.8
1,133.4 45.9 107.2
(1) Fairfax’s 58.0% economic interest in IKYA as a result of acquiring a 77.3% interest in IKYA through 75.0%-ownedThomas Cook India.
(2) Included in the carrying value of the acquired portfolio investments of American Safety, Hartville and IKYA were $485.7,$4.9 and $2.1 respectively of subsidiary unrestricted cash and cash equivalents.
(3) Asset held for sale was comprised of the fair value of the net assets of American Safety’s Bermuda-based reinsurancesubsidiary sold to an unrelated third party on October 8, 2013 for net proceeds of $52.5.
(4) Subsequent to the acquisition American Safety repaid $13.0 principal amount of its trust preferred securities for cashconsideration of $13.4 as described in note 15.
24. Financial Risk Management
Overview
The primary goals of the company’s financial risk management are to ensure that the outcomes of activitiesinvolving elements of risk are consistent with the company’s objectives and risk tolerance, while maintaining anappropriate balance between risk and reward and protecting the company’s consolidated balance sheet from eventsthat have the potential to materially impair its financial strength. The company’s exposure to potential loss from itsinsurance and reinsurance operations and investment activities primarily relates to underwriting risk, credit risk,liquidity risk and various market risks. Balancing risk and reward is achieved through identifying risk appropriately,aligning risk tolerances with business strategy, diversifying risk, pricing appropriately for risk, mitigating riskthrough preventive controls and transferring risk to third parties. There were no significant changes in the types ofthe company’s risk exposures or the processes used by the company for managing those risk exposures atDecember 31, 2014 compared to those identified at December 31, 2013, except as discussed below.
88
Financial risk management objectives are achieved through a two tiered system, with detailed risk managementprocesses and procedures at the company’s primary operating subsidiaries and its investment managementsubsidiary combined with the analysis of the company-wide aggregation and accumulation of risks at the holdingcompany level. In addition, although the company and its operating subsidiaries have designated Chief RiskOfficers, the company regards each Chief Executive Officer as the chief risk officer of his or her company: each ChiefExecutive Officer is the individual ultimately responsible for risk management for his or her company and itssubsidiaries.
The company’s designated Chief Risk Officer reports on risk considerations to Fairfax’s Executive Committee andprovides a quarterly report to the Board of Directors on the key risk exposures. Management of Fairfax inconsultation with the designated Chief Risk Officer approves certain policies for overall risk management, as well aspolicies addressing specific areas such as investments, underwriting, catastrophe risk and reinsurance. TheInvestment Committee approves policies for the management of market risk (including currency risk, interest raterisk and other price risk) and the use of derivative and non-derivative financial instruments, and monitors to ensurecompliance with relevant regulatory guidelines and requirements. A discussion of the risks of the business (the riskfactors and the management of those risks) is an agenda item for every regularly scheduled meeting of the Boardof Directors.
Underwriting Risk
Underwriting risk is the risk that the total cost of claims, claims adjustment expenses and premium acquisitionexpenses will exceed premiums received and can arise as a result of numerous factors, including pricing risk,reserving risk and catastrophe risk. There were no significant changes to the company’s exposure to underwriting riskor the framework used to monitor, evaluate and manage underwriting risk at December 31, 2014 compared toDecember 31, 2013.
Pricing risk arises because actual claims experience can differ adversely from the assumptions included in pricingcalculations. Historically the underwriting results of the property and casualty industry have fluctuated significantlydue to the cyclicality of the insurance market. The market cycle is affected by the frequency and severity of losses,levels of capacity and demand, general economic conditions and competition on rates and terms of coverage. Theoperating companies focus on profitable underwriting using a combination of experienced underwriting andactuarial staff, pricing models and price adequacy monitoring tools.
Reserving risk arises because actual claims experience can differ adversely from the assumptions included in settingreserves, in large part due to the length of time between the occurrence of a loss, the reporting of the loss to theinsurer and the ultimate resolution of the claim. Claims provisions reflect expectations of the ultimate cost ofresolution and administration of claims based on an assessment of facts and circumstances then known, a review ofhistorical settlement patterns, estimates of trends in claims severity and frequency, legal theories of liability andother factors.
Variables in the reserve estimation process can be affected by both internal and external factors, such as trendsrelating to jury awards, economic inflation, medical inflation, worldwide economic conditions, tort reforms, courtinterpretations of coverage, the regulatory environment, underlying policy pricing, claims handling procedures,inclusion of exposures not contemplated at the time of policy inception and significant changes in severity orfrequency of losses relative to historical trends. Due to the amount of time between the occurrence of a loss, theactual reporting of the loss and the ultimate payment for the loss, provisions may ultimately develop differentlyfrom the actuarial assumptions made when initially estimating the provision for claims. The company’s provision forclaims is reviewed separately by, and must be acceptable to, internal actuaries at each operating company, the ChiefRisk Officer at Fairfax and one or more independent actuaries.
Catastrophe risk arises because property and casualty insurance companies may be exposed to large losses arisingfrom man-made or natural catastrophes that could result in significant underwriting losses. The company evaluatespotential catastrophic events and assesses the probability of occurrence and magnitude of these eventspredominantly through probable maximum loss (‘‘PML’’) modeling techniques and through the aggregation oflimits exposed. A wide range of events are simulated using the company’s proprietary and commercial models,including single large events and multiple events spanning the numerous geographic regions in which the companyoperates.
89
FAIRFAX FINANCIAL HOLDINGS LIMITED
Each of the operating companies has developed and applies strict underwriting guidelines for the amount ofcatastrophe exposure it may assume as a standalone entity for any one risk and location. Those guidelines areregularly monitored and updated by the operating companies. Each of the operating companies also managescatastrophe exposure by diversifying risk across geographic regions, catastrophe types and other lines of business,factoring in levels of reinsurance protection, adjusting the amount of business written based on capital levels andadhering to risk tolerances. The company’s head office aggregates catastrophe exposure company-wide andcontinually monitors the group exposure. The independent exposure limits for each entity in the group areaggregated to produce an exposure limit for the group as there is currently no model capable of simultaneouslyprojecting the magnitude and probability of loss in all geographic regions in which the company operates. Currentlythe company’s objective is to limit its company-wide catastrophe loss exposure such that one year’s aggregate pre-taxnet catastrophe losses would not exceed one year’s normalized net earnings before income taxes. The company takesa long term view and generally considers a 15% return on common shareholders’ equity, adjusted to a pre-tax basis,to be representative of one year’s normalized net earnings. The modeled probability of aggregate catastrophe losses inany one year exceeding this amount is generally more than once in every 250 years.
To manage its exposure to underwriting risk, and the pricing, reserving and catastrophe risks contained therein, thecompany’s operating companies have established limits for underwriting authority and the requirement for specificapprovals for transactions involving new products or for transactions involving existing products which exceedcertain limits of size or complexity. The company’s objective of operating with a prudent and stable underwritingphilosophy with sound reserving is also achieved through establishment of goals, delegation of authorities, financialmonitoring, underwriting reviews and remedial actions to facilitate continuous improvement. The companypurchases reinsurance protection for risks assumed when it is considered prudent and cost effective to do so, at theoperating company level for specific exposures and, if needed, at the holding company level for aggregate exposures.The company also actively takes steps to reduce the volume of insurance and reinsurance underwritten on particulartypes of risks when it desires to reduce its direct exposure due to inadequate pricing.
As part of its overall risk management strategy, the company cedes insurance risk through proportional,non-proportional and facultative reinsurance treaties. With proportional reinsurance, the reinsurer shares a pro rataportion of the company’s losses and premium, whereas with non-proportional reinsurance, the reinsurer assumespayment of the company’s loss above a specified retention, subject to a limit. Facultative reinsurance is thereinsurance of individual risks as agreed by the company and the reinsurer.
The following summarizes the company’s principal lines of business and the significant insurance risks inherenttherein:
• Property, which insures against losses to property from (among other things) fire, explosion, natural perils(for example earthquake, windstorm and flood), terrorism and engineering problems (for example, boilerexplosion, machinery breakdown and construction defects). Specific types of property risks underwritten bythe company include automobile, commercial and personal property and crop;
• Casualty, which insures against accidents (including workers’ compensation and automobile) and alsoincludes employers’ liability, accident and health, medical malpractice, and umbrella coverage;
• Specialty, which insures against marine, aerospace and surety risk, and other miscellaneous risks and liabilitiesthat are not identified above; and
• Reinsurance which includes, but is not limited to, property, casualty and liability exposures.
An analysis of revenue by line of business is included in note 25.
90
The table below shows the company’s concentration of risk by region and line of business based on gross premiumswritten prior to giving effect to ceded reinsurance premiums. The company’s exposure to general insurance riskvaries by geographic region and may change over time. Premiums ceded to reinsurers (including retrocessions) byline of business amounted to $400.1 for property (2013 – $427.3), $539.1 for casualty (2013 – $575.9) and $218.9 forspecialty (2013 – $187.7) for the year ended December 31, 2014.
Canada United States Asia(1) International(2) Total
For the years endedDecember 31 2014 2013 2014 2013 2014 2013 2014 2013 2014 2013
Property 560.9 573.3 1,173.5 1,238.9 405.7 351.6 448.5 525.7 2,588.6 2,689.5Casualty 516.0 552.3 2,805.9 2,548.3 268.0 237.1 490.0 416.2 4,079.9 3,753.9Specialty 113.1 118.2 211.0 197.3 247.8 244.7 219.5 223.5 791.4 783.7
Total 1,190.0 1,243.8 4,190.4 3,984.5 921.5 833.4 1,158.0 1,165.4 7,459.9 7,227.1
Insurance 1,120.7 1,164.7 3,426.0 3,148.0 404.3 398.2 371.9 368.0 5,322.9 5,078.9Reinsurance 69.3 79.1 764.4 836.5 517.2 435.2 786.1 797.4 2,137.0 2,148.2
1,190.0 1,243.8 4,190.4 3,984.5 921.5 833.4 1,158.0 1,165.4 7,459.9 7,227.1
(1) The Asia geographic segment comprises countries located throughout Asia including China, India, the Middle East,Malaysia, Singapore, Indonesia and Thailand.
(2) The International geographic segment comprises Australia and countries located in Africa, Europe and South America.
The table below shows the sensitivity of earnings from operations before income taxes and total equity after givingeffect to a one percentage point increase in the loss ratio. The loss ratio is regarded as an additional GAAP measureand is calculated by the company with respect to its ongoing insurance and reinsurance operations as losses onclaims (including losses and loss adjustment expenses) expressed as a percentage of net premiums earned. Such anincrease could arise from higher frequency of losses, increased severity of losses, or from a combination of both. Thesensitivity analysis presented below does not consider the probability of such changes to loss frequency or severityoccurring or any non-linear effects of reinsurance and as a result, each additional percentage point increase in theloss ratio would result in a linear impact on earnings from operations before income taxes and total equity. Inpractice, the company monitors insurance risk by evaluating extreme scenarios with models which consider thenon-linear effects of reinsurance.
Insurance andInsurance Reinsurance Reinsurance
Northbridge U.S. Fairfax Asia OdysseyRe Other
For the years ended December 31 2014 2013 2014 2013 2014 2013 2014 2013 2014 2013
Impact of +1% increase in loss ratio on:Earnings from operations before income taxes 9.4 9.9 20.2 19.3 2.7 2.6 23.6 23.7 3.9 4.4Total equity 6.9 7.3 13.0 12.5 2.4 2.2 15.3 15.4 3.6 3.8
Credit Risk
Credit risk is the risk of loss resulting from the failure of a counterparty to honour its financial obligations to thecompany. Credit risk arises predominantly with respect to cash and short term investments, investments in debtinstruments, insurance contract receivables, recoverable from reinsurers and receivable from counterparties toderivative contracts (primarily total return swaps and CPI-linked derivatives). There were no significant changesto the company’s exposure to credit risk (except as set out in the discussion which follows) or the framework used tomonitor, evaluate and manage credit risk at December 31, 2014 compared to December 31, 2013.
91
FAIRFAX FINANCIAL HOLDINGS LIMITED
The company’s aggregate gross credit risk exposure at December 31, 2014 (without taking into account amounts heldby the company as collateral) was comprised as follows:
December 31, December 31,2014 2013
Cash and short term investments 6,293.3 8,011.4Bonds:
U.S., U.K., German, and Canadian sovereign government 2,408.2 2,134.7Other sovereign government 1,261.0 620.5Canadian provincials 217.1 164.7U.S. states and municipalities 6,998.2 6,227.7Corporate and other 1,534.8 1,405.2
Receivable from counterparties to derivative contracts 514.9 219.6Insurance contract receivables 1,931.7 2,017.0Recoverable from reinsurers 3,982.1 4,974.7Other assets 664.9 561.4
Total gross credit risk exposure 25,806.2 26,336.9
At December 31, 2014, the company had income taxes refundable of $51.1 (December 31, 2013 – $114.1).
Cash and Short Term Investments
The company’s cash and short term investments (including at the holding company) are held at major financialinstitutions in the jurisdictions in which the operations are located. At December 31, 2014, 89.0% of these balanceswere held in Canadian and U.S. financial institutions, 3.4% in European financial institutions and 7.6% in otherforeign financial institutions (December 31, 2013 – 93.0%, 2.3% and 4.7% respectively). The company monitorsrisks associated with cash and short term investments by regularly reviewing the financial strength andcreditworthiness of these financial institutions and more frequently during periods of economic volatility. As a resultof these reviews, the company may transfer balances from financial institutions where it perceives heightened creditrisk to other institutions considered by management to be more stable.
Investments in Debt Instruments
The company’s risk management strategy for debt instruments is to invest primarily in debt instruments of highcredit quality issuers and to limit the amount of credit exposure with respect to any one corporate issuer. While thecompany reviews third party credit ratings, it also carries out its own analysis and does not delegate the creditdecision to rating agencies. The company endeavours to limit credit exposure by monitoring fixed income portfoliolimits on individual corporate issuers and limits based on credit quality and may, from time to time, initiate positionsin certain types of derivatives to further mitigate credit risk exposure.
As at December 31, 2014 the company had investments with a fair value of $9,978.9 (December 31, 2013 – $8,298.0)in bonds exposed to credit risk representing in the aggregate 38.1% (December 31, 2013 – 33.4%) of the totalinvestment portfolio (all bonds included in Canadian provincials, U.S. states and municipalities, corporate andother, and other sovereign government bonds). Other sovereign government bonds included Greek bonds purchasedat deep discounts to par of $178.6 (December 31, 2013 – $248.9) that were rated below investment grade. As atDecember 31, 2014 and 2013, the company did not have any investments in bonds issued by Ireland, Italy, Portugalor Spain. The company considers its investment in sovereign bonds rated AA/Aa or higher (primarily sovereignbonds issued by the U.S., U.K., German and Canadian governments, including $2,094.2 (December 31, 2013 –$1,669.6) of U.S. treasury bonds), representing 9.3% (December 31, 2013 – 9.1%) of the total investment portfolio, topresent only a nominal risk of default. The company’s exposure to credit risk from its investment in debt securitiesremained substantially unchanged at December 31, 2014 compared to December 31, 2013 notwithstandingpurchases of higher yielding Canadian corporate bonds during 2014. There were no other significant changes to thecompany’s framework used to monitor, evaluate and manage credit risk at December 31, 2014 compared toDecember 31, 2013 with respect to the company’s investments in debt securities.
92
The composition of the company’s fixed income portfolio classified according to the higher of each security’srespective S&P and Moody’s issuer credit rating is presented in the table that follows:
December 31, 2014 December 31, 2013
Amortized Carrying Amortized CarryingIssuer Credit Rating cost value % cost value %
AAA/Aaa 2,402.4 2,636.2 21.2 2,693.0 2,533.8 24.0AA/Aa 5,266.0 6,419.2 51.8 3,994.5 4,472.8 42.4A/A 839.8 956.4 7.7 2,135.8 2,247.8 21.3BBB/Baa 994.5 1,097.4 8.8 169.9 177.4 1.7BB/Ba 35.1 51.8 0.4 34.9 44.6 0.4B/B 359.7 178.6 1.4 447.3 294.5 2.8Lower than B/B and unrated 879.5 1,079.7 8.7 774.3 781.9 7.4
Total 10,777.0 12,419.3 100.0 10,249.7 10,552.8 100.0
There were no significant changes to the composition of the company’s fixed income portfolio classified accordingto the higher of each security’s respective S&P and Moody’s issuer credit rating at December 31, 2014 compared toDecember 31, 2013, notwithstanding the increase in the categories rated AA/Aa and BBB/Baa. The increase in bondsrated AA/Aa and BBB/Baa reflected an upgrade to the credit rating on certain of the company’s taxable U.S. statebonds (in the A/A category on December 31, 2013) and the purchases of other sovereign government bondsrespectively. At December 31, 2014, 89.5% (December 31, 2013 – 89.4%) of the fixed income portfolio carrying valuewas rated investment grade or better, with 73.0% (December 31, 2013 – 66.4%) being rated AA or better (primarilyconsisting of government obligations). At December 31, 2014 holdings of fixed income securities in the ten issuers(excluding U.S., Canadian, U.K. and German sovereign government bonds) to which the company had the greatestexposure totaled $4,829.7 (December 31, 2013 – $3,324.3), which represented approximately 18.4% (December 31,2013 – 13.4%) of the total investment portfolio. The exposure to the largest single issuer of corporate bonds held atDecember 31, 2014 was $653.3 (December 31, 2013 – $250.0), which represented approximately 2.5% (December 31,2013 – 1.0%) of the total investment portfolio.
The consolidated investment portfolio included $7.0 billion (December 31, 2013 – $6.2 billion) of U.S. state andmunicipal bonds (approximately $5.2 billion tax-exempt, $1.8 billion taxable), a large portion of which werepurchased during 2008 and are owned in the subsidiary investment portfolios. A significant portion of thecompany’s investment in U.S. state and municipal bonds, approximately $3.9 billion at December 31, 2014(December 31, 2013 – $3.7 billion), are insured by Berkshire Hathaway Assurance Corp. for the payment of interestand principal in the event of issuer default; the company believes that this insurance significantly mitigates thecredit risk associated with these bonds.
Counterparties to Derivative Contracts
Counterparty risk arises from the company’s derivative contracts primarily in three ways: first, a counterparty may beunable to honour its obligation under a derivative contract and there may not be sufficient collateral pledged infavour of the company to support that obligation; second, collateral deposited by the company to a counterparty as aprerequisite for entering into certain derivative contracts (also known as initial margin) may be at risk should thecounterparty face financial difficulty; and third, excess collateral pledged in favour of a counterparty may be at riskshould the counterparty face financial difficulty (counterparties may hold excess collateral as a result of the timing ofthe settlement of the amount of collateral required to be pledged based on the fair value of a derivative contract).
The company endeavours to limit counterparty risk through the terms of agreements negotiated with thecounterparties to its derivative contracts. Pursuant to these agreements, counterparties are contractually required todeposit eligible collateral in collateral accounts (subject to certain minimum thresholds) for the benefit of thecompany depending on the then current fair value of the derivative contracts, calculated on a daily basis. Thecompany’s exposure to risk associated with providing initial margin is mitigated where possible through the use ofsegregated third party custodian accounts whereby counterparties are permitted to take control of the collateral onlyin the event of default by the company.
93
FAIRFAX FINANCIAL HOLDINGS LIMITED
Agreements negotiated with counterparties provide for a single net settlement of all financial instruments covered bythe agreement in the event of default by the counterparty, thereby permitting obligations owed by the company to acounterparty to be offset to the extent of the aggregate amount receivable by the company from that counterparty(the ‘‘net settlement arrangements’’). The following table sets out the company’s exposure to credit risk related to thecounterparties to its derivative contracts, assuming all such counterparties are simultaneously in default:
December 31, December 31,2014 2013
Total derivative assets(1) 514.9 219.6Impact of net settlement arrangements (110.0) (136.1)Fair value of collateral deposited for the benefit of the company(2) (171.1) (47.4)Excess collateral pledged by the company in favour of counterparties 137.1 123.1Initial margin not held in segregated third party custodian accounts 61.8 60.0
Net derivative counterparty exposure after net settlement and collateralarrangements 432.7 219.2
(1) Excludes exchange traded instruments comprised principally of equity and credit warrants and equity call options whichare not subject to counterparty risk.
(2) Excludes $21.2 (December 31, 2013 – $3.0) of excess collateral pledged by counterparties.
The fair value of the collateral deposited for the benefit of the company at December 31, 2014 consisted of cash of$27.8 and government securities of $164.5 (December 31, 2013 – $25.3 and $25.1 respectively). The company hadnot exercised its right to sell or repledge collateral at December 31, 2014.
Recoverable from Reinsurers
Credit exposure on the company’s recoverable from reinsurers balance existed at December 31, 2014 to the extentthat any reinsurer may not be able or willing to reimburse the company under the terms of the relevant reinsurancearrangements. The company has a process to regularly assess the creditworthiness of reinsurers with whom ittransacts business. Internal guidelines generally require reinsurers to have strong A.M. Best ratings and maintaincapital and surplus exceeding $500.0. Where contractually provided for, the company has collateral for outstandingbalances in the form of cash, letters of credit, guarantees or assets held in trust accounts. This collateral may be drawnon when amounts remain unpaid beyond contractually specified time periods on an individual reinsurer basis.
The company’s reinsurance security department conducts ongoing detailed assessments of current and potentialreinsurers and annual reviews on impaired reinsurers, and provides recommendations for uncollectible reinsuranceprovisions for the group. The reinsurance security department also collects and maintains individual and groupreinsurance exposures aggregated across the group. Most of the reinsurance balances for reinsurers rated B++ andlower or which are not rated were inherited by the company on acquisition of a subsidiary. The company’s largestsingle reinsurer (Swiss Re America Corp.) represents 4.4% (December 31, 2013 – 5.6%) of shareholders’ equityattributable to shareholders of Fairfax and is rated A+ by A.M. Best.
The company’s gross exposure to credit risk from counterparties to its reinsurance contracts was lower atDecember 31, 2014 compared to December 31, 2013 principally as a result of normal cession and collection activityat Runoff including the commutation of a significant reinsurance recoverable balance. Changes that occurred in theprovision for uncollectible reinsurance during the period are disclosed in note 9.
94
The following table presents the gross recoverable from reinsurers classified according to the financial strength ratingof the reinsurers. Pools and associations, shown separately, are generally government or similar insurance fundscarrying limited credit risk.
December 31, 2014 December 31, 2013
Outstanding Net Outstanding NetGross balances unsecured Gross balances unsecured
recoverable for which recoverable recoverable for which recoverableA.M. Best Rating from security from from security from(or S&P equivalent) reinsurers is held reinsurers reinsurers is held reinsurers
A++ 463.4 108.3 355.1 263.5 52.8 210.7A+ 1,425.2 427.3 997.9 1,774.4 438.2 1,336.2A 1,289.6 133.6 1,156.0 1,533.7 160.8 1,372.9A- 346.4 186.5 159.9 386.0 195.7 190.3B++ 23.3 12.7 10.6 25.1 4.2 20.9B+ 2.1 0.7 1.4 3.0 0.1 2.9B or lower 28.7 23.8 4.9 78.8 70.5 8.3Not rated 539.4 104.2 435.2 965.1 568.9 396.2Pools and associations 68.3 22.2 46.1 173.9 73.5 100.4
4,186.4 1,019.3 3,167.1 5,203.5 1,564.7 3,638.8Provision for uncollectible reinsurance (204.3) (204.3) (228.8) (228.8)
Recoverable from reinsurers 3,982.1 2,962.8 4,974.7 3,410.0
Liquidity Risk
Liquidity risk is the potential for loss if the company is unable to meet financial commitments in a timely manner atreasonable costs as they fall due. It is the company’s policy to ensure that sufficient liquid assets are available to meetfinancial commitments, including liabilities to policyholders and debt holders, dividends on preferred shares andinvestment commitments. Cash flow analysis is performed on an ongoing basis at both the holding company andsubsidiary company level to ensure that future cash needs are met or exceeded by cash flows generated from theongoing operations.
The holding company’s known significant commitments for 2015 consist of the funding of the Brit Offer($1.88 billion (£1.22 billion)), payment of the $216.1 ($10.00 per share) dividend on common shares (paidJanuary 2015), interest and corporate overhead expenses, preferred share dividends, income tax payments andpotential cash outflows related to derivative contracts (described below). The net proceeds from underwritten publicofferings (described in more detail in notes 15 and 16) of 1.15 million subordinate voting shares ($575.9), 9.2 millionSeries M preferred shares ($179.0) and Cdn$350.0 of 4.95% Fairfax senior notes due 2025 ($275.7), all of whichclosed on March 3, 2015, will be used to finance the Brit Offer.
On August 13, 2014 the company completed a private debt offering of $300.0 principal amount of 4.875% seniornotes due August 13, 2024 for net proceeds of $294.2 (see note 15). The company used a portion of these net proceedsto fund the redemption in the fourth quarter of 2014 of the $50.0 principal amount of OdysseyRe Series B unsecuredsenior notes due 2016 and the $25.0 principal amount of American Safety trust preferred securities due 2035 anddisclosed that it intends to use the remaining net proceeds to fund the repayment, upon maturity, of the Fairfax($82.4) and OdysseyRe ($125.0) unsecured senior notes due in 2015.
The company believes that holding company cash and investments, net of holding company short sale andderivative obligations at December 31, 2014 of $1,212.7 provides adequate liquidity to meet the holding company’sknown obligations in 2015. The holding company expects to continue to receive investment management andadministration fees from its insurance and reinsurance subsidiaries, investment income on its holdings of cash andinvestments, and dividends from its insurance and reinsurance subsidiaries. To further augment its liquidity, theholding company can draw upon its $300.0 unsecured revolving credit facility. On February 16, 2015, a Canadianchartered bank provided the company with a £1.2 billion commitment for the full amount of the considerationpayable pursuant to the Brit Offer described in note 23. For further details related to the credit facility and thecommitment, refer to note 15 (Subsidiary Indebtedness, Long Term Debt and Credit Facilities).
95
FAIRFAX FINANCIAL HOLDINGS LIMITED
The liquidity requirements of the insurance and reinsurance subsidiaries principally relate to the liabilities associatedwith underwriting, operating costs and expenses, the payment of dividends to the holding company, contributionsto their subsidiaries, payment of principal and interest on their outstanding debt obligations, income tax paymentsand certain derivative obligations (described below). Liabilities associated with underwriting include the payment ofclaims and direct commissions. Historically, the insurance and reinsurance subsidiaries have used cash inflows fromoperating activities (primarily the collection of premiums and reinsurance commissions) and investment activities(primarily repayments of principal, sales of investment securities and investment income) to fund their liquidityrequirements. The insurance and reinsurance subsidiaries may also receive cash inflows from financing activities(primarily distributions received from their subsidiaries).
The company’s insurance and reinsurance subsidiaries (and the holding company on a consolidated basis) focus onthe stress that could be placed on liquidity requirements as a result of severe disruption or volatility in the capitalmarkets or extreme catastrophe activity or the combination of both. The insurance and reinsurance subsidiariesmaintain investment strategies intended to provide adequate funds to pay claims or withstand disruption orvolatility in the capital markets without forced sales of investments. The insurance and reinsurance subsidiaries holdhighly liquid, high quality short-term investment securities and other liquid investment grade fixed maturitysecurities to fund anticipated claim payments, operating expenses and commitments related to investments. AtDecember 31, 2014 portfolio investments net of short sale and derivative obligations totaled $25.0 billion. Theseportfolio investments may include investments in inactively traded corporate debentures, preferred stocks, commonstocks and limited partnership interests that are relatively illiquid. At December 31, 2014 these asset classesrepresented approximately 7.6% (December 31, 2013 – 7.6%) of the carrying value of the insurance and reinsurancesubsidiaries’ portfolio investments.
The insurance and reinsurance subsidiaries and the holding company may experience cash inflows or outflows(which at times could be significant) related to their derivative contracts, including collateral requirements and cashsettlements of market value movements of total return swaps which have occurred since the most recent reset date.During 2014 the insurance and reinsurance subsidiaries and the holding company paid net cash of $194.2 (2013 –$1,615.4) and $113.4 (2013 – $67.8) respectively, in connection with long and short equity and equity index totalreturn swap derivative contracts (excluding the impact of collateral requirements).
The insurance and reinsurance subsidiaries typically fund such obligations from cash provided by operatingactivities (and may fund such obligations from sales of equity-related investments, the market value of which willgenerally vary inversely with the market value of short equity and equity index total return swaps). The holdingcompany typically funds any such obligations from holding company cash and investments and its additionalsources of liquidity as discussed above.
96
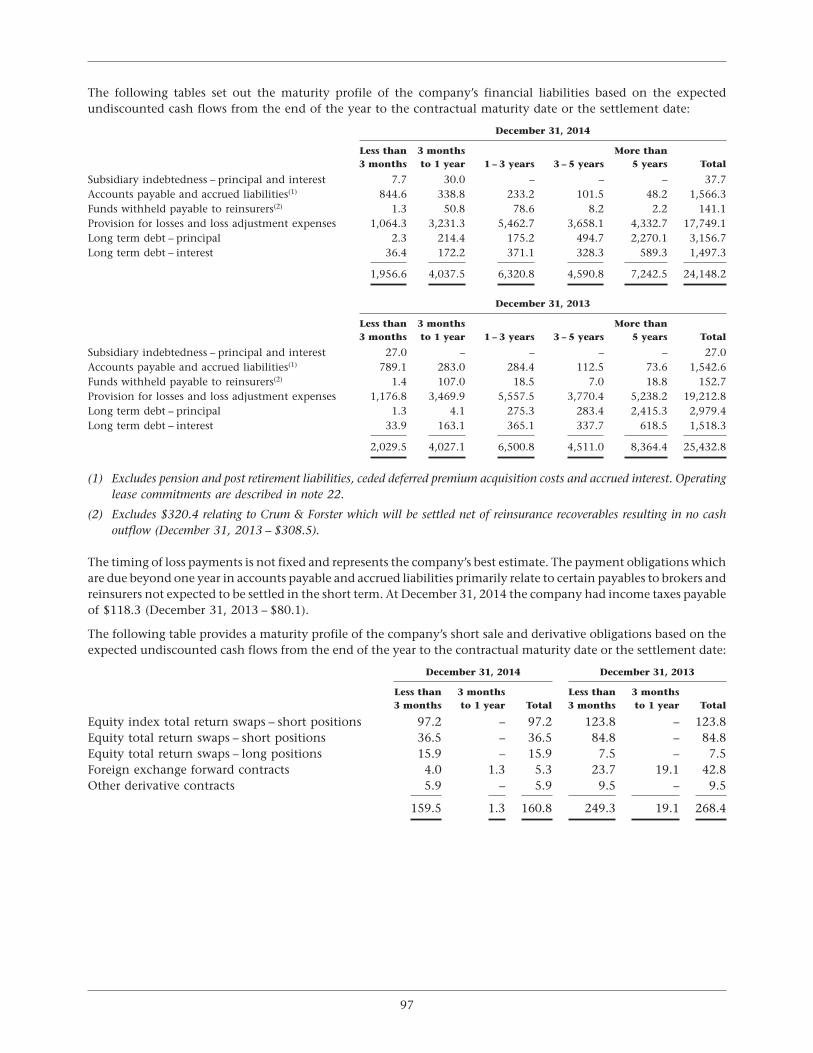
The following tables set out the maturity profile of the company’s financial liabilities based on the expectedundiscounted cash flows from the end of the year to the contractual maturity date or the settlement date:
December 31, 2014
Less than 3 months More than3 months to 1 year 1 – 3 years 3 – 5 years 5 years Total
Subsidiary indebtedness – principal and interest 7.7 30.0 – – – 37.7Accounts payable and accrued liabilities(1) 844.6 338.8 233.2 101.5 48.2 1,566.3Funds withheld payable to reinsurers(2) 1.3 50.8 78.6 8.2 2.2 141.1Provision for losses and loss adjustment expenses 1,064.3 3,231.3 5,462.7 3,658.1 4,332.7 17,749.1Long term debt – principal 2.3 214.4 175.2 494.7 2,270.1 3,156.7Long term debt – interest 36.4 172.2 371.1 328.3 589.3 1,497.3
1,956.6 4,037.5 6,320.8 4,590.8 7,242.5 24,148.2
December 31, 2013
Less than 3 months More than3 months to 1 year 1 – 3 years 3 – 5 years 5 years Total
Subsidiary indebtedness – principal and interest 27.0 – – – – 27.0Accounts payable and accrued liabilities(1) 789.1 283.0 284.4 112.5 73.6 1,542.6Funds withheld payable to reinsurers(2) 1.4 107.0 18.5 7.0 18.8 152.7Provision for losses and loss adjustment expenses 1,176.8 3,469.9 5,557.5 3,770.4 5,238.2 19,212.8Long term debt – principal 1.3 4.1 275.3 283.4 2,415.3 2,979.4Long term debt – interest 33.9 163.1 365.1 337.7 618.5 1,518.3
2,029.5 4,027.1 6,500.8 4,511.0 8,364.4 25,432.8
(1) Excludes pension and post retirement liabilities, ceded deferred premium acquisition costs and accrued interest. Operatinglease commitments are described in note 22.
(2) Excludes $320.4 relating to Crum & Forster which will be settled net of reinsurance recoverables resulting in no cashoutflow (December 31, 2013 – $308.5).
The timing of loss payments is not fixed and represents the company’s best estimate. The payment obligations whichare due beyond one year in accounts payable and accrued liabilities primarily relate to certain payables to brokers andreinsurers not expected to be settled in the short term. At December 31, 2014 the company had income taxes payableof $118.3 (December 31, 2013 – $80.1).
The following table provides a maturity profile of the company’s short sale and derivative obligations based on theexpected undiscounted cash flows from the end of the year to the contractual maturity date or the settlement date:
December 31, 2014 December 31, 2013
Less than 3 months Less than 3 months3 months to 1 year Total 3 months to 1 year Total
Equity index total return swaps – short positions 97.2 – 97.2 123.8 – 123.8Equity total return swaps – short positions 36.5 – 36.5 84.8 – 84.8Equity total return swaps – long positions 15.9 – 15.9 7.5 – 7.5Foreign exchange forward contracts 4.0 1.3 5.3 23.7 19.1 42.8Other derivative contracts 5.9 – 5.9 9.5 – 9.5
159.5 1.3 160.8 249.3 19.1 268.4
97
FAIRFAX FINANCIAL HOLDINGS LIMITED
Market Risk
Market risk (comprised of currency risk, interest rate risk and other price risk) is the risk that the fair value or futurecash flows of a financial instrument will fluctuate because of changes in market prices. The company is exposed tomarket risk principally in its investing activities but also in its underwriting activities to the extent that thoseactivities expose the company to foreign currency risk. The company’s investment portfolios are managed with along term, value-oriented investment philosophy emphasizing downside protection. The company has policies tolimit and monitor its individual issuer exposures and aggregate equity exposure. Aggregate exposure to single issuersand total equity positions are monitored at the subsidiary level and in aggregate at the company level. The followingis a discussion of the company’s primary market risk exposures and how those exposures are currently managed.
Interest Rate Risk
Interest rate risk is the risk that the fair value or future cash flows of a financial instrument will fluctuate because ofchanges in market interest rates. As interest rates rise, the fair value of fixed income investments decline and,conversely, as interest rates decline, the fair value of fixed income investments rise. In each case, the longer thematurity of the financial instrument, the greater the consequence of a change in interest rates. The company’sinterest rate risk management strategy is to position its fixed income securities portfolio based on its view of futureinterest rates and the yield curve, balanced with liquidity requirements. The company may reposition the portfolioin response to changes in the interest rate environment. At December 31, 2014 the company’s investment portfolioincluded $12.4 billion of fixed income securities (measured at fair value) which are subject to interest rate risk.
In the portions of the table below involving an increase in interest rates, the company’s exposure to interest rate riskat December 31, 2014 as measured by the hypothetical percentage change in fair value, decreased modestly relativeto December 31, 2013, principally reflecting the interaction of the decrease in interest rates in 2014 with the callfeatures embedded in the majority of the company’s tax exempt municipal bonds. Decreasing interest rates in 2014had the effect of increasing the likelihood that issuers would call those bonds prior to the contractual maturity dateand refinance at lower interest rates causing the fair value of the majority of those bonds to reflect the term until thecall date rather than the term to the contractual maturity date. Under the interest rate environment that prevailed atDecember 31, 2013, the majority of those bonds were expected to remain outstanding until their contractualmaturity date. In the portions of the table below involving a decrease in interest rates, the potential for thecompany’s bond portfolio to appreciate increased at December 31, 2014 compared to December 31, 2013, principallyas a result of the decrease in interest rates in 2014 which generally results in an increase in the duration of the bondportfolio. There were no significant changes to the company’s framework used to monitor, evaluate and manageinterest rate risk at December 31, 2014 compared to December 31, 2013.
Movements in the term structure of interest rates affect the level and timing of recognition in earnings of gains andlosses on fixed income securities held. Generally, the company’s investment income may be reduced duringsustained periods of lower interest rates as higher yielding fixed income securities are called, mature, or are sold andthe proceeds are reinvested at lower rates. During periods of rising interest rates, the market value of the company’sexisting fixed income securities will generally decrease and gains on fixed income securities will likely be reduced.Losses are likely to be incurred following significant increases in interest rates. General economic conditions,political conditions and many other factors can also adversely affect the bond markets and, consequently, the valueof the fixed income securities held. These risks are monitored by the company’s senior portfolio managers along withthe company’s CEO and are considered when managing the consolidated bond portfolio and yield.
98
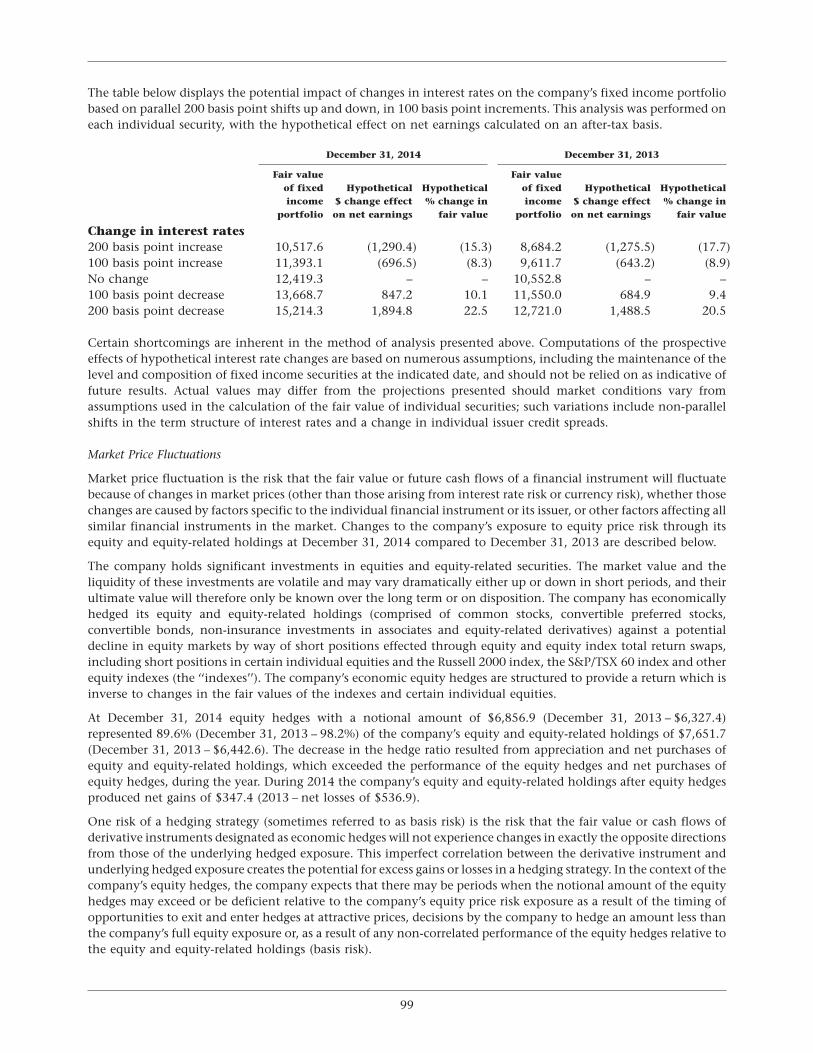
The table below displays the potential impact of changes in interest rates on the company’s fixed income portfoliobased on parallel 200 basis point shifts up and down, in 100 basis point increments. This analysis was performed oneach individual security, with the hypothetical effect on net earnings calculated on an after-tax basis.
December 31, 2014 December 31, 2013
Fair value Fair valueof fixed Hypothetical Hypothetical of fixed Hypothetical Hypotheticalincome $ change effect % change in income $ change effect % change in
portfolio on net earnings fair value portfolio on net earnings fair value
Change in interest rates200 basis point increase 10,517.6 (1,290.4) (15.3) 8,684.2 (1,275.5) (17.7)100 basis point increase 11,393.1 (696.5) (8.3) 9,611.7 (643.2) (8.9)No change 12,419.3 – – 10,552.8 – –100 basis point decrease 13,668.7 847.2 10.1 11,550.0 684.9 9.4200 basis point decrease 15,214.3 1,894.8 22.5 12,721.0 1,488.5 20.5
Certain shortcomings are inherent in the method of analysis presented above. Computations of the prospectiveeffects of hypothetical interest rate changes are based on numerous assumptions, including the maintenance of thelevel and composition of fixed income securities at the indicated date, and should not be relied on as indicative offuture results. Actual values may differ from the projections presented should market conditions vary fromassumptions used in the calculation of the fair value of individual securities; such variations include non-parallelshifts in the term structure of interest rates and a change in individual issuer credit spreads.
Market Price Fluctuations
Market price fluctuation is the risk that the fair value or future cash flows of a financial instrument will fluctuatebecause of changes in market prices (other than those arising from interest rate risk or currency risk), whether thosechanges are caused by factors specific to the individual financial instrument or its issuer, or other factors affecting allsimilar financial instruments in the market. Changes to the company’s exposure to equity price risk through itsequity and equity-related holdings at December 31, 2014 compared to December 31, 2013 are described below.
The company holds significant investments in equities and equity-related securities. The market value and theliquidity of these investments are volatile and may vary dramatically either up or down in short periods, and theirultimate value will therefore only be known over the long term or on disposition. The company has economicallyhedged its equity and equity-related holdings (comprised of common stocks, convertible preferred stocks,convertible bonds, non-insurance investments in associates and equity-related derivatives) against a potentialdecline in equity markets by way of short positions effected through equity and equity index total return swaps,including short positions in certain individual equities and the Russell 2000 index, the S&P/TSX 60 index and otherequity indexes (the ‘‘indexes’’). The company’s economic equity hedges are structured to provide a return which isinverse to changes in the fair values of the indexes and certain individual equities.
At December 31, 2014 equity hedges with a notional amount of $6,856.9 (December 31, 2013 – $6,327.4)represented 89.6% (December 31, 2013 – 98.2%) of the company’s equity and equity-related holdings of $7,651.7(December 31, 2013 – $6,442.6). The decrease in the hedge ratio resulted from appreciation and net purchases ofequity and equity-related holdings, which exceeded the performance of the equity hedges and net purchases ofequity hedges, during the year. During 2014 the company’s equity and equity-related holdings after equity hedgesproduced net gains of $347.4 (2013 – net losses of $536.9).
One risk of a hedging strategy (sometimes referred to as basis risk) is the risk that the fair value or cash flows ofderivative instruments designated as economic hedges will not experience changes in exactly the opposite directionsfrom those of the underlying hedged exposure. This imperfect correlation between the derivative instrument andunderlying hedged exposure creates the potential for excess gains or losses in a hedging strategy. In the context of thecompany’s equity hedges, the company expects that there may be periods when the notional amount of the equityhedges may exceed or be deficient relative to the company’s equity price risk exposure as a result of the timing ofopportunities to exit and enter hedges at attractive prices, decisions by the company to hedge an amount less thanthe company’s full equity exposure or, as a result of any non-correlated performance of the equity hedges relative tothe equity and equity-related holdings (basis risk).
99
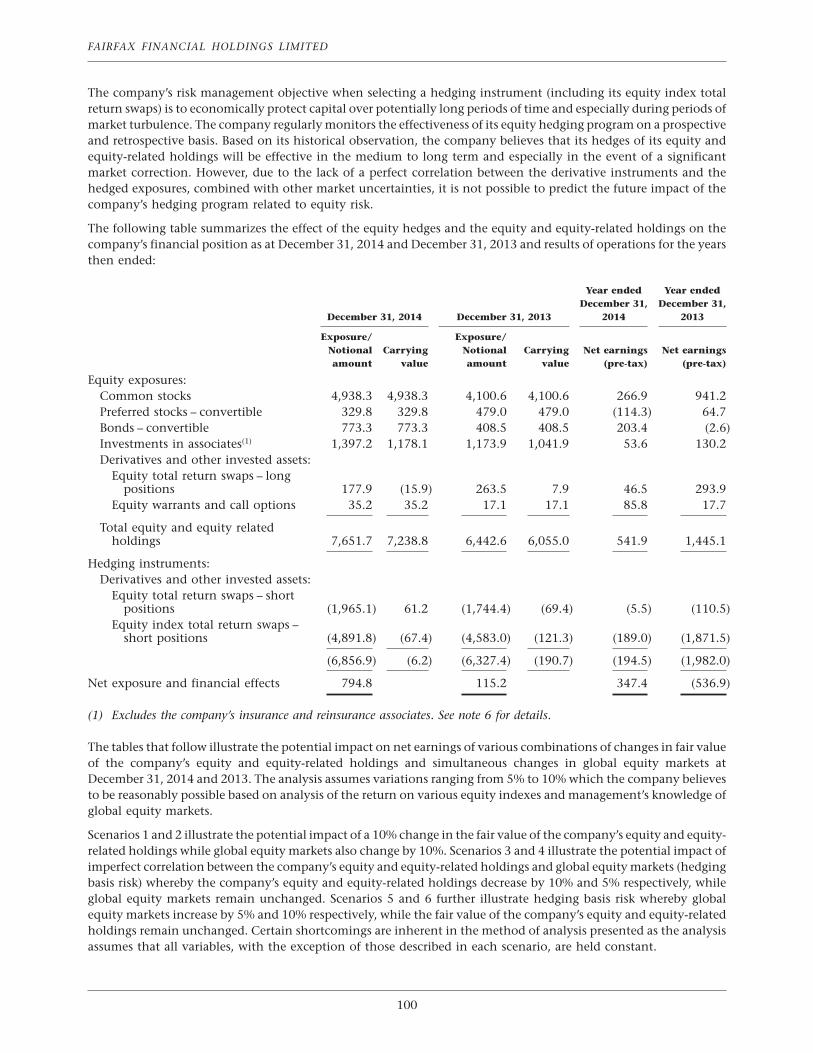
FAIRFAX FINANCIAL HOLDINGS LIMITED
The company’s risk management objective when selecting a hedging instrument (including its equity index totalreturn swaps) is to economically protect capital over potentially long periods of time and especially during periods ofmarket turbulence. The company regularly monitors the effectiveness of its equity hedging program on a prospectiveand retrospective basis. Based on its historical observation, the company believes that its hedges of its equity andequity-related holdings will be effective in the medium to long term and especially in the event of a significantmarket correction. However, due to the lack of a perfect correlation between the derivative instruments and thehedged exposures, combined with other market uncertainties, it is not possible to predict the future impact of thecompany’s hedging program related to equity risk.
The following table summarizes the effect of the equity hedges and the equity and equity-related holdings on thecompany’s financial position as at December 31, 2014 and December 31, 2013 and results of operations for the yearsthen ended:
Year ended Year endedDecember 31, December 31,
December 31, 2014 December 31, 2013 2014 2013
Exposure/ Exposure/Notional Carrying Notional Carrying Net earnings Net earningsamount value amount value (pre-tax) (pre-tax)
Equity exposures:Common stocks 4,938.3 4,938.3 4,100.6 4,100.6 266.9 941.2Preferred stocks – convertible 329.8 329.8 479.0 479.0 (114.3) 64.7Bonds – convertible 773.3 773.3 408.5 408.5 203.4 (2.6)Investments in associates(1) 1,397.2 1,178.1 1,173.9 1,041.9 53.6 130.2Derivatives and other invested assets:
Equity total return swaps – longpositions 177.9 (15.9) 263.5 7.9 46.5 293.9
Equity warrants and call options 35.2 35.2 17.1 17.1 85.8 17.7
Total equity and equity relatedholdings 7,651.7 7,238.8 6,442.6 6,055.0 541.9 1,445.1
Hedging instruments:Derivatives and other invested assets:
Equity total return swaps – shortpositions (1,965.1) 61.2 (1,744.4) (69.4) (5.5) (110.5)
Equity index total return swaps –short positions (4,891.8) (67.4) (4,583.0) (121.3) (189.0) (1,871.5)
(6,856.9) (6.2) (6,327.4) (190.7) (194.5) (1,982.0)
Net exposure and financial effects 794.8 115.2 347.4 (536.9)
(1) Excludes the company’s insurance and reinsurance associates. See note 6 for details.
The tables that follow illustrate the potential impact on net earnings of various combinations of changes in fair valueof the company’s equity and equity-related holdings and simultaneous changes in global equity markets atDecember 31, 2014 and 2013. The analysis assumes variations ranging from 5% to 10% which the company believesto be reasonably possible based on analysis of the return on various equity indexes and management’s knowledge ofglobal equity markets.
Scenarios 1 and 2 illustrate the potential impact of a 10% change in the fair value of the company’s equity and equity-related holdings while global equity markets also change by 10%. Scenarios 3 and 4 illustrate the potential impact ofimperfect correlation between the company’s equity and equity-related holdings and global equity markets (hedgingbasis risk) whereby the company’s equity and equity-related holdings decrease by 10% and 5% respectively, whileglobal equity markets remain unchanged. Scenarios 5 and 6 further illustrate hedging basis risk whereby globalequity markets increase by 5% and 10% respectively, while the fair value of the company’s equity and equity-relatedholdings remain unchanged. Certain shortcomings are inherent in the method of analysis presented as the analysisassumes that all variables, with the exception of those described in each scenario, are held constant.
100
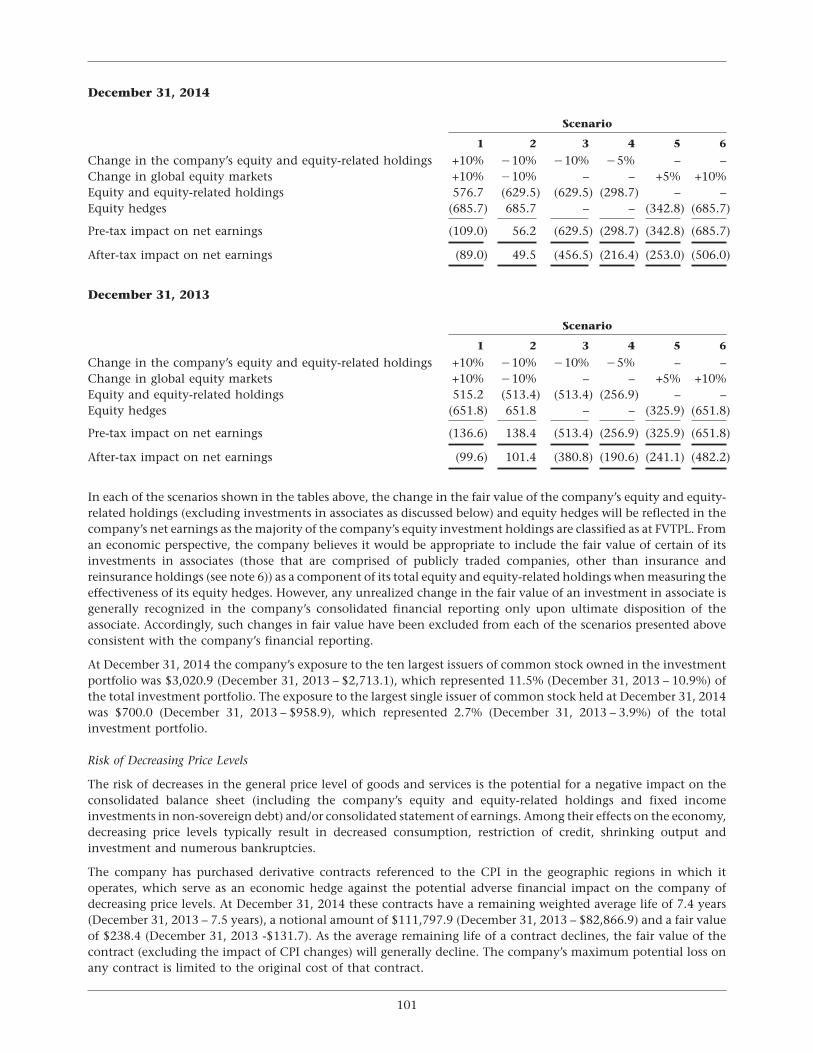
December 31, 2014
Scenario
1 2 3 4 5 6
Change in the company’s equity and equity-related holdings +10% �10% �10% �5% – –Change in global equity markets +10% �10% – – +5% +10%Equity and equity-related holdings 576.7 (629.5) (629.5) (298.7) – –Equity hedges (685.7) 685.7 – – (342.8) (685.7)
Pre-tax impact on net earnings (109.0) 56.2 (629.5) (298.7) (342.8) (685.7)
After-tax impact on net earnings (89.0) 49.5 (456.5) (216.4) (253.0) (506.0)
December 31, 2013
Scenario
1 2 3 4 5 6
Change in the company’s equity and equity-related holdings +10% �10% �10% �5% – –Change in global equity markets +10% �10% – – +5% +10%Equity and equity-related holdings 515.2 (513.4) (513.4) (256.9) – –Equity hedges (651.8) 651.8 – – (325.9) (651.8)
Pre-tax impact on net earnings (136.6) 138.4 (513.4) (256.9) (325.9) (651.8)
After-tax impact on net earnings (99.6) 101.4 (380.8) (190.6) (241.1) (482.2)
In each of the scenarios shown in the tables above, the change in the fair value of the company’s equity and equity-related holdings (excluding investments in associates as discussed below) and equity hedges will be reflected in thecompany’s net earnings as the majority of the company’s equity investment holdings are classified as at FVTPL. Froman economic perspective, the company believes it would be appropriate to include the fair value of certain of itsinvestments in associates (those that are comprised of publicly traded companies, other than insurance andreinsurance holdings (see note 6)) as a component of its total equity and equity-related holdings when measuring theeffectiveness of its equity hedges. However, any unrealized change in the fair value of an investment in associate isgenerally recognized in the company’s consolidated financial reporting only upon ultimate disposition of theassociate. Accordingly, such changes in fair value have been excluded from each of the scenarios presented aboveconsistent with the company’s financial reporting.
At December 31, 2014 the company’s exposure to the ten largest issuers of common stock owned in the investmentportfolio was $3,020.9 (December 31, 2013 – $2,713.1), which represented 11.5% (December 31, 2013 – 10.9%) ofthe total investment portfolio. The exposure to the largest single issuer of common stock held at December 31, 2014was $700.0 (December 31, 2013 – $958.9), which represented 2.7% (December 31, 2013 – 3.9%) of the totalinvestment portfolio.
Risk of Decreasing Price Levels
The risk of decreases in the general price level of goods and services is the potential for a negative impact on theconsolidated balance sheet (including the company’s equity and equity-related holdings and fixed incomeinvestments in non-sovereign debt) and/or consolidated statement of earnings. Among their effects on the economy,decreasing price levels typically result in decreased consumption, restriction of credit, shrinking output andinvestment and numerous bankruptcies.
The company has purchased derivative contracts referenced to the CPI in the geographic regions in which itoperates, which serve as an economic hedge against the potential adverse financial impact on the company ofdecreasing price levels. At December 31, 2014 these contracts have a remaining weighted average life of 7.4 years(December 31, 2013 – 7.5 years), a notional amount of $111,797.9 (December 31, 2013 – $82,866.9) and a fair valueof $238.4 (December 31, 2013 -$131.7). As the average remaining life of a contract declines, the fair value of thecontract (excluding the impact of CPI changes) will generally decline. The company’s maximum potential loss onany contract is limited to the original cost of that contract.
101
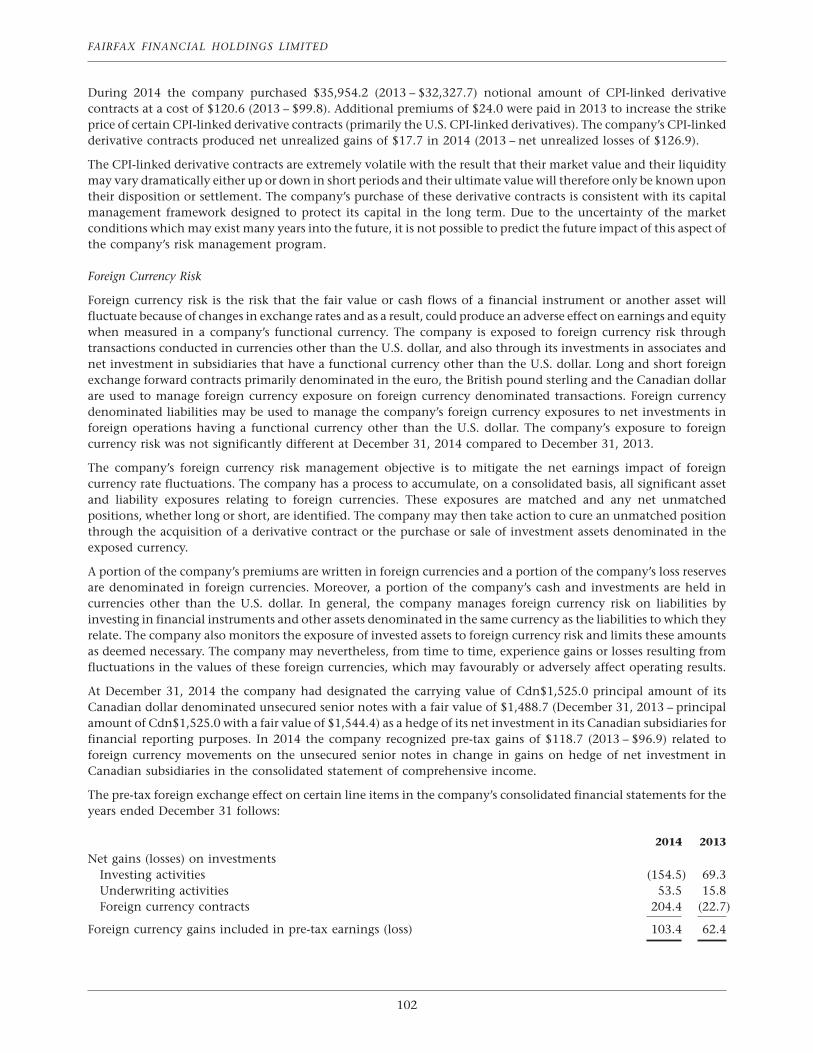
FAIRFAX FINANCIAL HOLDINGS LIMITED
During 2014 the company purchased $35,954.2 (2013 – $32,327.7) notional amount of CPI-linked derivativecontracts at a cost of $120.6 (2013 – $99.8). Additional premiums of $24.0 were paid in 2013 to increase the strikeprice of certain CPI-linked derivative contracts (primarily the U.S. CPI-linked derivatives). The company’s CPI-linkedderivative contracts produced net unrealized gains of $17.7 in 2014 (2013 – net unrealized losses of $126.9).
The CPI-linked derivative contracts are extremely volatile with the result that their market value and their liquiditymay vary dramatically either up or down in short periods and their ultimate value will therefore only be known upontheir disposition or settlement. The company’s purchase of these derivative contracts is consistent with its capitalmanagement framework designed to protect its capital in the long term. Due to the uncertainty of the marketconditions which may exist many years into the future, it is not possible to predict the future impact of this aspect ofthe company’s risk management program.
Foreign Currency Risk
Foreign currency risk is the risk that the fair value or cash flows of a financial instrument or another asset willfluctuate because of changes in exchange rates and as a result, could produce an adverse effect on earnings and equitywhen measured in a company’s functional currency. The company is exposed to foreign currency risk throughtransactions conducted in currencies other than the U.S. dollar, and also through its investments in associates andnet investment in subsidiaries that have a functional currency other than the U.S. dollar. Long and short foreignexchange forward contracts primarily denominated in the euro, the British pound sterling and the Canadian dollarare used to manage foreign currency exposure on foreign currency denominated transactions. Foreign currencydenominated liabilities may be used to manage the company’s foreign currency exposures to net investments inforeign operations having a functional currency other than the U.S. dollar. The company’s exposure to foreigncurrency risk was not significantly different at December 31, 2014 compared to December 31, 2013.
The company’s foreign currency risk management objective is to mitigate the net earnings impact of foreigncurrency rate fluctuations. The company has a process to accumulate, on a consolidated basis, all significant assetand liability exposures relating to foreign currencies. These exposures are matched and any net unmatchedpositions, whether long or short, are identified. The company may then take action to cure an unmatched positionthrough the acquisition of a derivative contract or the purchase or sale of investment assets denominated in theexposed currency.
A portion of the company’s premiums are written in foreign currencies and a portion of the company’s loss reservesare denominated in foreign currencies. Moreover, a portion of the company’s cash and investments are held incurrencies other than the U.S. dollar. In general, the company manages foreign currency risk on liabilities byinvesting in financial instruments and other assets denominated in the same currency as the liabilities to which theyrelate. The company also monitors the exposure of invested assets to foreign currency risk and limits these amountsas deemed necessary. The company may nevertheless, from time to time, experience gains or losses resulting fromfluctuations in the values of these foreign currencies, which may favourably or adversely affect operating results.
At December 31, 2014 the company had designated the carrying value of Cdn$1,525.0 principal amount of itsCanadian dollar denominated unsecured senior notes with a fair value of $1,488.7 (December 31, 2013 – principalamount of Cdn$1,525.0 with a fair value of $1,544.4) as a hedge of its net investment in its Canadian subsidiaries forfinancial reporting purposes. In 2014 the company recognized pre-tax gains of $118.7 (2013 – $96.9) related toforeign currency movements on the unsecured senior notes in change in gains on hedge of net investment inCanadian subsidiaries in the consolidated statement of comprehensive income.
The pre-tax foreign exchange effect on certain line items in the company’s consolidated financial statements for theyears ended December 31 follows:
2014 2013
Net gains (losses) on investmentsInvesting activities (154.5) 69.3Underwriting activities 53.5 15.8Foreign currency contracts 204.4 (22.7)
Foreign currency gains included in pre-tax earnings (loss) 103.4 62.4
102
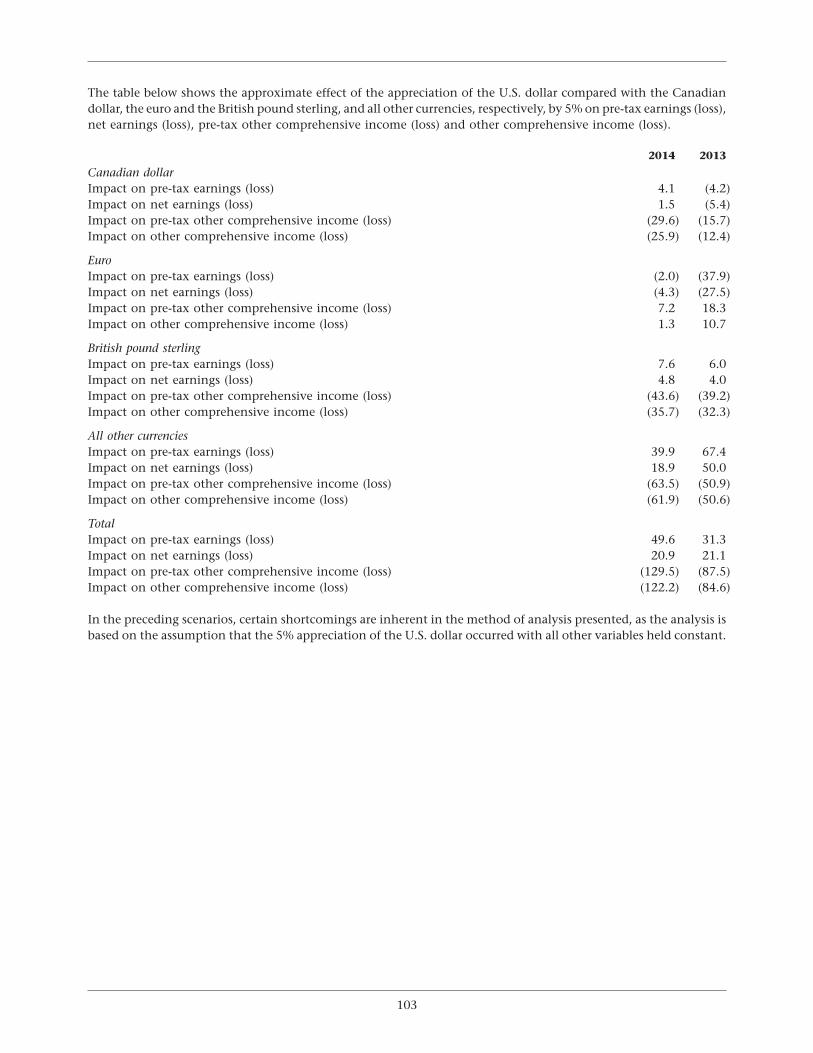
The table below shows the approximate effect of the appreciation of the U.S. dollar compared with the Canadiandollar, the euro and the British pound sterling, and all other currencies, respectively, by 5% on pre-tax earnings (loss),net earnings (loss), pre-tax other comprehensive income (loss) and other comprehensive income (loss).
2014 2013
Canadian dollarImpact on pre-tax earnings (loss) 4.1 (4.2)Impact on net earnings (loss) 1.5 (5.4)Impact on pre-tax other comprehensive income (loss) (29.6) (15.7)Impact on other comprehensive income (loss) (25.9) (12.4)
EuroImpact on pre-tax earnings (loss) (2.0) (37.9)Impact on net earnings (loss) (4.3) (27.5)Impact on pre-tax other comprehensive income (loss) 7.2 18.3Impact on other comprehensive income (loss) 1.3 10.7
British pound sterlingImpact on pre-tax earnings (loss) 7.6 6.0Impact on net earnings (loss) 4.8 4.0Impact on pre-tax other comprehensive income (loss) (43.6) (39.2)Impact on other comprehensive income (loss) (35.7) (32.3)
All other currenciesImpact on pre-tax earnings (loss) 39.9 67.4Impact on net earnings (loss) 18.9 50.0Impact on pre-tax other comprehensive income (loss) (63.5) (50.9)Impact on other comprehensive income (loss) (61.9) (50.6)
TotalImpact on pre-tax earnings (loss) 49.6 31.3Impact on net earnings (loss) 20.9 21.1Impact on pre-tax other comprehensive income (loss) (129.5) (87.5)Impact on other comprehensive income (loss) (122.2) (84.6)
In the preceding scenarios, certain shortcomings are inherent in the method of analysis presented, as the analysis isbased on the assumption that the 5% appreciation of the U.S. dollar occurred with all other variables held constant.
103
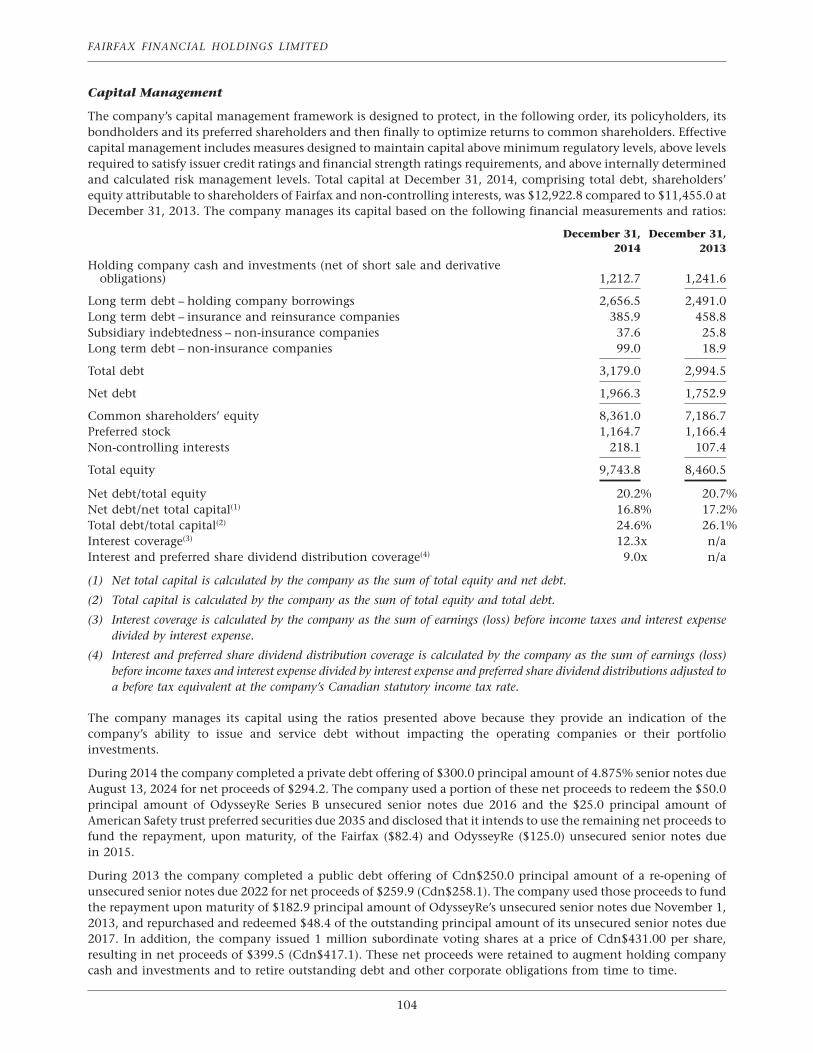
FAIRFAX FINANCIAL HOLDINGS LIMITED
Capital Management
The company’s capital management framework is designed to protect, in the following order, its policyholders, itsbondholders and its preferred shareholders and then finally to optimize returns to common shareholders. Effectivecapital management includes measures designed to maintain capital above minimum regulatory levels, above levelsrequired to satisfy issuer credit ratings and financial strength ratings requirements, and above internally determinedand calculated risk management levels. Total capital at December 31, 2014, comprising total debt, shareholders’equity attributable to shareholders of Fairfax and non-controlling interests, was $12,922.8 compared to $11,455.0 atDecember 31, 2013. The company manages its capital based on the following financial measurements and ratios:
December 31, December 31,2014 2013
Holding company cash and investments (net of short sale and derivativeobligations) 1,212.7 1,241.6
Long term debt – holding company borrowings 2,656.5 2,491.0Long term debt – insurance and reinsurance companies 385.9 458.8Subsidiary indebtedness – non-insurance companies 37.6 25.8Long term debt – non-insurance companies 99.0 18.9
Total debt 3,179.0 2,994.5
Net debt 1,966.3 1,752.9
Common shareholders’ equity 8,361.0 7,186.7Preferred stock 1,164.7 1,166.4Non-controlling interests 218.1 107.4
Total equity 9,743.8 8,460.5
Net debt/total equity 20.2% 20.7%Net debt/net total capital(1) 16.8% 17.2%Total debt/total capital(2) 24.6% 26.1%Interest coverage(3) 12.3x n/aInterest and preferred share dividend distribution coverage(4) 9.0x n/a
(1) Net total capital is calculated by the company as the sum of total equity and net debt.
(2) Total capital is calculated by the company as the sum of total equity and total debt.
(3) Interest coverage is calculated by the company as the sum of earnings (loss) before income taxes and interest expensedivided by interest expense.
(4) Interest and preferred share dividend distribution coverage is calculated by the company as the sum of earnings (loss)before income taxes and interest expense divided by interest expense and preferred share dividend distributions adjusted toa before tax equivalent at the company’s Canadian statutory income tax rate.
The company manages its capital using the ratios presented above because they provide an indication of thecompany’s ability to issue and service debt without impacting the operating companies or their portfolioinvestments.
During 2014 the company completed a private debt offering of $300.0 principal amount of 4.875% senior notes dueAugust 13, 2024 for net proceeds of $294.2. The company used a portion of these net proceeds to redeem the $50.0principal amount of OdysseyRe Series B unsecured senior notes due 2016 and the $25.0 principal amount ofAmerican Safety trust preferred securities due 2035 and disclosed that it intends to use the remaining net proceeds tofund the repayment, upon maturity, of the Fairfax ($82.4) and OdysseyRe ($125.0) unsecured senior notes duein 2015.
During 2013 the company completed a public debt offering of Cdn$250.0 principal amount of a re-opening ofunsecured senior notes due 2022 for net proceeds of $259.9 (Cdn$258.1). The company used those proceeds to fundthe repayment upon maturity of $182.9 principal amount of OdysseyRe’s unsecured senior notes due November 1,2013, and repurchased and redeemed $48.4 of the outstanding principal amount of its unsecured senior notes due2017. In addition, the company issued 1 million subordinate voting shares at a price of Cdn$431.00 per share,resulting in net proceeds of $399.5 (Cdn$417.1). These net proceeds were retained to augment holding companycash and investments and to retire outstanding debt and other corporate obligations from time to time.
104
The company’s capital management objectives includes maintaining sufficient liquid resources at the holdingcompany to be able to pay interest on its debt, dividends to its preferred shareholders and all other holding companyobligations. Accordingly, the company monitors its interest and preferred share dividend distribution coverage ratiocalculated as described in footnote 4 in the table above.
In the U.S., the National Association of Insurance Commissioners (‘‘NAIC’’) has developed a model law andrisk-based capital (‘‘RBC’’) formula designed to help regulators identify property and casualty insurers that may beinadequately capitalized. Under the NAIC’s requirements, an insurer must maintain total capital and surplus above acalculated threshold or face varying levels of regulatory action. The threshold is based on a formula that attempts toquantify the risk of a company’s insurance, investment and other business activities. At December 31, 2014 and 2013the U.S. insurance, reinsurance and runoff subsidiaries had capital and surplus in excess of the regulatory minimumrequirement of two times the authorized control level.
In Canada, property and casualty companies are regulated by the Office of the Superintendent of FinancialInstitutions on the basis of a minimum supervisory target of 150% of a minimum capital test (‘‘MCT’’) formula. AtDecember 31, 2014 and 2013 Northbridge’s subsidiaries had a weighted average MCT ratio well in excess of the 150%minimum supervisory target.
In countries other than the U.S. and Canada where the company operates (the United Kingdom, Barbados,Singapore, Malaysia, Hong Kong, Poland, Brazil and Indonesia and other jurisdictions), the company met orexceeded the applicable regulatory capital requirements at December 31, 2014.
25. Segmented Information
The company is a holding company which, through its subsidiaries, is engaged in property and casualty insurance,conducted on a primary and reinsurance basis, and runoff operations. The company identifies its operating segmentsby operating company consistent with its management structure. The company has aggregated certain of theseoperating segments into reporting segments as subsequently described. The accounting policies of the reportingsegments are the same as those described in note 3. Transfer prices for inter-segment transactions are set at arm’slength. Geographic premiums are determined based on the domicile of the various subsidiaries and where theprimary underlying risk of the business resides.
Insurance
Northbridge – Northbridge is a national commercial property and casualty insurer in Canada providing property andcasualty insurance products through its Northbridge Insurance and Federated subsidiaries.
U.S. Insurance – U.S. Insurance is comprised of Crum & Forster and Zenith National. Crum & Forster is a nationalcommercial property and casualty insurance company in the United States writing a broad range of commercialcoverages. Its subsidiaries, Seneca Insurance and First Mercury, provide property and casualty insurance to smallbusinesses and certain specialty coverages. Zenith National is primarily engaged in the workers’ compensationinsurance business in the United States.
Fairfax Asia – Fairfax Asia includes the company’s operations that underwrite insurance and reinsurance coverages inSingapore (First Capital), Hong Kong (Falcon), Malaysia (Pacific Insurance) and an 80.0% interest in Indonesia(Fairfax Indonesia acquired on May 21, 2014). Fairfax Asia also includes the company’s equity accounted interests inMumbai-based ICICI Lombard (26.0%) and Thailand-based Falcon Thailand (40.5%).
Reinsurance
OdysseyRe – OdysseyRe underwrites reinsurance, providing a full range of property and casualty products on aworldwide basis, and underwrites specialty insurance, primarily in the United States and in the United Kingdom,both directly and through the Lloyd’s market in London.
Insurance and Reinsurance – Other
Insurance and Reinsurance – Other is comprised of Group Re, Advent, Polish Re and Fairfax Brasil. Group Reprimarily constitutes the participation of CRC Re and Wentworth (both based in Barbados) in the reinsurance ofFairfax’s subsidiaries by quota share or through participation in those subsidiaries’ third party reinsurance programson the same terms as third party reinsurers. Group Re also writes third party business. Advent is a reinsurance and
105
FAIRFAX FINANCIAL HOLDINGS LIMITED
insurance company, operating through Syndicate 780 at Lloyd’s, focused on specialty property reinsurance andinsurance risks. Polish Re underwrites reinsurance in Central and Eastern Europe. Fairfax Brasil writes commercialproperty and casualty insurance in Brazil.
Runoff
The Runoff reporting segment principally comprises RiverStone (UK), Syndicate 3500, RiverStone Insurance and theU.S. runoff company formed on the merger of TIG Insurance and International Insurance Company combined withOld Lyme, Fairmont, General Fidelity, Clearwater Insurance, Commonwealth Insurance Company of America (sinceJanuary 1, 2013) and American Safety (since October 3, 2013 pursuant to the transaction described in note 23).
Other
The Other reporting segment is comprised of Ridley, William Ashley, Sporting Life, Prime Restaurants, Thomas CookIndia, IKYA, The Keg (since February 4, 2014), Praktiker (since June 5, 2014), Sterling Resorts (consolidated sinceSeptember 3, 2014), MFXchange (since November 3, 2014) and Pethealth (since November 14, 2014). Ridley isengaged in the animal nutrition business in the U.S. and Canada. William Ashley is a prestige retailer of exclusivetableware and gifts in Canada. Sporting Life is a Canadian retailer of sporting goods and sports apparel. PrimeRestaurants (acquired on January 10, 2012) franchises, owns and operates a network of casual dining restaurants andpubs primarily in Canada. The assets and liabilities of Prime Restaurants were de-consolidated from the company’sfinancial reporting effective October 31, 2013 following the sale of Prime Restaurants to Cara. Thomas Cook India isan integrated travel and travel-related financial services company in India offering a broad range of services thatinclude foreign exchange, corporate and leisure travel and insurance. IKYA (acquired by Thomas Cook India onMay 14, 2013 pursuant to the transaction described in note 23) provides specialized human resources services toleading corporate clients in India. The Keg (acquired on February 4, 2014 pursuant to the transaction described innote 23) franchises, owns and operates a network of premium dining restaurants across Canada and in selectlocations in the United States. Praktiker (acquired on June 5, 2014 pursuant to the transaction described in note 23) isone of the largest home improvement and do-it-yourself goods retailers in Greece, operating 14 stores. SterlingResorts (consolidated since September 3, 2014 pursuant to the transaction described in note 23) is engaged invacation ownership and leisure hospitality and operates a network of resorts in India. MFXchange (reported in theOther segment since November 3, 2014) is a technology company. Pethealth (acquired on November 14, 2014pursuant to the transaction described in note 23) is headquartered in Canada and provides pet medical insurance,management software and pet-related database management services in North America and the United Kingdom.The goodwill and intangible assets associated with Pethealth’s marketing of pet medical insurance were allocated tothe Crum & Forster and Northbridge reporting segments since Crum & Forster and Northbridge were to becomePethealth’s ongoing insurance carriers. Pethealth’s residual assets and liabilities and results of operations wereconsolidated in the Other reporting segment.
Corporate and Other
Corporate and Other includes the parent entity (Fairfax Financial Holdings Limited), its subsidiary intermediateholding companies and Hamblin Watsa, an investment management company. MFXchange was reported in theCorporate and Other segment prior to its transfer to the Other segment as described in the preceding paragraph.
In the fourth quarter of 2014, Fairfax centralized the ownership of wholly-owned OdysseyRe under a singleintermediate holding company in the U.S. (the ‘‘OdysseyRe reorganization’’). Prior to the OdysseyRe reorganization,OdysseyRe was owned by Crum & Forster (8.1%), Runoff (TIG Insurance) (20.1%) and Fairfax (71.8%, throughvarious U.S. intermediate holding companies). The OdysseyRe reorganization had no effect on Fairfax’s consolidatedfinancial reporting.
The OdysseyRe reorganization was principally comprised of the following transactions: OdysseyRe redeemed theinvestment of Crum & Forster in it and portions of the investments of Runoff and Fairfax in it in exchange for cashand unaffiliated marketable securities with fair values of $367.5, $510.1 and $12.8 respectively. The remainder ofRunoff’s investment in OdysseyRe (fair value of $380.7) was distributed to Fairfax as a dividend-in-kind. Crum &Forster and Runoff remitted to Fairfax a portion of the redemption proceeds received from OdysseyRe (Crum &Forster paid a dividend of $150.0 and Runoff made an intercompany advance of $350.0), from which Fairfax made acapital contribution to OdysseyRe of $400.0.
106
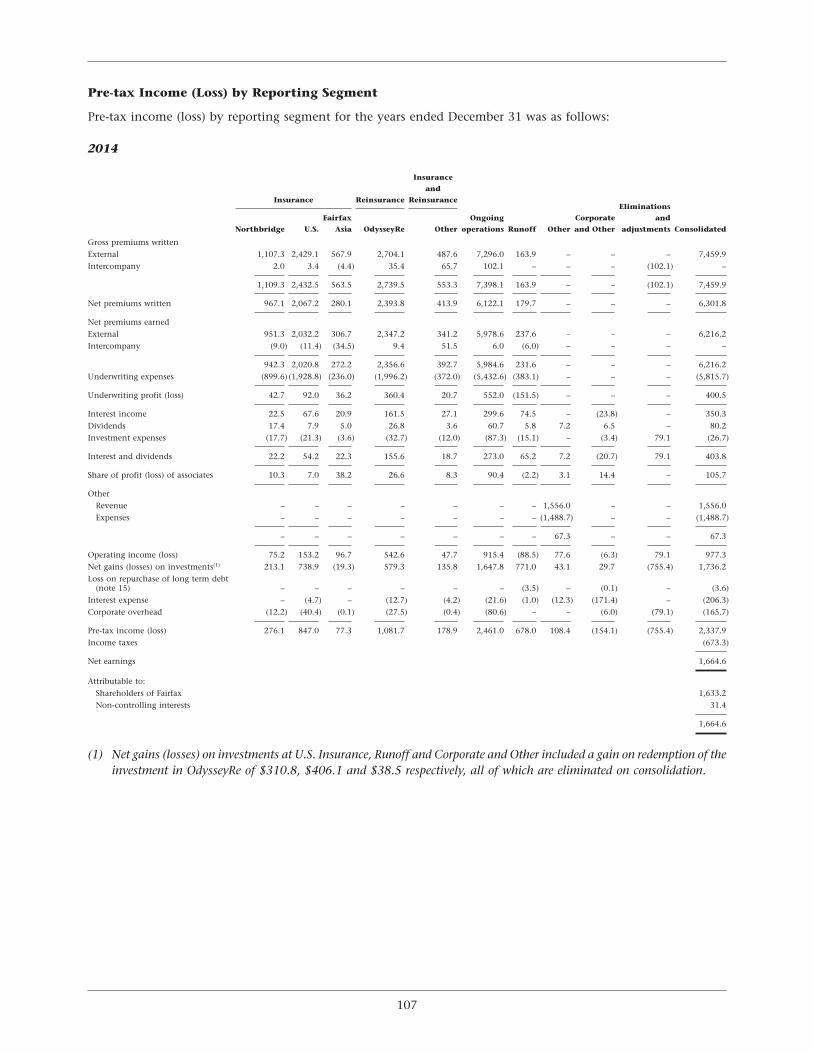
Pre-tax Income (Loss) by Reporting Segment
Pre-tax income (loss) by reporting segment for the years ended December 31 was as follows:
2014
Insurance
and
Insurance Reinsurance ReinsuranceEliminations
Fairfax Ongoing Corporate and
Northbridge U.S. Asia OdysseyRe Other operations Runoff Other and Other adjustments Consolidated
Gross premiums written
External 1,107.3 2,429.1 567.9 2,704.1 487.6 7,296.0 163.9 – – – 7,459.9
Intercompany 2.0 3.4 (4.4) 35.4 65.7 102.1 – – – (102.1) –
1,109.3 2,432.5 563.5 2,739.5 553.3 7,398.1 163.9 – – (102.1) 7,459.9
Net premiums written 967.1 2,067.2 280.1 2,393.8 413.9 6,122.1 179.7 – – – 6,301.8
Net premiums earned
External 951.3 2,032.2 306.7 2,347.2 341.2 5,978.6 237.6 – – – 6,216.2
Intercompany (9.0) (11.4) (34.5) 9.4 51.5 6.0 (6.0) – – – –
942.3 2,020.8 272.2 2,356.6 392.7 5,984.6 231.6 – – – 6,216.2
Underwriting expenses (899.6) (1,928.8) (236.0) (1,996.2) (372.0) (5,432.6) (383.1) – – – (5,815.7)
Underwriting profit (loss) 42.7 92.0 36.2 360.4 20.7 552.0 (151.5) – – – 400.5
Interest income 22.5 67.6 20.9 161.5 27.1 299.6 74.5 – (23.8) – 350.3
Dividends 17.4 7.9 5.0 26.8 3.6 60.7 5.8 7.2 6.5 – 80.2
Investment expenses (17.7) (21.3) (3.6) (32.7) (12.0) (87.3) (15.1) – (3.4) 79.1 (26.7)
Interest and dividends 22.2 54.2 22.3 155.6 18.7 273.0 65.2 7.2 (20.7) 79.1 403.8
Share of profit (loss) of associates 10.3 7.0 38.2 26.6 8.3 90.4 (2.2) 3.1 14.4 – 105.7
Other
Revenue – – – – – – – 1,556.0 – – 1,556.0
Expenses – – – – – – – (1,488.7) – – (1,488.7)
– – – – – – – 67.3 – – 67.3
Operating income (loss) 75.2 153.2 96.7 542.6 47.7 915.4 (88.5) 77.6 (6.3) 79.1 977.3
Net gains (losses) on investments(1) 213.1 738.9 (19.3) 579.3 135.8 1,647.8 771.0 43.1 29.7 (755.4) 1,736.2
Loss on repurchase of long term debt(note 15) – – – – – – (3.5) – (0.1) – (3.6)
Interest expense – (4.7) – (12.7) (4.2) (21.6) (1.0) (12.3) (171.4) – (206.3)
Corporate overhead (12.2) (40.4) (0.1) (27.5) (0.4) (80.6) – – (6.0) (79.1) (165.7)
Pre-tax income (loss) 276.1 847.0 77.3 1,081.7 178.9 2,461.0 678.0 108.4 (154.1) (755.4) 2,337.9
Income taxes (673.3)
Net earnings 1,664.6
Attributable to:
Shareholders of Fairfax 1,633.2
Non-controlling interests 31.4
1,664.6
(1) Net gains (losses) on investments at U.S. Insurance, Runoff and Corporate and Other included a gain on redemption of theinvestment in OdysseyRe of $310.8, $406.1 and $38.5 respectively, all of which are eliminated on consolidation.
107
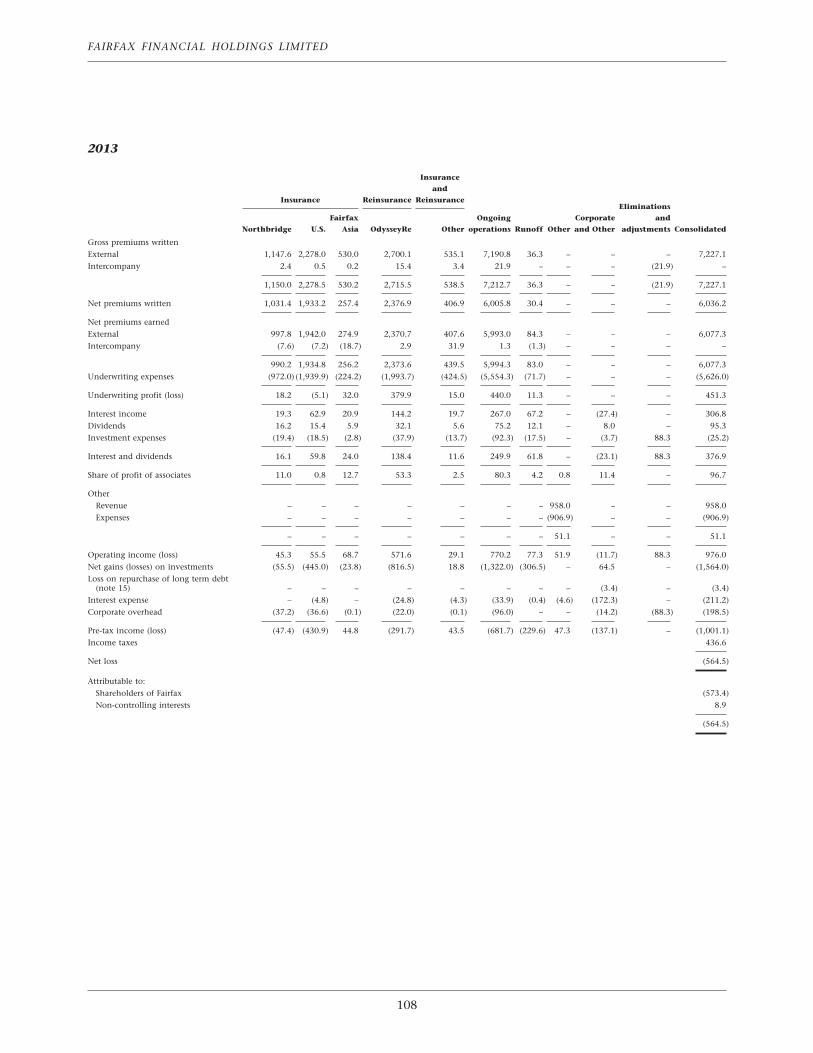
FAIRFAX FINANCIAL HOLDINGS LIMITED
2013
Insurance
and
Insurance Reinsurance ReinsuranceEliminations
Fairfax Ongoing Corporate and
Northbridge U.S. Asia OdysseyRe Other operations Runoff Other and Other adjustments Consolidated
Gross premiums written
External 1,147.6 2,278.0 530.0 2,700.1 535.1 7,190.8 36.3 – – – 7,227.1
Intercompany 2.4 0.5 0.2 15.4 3.4 21.9 – – – (21.9) –
1,150.0 2,278.5 530.2 2,715.5 538.5 7,212.7 36.3 – – (21.9) 7,227.1
Net premiums written 1,031.4 1,933.2 257.4 2,376.9 406.9 6,005.8 30.4 – – – 6,036.2
Net premiums earned
External 997.8 1,942.0 274.9 2,370.7 407.6 5,993.0 84.3 – – – 6,077.3
Intercompany (7.6) (7.2) (18.7) 2.9 31.9 1.3 (1.3) – – – –
990.2 1,934.8 256.2 2,373.6 439.5 5,994.3 83.0 – – – 6,077.3
Underwriting expenses (972.0) (1,939.9) (224.2) (1,993.7) (424.5) (5,554.3) (71.7) – – – (5,626.0)
Underwriting profit (loss) 18.2 (5.1) 32.0 379.9 15.0 440.0 11.3 – – – 451.3
Interest income 19.3 62.9 20.9 144.2 19.7 267.0 67.2 – (27.4) – 306.8
Dividends 16.2 15.4 5.9 32.1 5.6 75.2 12.1 – 8.0 – 95.3
Investment expenses (19.4) (18.5) (2.8) (37.9) (13.7) (92.3) (17.5) – (3.7) 88.3 (25.2)
Interest and dividends 16.1 59.8 24.0 138.4 11.6 249.9 61.8 – (23.1) 88.3 376.9
Share of profit of associates 11.0 0.8 12.7 53.3 2.5 80.3 4.2 0.8 11.4 – 96.7
Other
Revenue – – – – – – – 958.0 – – 958.0
Expenses – – – – – – – (906.9) – – (906.9)
– – – – – – – 51.1 – – 51.1
Operating income (loss) 45.3 55.5 68.7 571.6 29.1 770.2 77.3 51.9 (11.7) 88.3 976.0
Net gains (losses) on investments (55.5) (445.0) (23.8) (816.5) 18.8 (1,322.0) (306.5) – 64.5 – (1,564.0)
Loss on repurchase of long term debt(note 15) – – – – – – – – (3.4) – (3.4)
Interest expense – (4.8) – (24.8) (4.3) (33.9) (0.4) (4.6) (172.3) – (211.2)
Corporate overhead (37.2) (36.6) (0.1) (22.0) (0.1) (96.0) – – (14.2) (88.3) (198.5)
Pre-tax income (loss) (47.4) (430.9) 44.8 (291.7) 43.5 (681.7) (229.6) 47.3 (137.1) – (1,001.1)
Income taxes 436.6
Net loss (564.5)
Attributable to:
Shareholders of Fairfax (573.4)
Non-controlling interests 8.9
(564.5)
108
Investments in Associates, Additions to Goodwill, Segment Assets and Segment Liabilities
Investments in associates, additions to goodwill, segment assets and segment liabilities by reporting segment as atand for the years ended December 31 were as follows:
Investments in Additions to Segmentassociates goodwill Segment assets liabilities
2014 2013 2014 2013 2014 2013 2014 2013
Insurance – Canada (Northbridge) 164.7 176.5 8.3 – 4,670.6 4,988.4 3,106.2 3,508.5
– U.S. (Crum & Forster and Zenith National) 156.2 119.5 44.3 21.2 9,133.4 8,522.8 6,327.9 6,323.8
– Asia (Fairfax Asia) 163.6 115.1 4.1 – 1,868.7 1,795.0 1,207.8 1,185.0
Reinsurance – OdysseyRe 519.8 492.4 11.8 – 11,100.7 11,141.8 7,088.1 7,332.5
Insurance and Reinsurance – Other 107.4 64.3 – – 2,371.4 2,265.0 1,559.4 1,563.5
Ongoing operations 1,111.7 967.8 68.5 21.2 29,144.8 28,713.0 19,289.4 19,913.3
Runoff 275.5 210.6 – 34.4 6,963.7 7,476.9 4,899.0 5,879.1
Other 17.9 17.3 152.4 27.6 1,376.4 682.9 700.7 321.3
Corporate and other and eliminations and adjustments 212.6 236.8 – – (1,353.7) (873.8) 1,498.3 1,424.8
Consolidated 1,617.7 1,432.5 220.9 83.2 36,131.2 35,999.0 26,387.4 27,538.5
Product Line
Revenue by product line for the years ended December 31 was as follows:
Property Casualty Specialty Total
2014 2013 2014 2013 2014 2013 2014 2013
Net premiums earnedInsurance – Canada (Northbridge) 405.0 420.7 443.8 478.3 93.5 91.2 942.3 990.2
– U.S. (Crum & Forster and Zenith National) 204.9 178.0 1,746.8 1,693.9 69.1 62.9 2,020.8 1,934.8– Asia (Fairfax Asia) 25.6 23.2 186.8 174.1 59.8 58.9 272.2 256.2
Reinsurance – OdysseyRe 1,317.9 1,235.0 811.8 859.6 226.9 279.0 2,356.6 2,373.6Insurance and Reinsurance – Other 171.5 244.8 119.4 121.1 101.8 73.6 392.7 439.5
Ongoing operations 2,124.9 2,101.7 3,308.6 3,327.0 551.1 565.6 5,984.6 5,994.3Runoff 2.6 1.3 224.5 15.3 4.5 66.4 231.6 83.0
2,127.5 2,103.0 3,533.1 3,342.3 555.6 632.0 6,216.2 6,077.3Interest and dividends 403.8 376.9Share of profit of associates 105.7 96.7Net gains (losses) on investments 1,736.2 (1,564.0)Other 1,556.0 958.0
Total consolidated revenue 10,017.9 5,944.9
Allocation of revenue 34.2% 34.6% 56.9% 55.0% 8.9% 10.4%
109
FAIRFAX FINANCIAL HOLDINGS LIMITED
Geographic Region
Revenue by geographic region for the years ended December 31 was as follows:
Canada United States Asia(1) International(2) Total
2014 2013 2014 2013 2014 2013 2014 2013 2014 2013
Net premiums earnedInsurance – Canada (Northbridge) 933.0 980.6 9.2 9.5 – – 0.1 0.1 942.3 990.2
– U.S. (Crum & Forster and Zenith National) – – 2,020.6 1,934.7 – – 0.2 0.1 2,020.8 1,934.8– Asia (Fairfax Asia) – – – – 272.2 256.2 – – 272.2 256.2
Reinsurance – OdysseyRe 96.3 95.7 1,346.5 1,281.3 281.4 249.7 632.4 746.9 2,356.6 2,373.6Insurance and Reinsurance – Other 8.2 19.6 95.7 120.3 75.7 60.5 213.1 239.1 392.7 439.5
Ongoing operations 1,037.5 1,095.9 3,472.0 3,345.8 629.3 566.4 845.8 986.2 5,984.6 5,994.3Runoff – – 150.1 31.5 – – 81.5 51.5 231.6 83.0
1,037.5 1,095.9 3,622.1 3,377.3 629.3 566.4 927.3 1,037.7 6,216.2 6,077.3Interest and dividends 403.8 376.9Share of profit of associates 105.7 96.7Net gains (losses) on investments 1,736.2 (1,564.0)Other 1,556.0 958.0
Total consolidated revenue 10,017.9 5,944.9
Allocation of revenue 16.7% 18.0% 58.3% 55.6% 10.1% 9.3% 14.9% 17.1%
(1) The Asia geographic segment comprises countries located throughout Asia including China, India, the Middle East,Malaysia, Singapore, Indonesia and Thailand.
(2) The International geographic segment comprises Australia and countries located in Africa, Europe and South America.
26. Expenses
Losses on claims, net, operating expenses and other expenses for the years ended December 31 were comprisedas follows:
2014 2013
Losses and loss adjustment expenses 3,584.0 3,467.5Salaries and employee benefits expense (note 27) 1,145.1 1,010.1Other reporting segment cost of sales 978.3 623.2Depreciation, amortization and impairment charges 94.2 104.3Premium taxes 93.2 93.8Audit, legal and tax professional fees 99.6 93.0Information technology costs 79.8 78.1Operating lease costs 96.9 66.2Restructuring costs 20.6 12.9Loss on repurchase of long term debt (note 15) 3.6 3.4Administrative expense and other 318.5 213.1
6,513.8 5,765.6
110
27. Salaries and Employee Benefits Expense
Salaries and employee benefits expense for the years ended December 31 were comprised as follows:
2014 2013
Wages and salaries 904.6 790.4Employee benefits 161.5 141.9Defined benefit pension plan expense (note 21) 20.7 24.9Defined contribution pension plan expense (note 21) 24.1 21.9Share-based payments to directors and employees 25.4 20.5Defined benefit post retirement expense (note 21) 8.8 10.5
1,145.1 1,010.1
28. Supplementary Cash Flow Information
Cash and cash equivalents were included on the consolidated balance sheets as follows:
December 31, December 31,2014 2013
Holding company cash and investments:Cash and balances with banks 93.7 157.2Treasury bills and other eligible bills 224.0 57.2
317.7 214.4
Subsidiary cash and short term investments:Cash and balances with banks 1,336.3 1,786.7Treasury bills and other eligible bills 1,698.2 2,091.7
3,034.5 3,878.4
Subsidiary assets pledged for short sale and derivative obligations:Treasury bills and other eligible bills – 11.8
Subsidiary indebtedness – bank overdrafts – (6.0)
Cash, cash equivalents and bank overdrafts included in theconsolidated balance sheets 3,352.2 4,098.6
Less: Subsidiary cash and cash equivalents – restricted(1)
Cash and balances with banks 122.1 96.7Treasury bills and other eligible bills 211.4 243.7
333.5 340.4
Cash, cash equivalents and bank overdrafts included in theconsolidated statements of cash flows 3,018.7 3,758.2
(1) Cash, cash equivalents and bank overdrafts as presented in the consolidated statements of cash flows excludes balancesthat are restricted. Restricted cash and cash equivalents are comprised primarily of amounts required to be maintained ondeposit with various regulatory authorities to support the subsidiaries’ insurance and reinsurance operations.
111
FAIRFAX FINANCIAL HOLDINGS LIMITED
Details of certain cash flows included in the consolidated statements of cash flows for the years ended December 31were as follows:
2014 2013
(a) Net (purchases) sales of securities classified as at FVTPLShort term investments 918.9 1,159.1Bonds (620.9) 8.7Preferred stocks 60.3 (34.6)Common stocks (527.5) 1,585.6Derivatives and short sales (420.8) (1,823.1)
(590.0) 895.7
(b) Changes in operating assets and liabilitiesNet decrease (increase) in restricted cash and cash equivalents 4.7 (168.5)Provision for losses and loss adjustment expenses (926.8) (855.3)Provision for unearned premiums 102.1 (67.6)Insurance contract receivables 21.7 (57.2)Recoverable from reinsurers 860.7 481.0Other receivables (33.2) (39.3)Funds withheld payable to reinsurers 5.0 (34.4)Accounts payable and accrued liabilities 23.3 (44.3)Income taxes payable 27.0 9.8Other (13.7) 8.9
70.8 (766.9)
(c) Net interest and dividends receivedInterest and dividends received 612.3 547.7Interest paid (192.3) (199.7)
420.0 348.0
(d) Net income taxes (paid) refund received (52.3) 19.9
(e) Dividends paidCommon share dividends paid (215.7) (205.5)Preferred share dividends paid (56.9) (60.8)Dividends paid to non-controlling interests (6.6) (6.4)
(279.2) (272.7)
29. Related Party Transactions
Compensation for the company’s key management team for the years ended December 31 was as follows:
2014 2013
Salaries and other short-term employee benefits 10.7 7.1Share-based payments 1.4 1.0
12.1 8.1
Compensation for the company’s Board of Directors for the years ended December 31 was as follows:
2014 2013
Retainers and fees 0.8 1.0Share-based payments 0.1 0.1
0.9 1.1
The compensation presented above is determined in accordance with the company’s IFRS accounting policies andwill differ from the compensation presented in the company’s Management Proxy Circular.
112
Index to Management’s Discussion and Analysis of Financial Condition and Results of Operations
Notes to Management’s Discussion and Analysis of Financial Condition and Results of Operations . . . . . . 114Overview of Consolidated Performance . . . . . . . . . . . . . . . . . . . . . . . . . . . . . . . . . . . . . . . . . . . . . . . 115Business Developments
Acquisitions and Divestitures . . . . . . . . . . . . . . . . . . . . . . . . . . . . . . . . . . . . . . . . . . . . . . . . . . . 115Operating Environment . . . . . . . . . . . . . . . . . . . . . . . . . . . . . . . . . . . . . . . . . . . . . . . . . . . . . . . 118
Sources of Revenue . . . . . . . . . . . . . . . . . . . . . . . . . . . . . . . . . . . . . . . . . . . . . . . . . . . . . . . . . . . . . 119Net Premiums Earned by Geographic Region . . . . . . . . . . . . . . . . . . . . . . . . . . . . . . . . . . . . . . . . . . . 122Sources of Net Earnings . . . . . . . . . . . . . . . . . . . . . . . . . . . . . . . . . . . . . . . . . . . . . . . . . . . . . . . . . . 122Net Earnings by Reporting Segment . . . . . . . . . . . . . . . . . . . . . . . . . . . . . . . . . . . . . . . . . . . . . . . . . 126Balance Sheets by Reporting Segment . . . . . . . . . . . . . . . . . . . . . . . . . . . . . . . . . . . . . . . . . . . . . . . . 127Components of Net Earnings
Underwriting and Operating Income . . . . . . . . . . . . . . . . . . . . . . . . . . . . . . . . . . . . . . . . . . . . . . 130Interest and Dividends . . . . . . . . . . . . . . . . . . . . . . . . . . . . . . . . . . . . . . . . . . . . . . . . . . . . . . . 151Net Gains (Losses) on Investments . . . . . . . . . . . . . . . . . . . . . . . . . . . . . . . . . . . . . . . . . . . . . . . 151Interest Expense . . . . . . . . . . . . . . . . . . . . . . . . . . . . . . . . . . . . . . . . . . . . . . . . . . . . . . . . . . . . 151Corporate Overhead and Other . . . . . . . . . . . . . . . . . . . . . . . . . . . . . . . . . . . . . . . . . . . . . . . . . 151Income Taxes . . . . . . . . . . . . . . . . . . . . . . . . . . . . . . . . . . . . . . . . . . . . . . . . . . . . . . . . . . . . . . 152Non-controlling Interests . . . . . . . . . . . . . . . . . . . . . . . . . . . . . . . . . . . . . . . . . . . . . . . . . . . . . . 153
Components of Consolidated Balance SheetsConsolidated Balance Sheet Summary . . . . . . . . . . . . . . . . . . . . . . . . . . . . . . . . . . . . . . . . . . . . . 153Provision for Losses and Loss Adjustment Expenses . . . . . . . . . . . . . . . . . . . . . . . . . . . . . . . . . . . . 155Asbestos and Pollution . . . . . . . . . . . . . . . . . . . . . . . . . . . . . . . . . . . . . . . . . . . . . . . . . . . . . . . 168Recoverable from Reinsurers . . . . . . . . . . . . . . . . . . . . . . . . . . . . . . . . . . . . . . . . . . . . . . . . . . . . 172
InvestmentsHamblin Watsa Investment Counsel Ltd. . . . . . . . . . . . . . . . . . . . . . . . . . . . . . . . . . . . . . . . . . . . 176Overview of Investment Performance . . . . . . . . . . . . . . . . . . . . . . . . . . . . . . . . . . . . . . . . . . . . . 177Interest and Dividend Income . . . . . . . . . . . . . . . . . . . . . . . . . . . . . . . . . . . . . . . . . . . . . . . . . . 177Net Gains (Losses) on Investments . . . . . . . . . . . . . . . . . . . . . . . . . . . . . . . . . . . . . . . . . . . . . . . 180Total Return on the Investment Portfolio . . . . . . . . . . . . . . . . . . . . . . . . . . . . . . . . . . . . . . . . . . . 181Bonds . . . . . . . . . . . . . . . . . . . . . . . . . . . . . . . . . . . . . . . . . . . . . . . . . . . . . . . . . . . . . . . . . . . 183Common Stocks . . . . . . . . . . . . . . . . . . . . . . . . . . . . . . . . . . . . . . . . . . . . . . . . . . . . . . . . . . . . 184Derivatives and Derivative Counterparties . . . . . . . . . . . . . . . . . . . . . . . . . . . . . . . . . . . . . . . . . . 185Float . . . . . . . . . . . . . . . . . . . . . . . . . . . . . . . . . . . . . . . . . . . . . . . . . . . . . . . . . . . . . . . . . . . . 186
Financial ConditionCapital Resources and Management . . . . . . . . . . . . . . . . . . . . . . . . . . . . . . . . . . . . . . . . . . . . . . 188Book Value per Share . . . . . . . . . . . . . . . . . . . . . . . . . . . . . . . . . . . . . . . . . . . . . . . . . . . . . . . . 190Liquidity . . . . . . . . . . . . . . . . . . . . . . . . . . . . . . . . . . . . . . . . . . . . . . . . . . . . . . . . . . . . . . . . . 191Contractual Obligations . . . . . . . . . . . . . . . . . . . . . . . . . . . . . . . . . . . . . . . . . . . . . . . . . . . . . . . 194
Accounting and Disclosure MattersManagement’s Evaluation of Disclosure Controls and Procedures . . . . . . . . . . . . . . . . . . . . . . . . . . 194Management’s Report on Internal Control Over Financial Reporting . . . . . . . . . . . . . . . . . . . . . . . . 194Critical Accounting Estimates and Judgments . . . . . . . . . . . . . . . . . . . . . . . . . . . . . . . . . . . . . . . . 195Significant Accounting Changes . . . . . . . . . . . . . . . . . . . . . . . . . . . . . . . . . . . . . . . . . . . . . . . . . 195Future Accounting Changes . . . . . . . . . . . . . . . . . . . . . . . . . . . . . . . . . . . . . . . . . . . . . . . . . . . . 195
Risk ManagementOverview . . . . . . . . . . . . . . . . . . . . . . . . . . . . . . . . . . . . . . . . . . . . . . . . . . . . . . . . . . . . . . . . . 196Issues and Risks . . . . . . . . . . . . . . . . . . . . . . . . . . . . . . . . . . . . . . . . . . . . . . . . . . . . . . . . . . . . 196
OtherQuarterly Data (unaudited) . . . . . . . . . . . . . . . . . . . . . . . . . . . . . . . . . . . . . . . . . . . . . . . . . . . . 205Stock Prices and Share Information . . . . . . . . . . . . . . . . . . . . . . . . . . . . . . . . . . . . . . . . . . . . . . . 205Compliance with Corporate Governance Rules . . . . . . . . . . . . . . . . . . . . . . . . . . . . . . . . . . . . . . . 206Forward-Looking Statements . . . . . . . . . . . . . . . . . . . . . . . . . . . . . . . . . . . . . . . . . . . . . . . . . . . 206
113
FAIRFAX FINANCIAL HOLDINGS LIMITED
Management’s Discussion and Analysis of Financial Condition and Results of Operations
(as of March 6, 2015)
(Figures and amounts are in US$ and $ millions except per share amounts and as otherwise indicated. Figures may not add dueto rounding.)
Notes to Management’s Discussion and Analysis of Financial Condition and Results of Operations
(1) Readers of the Management’s Discussion and Analysis of Financial Condition and Results of Operations(‘‘MD&A’’) should review the entire Annual Report for additional commentary and information. Additionalinformation relating to the company, including its annual information form, can be found on SEDAR atwww.sedar.com. Additional information can also be accessed from the company’s website www.fairfax.ca.
(2) Management analyzes and assesses the underlying insurance, reinsurance and runoff operations and thefinancial position of the consolidated group in various ways. Certain of the measures provided in thisAnnual Report, which have been used historically and disclosed regularly in Fairfax’s Annual Reports andinterim financial reporting, are non-GAAP measures. Where non-GAAP measures are used, descriptionshave been provided in the commentary as to the nature of the adjustments made.
(3) The combined ratio is the traditional measure of underwriting results of property and casualty companies. Anon-GAAP measure, the combined ratio is calculated by the company as the sum of the loss ratio (claimslosses and loss adjustment expenses expressed as a percentage of net premiums earned) and the expenseratio (commissions, premium acquisition costs and other underwriting expenses expressed as a percentageof net premiums earned). Other non-GAAP measures used by the company include the commission expenseratio (commissions expressed as a percentage of net premiums earned) and the accident year combined ratio(calculated in the same manner as the combined ratio but excluding the net favourable or adversedevelopment of reserves established for claims that occurred in previous accident years).
(4) ‘‘Interest and dividends’’ in this MD&A is derived from the consolidated statement of earnings prepared inaccordance with IFRS as issued by the IASB and is comprised of the sum of interest and dividends and shareof profit (loss) of associates. ‘‘Consolidated interest and dividend income’’ in this MD&A refers to interestand dividends as presented in the consolidated statement of earnings.
(5) The company’s long equity total return swaps allow the company to receive the total return on a notionalamount of an equity index or individual equity security (including dividends and capital gains or losses) inexchange for the payment of a floating rate of interest on the notional amount. Conversely, short equitytotal return swaps allow the company to pay the total return on a notional amount of an equity index orindividual equity security in exchange for the receipt of a floating rate of interest on the notional amount.Throughout this MD&A, the term ‘‘total return swap expense’’ refers to the net dividends and interest paidor received related to the company’s long and short equity and equity index total return swaps.
(6) Additional GAAP measures included in the Capital Resources and Management section of this MD&Ainclude: net debt divided by total equity, net debt divided by net total capital and total debt divided by totalcapital. The company also calculates an interest coverage ratio and an interest and preferred share dividenddistribution coverage ratio as a measure of its ability to service its debt and pay dividends to its preferredshareholders.
(7) Average annual return on average equity, a non-GAAP measure, is derived from segment balance sheets andsegment operating results. It is calculated for a reporting segment as the cumulative net earnings for aspecified period of time expressed as a percentage of average equity over the same period.
(8) Intercompany shareholdings are presented as ‘Investments in Fairfax affiliates’ on the segmented balancesheets and carried at cost.
(9) References in this MD&A to the company’s insurance and reinsurance operations do not include its runoffoperations.
114
Overview of Consolidated Performance
The insurance and reinsurance operations produced a record underwriting profit of $552.0 and combined ratio of90.8% in 2014 compared to underwriting profit of $440.0 and a combined ratio of 92.7% in 2013 with theyear-over-year improvement principally reflecting lower current period catastrophe losses, an increase in thenon-catastrophe underwriting margins related to the current accident year and higher net favourable prior yearreserve development. Operating income of the insurance and reinsurance operations (excluding net gains (losses) oninvestments) increased to $915.4 in 2014 from $770.2 in 2013 primarily as a result of higher underwriting profits andinterest and dividend income. Net premiums written by the insurance and reinsurance operations increased by 1.1%in 2014 (after adjusting for timing differences in recognizing crop insurance premiums written by OdysseyRe).
Net investment gains of $1,736.2 in 2014 (compared to net investment losses of $1,564.0 in 2013) were principallycomprised of net unrealized gains on bonds and net realized gains on equity and equity-related holdings after equityhedges. Consolidated interest and dividend income increased to $403.8 in 2014 from $376.9 in 2013 reflecting anincrease in interest income earned and lower total return swap expense. At December 31, 2014 the company hadholdings of cash and short term investments of $6,293.3 which accounted for 24.0% of its portfolio investments.
Reflecting significant net gains on investments and the increase in underwriting profit, partially offset by higher netadverse prior year reserve development at Runoff and the increased provision for income taxes, there was netearnings of $1,633.2 in 2014 compared to a net loss of $573.4 in 2013. Consequently, the company’s consolidatedtotal debt to total capital ratio decreased to 24.6% at December 31, 2014 from 26.1% at December 31, 2013, and itscommon shareholders’ equity at December 31, 2014 was $8,361.0 or $394.83 per basic share compared to $7,186.7 or$339.00 per basic share at December 31, 2013 (an increase of 19.5%, adjusted for the $10.00 per common sharedividend paid in the first quarter of 2014).
Maintaining its emphasis on financial soundness, the company held $1,244.3 of cash and investments at theholding company level ($1,212.7 net of $31.6 of holding company short sale and derivative obligations) atDecember 31, 2014 compared to $1,296.7 ($1,241.6 net of $55.1 of holding company short sale and derivativeobligations) at December 31, 2013.
Business Developments
Acquisitions and Divestitures
Subsequent to December 31, 2014
On February 16, 2015 the company announced that it had reached an agreement with the board of directors ofBrit PLC (‘‘Brit’’) regarding the terms of a recommended cash offer to acquire all of the outstanding shares of Brit(the ‘‘Brit Offer’’) for a total price of 305 pence per share, comprising 280 pence in cash to be paid by the companyand Brit’s announced 2014 final and special dividends of 25 pence (the ‘‘Brit Offer Price’’). The aggregate purchaseprice for the Brit Offer is approximately $1.88 billion (£1.22 billion). The Brit Offer is subject to customary closingconditions, including customary competition and merger conditions and other regulatory approvals as required. Britis a market-leading global Lloyd’s of London specialty insurer and reinsurer. The net proceeds from underwrittenpublic offerings of 1.15 million subordinate voting shares ($575.9 (Cdn$717.1)), 9.2 million Series M preferred shares($179.0 (Cdn$222.9)) and Cdn$350.0 of 4.95% Fairfax senior notes due 2025 ($275.7), all of which closed onMarch 3, 2015, will be used to finance the Brit Offer. The offerings are described in more detail in notes 15 (SubsidiaryIndebtedness, Long Term Debt and Credit Facilities) and 16 (Total Equity) to the consolidated financial statementsfor the year ended December 31, 2014.
On January 30, 2015 the company, through subsidiaries, acquired 30,000,000 multiple voting shares of Fairfax IndiaHoldings Corporation (‘‘Fairfax India’’) for $300.0 through a private placement. These multiple voting sharesrepresented approximately 95.2% of the voting rights and 28.3% of the equity interest in Fairfax India upon theclosing of its offerings (inclusive of the over-allotment of subordinate voting shares that closed on February 10,2015). Fairfax India was established, with the support of Fairfax, to invest in public and private equity securities anddebt instruments in India and Indian businesses or other businesses primarily conducted in or dependent on India.Hamblin Watsa is the portfolio advisor to Fairfax India and its subsidiaries. Fairfax India will be included in thecompany’s consolidated financial reporting commencing in the first quarter of 2015.
On January 1, 2015 the company acquired 78% of Union Assurance General Limited (‘‘Union Assurance’’) for cashconsideration of $26.8 (3.5 billion Sri Lankan rupees). Union Assurance is headquartered in Colombo, Sri Lanka and
115
FAIRFAX FINANCIAL HOLDINGS LIMITED
underwrites general insurance in Sri Lanka, specializing in automobile and personal accident lines of business andwriting approximately $41 of gross premiums written in 2013.
On December 16, 2014 the company entered into an agreement with QBE Insurance (Europe) Limited (‘‘QBE’’) toacquire QBE’s insurance operations in the Czech Republic, Hungary and Slovakia. The existing businesses andrenewal rights of QBE’s operations in the Czech Republic, Hungary and Slovakia are expected to be transferred toFairfax by the third quarter of 2015, subject to customary closing conditions, including various regulatory approvals.In QBE’s most recent fiscal year, its operations in the Czech Republic, Hungary and Slovakia generated over $40 ingross premiums written across a range of general insurance classes, including property, travel, general liability andproduct protection. On February 3, 2015 the company also entered into an agreement to acquire QBE’s generalinsurance operations in Ukraine, which generated over $5 of gross premiums written in 2014.
On December 1, 2014 the company entered into an agreement to acquire the general insurance business of MCISInsurance Berhad (formerly known as MCIS Zurich Insurance Berhad) (‘‘MCIS’’) through its wholly-ownedsubsidiary Pacific Insurance. The transaction is subject to customary closing conditions, including Malaysian courtapproval, and is expected to close in the first quarter of 2015. MCIS is an established general insurer in Malaysia withover $55 of gross premiums written in 2013 in its general insurance business.
Year ended December 31, 2014
In the fourth quarter of 2014, Fairfax centralized the ownership of its wholly-owned reinsurance and insurancecompany, Odyssey Re Holdings Corp. (‘‘OdysseyRe’’), under a single intermediate holding company in theU.S. (the ‘‘OdysseyRe reorganization’’). Prior to the OdysseyRe reorganization, OdysseyRe was owned by Crum &Forster (8.1%), Runoff (TIG Insurance) (20.1%) and Fairfax (71.8%, through various U.S. intermediate holdingcompanies).
The OdysseyRe reorganization was effected in order to accomplish the following in respect of Fairfax and its affiliates:simplify the ownership of OdysseyRe; enhance investment flexibility (principally at Crum & Forster and Runoff(TIG Insurance)); reduce certain risk charges applied by insurance regulators and rating agencies to the capital ofinsurance entities when they own investments in affiliated companies (this affected principally Crum & Forster andTIG Insurance); create a direct channel through which OdysseyRe may remit dividends to Fairfax; and reduceregulatory overlap among jurisdictions.
The OdysseyRe reorganization was principally comprised of the following transactions: OdysseyRe redeemed theinvestment of Crum & Forster in it and portions of the investments of Runoff and Fairfax in it in exchange for cashand unaffiliated marketable securities with fair values of $367.5, $510.1 and $12.8 respectively. The remainder ofRunoff’s investment in OdysseyRe (fair value of $380.7) was distributed to Fairfax as a tax-free dividend-in-kind.Crum & Forster and Runoff remitted to Fairfax a portion of the redemption proceeds received from OdysseyRe(Crum & Forster paid a dividend of $150.0 and Runoff made an intercompany advance of $350.0), from whichFairfax made a capital contribution to OdysseyRe of $400.0.
The OdysseyRe reorganization had no effect on Fairfax’s consolidated financial reporting; however, it impactedOdysseyRe, Crum & Forster and Runoff individually as follows:
OdysseyRe
OdysseyRe redeemed the investment of Crum & Forster in it and portions of the investments of Runoff and Fairfax init in exchange for cash and unaffiliated marketable securities with fair values of $367.5, $510.1 and $12.8respectively. Out of a portion of these redemption proceeds which were remitted by Crum & Forster and Runoff toFairfax, Fairfax made a capital contribution to OdysseyRe of $400.0. The net effect of these transactions onOdysseyRe’s shareholders’ equity was a decrease of $490.3. Notwithstanding the reorganization, the statutory capitalof OdysseyRe’s principal operating subsidiary (Odyssey Reinsurance Company) increased from $3,102.5 atDecember 31, 2013 to $3,248.7 at December 31, 2014, reflecting significant net earnings and net unrealizedinvestment gains in 2014.
Crum & Forster
OdysseyRe redeemed Crum & Forster’s investment in it (carrying value of $56.7) in exchange for cash andunaffiliated marketable securities with a fair value of $367.5, resulting in a non-taxable net gain on investment atCrum & Forster of $310.8 (this gain is eliminated in Fairfax’s consolidated financial reporting). Crum & Forster paid a
116

dividend of $150.0 to Fairfax from a portion of the proceeds received from OdysseyRe, comprised primarily ofU.S. municipal and corporate bonds and U.S. treasury bills. The net effect of these transactions increased Crum &Forster’s shareholders’ equity by $160.8 and decreased its statutory capital by $110.0 (the latter reflects the highercarrying value of the investment in OdysseyRe under statutory accounting principles). Notwithstanding the decreasein statutory capital, Crum & Forster’s risk-based capital ratio increased in 2014, principally as a result of animprovement in the composition of its investment portfolio.
Runoff
OdysseyRe redeemed a portion of Runoff’s investment in it (carrying value of $104.0) in exchange for cash andunaffiliated marketable securities with a fair value of $510.1, resulting in a non-taxable net gain on investment atRunoff of $406.1 (this gain is eliminated in Fairfax’s consolidated financial reporting). Runoff made an intercompanyadvance of $350.0 to Fairfax from a portion of the proceeds received from OdysseyRe, comprised primarily of cashand U.S. treasury bills. The intercompany advance bears interest at 5.2% per annum, and is repayable in equalinstallments over ten years. The remainder of Runoff’s investment in OdysseyRe (carrying value of $74.5) wasdistributed to Fairfax as a tax-free dividend-in-kind (fair value of $380.7). The net effect of these transactions was anincrease of $331.6 in Runoff’s shareholders’ equity and a decrease of $243.1 in TIG Insurance’s statutory capital(the latter reflects the higher carrying value of the investment in OdysseyRe under statutory accounting principles).Notwithstanding the decrease in statutory capital, Runoff’s risk-based capital increased in 2014, principally as a resultof an improvement in the composition of its investment portfolio.
On November 14, 2014 the company acquired all of the outstanding common shares, preferred shares and employeeshare options of Pethealth Inc. (‘‘Pethealth’’) for cash consideration of $88.7 (Cdn$100.4). The goodwill andintangible assets associated with Pethealth’s marketing of pet medical insurance were allocated to the Crum & Forster($90.9 comprised of $39.4 of goodwill, $47.3 of customer relationships and $4.2 of computer software) andNorthbridge ($17.3 comprised of $8.3 of goodwill, $8.0 of customer relationships and $1.0 of computer software)reporting segments since Crum & Forster & Northbridge were to become Pethealth’s ongoing insurance carriers.Pethealth’s residual assets and liabilities and results of operations were consolidated in the Other reporting segment.Pethealth is headquartered in Canada and provides pet medical insurance, related management software andpet-related database management services in North America and the United Kingdom.
During the first half of 2014 Thomas Cook India acquired a 41.9% ownership interest in Sterling Holiday Resorts(India) Limited (‘‘Sterling Resorts’’) for cash purchase consideration of $57.4 (3,534.6 million Indian rupees), andclassified its investment as an associate. On September 3, 2014 Thomas Cook India increased its ownership interest to55.1% by acquiring additional common shares of Sterling Resorts for cash consideration of $19.2 (1,162.6 millionIndian rupees). The assets and liabilities and results of operations of Sterling Resorts were consolidated within theOther reporting segment. Sterling Resorts is engaged in vacation ownership and leisure hospitality and operates anetwork of resorts in India. Refer to note 23 (Acquisitions and Divestitures) to the consolidated financial statementsfor the year ended December 31, 2014 for further details.
On June 5, 2014 Fairfax completed the acquisition of a 100% interest in Praktiker Hellas Commercial SocieteAnonyme (‘‘Praktiker’’) for cash purchase consideration of $28.6 (A21.0 million). The assets and liabilities and resultsof operations of Praktiker were consolidated in the Other reporting segment. Praktiker is one of the largest homeimprovement and do-it-yourself goods retailers in Greece, operating 14 stores.
On May 21, 2014 Fairfax Asia completed the acquisition of an 80.0% interest in PT Batavia Mitratama Insurance(subsequently renamed PT Fairfax Insurance Indonesia (‘‘Fairfax Indonesia’’)) for cash purchase consideration of$8.5 (98.2 billion Indonesian rupees). Subsequent to the acquisition, Fairfax Asia contributed an additional $12.9 toFairfax Indonesia (maintaining its 80.0% interest) to support business expansion. The assets and liabilities andresults of operations of Fairfax Indonesia were consolidated in the Insurance – Fairfax Asia reporting segment. FairfaxIndonesia is headquartered in Jakarta, Indonesia and underwrites general insurance, specializing in automobilecoverage in Indonesia.
On February 4, 2014 the company completed the acquisition of 51.0% of the outstanding common shares of KegRestaurants Limited (‘‘The Keg’’) for cash purchase consideration of $76.7 (Cdn$85.0). The assets and liabilities andresults of operations of The Keg were consolidated in the Other reporting segment. The Keg franchises, owns andoperates a network of premium dining restaurants across Canada and in select locations in the United States.
117
FAIRFAX FINANCIAL HOLDINGS LIMITED
Year ended December 31, 2013
On October 31, 2013 the company contributed its 81.7% interest in Prime Restaurants Inc. (‘‘Prime Restaurants’’) toCara Operations Limited (‘‘Cara’’) in exchange for Cara preferred shares and equity warrants with a combined fairvalue of $54.5 (Cdn$56.9). Subsequently, the company determined that it no longer controlled Prime Restaurantsand de-consolidated Prime Restaurants from its financial reporting effective October 31, 2013.
On October 3, 2013 Runoff acquired American Safety Insurance Holdings, Ltd. (‘‘American Safety’’). The renewalrights to American Safety’s environmental casualty, excess and surplus lines casualty, property and package lines ofbusiness and surety lines of business were assumed by Crum & Forster and Hudson Insurance Company (‘‘HudsonInsurance’’, a wholly-owned insurance subsidiary of OdysseyRe), respectively.
On July 3, 2013 Crum & Forster acquired a 100% interest in Hartville Group, Inc. (‘‘Hartville’’).
On May 14, 2013 Thomas Cook India acquired a 77.3% interest in IKYA Human Capital Solutions Private Limited(‘‘IKYA’’) for purchase consideration of $46.8 (2,563.2 million Indian rupees).
Refer to note 23 (Acquisitions and Divestitures) to the consolidated financial statements for the year endedDecember 31, 2014 for further details of these acquisitions.
Operating Environment
Insurance Environment
The property and casualty insurance and reinsurance industry is expected to report a second consecutive year ofunderwriting profitability in 2014 largely driven by the absence of major catastrophe losses and the continuedbenefit from favourable reserve development. Accident year combined ratios have generally remained below 100%as price increases in 2014 have generally kept pace with loss costs. The industry continues to feel the effects ofhistorically low interest rates that are negatively affecting operating income, offset somewhat by an increase ininvestment portfolios due to positive operating cash flows. If interest rates remain at these low levels, interest incomeearned in the future will likely continue to decline even further due to lower reinvestment rates. Strong performancein the equity markets in the U.S. and Canada and decreases in interest rates produced realized and unrealized gainson common stocks and bonds for many in the industry in 2014 and contributed to the overall growth in capital forthe industry. Equity markets are at all-time highs and interest rates are at historical lows, raising concern overwhether such trends can persist into the future. Insurance pricing on property lines of business declined, whilecasualty lines increased modestly in 2014. Larger account business continues to experience more pricing pressurethan medium-to-small account business. Insurance pricing in 2015 is likely to be affected by the direction of interestrates, probable lower levels of favourable reserve development, capacity available within the industry, the extent towhich a line of business is loss-affected and the general strength of the global economy.
The reinsurance sector remains overcapitalized as a result of recent strong earnings and additional capacity fromnon-traditional capital providers. Pricing on many reinsurance lines remains attractive; however, propertycatastrophe-exposed business has experienced double digit price decreases (primarily due to the absence ofsignificant catastrophe losses), while non-catastrophe property and casualty reinsurance business is experiencingmore moderate price decreases reflecting the factors described above affecting insurance pricing.
118
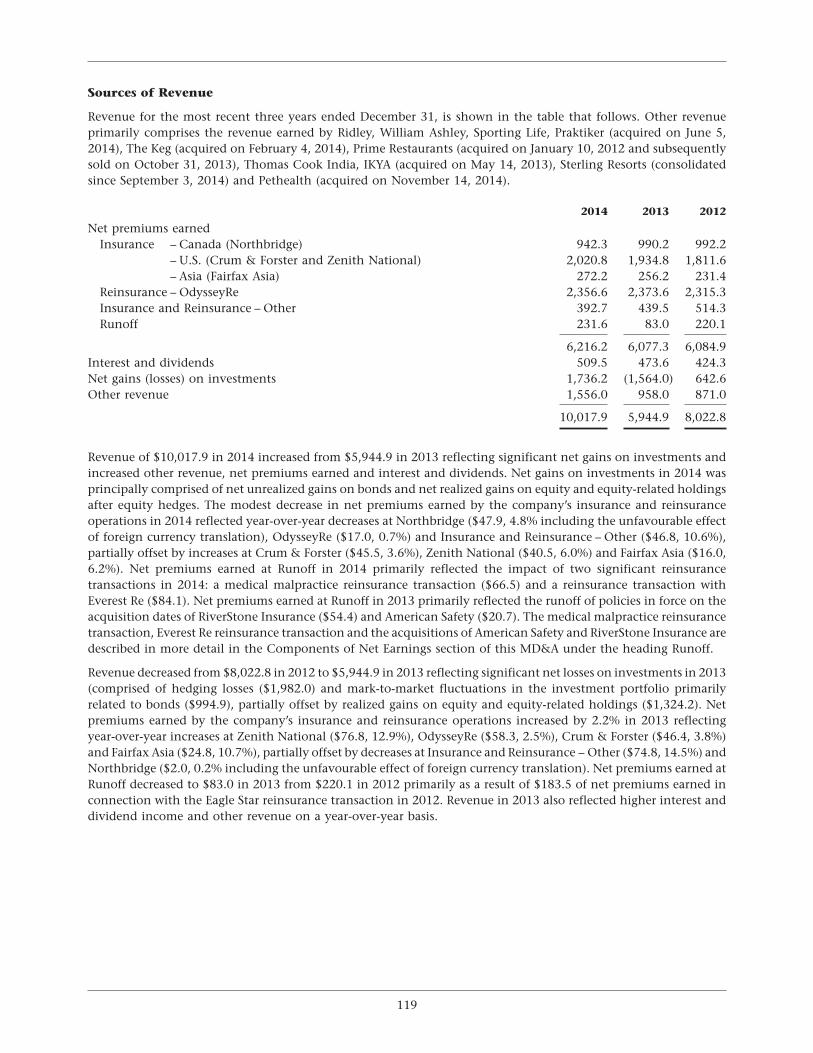
Sources of Revenue
Revenue for the most recent three years ended December 31, is shown in the table that follows. Other revenueprimarily comprises the revenue earned by Ridley, William Ashley, Sporting Life, Praktiker (acquired on June 5,2014), The Keg (acquired on February 4, 2014), Prime Restaurants (acquired on January 10, 2012 and subsequentlysold on October 31, 2013), Thomas Cook India, IKYA (acquired on May 14, 2013), Sterling Resorts (consolidatedsince September 3, 2014) and Pethealth (acquired on November 14, 2014).
2014 2013 2012
Net premiums earnedInsurance – Canada (Northbridge) 942.3 990.2 992.2
– U.S. (Crum & Forster and Zenith National) 2,020.8 1,934.8 1,811.6– Asia (Fairfax Asia) 272.2 256.2 231.4
Reinsurance – OdysseyRe 2,356.6 2,373.6 2,315.3Insurance and Reinsurance – Other 392.7 439.5 514.3Runoff 231.6 83.0 220.1
6,216.2 6,077.3 6,084.9Interest and dividends 509.5 473.6 424.3Net gains (losses) on investments 1,736.2 (1,564.0) 642.6Other revenue 1,556.0 958.0 871.0
10,017.9 5,944.9 8,022.8
Revenue of $10,017.9 in 2014 increased from $5,944.9 in 2013 reflecting significant net gains on investments andincreased other revenue, net premiums earned and interest and dividends. Net gains on investments in 2014 wasprincipally comprised of net unrealized gains on bonds and net realized gains on equity and equity-related holdingsafter equity hedges. The modest decrease in net premiums earned by the company’s insurance and reinsuranceoperations in 2014 reflected year-over-year decreases at Northbridge ($47.9, 4.8% including the unfavourable effectof foreign currency translation), OdysseyRe ($17.0, 0.7%) and Insurance and Reinsurance – Other ($46.8, 10.6%),partially offset by increases at Crum & Forster ($45.5, 3.6%), Zenith National ($40.5, 6.0%) and Fairfax Asia ($16.0,6.2%). Net premiums earned at Runoff in 2014 primarily reflected the impact of two significant reinsurancetransactions in 2014: a medical malpractice reinsurance transaction ($66.5) and a reinsurance transaction withEverest Re ($84.1). Net premiums earned at Runoff in 2013 primarily reflected the runoff of policies in force on theacquisition dates of RiverStone Insurance ($54.4) and American Safety ($20.7). The medical malpractice reinsurancetransaction, Everest Re reinsurance transaction and the acquisitions of American Safety and RiverStone Insurance aredescribed in more detail in the Components of Net Earnings section of this MD&A under the heading Runoff.
Revenue decreased from $8,022.8 in 2012 to $5,944.9 in 2013 reflecting significant net losses on investments in 2013(comprised of hedging losses ($1,982.0) and mark-to-market fluctuations in the investment portfolio primarilyrelated to bonds ($994.9), partially offset by realized gains on equity and equity-related holdings ($1,324.2). Netpremiums earned by the company’s insurance and reinsurance operations increased by 2.2% in 2013 reflectingyear-over-year increases at Zenith National ($76.8, 12.9%), OdysseyRe ($58.3, 2.5%), Crum & Forster ($46.4, 3.8%)and Fairfax Asia ($24.8, 10.7%), partially offset by decreases at Insurance and Reinsurance – Other ($74.8, 14.5%) andNorthbridge ($2.0, 0.2% including the unfavourable effect of foreign currency translation). Net premiums earned atRunoff decreased to $83.0 in 2013 from $220.1 in 2012 primarily as a result of $183.5 of net premiums earned inconnection with the Eagle Star reinsurance transaction in 2012. Revenue in 2013 also reflected higher interest anddividend income and other revenue on a year-over-year basis.
119
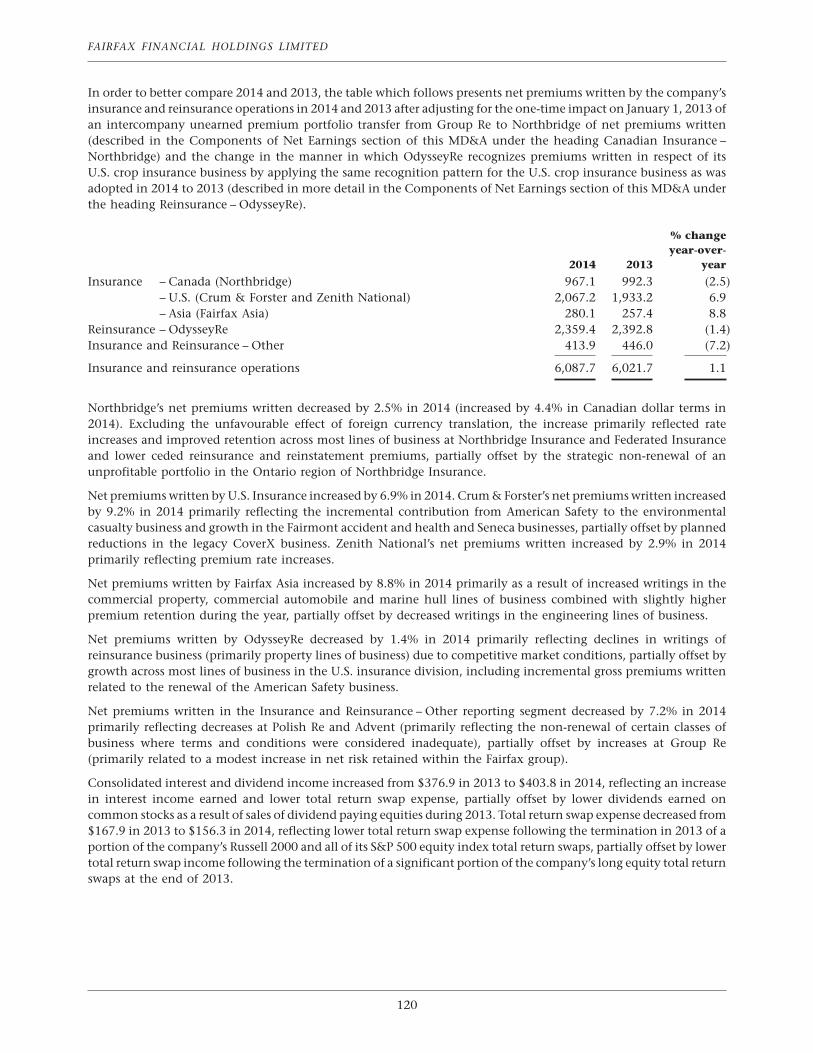
FAIRFAX FINANCIAL HOLDINGS LIMITED
In order to better compare 2014 and 2013, the table which follows presents net premiums written by the company’sinsurance and reinsurance operations in 2014 and 2013 after adjusting for the one-time impact on January 1, 2013 ofan intercompany unearned premium portfolio transfer from Group Re to Northbridge of net premiums written(described in the Components of Net Earnings section of this MD&A under the heading Canadian Insurance –Northbridge) and the change in the manner in which OdysseyRe recognizes premiums written in respect of itsU.S. crop insurance business by applying the same recognition pattern for the U.S. crop insurance business as wasadopted in 2014 to 2013 (described in more detail in the Components of Net Earnings section of this MD&A underthe heading Reinsurance – OdysseyRe).
% changeyear-over-
2014 2013 year
Insurance – Canada (Northbridge) 967.1 992.3 (2.5)– U.S. (Crum & Forster and Zenith National) 2,067.2 1,933.2 6.9– Asia (Fairfax Asia) 280.1 257.4 8.8
Reinsurance – OdysseyRe 2,359.4 2,392.8 (1.4)Insurance and Reinsurance – Other 413.9 446.0 (7.2)
Insurance and reinsurance operations 6,087.7 6,021.7 1.1
Northbridge’s net premiums written decreased by 2.5% in 2014 (increased by 4.4% in Canadian dollar terms in2014). Excluding the unfavourable effect of foreign currency translation, the increase primarily reflected rateincreases and improved retention across most lines of business at Northbridge Insurance and Federated Insuranceand lower ceded reinsurance and reinstatement premiums, partially offset by the strategic non-renewal of anunprofitable portfolio in the Ontario region of Northbridge Insurance.
Net premiums written by U.S. Insurance increased by 6.9% in 2014. Crum & Forster’s net premiums written increasedby 9.2% in 2014 primarily reflecting the incremental contribution from American Safety to the environmentalcasualty business and growth in the Fairmont accident and health and Seneca businesses, partially offset by plannedreductions in the legacy CoverX business. Zenith National’s net premiums written increased by 2.9% in 2014primarily reflecting premium rate increases.
Net premiums written by Fairfax Asia increased by 8.8% in 2014 primarily as a result of increased writings in thecommercial property, commercial automobile and marine hull lines of business combined with slightly higherpremium retention during the year, partially offset by decreased writings in the engineering lines of business.
Net premiums written by OdysseyRe decreased by 1.4% in 2014 primarily reflecting declines in writings ofreinsurance business (primarily property lines of business) due to competitive market conditions, partially offset bygrowth across most lines of business in the U.S. insurance division, including incremental gross premiums writtenrelated to the renewal of the American Safety business.
Net premiums written in the Insurance and Reinsurance – Other reporting segment decreased by 7.2% in 2014primarily reflecting decreases at Polish Re and Advent (primarily reflecting the non-renewal of certain classes ofbusiness where terms and conditions were considered inadequate), partially offset by increases at Group Re(primarily related to a modest increase in net risk retained within the Fairfax group).
Consolidated interest and dividend income increased from $376.9 in 2013 to $403.8 in 2014, reflecting an increasein interest income earned and lower total return swap expense, partially offset by lower dividends earned oncommon stocks as a result of sales of dividend paying equities during 2013. Total return swap expense decreased from$167.9 in 2013 to $156.3 in 2014, reflecting lower total return swap expense following the termination in 2013 of aportion of the company’s Russell 2000 and all of its S&P 500 equity index total return swaps, partially offset by lowertotal return swap income following the termination of a significant portion of the company’s long equity total returnswaps at the end of 2013.
120
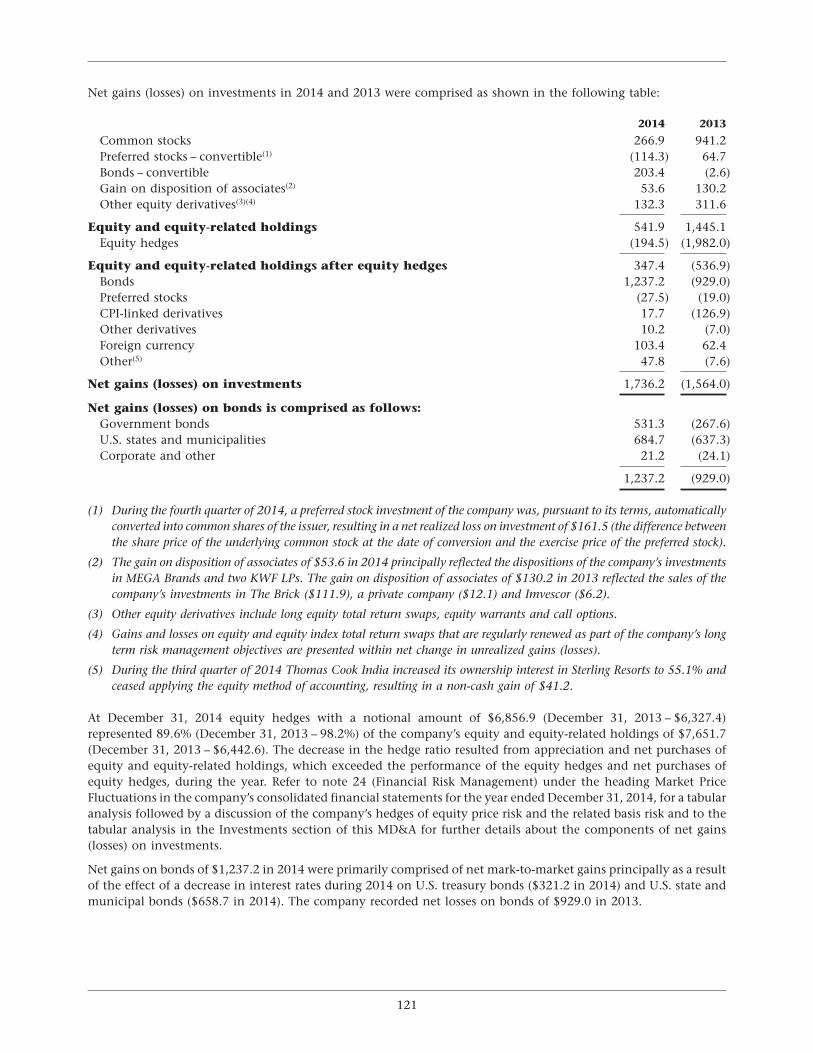
Net gains (losses) on investments in 2014 and 2013 were comprised as shown in the following table:
2014 2013
Common stocks 266.9 941.2Preferred stocks – convertible(1) (114.3) 64.7Bonds – convertible 203.4 (2.6)Gain on disposition of associates(2) 53.6 130.2Other equity derivatives(3)(4) 132.3 311.6
Equity and equity-related holdings 541.9 1,445.1Equity hedges (194.5) (1,982.0)
Equity and equity-related holdings after equity hedges 347.4 (536.9)Bonds 1,237.2 (929.0)Preferred stocks (27.5) (19.0)CPI-linked derivatives 17.7 (126.9)Other derivatives 10.2 (7.0)Foreign currency 103.4 62.4Other(5) 47.8 (7.6)
Net gains (losses) on investments 1,736.2 (1,564.0)
Net gains (losses) on bonds is comprised as follows:Government bonds 531.3 (267.6)U.S. states and municipalities 684.7 (637.3)Corporate and other 21.2 (24.1)
1,237.2 (929.0)
(1) During the fourth quarter of 2014, a preferred stock investment of the company was, pursuant to its terms, automaticallyconverted into common shares of the issuer, resulting in a net realized loss on investment of $161.5 (the difference betweenthe share price of the underlying common stock at the date of conversion and the exercise price of the preferred stock).
(2) The gain on disposition of associates of $53.6 in 2014 principally reflected the dispositions of the company’s investmentsin MEGA Brands and two KWF LPs. The gain on disposition of associates of $130.2 in 2013 reflected the sales of thecompany’s investments in The Brick ($111.9), a private company ($12.1) and Imvescor ($6.2).
(3) Other equity derivatives include long equity total return swaps, equity warrants and call options.
(4) Gains and losses on equity and equity index total return swaps that are regularly renewed as part of the company’s longterm risk management objectives are presented within net change in unrealized gains (losses).
(5) During the third quarter of 2014 Thomas Cook India increased its ownership interest in Sterling Resorts to 55.1% andceased applying the equity method of accounting, resulting in a non-cash gain of $41.2.
At December 31, 2014 equity hedges with a notional amount of $6,856.9 (December 31, 2013 – $6,327.4)represented 89.6% (December 31, 2013 – 98.2%) of the company’s equity and equity-related holdings of $7,651.7(December 31, 2013 – $6,442.6). The decrease in the hedge ratio resulted from appreciation and net purchases ofequity and equity-related holdings, which exceeded the performance of the equity hedges and net purchases ofequity hedges, during the year. Refer to note 24 (Financial Risk Management) under the heading Market PriceFluctuations in the company’s consolidated financial statements for the year ended December 31, 2014, for a tabularanalysis followed by a discussion of the company’s hedges of equity price risk and the related basis risk and to thetabular analysis in the Investments section of this MD&A for further details about the components of net gains(losses) on investments.
Net gains on bonds of $1,237.2 in 2014 were primarily comprised of net mark-to-market gains principally as a resultof the effect of a decrease in interest rates during 2014 on U.S. treasury bonds ($321.2 in 2014) and U.S. state andmunicipal bonds ($658.7 in 2014). The company recorded net losses on bonds of $929.0 in 2013.
121
FAIRFAX FINANCIAL HOLDINGS LIMITED
The company’s CPI-linked derivative contracts produced unrealized gains of $17.7 in 2014 compared to unrealizedlosses of $126.9 in 2013. Unrealized gains (losses) on CPI-linked derivative contracts typically reflect decreases(increases) in the values of the CPI indexes underlying those contracts during the periods presented (those contractsare structured to benefit the company during periods of decreasing CPI index values).
The increase in other revenue from $958.0 in 2013 to $1,556.0 in 2014, principally reflected the consolidation of therevenue of IKYA (acquired on May 14, 2013), The Keg (acquired on February 4, 2014) and Praktiker (acquired onJune 5, 2014), partially offset by lower revenue following the disposition of Prime Restaurants (sold onOctober 31, 2013).
Net Premiums Earned by Geographic Region
As presented in note 25 (Segmented Information) to the consolidated financial statements for the year endedDecember 31, 2014, on the basis of geographic regions, the United States, Canada, International and Asia accountedfor 58.3%, 16.7%, 14.9% and 10.1% respectively, of net premiums earned in 2014 compared to 55.6%, 18.0%, 17.1%and 9.3% respectively, of net premiums earned in 2013.
United States
Net premiums earned in the United States geographic region increased by 7.2% from $3,377.3 in 2013 to $3,622.1 in2014 primarily reflecting the impact on Runoff of the Everest Re reinsurance transaction and runoff of policies inforce on the acquisition date of American Safety, growth in the accident and health and environmental casualtybusiness at Crum & Forster, premium rate increases on workers’ compensation business at Zenith National andgrowth across most lines of the U.S. insurance business of OdysseyRe, partially offset by decreases in OdysseyRe’sreinsurance business.
Canada
Net premiums earned in the Canada geographic region decreased by 5.3% from $1,095.9 in 2013 to $1,037.5 in 2014primarily at Northbridge as a result of the unfavourable effect of the strengthening of the U.S. dollar relative to theCanadian dollar as measured by average annual rates of exchange, partially offset by premium rate increases andstronger retention rates.
International
Net premiums earned in the International geographic region decreased by 10.6% from $1,037.7 in 2013 to $927.3 in2014 principally reflecting decreases at OdysseyRe in its reinsurance business and the non-renewal of certain classesof business where terms and conditions were considered inadequate at Polish Re.
Asia
Net premiums earned in the Asia geographic region increased by 11.1% from $566.4 in 2013 to $629.3 in 2014primarily reflecting growth at Fairfax Asia.
Sources of Net Earnings
The following table presents the combined ratios and underwriting and operating results for each of the insuranceand reinsurance operations and, as applicable, for runoff operations, as well as the earnings contributions from theOther reporting segment for the years ended December 31, 2014, 2013 and 2012. In that table, interest and dividendsin the consolidated statements of earnings are presented separately as they relate to the insurance and reinsuranceoperating segments, and included in Runoff, Corporate overhead and other, and Other as they relate to thosesegments. Net realized gains before equity hedges, net change in unrealized gains (losses) before equity hedges and
122
equity hedging net losses are each shown separately to present more meaningfully the results of the company’sinvestment management strategies.
2014 2013 2012
Combined ratiosInsurance – Canada (Northbridge) 95.5% 98.2% 106.2%
– U.S. (Crum & Forster and Zenith National) 95.4% 100.3% 111.4%– Asia (Fairfax Asia) 86.7% 87.5% 87.0%
Reinsurance – OdysseyRe 84.7% 84.0% 88.5%Insurance and Reinsurance – Other 94.7% 96.6% 104.3%
Consolidated 90.8% 92.7% 99.9%
Sources of net earningsUnderwritingInsurance – Canada (Northbridge) 42.7 18.2 (61.7)
– U.S. (Crum & Forster and Zenith National) 92.0 (5.1) (206.3)– Asia (Fairfax Asia) 36.2 32.0 30.1
Reinsurance – OdysseyRe 360.4 379.9 265.8Insurance and Reinsurance – Other 20.7 15.0 (21.8)
Underwriting profit 552.0 440.0 6.1Interest and dividends – insurance and reinsurance 363.4 330.2 292.4
Operating income 915.4 770.2 298.5Runoff (excluding net gains (losses) on investments) (88.5) 77.3 14.6Other reporting segment 77.6 51.9 34.1Interest expense (206.3) (211.2) (208.2)Corporate overhead and other (96.5) (125.3) (132.6)
Pre-tax income before net gains (losses) on investments 601.7 562.9 6.4Net realized gains before equity hedges 777.6 1,379.6 1,058.7
Pre-tax income including net realized gains before equity hedges 1,379.3 1,942.5 1,065.1Net change in unrealized gains (losses) before equity hedges 1,153.1 (961.6) 589.4Equity hedging net losses (194.5) (1,982.0) (1,005.5)
Pre-tax income (loss) 2,337.9 (1,001.1) 649.0Income taxes (673.3) 436.6 (114.0)
Net earnings (loss) 1,664.6 (564.5) 535.0
Attributable to:Shareholders of Fairfax 1,633.2 (573.4) 526.9Non-controlling interests 31.4 8.9 8.1
1,664.6 (564.5) 535.0
Net earnings (loss) per share $ 74.43 $ (31.15) $ 22.95Net earnings (loss) per diluted share $ 73.01 $ (31.15) $ 22.68Cash dividends paid per share $ 10.00 $ 10.00 $ 10.00
The underwriting profit of the company’s insurance and reinsurance operations increased from $440.0 (combinedratio of 92.7%) in 2013 to $552.0 (combined ratio of 90.8%) in 2014 principally as a result of lower current periodcatastrophe losses, improvement in the non-catastrophe underwriting margins related to the current accident yearand higher net favourable prior year reserve development.
123
FAIRFAX FINANCIAL HOLDINGS LIMITED
Net favourable development of $445.7 (7.4 combined ratio points) in 2014 and $440.0 (7.3 combined ratio points) in2013 was comprised as follows:
2014 2013
Insurance – Canada (Northbridge) (110.2) (154.0)– U.S. (Crum & Forster and Zenith National) (72.6) (27.7)– Asia (Fairfax Asia) (20.6) (16.7)
Reinsurance – OdysseyRe (189.1) (214.7)Insurance and Reinsurance – Other (53.2) (26.9)
Insurance and reinsurance operations (445.7) (440.0)
Catastrophe losses which added 3.2 combined ratio points ($189.0) to the combined ratio in 2014 compared to4.8 combined ratio points ($289.3) in 2013 were comprised as follows:
2014 2013
Catastrophe Combined Catastrophe Combinedlosses(1) ratio impact losses(1) ratio impact
Windstorm Ela 41.7 0.7 – –Alberta floods – – 66.3 1.1Toronto floods – – 29.5 0.5Germany hail storms – – 27.0 0.5Typhoon Fitow – – 25.8 0.4Central Europe floods – – 19.7 0.3Other 147.3 2.5 121.0 2.0
189.0 3.2 points 289.3 4.8 points
(1) Net of reinstatement premiums.
The following table presents the components of the company’s combined ratios for the years endedDecember 31, 2014 and 2013:
2014 2013
Underwriting profit 552.0 440.0
Loss & LAE – accident year 66.4% 68.9%Commissions 16.0% 16.1%Underwriting expense 15.8% 15.0%
Combined ratio – accident year 98.2% 100.0%Net favourable development (7.4)% (7.3)%
Combined ratio – calendar year 90.8% 92.7%
The commission expense ratio of the company’s insurance and reinsurance operations decreased modestly from16.1% in 2013 to 16.0% in 2014 reflecting increased profit commission on reinsurance ceded by First Capital on itsproperty line of business and lower inward reinstatement premiums earned at OdysseyRe (which do not attractcommissions) and changes in the mix of business at Northbridge and OdysseyRe.
The underwriting expense ratio of the company’s insurance and reinsurance operations increased from 15.0% in2013 to 15.8% in 2014 due to increased underwriting expenses of 5.6% in 2014 (primarily reflecting increasedcompensation and legal expenses) and decreased net premiums earned of 0.2% in 2014.
124
Operating expenses in the consolidated statements of earnings include only the operating expenses of the company’sinsurance and reinsurance and runoff operations and corporate overhead. Operating expenses increased from$1,185.0 in 2013 to $1,227.2 in 2014 primarily as a result of increased underwriting expenses of the insurance andreinsurance operations (described above) and higher operating expenses at Runoff (primarily reflecting incrementaloperating expenses associated with the Everest Re reinsurance transaction and American Safety (acquired onOctober 3, 2013), partially offset by the release of a provision for uncollectible reinsurance), partially offset bydecreased Fairfax corporate overhead (primarily as a result of lower compensation expenses and legal fees andone-time expenses incurred in 2013 related to the acquisition of American Safety) and lower subsidiary companies’corporate overhead (primarily as a result of a non-recurring charge of $31.2 incurred at Northbridge in 2013 relatedto redundant software development costs, partially offset by higher restructuring costs and charitable donationsin 2014).
Other expenses increased from $910.3 in 2013 to $1,492.3 in 2014 primarily as a result of the consolidation of theoperating expenses of Praktiker (acquired on June 5, 2014), The Keg (acquired February 4, 2014) and IKYA (acquiredon May 14, 2013), partially offset by lower operating expenses following the disposition of Prime Restaurants (soldon October 31, 2013).
The company reported net earnings attributable to shareholders of Fairfax of $1,633.2 (net earnings of $74.43 perbasic and $73.01 per diluted share) in 2014 compared to a net loss attributable to shareholders of Fairfax of $573.4(a net loss of $31.15 per basic and diluted share) in 2013. The year-over-year increase in profitability was primarilydue to significant net gains on investments and the increase in underwriting profit, partially offset by higher netadverse prior year reserve development at Runoff and the increased provision for income taxes.
Common shareholders’ equity increased from $7,186.7 at December 31, 2013 to $8,361.0 at December 31, 2014primarily reflecting net earnings attributable to shareholders of Fairfax ($1,633.2), partially offset by decreasedaccumulated other comprehensive income (a decrease of $196.5 in 2014 primarily related to net unrealized foreigncurrency translation losses ($74.6), the share of other comprehensive loss of associates ($89.4 inclusive of actuariallosses related to associates’ defined benefit plans of $36.7) and actuarial losses related to the company’s subsidiaries’defined benefit plans ($32.5)) and the payment of dividends on the company’s common and preferred shares($272.6). Common shareholders’ equity at December 31, 2014 was $8,361.0 or $394.83 per basic share compared to$7,186.7 or $339.00 per basic share at December 31, 2013, representing an increase per basic share in 2014 of 16.5%(without adjustment for the $10.00 per common share dividend paid in the first quarter of 2014, or an increase of19.5% adjusted to include that dividend).
125
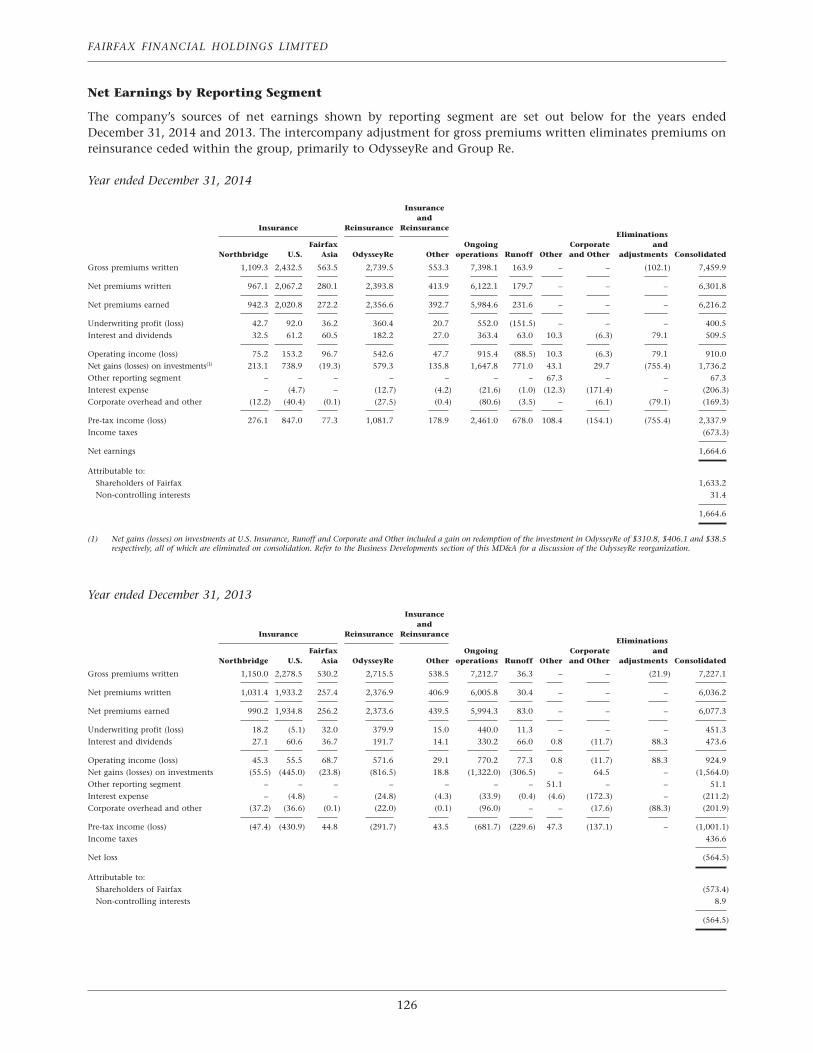
FAIRFAX FINANCIAL HOLDINGS LIMITED
Net Earnings by Reporting Segment
The company’s sources of net earnings shown by reporting segment are set out below for the years endedDecember 31, 2014 and 2013. The intercompany adjustment for gross premiums written eliminates premiums onreinsurance ceded within the group, primarily to OdysseyRe and Group Re.
Year ended December 31, 2014
Insuranceand
Insurance Reinsurance ReinsuranceEliminations
Fairfax Ongoing Corporate andNorthbridge U.S. Asia OdysseyRe Other operations Runoff Other and Other adjustments Consolidated
Gross premiums written 1,109.3 2,432.5 563.5 2,739.5 553.3 7,398.1 163.9 – – (102.1) 7,459.9
Net premiums written 967.1 2,067.2 280.1 2,393.8 413.9 6,122.1 179.7 – – – 6,301.8
Net premiums earned 942.3 2,020.8 272.2 2,356.6 392.7 5,984.6 231.6 – – – 6,216.2
Underwriting profit (loss) 42.7 92.0 36.2 360.4 20.7 552.0 (151.5) – – – 400.5
Interest and dividends 32.5 61.2 60.5 182.2 27.0 363.4 63.0 10.3 (6.3) 79.1 509.5
Operating income (loss) 75.2 153.2 96.7 542.6 47.7 915.4 (88.5) 10.3 (6.3) 79.1 910.0
Net gains (losses) on investments(1) 213.1 738.9 (19.3) 579.3 135.8 1,647.8 771.0 43.1 29.7 (755.4) 1,736.2
Other reporting segment – – – – – – – 67.3 – – 67.3
Interest expense – (4.7) – (12.7) (4.2) (21.6) (1.0) (12.3) (171.4) – (206.3)
Corporate overhead and other (12.2) (40.4) (0.1) (27.5) (0.4) (80.6) (3.5) – (6.1) (79.1) (169.3)
Pre-tax income (loss) 276.1 847.0 77.3 1,081.7 178.9 2,461.0 678.0 108.4 (154.1) (755.4) 2,337.9
Income taxes (673.3)
Net earnings 1,664.6
Attributable to:
Shareholders of Fairfax 1,633.2
Non-controlling interests 31.4
1,664.6
(1) Net gains (losses) on investments at U.S. Insurance, Runoff and Corporate and Other included a gain on redemption of the investment in OdysseyRe of $310.8, $406.1 and $38.5respectively, all of which are eliminated on consolidation. Refer to the Business Developments section of this MD&A for a discussion of the OdysseyRe reorganization.
Year ended December 31, 2013
Insuranceand
Insurance Reinsurance ReinsuranceEliminations
Fairfax Ongoing Corporate andNorthbridge U.S. Asia OdysseyRe Other operations Runoff Other and Other adjustments Consolidated
Gross premiums written 1,150.0 2,278.5 530.2 2,715.5 538.5 7,212.7 36.3 – – (21.9) 7,227.1
Net premiums written 1,031.4 1,933.2 257.4 2,376.9 406.9 6,005.8 30.4 – – – 6,036.2
Net premiums earned 990.2 1,934.8 256.2 2,373.6 439.5 5,994.3 83.0 – – – 6,077.3
Underwriting profit (loss) 18.2 (5.1) 32.0 379.9 15.0 440.0 11.3 – – – 451.3
Interest and dividends 27.1 60.6 36.7 191.7 14.1 330.2 66.0 0.8 (11.7) 88.3 473.6
Operating income (loss) 45.3 55.5 68.7 571.6 29.1 770.2 77.3 0.8 (11.7) 88.3 924.9
Net gains (losses) on investments (55.5) (445.0) (23.8) (816.5) 18.8 (1,322.0) (306.5) – 64.5 – (1,564.0)
Other reporting segment – – – – – – – 51.1 – – 51.1
Interest expense – (4.8) – (24.8) (4.3) (33.9) (0.4) (4.6) (172.3) – (211.2)
Corporate overhead and other (37.2) (36.6) (0.1) (22.0) (0.1) (96.0) – – (17.6) (88.3) (201.9)
Pre-tax income (loss) (47.4) (430.9) 44.8 (291.7) 43.5 (681.7) (229.6) 47.3 (137.1) – (1,001.1)
Income taxes 436.6
Net loss (564.5)
Attributable to:
Shareholders of Fairfax (573.4)
Non-controlling interests 8.9
(564.5)
126
Balance Sheets by Reporting Segment
The company’s segmented balance sheets as at December 31, 2014 and 2013 present the assets and liabilities of, andthe capital invested by the company in, each of the company’s major reporting segments. The segmented balancesheets have been prepared on the following basis:
(a) The balance sheet for each segment is on a legal entity basis for the subsidiaries within the segment and isprepared in accordance with IFRS and Fairfax’s accounting policies and include, where applicable, purchaseaccounting adjustments principally related to goodwill and intangible assets which arose on their initialacquisition or on a subsequent step acquisition by the company.
(b) Investments in Fairfax affiliates, which are carried at cost, are disclosed in the financial informationaccompanying the discussion of the company’s reporting segments. Affiliated insurance and reinsurancebalances, including premiums receivable (included in insurance contracts receivable), deferred premiumacquisition costs, recoverable from reinsurers, funds withheld payable to reinsurers, provision for losses andloss adjustment expenses and provision for unearned premiums, are not shown separately but areeliminated in Corporate and Other.
(c) Corporate and Other includes the Fairfax entity and its subsidiary intermediate holding companies as wellas the consolidating and eliminating entries required under IFRS to prepare consolidated financialstatements. The most significant of those entries are derived from the elimination of intercompanyreinsurance (primarily consisting of reinsurance provided by Group Re and reinsurance between OdysseyReand the primary insurers), which affects recoverable from reinsurers, provision for losses and lossadjustment expenses and unearned premiums. Corporate and Other long term debt of $2,656.5 as atDecember 31, 2014 (December 31, 2013 – $2,491.0) consisted of Fairfax debt of $2,514.7 (December 31,2013 – $2,337.7) and other long term obligations, comprised of the purchase consideration payable relatedto the TRG acquisition of $139.7 (December 31, 2013 – $144.2) and TIG trust preferred securities of $2.1(December 31, 2013 – $9.1).
127
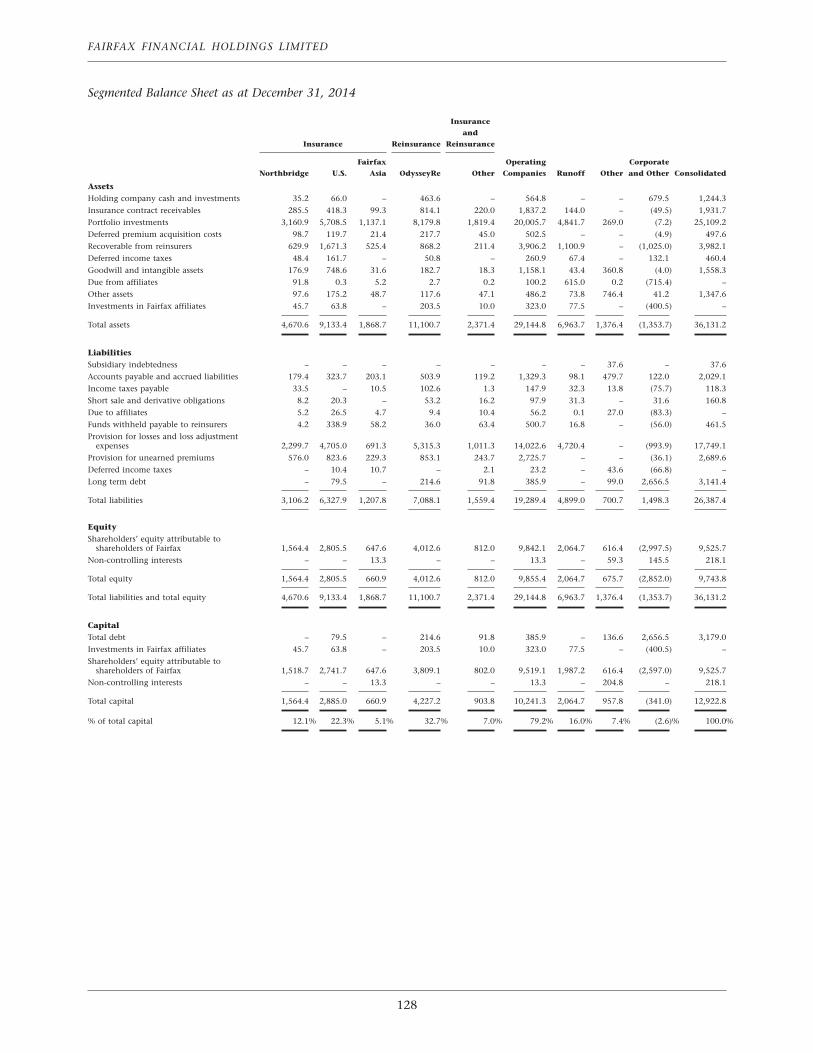
FAIRFAX FINANCIAL HOLDINGS LIMITED
Segmented Balance Sheet as at December 31, 2014
Insurance
and
Insurance Reinsurance Reinsurance
Fairfax Operating Corporate
Northbridge U.S. Asia OdysseyRe Other Companies Runoff Other and Other Consolidated
AssetsHolding company cash and investments 35.2 66.0 – 463.6 – 564.8 – – 679.5 1,244.3
Insurance contract receivables 285.5 418.3 99.3 814.1 220.0 1,837.2 144.0 – (49.5) 1,931.7
Portfolio investments 3,160.9 5,708.5 1,137.1 8,179.8 1,819.4 20,005.7 4,841.7 269.0 (7.2) 25,109.2
Deferred premium acquisition costs 98.7 119.7 21.4 217.7 45.0 502.5 – – (4.9) 497.6
Recoverable from reinsurers 629.9 1,671.3 525.4 868.2 211.4 3,906.2 1,100.9 – (1,025.0) 3,982.1
Deferred income taxes 48.4 161.7 – 50.8 – 260.9 67.4 – 132.1 460.4
Goodwill and intangible assets 176.9 748.6 31.6 182.7 18.3 1,158.1 43.4 360.8 (4.0) 1,558.3
Due from affiliates 91.8 0.3 5.2 2.7 0.2 100.2 615.0 0.2 (715.4) –
Other assets 97.6 175.2 48.7 117.6 47.1 486.2 73.8 746.4 41.2 1,347.6
Investments in Fairfax affiliates 45.7 63.8 – 203.5 10.0 323.0 77.5 – (400.5) –
Total assets 4,670.6 9,133.4 1,868.7 11,100.7 2,371.4 29,144.8 6,963.7 1,376.4 (1,353.7) 36,131.2
LiabilitiesSubsidiary indebtedness – – – – – – – 37.6 – 37.6
Accounts payable and accrued liabilities 179.4 323.7 203.1 503.9 119.2 1,329.3 98.1 479.7 122.0 2,029.1
Income taxes payable 33.5 – 10.5 102.6 1.3 147.9 32.3 13.8 (75.7) 118.3
Short sale and derivative obligations 8.2 20.3 – 53.2 16.2 97.9 31.3 – 31.6 160.8
Due to affiliates 5.2 26.5 4.7 9.4 10.4 56.2 0.1 27.0 (83.3) –
Funds withheld payable to reinsurers 4.2 338.9 58.2 36.0 63.4 500.7 16.8 – (56.0) 461.5
Provision for losses and loss adjustmentexpenses 2,299.7 4,705.0 691.3 5,315.3 1,011.3 14,022.6 4,720.4 – (993.9) 17,749.1
Provision for unearned premiums 576.0 823.6 229.3 853.1 243.7 2,725.7 – – (36.1) 2,689.6
Deferred income taxes – 10.4 10.7 – 2.1 23.2 – 43.6 (66.8) –
Long term debt – 79.5 – 214.6 91.8 385.9 – 99.0 2,656.5 3,141.4
Total liabilities 3,106.2 6,327.9 1,207.8 7,088.1 1,559.4 19,289.4 4,899.0 700.7 1,498.3 26,387.4
EquityShareholders’ equity attributable to
shareholders of Fairfax 1,564.4 2,805.5 647.6 4,012.6 812.0 9,842.1 2,064.7 616.4 (2,997.5) 9,525.7
Non-controlling interests – – 13.3 – – 13.3 – 59.3 145.5 218.1
Total equity 1,564.4 2,805.5 660.9 4,012.6 812.0 9,855.4 2,064.7 675.7 (2,852.0) 9,743.8
Total liabilities and total equity 4,670.6 9,133.4 1,868.7 11,100.7 2,371.4 29,144.8 6,963.7 1,376.4 (1,353.7) 36,131.2
CapitalTotal debt – 79.5 – 214.6 91.8 385.9 – 136.6 2,656.5 3,179.0
Investments in Fairfax affiliates 45.7 63.8 – 203.5 10.0 323.0 77.5 – (400.5) –
Shareholders’ equity attributable toshareholders of Fairfax 1,518.7 2,741.7 647.6 3,809.1 802.0 9,519.1 1,987.2 616.4 (2,597.0) 9,525.7
Non-controlling interests – – 13.3 – – 13.3 – 204.8 – 218.1
Total capital 1,564.4 2,885.0 660.9 4,227.2 903.8 10,241.3 2,064.7 957.8 (341.0) 12,922.8
% of total capital 12.1% 22.3% 5.1% 32.7% 7.0% 79.2% 16.0% 7.4% (2.6)% 100.0%
128
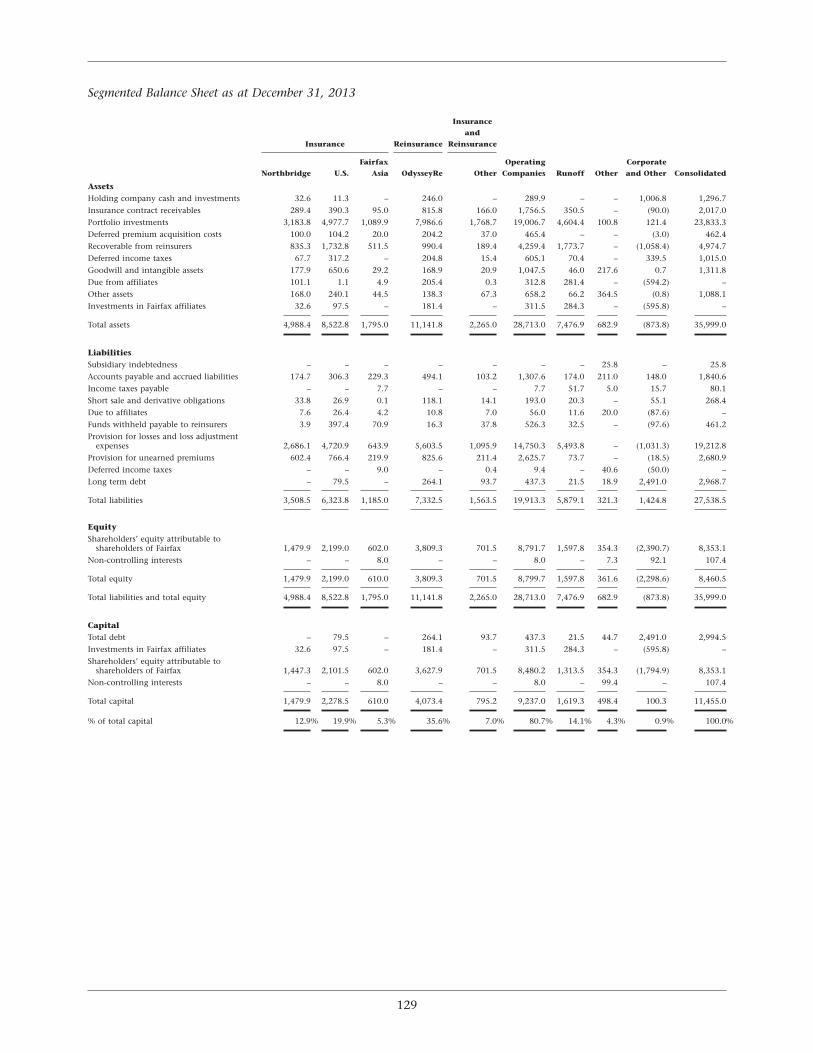
Segmented Balance Sheet as at December 31, 2013
Insurance
and
Insurance Reinsurance Reinsurance
Fairfax Operating Corporate
Northbridge U.S. Asia OdysseyRe Other Companies Runoff Other and Other Consolidated
AssetsHolding company cash and investments 32.6 11.3 – 246.0 – 289.9 – – 1,006.8 1,296.7
Insurance contract receivables 289.4 390.3 95.0 815.8 166.0 1,756.5 350.5 – (90.0) 2,017.0
Portfolio investments 3,183.8 4,977.7 1,089.9 7,986.6 1,768.7 19,006.7 4,604.4 100.8 121.4 23,833.3
Deferred premium acquisition costs 100.0 104.2 20.0 204.2 37.0 465.4 – – (3.0) 462.4
Recoverable from reinsurers 835.3 1,732.8 511.5 990.4 189.4 4,259.4 1,773.7 – (1,058.4) 4,974.7
Deferred income taxes 67.7 317.2 – 204.8 15.4 605.1 70.4 – 339.5 1,015.0
Goodwill and intangible assets 177.9 650.6 29.2 168.9 20.9 1,047.5 46.0 217.6 0.7 1,311.8
Due from affiliates 101.1 1.1 4.9 205.4 0.3 312.8 281.4 – (594.2) –
Other assets 168.0 240.1 44.5 138.3 67.3 658.2 66.2 364.5 (0.8) 1,088.1
Investments in Fairfax affiliates 32.6 97.5 – 181.4 – 311.5 284.3 – (595.8) –
Total assets 4,988.4 8,522.8 1,795.0 11,141.8 2,265.0 28,713.0 7,476.9 682.9 (873.8) 35,999.0
LiabilitiesSubsidiary indebtedness – – – – – – – 25.8 – 25.8
Accounts payable and accrued liabilities 174.7 306.3 229.3 494.1 103.2 1,307.6 174.0 211.0 148.0 1,840.6
Income taxes payable – – 7.7 – – 7.7 51.7 5.0 15.7 80.1
Short sale and derivative obligations 33.8 26.9 0.1 118.1 14.1 193.0 20.3 – 55.1 268.4
Due to affiliates 7.6 26.4 4.2 10.8 7.0 56.0 11.6 20.0 (87.6) –
Funds withheld payable to reinsurers 3.9 397.4 70.9 16.3 37.8 526.3 32.5 – (97.6) 461.2
Provision for losses and loss adjustmentexpenses 2,686.1 4,720.9 643.9 5,603.5 1,095.9 14,750.3 5,493.8 – (1,031.3) 19,212.8
Provision for unearned premiums 602.4 766.4 219.9 825.6 211.4 2,625.7 73.7 – (18.5) 2,680.9
Deferred income taxes – – 9.0 – 0.4 9.4 – 40.6 (50.0) –
Long term debt – 79.5 – 264.1 93.7 437.3 21.5 18.9 2,491.0 2,968.7
Total liabilities 3,508.5 6,323.8 1,185.0 7,332.5 1,563.5 19,913.3 5,879.1 321.3 1,424.8 27,538.5
EquityShareholders’ equity attributable to
shareholders of Fairfax 1,479.9 2,199.0 602.0 3,809.3 701.5 8,791.7 1,597.8 354.3 (2,390.7) 8,353.1
Non-controlling interests – – 8.0 – – 8.0 – 7.3 92.1 107.4
Total equity 1,479.9 2,199.0 610.0 3,809.3 701.5 8,799.7 1,597.8 361.6 (2,298.6) 8,460.5
Total liabilities and total equity 4,988.4 8,522.8 1,795.0 11,141.8 2,265.0 28,713.0 7,476.9 682.9 (873.8) 35,999.0
CapitalTotal debt – 79.5 – 264.1 93.7 437.3 21.5 44.7 2,491.0 2,994.5
Investments in Fairfax affiliates 32.6 97.5 – 181.4 – 311.5 284.3 – (595.8) –
Shareholders’ equity attributable toshareholders of Fairfax 1,447.3 2,101.5 602.0 3,627.9 701.5 8,480.2 1,313.5 354.3 (1,794.9) 8,353.1
Non-controlling interests – – 8.0 – – 8.0 – 99.4 – 107.4
Total capital 1,479.9 2,278.5 610.0 4,073.4 795.2 9,237.0 1,619.3 498.4 100.3 11,455.0
% of total capital 12.9% 19.9% 5.3% 35.6% 7.0% 80.7% 14.1% 4.3% 0.9% 100.0%
129
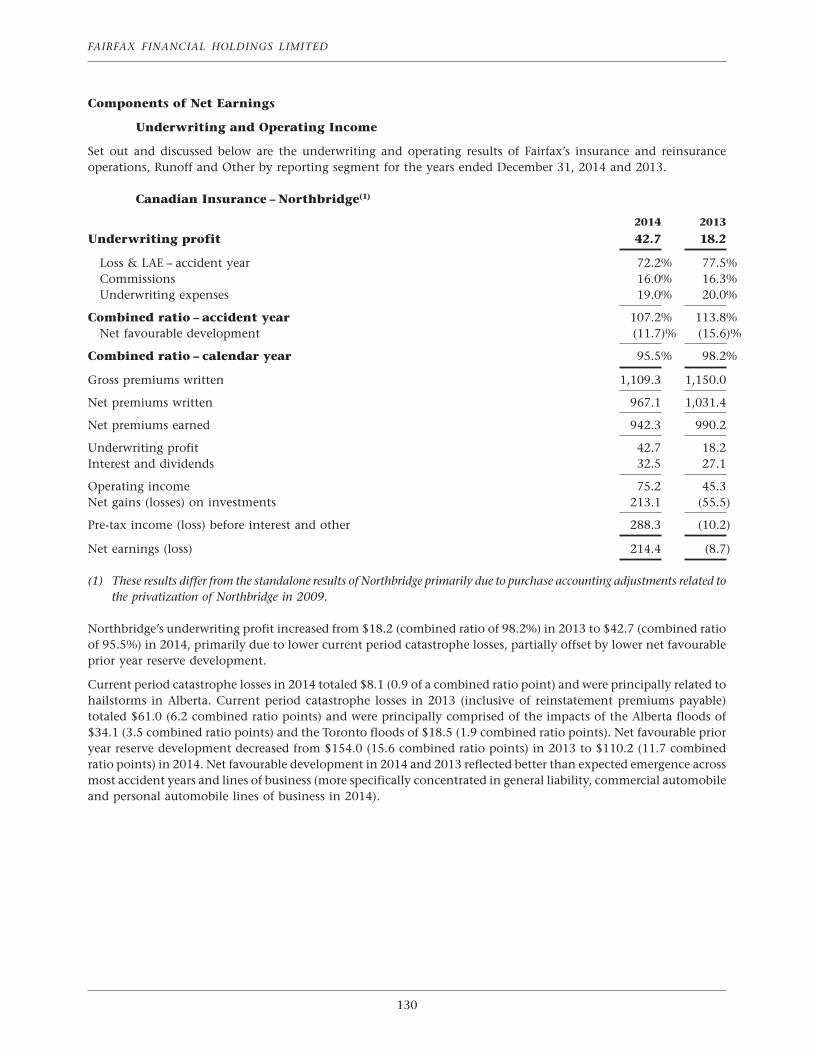
Components of Net Earnings
Underwriting and Operating Income
Set out and discussed below are the underwriting and operating results of Fairfax’s insurance and reinsuranceoperations, Runoff and Other by reporting segment for the years ended December 31, 2014 and 2013.
Canadian Insurance – Northbridge(1)
2014 2013
Underwriting profit 42.7 18.2
Loss & LAE – accident year 72.2% 77.5%Commissions 16.0% 16.3%Underwriting expenses 19.0% 20.0%
Combined ratio – accident year 107.2% 113.8%Net favourable development (11.7)% (15.6)%
Combined ratio – calendar year 95.5% 98.2%
Gross premiums written 1,109.3 1,150.0
Net premiums written 967.1 1,031.4
Net premiums earned 942.3 990.2
Underwriting profit 42.7 18.2Interest and dividends 32.5 27.1
Operating income 75.2 45.3Net gains (losses) on investments 213.1 (55.5)
Pre-tax income (loss) before interest and other 288.3 (10.2)
Net earnings (loss) 214.4 (8.7)
(1) These results differ from the standalone results of Northbridge primarily due to purchase accounting adjustments related tothe privatization of Northbridge in 2009.
Northbridge’s underwriting profit increased from $18.2 (combined ratio of 98.2%) in 2013 to $42.7 (combined ratioof 95.5%) in 2014, primarily due to lower current period catastrophe losses, partially offset by lower net favourableprior year reserve development.
Current period catastrophe losses in 2014 totaled $8.1 (0.9 of a combined ratio point) and were principally related tohailstorms in Alberta. Current period catastrophe losses in 2013 (inclusive of reinstatement premiums payable)totaled $61.0 (6.2 combined ratio points) and were principally comprised of the impacts of the Alberta floods of$34.1 (3.5 combined ratio points) and the Toronto floods of $18.5 (1.9 combined ratio points). Net favourable prioryear reserve development decreased from $154.0 (15.6 combined ratio points) in 2013 to $110.2 (11.7 combinedratio points) in 2014. Net favourable development in 2014 and 2013 reflected better than expected emergence acrossmost accident years and lines of business (more specifically concentrated in general liability, commercial automobileand personal automobile lines of business in 2014).
130
FAIRFAX FINANCIAL HOLDINGS LIMITED
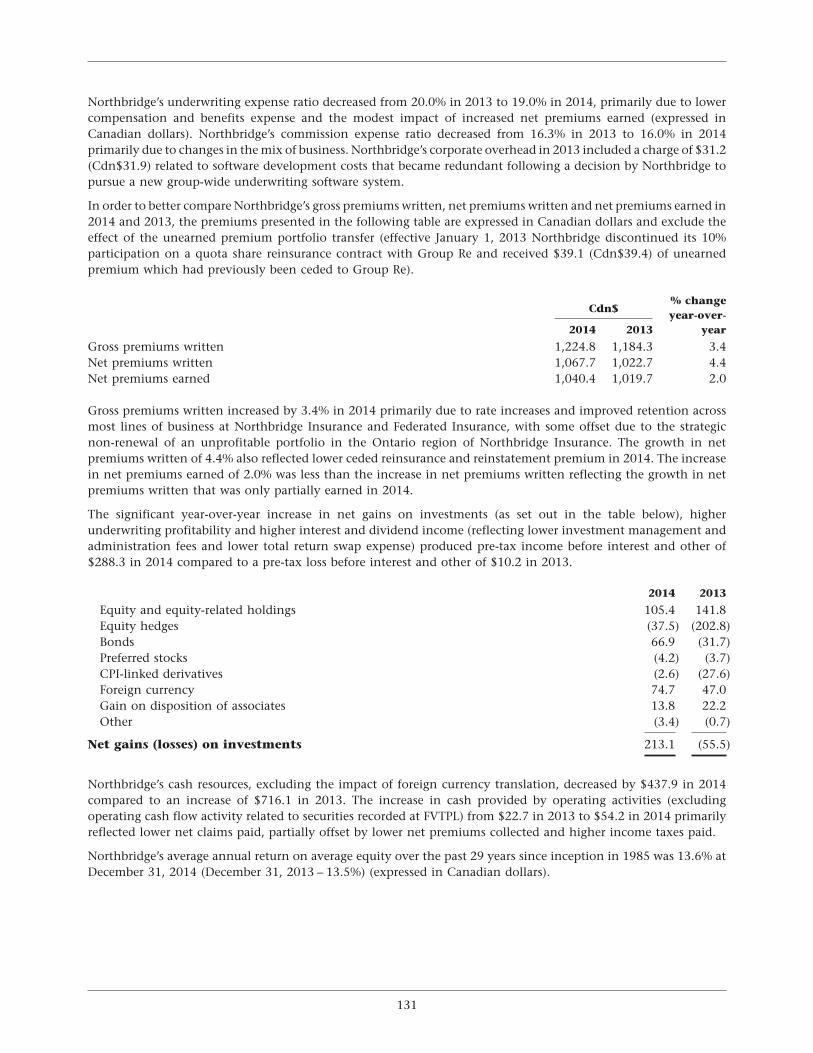
Northbridge’s underwriting expense ratio decreased from 20.0% in 2013 to 19.0% in 2014, primarily due to lowercompensation and benefits expense and the modest impact of increased net premiums earned (expressed inCanadian dollars). Northbridge’s commission expense ratio decreased from 16.3% in 2013 to 16.0% in 2014primarily due to changes in the mix of business. Northbridge’s corporate overhead in 2013 included a charge of $31.2(Cdn$31.9) related to software development costs that became redundant following a decision by Northbridge topursue a new group-wide underwriting software system.
In order to better compare Northbridge’s gross premiums written, net premiums written and net premiums earned in2014 and 2013, the premiums presented in the following table are expressed in Canadian dollars and exclude theeffect of the unearned premium portfolio transfer (effective January 1, 2013 Northbridge discontinued its 10%participation on a quota share reinsurance contract with Group Re and received $39.1 (Cdn$39.4) of unearnedpremium which had previously been ceded to Group Re).
% changeCdn$
year-over-2014 2013 year
Gross premiums written 1,224.8 1,184.3 3.4Net premiums written 1,067.7 1,022.7 4.4Net premiums earned 1,040.4 1,019.7 2.0
Gross premiums written increased by 3.4% in 2014 primarily due to rate increases and improved retention acrossmost lines of business at Northbridge Insurance and Federated Insurance, with some offset due to the strategicnon-renewal of an unprofitable portfolio in the Ontario region of Northbridge Insurance. The growth in netpremiums written of 4.4% also reflected lower ceded reinsurance and reinstatement premium in 2014. The increasein net premiums earned of 2.0% was less than the increase in net premiums written reflecting the growth in netpremiums written that was only partially earned in 2014.
The significant year-over-year increase in net gains on investments (as set out in the table below), higherunderwriting profitability and higher interest and dividend income (reflecting lower investment management andadministration fees and lower total return swap expense) produced pre-tax income before interest and other of$288.3 in 2014 compared to a pre-tax loss before interest and other of $10.2 in 2013.
2014 2013
Equity and equity-related holdings 105.4 141.8Equity hedges (37.5) (202.8)Bonds 66.9 (31.7)Preferred stocks (4.2) (3.7)CPI-linked derivatives (2.6) (27.6)Foreign currency 74.7 47.0Gain on disposition of associates 13.8 22.2Other (3.4) (0.7)
Net gains (losses) on investments 213.1 (55.5)
Northbridge’s cash resources, excluding the impact of foreign currency translation, decreased by $437.9 in 2014compared to an increase of $716.1 in 2013. The increase in cash provided by operating activities (excludingoperating cash flow activity related to securities recorded at FVTPL) from $22.7 in 2013 to $54.2 in 2014 primarilyreflected lower net claims paid, partially offset by lower net premiums collected and higher income taxes paid.
Northbridge’s average annual return on average equity over the past 29 years since inception in 1985 was 13.6% atDecember 31, 2014 (December 31, 2013 – 13.5%) (expressed in Canadian dollars).
131
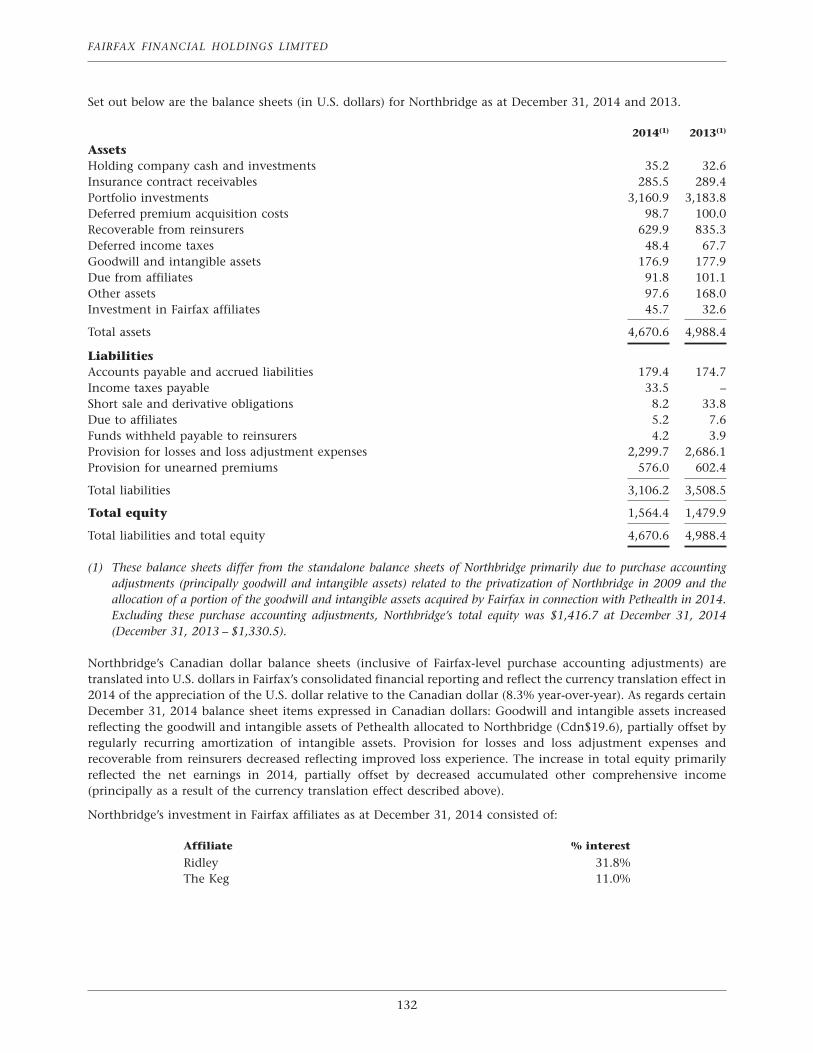
Set out below are the balance sheets (in U.S. dollars) for Northbridge as at December 31, 2014 and 2013.
2014(1) 2013(1)
AssetsHolding company cash and investments 35.2 32.6Insurance contract receivables 285.5 289.4Portfolio investments 3,160.9 3,183.8Deferred premium acquisition costs 98.7 100.0Recoverable from reinsurers 629.9 835.3Deferred income taxes 48.4 67.7Goodwill and intangible assets 176.9 177.9Due from affiliates 91.8 101.1Other assets 97.6 168.0Investment in Fairfax affiliates 45.7 32.6
Total assets 4,670.6 4,988.4
LiabilitiesAccounts payable and accrued liabilities 179.4 174.7Income taxes payable 33.5 –Short sale and derivative obligations 8.2 33.8Due to affiliates 5.2 7.6Funds withheld payable to reinsurers 4.2 3.9Provision for losses and loss adjustment expenses 2,299.7 2,686.1Provision for unearned premiums 576.0 602.4
Total liabilities 3,106.2 3,508.5
Total equity 1,564.4 1,479.9
Total liabilities and total equity 4,670.6 4,988.4
(1) These balance sheets differ from the standalone balance sheets of Northbridge primarily due to purchase accountingadjustments (principally goodwill and intangible assets) related to the privatization of Northbridge in 2009 and theallocation of a portion of the goodwill and intangible assets acquired by Fairfax in connection with Pethealth in 2014.Excluding these purchase accounting adjustments, Northbridge’s total equity was $1,416.7 at December 31, 2014(December 31, 2013 – $1,330.5).
Northbridge’s Canadian dollar balance sheets (inclusive of Fairfax-level purchase accounting adjustments) aretranslated into U.S. dollars in Fairfax’s consolidated financial reporting and reflect the currency translation effect in2014 of the appreciation of the U.S. dollar relative to the Canadian dollar (8.3% year-over-year). As regards certainDecember 31, 2014 balance sheet items expressed in Canadian dollars: Goodwill and intangible assets increasedreflecting the goodwill and intangible assets of Pethealth allocated to Northbridge (Cdn$19.6), partially offset byregularly recurring amortization of intangible assets. Provision for losses and loss adjustment expenses andrecoverable from reinsurers decreased reflecting improved loss experience. The increase in total equity primarilyreflected the net earnings in 2014, partially offset by decreased accumulated other comprehensive income(principally as a result of the currency translation effect described above).
Northbridge’s investment in Fairfax affiliates as at December 31, 2014 consisted of:
Affiliate % interest
Ridley 31.8%The Keg 11.0%
132
FAIRFAX FINANCIAL HOLDINGS LIMITED
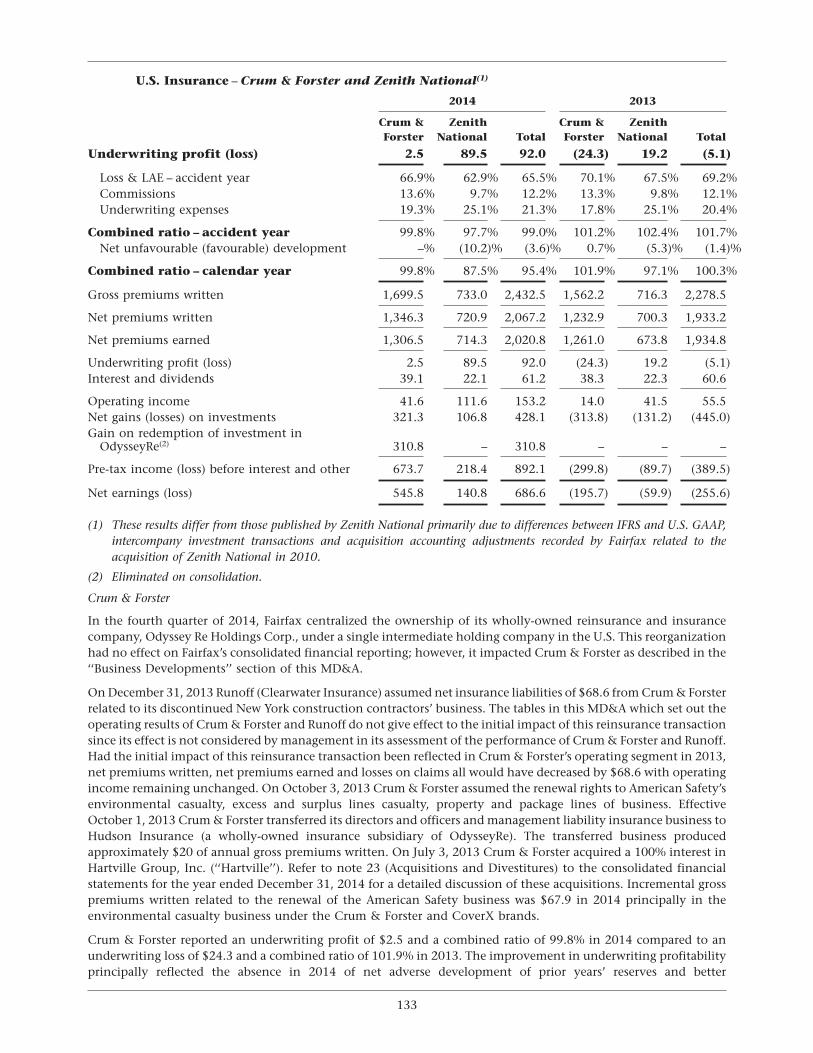
U.S. Insurance – Crum & Forster and Zenith National(1)
2014 2013
Crum & Zenith Crum & ZenithForster National Total Forster National Total
Underwriting profit (loss) 2.5 89.5 92.0 (24.3) 19.2 (5.1)
Loss & LAE – accident year 66.9% 62.9% 65.5% 70.1% 67.5% 69.2%Commissions 13.6% 9.7% 12.2% 13.3% 9.8% 12.1%Underwriting expenses 19.3% 25.1% 21.3% 17.8% 25.1% 20.4%
Combined ratio – accident year 99.8% 97.7% 99.0% 101.2% 102.4% 101.7%Net unfavourable (favourable) development –% (10.2)% (3.6)% 0.7% (5.3)% (1.4)%
Combined ratio – calendar year 99.8% 87.5% 95.4% 101.9% 97.1% 100.3%
Gross premiums written 1,699.5 733.0 2,432.5 1,562.2 716.3 2,278.5
Net premiums written 1,346.3 720.9 2,067.2 1,232.9 700.3 1,933.2
Net premiums earned 1,306.5 714.3 2,020.8 1,261.0 673.8 1,934.8
Underwriting profit (loss) 2.5 89.5 92.0 (24.3) 19.2 (5.1)Interest and dividends 39.1 22.1 61.2 38.3 22.3 60.6
Operating income 41.6 111.6 153.2 14.0 41.5 55.5Net gains (losses) on investments 321.3 106.8 428.1 (313.8) (131.2) (445.0)Gain on redemption of investment in
OdysseyRe(2) 310.8 – 310.8 – – –
Pre-tax income (loss) before interest and other 673.7 218.4 892.1 (299.8) (89.7) (389.5)
Net earnings (loss) 545.8 140.8 686.6 (195.7) (59.9) (255.6)
(1) These results differ from those published by Zenith National primarily due to differences between IFRS and U.S. GAAP,intercompany investment transactions and acquisition accounting adjustments recorded by Fairfax related to theacquisition of Zenith National in 2010.
(2) Eliminated on consolidation.
Crum & Forster
In the fourth quarter of 2014, Fairfax centralized the ownership of its wholly-owned reinsurance and insurancecompany, Odyssey Re Holdings Corp., under a single intermediate holding company in the U.S. This reorganizationhad no effect on Fairfax’s consolidated financial reporting; however, it impacted Crum & Forster as described in the‘‘Business Developments’’ section of this MD&A.
On December 31, 2013 Runoff (Clearwater Insurance) assumed net insurance liabilities of $68.6 from Crum & Forsterrelated to its discontinued New York construction contractors’ business. The tables in this MD&A which set out theoperating results of Crum & Forster and Runoff do not give effect to the initial impact of this reinsurance transactionsince its effect is not considered by management in its assessment of the performance of Crum & Forster and Runoff.Had the initial impact of this reinsurance transaction been reflected in Crum & Forster’s operating segment in 2013,net premiums written, net premiums earned and losses on claims all would have decreased by $68.6 with operatingincome remaining unchanged. On October 3, 2013 Crum & Forster assumed the renewal rights to American Safety’senvironmental casualty, excess and surplus lines casualty, property and package lines of business. EffectiveOctober 1, 2013 Crum & Forster transferred its directors and officers and management liability insurance business toHudson Insurance (a wholly-owned insurance subsidiary of OdysseyRe). The transferred business producedapproximately $20 of annual gross premiums written. On July 3, 2013 Crum & Forster acquired a 100% interest inHartville Group, Inc. (‘‘Hartville’’). Refer to note 23 (Acquisitions and Divestitures) to the consolidated financialstatements for the year ended December 31, 2014 for a detailed discussion of these acquisitions. Incremental grosspremiums written related to the renewal of the American Safety business was $67.9 in 2014 principally in theenvironmental casualty business under the Crum & Forster and CoverX brands.
Crum & Forster reported an underwriting profit of $2.5 and a combined ratio of 99.8% in 2014 compared to anunderwriting loss of $24.3 and a combined ratio of 101.9% in 2013. The improvement in underwriting profitabilityprincipally reflected the absence in 2014 of net adverse development of prior years’ reserves and better
133
non-catastrophe underwriting margins related to the current accident year (primarily reflecting the impact ofunderwriting actions that have improved the performance of the legacy CoverX business and the impact of a singlelarge loss of $8.0 (0.6 of a combined ratio point) in 2013), partially offset by a modest increase in operating expenses.
There was no net prior year reserve development in 2014 whereas the underwriting results in 2013 included $8.3 (0.7of a combined ratio point) of net adverse prior year reserve development, primarily related to general liability lossreserves at First Mercury, partially offset by net favourable prior year reserve development related to a single largeliability claim at Crum & Forster. Current period catastrophe losses in 2014 primarily related to the effects of stormsand severe winter weather in the U.S. northeast and storms in the U.S. midwest and totaled $14.3 (1.1 combined ratiopoints). Current period catastrophe losses in 2013 totaled $3.7 (0.3 of a combined ratio point).
Crum & Forster’s underwriting expense ratio (excluding commissions) increased from 17.8% in 2013 to 19.3% in2014, primarily as a result of increased employee compensation and benefit costs necessary to support the growth ingross premiums written and incremental costs related to American Safety.
Gross premiums written increased by 8.8% from $1,562.2 in 2013 to $1,699.5 in 2014 reflecting the incrementalcontribution from American Safety to the environmental casualty business and growth in the Fairmont accident andhealth and Seneca businesses, partially offset by planned reductions in the legacy CoverX business. Net premiumswritten increased by 9.2% in 2014 consistent with the increase in gross premiums written. The increase in netpremiums earned of 3.6% lagged the growth in net premiums written principally as a result of the reductions in netpremiums written in 2013 in the legacy CoverX business and in the middle markets business of Crum & Forster,partially offset by the impact of the timing of earned premiums related to the American Safety business and growthin the Fairmont accident and health business.
Interest and dividend income increased modestly from $38.3 in 2013 to $39.1 in 2014 reflecting increased interestincome earned and share of profit of associates, partially offset by lower dividends received on common stocks. Thesignificant increase in net gains on investments (as set out in the table below) coupled with the gain on redemptionof Crum & Forster’s investment in OdysseyRe, the year-over-year improvement in underwriting profitability andslightly higher interest and dividend income, produced pre-tax income before interest and other of $673.7 in 2014compared to a pre-tax loss before interest and other of $299.8 in 2013.
Crum & Forster’s cash resources, excluding the impact of foreign currency translation, decreased by $33.4 in 2014compared to an increase of $14.8 in 2013. Cash provided by operating activities (excluding operating cash flowactivity related to securities recorded as at FVTPL) decreased from $122.8 in 2013 to $115.6 in 2014 primarily as aresult of lower income tax recoveries, partially offset by increased underwriting cash flows.
Crum & Forster’s cumulative net earnings since acquisition on August 13, 1998 was $1,952.6, and its annual returnon average equity since acquisition has been 10.7% (December 31, 2013 – 9.2%).
Zenith National
Zenith National reported an underwriting profit of $89.5 and a combined ratio of 87.5% in 2014 compared to anunderwriting profit of $19.2 and a combined ratio of 97.1% in 2013. Net premiums earned in 2014 of $714.3increased from $673.8 in 2013, principally reflecting premium rate increases.
The improvement in Zenith National’s combined ratio in 2014 compared to 2013 reflected a decrease of4.6 percentage points in the estimated accident year loss and LAE ratio in 2014 and higher net favourabledevelopment of prior years’ reserves (10.2 percentage points in 2014). The decrease in the estimated accident yearloss and LAE ratio in 2014 was due to favourable loss development trends for accident year 2013 combined with priceincreases equal to estimated loss trends for accident year 2014. Net favourable prior year reserve development in2014 reflected net favourable emergence related to the 2011, 2012 and 2013 accident years.
The significant increase in net gains on investments (as set out in the table below), the improvement in underwritingprofitability and stable interest and dividend income ($22.1 in 2014 compared to $22.3 in 2013), produced pre-taxincome before interest and other of $218.4 in 2014 compared to a pre-tax loss before interest and other of $89.7in 2013.
At December 31, 2014 Zenith National had unrestricted cash and cash equivalents of $39.2 (December 31, 2013 –$54.0). Cash provided by operating activities (excluding operating cash flow activity related to securities recorded asat FVTPL) increased from $109.2 in 2013 to $119.2 in 2014, primarily as a result of increased net premiumcollections.
134
FAIRFAX FINANCIAL HOLDINGS LIMITED
Net gains (losses) on investments in the years ended December 31, 2014 and 2013 for the U.S. Insurance segmentwere comprised as shown in the following table:
2014 2013
Crum & Zenith Crum & ZenithForster National Total Forster National Total
Equity and equity-related holdings 96.7 17.9 114.6 226.2 90.0 316.2Equity hedges (15.0) (14.8) (29.8) (339.0) (121.5) (460.5)Bonds 230.4 93.4 323.8 (179.6) (89.4) (269.0)CPI-linked derivatives (3.3) 2.9 (0.4) (15.8) (9.2) (25.0)Gain on disposition of associates 10.5 – 10.5 – – –Other 2.0 7.4 9.4 (5.6) (1.1) (6.7)
Net gains (losses) on investments 321.3 106.8 428.1 (313.8) (131.2) (445.0)
Set out below are the balance sheets for U.S. Insurance as at December 31, 2014 and 2013.
2014 2013
Crum & Zenith Inter- Crum & Zenith Inter-Forster National(1) company Total Forster National(1) company Total
AssetsHolding company cash and investments 5.8 60.2 – 66.0 5.6 5.7 – 11.3Insurance contract receivables 212.7 205.6 – 418.3 194.0 196.3 – 390.3Portfolio investments 3,918.9 1,789.6 – 5,708.5 3,320.1 1,657.6 – 4,977.7Deferred premium acquisition costs 109.8 9.9 – 119.7 95.1 9.1 – 104.2Recoverable from reinsurers 1,527.0 144.3 – 1,671.3 1,568.3 164.5 – 1,732.8Deferred income taxes 161.7 – – 161.7 272.8 44.4 – 317.2Goodwill and intangible assets 294.7 453.9 – 748.6 187.1 463.5 – 650.6Due from affiliates 0.1 0.2 – 0.3 0.9 0.2 – 1.1Other assets 113.7 61.5 – 175.2 183.4 56.7 – 240.1Investments in Fairfax affiliates 81.2 12.0 (29.4) 63.8 126.9 – (29.4) 97.5
Total assets 6,425.6 2,737.2 (29.4) 9,133.4 5,954.2 2,598.0 (29.4) 8,522.8
LiabilitiesAccounts payable and accrued liabilities 249.4 74.3 – 323.7 241.6 64.7 – 306.3Short sale and derivative obligations 12.3 8.0 – 20.3 14.7 12.2 – 26.9Due to affiliates 25.3 1.2 – 26.5 26.0 0.4 – 26.4Funds withheld payable to reinsurers 338.9 – – 338.9 397.4 – – 397.4Provision for losses and loss adjustment
expenses 3,407.6 1,297.4 – 4,705.0 3,401.0 1,319.9 – 4,720.9Provision for unearned premiums 575.0 248.6 – 823.6 525.0 241.4 – 766.4Deferred income taxes – 10.4 – 10.4 – – – –Long term debt 41.4 38.1 – 79.5 41.4 38.1 – 79.5
Total liabilities 4,649.9 1,678.0 – 6,327.9 4,647.1 1,676.7 – 6,323.8
Total equity 1,775.7 1,059.2 (29.4) 2,805.5 1,307.1 921.3 (29.4) 2,199.0
Total liabilities and total equity 6,425.6 2,737.2 (29.4) 9,133.4 5,954.2 2,598.0 (29.4) 8,522.8
(1) These balance sheets differ from those published by Zenith National, primarily due to differences between IFRS and USGAAP and acquisition accounting adjustments (principally goodwill and intangible assets) which arose on the acquisitionof Zenith National in 2010. Excluding these acquisition accounting adjustments, Zenith National’s IFRS total equity was$675.2 at December 31, 2014 (December 31, 2013 – $532.5).
Significant changes to the balance sheet of U.S. Insurance at December 31, 2014 compared to December 31, 2013primarily reflected growth in the year-over-year business volumes at Crum & Forster. Portfolio investments increasedprincipally as a result of mark-to-market gains primarily related to bonds and common stocks, the net proceedsreceived by Crum & Forster related to the OdysseyRe reorganization and cash provided by operating activities(excluding operating cash flow activity related to securities recorded as at FVTPL), partially offset by the payment byCrum & Forster of a dividend to Fairfax of $150.0 and hedging losses. Recoverable from reinsurers decreased as a
135
result of increased collections (Crum & Forster) and the impact of net favourable prior year reserve development onlosses ceded to reinsurers and increased retention levels (Zenith National). Deferred income taxes decreasedreflecting the impact of increased net unrealized gains on bonds (Crum & Forster and Zenith National) and theutilization of operating losses carried forward (Zenith National). Goodwill and intangible assets increased reflectingthe goodwill and intangible assets of Pethealth ($90.9 allocated to Crum & Forster) and the impact of the acquisitionsof certain smaller insurance agencies that will augment Crum & Forster’s distribution capability. Provision for lossesand loss adjustment expenses decreased primarily as a result of favourable prior year reserve development onworkers’ compensation loss reserves (Zenith National), partially offset by the impacts of increased business volumesoffset by improved loss experience (Crum & Forster). Total equity increased primarily as a result of net earnings of$545.8 (2013 – net loss of $195.7) and $140.8 (2013 – net loss of $59.9) at Crum & Forster and Zenith Nationalrespectively, the allocation to Crum & Forster of the goodwill, intangible assets and related deferred tax liabilities ofPethealth and capital contributions from Fairfax to Crum & Forster and Zenith National of $5.0 (2013 – $65.0) andnil (2013 – $10.0) respectively. Crum & Forster paid dividends to Fairfax and its affiliates in 2014 of $150.0 (2013 –nil) to facilitate the OdysseyRe reorganization.
U.S. Insurance’s investments in Fairfax affiliates as at December 31, 2014 consisted of:
Affiliate % interest
TRG Holdings 1.4%Advent 13.8%Zenith National(1) 2.0%The Keg 15.3%
(1) Represents Crum & Forster’s investment in Zenith National which is eliminated within the U.S. Insurance segmentedbalance sheets.
Asian Insurance – Fairfax Asia
2014 2013
Underwriting profit 36.2 32.0
Loss & LAE – accident year 81.4% 80.3%Commissions (0.1)% 1.4%Underwriting expenses 13.0% 12.3%
Combined ratio – accident year 94.3% 94.0%Net favourable development (7.6)% (6.5)%
Combined ratio – calendar year 86.7% 87.5%
Gross premiums written 563.5 530.2
Net premiums written 280.1 257.4
Net premiums earned 272.2 256.2
Underwriting profit 36.2 32.0Interest and dividends 60.5 36.7
Operating income 96.7 68.7Net losses on investments (19.3) (23.8)
Pre-tax income before interest and other 77.4 44.9
Net earnings 66.1 35.8
Fairfax Asia comprises the company’s Asian holdings and operations: Singapore-based First Capital InsuranceLimited, Hong Kong-based Falcon Insurance (Hong Kong) Company Limited, Malaysia-based The Pacific InsuranceBerhad, 80.0%-owned Indonesia-based Fairfax Indonesia, 40.5%-owned Bangkok-based Falcon Insurance PLC(‘‘Falcon Thailand’’) and 26.0%-owned Mumbai-based ICICI Lombard General Insurance Company Limited (‘‘ICICILombard’’), India’s largest (by market share) private general insurer (the remaining 74.0% interest is held by ICICIBank, India’s second largest commercial bank). Falcon Thailand and ICICI Lombard are reported under the equitymethod of accounting.
136
FAIRFAX FINANCIAL HOLDINGS LIMITED
On January 1, 2015 the company acquired 78% of Union Assurance General Limited (‘‘Union Assurance’’) for cashconsideration of $26.8 (3.5 billion Sri Lankan rupees). Union Assurance is headquartered in Colombo, Sri Lanka andunderwrites general insurance in Sri Lanka, specializing in automobile and personal accident lines of business andwriting approximately $41 of gross premiums written in 2013.
On December 1, 2014 the company entered into an agreement to acquire the general insurance business of MCISInsurance Berhad (formerly known as MCIS Zurich Insurance Berhad) (‘‘MCIS’’) through its wholly-ownedsubsidiary Pacific Insurance. The transaction is subject to customary closing conditions, including Malaysian courtapproval, and is expected to close in the first quarter of 2015. MCIS is an established general insurer in Malaysia withover $55 of gross premiums written in 2013 in its general insurance business.
On May 21, 2014 Fairfax Asia completed the acquisition of an 80.0% interest in PT Batavia Mitratama Insurance(subsequently renamed PT Fairfax Insurance Indonesia (‘‘Fairfax Indonesia’’)) for cash purchase consideration of$8.5 (98.2 billion Indonesian rupees). Subsequent to the acquisition, Fairfax Asia contributed an additional $12.9 toFairfax Indonesia (maintaining its 80.0% interest) to support business expansion. Fairfax Indonesia is headquarteredin Jakarta, Indonesia and underwrites general insurance, specializing in automobile coverage in Indonesia.
Fairfax Asia reported an underwriting profit of $36.2 and a combined ratio of 86.7% in 2014 compared to anunderwriting profit of $32.0 and a combined ratio of 87.5% in 2013. Each of First Capital, Falcon and PacificInsurance produced combined ratios as set out in the following table:
2014 2013
First Capital 74.4% 78.1%Falcon 98.8% 101.3%Pacific Insurance 98.9% 91.7%
The combined ratio in 2014 included 7.6 combined ratio points ($20.6) of net favourable prior year reservedevelopment primarily related to engineering, workers’ compensation, property and commercial automobile lossreserves. The combined ratio in 2013 included 6.5 combined ratio points ($16.7) of net favourable prior year reservedevelopment primarily related to the commercial automobile, workers’ compensation and marine hull loss reserves.
The commission income ratio of 0.1% in 2014 compared to the commission expense ratio of 1.4% in 2013 with theimprovement primarily the result of higher profit commission earned on reinsurance ceded by First Capital on itsproperty line of business. The underwriting expense ratio increased from 12.3% in 2013 to 13.0% in 2014, primarilyas a result of a modest increase in operating expenses at Pacific Insurance related to the acquisition of MCIS.
Gross premiums written, net premiums written and net premiums earned in 2014 increased by 6.3%, 8.8% and 6.2%respectively, primarily as a result of increased writings in the commercial property, commercial automobile andmarine hull lines of business, partially offset by decreased writings in the engineering lines of business. The increasein net premiums written of 8.8% was higher than the growth in gross premiums written due to slightly higherpremium retention in 2014. The increase in net premiums earned of 6.2% was less than the increase in net premiumswritten reflecting the growth in net premiums written that was only partially earned in 2014.
The combination of increased interest and dividend income (reflecting the increased share of profit of associates,principally ICICI Lombard), lower net losses on investments (as set out in the table below) and increasedunderwriting profit, produced pre-tax income before interest and other of $77.4 in 2014 compared to pre-tax incomebefore interest and other of $44.9 in 2013.
2014 2013
Equity and equity-related holdings (26.6) 9.1Equity hedges – (30.1)Bonds 2.2 (6.7)Preferred stocks 0.3 (1.0)Foreign currency 5.3 5.0Other (0.5) (0.1)
Net losses on investments (19.3) (23.8)
137
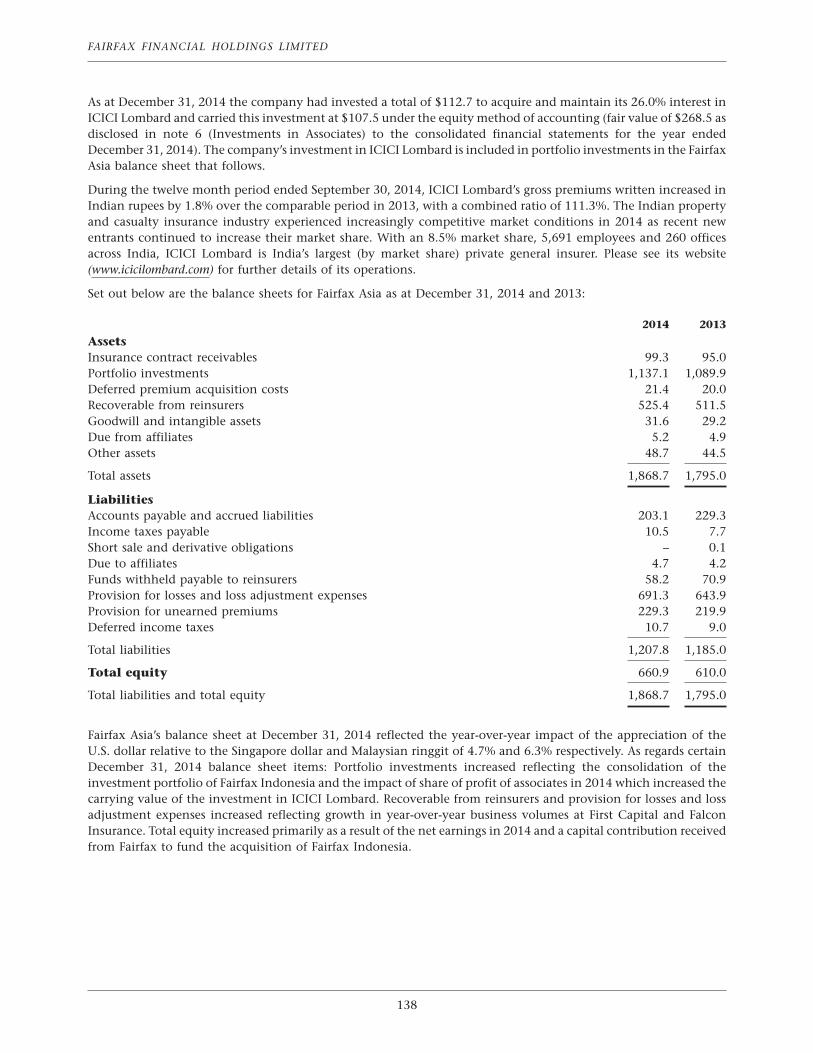
As at December 31, 2014 the company had invested a total of $112.7 to acquire and maintain its 26.0% interest inICICI Lombard and carried this investment at $107.5 under the equity method of accounting (fair value of $268.5 asdisclosed in note 6 (Investments in Associates) to the consolidated financial statements for the year endedDecember 31, 2014). The company’s investment in ICICI Lombard is included in portfolio investments in the FairfaxAsia balance sheet that follows.
During the twelve month period ended September 30, 2014, ICICI Lombard’s gross premiums written increased inIndian rupees by 1.8% over the comparable period in 2013, with a combined ratio of 111.3%. The Indian propertyand casualty insurance industry experienced increasingly competitive market conditions in 2014 as recent newentrants continued to increase their market share. With an 8.5% market share, 5,691 employees and 260 officesacross India, ICICI Lombard is India’s largest (by market share) private general insurer. Please see its website(www.icicilombard.com) for further details of its operations.
Set out below are the balance sheets for Fairfax Asia as at December 31, 2014 and 2013:
2014 2013
AssetsInsurance contract receivables 99.3 95.0Portfolio investments 1,137.1 1,089.9Deferred premium acquisition costs 21.4 20.0Recoverable from reinsurers 525.4 511.5Goodwill and intangible assets 31.6 29.2Due from affiliates 5.2 4.9Other assets 48.7 44.5
Total assets 1,868.7 1,795.0
LiabilitiesAccounts payable and accrued liabilities 203.1 229.3Income taxes payable 10.5 7.7Short sale and derivative obligations – 0.1Due to affiliates 4.7 4.2Funds withheld payable to reinsurers 58.2 70.9Provision for losses and loss adjustment expenses 691.3 643.9Provision for unearned premiums 229.3 219.9Deferred income taxes 10.7 9.0
Total liabilities 1,207.8 1,185.0
Total equity 660.9 610.0
Total liabilities and total equity 1,868.7 1,795.0
Fairfax Asia’s balance sheet at December 31, 2014 reflected the year-over-year impact of the appreciation of theU.S. dollar relative to the Singapore dollar and Malaysian ringgit of 4.7% and 6.3% respectively. As regards certainDecember 31, 2014 balance sheet items: Portfolio investments increased reflecting the consolidation of theinvestment portfolio of Fairfax Indonesia and the impact of share of profit of associates in 2014 which increased thecarrying value of the investment in ICICI Lombard. Recoverable from reinsurers and provision for losses and lossadjustment expenses increased reflecting growth in year-over-year business volumes at First Capital and FalconInsurance. Total equity increased primarily as a result of the net earnings in 2014 and a capital contribution receivedfrom Fairfax to fund the acquisition of Fairfax Indonesia.
138
FAIRFAX FINANCIAL HOLDINGS LIMITED
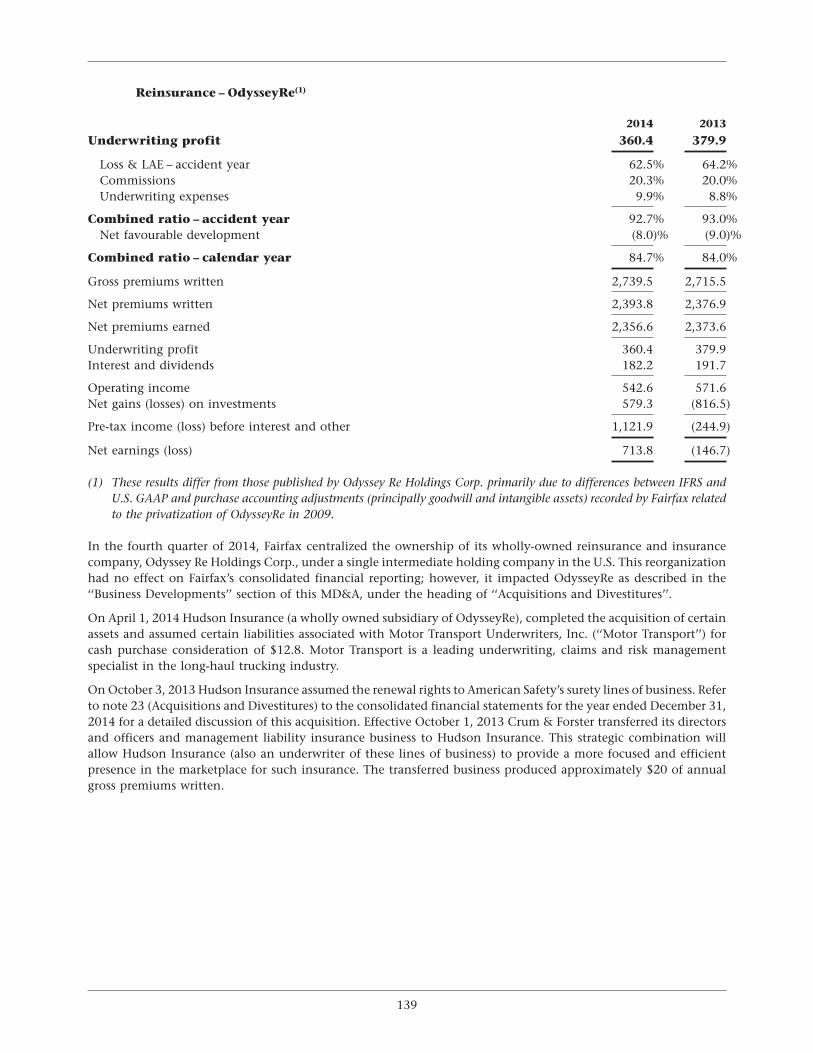
Reinsurance – OdysseyRe(1)
2014 2013
Underwriting profit 360.4 379.9
Loss & LAE – accident year 62.5% 64.2%Commissions 20.3% 20.0%Underwriting expenses 9.9% 8.8%
Combined ratio – accident year 92.7% 93.0%Net favourable development (8.0)% (9.0)%
Combined ratio – calendar year 84.7% 84.0%
Gross premiums written 2,739.5 2,715.5
Net premiums written 2,393.8 2,376.9
Net premiums earned 2,356.6 2,373.6
Underwriting profit 360.4 379.9Interest and dividends 182.2 191.7
Operating income 542.6 571.6Net gains (losses) on investments 579.3 (816.5)
Pre-tax income (loss) before interest and other 1,121.9 (244.9)
Net earnings (loss) 713.8 (146.7)
(1) These results differ from those published by Odyssey Re Holdings Corp. primarily due to differences between IFRS andU.S. GAAP and purchase accounting adjustments (principally goodwill and intangible assets) recorded by Fairfax relatedto the privatization of OdysseyRe in 2009.
In the fourth quarter of 2014, Fairfax centralized the ownership of its wholly-owned reinsurance and insurancecompany, Odyssey Re Holdings Corp., under a single intermediate holding company in the U.S. This reorganizationhad no effect on Fairfax’s consolidated financial reporting; however, it impacted OdysseyRe as described in the‘‘Business Developments’’ section of this MD&A, under the heading of ‘‘Acquisitions and Divestitures’’.
On April 1, 2014 Hudson Insurance (a wholly owned subsidiary of OdysseyRe), completed the acquisition of certainassets and assumed certain liabilities associated with Motor Transport Underwriters, Inc. (‘‘Motor Transport’’) forcash purchase consideration of $12.8. Motor Transport is a leading underwriting, claims and risk managementspecialist in the long-haul trucking industry.
On October 3, 2013 Hudson Insurance assumed the renewal rights to American Safety’s surety lines of business. Referto note 23 (Acquisitions and Divestitures) to the consolidated financial statements for the year ended December 31,2014 for a detailed discussion of this acquisition. Effective October 1, 2013 Crum & Forster transferred its directorsand officers and management liability insurance business to Hudson Insurance. This strategic combination willallow Hudson Insurance (also an underwriter of these lines of business) to provide a more focused and efficientpresence in the marketplace for such insurance. The transferred business produced approximately $20 of annualgross premiums written.
139
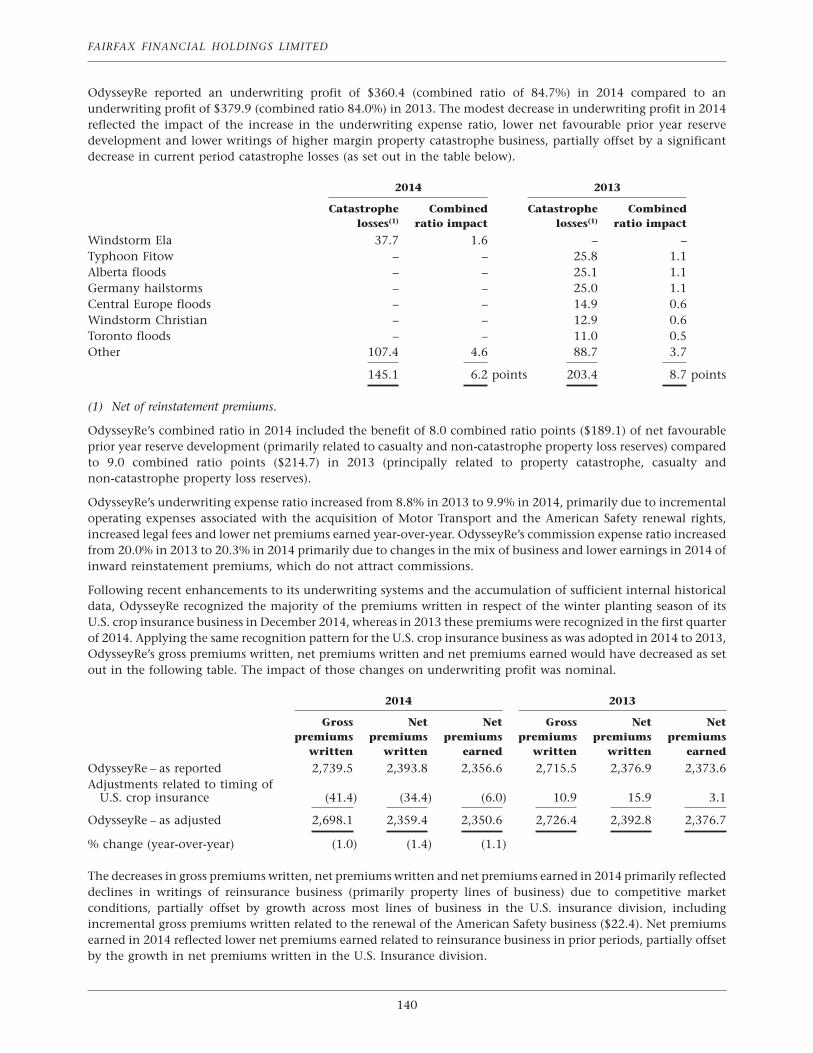
FAIRFAX FINANCIAL HOLDINGS LIMITED
OdysseyRe reported an underwriting profit of $360.4 (combined ratio of 84.7%) in 2014 compared to anunderwriting profit of $379.9 (combined ratio 84.0%) in 2013. The modest decrease in underwriting profit in 2014reflected the impact of the increase in the underwriting expense ratio, lower net favourable prior year reservedevelopment and lower writings of higher margin property catastrophe business, partially offset by a significantdecrease in current period catastrophe losses (as set out in the table below).
2014 2013
Catastrophe Combined Catastrophe Combinedlosses(1) ratio impact losses(1) ratio impact
Windstorm Ela 37.7 1.6 – –Typhoon Fitow – – 25.8 1.1Alberta floods – – 25.1 1.1Germany hailstorms – – 25.0 1.1Central Europe floods – – 14.9 0.6Windstorm Christian – – 12.9 0.6Toronto floods – – 11.0 0.5Other 107.4 4.6 88.7 3.7
145.1 6.2 points 203.4 8.7 points
(1) Net of reinstatement premiums.
OdysseyRe’s combined ratio in 2014 included the benefit of 8.0 combined ratio points ($189.1) of net favourableprior year reserve development (primarily related to casualty and non-catastrophe property loss reserves) comparedto 9.0 combined ratio points ($214.7) in 2013 (principally related to property catastrophe, casualty andnon-catastrophe property loss reserves).
OdysseyRe’s underwriting expense ratio increased from 8.8% in 2013 to 9.9% in 2014, primarily due to incrementaloperating expenses associated with the acquisition of Motor Transport and the American Safety renewal rights,increased legal fees and lower net premiums earned year-over-year. OdysseyRe’s commission expense ratio increasedfrom 20.0% in 2013 to 20.3% in 2014 primarily due to changes in the mix of business and lower earnings in 2014 ofinward reinstatement premiums, which do not attract commissions.
Following recent enhancements to its underwriting systems and the accumulation of sufficient internal historicaldata, OdysseyRe recognized the majority of the premiums written in respect of the winter planting season of itsU.S. crop insurance business in December 2014, whereas in 2013 these premiums were recognized in the first quarterof 2014. Applying the same recognition pattern for the U.S. crop insurance business as was adopted in 2014 to 2013,OdysseyRe’s gross premiums written, net premiums written and net premiums earned would have decreased as setout in the following table. The impact of those changes on underwriting profit was nominal.
2014 2013
Gross Net Net Gross Net Netpremiums premiums premiums premiums premiums premiums
written written earned written written earned
OdysseyRe – as reported 2,739.5 2,393.8 2,356.6 2,715.5 2,376.9 2,373.6Adjustments related to timing of
U.S. crop insurance (41.4) (34.4) (6.0) 10.9 15.9 3.1
OdysseyRe – as adjusted 2,698.1 2,359.4 2,350.6 2,726.4 2,392.8 2,376.7
% change (year-over-year) (1.0) (1.4) (1.1)
The decreases in gross premiums written, net premiums written and net premiums earned in 2014 primarily reflecteddeclines in writings of reinsurance business (primarily property lines of business) due to competitive marketconditions, partially offset by growth across most lines of business in the U.S. insurance division, includingincremental gross premiums written related to the renewal of the American Safety business ($22.4). Net premiumsearned in 2014 reflected lower net premiums earned related to reinsurance business in prior periods, partially offsetby the growth in net premiums written in the U.S. Insurance division.
140
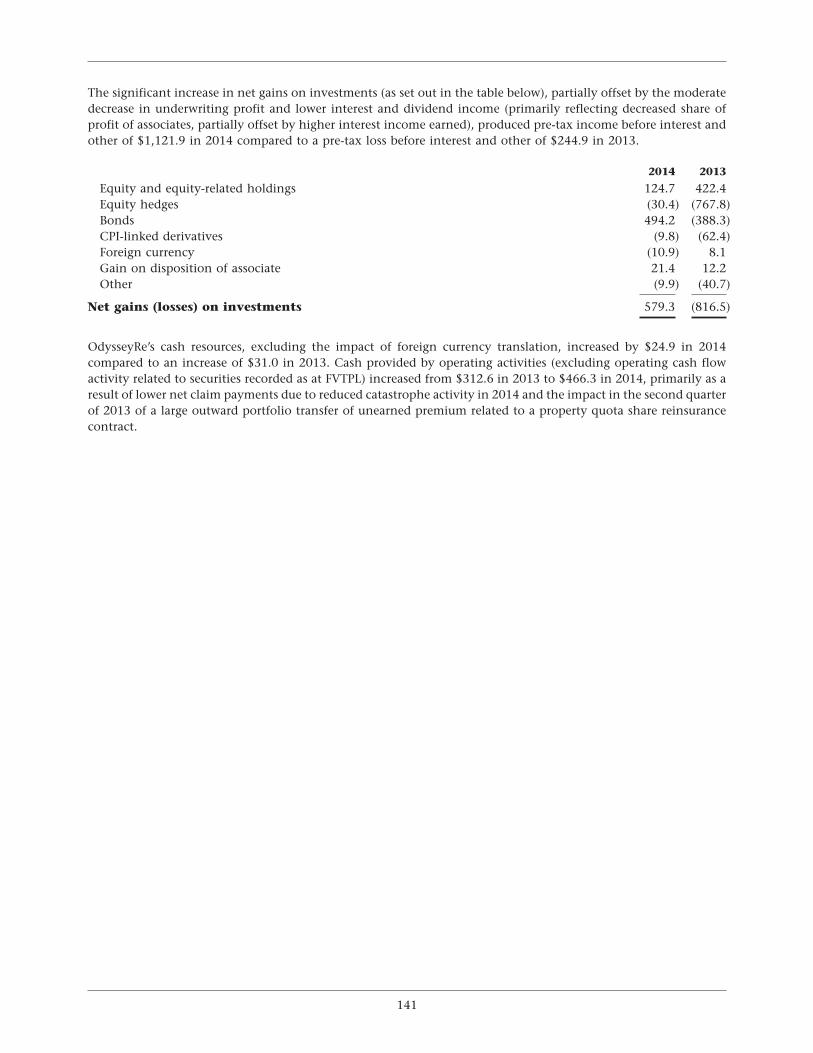
The significant increase in net gains on investments (as set out in the table below), partially offset by the moderatedecrease in underwriting profit and lower interest and dividend income (primarily reflecting decreased share ofprofit of associates, partially offset by higher interest income earned), produced pre-tax income before interest andother of $1,121.9 in 2014 compared to a pre-tax loss before interest and other of $244.9 in 2013.
2014 2013
Equity and equity-related holdings 124.7 422.4Equity hedges (30.4) (767.8)Bonds 494.2 (388.3)CPI-linked derivatives (9.8) (62.4)Foreign currency (10.9) 8.1Gain on disposition of associate 21.4 12.2Other (9.9) (40.7)
Net gains (losses) on investments 579.3 (816.5)
OdysseyRe’s cash resources, excluding the impact of foreign currency translation, increased by $24.9 in 2014compared to an increase of $31.0 in 2013. Cash provided by operating activities (excluding operating cash flowactivity related to securities recorded as at FVTPL) increased from $312.6 in 2013 to $466.3 in 2014, primarily as aresult of lower net claim payments due to reduced catastrophe activity in 2014 and the impact in the second quarterof 2013 of a large outward portfolio transfer of unearned premium related to a property quota share reinsurancecontract.
141
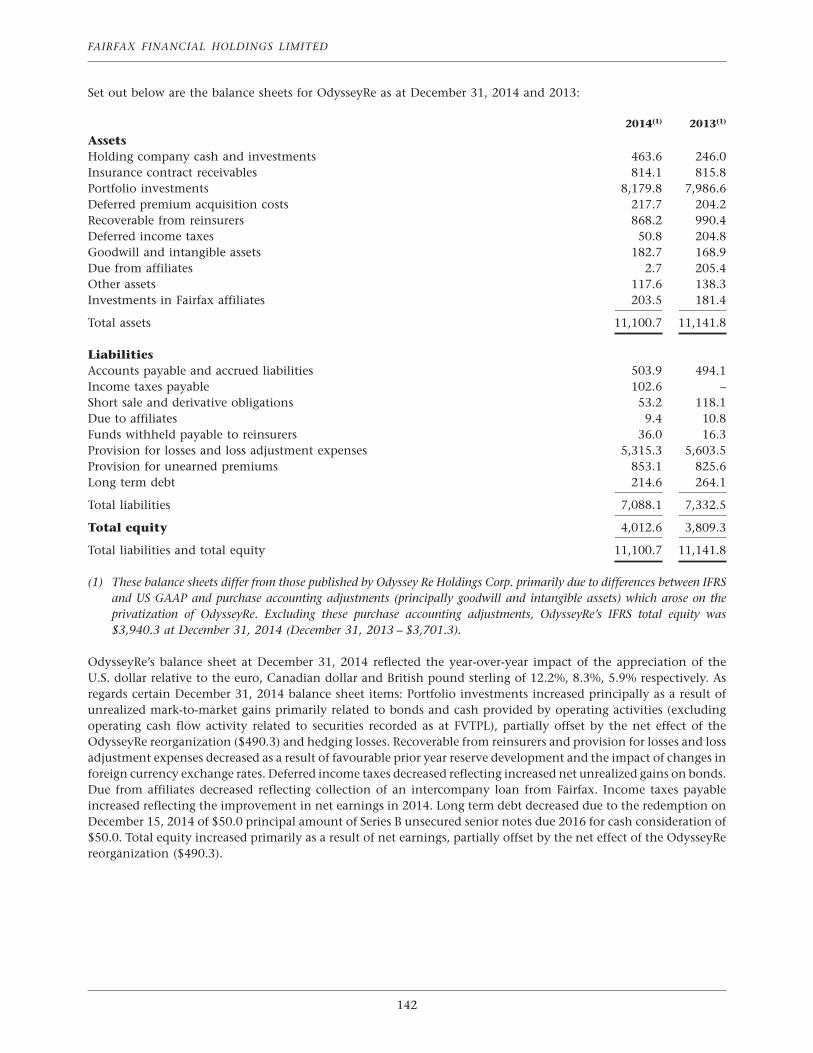
FAIRFAX FINANCIAL HOLDINGS LIMITED
Set out below are the balance sheets for OdysseyRe as at December 31, 2014 and 2013:
2014(1) 2013(1)
AssetsHolding company cash and investments 463.6 246.0Insurance contract receivables 814.1 815.8Portfolio investments 8,179.8 7,986.6Deferred premium acquisition costs 217.7 204.2Recoverable from reinsurers 868.2 990.4Deferred income taxes 50.8 204.8Goodwill and intangible assets 182.7 168.9Due from affiliates 2.7 205.4Other assets 117.6 138.3Investments in Fairfax affiliates 203.5 181.4
Total assets 11,100.7 11,141.8
LiabilitiesAccounts payable and accrued liabilities 503.9 494.1Income taxes payable 102.6 –Short sale and derivative obligations 53.2 118.1Due to affiliates 9.4 10.8Funds withheld payable to reinsurers 36.0 16.3Provision for losses and loss adjustment expenses 5,315.3 5,603.5Provision for unearned premiums 853.1 825.6Long term debt 214.6 264.1
Total liabilities 7,088.1 7,332.5
Total equity 4,012.6 3,809.3
Total liabilities and total equity 11,100.7 11,141.8
(1) These balance sheets differ from those published by Odyssey Re Holdings Corp. primarily due to differences between IFRSand US GAAP and purchase accounting adjustments (principally goodwill and intangible assets) which arose on theprivatization of OdysseyRe. Excluding these purchase accounting adjustments, OdysseyRe’s IFRS total equity was$3,940.3 at December 31, 2014 (December 31, 2013 – $3,701.3).
OdysseyRe’s balance sheet at December 31, 2014 reflected the year-over-year impact of the appreciation of theU.S. dollar relative to the euro, Canadian dollar and British pound sterling of 12.2%, 8.3%, 5.9% respectively. Asregards certain December 31, 2014 balance sheet items: Portfolio investments increased principally as a result ofunrealized mark-to-market gains primarily related to bonds and cash provided by operating activities (excludingoperating cash flow activity related to securities recorded as at FVTPL), partially offset by the net effect of theOdysseyRe reorganization ($490.3) and hedging losses. Recoverable from reinsurers and provision for losses and lossadjustment expenses decreased as a result of favourable prior year reserve development and the impact of changes inforeign currency exchange rates. Deferred income taxes decreased reflecting increased net unrealized gains on bonds.Due from affiliates decreased reflecting collection of an intercompany loan from Fairfax. Income taxes payableincreased reflecting the improvement in net earnings in 2014. Long term debt decreased due to the redemption onDecember 15, 2014 of $50.0 principal amount of Series B unsecured senior notes due 2016 for cash consideration of$50.0. Total equity increased primarily as a result of net earnings, partially offset by the net effect of the OdysseyRereorganization ($490.3).
142
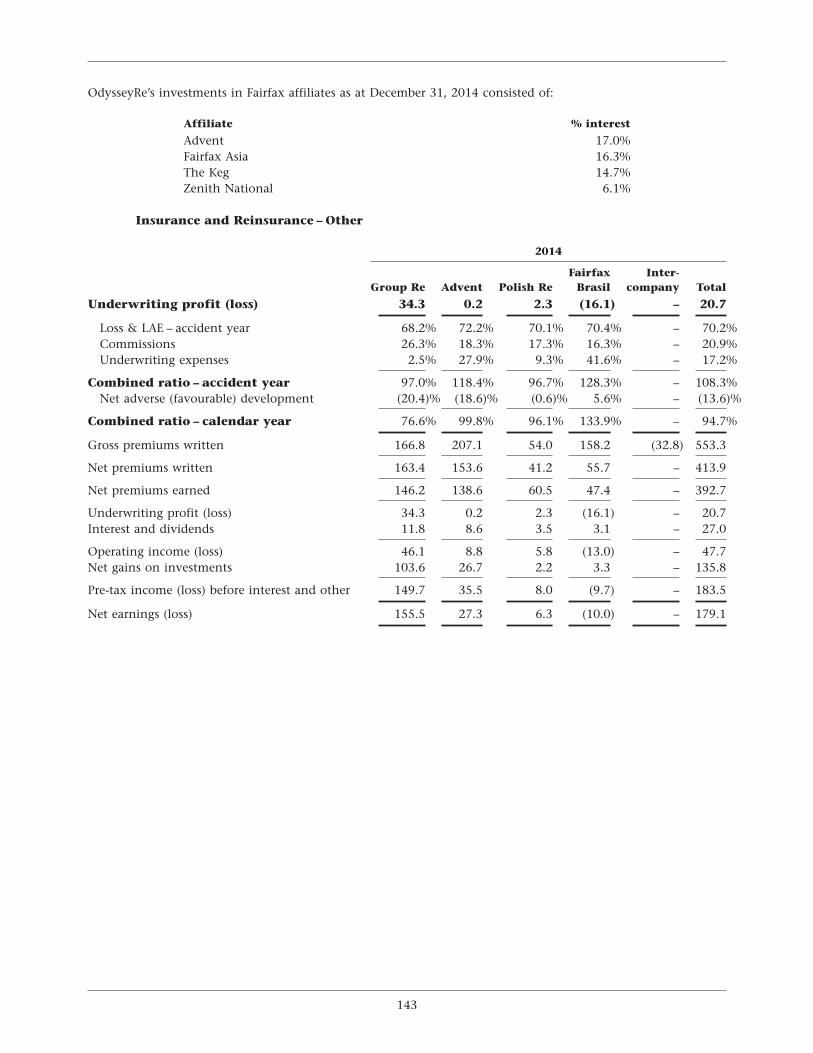
OdysseyRe’s investments in Fairfax affiliates as at December 31, 2014 consisted of:
Affiliate % interest
Advent 17.0%Fairfax Asia 16.3%The Keg 14.7%Zenith National 6.1%
Insurance and Reinsurance – Other
2014
Fairfax Inter-Group Re Advent Polish Re Brasil company Total
Underwriting profit (loss) 34.3 0.2 2.3 (16.1) – 20.7
Loss & LAE – accident year 68.2% 72.2% 70.1% 70.4% – 70.2%Commissions 26.3% 18.3% 17.3% 16.3% – 20.9%Underwriting expenses 2.5% 27.9% 9.3% 41.6% – 17.2%
Combined ratio – accident year 97.0% 118.4% 96.7% 128.3% – 108.3%Net adverse (favourable) development (20.4)% (18.6)% (0.6)% 5.6% – (13.6)%
Combined ratio – calendar year 76.6% 99.8% 96.1% 133.9% – 94.7%
Gross premiums written 166.8 207.1 54.0 158.2 (32.8) 553.3
Net premiums written 163.4 153.6 41.2 55.7 – 413.9
Net premiums earned 146.2 138.6 60.5 47.4 – 392.7
Underwriting profit (loss) 34.3 0.2 2.3 (16.1) – 20.7Interest and dividends 11.8 8.6 3.5 3.1 – 27.0
Operating income (loss) 46.1 8.8 5.8 (13.0) – 47.7Net gains on investments 103.6 26.7 2.2 3.3 – 135.8
Pre-tax income (loss) before interest and other 149.7 35.5 8.0 (9.7) – 183.5
Net earnings (loss) 155.5 27.3 6.3 (10.0) – 179.1
143
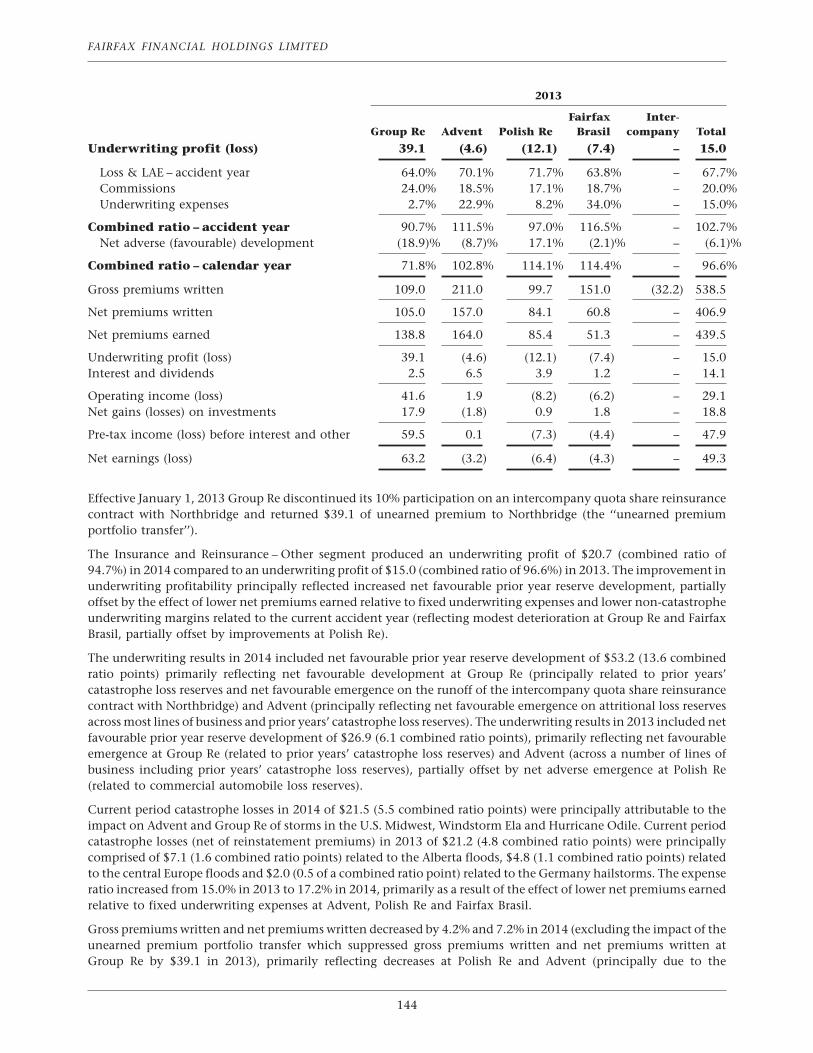
FAIRFAX FINANCIAL HOLDINGS LIMITED
2013
Fairfax Inter-Group Re Advent Polish Re Brasil company Total
Underwriting profit (loss) 39.1 (4.6) (12.1) (7.4) – 15.0
Loss & LAE – accident year 64.0% 70.1% 71.7% 63.8% – 67.7%Commissions 24.0% 18.5% 17.1% 18.7% – 20.0%Underwriting expenses 2.7% 22.9% 8.2% 34.0% – 15.0%
Combined ratio – accident year 90.7% 111.5% 97.0% 116.5% – 102.7%Net adverse (favourable) development (18.9)% (8.7)% 17.1% (2.1)% – (6.1)%
Combined ratio – calendar year 71.8% 102.8% 114.1% 114.4% – 96.6%
Gross premiums written 109.0 211.0 99.7 151.0 (32.2) 538.5
Net premiums written 105.0 157.0 84.1 60.8 – 406.9
Net premiums earned 138.8 164.0 85.4 51.3 – 439.5
Underwriting profit (loss) 39.1 (4.6) (12.1) (7.4) – 15.0Interest and dividends 2.5 6.5 3.9 1.2 – 14.1
Operating income (loss) 41.6 1.9 (8.2) (6.2) – 29.1Net gains (losses) on investments 17.9 (1.8) 0.9 1.8 – 18.8
Pre-tax income (loss) before interest and other 59.5 0.1 (7.3) (4.4) – 47.9
Net earnings (loss) 63.2 (3.2) (6.4) (4.3) – 49.3
Effective January 1, 2013 Group Re discontinued its 10% participation on an intercompany quota share reinsurancecontract with Northbridge and returned $39.1 of unearned premium to Northbridge (the ‘‘unearned premiumportfolio transfer’’).
The Insurance and Reinsurance – Other segment produced an underwriting profit of $20.7 (combined ratio of94.7%) in 2014 compared to an underwriting profit of $15.0 (combined ratio of 96.6%) in 2013. The improvement inunderwriting profitability principally reflected increased net favourable prior year reserve development, partiallyoffset by the effect of lower net premiums earned relative to fixed underwriting expenses and lower non-catastropheunderwriting margins related to the current accident year (reflecting modest deterioration at Group Re and FairfaxBrasil, partially offset by improvements at Polish Re).
The underwriting results in 2014 included net favourable prior year reserve development of $53.2 (13.6 combinedratio points) primarily reflecting net favourable development at Group Re (principally related to prior years’catastrophe loss reserves and net favourable emergence on the runoff of the intercompany quota share reinsurancecontract with Northbridge) and Advent (principally reflecting net favourable emergence on attritional loss reservesacross most lines of business and prior years’ catastrophe loss reserves). The underwriting results in 2013 included netfavourable prior year reserve development of $26.9 (6.1 combined ratio points), primarily reflecting net favourableemergence at Group Re (related to prior years’ catastrophe loss reserves) and Advent (across a number of lines ofbusiness including prior years’ catastrophe loss reserves), partially offset by net adverse emergence at Polish Re(related to commercial automobile loss reserves).
Current period catastrophe losses in 2014 of $21.5 (5.5 combined ratio points) were principally attributable to theimpact on Advent and Group Re of storms in the U.S. Midwest, Windstorm Ela and Hurricane Odile. Current periodcatastrophe losses (net of reinstatement premiums) in 2013 of $21.2 (4.8 combined ratio points) were principallycomprised of $7.1 (1.6 combined ratio points) related to the Alberta floods, $4.8 (1.1 combined ratio points) relatedto the central Europe floods and $2.0 (0.5 of a combined ratio point) related to the Germany hailstorms. The expenseratio increased from 15.0% in 2013 to 17.2% in 2014, primarily as a result of the effect of lower net premiums earnedrelative to fixed underwriting expenses at Advent, Polish Re and Fairfax Brasil.
Gross premiums written and net premiums written decreased by 4.2% and 7.2% in 2014 (excluding the impact of theunearned premium portfolio transfer which suppressed gross premiums written and net premiums written atGroup Re by $39.1 in 2013), primarily reflecting decreases at Polish Re and Advent (principally due to the
144
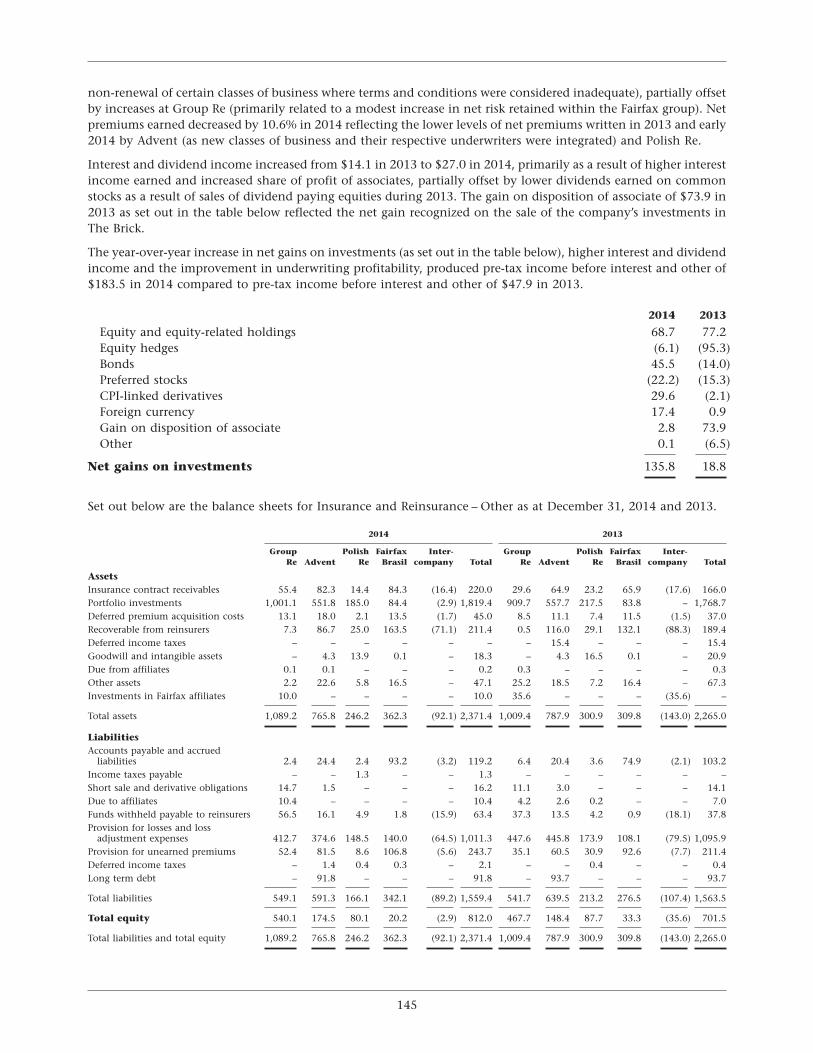
non-renewal of certain classes of business where terms and conditions were considered inadequate), partially offsetby increases at Group Re (primarily related to a modest increase in net risk retained within the Fairfax group). Netpremiums earned decreased by 10.6% in 2014 reflecting the lower levels of net premiums written in 2013 and early2014 by Advent (as new classes of business and their respective underwriters were integrated) and Polish Re.
Interest and dividend income increased from $14.1 in 2013 to $27.0 in 2014, primarily as a result of higher interestincome earned and increased share of profit of associates, partially offset by lower dividends earned on commonstocks as a result of sales of dividend paying equities during 2013. The gain on disposition of associate of $73.9 in2013 as set out in the table below reflected the net gain recognized on the sale of the company’s investments inThe Brick.
The year-over-year increase in net gains on investments (as set out in the table below), higher interest and dividendincome and the improvement in underwriting profitability, produced pre-tax income before interest and other of$183.5 in 2014 compared to pre-tax income before interest and other of $47.9 in 2013.
2014 2013
Equity and equity-related holdings 68.7 77.2Equity hedges (6.1) (95.3)Bonds 45.5 (14.0)Preferred stocks (22.2) (15.3)CPI-linked derivatives 29.6 (2.1)Foreign currency 17.4 0.9Gain on disposition of associate 2.8 73.9Other 0.1 (6.5)
Net gains on investments 135.8 18.8
Set out below are the balance sheets for Insurance and Reinsurance – Other as at December 31, 2014 and 2013.
2014 2013
Group Polish Fairfax Inter- Group Polish Fairfax Inter-Re Advent Re Brasil company Total Re Advent Re Brasil company Total
AssetsInsurance contract receivables 55.4 82.3 14.4 84.3 (16.4) 220.0 29.6 64.9 23.2 65.9 (17.6) 166.0Portfolio investments 1,001.1 551.8 185.0 84.4 (2.9) 1,819.4 909.7 557.7 217.5 83.8 – 1,768.7Deferred premium acquisition costs 13.1 18.0 2.1 13.5 (1.7) 45.0 8.5 11.1 7.4 11.5 (1.5) 37.0Recoverable from reinsurers 7.3 86.7 25.0 163.5 (71.1) 211.4 0.5 116.0 29.1 132.1 (88.3) 189.4Deferred income taxes – – – – – – – 15.4 – – – 15.4Goodwill and intangible assets – 4.3 13.9 0.1 – 18.3 – 4.3 16.5 0.1 – 20.9Due from affiliates 0.1 0.1 – – – 0.2 0.3 – – – – 0.3Other assets 2.2 22.6 5.8 16.5 – 47.1 25.2 18.5 7.2 16.4 – 67.3Investments in Fairfax affiliates 10.0 – – – – 10.0 35.6 – – – (35.6) –
Total assets 1,089.2 765.8 246.2 362.3 (92.1) 2,371.4 1,009.4 787.9 300.9 309.8 (143.0) 2,265.0
LiabilitiesAccounts payable and accrued
liabilities 2.4 24.4 2.4 93.2 (3.2) 119.2 6.4 20.4 3.6 74.9 (2.1) 103.2Income taxes payable – – 1.3 – – 1.3 – – – – – –Short sale and derivative obligations 14.7 1.5 – – – 16.2 11.1 3.0 – – – 14.1Due to affiliates 10.4 – – – – 10.4 4.2 2.6 0.2 – – 7.0Funds withheld payable to reinsurers 56.5 16.1 4.9 1.8 (15.9) 63.4 37.3 13.5 4.2 0.9 (18.1) 37.8Provision for losses and loss
adjustment expenses 412.7 374.6 148.5 140.0 (64.5) 1,011.3 447.6 445.8 173.9 108.1 (79.5) 1,095.9Provision for unearned premiums 52.4 81.5 8.6 106.8 (5.6) 243.7 35.1 60.5 30.9 92.6 (7.7) 211.4Deferred income taxes – 1.4 0.4 0.3 – 2.1 – – 0.4 – – 0.4Long term debt – 91.8 – – – 91.8 – 93.7 – – – 93.7
Total liabilities 549.1 591.3 166.1 342.1 (89.2) 1,559.4 541.7 639.5 213.2 276.5 (107.4) 1,563.5
Total equity 540.1 174.5 80.1 20.2 (2.9) 812.0 467.7 148.4 87.7 33.3 (35.6) 701.5
Total liabilities and total equity 1,089.2 765.8 246.2 362.3 (92.1) 2,371.4 1,009.4 787.9 300.9 309.8 (143.0) 2,265.0
145
FAIRFAX FINANCIAL HOLDINGS LIMITED
The balance sheet of Insurance and Reinsurance – Other at December 31, 2014 reflected the year-over-year impact ofthe appreciation of the U.S. dollar relative to the Canadian dollar (Group Re), Polish zloty (Polish Re) and Brazilianreal (Fairfax Brasil) of 8.3%, 15.0% and 11.2% respectively. Portfolio investments increased principally as a result ofappreciation of common stocks, bonds, and CPI-linked derivatives, and cash provided by operating activities(excluding operating cash flow activity related to securities recorded as at FVTPL), partially offset by losses onpreferred stocks. Recoverable from reinsurers increased reflecting growth in year-over-year business volumes atFairfax Brasil, partially offset by collections from reinsurers consistent with the decrease in provision for losses andloss adjustment expenses at Advent. Provision for losses and loss adjustment expenses decreased reflecting netfavourable prior year reserve development of attritional loss reserves across most lines of business and catastropheloss reserves and payments made in respect of prior year catastrophe losses at Advent and normal course settlementof the runoff of loss reserves assumed in connection with the Northbridge intercompany reinsurance arrangement atGroup Re, partially offset by the impact on provision for losses and loss adjustment expenses of growth inyear-over-year business volumes at Fairfax Brasil. Total equity increased primarily as a result of net earnings, partiallyoffset by dividends paid to Fairfax of $60.2 (2013 – $118.1). The dividend paid to Fairfax in 2014 of $60.2 was adividend-in-kind comprised of its 100% ownership interest in TIG Insurance (Barbados) Limited ($24.1) and 14.8%ownership interest in Advent ($36.1). The dividend paid to Fairfax in 2013 of $118.1 was inclusive of adividend-in-kind of $28.0 comprised of CRC Re’s 26.0% ownership interest in Ridley.
Group Re’s investments in Fairfax affiliates as at December 31, 2014 consisted of:
Affiliate % interest
The Keg 6.7%
Runoff
The Runoff business segment was formed with the acquisition on August 11, 1999 of the company’s interest in TheResolution Group (‘‘TRG’’), which was comprised of the runoff management expertise and experienced personnel ofTRG and TRG’s wholly-owned insurance subsidiary in runoff, International Insurance Company (‘‘IIC’’). The Runoffsegment currently consists of two groups: the U.S. Runoff group, consisting of TIG Insurance Company(the company resulting from the December 2002 merger of TIG Insurance Company and IIC), the Fairmont legalentities placed into runoff on January 1, 2006, General Fidelity (since August 17, 2010), Clearwater Insurance (sinceJanuary 1, 2011), Valiant Insurance (from July 1, 2011 until October 6, 2014 when it was sold), CommonwealthInsurance Company of America (since January 1, 2013) and American Safety (since October 3, 2013), and theEuropean Runoff group, consisting of RiverStone (UK), Syndicate 3500 and RiverStone Insurance (since October 12,2012). The Runoff business segment also includes Resolution Group Reinsurance (Barbados) Limited (since July 4,2014) and TIG Insurance (Barbados) Limited (since December 13, 2012) formed to facilitate certain reinsurancetransactions. Both groups are managed by the dedicated RiverStone runoff management operation which has383 employees in the U.S. and the U.K.
In the fourth quarter of 2014, Fairfax centralized the ownership of its wholly-owned reinsurance and insurancecompany, Odyssey Re Holdings Corp., under a single intermediate holding company in the U.S. This reorganizationhad no effect on Fairfax’s consolidated financial reporting; however, it impacted Runoff as described in the ‘‘BusinessDevelopments’’ section of this MD&A.
On December 4, 2014, RiverStone (UK) agreed to reinsure an Italian medical malpractice runoff portfolio principallycomprised of liabilities arising from direct policies issued to hospitals in Italy between 2007 and 2010 (the ‘‘medicalmalpractice reinsurance transaction’’). Runoff received a cash premium of $66.5 as consideration for the assumptionof $65.5 of net loss reserves.
On October 6, 2014, TIG Insurance sold its wholly-owned inactive subsidiary Valiant Insurance Company and itswholly-owned subsidiary Valiant Specialty Insurance Company (‘‘Valiant Group’’) to a third party purchaser andrecognized a net gain on investment of $6.5. Subsequent to the sale, TIG Insurance will continue to reinsure 100% ofthe gross insurance liabilities of Valiant Group and has entered into an administrative agreement with the purchaserwhereby TIG Insurance will provide claims handling services in respect of those liabilities.
On August 29, 2014 U.S. Runoff agreed to reinsure a construction defect runoff portfolio of Everest Re(the ‘‘Everest Re reinsurance transaction’’) and received a cash premium of $84.6 as consideration for the assumption
146
of $82.6 of net loss reserves. This construction defect runoff portfolio was principally comprised of direct policiesissued to general contractors between 2002 and 2004, primarily in the western U.S. (predominantly California).
On August 18, 2014 Runoff commuted a $312.7 reinsurance recoverable from Brit Group for proceeds of $310.2,comprised of cash and investments, and recognized a loss of $2.5.
On December 31, 2013 Clearwater Insurance assumed net insurance liabilities of $68.6 from Crum & Forster relatedto its discontinued New York construction contractors’ business. The tables in this MD&A which set out theoperating results of Crum & Forster and Runoff do not give effect to the initial impact of this reinsurance transactionsince its effect is not considered by management in its assessment of the performance of Crum & Forster and Runoff.Had the initial impact of this reinsurance transaction been reflected in Runoff’s operating segment in 2013, grosspremiums written, net premiums written, net premiums earned and losses on claims all would have increased by$68.6 with operating income remaining unchanged.
On October 3, 2013 the company acquired all of the outstanding common shares of American Safety InsuranceHoldings, Ltd. (‘‘American Safety’’) for $30.25 per share in cash, representing aggregate purchase consideration of$317.1. On October 8, 2013 the company sold American Safety’s Bermuda-based reinsurance subsidiary, AmericanSafety Reinsurance, Ltd. (‘‘AS Re’’), to an unrelated third party for net proceeds of $52.5. Crum & Forster assumed therenewal rights to American Safety’s environmental casualty, excess and surplus lines casualty, property and packagelines of business. Hudson Insurance (a wholly-owned insurance subsidiary of OdysseyRe) assumed the renewal rightsto American Safety’s surety lines of business. The remainder of American Safety’s lines of business which did not meetFairfax’s underwriting criteria were placed into runoff under the supervision of the RiverStone group. The purchaseconsideration for this acquisition was financed internally by the company’s runoff subsidiaries, Crum & Forster andHudson Insurance and was partially defrayed by the proceeds received on the sale of AS Re ($52.5) and the receipt of apost-acquisition dividend of excess capital paid by American Safety ($123.7). The fair values of the portfolioinvestments (including cash and short term investments), insurance contract liabilities and recoverable fromreinsurers of American Safety that were ultimately consolidated by the Runoff reporting segment wereapproximately $642, $652 and $220 respectively, after giving effect to the post-acquisition transactions described inthe preceding sentence. American Safety, a Bermuda-based holding company, underwrote specialty risks through itsU.S.-based program administrator, American Safety Insurance Services, Inc., and its U.S. insurance and Bermudareinsurance companies.
On March 29, 2013 TIG Insurance commuted an $85.4 reinsurance recoverable for proceeds of $118.5 (principallycash consideration of $115.8) and recognized a gain of $33.1.
Effective January 1, 2013 Northbridge sold its wholly-owned subsidiary Commonwealth Insurance Company ofAmerica (‘‘CICA’’) to TIG Insurance. CICA had total equity of $20.8 on January 1, 2013 principally to support itsU.S. property business placed into runoff effective May 1, 2012. Periods prior to January 1, 2013 have not beenrestated as the impact was not significant.
Set out below is a summary of the operating results of Runoff for the years ended December 31, 2014 and 2013.
2014 2013
Gross premiums written 163.9 36.3
Net premiums written 179.7 30.4
Net premiums earned 231.6 83.0Losses on claims (265.9) 23.8Operating expenses (117.2) (95.5)Interest and dividends 63.0 66.0
Operating income (loss) (88.5) 77.3Net gains (losses) on investments 364.9 (306.5)Gain on redemption of investment in OdysseyRe(1) 406.1 –Loss on repurchase of long term debt (3.5) –
Pre-tax income (loss) before interest and other 679.0 (229.2)
(1) Eliminated on consolidation.
147
FAIRFAX FINANCIAL HOLDINGS LIMITED
Runoff reported an operating loss of $88.5 in 2014 compared to operating income of $77.3 in 2013. Net premiumsearned in 2014 of $231.6 principally reflected the impacts of the Everest Re reinsurance transaction and the medicalmalpractice reinsurance transaction ($84.1 and $66.5 respectively), the runoff of policies in force on the acquisitiondate of American Safety ($65.9) and premium adjustments at RiverStone Insurance ($15.0). Net premiums earned in2013 of $83.0 principally reflected the runoff of policies in force on the acquisition dates of RiverStone Insurance andAmerican Safety ($29.5 and $20.7 respectively) and premium adjustments at RiverStone Insurance ($24.9).
Losses on claims of $265.9 in 2014 primarily reflected net adverse prior year reserve development at ClearwaterInsurance ($111.2 principally related to strengthening of construction contractors loss reserves assumed fromCrum & Forster and asbestos and environmental loss reserves in the legacy portfolio) and TIG Insurance ($55.8principally related to strengthening of latent loss reserves, partially offset by net favourable development of workers’compensation loss reserves) and the impacts of the medical malpractice reinsurance transaction and the Everest Rereinsurance transaction ($65.5 and $72.6 respectively), partially offset by net favourable prior year reservedevelopment at American Safety ($67.4 related to environmental remediation contractor and other long tail casualtyloss reserves).
Losses on claims in 2013 included a gain of $33.1 on significant reinsurance commutation and reflected net adverseprior year reserve development at Clearwater Insurance ($43.0 principally related to strengthening of asbestos andenvironmental loss reserves and other latent claims assumed from Crum & Forster and asbestos loss reserves in thelegacy portfolio) and TIG Insurance ($43.4 primarily related to asbestos and environmental loss reserves), partiallyoffset by net favourable prior year reserve development at General Fidelity ($50.7 primarily related to constructiondefect and marine loss reserves) and European Runoff ($34.1 primarily at RiverStone (UK) across all lines of businessincluding the release of redundant unallocated loss adjustment expense reserves).
Operating expenses increased from $95.5 in 2013 to $117.2 in 2014, primarily as a result of incremental operatingexpenses associated with the Everest Re reinsurance transaction and American Safety, partially offset by the release ofa provision for uncollectible reinsurance in European Runoff.
Interest and dividend income decreased from $66.0 in 2013 to $63.0 in 2014 primarily reflecting lower dividendsearned on common stocks and lower share of profit of associates (principally related to Runoff’s investment in ThaiRe), partially offset by lower total return swap expense.
The Runoff segment produced pre-tax income before interest and other of $679.0 in 2014 compared to a pre-tax lossbefore interest and other of $229.2 in 2013 with the year-over-year increase in profitability primarily due to thesignificant increase in net gains on investments (as set out in the table below) and the net gain on redemption ofRunoff’s investment in OdysseyRe, partially offset by the increased operating loss and the loss on repurchase of longterm debt (described below).
2014 2013
Equity and equity-related holdings 69.8 218.3Equity hedges (24.6) (313.2)Bonds 294.4 (226.9)CPI-linked derivatives (3.8) (5.6)Foreign currency 17.4 10.6Gain on disposition of associate 4.4 9.8Other 7.3 0.5
Net gains (losses) on investments 364.9 (306.5)
On December 15, 2014 Runoff redeemed $25.0 principal amount (carrying value of $21.5) of American Safety’sfloating rate trust preferred securities due 2035 for cash consideration of $25.0 and recorded a loss on repurchase oflong term debt of $3.5 in other expenses in the consolidated statement of earnings. During 2014 Runoff paiddividends to Fairfax comprised of a cash dividend of $60.4 (2013 – $30.0) and a dividend-in-kind in connection withthe OdysseyRe reorganization (comprised of marketable securities) of $74.5 (2013 – nil). The cash dividend receivedby Fairfax of $30.0 in 2013 was immediately reinvested into Runoff and formed part of the funding for theacquisition of American Safety.
148
Runoff cash flow may be volatile as to timing and amounts, with potential variability arising principally from therequirement to pay gross claims initially while third party reinsurance is only collected subsequently in accordancewith its terms and from the delay, until some time after claims are paid, of the release of assets pledged to secure thepayment of those claims.
Set out below are the balance sheets for Runoff as at December 31, 2014 and 2013.
2014 2013
AssetsInsurance contract receivables 144.0 350.5Portfolio investments 4,841.7 4,604.4Recoverable from reinsurers 1,100.9 1,773.7Deferred income taxes 67.4 70.4Goodwill and intangible assets 43.4 46.0Due from affiliates 615.0 281.4Other assets 73.8 66.2Investments in Fairfax affiliates 77.5 284.3
Total assets 6,963.7 7,476.9
LiabilitiesAccounts payable and accrued liabilities 98.1 174.0Income taxes payable 32.3 51.7Short sale and derivative obligations 31.3 20.3Due to affiliates 0.1 11.6Funds withheld payable to reinsurers 16.8 32.5Provision for losses and loss adjustment expenses 4,720.4 5,493.8Provision for unearned premiums – 73.7Long term debt – 21.5
Total liabilities 4,899.0 5,879.1
Total equity 2,064.7 1,597.8
Total liabilities and total equity 6,963.7 7,476.9
The balance sheet for the Runoff segment represents the sum of individual entity balance sheets even though theindividual entities are not necessarily a part of the same ownership structure. Significant changes to the 2014 balancesheet of the Runoff segment compared to 2013 primarily reflected the impacts of the commutation with the BritGroup, the medical malpractice reinsurance transaction and the Everest Re transaction which increased portfolioinvestments and provision for losses and loss adjustment expenses by $461.3 and $148.1 respectively and decreasedrecoverable from reinsurers by $312.7 at December 31, 2014. Insurance contract receivables decreased as a result ofthe collection in 2014 of commutation balances that were receivable at December 31, 2013, the collection of apremium receivable related to the Eaglestar reinsurance transaction and the impact of premium adjustments atRiverStone Insurance. The increase in portfolio investments also reflected mark-to-market gains primarily related tobonds and common stocks, net proceeds received related to the OdysseyRe reorganization ($160.1), partially offsetby hedging losses and cash used in operating activities (excluding operating cash flow activity related to securitiesrecorded as at FVTPL). At December 31, 2014 Runoff’s portfolio investments of $4,841.7 included $636.5 and $258.0of investments pledged by U.S. Runoff and European Runoff respectively, to support insurance and reinsuranceobligations in the ordinary course of carrying on their business. Recoverable from reinsurers decreased due tocontinued progress by Runoff in collecting and commuting its remaining reinsurance recoverable balances(particularly at RiverStone Insurance related to the commutation with the Brit Group). At December 31, 2014recoverable from reinsurers included recoverables related to asbestos and pollution claims of $369.4 primarily at TIGInsurance and Clearwater Insurance. Due from affiliates increased as a result of an intercompany advance of $350.0to Fairfax as a result of the OdysseyRe reorganization. Accounts payable and accrued liabilities decreased due tosettlement of a payable balance at RiverStone Insurance associated with the commutation with the Brit Group.Provision for losses and loss adjustment expenses decreased as a result of the continued progress by Runoff in settlingits remaining claims (particularly at RiverStone Insurance), partially offset by adverse prior year reserve development
149
FAIRFAX FINANCIAL HOLDINGS LIMITED
principally at Clearwater Insurance and TIG Insurance. The decrease in provision for unearned premiums reflectedthe runoff of policies in force on the acquisition dates of RiverStone Insurance and American Safety. The decrease inlong term debt reflected the redemption of $25.0 principal amount (carrying value of $21.5) of American Safety’sfloating rate trust preferred securities due 2035 for cash consideration of $25.0. Total equity increased primarily as aresult of net earnings (inclusive of the net gain on redemption of Runoff’s investment in OdysseyRe), partially offsetby dividends paid to Fairfax.
Runoff’s investments in Fairfax affiliates as at December 31, 2014 consisted of:
Affiliate % interest
Advent 15.0%TRG Holdings 21.0%The Keg 3.3%
Other
2014 2013
Revenue 1,556.0 958.0Expenses (1,488.7) (906.9)
Pre-tax income before interest and other 67.3 51.1Interest and dividends 10.3 0.8Net gains on investments 43.1 –Interest expense (12.3) (4.6)
Pre-tax income 108.4 47.3
Net earnings 96.1 28.5
The Other reporting segment is primarily comprised as follows (with the date of acquisition by Fairfax shown inparenthesis): Ridley is one of North America’s leading animal nutrition companies and operates in the U.S. andCanada (November 2008); William Ashley is a prestige retailer of exclusive tableware and gifts in Canada (August 16,2011); Sporting Life is a Canadian retailer of sporting goods and sports apparel (December 22, 2011); Thomas CookIndia is an integrated travel and travel related financial services company in India (August 14, 2012); IKYA providesspecialized human resources services to leading corporate clients in India (May 14, 2013); The Keg franchises, ownsand operates a network of premium dining restaurants across Canada and in select locations in the United States(February 4, 2014); Praktiker is one of the largest home improvement and do-it-yourself goods retailers in Greece(June 5, 2014); Sterling Resorts is engaged in vacation ownership and leisure hospitality and operates a network ofresorts in India (September 3, 2014); and, Pethealth which is headquartered in Canada and provides pet medicalinsurance, management software and pet-related database management services in North America and theUnited Kingdom (November 14, 2014).
On November 14, 2014 the company acquired all of the outstanding common shares, preferred shares and employeeshare options of Pethealth for cash purchase consideration of $88.7 (Cdn$100.4). The goodwill and intangible assetsassociated with the marketing of pet medical insurance was allocated to the Crum & Forster and Northbridgereporting segments ($90.9 and $17.3 respectively) since they will become Pethealth’s ongoing insurance carriers.Pethealth’s residual assets and liabilities and results of operations were consolidated in the Other reporting segment.
On September 3, 2014 the company acquired control of Sterling Resorts through its 73.0%-owned Thomas CookIndia subsidiary pursuant to the transaction described in note 23 (Acquisitions and Divestitures) to the consolidatedfinancial statements for the year ended December 31, 2014. Having obtained control, Thomas Cook India wasrequired to re-measure its existing ownership interest in Sterling Resorts at fair value as of September 3, 2014,resulting in the recognition of a one-time non-cash gain of $41.2, representing the difference between the fair valueof the previously held interest in Sterling Resorts and its carrying value under the equity method of accounting.
On June 5, 2014 Fairfax completed the acquisition of a 100% interest in Praktiker for cash purchase consideration of$28.6 (A21.0 million). On February 4, 2014 the company completed the acquisition of 51.0% of the outstandingcommon shares of The Keg for cash purchase consideration of $76.7 (Cdn$85.0).
150
Prime Restaurants, which franchises, owns and operates a network of casual dining restaurants and pubs in Canada,was sold on October 31, 2013. On May 14, 2013 Thomas Cook India acquired a 77.3% interest in IKYA for cashpurchase consideration of $46.8 (2,563.2 million Indian rupees) pursuant to the transactions described in note 23(Acquisitions and Divestitures) to the consolidated financial statements for the year ended December 31, 2014.
Ridley’s revenue and expenses fluctuate with changes in raw material prices. The increases in Ridley’s revenue($561.1 in 2013 increased to $588.8 in 2014) and expenses ($533.3 in 2013 increased to $553.3 in 2014) primarilyreflected higher sales volumes combined with a more favourable product mix on a year-over-year basis. The increasesin IKYA’s revenue ($147.5 in 2013 increased to $312.2 in 2014) and expenses ($143.3 in 2013 increased to $300.8 in2014), principally reflected the consolidation of IKYA for the full year of 2014 (compared to approximately eightmonths in 2013) and significant growth in its business driven by the information technology and general staffingsegments. The Keg contributed revenue of $249.3 and expenses of $251.8 since its acquisition on February 4, 2014.The remaining revenues and expenses included in the Other reporting segment were primarily comprised of therevenues and expenses of William Ashley, Sporting Life, Praktiker, Prime Restaurants (sold on October 31, 2013),Thomas Cook India, Sterling Resorts and Pethealth, from their respective acquisition dates (and up to disposal datewith respect to Prime Restaurants).
Interest and Dividends
An analysis of consolidated interest and dividend income is presented in the Investments section of this MD&A.
Net Gains (Losses) on Investments
An analysis of consolidated net gains (losses) on investments is provided in the Investments section of this MD&A.
Interest Expense
Consolidated interest expense decreased from $211.2 in 2013 to $206.3 in 2014, reflecting the repayment onNovember 1, 2013 of $182.9 principal amount of OdysseyRe unsecured senior notes upon maturity, the repurchasein the first quarter of 2013 of $48.4 principal amount of Fairfax unsecured senior notes due 2017 and the favourableimpact of foreign currency translation on the interest expense of the company’s Canadian dollar denominated longterm debt, partially offset by the issuance on August 13, 2014 of $300.0 principal amount of unsecured senior notesdue 2024, the consolidation of the subsidiary indebtedness and long term debt of American Safety, IKYA and The Kegand higher subsidiary indebtedness and long term debt of Thomas Cook India year-over-year.
Consolidated interest expense was comprised as follows:
2014 2013
Fairfax 171.4 172.3Crum & Forster 1.4 1.5Zenith National 3.3 3.3OdysseyRe 12.7 24.8Advent 4.2 4.3Runoff 1.0 0.4Other (principally related to The Keg and Thomas Cook India) 12.3 4.6
206.3 211.2
151
FAIRFAX FINANCIAL HOLDINGS LIMITED
Corporate Overhead and Other
Corporate overhead and other consists of the expenses of all of the group holding companies, net of the company’sinvestment management and administration fees and interest and dividends (inclusive of share of profit (loss) ofassociates and total return swap expense) earned on holding company cash and investments, and is comprised ofthe following:
2014 2013
Fairfax corporate overhead 85.1 102.5Subsidiary holding companies’ corporate overhead 80.6 96.0Holding company interest and dividends 6.3 11.7Investment management and administration fees (79.1) (88.3)Loss on repurchase of long term debt 3.6 3.4
96.5 125.3
Fairfax corporate overhead decreased from $102.5 in 2013 to $85.1 in 2014, primarily as a result of lowercompensation expenses and legal fees and one-time expenses incurred in 2013 related to the acquisition of AmericanSafety. Subsidiary holding companies’ corporate overhead decreased from $96.0 in 2013 to $80.6 in 2014, primarilyas a result of a non-recurring charge of $31.2 incurred at Northbridge in 2013 related to redundant softwaredevelopment costs, partially offset by higher restructuring costs and charitable donations in 2014.
Total return swap expense ($30.0 in 2014 and $31.2 in 2013) is reported as a component of interest and dividendincome. Holding company interest and dividends also included share of profit of associates ($14.4 in 2014 and $11.4in 2013). Prior to giving effect to the impacts of total return swap expense and share of profit of associates, interestand dividend income on holding company cash and investments increased from $8.1 in 2013 to $9.3 in 2014.
Investment management and administration fees decreased from $88.3 in 2013 to $79.1 in 2014 primarily as a resultof adjustments to the fees in respect of the prior year.
2014 2013
Equity and equity-related holdings 30.2 129.9Equity hedges (66.1) (112.3)Bonds 9.6 7.6Foreign currency (11.7) (3.7)Gain on disposition of associates 0.7 12.1Gain on redemption of investment in OdysseyRe(1) 38.5 –Other 28.5 30.9
Net gains on investments 29.7 64.5
(1) Eliminated on consolidation.
Income Taxes
The $673.3 provision for income taxes in 2014 differed from the provision for income taxes that would bedetermined by applying the company’s Canadian statutory income tax rate of 26.5% to the company’s earningsbefore income taxes primarily as a result of income earned in jurisdictions where the corporate income tax rate ishigher than the company’s Canadian statutory income tax rate and unrecorded income tax losses and temporarydifferences, partially offset by non-taxable investment income (including dividend income, non-taxable interestincome, capital gains and the 50% of net capital gains which are not taxable in Canada).
The $436.6 recovery of income taxes in 2013 differed from the recovery of income taxes that would be determined byapplying the company’s Canadian statutory income tax rate of 26.5% to the company’s loss before income taxesprimarily as a result of non-taxable investment income (including dividend income, non-taxable interest income,capital gains and the 50% of net capital gains which are not taxable in Canada) and losses incurred in jurisdictionswhere the corporate income tax rate is higher than the company’s Canadian statutory income tax rate, partiallyoffset by unrecorded income tax losses and temporary differences.
152
Non-controlling Interests
The attribution of net earnings (loss) to the non-controlling interests is comprised of the following:
2014 2013
Thomas Cook India 12.4 1.3The Keg 7.2 –Ridley 6.7 4.5IKYA 3.8 1.1Sporting Life 1.6 1.9Fairfax Asia 1.5 0.9Prime Restaurants – 0.5Other (1.8) (1.3)
31.4 8.9
Non-controlling interests increased from $8.9 in 2013 to $31.4 in 2014 primarily as a result of increased net earningsat Thomas Cook India (principally related to the recognition of a one-time non-cash gain of $41.2 related to itsinvestment in Sterling Resorts) and Ridley and the impacts from the acquisition of The Keg during the first quarter of2014 and the consolidation of IKYA for the full year of 2014 (compared to approximately eight months in 2013),partially offset by the impact of the de-consolidation of Prime Restaurants subsequent to its sale to Cara. Refer tonote 23 (Acquisitions and Divestitures) to the consolidated financial statements for the year ended December 31,2014 for additional details related to the acquisition of The Keg.
Components of Consolidated Balance Sheets
Consolidated Balance Sheet Summary
The assets and liabilities reflected on the company’s consolidated balance sheet at December 31, 2014 were impactedby the acquisitions of Pethealth, Sterling Resorts, Praktiker and The Keg. Refer to note 23 (Acquisitions andDivestitures) to the consolidated financial statements for the year ended December 31, 2014 for additional detailsrelated to these acquisitions.
Holding company cash and investments decreased to $1,244.3 ($1,212.7 net of $31.6 of holding companyshort sale and derivative obligations) at December 31, 2014 from $1,296.7 at December 31, 2013 ($1,241.6 net of$55.1 of holding company short sale and derivative obligations). Significant cash movements at the Fairfax holdingcompany level during 2014 are as set out in the Financial Condition section of this MD&A under the headingof Liquidity.
Insurance contract receivables decreased by $85.3 to $1,931.7 at December 31, 2014 from $2,017.0 atDecember 31, 2013 primarily at Runoff reflecting collections of reinsurance premiums receivable and the collectionin the first quarter of 2014 of commutation proceeds receivable at December 31, 2013, partially offset by increasedinsurance premiums receivable reflecting the timing of policy renewals at OdysseyRe (principally related to itsU.S. crop business) and the impact of increased business volumes at Fairfax Brasil and Advent.
Portfolio investments comprise investments carried at fair value and equity accounted investments, theaggregate carrying value of which was $25,109.2 at December 31, 2014 ($24,980.0 net of subsidiary short sale andderivative obligations) compared to an aggregate carrying value at December 31, 2013 of $23,833.3 ($23,620.0 net ofsubsidiary short sale and derivative obligations). The increase of $1,360.0 year-over-year generally reflected netunrealized appreciation of bonds (principally government bonds and bonds issued by U.S. states and municipalities)and common stocks, and cash provided by operating activities, partially offset by the unfavourable impact of foreigncurrency translation (principally the strengthening of the U.S. dollar relative to the Canadian dollar) in addition tothe specific factors which caused movements in portfolio investments as discussed in the subsequent paragraphs.
Subsidiary cash and short term investments (including cash and short term investments pledged for short sale andderivative obligations) decreased by $1,741.3 primarily reflecting cash used to fund net purchases of othergovernment bonds and other common stocks, net settlements of long and short equity and equity index total returnswaps in accordance with their reset provisions, acquisitions of certain investments in associates (net of dispositions)and to enter into CPI-linked derivative contracts and the unfavourable impact of foreign currency translation
153
FAIRFAX FINANCIAL HOLDINGS LIMITED
(principally the strengthening of the U.S. dollar relative to the Canadian dollar), partially offset by cash provided byoperating activities.
Bonds (including bonds pledged for short sale derivative obligations) increased by $1,782.0 primarily reflecting netunrealized appreciation (principally related to bonds issued by U.S. states and municipalities and theU.S. government) and net purchases of other government bonds.
Common stocks increased by $1,012.8 primarily reflecting net unrealized appreciation and net purchases of othercommon stocks.
Investments in associates increased by $185.2 primarily reflecting the share of profit of associates of $105.7, aninvestment in AgriCo, and additional investments in Grivalia Properties (formerly Eurobank Properties REIC prior toOctober 15, 2014) and Thai Re, partially offset by the share of losses on defined benefit plans of associates of $50.8(principally related to Resolute), the sale of the company’s investments in MEGA Brands and two KWF LPs, and netunrealized foreign currency translation losses.
Derivatives and other invested assets net of short sale and derivative obligations increased by $286.7 primarilyreflecting lower net payables to counterparties to the company’s short equity and equity index total return swaps(excluding the impact of collateral requirements), premiums paid to enter into new CPI-linked derivatives, netunrealized appreciation of CPI-linked derivatives and increased net receivables related to foreign currency contracts.
Recoverable from reinsurers decreased by $992.6 to $3,982.1 at December 31, 2014 from $4,974.7 atDecember 31, 2013 primarily reflecting Runoff’s continued progress reducing its recoverable from reinsurers(through normal cession and collection activity and commutations including the commutation of a reinsurancerecoverable from the Brit Group with a carrying value of $312.7), the impact of more favourable loss experience atOdysseyRe in its U.S. crop insurance business, the impact on loss reserves of the strengthening of the U.S. dollarrelative to the Canadian dollar (principally at Northbridge) and favourable prior year reserve development cededto reinsurers.
Deferred income taxes decreased by $554.6 to $460.4 at December 31, 2014 from $1,015.0 at December 31, 2013primarily due to the impact of net realized and unrealized investment gains and improved underwriting profitabilityin the U.S.
Goodwill and intangible assets increased by $246.5 to $1,558.3 at December 31, 2014 from $1,311.8 atDecember 31, 2013, primarily as a result of the acquisitions of The Keg and Pethealth and the consolidation ofSterling Resorts, as described in note 23 (Acquisitions and Divestitures) to the consolidated financial statements forthe year ended December 31, 2014. At December 31, 2014 consolidated goodwill of $1,048.7 (December 31, 2013 –$851.3) and intangible assets of $509.6 (December 31, 2013 – $460.5) was comprised by reporting segment as set outin note 12 (Goodwill and Intangible Assets) to the consolidated financial statements for the year ended December 31,2014. Impairment tests for goodwill and intangible assets not subject to amortization were completed in 2014 and itwas concluded that no impairment had occurred.
Other assets increased by $259.5 to $1,347.6 at December 31, 2014 from $1,088.1 at December 31, 2013 primarilyas a result of the consolidation of the assets of The Keg, Sterling Resorts and Praktiker, partially offset by decreasedincome taxes refundable reflecting operating income earned in 2014 (principally at Northbridge) and lowerreceivables on securities sold not yet settled.
Provision for losses and loss adjustment expenses decreased by $1,463.7 to $17,749.1 at December 31, 2014from $19,212.8 at December 31, 2013 primarily reflecting Runoff’s continued progress settling its claim liabilities,the impact on loss reserves of the strengthening of the U.S. dollar relative to the Canadian dollar (principally atNorthbridge) and the euro and British Pound Sterling (principally at OdysseyRe and Runoff), favourable prior yearreserve development at OdysseyRe, Northbridge, Group Re, Advent and Zenith National and lower current periodcatastrophe losses, partially offset by the impact of the Everest Re reinsurance transaction and medical malpracticereinsurance transaction and unfavourable prior year reserve development at Runoff and increased claim liabilities atFairfax Asia and Fairfax Brasil (reflecting increased business volumes).
Non-controlling interests increased by $110.7 to $218.1 at December 31, 2014 from $107.4 at December 31, 2013principally as a result of the consolidation of Sterling Resorts, the acquisition of The Keg and net earningsattributable to non-controlling interests, partially offset by dividends paid to non-controlling shareholders.
154
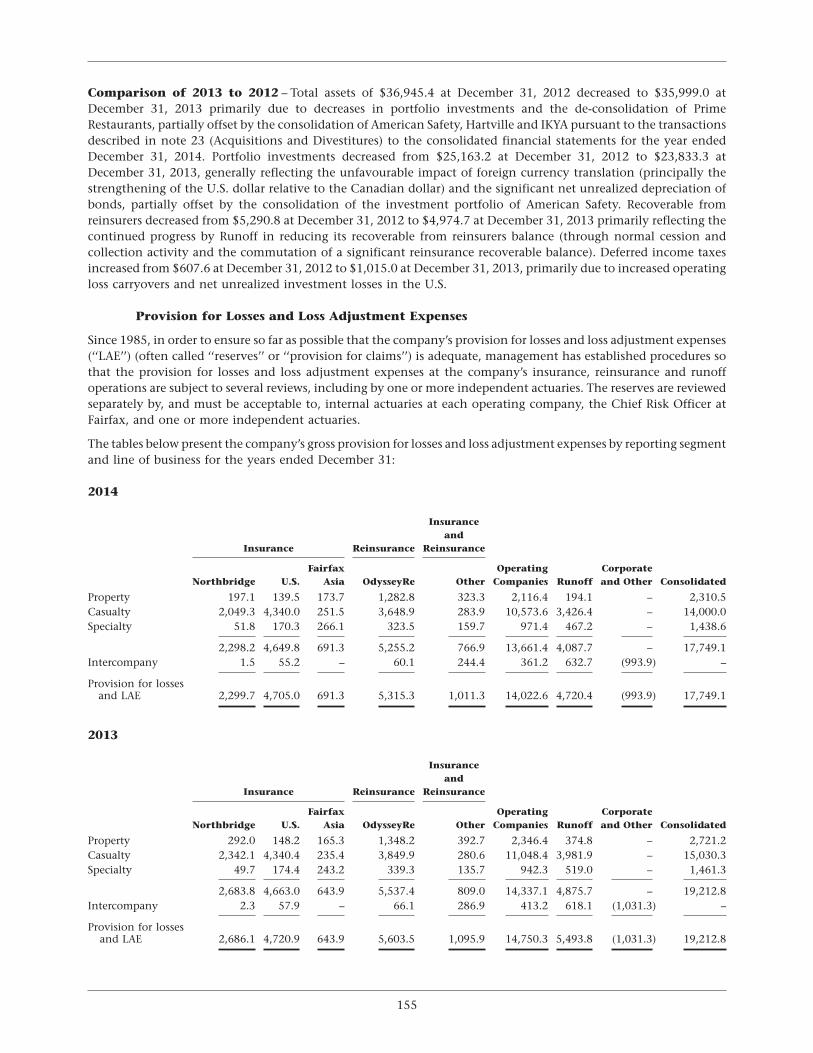
Comparison of 2013 to 2012 – Total assets of $36,945.4 at December 31, 2012 decreased to $35,999.0 atDecember 31, 2013 primarily due to decreases in portfolio investments and the de-consolidation of PrimeRestaurants, partially offset by the consolidation of American Safety, Hartville and IKYA pursuant to the transactionsdescribed in note 23 (Acquisitions and Divestitures) to the consolidated financial statements for the year endedDecember 31, 2014. Portfolio investments decreased from $25,163.2 at December 31, 2012 to $23,833.3 atDecember 31, 2013, generally reflecting the unfavourable impact of foreign currency translation (principally thestrengthening of the U.S. dollar relative to the Canadian dollar) and the significant net unrealized depreciation ofbonds, partially offset by the consolidation of the investment portfolio of American Safety. Recoverable fromreinsurers decreased from $5,290.8 at December 31, 2012 to $4,974.7 at December 31, 2013 primarily reflecting thecontinued progress by Runoff in reducing its recoverable from reinsurers balance (through normal cession andcollection activity and the commutation of a significant reinsurance recoverable balance). Deferred income taxesincreased from $607.6 at December 31, 2012 to $1,015.0 at December 31, 2013, primarily due to increased operatingloss carryovers and net unrealized investment losses in the U.S.
Provision for Losses and Loss Adjustment Expenses
Since 1985, in order to ensure so far as possible that the company’s provision for losses and loss adjustment expenses(‘‘LAE’’) (often called ‘‘reserves’’ or ‘‘provision for claims’’) is adequate, management has established procedures sothat the provision for losses and loss adjustment expenses at the company’s insurance, reinsurance and runoffoperations are subject to several reviews, including by one or more independent actuaries. The reserves are reviewedseparately by, and must be acceptable to, internal actuaries at each operating company, the Chief Risk Officer atFairfax, and one or more independent actuaries.
The tables below present the company’s gross provision for losses and loss adjustment expenses by reporting segmentand line of business for the years ended December 31:
2014
Insuranceand
Insurance Reinsurance Reinsurance
Fairfax Operating CorporateNorthbridge U.S. Asia OdysseyRe Other Companies Runoff and Other Consolidated
Property 197.1 139.5 173.7 1,282.8 323.3 2,116.4 194.1 – 2,310.5Casualty 2,049.3 4,340.0 251.5 3,648.9 283.9 10,573.6 3,426.4 – 14,000.0Specialty 51.8 170.3 266.1 323.5 159.7 971.4 467.2 – 1,438.6
2,298.2 4,649.8 691.3 5,255.2 766.9 13,661.4 4,087.7 – 17,749.1Intercompany 1.5 55.2 – 60.1 244.4 361.2 632.7 (993.9) –
Provision for lossesand LAE 2,299.7 4,705.0 691.3 5,315.3 1,011.3 14,022.6 4,720.4 (993.9) 17,749.1
2013
Insuranceand
Insurance Reinsurance Reinsurance
Fairfax Operating CorporateNorthbridge U.S. Asia OdysseyRe Other Companies Runoff and Other Consolidated
Property 292.0 148.2 165.3 1,348.2 392.7 2,346.4 374.8 – 2,721.2Casualty 2,342.1 4,340.4 235.4 3,849.9 280.6 11,048.4 3,981.9 – 15,030.3Specialty 49.7 174.4 243.2 339.3 135.7 942.3 519.0 – 1,461.3
2,683.8 4,663.0 643.9 5,537.4 809.0 14,337.1 4,875.7 – 19,212.8Intercompany 2.3 57.9 – 66.1 286.9 413.2 618.1 (1,031.3) –
Provision for lossesand LAE 2,686.1 4,720.9 643.9 5,603.5 1,095.9 14,750.3 5,493.8 (1,031.3) 19,212.8
155
FAIRFAX FINANCIAL HOLDINGS LIMITED
In the ordinary course of carrying on business, Fairfax’s insurance, reinsurance and runoff companies may pledgetheir own assets as security for their own obligations to pay claims or to make premium (and accrued interest)payments. Circumstances where assets may be so pledged (either directly or to support letters of credit issued for thefollowing purposes) include: regulatory deposits (such as with U.S. states for workers’ compensation business);deposits of funds at Lloyd’s in support of London market underwriting; and by a non-admitted company underU.S. insurance regulations as security for claims assumed or to support funds withheld obligations. Generally, thepledged assets are released as the underlying payment obligation is fulfilled. The $3.6 billion of cash and investmentspledged by the company’s subsidiaries at December 31, 2014, as described in note 5 (Cash and Investments) to theconsolidated financial statements for the year ended December 31, 2014, represented the aggregate amount at thatdate that had been pledged in the ordinary course of business to support each pledging subsidiary’s respectiveobligations as previously described in this paragraph (these pledges do not involve the cross-collateralization by onegroup company of another group company’s obligations).
Claims provisions are established by our primary insurance companies by the case method as claims are initiallyreported. The provisions are subsequently adjusted as additional information on the estimated ultimate amount of aclaim becomes known during the course of its settlement. The company’s reinsurance companies rely on initial andsubsequent claims reports received from ceding companies to establish estimates of provision for claims. Indetermining the provision to cover the estimated ultimate liability for all of the company’s insurance andreinsurance obligations, a provision is also made for management’s calculation of factors affecting the futuredevelopment of claims including incurred but not reported claims based on the volume of business currently inforce, the historical experience on claims and potential changes, such as changes in the underlying book of business,in law and in cost factors.
As time passes, more information about the claims becomes known and provision estimates are consequentlyadjusted upward or downward. Because of the various elements of estimation encompassed in this process and thetime it takes to settle many of the more substantial claims, several years may be required before a meaningfulcomparison of actual losses to the original estimates of provision for claims can be developed.
The development of the provision for claims is often measured as the difference between estimates of reserves as ofthe initial year-end and the re-estimated liability at each subsequent year-end. This is based on actual payments infull or partial settlement of claims, plus re-estimates of the reserves required for claims still open or claims stillunreported. Favourable development (or redundancies) means that subsequent reserve estimates are lower thanoriginally indicated, while unfavourable development (or deficiencies) means that the original reserve estimateswere lower than subsequently indicated. The aggregate net favourable development of $374.4 and $476.0 in 2014and 2013 respectively were comprised as shown in the following table:
Favourable/(Unfavourable)
2014 2013
Insurance – Canada (Northbridge) 110.2 154.0– U.S. (Crum & Forster and Zenith National) 72.6 27.7– Asia (Fairfax Asia) 20.6 16.7
Reinsurance – OdysseyRe 189.1 214.7Insurance and Reinsurance – Other 53.2 26.9
Insurance and reinsurance operating companies 445.7 440.0Runoff (71.3) 36.0
Net favourable reserve development 374.4 476.0
156
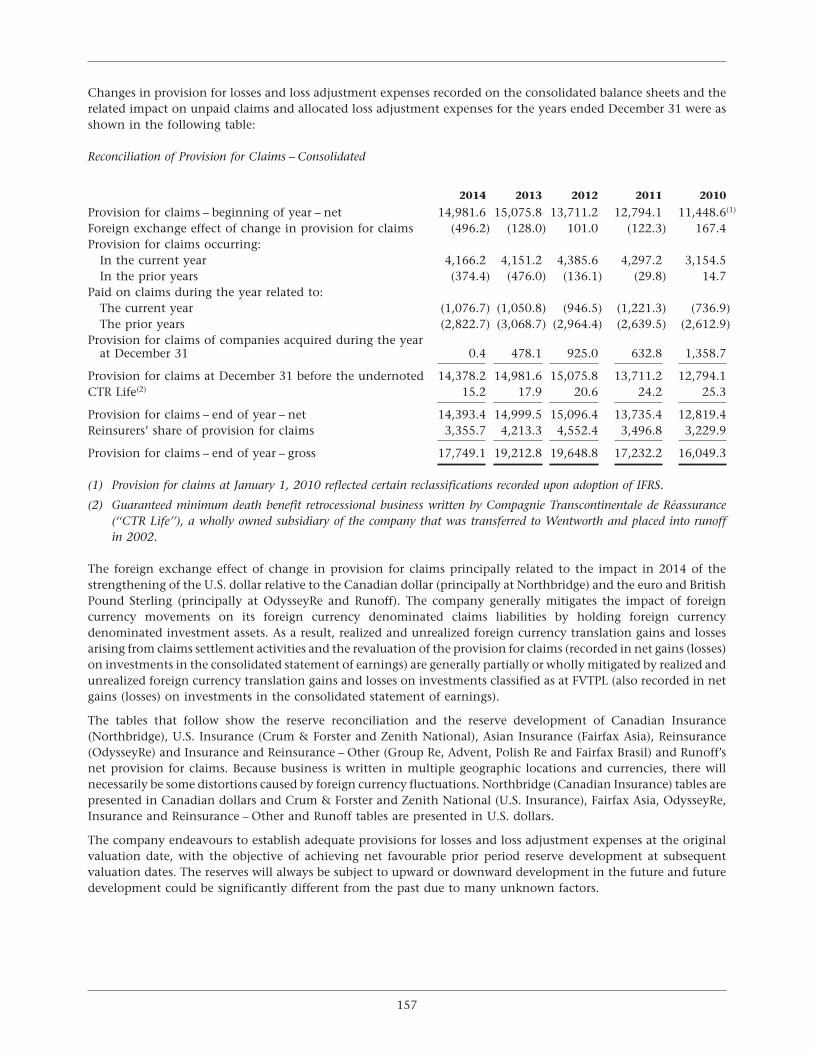
Changes in provision for losses and loss adjustment expenses recorded on the consolidated balance sheets and therelated impact on unpaid claims and allocated loss adjustment expenses for the years ended December 31 were asshown in the following table:
Reconciliation of Provision for Claims – Consolidated
2014 2013 2012 2011 2010
Provision for claims – beginning of year – net 14,981.6 15,075.8 13,711.2 12,794.1 11,448.6(1)
Foreign exchange effect of change in provision for claims (496.2) (128.0) 101.0 (122.3) 167.4Provision for claims occurring:
In the current year 4,166.2 4,151.2 4,385.6 4,297.2 3,154.5In the prior years (374.4) (476.0) (136.1) (29.8) 14.7
Paid on claims during the year related to:The current year (1,076.7) (1,050.8) (946.5) (1,221.3) (736.9)The prior years (2,822.7) (3,068.7) (2,964.4) (2,639.5) (2,612.9)
Provision for claims of companies acquired during the yearat December 31 0.4 478.1 925.0 632.8 1,358.7
Provision for claims at December 31 before the undernoted 14,378.2 14,981.6 15,075.8 13,711.2 12,794.1CTR Life(2) 15.2 17.9 20.6 24.2 25.3
Provision for claims – end of year – net 14,393.4 14,999.5 15,096.4 13,735.4 12,819.4Reinsurers’ share of provision for claims 3,355.7 4,213.3 4,552.4 3,496.8 3,229.9
Provision for claims – end of year – gross 17,749.1 19,212.8 19,648.8 17,232.2 16,049.3
(1) Provision for claims at January 1, 2010 reflected certain reclassifications recorded upon adoption of IFRS.
(2) Guaranteed minimum death benefit retrocessional business written by Compagnie Transcontinentale de Reassurance(‘‘CTR Life’’), a wholly owned subsidiary of the company that was transferred to Wentworth and placed into runoffin 2002.
The foreign exchange effect of change in provision for claims principally related to the impact in 2014 of thestrengthening of the U.S. dollar relative to the Canadian dollar (principally at Northbridge) and the euro and BritishPound Sterling (principally at OdysseyRe and Runoff). The company generally mitigates the impact of foreigncurrency movements on its foreign currency denominated claims liabilities by holding foreign currencydenominated investment assets. As a result, realized and unrealized foreign currency translation gains and lossesarising from claims settlement activities and the revaluation of the provision for claims (recorded in net gains (losses)on investments in the consolidated statement of earnings) are generally partially or wholly mitigated by realized andunrealized foreign currency translation gains and losses on investments classified as at FVTPL (also recorded in netgains (losses) on investments in the consolidated statement of earnings).
The tables that follow show the reserve reconciliation and the reserve development of Canadian Insurance(Northbridge), U.S. Insurance (Crum & Forster and Zenith National), Asian Insurance (Fairfax Asia), Reinsurance(OdysseyRe) and Insurance and Reinsurance – Other (Group Re, Advent, Polish Re and Fairfax Brasil) and Runoff’snet provision for claims. Because business is written in multiple geographic locations and currencies, there willnecessarily be some distortions caused by foreign currency fluctuations. Northbridge (Canadian Insurance) tables arepresented in Canadian dollars and Crum & Forster and Zenith National (U.S. Insurance), Fairfax Asia, OdysseyRe,Insurance and Reinsurance – Other and Runoff tables are presented in U.S. dollars.
The company endeavours to establish adequate provisions for losses and loss adjustment expenses at the originalvaluation date, with the objective of achieving net favourable prior period reserve development at subsequentvaluation dates. The reserves will always be subject to upward or downward development in the future and futuredevelopment could be significantly different from the past due to many unknown factors.
157
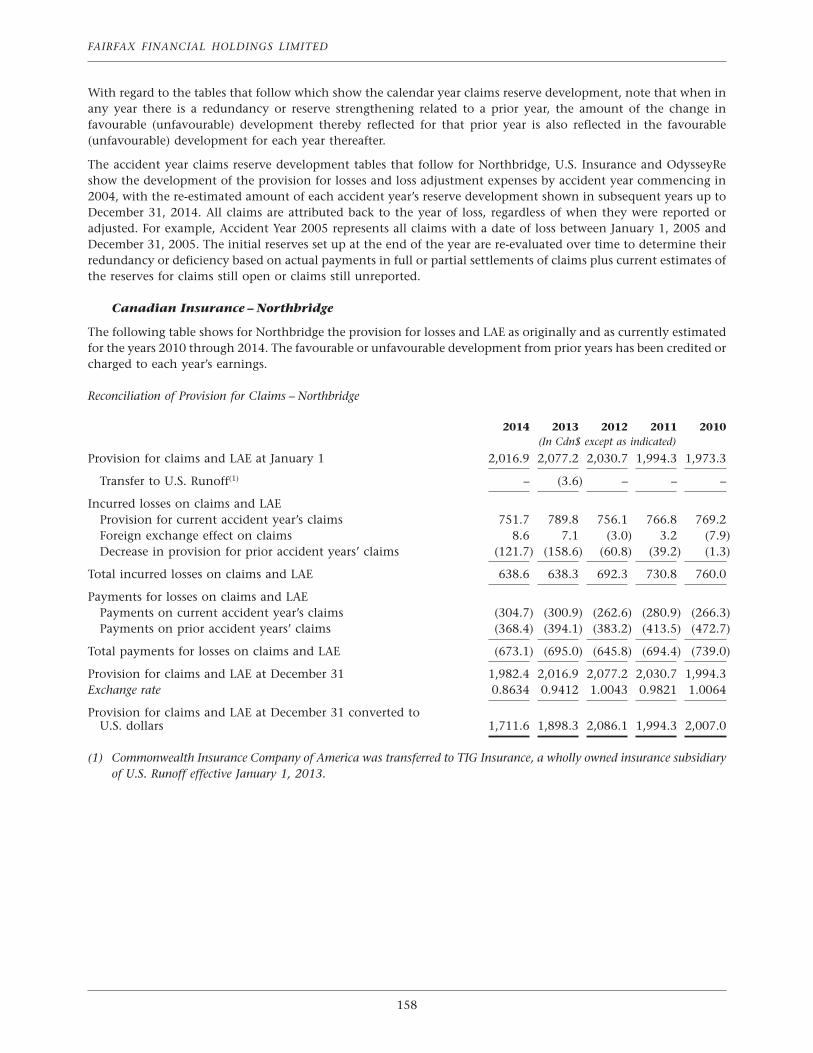
FAIRFAX FINANCIAL HOLDINGS LIMITED
With regard to the tables that follow which show the calendar year claims reserve development, note that when inany year there is a redundancy or reserve strengthening related to a prior year, the amount of the change infavourable (unfavourable) development thereby reflected for that prior year is also reflected in the favourable(unfavourable) development for each year thereafter.
The accident year claims reserve development tables that follow for Northbridge, U.S. Insurance and OdysseyReshow the development of the provision for losses and loss adjustment expenses by accident year commencing in2004, with the re-estimated amount of each accident year’s reserve development shown in subsequent years up toDecember 31, 2014. All claims are attributed back to the year of loss, regardless of when they were reported oradjusted. For example, Accident Year 2005 represents all claims with a date of loss between January 1, 2005 andDecember 31, 2005. The initial reserves set up at the end of the year are re-evaluated over time to determine theirredundancy or deficiency based on actual payments in full or partial settlements of claims plus current estimates ofthe reserves for claims still open or claims still unreported.
Canadian Insurance – Northbridge
The following table shows for Northbridge the provision for losses and LAE as originally and as currently estimatedfor the years 2010 through 2014. The favourable or unfavourable development from prior years has been credited orcharged to each year’s earnings.
Reconciliation of Provision for Claims – Northbridge
2014 2013 2012 2011 2010(In Cdn$ except as indicated)
Provision for claims and LAE at January 1 2,016.9 2,077.2 2,030.7 1,994.3 1,973.3
Transfer to U.S. Runoff(1) – (3.6) – – –
Incurred losses on claims and LAEProvision for current accident year’s claims 751.7 789.8 756.1 766.8 769.2Foreign exchange effect on claims 8.6 7.1 (3.0) 3.2 (7.9)Decrease in provision for prior accident years’ claims (121.7) (158.6) (60.8) (39.2) (1.3)
Total incurred losses on claims and LAE 638.6 638.3 692.3 730.8 760.0
Payments for losses on claims and LAEPayments on current accident year’s claims (304.7) (300.9) (262.6) (280.9) (266.3)Payments on prior accident years’ claims (368.4) (394.1) (383.2) (413.5) (472.7)
Total payments for losses on claims and LAE (673.1) (695.0) (645.8) (694.4) (739.0)
Provision for claims and LAE at December 31 1,982.4 2,016.9 2,077.2 2,030.7 1,994.3Exchange rate 0.8634 0.9412 1.0043 0.9821 1.0064
Provision for claims and LAE at December 31 converted toU.S. dollars 1,711.6 1,898.3 2,086.1 1,994.3 2,007.0
(1) Commonwealth Insurance Company of America was transferred to TIG Insurance, a wholly owned insurance subsidiaryof U.S. Runoff effective January 1, 2013.
158
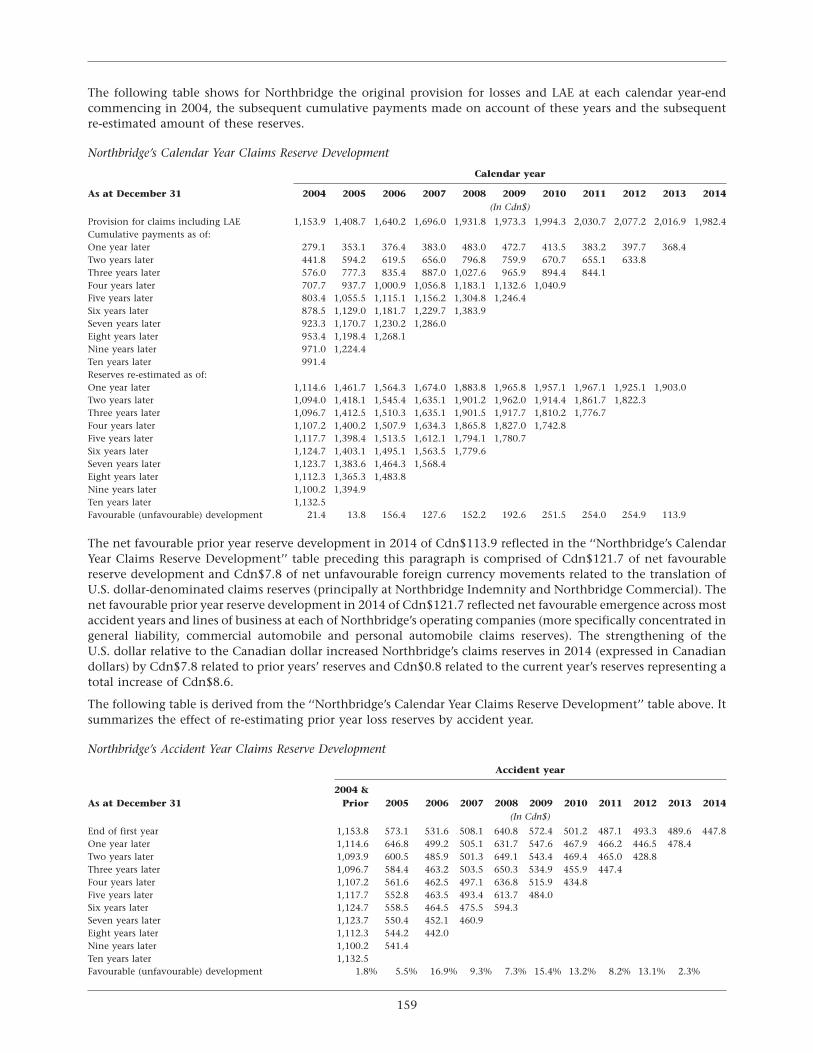
The following table shows for Northbridge the original provision for losses and LAE at each calendar year-endcommencing in 2004, the subsequent cumulative payments made on account of these years and the subsequentre-estimated amount of these reserves.
Northbridge’s Calendar Year Claims Reserve Development
Calendar year
As at December 31 2004 2005 2006 2007 2008 2009 2010 2011 2012 2013 2014(In Cdn$)
Provision for claims including LAE 1,153.9 1,408.7 1,640.2 1,696.0 1,931.8 1,973.3 1,994.3 2,030.7 2,077.2 2,016.9 1,982.4Cumulative payments as of:One year later 279.1 353.1 376.4 383.0 483.0 472.7 413.5 383.2 397.7 368.4Two years later 441.8 594.2 619.5 656.0 796.8 759.9 670.7 655.1 633.8Three years later 576.0 777.3 835.4 887.0 1,027.6 965.9 894.4 844.1Four years later 707.7 937.7 1,000.9 1,056.8 1,183.1 1,132.6 1,040.9Five years later 803.4 1,055.5 1,115.1 1,156.2 1,304.8 1,246.4Six years later 878.5 1,129.0 1,181.7 1,229.7 1,383.9Seven years later 923.3 1,170.7 1,230.2 1,286.0Eight years later 953.4 1,198.4 1,268.1Nine years later 971.0 1,224.4Ten years later 991.4Reserves re-estimated as of:One year later 1,114.6 1,461.7 1,564.3 1,674.0 1,883.8 1,965.8 1,957.1 1,967.1 1,925.1 1,903.0Two years later 1,094.0 1,418.1 1,545.4 1,635.1 1,901.2 1,962.0 1,914.4 1,861.7 1,822.3Three years later 1,096.7 1,412.5 1,510.3 1,635.1 1,901.5 1,917.7 1,810.2 1,776.7Four years later 1,107.2 1,400.2 1,507.9 1,634.3 1,865.8 1,827.0 1,742.8Five years later 1,117.7 1,398.4 1,513.5 1,612.1 1,794.1 1,780.7Six years later 1,124.7 1,403.1 1,495.1 1,563.5 1,779.6Seven years later 1,123.7 1,383.6 1,464.3 1,568.4Eight years later 1,112.3 1,365.3 1,483.8Nine years later 1,100.2 1,394.9Ten years later 1,132.5Favourable (unfavourable) development 21.4 13.8 156.4 127.6 152.2 192.6 251.5 254.0 254.9 113.9
The net favourable prior year reserve development in 2014 of Cdn$113.9 reflected in the ‘‘Northbridge’s CalendarYear Claims Reserve Development’’ table preceding this paragraph is comprised of Cdn$121.7 of net favourablereserve development and Cdn$7.8 of net unfavourable foreign currency movements related to the translation ofU.S. dollar-denominated claims reserves (principally at Northbridge Indemnity and Northbridge Commercial). Thenet favourable prior year reserve development in 2014 of Cdn$121.7 reflected net favourable emergence across mostaccident years and lines of business at each of Northbridge’s operating companies (more specifically concentrated ingeneral liability, commercial automobile and personal automobile claims reserves). The strengthening of theU.S. dollar relative to the Canadian dollar increased Northbridge’s claims reserves in 2014 (expressed in Canadiandollars) by Cdn$7.8 related to prior years’ reserves and Cdn$0.8 related to the current year’s reserves representing atotal increase of Cdn$8.6.
The following table is derived from the ‘‘Northbridge’s Calendar Year Claims Reserve Development’’ table above. Itsummarizes the effect of re-estimating prior year loss reserves by accident year.
Northbridge’s Accident Year Claims Reserve Development
Accident year
2004 &As at December 31 Prior 2005 2006 2007 2008 2009 2010 2011 2012 2013 2014
(In Cdn$)
End of first year 1,153.8 573.1 531.6 508.1 640.8 572.4 501.2 487.1 493.3 489.6 447.8One year later 1,114.6 646.8 499.2 505.1 631.7 547.6 467.9 466.2 446.5 478.4Two years later 1,093.9 600.5 485.9 501.3 649.1 543.4 469.4 465.0 428.8Three years later 1,096.7 584.4 463.2 503.5 650.3 534.9 455.9 447.4Four years later 1,107.2 561.6 462.5 497.1 636.8 515.9 434.8Five years later 1,117.7 552.8 463.5 493.4 613.7 484.0Six years later 1,124.7 558.5 464.5 475.5 594.3Seven years later 1,123.7 550.4 452.1 460.9Eight years later 1,112.3 544.2 442.0Nine years later 1,100.2 541.4Ten years later 1,132.5Favourable (unfavourable) development 1.8% 5.5% 16.9% 9.3% 7.3% 15.4% 13.2% 8.2% 13.1% 2.3%
159
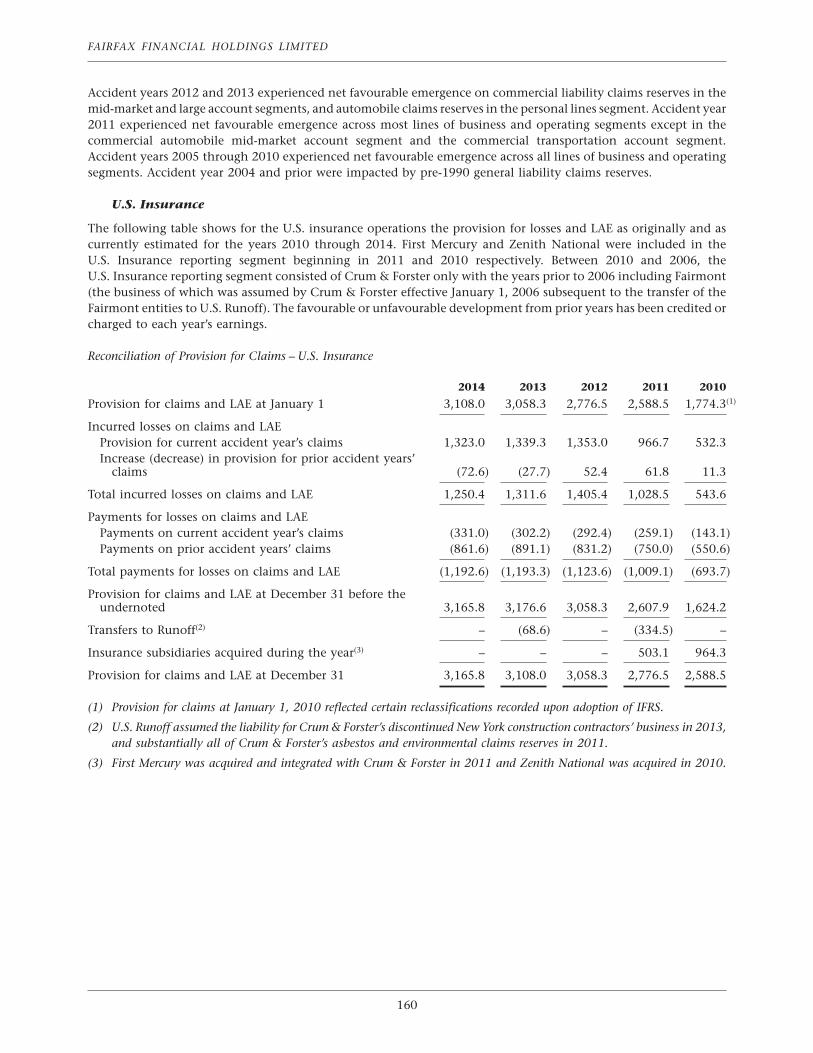
FAIRFAX FINANCIAL HOLDINGS LIMITED
Accident years 2012 and 2013 experienced net favourable emergence on commercial liability claims reserves in themid-market and large account segments, and automobile claims reserves in the personal lines segment. Accident year2011 experienced net favourable emergence across most lines of business and operating segments except in thecommercial automobile mid-market account segment and the commercial transportation account segment.Accident years 2005 through 2010 experienced net favourable emergence across all lines of business and operatingsegments. Accident year 2004 and prior were impacted by pre-1990 general liability claims reserves.
U.S. Insurance
The following table shows for the U.S. insurance operations the provision for losses and LAE as originally and ascurrently estimated for the years 2010 through 2014. First Mercury and Zenith National were included in theU.S. Insurance reporting segment beginning in 2011 and 2010 respectively. Between 2010 and 2006, theU.S. Insurance reporting segment consisted of Crum & Forster only with the years prior to 2006 including Fairmont(the business of which was assumed by Crum & Forster effective January 1, 2006 subsequent to the transfer of theFairmont entities to U.S. Runoff). The favourable or unfavourable development from prior years has been credited orcharged to each year’s earnings.
Reconciliation of Provision for Claims – U.S. Insurance
2014 2013 2012 2011 2010
Provision for claims and LAE at January 1 3,108.0 3,058.3 2,776.5 2,588.5 1,774.3(1)
Incurred losses on claims and LAEProvision for current accident year’s claims 1,323.0 1,339.3 1,353.0 966.7 532.3Increase (decrease) in provision for prior accident years’
claims (72.6) (27.7) 52.4 61.8 11.3
Total incurred losses on claims and LAE 1,250.4 1,311.6 1,405.4 1,028.5 543.6
Payments for losses on claims and LAEPayments on current accident year’s claims (331.0) (302.2) (292.4) (259.1) (143.1)Payments on prior accident years’ claims (861.6) (891.1) (831.2) (750.0) (550.6)
Total payments for losses on claims and LAE (1,192.6) (1,193.3) (1,123.6) (1,009.1) (693.7)
Provision for claims and LAE at December 31 before theundernoted 3,165.8 3,176.6 3,058.3 2,607.9 1,624.2
Transfers to Runoff(2) – (68.6) – (334.5) –
Insurance subsidiaries acquired during the year(3) – – – 503.1 964.3
Provision for claims and LAE at December 31 3,165.8 3,108.0 3,058.3 2,776.5 2,588.5
(1) Provision for claims at January 1, 2010 reflected certain reclassifications recorded upon adoption of IFRS.
(2) U.S. Runoff assumed the liability for Crum & Forster’s discontinued New York construction contractors’ business in 2013,and substantially all of Crum & Forster’s asbestos and environmental claims reserves in 2011.
(3) First Mercury was acquired and integrated with Crum & Forster in 2011 and Zenith National was acquired in 2010.
160
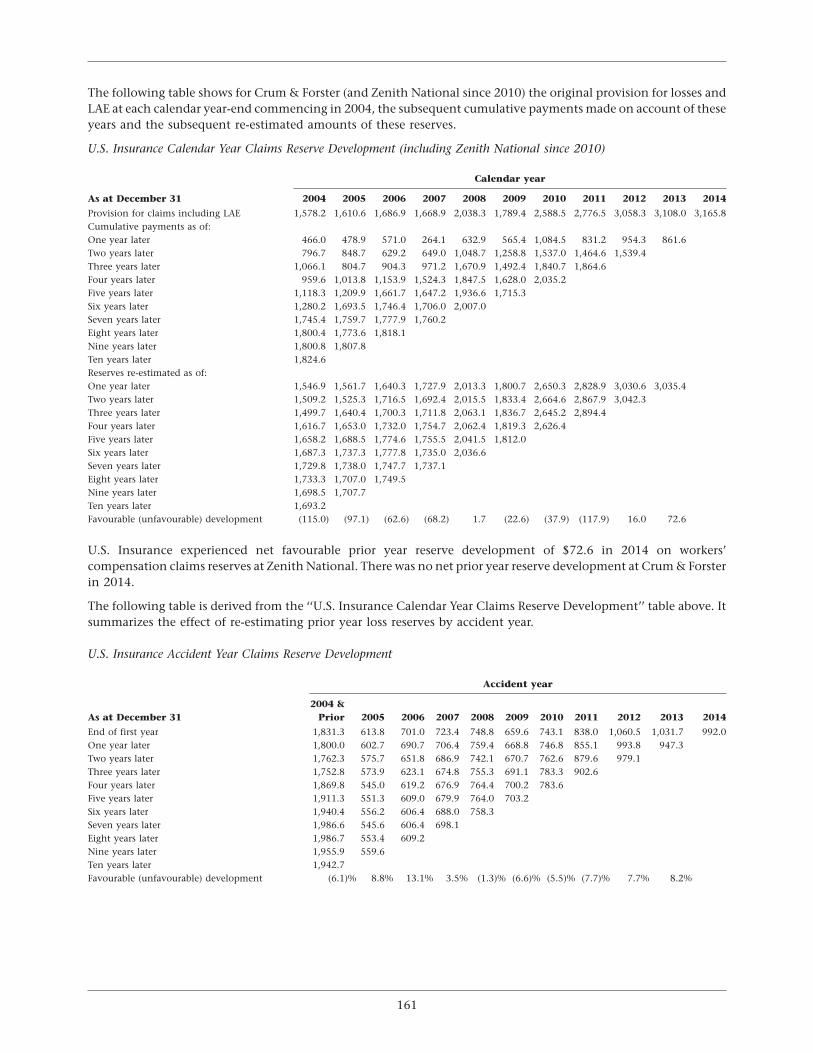
The following table shows for Crum & Forster (and Zenith National since 2010) the original provision for losses andLAE at each calendar year-end commencing in 2004, the subsequent cumulative payments made on account of theseyears and the subsequent re-estimated amounts of these reserves.
U.S. Insurance Calendar Year Claims Reserve Development (including Zenith National since 2010)
Calendar year
As at December 31 2004 2005 2006 2007 2008 2009 2010 2011 2012 2013 2014
Provision for claims including LAE 1,578.2 1,610.6 1,686.9 1,668.9 2,038.3 1,789.4 2,588.5 2,776.5 3,058.3 3,108.0 3,165.8Cumulative payments as of:One year later 466.0 478.9 571.0 264.1 632.9 565.4 1,084.5 831.2 954.3 861.6Two years later 796.7 848.7 629.2 649.0 1,048.7 1,258.8 1,537.0 1,464.6 1,539.4Three years later 1,066.1 804.7 904.3 971.2 1,670.9 1,492.4 1,840.7 1,864.6Four years later 959.6 1,013.8 1,153.9 1,524.3 1,847.5 1,628.0 2,035.2Five years later 1,118.3 1,209.9 1,661.7 1,647.2 1,936.6 1,715.3Six years later 1,280.2 1,693.5 1,746.4 1,706.0 2,007.0Seven years later 1,745.4 1,759.7 1,777.9 1,760.2Eight years later 1,800.4 1,773.6 1,818.1Nine years later 1,800.8 1,807.8Ten years later 1,824.6Reserves re-estimated as of:One year later 1,546.9 1,561.7 1,640.3 1,727.9 2,013.3 1,800.7 2,650.3 2,828.9 3,030.6 3,035.4Two years later 1,509.2 1,525.3 1,716.5 1,692.4 2,015.5 1,833.4 2,664.6 2,867.9 3,042.3Three years later 1,499.7 1,640.4 1,700.3 1,711.8 2,063.1 1,836.7 2,645.2 2,894.4Four years later 1,616.7 1,653.0 1,732.0 1,754.7 2,062.4 1,819.3 2,626.4Five years later 1,658.2 1,688.5 1,774.6 1,755.5 2,041.5 1,812.0Six years later 1,687.3 1,737.3 1,777.8 1,735.0 2,036.6Seven years later 1,729.8 1,738.0 1,747.7 1,737.1Eight years later 1,733.3 1,707.0 1,749.5Nine years later 1,698.5 1,707.7Ten years later 1,693.2Favourable (unfavourable) development (115.0) (97.1) (62.6) (68.2) 1.7 (22.6) (37.9) (117.9) 16.0 72.6
U.S. Insurance experienced net favourable prior year reserve development of $72.6 in 2014 on workers’compensation claims reserves at Zenith National. There was no net prior year reserve development at Crum & Forsterin 2014.
The following table is derived from the ‘‘U.S. Insurance Calendar Year Claims Reserve Development’’ table above. Itsummarizes the effect of re-estimating prior year loss reserves by accident year.
U.S. Insurance Accident Year Claims Reserve Development
Accident year
2004 &As at December 31 Prior 2005 2006 2007 2008 2009 2010 2011 2012 2013 2014
End of first year 1,831.3 613.8 701.0 723.4 748.8 659.6 743.1 838.0 1,060.5 1,031.7 992.0One year later 1,800.0 602.7 690.7 706.4 759.4 668.8 746.8 855.1 993.8 947.3Two years later 1,762.3 575.7 651.8 686.9 742.1 670.7 762.6 879.6 979.1Three years later 1,752.8 573.9 623.1 674.8 755.3 691.1 783.3 902.6Four years later 1,869.8 545.0 619.2 676.9 764.4 700.2 783.6Five years later 1,911.3 551.3 609.0 679.9 764.0 703.2Six years later 1,940.4 556.2 606.4 688.0 758.3Seven years later 1,986.6 545.6 606.4 698.1Eight years later 1,986.7 553.4 609.2Nine years later 1,955.9 559.6Ten years later 1,942.7Favourable (unfavourable) development (6.1)% 8.8% 13.1% 3.5% (1.3)% (6.6)% (5.5)% (7.7)% 7.7% 8.2%
161
FAIRFAX FINANCIAL HOLDINGS LIMITED
Accident years 2013 and 2012 experienced net favourable emergence on general liability and workers’ compensationclaims reserves. Accident years 2008 through 2011 experienced net adverse emergence principally related tounfavourable trends on workers’ compensation claims reserves at Crum & Forster and Zenith National and generalliability claims reserves at First Mercury. Accident years 2005 through 2007 experienced net favourable emergence ongeneral liability, commercial multi-peril and workers’ compensation claims reserves. Accident year 2004 and priorwere impacted by the effects of increased frequency and severity on casualty claims reserves, the effects of increasedcompetitive conditions during 2003 and prior periods and included strengthening of asbestos, environmental andlatent claims reserves.
Asian Insurance – Fairfax Asia
The following table shows for Fairfax Asia the provision for losses and LAE as originally and as currently estimated forthe years 2010 through 2014. Fairfax Indonesia and Pacific Insurance were included in the Fairfax Asia reportingsegment beginning in 2014 and 2011 respectively. The favourable or unfavourable development from prior years hasbeen credited or charged to each year’s earnings.
Reconciliation of Provision for Claims – Fairfax Asia
2014 2013 2012 2011 2010
Provision for claims and LAE at January 1 360.0 318.8 266.0 203.0 138.7
Incurred losses on claims and LAEProvision for current accident year’s claims 221.3 205.7 182.4 144.6 130.2Foreign exchange effect on claims (15.1) (10.1) 13.0 (3.1) 12.7Decrease in provision for prior accident years’ claims (20.6) (16.7) (16.4) (17.6) (10.0)
Total incurred losses on claims and LAE 185.6 178.9 179.0 123.9 132.9
Payments for losses on claims and LAEPayments on current accident year’s claims (63.1) (49.4) (44.1) (24.5) (24.0)Payments on prior accident years’ claims (110.3) (88.3) (82.1) (62.2) (44.6)
Total payments for losses on claims and LAE (173.4) (137.7) (126.2) (86.7) (68.6)
Insurance subsidiaries acquired during the year(1) 0.4 – – 25.8 –
Provision for claims and LAE at December 31 372.6 360.0 318.8 266.0 203.0
(1) Fairfax Indonesia and Pacific Insurance were acquired in 2014 and 2011 respectively.
The following table shows for Fairfax Asia the original provision for losses and LAE at each calendar year-endcommencing in 2004, the subsequent cumulative payments made on account of these years and the subsequentre-estimated amount of these reserves. The following Asian Insurance subsidiaries’ reserves are included from therespective years in which such subsidiaries were acquired:
Year acquired
Falcon Insurance 1998Winterthur (Asia) (now part of First Capital Insurance) 2001First Capital Insurance 2004Pacific Insurance 2011Fairfax Indonesia 2014
162
Fairfax Asia’s Calendar Year Claims Reserve Development
Calendar year
As at December 31 2004 2005 2006 2007 2008 2009 2010 2011 2012 2013 2014
Provision for claims including LAE 54.7 74.7 87.6 91.0 113.2 138.7 203.0 266.0 318.8 360.0 372.2Cumulative payments as of:One year later 13.3 15.6 26.5 30.9 41.0 44.6 62.2 82.1 88.3 110.3Two years later 21.9 32.6 45.2 49.8 56.5 65.2 92.4 120.0 135.3Three years later 29.1 44.6 56.3 55.8 62.8 75.7 106.3 142.9Four years later 32.6 50.3 58.8 58.0 66.2 80.5 115.7Five years later 33.8 51.1 59.9 59.1 67.7 83.2Six years later 34.2 51.5 60.1 59.9 68.5Seven years later 34.3 51.5 60.4 59.9Eight years later 34.4 51.6 60.3Nine years later 34.4 51.6Ten years later 34.5Reserves re-estimated as of:One year later 59.6 79.6 84.5 94.9 106.0 136.3 185.0 260.2 293.8 330.3Two years later 58.2 72.2 84.1 84.7 100.2 124.5 177.9 240.6 275.5Three years later 49.9 71.8 75.0 79.5 93.2 118.4 165.8 226.8Four years later 48.3 64.7 72.2 75.4 89.2 110.1 161.7Five years later 43.5 63.4 69.4 71.8 83.9 108.0Six years later 42.9 60.7 67.4 69.3 82.7Seven years later 41.3 58.6 66.0 68.5Eight years later 40.0 57.0 65.5Nine years later 38.7 56.7Ten years later 38.0Favourable (unfavourable) development 16.7 18.0 22.1 22.5 30.5 30.7 41.3 39.2 43.3 29.7
The net favourable prior year reserve development in 2014 of $29.7 reflected in the ‘‘Fairfax Asia’s Calendar YearClaims Reserve Development’’ table preceding this paragraph is comprised of $20.6 of net favourable reservedevelopment and $9.1 of net favourable foreign currency movements related to the translation of non-U.S. dollar-denominated claims reserves. The net favourable prior year reserve development in 2014 of $20.6 reflected netfavourable emergence on engineering, workers’ compensation, property and commercial automobile claimsreserves. Principally as a result of the strengthening of the U.S. dollar relative to the Singapore dollar in 2014, FairfaxAsia’s claims reserves (expressed in U.S. dollars) decreased by $9.1 related to prior years’ reserves and $6.0 related tothe current year’s reserves representing a total decrease of $15.1.
163
FAIRFAX FINANCIAL HOLDINGS LIMITED
Reinsurance – OdysseyRe
The following table shows for OdysseyRe the provision for losses and LAE as originally and as currently estimated forthe years 2010 through 2014. Clearwater Insurance was transferred to the U.S. Runoff reporting segment onJanuary 1, 2011. The favourable or unfavourable development from prior years has been credited or charged to eachyear’s earnings.
Reconciliation of Provision for Claims – OdysseyRe
2014 2013 2012 2011 2010
Provision for claims and LAE at January 1 4,812.8 4,842.7 4,789.5 4,857.2 4,666.3
Transfer of Clearwater Insurance to U.S. Runoff(1) – – – (484.2) –
Incurred losses on claims and LAEProvision for current accident year’s claims 1,473.1 1,524.3 1,566.5 1,863.7 1,320.6Foreign exchange effect on claims (186.2) 9.9 20.4 (38.0) 46.5Decrease in provision for prior accident years’ claims (189.1) (214.7) (152.0) (51.4) (3.6)
Total incurred losses on claims and LAE 1,097.8 1,319.5 1,434.9 1,774.3 1,363.5
Payments for losses on claims and LAEPayments on current accident year’s claims (311.4) (283.3) (249.3) (439.0) (184.4)Payments on prior accident years’ claims (1,010.1) (1,066.1) (1,132.4) (918.8) (988.2)
Total payments for losses on claims and LAE (1,321.5) (1,349.4) (1,381.7) (1,357.8) (1,172.6)
Provision for claims and LAE at December 31 4,589.1 4,812.8 4,842.7 4,789.5 4,857.2
(1) Clearwater Insurance was transferred to Runoff effective January 1, 2011.
The following table shows for OdysseyRe the original provision for losses and LAE at each calendar year-endcommencing in 2004, the subsequent cumulative payments made on account of these years and the subsequentre-estimated amount of these reserves.
OdysseyRe’s Calendar Year Claims Reserve Development(1)
Calendar year
As at December 31 2004 2005 2006 2007 2008 2009 2010 2011 2012 2013 2014
Provision for claims including LAE 3,132.5 3,865.4 4,403.1 4,475.6 4,560.3 4,666.3 4,857.2 4,789.5 4,842.7 4,812.8 4,589.1Cumulative payments as of:One year later 913.7 787.3 1,111.1 1,016.0 1,024.2 988.2 1,403.0 1,132.4 1,066.1 1,010.1Two years later 1,298.5 1,614.0 1,808.2 1,646.5 1,676.1 2,006.8 2,053.7 1,760.2 1,642.9Three years later 1,835.7 2,160.9 2,273.0 2,123.5 2,567.1 2,484.3 2,482.0 2,152.9Four years later 2,221.0 2,520.9 2,661.8 2,887.8 2,942.5 2,823.6 2,766.9Five years later 2,490.5 2,831.1 3,347.6 3,164.1 3,206.4 3,046.0Six years later 2,734.3 3,463.2 3,572.9 3,360.3 3,376.6Seven years later 3,323.4 3,653.1 3,721.2 3,488.6Eight years later 3,476.2 3,769.1 3,817.5Nine years later 3,559.8 3,842.8Ten years later 3,615.9Reserves re-estimated as of:One year later 3,299.0 4,050.8 4,443.6 4,465.5 4,549.0 4,662.7 4,805.8 4,637.5 4,628.0 4,623.7Two years later 3,537.0 4,143.5 4,481.5 4,499.0 4,567.7 4,650.4 4,726.6 4,500.3 4,439.1Three years later 3,736.1 4,221.3 4,564.3 4,537.8 4,561.3 4,606.6 4,674.1 4,357.3Four years later 3,837.5 4,320.5 4,623.1 4,534.5 4,548.7 4,591.2 4,566.5Five years later 3,950.1 4,393.0 4,628.3 4,522.9 4,535.0 4,489.4Six years later 4,023.3 4,406.7 4,630.5 4,516.0 4,460.5Seven years later 4,046.7 4,426.1 4,627.3 4,464.0Eight years later 4,073.1 4,434.0 4,577.3Nine years later 4,081.6 4,395.1Ten years later 4,056.8Favourable (unfavourable) development (924.3) (529.7) (174.2) 11.6 99.8 176.9 290.7 432.2 403.6 189.1
(1) The table above reflects the transfer of Clearwater Insurance to Runoff effective January 1, 2011.
164
OdysseyRe experienced net favourable prior year reserve development of $189.1 in 2014, attributable to decreasedloss estimates in its Americas ($96.0), EuroAsia ($28.1), London Market ($37.1) and U.S. Insurance ($27.9) divisionsprimarily related to net favourable emergence on casualty and non-catastrophe property claims reserves.
The following table is derived from the ‘‘OdysseyRe’s Calendar Year Claims Reserve Development’’ table above. Itsummarizes the effect of re-estimating prior year loss reserves by accident year.
OdysseyRe’s Accident Year Claims Reserve Development
Accident Year
2004 &As at December 31 Prior 2005 2006 2007 2008 2009 2010 2011 2012 2013 2014
End of first year 3,132.5 1,480.2 1,139.6 1,143.1 1,110.8 1,141.5 1,182.7 1,386.7 1,337.6 1,251.0 975.5One year later 3,298.9 1,427.6 1,087.4 1,095.2 1,066.1 1,119.2 1,143.6 1,313.9 1,260.1 1,250.7Two years later 3,537.0 1,321.2 1,047.5 1,045.7 1,045.9 1,113.3 1,108.2 1,229.2 1,214.2Three years later 3,736.0 1,297.5 1,031.1 1,025.8 1,042.8 1,082.1 1,071.1 1,193.8Four years later 3,837.5 1,284.1 1,017.4 1,017.3 1,041.8 1,080.3 1,065.4Five years later 3,950.1 1,283.4 1,008.9 1,003.5 1,035.0 1,053.1Six years later 4,023.3 1,273.7 991.8 999.8 1,012.5Seven years later 4,046.7 1,266.6 980.6 997.9Eight years later 4,073.1 1,266.2 969.4Nine years later 4,081.6 1,252.1Ten years later 4,056.8Favourable (unfavourable)
development (29.5)% 15.4% 14.9% 12.7% 8.8% 7.7% 9.9% 13.9% 9.2% 0.0%
Improvements in competitive conditions and the economic environment beginning in 2001 resulted in a continueddownward trend on re-estimated reserves for accident years 2005 through 2012. Initial loss estimates for thoseaccident years did not fully anticipate the improvements in market and economic conditions achieved since theearly 2000s. Accident years 2011 and 2012 benefited from net favourable emergence on catastrophe loss reserves.The deterioration in accident year 2004 and prior principally reflected net adverse emergence on asbestos andenvironmental pollution loss reserves and U.S. casualty loss reserves.
165
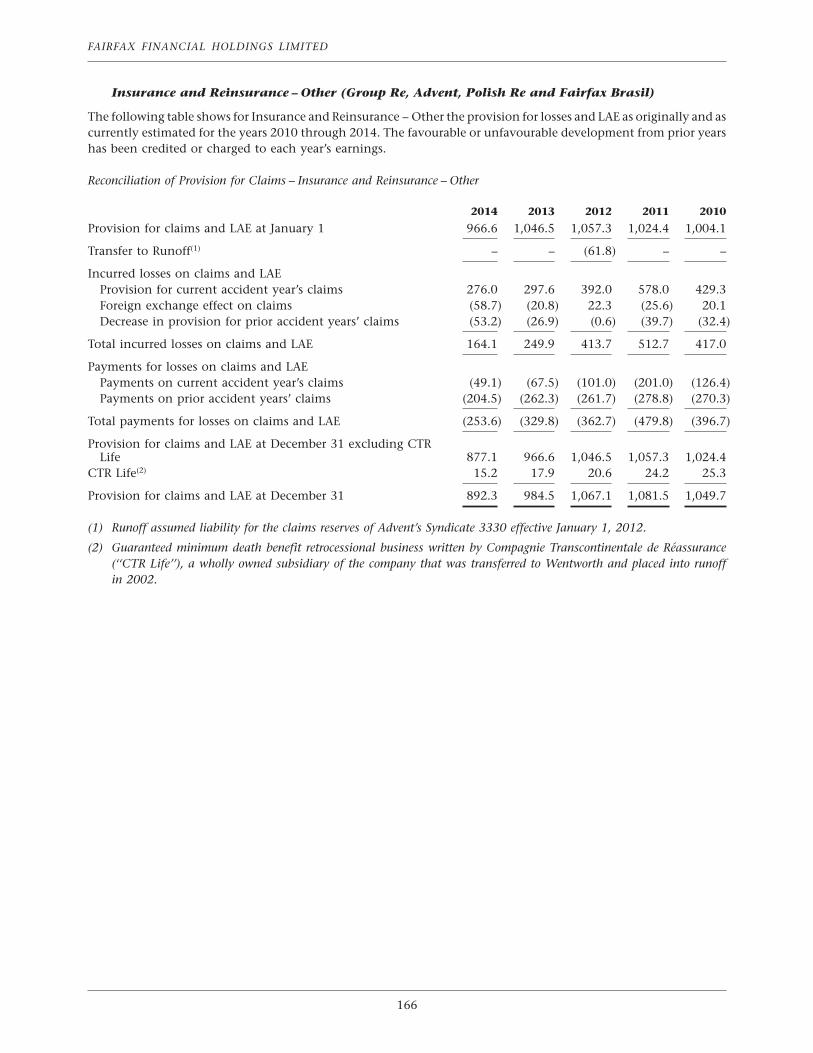
FAIRFAX FINANCIAL HOLDINGS LIMITED
Insurance and Reinsurance – Other (Group Re, Advent, Polish Re and Fairfax Brasil)
The following table shows for Insurance and Reinsurance – Other the provision for losses and LAE as originally and ascurrently estimated for the years 2010 through 2014. The favourable or unfavourable development from prior yearshas been credited or charged to each year’s earnings.
Reconciliation of Provision for Claims – Insurance and Reinsurance – Other
2014 2013 2012 2011 2010
Provision for claims and LAE at January 1 966.6 1,046.5 1,057.3 1,024.4 1,004.1
Transfer to Runoff(1) – – (61.8) – –
Incurred losses on claims and LAEProvision for current accident year’s claims 276.0 297.6 392.0 578.0 429.3Foreign exchange effect on claims (58.7) (20.8) 22.3 (25.6) 20.1Decrease in provision for prior accident years’ claims (53.2) (26.9) (0.6) (39.7) (32.4)
Total incurred losses on claims and LAE 164.1 249.9 413.7 512.7 417.0
Payments for losses on claims and LAEPayments on current accident year’s claims (49.1) (67.5) (101.0) (201.0) (126.4)Payments on prior accident years’ claims (204.5) (262.3) (261.7) (278.8) (270.3)
Total payments for losses on claims and LAE (253.6) (329.8) (362.7) (479.8) (396.7)
Provision for claims and LAE at December 31 excluding CTRLife 877.1 966.6 1,046.5 1,057.3 1,024.4
CTR Life(2) 15.2 17.9 20.6 24.2 25.3
Provision for claims and LAE at December 31 892.3 984.5 1,067.1 1,081.5 1,049.7
(1) Runoff assumed liability for the claims reserves of Advent’s Syndicate 3330 effective January 1, 2012.
(2) Guaranteed minimum death benefit retrocessional business written by Compagnie Transcontinentale de Reassurance(‘‘CTR Life’’), a wholly owned subsidiary of the company that was transferred to Wentworth and placed into runoffin 2002.
166
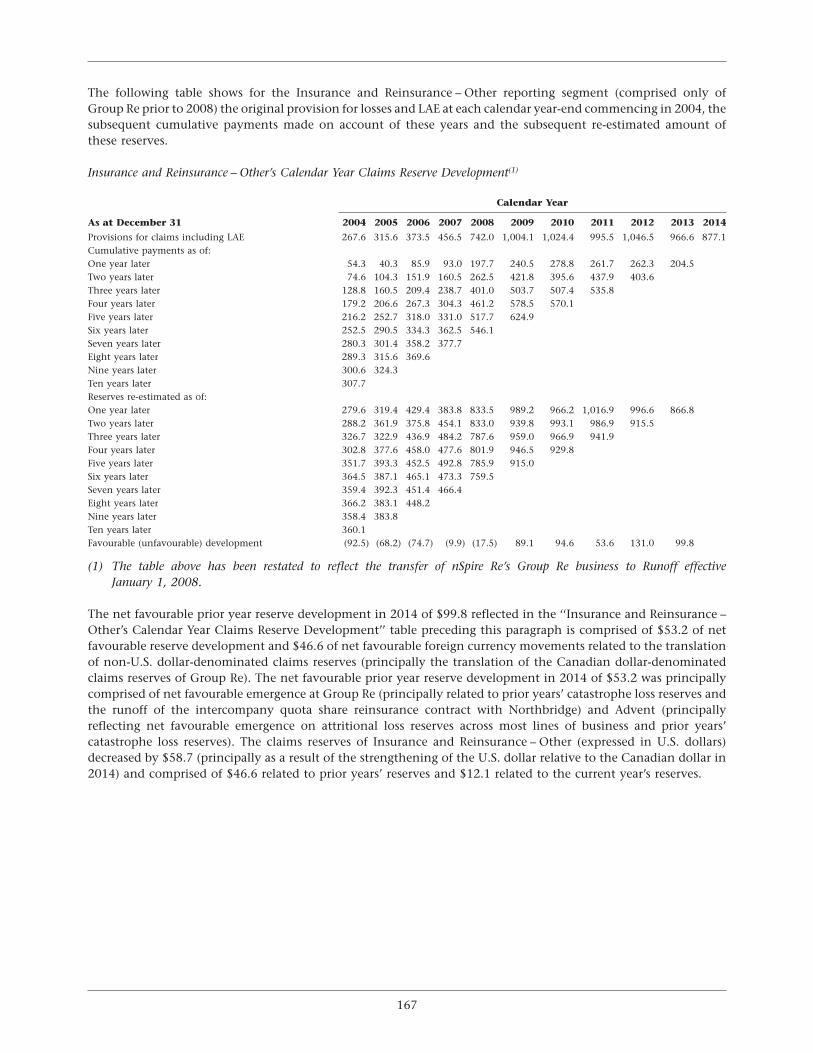
The following table shows for the Insurance and Reinsurance – Other reporting segment (comprised only ofGroup Re prior to 2008) the original provision for losses and LAE at each calendar year-end commencing in 2004, thesubsequent cumulative payments made on account of these years and the subsequent re-estimated amount ofthese reserves.
Insurance and Reinsurance – Other’s Calendar Year Claims Reserve Development(1)
Calendar Year
As at December 31 2004 2005 2006 2007 2008 2009 2010 2011 2012 2013 2014
Provisions for claims including LAE 267.6 315.6 373.5 456.5 742.0 1,004.1 1,024.4 995.5 1,046.5 966.6 877.1Cumulative payments as of:One year later 54.3 40.3 85.9 93.0 197.7 240.5 278.8 261.7 262.3 204.5Two years later 74.6 104.3 151.9 160.5 262.5 421.8 395.6 437.9 403.6Three years later 128.8 160.5 209.4 238.7 401.0 503.7 507.4 535.8Four years later 179.2 206.6 267.3 304.3 461.2 578.5 570.1Five years later 216.2 252.7 318.0 331.0 517.7 624.9Six years later 252.5 290.5 334.3 362.5 546.1Seven years later 280.3 301.4 358.2 377.7Eight years later 289.3 315.6 369.6Nine years later 300.6 324.3Ten years later 307.7Reserves re-estimated as of:One year later 279.6 319.4 429.4 383.8 833.5 989.2 966.2 1,016.9 996.6 866.8Two years later 288.2 361.9 375.8 454.1 833.0 939.8 993.1 986.9 915.5Three years later 326.7 322.9 436.9 484.2 787.6 959.0 966.9 941.9Four years later 302.8 377.6 458.0 477.6 801.9 946.5 929.8Five years later 351.7 393.3 452.5 492.8 785.9 915.0Six years later 364.5 387.1 465.1 473.3 759.5Seven years later 359.4 392.3 451.4 466.4Eight years later 366.2 383.1 448.2Nine years later 358.4 383.8Ten years later 360.1Favourable (unfavourable) development (92.5) (68.2) (74.7) (9.9) (17.5) 89.1 94.6 53.6 131.0 99.8
(1) The table above has been restated to reflect the transfer of nSpire Re’s Group Re business to Runoff effectiveJanuary 1, 2008.
The net favourable prior year reserve development in 2014 of $99.8 reflected in the ‘‘Insurance and Reinsurance –Other’s Calendar Year Claims Reserve Development’’ table preceding this paragraph is comprised of $53.2 of netfavourable reserve development and $46.6 of net favourable foreign currency movements related to the translationof non-U.S. dollar-denominated claims reserves (principally the translation of the Canadian dollar-denominatedclaims reserves of Group Re). The net favourable prior year reserve development in 2014 of $53.2 was principallycomprised of net favourable emergence at Group Re (principally related to prior years’ catastrophe loss reserves andthe runoff of the intercompany quota share reinsurance contract with Northbridge) and Advent (principallyreflecting net favourable emergence on attritional loss reserves across most lines of business and prior years’catastrophe loss reserves). The claims reserves of Insurance and Reinsurance – Other (expressed in U.S. dollars)decreased by $58.7 (principally as a result of the strengthening of the U.S. dollar relative to the Canadian dollar in2014) and comprised of $46.6 related to prior years’ reserves and $12.1 related to the current year’s reserves.
167
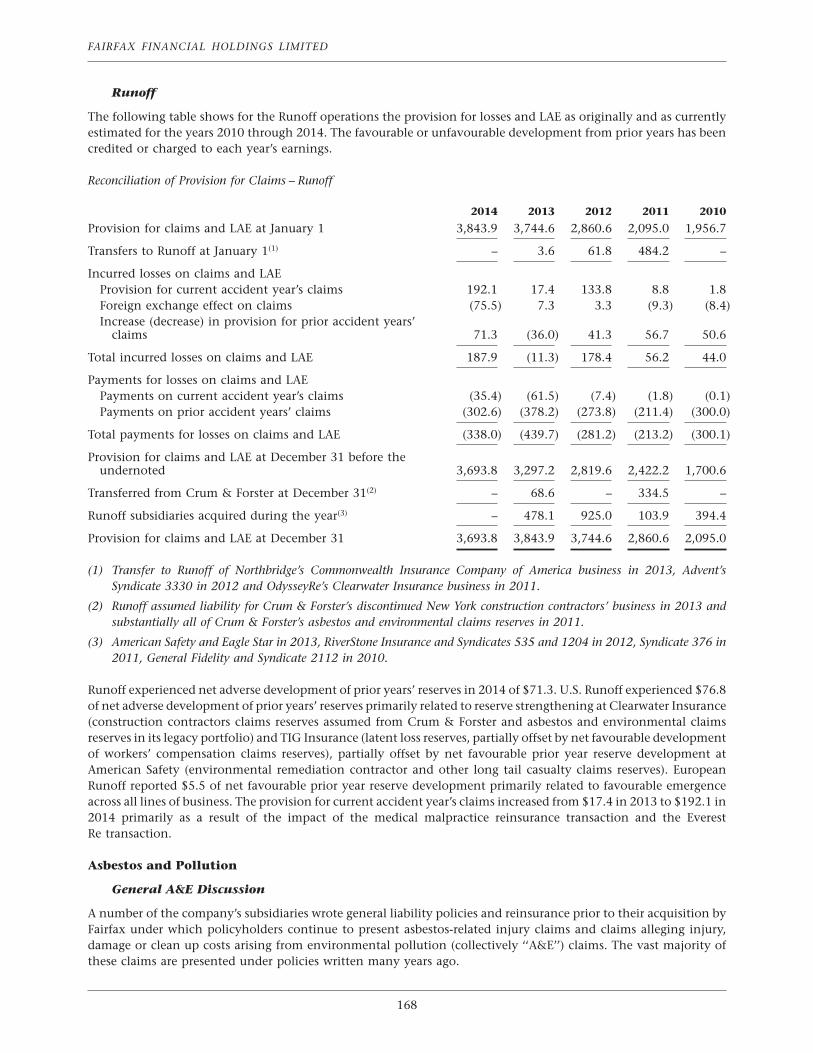
FAIRFAX FINANCIAL HOLDINGS LIMITED
Runoff
The following table shows for the Runoff operations the provision for losses and LAE as originally and as currentlyestimated for the years 2010 through 2014. The favourable or unfavourable development from prior years has beencredited or charged to each year’s earnings.
Reconciliation of Provision for Claims – Runoff
2014 2013 2012 2011 2010
Provision for claims and LAE at January 1 3,843.9 3,744.6 2,860.6 2,095.0 1,956.7
Transfers to Runoff at January 1(1) – 3.6 61.8 484.2 –
Incurred losses on claims and LAEProvision for current accident year’s claims 192.1 17.4 133.8 8.8 1.8Foreign exchange effect on claims (75.5) 7.3 3.3 (9.3) (8.4)Increase (decrease) in provision for prior accident years’
claims 71.3 (36.0) 41.3 56.7 50.6
Total incurred losses on claims and LAE 187.9 (11.3) 178.4 56.2 44.0
Payments for losses on claims and LAEPayments on current accident year’s claims (35.4) (61.5) (7.4) (1.8) (0.1)Payments on prior accident years’ claims (302.6) (378.2) (273.8) (211.4) (300.0)
Total payments for losses on claims and LAE (338.0) (439.7) (281.2) (213.2) (300.1)
Provision for claims and LAE at December 31 before theundernoted 3,693.8 3,297.2 2,819.6 2,422.2 1,700.6
Transferred from Crum & Forster at December 31(2) – 68.6 – 334.5 –
Runoff subsidiaries acquired during the year(3) – 478.1 925.0 103.9 394.4
Provision for claims and LAE at December 31 3,693.8 3,843.9 3,744.6 2,860.6 2,095.0
(1) Transfer to Runoff of Northbridge’s Commonwealth Insurance Company of America business in 2013, Advent’sSyndicate 3330 in 2012 and OdysseyRe’s Clearwater Insurance business in 2011.
(2) Runoff assumed liability for Crum & Forster’s discontinued New York construction contractors’ business in 2013 andsubstantially all of Crum & Forster’s asbestos and environmental claims reserves in 2011.
(3) American Safety and Eagle Star in 2013, RiverStone Insurance and Syndicates 535 and 1204 in 2012, Syndicate 376 in2011, General Fidelity and Syndicate 2112 in 2010.
Runoff experienced net adverse development of prior years’ reserves in 2014 of $71.3. U.S. Runoff experienced $76.8of net adverse development of prior years’ reserves primarily related to reserve strengthening at Clearwater Insurance(construction contractors claims reserves assumed from Crum & Forster and asbestos and environmental claimsreserves in its legacy portfolio) and TIG Insurance (latent loss reserves, partially offset by net favourable developmentof workers’ compensation claims reserves), partially offset by net favourable prior year reserve development atAmerican Safety (environmental remediation contractor and other long tail casualty claims reserves). EuropeanRunoff reported $5.5 of net favourable prior year reserve development primarily related to favourable emergenceacross all lines of business. The provision for current accident year’s claims increased from $17.4 in 2013 to $192.1 in2014 primarily as a result of the impact of the medical malpractice reinsurance transaction and the EverestRe transaction.
Asbestos and Pollution
General A&E Discussion
A number of the company’s subsidiaries wrote general liability policies and reinsurance prior to their acquisition byFairfax under which policyholders continue to present asbestos-related injury claims and claims alleging injury,damage or clean up costs arising from environmental pollution (collectively ‘‘A&E’’) claims. The vast majority ofthese claims are presented under policies written many years ago.
168
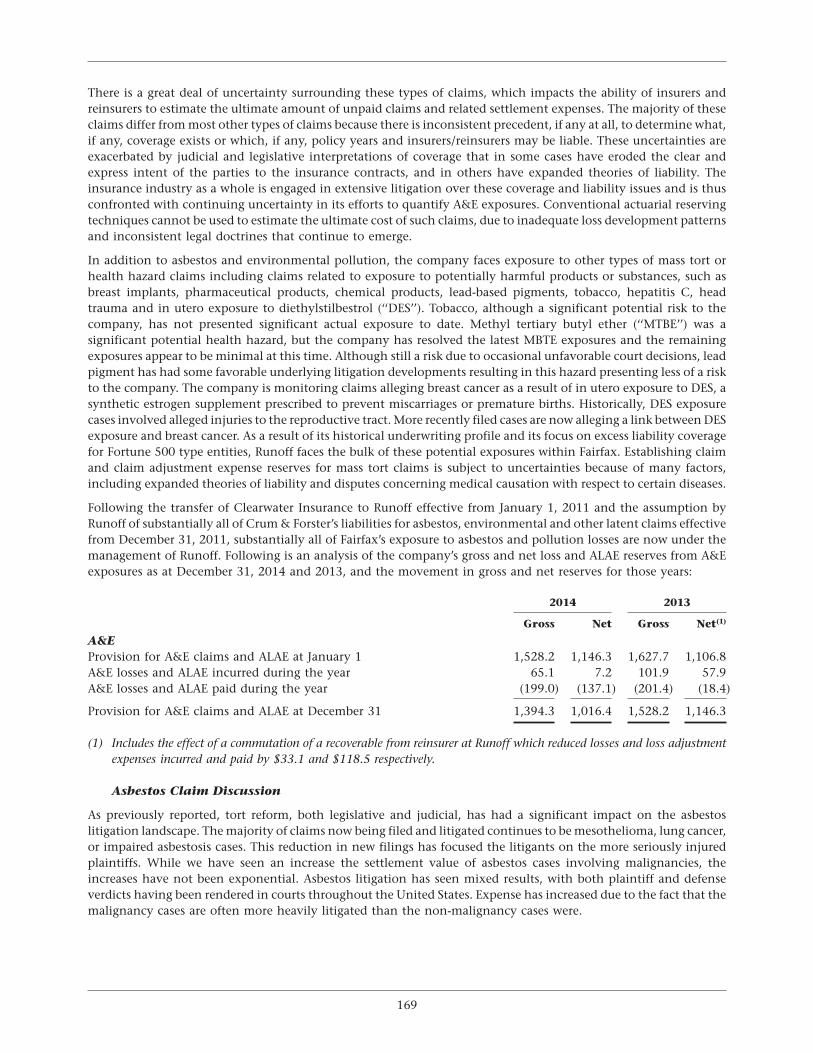
There is a great deal of uncertainty surrounding these types of claims, which impacts the ability of insurers andreinsurers to estimate the ultimate amount of unpaid claims and related settlement expenses. The majority of theseclaims differ from most other types of claims because there is inconsistent precedent, if any at all, to determine what,if any, coverage exists or which, if any, policy years and insurers/reinsurers may be liable. These uncertainties areexacerbated by judicial and legislative interpretations of coverage that in some cases have eroded the clear andexpress intent of the parties to the insurance contracts, and in others have expanded theories of liability. Theinsurance industry as a whole is engaged in extensive litigation over these coverage and liability issues and is thusconfronted with continuing uncertainty in its efforts to quantify A&E exposures. Conventional actuarial reservingtechniques cannot be used to estimate the ultimate cost of such claims, due to inadequate loss development patternsand inconsistent legal doctrines that continue to emerge.
In addition to asbestos and environmental pollution, the company faces exposure to other types of mass tort orhealth hazard claims including claims related to exposure to potentially harmful products or substances, such asbreast implants, pharmaceutical products, chemical products, lead-based pigments, tobacco, hepatitis C, headtrauma and in utero exposure to diethylstilbestrol (‘‘DES’’). Tobacco, although a significant potential risk to thecompany, has not presented significant actual exposure to date. Methyl tertiary butyl ether (‘‘MTBE’’) was asignificant potential health hazard, but the company has resolved the latest MBTE exposures and the remainingexposures appear to be minimal at this time. Although still a risk due to occasional unfavorable court decisions, leadpigment has had some favorable underlying litigation developments resulting in this hazard presenting less of a riskto the company. The company is monitoring claims alleging breast cancer as a result of in utero exposure to DES, asynthetic estrogen supplement prescribed to prevent miscarriages or premature births. Historically, DES exposurecases involved alleged injuries to the reproductive tract. More recently filed cases are now alleging a link between DESexposure and breast cancer. As a result of its historical underwriting profile and its focus on excess liability coveragefor Fortune 500 type entities, Runoff faces the bulk of these potential exposures within Fairfax. Establishing claimand claim adjustment expense reserves for mass tort claims is subject to uncertainties because of many factors,including expanded theories of liability and disputes concerning medical causation with respect to certain diseases.
Following the transfer of Clearwater Insurance to Runoff effective from January 1, 2011 and the assumption byRunoff of substantially all of Crum & Forster’s liabilities for asbestos, environmental and other latent claims effectivefrom December 31, 2011, substantially all of Fairfax’s exposure to asbestos and pollution losses are now under themanagement of Runoff. Following is an analysis of the company’s gross and net loss and ALAE reserves from A&Eexposures as at December 31, 2014 and 2013, and the movement in gross and net reserves for those years:
2014 2013
Gross Net Gross Net(1)
A&EProvision for A&E claims and ALAE at January 1 1,528.2 1,146.3 1,627.7 1,106.8A&E losses and ALAE incurred during the year 65.1 7.2 101.9 57.9A&E losses and ALAE paid during the year (199.0) (137.1) (201.4) (18.4)
Provision for A&E claims and ALAE at December 31 1,394.3 1,016.4 1,528.2 1,146.3
(1) Includes the effect of a commutation of a recoverable from reinsurer at Runoff which reduced losses and loss adjustmentexpenses incurred and paid by $33.1 and $118.5 respectively.
Asbestos Claim Discussion
As previously reported, tort reform, both legislative and judicial, has had a significant impact on the asbestoslitigation landscape. The majority of claims now being filed and litigated continues to be mesothelioma, lung cancer,or impaired asbestosis cases. This reduction in new filings has focused the litigants on the more seriously injuredplaintiffs. While we have seen an increase the settlement value of asbestos cases involving malignancies, theincreases have not been exponential. Asbestos litigation has seen mixed results, with both plaintiff and defenseverdicts having been rendered in courts throughout the United States. Expense has increased due to the fact that themalignancy cases are often more heavily litigated than the non-malignancy cases were.
169
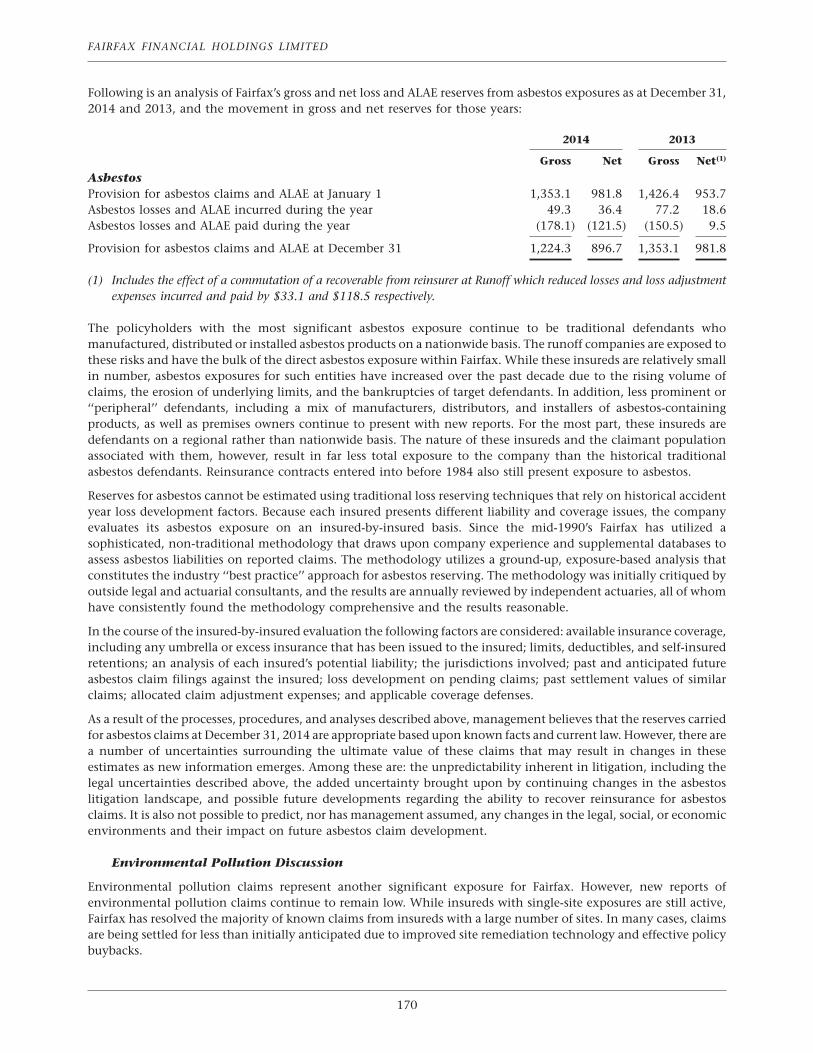
FAIRFAX FINANCIAL HOLDINGS LIMITED
Following is an analysis of Fairfax’s gross and net loss and ALAE reserves from asbestos exposures as at December 31,2014 and 2013, and the movement in gross and net reserves for those years:
2014 2013
Gross Net Gross Net(1)
AsbestosProvision for asbestos claims and ALAE at January 1 1,353.1 981.8 1,426.4 953.7Asbestos losses and ALAE incurred during the year 49.3 36.4 77.2 18.6Asbestos losses and ALAE paid during the year (178.1) (121.5) (150.5) 9.5
Provision for asbestos claims and ALAE at December 31 1,224.3 896.7 1,353.1 981.8
(1) Includes the effect of a commutation of a recoverable from reinsurer at Runoff which reduced losses and loss adjustmentexpenses incurred and paid by $33.1 and $118.5 respectively.
The policyholders with the most significant asbestos exposure continue to be traditional defendants whomanufactured, distributed or installed asbestos products on a nationwide basis. The runoff companies are exposed tothese risks and have the bulk of the direct asbestos exposure within Fairfax. While these insureds are relatively smallin number, asbestos exposures for such entities have increased over the past decade due to the rising volume ofclaims, the erosion of underlying limits, and the bankruptcies of target defendants. In addition, less prominent or‘‘peripheral’’ defendants, including a mix of manufacturers, distributors, and installers of asbestos-containingproducts, as well as premises owners continue to present with new reports. For the most part, these insureds aredefendants on a regional rather than nationwide basis. The nature of these insureds and the claimant populationassociated with them, however, result in far less total exposure to the company than the historical traditionalasbestos defendants. Reinsurance contracts entered into before 1984 also still present exposure to asbestos.
Reserves for asbestos cannot be estimated using traditional loss reserving techniques that rely on historical accidentyear loss development factors. Because each insured presents different liability and coverage issues, the companyevaluates its asbestos exposure on an insured-by-insured basis. Since the mid-1990’s Fairfax has utilized asophisticated, non-traditional methodology that draws upon company experience and supplemental databases toassess asbestos liabilities on reported claims. The methodology utilizes a ground-up, exposure-based analysis thatconstitutes the industry ‘‘best practice’’ approach for asbestos reserving. The methodology was initially critiqued byoutside legal and actuarial consultants, and the results are annually reviewed by independent actuaries, all of whomhave consistently found the methodology comprehensive and the results reasonable.
In the course of the insured-by-insured evaluation the following factors are considered: available insurance coverage,including any umbrella or excess insurance that has been issued to the insured; limits, deductibles, and self-insuredretentions; an analysis of each insured’s potential liability; the jurisdictions involved; past and anticipated futureasbestos claim filings against the insured; loss development on pending claims; past settlement values of similarclaims; allocated claim adjustment expenses; and applicable coverage defenses.
As a result of the processes, procedures, and analyses described above, management believes that the reserves carriedfor asbestos claims at December 31, 2014 are appropriate based upon known facts and current law. However, there area number of uncertainties surrounding the ultimate value of these claims that may result in changes in theseestimates as new information emerges. Among these are: the unpredictability inherent in litigation, including thelegal uncertainties described above, the added uncertainty brought upon by continuing changes in the asbestoslitigation landscape, and possible future developments regarding the ability to recover reinsurance for asbestosclaims. It is also not possible to predict, nor has management assumed, any changes in the legal, social, or economicenvironments and their impact on future asbestos claim development.
Environmental Pollution Discussion
Environmental pollution claims represent another significant exposure for Fairfax. However, new reports ofenvironmental pollution claims continue to remain low. While insureds with single-site exposures are still active,Fairfax has resolved the majority of known claims from insureds with a large number of sites. In many cases, claimsare being settled for less than initially anticipated due to improved site remediation technology and effective policybuybacks.
170
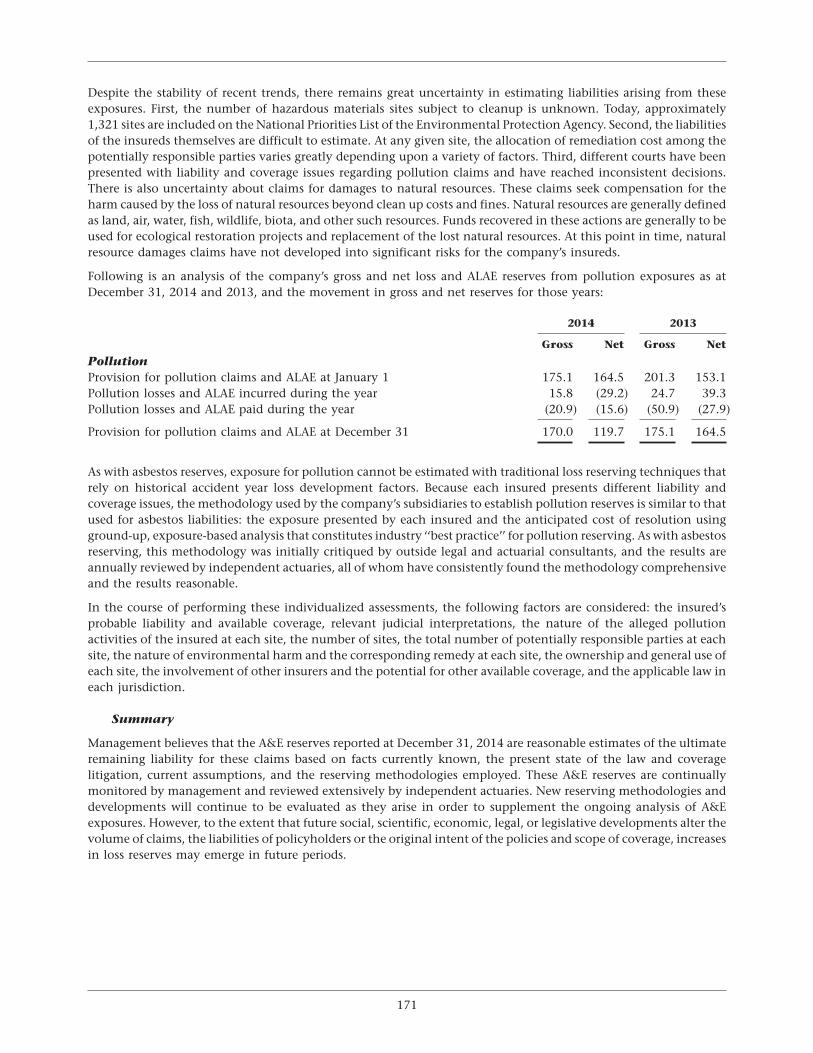
Despite the stability of recent trends, there remains great uncertainty in estimating liabilities arising from theseexposures. First, the number of hazardous materials sites subject to cleanup is unknown. Today, approximately1,321 sites are included on the National Priorities List of the Environmental Protection Agency. Second, the liabilitiesof the insureds themselves are difficult to estimate. At any given site, the allocation of remediation cost among thepotentially responsible parties varies greatly depending upon a variety of factors. Third, different courts have beenpresented with liability and coverage issues regarding pollution claims and have reached inconsistent decisions.There is also uncertainty about claims for damages to natural resources. These claims seek compensation for theharm caused by the loss of natural resources beyond clean up costs and fines. Natural resources are generally definedas land, air, water, fish, wildlife, biota, and other such resources. Funds recovered in these actions are generally to beused for ecological restoration projects and replacement of the lost natural resources. At this point in time, naturalresource damages claims have not developed into significant risks for the company’s insureds.
Following is an analysis of the company’s gross and net loss and ALAE reserves from pollution exposures as atDecember 31, 2014 and 2013, and the movement in gross and net reserves for those years:
2014 2013
Gross Net Gross Net
PollutionProvision for pollution claims and ALAE at January 1 175.1 164.5 201.3 153.1Pollution losses and ALAE incurred during the year 15.8 (29.2) 24.7 39.3Pollution losses and ALAE paid during the year (20.9) (15.6) (50.9) (27.9)
Provision for pollution claims and ALAE at December 31 170.0 119.7 175.1 164.5
As with asbestos reserves, exposure for pollution cannot be estimated with traditional loss reserving techniques thatrely on historical accident year loss development factors. Because each insured presents different liability andcoverage issues, the methodology used by the company’s subsidiaries to establish pollution reserves is similar to thatused for asbestos liabilities: the exposure presented by each insured and the anticipated cost of resolution usingground-up, exposure-based analysis that constitutes industry ‘‘best practice’’ for pollution reserving. As with asbestosreserving, this methodology was initially critiqued by outside legal and actuarial consultants, and the results areannually reviewed by independent actuaries, all of whom have consistently found the methodology comprehensiveand the results reasonable.
In the course of performing these individualized assessments, the following factors are considered: the insured’sprobable liability and available coverage, relevant judicial interpretations, the nature of the alleged pollutionactivities of the insured at each site, the number of sites, the total number of potentially responsible parties at eachsite, the nature of environmental harm and the corresponding remedy at each site, the ownership and general use ofeach site, the involvement of other insurers and the potential for other available coverage, and the applicable law ineach jurisdiction.
Summary
Management believes that the A&E reserves reported at December 31, 2014 are reasonable estimates of the ultimateremaining liability for these claims based on facts currently known, the present state of the law and coveragelitigation, current assumptions, and the reserving methodologies employed. These A&E reserves are continuallymonitored by management and reviewed extensively by independent actuaries. New reserving methodologies anddevelopments will continue to be evaluated as they arise in order to supplement the ongoing analysis of A&Eexposures. However, to the extent that future social, scientific, economic, legal, or legislative developments alter thevolume of claims, the liabilities of policyholders or the original intent of the policies and scope of coverage, increasesin loss reserves may emerge in future periods.
171
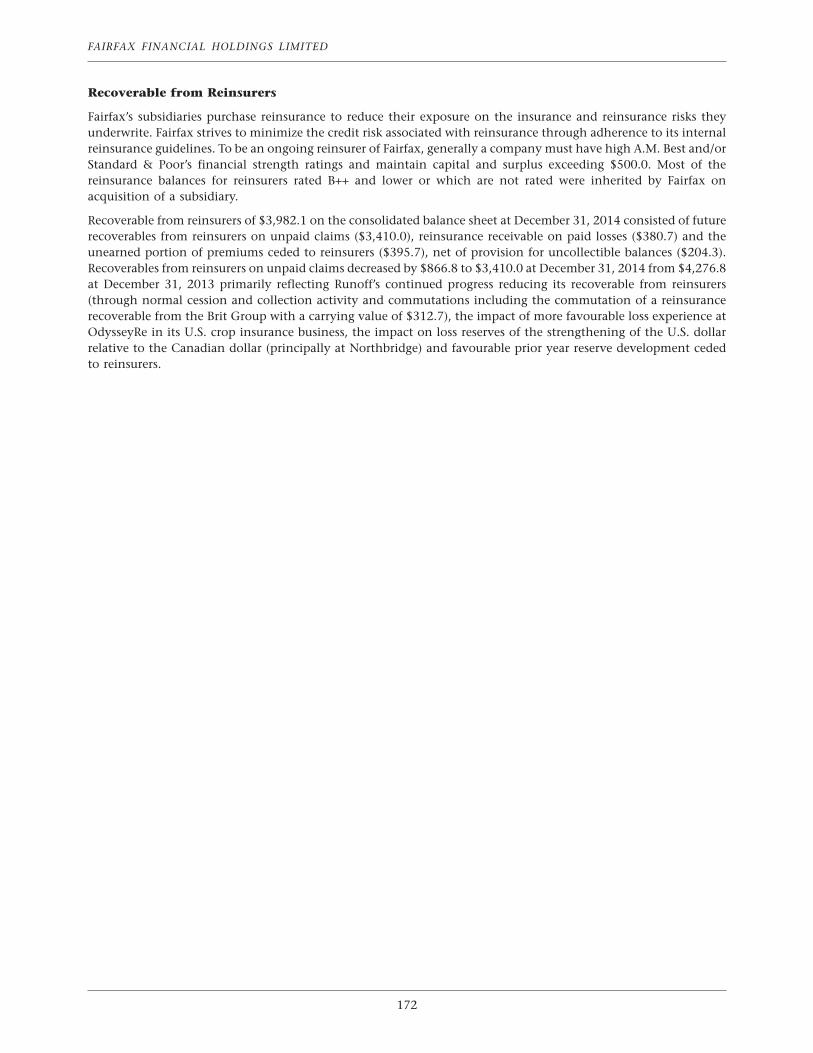
FAIRFAX FINANCIAL HOLDINGS LIMITED
Recoverable from Reinsurers
Fairfax’s subsidiaries purchase reinsurance to reduce their exposure on the insurance and reinsurance risks theyunderwrite. Fairfax strives to minimize the credit risk associated with reinsurance through adherence to its internalreinsurance guidelines. To be an ongoing reinsurer of Fairfax, generally a company must have high A.M. Best and/orStandard & Poor’s financial strength ratings and maintain capital and surplus exceeding $500.0. Most of thereinsurance balances for reinsurers rated B++ and lower or which are not rated were inherited by Fairfax onacquisition of a subsidiary.
Recoverable from reinsurers of $3,982.1 on the consolidated balance sheet at December 31, 2014 consisted of futurerecoverables from reinsurers on unpaid claims ($3,410.0), reinsurance receivable on paid losses ($380.7) and theunearned portion of premiums ceded to reinsurers ($395.7), net of provision for uncollectible balances ($204.3).Recoverables from reinsurers on unpaid claims decreased by $866.8 to $3,410.0 at December 31, 2014 from $4,276.8at December 31, 2013 primarily reflecting Runoff’s continued progress reducing its recoverable from reinsurers(through normal cession and collection activity and commutations including the commutation of a reinsurancerecoverable from the Brit Group with a carrying value of $312.7), the impact of more favourable loss experience atOdysseyRe in its U.S. crop insurance business, the impact on loss reserves of the strengthening of the U.S. dollarrelative to the Canadian dollar (principally at Northbridge) and favourable prior year reserve development cededto reinsurers.
172
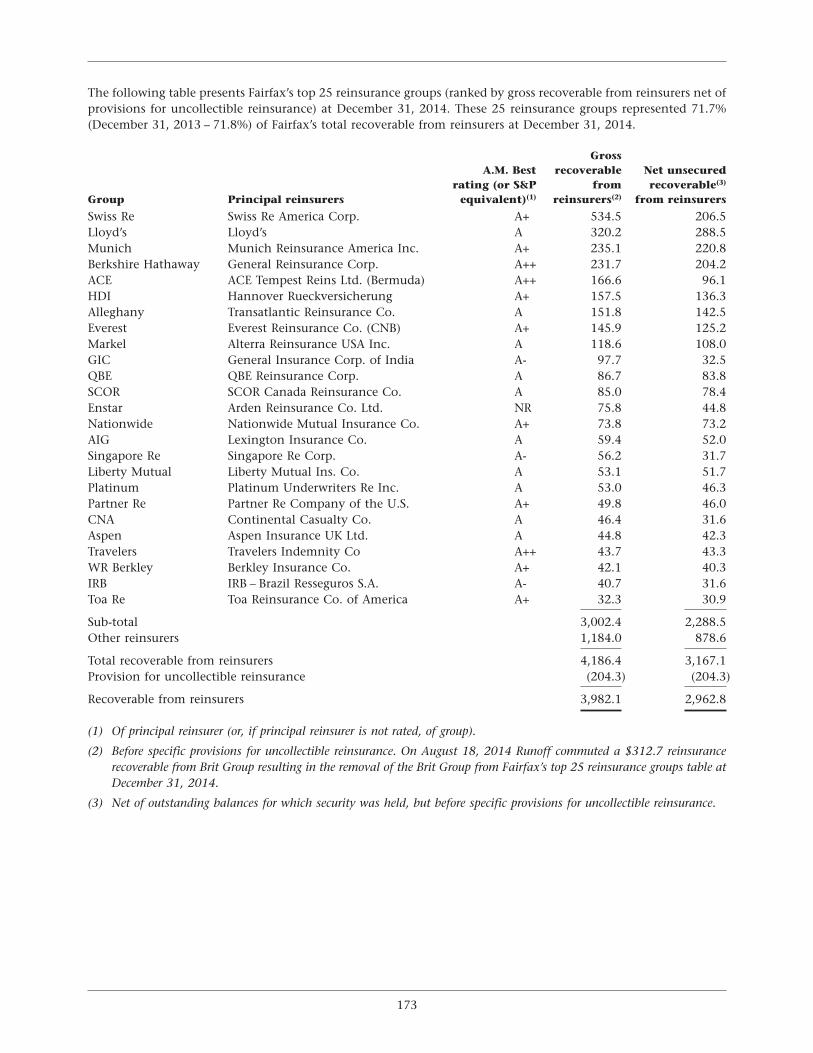
The following table presents Fairfax’s top 25 reinsurance groups (ranked by gross recoverable from reinsurers net ofprovisions for uncollectible reinsurance) at December 31, 2014. These 25 reinsurance groups represented 71.7%(December 31, 2013 – 71.8%) of Fairfax’s total recoverable from reinsurers at December 31, 2014.
GrossA.M. Best recoverable Net unsecured
rating (or S&P from recoverable(3)
Group Principal reinsurers equivalent)(1) reinsurers(2) from reinsurers
Swiss Re Swiss Re America Corp. A+ 534.5 206.5Lloyd’s Lloyd’s A 320.2 288.5Munich Munich Reinsurance America Inc. A+ 235.1 220.8Berkshire Hathaway General Reinsurance Corp. A++ 231.7 204.2ACE ACE Tempest Reins Ltd. (Bermuda) A++ 166.6 96.1HDI Hannover Rueckversicherung A+ 157.5 136.3Alleghany Transatlantic Reinsurance Co. A 151.8 142.5Everest Everest Reinsurance Co. (CNB) A+ 145.9 125.2Markel Alterra Reinsurance USA Inc. A 118.6 108.0GIC General Insurance Corp. of India A- 97.7 32.5QBE QBE Reinsurance Corp. A 86.7 83.8SCOR SCOR Canada Reinsurance Co. A 85.0 78.4Enstar Arden Reinsurance Co. Ltd. NR 75.8 44.8Nationwide Nationwide Mutual Insurance Co. A+ 73.8 73.2AIG Lexington Insurance Co. A 59.4 52.0Singapore Re Singapore Re Corp. A- 56.2 31.7Liberty Mutual Liberty Mutual Ins. Co. A 53.1 51.7Platinum Platinum Underwriters Re Inc. A 53.0 46.3Partner Re Partner Re Company of the U.S. A+ 49.8 46.0CNA Continental Casualty Co. A 46.4 31.6Aspen Aspen Insurance UK Ltd. A 44.8 42.3Travelers Travelers Indemnity Co A++ 43.7 43.3WR Berkley Berkley Insurance Co. A+ 42.1 40.3IRB IRB – Brazil Resseguros S.A. A- 40.7 31.6Toa Re Toa Reinsurance Co. of America A+ 32.3 30.9
Sub-total 3,002.4 2,288.5Other reinsurers 1,184.0 878.6
Total recoverable from reinsurers 4,186.4 3,167.1Provision for uncollectible reinsurance (204.3) (204.3)
Recoverable from reinsurers 3,982.1 2,962.8
(1) Of principal reinsurer (or, if principal reinsurer is not rated, of group).
(2) Before specific provisions for uncollectible reinsurance. On August 18, 2014 Runoff commuted a $312.7 reinsurancerecoverable from Brit Group resulting in the removal of the Brit Group from Fairfax’s top 25 reinsurance groups table atDecember 31, 2014.
(3) Net of outstanding balances for which security was held, but before specific provisions for uncollectible reinsurance.
173
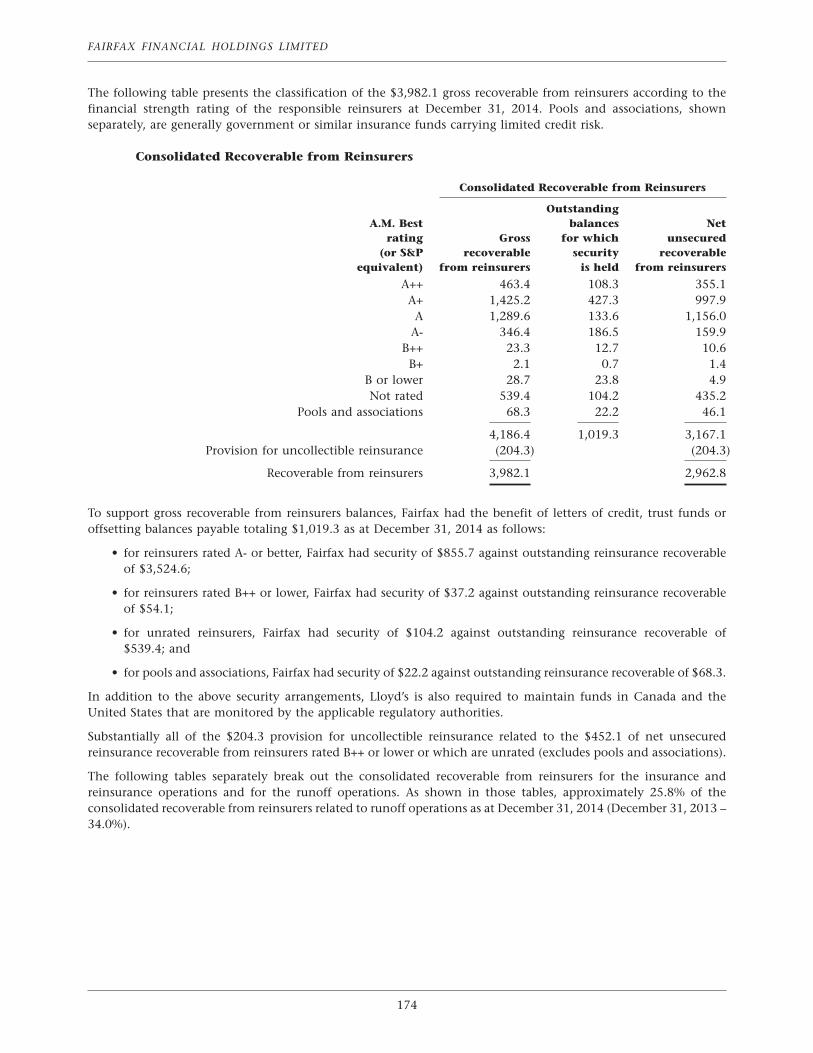
FAIRFAX FINANCIAL HOLDINGS LIMITED
The following table presents the classification of the $3,982.1 gross recoverable from reinsurers according to thefinancial strength rating of the responsible reinsurers at December 31, 2014. Pools and associations, shownseparately, are generally government or similar insurance funds carrying limited credit risk.
Consolidated Recoverable from Reinsurers
Consolidated Recoverable from Reinsurers
OutstandingA.M. Best balances Net
rating Gross for which unsecured(or S&P recoverable security recoverable
equivalent) from reinsurers is held from reinsurers
A++ 463.4 108.3 355.1A+ 1,425.2 427.3 997.9
A 1,289.6 133.6 1,156.0A- 346.4 186.5 159.9
B++ 23.3 12.7 10.6B+ 2.1 0.7 1.4
B or lower 28.7 23.8 4.9Not rated 539.4 104.2 435.2
Pools and associations 68.3 22.2 46.1
4,186.4 1,019.3 3,167.1Provision for uncollectible reinsurance (204.3) (204.3)
Recoverable from reinsurers 3,982.1 2,962.8
To support gross recoverable from reinsurers balances, Fairfax had the benefit of letters of credit, trust funds oroffsetting balances payable totaling $1,019.3 as at December 31, 2014 as follows:
• for reinsurers rated A- or better, Fairfax had security of $855.7 against outstanding reinsurance recoverableof $3,524.6;
• for reinsurers rated B++ or lower, Fairfax had security of $37.2 against outstanding reinsurance recoverableof $54.1;
• for unrated reinsurers, Fairfax had security of $104.2 against outstanding reinsurance recoverable of$539.4; and
• for pools and associations, Fairfax had security of $22.2 against outstanding reinsurance recoverable of $68.3.
In addition to the above security arrangements, Lloyd’s is also required to maintain funds in Canada and theUnited States that are monitored by the applicable regulatory authorities.
Substantially all of the $204.3 provision for uncollectible reinsurance related to the $452.1 of net unsecuredreinsurance recoverable from reinsurers rated B++ or lower or which are unrated (excludes pools and associations).
The following tables separately break out the consolidated recoverable from reinsurers for the insurance andreinsurance operations and for the runoff operations. As shown in those tables, approximately 25.8% of theconsolidated recoverable from reinsurers related to runoff operations as at December 31, 2014 (December 31, 2013 –34.0%).
174
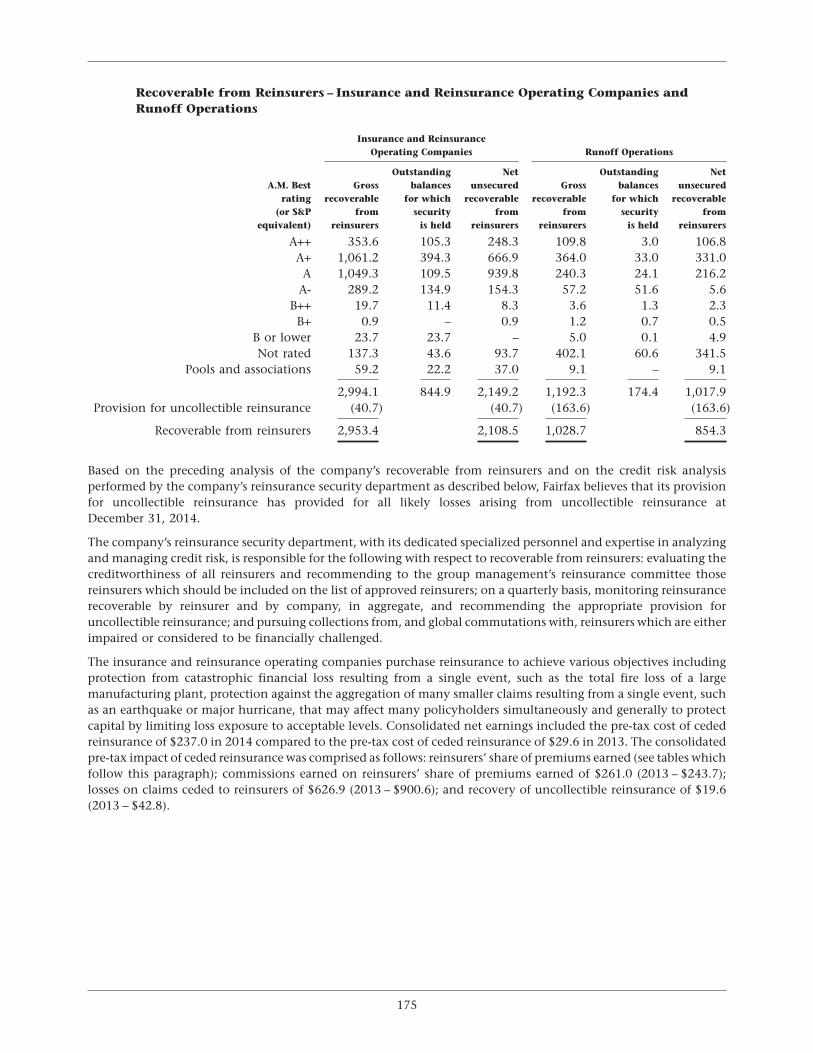
Recoverable from Reinsurers – Insurance and Reinsurance Operating Companies andRunoff Operations
Insurance and ReinsuranceOperating Companies Runoff Operations
Outstanding Net Outstanding NetA.M. Best Gross balances unsecured Gross balances unsecured
rating recoverable for which recoverable recoverable for which recoverable(or S&P from security from from security from
equivalent) reinsurers is held reinsurers reinsurers is held reinsurers
A++ 353.6 105.3 248.3 109.8 3.0 106.8A+ 1,061.2 394.3 666.9 364.0 33.0 331.0
A 1,049.3 109.5 939.8 240.3 24.1 216.2A- 289.2 134.9 154.3 57.2 51.6 5.6
B++ 19.7 11.4 8.3 3.6 1.3 2.3B+ 0.9 – 0.9 1.2 0.7 0.5
B or lower 23.7 23.7 – 5.0 0.1 4.9Not rated 137.3 43.6 93.7 402.1 60.6 341.5
Pools and associations 59.2 22.2 37.0 9.1 – 9.1
2,994.1 844.9 2,149.2 1,192.3 174.4 1,017.9Provision for uncollectible reinsurance (40.7) (40.7) (163.6) (163.6)
Recoverable from reinsurers 2,953.4 2,108.5 1,028.7 854.3
Based on the preceding analysis of the company’s recoverable from reinsurers and on the credit risk analysisperformed by the company’s reinsurance security department as described below, Fairfax believes that its provisionfor uncollectible reinsurance has provided for all likely losses arising from uncollectible reinsurance atDecember 31, 2014.
The company’s reinsurance security department, with its dedicated specialized personnel and expertise in analyzingand managing credit risk, is responsible for the following with respect to recoverable from reinsurers: evaluating thecreditworthiness of all reinsurers and recommending to the group management’s reinsurance committee thosereinsurers which should be included on the list of approved reinsurers; on a quarterly basis, monitoring reinsurancerecoverable by reinsurer and by company, in aggregate, and recommending the appropriate provision foruncollectible reinsurance; and pursuing collections from, and global commutations with, reinsurers which are eitherimpaired or considered to be financially challenged.
The insurance and reinsurance operating companies purchase reinsurance to achieve various objectives includingprotection from catastrophic financial loss resulting from a single event, such as the total fire loss of a largemanufacturing plant, protection against the aggregation of many smaller claims resulting from a single event, suchas an earthquake or major hurricane, that may affect many policyholders simultaneously and generally to protectcapital by limiting loss exposure to acceptable levels. Consolidated net earnings included the pre-tax cost of cededreinsurance of $237.0 in 2014 compared to the pre-tax cost of ceded reinsurance of $29.6 in 2013. The consolidatedpre-tax impact of ceded reinsurance was comprised as follows: reinsurers’ share of premiums earned (see tables whichfollow this paragraph); commissions earned on reinsurers’ share of premiums earned of $261.0 (2013 – $243.7);losses on claims ceded to reinsurers of $626.9 (2013 – $900.6); and recovery of uncollectible reinsurance of $19.6(2013 – $42.8).
175
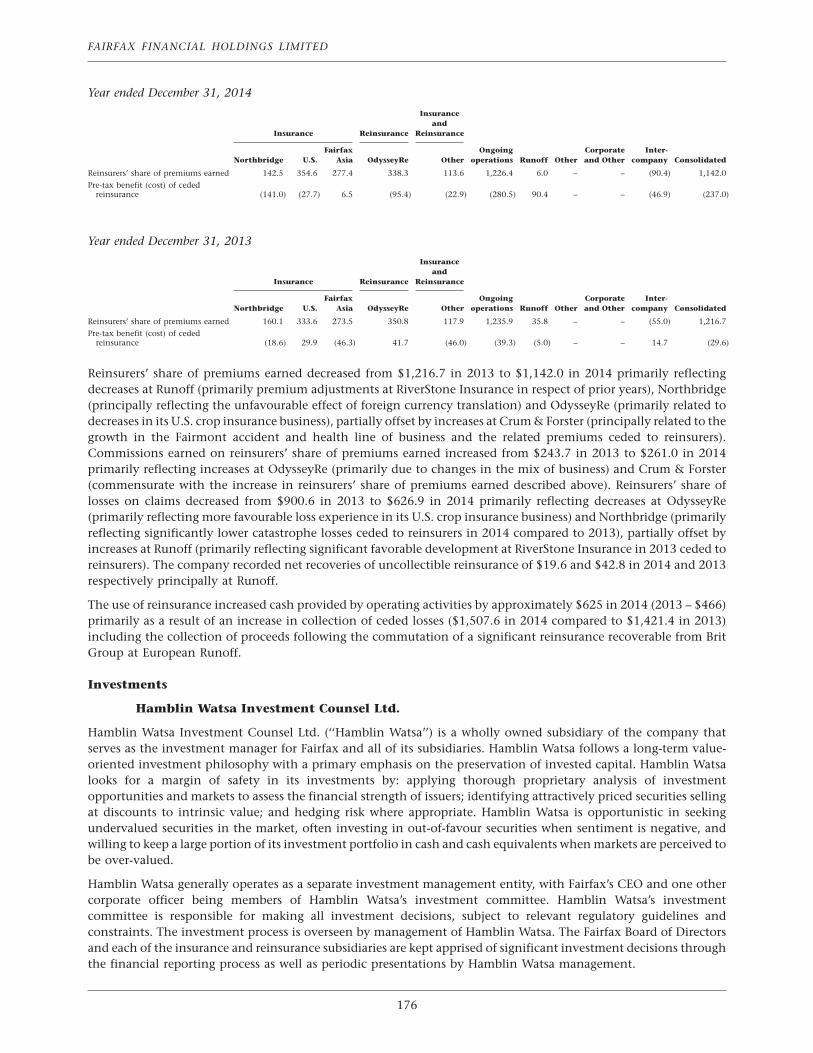
FAIRFAX FINANCIAL HOLDINGS LIMITED
Year ended December 31, 2014
Insuranceand
Insurance Reinsurance Reinsurance
Fairfax Ongoing Corporate Inter-Northbridge U.S. Asia OdysseyRe Other operations Runoff Other and Other company Consolidated
Reinsurers’ share of premiums earned 142.5 354.6 277.4 338.3 113.6 1,226.4 6.0 – – (90.4) 1,142.0
Pre-tax benefit (cost) of cededreinsurance (141.0) (27.7) 6.5 (95.4) (22.9) (280.5) 90.4 – – (46.9) (237.0)
Year ended December 31, 2013
Insuranceand
Insurance Reinsurance Reinsurance
Fairfax Ongoing Corporate Inter-Northbridge U.S. Asia OdysseyRe Other operations Runoff Other and Other company Consolidated
Reinsurers’ share of premiums earned 160.1 333.6 273.5 350.8 117.9 1,235.9 35.8 – – (55.0) 1,216.7
Pre-tax benefit (cost) of cededreinsurance (18.6) 29.9 (46.3) 41.7 (46.0) (39.3) (5.0) – – 14.7 (29.6)
Reinsurers’ share of premiums earned decreased from $1,216.7 in 2013 to $1,142.0 in 2014 primarily reflectingdecreases at Runoff (primarily premium adjustments at RiverStone Insurance in respect of prior years), Northbridge(principally reflecting the unfavourable effect of foreign currency translation) and OdysseyRe (primarily related todecreases in its U.S. crop insurance business), partially offset by increases at Crum & Forster (principally related to thegrowth in the Fairmont accident and health line of business and the related premiums ceded to reinsurers).Commissions earned on reinsurers’ share of premiums earned increased from $243.7 in 2013 to $261.0 in 2014primarily reflecting increases at OdysseyRe (primarily due to changes in the mix of business) and Crum & Forster(commensurate with the increase in reinsurers’ share of premiums earned described above). Reinsurers’ share oflosses on claims decreased from $900.6 in 2013 to $626.9 in 2014 primarily reflecting decreases at OdysseyRe(primarily reflecting more favourable loss experience in its U.S. crop insurance business) and Northbridge (primarilyreflecting significantly lower catastrophe losses ceded to reinsurers in 2014 compared to 2013), partially offset byincreases at Runoff (primarily reflecting significant favorable development at RiverStone Insurance in 2013 ceded toreinsurers). The company recorded net recoveries of uncollectible reinsurance of $19.6 and $42.8 in 2014 and 2013respectively principally at Runoff.
The use of reinsurance increased cash provided by operating activities by approximately $625 in 2014 (2013 – $466)primarily as a result of an increase in collection of ceded losses ($1,507.6 in 2014 compared to $1,421.4 in 2013)including the collection of proceeds following the commutation of a significant reinsurance recoverable from BritGroup at European Runoff.
Investments
Hamblin Watsa Investment Counsel Ltd.
Hamblin Watsa Investment Counsel Ltd. (‘‘Hamblin Watsa’’) is a wholly owned subsidiary of the company thatserves as the investment manager for Fairfax and all of its subsidiaries. Hamblin Watsa follows a long-term value-oriented investment philosophy with a primary emphasis on the preservation of invested capital. Hamblin Watsalooks for a margin of safety in its investments by: applying thorough proprietary analysis of investmentopportunities and markets to assess the financial strength of issuers; identifying attractively priced securities sellingat discounts to intrinsic value; and hedging risk where appropriate. Hamblin Watsa is opportunistic in seekingundervalued securities in the market, often investing in out-of-favour securities when sentiment is negative, andwilling to keep a large portion of its investment portfolio in cash and cash equivalents when markets are perceived tobe over-valued.
Hamblin Watsa generally operates as a separate investment management entity, with Fairfax’s CEO and one othercorporate officer being members of Hamblin Watsa’s investment committee. Hamblin Watsa’s investmentcommittee is responsible for making all investment decisions, subject to relevant regulatory guidelines andconstraints. The investment process is overseen by management of Hamblin Watsa. The Fairfax Board of Directorsand each of the insurance and reinsurance subsidiaries are kept apprised of significant investment decisions throughthe financial reporting process as well as periodic presentations by Hamblin Watsa management.
176
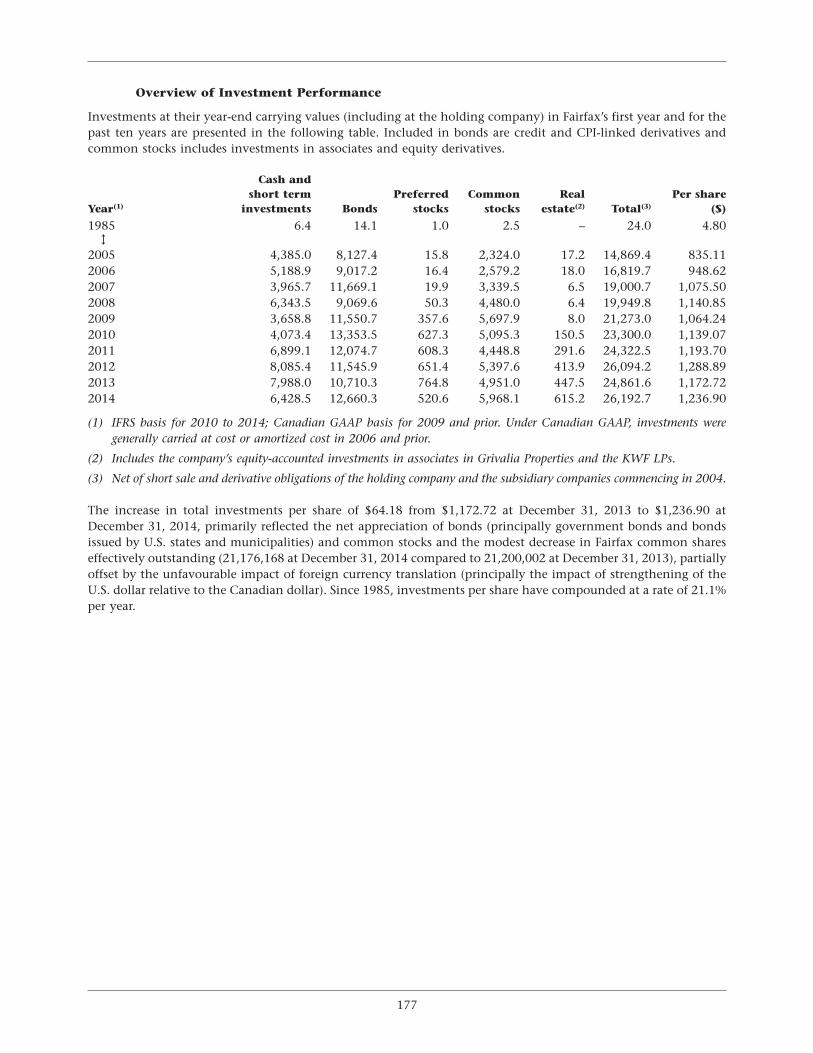
Overview of Investment Performance
Investments at their year-end carrying values (including at the holding company) in Fairfax’s first year and for thepast ten years are presented in the following table. Included in bonds are credit and CPI-linked derivatives andcommon stocks includes investments in associates and equity derivatives.
Cash andshort term Preferred Common Real Per share
Year(1) investments Bonds stocks stocks estate(2) Total(3) ($)
1985 6.4 14.1 1.0 2.5 – 24.0 4.80�
2005 4,385.0 8,127.4 15.8 2,324.0 17.2 14,869.4 835.112006 5,188.9 9,017.2 16.4 2,579.2 18.0 16,819.7 948.622007 3,965.7 11,669.1 19.9 3,339.5 6.5 19,000.7 1,075.502008 6,343.5 9,069.6 50.3 4,480.0 6.4 19,949.8 1,140.852009 3,658.8 11,550.7 357.6 5,697.9 8.0 21,273.0 1,064.242010 4,073.4 13,353.5 627.3 5,095.3 150.5 23,300.0 1,139.072011 6,899.1 12,074.7 608.3 4,448.8 291.6 24,322.5 1,193.702012 8,085.4 11,545.9 651.4 5,397.6 413.9 26,094.2 1,288.892013 7,988.0 10,710.3 764.8 4,951.0 447.5 24,861.6 1,172.722014 6,428.5 12,660.3 520.6 5,968.1 615.2 26,192.7 1,236.90
(1) IFRS basis for 2010 to 2014; Canadian GAAP basis for 2009 and prior. Under Canadian GAAP, investments weregenerally carried at cost or amortized cost in 2006 and prior.
(2) Includes the company’s equity-accounted investments in associates in Grivalia Properties and the KWF LPs.
(3) Net of short sale and derivative obligations of the holding company and the subsidiary companies commencing in 2004.
The increase in total investments per share of $64.18 from $1,172.72 at December 31, 2013 to $1,236.90 atDecember 31, 2014, primarily reflected the net appreciation of bonds (principally government bonds and bondsissued by U.S. states and municipalities) and common stocks and the modest decrease in Fairfax common shareseffectively outstanding (21,176,168 at December 31, 2014 compared to 21,200,002 at December 31, 2013), partiallyoffset by the unfavourable impact of foreign currency translation (principally the impact of strengthening of theU.S. dollar relative to the Canadian dollar). Since 1985, investments per share have compounded at a rate of 21.1%per year.
177
FAIRFAX FINANCIAL HOLDINGS LIMITED
Interest and Dividend Income
The majority of interest and dividend income is earned by the insurance, reinsurance and runoff companies. Interestand dividend income on holding company cash and investments was $23.7 in 2014 (2013 – $19.5) prior to givingeffect to total return swap expense of $30.0 (2013 – $31.2). Interest and dividend income earned in Fairfax’s first yearand for the past ten years is presented in the following table.
Interest and dividend income
Average Pre-tax After tax
Investments at Yield Per share Yield Per shareYear(1) carrying value(2) Amount (%) ($) Amount(3) (%) ($)
1986 46.3 3.4 7.34 0.70 1.8 3.89 0.38�
2005 14,142.5 466.1 3.30 28.34 303.0 2.14 18.422006 15,827.0 746.5 4.72 42.03 485.3 3.07 27.322007 17,898.0 761.0 4.25 42.99 494.7 2.76 27.952008 19,468.8 626.4 3.22 34.73 416.6 2.14 23.102009 20,604.2 712.7 3.46 38.94 477.5 2.32 26.092010 22,270.2 711.5 3.20 34.82 490.9 2.20 24.022011 23,787.5 705.3 2.97 34.56 505.7 2.13 24.782012 25,185.2 409.3 1.63 19.90 300.8 1.19 14.632013 25,454.7 376.9 1.48 18.51 277.0 1.09 13.602014 25,527.2 403.8 1.58 18.70 296.8 1.16 13.74
(1) IFRS basis for 2010 to 2014; Canadian GAAP basis for 2009 and prior. Under Canadian GAAP, investments weregenerally carried at cost or amortized cost in 2006 and prior.
(2) Net of short sale and derivative obligations of the holding company and the subsidiary companies commencing in 2004.
(3) Tax effected at the company’s Canadian statutory income tax rate.
Consolidated interest and dividend income increased from $376.9 in 2013 to $403.8 in 2014 reflecting an increase ininterest income earned and lower total return swap expense, partially offset by lower dividends earned on commonstocks as a result of sales of dividend paying equities during 2013. Total return swap expense decreased from $167.9in 2013 to $156.3 in 2014, reflecting lower total return swap expense following the termination in 2013 of a portionof the company’s Russell 2000 and all of its S&P 500 equity index total return swaps, partially offset by lower totalreturn swap income following the termination of a significant portion of the company’s long equity total returnswaps at the end of 2013.
The company’s pre-tax interest and dividend income yield increased from 1.48% in 2013 to 1.58% in 2014 and thecompany’s after-tax interest and dividend yield increased from 1.09% in 2013 to 1.16% in 2014. Prior to giving effectto the interest expense which accrued to reinsurers on funds withheld and total return return swap expense(described in the two subsequent paragraphs), interest and dividend income in 2014 of $579.6 (2013 – $563.5)produced a pre-tax gross portfolio yield of 2.27% (2013 – 2.21%). Higher yields on the company’s investmentportfolio in 2014 compared to 2013 principally reflected the factors which resulted in higher interest and dividendincome described in the preceding paragraph.
Funds withheld payable to reinsurers shown on the consolidated balance sheets represents funds to which thecompany’s reinsurers are entitled (principally premiums and accumulated accrued interest on aggregate stop lossreinsurance treaties) but which Fairfax retains as collateral for future obligations of those reinsurers. Claims payableunder such reinsurance treaties are paid first out of the funds withheld balances. At December 31, 2014 fundswithheld payable to reinsurers shown on the consolidated balance sheet of $461.5 (December 31, 2013 – $461.2)principally related to Crum & Forster of $338.9 (December 31, 2013 – $397.4) and First Capital of $62.5(December 31, 2013 – $75.7). Interest expense which accrued to reinsurers on funds withheld totaled $19.5 in 2014(2013 – $18.7). The company’s consolidated interest and dividend income in 2014 and 2013 is shown net ofthese amounts.
178
The company’s long equity total return swaps allow the company to receive the total return on a notional amount ofan equity index or individual equity security (including dividends and capital gains or losses) in exchange for thepayment of a floating rate of interest on the notional amount. Conversely, short equity total return swaps allow thecompany to pay the total return on a notional amount of an equity index or individual equity security in exchangefor the receipt of a floating rate of interest on the notional amount. Throughout this MD&A, the term ‘‘total returnswap expense’’ refers to the net dividends and interest paid or received related to the company’s long and shortequity and equity index total return swaps which totaled $156.3 in 2014 (2013 – $167.9). The company’sconsolidated interest and dividend income in 2014 and 2013 is shown net of these amounts.
The share of profit from associates increased from $96.7 in 2013 to $105.7 in 2014, primarily reflectingimprovements in the share of profit of ICICI Lombard, Grivalia Properties and Thai Re, partially offset by decreases inthe share of profit of Resolute and decreased limited partnerships investment income.
Upon initial application of the equity method of accounting to its investment in Resolute, Fairfax was required todetermine its proportionate share of the fair value of Resolute’s assets and liabilities at that date. Differences betweenfair value and Resolute’s carrying value were identified (collectively, fair value adjustments) primarily with respect toResolute’s fixed assets, deferred income tax assets and pension benefit obligations. These fair value adjustments havebeen and will be recognized in Fairfax’s share of profit (loss) of Resolute in any period to the extent that in that periodResolute adjusts the carrying value of those particular assets and liabilities. As a result, Fairfax’s share of profit (loss) ofResolute will in any such period differ, potentially significantly, from what would be determined by applyingFairfax’s ownership percentage of Resolute to Resolute’s reported net earnings (loss).
179
FAIRFAX FINANCIAL HOLDINGS LIMITED
Net Gains (Losses) on Investments
Net gains on investments of $1,736.2 in 2014 (2013 – net losses on investments of $1,564.0) were comprised asshown in the following table:
2014 2013
Net Net change in Net gains Net Net change in Net gainsrealized gains unrealized (losses) on realized gains unrealized (losses) on
(losses) gains (losses) investments (losses) gains (losses) investments
Common stocks 483.5 (216.6) 266.9 684.1 257.1 941.2Preferred stocks – convertible (161.5)(1) 47.2 (114.3) – 64.7 64.7Bonds – convertible 36.7 166.7 203.4 153.6 (156.2) (2.6)Gain on disposition of associates(2) 53.6 – 53.6 130.2 – 130.2Other equity derivatives(3)(4) 184.6 (52.3) 132.3 356.3 (44.7) 311.6
Equity and equity-related holdings 596.9 (55.0) 541.9 1,324.2 120.9 1,445.1Equity hedges(3) 13.0 (207.5) (194.5) (1,350.7) (631.3) (1,982.0)
Equity and equity-related holdings afterequity hedges 609.9 (262.5) 347.4 (26.5) (510.4) (536.9)Bonds 103.0 1,134.2 1,237.2 65.9 (994.9) (929.0)Preferred stocks (0.3) (27.2) (27.5) (1.2) (17.8) (19.0)CPI-linked derivatives – 17.7 17.7 – (126.9) (126.9)Other derivatives 12.5 (2.3) 10.2 2.1 (9.1) (7.0)Foreign currency 59.0 44.4 103.4 (3.7) 66.1 62.4Other 6.5(5) 41.3 47.8 (7.7) 0.1 (7.6)
Net gains (losses) on investments 790.6 945.6 1,736.2 28.9 (1,592.9) (1,564.0)
Net gains (losses) on bonds is comprisedas follows:Government bonds 79.6 451.7 531.3 35.9 (303.5) (267.6)U.S. states and municipalities 18.5 666.2 684.7 19.1 (656.4) (637.3)Corporate and other 4.9 16.3 21.2 10.9 (35.0) (24.1)
103.0 1,134.2 1,237.2 65.9 (994.9) (929.0)
(1) During the fourth quarter of 2014, a preferred stock investment of the company was, pursuant to its terms, automaticallyconverted into common shares of the issuer, resulting in a net realized loss on investment of $161.5 (the difference betweenthe share price of the underlying common stock at the date of conversion and the exercise price of the preferred stock).
(2) The gain on disposition of associates of $53.6 in 2014 principally reflected the dispositions of the company’s investmentsin MEGA Brands and two KWF LPs. The gain on disposition of associates of $130.2 in 2013 reflected the sales of thecompany’s investments in The Brick ($111.9), a private company ($12.1) and Imvescor ($6.2).
(3) Other equity derivatives include long equity total return swaps, equity warrants and call options.
(4) Gains and losses on equity and equity index total return swaps that are regularly renewed as part of the company’s longterm risk management objectives are presented within net change in unrealized gains (losses).
(5) During the third quarter of 2014 Thomas Cook India increased its ownership interest in Sterling Resorts to 55.1% andceased applying the equity method of accounting, resulting in a non-cash gain of $41.2.
Equity and equity related holdings after equity hedges: The company uses short equity and equity indextotal return swaps to economically hedge equity price risk associated with its equity and equity-related holdings. Thecompany’s economic equity hedges are structured to provide a return which is inverse to changes in the fair values ofthe Russell 2000 index, the S&P/TSX 60 index, other equity indexes and certain individual equity securities. AtDecember 31, 2014 equity hedges with a notional amount of $6,856.9 (December 31, 2013 – $6,327.4) represented89.6% (December 31, 2013 – 98.2%) of the company’s equity and equity-related holdings of $7,651.7 (December 31,2013 – $6,442.6). The decrease in the hedge ratio resulted from appreciation and net purchases of equity and equity-related holdings, which exceeded the performance of the equity hedges and net purchases of equity hedges, duringthe year. During 2014 the company’s equity and equity-related holdings after equity hedges produced net gains of$347.4 (2013 – net losses of $536.9).
180
There may be periods when the notional amount of the equity hedges may exceed or be deficient relative to thecompany’s equity price risk exposure as a result of the timing of opportunities to exit and enter hedges at attractiveprices, decisions by the company to hedge an amount less than the company’s full equity exposure or, on atemporary basis, as a result of non-correlated performance of the equity hedges relative to the equity and equity-related holdings. The company’s risk management objective is for the equity hedges to be reasonably effective inprotecting that proportion of the company’s equity and equity-related holdings to which the hedges relate should asignificant correction in the market occur. However, due to the lack of a perfect correlation between the hedged itemsand the hedging items, combined with other market uncertainties, it is not possible to predict the future impact ofthe company’s hedging program related to equity price risk.
Bonds: Net gains on bonds of $1,237.2 in 2014 were primarily comprised of net mark-to-market gains principallyas a result of the effect of a decrease in interest rates during 2014 on U.S. treasury bonds ($321.2) and U.S. state andmunicipal bonds ($658.7). The company recorded net losses on bonds of $929.0 in 2013.
CPI-linked derivatives: The company has purchased derivative contracts referenced to consumer price indexes(‘‘CPI’’) in the geographic regions in which it operates which serve as an economic hedge against the potentialadverse financial impact on the company of decreasing price levels. At December 31, 2014 these contracts have aremaining weighted average life of 7.4 years (December 31, 2013 – 7.5 years), a notional amount of $111.8 billion(December 31, 2013 – $82.9 billion) and fair value of $238.4 (December 31, 2013 – $131.7). The company’sCPI-linked derivative contracts produced unrealized gains of $17.7 in 2014 compared to unrealized losses of $126.9in 2013. Unrealized gains (losses) on CPI-linked derivative contracts typically reflect decreases (increases) in thevalues of the CPI indexes underlying those contracts during the periods presented (those contracts are structured tobenefit the company during periods of decreasing CPI index values). Refer to the analysis in note 7 (Short Sales andDerivatives) under the heading CPI-linked derivatives in the company’s consolidated financial statements for theyear ended December 31, 2014 for a discussion of the company’s economic hedge against the potential adversefinancial impact of decreasing price levels.
Average Market UnrealizedFloor life Notional Cost(2) Market value(2) gain
Underlying CPI index rate(1) (in years) amount Cost (in bps) value (in bps) (loss)
United States 0.0% 7.6 46,225.0 286.4 62.0 78.8 17.0 (207.6)United States 0.5% 9.8 12,600.0 40.3 32.0 72.5 57.5 32.2European Union 0.0% 6.5 44,499.7 285.9 64.2 70.4 15.8 (215.5)United Kingdom 0.0% 7.9 5,145.6 24.4 47.4 4.8 9.3 (19.6)France 0.0% 7.7 3,327.6 18.4 55.3 11.9 35.8 (6.5)
7.4 111,797.9 655.4 238.4 (417.0)
(1) Contracts with a floor rate of 0.0% provide a payout at maturity if there is cumulative deflation over the life of thecontract. Contracts with a floor rate of 0.5% provide a payout at maturity if cumulative inflation averages less than 0.5%per year over the life of the contract.
(2) Expressed as a percentage of the notional amount.
Total Return on the Investment Portfolio
The following table presents the performance of the investment portfolio since Fairfax’s inception in 1985. For theyears 1986 to 2006, the calculation of total return on average investments included interest and dividends, netrealized gains (losses) and changes in net unrealized gains (losses) as the majority of the company’s investmentportfolio was carried at cost or amortized cost. For the years 2007 to 2009, Canadian GAAP required the company tocarry most of its investments at fair value and as a result, the calculation of total return on average investmentsduring this period included interest and dividends, net investment gains (losses) recorded in net earnings, netunrealized gains (losses) recorded in other comprehensive income and changes in net unrealized gains (losses) onequity accounted investments. Effective January 1, 2010, the company adopted IFRS and was required to carry themajority of its investments as at FVTPL and as a result, the calculation of total return on average investments for theyears 2010 to 2014 includes interest and dividends, net investment gains (losses) recorded in net earnings andchanges in net unrealized gains (losses) on equity accounted investments. All of the above noted amounts areincluded in the calculation of total return on average investments on a pre-tax basis.
181
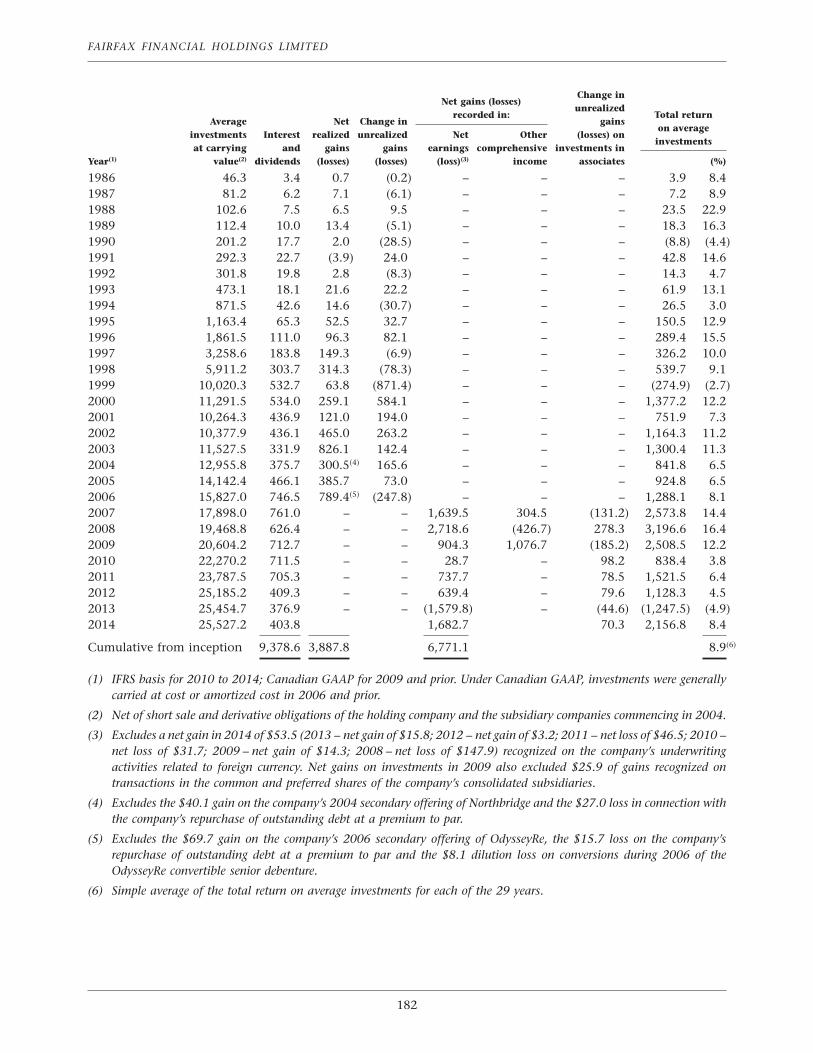
FAIRFAX FINANCIAL HOLDINGS LIMITED
Change inNet gains (losses)
unrealizedrecorded in: Total return
Average Net Change in gainson average
investments Interest realized unrealized Net Other (losses) oninvestments
at carrying and gains gains earnings comprehensive investments inYear(1) value(2) dividends (losses) (losses) (loss)(3) income associates (%)
1986 46.3 3.4 0.7 (0.2) – – – 3.9 8.41987 81.2 6.2 7.1 (6.1) – – – 7.2 8.91988 102.6 7.5 6.5 9.5 – – – 23.5 22.91989 112.4 10.0 13.4 (5.1) – – – 18.3 16.31990 201.2 17.7 2.0 (28.5) – – – (8.8) (4.4)1991 292.3 22.7 (3.9) 24.0 – – – 42.8 14.61992 301.8 19.8 2.8 (8.3) – – – 14.3 4.71993 473.1 18.1 21.6 22.2 – – – 61.9 13.11994 871.5 42.6 14.6 (30.7) – – – 26.5 3.01995 1,163.4 65.3 52.5 32.7 – – – 150.5 12.91996 1,861.5 111.0 96.3 82.1 – – – 289.4 15.51997 3,258.6 183.8 149.3 (6.9) – – – 326.2 10.01998 5,911.2 303.7 314.3 (78.3) – – – 539.7 9.11999 10,020.3 532.7 63.8 (871.4) – – – (274.9) (2.7)2000 11,291.5 534.0 259.1 584.1 – – – 1,377.2 12.22001 10,264.3 436.9 121.0 194.0 – – – 751.9 7.32002 10,377.9 436.1 465.0 263.2 – – – 1,164.3 11.22003 11,527.5 331.9 826.1 142.4 – – – 1,300.4 11.32004 12,955.8 375.7 300.5(4) 165.6 – – – 841.8 6.52005 14,142.4 466.1 385.7 73.0 – – – 924.8 6.52006 15,827.0 746.5 789.4(5) (247.8) – – – 1,288.1 8.12007 17,898.0 761.0 – – 1,639.5 304.5 (131.2) 2,573.8 14.42008 19,468.8 626.4 – – 2,718.6 (426.7) 278.3 3,196.6 16.42009 20,604.2 712.7 – – 904.3 1,076.7 (185.2) 2,508.5 12.22010 22,270.2 711.5 – – 28.7 – 98.2 838.4 3.82011 23,787.5 705.3 – – 737.7 – 78.5 1,521.5 6.42012 25,185.2 409.3 – – 639.4 – 79.6 1,128.3 4.52013 25,454.7 376.9 – – (1,579.8) – (44.6) (1,247.5) (4.9)2014 25,527.2 403.8 1,682.7 70.3 2,156.8 8.4
Cumulative from inception 9,378.6 3,887.8 6,771.1 8.9(6)
(1) IFRS basis for 2010 to 2014; Canadian GAAP for 2009 and prior. Under Canadian GAAP, investments were generallycarried at cost or amortized cost in 2006 and prior.
(2) Net of short sale and derivative obligations of the holding company and the subsidiary companies commencing in 2004.
(3) Excludes a net gain in 2014 of $53.5 (2013 – net gain of $15.8; 2012 – net gain of $3.2; 2011 – net loss of $46.5; 2010 –net loss of $31.7; 2009 – net gain of $14.3; 2008 – net loss of $147.9) recognized on the company’s underwritingactivities related to foreign currency. Net gains on investments in 2009 also excluded $25.9 of gains recognized ontransactions in the common and preferred shares of the company’s consolidated subsidiaries.
(4) Excludes the $40.1 gain on the company’s 2004 secondary offering of Northbridge and the $27.0 loss in connection withthe company’s repurchase of outstanding debt at a premium to par.
(5) Excludes the $69.7 gain on the company’s 2006 secondary offering of OdysseyRe, the $15.7 loss on the company’srepurchase of outstanding debt at a premium to par and the $8.1 dilution loss on conversions during 2006 of theOdysseyRe convertible senior debenture.
(6) Simple average of the total return on average investments for each of the 29 years.
182
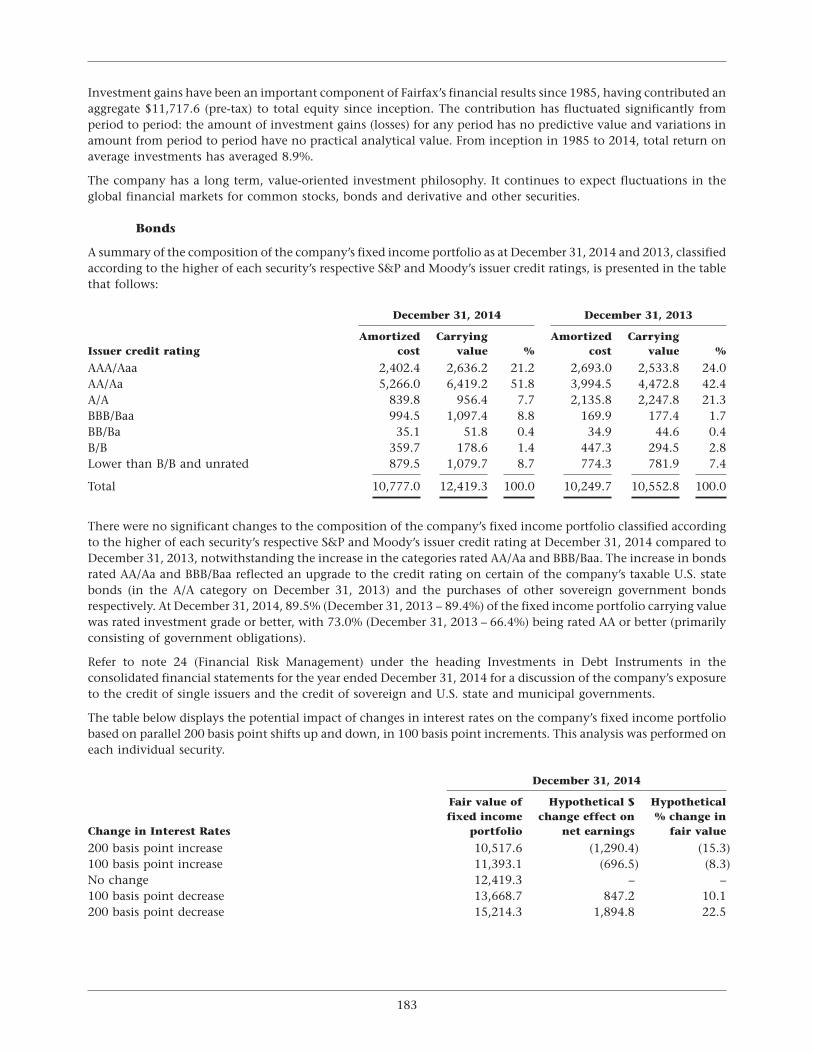
Investment gains have been an important component of Fairfax’s financial results since 1985, having contributed anaggregate $11,717.6 (pre-tax) to total equity since inception. The contribution has fluctuated significantly fromperiod to period: the amount of investment gains (losses) for any period has no predictive value and variations inamount from period to period have no practical analytical value. From inception in 1985 to 2014, total return onaverage investments has averaged 8.9%.
The company has a long term, value-oriented investment philosophy. It continues to expect fluctuations in theglobal financial markets for common stocks, bonds and derivative and other securities.
Bonds
A summary of the composition of the company’s fixed income portfolio as at December 31, 2014 and 2013, classifiedaccording to the higher of each security’s respective S&P and Moody’s issuer credit ratings, is presented in the tablethat follows:
December 31, 2014 December 31, 2013
Amortized Carrying Amortized CarryingIssuer credit rating cost value % cost value %
AAA/Aaa 2,402.4 2,636.2 21.2 2,693.0 2,533.8 24.0AA/Aa 5,266.0 6,419.2 51.8 3,994.5 4,472.8 42.4A/A 839.8 956.4 7.7 2,135.8 2,247.8 21.3BBB/Baa 994.5 1,097.4 8.8 169.9 177.4 1.7BB/Ba 35.1 51.8 0.4 34.9 44.6 0.4B/B 359.7 178.6 1.4 447.3 294.5 2.8Lower than B/B and unrated 879.5 1,079.7 8.7 774.3 781.9 7.4
Total 10,777.0 12,419.3 100.0 10,249.7 10,552.8 100.0
There were no significant changes to the composition of the company’s fixed income portfolio classified accordingto the higher of each security’s respective S&P and Moody’s issuer credit rating at December 31, 2014 compared toDecember 31, 2013, notwithstanding the increase in the categories rated AA/Aa and BBB/Baa. The increase in bondsrated AA/Aa and BBB/Baa reflected an upgrade to the credit rating on certain of the company’s taxable U.S. statebonds (in the A/A category on December 31, 2013) and the purchases of other sovereign government bondsrespectively. At December 31, 2014, 89.5% (December 31, 2013 – 89.4%) of the fixed income portfolio carrying valuewas rated investment grade or better, with 73.0% (December 31, 2013 – 66.4%) being rated AA or better (primarilyconsisting of government obligations).
Refer to note 24 (Financial Risk Management) under the heading Investments in Debt Instruments in theconsolidated financial statements for the year ended December 31, 2014 for a discussion of the company’s exposureto the credit of single issuers and the credit of sovereign and U.S. state and municipal governments.
The table below displays the potential impact of changes in interest rates on the company’s fixed income portfoliobased on parallel 200 basis point shifts up and down, in 100 basis point increments. This analysis was performed oneach individual security.
December 31, 2014
Fair value of Hypothetical $ Hypotheticalfixed income change effect on % change in
Change in Interest Rates portfolio net earnings fair value
200 basis point increase 10,517.6 (1,290.4) (15.3)100 basis point increase 11,393.1 (696.5) (8.3)No change 12,419.3 – –100 basis point decrease 13,668.7 847.2 10.1200 basis point decrease 15,214.3 1,894.8 22.5
183
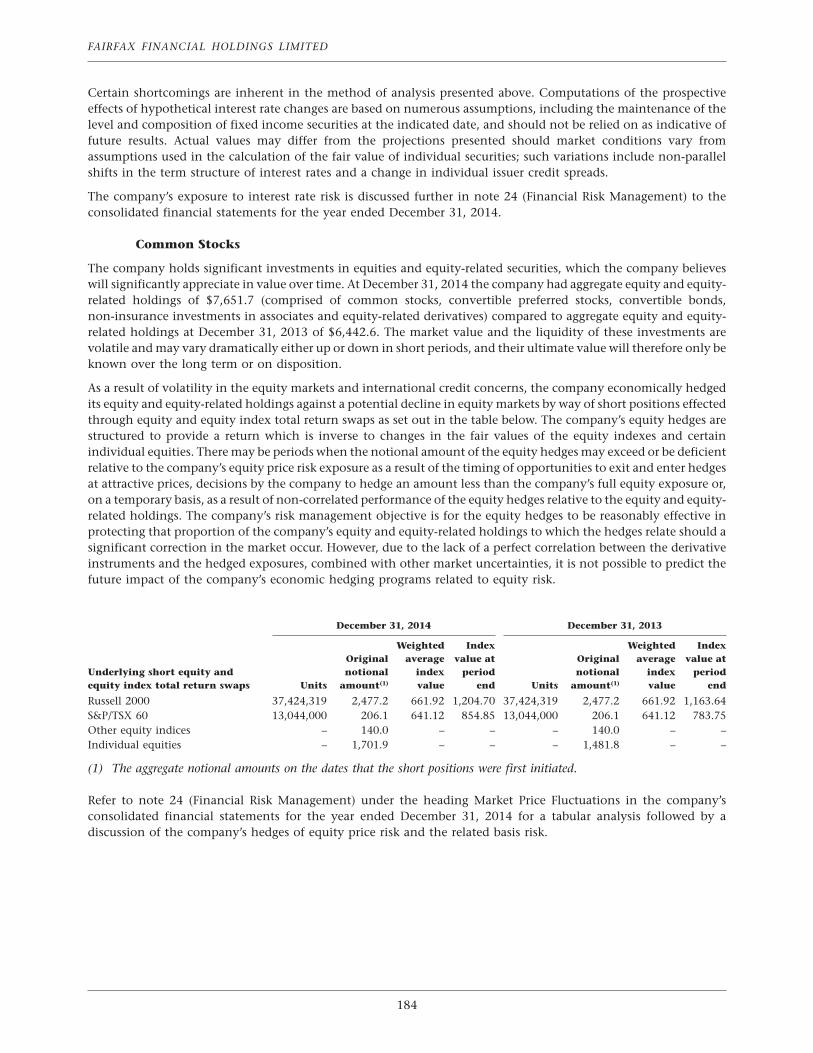
FAIRFAX FINANCIAL HOLDINGS LIMITED
Certain shortcomings are inherent in the method of analysis presented above. Computations of the prospectiveeffects of hypothetical interest rate changes are based on numerous assumptions, including the maintenance of thelevel and composition of fixed income securities at the indicated date, and should not be relied on as indicative offuture results. Actual values may differ from the projections presented should market conditions vary fromassumptions used in the calculation of the fair value of individual securities; such variations include non-parallelshifts in the term structure of interest rates and a change in individual issuer credit spreads.
The company’s exposure to interest rate risk is discussed further in note 24 (Financial Risk Management) to theconsolidated financial statements for the year ended December 31, 2014.
Common Stocks
The company holds significant investments in equities and equity-related securities, which the company believeswill significantly appreciate in value over time. At December 31, 2014 the company had aggregate equity and equity-related holdings of $7,651.7 (comprised of common stocks, convertible preferred stocks, convertible bonds,non-insurance investments in associates and equity-related derivatives) compared to aggregate equity and equity-related holdings at December 31, 2013 of $6,442.6. The market value and the liquidity of these investments arevolatile and may vary dramatically either up or down in short periods, and their ultimate value will therefore only beknown over the long term or on disposition.
As a result of volatility in the equity markets and international credit concerns, the company economically hedgedits equity and equity-related holdings against a potential decline in equity markets by way of short positions effectedthrough equity and equity index total return swaps as set out in the table below. The company’s equity hedges arestructured to provide a return which is inverse to changes in the fair values of the equity indexes and certainindividual equities. There may be periods when the notional amount of the equity hedges may exceed or be deficientrelative to the company’s equity price risk exposure as a result of the timing of opportunities to exit and enter hedgesat attractive prices, decisions by the company to hedge an amount less than the company’s full equity exposure or,on a temporary basis, as a result of non-correlated performance of the equity hedges relative to the equity and equity-related holdings. The company’s risk management objective is for the equity hedges to be reasonably effective inprotecting that proportion of the company’s equity and equity-related holdings to which the hedges relate should asignificant correction in the market occur. However, due to the lack of a perfect correlation between the derivativeinstruments and the hedged exposures, combined with other market uncertainties, it is not possible to predict thefuture impact of the company’s economic hedging programs related to equity risk.
December 31, 2014 December 31, 2013
Weighted Index Weighted IndexOriginal average value at Original average value at
Underlying short equity and notional index period notional index periodequity index total return swaps Units amount(1) value end Units amount(1) value end
Russell 2000 37,424,319 2,477.2 661.92 1,204.70 37,424,319 2,477.2 661.92 1,163.64S&P/TSX 60 13,044,000 206.1 641.12 854.85 13,044,000 206.1 641.12 783.75Other equity indices – 140.0 – – – 140.0 – –Individual equities – 1,701.9 – – – 1,481.8 – –
(1) The aggregate notional amounts on the dates that the short positions were first initiated.
Refer to note 24 (Financial Risk Management) under the heading Market Price Fluctuations in the company’sconsolidated financial statements for the year ended December 31, 2014 for a tabular analysis followed by adiscussion of the company’s hedges of equity price risk and the related basis risk.
184
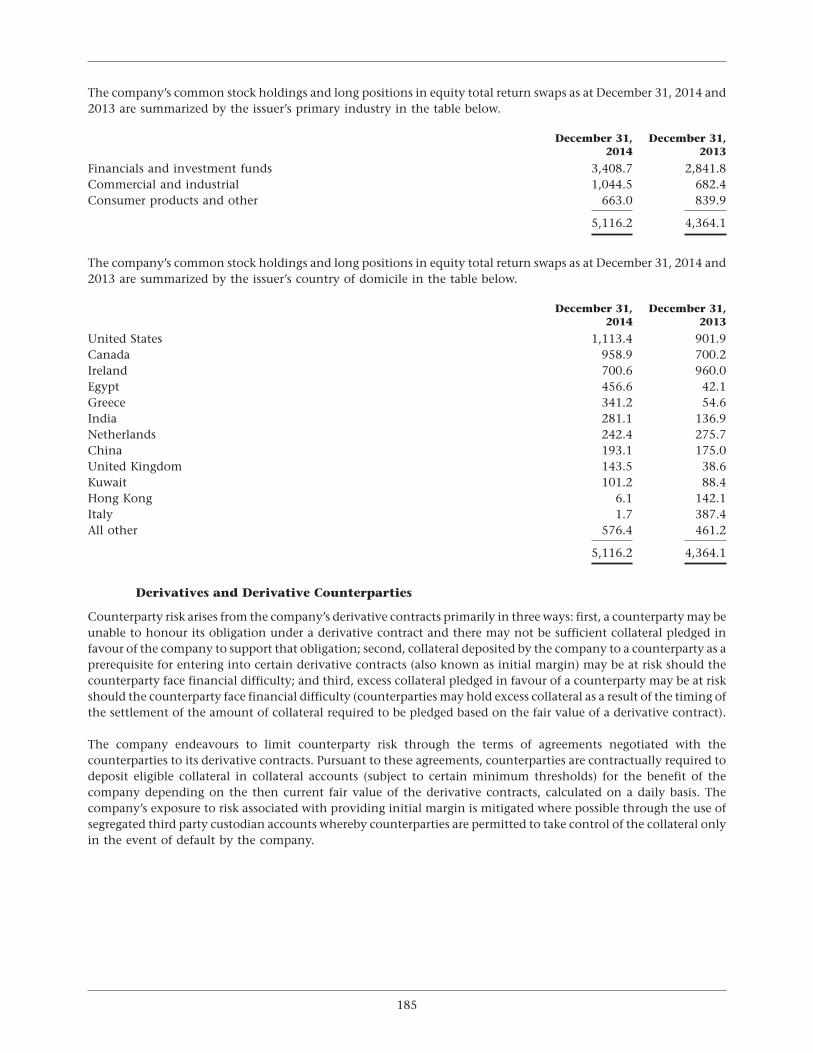
The company’s common stock holdings and long positions in equity total return swaps as at December 31, 2014 and2013 are summarized by the issuer’s primary industry in the table below.
December 31, December 31,2014 2013
Financials and investment funds 3,408.7 2,841.8Commercial and industrial 1,044.5 682.4Consumer products and other 663.0 839.9
5,116.2 4,364.1
The company’s common stock holdings and long positions in equity total return swaps as at December 31, 2014 and2013 are summarized by the issuer’s country of domicile in the table below.
December 31, December 31,2014 2013
United States 1,113.4 901.9Canada 958.9 700.2Ireland 700.6 960.0Egypt 456.6 42.1Greece 341.2 54.6India 281.1 136.9Netherlands 242.4 275.7China 193.1 175.0United Kingdom 143.5 38.6Kuwait 101.2 88.4Hong Kong 6.1 142.1Italy 1.7 387.4All other 576.4 461.2
5,116.2 4,364.1
Derivatives and Derivative Counterparties
Counterparty risk arises from the company’s derivative contracts primarily in three ways: first, a counterparty may beunable to honour its obligation under a derivative contract and there may not be sufficient collateral pledged infavour of the company to support that obligation; second, collateral deposited by the company to a counterparty as aprerequisite for entering into certain derivative contracts (also known as initial margin) may be at risk should thecounterparty face financial difficulty; and third, excess collateral pledged in favour of a counterparty may be at riskshould the counterparty face financial difficulty (counterparties may hold excess collateral as a result of the timing ofthe settlement of the amount of collateral required to be pledged based on the fair value of a derivative contract).
The company endeavours to limit counterparty risk through the terms of agreements negotiated with thecounterparties to its derivative contracts. Pursuant to these agreements, counterparties are contractually required todeposit eligible collateral in collateral accounts (subject to certain minimum thresholds) for the benefit of thecompany depending on the then current fair value of the derivative contracts, calculated on a daily basis. Thecompany’s exposure to risk associated with providing initial margin is mitigated where possible through the use ofsegregated third party custodian accounts whereby counterparties are permitted to take control of the collateral onlyin the event of default by the company.
185
FAIRFAX FINANCIAL HOLDINGS LIMITED
Agreements negotiated with counterparties provide for a single net settlement of all financial instruments covered bythe agreement in the event of default by the counterparty, thereby permitting obligations owed by the company to acounterparty to be offset to the extent of the aggregate amount receivable by the company from that counterparty(the ‘‘net settlement arrangements’’). The following table sets out the company’s exposure to credit risk related to thecounterparties to its derivative contracts, assuming all such counterparties are simultaneously in default:
December 31, December 31,2014 2013
Total derivative assets(1) 514.9 219.6Impact of net settlement arrangements (110.0) (136.1)Fair value of collateral deposited for the benefit of the company(2) (171.1) (47.4)Excess collateral pledged by the company in favour of counterparties 137.1 123.1Initial margin not held in segregated third party custodian accounts 61.8 60.0
Net derivative counterparty exposure after net settlement and collateralarrangements 432.7 219.2
(1) Excludes exchange traded instruments comprised principally of equity, credit warrants and call options which are notsubject to counterparty risk.
(2) Excludes $21.2 (December 31, 2013 – $3.0) of excess collateral pledged by counterparties.
The fair value of the collateral deposited for the benefit of the company at December 31, 2014 consisted of cash of$27.8 and government securities of $164.5 (December 31, 2013 – $25.3 and $25.1 respectively). The company hadnot exercised its right to sell or repledge collateral at December 31, 2014.
Float
Fairfax’s float (a non-GAAP measure) is the sum of its loss reserves, including loss adjustment expense reserves,unearned premium reserves and other insurance contract liabilities, less insurance contract receivables, recoverablefrom reinsurers and deferred premium acquisition costs. The annual benefit (cost) of float is calculated by dividingthe underwriting profit (loss) by the average float in that year. Float arises as an insurance or reinsurance businessreceives premiums in advance of the payment of claims.
The following table presents the accumulated float and the cost of generating that float for Fairfax’s insurance andreinsurance operations. The average float from those operations decreased by 2.8% in 2014 to $11,707.4, at no cost.
Average longterm Canada
Underwriting Average Cost (benefit) treasuryYear profit (loss)(1) float of float bond yield
1986 2.5 21.6 (11.6)% 9.6%�
2010 (236.6) 10,430.5 2.3% 3.8%2011 (754.4) 11,315.1 6.7% 3.3%2012 6.1 11,906.0 (0.1)% 2.4%2013 440.0 12,045.7 (3.7)% 2.8%2014 552.0 11,707.4 (4.7)% 2.8%Weighted average since inception 1.4% 4.2%
Fairfax weighted average financing differential since inception: 2.8%
(1) IFRS basis for 2011 to 2014; Canadian GAAP basis for 2010 and prior without reclassifications to conform with the IFRSpresentation adopted in 2011.
186
The following table presents a breakdown of total year-end float for the most recent five years.
Insuranceand
TotalInsurance Reinsurance Reinsurance
InsuranceFairfax and
Year Northbridge(1) U.S.(2) Asia(3) OdysseyRe(4) Other(5) Reinsurance Runoff(6) Total
2010 2,191.9 2,949.7 144.1 4,797.6 977.3 11,060.6 2,048.9 13,109.52011 2,223.1 3,207.7 387.0 4,733.4 1,018.4 11,569.6 2,829.4 14,399.02012 2,314.1 3,509.1 470.7 4,905.9 1,042.6 12,242.4 3,636.8 15,879.22013 2,112.0 3,541.0 519.3 4,673.5 1,003.2 11,849.0 3,701.5 15,550.52014 1,910.8 3,757.9 524.4 4,492.3 880.4 11,565.8 3,499.2 15,065.0
During 2014, the company’s aggregate float decreased by $485.5 to $15,065.0.
(1) Northbridge’s float decreased by 9.5% (decreased by 1.8% in Canadian dollars) primarily due to the effect of thestrengthening of the U.S. dollar relative to the Canadian dollar and net favourable reserve development. There was no costof float.
(2) U.S. Insurance’s float increased by 6.1% (at no cost) due to increased unearned premium reserves and decreasedreinsurance recoverables, partially offset by increased reinsurance balances receivable, primarily from increased premiumvolumes.
(3) Fairfax Asia’s float increased by 1.0% (at no cost) due to increased loss reserves and unearned premium reserves, partiallyoffset by decreased payables to reinsurers balances and funds withheld payable to reinsurers, primarily from increasedpremium volumes.
(4) OdysseyRe’s float decreased by 3.9% primarily due to decreased loss reserves and payable to reinsurers balances, partiallyoffset by decreased reinsurance recoverables, primarily from net favourable reserve development. There was no cost of float.
(5) Insurance and Reinsurance – Other’s float decreased by 12.2% primarily due to decreased loss reserves partially offset bylower insurance balances receivable, primarily from net favourable reserve development. There was no cost of float.
(6) Runoff’s float decreased by 5.5% due to a decrease in loss reserves, unearned premium reserves and payable to reinsurersbalances, partially offset by lower insurance balances receivable and reinsurance recoverables, primarily from normalcourse payment of claims and collection of reinsurance balances, offset by two large reinsurance transactions and asignificant commutation.
187
FAIRFAX FINANCIAL HOLDINGS LIMITED
Financial Condition
Capital Resources and Management
The company manages its capital based on the following financial measurements and ratios:
2014 2013 2012 2011 2010
Holding company cash and investments (net of short sale and derivativeobligations) 1,212.7 1,241.6 1,128.0 962.8 1,474.2
Long term debt – holding company borrowings 2,656.5 2,491.0 2,377.7 2,394.6 1,809.6Long term debt – insurance and reinsurance companies 385.9 458.8 618.3 622.4 916.4Subsidiary indebtedness – non-insurance companies 37.6 25.8 52.1 1.0 2.2Long term debt – non-insurance companies 99.0 18.9 0.5 0.5 0.9
Total debt 3,179.0 2,994.5 3,048.6 3,018.5 2,729.1
Net debt 1,966.3 1,752.9 1,920.6 2,055.7 1,254.9
Common shareholders’ equity 8,361.0 7,186.7 7,654.7 7,427.9 7,697.9Preferred stock 1,164.7 1,166.4 1,166.4 934.7 934.7Non-controlling interests 218.1 107.4 73.4 45.9 41.3
Total equity 9,743.8 8,460.5 8,894.5 8,408.5 8,673.9
Net debt/total equity 20.2% 20.7% 21.6% 24.4% 14.5%Net debt/net total capital(1) 16.8% 17.2% 17.8% 19.6% 12.6%Total debt/total capital(2) 24.6% 26.1% 25.5% 26.4% 23.9%Interest coverage(3) 12.3x n/a 4.2x 1.0x 1.8xInterest and preferred share dividend distribution coverage(4) 9.0x n/a 3.0x 0.7x 1.4x
(1) Net total capital is calculated by the company as the sum of total equity and net debt.
(2) Total capital is calculated by the company as the sum of total equity and total debt.
(3) Interest coverage is calculated by the company as the sum of earnings (loss) before income taxes and interest expensedivided by interest expense.
(4) Interest and preferred share dividend distribution coverage is calculated by the company as the sum of earnings (loss)before income taxes and interest expense divided by interest expense and preferred share dividend distributions adjusted toa before tax equivalent at the company’s Canadian statutory income tax rate.
Holding company borrowings at December 31, 2014 increased by $165.5 to $2,656.5 from $2,491.0 at December 31,2013 primarily reflecting the issuance on August 13, 2014 of $300.0 principal amount of holding companyunsecured senior notes due 2024, partially offset by the impact of foreign currency translation on the company’sCanadian dollar denominated long term debt and the repurchase of $7.0 principal amount of trust preferredsecurities due 2027.
Subsidiary debt (comprised of long term debt of the insurance and reinsurance companies, subsidiary indebtednessand long term debt of the non-insurance companies) at December 31, 2014 increased by $19.0 to $522.5 from $503.5at December 31, 2013, primarily reflecting the consolidation of the long term debt of The Keg and higher subsidiaryindebtedness at IKYA, partially offset by the redemption of $50.0 principal amount of OdysseyRe Series B unsecuredsenior notes due 2016 and the redemption of $25.0 principal amount of American Safety’s floating rate trustpreferred securities due 2035.
Common shareholders’ equity at December 31, 2014 increased by $1,174.3 to $8,361.0 from $7,186.7 atDecember 31, 2013 primarily as a result of net earnings attributable to shareholders of Fairfax ($1,633.2), partiallyoffset by decreased accumulated other comprehensive income (a decrease of $196.5 in 2014, primarily related to netunrealized foreign currency translation losses ($74.6), the share of other comprehensive loss of associates ($89.4inclusive of actuarial losses related to associates’ defined benefit plans of $36.7) and actuarial losses related to thecompany’s subsidiaries’ defined benefit plans ($32.5)) and the payment of dividends on the company’s common andpreferred shares ($272.6).
The changes in holding company borrowings, subsidiary debt and common shareholders’ equity affected thecompany’s leverage ratios as follows: the consolidated net debt/net total capital ratio decreased to 16.8% atDecember 31, 2014 from 17.2% at December 31, 2013 primarily as a result of increases in net total capital, partially
188
offset by increases in net debt. The increase in net debt was due to an increase in total debt (primarily increasedholding company borrowings and subsidiary debt as described above) and a slight decrease in holding company cashand investments (net of short sale and derivative obligations). The increase in net total capital was due to increases incommon shareholders’ equity, non-controlling interests and net debt. The consolidated total debt/total capital ratiodecreased to 24.6% at December 31, 2014 from 26.1% at December 31, 2013 primarily as a result of increased totalcapital (reflecting increases in common shareholders’ equity, total debt and non-controlling interests), partiallyoffset by increased total debt (primarily increased holding company borrowings and subsidiary debt as describedabove).
The company believes that cash and investments net of short sale and derivative obligations at December 31, 2014 of$1,212.7 (December 31, 2013 – $1,241.6) provide adequate liquidity to meet the holding company’s knownobligations in 2015. Refer to the third paragraph of the Liquidity section of this MD&A for a discussion of the sourcesof liquidity available to the holding company and the holding company’s known significant commitments for 2015.
The company’s operating companies continue to maintain capital above minimum regulatory levels, at adequatelevels required to support their issuer credit and financial strength ratings, and above internally calculated riskmanagement levels as discussed below. A common non-GAAP measure of capital adequacy in the property andcasualty industry is the ratio of premiums to statutory surplus (or total equity). These ratios are shown for theinsurance and reinsurance operating companies of Fairfax for the most recent five years in the following table:
Net premiums written to statutorysurplus (total equity)
2014 2013 2012 2011 2010
InsuranceNorthbridge (Canada) 0.8 0.9 0.8 1.0 0.8Crum & Forster (U.S.)(1) 1.1 1.1 1.0 0.9 0.6Zenith National (U.S.)(2) 1.3 1.4 1.4 0.8 0.6Fairfax Asia 0.4 0.4 0.5 0.5 0.4
Reinsurance – OdysseyRe 0.6 0.6 0.6 0.6 0.5Insurance and Reinsurance – Other(3) 0.5 0.6 0.7 0.8 0.8Canadian insurance industry 1.0 1.0 1.0 1.1 1.1U.S. insurance industry 0.7 0.7 0.8 0.8 0.7
(1) First Mercury was acquired February 9, 2011.
(2) Zenith National was acquired May 20, 2010. Zenith National’s net premiums written in 2010 includes the portion of thatyear prior to the acquisition by Fairfax.
(3) Other includes Group Re, Advent, Polish Re and Fairfax Brasil (effective March 2010).
In the U.S., the National Association of Insurance Commissioners (‘‘NAIC’’) has developed a model law andrisk-based capital (‘‘RBC’’) formula designed to help regulators identify property and casualty insurers that may beinadequately capitalized. Under the NAIC’s requirements, an insurer must maintain total capital and surplus above acalculated threshold or face varying levels of regulatory action. The threshold is based on a formula that attempts toquantify the risk of a company’s insurance and reinsurance, investment and other business activities. AtDecember 31, 2014 the U.S. insurance, reinsurance and runoff subsidiaries had capital and surplus in excess of theregulatory minimum requirement of two times the authorized control level – each subsidiary had capital and surplusof at least 3.7 times (December 31, 2013 – 3.4 times) the authorized control level, except for TIG Insurance which had2.9 times (December 31, 2013 – 2.1 times).
In Canada, property and casualty companies are regulated by the Office of the Superintendent of FinancialInstitutions on the basis of a minimum supervisory target of 150% of a minimum capital test (‘‘MCT’’) formula. AtDecember 31, 2014 Northbridge’s subsidiaries had a weighted average MCT ratio of 214% of the minimum statutorycapital required, compared to 205% at December 31, 2013, well in excess of the 150% minimum supervisory target.
In countries other than the U.S. and Canada where the company operates (the United Kingdom, Barbados,Singapore, Malaysia, Hong Kong, Poland, Brazil and Indonesia and other jurisdictions), the company met orexceeded the applicable regulatory capital requirements at December 31, 2014.
189
FAIRFAX FINANCIAL HOLDINGS LIMITED
The issuer credit ratings and financial strength ratings of Fairfax and its insurance and reinsurance operatingcompanies were as follows as at December 31, 2014:
StandardIssuer Credit Ratings A.M. Best & Poor’s Moody’s DBRSFairfax Financial Holdings Limited bbb BBB- Baa3 BBB
Financial Strength RatingsCrum & Forster Holdings Corp.(1) A A- Baa1 –Zenith National Insurance Corp. A BBB+ Baa1 –Odyssey Re Holdings Corp.(1) A A- A3 –Northbridge Commercial Insurance Corp. A A- – –Northbridge General Insurance Corp. A A- A3 –Northbridge Indemnity Insurance Corp. A A- – –Federated Insurance Company of Canada A A- – –Wentworth Insurance Company Ltd. A- – – –First Capital Insurance Limited A – – –Falcon Insurance Company (Hong Kong) Limited – A- – –Advent Capital (Holdings) PLC(2) A A+ – –Polish Re A- BBB+ – –
(1) Financial strength ratings apply to the operating companies.
(2) Advent’s ratings are the A.M. Best and Standard & Poor’s ratings assigned to Lloyd’s.
During 2014 Moody’s revised Zenith National from an ‘‘A3’’ at December 31, 2013 to a ‘‘Baa1’’ at December 31, 2014.Moody’s attributed the revision to Zenith National’s elevated underwriting leverage relative to its concentration inthe workers’ compensation business and its exposure to potential earnings volatility associated with its commonstock portfolio.
Book Value Per Share
Common shareholders’ equity at December 31, 2014 of $8,361.0 or $394.83 per basic share (excluding theunrecorded $830.5 excess of fair value over the carrying value of investments in associates and certain consolidatedsubsidiaries) compared to $7,186.7 or $339.00 per basic share (excluding the unrecorded $534.4 excess of fair valueover the carrying value of investments in associates and certain consolidated subsidiaries) at December 31, 2013,representing an increase per basic share in 2014 of 16.5% (without adjustment for the $10.00 per common sharedividend paid in the first quarter of 2014, or an increase of 19.5% adjusted to include that dividend). During 2014 thenumber of basic shares decreased primarily as a result of the repurchase of 23,826 subordinate voting shares fortreasury (for use in the company’s share-based payment awards). At December 31, 2014 there were21,176,168 common shares effectively outstanding.
The company has issued and repurchased common shares in the most recent five years as follows:
Number of Averagesubordinate issue/repurchase Net proceeds/
Date voting shares price per share (repurchase cost)
2010 – issuance of shares 563,381 354.64 199.82010 – repurchase of shares (43,900) 382.69 (16.8)2011 – repurchase of shares (25,700) 389.11 (10.0)2013 – issuance of shares 1,000,000 399.49 399.52013 – repurchase of shares (36) 402.78 –2014 – repurchase of shares (8) 430.98 –
On September 26, 2014 the company commenced its normal course issuer bid by which it is authorized, until expiryof the bid on September 25, 2015, to acquire up to 800,000 subordinate voting shares, representing approximately3.9% of the public float in respect of the subordinate voting shares. Decisions regarding any future repurchases willbe based on market conditions, share price and other factors including opportunities to invest capital for growth. TheNotice of Intention to Make a Normal Course Issuer Bid is available by contacting the Corporate Secretary ofthe company.
190
Share issuances in 2010 and 2013 were pursuant to public offerings. During 2014 and 2013 the company did notrepurchase for cancellation any subordinate voting shares under the terms of normal course issuer bids. During 2014the company repurchased 8 shares (2013 – 36 shares) for cancellation from former employees.
Fairfax’s indirect ownership of its own shares through The Sixty Two Investment Company Limited results in aneffective reduction of shares outstanding by 799,230, and this reduction has been reflected in the earnings per shareand book value per share figures.
The table below presents the excess of fair value over carrying value of investments in associates and certainsubsidiaries the company considers to be portfolio investments but that are required to be consolidated under IFRS.The excess of fair value over carrying value of these investments is not included in the calculation of book valueper share.
December 31, 2014 December 31, 2013
Excess of Excess offair value fair value
over overCarrying carrying Fair Carrying carrying
Fair value value(1) value value value(1) value
Insurance and reinsurance associates 673.3 439.6 233.7 641.1 390.6 250.5Non-insurance associates 1,397.2 1,178.1 219.1 1,173.9 1,041.9 132.0Ridley 245.8 71.4 174.4 130.7 69.5 61.2Thomas Cook India 472.8 269.5 203.3 253.3 162.6 90.7
2,789.1 1,958.6 830.5 2,199.0 1,664.6 534.4
(1) The carrying values of Ridley and Thomas Cook India represent their respective values under the equity methodof accounting.
Liquidity
Holding company cash and investments at December 31, 2014 totaled $1,244.3 ($1,212.7 net of $31.6 of holdingcompany short sale and derivative obligations) compared to $1,296.7 at December 31, 2013 ($1,241.6 net of $55.1 ofholding company short sale and derivative obligations).
Significant cash and investment movements at the Fairfax holding company level during 2014 included thefollowing outflows: the payment of $272.6 of common and preferred share dividends, the payment of $158.1 ofinterest on long term debt, the payment of $113.4 of net cash with respect to the reset provisions of long and shortequity and equity index total return swaps (excluding the impact of collateral requirements), the funding for theredemptions of OdysseyRe Series B unsecured senior notes due 2016 and American Safety trust preferred securitiesdue 2035 ($50.0 and $25.0 principal amounts respectively), cash purchase consideration of $28.6 (A21.0 million) and$88.7 (Cdn$100.4) related to the acquisitions of Praktiker and Pethealth respectively and intra-group and capitaltransactions (inclusive of those related to the OdysseyRe reorganization as described in the ‘‘Business Developments’’section of this MD&A). Significant inflows during 2014 included the following: net proceeds of $294.2 from theissuance of $300.0 principal amount of 4.875% senior notes due August 13, 2024, the receipt of corporate income taxrefunds ($106.4) and the receipt of dividends from subsidiaries (primarily OdysseyRe (ordinary dividends of $225.0and an extraordinary dividend of $100.0), Crum & Forster ($150.0), Zenith National ($50.0) and Runoff ($60.4)).Dividends of $150.0 and $100.0 paid by Crum & Forster and OdysseyRe respectively were to facilitate the OdysseyRereorganization. The carrying value of holding company cash and investments was also affected by the following:receipt of investment management and administration fees, disbursements associated with corporate overheadexpenses and costs in connection with the repurchase of subordinate voting shares for treasury. The carrying valuesof holding company investments vary with changes in the fair values of those investments.
The company believes that holding company cash and investments, net of holding company short sale andderivative obligations at December 31, 2014 of $1,212.7 provides adequate liquidity to meet the holding company’sknown obligations in 2015. The holding company expects to continue to receive investment management andadministration fees from its insurance and reinsurance subsidiaries, investment income on its holdings of cash andinvestments, and dividends from its insurance and reinsurance subsidiaries. To further augment its liquidity, theholding company can draw upon its $300.0 unsecured revolving credit facility (for further details related to the credit
191
FAIRFAX FINANCIAL HOLDINGS LIMITED
facility, refer to note 15 (Subsidiary Indebtedness, Long Term Debt and Credit Facilities) to the consolidated financialstatements for the year ended December 31, 2014). The holding company’s known significant commitments for2015 consist of the funding of the Brit Offer ($1.88 billion (£1.22 billion)), payment of the $216.1 ($10.00 per share)dividend on common shares (paid January 2015), interest and corporate overhead expenses, preferred sharedividends, income tax payments and potential cash outflows related to derivative contracts (described below). Thenet proceeds from underwritten public offerings of 1.15 million subordinate voting shares ($575.9 (Cdn$717.1)),9.2 million Series M preferred shares ($179.0 (Cdn$222.9)) and Cdn$350.0 of 4.95% Fairfax senior notes due 2025($275.7), all of which closed on March 3, 2015, will be used to finance the Brit Offer. The offerings are described inmore detail in notes 15 (Subsidiary Indebtedness, Long Term Debt and Credit Facilities) and 16 (Total Equity) to theconsolidated financial statements for the year ended December 31, 2014.
The company used a portion of the net proceeds received from the August 13, 2014 private debt offering of $300.0principal amount of 4.875% senior notes due 2024 to fund the redemption in the fourth quarter of 2014 of the $50.0principal amount of OdysseyRe Series B unsecured senior notes due 2016 and the $25.0 principal amount ofAmerican Safety trust preferred securities due 2035 and disclosed that it intends to use the remaining net proceeds tofund the repayment, upon maturity, of the Fairfax ($82.4) and OdysseyRe ($125.0) unsecured senior notes duein 2015.
The holding company may experience cash inflows or outflows (which at times could be significant) related to itsderivative contracts, including collateral requirements and cash settlements of market value movements of totalreturn swaps which have occurred since the most recent reset date. During 2014 the holding company paid net cashof $113.4 (2013 – $67.8) in connection with long and short equity and equity index total return swap derivativecontracts (excluding the impact of collateral requirements).
During 2014 subsidiary cash and short term investments (including cash and short term investments pledged forshort sale and derivative obligations) decreased by $1,741.3 primarily reflecting cash used to fund net purchases ofother government bonds and other common stocks, net settlements of long and short equity and equity index totalreturn swaps in accordance with their reset provisions, acquisitions of certain investments in associates (net ofdispositions) and to enter into CPI-linked derivative contracts and the unfavourable impact of foreign currencytranslation (principally the strengthening of the U.S. dollar relative to the Canadian dollar), partially offset by cashprovided by operating activities. The insurance and reinsurance subsidiaries may experience cash inflows or outflows(which at times could be significant) related to their derivative contracts including collateral requirements and cashsettlements of market value movements of total return swaps which have occurred since the most recent reset date.During 2014 the insurance and reinsurance subsidiaries paid net cash of $194.2 (2013 – $1,615.4) in connection withlong and short equity and equity index total return swap derivative contracts (excluding the impact of collateralrequirements). The insurance and reinsurance subsidiaries typically fund any such obligations from cash provided byoperating activities. In addition, obligations incurred on short equity and equity index total return swaps may befunded from sales of equity-related investments, the market values of which will generally vary inversely with themarket values of the short equity and equity index total return swaps.
192
The following table presents major components of cash flow for the years ended December 31, 2014 and 2013:
2014 2013
Operating activitiesCash provided by (used in) operating activities before the undernoted 519.8 (188.4)Net (purchases) sales of securities classified as at FVTPL (590.0) 895.7
Investing activitiesNet (purchases) sales of investments in associates and joint ventures (138.1) 125.8Net purchase of subsidiaries, net of cash acquired (189.9) 136.3Net purchases of premises and equipment and intangible assets (67.1) (48.1)
Financing activitiesNet (repayment) issuances of subsidiary indebtedness 17.4 (31.0)Issuance of long term debt 294.2 278.1Repurchase of holding company and subsidiary debt and securities (90.1) (251.2)Issuance of subordinate voting shares – 399.5Repurchase of preferred shares (1.2) –Purchase of subordinate voting shares for treasury (24.6) (25.7)Issuance of subsidiary common shares to non-controlling interests – 32.9Common and preferred share dividends paid (272.6) (266.3)Dividends paid to non-controlling interests (6.6) (6.4)
Increase (decrease) in cash, cash equivalents and bank overdrafts during the year (548.8) 1,051.2
Cash provided by operating activities (excluding net (purchases) sales of securities classified as at FVTPL) was $519.8in 2014 compared to cash used in operating activities of $188.4 in 2013 reflecting lower net paid losses and highernet premiums collected, partially offset by higher income taxes paid. Refer to note 28 (Supplementary Cash FlowInformation) to the consolidated financial statements for the year ended December 31, 2014 for details of net(purchases) sales of securities classified as at FVTPL.
Net purchases of investments in associates and joint ventures of $138.1 in 2014 primarily reflected investments inAgriCo and Sterling Resorts and additional investments in Grivalia Properties and Thai Re, partially offset by the saleof the company’s investments in MEGA Brands and two KWF LPs. Net sales of investments in associates and jointventures of $125.8 in 2013 primarily reflected the sales of the company’s investments in The Brick, Imvescor and aprivate company, partially offset by additional investments in MEGA Brands and Resolute. Net purchases ofsubsidiaries, net of cash acquired of $189.9 in 2014 primarily related to the acquisition of a 51.0% interest in The Keg,the acquisitions of Praktiker and Pethealth, and the additional controlling interest in Sterling Resorts. Net purchasesof subsidiaries, net of cash acquired of $136.3 in 2013 primarily related to the acquisition of a 58.0% economicinterest in IKYA and the acquisitions of American Safety and Hartville.
Net repayment (issuance) of subsidiary indebtedness in 2014 and 2013 primarily reflected advances and repaymentsof the subsidiary indebtedness of Ridley, IKYA and Thomas Cook India in the normal course of business. Issuance oflong term debt of $294.2 in 2014 reflected net proceeds from the issuance of $300.0 principal amount of Fairfax(US) Inc. 4.875% senior notes due August 13, 2024. Issuance of long term debt of $278.1 in 2013 reflected netproceeds from the issuance of Cdn$250.0 principal amount of Fairfax 5.84% unsecured senior notes due 2022 for netproceeds of $259.9 (Cdn$258.1) and net proceeds received by Thomas Cook India following the issuance of $18.3(1 billion Indian rupees) principal amount of its debentures due 2018. Repurchase of holding company andsubsidiary debt and securities of $90.1 in 2014 primarily reflected the redemption of $50.0 principal amount ofOdysseyRe Series B unsecured senior notes due 2016, the redemption of $25.0 principal amount of American Safetytrust preferred securities due 2035 and the repurchase of $7.0 principal amount of holding company trust preferredsecurities due 2027. Repurchase of holding company and subsidiary debt and securities of $251.2 in 2013 primarilyreflected the repayment of $182.9 principal amount of the OdysseyRe unsecured senior notes upon maturity, therepurchase and redemption of $48.4 principal amount of Fairfax unsecured senior notes due 2017, and theredemption of $13.0 principal amount of American Safety’s trust preferred securities. Issuance of subordinate votingshares of $399.5 (Cdn$417.1) related to the issuance of 1 million subordinate voting shares on November 15, 2013.Issuance of subsidiary common shares to non-controlling interests of $32.9 in 2013 reflected the private placementof Thomas Cook India common shares with qualified institutional buyers to partially fund the acquisition of IKYA.
193
FAIRFAX FINANCIAL HOLDINGS LIMITED
The company paid preferred share dividends of $56.9 in 2014 (2013 – $60.8). The company paid common sharedividends of $215.7 in 2014 (2013 – $205.5).
Contractual Obligations
The following table provides a payment schedule of the company’s significant current and future obligations(holding company and subsidiaries) as at December 31, 2014:
Less than More than1 year 1-3 years 3-5 years 5 years Total
Provision for losses and loss adjustment expenses 4,295.6 5,462.7 3,658.1 4,332.7 17,749.1Long term debt obligations – principal 216.7 175.2 494.7 2,270.1 3,156.7Long term debt obligations – interest 208.6 371.1 328.3 589.3 1,497.3Operating leases – obligations 98.6 162.5 132.0 195.0 588.1
4,819.5 6,171.5 4,613.1 7,387.1 22,991.2
For further detail on the maturity profile of the company’s financial liabilities, please see the heading Liquidity Riskin note 24 (Financial Risk Management) to the consolidated financial statements for the year endedDecember 31, 2014.
Contingencies and Commitments
For a full description of these matters, please see note 20 (Contingencies and Commitments) to the consolidatedfinancial statements for the year ended December 31, 2014.
Accounting and Disclosure Matters
Management’s Evaluation of Disclosure Controls and Procedures
Under the supervision and with the participation of the company’s management, including the company’s CEO andCFO, the company conducted an evaluation of the effectiveness of its disclosure controls and procedures as ofDecember 31, 2014, as required by Canadian securities legislation. Disclosure controls and procedures are designedto ensure that the information required to be disclosed by the company in the reports it files or submits undersecurities legislation is recorded, processed, summarized and reported on a timely basis and that such information isaccumulated and reported to management, including the company’s CEO and CFO, as appropriate, to allow requireddisclosures to be made in a timely fashion. Based on their evaluation, the CEO and CFO have concluded that as ofDecember 31, 2014, the company’s disclosure controls and procedures were effective.
Management’s Report on Internal Control Over Financial Reporting
The company’s management is responsible for establishing and maintaining adequate internal control over financialreporting (as defined in Rule 13a-15(f) under the Securities Exchange Act of 1934 and under NationalInstrument 52-109). The company’s internal control over financial reporting is a process designed to providereasonable assurance regarding the reliability of financial reporting and the preparation of financial statements forexternal purposes in accordance with International Financial Reporting Standards as issued by the InternationalAccounting Standards Board. A company’s internal control over financial reporting includes those policies andprocedures that (i) pertain to the maintenance of records that, in reasonable detail, accurately and fairly reflect thetransactions and dispositions of the assets of the company; (ii) provide reasonable assurance that transactions arerecorded as necessary to permit preparation of financial statements in accordance with generally acceptedaccounting principles, and that receipts and expenditures of the company are being made only in accordance withauthorizations of management and directors of the company; and (iii) provide reasonable assurance regardingprevention or timely detection of unauthorized acquisition, use, or disposition of the company’s assets that couldhave a material effect on the financial statements.
Because of its inherent limitations, internal control over financial reporting may not prevent or detectmisstatements. Also, projections of any evaluation of effectiveness to future periods are subject to the risk thatcontrols may become inadequate because of changes in conditions, or that the degree of compliance with thepolicies or procedures may deteriorate.
194
The company’s management assessed the effectiveness of the company’s internal control over financial reporting asof December 31, 2014. In making this assessment, the company’s management used the criteria set forth by theCommittee of Sponsoring Organizations of the Treadway Commission (‘‘COSO’’) in Internal Control – IntegratedFramework (2013). The company’s management, including the CEO and CFO, concluded that, as of December 31,2014, the company’s internal control over financial reporting was effective based on the criteria in Internal Control –Integrated Framework (2013) issued by COSO.
Pursuant to the requirements of the U.S. Securities Exchange Act, the effectiveness of the company’s internal controlover financial reporting as of December 31, 2014, has been audited by PricewaterhouseCoopers LLP, an independentauditor, as stated in its report which appears within this Annual Report.
Critical Accounting Estimates and Judgments
Please refer to note 4 (Critical Accounting Estimates and Judgments) to the consolidated financial statements for theyear ended December 31, 2014.
Significant Accounting Changes
There were no significant accounting changes during 2014. Please refer to note 3 (Summary of SignificantAccounting Policies) to the consolidated financial statements for the year ended December 31, 2014 for a detaileddiscussion of the company’s accounting policies.
Future Accounting Changes
Many IFRS are currently undergoing modification or are yet to be issued for the first time. Future standards expectedto have an impact on the company’s consolidated financial reporting are discussed below. New standards andamendments that have been issued but are not yet effective are described in note 3 (Summary of SignificantAccounting Policies) to the consolidated financial statements for the year ended December 31, 2014.
Insurance contracts
The Exposure Draft – Insurance Contracts was issued by the IASB on July 30, 2010 and a revised exposure draft waspublished in June of 2013. The proposed standard is comprehensive in scope and addresses recognition,measurement, presentation and disclosure for insurance contracts. The measurement approach is based on thefollowing building blocks: (i) a current, unbiased probability-weighted estimate of future cash flows expected to ariseas the insurer fulfills the contract; (ii) the effect of the time value of money; (iii) a risk adjustment that measures theeffects of uncertainty about the amount and timing of future cash flows; and (iv) a contractual service margin whichrepresents the unearned profit in a contract (that is recognized in net earnings as the insurer fulfills its performanceobligations under the contract). Estimates are required to be re-measured each reporting period. In addition, asimplified measurement approach is permitted for short-duration contracts in which the coverage period isapproximately one year or less. The publication date of the final standard is yet to be determined, with an effectivedate expected to be no earlier than January 1, 2019. Retrospective application will be required with some practicalexpedients available on adoption. The company has commenced evaluating the impact of the exposure draft on itsfinancial reporting, and potentially, its business activities. The building block approach and the need for currentestimates could significantly increase operational complexity compared to existing practice. The use of differentmeasurement models depending on whether an insurance contract is considered short-duration or long-durationunder the exposure draft presents certain implementation challenges and the proposed presentation requirementssignificantly alter the disclosure of profit and loss from insurance contracts in the consolidated financial statements.
Leases
The IASB together with the FASB is developing a new accounting standard for leases, impacting both lessees andlessors. On August 17, 2010 the IASB issued an Exposure Draft – Leases that proposes to largely eliminate thedistinction between operating and capital leases. A revised Exposure Draft was published in May of 2013. Under theproposed standard a lessee would be required to recognize a right-of-use asset and a liability for its obligation to makelease payments while a lessor would derecognize the underlying asset and replace it with a lease receivable andresidual asset. The final standard is expected to be published during the second half of 2015, with an effective dateyet to be determined. However, the proposed standard is expected to apply to all leases in force at the effective date.
195
FAIRFAX FINANCIAL HOLDINGS LIMITED
The company has commenced a preliminary assessment of the impact of this proposed standard on its leasecommitments.
Risk Management
Overview
The primary goals of the company’s financial risk management are to ensure that the outcomes of activitiesinvolving elements of risk are consistent with the company’s objectives and risk tolerance, while maintaining anappropriate balance between risk and reward and protecting the company’s consolidated balance sheet from eventsthat have the potential to materially impair its financial strength. The company’s exposure to potential loss from itsinsurance and reinsurance operations and investment activities primarily relates to underwriting risk, credit risk,liquidity risk and various market risks. Balancing risk and reward is achieved through identifying risk appropriately,aligning risk tolerances with business strategy, diversifying risk, pricing appropriately for risk, mitigating riskthrough preventive controls and transferring risk to third parties.
Financial risk management objectives are achieved through a two tiered system, with detailed risk managementprocesses and procedures at the company’s primary operating subsidiaries and its investment managementsubsidiary combined with the analysis of the company-wide aggregation and accumulation of risks at the holdingcompany level. In addition, although the company and its operating subsidiaries have designated Chief RiskOfficers, the company regards each Chief Executive Officer as the chief risk officer of his or her company: each ChiefExecutive Officer is the individual ultimately responsible for risk management for his or her company and itssubsidiaries.
The company’s designated Chief Risk Officer reports on risk considerations to Fairfax’s Executive Committee andprovides a quarterly report to the Board of Directors on the key risk exposures. Management of Fairfax inconsultation with the designated Chief Risk Officer approves certain policies for overall risk management, as well aspolicies addressing specific areas such as investments, underwriting, catastrophe risk and reinsurance. TheInvestment Committee approves policies for the management of market risk (including currency risk, interest raterisk and other price risk) and the use of derivative and non-derivative financial instruments, and monitors to ensurecompliance with relevant regulatory guidelines and requirements. A discussion of the risks of the business (the riskfactors and the management of those risks) is an agenda item for every regularly scheduled meeting of the Boardof Directors.
Issues and Risks
The following issues and risks, among others, should be considered in evaluating the outlook of the company. Forfurther detail about the issues and risks relating to the company, please see Risk Factors in Fairfax’s most recent ShortForm Base Shelf Prospectus and Supplements filed with the securities regulatory authorities in Canada, which areavailable on SEDAR at www.sedar.com.
Claims Reserves
Reserves are maintained to cover the estimated ultimate unpaid liability for losses and loss adjustment expenses withrespect to reported and unreported claims incurred as of the end of each accounting period. The company’s success isdependent upon its ability to accurately assess the risks associated with the businesses being insured or reinsured.Failure to accurately assess the risks assumed may lead to the setting of inappropriate premium rates and establishingreserves that are inadequate to cover losses. This could adversely affect the company’s net earnings and financialcondition.
Reserves do not represent an exact calculation of liability, but instead represent estimates at a given point in timeinvolving actuarial and statistical projections of the company’s expectations of the ultimate settlement andadministration costs of claims incurred. Establishing an appropriate level of claims reserves is an inherentlyuncertain process. Both proprietary and commercially available actuarial models, as well as historical insuranceindustry loss development patterns, are utilized in the establishment of appropriate claims reserves. The company’smanagement of pricing risk is discussed in note 24 (Financial Risk Management), and management of claims reservesis discussed in note 4 (Critical Accounting Estimates and Judgments) and note 8 (Insurance Contract Liabilities), tothe consolidated financial statements for the year ended December 31, 2014.
196
Catastrophe Exposure
The company’s insurance and reinsurance operations are exposed to claims arising out of catastrophes. Catastrophescan be caused by various events, including natural events such as hurricanes, windstorms, earthquakes, hailstorms,severe winter weather and fires, and unnatural events such as terrorist attacks and riots. The incidence and severity ofcatastrophes are inherently unpredictable.
The extent of losses from a catastrophe is a function of both the total amount of insured exposure in the area affectedby the event and the severity of the event. Most catastrophes are restricted to small geographic areas; however,hurricanes, windstorms and earthquakes may produce significant damage in large, heavily populated areas.Catastrophes can cause losses in a variety of property and casualty lines, including losses relating to businessinterruptions occurring in the same geographic area as the catastrophic event or in the other geographic areas. It ispossible that a catastrophic event or multiple catastrophic events could have a material adverse effect upon thecompany’s net earnings and financial condition. The company believes that increases in the value and geographicconcentration of insured property, higher construction costs due to labour and raw material shortages following asignificant catastrophe event, and climate change could increase the severity of claims from catastrophic events inthe future. The company’s management of catastrophe risk is discussed in note 24 (Financial Risk Management) tothe consolidated financial statements for the year ended December 31, 2014.
Cyclical Nature of the Property & Casualty Business
The financial performance of the insurance and reinsurance industries has historically tended to fluctuate due tocompetition, frequency of occurrence or severity of catastrophic events, levels of capacity, general economicconditions and other factors. Demand for insurance and reinsurance is influenced significantly by underwritingresults of primary insurers and prevailing general economic conditions. Factors such as changes in the level ofemployment, wages, consumer spending, business investment and government spending, the volatility andstrength of the global capital markets and inflation or deflation all affect the business and economic environmentand, ultimately, the demand for insurance and reinsurance products, and therefore may affect the company’s netearnings, financial position or cash flows.
The property and casualty insurance business historically has been characterized by periods of intense pricecompetition due to excess underwriting capacity, as well as periods when shortages of underwriting capacity havepermitted attractive premium levels. The company expects to continue to experience the effects of this cyclicality,which, during down periods, could harm its financial position, profitability or cash flows.
In the reinsurance industry, the supply of reinsurance is related to prevailing prices and levels of surplus capacitythat, in turn, may fluctuate in response to changes in rates of return being realized. It is possible that premium ratesor other terms and conditions of trade could vary in the future, that the present level of demand will not continuebecause insurers, including the larger insurers created by industry consolidation, may require less reinsurance or thatthe present level of supply of reinsurance could increase as a result of capital provided by existing reinsurers oralternative forms of reinsurance capacity entering the market from recent or future market entrants. If any of theseevents transpire, the company’s results of operations in its reinsurance business could be adversely affected.
The company actively manages its operations to withstand the cyclical nature of the property and casualty businessby maintaining sound liquidity and strong capital management as discussed in note 24 (Financial Risk Management)to the consolidated financial statements for the year ended December 31, 2014.
Investment Portfolio
Investment returns are an important part of the company’s overall profitability as the company’s operating resultsdepend in part on the performance of its investment portfolio. The company’s investment portfolio includes bondsand other debt instruments, common stocks, preferred stocks, equity-related securities and derivative instruments.Accordingly, fluctuations in the fixed income or equity markets could impair profitability, financial condition orcash flows. Investment income is derived from interest and dividends, together with net gains or losses oninvestments. The portion derived from net gains or losses on investments generally fluctuates from year to year andis typically a less predictable source of investment income than interest and dividends, particularly in the short term.The return on the portfolio and the risks associated with the investments are affected by the asset mix, which canchange materially depending on market conditions.
197
FAIRFAX FINANCIAL HOLDINGS LIMITED
The ability of the company to achieve its investment objectives is affected by general economic conditions that arebeyond its control. General economic conditions can adversely affect the markets for interest-rate-sensitivesecurities, including the extent and timing of investor participation in such markets, the level and volatility ofinterest rates and, consequently, the value of fixed income securities. Interest rates are highly sensitive to manyfactors, including governmental monetary policies, domestic and international economic and political conditionsand other factors beyond the company’s control. General economic conditions, stock market conditions and manyother factors can also adversely affect the equity markets and, consequently, the value of the equities owned. Inaddition, defaults by third parties who fail to pay or perform on their obligations could reduce the company’sinvestment income and net gains on investment or result in investment losses. The company’s management of creditrisk, liquidity risk, market risk and interest rate risk is discussed in note 24 (Financial Risk Management) to theconsolidated financial statements for the year ended December 31, 2014.
Derivative Instruments
The company may hold significant investments in derivative instruments, primarily for general protection againstdeclines in the fair value of the company’s financial assets. Derivative instruments may be used to manage or reducerisks or as a cost-effective way to synthetically replicate the investment characteristics of an otherwise permittedinvestment. The market value and liquidity of these investments are volatile or extremely volatile and may varydramatically up or down in short periods, and their ultimate value will therefore only be known upon theirdisposition or settlement.
Use of derivative instruments is governed by the company’s investment policies and exposes the company to anumber of risks, including credit risk, interest rate risk, liquidity risk, inflation risk, market risk and counterparty risk.The company endeavors to limit counterparty risk through the terms of agreements negotiated with counterparties.Pursuant to these agreements, both parties are required to deposit eligible collateral in collateral accounts for eitherthe benefit of the company or the counterparty depending on the then current fair value or change in the fair valueof the derivative contract.
The company may not be able to realize its investment objectives with respect to derivative instruments, whichcould reduce net earnings significantly and adversely affect the company’s business, financial position or results ofoperations. The company’s use of derivatives is discussed in note 7 (Short Sales and Derivatives) and management ofcredit risk, liquidity risk, market risk and interest rate risk is discussed in note 24 (Financial Risk Management) to theconsolidated financial statements for the year ended December 31, 2014.
Economic Hedging Strategies
The company may use derivative instruments to manage or reduce its exposure to credit risk and various marketrisks, including interest rate risk, equity market risk, inflation/deflation risk and foreign currency risk. Hedgingstrategies may be implemented by the company to hedge risks associated with a specific financial instrument, assetor liability or at a macro level to hedge systemic financial risk and the impact of potential future economic crisis andcredit related problems on its operations and the value of its financial assets. Credit default swaps, total return swapsand consumer price index-linked derivative instruments have typically been used to hedge macro level risks. Thecompany’s use of derivatives is discussed in note 7 (Short Sales and Derivatives) to the consolidated financialstatements for the year ended December 31, 2014.
The company’s derivative instruments may expose it to basis risk, counterparty risk, credit risk and liquidity risk,notwithstanding that the company’s principal use of derivative instruments is to hedge exposures to various risks.Basis risk is the risk that the fair value or cash flows of derivative instruments designated as economic hedges will notexperience changes in exactly the opposite directions from those of the underlying hedged exposure. This imperfectcorrelation between the derivative instrument and underlying hedged exposure creates the potential for excess gainsor losses in a hedging strategy which may adversely impact the net effectiveness of the hedge and may diminish thefinancial viability of maintaining the hedging strategy and therefore adversely impact the company’s financialcondition and results of operations.
The company regularly monitors the effectiveness of its hedging program on a prospective and retrospective basisand based on its historical observation, the company believes that its hedges will be reasonably effective in themedium to long term and especially in the event of a significant market correction. The management of basis risk isalso discussed in note 24 (Financial Risk Management) to the consolidated financial statements for the year endedDecember 31, 2014.
198
Latent Claims
The company has established loss reserves for asbestos, environmental and other latent claims that represent its bestestimate of ultimate claims and claims adjustment expenses based upon known facts and current law. As a result ofsignificant issues surrounding liabilities of insurers, risks inherent in major litigation and diverging legalinterpretations and judgments in different jurisdictions, actual liability for these types of claims could exceed the lossreserves set by the company by an amount that could be material to its operating results and financial condition infuture periods.
As a result of tort reform, both legislative and judicial, there has been a decrease in mass asbestos plaintiff screeningefforts over the past few years and a decline in the number of unimpaired plaintiffs filing claims. The majority ofclaims now being filed and litigated continues to relate to mesothelioma, lung cancer or impaired asbestosis cases.This reduction in new filings has focused the litigants on the more seriously injured plaintiffs. While initially therewas a concern that such a focus would exponentially increase the settlement value of asbestos cases involvingmalignancies, this has not been the case. Expense has increased somewhat as a result of this trend, however,primarily due to the fact that the malignancy cases are often more heavily litigated than the non-malignancy cases.
Similarly, as a result of various regulatory efforts aimed at environmental remediation, the company, and its peers inthe insurance industry, continue to be involved in litigation involving policy coverage and liability issues withrespect to environmental claims. In addition to regulatory pressures, the results of court decisions affecting theindustry’s coverage positions continue to be inconsistent and have expanded coverage beyond its original intent.Accordingly, the ultimate responsibility and liability for environmental remediation costs remains uncertain. Inaddition to asbestos and environmental pollution, the company faces exposure to other types of mass tort or healthhazard claims, including claims related to exposure to potentially harmful products or substances, such as breastimplants, pharmaceutical products, chemical products, lead-based pigments, tobacco, hepatitis C, head trauma andin utero exposure to diethylstilbestrol (‘‘DES’’). Tobacco, although a significant potential risk to the company, hasnot presented significant actual exposure to date.
The company’s management of reserving risk is discussed in note 24 (Financial Risk Management) and in note 8(Insurance Contract Liabilities) to the consolidated financial statements for the year ended December 31, 2014 andin the Asbestos and Pollution section of this MD&A.
Recoverable from Reinsurers and Insureds
Most insurance and reinsurance companies reduce their exposure to any individual claim by reinsuring amounts inexcess of their maximum desired retention. Reinsurance is an arrangement in which an insurance company, calledthe ceding company, transfers insurance risk to another insurer, called the reinsurer, which accepts the risk in returnfor a premium payment. This third party reinsurance does not relieve the company of its primary obligation to theinsured. Recoverable from reinsurers balances may become an issue mainly due to reinsurer solvency and creditconcerns, due to the potentially long time period over which claims may be paid and the resulting recoveries arereceived from the reinsurers, or due to policy disputes. If reinsurers are unwilling or unable to pay amounts due underreinsurance contracts, the company will incur unexpected losses and its cash flow will be adversely affected. Thecredit risk associated with the company’s reinsurance recoverable balances is addressed in note 24 (Financial RiskManagement) to the consolidated financial statements for the year ended December 31, 2014 and in the Recoverablefrom Reinsurers section of this MD&A.
The company’s insurance and reinsurance companies write certain insurance policies, such as large deductiblepolicies (policies where the insured retains a specific amount of any potential loss), in which the insured mustreimburse the company’s insurance and reinsurance companies for certain losses. Accordingly, the company’sinsurance and reinsurance companies bear credit risk on these policies as there is no assurance that the insureds willprovide reimbursement on a timely basis or at all.
Acquisitions and Divestitures
The company may periodically and opportunistically acquire other insurance and reinsurance companies or executeother strategic initiatives developed by management. Although the company undertakes due diligence prior to thecompletion of an acquisition, it is possible that unanticipated factors could arise and there is no assurance that theanticipated financial or strategic objectives following an integration effort or the implementation of a strategicinitiative will be achieved which could adversely affect the company’s net earnings and financial position.
199
FAIRFAX FINANCIAL HOLDINGS LIMITED
The strategies and performance of operating companies, and the alignment of those strategies throughout theorganization, are regularly assessed through various processes involving senior management and the company’sBoard of Directors.
Ratings
Financial strength and credit ratings by the major North American rating agencies are important factors inestablishing competitive position for insurance and reinsurance companies. The claims-paying ability ratingsassigned by rating agencies to reinsurance or insurance companies represent independent opinions of financialstrength and ability to meet policyholder obligations. A downgrade in these ratings could lead to a significantreduction in the number of insurance policies the company’s insurance subsidiaries write and could cause earlytermination of contracts written by the company’s reinsurance subsidiaries or a requirement for them to postcollateral at the direction of their counterparts. In addition, a downgrade of the company’s credit rating may affectthe cost and availability of unsecured financing. Ratings are subject to periodic review at the discretion of eachrespective rating agency and may be revised downward or revoked at their sole discretion. Rating agencies may alsoincrease their scrutiny of rated companies, revise their rating standards or take other action. The company hasdedicated personnel that manage the company’s relationships with its various rating agencies.
Competition
The property and casualty insurance industry and the reinsurance industry are both highly competitive, and willlikely remain highly competitive in the foreseeable future. Competition in these industries is based on many factors,including premiums charged and other terms and conditions offered, products and services provided, commissionstructure, financial ratings assigned by independent rating agencies, speed of claims payment, reputation, sellingeffort, perceived financial strength and the experience of the insurer or reinsurer in the line of insurance orreinsurance to be written. The company competes with a large number of Canadian, U.S. and foreign insurers andreinsurers, as well as certain underwriting syndicates, some of which have greater financial, marketing andmanagement resources than the company. In addition, some financial institutions, such as banks, are now able tooffer services similar to those offered by the company’s reinsurance subsidiaries while in recent years, capital marketparticipants have also created alternative products that are intended to compete with reinsurance products.
Consolidation within the insurance industry could result in insurance and reinsurance market participants usingtheir market power to implement price reductions. If competitive pressures compel the company to reduce its prices,the company’s operating margins could decrease. As the insurance industry consolidates, competition for customerscould become more intense and the importance of acquiring and properly servicing each customer could becomegreater, causing the company to incur greater expenses relating to customer acquisition and retention and furtherreducing operating margins. The company’s management of pricing risk is discussed in note 24 (Financial RiskManagement) to the consolidated financial statements for the year ended December 31, 2014.
Emerging Claim and Coverage Issues
The provision for claims is an estimate and may be found to be deficient, perhaps very significantly, in the future as aresult of unanticipated frequency or severity of claims or for a variety of other reasons including unpredictable juryverdicts, expansion of insurance coverage to include exposures not contemplated at the time of policy issue (as wasthe case with asbestos and pollution exposures) and extreme weather events. Unanticipated developments in the lawas well as changes in social and environmental conditions could result in unexpected claims for coverage underinsurance and reinsurance contracts. With respect to casualty lines of business, these legal, social and environmentalchanges may not become apparent until some time after their occurrence.
The full effects of these and other unforeseen emerging claim and coverage issues are extremely hard to predict. As aresult, the full extent of the company’s liability under its coverages, and in particular its casualty insurance policiesand reinsurance contracts, may not be known for many years after a policy or contract is issued. The company’sexposure to this uncertainty is greatest in its ‘‘long-tail’’ casualty businesses, because in these lines of business claimscan typically be made for many years, making them more susceptible to these trends than in the property insurancebusiness, which is more typically ‘‘short-tail’’.
The company seeks to limit its loss exposure by employing a variety of policy limits and other terms and conditionsand through prudent underwriting of each program written. Loss exposure is also limited by geographicdiversification. The company’s management of reserving risk is discussed in note 24 (Financial Risk Management)
200
and in note 8 (Insurance Contract Liabilities) to the consolidated financial statements for the year endedDecember 31, 2014 and in the Asbestos and Pollution section of this MD&A.
Cost of Reinsurance and Adequate Protection
The company uses reinsurance arrangements, including reinsurance of its own reinsurance business purchased fromother reinsurers, referred to as retrocessionaires, to help manage its exposure to property and casualty risks. Theavailability of reinsurance and the rates charged by reinsurers are subject to prevailing market conditions, both interms of price and available capacity, which can affect the company’s business volume and profitability. Manyreinsurance companies have begun to exclude certain coverages from, or alter terms in, the policies they offer.Reinsurers are also imposing terms, such as lower per occurrence and aggregate limits, on primary insurers that areinconsistent with corresponding terms in the policies written by these primary insurers. In the future, alleviation ofrisk through reinsurance arrangements may become increasingly difficult.
The rates charged by reinsurers and the availability of reinsurance to the company’s subsidiaries will generally reflectthe recent loss experience of the company and of the industry in general. For example, the significant hurricanelosses in 2004 and 2005 caused the prices for catastrophe reinsurance protection in Florida to increase significantly in2006. In 2011 the insurance industry experienced the second highest number of insured losses in history, primarilydue to numerous catastrophes. The significant catastrophe losses incurred by reinsurers worldwide resulted in highercosts for reinsurance protection in 2012. Currently there exists excess capital within the reinsurance market due tofavourable operating results of reinsurers and alternative forms of reinsurance capacity entering the market. As aresult, the market has become very competitive with prices decreasing for most lines of business, especially onproperty lines of business and most significantly on catastrophe-exposed business. Each of the company’ssubsidiaries continues to evaluate the relative costs and benefits of accepting more risk on a net basis, reducingexposure on a direct basis, and paying additional premiums for reinsurance.
Holding Company Liquidity
Fairfax is a holding company that conducts substantially all of its business through its subsidiaries and receivessubstantially all of its earnings from them. The holding company controls the operating insurance and reinsurancecompanies, each of which must comply with applicable insurance regulations of the jurisdictions in which itoperates. Each operating company must maintain reserves for losses and loss adjustment expenses to cover the risksit has underwritten.
Although substantially all of the holding company’s operations are conducted through its subsidiaries, none of itssubsidiaries are obligated to make funds available to the holding company for payment of its outstanding debt.Accordingly, the holding company’s ability to meet financial obligations, including the ability to make payments onoutstanding debt, is dependent on the distribution of earnings from its subsidiaries. The ability of subsidiaries to paydividends in the future will depend on their statutory surplus, on earnings and on regulatory restrictions. Dividends,distributions or returns of capital to the holding company are subject to restrictions set forth in the insurance lawsand regulations of Canada, the United States, the United Kingdom, Barbados, Poland, Hong Kong, Indonesia,Singapore, Malaysia and Brazil and is affected by the subsidiaries’ credit agreements, indentures, rating agencies, thediscretion of insurance regulatory authorities and capital support agreements with subsidiaries. The holdingcompany strives to be soundly financed and maintains high levels of liquid assets as discussed in note 24 (FinancialRisk Management) to the consolidated financial statements for the year ended December 31, 2014 and in theLiquidity section of this MD&A.
Access to Capital
The company’s future capital requirements depend on many factors, including its ability to successfully write newbusiness and to establish premium rates and reserves at levels sufficient to cover losses. To the extent that the fundsgenerated by the company’s business are insufficient to fund future operations, additional funds may need to beraised through equity or debt financings. If the company requires additional capital or liquidity but cannot obtain iton reasonable terms or at all, its business, operating results and financial condition would be materially adverselyaffected.
The company’s ability and/or the ability of its subsidiaries to obtain additional financing for working capital, capitalexpenditures or acquisitions in the future may also be limited under the terms of its credit facility discussed innote 15 (Subsidiary Indebtedness, Long Term Debt and Credit Facilities) to the consolidated financial statements for
201
FAIRFAX FINANCIAL HOLDINGS LIMITED
the year ended December 31, 2014. The credit facility contains various covenants that may restrict, among otherthings, the company’s ability or the ability of its subsidiaries to incur additional indebtedness, to create liens or otherencumbrances and to sell or otherwise dispose of assets and merge or consolidate with another entity. This risk ismitigated by maintaining high levels of liquid assets at the holding company. The company’s management ofliquidity risk is discussed further in note 24 (Financial Risk Management) to the consolidated financial statements forthe year ended December 31, 2014 and in the Liquidity section of this MD&A.
Key Employees
The company is substantially dependent on a small number of key employees, including its Chairman, ChiefExecutive Officer and significant shareholder, Mr. Prem Watsa, and the senior management of the company and itsoperating subsidiaries. The industry experience and reputations of these individuals are important factors in thecompany’s ability to attract new business. The company’s success has been, and will continue to be, dependent on itsability to retain the services of existing key employees and to attract and retain additional qualified personnel in thefuture. At the operating subsidiaries, employment agreements have been entered into with key employees. Thecompany does not currently maintain key employee insurance with respect to any of its employees.
Regulatory, Political and other Influences
The insurance and reinsurance industries are highly regulated and are subject to changing political, economic andregulatory influences. These factors affect the practices and operation of insurance and reinsurance organizations.Federal, state and provincial governments in the United States and Canada, as well as governments in foreignjurisdictions in which the company operates, have periodically considered programs to reform or amend theinsurance systems at both the federal and local levels. For example, regulatory capital guidelines may change for thecompany’s European operations due to Solvency II; the Dodd-Frank Act creates a new framework for regulation ofover-the-counter derivatives in the United States which could increase the cost of the company’s use of derivativesfor investment and hedging purposes; the activities of the International Association of Insurance Supervisors isexpected to lead to additional regulatory oversight of the company; and the Canadian and U.S. insurance regulators’Own Risk and Solvency Assessment (‘‘ORSA’’) initiatives will require the company’s North American operations toperform self-assessments of the capital available to support their business risks. Such changes could adversely affectthe financial results of the company’s subsidiaries, including their ability to pay dividends, cause unplannedmodifications of products or services, or result in delays or cancellations of sales of products and services by insurersor reinsurers. Insurance industry participants may respond to changes by reducing their investments or postponinginvestment decisions, including investments in the company’s products and services. The company’s managementof the risks associated with its capital within the various regulatory regimes in which it operates (CapitalManagement) is discussed in note 24 (Financial Risk Management) to the consolidated financial statements for theyear ended December 31, 2014 and in the Capital Resources and Management section of this MD&A.
Information Requests or Proceedings by Government Authorities
Each of the company’s insurance and reinsurance companies is subject to insurance legislation in the jurisdiction inwhich it operates. From time to time, the insurance industry has been subject to investigations, litigation andregulatory activity by various insurance, governmental and enforcement authorities, concerning certain practiceswithin the industry. From time to time, consumer advocacy groups or the media also focus attention on certaininsurance industry practices. The existence of information requests or proceedings by government authorities couldhave various adverse effects. The company’s internal and external legal counsels coordinate with operatingcompanies in responding to information requests and government proceedings.
Regional or Geographical Limitations and Risks
The company’s international operations are regulated in various jurisdictions with respect to licensing requirements,currency, amount and type of security deposits, amount and type of reserves, amount and type of local investmentand other matters. International operations and assets held abroad may be adversely affected by political and otherdevelopments in foreign countries, including possibilities of tax changes, nationalization and changes in regulatorypolicy, as well as by consequences of hostilities and unrest. The risks of such occurrences and their overall effect uponthe company vary from country to country and cannot easily be predicted.
202
The company regularly monitors for political and other changes in each country where it operates. The decentralizednature of the company’s operations permits quick adaptation to, or mitigation of, evolving regional risks.Furthermore, the company’s international operations are widespread and therefore not dependent on the economicstability of any one particular region.
Lawsuits
The company may, from time to time, become party to a variety of legal claims and regulatory proceedings. Theexistence of such claims against the company or its affiliates, directors or officers could have various adverse effects,including the incurrence of significant legal expenses defending claims, even those without merit.
Operating companies manage day-to-day regulatory and legal risk primarily by implementing appropriate policies,procedures and controls. Internal and external legal counsels also work closely with the operating companies toidentify and mitigate areas of potential regulatory and legal risk. The company’s legal and regulatory matters arediscussed in note 20 (Contingencies and Commitments) to the consolidated financial statements for the year endedDecember 31, 2014.
Significant Shareholder
The company’s Chairman and Chief Executive Officer, Mr. Prem Watsa, owns, directly or indirectly, or exercisescontrol or direction over shares representing 42.6% of the voting power of the company’s outstanding shares.Mr. Watsa has the ability to substantially influence certain actions requiring shareholder approval, includingapproving a business combination or consolidation, liquidation or sale of assets, electing members of the Board ofDirectors and adopting amendments to articles of incorporation and by-laws.
Foreign Exchange
The company’s reporting currency is the U.S. dollar. A portion of the company’s premiums and expenses aredenominated in foreign currencies and a portion of assets (including investments) and loss reserves are alsodenominated in foreign currencies. The company may, from time to time, experience losses resulting fromfluctuations in the values of foreign currencies (including when certain foreign currency assets and liabilities arehedged) which could adversely affect the company’s operating results. The company’s management of foreigncurrency risk is discussed in note 24 (Financial Risk Management) to the consolidated financial statements for theyear ended December 31, 2014.
Reliance on Distribution Channels
The company uses brokers to distribute its business and in some instances will distribute through agents or directly tocustomers. The company may also conduct business through third parties such as managing general agents where itis cost effective to do so and where the company can control the underwriting process to ensure its risk managementcriteria are met. Each of these channels has its own distinct distribution characteristics and customers. A largemajority of the company’s business is generated by brokers (including international reinsurance brokers with respectto the Reinsurance reporting segment), with the remainder split among the other distribution channels. This issubstantially consistent across the company’s insurance and reinsurance reporting segments.
The company’s insurance operations have relationships with many different types of brokers including independentretail brokers, wholesale brokers and national brokers depending on the particular jurisdiction, while the company’sreinsurance operations are dependent primarily on a limited number of international reinsurance brokers. Thecompany transacts business with these brokers on a non-exclusive basis. These independent brokers also transact thebusiness of the company’s competitors and there can be no assurance as to their continuing commitment todistribute the company’s insurance and reinsurance products. The continued profitability of the company depends,in part, on the marketing efforts of independent brokers and the ability of the company to offer insurance andreinsurance products and maintain financial ratings that meet the requirements and preferences of such brokers andtheir policyholders.
Because the majority of the company’s brokers are independent, there is limited ability to exercise control over them.In the event that an independent broker exceeds its authority by binding the company on a risk which does notcomply with the company’s underwriting guidelines, the company may be at risk for that policy until the applicationis received and a cancellation effected. Although to date the company has not experienced a material loss from
203
FAIRFAX FINANCIAL HOLDINGS LIMITED
improper use of binding authority by its brokers, any improper use of such authority may result in losses that couldhave a material adverse effect on the business, results of operations and financial condition of the company. Thecompany’s insurance and reinsurance subsidiaries closely manage and monitor broker relationships and regularlyaudit broker compliance with the company’s established underwriting guidelines.
Goodwill and Intangible Assets
The goodwill and intangible assets on the company’s consolidated balance sheet originated from variousacquisitions made by the company or its operating subsidiaries. Continued profitability of acquired businesses is akey driver for there to be no impairment in the carrying value of goodwill and intangible assets. An intangible assetmay be impaired if the economic benefit to be derived from its use is unexpectedly diminished.
Management regularly reviews the current and expected profitability of the operating companies relative to plan inassessing the carrying value of goodwill. The intended use, expected life, and economic benefit to be derived fromintangible assets are evaluated by the company when there are potential indicators of impairment. The carryingvalues of goodwill and indefinite-lived intangible assets are tested for impairment at least annually or more often ifevents or circumstances indicate there may be potential impairment.
Taxation
Realization of deferred income tax assets is dependent upon the generation of taxable income in those jurisdictionswhere the relevant tax losses and temporary differences exist. Failure to achieve projected levels of profitability couldlead to a writedown in the company’s deferred income tax asset if it is no longer probable that the amount of the assetwill be realized.
The company is subject to income taxes in Canada, the U.S. and many foreign jurisdictions where it operates, andthe company’s determination of its tax liability is subject to review by applicable domestic and foreign taxauthorities. While the company believes its tax positions to be reasonable, where the company’s interpretationsdiffer from those of tax authorities or the timing of realization is not as expected, the provision for income taxes mayincrease or decrease in future periods to reflect actual experience.
The company has specialist tax personnel responsible for assessing the income tax consequences of plannedtransactions and events and undertaking the appropriate tax planning. The company also consults with external taxprofessionals as needed. Tax legislation of each jurisdiction in which the company operates is interpreted todetermine the provision for income taxes and expected timing of the reversal of deferred income tax assets andliabilities.
Guaranty Funds and Shared Markets
Virtually all U.S. states require insurers licensed to do business in their state to bear a portion of the loss suffered bysome insureds as the result of impaired or insolvent insurance companies. Many states also have laws that establishsecond-injury funds to provide compensation to injured employees for aggravation of a prior condition or injury,which are funded by either assessments based on paid losses or premium surcharge mechanisms. In addition, as acondition to the ability to conduct business in various jurisdictions, the company’s U.S. insurance subsidiaries arerequired to participate in mandatory property and casualty shared market mechanisms or pooling arrangements,which provide various types of insurance coverage to individuals or other entities that otherwise are unable topurchase that coverage from private insurers. The effect of these assessments and mandatory shared-marketmechanisms or changes in them could reduce the profitability of the company’s U.S. insurance subsidiaries in anygiven period or limit their ability to grow their business. Similarly, the company’s Canadian insurance subsidiariescontribute to a mandatory guaranty fund that protects insureds in the event of a Canadian property and casualtyinsurer becoming insolvent.
Technology
Third parties provide certain of the key components of the company’s business infrastructure such as voice and datacommunications and network access. Given the high volume of transactions processed daily, the company is relianton such third party provided services to successfully deliver its products and services. Despite the contingency plansof the company and those of its third party service providers, failure of these systems could interrupt the company’soperations and impact its ability to rapidly evaluate and commit to new business opportunities.
204
In addition, a security breach of the company’s computer systems could damage its reputation or result in liability.The company retains confidential information regarding its business dealings in its computer systems, including, insome cases, confidential personal information regarding its insureds. Therefore, it is critical that the company’sfacilities and infrastructure remain secure and are perceived by the marketplace to be secure.
The company has highly trained staff that are committed to the continual development and maintenance of itssystems. Operational availability, integrity and security of the company’s information, systems and infrastructure areactively managed through threat and vulnerability assessments, strict security policies and disciplined changemanagement practices.
Other
Quarterly Data (unaudited)
Years ended December 31
First Second Third Fourth FullQuarter Quarter Quarter Quarter Year
2014Revenue 2,882.5 2,407.5 2,654.2 2,073.7 10,017.9Net earnings 785.0 366.4 475.0 38.2 1,664.6Net earnings attributable to shareholders of Fairfax 784.6 363.7 461.2 23.7 1,633.2Net earnings per share $ 36.35 $ 16.47 $ 21.10 $ 0.50 $ 74.43Net earnings per diluted share $ 35.72 $ 16.15 $ 20.68 $ 0.49 $ 73.01
2013Revenue 1,784.6 1,355.8 1,120.8 1,683.7 5,944.9Net earnings (loss) 163.3 (156.9) (569.1) (1.8) (564.5)Net earnings (loss) attributable to shareholders of Fairfax 161.6 (157.8) (571.7) (5.5) (573.4)Net earnings (loss) per share $ 7.22 $ (8.55) $ (29.02) $ (0.98) $ (31.15)Net earnings (loss) per diluted share $ 7.12 $ (8.55) $ (29.02) $ (0.98) $ (31.15)
The company’s significant net gains on investments and higher underwriting profit, partially offset by higher netadverse prior year reserve development at Runoff and the increased provision for income taxes generated netearnings attributable to shareholders of Fairfax of $1,633.2 in 2014 (2013 – a net loss of attributable to shareholdersof Fairfax $573.4). The net loss attributable to shareholders of Fairfax of $571.7 in the third quarter of 2013 aroseprincipally as a result of significant net losses on investments (primarily related to equity and equity-related holdingsafter equity hedges, and bonds) and lower interest and dividend income, partially offset by the increased recovery ofincome taxes and higher underwriting profit.
Operating results at the company’s insurance and reinsurance operations continue to be affected by a difficultcompetitive environment. Individual quarterly results have been (and may in the future be) affected by losses fromsignificant natural or other catastrophes, by reserve releases and strengthenings and by settlements orcommutations, the occurrence of which are not predictable, and have been (and are expected to continue to be)significantly impacted by net gains or losses on investments, the timing of which are not predictable.
Stock Prices and Share Information
As at March 6, 2015, Fairfax had 21,547,050 subordinate voting shares and 1,548,000 multiple voting sharesoutstanding (an aggregate of 22,295,820 shares effectively outstanding after an intercompany holding). Eachsubordinate voting share carries one vote per share at all meetings of shareholders except for separate meetings ofholders of another class of shares. Each multiple voting share carries ten votes per share at all meetings ofshareholders except in certain circumstances (which have not occurred) and except for separate meetings of holdersof another class of shares. The multiple voting shares are not publicly traded.
205
FAIRFAX FINANCIAL HOLDINGS LIMITED
The table that follows presents the Toronto Stock Exchange high, low and closing Canadian dollar prices ofsubordinate voting shares of Fairfax for each quarter of 2014 and 2013.
First Second Third FourthQuarter Quarter Quarter Quarter
(Cdn$)
2014High 487.99 529.49 527.58 620.54Low 415.01 462.00 490.00 496.40Close 480.00 506.22 501.79 608.78
2013High 402.00 438.00 437.00 477.46Low 352.60 386.98 407.00 402.25Close 396.66 413.57 416.56 424.11
Compliance with Corporate Governance Rules
Fairfax is a Canadian reporting issuer with securities listed on the Toronto Stock Exchange and trading in Canadiandollars under the symbol FFH and in U.S. dollars under the symbol FFH.U. It has in place corporate governancepractices that comply with all applicable rules and substantially comply with all applicable guidelines and policies ofthe Canadian Securities Administrators and the practices set out therein.
The company’s Board of Directors has adopted a set of Corporate Governance Guidelines (which include a writtenmandate of the Board), established an Audit Committee, a Governance and Nominating Committee and aCompensation Committee, approved written charters for all of its committees, approved a Code of Business Conductand Ethics applicable to all directors, officers and employees of the company and established, in conjunction withthe Audit Committee, a Whistleblower Policy. The company continues to monitor developments in the area ofcorporate governance as well as its own procedures.
Forward-Looking Statements
Certain statements contained herein may constitute forward-looking statements and are made pursuant to the ‘‘safeharbour’’ provisions of the United States Private Securities Litigation Reform Act of 1995. Such forward-lookingstatements are subject to known and unknown risks, uncertainties and other factors which may cause the actualresults, performance or achievements of Fairfax to be materially different from any future results, performance orachievements expressed or implied by such forward-looking statements.
Such factors include, but are not limited to: a reduction in net earnings if our loss reserves are insufficient;underwriting losses on the risks we insure that are higher or lower than expected; the occurrence of catastrophicevents with a frequency or severity exceeding our estimates; changes in market variables, including interest rates,foreign exchange rates, equity prices and credit spreads, which could negatively affect our investment portfolio; thecycles of the insurance market and general economic conditions, which can substantially influence our and ourcompetitors’ premium rates and capacity to write new business; insufficient reserves for asbestos, environmental andother latent claims; exposure to credit risk in the event our reinsurers fail to make payments to us under ourreinsurance arrangements; exposure to credit risk in the event our insureds, insurance producers or reinsuranceintermediaries fail to remit premiums that are owed to us or failure by our insureds to reimburse us for deductiblesthat are paid by us on their behalf; the timing of claims payments being sooner or the receipt of reinsurancerecoverables being later than anticipated by us; the inability of our subsidiaries to maintain financial or claimspaying ability ratings; risks associated with implementing our business strategies; risks associated with our use ofderivative instruments; the failure of our hedging methods to achieve their desired risk management objective; adecrease in the level of demand for insurance or reinsurance products, or increased competition in the insuranceindustry; the impact of emerging claim and coverage issues; the failure of any of the loss limitation methods weemploy; our inability to access cash of our subsidiaries; our inability to obtain required levels of capital on favourableterms, if at all; loss of key employees; our inability to obtain reinsurance coverage in sufficient amounts, atreasonable prices or on terms that adequately protect us; the passage of legislation subjecting our businesses toadditional supervision or regulation, including additional tax regulation, in the United States, Canada or otherjurisdictions in which we operate; risks associated with government investigations of, and litigation and negativepublicity related to, insurance industry practice or any other conduct; risks associated with political and other
206

developments in foreign jurisdictions in which we operate; risks associated with legal or regulatory proceedings;failures or security breaches of our computer and data processing systems; the influence exercisable by our significantshareholder; adverse fluctuations in foreign currency exchange rates; our dependence on independent brokers overwhom we exercise little control; an impairment in the carrying value of our goodwill and indefinite-lived intangibleassets; our failure to realize deferred income tax assets; and assessments and shared market mechanisms which mayadversely affect our U.S. insurance subsidiaries. Additional risks and uncertainties are described in this AnnualReport, which is available at www.fairfax.ca and in our Supplemental and Base Shelf Prospectus (under ‘‘RiskFactors’’) filed with the securities regulatory authorities in Canada, which is available on SEDAR at www.sedar.com.Fairfax disclaims any intention or obligation to update or revise any forward-looking statements.
207
FAIRFAX FINANCIAL HOLDINGS LIMITED
APPENDIXGUIDING PRINCIPLES FOR FAIRFAX FINANCIAL HOLDINGS LIMITED
OBJECTIVES:
1) We expect to compound our book value per share over the long term by 15% annually by running Fairfax and itssubsidiaries for the long term benefit of customers, employees and shareholders – at the expense of short termprofits if necessary.
Our focus is long term growth in book value per share and not quarterly earnings. We plan to grow throughinternal means as well as through friendly acquisitions.
2) We always want to be soundly financed.
3) We provide complete disclosure annually to our shareholders.
STRUCTURE:
1) Our companies are decentralized and run by the presidents except for performance evaluation, successionplanning, acquisitions and financing which are done by or with Fairfax. Cooperation among companies isencouraged to the benefit of Fairfax in total.
2) Complete and open communication between Fairfax and subsidiaries is an essential requirement at Fairfax.
3) Share ownership and large incentives are encouraged across the Group.
4) Fairfax will always be a very small holding company and not an operating company.
VALUES:
1) Honesty and integrity are essential in all our relationships and will never be compromised.
2) We are results oriented – not political.
3) We are team players – no ‘‘egos’’. A confrontational style is not appropriate. We value loyalty – to Fairfax andour colleagues.
4) We are hard working but not at the expense of our families.
5) We always look at opportunities but emphasize downside protection and look for ways to minimize lossof capital.
6) We are entrepreneurial. We encourage calculated risk taking. It is all right to fail but we should learn fromour mistakes.
7) We will never bet the company on any project or acquisition.
8) We believe in having fun – at work!
208
Directors of the Company Officers of the CompanyAnthony F. Griffiths David BonhamCorporate Director Vice President and Chief Financial OfficerRobert J. Gunn Peter ClarkeCorporate Director Vice President and Chief Risk OfficerAlan D. Horn Jean CloutierPresident and Chief Executive Officer Vice President, International OperationsRogers Telecommunications Limited Hank EdmistonJohn R.V. Palmer Vice President, Regulatory AffairsChairman, Toronto Leadership Centre
Vinodh LoganadhanTimothy R. Price Vice President, Administrative ServicesChairman, Brookfield Funds,
Bradley MartinBrookfield Asset ManagementVice President, Strategic Investments
Brandon W. SweitzerPaul RivettDean, School of Risk Management, St. John’s UniversityPresident
Benjamin P. Watsa (as of April 2015)Eric SalsbergPartner and Portfolio ManagerVice President, Corporate Affairs and Corporate SecretaryLissom Investment Management Inc.Ronald SchokkingV. Prem WatsaVice President and TreasurerChairman and Chief Executive Officer of the CompanyJohn VarnellOperating ManagementVice President, Corporate Development
Fairfax Insurance GroupDorothy Whitaker
Andrew A. Barnard, President and Chief Operating Officer Vice President, TaxationCanadian Insurance V. Prem Watsa
Chairman and Chief Executive OfficerSilvy Wright, PresidentNorthbridge Financial Corporation Head Office
U.S. Insurance 95 Wellington Street WestMarc Adee, President Suite 800Crum & Forster Holdings Corp. Toronto, Ontario, Canada M5J 2N7
Telephone: (416) 367-4941Kari Van Gundy, PresidentWebsite: www.fairfax.caZenith National Insurance Corp.
AuditorsAsian InsurancePricewaterhouseCoopers LLPRamaswamy Athappan, President
Fairfax Asia and General CounselFirst Capital Insurance LimitedTorys LLPSammy Y. Chan, President
Fairfax Asia Transfer Agents and RegistrarsGobinath Athappan, COO Fairfax Asia and Valiant Trust Company, TorontoPresident Fairfax Malaysia Registrar and Transfer Company, Cranford, New Jersey
Other Insurance Share ListingBruno Camargo, President Toronto Stock ExchangeFairfax Brasil Stock Symbol: FFH and FFH.UPeter Csakvari, President
Annual MeetingFairfax Eastern EuropeThe annual meeting of the shareholders ofSean Smith, PresidentFairfax Financial Holdings Limited will bePethealth Inc.held on Thursday, April 16, 2015 at 9:30 a.m.
Reinsurance – OdysseyRe (Toronto time) at Roy Thomson Hall,60 Simcoe Street, Toronto, CanadaBrian D. Young, President
Odyssey Re Holdings Corp.
Other ReinsuranceNigel Fitzgerald, PresidentTrevor Ambridge, Managing DirectorAdvent Capital (Holdings) PLCMonika Wozniak-Makarska, PresidentPolish Re
RunoffNicholas C. Bentley, PresidentRiverStone Group LLC
OtherBijan Khosrowshahi, PresidentFairfax InternationalRoger Lace, PresidentHamblin Watsa Investment Counsel Ltd.
209
