2014 aps march meeting presentation
TRANSCRIPT

Magnetic Phase
Transitions in Intercalated
Dichalcogenide
Nanostructures
CORBYN MELLINGER
UNIVERSITY OF NORTHERN IOWA

Intercalated Dichalcogenide
Nanostructures
Layered material made up of TaS2 with
magnetic Mn ions between layers
Concentration of Mn determines
magnetic properties
Our sample: Mn0.235TaS2
(Layered structure of MnxTaS2))
(SEM image of MnxTaS2 nanotubes)

Magnetism Background
Atoms possess orbital
and spin angular
momentum
These spins contribute
to “magnetic
moments”
Magnetic phase of
material depends on
short-range and long-
range order of
individual momentsA: Paramagnetic
B: Ferromagnetic

Objectives
Characterize magnetic phase transitions in Mn0.235TaS2
nanostructures
Previous research characterize transitions for 15%, 20%, and 23%
intercalation
Build phase diagram for general MnxTaS2 as a function of
x
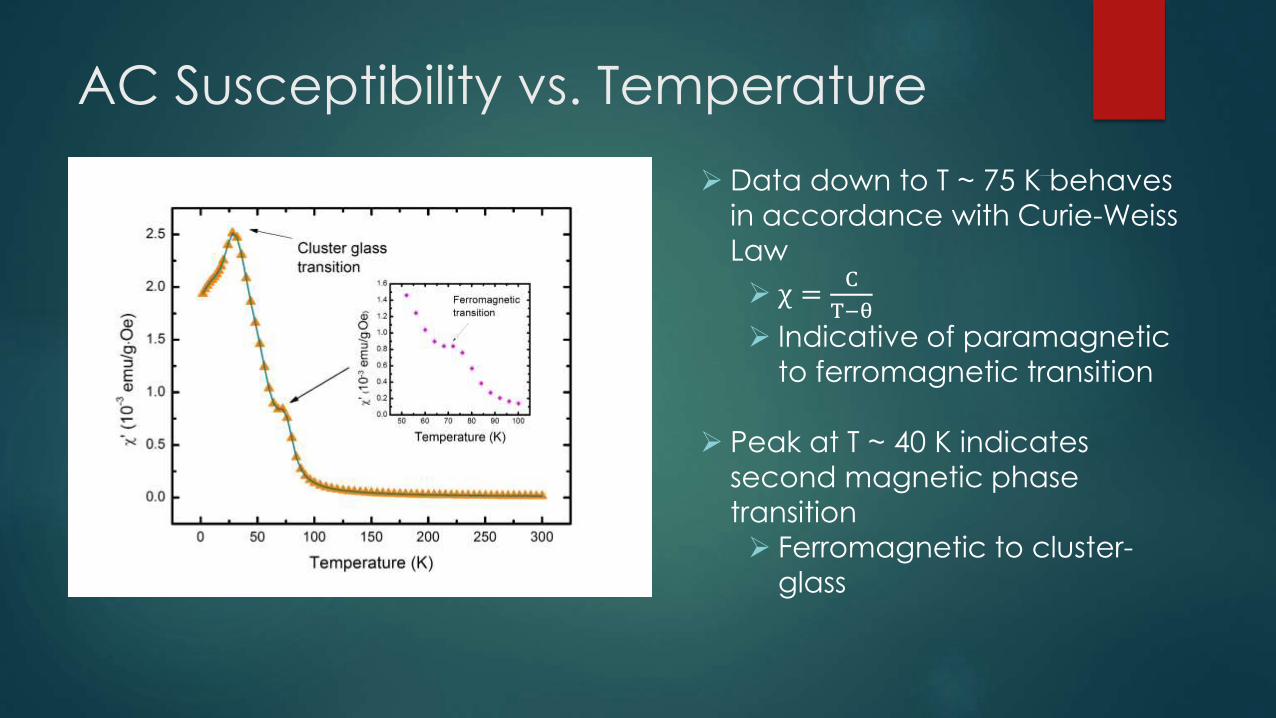
AC Susceptibility vs. Temperature
Data down to T ~ 75 K behaves
in accordance with Curie-Weiss
Law
χ =C
T−θ
Indicative of paramagnetic
to ferromagnetic transition
Peak at T ~ 40 K indicates
second magnetic phase
transition
Ferromagnetic to cluster-
glass
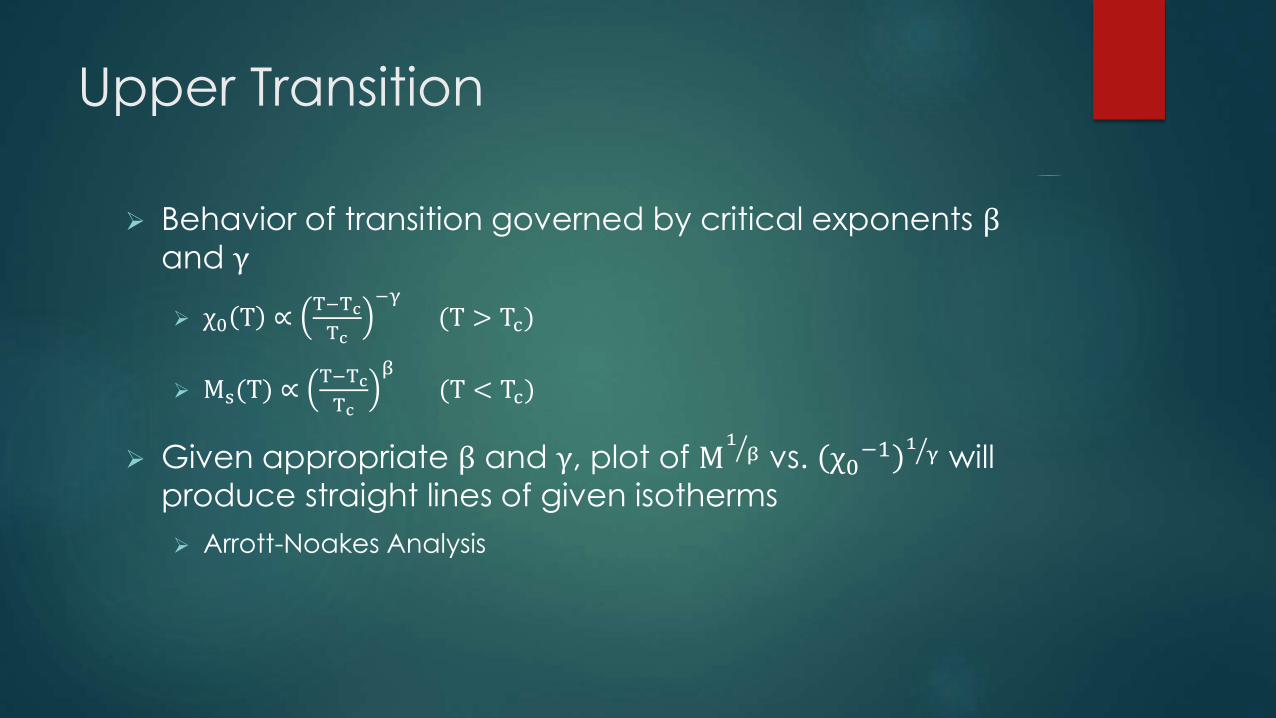
Upper Transition
Behavior of transition governed by critical exponents βand γ
χ0 T ∝T−Tc
Tc
−γ(T > Tc)
Ms(T) ∝T−Tc
Tc
β(T < Tc)
Given appropriate β and γ, plot of M 1 β vs. χ0−1 1 γ will
produce straight lines of given isotherms
Arrott-Noakes Analysis

Arrott-Noakes Analysis
Exponents selected using iterative
code in MATLAB
Many sets of values tried; set
returning straightest lines reported
back by program
Tc given as isotherm which
intersects origin

Kouvel-Fisher Analysis
Related to equations of
state
χ0−1 ∙
dχ0−1
dT
−1
=T−Tc
γ
Ms ∙dMs
dT
−1=
T−Tc
β
Does not require
exponents to be known
before analysis
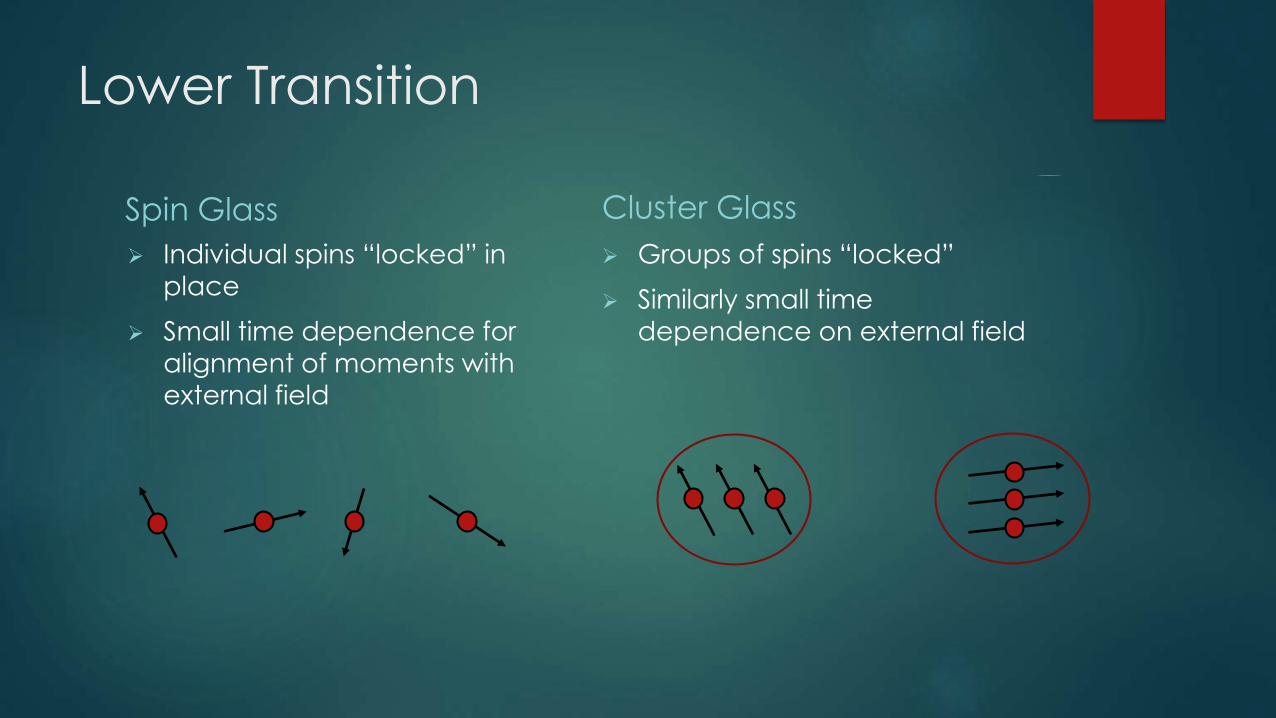
Lower Transition
Spin Glass
Individual spins “locked” in
place
Small time dependence for
alignment of moments with
external field
Cluster Glass
Groups of spins “locked”
Similarly small time
dependence on external field
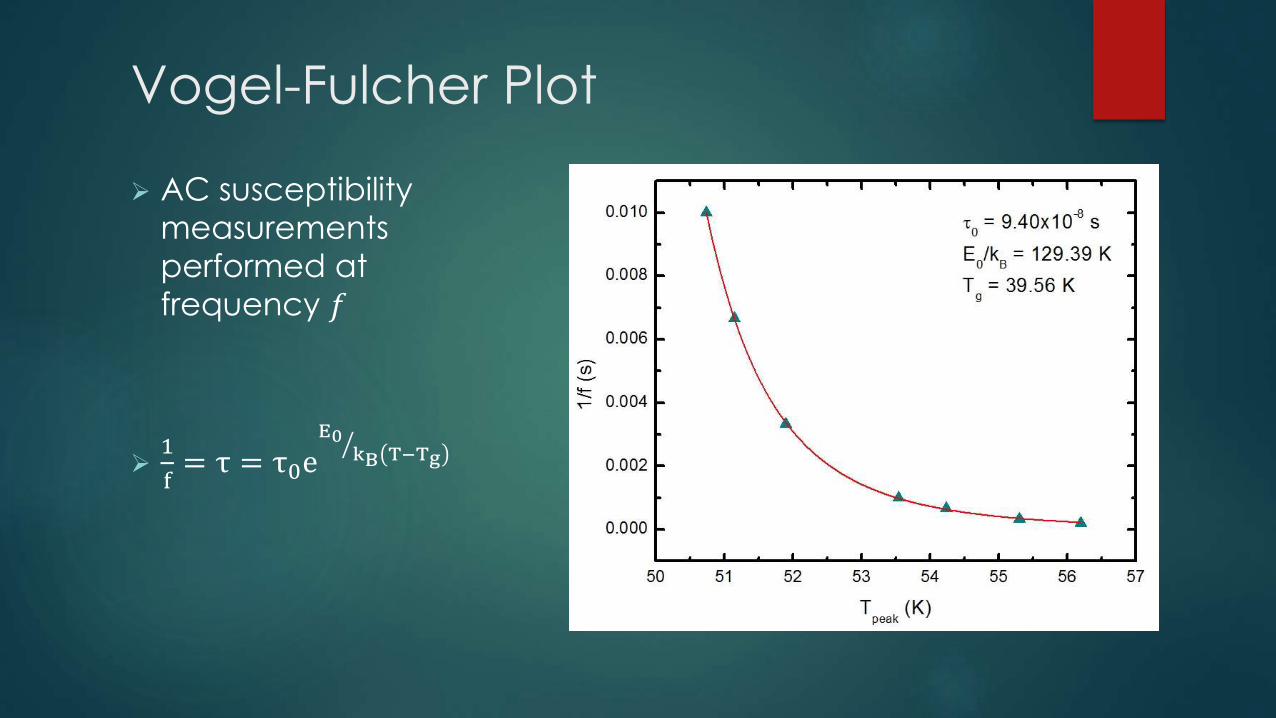
Vogel-Fulcher Plot
AC susceptibility
measurements
performed at
frequency 𝑓
1
f= τ = τ0e
E0
kB T−Tg

Phase Diagram
Adjusted phase
diagram based on
new x = 0.235 data
More points desired
near multicritical
point (x~0.225) and
for higher x
Conclusions & Analysis
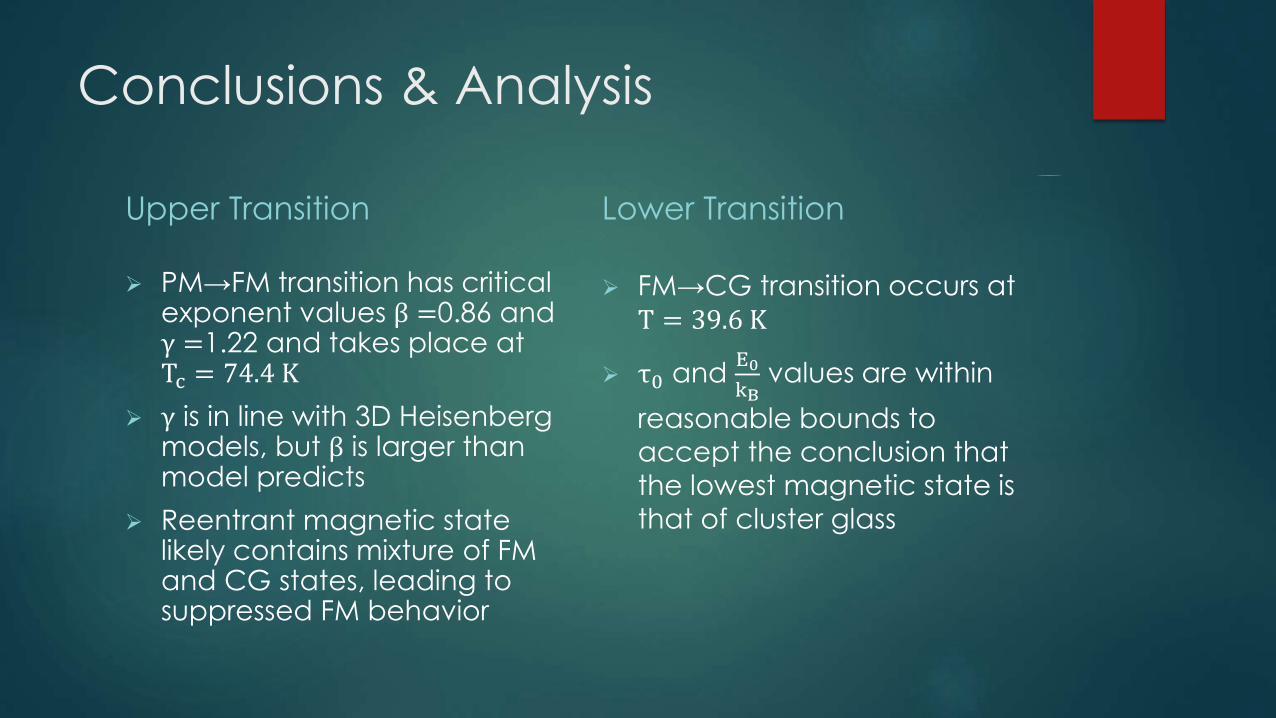
Upper Transition
PM→FM transition has critical exponent values β =0.86 and γ =1.22 and takes place at Tc = 74.4 K
γ is in line with 3D Heisenberg models, but β is larger than model predicts
Reentrant magnetic state likely contains mixture of FM and CG states, leading to suppressed FM behavior
Lower Transition
FM→CG transition occurs at
T = 39.6 K
τ0 and E0
kBvalues are within
reasonable bounds to
accept the conclusion that
the lowest magnetic state is
that of cluster glass

Acknowledgements
National Science Foundation Award No. DMR-1206530
Department of Physics, University of Northern Iowa
Dr. Paul Shand