2014 chinese ajc crop analysis report - global fruitsglobalfruitsco.com/documents/2014 ajc crop...
TRANSCRIPT
2014 Chinese Apple Juice
Concentrate Crop Analysis Report
Prepared by: Lydia Zhang
October 2014
Global Fruits Commodities Inc.
243 North Service Road West, Oakville, Ontario L6M 3E5, Canada Tel: (905)-339-1771 Fax: (905)-339-1772
Email: [email protected] Website: www.globalfruitsco.com

2014 Chinese AJC Crop Analysis Report
ii
Table of Contents
1.0 Global AJC supply ................................................................................................... 1
1.1 European Market Analysis .............................................................................. 1
1.1.1 AJC Production Analysis by Country .................................................... 1
1.1.1.1 Poland .................................................................................... 1
1.1.1.2 Ukraine ................................................................................... 1
1.1.1.3 Spain ...................................................................................... 2
1.1.1.4 Italy ......................................................................................... 2
1.1.1.5 Turkey .................................................................................... 2
1.1.1.6 Hungary .................................................................................. 2
1.1.2 Additional Considerations ..................................................................... 2
1.1.2.1 Level of Acidity ....................................................................... 3
1.1.2.2 Kosher Certificates ................................................................. 3
1.1.2.3 Aseptic Packaging .................................................................. 4
1.1.2.4 Supplier Approval ................................................................... 4
1.1.2.5 Summary ................................................................................ 4
1.2 South American Apple Juice Concentrate ....................................................... 4
2.0 Chinese AJC Supply ............................................................................................... 5
2.1 2014 - 2015 Apple Fruit Crop Briefing ............................................................. 5
2.2 Production of AJC ........................................................................................... 6
2.3 Existing AJC Inventory from 2013 ................................................................... 7
3.0 World Apple Juice Concentrate Demand Change ................................................... 8
3.1 Chinese AJC Demand of Major Countries from 2006 - 2013 .......................... 8
3.2 North American Demand ............................................................................... 10
4.0 Supply Verses Demand......................................................................................... 13
4.1 World Supply situation for North America ..................................................... 13
4.2 Supply Verses North American Demand ....................................................... 14
5.0 AJC 2014 Price Forecast ...................................................................................... 16
5.1 2014 Forecast Trend ..................................................................................... 16
5.2 Suggestions on Purchasing Strategy to Lower Your Cost ............................. 16

2014 Chinese AJC Crop Analysis Report
Prepared by: Lydia Zhang Global Fruits Commodities Inc. Page 1
1.0 GLOBAL AJC SUPPLY
1.1 EUROPEAN MARKET ANALYSIS
On August 7th, Russia banned all meat, fish, dairy, fruit and vegetable imports from the
EU, the US, Norway, Canada and Australia for one year to retaliate against Western
sanctions on Moscow over the Ukraine crisis. The European commission has
announced emergency fund of USD 170 million for fruit and vegetable growers hit by
this embargo. The funding is compensation for fresh produce which will not be sold; it
will instead be distributed freely to schools, hospitals and other institutions. In 2013,
Russia Imported apples from EU-28 valued at USD 481.9 Million, while the national total
import value of apples are at USD 787.9 million, of apples valued at USD 389 million
originated from Poland. Compared to 2013, the apple crop of 2014 is up by 24%, 13
and 43% for Poland, Italy and Hungary, respectively. Even though China and Turkey
have relatively poor crops this year, the increase in production from Poland coupled with
the loss of demand from Russia will still lead to a large surplus on the global market.
This will in turn lead to more apples available for juicing, causing a decrease in price of
AJC this year. Due to the challenging market conditions of Eastern Europe, Polish AJC
producers are now turning to North America as a new potential market.
1.1.1 AJC Production Analysis by Country
1.1.1.1 Poland
Polish apple fruit harvest had been continually increasing since 2012, with the 2014
yield being the biggest in history. The total AJC production of Poland for 2013 was
220,000 MT, and will likely increase significantly this year. However, the acidity of the
AJC varies with length of time between production and harvest. AJC produced
immediately after harvest maintains the highest acidity and the level of acidity drops
gradually over time. The expected acidity of the October production is approximately 3.0
– 3.5%, and drops to 2.5 – 3.0% and 2.0 – 2.6% for November and December,
respectively. The next series of production in the spring of 2015 is expected to have
even lower acidity that is suited for the North American market. Coupled with remaining
inventories of 2013, it is anticipated that Poland will have around 80,000 MT of AJC
between the acidity levels of 2.0 – 3.0% by spring of 2015 for export to the North
American market.
1.1.1.2 Ukraine
The total AJC production of Ukraine was 70,000 MT in 2013. Historically, approximately
30% was exported to Russia. However, this route is no longer viable due to the current
political situation of Eastern Europe, and it is expected that the surplus volume now

2014 Chinese AJC Crop Analysis Report
Prepared by: Lydia Zhang Global Fruits Commodities Inc. Page 2
exist will be redirected to North America this year. Although 2014 represents a typical
year for Ukraine in terms apple crop, Polish apple fruit can be imported for additional
AJC production if capacity allows. The average acidity for Ukraine is between 2.5 –
3.5%. Similarly, the acidity varies with the production time after harvest. The expected
acidities are 3.5 – 4.0%, 2.3 – 3.0% for October and November, respectively.
Production is expected to stop around December or the end of the year. Approximately
6% volume is expected to be at a low acidity level of 2.6 – 2.8%, while up to 30%
volume is expected to be at a high acidity level of 3.0 – 3.2%. Due to the Embargo of
Russia, Ukraine is expected to have 21,000 MT of AJC in surplus that is between the
suitable acidity levels of 2.3 – 3.0% for North American market in early 2015.
1.1.1.3 Spain
The total AJC production of Spain was 30,000 MT in 2013. Furthermore, the total
harvest volume of apple fruit is expected to decrease 2014. Although Spanish AJC are
predominately of lower acidity of approximately 1.8 – 2.4%, competing demand of apple
being used to produce apple cider leaves a limited supply of raw fruit available for AJC
production and export.
1.1.1.4 Italy
The total AJC production of Italy was 50,000 MT in 2013, with the average acidity level
of 2.0 - 2.5%. The production of Italy is insignificant compared to other producers of the
EU-28 zone, and are often dependent on imports to satisfy domestic consumption.
1.1.1.5 Turkey
The total AJC production of Turkey was 70,000 MT in 2013. Although the acidity of
Turkey AJC is within the suitable range of North American demand at 1.8 – 2.5%, the
total harvest volume of apple fruit is expected to decrease 2014 and limited volume is
expected to be available for export.
1.1.1.6 Hungary
The total AJC production of Hungary was 42,000 MT in 2013, with an average acidity
level of 2.2 – 3.2%. Due to the limited base volume, any export to North American
market is expected to be insignificant.
1.1.2 Additional Considerations
There are a few aspects worth additional consideration when examining the potential of
European AJC gaining North American, and particularly US market acceptance.

2014 Chinese AJC Crop Analysis Report
Prepared by: Lydia Zhang Global Fruits Commodities Inc. Page 3
Figure 1: 2013 European AJC Productions
1.1.2.1 Level of Acidity
Polish and Ukrainian productions are of extreme high acidity in comparison to Chinese
AJC. North American Market has grown accustomed to the range of acidity of AJC
originating from China and South America. It is uncertain how much volume of high acid
from Poland and Ukraine will meet specification requirements of North American
customers. Even though North American customers can modify specification
requirements to accommodate for higher acidity, it is uncertain whether such move will
be ultimately cost effective in the long run.
1.1.2.2 Kosher Certificates
Kosher certificates are one of the basic requirements in North America. However, most
Polish and Ukrainian AJC manufacturers does not currently have kosher certificate for
their manufacturing facilities. Some of them are in the process of acquiring these
certificates for this season in order to export to North America.

2014 Chinese AJC Crop Analysis Report
Prepared by: Lydia Zhang Global Fruits Commodities Inc. Page 4
1.1.2.3 Aseptic Packaging
Many North American customers require Aseptic packaging on AJC deliveries, most of
Polish and Ukrainian AJC manufacturers does not have aseptic packaging installed.
Even though some US customers can accept non-aseptic packaged AJC for up to one
year exception, it is still uncertain if significant volume can be accepted in the US.
1.1.2.4 Supplier Approval
North American customers have standard procedures on approval of new suppliers.
The approval process involves specifications, documents and packaging. Due to the
length process required, not every North American customer will be willing to approve
new suppliers in Europe. Furthermore, most of the European suppliers are not ready to
have all the documents which US customers require.
1.1.2.5 Summary
From all different aspects, the European AJC surplus is not significant enough to shape
the market until the spring of 2015. The spring production will be lower in acidity that
can enter the North American market, which might have a higher impact.
1.2 SOUTH AMERICAN APPLE JUICE CONCENTRATE
South American AJC productions usually take up to 10 – 15% of total world production.
Include three big players: Argentina, Brazil, and Chile. The southern hemisphere crop
season will not start until March or April of next year; their current crop is almost
depleted and is not affecting the market at moment. However, the new crop in the
coming spring will likely have a significant impact on the supply volume and influence
AJC price in the spring of 2015.

2014 Chinese AJC Crop Analysis Report
Prepared by: Lydia Zhang Global Fruits Commodities Inc. Page 5
2.0 CHINESE AJC SUPPLY
2.1 2014 - 2015 APPLE FRUIT CROP BRIEFING
In the last few of years, Chinese farmers have been surprisingly successful in improving
their techniques on taking care of apple fruit crop. As a result, more percentage of crops
now enters the fresh apple market, thus causing the raw materials needed for apple
juice concentrate to shrink in volume. This is caused by the increase in price of the
domestic fresh apple market within China, as well as potential new Russian market due
to the trade embargo between Russia and EU-28. Currently Chinese farmers hope to
have more than 90% of their apple crop to enter fresh market to maximize profit from
their orchard.
During the period of 2006 - 2013, apple production has been raise at average rate of
7% annually. Basic on reports of the mid-crop season of 2014, it is anticipated that the
total crop yield will be less than the previous year. Furthermore, as shown in Figure 2,
although the raw apple fruit production has been steadily increasing for 7 years, the
processing apple volume has been on a downward trend. This trend is most likely to
continue given the decreased total crop yield of 2014.
Figure 2: 2006 to 2013 Apple Crop production, Export apple and
processing apple volume
26,059 27,860
29,847 31,681
33,263 35,992
38,491 39,680
804 1,019 1,153 1,171 1,123 1,035 976 994
6,500 6,825 5,200 4,225 3,705 4,076 4,830
3,270
0
5,000
10,000
15,000
20,000
25,000
30,000
35,000
40,000
45,000
2006 2007 2008 2009 2010 2011 2012 2013
Apple Production Export Apple Processing Apple Linear (Export Apple)

2014 Chinese AJC Crop Analysis Report
Prepared by: Lydia Zhang Global Fruits Commodities Inc. Page 6
2.2 PRODUCTION OF AJC
The processing grade apple volume is mainly reflected from three factors:
1. Processing plants bidding price: The lower the price, the lower volume will be
delivered to plants. The plants are reluctant to bid high prices for more
production, as it would lead more production and little margin on the sales.
2. Availability of the processing grade apple: If the bidding price is too low, it will
no longer be worthwhile for farmers to harvest and deliver to the plants. Not all
available processing grade apples will make it to the plants.
3. Fresh apple market: If fresh market is very profitable, less commitment will be
made on processing grade apples. This year, the small apple variety of
Qingguan, which has been mainly used previously for processing, will have
exporting potential to Russia as fresh apple.
Figure 3: Historical Chinese AJC Production from 2006 – 2013
and Forecast for 2014 - 2015
The projected Chinese AJC production of 2014 - 2015 as compared to 2006 – 2013
production is shown in Figure 3. Chinese manufactures has been producing for around
0
200
400
600
800
1000
1200
2006-07 2007-08 2008-09 2009-10 2010-11 2011-12 2012-13 2013-14 2014-15
1000
1050
800
650
570 627
743
503 450
2014 Chinese AJC Crop Analysis Report
Prepared by: Lydia Zhang Global Fruits Commodities Inc. Page 7
one month and half from the beginning of the new crop of 2014. Current reports indicate
the availability of processing grade fruit is very limited. Currently, the volume that has
been produced is less than half as the previously year’s production at this time. If the
trend continues, Chinese AJC total production for this crop year is expected to be less
than 450,000 MT, which is the lowest volume in the past ten years.
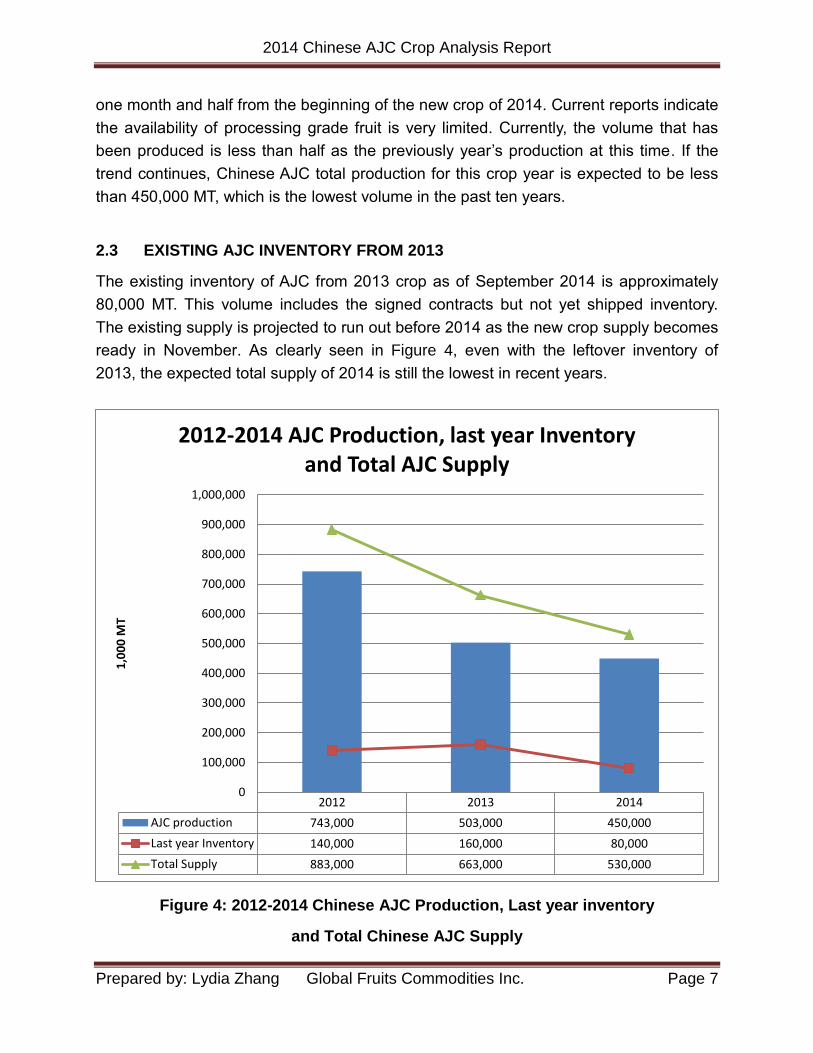
2.3 EXISTING AJC INVENTORY FROM 2013
The existing inventory of AJC from 2013 crop as of September 2014 is approximately
80,000 MT. This volume includes the signed contracts but not yet shipped inventory.
The existing supply is projected to run out before 2014 as the new crop supply becomes
ready in November. As clearly seen in Figure 4, even with the leftover inventory of
2013, the expected total supply of 2014 is still the lowest in recent years.
Figure 4: 2012-2014 Chinese AJC Production, Last year inventory
and Total Chinese AJC Supply
2012 2013 2014
AJC production 743,000 503,000 450,000
Last year Inventory 140,000 160,000 80,000
Total Supply 883,000 663,000 530,000
0
100,000
200,000
300,000
400,000
500,000
600,000
700,000
800,000
900,000
1,000,000
1,0
00
MT
2012-2014 AJC Production, last year Inventory and Total AJC Supply
2014 Chinese AJC Crop Analysis Report
Prepared by: Lydia Zhang Global Fruits Commodities Inc. Page 8
3.0 WORLD APPLE JUICE CONCENTRATE DEMAND CHANGE
3.1 CHINESE AJC DEMAND OF MAJOR COUNTRIES FROM 2006 - 2013
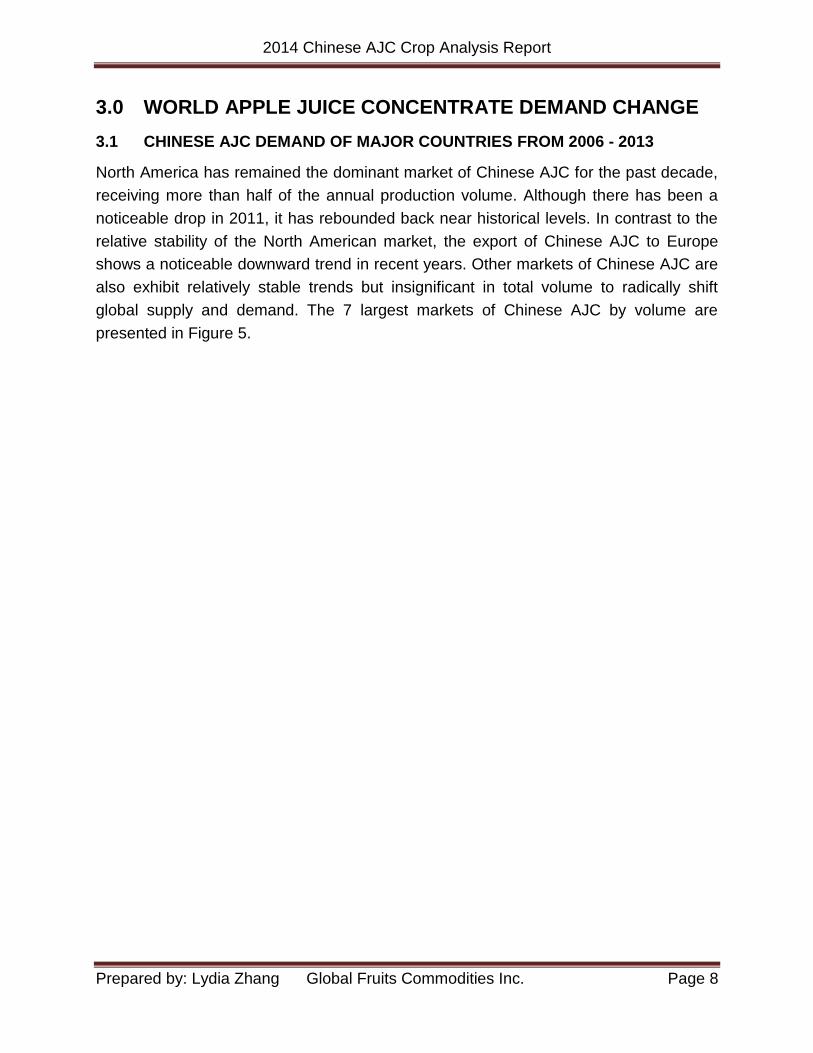
North America has remained the dominant market of Chinese AJC for the past decade,
receiving more than half of the annual production volume. Although there has been a
noticeable drop in 2011, it has rebounded back near historical levels. In contrast to the
relative stability of the North American market, the export of Chinese AJC to Europe
shows a noticeable downward trend in recent years. Other markets of Chinese AJC are
also exhibit relatively stable trends but insignificant in total volume to radically shift
global supply and demand. The 7 largest markets of Chinese AJC by volume are
presented in Figure 5.
2014 Chinese AJC Crop Analysis Report
Prepared by: Lydia Zhang Global Fruits Commodities Inc. Page 9
Figure 5: Chinese AJC Export Volume (MT) by Country and Region
0
50,000
100,000
150,000
200,000
250,000
300,000
350,000
400,000
450,000
2005 2006 2007 2008 2009 2010 2011 2012 2013 2014
North America
Europe
Russia
Japan
Australia
South Africa
Others

2014 Chinese AJC Crop Analysis Report
Prepared by: Lydia Zhang Global Fruits Commodities Inc. Page 10
3.2 NORTH AMERICAN DEMAND
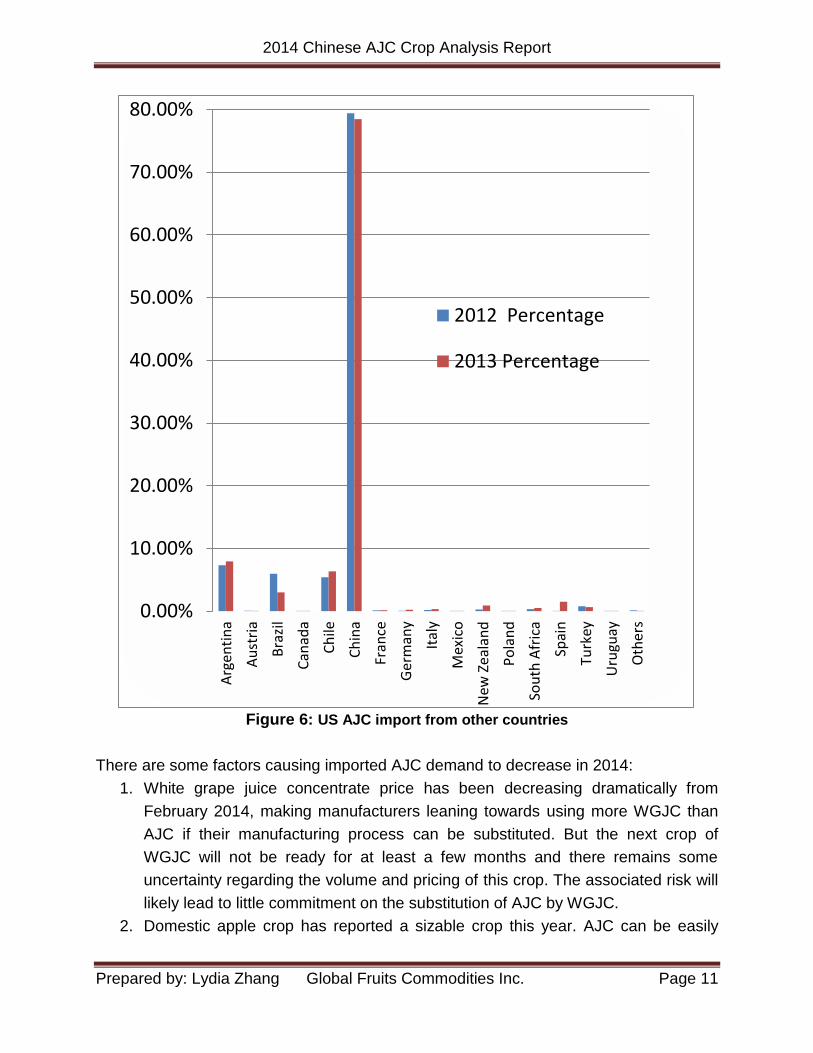
It can be seen in Table 1 that the US acquired almost 80% of AJC imports from China in
the last two years. Other than the US, Canada usually import AJC at least 50,000 MT a
year. This leads to the total North American annual consumption of AJC of at least
400,000 MT consecutively for the last 7 - 8 years.
Table 1: Assuming the total US consumption
2012 (MT) Percentage 2013(MT) Percentage
Argentina 30,542 7.30% 25,924 7.91%
Austria 222 0.05% 45 0.01%
Brazil 24,875 5.95% 9,768 2.98%
Canada 73 0.02% 78 0.02%
Chile 22,578 5.40% 20,808 6.35%
China 332,018 79.39% 257,197 78.46%
France 479 0.11% 438 0.13%
Germany 186 0.04% 708 0.22%
Italy 715 0.17% 995 0.30%
Mexico 167 0.04% 90 0.03%
New Zealand 1,032 0.25% 2,967 0.91%
Poland 151 0.04% 66 0.02%
South Africa 1,331 0.32% 1,620 0.49%
Spain 80 0.02% 4,827 1.47%
Turkey 3,216 0.77% 2,122 0.65%
Uruguay 152 0.04% 30 0.01%
Others 397 0.09% 111 0.03%
Total 418,214 100.00% 327,796 100.00%
2014 Chinese AJC Crop Analysis Report
Prepared by: Lydia Zhang Global Fruits Commodities Inc. Page 11
Figure 6: US AJC import from other countries
There are some factors causing imported AJC demand to decrease in 2014:
1. White grape juice concentrate price has been decreasing dramatically from
February 2014, making manufacturers leaning towards using more WGJC than
AJC if their manufacturing process can be substituted. But the next crop of
WGJC will not be ready for at least a few months and there remains some
uncertainty regarding the volume and pricing of this crop. The associated risk will
likely lead to little commitment on the substitution of AJC by WGJC.
2. Domestic apple crop has reported a sizable crop this year. AJC can be easily
0.00%
10.00%
20.00%
30.00%
40.00%
50.00%
60.00%
70.00%
80.00%
Arg
enti
na
Au
stri
a
Bra
zil
Can
ada
Ch
ile
Ch
ina
Fran
ce
Ger
man
y
Ital
y
Mex
ico
New
Ze
alan
d
Po
lan
d
Sou
th A
fric
a
Spai
n
Turk
ey
Uru
guay
Oth
ers
2012 Percentage
2013 Percentage
2014 Chinese AJC Crop Analysis Report
Prepared by: Lydia Zhang Global Fruits Commodities Inc. Page 12
produced from backyard apple orchards that are close to the manufacturing
facilities, and this will in part reduce volume sourced from China. However, this
only be applies to the manufacturers that are located close to the orchards and
can access the apple crop easily. Otherwise, the cost of transportation and other
labor cost will make it prohibitive to pursue.

2014 Chinese AJC Crop Analysis Report
Prepared by: Lydia Zhang Global Fruits Commodities Inc. Page 13
4.0 SUPPLY VERSES DEMAND
4.1 WORLD SUPPLY SITUATION FOR NORTH AMERICA
North American (US & Canadian) market has always represented the largest AJC
market in the world. It has received approximately 50 - 60% of the world total Chinese
AJC supply in recent years shown in Table 2. If this trend continues, it can be expected
that approximately 225,000 MT to 270,000 MT of Chinese AJC will be acquired by the
North American demand in 2014. Assuming the total AJC demand of North America will
be 400,000 MT in 2014 – 2015 crop year, then the gap in supply is 130,000 MT to
175,000 MT which has to be sourced elsewhere. In the last ten years, North America
has not had to source no more than 100,000 MT from sources outside of China, thus
making the size of the volume gap unprecedented and significant.
Table 2: Chinese AJC Export Volume (MT) to North America
Country 2006 2007 2008 2009 2010 2011 2012 2013 2014 2014
North
America251,833 399,782 359,289 413,028 428,237 288,461 377,072 351,500 225,000 270,000
World
Total671,695 1,031,356 684,374 795,695 784,151 608,495 620,627 597,814 450000 450,000
Percentag
e of w orld37.49% 38.76% 52.50% 51.91% 54.61% 47.41% 60.76% 58.80% 50.00% 60.00%
As mentioned in Section 1.0, Poland and Ukraine will be able to supply a total of
110,000 MT of AJC to North America with higher acidity. The Chinese supply will have
the same levels of acidity as previous years. There will likely be an oversupply of high
acidity AJC relative to North American demand 2014 – 2015. Depending on the cost
and price, it is likely that at least some customers will be interested in changing their
specification requirements to accommodate the higher acidity.
On the other hand, Chinese AJC suppliers make take advantage of the current
European situation and enter the Russia market. With already existing shortage of
Chinese AJC at the moment, North America may find itself with even available AJC
volumes from historical Chinese suppliers.

2014 Chinese AJC Crop Analysis Report
Prepared by: Lydia Zhang Global Fruits Commodities Inc. Page 14
4.2 SUPPLY VERSES NORTH AMERICAN DEMAND
Supply: 2014 world AJC total volume will be short, especially in lower acidity between
1.0 - 2.0% for North American demand. The total volume is expected to decrees by
approximately 50,000 MT as compared to the previous year (see details in section 2
Chinese AJC Supply).
Demand: North American demand will be 400,000 MT or higher due to the speculation
of European low price.
Overall supply will be less than demand by 50,000 MT (see details in section 2 Chinese
AJC Supply) or more this year. The imbalances of supply and demand will likely lead to
higher prices between the end of the year to the spring of 2015. However, the price will
likely drop as the spring production beings in Poland and South America, depending on
the volume they will contribute to the market.
At the start of the crop season, the AJC price will be determined by Chinese suppliers
as they are the only source with large volume to meet North American demand before
spring of next year. The price may increase if demand rises due to the initial low asking
price of Chinese AJC suppliers.
November, December, January, February and March are the five months which
Chinese AJC will be the only biggest volume to supply North American. Until March
2015 some of the Polish and Ukraine AJC high acid will be entering North American
market. At this time, we will know the approximate total supply volume of European high
acid, this will initiate the balance between the supply and world demand until the price
stabilizes.
However, by March 2015, South American crop will be introduced, and this will upset
the balance once more. Furthermore, there may be uncontrollable events and/or
economic situations that may upset the balance from the demand side over the course
of the year.
We will keep monitor the situation and release updated reports as appropriate.

2014 Chinese AJC Crop Analysis Report
Prepared by: Lydia Zhang Global Fruits Commodities Inc. Page 15
Figure 6: Chinese AJC 2014-2015 Price Forecast

2014 Chinese AJC Crop Analysis Report
Prepared by: Lydia Zhang Global Fruits Commodities Inc. Page 16
5.0 AJC 2014 PRICE FORECAST
5.1 2014 FORECAST TREND
1. Overall the trend is expected to be mild since the demand and supply is always
at the similar range.
2. The highest price of AJC will not be higher than $8.50/gallon which is equivalent
to approximately $1500/MT.
3. The price will start a downward trend after the end of February, the conclusion of
Chinese New Year celebration (starting Feb. 19th 2015) until summer.
5.2 SUGGESTIONS ON PURCHASING STRATEGY TO LOWER YOUR COST
1. Purchase small quantities at a time for 3 months needs over the first 6 months
before February, at 2 - 3 months ahead of shipping.
2. Avoid decision making on the highest price level for big volume or long shipment
schedule.
3. After February needs next year, buy for 6 months needs before the summer at 2-
3 months ahead of shipping, so you can get the lowest price available at the time
you need the product.